Embed Size (px)
Citation preview
ORIGINAL ARTICLE
Does Friedewald Formula Underestimate the Risk of IschemicHeart Disease?
Ekta Bansal • Navpreet Kaur
Received: 3 June 2013 / Accepted: 30 September 2013
� Association of Clinical Biochemists of India 2013
Abstract Traditionally Friedewald formula has been used
to calculate low density lipoprotein cholesterol (LDL-C)
concentration though now direct homogenous methods for its
measurement are also available. Clinical guidelines recom-
mend the use of calculated LDL-C to guide therapy because
the evidence base for cholesterol management is derived
almost exclusively from trials that use calculated LDL, with
direct measurement of LDL-C being reserved for those
patients who are non fasting or with significant hypertriglyc-
eridemia. In this study our aim was to compare calculated and
direct LDL and their variation at different cholesterol and
triglyceride levels. Fasting lipid profile estimation was done
on 503 outpatients in a tertiary hospital. Both direct and cal-
culated LDL were then compared. Mean fasting direct LDL
was found to be higher than calculated LDL in 87.1 % of
subjects by 8.64 ± 8.35 mg/dl. This difference was seen a all
levels of cholesterol and triglyceride. Using 130 mg/dl LDL
cholesterol as cut off fewer subjects were classified as high
risk by calculated LDL than direct LDL. In conclusion, direct
LDL is higher than calculated LDL. Compared with direct
measurement, the Friedewald calculation underestimates the
risk for ischemic heart disease.
Keywords Friedewald formula � Direct LDL �Calculated LDL
Introduction
The concentration of low-density lipoprotein cholesterol
(LDL-C) is one of the strongest markers of atherosclerosis
and predictor for assessing coronary heart disease (CHD)
risk. Strong positive association between increased LDL-C
and CHD has been well documented [1–3]. The National
Cholesterol Education Programme’s (NCEP) Adult Treat-
ment Panel III (ATP III) deemed that LDL-C concentration
was the primary basis for treatment and appropriate patients’
classification in risk categories [4]. The serum LDL-C con-
centration used to classify adults for high risk of heart disease
is: desirable\130 mg/dl, borderline high risk 130–159 mg/
dl, high risk[160 mg/dl. The goal for subjects with two or
more risk factors like diabetes, family history, hypertension,
smoking, low high density lipoprotein cholesterol (HDL) is
to achieve LDL-C concentration of 100 mg/dl [4]. Therefore
accurate and precise measurements of patients’ LDL-C
concentration is necessary to appropriately identify indi-
viduals with hypercholesterolemia and to monitor the
response to diet and drug treatments.
The reference method for LDL-C concentration mea-
surement, which combines ultracentrifugation-polyanion
precipitation, is not readily available and also impractical
in the routine laboratory [5]. A new generation of direct
homogenous assays [6, 7] for LDL-C determination in
serum has been developed with a satisfactory degree of
accuracy but at the same time these assays are expensive.
Friedewald’s formula [8] is still the most commonly
employed procedure in clinical laboratories for the esti-
mation of LDL-C concentration and it has been considered
acceptable for patients’ classification [4]. It is often used in
developing countries due to its simplicity, convenience and
low cost. Although convenient, the Friedewald calculation
suffers from several well-established limitations, which led
an Expert Panel convened by the NCEP to recommend
development of accurate direct LDL-C estimation methods
[5]. Earlier direct methods had limitations for general use.
Recently, a new generation of homogeneous methods
E. Bansal (&) � N. Kaur
Department of Biochemistry, DMC&H, Ludhiana 141001,
Punjab, India
e-mail: [email protected]
123
Ind J Clin Biochem
DOI 10.1007/s12291-013-0392-2
capable of full automation has been introduced that uses
specific reagents of various types to selectively expose and
directly measure the cholesterol associated with LDL.
As already reported by other authors the homogeneous
methods and Friedewald’s formula are not capable of
providing identical results [9, 10].
The present study was aimed to assess the difference in
direct LDL and calculated LDL as per Friedewald’s for-
mula in population from Punjab, North India.
Materials and Methods
503 outpatients who underwent lipid profile estimation were
selected for the study. Samples were collected after over-
night fasting. All estimations were done on Cobas c system
on the same day the sample was collected. Total cholesterol
(TC) and triglyceride (TG) levels were measured enzymat-
ically by CHOD-PAP and GPO-PAP methods (Roche
Diagnostics GmbH, Mannheim, Germany), respectively
according to the manufacturer’s specifications. All patients
who had TGs more than 400 mg/dl were excluded from the
study. High-density lipoprotein cholesterol (HDL-C) was
measured using a homogeneous assay without precipitation
(Roche Diagnostics GmbH, Mannheim, Germany) [11].
Friedewald formula was used to obtain calculated LDL
cholesterol values (C-LDL = TC - HDL-C - TG/5).
Direct LDL cholesterol (D-LDL) was measured by a
homogenous enzymatic colorimetric assay offered by Ky-
owa Medex and distributed by Roche Diagnostics. The
principle of D-LDL determination is as follows: At pH 6.75
in the presence of magnesium ions and a sugar compound
the enzymatic reaction for cholesterol in very low-density
lipoprotein (VLDL) and chylomicrons is markedly
reduced. Selective micellary solublization of LDL choles-
terol by a non ionic detergent enables its measurement by a
conventional enzymatic reaction with cholesterol esterase,
cholesterol oxidase and peroxidase (Roche Diagnostics
GmbH, Mannheim, Germany) [6, 11]. This direct homo-
geneous assay has been shown to meet current NCEP cri-
teria for precision (CV \ 4 %), accuracy (bias \ 4 %)
versus reference method and for total analytical error
(\12 %) [4, 11]. Within run CVs for direct LDL-C were
0.9 % at 96.9 mg/dl and 1.3 % at 237 mg/dl and the total
CVs were 1.9 % at 56.8 mg/dl and 2.1 % at 153 mg/dl.
Paired t test, v2 test and Pearson’s correlation coefficient
was used to find the statistical significance.
Results
Mean age of the study group was 51.40 ± 12.39 years. 68 %
were males and 32 % were females. Mean level of cholesterol
was 184.01 ± 43.89 mg/dl and maximum number of patients
(38.8 %) had cholesterol level between 150 and 199 mg/dl.
Mean TG was 139.92 ± 65.83 mg/dl and 49.5 % patients had
TG level between 101 and 200 mg/dl. Mean level of direct
LDL was 118.10 ± 38.45 mg/dl whereas mean calculated
LDL level was 109.46 ± 36.30 mg/dl (Table 1). 87.1 % of
patients had direct LDL more than calculated while only
12.9 % had direct LDL equal to or less than calculated LDL.
Mean difference between the two was 8.64 ± 8.35 mg/dl
which was statistically significant (p = 0.000) (Table 2).
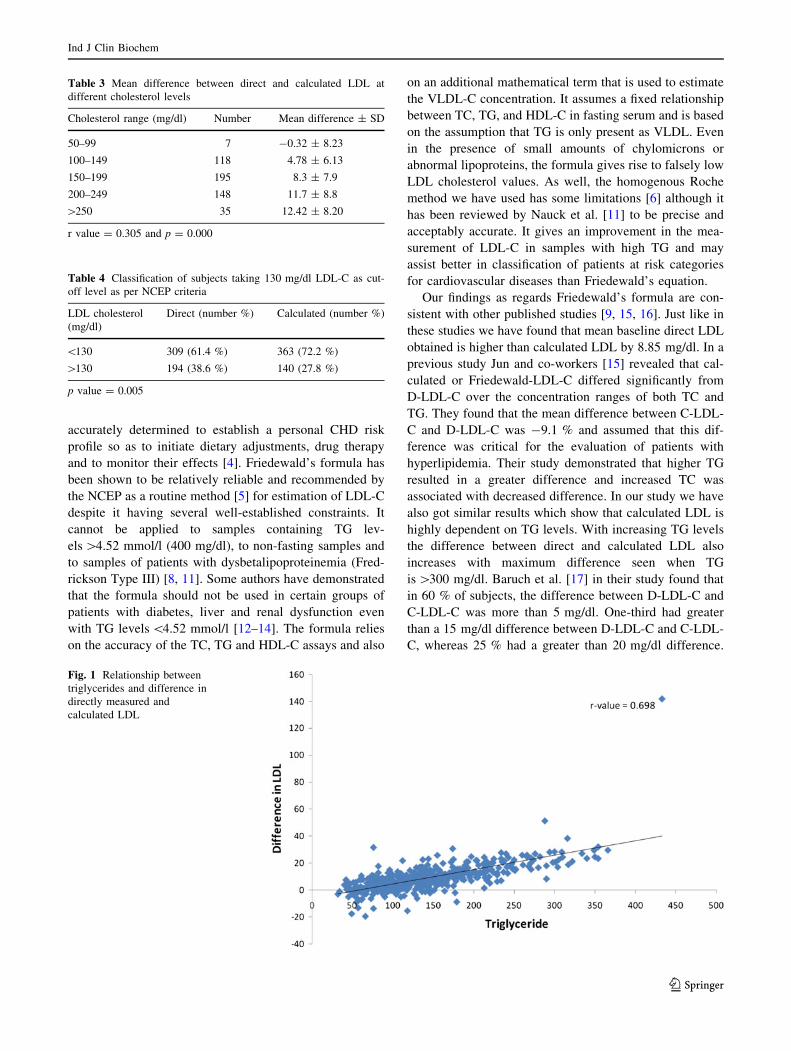
The difference between direct and calculated LDL was seen
at all levels of TG. It was 8.65 ± 6.1 mg/dl when TG was
between 101 and 200 mg/dl and increased up to 17.02 ±
7.73 mg/dl with TG between 201 and 300 mg/dl. Maximum
difference of 25.6 ± 5.70 mg/dl was seen when the level of
TGs was between 301 and 400 mg/dl (p = 0.000 and
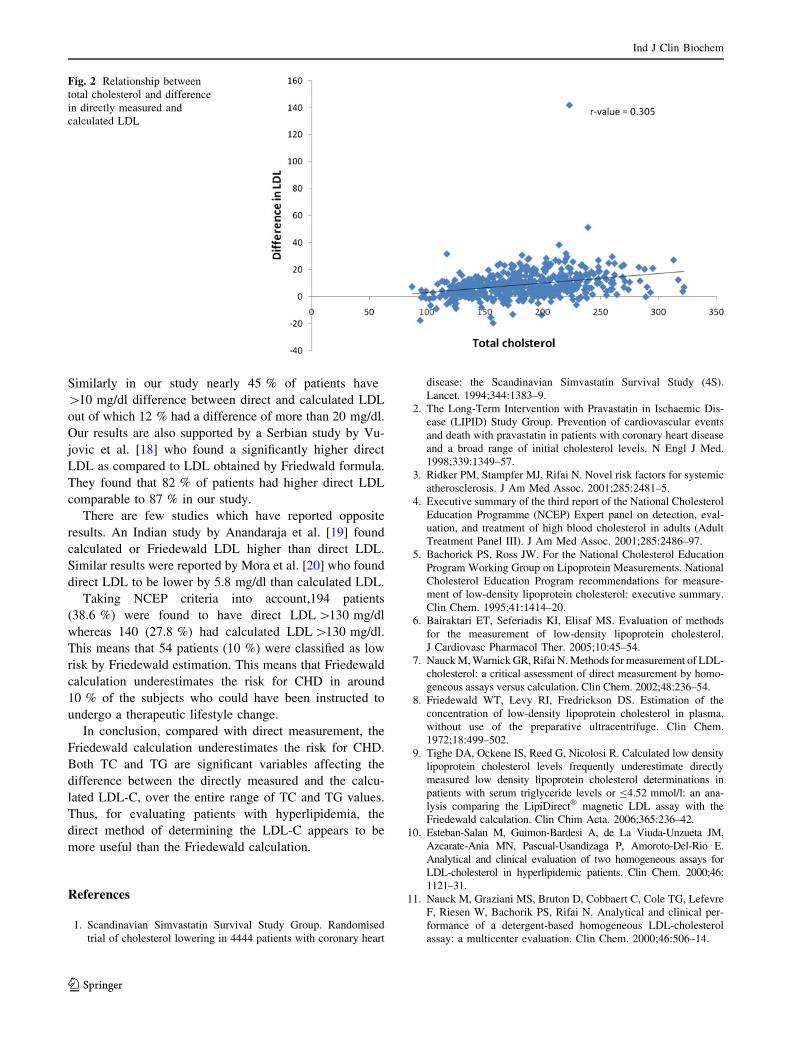
r = 0.698). Similar result was seen when the difference was
compared at different levels of TC (p = 0.000 and r = 0.305)
except at low levels (50–99 mg/dl) (Table 3). Subjects were
divided into two categories taking NCEP criteria of 130 mg/dl
LDL cholesterol as cut off. It was seen that more number of
subjects were classified into higher risk category ([130 mg/dl)
by using direct LDL measurement than by calculated LDL
(Table 4). Figures 1 and 2 show a positive correlation
between the difference between direct and calculated LDL
and increasing levels of TG (r = 0.698) and cholesterol
(r = 0.305).
Discussion
Strategies for treatment of lipid abnormalities are primarily
based on LDL-C concentration. Therefore, LDL-C must be
Table 1 Mean baseline values
Age 51.40 ± 12.39 years
Total cholesterol 184.01 ± 43.89 mg/dl
Triglyceride 139.92 ± 65.82 mg/dl
HDL cholesterol 46.60 ± 12.28 mg/dl
Direct LDL cholesterol 118.10 ± 38.47 mg/dl
Calculated LDL cholesterol 109.46 ± 36.30 mg/dl
Table 2 Classification of subjects depending on the difference
between direct and calculated LDL
Difference between direct and calculated
LDL (mg/dl)
Number Percentage
\10 242 55.2
10–20 144 32.9
[20 52 11.9
Mean difference between direct and calculated cholesterol was
8.64 ± 8.35 mg/dl. p value = 0.000
Ind J Clin Biochem
123
accurately determined to establish a personal CHD risk
profile so as to initiate dietary adjustments, drug therapy
and to monitor their effects [4]. Friedewald’s formula has
been shown to be relatively reliable and recommended by
the NCEP as a routine method [5] for estimation of LDL-C
despite it having several well-established constraints. It
cannot be applied to samples containing TG lev-
els [4.52 mmol/l (400 mg/dl), to non-fasting samples and
to samples of patients with dysbetalipoproteinemia (Fred-
rickson Type III) [8, 11]. Some authors have demonstrated
that the formula should not be used in certain groups of
patients with diabetes, liver and renal dysfunction even
with TG levels \4.52 mmol/l [12–14]. The formula relies
on the accuracy of the TC, TG and HDL-C assays and also
on an additional mathematical term that is used to estimate
the VLDL-C concentration. It assumes a fixed relationship
between TC, TG, and HDL-C in fasting serum and is based
on the assumption that TG is only present as VLDL. Even
in the presence of small amounts of chylomicrons or
abnormal lipoproteins, the formula gives rise to falsely low
LDL cholesterol values. As well, the homogenous Roche
method we have used has some limitations [6] although it
has been reviewed by Nauck et al. [11] to be precise and
acceptably accurate. It gives an improvement in the mea-
surement of LDL-C in samples with high TG and may
assist better in classification of patients at risk categories
for cardiovascular diseases than Friedewald’s equation.
Our findings as regards Friedewald’s formula are con-
sistent with other published studies [9, 15, 16]. Just like in
these studies we have found that mean baseline direct LDL
obtained is higher than calculated LDL by 8.85 mg/dl. In a
previous study Jun and co-workers [15] revealed that cal-
culated or Friedewald-LDL-C differed significantly from
D-LDL-C over the concentration ranges of both TC and
TG. They found that the mean difference between C-LDL-
C and D-LDL-C was -9.1 % and assumed that this dif-
ference was critical for the evaluation of patients with
hyperlipidemia. Their study demonstrated that higher TG
resulted in a greater difference and increased TC was
associated with decreased difference. In our study we have
also got similar results which show that calculated LDL is
highly dependent on TG levels. With increasing TG levels
the difference between direct and calculated LDL also
increases with maximum difference seen when TG
is [300 mg/dl. Baruch et al. [17] in their study found that
in 60 % of subjects, the difference between D-LDL-C and
C-LDL-C was more than 5 mg/dl. One-third had greater
than a 15 mg/dl difference between D-LDL-C and C-LDL-
C, whereas 25 % had a greater than 20 mg/dl difference.
Table 3 Mean difference between direct and calculated LDL at
different cholesterol levels
Cholesterol range (mg/dl) Number Mean difference ± SD
50–99 7 -0.32 ± 8.23
100–149 118 4.78 ± 6.13
150–199 195 8.3 ± 7.9
200–249 148 11.7 ± 8.8
[250 35 12.42 ± 8.20
r value = 0.305 and p = 0.000
Table 4 Classification of subjects taking 130 mg/dl LDL-C as cut-
off level as per NCEP criteria
LDL cholesterol
(mg/dl)
Direct (number %) Calculated (number %)
\130 309 (61.4 %) 363 (72.2 %)
[130 194 (38.6 %) 140 (27.8 %)
p value = 0.005
Fig. 1 Relationship between
triglycerides and difference in
directly measured and
calculated LDL
Ind J Clin Biochem
123
Similarly in our study nearly 45 % of patients have
[10 mg/dl difference between direct and calculated LDL
out of which 12 % had a difference of more than 20 mg/dl.
Our results are also supported by a Serbian study by Vu-
jovic et al. [18] who found a significantly higher direct
LDL as compared to LDL obtained by Friedwald formula.
They found that 82 % of patients had higher direct LDL
comparable to 87 % in our study.
There are few studies which have reported opposite
results. An Indian study by Anandaraja et al. [19] found
calculated or Friedewald LDL higher than direct LDL.
Similar results were reported by Mora et al. [20] who found
direct LDL to be lower by 5.8 mg/dl than calculated LDL.
Taking NCEP criteria into account,194 patients
(38.6 %) were found to have direct LDL [130 mg/dl
whereas 140 (27.8 %) had calculated LDL [130 mg/dl.
This means that 54 patients (10 %) were classified as low
risk by Friedewald estimation. This means that Friedewald
calculation underestimates the risk for CHD in around
10 % of the subjects who could have been instructed to
undergo a therapeutic lifestyle change.
In conclusion, compared with direct measurement, the
Friedewald calculation underestimates the risk for CHD.
Both TC and TG are significant variables affecting the
difference between the directly measured and the calcu-
lated LDL-C, over the entire range of TC and TG values.
Thus, for evaluating patients with hyperlipidemia, the
direct method of determining the LDL-C appears to be
more useful than the Friedewald calculation.
References
1. Scandinavian Simvastatin Survival Study Group. Randomised
trial of cholesterol lowering in 4444 patients with coronary heart
disease: the Scandinavian Simvastatin Survival Study (4S).
Lancet. 1994;344:1383–9.
2. The Long-Term Intervention with Pravastatin in Ischaemic Dis-
ease (LIPID) Study Group. Prevention of cardiovascular events
and death with pravastatin in patients with coronary heart disease
and a broad range of initial cholesterol levels. N Engl J Med.
1998;339:1349–57.
3. Ridker PM, Stampfer MJ, Rifai N. Novel risk factors for systemic
atherosclerosis. J Am Med Assoc. 2001;285:2481–5.
4. Executive summary of the third report of the National Cholesterol
Education Programme (NCEP) Expert panel on detection, eval-
uation, and treatment of high blood cholesterol in adults (Adult
Treatment Panel III). J Am Med Assoc. 2001;285:2486–97.
5. Bachorick PS, Ross JW. For the National Cholesterol Education
Program Working Group on Lipoprotein Measurements. National
Cholesterol Education Program recommendations for measure-
ment of low-density lipoprotein cholesterol: executive summary.
Clin Chem. 1995;41:1414–20.
6. Bairaktari ET, Seferiadis KI, Elisaf MS. Evaluation of methods
for the measurement of low-density lipoprotein cholesterol.
J Cardiovasc Pharmacol Ther. 2005;10:45–54.
7. Nauck M, Warnick GR, Rifai N. Methods for measurement of LDL-
cholesterol: a critical assessment of direct measurement by homo-
geneous assays versus calculation. Clin Chem. 2002;48:236–54.
8. Friedewald WT, Levy RI, Fredrickson DS. Estimation of the
concentration of low-density lipoprotein cholesterol in plasma,
without use of the preparative ultracentrifuge. Clin Chem.
1972;18:499–502.
9. Tighe DA, Ockene IS, Reed G, Nicolosi R. Calculated low density
lipoprotein cholesterol levels frequently underestimate directly
measured low density lipoprotein cholesterol determinations in
patients with serum triglyceride levels or B4.52 mmol/l: an ana-
lysis comparing the LipiDirect� magnetic LDL assay with the
Friedewald calculation. Clin Chim Acta. 2006;365:236–42.
10. Esteban-Salan M, Guimon-Bardesi A, de La Viuda-Unzueta JM,
Azcarate-Ania MN, Pascual-Usandizaga P, Amoroto-Del-Rio E.
Analytical and clinical evaluation of two homogeneous assays for
LDL-cholesterol in hyperlipidemic patients. Clin Chem. 2000;46:
1121–31.
11. Nauck M, Graziani MS, Bruton D, Cobbaert C, Cole TG, Lefevre
F, Riesen W, Bachorik PS, Rifai N. Analytical and clinical per-
formance of a detergent-based homogeneous LDL-cholesterol
assay: a multicenter evaluation. Clin Chem. 2000;46:506–14.
Fig. 2 Relationship between
total cholesterol and difference
in directly measured and
calculated LDL
Ind J Clin Biochem
123
12. Bairaktari ET, Tzallas C, Kalientzidou M, Tselepis AD, Siamo-
poulos KC, Seferiadis KI, Elisaf M. Evaluation of alternative
calculation methods for determining low-density lipoprotein
cholesterol (LDL-C) in hemodialysis patients. Clin Biochem.
2004;37:937–40.
13. Rubies-Prat J, Reverter JL, Senti M, Pedro-Botet I, Salinas I,
Lucas A, Nogues X, Sanmartı̀ A. Calculated low-density lipo-
protein cholesterol should not be used form management of
lipoprotein abnormalities in patients with diabetes mellitus.
Diabetes Care. 1993;16:1081–6.
14. Matas C, Cabre M, La Ville A, Prats E, Joven J, Turner PR,
Masana L, Campus J. Limitations of the Friedewald formula for
estimating low-density lipoprotein cholesterol in alcoholics with
liver disease. Clin Chem. 1994;40:404–6.
15. Jun KR, Park H, Chun S, Park H, Min WK. Effects of total
cholesterol and triglyceride on the percentage difference between
the low-density lipoprotein cholesterol concentration measured
directly and calculated using the Friedewald formula. Clin Chem
Lab Med. 2008;46(Supp 3):371–5.
16. Marniemi J, Maki J, Maatela J, Jarvisalo J, Impivaara O. Poor
applicability of the Friedewald formula in the assessment of
serum LDL cholesterol for clinical purposes. Clin Biochem.
1995;28:285–9.
17. Baruch L, Agarwal S, Gupta B, Haynos A, Johnson S, Kelly-
Johnson K, Eng C. Is directly measured low density cholesterol
clinically equivalent to calculated low density cholesterol? J Clin
Lipidol. 2010;4(4):259–64.
18. Vujovic A, Kotur-Stevuljevic J, Spasic S, Bujisic N, Martinovic
J, Vujovic M. Evaluation of different formulas for LDL calcu-
lation. Lipids Health Dis. 2010;9:27.
19. Anandaraja S, Narang R, Godeswar R, Laksmy R, Talwar KK.
Low-density lipoprotein cholesterol estimation by a new formula
in Indian population. Int J Cardiol. 2005;102:117–20.
20. Mora S, Rifai N, Buring JE, Ridker PM. Comparison of LDL
cholesterol concentration by Friedewald calculation and direct
measurement in relation to cardiovascular events in 27331
women. Clin Chem. 2009;55:888–94.
Ind J Clin Biochem
123