Embed Size (px)
Citation preview

Does Forsyth County’s Affordable Home Ownership Program
Build Wealth and Spur Economic Mobility?
Outcomes for a Sample of 508 Participants
Zachary Blizard and Craig Richardson
Center for the Study of Economic Mobility
Winston-Salem State University
March 31, 2021
This report is based on a larger CSEM working paper, titled “Analysis of the Forsyth County, North
Carolina Homeownership Program Outcomes.” This report details in depth the research programs’
methodologies and includes other results.

1
Executive Summary
The American dream is partially rooted in the promised satisfaction of home ownership. With that promise comes the building of
wealth and assets as property values rise over time. Wealth then transfers to future generations, as children and grandchildren have a
“leg up” for their own home purchases. Home ownership also vests people in their neighborhoods, changing their perspectives about
new improvements and investments. Any upgrade to their surroundings is now essentially a windfall bonus to their property value
rather than seen as a potential threat of rising rents and displacement. Lack of access to home ownership, on the other hand, contributes
to growing wealth gaps along socioeconomic lines, particularly between whites and Blacks.
However, purchasing a house is beyond the bounds of many low-income families, due to the burden of saving for a down payment
and often unavailable credit for smaller mortgages.1 At the same time, the Great Recession of 2008-9 came about because of Federal
policies that strongly encouraged home ownership, but with irresponsible economic policies that fostered reckless lending practices
and led to millions of foreclosures. Home prices at the lowest price tier have never recovered in value.2 Thus, how much wealth-
building actually happens in home ownership has been an open empirical question, particularly in the realm of government programs
that promote it. It requires painstaking work to track the lives of people over time as well as the changes in variables that define how
their wealth is measured in terms of property values. It is also important to track their success in holding onto their properties over
time and avoiding foreclosures. A foreclosure can be worse than never purchasing a house at all since it can lead to bankruptcy,
longstanding debts, and a negative net worth.
The Center for the Study of Economic Mobility (CSEM), based at Winston-Salem State University, North Carolina embarked on an
independent assessment of the Forsyth County Homeownership Program (FCHP), administered by our Forsyth County’s Department
of Community and Economic Development (CED). This housing program is a public-private partnership, with many government
sources contributing funds to the program, though only a small amount (around $2,000) is never paid back. Additionally, private
businesses (banks and mortgage companies) lend to participants and assist in training them, especially participants in the IDA portion
of the housing program.
Despite operating for decades, and helping over 800 participants become first-time homeowners, the FCHP program relied on
anecdotal feedback, because of lean budgets that did not allow for in-depth empirical analysis. Invited by the county, CSEM saw an
opportunity for taking an in-depth look at this program, using tried and true statistical techniques and analysis. The long-term goal of
the CSEM project is to analyze the effect of the FCHP on wealth accumulation, living standards and other measures of quality of life
for the participants.
Essentially, the big question is: “What is the return on investment for this program, which has operated for decades? Is the county
spending too much, too little or just right?”
Our study examines a subsample of 508 homeowners since 2004 since the data were not accurate in prior years. CSEM received no
payment from any group or institution for this analysis, thus assuring a full and candid assessment of this program. However, we
received full cooperation from the county in sharing the data and helping us input to input data by hand from hundreds of notebooks-
each containing information on the individual homeowner. (In addition, a CSEM documentary around this program is also in the
works.)
Note that the FCHP program has two primary branches, the Individual Development Account (IDA) and non- IDA. Participants in the
non-IDA program are not required to undergo substantial financial training and preparation prior to receiving the down payment
subsidy, while those in the IDA program are required to undergo significant training and preparation. For example, IDA participants
are required to regularly meet with financial planners and budget organizers, and to participate in monthly financial meetings for an
entire year prior to receiving any funds. Hence, the IDA is a “high touch” program that works closely with participants to not only
improve long term financial outcomes, but to improve financial literacy and related behaviors. This gave CSEM an opportunity to
analyze both groups and compares outcomes in this paper around the question of wealth accumulation, predictors of foreclosure rates
and the rate of return for each government dollar invested in the program. Our results show strong success as well as areas that the
county can focus on to further improve outcomes. Some of the most significant findings follow on the next page.
1 Eisen, B. (2019). Small mortgages are getting harder to come by: Lenders are offering fewer mortgages for cheaper properties even while racing
to serve deep-pocketed home buyers. The Wall Street Journal. Retrieved WSJ Website. 2 Id. at 1.

2
Center for the Study of Economic Mobility Findings:
Outcomes of the Forsyth County Affordable Home Ownership Program
(n = 508 participants, years 2004-2018).
Net Wealth Accumulation
For every $1 of county government dollars spent on the program, $5.49 of homeowner equity is generated.
Total net equity created from the program is $24.9 million and the average net equity for the homeowner is
$48,986, after an average 9.1 years in the program.
Blacks and whites had very similar outcomes regarding wealth-building.
IDA participants accumulated 19.7% more net wealth than non-IDA participants.
Paid Property Taxes
Of the 508 participants, as of October 2020, they have paid $6.2 million in property taxes. Per participant, the
average property taxes paid is around $12,255 over an average of 9.1 years.
Foreclosures
Of the 508 participants, as of October 2020, only 7.9% have had their houses foreclosed over the 15 year study
period, and nearly all around the years of the Great Recession.
Though low, the probability of participant being foreclosed upon significantly increased under the following
conditions:
1. single head of household
2. low credit scores
3. higher debt ratio
4. part-time employment status.
Home Values
From 2005 to 2020, the average FCHP participant’s home has appreciated by around 32.2%.
Participants with higher credit scores purchased homes that tended to remain more valuable.
Those with higher debt ratios bought homes that remain less valuable.
Cost to County Government
The cost of the program- counting the county government gifted funds not repaid, lost interest on county
government down payment loans, and unrecoverable loans due to foreclosures, was $4.5 million for 508 recipients
over the 15 years studied. The net equity created for these recipients was $24.9 million with other unmeasured
spillover effects associated with home ownership.
The data and information surrounding the FCHP are vast. We intend to continue analyzing what we find and publishing
our results. Therefore, this report is likely to be one of multiple reports. Future reports will include analyses of pre- and
post-move neighborhood comparisons (crime rates, demographic compositions, etc.), migration analyses, and deeper dives
into home values, among other things. In addition to analyzing currently available data, representatives from Forsyth
County’s CED Department are interested in creating a survey that asks past FCHP participants to describe their quality of
life after receiving the down payment subsidy and financial training. This survey will serve to gauge these household’s
health, access to jobs, social mobility, satisfaction with local education, and overall well-being.

3
Introduction
Forsyth County’s department of Community and Economic Development (CED) directs a
housing program to promote home ownership among low-income residents in Forsyth County,
NC, known as the Forsyth County Homeownership Program (FCHP). The program seeks to
promote home ownership by subsidizing down payments, which is a primary obstacle to ownership
among low-income residents. Low-income residents often lack savings to support a down payment,
hence, they tend to rent. Owning a home compared to renting provides the opportunity of building
equity and, in turn, growing wealth. Hence, low-income residents, who often live paycheck-to-
paycheck, are missing out on a potentially powerful opportunity to climb the economic ladder. As
of 2018, over 800 low-income residents have purchased homes as a result of participating in this
program. This housing program is a public-private partnership, with many state and federal
government sources contributing funds to the program. Additionally, private businesses (banks
and mortgage companies) lend to participants and assist in training them, especially participants
in the IDA portion of the housing program.
The program has two primary branches, Individual Development Account (IDA) and non-
IDA. Participants in the non-IDA program are not required to undergo substantial financial training
and preparation prior to receiving the down payment subsidy, while those in the IDA program are
required to undergo significant training and preparation. For example, IDA participants are
required to regularly meet with financial planners and budget organizers, and to participate in
monthly financial meetings for an entire year prior to receiving any funds. Hence, the IDA is a
“high touch” program that works closely with participants to not only improve long term financial
outcomes, but to improve financial literacy and related behaviors.
The FCHP has not been previously analyzed and, thus, the return on investment by Forsyth
County is not well understood except through anecdotal examples. Home ownership has always
been viewed as a mechanism for upward mobility and an embodiment of the of the American
Dream. Additionally, this program has been able to align the main societal players-business,
individuals, and governments, providing benefits to all three entities. The FCHP also addresses
long standing differences in wealth accumulation between racial groups and provides a potential
mechanism for narrowing this gap.
The goal of this Center for the Study of Economic Mobility (CSEM) project is to analyze
the effect of the FCHP on wealth accumulation, living standards and other measures of quality of
life for the participants. Our study examines 508 homeowners for which data is available and
accurate. Although there have been over 800 people who have participated in the CEDD program
since the 1990s, the present analysis only uses participants that participated after 2004. The reason
is because prior to 2005, participant records were not recorded and stored in a standardized and
structured way, making it nearly impossible to include these records in an analysis. In consultation
with the Director of CED, Dan Kornelis, it was decided that the analysis should only be carried
out on the post-2004 participants. Also, the 508 participants used in the present analysis had all
necessary data. There were some post-2004 participants who were missing critical information,
such as address information. Additionally, there were a number of participants who moved into
Forsyth County, NC from other states, such as Virginia, New York, and Georgia. These were
participants were not included in the analysis either to focus solely on original Forsyth County
residents. This report highlights a set of key findings from the overall CSEM project, which are
summarized on page 17.

4
Data The analysis dataset is comprised of housing data and recipient data. The housing data can
be divided into two categories: Physical information and Property information. The recipient data
also fits into two categories: Financial information and Demographic information. Table 1 lists
and describes all housing variables, and Table 2 lists and describes all recipient variables.
Table 1: Housing Data.

5
Table 2: Recipient Data
Summary statistics were generated to get a high-level view of our dataset. Table 3 displays
the mean and standard deviation all continuous numeric variables used in this analysis. Table 4
displays the percentage breakdown of the non-continuous numeric and factor variables used in this
analysis.
The average participant is around 37 years old and lives in a household with around 3
people. The average credit score is 656 and the average debt-to-income ratio is 0.3. The mean
payment-to-income ratio is 0.3. Of the houses that participants purchased, the average number of
bedrooms is 3 and the average square footage is around 1,369. Program participants have average
annual incomes of $31,216 and their new mortgages are average $664 a month. This means the
monthly mortgage is about 1/4th of the participants’ gross monthly income. On average,

6
participants have lived in their purchased homes, as of October 2020, for around 9 years. Per
participant, the mean accumulated wealth, as of October 2020, is around $48,986.
Table 3. Descriptive Statistics for Continuous Variables3
Table 4 contains the percentage breakdown of the categorical variables used. The majority
(> 70.0%) of participants identify as non-Hispanic Black and are single heads of household
(>76.0%). Most participants earn an hourly wage (>74.0%) and work full-time (>85.0%). Around
38.4% of the sample participated in the IDA program. Approximately 27.9 percent of participants
purchased their homes during the Great Recession. The majority of participants purchased their
new homes in Winston-Salem (>77.0%), with Rural Hall and Kernersville making up a bit more
than 15.0% and smaller neighborhoods comprising the rest.
3 All have an N = 508, except for the natural log of accumulated wealth, which has an N = 455. The reason is because 53 participants
have yet to accumulate any net wealth as of October 2020. Hence, there net wealth is either $0 or a negative number. The natural
log can only be taken for a number greater than zero.

7
Table 4. Percentage Breakdown of Non-Continuous Variables

8
Analysis
Home Values
One of the desired products of the CSEM project is to understand how participants’
property values behaved and to visualize trends in these market values for various groups of
participants. To create these visuals, estimates of market values were calculated using housing
sales data. Also, Zillow estimates were included as a comparison. Figure 1 plots the results from
2005 through 2020. In 2005, the average market value of the participants’ homes was just over
$100,000, while the average market value of all Forsyth County homes was around $150,000. The
trends of both over the 15-year timeframe are very similar.4
Figure 1. Trends in Home Values
From 2005 to 2020, FCHP Values +32.3%
Figure 2 shows the percentage change in home values adjusting for time. Participants who
have lived in their homes for longer tend to experience greater appreciation, which can distort the
picture of growth rates across the municipalities. The plotted values of the growth rates have been
adjusted to reflect this. The average percentage change in the home values in Rural Hall are used
as the reference point.5 Hence, the plotted rates are relative rates – relative to Rural Hall. According
4 Note that our market value estimates are consistently higher than those from Zillow. This could be because Zillow’s approach
underestimates home values in Forsyth County, especially considering that we have more and better data regarding sales in the
county than Zillow does. Nevertheless, it could be due to the fact that our process overestimates home value estimates in the county.
We rely on the county’s square footage data to include in the denominator of the market value formula. It appears that, in some
cases, the county under-records the square footage sizes of homes. Hence, if this is widespread, we are likely underestimating the
sizes of homes, which would in fact result in us overestimating their value. 5 These time adjusted rates were calculated using a linear regression. The percentage change in home values, for each participant,
was regressed on a variable indicating the years in which the participant lived in the home and the municipality where the new
house is located. In the model, an omitted category has to be chosen to avoid perfect multicollinearity. To avoid this, Rural Hall
was chosen as this category.
9
to the results, participants who moved to Lewisville (N=5) and Pfafftown (N=11) experienced the
greatest appreciation, while the participants who moved to Tobaccoville, King, and Germanton
(N=6) experienced the greatest depreciation.
Figure 2. Percentage Change in Home Values, Adjusting for Time
The histogram in Figure 3 shows the average % change in home values, from the moment
of purchase to the most recent moment in which the participant still lived in the house, conditional
on the time frame in which the house was constructed. Participants’ homes that were built in 1970-
1989 experienced the highest percentage change over the course of time in which participants lived
there.
Figure 3. Average % Change in Home Value and Year of Home Construction
Figure 4 shows the market value of all the participants' new homes from 2005 through
2018, by various credit score levels. Generally, participants with the lowest credit scores, at the
time of closing, bought properties that tended to maintain lower values, while those with higher
credit scores bought properties that tended to maintain higher values.

10
Figure 4. Market Values and Credit Scores
Figure 5 below shows the market value of all the participants' new homes from 2005
through 2018, by various debt ratio levels. Participants with the highest debt ratios tended to
purchase homes that maintained lower market values. However, participants with debt ratios
between 0.34 to 0.38 bought homes that maintained the highest market values.
Figure 5. Market Values and Debt Ratios

11
Accumulated Net Wealth
For the 508 participants, we estimate the total net equity accumulated. Total equity is equal
to the sum of the principal of loan paid as of October 2020, the appreciation of the house, and the
participant’s own money put towards the down payment on the house. From this, we subtract the
debt these participants have from publicly funded loans. Below, we provide an illustrative example
of how net equity is calculated.
Conceptual Example 1
This example involves a fictional participant, named Michelle, illustrated in Figures E.1-E.5. She
buys a $147,000 home. She receives a $120,000 30-year fixed mortgage loan from the bank. The
down payment is $27,000, which is comprised of multiple sources. Michelle receives a $20,000
deferred payment 0 interest loan from the NCHFA, which she will pay back at the end of the 30
years. Michelle puts down $5,000 of her own savings towards the down. The remaining $2,000 of
the total down payment is funded from gifted funds, which Michelle will not have to pay back.
Figure E.1: Source of Funds for $147,000 Home
In the first year, notice that her house has not appreciated in value yet (blue bar in Figure E.2). The
last bar (green), represents Michelle’s Total Net Worth at the time, which, in this case, is equal to
$7,000. The first red bar represents the bank loan ($120,000) and the second red bar represents the
NCHFA loan ($20,000). Her Net Worth is just the current value of her home ($147,000) minus
her total debt ($140,000).
12
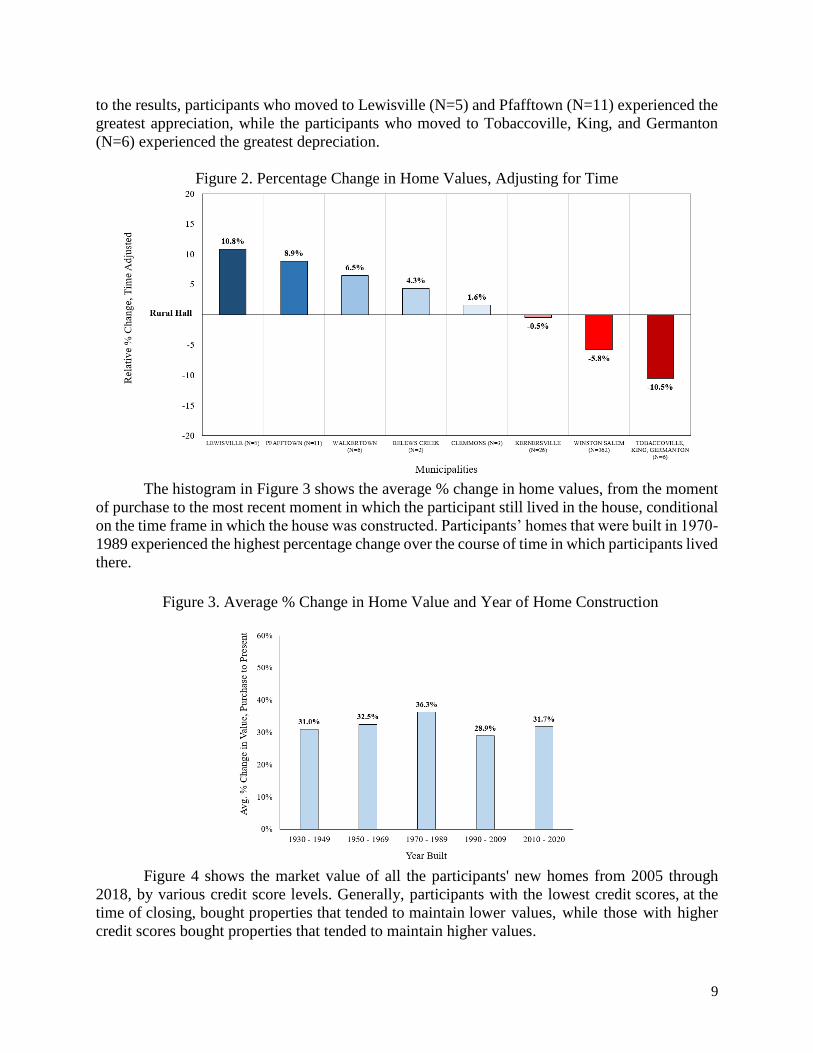
Figure E.2: Michelle’s First Year in Home Bought for $147,000
Note: Figure E.2 reflects a hypothetical $7,000 in down payment assistance, that reduced the size of the original bank loan.
In Michelle’s tenth year in the home, her accumulated equity picture has changed (see Figure E.3).
She has paid off $40,000 of the bank loan principal, evidence by the reduction in the first red bar.
This sum transfers to her net worth (green bar). Her home has appreciated in value. Since the first
year in her home, its value has increased from $147,000 to $188,270, over the last 10 years (blue
bar). This value is also transferred to Michelle’s net worth. Now, her total net worth is $88,270.
Figure E.3: Michelle’s Tenth Year in Home Bought for $147,000
Note: Figure E.3 reflects a hypothetical $7,000 in down payment assistance, that reduced the size of the original bank loan.
By her 20th year in the home, Michelle has paid off $80,000 of loan’s principal, all of which is
added to her net worth (see Figure E.4). Her home’s value has also appreciated. Since the 10th year,
the home’s value has appreciated from $188,270 to $243,733.6 This adds to Michelle’s net worth.
As of her 20th year in her home, her net worth is equal to $183,733.
6 For this example, we assume a 2.6% annual appreciation rate.

13
Figure E.4: Michelle’s 20th Year in Home Bought for $147,000
Note: Figure E.4 reflects a hypothetical $7,000 in down payment assistance, that reduced the size of the original bank loan.
By Michelle’s 30th year in her home, she has now fully paid off the bank loan (see Figure E.5).
The full principal of the bank loan is now transferred to her net worth. Additionally, her home’s
value has continued to appreciate. Since the 20th year, the home has appreciated from $243,733
to $318,271. Her net worth now stands at $298,271. Now that she has fully paid off her loan and
has lived in her house for 30 years, she will soon be required to pay back the $20,000 loan received
from the NCHFA.
Figure E.5: Michelle’s 30th Year in Home
Note: Figure E.5 reflects a hypothetical $7,000 in down payment assistance, that reduced the size of the original bank loan.
Using the process described above for the 508 participants, the result is the total net equity.
As of October 2020, total net equity is around $24.9 million, after an average of 9.1 years in the
program. Per participant, this is around $48,986 during the same time frame, an accumulation of
$5,383 in net equity per year.

14
Table 5. Total Net Equity7
FCHP allocated public funds as loans, which is money the county government will
eventually recoup. There are some funds given to participants that the county government simply
gifts to participants. Of the 508 participants, around 53% did not received any gifted funds. The
distribution in Figure 6 shows how gifted funds were allocated. Just over 26 percent received
between $3,000 and $4,000.
Figure 6. Distribution of Gifted Funds
With the total county funds and the net equity calculated, we then estimate the lost interest
on county government loans since they were provided to participants interest free. Using treasury
bond rates, we find that as of October 2020, lost interest on these funds is equal to approximately
$2,629,236. The sum of gifted funds, lost interest, and unrecoverable loans from foreclosures is
equal to $4,524,508 (total costs).8 With the costs calculated, we can then calculate the return on
investment (ROI). This is summarized in Table 6 below. Taking the net equity and dividing it by
the total costs, we get the ROI which is equal to 5.49. Interpreting the ROI, for every $1 dollar
spent on the program, $5.49 of accumulated equity is generated.
7 Note: The Total Debt from Government Loans, as was stated earlier, includes the 0% interest loans from NCHFA, NSP, and the
WS/FC Consortium HOME funds. In general, these loans will be repaid by the participant when the home is paid off, sold, or no
longer occupied by the homeowner, or a cash-out refinance occurs. However, if the home is foreclosed on, we assume that the
county then becomes responsible for paying back the loans. 8 Total gifted funds = $1,048,247, Lost interest on county government loans = $2,629,236, and Unrecoverable loans from
foreclosures = $847,025.

15
Table 6. Return on Investment
We examine how net equity varies across groups pf participants. If systematic differences
exist, this can better help the CED target certain participants, especially to offset any potential “red
flags” in outcomes. To analyze these average differences, we adjust accumulated wealth by time
and timing.9 We analyzed differences across relationship statuses, specifically married, single, and
divorced participants. We do this using both a paired t-test and a simple linear regression. Though
there are differences, none of them are statistically significant. We also analyzed racial differences
in accumulated wealth. Like for marital status, there are not significant differences in FCHP
outcomes across racial groups, in terms of accumulated wealth.
Benefits to the County, from Paid Property Taxes
We estimate the total property taxes paid by FCHP since they purchased their homes till
October of 2020. For the 508 participants in our sample, they have paid around $6.2 million in
property taxes.
Table 7. Property Taxes Paid by FCHP10
Modeling Foreclosures
Among the 508 participants, 40 of them had their homes foreclosed, or 7.9% of the total.
The 40 foreclosures were spread across many of the years largely between 2008 to 2014 (see Figure
9). The first set of foreclosures occurred in 2008, where 6 of the 40 participants had their homes
foreclosed on. Note that 39 of the 40 foreclosures occurred within six years of the 2008 Great
Recession, and only one foreclosure has occurred since then.
9 We adjust for time because participants who have owned their home for more years will have accumulated more wealth because
they have paid off a greater amount of the loan principal. Regarding timing, we adjust accumulated wealth by when participants
purchased their homes relative to the Great Recession (Before, During, or After). To estimate these average differences, adjusted
for time and timing, we estimate simple linear regressions 10 To estimate property taxes paid, we used the tax assessment values for each property and the appropriate property tax rates, for
each relevant year. For each year in which participants live in their home, we multiply the tax assessed value of it by the
appropriate tax rate. Taxes paid are prorated, since some participants purchased their new homes in the middle of a given year.

16
Figure 7. Distribution of Total Foreclosures, 2005-2020 (n=40)
Table 8 presents the rate of foreclosures by IDA status. Participants of IDA program had a
8.2% foreclosure rate, while non-IDA participants had a foreclosure rate of 7.7%. This is an
important result worth highlighting because it suggests the IDA participants did not have
substantially different foreclosure outcomes from the non-IDA participants.11
Table 8. Foreclosures and IDA Status
Table 9 contains the results of a logistic regression. The estimated model has Foreclosure
as the variable to predict. The explanatory variables are age at purchase, whether the participant is
black, whether the participant is a single head of household, credit score at purchase, debt ratio,
income, whether the participant is a salaried employee, whether he/she is a full-time employee,
monthly mortgage, whether the participant purchase before or after the Great Recession, and the
new city where the participant moved.
11 A chi-square test shows the difference between the foreclosure rates to be highly statistically insignificant.
17
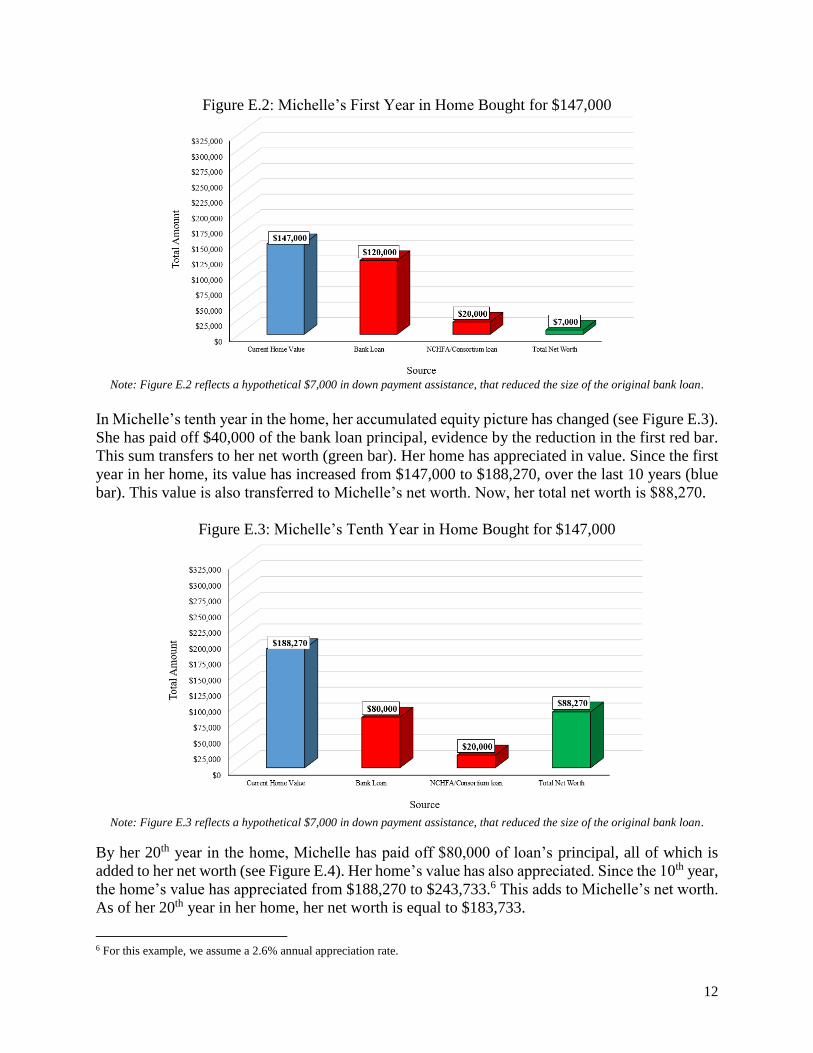
Table 9. Modeling Foreclosure12
Five of the marginal effects are statistically significant at least at the 5% level, which are
the two single head of household indicator variables, credit score, debt ratio, full-time employee
indicator, and the indicator for buying after the Great Recession. The marginal effect for the full-
time employment indicator is significant at the 10% level. We summarize the results as follows
(See Table 10):
Table 10. Summary of Logistic Regression Results
12 To interpret results of a logistic regression, logit coefficient estimates must be transformed into marginal effects. Marginal
effects allow for the results to be interpreted as changes in the probability, as a result of a unit change in a particular covariate.
The effects in Table 9 were calculated by holding the variables constant at their means.

18
Modeling Accumulated Net Wealth
Table 11 displays the results from a linear regression. In this model, the dependent variable
is the natural log of accumulated net wealth, from moment of purchase to October 2020, as a result
of purchasing a home as a FCHP participant. The independent variables include the participants’
race, disability status, age at purchase, head of household status, size of household, credit score at
purchase, debt ratio, payment-to-income ratio, income, employment type, employee type, IDA
status, years in the home as of October 2020, monthly mortgage, time of purchase relative to Great
Recession, location of new home, square footage of home, and number of bedrooms in new home.
Table 11. Modeling Accumulated Net Wealth
Eight of the coefficient estimates are significant at least at the 5% level, which are credit
score, square footage of home, number of bedrooms, whether the participant is an IDA participant,
years in home as of October 2020, whether participant purchased home before or after the Great
Recession, and whether participant purchased a home in an Other town (Clemmons, Lewisville,
etc.) relative to Winston-Salem. We interpret the results as follows (see Table 12):

19
Table 12. Summary of Linear Regression Results13
Discussion
The FCHP is a program that has wide ranging effects, not only on the participants
themselves, but also Forsyth County’s larger community. In this brief, we have presented and
discussed a handful of key findings from the CSEM project. In general, our findings suggest that
this program is a highly effective mechanism to promote wealth accumulation among low-income
people. Not only is it effective at generating wealth, it also appears to be a highly efficient and cost
effective program.
Key Set of Findings
Net Wealth 14
For every $1 dollar spent on the program, $5.49 of accumulated equity is generated.
Total net equity is equal to $24.9 million and the average net equity is $48,986, as of October
2020.
In terms of accumulated net wealth, blacks and whites had very similar outcomes.
IDA participants accumulated significantly more wealth than non-IDA participants, as of
October 2020. Holding constant many factors, like years spent in the home, IDA participants
accumulated 19.7% more net wealth than non-IDA participants. The annual return on equity
for IDA participants is $297 higher than non-IDA participants.
As credit score increases by 100 points, accumulated wealth increases by 7.6%.
Participants who purchased prior to the Great Recession, relative to during it, accumulated
wealth decreases by around 24.0%.
When a home is bought after the Great Recession, compared to during it, accumulated wealth
13 The model uses a log transformed version of net equity because this has multiple desirable statistical properties. Since the
model has a log transformed dependent variable, the coefficient estimates must be manipulated prior to interpreting them as
marginal changes. The formula to do this is: %∆ 𝐴𝑐𝑐𝑢𝑚𝑢𝑙𝑎𝑡𝑒𝑑 𝑁𝑒𝑡 𝐸𝑞𝑢𝑖𝑡𝑦 = 100 ∙ (𝑒𝛽 − 1) 14 The average participant, as of October 2020, has lived in their home for around 9 years. Therefore, this is net wealth built over
an average of 9 years.

20
increases by around 113.6%.
Paid Property Taxes
Of the 508 participants, as of October 2020, they have paid $6.2 million in property taxes.
Per participant, the average property taxes paid is around $12,255.
Foreclosures
Of the 508 participants, as of October 2020, only 7.9% have had their houses foreclosed. Most
occurred around, or soon after, the Great Recession.
Being a single head of household significantly predicts foreclosure, as does credit score, debt
ratio, and being a full-time employee relative to a part-time one.
As credit score increases by 50 points, the probability of foreclosure decreases by 0.6%.
As debt ratio increases by 0.1 percentage points, the probability of foreclosure decreases by
2.1%.
If a full-time employee, relative to part-time, the probability of foreclosure decreases by
2.8%.
When a home is purchased after the Great Recession, relative to during it, the probability of
foreclosure decreases by 5.8%.
Home Values
From 2005 to 2020, the average FCHP participant’s home has appreciated by around 32.2%.
Homes built in 1970-1989 that participants purchased appreciated the most, by around 36.3%.
Participants with higher credit scores purchased homes that tended to remain more valuable.
Those with higher debt ratios bought homes that remain less valuable.
Next Steps
The data and information surrounding the FCHP are vast. We intend to continue analyzing
what we find and publishing our results. Therefore, this report is likely to be one of multiple
reports. Future reports will include analyses of pre- and post-move neighborhood comparisons
(crime rates, demographic compositions, etc.), migration analyses, and deeper dives into home
values, among other things. In addition to analyzing currently available data, representatives from
Forsyth County’s CED Department are interested in creating a survey that asks past FCHP
participants to describe their quality of life after receiving the down payment subsidy and financial
training. This survey will serve to gauge these household’s health, access to jobs, social mobility,
satisfaction with local education, and overall well-being.
Acknowledgments
We would like to thank a few people and organizations. First, we would like to thank the CED
department, especially Dan Kornelis and Bianca Green. Second, we would like to than Joseph
Sloop at MapForsyth. Third, we would like to thank the entire Forsyth County Tax Department.