Embed Size (px)
Citation preview
DI
SC
US
SI
ON
P
AP
ER
S
ER
IE
S
Forschungsinstitut zur Zukunft der ArbeitInstitute for the Study of Labor
Does Culture Affect Divorce Decisions?Evidence from European Immigrants in the US
IZA DP No. 5960
September 2011
Delia FurtadoMiriam MarcénAlmudena Sevilla-Sanz

Does Culture Affect Divorce Decisions?
Evidence from European Immigrants in the US
Delia Furtado University of Connecticut
and IZA
Miriam Marcén Universidad de Zaragoza
Almudena Sevilla-Sanz
University of Oxford
Discussion Paper No. 5960 September 2011
IZA
P.O. Box 7240 53072 Bonn
Germany
Phone: +49-228-3894-0 Fax: +49-228-3894-180
E-mail: [email protected]
Any opinions expressed here are those of the author(s) and not those of IZA. Research published in this series may include views on policy, but the institute itself takes no institutional policy positions. The Institute for the Study of Labor (IZA) in Bonn is a local and virtual international research center and a place of communication between science, politics and business. IZA is an independent nonprofit organization supported by Deutsche Post Foundation. The center is associated with the University of Bonn and offers a stimulating research environment through its international network, workshops and conferences, data service, project support, research visits and doctoral program. IZA engages in (i) original and internationally competitive research in all fields of labor economics, (ii) development of policy concepts, and (iii) dissemination of research results and concepts to the interested public. IZA Discussion Papers often represent preliminary work and are circulated to encourage discussion. Citation of such a paper should account for its provisional character. A revised version may be available directly from the author.

IZA Discussion Paper No. 5960 September 2011
ABSTRACT
Does Culture Affect Divorce Decisions? Evidence from European Immigrants in the US*
This paper explores the role of culture in determining divorce decisions by examining country of origin differences in divorce rates of immigrants in the United States. Because childhood-arriving immigrants are all exposed to a common set of US laws and institutions, we interpret relationships between their divorce tendencies and home country divorce rates as evidence of the effect of culture. Our results are robust to controlling for several home country variables including average church attendance and GDP. Moreover, specifications with country of origin fixed effects suggest that divorce probabilities are especially low for immigrants from countries with low divorce rates that reside amidst a large number of co-ethnics. Supplemental analyses indicate that divorce culture has a stronger impact on the divorce decisions of females than of males pointing to a potentially gendered nature of divorce taboos. JEL Classification: J12, Z13, J61 Keywords: divorce, culture, immigrants Corresponding author: Delia Furtado Department of Economics University of Connecticut 341 Mansfield Road, Unit 1063 Storrs, CT 06269-1063 USA E-mail: [email protected]
* We would like to thank Manuel Arellano, Martin Browning, Libertad Gonzalez, Berkay Ozcan and Stephen L. Ross for the many helpful suggestions. The paper has also benefited from comments provided by participants at the 2011 Annual Meeting of the Population Association of America, the 2011 Migration: Economic Change, Social Change Conference, the 2010 SOLE-EALE International Conference, the 2009 Congress of the Spanish Economics Association, the 2009 European Society of Population Economics Conference and seminars at CEMFI and the University of Connecticut. Any remaining errors are our own.

3
1 Introduction
Much of the recent literature on divorce has focused on the role of divorce laws in explaining
changes in divorce rates, generally finding a positive relationship between the permissiveness of
the laws and the likelihood of divorce, at least in the short run (Wolfers 2006; González and
Viitanen 2009). Although differences in laws may have explained cross-country variation in
divorce rates in the past, the current rather homogenous divorce law regime across Europe
(González and Viitanen 2009) is unlikely to account for divorce rates which still vary
substantially across countries (see Column 1 in Table 1).1 An alternative potential explanation
lies in cross-country differences in the generosity of welfare policies. Given that the welfare state
often substitutes for many of the services historically provided within families, countries with a
larger share of GDP devoted to transfers and public services tend to have higher divorce rates
(Tjøtta and Vaage 2008). Other institutional and economic determinants of divorce, which are
likely to vary by country, include unemployment rates (Jensen and Smith 1990), tax laws
(Dickert-Colin 1999), laws regarding property distribution within marriage (Gray 1998), and
laws concerning alimony payments, child support (Nixon 1997; Heim 2003), and child custody
(González-Val and Marcén 2011; Halla 2011). In this paper, we present evidence suggesting that
culture also plays an important role.
Following Fernández (2007), we conceptualize culture as a set of beliefs and preferences that
vary across time, space, or social groups. Most important for our analysis is that culture is
portable and remarkably persistent. International migrants cannot bring with them the economies
and laws of their home countries, but do bring their norms, belief systems, and traditions. 1 By 2003, almost all European countries implicitly or explicitly permitted unilateral divorce at least after a required separation period. The only two countries that presently do not have unilateral regimes are Ireland and Italy. In these two countries, if a spouse opposes a divorce, then the divorce is not necessarily granted.

4
Although it is true that these preferences may have arisen in response to historical laws and
institutions, they are certainly slower to change and are likely to persist even when the laws that
gave rise to them change. Culture, necessarily social in nature, may be transmitted from parents
to children through socialization (Bisin and Verdier 2000; Bisin et al. 2004), within
neighborhoods (Borjas 2005), or through the broader society via television and internet (Chong
and La Ferrara 2009). Parents surely instill in their children beliefs about the morality of divorce,
but children may also form their own attitudes based on perceptions of role models within their
communities. Adults may also be affected by divorce culture if certain communities tend to
ostracize divorcees.
The interrelationship between institutions and norms makes it difficult to rigorously
disentangle the two using cross-country data. Countries in which inhabitants have more liberal
attitudes toward divorce enact liberal divorce policies. At the same time, more liberal divorce
policies can generate attitudes which are more accepting of divorce. To separate the effect of
culture from institutions on an individual’s probability of divorce, we examine divorce patterns
of immigrants from Europe who arrived in the US at or under the age of 5. Immigrants in our
sample have lived under the laws, institutions, and markets of the United States. However, since
their preferences are likely to reflect the attitudes of their parents and ethnic communities,
differences in their divorce rates by country of origin may be interpreted as evidence of the
importance of culture. For example, if divorce laws were the only explanation for why Italy has a
lower divorce rate than Russia, then when we remove differences in laws by examining Russians
and Italians living in the same city in the US, all Russian-Italian divorce differentials should be
eliminated. Instead, if home country divorce rates can explain divorce patterns of childhood
migrants who have spent most of their lives exposed to US culture and norms, this may be
5
interpreted as evidence that cultural variation is at least a partial explanation for the differences
in divorce rates across European countries.
In our empirical analysis, we use data from the 2000 US Census to estimate the probability
that a European immigrant who arrived in the US as a young child is divorced, based on the
person’s home country divorce rate--defined as the number of divorces in a year per 100 married
inhabitants. Our results suggest that culture plays an important role in explaining divorce, even
after controlling for an individual’s socioeconomic characteristics. We find that when the divorce
rate increases by one, the probability that an immigrant in the US is divorced increases by about
six percentage points. Thus, given that Russians have the highest divorce rate of 1.26 and Italians
have the lowest divorce of 0.13, our model predicts that immigrants from Russia are almost
seven percentage points more likely to be divorced than immigrants from Italy.
Our results contribute to a growing literature on the effect of culture on economic outcomes
(see Fernández and Fogli (2005) and Guiso et al. (2006) for a review). Using methodologies
similar to ours, studies have examined the effect of culture on savings rates (Carroll et al. 1994),
fertility and female labor force participation (Antecol 2000; Fernández and Fogli 2006;
Fernández 2007; Fernández and Fogli 2009), living arrangements (Giuliano 2007),
unemployment rates (Brügger et al. 2009), and preferences for a child’s sex (Almond et al. 2009).
We add to this body of knowledge by examining the role of culture on divorce rates.
Throughout the paper, particular emphasis is placed on convincing readers that our results are
not driven by unobserved heterogeneity across ethnic groups. For example, given that divorce
rates are higher among couples that marry young (Lehrer 2008) and have fewer children (Svarer
and Verner 2008), beliefs about appropriate age at marriage and ideal number of children may be
driving our results. To examine this issue, we add origin country average female age at first
6
marriage and total fertility rates, as well as a host of other country of origin level variables to our
main specification. In all models, the estimated coefficient on home country divorce rates
changes very little.
As an additional check that divorce norms are driving our results, we consider the
relationship between home country divorce rates and other outcome variables. If some
unobserved characteristic, such as female earnings ability, were the main factor explaining the
cross-ancestry differences in divorce patterns, then we might expect it to also affect the
probability of marriage and wages. It turns out, however, that there is no statistically significant
relationship between home country divorce rates and these variables.
We also separate the analysis by gender in order to test the hypothesis that women are more
sensitive to divorce culture than men. If women predominantly form their identities based on
their wife and mother roles, while men form theirs based on their worker and breadwinner roles
(Akerlof and Kranton 2000), then if it is in fact divorce culture which is driving the results, we
would expect home country divorce rates to have a stronger impact on women than on men. This
is precisely what we find. Separating the analysis by gender also allows us to include additional
control variables which could be considered highly endogenous in specifications with both males
and females. In all models, home country divorce rates remain an important determinant of
divorce probabilities lending further creditability to our research design.
In the last section, we follow Fernández and Fogli (2009) in presenting evidence suggesting
that culture is not only transmitted from parent to child, but also within communities. We find
that an increase in the concentration of individuals from the same country of origin leads to a
larger decrease in the probability of being divorced for immigrants from countries with lower
divorce rates. The fact that we find evidence of culture in specifications including country of
7
origin fixed effects provides some additional evidence that our analysis is identifying the role of
culture as opposed to unobserved individual characteristics that happen to be correlated within
ethnic groups.
The paper is organized as follows. Section 2 presents the empirical strategy, and Section 3
describes the data. Baseline results and robustness checks are discussed in Section 4. Section 5
explores gender differences in the impact of culture on divorce, and Section 6 presents evidence
of peer effects in the transmission of divorce culture. Section 7 concludes.
2 Empirical Strategy
It is difficult to distinguish the effect of culture from the effect of markets and institutions in
explaining variation in cross-country divorce rates in Europe. Our empirical approach makes use
of the fact that all European immigrants who arrived in the US at a young age are, and have been,
exposed to US markets and institutions. Thus, evidence that home country divorce rates can
explain divorce propensities of young arriving immigrants might be interpreted as suggestive of
the role of culture. The following equation forms the empirical framework of this analysis:
1 2ijk j ijk k ijkD DR X , (1)
where Dijk is an indicator variable for whether individual i of cultural origin j who lives in
metropolitan area k reports being divorced.2 Our measure of culture, DRj, is the divorce rate in
country j. Standard errors are clustered at the country of origin level to account for any within-
ethnicity correlation in the error terms. If culture matters, then individuals originating from
countries with more liberal cultures regarding divorce should have a higher probability of
divorce than individuals from more traditional backgrounds. Thus, we expect 1 to be positive,
2 We use a linear probability model for simplicity, but results are similar when using probit or logit models.

8
as higher home country divorce rates should be associated with more liberal attitudes regarding
divorce.
Metropolitan statistical area (MSA) fixed effects, denoted δk, are included to control for
regional variation in US divorce rates that might arise from cross-city differences in US divorce
attitudes or cross-state differences in divorce laws (Gruber 2004; Friedberg 1998).3 The vector
Xijk contains controls for gender, education, and age--individual characteristics that may affect
divorce rates for reasons unrelated to culture. We allow for a very flexible functional form of age
by including a full set of age fixed effects. In principle, it would also be desirable to control for
spouse characteristics, but the Census does not ask for information on ex-spouses.
Our dependent variable measures whether a person is divorced at the time of the survey.
Ideally, we would ask whether culture affects the probability that a person ever divorces,
conditional on having ever been married. Unfortunately, there is no recent data set that contains
information on ever having been divorced that also meets all of our variable and sample size
requirements. 4 However, this is only problematic for our purposes if remarriage rates are
negatively associated with divorce tendencies. Figure 1 uses data from the World Values Survey
to show that remarriage rates, conditional on divorcing, are higher in countries with larger
proportions of the population reporting to have ever been divorced (details on variable
construction can be found in Appendix C). Thus, if in the US, divorcees from high divorce
countries are more likely to remarry, all of our estimated effects of culture on current divorce
3 By restricting the sample to MSA residents, we not only lose about a fifth of the sample, but any conclusions we draw are technically only applicable to city dwellers who may be especially sensitive to origin country norms and taboos. To examine this issue empirically, we ran our baseline regressions without restricting the sample to MSA residents and replacing the MSA fixed effects with state fixed effects. Results do not change substantially. 4 The longitudinal data sets that are typically used to study divorce, such as the Panel Study of Income Dynamics (PSID) and the National Longitudinal Survey of Youth (NLSY), do not have large enough samples of immigrants, much less childhood migrants, to conduct the analysis in this paper.
9
status may be interpreted as lower bounds of the effect of divorce culture on the probability of
ever having been divorced.5
3 Data
In our main analysis, we use data from the five percent Public-Use Microdata Sample (PUMS) of
the 2000 US Census (Ruggles et al. 2010). Our sample consists of immigrants from Europe who
arrived in the US when they were five years of age or below. These immigrants all grew up
under US laws, institutions, and markets, but their attitudes are likely to reflect the attitudes of
their ethnic communities in addition to the attitudes of their families and the broader US society.6
We keep individuals who are between the ages of 25 and 64 since everyone in this sample is
likely to have completed schooling and is below retirement age. Given that marriage is a
prerequisite of divorce, we restrict the sample to those who are either married or divorced in
order to avoid attenuation bias.7 Lastly, we keep only residents of identifiable MSAs. Our final
sample consists of 20,751 immigrants from 26 different European countries. The United
Kingdom includes England, Scotland, Wales and “United Kingdom, country not specified.”
Czechoslovakia includes the Czech Republic.
Much of the previous literature using the epidemiological approach to identify the effect of
culture uses second-generation immigrants instead of first-generation immigrants. The rationale
is that since second-generation immigrants have been exposed to US markets and institutions
5 As an additional check, we also used 1980 Census data, the last Census to ask for information on marital history, to compare estimates of the effect of home country divorce rates on the probability of being currently divorced to the probability of ever having been divorced. As expected, home country divorce rates have a larger impact on the probability of having ever been divorced. Results are available upon request. 6 When we restrict the sample to those individuals whose reported ancestry matches their country of birth, estimated home country divorce rate coefficients are slightly larger. This result is expected as country of origin divorce culture should matter less for people who do not identify with their country of birth. 7 We also ran our analysis on a full sample of single, married, and divorced individuals. The estimated coefficient on home country divorce rate was positive and statistically significant, but smaller in magnitude than the coefficient estimated using the ever-married sample.
10
their entire lives, they are unlikely to suffer from language barriers and do not suffer from the
“shock” of immigration (Fernández and Fogli 2006; Fernández 2007; Fernández and Fogli 2009;
Giuliano 2007). The early childhood arrivers in our sample also satisfy these criteria. Home
country laws and institutions are not likely to have had a large impact on early childhood
migrants, language barriers are not likely to be a problem for young arrivers, and because they
were so young at the time of migration, it is unlikely to have had a lasting disruptive effect on
their lives. There are, however, two important reasons to favor our childhood migrant sample
over a second-generation immigrant sample. First, because divorce patterns have changed so
dramatically in the past 30 years, we feel it is important to use recent data, and 1970 was the last
year the Census asked for information on parents’ countries of birth.8 Second, our childhood
migrant sample is likely to be more homogeneous in terms of assimilation to the US. Second-
generation immigrants may have been born shortly after both of their parents migrated to the US
(in which case they would be very similar to our sample of childhood migrants) or they may
have one parent who migrated to the US as an infant and another parent whose family has been
in the US for generations. The tendency to be at one extreme rather than the other may be
correlated with home country divorce rates but affect divorce decisions for reasons which are
unrelated to divorce culture.
For our main analysis, we use the 2000 divorce rate in the immigrant´s country of origin as
our cultural proxy. Divorce rates are computed by dividing the number of divorces in a year by
the number of people that are married in that year and then multiplying by 100. An alternative
approach often used in the literature is to measure home country divorce rates in the year of
migration for the average person in the sample (or the person’s parents if using second-
8 It is possible to identify second generation immigrants in recent Current Population Surveys (CPS), but small sample sizes make it difficult to precisely estimate some of our coefficients of interest.

11
generation immigrants). As Fernández and Fogli (2009) recognize, it is not obvious theoretically
which year to use. On the one hand, divorce rates at the time of migration may best reflect home
country culture as experienced by immigrants. On the other hand, if immigrants remain in close
contact with family and friends in their home countries years after migrating, values and taboos
may be best captured by concurrent home country divorce patterns. Rather than trying to resolve
this issue on theoretical grounds, we follow Fernández's approach and run the analysis measuring
home country divorce rates in various years. As can be seen in Appendix A, results remain
robust regardless of the year in which home country divorce rates are measured, which is not
surprising since culture evolves slowly. We choose to focus on divorce rates for the year 2000
since there is less missing data in 2000 compared to the previous years (see Appendix C for
details on how we dealt with missing data in constructing the home country divorce rate
variables).
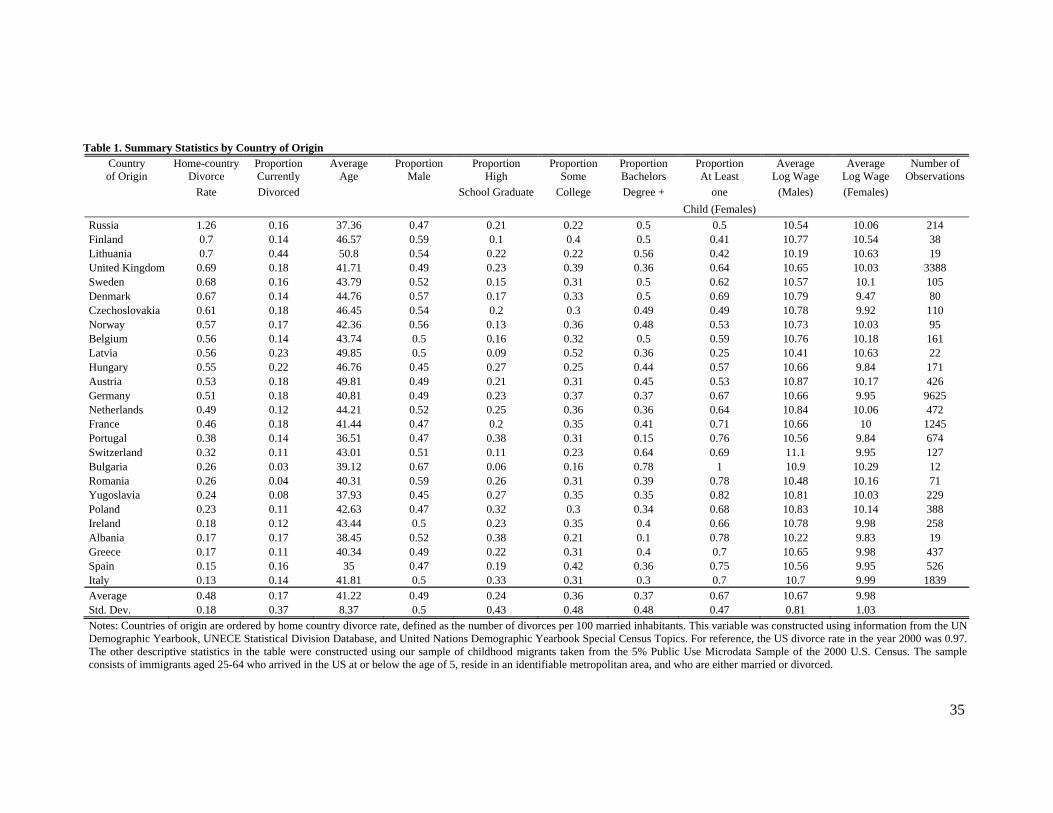
Table 1 presents summary statistics of the relevant variables by country of origin. Countries
are ordered from highest to lowest divorce rate. The first column shows large home-country
divorce rate variation: from 1.26 divorces per 100 married individuals in Russia to 0.13 in Italy.
The proportion of childhood arrivers that are divorced is shown in the next column. Immigrants
from countries with high divorce rates are more likely to be divorced than immigrants from
countries with low divorce rates, but this may be explained by differences in age or education.
As can be seen in the table, immigrants from Portugal and Spain tend to be younger than those in
other groups suggesting a relatively more recent arrival of these groups to the US.
Approximately 37% of our sample has at least a college degree, although education levels range
widely across origin countries with Albania having the lowest proportion of immigrants with at
least a college degree (10%) and Switzerland the highest (64%). Bulgarian and Yugoslavian
12
women have higher probabilities of having at least one child in the household, while Latvians
have rather low fertility rates. Male wage income is highest for the Swiss and lowest for
Lithuanians, while female income is highest for Latvians and Lithuanians and lowest for Danes.
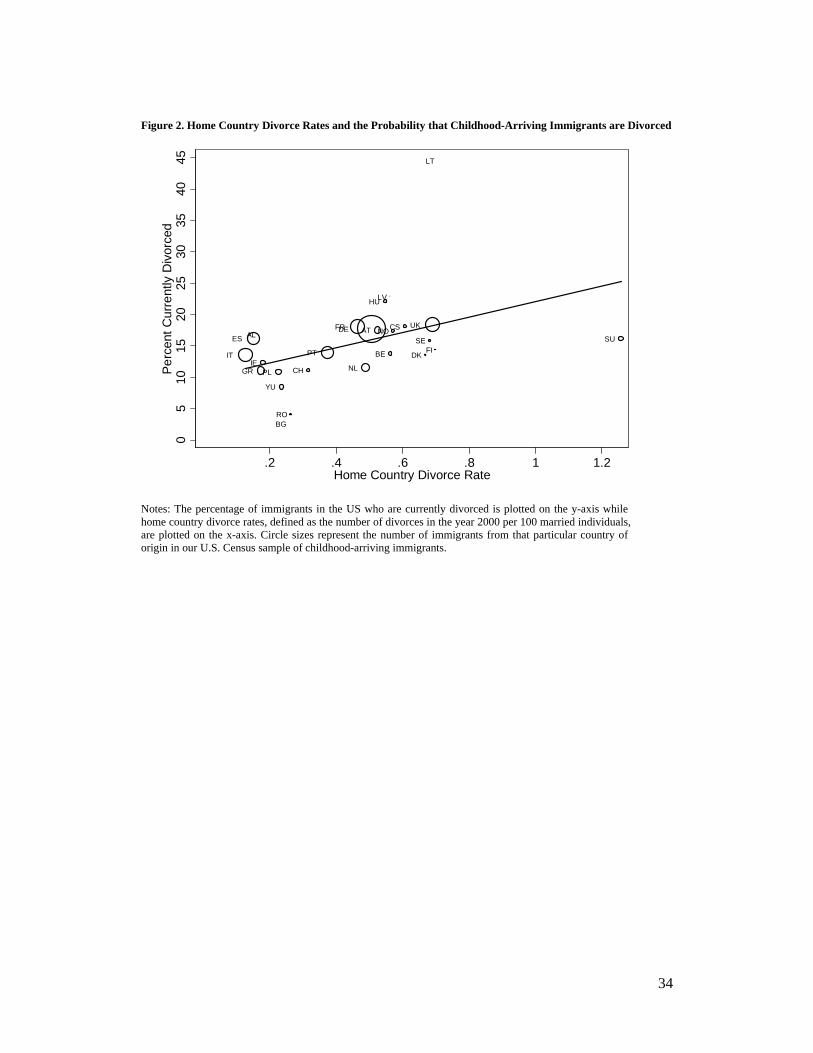
Figure 2 plots home country divorce rates on the x-axis and the percent of immigrants in our
sample that are divorced on the y-axis. Larger circles represent countries with more observations
in our data set. As can be seen from the figure, immigrants from countries with higher divorce
rates are more likely to be divorced in the year 2000. In fact, the slope of the line through the
scatter plot suggests that an increase of one in the number of divorces per 100 married
individuals in a European country is associated with a nine point increase in the percentage of
immigrants from that country who are currently divorced while residing in the US. Figure 2
certainly provides suggestive evidence that divorce culture matters, but as shown in Table 1,
immigrants from different countries differ in terms of gender composition, education, and age,
all known determinants of divorce (as discussed in more detail in Section 4.2). In the next section,
we turn to multivariate analysis to better identify the effect of culture on being divorced.
4 Results: Culture and Divorce
4.1 Baseline Model
Table 2 reports regression results from models which include controls for individual-level
socioeconomic characteristics. Age is certainly an important determinant of divorce as studies
have found that older individuals are less likely to get divorced, conditional on being married
(Peters 1986).9 Given that men are more likely to get remarried (Stevenson and Wolfers 2007),
our finding that men are less likely to be divorced than women should not be surprising. Also
9 In results not reported, we find that age has a positive effect on the probability of currently being divorced. This is presumably because older individuals have had more time to end a marriage.
13
consistent with the divorce literature, higher levels of education are associated with lower
probabilities of divorce, and the college-educated have especially low divorce rates (Becker et al.
1977; Peters 1986; Isen and Stevenson 2010). Most importantly, the estimated effect of home
country divorce rates is positive and statistically significant despite our inclusion of these control
variables in the model.
In the second column, MSA fixed effects are added. If immigrants from countries with high
divorce rates tend to settle in cities with high divorce rates, it might lead to a bias in the culture
coefficient as the cultural proxy may be capturing the effect of US divorce laws and institutions,
rather than the effect of culture. The estimated coefficient on the divorce cultural proxy
decreases by about a third after including MSA fixed effects in the specification, suggesting that
immigrants from high divorce rate countries are indeed more likely to reside in high divorce US
cities.
Overall, our estimates indicate that when the number of divorces per hundred married
individuals in an immigrant’s home country increases by one, there is over a six percentage point
increase in the probability that an immigrant is divorced (column 2 in Table 2). In other words,
immigrants from Russia, the country with the highest divorce rate of 1.26, are almost seven
percentage points more likely to be divorced than immigrants from Italy given Italy’s divorce
rate of 0.13 - the lowest among the countries considered.
To check whether these results are sensitive to sample selection, we run several simple
robustness checks on the baseline specification. First, we drop Germans from the sample since
they are the largest immigrant group and may be driving the results. In another specification, we
drop Russia (the country with the highest divorce rate) and Italy (the country with the lowest
divorce rate). As can be seen in Table 2, in both of these specification checks, the estimated

14
divorce rate coefficients remain within about a percentage point of our baseline estimate and are
both statistically significant.
A country’s divorce rate is not the only possible measure of home country attitudes toward
divorce. Using data from the World Values Survey, we also examine a more direct measure of
attitudes about divorce: the percentage of the origin country’s population believing that divorce
is never justifiable.10 There is generally a negative relationship between home country divorce
rates and the percentage of the population believing that divorce is never justifiable, but Spain,
for example, has particularly favorable attitudes toward divorce conditional on their very low
divorce rates. 11 As seen in the last column of Table 2, this measure of divorce culture also has a
significant impact on the probability of being divorced for immigrants residing in the US.
Specifically, a ten percentage point increase in the percentage of individuals believing that
divorce is never justifiable results in a 0.1 point decrease in the probability that an immigrant is
divorced. Because of the potential disconnect between what individuals respond in a survey and
their genuine attitudes, the home country divorce rate remains our preferred measure of culture,
but it is comforting that results are not sensitive to our choice of cultural proxy.
4.2 Cross-Country Differences in Divorce Rates and Unobserved Heterogeneity
A potential concern with our analysis is that even young arriving immigrants from the same
country may have characteristics in common with each other that affect divorce tendencies. If
these unobserved attributes are correlated with home country divorce rates, we might
erroneously interpret our results as evidence of culture even if no divorce taboo actually exists. 10 Respondents to the World Values Survey (WVS) were asked whether they think that divorce can always be justified, never be justified, or something in between (1 Never justifiable, …, 10 Always Justifiable). Data is available for four waves: 1981-1984, 1989-1993, 1995-1998, and 1999-2004. We pool all of the waves together since there is no wave in which all countries considered are available. We have also run further tests using just wave 2 (1989-93), which includes information for all countries considered except Greece, and wave 4 (1999-2004) which includes information for all countries except Switzerland and Norway. Results were robust. 11 This may explain the relatively high proportion of Spanish divorcees in the US.

15
Unfortunately, data on many of the known correlates of divorce, such as age at marriage and
religiosity, are not available in the 2000 U.S. Census. Therefore, in order to determine whether
omitted variables are likely to severely bias our results, we start by adding several home country
aggregate variables to our baseline model, reproduced in Column 1 of Table 3 for convenience.12
The relationship between household income and divorce is theoretically ambiguous. Since
lawyers and court fees can be very expensive, high-income couples may simply be better able to
afford to end a marriage. Moreover, divorce should be more attractive to individuals who can
afford to maintain a similar standard of living outside of marriage, again implying a positive
relationship between income and divorce. On the other hand, the relationship may also be
negative since high income couples typically own assets, such as a large house and expensive
furniture, which are difficult to equitably divide upon divorce (Becker et al. 1977). In any case,
given the potential relationship between household income and home country divorce rates, our
estimated coefficient on home country divorce rates may be measuring the effect of income, in
addition to or instead of, divorce taboos. To address this, we would have liked to control for
household income of all current and prior marriages, but this information is not available for
divorced couples in the Census. Moreover, given that household income is likely endogenous to
marriage quality, it is unclear that we would want to use this variable even if it were available.
Instead, we use home country GDP per capita, measured in hundreds of thousands of US dollars,
as a proxy for household income. As can be seen in Column 2 of Table 3, there is no change in
the estimated home country divorce rate coefficient when this variable is added to the model.
Another empirical regularity documented in the divorce literature is that couples with
children are less likely to divorce (Becker et al. 1977; Peters 1986). This may be either because
the financial, and especially, emotional costs of divorce are higher when children are involved or 12 See Appendix B for summary statistics on these variables and Appendix C for a description of our data sources.

16
because couples only have children when they envision good long-term prospects for a marriage.
If fertility is correlated within ethnicity in the US for reasons unrelated to culture, then it is
important to control for fertility rates in the regressions in order to properly identify the effect of
divorce culture. Unfortunately, the census only contains information on the number of children
living in the household, a very poor measure of fertility, especially for divorced males and older
couples. To explore the relationship between children and divorce taboos, we use country of
origin fertility rates as a proxy for fertility. As can be seen in column 3, when this variable is
added to the baseline model, the estimated coefficient on origin country divorce rates actually
increases by 15% to 0.07. 13
Next, we consider the relationship between religiosity and country-specific divorce taboos.
Beliefs about the morality of divorce are certainly transmitted through religion. The Catholic
Church, for example, teaches that marriages are indissoluble while more liberal Protestant
denominations support no-fault divorce laws (Bahr and Chadwick 1985). Apart from direct
prohibitions of divorce, many religions have very family-centered rituals (Lehrer and Chiswick
1993) which might make divorce more costly for those heavily involved with their religious
communities. To examine the role of religiosity in transmitting divorce culture, we add to our
baseline model a country of origin level variable measuring the proportion of the home country
population which attends religious services weekly.
It is difficult to interpret results from a regression that includes a measure of religiosity. If the
estimated home country divorce rate coefficient is smaller in models that include home country
13 The total fertility rate is defined as the average number of children that would be born alive to a woman during her lifetime if she were to pass through her childbearing years conforming to the age-specific fertility rates of a given year. One potential issue with this variable is that fertility rates have changed quite dramatically in Europe in the past century making home country fertility rates in the year 2000 a poor proxy for fertility rates of immigrants who arrived in the US many years prior. To address this, we ran regressions using home country total fertility rates at the time of migration as opposed to at the time of the survey. Results were robust to this specification. See Appendix C for details on data sources.
17
religiosity, this may simply suggest that norms about divorce are transmitted through religion.
However, it may also be that a person’s divorce tendencies are related solely to his or her
personal religious beliefs, which may be independent of cultural transmission. 14 Ultimately, it is
difficult to distinguish between the two even within a thought experiment because the practice of
most religions is very social. An additional problem is that more socially liberal countries tend to
have more lenient attitudes towards divorce and also happen to be less religious. However,
results, shown in column 4, suggest that these distinctions are not empirically important for our
purposes. Although religiosity, as measured by weekly church attendance, has a negative and
statistically significant effect on the probability of being currently divorced, the home country
divorce coefficient decreases only slightly and remains positive and statistically significant after
controlling for religiosity.15 We also add proportion catholic in home country to the model in
Column 5. This inclusion of this variable actually increases the estimated effect of home country
divorce rates.
Another potentially important predictor of divorce is whether the marriage is an interethnic
marriage. Differences in tastes, values, and communication styles may make it difficult for
spouses of different ethnicities to make joint decisions, or they may lack the social support
necessary to work out their differences (Kalmijn et al. 2004). Meanwhile, cross-ethnicity
differences in endogamy rates may result from reasons completely unrelated to divorce taboos.
For example, ethnic groups that are more residentially dispersed may find it difficult to find
same-ethnicity spouses. 16 Given that exogamous marriages are more likely to end in divorce
14 The evidence of the effect of religiosity on divorce is mixed. Lehrer and Chiswick (1993) find that more religious individuals have a lower probability of divorce, but Trent and South (1989) fail to find any significant effect of religion on divorce probabilities. 15 Religiosity measures are not available for Norway and Switzerland in the WVS. We have re-run our baseline regressions without observations from these countries and results hold. 16 For details on the determinants of intermarriage for first and second generation immigrants, see Chiswick and Houseworth (2008) and Furtado and Theodoropoulos (2011).
18
(Kalmijn et al. 2004), our estimated coefficient on home country divorce rates will be biased if
endogamy patterns in the US happen to be correlated with home country divorce rates. To
examine this issue, we construct endogamy rates by European ethnic group for our sample of
married males who arrived in the US at or before the age of five using 2000 US Census data.
The endogamy rate is defined as the proportion of couples where the husband’s country of birth
matches the country of birth of the wife. Consistent with the theoretical predictions in Becker et
al. (1977) and the empirical findings of Kalmijn (1993), results in column 6 suggest that people
in ethnic groups with higher endogamy rates are less likely to be currently divorced. However,
adding this variable to the specification does not significantly change the coefficient associated
with divorce culture.
Finally, many papers have documented a negative relationship between age at marriage and
divorce propensity (e.g. Becker et al. 1977). Becker et al. (1977) suggest that because young
people have less information about themselves, their potential spouses, and the marriage market
more generally, new information acquired within marriage might make marital dissolution
optimal.17 In column 7, country of origin average female age at first marriage is added to the
baseline specification. Again, adding this variable to the regression has no impact on our
measure of the effect of divorce culture.
Column 8 shows regression results from a specification that includes all of these country of
origin variables. The full model is suggestive of an even stronger impact of culture on being
divorced than the baseline model, as the estimated coefficient on our cultural proxy almost
doubles from .06 to .11.
17 Becker et al.’s theoretical analysis points to a nonlinear relationship between age at marriage and divorce propensity since people who remain unmarried by a certain age are more likely to marry suboptimal spouses. In fact, their empirical work suggests that people who marry for the first time later in life have the highest probability of marital dissolution.

19
A potential problem with these origin-country controls is that immigrants may not be a very
representative sample of the population in their home countries. They may have very different
characteristics from non-migrants but still display similarities with each other which happen to
be correlated with home country divorce rates. For example, migrants may display patterns of
adventure-seeking behavior and risk aversion which are quite different from non-migrants. 18
Moreover, immigrants tend to migrate from specific areas of home countries making them
potentially very similar to each other but again quite different from the average non-migrant.
To address these issues, we follow Fernández and Fogli (2009) in conducting placebo
regressions. If there were some unobserved social characteristic, such as risk aversion or fertility,
correlated with home country divorce rates but independent of divorce norms and taboos, then
we might expect it to also affect marriage rates. Similarly, unobserved human capital
characteristics which might affect people’s prospects upon leaving a marriage would surely also
affect wages. Table 4 presents results from these placebo regressions. We find that divorce
culture has a much stronger impact on the probability of having exited a marriage (0.06) than on
the probability of entering a marriage (0.03), and the latter is not statistically significant. We run
similar regressions with log wage, a measure of unobserved human capital, as the dependent
variable, for the whole sample as well as for men and women separately. Home country divorce
rates have no statistically significant impact on wages suggesting that unobserved human capital
is not likely to bias our baseline estimates.
5 Gender and Culture
18 Whether this is problematic for our baseline analysis depends on the relationship between these characteristics and home country divorce rates. If, for example, all migrants were more “willing to experience new things” than non-migrants regardless of their country of origin, then our analysis which relies on cross-country variation would not suffer from any bias.
20
For even further evidence that our results reflect the effect of divorce culture, we separate the
sample by gender. If as suggested by Heaton and Blake (1999), women are more attentive to
their marital roles while men are more attentive to their worker roles, women are likely to be
more sensitive to any divorce stigma than men. This can be interpreted in light of identity models
(e.g., Akerlof and Kranton 2000), if women lose identity for being divorced to a greater extent
than men given the gendered convention that “women should stand by their men.” Interestingly,
although men are more likely than women to end club memberships post divorce, women
experience greater declines in contacts with friends and family after divorce (Kalmijn and Uunk
2007). In general, wives are more perceptive of marital problems than husbands and play a
larger role in relationship maintenance (Heaton and Blake 1999). Since women are more likely
to instigate divorce (Brinig and Allen 2000; Kalmijn and Poortman 2006), then it is their real or
perceived costs of divorce that ultimately determine whether a marriage dissolves. Thus, if
divorce stigma is really driving our results, then we would expect women to be more sensitive to
home country divorce rates than men.
Another reason to separate the sample by gender is that it allows us to include some
important control variables, specifically wages and whether there is a young child in the
household, which are omitted from the baseline specification due to endogeneity concerns.
Higher incomes of husbands are associated with smaller likelihoods of divorce while, the
earnings potentials of women, if anything, are associated with increases in the probability of
divorce (Burgess et al. 2003; Jalovaara 2003; Weiss and Willis 1997). As discussed previously,
if average wage income differs by country of origin in a way that is correlated with home
country divorce rates, then our estimated effect of culture may simply be picking up differences
in wages. We do not control for wages in our baseline specifications because women who will

21
eventually divorce have higher labor force participation rates than married women who never
divorce (Johnson and Skinner 1986). Thus, controlling for this endogenous variable would lead
to biased coefficients in models that include both males and females. That said, since more men
work regardless of marital status (89% of men in our sample earn a wage compared to only 77%
of women), we do not expect this variable to result in as severely biased estimated coefficients in
an all-male sample.
Similarly, although we would have liked to control for children born in first marriages, the
2000 U.S. Census only provides information on children residing in the household. Because in
many cases divorced fathers do not reside with their children, controlling for the presence of
children in the household may result in severe endogeneity bias in our male sample. However,
since mothers typically live with their children regardless of marital status, it seems reasonable to
control for this variable in our female sample.
Table 5 presents results separately for men and women. Raw correlations between culture
and the probability of being divorced shown in the first and fourth columns suggest that women
are more heavily influenced by culture than men. In the full specifications, shown in the second
and fifth columns, both of the estimated home country divorce rate coefficients are smaller than
in the baseline specifications, but women are almost 50 percent more sensitive to home country
divorce rates than men. When wages are added to the male specification in column 3 of Table 5,
the estimated culture coefficient decreases slightly but remains positive and statistically
significant.19 Consistent with the literature, an increase in a male’s wages results in decreases in
the probability that he is currently divorced.
19 Sample sizes are smaller in specifications controlling for wage because they do not include individuals who are not employed. When we compare results from regressions with and without wage controls using only samples of employed workers, conclusions are the same: Although wages do impact divorce tendencies, home country divorce rates remain significant predictors of divorce probabilities even in specifications which control for wages.

22
As can be seen in column 6 of Table 5, the presence of a child currently residing in the
household is negatively associated with a decrease in the probability that a woman is divorced by
about fourteen percentage points. This is consistent with the literature showing that children also
have a stabilizing effect on marriages (Waite and Lillard 1991). When this measure of the
presence of children is added to the model, the coefficient on divorce culture decreases slightly
but remains positive and statistically significant suggesting that cross-ethnicity differences in
fertility are not driving our culture results.20
Mindful of the potential bias that may result, we also add female wages to the model in
column 7. As expected, female wages are associated with higher divorce rates. Interestingly, the
divorce culture coefficient decreases only slightly and remains statistically significant when this
variable is added. We conclude, therefore, that divorce norms and taboo are likely to be
important drivers of divorce patterns.
6 Cultural Transmission and Peer Effects
In this section, we explore how divorce culture is transmitted from person to person. Parents
certainly instil in their children a set of values about family and divorce which gets passed down
from generation to generation. In fact, this vertical transmission of culture is often cited as a
possible explanation for why children of divorced parents are more likely to divorce (Amato
1996; Gruber 2004). It is also possible that home country divorce culture has no impact on the
divorce decisions of immigrants in our sample but that immigrants simply respond to whether
their own parents are divorced. To address this issue, we would have liked to control for whether 20 Interpretation of results with controls for children in the household may remain problematic even in regressions run on the female sample. Children living in the household at the time of the survey are likely to be a bad proxy for children ever born, especially for older women. Since Suchindran and Koo (1992) report that on average women have their last births in their 30s, we address this concern by running the regressions on a younger sample of women, ages 25 to 50. Restricting the sample in this way results in smaller and less statistically significant estimated coefficients on our divorce cultural proxy. However, just as in the older sample, adding controls for children in the household does not significantly change the estimated coefficient on home country divorce rates.

23
a person’s parents were divorced, but this information is not available in the data. Instead, we
examine whether immigrants’ sensitivities to home country divorce rates differ depending on
whether they live in predominantly same-ethnicity communities. Under the rather strong
assumption that parental divorce rates are the same regardless of where families live, then we
might interpret a stronger relationship between home country divorce rates and own divorce
probabilities in predominantly ethnic communities as evidence that culture is horizontally
transmitted through neighborhood effects.
As described in Fernández and Fogli (2009), local communities can preserve culture by
either providing role models for acceptable family arrangements or by punishing behavior which
is different from the norm. Indeed, McDermott et al. (2009) find that divorce spreads across
friends, siblings, and co-workers. Similarly, several papers have found that communities whose
members are more socially integrated (as measured by church membership, urbanicity, and
population change) have lower divorce rates (Glenn and Shelton 1985; Breault and Kposowa
1987).
To identify the role of network effects in the probability of being divorced, we use an
empirical strategy similar to that in Bertrand et al.’s (2000) work on network effects and welfare
cultures. Since European divorce rates are lower than US divorce rates (see Table 1), if culture is
transmitted within local communities, then we might expect that immigrants living in
predominantly ethnic areas will be less likely to divorce than immigrants living amidst
Americans. Moreover, the effect of ethnic concentration should be particularly strong for
immigrants in ethnic groups with especially low divorce rates. To formalize this idea, consider
the following equation,
1 2 3*ijk jk jk j ijk k j ijkD P P DR e X ,
24
where the proportion of individuals in the immigrant’s metropolitan area from the same country
of origin is denoted jkP , j represents country of origin fixed effects and ijke is an error term.
The other variables are defined as before. If culture is transmitted within communities and
immigrants typically have lower divorce rates than natives, we may expect that an increase in the
concentration of individuals from one’s country of origin results in a decrease in divorce rates so
α1 should be negative. The country of origin fixed effects will absorb any determinant of divorce
which varies systematically by country of origin. This certainly includes the country of origin
divorce rate used in our original specification, but the fixed effects will also control for any
unobserved determinants of divorce which are common to all people from the same origin
country.
Our variable of interest is the interaction between ethnic concentration and home country
divorce rate. As discussed above, an increase in the concentration of same-ethnicity immigrants
should decrease divorce rates more for immigrants from countries with low divorce rates than for
immigrants from high divorce countries. For example, since the divorce rate in Russia is higher
than the divorce rate in Italy, an increase in the concentration of same-ethnicity immigrants
should have a more negative effect on Italians than Russians. In fact, if divorce rates of the
Russians that immigrate to the US, probably a non-random sample of Russians, are higher than
the divorce rates of Americans, we might expect Russian immigrants surrounded by other
Russians to have higher divorce rates than Americans. In any case, we expect α2 to be positive.
Table 6 presents regression results. As can be seen in the first column, ethnic concentration
has a statistically insignificant effect on divorce rates. When the home country’s divorce rate is
added in the second column, the concentration coefficient remains insignificant, but the home
country divorce rate has the expected positive sign and the magnitude is the same as the value in
25
our baseline specification presented in Column 2 of Table 2. In the third column, the interaction
between origin country divorce rate and ethnic concentration is added to the model, and as
predicted, the coefficient on the interaction is positive and statistically significant. Moreover,
when the interaction is included, the estimated coefficient on the concentration variable becomes
negative (although it is still not statistically significant).
Since we are identifying the role of culture off of variation in the interaction between ethnic
concentration and home country divorce rate in this model, we can replace home country divorce
rate with home country dummy variables. As can be seen in column 4, our coefficient of interest
increases from .58 to .93 and becomes highly significant, again confirming that an increase in the
concentration of immigrants leads to a larger decrease in the probability of being currently
divorced for immigrants from countries with relatively low divorce rates. A ten percentage point
increase in the concentration of co-ethnics leads to a four percentage point decrease in the
probability of being currently divorced for Italians since the total divorce rate in Italy is 0.13, but
only about half percentage point decrease in the probability that a German is currently divorced
since the German divorce rate is 0.51. In fact, the same ten percentage point increase in the
concentration of Russians results in an over six percentage point increase in the probability of
currently being divorced for Russians since the Russian divorce rate is 1.26.
As discussed above, an attractive feature of this approach is that it can speak to many of the
potential sources of bias in our main specification. By including country of origin fixed effects,
we are implicitly controlling for all of the characteristics which vary by country but that cannot
be interpreted as divorce culture. Besides parental divorce rates, examples might include
tendencies toward domestic violence, adultery, and drug or alcohol abuse. We are not claiming
that in itself this is a full proof method of identifying divorce culture since immigrants that
26
choose to reside amidst co-ethnics may have preferences and constraints which are similar to
those in their ethnic groups. However, it is comforting that the different methods of identifying
culture point to the same basic conclusion: The differences in divorce rates in Europe cannot be
explained entirely by laws and institutions. Our evidence suggests that culture plays an important
role.
7 Conclusion
This paper aims to rigorously disentangle the effects of markets and institutions from the effects
of culture in determining divorce decisions. Because immigrants that arrived in the US as young
children absorb home country culture from their parents and ethnic communities but are exposed
to US laws and institutions, we interpret the positive estimated effect of home country divorce
rates on their divorce probabilities as evidence of the role of culture.
We view our results as strong evidence that cross-country variation in divorce laws, welfare
policies, and economic conditions in Europe cannot entirely explain the observed variation in
divorce rates. Using several techniques, we make a case for the importance of culture in divorce
decisions, but acknowledge that our list of controls is rather limited. For example, determinants
of divorce not considered in our analysis include whether the marriage is a first, second, or third
marriage, premarital childbearing (White 1990), unexpected economic shocks (Böheim and
Ermisch 2001; Weiss and Willis 1997), and premarital cohabitation (Lillard et al 1995). Our
omission of these variables is partly due to data limitations, but it is unclear whether we would
want to include a long list of controls even if the data were available. Attitudes about divorce
may impact divorce rates through marriage, birth timing, and cohabitation decisions and so
including these controls would limit the avenues through which culture is allowed to operate. All
in all, we view our results as evidence in favor of the role of culture but believe that a more
27
thorough examination of the mechanisms through which culture operates is an interesting
question for future research.
Cross-country differences in culture may explain the findings in the literature that similar
changes in divorce laws have very different effects on divorce outcomes (Poppel and de Beer
1993; Smith 1997; and Allen 1998). Moreover, the interplay between culture and laws may help
explain why policies resulting in small short term increases in divorce rates may have large long
term effects. Differences in culture may also reconcile the empirical observation that decreases in
reported well-being after a divorce differ across countries (Kalmijn 2009). We leave an
examination of these issues for future research.

28
References
Akerlof, George A., and Rachel E. Kranton (2000). “Economics and Identity.” Quarterly Journal of Economics, 115(3), 715-753.
Allen, Douglas W. (1998). “No-Fault Divorce in Canada: Its Cause and Effect.” Journal of Economic Behavior and Organization, 37(2), 129-149.
Almond, Douglas Jr, Lena Edlund and Kevin Milligan (2009). “Son Preference and the Persistence of Culture: Evidence from Asian Immigrants to Canada.” NBER Working Paper No. 15391.
Amato, Paul R. (1996). “Explaining the Intergenerational Transmission of Divorce.” Journal of Marriage and the Family, 58(3), 628-640.
Antecol, Heather (2000). “An Examination of Cross-Country Differences in the Gender Gap in Labor Force Participation rates.” Labour Economics, 7(4), 409-426.
Bahr, Howard M., and Bruce A. Chadwick (1985). “Religion and Family in Middletown, USA.” Journal of Marriage and the Family, 47(2), 407-414. Becker, Gary S., Elisabeth M. Landes, and Robert T. Michael (1977). “An Economic Analysis of Marital
Instability.” Journal of Political Economy, 85(6), 1141-1187.
Bertrand, Marrianne, Erzo F. P. Luttmer and Sendhil Mullainathan (2000). “Network Effects and Welfare Culutres.” Quarterly Journal of Economics, 115(3), 1019-1055.
Bisin, Alberto, Giorgio Topa and Thierry Verdier (2004). "Religious Intermarriage and Socialization in the United States." Journal of Political Economy, 112(3), 615-664.
Bisin, Alberto and Thierry Verdier (2000). “Beyond the Melting Pot: Cultural Transmission, Marriage, and the Evolution of Ethnic and Religious Traits.” Quarterly Journal of Economics, 115(3), 955-988.
Boheim, Rene and John Ermisch (2001). “Partnership Dissolution in the UK: the Role of Economic Circumstances.” Oxford Bulletin of Economics and Statistics, 63(2), 197-208. Borjas, George J. (2005). “The Labor-Market Impact of High-Skill Immigration.” The American Economic Review, 95(2), 56-60.
Breault, Kevin D., and Augustine J. Kposowa (1987). “Explaining Divorce in the United States: A Study of 3,111 Counties in 1980.” Journal of Marriage and the Family, 49(3), 549-558. Brinig, Margaret F., and Douglas W. Allen (2000). “’These Boots are Made for Walking’: Why Most Divorce Filers are Women.” American Law and Economics Review 2(1), 126-169.
Brügger, Beatrix, Raphael Lalive and Josef Zweimüller (2009). “Does Culture Affect Unemployment? Evidence from Röstigraben.” IZA Discussion Papers 4283, Institute for the Study of Labor (IZA).
Burgess, Simon, Carol Propper and Arnstein Aassve (2003). “The Role of Income in Marriage and Divorce Transitions Among Young Americans.” Journal of Population Economics, 16(3), 455–475.

29
Carroll, Christopher D., Byung-Kun Rhee and Changyong Rhee (1994). “Are There Cultural Effects on Saving? Some Cross-Sectional Evidence.” Quarterly Journal of Economics, 109(3), 685-699. Chiswick Barry R. and Christina A.Houseworth (2008) “Ethnic Intermarriage among Immigrants: Human Capital and Assortative Mating” IZA Discussion Papers 3740, Institute for the Study of Labor
(IZA).
Chong, Alberto, and Eliana La Ferrara (2009). “Television and Divorce: Evidence From Brazillian Novelas.” Journal of the European Economic Association, 7(2–3), 458–468.
Council of Europe (2002). “Recent demographic developments in Europe” Demographic Yearbook, 70-71. http://www.coe.int/t/e/social_cohesion/population/demographic_year_book/2002_Edition/
Dickert-Conlin, Stacy (1999). “Taxes and Transfers: Their Effects on the Decision to End a Marriage.” Journal of Public Economics, 73(2), 217–240. Fernández, Raquel (2007). “Women, Work, and Culture.” Journal of the European Economic Association, 5(2-3), 305-332. Fernández, Raquel, and Alessandra Fogli (2005). “Culture: An Empirical Investigation of Beliefs, Work, and Fertility.” NBER Working Paper No. 11268.
Fernández, Raquel, and Alessandra Fogli (2006). “Fertility: The Role of Culture and Family Experience.” Journal of the European Economic Association, 4(2-3), 552-561.
Fernández, Raquel, and Alessandra Fogli (2009). “Culture: An Empirical Investigation of Beliefs, Work, and Fertility.” American Economic Journal: Macroeconomics, American Economic Association, 1(1), 146-177.
Friedberg, Leora (1998). “Did Unilateral Divorce Raise Divorce Rates? Evidence from Panel Data.” American Economic Review, 88(3), 608–627. Furtado, Delia and Nikolaos Theodoropoulos (2011) “Interethnic Marriage: a Choice between Ethnic and
Educational Similarities.” Journal of Population Economics, 24(4), 1257-1279.
Giuliano, Paola (2007). “Living Arrangements in Western Europe: Does Cultural Origin Matter?” Journal of the European Economic Association, 5(5), 927-952.
Glenn, Norval D., and Beth Ann Shelton (1985). “Regional Differences in Divorce in the United States.” Journal of Marriage and the Family, 47(3), 641-652. González-Val, Rafael and Miriam Marcén (2011). “Unilateral Divorce vs. Child Custody and Child
Support in the US.” Journal of Economic Behavior & Organization, forthcoming.
González, Libertad, and Tarja K. Viitanen (2009). “The Effect of Divorce Laws on Divorce Rates in Europe.” European Economic Review, 53(2), 127–138.
Gray, Jeffrey S. (1998). “Divorce-Law Changes, Household Bargaining, and Married Women’s Labor Supply.” American Economic Review, 88(3), 628–642.

30
Gruber, Jonathan (2004). “Is Making Divorce Easier Bad for Children? The Long-Run Implications of Unilateral Divorce.” Journal of Labor Economics, 22(4), 799–833.
Guiso, Luigi, Paola Sapienza and Luigi Zingales (2006). “Does Culture Affect Economic Outcomes?” Journal of Economic Perspectives, 20(2), 23-48. Halla, Martin (2011). “The Effect of Joint Custody on Marriage and Divorce,” Journal of the European
Economic Association, forthcoming Heaton, Tim B., and Ashley M. Blake (1999). “Gender Differences in Determinants of Marital Disruption.” Journal of Family Issues, 20(1), 25-45.
Heim, Bradley T. (2003). Does Child Support Enforcement Reduce Divorce Rates? A Reexamination.” Journal of Human Resources, 38 (4) 773-791.
Isen, Adam, and Betsey Stevenson (2010). “Women's Education and Family Behavior: Trends in Marriage, Divorce and Fertility.” NBER Working Paper No. 15725.
Jalovaara, Marika (2003). “The Joint Effects of Marriage Partners' Socioeconomic Positions on the Risk of Divorce.” Demography, 40(1), 67-81.
Jensen, Peter and Nina Smith (1990). “Unemployment and Marital Dissolution.” Journal of Population Economics, 3(3), 215-229.
Johnson, William R., and Jonathan Skinner (1986). “Labor Supply and Marital Separation.” American
Economic Review 76(3), 455-469.
Kalmijn, Matthijs (1993). “Spouse Selection Among the Children of European Immigrants: A Comparison of Marriage Cohorts in the 1960 Census.” International Migration Review, 27(1), 51-78.
Kalmijn, Matthijs (2009). “Country Differences in the Effects of Divorce on Well-being: The Role of Norms, Support, and Selectivity.” European Sociological Review, doi:10.1093/esr/jcp035.
Kalmijn, Matthijs, Paul M. De Graaf and Anne-Rigt Poortman (2004). “Interactions Between Cultural and Economic Determinants of Divorce in The Netherlands.” Journal of Marriage and Family, 66(1), 75-89.
Kalmijn, Matthijs, and Anne-Rigt Poortman (2006). “His or Her Divorce: The Gendered Nature of Divorce and its Determinants.” European Sociological Review, 22(2), 201-214.
Kalmijn, Matthijs, and Wilfred Uunk (2007). “Regional Value Differences in Europe and the Social Consequences of Divorce: A Test of the Stigmatization Hypothesis.” Social Science Research, 36(2), 447-468.
Lehrer, Evelyn L., and Carmel U. Chiswick (1993). “Religion as a Determinant of Marital Stability.” Demography, 30(3), 385-404.
Lillard, Lee A., Michael J. Brien and Linda J. Waite (1995). “Premarital Cohabitation and Subsequent Marital Dissolution: A Matter of Self-Selection?” Demography, 32(3), 437-457.
31
McDermott, Rose, Nicholas A. Christakis, and James H. Fowler (2009). “Breaking Up is Hard to Do, Unless Everyone Else is Doing it Too: Social Network Effects on Divorce in a Longitudinal Sample Followed for 32 Years.” Available at SSRN: http://ssrn.com/abstract=1490708.
Nixon, Lucia A. (1997). “The Effect of Child Support Enforcement on Marital Dissolution.” Journal of Human Resources, 32(1) 159-181.
Peters, Elizabeth H. (1986). “Marriage and Divorce: Informational Constraints and Private Contracting.” American Economic Review, 76(3), 437-454.
van Poppel, Frans, and Joop de Beer (1993). “Measuring the Effect of Changing Legislation on the Frequency of Divorce: The Netherlands, 1830-1990.” Demography, 30(3), 425–441. Ruggles, Steven, Alexander, J. Trent, Genadek, Katie, Goeken, Ronald, Schroeder, Matthew B., and Matthew Sobek. Integrated Public Use Microdata Series: Version 5.0 [Machine-readable database]. Minneapolis: University of Minnesota, 2010. Sevilla-Sanz, Almudena (2010). “Division of Household Labor and Cross-Country Differences in Household Formation Rates.” Journal of Population Economics, 23(1), 225-249.
Smith, Ian (1997). “Explaining the Growth of Divorce in Great Britain.” Scottish Journal of Political Economy, 44(5) 519–543. Svarer, Michael and Mette Verner (2008). “Do Children Stabilize Relationships in Denmark?” Journal of Population Economics, 21(2), 395–417.
Tjøtta, Sigve, and Kjell Vaage (2008). “Public Transfers and Marital Dissolution.” Journal of Population Economics, 21(2), 419–437.
Trent, Katherine, and Scott J. South (1989). “Structural Determinants of the Divorce Rate: A Cross- Societal Analysis.” Journal of Marriage and the Family, 51(2), 391-404. United Nations Demographic Yearbooks (several issues) http://unstats.un.org/unsd/demographic/products/dyb/dyb2.htm United Nations Demographic Yearbooks- Historical Supplement (1997). “Table 4. Selected derived measures of natality: 1948-1997” http://unstats.un.org/unsd/demographic/products/dyb/DYBHist/HistTab04.pdf
United Nations Demographic Yearbooks- Historical Supplement (1997). “Table 12. Population by marital
status, age, sex, and urban/rural residence, each census: 1948-1997” http://unstats.un.org/unsd/demographic/products/dyb/DYBHist/HistTab12.pdf
United Nations Demographic Yearbook Special Census Topics (2006) “Table 2 Population by marital status, age, sex, urban/rural residence: each census, 1985-2004” http://unstats.un.org/unsd/demographic/products/dyb/dybcensus/V1_Table2.pdf
United Nations Economic Commission for Europe (UNECE) Statistical Division Database (2010), “Mean Age at first marriage by sex”

32
http://w3.unece.org/pxweb/dialog/varval.asp?ma=052_GEFHAge1stMarige_r&path=../database/STAT/30-GE/02-Families_households/&lang=1&ti=Mean+age+at+first+marriage+by+sex
United Nations Economic Commission for Europe (UNECE) Statistical Division Database (2010),
“Total Fertility Rate” http://w3.unece.org/pxweb/dialog/varval.asp?ma=02_GEFHFertilityRate_r&path=../DATABASE/STAT/30-GE/02-Families_households&lang=1
United Nations Economic Commission for Europe (UNECE) Statistical Division Database (2011),
“Population, 5-year age groups, by marital status and sex” http://w3.unece.org/pxweb/dialog/varval.asp?ma=005_GEPOPop5YearMaSta_r&path=../database/STAT/30-GE/01-Pop/&lang=1&ti=Population%2C+5-year+age+groups%2C+by+marital+status+and+sex
United Nations Statistics Division (2010), “GDP: Gross Domestic Product at Current Prices in US$”
(National Accounts Main Aggregates Database). http://unstats.un.org/unsd/snaama/dnltransfer.asp?fID=9
Waite, Linda J., and Lee A. Lillard (1991). “Children and Marital Disruption.” American Journal of Sociology, 96(4), 930-953.
Weiss, Yoram, and Robert J. Willis (1997), “Match Quality, New Information, and Marital Dissolution.” Journal of Labor Economics, 15(l), S293-S329.
White, Lynn K. (1990). “Determinants of Divorce: A Review of Research in the Eighties.” Journal of Marriage and the Family, 52(4), 904-912.
Wolfers, Justin (2006). “Did Unilateral Divorce Laws Raise Divorce Rates? A Reconciliation and New Results.” American Economic Review, 96(5), 1802-1820. World Values Survey 2000, Official data file v.20090914, World Values Survey Association
(www.worldvaluessurvey.org) Aggregate File Producer: ASEP/JDS, Madrid. World Values Survey 1995, Official data file v.3, World Values Survey Association
(www.worldvaluessurvey.org) Aggregate File Producer: ASEP/JDS, Madrid.
World Values Survey 1990, Official data file v.20090906, World Values Survey Association (www.worldvaluessurvey.org) Aggregate File Producer: ASEP/JDS, Madrid.
World Values Survey 1981, Official data file v.20090906, World Values Survey Association (www.worldvaluessurvey.org) Aggregate File Producer: ASEP/JDS, Madrid.

33
Figure 1. Remarriage Rates and Divorce Rates
Notes: Divorce rates are defined as the number of divorces in the year 2000 per 100 married individuals in a country. Remarriage rates, the number of people that are married divided by the number of people that have ever been divorced, were calculated by the authors using data from the 1999-2004 World Values Survey on a sample of individuals aged 25 to 64. The 2-letter codes for countries are supplied by the ISO (International Organization for Standardization). No data were available for Albania, Norway and Switzerland. Circle sizes represent country populations estimated using WVS weighted observations.
DK
FI
SE
UK
IE
BEFR
NL
GR
IT
PT
ES
ATBG
CSDE
HU
PLRO
YU
LV
LT
SU0
.1.2
.3.4
.5.6
.7.8
.91
Rem
arr
iage
Rat
e
.2 .4 .6 .8 1 1.2Home Country Divorce Rate
34
Figure 2. Home Country Divorce Rates and the Probability that Childhood-Arriving Immigrants are Divorced
Notes: The percentage of immigrants in the US who are currently divorced is plotted on the y-axis while home country divorce rates, defined as the number of divorces in the year 2000 per 100 married individuals, are plotted on the x-axis. Circle sizes represent the number of immigrants from that particular country of origin in our U.S. Census sample of childhood-arriving immigrants.
DKFI
NOSE
UK
IEBE
FR
NLCH
AL
GR
IT PT
ESAT
BG
CSDE
HU
PL
RO
YU
LV
LT
SU
05
1015
2025
3035
4045
Pe
rcen
t C
urre
ntly
Div
orce
d
.2 .4 .6 .8 1 1.2Home Country Divorce Rate
35
Table 1. Summary Statistics by Country of Origin Country of Origin
Home-country Divorce
Proportion Currently
Average Age
Proportion Male
Proportion High
Proportion Some
Proportion Bachelors
Proportion At Least
Average Log Wage
Average Log Wage
Number of Observations
Rate Divorced School Graduate College Degree + one (Males) (Females) Child (Females)
Russia 1.26 0.16 37.36 0.47 0.21 0.22 0.5 0.5 10.54 10.06 214 Finland 0.7 0.14 46.57 0.59 0.1 0.4 0.5 0.41 10.77 10.54 38 Lithuania 0.7 0.44 50.8 0.54 0.22 0.22 0.56 0.42 10.19 10.63 19 United Kingdom 0.69 0.18 41.71 0.49 0.23 0.39 0.36 0.64 10.65 10.03 3388 Sweden 0.68 0.16 43.79 0.52 0.15 0.31 0.5 0.62 10.57 10.1 105 Denmark 0.67 0.14 44.76 0.57 0.17 0.33 0.5 0.69 10.79 9.47 80 Czechoslovakia 0.61 0.18 46.45 0.54 0.2 0.3 0.49 0.49 10.78 9.92 110 Norway 0.57 0.17 42.36 0.56 0.13 0.36 0.48 0.53 10.73 10.03 95Belgium 0.56 0.14 43.74 0.5 0.16 0.32 0.5 0.59 10.76 10.18 161 Latvia 0.56 0.23 49.85 0.5 0.09 0.52 0.36 0.25 10.41 10.63 22 Hungary 0.55 0.22 46.76 0.45 0.27 0.25 0.44 0.57 10.66 9.84 171 Austria 0.53 0.18 49.81 0.49 0.21 0.31 0.45 0.53 10.87 10.17 426 Germany 0.51 0.18 40.81 0.49 0.23 0.37 0.37 0.67 10.66 9.95 9625Netherlands 0.49 0.12 44.21 0.52 0.25 0.36 0.36 0.64 10.84 10.06 472 France 0.46 0.18 41.44 0.47 0.2 0.35 0.41 0.71 10.66 10 1245 Portugal 0.38 0.14 36.51 0.47 0.38 0.31 0.15 0.76 10.56 9.84 674 Switzerland 0.32 0.11 43.01 0.51 0.11 0.23 0.64 0.69 11.1 9.95 127 Bulgaria 0.26 0.03 39.12 0.67 0.06 0.16 0.78 1 10.9 10.29 12 Romania 0.26 0.04 40.31 0.59 0.26 0.31 0.39 0.78 10.48 10.16 71Yugoslavia 0.24 0.08 37.93 0.45 0.27 0.35 0.35 0.82 10.81 10.03 229 Poland 0.23 0.11 42.63 0.47 0.32 0.3 0.34 0.68 10.83 10.14 388 Ireland 0.18 0.12 43.44 0.5 0.23 0.35 0.4 0.66 10.78 9.98 258 Albania 0.17 0.17 38.45 0.52 0.38 0.21 0.1 0.78 10.22 9.83 19 Greece 0.17 0.11 40.34 0.49 0.22 0.31 0.4 0.7 10.65 9.98 437Spain 0.15 0.16 35 0.47 0.19 0.42 0.36 0.75 10.56 9.95 526 Italy 0.13 0.14 41.81 0.5 0.33 0.31 0.3 0.7 10.7 9.99 1839 Average 0.48 0.17 41.22 0.49 0.24 0.36 0.37 0.67 10.67 9.98 Std. Dev. 0.18 0.37 8.37 0.5 0.43 0.48 0.48 0.47 0.81 1.03 Notes: Countries of origin are ordered by home country divorce rate, defined as the number of divorces per 100 married inhabitants. This variable was constructed using information from the UN Demographic Yearbook, UNECE Statistical Division Database, and United Nations Demographic Yearbook Special Census Topics. For reference, the US divorce rate in the year 2000 was 0.97. The other descriptive statistics in the table were constructed using our sample of childhood migrants taken from the 5% Public Use Microdata Sample of the 2000 U.S. Census. The sample consists of immigrants aged 25-64 who arrived in the US at or below the age of 5, reside in an identifiable metropolitan area, and who are either married or divorced.

36
Table 2. Divorce Culture and the Probability of Being Currently Divorced
Baseline Models
Without Germany
Without Russia and
Italy
Divorce Never
Justifiable Dependent Variable: Currently Divorced (1) (2)
(3)
(4)
(5)
Home Country Divorce Rate 0.093*** 0.061*** 0.052*** 0.072**
(0.019) (0.014) (0.015) (0.029)
% of Home Country Reporting -0.001** Divorce Never Justifiable (0.001) Male -0.025*** -0.026*** -0.020*** -0.028*** -0.026*** (0.004) (0.004) (0.006) (0.004) (0.004)High School Graduate or GED -0.030* -0.034* -0.022 -0.044*** -0.033* (0.016) (0.017) (0.026) (0.014) (0.017) Some College -0.031 -0.041** -0.021 -0.054*** -0.040* (0.020) (0.020) (0.025) (0.015) (0.020) Bachelors Degree + -0.099*** -0.103*** -0.078** -0.120*** -0.102*** (0.025) (0.025) (0.033) (0.018) (0.025) Age Fixed Effects Yes Yes Yes Yes Yes MSA Fixed Effects No Yes Yes Yes Yes Observations 20751 20751 11126 18698 20751 R-squared 0.020 0.042 0.058 0.044 0.042 Notes: Home country divorce rates are defined as the number of divorces per 100 married inhabitants in the country of origin. The sample consists of immigrants aged 25-64 who arrived in the US at or below the age of 5, reside in an identifiable metropolitan area, and who are either married or divorced. We estimate linear probability models where the dependent variable is an indicator variable equal to one if the individual is currently divorced. Column 1 includes controls for gender (male=1, 0 otherwise), education (high school graduate or GED, some college, and bachelors degree or more), and age fixed effects. Column 2 adds MSA fixed effects to the specification. Column 3 drops Germans from the sample while column 4 drops Russians and Italians. In column 5, home country divorce rates are replaced with the percentage of people in a person’s home country that believes that divorce is never justifiable. Robust standard errors, clustered by country of origin, are in parenthesis. Observations are weighted using Census-provided person weights. *** Significant at the 1% level, ** Significant at the 5% level, * Significant at the 10% level.
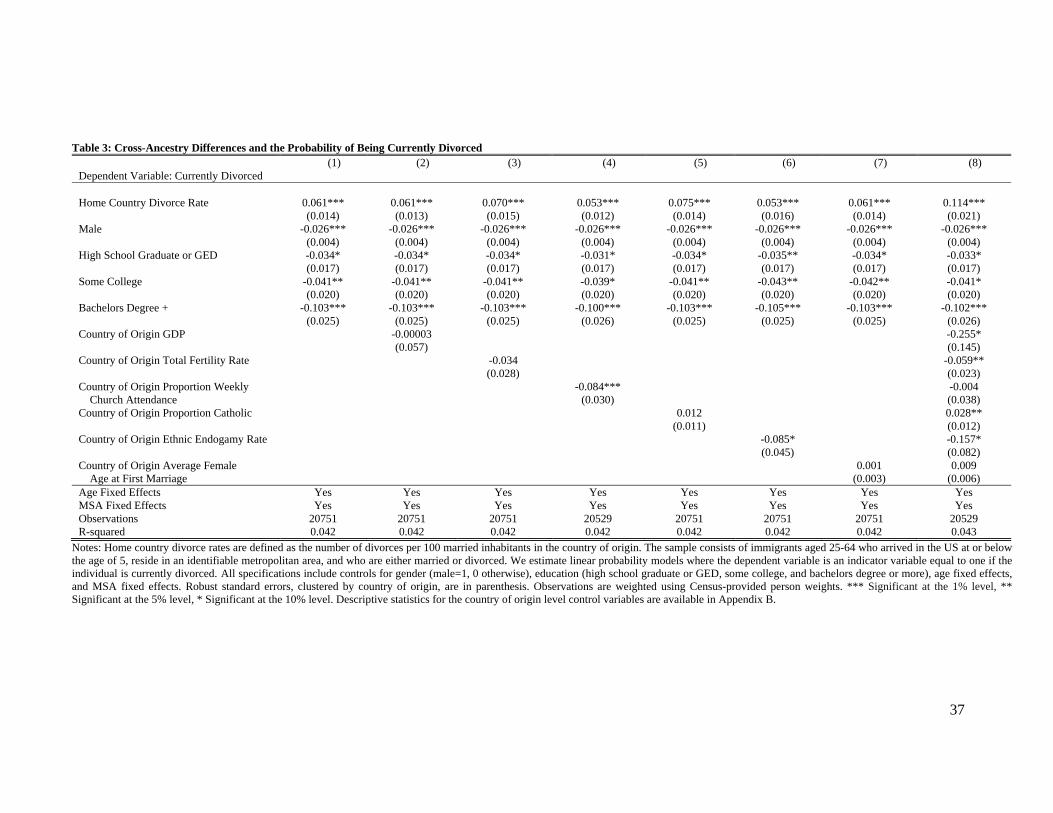
37
Table 3: Cross-Ancestry Differences and the Probability of Being Currently Divorced (1) (2) (3) (4) (5) (6) (7) (8)
Dependent Variable: Currently Divorced Home Country Divorce Rate 0.061*** 0.061*** 0.070*** 0.053*** 0.075*** 0.053*** 0.061*** 0.114*** (0.014) (0.013) (0.015) (0.012) (0.014) (0.016) (0.014) (0.021) Male -0.026*** -0.026*** -0.026*** -0.026*** -0.026*** -0.026*** -0.026*** -0.026*** (0.004) (0.004) (0.004) (0.004) (0.004) (0.004) (0.004) (0.004)High School Graduate or GED -0.034* -0.034* -0.034* -0.031* -0.034* -0.035** -0.034* -0.033* (0.017) (0.017) (0.017) (0.017) (0.017) (0.017) (0.017) (0.017) Some College -0.041** -0.041** -0.041** -0.039* -0.041** -0.043** -0.042** -0.041* (0.020) (0.020) (0.020) (0.020) (0.020) (0.020) (0.020) (0.020) Bachelors Degree + -0.103*** -0.103*** -0.103*** -0.100*** -0.103*** -0.105*** -0.103*** -0.102*** (0.025) (0.025) (0.025) (0.026) (0.025) (0.025) (0.025) (0.026)Country of Origin GDP -0.00003 -0.255* (0.057) (0.145) Country of Origin Total Fertility Rate -0.034 -0.059** (0.028) (0.023) Country of Origin Proportion Weekly -0.084*** -0.004 Church Attendance (0.030) (0.038) Country of Origin Proportion Catholic 0.012 0.028** (0.011) (0.012) Country of Origin Ethnic Endogamy Rate -0.085* -0.157* (0.045) (0.082) Country of Origin Average Female 0.001 0.009 Age at First Marriage (0.003) (0.006) Age Fixed Effects Yes Yes Yes Yes Yes Yes Yes Yes MSA Fixed Effects Yes Yes Yes Yes Yes Yes Yes Yes Observations 20751 20751 20751 20529 20751 20751 20751 20529 R-squared 0.042 0.042 0.042 0.042 0.042 0.042 0.042 0.043
Notes: Home country divorce rates are defined as the number of divorces per 100 married inhabitants in the country of origin. The sample consists of immigrants aged 25-64 who arrived in the US at or below the age of 5, reside in an identifiable metropolitan area, and who are either married or divorced. We estimate linear probability models where the dependent variable is an indicator variable equal to one if the individual is currently divorced. All specifications include controls for gender (male=1, 0 otherwise), education (high school graduate or GED, some college, and bachelors degree or more), age fixed effects, and MSA fixed effects. Robust standard errors, clustered by country of origin, are in parenthesis. Observations are weighted using Census-provided person weights. *** Significant at the 1% level, ** Significant at the 5% level, * Significant at the 10% level. Descriptive statistics for the country of origin level control variables are available in Appendix B.
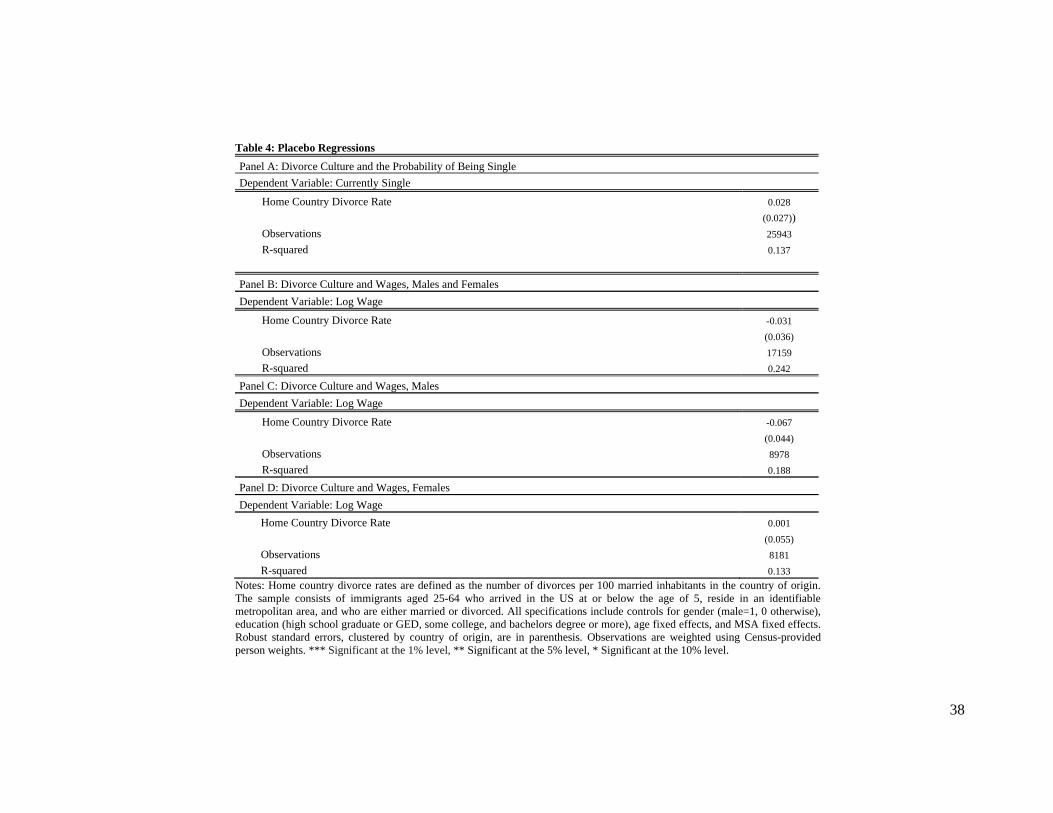
38
Table 4: Placebo Regressions
Panel A: Divorce Culture and the Probability of Being Single Dependent Variable: Currently Single
Home Country Divorce Rate 0.028 (0.027)) Observations 25943R-squared 0.137
Panel B: Divorce Culture and Wages, Males and Females Dependent Variable: Log Wage
Home Country Divorce Rate -0.031 (0.036)Observations 17159R-squared 0.242
Panel C: Divorce Culture and Wages, Males Dependent Variable: Log Wage
Home Country Divorce Rate -0.067 (0.044)Observations 8978R-squared 0.188
Panel D: Divorce Culture and Wages, Females Dependent Variable: Log Wage
Home Country Divorce Rate 0.001 (0.055)Observations 8181R-squared 0.133
Notes: Home country divorce rates are defined as the number of divorces per 100 married inhabitants in the country of origin. The sample consists of immigrants aged 25-64 who arrived in the US at or below the age of 5, reside in an identifiable metropolitan area, and who are either married or divorced. All specifications include controls for gender (male=1, 0 otherwise), education (high school graduate or GED, some college, and bachelors degree or more), age fixed effects, and MSA fixed effects. Robust standard errors, clustered by country of origin, are in parenthesis. Observations are weighted using Census-provided person weights. *** Significant at the 1% level, ** Significant at the 5% level, * Significant at the 10% level.

39
Table 5: Divorce Culture and the Probability of Being Currently Divorced by Gender
(1) (2) (3) (4) (5) (6) (7) Dependent Variable: Currently Divorced Males Females Home Country Divorce Rate 0.073*** 0.050*** 0.042*** 0.102*** 0.074*** 0.063*** 0.068*** (0.013) (0.014) (0.014) (0.033) (0.021) (0.020) (0.022) High School Graduate or GED -0.029 -0.004 -0.033 -0.033 -0.032 (0.020) (0.019) (0.024) (0.024) (0.033) Some College -0.072** -0.031 -0.009 -0.009 -0.012 (0.028) (0.022) (0.024) (0.024) (0.031) Bachelors Degree + -0.135*** -0.070** -0.066** -0.071*** -0.095*** (0.032) (0.025) (0.026) (0.025) (0.033)Log (Annual Wage Income) -0.058*** 0.024*** (0.004) (0.002)At least one child in household -0.137*** -0.122*** (0.011) (0.010) Age Fixed Effects No Yes Yes No Yes Yes Yes MSA Fixed Effects No Yes Yes No Yes Yes Yes Observations 10074 10074 8978 10677 10677 10677 8181 R-squared 0.001 0.059 0.075 0.002 0.061 0.085 0.098
Notes: Home country divorce rates are defined as the number of divorces per 100 married inhabitants in the country of origin. The samples, separated by gender, consist of immigrants aged 25-64 who arrived in the US at or below the age of 5, reside in an identifiable metropolitan area, and who are either married or divorced. We estimate linear probability models where the dependent variable is an indicator variable equal to one if the individual is currently divorced. All specifications include controls for education (high school graduate or GED, some college, and bachelors degree or more), age fixed effects, and MSA fixed effects. Robust standard errors, clustered by country of origin, are in parenthesis. Observations are weighted using Census-provided person weights. *** Significant at the 1% level, ** Significant at the 5% level, * Significant at the 10% level.
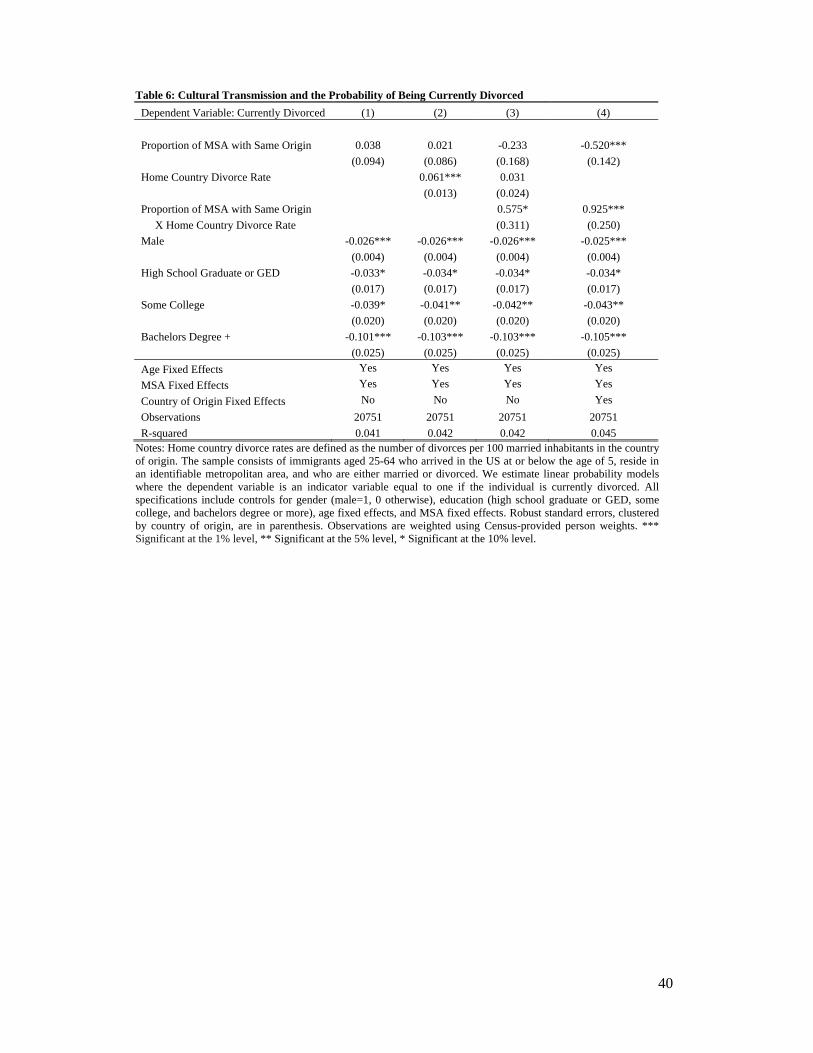
40
Table 6: Cultural Transmission and the Probability of Being Currently Divorced Dependent Variable: Currently Divorced (1) (2) (3) (4) Proportion of MSA with Same Origin 0.038 0.021 -0.233 -0.520*** (0.094) (0.086) (0.168) (0.142) Home Country Divorce Rate 0.061*** 0.031 (0.013) (0.024) Proportion of MSA with Same Origin 0.575* 0.925*** X Home Country Divorce Rate (0.311) (0.250) Male -0.026*** -0.026*** -0.026*** -0.025*** (0.004) (0.004) (0.004) (0.004) High School Graduate or GED -0.033* -0.034* -0.034* -0.034* (0.017) (0.017) (0.017) (0.017) Some College -0.039* -0.041** -0.042** -0.043** (0.020) (0.020) (0.020) (0.020) Bachelors Degree + -0.101*** -0.103*** -0.103*** -0.105*** (0.025) (0.025) (0.025) (0.025) Age Fixed Effects Yes Yes Yes Yes MSA Fixed Effects Yes Yes Yes Yes Country of Origin Fixed Effects No No No Yes Observations 20751 20751 20751 20751 R-squared 0.041 0.042 0.042 0.045
Notes: Home country divorce rates are defined as the number of divorces per 100 married inhabitants in the country of origin. The sample consists of immigrants aged 25-64 who arrived in the US at or below the age of 5, reside in an identifiable metropolitan area, and who are either married or divorced. We estimate linear probability models where the dependent variable is an indicator variable equal to one if the individual is currently divorced. All specifications include controls for gender (male=1, 0 otherwise), education (high school graduate or GED, some college, and bachelors degree or more), age fixed effects, and MSA fixed effects. Robust standard errors, clustered by country of origin, are in parenthesis. Observations are weighted using Census-provided person weights. *** Significant at the 1% level, ** Significant at the 5% level, * Significant at the 10% level.

41
APPENDIX A: Divorce Culture and the Probability of Being Currently Divorced using Home Country Divorce Rates from 1980-2000 as Cultural Proxies Dependent Variable: Currently Divorced (1) (2) (3) Male -0.026*** -0.026*** -0.026*** (0.004) (0.004) (0.004) High School Graduate or GED -0.034* -0.034* -0.034* (0.017) (0.017) (0.017) Some College -0.041** -0.041** -0.041** (0.020) (0.020) (0.020) Bachelors Degree + -0.103*** -0.103*** -0.103*** (0.025) (0.025) (0.025) Home Country Divorce Rate 1980 0.047*** (0.016) Home Country Divorce Rate 1990 0.053*** (0.014) Home Country Divorce Rate 2000 0.061*** (0.014) Age Fixed Effects Yes Yes Yes MSA Fixed Effects Yes Yes Yes Observations 20751 20751 20751 R-squared 0.042 0.042 0.042
Notes: Home country divorce rates are defined as the number of divorces per 100 married inhabitants in the country of origin. The sample consists of immigrants aged 25-64 who arrived in the US at or below the age of 5, reside in an identifiable metropolitan area, and who are either married or divorced. We estimate linear probability models where the dependent variable is an indicator variable equal to one if the individual is currently divorced. All specifications include controls for gender (male=1, 0 otherwise), education (high school graduate or GED, some college, and bachelors degree or more), age fixed effects, and MSA fixed effects. Robust standard errors, clustered by country of origin, are in parenthesis. Observations are weighted using Census-provided person weights. *** Significant at the 1% level, ** Significant at the 5% level, * Significant at the 10% level.

42
APPENDIX B: Descriptive Statistics of Country of Origin Variables
Country Divorce Rate
GDP per capita (in 100,000s)
Total fertility rate
Proportion: Weekly church
atendence Proportion: Catholics
Ethnic endogamy
rates
Average female age at first marriage
Russia 1.26 0.02 1.2 0.03 0.01 0.3 22.6 Finland 0.7 0.24 1.7 0.12 0.001 0.05 28.6 Lithuania 0.7 0.03 1.4 0.08 0.92 0.04 23.7United Kingdom 0.69 0.25 1.6 0.15 0.15 0.01 28.3 Sweden 0.68 0.28 1.6 0.13 0.02 0.11 30.6 Denmark 0.67 0.30 1.8 0.03 0.01 0.02 30.1 Czechoslovakia 0.61 0.06 1.1 0.07 0.84 0.12 24.6 Norway 0.57 0.37 1.8 0.01 0.05 28.9 Belgium 0.56 0.23 1.6 0.11 0.91 0.03 26.8 Latvia 0.56 0.03 1.2 0.28 0.33 0.17 24.9 Hungary 0.55 0.05 1.3 0.09 0.7 0.09 24.7 Austria 0.53 0.24 1.4 0.11 0.91 0.06 28.1 Germany 0.51 0.23 1.4 0.11 0.35 0.05 28.4 Netherlands 0.49 0.24 1.7 0.13 0.5 0.06 29.1 France 0.46 0.22 1.9 0.05 0.92 0.03 28.6Portugal 0.38 0.11 1.6 0.29 0.97 0.24 25.7 Switzerland 0.32 0.34 1.5 0.47 0.06 27.9 Bulgaria 0.26 0.02 1.3 0.07 0.003 0.14 24.7 Romania 0.26 0.02 1.4 0.13 0.08 0.31 23.6 Yugoslavia 0.24 0.03 1.47 0.13 0.42 0.00 24.91 Poland 0.23 0.04 1.4 0.34 0.98 0.24 23.5 Ireland 0.18 0.25 1.9 0.36 0.96 0.09 30.4 Albania 0.17 0.01 2 0.13 0.09 0.00 23.1 Greece 0.17 0.12 1.3 0.12 0.02 0.21 26.8 Spain 0.15 0.14 1.2 0.18 0.98 0.03 28.1 Italy 0.13 0.19 1.3 0.15 0.99 0.11 28.1Average 0.48 0.21 1.47 0.13 0.47 0.06 28.01 Std. Dev. 0.18 0.06 0.17 0.06 0.31 0.06 1.23
Notes: Countries of origin are ordered by home country divorce rate from highest to lowest. Detailed variable definitions and data sources are provided in Appendix C.
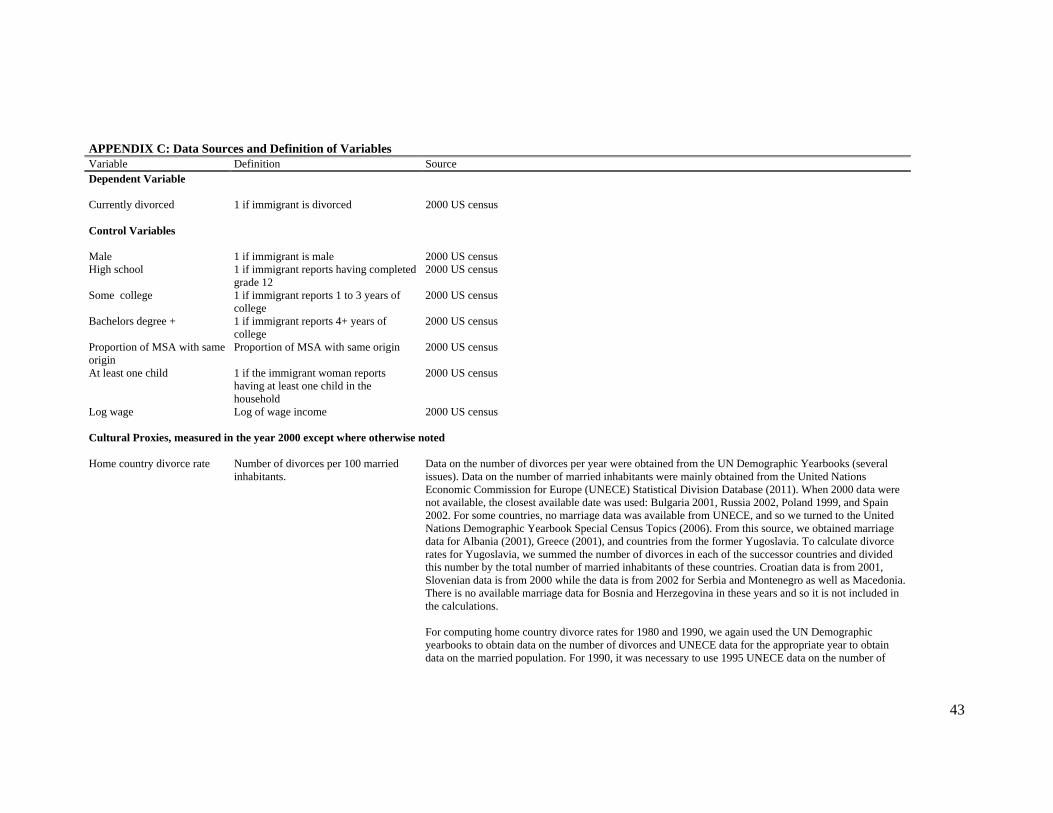
43
APPENDIX C: Data Sources and Definition of Variables Variable Definition Source Dependent Variable Currently divorced 1 if immigrant is divorced 2000 US census Control Variables Male 1 if immigrant is male 2000 US census High school 1 if immigrant reports having completed
grade 12 2000 US census
Some college 1 if immigrant reports 1 to 3 years of college
2000 US census
Bachelors degree + 1 if immigrant reports 4+ years of college
2000 US census
Proportion of MSA with same origin
Proportion of MSA with same origin 2000 US census
At least one child 1 if the immigrant woman reports having at least one child in the household
2000 US census
Log wage Log of wage income 2000 US census Cultural Proxies, measured in the year 2000 except where otherwise noted Home country divorce rate Number of divorces per 100 married
inhabitants. Data on the number of divorces per year were obtained from the UN Demographic Yearbooks (several issues). Data on the number of married inhabitants were mainly obtained from the United Nations Economic Commission for Europe (UNECE) Statistical Division Database (2011). When 2000 data were not available, the closest available date was used: Bulgaria 2001, Russia 2002, Poland 1999, and Spain 2002. For some countries, no marriage data was available from UNECE, and so we turned to the United Nations Demographic Yearbook Special Census Topics (2006). From this source, we obtained marriage data for Albania (2001), Greece (2001), and countries from the former Yugoslavia. To calculate divorce rates for Yugoslavia, we summed the number of divorces in each of the successor countries and divided this number by the total number of married inhabitants of these countries. Croatian data is from 2001, Slovenian data is from 2000 while the data is from 2002 for Serbia and Montenegro as well as Macedonia. There is no available marriage data for Bosnia and Herzegovina in these years and so it is not included in the calculations. For computing home country divorce rates for 1980 and 1990, we again used the UN Demographic yearbooks to obtain data on the number of divorces and UNECE data for the appropriate year to obtain data on the married population. For 1990, it was necessary to use 1995 UNECE data on the number of

44
married inhabitants for Belgium, Germany, Italy, the Netherlands, and Portugal. United Nations Demographic Yearbook Special Census Topics (2006) was used to obtain data for Albania (2001), Greece (1991), Latvia (1989), Russia (1989), and Yugoslavia (1990). To measure the married population in 1980, UNECE data was used for the Netherlands (1995) and Lithuania (1990). United Nations Demographic Yearbook Special Census Topics (2006) data was used for Albania (2001), Latvia (1989), and Russia (1989). The Historical Supplement of the United Nations Demographic Yearbooks (1997) was used to obtain data for Belgium (1981), Denmark (1981), Finland (1980), France (1982), Germany (1981, Democratic; 1987 Federal), Greece (1981), Italy (1981), Portugal (1981), Romania (1977), and Yugoslavia (1981). Throughout, divorce rates were computed by using divorce and marriage data for the same years.
% saying divorce never justifiable
Percent individuals who report divorce can never be justified (answers 1, 2 and 3 to the question of the WVS).
Computed by authors using data from the World Values Survey (WVS), WVS1981 (1981-1984), WVS1990 (1989-1993), WVS1995 (1995-1998), and WVS2000 (1999-2004). All waves were merged to increase sample size.
Country of Origin Variables, measured in the year 2000 except where otherwise noted Gross Domestic Product (GDP)
Per capita GDP in hundreds of thousands of US dollars
United Nations Statistics Division (2010)
Proportion: weekly church attendance
Proportion of individuals who report weekly attendance at church, mosque or synagogue
Computed by authors using data from the World Values Survey (WVS). WVS2000 (1999-2004). (Wave 1999-2004). No data for Norway and Switzerland
Proportion: catholic Proportion of individuals who report being Roman Catholic
Computed by authors using data from the World Values Survey (WVS). WVS2000 (1999-2004). (Wave 1994-1999 for Norway and Switzerland )
Total fertility rate Total fertility rate
United Nations Economic Commission for Europe (UNECE) Statistical Division Database (2010) For creating the total fertility rate at the time of migration, total fertility rate data from 1960 onwards were obtained from the Council of Europe’s Demographic Yearbook (2002). From 1948-1959, fertility data come from the United Nations Demographic Yearbook, Historical supplement (1997). Gaps from 1935 to 1947 were linearly estimated.
Interethnic marriage rate The proportion of married men (spouse present) who arrived at the US at or under the age of 5 whose spouses share a common birth place
Computed by authors using 2000 US census
Average female age at first Marriage
Age at first marriage for females
United Nations Economic Commission for Europe (UNECE) Statistical Division Database (2010). Data for Ireland is from 2002, Russia from 1995, and Norway from 1999.
Remarriage Rate The number of people, aged 25-64, that are married divided by the number of people that have ever been divorced
Computed by authors using WVS2000 (1999-2004) World Values Survey