Embed Size (px)
Citation preview

Does Autonomous Spending Work? Evidence from Brazil´s
Direct Cash to School Program.
Joana Costa
PUC-Rio/IPEA
Claudio Ferraz
PUC-Rio

Introduction
Pure resource policies have disappointing effects on student achievement. Changing
incentives and system distortions might be key to effectiveness of increasing
resources. (Hanushek, 2006) (Kremer and Holla, 2009)
Decentralization of decision making to local levels is indicated as a possible way to
improve school efficiency.
School-based management is a strong form of decentralization and a promising route
to enhance the use of (additional) school inputs.
(Bruns, Filmer & Patrinos, 2011)

Objective
The aim of this study is to assess if an increase of monetary resources locally
managed by schools results in better educational outcomes.
We investigate the use of the resources (on materials and physical infrastructure) and
its impact on student test scores.
We also explore how the results vary with different local institutional settings, such
as more parent engagement.

OUTLINE 1. Literature Review
2. Brazilian framework: PDDE Description
3. Data and Identification strategy
4. Preliminary findings
PDDE´s effect on aggregated infrastructure indicators
PDDE´s effect on disaggregated equipment indicators
PDDE´s effect on student performance
Heterogeneous effects according to parent’s engagement
5. Conclusions
6. Next steps
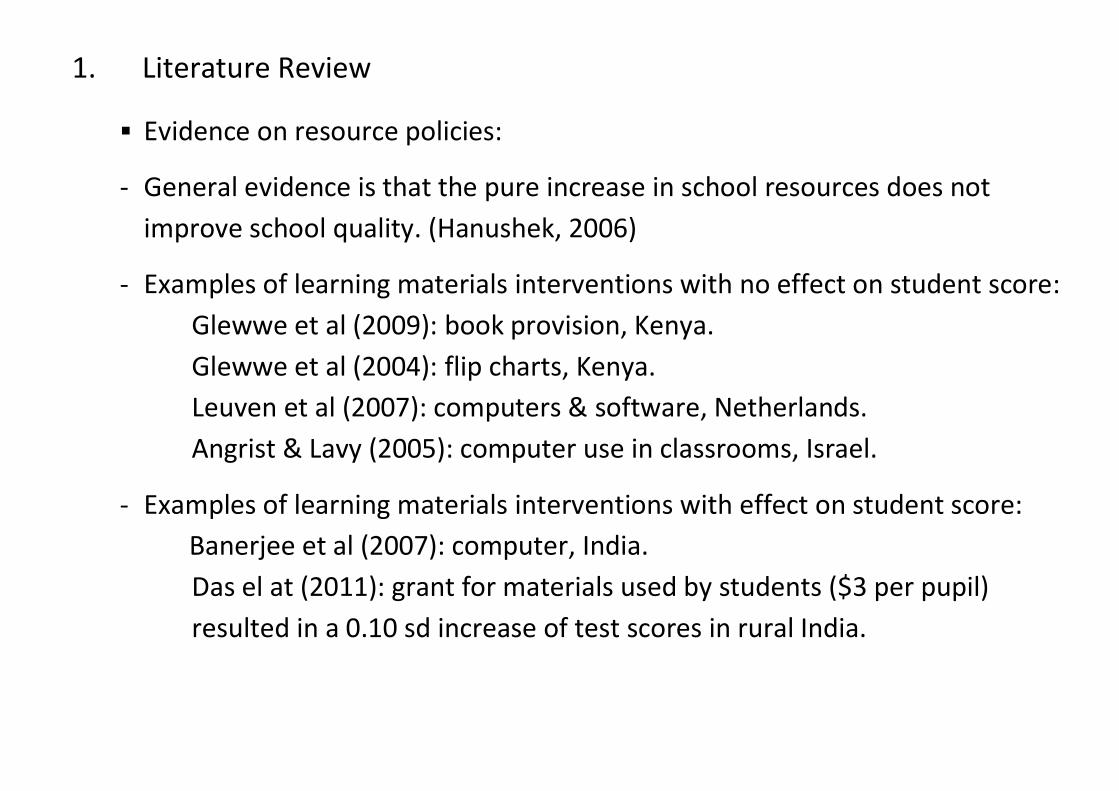
1. Literature Review
Evidence on resource policies:
- General evidence is that the pure increase in school resources does not
improve school quality. (Hanushek, 2006)
- Examples of learning materials interventions with no effect on student score:
Glewwe et al (2009): book provision, Kenya.
Glewwe et al (2004): flip charts, Kenya.
Leuven et al (2007): computers & software, Netherlands.
Angrist & Lavy (2005): computer use in classrooms, Israel.
- Examples of learning materials interventions with effect on student score:
Banerjee et al (2007): computer, India.
Das el at (2011): grant for materials used by students ($3 per pupil)
resulted in a 0.10 sd increase of test scores in rural India.

Evidence on school based management and increased funding:
- Clark (2009): improvement of 0.25 sd in pass rates on standardized exams
in UK.
- Gertler, Patrinos & Rubio-Codina (2006): Monetary support ($500-$700) to parent associations´ management (AGE) reduced grade failure by 7.4% in Mexico.
- Bruns et al (2011): Gertler, Patrinos & Rodríguez-Oreggia (2010) conduct
evaluation of AGE 125- a RCT that doubled resources in AGE schools.
Preliminary findings suggest that double funding increased Spanish scores
in 5-5.6% and Math scores in 6.3-8%.

Evidence that local characteristics matters for local decision making:
- Galiani et al (2008): poor municipalities did not benefited from school
decentralization in Argentina
- Duflo, Dupas & Kremer (2012): The Extra Teacher Program in Kenya was
more effective if parents received a SBM training (teachers were less absent
and less relatives were hired)

2. Brazilian framework: PDDE Description
It provides supplementary funding for public schools to improve its physical and
pedagogical infrastructure.
The use of funds is restricted to school maintenance, to equipment´s expenses, to
pedagogical project´s implementation or to school activities´ development. It is
expressly forbidden to pay wages or taxes.
In order to receive the PDDE´s monetary support, the school must establish an
institution termed Unidade Executora (Implementing Unit). All school community
members should be represented in this association.
This organization is responsible for deciding the PDDE´s resource allocation and for
annually preparing reports for the local government level.

PDDE coverage: approximately 92% among urban primary schools and 80% for rural
primary schools, in 2010.
PDDE grant varies according to the number of students and the school region. In
2010, the median value transferred to primary urban schools was R$3,975,
approximately U$2209. For primary rural school this amount was R$646.20, nearly
U$358.
Primary urban schools which achieved its IDEB target receive an increase of 50%.
IDEB´s formula combines pass rates and test scores and it ranges from zero to ten.
For 2007 on, there are IDEB targets set for each school by the Brazilian Government.
The targets were planned with the aim of enhancing the national IDEB from 3.8 in
2005 to 6.0 in 2022.

3. Data and Identification Strategy
DATA:
PDDE´s administrative record, FNDE
- Info on PDDE amount received by each school
School census, INEP
- School characteristics variables: teacher-student ration, % of non-white
students, % of teachers with post-graduate degree,…
“Prova Brasil” microdata, INEP
- Outcome variables: Student test grades, aggregated indices constructed
for literature, materials and physical infrastructure and availability of
resources.
- Infrastructure indices were built on perceptions variables from the
principal, teachers, and survey taker about the school.

Descriptive Statistics
Table 1: 2008 PDDE characteristics for primary urban schools
median mean sd N
all:
PDDE R$ 4976.10 R$ 5847.34 2772.03 14127
PDDE/student R$ 14.17 R$ 15.10 5.12 14127
Only bonus schools:
bonus R$ 1962.60 R$ 2136.60 946.17 10278
bonus/student R$ 5.18 R$ 5.51 1.61 10278

Table 2: School´s indicators for infrastructure
2007 2009
Principal´s view: Availability of monetary resources .66 .68
Physical Infrastructure .21 .21
Equipment Infrastructure .57 .65
Teachers´view: Availability of pedagogical resources .90 .91
Availability of monetary resources .91 .91
Equipment Infrastructure .53 .69
Literature Infrastructure .97 .95
Interviewer´s view: Physical Infrastructure .81 .81
Equipment Infrastructure .64 .69
Literature Infrastructure .65 .68

Table 3: School´s indicators for equipment
2007 2009
television .92 .92
parabolic antenna .43 .39
VHS .74 .67
copy machine .41 .62
mimeo .77 .74
video projector .18 .35
slide projector .58 .62
printing machine .80 .89
sound machine .84 .86
computer .82 .89

IDENTIFICATION STRATEGY:
- Regression Discontinuity Design
- Our strategy is to compare schools that barely accomplished its IDEB target
with those that almost achieved it in order to evaluate how the extra
monetary support was allocated and if it promoted education quality.
- There is no other national/regional program that considers this same rule.

- Fuzzy regression discontinuity model for schools´ outcomes:
b b e09 08 07
i 0 1 i i iY = + PDDE + f(z ) +
09
iY : school i´s outcome in 2009
08
iPDDE : school i´s PDDE income per student received in 2008 07
iz : forcing variable (the 2007´s IDEB score minus the 2007´s IDEB target)
- TSLS estimator where the dummy variable [ 0]iD I zi is used as an
instrument for the continuous variable 08
iPDDE .
- 1st stage: 07
0 1 ( )i i iD g za a m08
iPDDE

- The key hypothesis to our identification strategy is that these two groups are
comparable since schools would not be able to precisely control their IDEB
results.
Figure 1: Density of Forcing Variable – Primary urban schools
0.2
.4.6
.8
Density
-4 -2 0 2 4 6Forcing Variable-1st Primary Cycle

- It is also key that there is a discontinuity in the distribution of PDDE income at
the cutoff value of the forcing variable.
Figure 2: PDDE value per student in 2008
10
12
14
16
18
2008 P
DD
E/s
tudent
(R$)
-2 -1 0 1 2Forcing Variable, 2007

4. Preliminary findings

PDDE´s effect on aggregated infrastructure indicators

Table 4: Principal´s indicators
OLS RDD
Linear Quadratic Cubic Linear
Principal´s view: Availability of monetary resources PDDE/student (2008) 0.418***
0.535*** 0.505** 0.560** 0.581***
(0.0712)
(0.190) (0.233) (0.268) (0.184)
11404
11404 11404 11404 11404
Physical Infrastructure PDDE/student (2008) 0.0276
0.268** 0.228* 0.0658 0.173**
(0.0337)
(0.106) (0.130) (0.149) (0.0851)
10785
10785 10785 10785 10785
Equipment Infrastructure PDDE/student (2008) 0.206***
0.450*** 0.345** 0.218 0.412***
(0.0414)
(0.120) (0.147) (0.169) (0.105)
9296
9296 9296 9296 9296
Controls: regions & number of students Y Y Y Y Y
other school characteristics controls Y N N N Y

Table 5: Teacher´s indicators
OLS RDD
Linear Quadratic Cubic Linear
Teachers´view:
Availability of pedagogical resources PDDE/student (2008) 0.374***
0.638*** 0.543** 0.492* 0.610***
(0.0750)
(0.185) (0.223) (0.257) (0.183)
8614
8614 8614 8614 8614
Availability of monetary resources PDDE/student (2008) 0.395***
0.750*** 0.774*** 0.742*** 0.728***
(0.0735)
(0.181) (0.218) (0.252) (0.179)
8614
8614 8614 8614 8614
Equipment Infrastructure PDDE/student (2008) 0.138*
0.728*** 0.785*** 0.762*** 0.544***
(0.0760)
(0.210) (0.253) (0.292) (0.185)
8614
8614 8614 8614 8614
Literature Infrastructure PDDE/student (2008) 0.0653**
0.0683 -0.0172 0.0421 0.0485
(0.0306)
(0.0762) (0.0916) (0.106) (0.0747)
8614
8614 8614 8614 8614
Controls: regions & number of students Y Y Y Y Y
other school characteristics controls Y N N N Y

Table 6: Interviewer´s indicators
OLS RDD
Linear Quadratic Cubic Linear
Interviewer´s view: Physical Infrastructure PDDE/student (2008) 0.0529
0.0206 -0.0892 -0.204 -0.00549
(0.0427)
(0.115) (0.141) (0.162) (0.108)
9352
9352 9352 9352 9352
Equipment Infrastructure PDDE/student (2008) 0.232***
0.374*** 0.287** 0.195 0.366***
(0.0431)
(0.115) (0.141) (0.163) (0.105)
8909
8909 8909 8909 8909
Literature Infrastructure PDDE/student (2008) 0.0492
0.118 0.00675 0.0858 0.123
(0.0696)
(0.175) (0.214) (0.248) (0.168)
8194
8194 8194 8194 8194
Controls: regions & number of students Y Y Y Y Y
other school characteristics controls Y N N N Y

PDDE´s effect on disaggregated equipment indicators

Table 7: Disaggregated interviewer´s indicator OLS RDD Linear Quadratic Cubic Linear
television 0.121**
0.0653 0.0586 0.130 0.0719
(0.0473)
(0.116) (0.141) (0.164) (0.115)
8771
8771 8771 8771 8771
parabolic antenna 0.362***
0.0887 -0.0323 -0.462 0.201
(0.107)
(0.291) (0.355) (0.412) (0.261)
8771
8771 8771 8771 8771
VHS 0.225**
0.586** 0.436 0.384 0.549**
(0.109)
(0.272) (0.331) (0.385) (0.265)
8771
8771 8771 8771 8771
copy machine 0.0988
0.664** 0.494 0.0985 0.442
(0.115)
(0.297) (0.362) (0.420) (0.281)
8771
8771 8771 8771 8771
mimeo 0.329***
0.270 0.296 0.422 0.365*
(0.0871)
(0.218) (0.266) (0.309) (0.212)
8771
8771 8771 8771 8771
video projector 0.108
0.377 0.301 0.541 0.321
(0.127)
(0.313) (0.381) (0.443) (0.308)
8771
8771 8771 8771 8771
slide projector 0.185*
0.337 0.114 -0.258 0.218
(0.103)
(0.304) (0.370) (0.430) (0.251)
8771
8771 8771 8771 8771
printing machine 0.141**
0.570*** 0.507** 0.459* 0.590***
(0.0670)
(0.167) (0.204) (0.237) (0.164)
8771
8771 8771 8771 8771
sound machine 0.285***
0.168 0.0300 0.0607 0.130
(0.0733)
(0.181) (0.220) (0.256) (0.178)
8771
8771 8771 8771 8771
computer 0.152**
0.455*** 0.502*** 0.427* 0.441***
(0.0625)
(0.155) (0.189) (0.220) (0.152)
8771 8771 8771 8771 8771

PDDE´s effect on student performance

Table 8: PDDE´s effect on academic achievement
OLS RDD
Linear Quadratic Cubic Linear
Math score (2009) PDDE/student (2008) -0.00144**
0.000945 0.00285 0.00363 -0.000119
(0.000656)
(0.00179) (0.00219) (0.00253) (0.00166)
14127
14127 14127 14127 14127
Portuguese score (2009) PDDE/student (2008) -0.00115*
0.00127 0.00211 0.00260 0.000411
(0.000624)
(0.00170) (0.00208) (0.00241) (0.00158)
14127
14127 14127 14127 14127
Pass rate (2009) PDDE/student (2008) 0.110***
0.0841* 0.0304 0.0187 0.0684*
(0.0161)
(0.0430) (0.0525) (0.0607) (0.0408)
14117
14117 14117 14117 14117
Controls: regions & number of students Y Y Y Y Y
other school characteristics controls Y N N N Y

Heterogeneous effect according to parent’s engagement (through
Parent Teacher Association)
Less active PTA (less than 3 meetings/year or inexistent)
X
More active PTA (3 or more meetings/year)

Table 9: Effect on infrastructure indicators Less Active PTA More Active PTA
RDD Specification Linear Quadratic Cubic Linear Linear Quadratic Cubic Linear
Principal´s view: Availability of monetary resources
PDDE/student (2008) 0.0173 0.155 -0.0593 0.110
0.863*** 0.759** 0.808** 0.855***
(0.312) (0.386) (0.464) (0.304)
(0.248) (0.304) (0.347) (0.238)
4,140 4,140 4,140 4,140
6,915 6,915 6,915 6,915 Equipment Infrastructure
PDDE/student (2008) 0.476** 0.399* 0.0534 0.397**
0.410*** 0.276 0.184 0.429***
(0.195) (0.240) (0.291) (0.172)
(0.155) (0.190) (0.218) (0.137)
3,406 3,406 3,406 3,406
5,627 5,627 5,627 5,627
Teachers´view: Availability of monetary resources
PDDE/student (2008) 0.607* 0.514 0.544 0.609*
0.811*** 0.821*** 0.726** 0.775***
(0.317) (0.402) (0.475) (0.315)
(0.225) (0.273) (0.316) (0.222)
3,070 3,070 3,070 3,070
5,097 5,097 5,097 5,097 Equipment Infrastructure
PDDE/student (2008) 0.935** 0.947** 0.771 0.709**
0.565** 0.581* 0.579 0.406*
(0.366) (0.464) (0.547) (0.324)
(0.262) (0.317) (0.367) (0.231)
3,070 3,070 3,070 3,070
5,097 5,097 5,097 5,097
Interviewer´s view: Equipment Infrastructure
PDDE/student (2008) 0.328 -0.0540 -0.313 0.275
0.324** 0.325* 0.371* 0.342***
(0.205) (0.262) (0.317) (0.183)
(0.144) (0.175) (0.205) (0.132)
2,995 2,995 2,995 2,995
5,451 5,451 5,451 5,451 Literature Infrastructure
PDDE/student (2008) -0.0338 -0.0392 0.300 0.0542
0.116 -0.0388 0.0119 0.0871
(0.291) (0.374) (0.469) (0.278)
(0.226) (0.276) (0.316) (0.219)
2,619 2,619 2,619 2,619
5,168 5,168 5,168 5,168 Controls: regions & number of students Y Y Y Y Y Y Y Y
other school characteristics controls N N N Y N N N Y
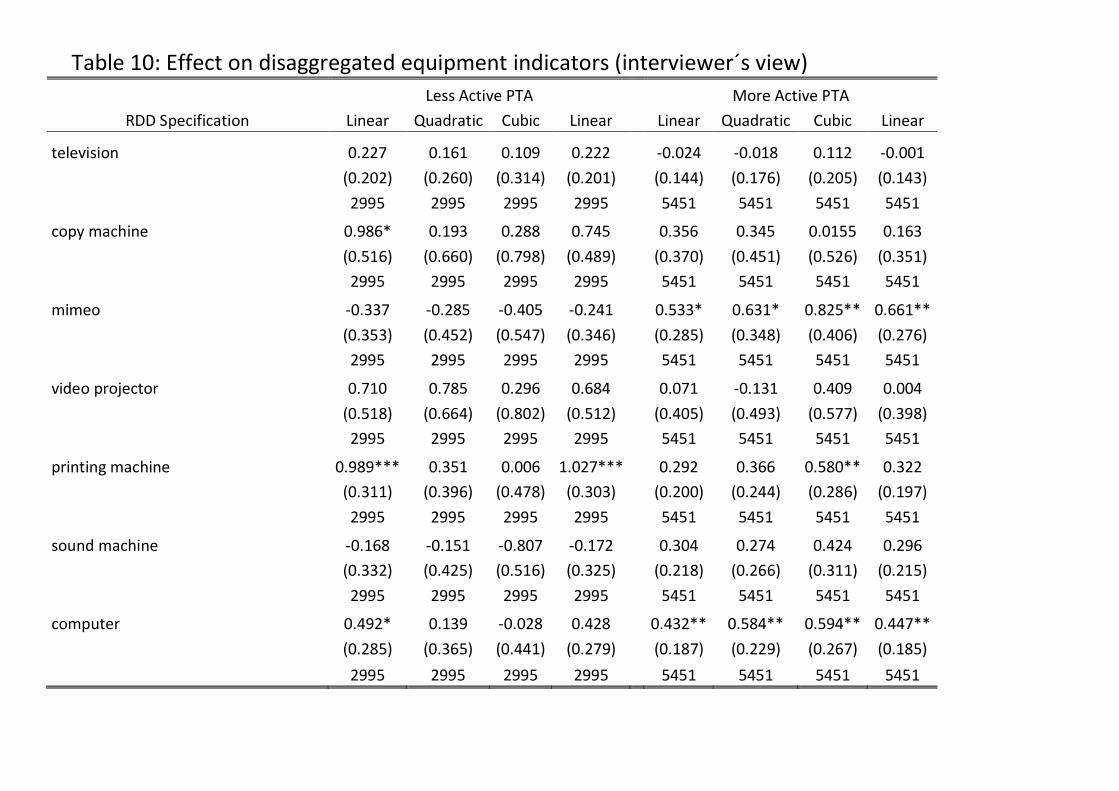
Table 10: Effect on disaggregated equipment indicators (interviewer´s view)
Less Active PTA More Active PTA
RDD Specification Linear Quadratic Cubic Linear Linear Quadratic Cubic Linear
television 0.227 0.161 0.109 0.222
-0.024 -0.018 0.112 -0.001
(0.202) (0.260) (0.314) (0.201)
(0.144) (0.176) (0.205) (0.143)
2995 2995 2995 2995
5451 5451 5451 5451
copy machine 0.986* 0.193 0.288 0.745
0.356 0.345 0.0155 0.163
(0.516) (0.660) (0.798) (0.489)
(0.370) (0.451) (0.526) (0.351)
2995 2995 2995 2995
5451 5451 5451 5451
mimeo -0.337 -0.285 -0.405 -0.241
0.533* 0.631* 0.825** 0.661**
(0.353) (0.452) (0.547) (0.346)
(0.285) (0.348) (0.406) (0.276)
2995 2995 2995 2995
5451 5451 5451 5451
video projector 0.710 0.785 0.296 0.684
0.071 -0.131 0.409 0.004
(0.518) (0.664) (0.802) (0.512)
(0.405) (0.493) (0.577) (0.398)
2995 2995 2995 2995
5451 5451 5451 5451
printing machine 0.989*** 0.351 0.006 1.027***
0.292 0.366 0.580** 0.322
(0.311) (0.396) (0.478) (0.303)
(0.200) (0.244) (0.286) (0.197)
2995 2995 2995 2995
5451 5451 5451 5451
sound machine -0.168 -0.151 -0.807 -0.172
0.304 0.274 0.424 0.296
(0.332) (0.425) (0.516) (0.325)
(0.218) (0.266) (0.311) (0.215)
2995 2995 2995 2995
5451 5451 5451 5451
computer 0.492* 0.139 -0.028 0.428
0.432** 0.584** 0.594** 0.447**
(0.285) (0.365) (0.441) (0.279)
(0.187) (0.229) (0.267) (0.185)
2995 2995 2995 2995 5451 5451 5451 5451

5. Conclusions
- PDDE´s extra cash is used for improving school materials, such as
computer and printing machine
- No impact on academic performance
- More parent´s participation leads to more visible cash spending

6. Next steps
- Explore other heterogeneous effects for different local institution
features and other school characteristics.
- Explore audit information about irregularities of PDDE for some
random chosen municipalities.