Embed Size (px)
Citation preview

DOES AGEING MATTER WHEN IT COMES TO WORKFORCE PRODUCTIVITY? Ben Franklin MAY 2018
Partners ProgrammeInternational Longevity Centre - UK

The International Longevity Centre - UK (ILC-UK) is an independent, non-partisan think-tank dedicated to addressing issues of longevity, ageing and population change. It develops ideas, undertakes research and creates a forum for debate.
The ILC-UK is a registered charity (no. 1080496) incorporated with limited liability in England and Wales (company no. 3798902).
ILC–UK11 Tufton StreetLondonSW1P 3QBTel: +44 (0) 20 7340 0440
E-mail: [email protected]

I 3 I Does ageing matter when it comes to workforce productivity?
Content
About this report...................................................................................................................................4
Summary ..............................................................................................................................................4
Introduction ..........................................................................................................................................4
Why might age effect productivity? ...................................................................................................5
Measuring the link between age and productivity in England ........................................................5
Headline findings .................................................................................................................................7
Conclusion .........................................................................................................................................12
I 4 I Does ageing matter when it comes to workforce productivity?
About this reportThis is the first in a series of short ILC reports exploring the relation between demographic forces and macroeconomic outcomes. In this paper, the author uses English local authority data to explore the economic effects of two demographic forces: 1) the 50+ share of the workforce and 2) the 70+ share of the population. Economic impacts are measured in terms of output per worker (GVA per worker).
SummaryBased on analysis of English Local Authority data, this report finds that ageing impacts workforce productivity through two channels. First, a higher share of older people in the workforce acts to drag down the overall level of productivity which may be because work suffers from diminishing returns. Second, an increased share of elderly people in the population, raises the rate of productivity growth. We suggest this may be because restrictions to labour supply boost incentives to invest in capital and innovate. More specifically we find:
• Across English local authorities, the level of health and education is strongly correlated with workforce productivity. Raising the level of education and health of the population will therefore remain key drivers of workforce productivity irrespective of age.
• However, after controlling for health and education in a regression model of productivity, the age of the workforce does matter. Specifically, the higher the proportion of the workforce aged 50+, the lower the level of productivity.
• When exploring changes in productivity between 2001 and 2011 we find that overall age structures also matter. In particular, the higher the increase in the proportion of people aged 70+, the faster the rate of productivity growth.
• We outline possible reasons for the dual effects of age on productivity. We argue that the negative relationship between the 50+ share of the workforce and the level productivity is because work suffers from diminishing returns – for every year worked, there is a relatively smaller gain in output. Meanwhile the positive relationship between the 70+ share of the population and productivity is likely driven by scarcity of labour compelling investment and innovation.
• More research is needed to fully unpick the factors underpinning the dual effects observed in this research.
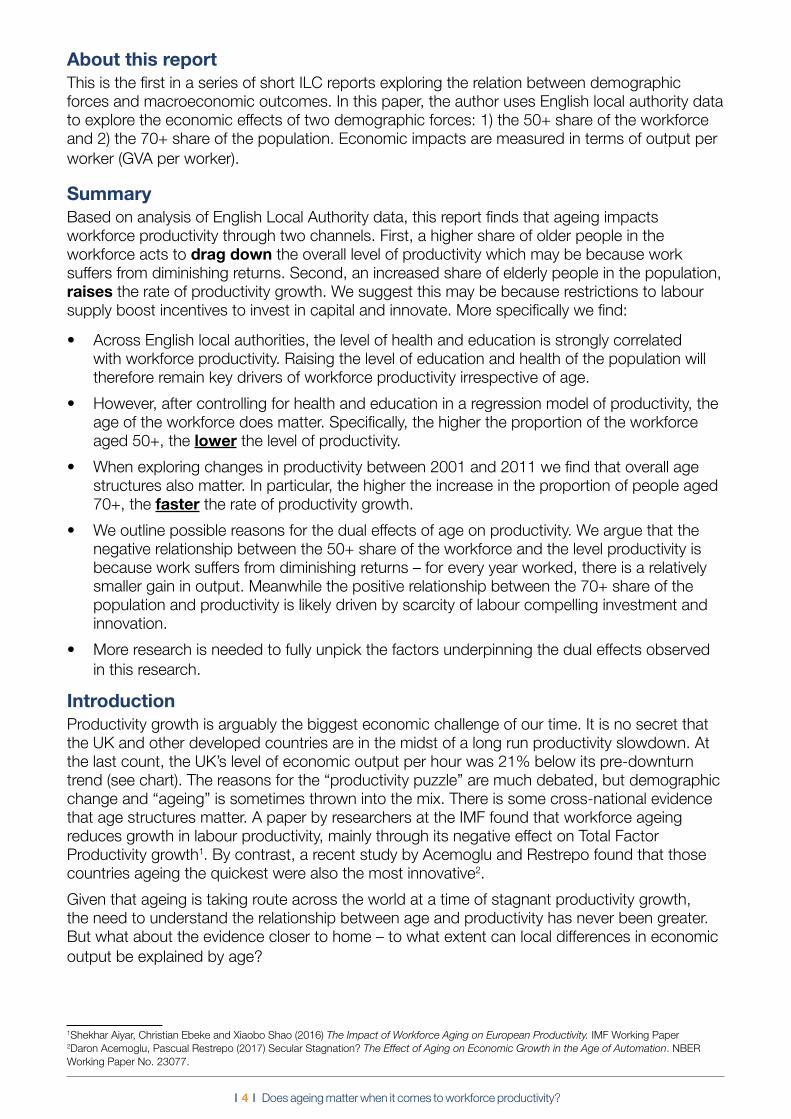
IntroductionProductivity growth is arguably the biggest economic challenge of our time. It is no secret that the UK and other developed countries are in the midst of a long run productivity slowdown. At the last count, the UK’s level of economic output per hour was 21% below its pre-downturn trend (see chart). The reasons for the “productivity puzzle” are much debated, but demographic change and “ageing” is sometimes thrown into the mix. There is some cross-national evidence that age structures matter. A paper by researchers at the IMF found that workforce ageing reduces growth in labour productivity, mainly through its negative effect on Total Factor Productivity growth1. By contrast, a recent study by Acemoglu and Restrepo found that those countries ageing the quickest were also the most innovative2.
Given that ageing is taking route across the world at a time of stagnant productivity growth, the need to understand the relationship between age and productivity has never been greater. But what about the evidence closer to home – to what extent can local differences in economic output be explained by age?
1Shekhar Aiyar, Christian Ebeke and Xiaobo Shao (2016) The Impact of Workforce Aging on European Productivity. IMF Working Paper2Daron Acemoglu, Pascual Restrepo (2017) Secular Stagnation? The Effect of Aging on Economic Growth in the Age of Automation. NBER Working Paper No. 23077.
I 5 I Does ageing matter when it comes to workforce productivity?
Figure1: Productivity per hour (actual and trend)In
dex,
qua
rter 4
200
7
Productivity per hour (actual and trend)
Output per hour (trend)Output per hour
60
70
80
90
100
110
120
130
1994
Q1
1994
Q4
1995
Q3
1996
Q2
1997
Q1
1997
Q4
1998
Q3
1999
Q2
2000
Q1
2000
Q4
2001
Q3
2002
Q2
2003
Q1
2003
Q4
2004
Q3
2005
Q2
2009
Q1
2009
Q4
2010
Q3
2011
Q2
2012
Q1
2012
Q4
2013
Q3
2014
Q2
2015
Q1
2015
Q4
2016
Q3
2017
Q2
2006
Q1
2006
Q4
2007
Q3
2008
Q2
Source: ONS and author’s calculations
Why might age effect productivity?Previous literature has outlined some of the potential reasons why older workforces might be more or less productive than younger workforces. On the one hand, older workers have the benefit of years of accumulating new skills and experiences, while on the other they might suffer from the depreciation of knowledge, physical and mental capabilities. In addition, as the IMF paper notes, workforce skills also depend on the “stock of knowledge acquired before entering the labor (sic) market, or in the early stages of individuals’ careers. This stock of skills is likely to become increasingly dated as the average age of participants in the workforce rises”. Now clearly this last point would not be a significant problem if countries invest in lifelong learning, but currently, in the UK at least, we are going in the wrong direction3.
Aside from the age of the workforce itself, overall age structures might also effect productivity growth. While some of the economic literature on ageing focuses on the potential negative economic effects from reduced labour supply, recent work has focused on the adjustments firms are likely to make in response. For instance, Acemoglu and Restrepo (2017), find that those countries ageing the fastest, are at the forefront of the adoption of new technologies – specifically robots4. In this sense, an ageing population could incentivise increased investment in new technologies and innovation as labour becomes increasingly expensive relative to capital.
Measuring the link between age and productivity in England For the analysis conducted in this report, we define productivity as the average amount being produced by a worker in a local authority (productivity per worker). To construct this measure, we take data on total Gross Value Added (GVA) for local authorities from the ONS, and combine this with information on resident’s employment from the 2001 and 2011 Census. This gives us total GVA per worker for each English local authority in both 2001 and 2011. To explore the relationship between workforce productivity and age we look at two different measures of age as well as two other important measures for comparative purposes (health and education). All population and workforce data are taken from Census via Nomis:
3 See for instance, Bursnall and Speckesser (2017), Investment in adult skills is decreasing in the UK – here’s why we should be worried. Blog for NIESR: https://www.niesr.ac.uk/blog/investment-adult-skills-decreasing-uk-%E2%80%93-here%E2%80%99s-why-we-should-be-wor-ried 4 Acemoglu, Daron and Pascual Restrepo (2016) “The Race between Machine and Man: Implications of Technology for Growth, Factor Shares and Employment” NBER Working Paper No. 22252
I 6 I Does ageing matter when it comes to workforce productivity?
Key variables:
1. The proportion of people in the workforce aged over 50.
2. The proportion of people in the resident population aged over 70.
3. The health status of the working age population (proportion in bad health).
4. The education level of the working age population (proportion with Level 4 qualifications or higher).
About local authority GVA data
Gross Value Added (GVA) is a measure of the increase in the value of the economy due to the production of goods and services. It is measured at current basic prices, which include the effect of inflation, excluding taxes (less subsidies) on products. GVA plus taxes (less subsidies) on products is equivalent to Gross Domestic Product (GDP).
The GVA data used for this report is the income approach - GVA(I). The income approach involves adding up all the income earned by resident individuals or corporations in the production of goods and services. This excludes transfer payments such as state benefits which represent a redistribution of incomes previously earned. While provided by the ONS, these local authority level data are experimental statistics rather than strictly National Statistics. The issue is that the relevant LA datasets used to construct local GVA series only go back a few years, so the ONS has to apportion previous year’s LA data from a relatively limited time series. But since this is the best data available, we choose to use this in our analysis.
For more information see ONS (2016) UK regional accounts methodology guide
We explore the relationship between age and productivity in two ways. First, we explore the extent to which older local authorities are less/more productive and second, we explore whether changes to the age structures of local authorities between the 2001 and 2011 Census are related to changes to productivity growth in the intervening period. For comparative purposes we also present our results for health and education. To estimate the statistical relationships, we first perform correlation analysis and then conduct two cross-sectional regression models to see whether the effects of age remain significant after the inclusion of other variables.
Finally, it should be noted that due to the presence of large outliers in the data we “trim the tails” by removing the top and bottom 2% of local authorities in terms of output per worker.
I 7 I Does ageing matter when it comes to workforce productivity?
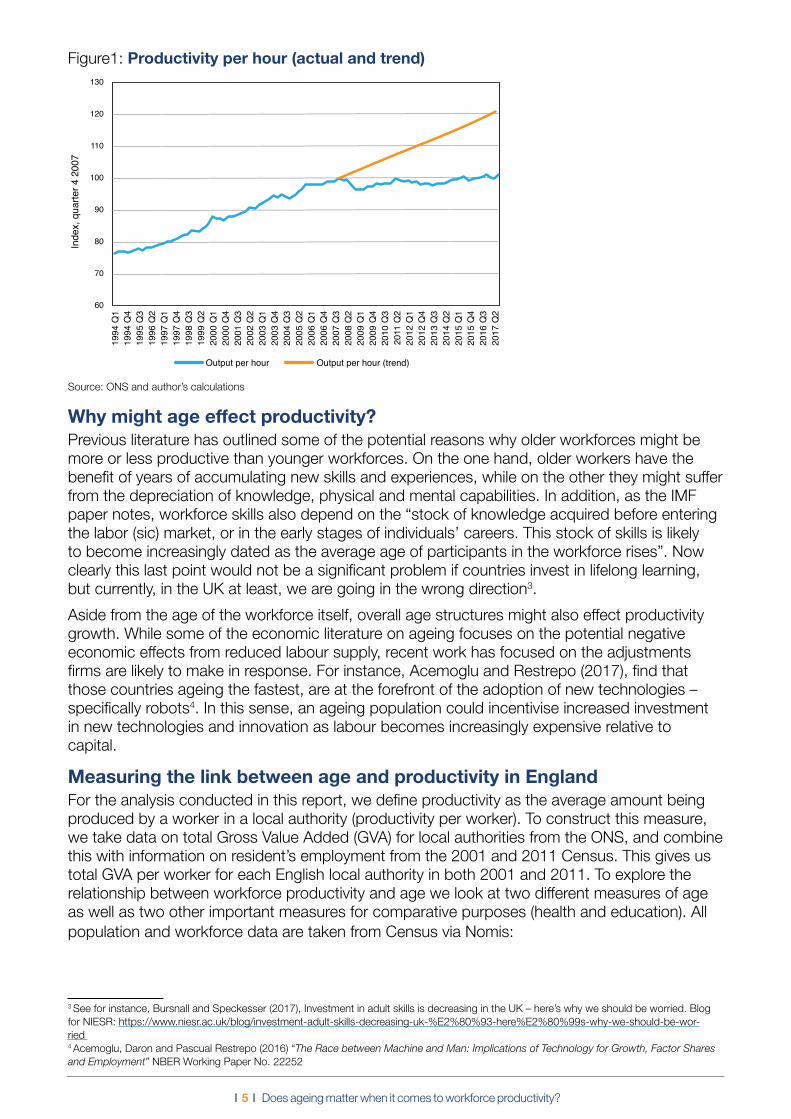
HEADLINE 1: NO CORRELATION BETWEEN AN OLDER WORKFORCE AND PRODUCTIVITY In both 2001 and 2011 there was no correlation between the proportion of the workforce over the age of 50 and GVA per worker (each dot on chart represents a local authority).
Figure 2: GVA per worker and % of workforce over 50 (2011)40.00%
£20,000.00 £30,000.00 £40,000.00 £50,000.00 £60,000.00 £70,000.00 £80,000.00 £90,000.00 £100,000.00 £110,000.00
35.00%
25.00%
20.00%
15.00%
R2 = 0.0653
10.00%
30.00%
% o
f wor
kfor
ce o
ver 5
0
GVA per worker
GVA per worker and % of workforce over 50 (2011)
Source: ONS and author’s calculations
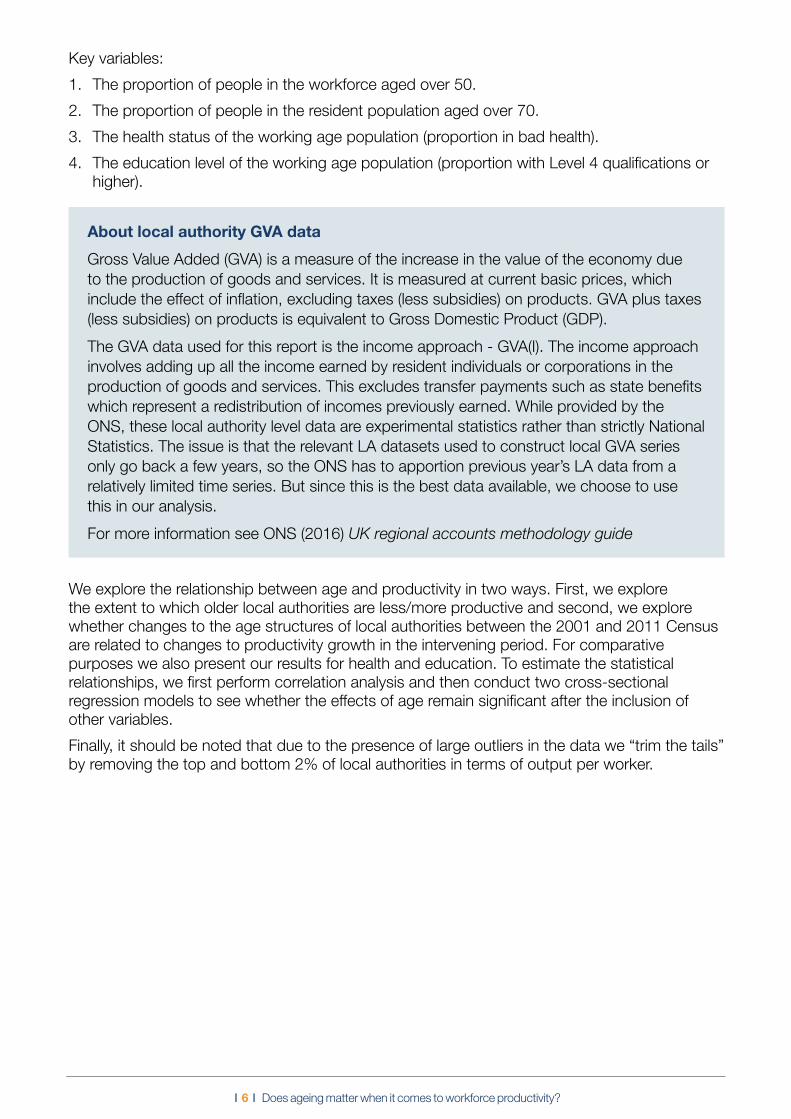
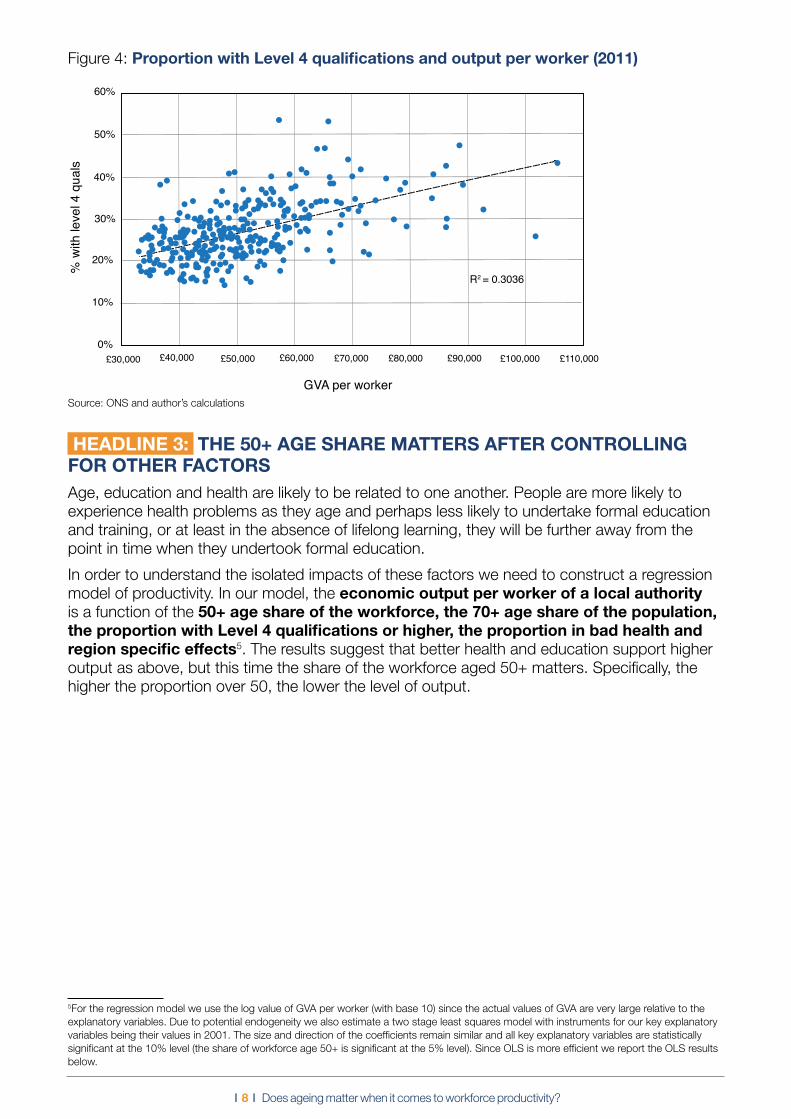
HEADLINE 2: HEALTHIER AND BETTER EDUCATED LOCAL AUTHORITIES ARE MORE PRODUCTIVE The health and relative education of the working age population are correlated with GVA per worker. Focusing on supporting the health and education of the workforce, irrespective of age, is therefore likely to support higher levels of economic output.
Figure 3: Proportion in bad health and output per worker (2011)
10.0%
£30,000.00 £40,000.00 £50,000.00 £60,000.00 £70,000.00 £80,000.00 £90,000.00 £100,000.00
9.0%
8.0%
7.0%
5.0%
4.0%
3.0%
2.0%
0.0%
1.0%R2 = 0.2668
6.0%
% in
bad
hea
lth
GVA per worker
GVA per worker and % of workforce over 50 (2011)
Source: ONS and author’s calculations
I 8 I Does ageing matter when it comes to workforce productivity?
Figure 4: Proportion with Level 4 qualifications and output per worker (2011)
£30,000 £40,000 £50,000 £60,000 £70,000 £80,000 £90,000 £110,000£100,000
50%
40%
30%
20%
0%
10%
R2 = 0.3036
60%%
with
leve
l 4 q
uals
GVA per worker
Proportion with Level 4 qualifications and output worker (2011)
Source: ONS and author’s calculations
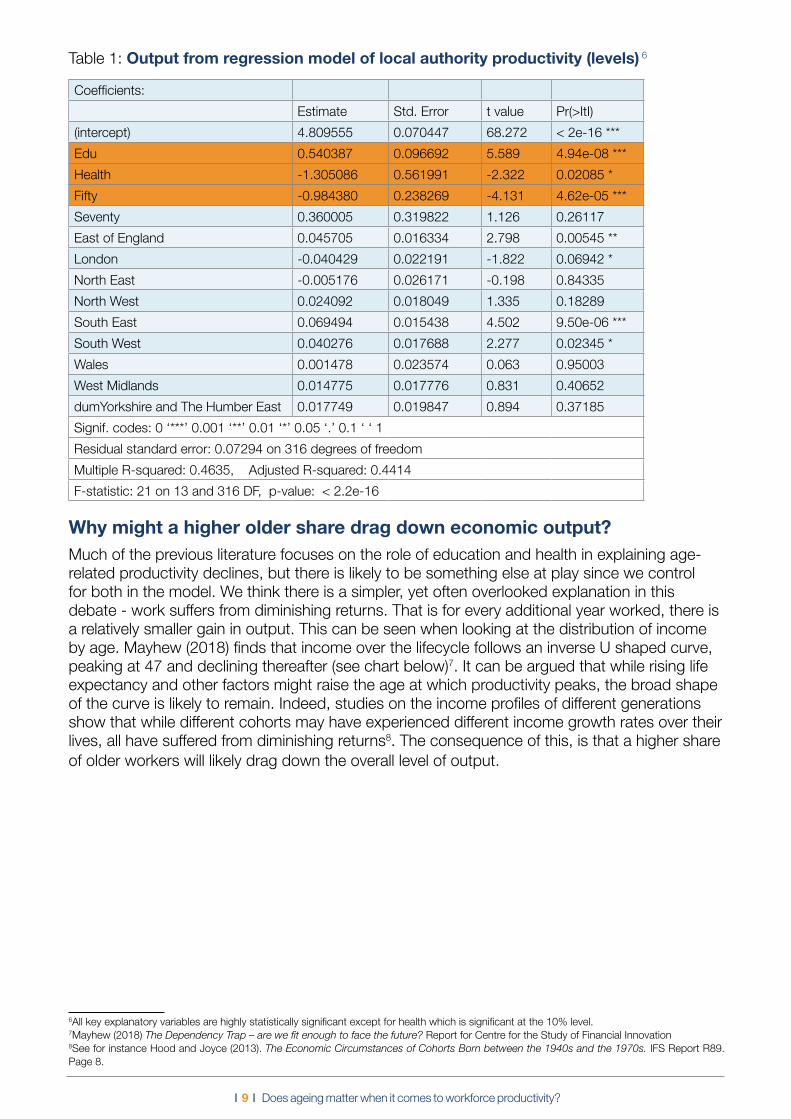
HEADLINE 3: THE 50+ AGE SHARE MATTERS AFTER CONTROLLING FOR OTHER FACTORSAge, education and health are likely to be related to one another. People are more likely to experience health problems as they age and perhaps less likely to undertake formal education and training, or at least in the absence of lifelong learning, they will be further away from the point in time when they undertook formal education.
In order to understand the isolated impacts of these factors we need to construct a regression model of productivity. In our model, the economic output per worker of a local authority is a function of the 50+ age share of the workforce, the 70+ age share of the population, the proportion with Level 4 qualifications or higher, the proportion in bad health and region specific effects5. The results suggest that better health and education support higher output as above, but this time the share of the workforce aged 50+ matters. Specifically, the higher the proportion over 50, the lower the level of output.
5For the regression model we use the log value of GVA per worker (with base 10) since the actual values of GVA are very large relative to the explanatory variables. Due to potential endogeneity we also estimate a two stage least squares model with instruments for our key explanatory variables being their values in 2001. The size and direction of the coefficients remain similar and all key explanatory variables are statistically significant at the 10% level (the share of workforce age 50+ is significant at the 5% level). Since OLS is more efficient we report the OLS results below.
I 9 I Does ageing matter when it comes to workforce productivity?
Table 1: Output from regression model of local authority productivity (levels) 6
Coefficients:
Estimate Std. Error t value Pr(>ItI)
(intercept) 4.809555 0.070447 68.272 < 2e-16 ***
Edu 0.540387 0.096692 5.589 4.94e-08 ***
Health -1.305086 0.561991 -2.322 0.02085 *
Fifty -0.984380 0.238269 -4.131 4.62e-05 ***
Seventy 0.360005 0.319822 1.126 0.26117
East of England 0.045705 0.016334 2.798 0.00545 **
London -0.040429 0.022191 -1.822 0.06942 *
North East -0.005176 0.026171 -0.198 0.84335
North West 0.024092 0.018049 1.335 0.18289
South East 0.069494 0.015438 4.502 9.50e-06 ***
South West 0.040276 0.017688 2.277 0.02345 *
Wales 0.001478 0.023574 0.063 0.95003
West Midlands 0.014775 0.017776 0.831 0.40652
dumYorkshire and The Humber East 0.017749 0.019847 0.894 0.37185
Signif. codes: 0 ‘***’ 0.001 ‘**’ 0.01 ‘*’ 0.05 ‘.’ 0.1 ‘ ‘ 1
Residual standard error: 0.07294 on 316 degrees of freedom
Multiple R-squared: 0.4635, Adjusted R-squared: 0.4414
F-statistic: 21 on 13 and 316 DF, p-value: < 2.2e-16
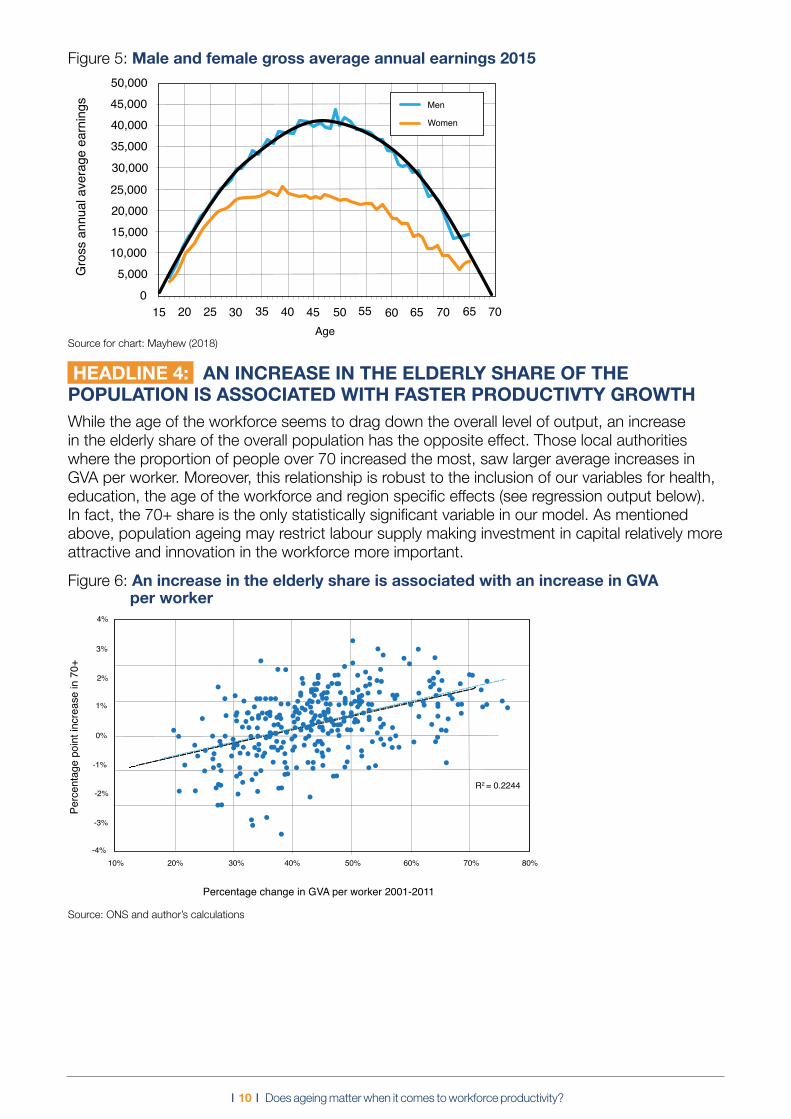
Why might a higher older share drag down economic output?Much of the previous literature focuses on the role of education and health in explaining age-related productivity declines, but there is likely to be something else at play since we control for both in the model. We think there is a simpler, yet often overlooked explanation in this debate - work suffers from diminishing returns. That is for every additional year worked, there is a relatively smaller gain in output. This can be seen when looking at the distribution of income by age. Mayhew (2018) finds that income over the lifecycle follows an inverse U shaped curve, peaking at 47 and declining thereafter (see chart below)7. It can be argued that while rising life expectancy and other factors might raise the age at which productivity peaks, the broad shape of the curve is likely to remain. Indeed, studies on the income profiles of different generations show that while different cohorts may have experienced different income growth rates over their lives, all have suffered from diminishing returns8. The consequence of this, is that a higher share of older workers will likely drag down the overall level of output.
6All key explanatory variables are highly statistically significant except for health which is significant at the 10% level. 7Mayhew (2018) The Dependency Trap – are we fit enough to face the future? Report for Centre for the Study of Financial Innovation8See for instance Hood and Joyce (2013). The Economic Circumstances of Cohorts Born between the 1940s and the 1970s. IFS Report R89. Page 8.
I 10 I Does ageing matter when it comes to workforce productivity?
Figure 5: Male and female gross average annual earnings 2015G
ross
ann
ual a
vera
ge e
arni
ngs
Age
50,00045,00040,00035,000
30,000
25,00020,00015,00010,000
5,000
015 25 30 40 50 60 70 7020 35 45 55 65 65
Men
Women
Source for chart: Mayhew (2018)
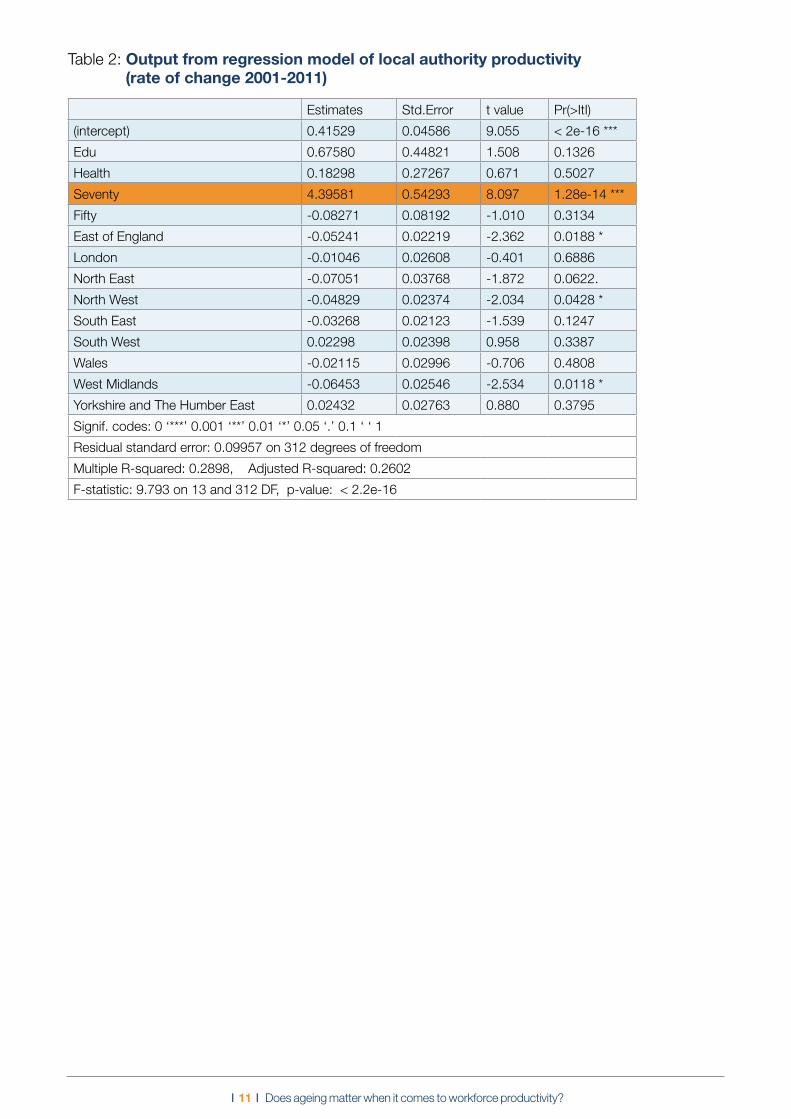
HEADLINE 4: AN INCREASE IN THE ELDERLY SHARE OF THE POPULATION IS ASSOCIATED WITH FASTER PRODUCTIVTY GROWTHWhile the age of the workforce seems to drag down the overall level of output, an increase in the elderly share of the overall population has the opposite effect. Those local authorities where the proportion of people over 70 increased the most, saw larger average increases in GVA per worker. Moreover, this relationship is robust to the inclusion of our variables for health, education, the age of the workforce and region specific effects (see regression output below). In fact, the 70+ share is the only statistically significant variable in our model. As mentioned above, population ageing may restrict labour supply making investment in capital relatively more attractive and innovation in the workforce more important.
Figure 6: An increase in the elderly share is associated with an increase in GVA per worker
10%-4%
-3%
-2%
-1%
1%
2%
3%
4%
0%
20% 30% 40% 50% 60% 70% 80%
R2 = 0.2244
Perc
enta
ge p
oint
incr
ease
in 7
0+
Percentage change in GVA per worker 2001-2011
An increase in the elderly share is associated with an increase in GVA per worker
Source: ONS and author’s calculations
I 11 I Does ageing matter when it comes to workforce productivity?
Table 2: Output from regression model of local authority productivity (rate of change 2001-2011)
Estimates Std.Error t value Pr(>ItI)
(intercept) 0.41529 0.04586 9.055 < 2e-16 ***
Edu 0.67580 0.44821 1.508 0.1326
Health 0.18298 0.27267 0.671 0.5027
Seventy 4.39581 0.54293 8.097 1.28e-14 ***
Fifty -0.08271 0.08192 -1.010 0.3134
East of England -0.05241 0.02219 -2.362 0.0188 *
London -0.01046 0.02608 -0.401 0.6886
North East -0.07051 0.03768 -1.872 0.0622.
North West -0.04829 0.02374 -2.034 0.0428 *
South East -0.03268 0.02123 -1.539 0.1247
South West 0.02298 0.02398 0.958 0.3387
Wales -0.02115 0.02996 -0.706 0.4808
West Midlands -0.06453 0.02546 -2.534 0.0118 *
Yorkshire and The Humber East 0.02432 0.02763 0.880 0.3795
Signif. codes: 0 ‘***’ 0.001 ‘**’ 0.01 ‘*’ 0.05 ‘.’ 0.1 ‘ ‘ 1
Residual standard error: 0.09957 on 312 degrees of freedom
Multiple R-squared: 0.2898, Adjusted R-squared: 0.2602
F-statistic: 9.793 on 13 and 312 DF, p-value: < 2.2e-16
I 12 I Does ageing matter when it comes to workforce productivity?
Conclusion
Our results show that ageing may affect workforce productivity through two channels.
First, the higher the proportion of the workforce aged 50+, the lower the level of output per worker. While previous research has highlighted the role of health and education, we control for these factors and still find a negative relationship. We posit a simple explanation – work suffers from diminishing returns. For every additional year worked there is a relatively smaller gain in output and data suggests that output may even fall at older ages. We can speculate that rising life expectancy could help to negate this impact by shifting the productivity curve to the right and thereby raising the peak productivity age. Lifelong learning and retraining could also result in changes to the gradient of the curve. For instance, it may help to slow the speed of decline in productivity growth as people supplement old and potentially obsolete skills with new ones. An important question is the extent to which retraining and life-long learning can sustain productivity growth over the lifecycle. Similar points could be made regarding investment in health and healthy ageing – which may also prolong the slowdown.
In any case, irrespective of workforce age, investment in education and health are likely to remain critical drivers of long run productivity. Both are correlated with output per worker across local authorities in our analysis.
Our second key finding relates to the rate of productivity growth between 2001 and 2011. We find the higher the increase in the proportion of people aged 70+, the greater the rate of productivity growth. This tentatively raises the hope that as labour supply tightens in the face of ageing, this will compel investment in capital and spur innovation in the economy.
In summary, with reference to English local authority data, this report provides support to both prevailing conclusions in the recent economic literature regarding the impacts of ageing on productivity. An older workforce may be a drag on output, but an ageing population could raise the rate of productivity growth. The extent to which we can limit the former channel and maximise the latter will help to determine our future economic prospects.

I 13 I Does ageing matter when it comes to workforce productivity?
About the International Longevity Centre – UK (ILC-UK)The International Longevity Centre – UK (ILC-UK) is an independent, research led, think-tank dedicated to addressing issues of longevity, ageing and demographic change. We develop ideas, undertake research and create a forum for action and debate.
The ILC-UK was established in 2000 to explore and address the new longevity revolution and its impact on the lifecourse and society. It provides the visionary approach needed for individual and societal planning to ensure a progressive, economically viable and socially inclusive tomorrow for all.
Based in Westminster, much of our work is directed at the highest levels of government and the civil service, in London, local government and Brussels. We have a reputation as a respected think-tank which works, often with key partner organisations, to inform important decision-making processes. We are aided in this work by our Chief Executive, Baroness Sally Greengross, former director-general of Age Concern and now a cross-bench peer.
Our policy and research remit is broad, and covers everything from pensions and financial planning, to health and social care, housing design, and age discrimination. We work primarily with central government, but also actively build relationships with local government, the private sector and relevant professional and academic associations.
The ILC-UK Partners Programme
ILC-UK is very grateful for the support of our current Partners, without whose help we could not play our unique role. Our current Partners are:
Through the ILC-UK Partners Programme, organisations are exposed to the latest available research and data in the UK, EU and the rest of the world. Partners are helped to understand and plan for changing societal trends and given opportunities to participate in cutting-edge debates to help them remain ahead of policy curves. Membership will help you nudge or shape policy development.
If you are interested in finding out more about our Partners Programme or becoming a Partner, please contact David Sinclair at [email protected]
Anchor Audley Aviva Centre for Ageing Better Edinburgh Napier University EY
FirstPort Housing&Care 21 Hymans Robertson Legal & General Newcastle University Institute for Ageing Prudential
AUDLEYGROUP

ILC–UK11 Tufton StreetLondonSW1P 3QBTel : +44 (0) 20 7340 0440www.ilcuk.org.uk
Published in May 2018 © ILC-UK 2018Registered Charity Number: 1080496.
Partners ProgrammeInternational Longevity Centre - UK