Embed Size (px)
Citation preview
DPIBE, Dec 2015 Recession and Alcohol Consumption
1
Does a Recession have an Impact on Alcohol
Consumption?
Johanna Dziadkiewicz, Alexia Pisani, Rebecca Wong
Abstract
The hypothesis of this paper is alcohol consumption will decrease when a country experiences
a recession. We have used data covering the yearly consumption (in litres per capita) of alcohol
from the World Health Organization (2015), combined with yearly & quarterly GDP data from
the OECD website (2015) to firstly identify years where there have been more than 2 periods
of negative growth (recession), and to compare these data sets to see if any relationship exists.
We have used correlation analysis between the financial data and the consumption data, as well
as scatter graphs to see if there is a high correlation (0.7) or a trend, for 3 countries that have
experienced a recession over the last 15 years (US, Finland & Greece). What we found is that
some types of alcohol did appear to show both positive and negative relationships to GDP or
recession but this relationship differed between countries. There are other factors that must be
considered including cultural relationship to alcohol in different locations, as well as any
government or social programs.
DPIBE, Dec 2015 Recession and Alcohol Consumption
2
1. Introduction and hypothesis
In 2014, the World Health Organisation (WHO) stated in their Global Alcohol Report that the
most important factor affecting alcohol consumption is economic uncertainty (WHO 2014).
Previous theoretical evidence suggests that there is a relationship between alcohol consumption
and GDP, as well as a recession. One possible explanation for the dramatic change in
consumption during a recession relates to whether the good is classified as inferior or normal.
Increase in demand when GDP is increasing would lead to classification of alcohol as a normal
good, or inferior if demand falls.
The hypothesis of this paper is: alcohol consumption will decrease when a country experiences
a recession. The alternate hypothesis is: alcohol consumption will increase when a country
experiences a recession.
To test our hypothesis we conducted a series of correlation analyses to look at the relationship
of GDP and consumption of alcohol in periods with and without recession. The alternate
hypothesis will be accepted if there is a strong positive correlation between a country's GDP in
recession and alcohol consumption (above 0.7).
2. Theory and literature review
The theories of income effect and normal or inferior goods can give an explanation as to why
consumption would change during periods of recession.
Income effect theory states that the quantity of a good a consumer demands changes with a
change in income. For normal goods, less of the good is consumed when an income decreases.
This theory would support the hypothesis that alcohol consumption will decrease when a
country experiences recession. This is because during a recession household incomes will
decrease as a result of the whole economy experiencing negative growth.
DPIBE, Dec 2015 Recession and Alcohol Consumption
3
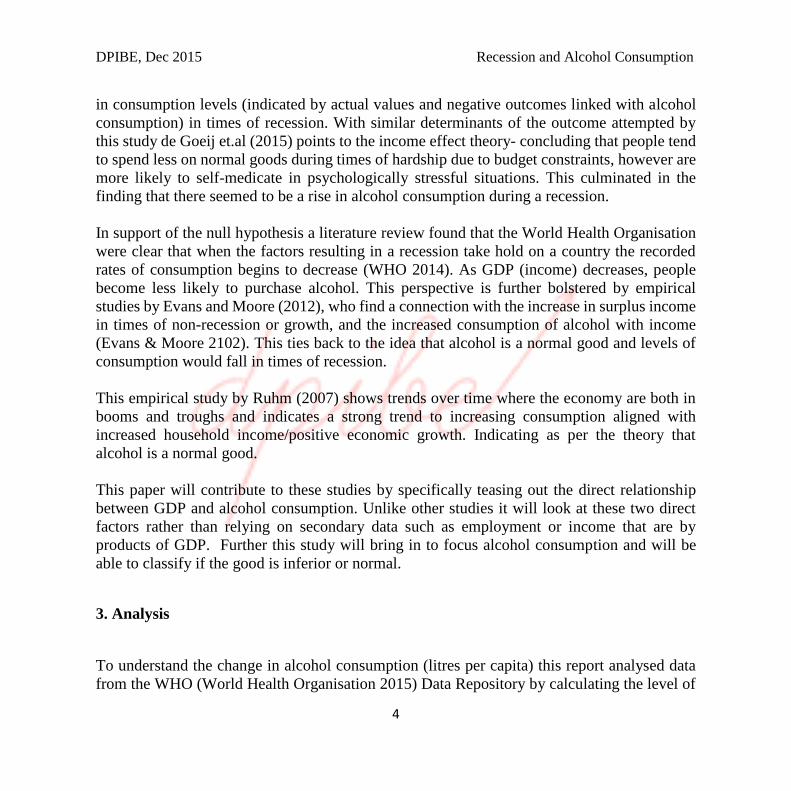
Alternatively, if alcohol is considered an inferior good- increases in income would mean a
reduction in consumption of that good, and conversely as income falls demand for the good
increases.
Both outcomes of the stated hypotheses in terms
of the theory can be explained by the graph to
the left. Assuming that alcohol is a normal good,
we will see that as income decreases (recession),
the quantity demanded would decrease to Q1.
As for the alternate hypothesis that argues
alcohol consumption increases when there is a
recession, we are assuming alcohol is an inferior
good and as such when income decreases
quantity demanded increases to Q2.
There is a multitude of literature on the topic
arguing both sides of the hypotheses.
Proponents of the alternate hypothesis include
Cotti, Dunn & Tefft 2014 who concluded that
macroeconomic indicators during a recession
(unemployment rates and income per capita)
were seen to impact on the demand for alcohol (Cotti, Dunn & Tefft 2014). They found that
demand for packaged alcohol and all major alcohol subtypes was positively correlated to
unemployment levels, labelling it pro-cyclical.
The study by Mulia et. al (2014) analysed the 2009-2010 US National Alcohol Survey, in which
they looked at the relationship of a recession-induced economic losses within households and
alcohol usage. They found that severe economic loss- a person's job or housing- was positively
correlated to positively correlate to alcohol consumption. Ruhm (2005) and Dee (2001) indicate
that during periods of economic growth alcohol consumption has been statically proven to
increase. This supports the alternate hypothesis from the perspective that a recession should
have the alternate effect of decreasing during a recession. Studies argue that there is an increase
Figure 1: Income effect on normal/inferior goods
DPIBE, Dec 2015 Recession and Alcohol Consumption
4
in consumption levels (indicated by actual values and negative outcomes linked with alcohol
consumption) in times of recession. With similar determinants of the outcome attempted by
this study de Goeij et.al (2015) points to the income effect theory- concluding that people tend
to spend less on normal goods during times of hardship due to budget constraints, however are
more likely to self-medicate in psychologically stressful situations. This culminated in the
finding that there seemed to be a rise in alcohol consumption during a recession.
In support of the null hypothesis a literature review found that the World Health Organisation
were clear that when the factors resulting in a recession take hold on a country the recorded
rates of consumption begins to decrease (WHO 2014). As GDP (income) decreases, people
become less likely to purchase alcohol. This perspective is further bolstered by empirical
studies by Evans and Moore (2012), who find a connection with the increase in surplus income
in times of non-recession or growth, and the increased consumption of alcohol with income
(Evans & Moore 2102). This ties back to the idea that alcohol is a normal good and levels of
consumption would fall in times of recession.
This empirical study by Ruhm (2007) shows trends over time where the economy are both in
booms and troughs and indicates a strong trend to increasing consumption aligned with
increased household income/positive economic growth. Indicating as per the theory that
alcohol is a normal good.
This paper will contribute to these studies by specifically teasing out the direct relationship
between GDP and alcohol consumption. Unlike other studies it will look at these two direct
factors rather than relying on secondary data such as employment or income that are by
products of GDP. Further this study will bring in to focus alcohol consumption and will be
able to classify if the good is inferior or normal.
3. Analysis
To understand the change in alcohol consumption (litres per capita) this report analysed data
from the WHO (World Health Organisation 2015) Data Repository by calculating the level of
DPIBE, Dec 2015 Recession and Alcohol Consumption
5
correlation with GDP (World Data Bank 2015), and whether the economy experienced a
recession during that year. For the purposes of this study we have classified a recession as two
periods of negative growth in GDP.
Scatter diagrams were also created to visualise this relationship and demonstrate the trend of
each type of alcohol. Raw data can be found in the Appendix, for the purpose of this report
periods of recession were coded with a 1 and periods without recession were coded with a zero.
Key significant positive and negative changes are highlighted in green and red.
3.1: United States of America
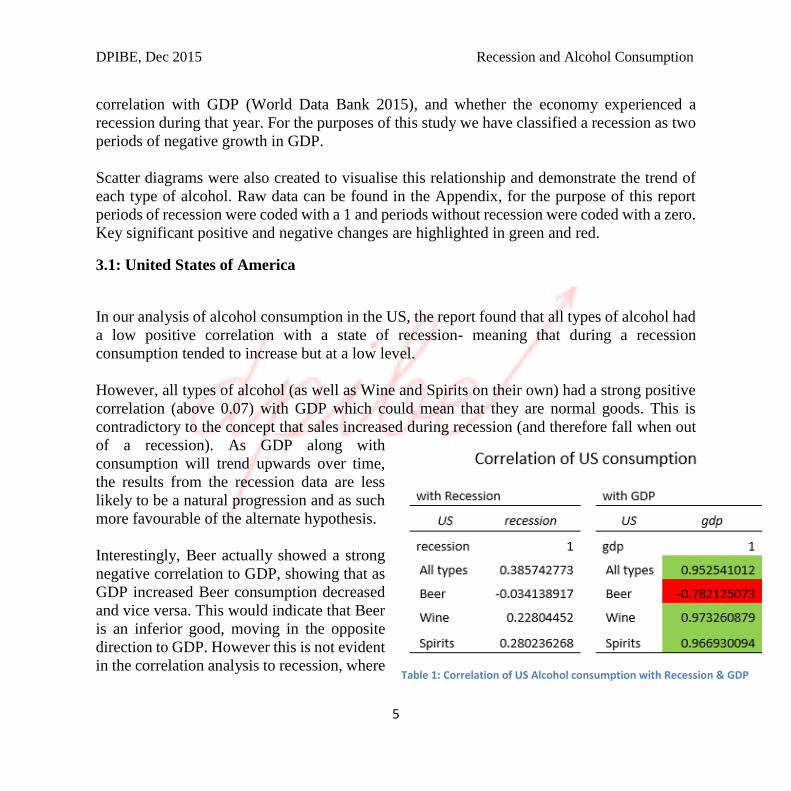
In our analysis of alcohol consumption in the US, the report found that all types of alcohol had
a low positive correlation with a state of recession- meaning that during a recession
consumption tended to increase but at a low level.
However, all types of alcohol (as well as Wine and Spirits on their own) had a strong positive
correlation (above 0.07) with GDP which could mean that they are normal goods. This is
contradictory to the concept that sales increased during recession (and therefore fall when out
of a recession). As GDP along with
consumption will trend upwards over time,
the results from the recession data are less
likely to be a natural progression and as such
more favourable of the alternate hypothesis.
Interestingly, Beer actually showed a strong
negative correlation to GDP, showing that as
GDP increased Beer consumption decreased
and vice versa. This would indicate that Beer
is an inferior good, moving in the opposite
direction to GDP. However this is not evident
in the correlation analysis to recession, where Table 1: Correlation of US Alcohol consumption with Recession & GDP
DPIBE, Dec 2015 Recession and Alcohol Consumption
6
beer consumption has a weak negative relationship, indicating that the cause of change could
be attributed to other factors.
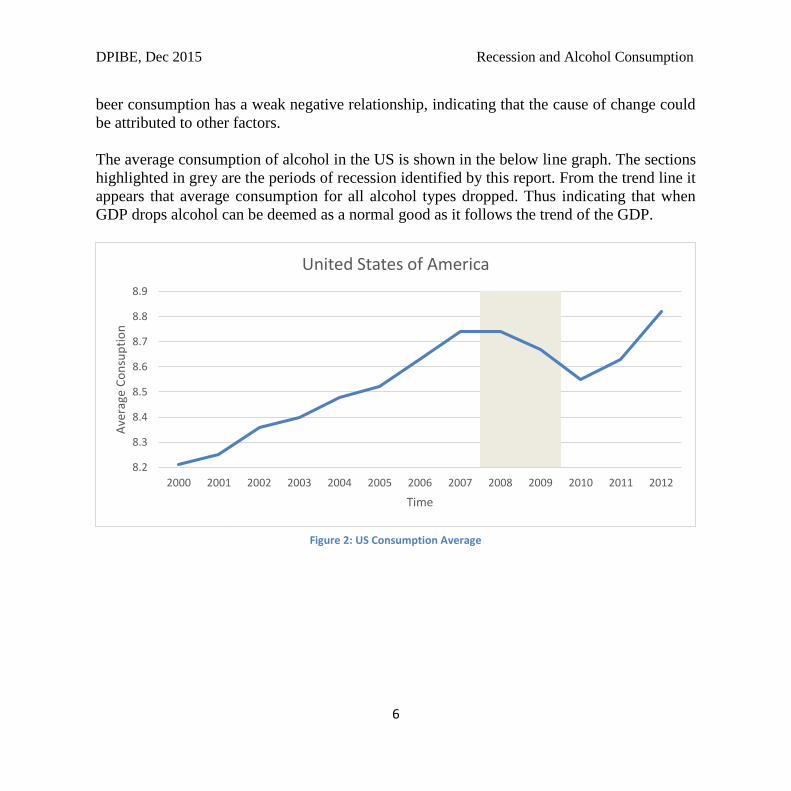
The average consumption of alcohol in the US is shown in the below line graph. The sections
highlighted in grey are the periods of recession identified by this report. From the trend line it
appears that average consumption for all alcohol types dropped. Thus indicating that when
GDP drops alcohol can be deemed as a normal good as it follows the trend of the GDP.
8.2
8.3
8.4
8.5
8.6
8.7
8.8
8.9
2000 2001 2002 2003 2004 2005 2006 2007 2008 2009 2010 2011 2012
Ave
rage
Co
nsu
pti
on
Time
United States of America
Figure 2: US Consumption Average
DPIBE, Dec 2015 Recession and Alcohol Consumption
7
3.2: Finland
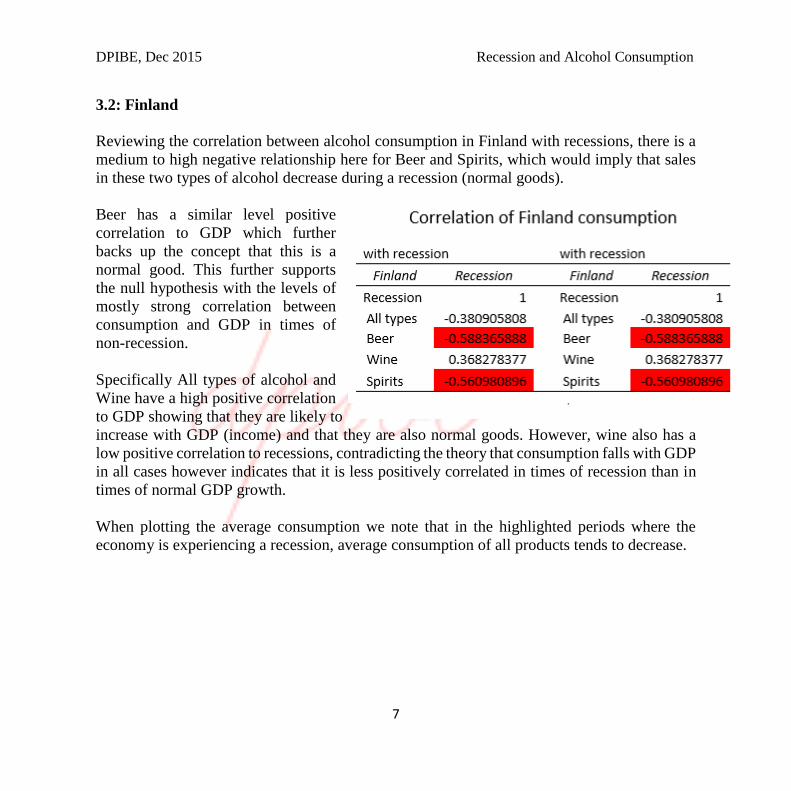
Reviewing the correlation between alcohol consumption in Finland with recessions, there is a
medium to high negative relationship here for Beer and Spirits, which would imply that sales
in these two types of alcohol decrease during a recession (normal goods).
Beer has a similar level positive
correlation to GDP which further
backs up the concept that this is a
normal good. This further supports
the null hypothesis with the levels of
mostly strong correlation between
consumption and GDP in times of
non-recession.
Specifically All types of alcohol and
Wine have a high positive correlation
to GDP showing that they are likely to
increase with GDP (income) and that they are also normal goods. However, wine also has a
low positive correlation to recessions, contradicting the theory that consumption falls with GDP
in all cases however indicates that it is less positively correlated in times of recession than in
times of normal GDP growth.
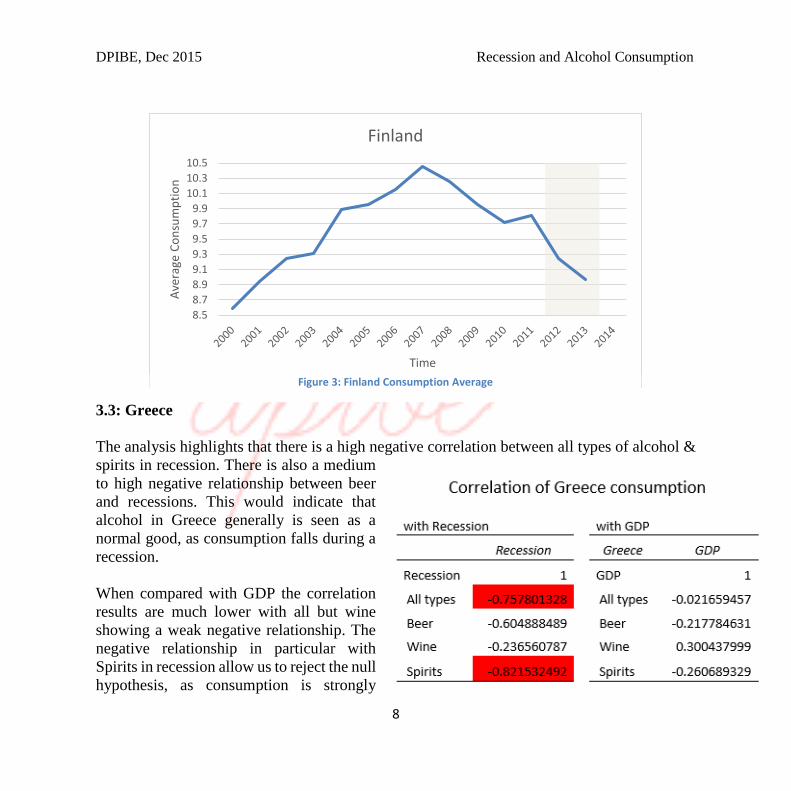
When plotting the average consumption we note that in the highlighted periods where the
economy is experiencing a recession, average consumption of all products tends to decrease.
Table 2: Correlation of Finland Alcohol consumption with Recession & GDP
DPIBE, Dec 2015 Recession and Alcohol Consumption
8
3.3: Greece
The analysis highlights that there is a high negative correlation between all types of alcohol &
spirits in recession. There is also a medium
to high negative relationship between beer
and recessions. This would indicate that
alcohol in Greece generally is seen as a
normal good, as consumption falls during a
recession.
When compared with GDP the correlation
results are much lower with all but wine
showing a weak negative relationship. The
negative relationship in particular with
Spirits in recession allow us to reject the null
hypothesis, as consumption is strongly
Table 3: Correlation of Greece Alcohol consumption with Recession & GDP
8.5
8.7
8.9
9.1
9.3
9.5
9.7
9.9
10.1
10.3
10.5A
vera
ge C
on
sum
pti
on
Time
Finland
Figure 3: Finland Consumption Average
DPIBE, Dec 2015 Recession and Alcohol Consumption
9
(above 0.7) negatively correlated to recession– indicating that consumption of spirits decreases
during recession.
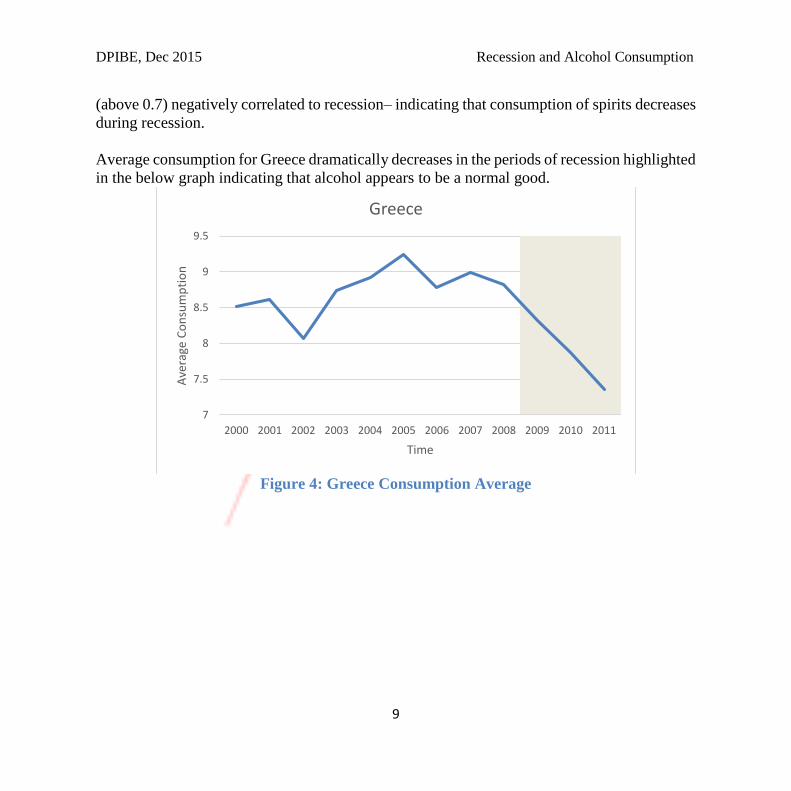
Average consumption for Greece dramatically decreases in the periods of recession highlighted
in the below graph indicating that alcohol appears to be a normal good.
Figure 4: Greece Consumption Average
7
7.5
8
8.5
9
9.5
2000 2001 2002 2003 2004 2005 2006 2007 2008 2009 2010 2011
Ave
rage
Co
nsu
mp
tio
n
Time
Greece
DPIBE, Dec 2015 Recession and Alcohol Consumption
10
4. Conclusions and Limitations
The data utilised in the analysis is restricted to three countries. The US and Finland both
showed some relationship between economic performance and consumption of alcohol, but
when comparing recessions to GDP the results were contradictory and may require further
analysis to understand other factors that may be impacting our data. Of all three nations the US
appears to be the most likely to increase per capita per consumption in recession followed by
Greece. This variance between results could be accredited to differences in culture, and aspects
of society which affect attitudes towards consumption of alcohol.
The WHO data on alcohol consumption is quite limited, and is only available from the year
2000. This meant that the number of records was limited to only 12-14 per country, and it is
likely that there is not sufficient data to make an accurate conclusion.
In the report countries which have experienced a recession after the year 2000 were selected to
ensure we can view the change in behaviour during or after a recession. The countries chosen
are the United States of America (US), Finland & Greece.
Other factors that might impact on our results include any social or government programs
within these countries to reduce consumption of alcohol, or the possibility of substitutes that
could create false or misleading data. Further the GDP per capita income varies substantially
from nation to nation and hence may have a substantial impact on our findings.
Lastly we must consider the taxes on alcohol- in Greece the tax rate is relatively lower than in
Finland, which may have a substantial impact and cause an increase in unrecorded rates of
alcohol consumption in Finland as compared to Greece.
Overall the analysis in the previous section indicates that there are grounds to reject the
alternate hypothesis, however this cannot be done with certainty. All three countries examined
indicated that there was not a strong enough relationship (0.7) to deem the alternate hypothesis
as accurate given that some of the data in recession indicate falling consumption.
DPIBE, Dec 2015 Recession and Alcohol Consumption
11
References
Bor, J, Basu, S, Coutts, A, McKee, M & Stuckler, D 2013, ‘Alcohol use during the great recession of
2008–2009.’ Alcohol and alcoholism, vol. 48, no. 3, 343-348.
Cotti, CD, Dunn, RA & Tefft, N 2014, ‘The Great Recession and Consumer Demand for Alcohol: A
Dynamic Panel-Data Analysis of US Households.’ September 25, 2014, Available at SSRN
2184415.
Dee, TS 2001, 'Alcohol Abuse and Economic Conditions: Evidence from Repeated Cross-Sections of
Individual-Level Data', Health Economics, vol. 10, no. 3, pp. 257-270.
De Goeij, MC, Suhrcke, M, Toffolutti, V, Van de Mheen, D, Schoenmakers, TM & Kunst, AE 2015,
‘How economic crises affect alcohol consumption and alcohol-related health problems: A
realist systematic review.’ Social Science & Medicine, vol. 131, 131-146.
European Central Bank 2015, European Central Bank website, accessed 7/8/2015,
https://www.ecb.europa.eu/home/html/index.en.html
Evans, WN, & Moore, TJ 2012, 'liquidity, economic activity, and mortality', Review of Economics &
Statistics, vol. 94, no. 2, pp. 400-418.
Federal Reserve 2015, Board of Governors of the Federal Reserve website, accessed 7/8/2015,
http://www.federalreserve.gov/
Harhay, MO, Bor, J, Basu, S, McKee, M, Mindell, JS, Shelton, NJ & Stuckler, D 2014, ‘Differential
impact of the economic recession on alcohol use among white British adults, 2004–2010.’ The
European Journal of Public Health, vol. 24, no. 3, 410-415.
Haukeland, JV 1984, ‘Sociocultural impacts of tourism in Scandinavia: Studies of three host
communities’, Tourism Management, vol. 5, no. 3, September 1984, Pages 207–214
International Monetary Fund 2015, International Monetary Fund website, accessed 8/8/2015,
http://www.imf.org/external/index.htm
DPIBE, Dec 2015 Recession and Alcohol Consumption
12
Kahn, M 2015, ‘Finland embarks on ‘painful’ austerity blitz’, The Telegraph,
http://www.telegraph.co.uk/finance/economics/11633816/Finland-embarks-on-painful-
austerity-blitz.html
Luoto, R, Poikolainen, K, & Uutela, A 1998, 'Unemployment, sociodemographic background and
consumption of alcohol before and during the economic recession of the 1990s in Finland',
International Journal Of Epidemiology, vol. 27, no. 4, pp. 623-629.
Mulia, N, Zemore, SE, Murphy, R, Liu, H & Catalano, R 2014, ‘Economic loss and alcohol
consumption and problems during the 2008 to 2009 US recession.’ Alcoholism: Clinical and
Experimental Research, vol. 38, no.4, 1026-1034.
OECD 2015, Gross Domestic Product (GDP), OECD, accessed 8/8/2015,
https://data.oecd.org/gdp/gross-domestic-product-gdp.htm
Ólafsdóttir, H 2015, ‘Considerations on the Crash in Iceland and its effects on alcohol and drug
issues.’ Nordic Studies on Alcohol and Drugs, vol32, no. 3, 325-328.
Pacula, RL 2011, ‘Substance use and recessions: What can be learned from economic analyses of
alcohol?’ International Journal of Drug Policy, vol. 22, no. 5, 326-334.
Ruhm, CJ 2005, 'Commentary: mortality increases during economic upturns', International Journal
Of Epidemiology, vol. 34, no. 6, pp. 1206-1211.
The World Bank 2015, World DataBank website, accessed 8/8/2015,
http://databank.worldbank.org/data/home.aspx
Ruhm, CJ 2007, 'A healthy economy can break your heart', Demography, vol. 44, no. 4, pp. 829-848.
World Bank Data 2015, World DataBank website, retrieved on 8 August 2015,
http://databank.worldbank.org/data/home.aspx
World Health Organization 2014, Global status report on alcohol and health 2014, World Health
Organization, retrieved 10 August 2015,
http://www.who.int/substance_abuse/publications/global_alcohol_report/en/
DPIBE, Dec 2015 Recession and Alcohol Consumption
13
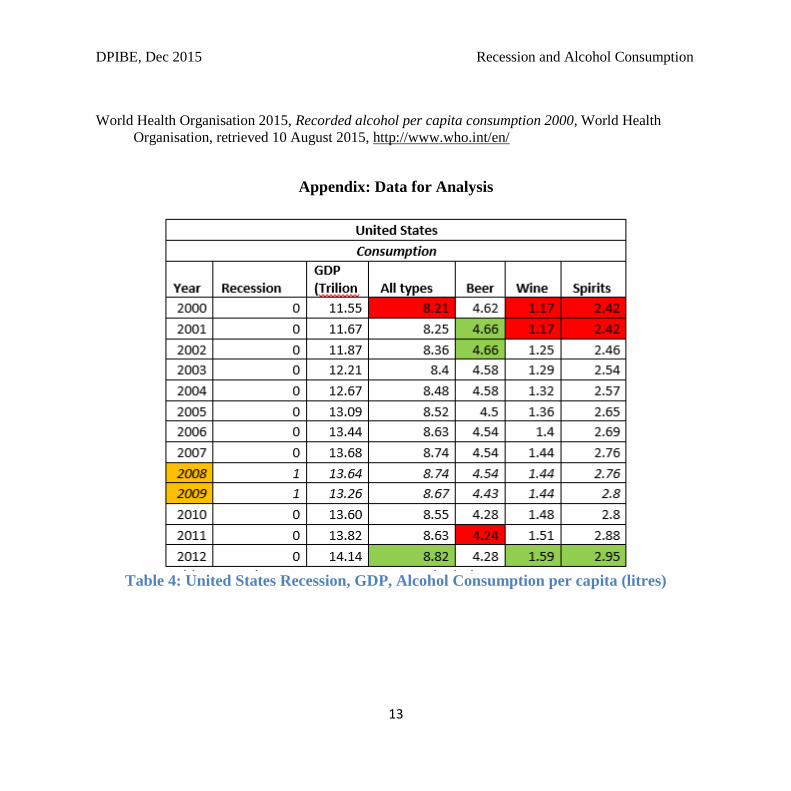
World Health Organisation 2015, Recorded alcohol per capita consumption 2000, World Health
Organisation, retrieved 10 August 2015, http://www.who.int/en/
Appendix: Data for Analysis
Table 4: United States Recession, GDP, Alcohol Consumption per capita (litres)
DPIBE, Dec 2015 Recession and Alcohol Consumption
14
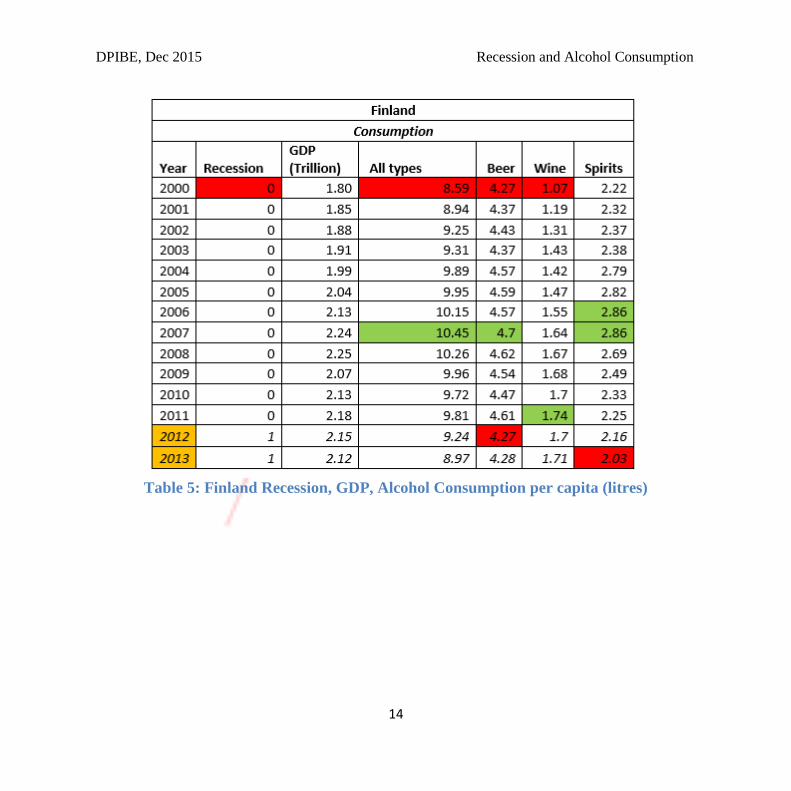
Table 5: Finland Recession, GDP, Alcohol Consumption per capita (litres)
DPIBE, Dec 2015 Recession and Alcohol Consumption
15
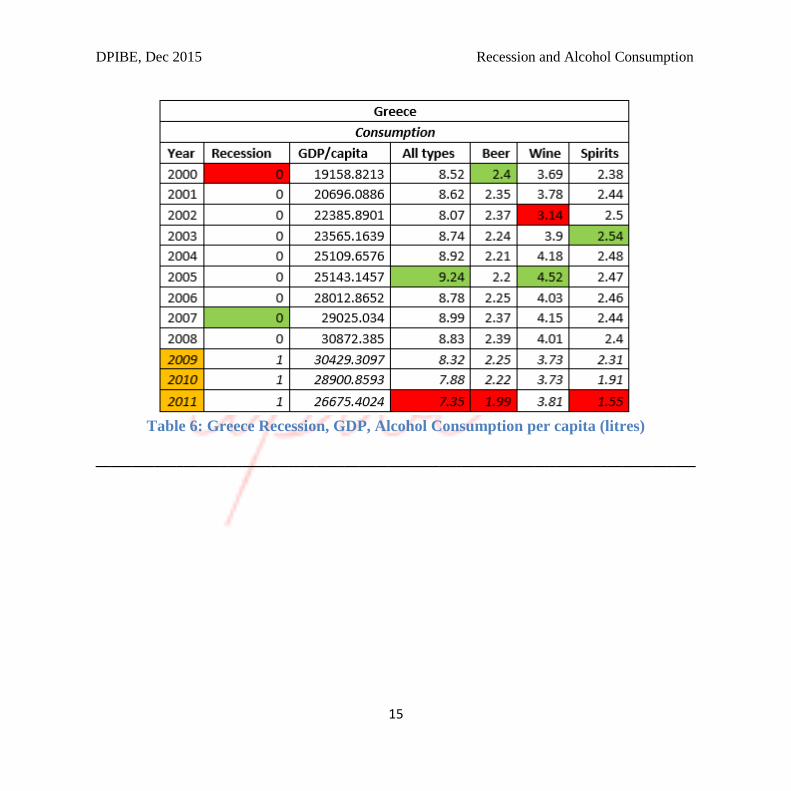
Table 6: Greece Recession, GDP, Alcohol Consumption per capita (litres)
__________________________________________________________________________________