Embed Size (px)
Citation preview

Steve Bossart, Senior Energy Analyst
Wyoming Infrastructure Authority Fall Energy Conference
October 7, 2014
Jackson, Wyoming
DOE OE Electric Transmission
System Reliability Program

• Background
• DOE OE Transmission Program
– OE ARRA Transmission Projects
– OE Core Transmission Projects
TopicsDOE OE Transmission System Reliability Program

Background

How can Wyoming best apply smart grid technologies in new and existing transmission planning to integrate
and increase value of local (end-user) utility smart grid investments?

Electric Power System Transition to a Modern Grid
DistributionTransmission Consumer
Generation/Storage
Large-Scale Generation/
Storage
Microgrid/CHP
Consumer
Generation/Storage
Generation/Storage

Smart Grid in Transmission• Synchrophasors (a.k.a., Phasor Measurement Units)
– Voltage, phase angle, current, frequency, time, location
– Current Use: Wide area awareness, post-event analysis, planning model validation
– Future Use: Real-time control, state estimation, self-healing
• Phasor Data Concentrators
• Dynamic Line Rating
– Ambient conditions (e.g., temperature & wind)
– Line conditions (e.g., temperature, tension)
• Equipment health monitors (e.g., transformers)
• Weather forecasting important for renewable energy farms
• Higher DC and AC transmission voltages
– Reduce line losses
• Low loss cables
• Cyber security
• Physical security and robustness

Future modern gridGreater interaction between T & D
– Distributed assets alleviate transmission congestion
– Transmission and main grid distribution assets alleviate microgrid congestion
– Better communication between T&D operations
– Changing wholesale and retail markets
– Optimization of entire power system
– Coordinate GT&D to gain efficiency
– More highly networked T&D systems
– Move power between circuits

Transmission Planning Impacted By Increase in DER
• Renewable energy, energy storage, distributed generation
Increase in consumer participation• Demand response, photovoltaic,
electric vehicles, community storage,microgrids
Increase in renewable energy farms
Stronger import and export capabilities between regions
Trend to defer large G&T investments and increase utilization of existing assets

OE ARRA Transmission Projects

10
Synchrophasors• Vectors represent the magnitude & phase angle
of voltage and current
• Magnitude is the amplitude of ac voltage or
current waveform
• Angle is shift in voltage or current waveform
from reference waveform
• Sample voltage and current 30-60 times per
second and send to phasor data concentrator
• Each PMU is time-synchronized using GPS to
allow widely separated locations to record data
at same instant of time
• Addresses current industry problems
– Wide area situational awareness
– Systems dynamic monitoring
– Improved modeling and model validation
– Blackout prevention and mitigation
– Congestion and bottlenecks
– Common data and common displays
– Monitor reliability standards

11
* Total cost in millions

12
SGIG Transmission Technologies Deployed
Data through June 30, 2014
Installed synchrophasors – 1,111
Installed PMU data concentrators– 164

13
Synchrophasor Technology for Transmission
System Operations
Improved reliability, capacity and operational efficiency – Energy flows on the California-Oregon Intertie can be increased by 100 MW or more reducing energy costs by an estimated $35 - $75 million over 40 years without new capital investments
April 20072009: About 200 PMUs
2014: About 1700 PMUs

14
Dynamic Line Rating Technology• Adjust transmission capacity ratings in real-time
– Sensors and communications devices
• Wind speed, ambient temperature, solar radiation
• Line temperature, sag, tension, clearance
– Conductor characteristics
– Software
• Comparison is static line ratings which are usually
conservative based on windless, sunny, hot days
• Benefits: congestion relief, improved efficiency, defer
capital costs, improved asset utilization, improved
situational awareness
• Two DLR projects in SGDP program
– New York Power Authority/EPRI – R&D
– Oncor – Demonstration and deployment

15
Oncor Dynamic Line Rating Project
Key Project
ElementsOncor’s DLR Project
Project partners Nexans
Promethean Devices
EDM International, Inc.
Southwest Research Institute (SwRI)
Siemens Energy Inc.
Chapman Construction Company
Electric Reliability Council of Texas (ERCOT)
Total installed cost $4,833,000
Total project budget $7,279,166
Project duration 1/1/10 – 5/4/13
Project location Five 345 kV and three 138 kV transmission line circuits in Texas
DLR equipment 27 Nexans CAT-1 units, including 45 load cells
5 Video Sagometer systems
2 Real-Time Transmission Line Monitoring Systems (RT-TLMS)
DLR software Nexans’ proprietary IntelliCAT software
Average increased
real-time capacity
8%-12% above ambient-adjusted rating (138 kV lines)
6%-14% above ambient-adjusted rating (345 kV lines)

16
Line Type Alternative DescriptionNew Rating
(% Static)
Cost per
Mile
138 kV Lattice,
Wood H-Frame
Reconductor Aluminum Conductor
Composite Core (ACCC) cable 193% $321,851
DLR 110% $56,200
138 kV Wood
H-Frame
Rerate 125 °C
Modify structures 130% $10,561
Rerate 125 °C
Replace structures
Rebuild
130%
209%
$6,919
$750,000
DLR 110% $29,471
138 kV Wood
H-frame
Rebuild 140% $237,871
DLR 110% $16,767
138 kV Wood
H-Frame
Reconductor 212% $750,000
DLR 110% $28,323
Although Oncor could not quantify the congestion-related economic
benefits of deploying DLR technologies, it was able to estimate the
savings associated with the deferral of other transmission upgrades.

17
Interconnection Transmission Planning and Analysis Program
• Strengthens capabilities in three interconnections serving the lower 48 states
• Prepares analyses of transmission requirements under alternative futures
• Develops long-term interconnection-wide transmission expansion plans
Benefits:
• Improve regional, interregional, and interconnection-wide coordination
• Improve quality of information to industry planners and policymakers
• Create of long-term transmission requirements under a wide range of futures
• Facilitate development of new transmission facilities that will foster
development of renewable or other low-carbon generation capacity
• Six awards, two per each interconnection for $60M
• Two awards to state policymaker groups for $20M

18
OE Core Transmission Projects
19
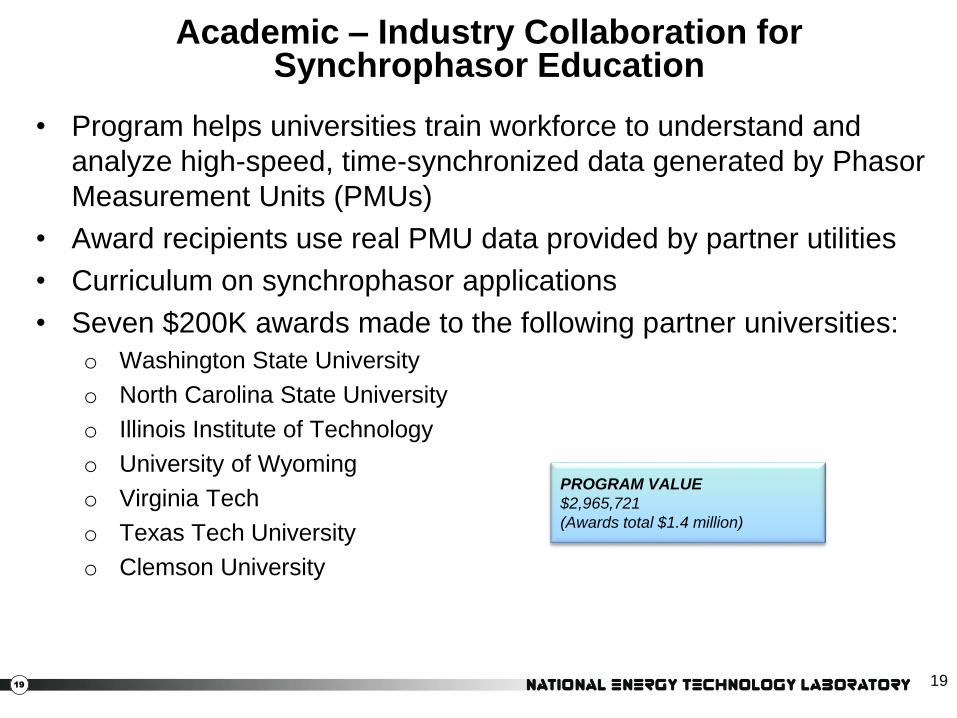
Academic – Industry Collaboration for Synchrophasor Education
• Program helps universities train workforce to understand and
analyze high-speed, time-synchronized data generated by Phasor
Measurement Units (PMUs)
• Award recipients use real PMU data provided by partner utilities
• Curriculum on synchrophasor applications
• Seven $200K awards made to the following partner universities:
o Washington State University
o North Carolina State University
o Illinois Institute of Technology
o University of Wyoming
o Virginia Tech
o Texas Tech University
o Clemson University
19
PROGRAM VALUE
$2,965,721
(Awards total $1.4 million)

20
Pre-Commercial Synchrophasor R&D
• Advance development of production-grade software
that uses synchrophasor data to improve reliability
and economic efficiency of the bulk power system
• Aimed toward planning, operations, and ultimately
real-time control
– Real-time and offline applications
– Monitoring and visualization of control room operations
– Wide-area control and protection
– Power system restoration
– Power system model validation
– Wholesale market efficiency

21
Awards
Approximate Funding: $23.2M
• 6 awards; $10.6 M DOE; $12.6 awardee
• Pacific Gas & Electric
– Improve data quality validation and security, strengthen
system wide indicators, speed system restoration, improve
post event analysis
• Quanta Technology
– Combine PMU data with other sensors to provide fast,
reliable and detailed visibility in NY Power Authority area
• Electric Power Group
– Expand grid operator training by developing simulator
software to teach operators how to use PMU data
– Demonstrated by ERCOT and SCE

22
Awards (continued)
• Burns & McDonnell Engineering Company
– Develop software to monitor and analyze grid conditions
in real-time
– Test software at Southern Company
• Hawaiian Electric Company
– Incorporate PMU data into its T&D modeling and system-
wide data analysis
– Evaluate new visualization techniques
• Peak Reliability
– Develop automated controls and improve grid condition
data delivery and quality
– Serves as reliability coordinator in 14 western states,
British Columbia, and northern Baja California, Mexico

23

24

25
NASPI Accomplishments and Issues
https://www.naspi.org/