Embed Size (px)
Citation preview
DOE-EM/GJTAC2007
Prepared by the Technical Assistance Contractor under DOE contract number DE-AC30-07CC60012 for the U.S. Department of Energy Office of Environmental Management, Grand Junction, Colorado.
Moab UMTRA Project 2011 Flood Response Summary December 2011

DOE-EM/GJTAC2007
Moab UMTRA Project 2011 Flood Response Summary
Revision 0
December 2011
Prepared by the Technical Assistance Contractor under contract number DE-AC30-07CC60012 for the U.S. Department of Energy Office of Environmental Management, Grand Junction, Colorado.
DOE-EM/GJTAC2007
Kenneth 0. PillTAC Ground Water Manager
Moab UMTRA Project2011 Flood Response Summary
U.S. Oepmlnient of EnergyRevision 0 December 201 I
Pagel
Moth UMTRA Projc~t 201 I EloodResponse SummaiyDOE-EM1GJTAC2007
RevIsion 0
Review and Approval
Date
RoField
~.:cheySenior Program Manager
jYet2f÷ ‘1Date
In concmTence:
Donald R. MetzLerMoab Federal Project Director
Date

U.S. Department of Energy Moab UMTRA Project 2011 Flood Response Summary Revision 0 December 2011 DOE-EM/GJTAC2007
Page ii
Revision History Revision No. Date Reason/Basis for Revision
0 December 2011 Initial issue.
U.S. Department of Energy Moab UMTRA Project 2011 Flood Response Summary Revision 0 November 2011 DOE-EM/GJTAC2007
Page iii
Table of Contents Section Page Acronyms and Abbreviations ..........................................................................................................v 1.0 Introduction ........................................................................................................................1
1.1 Purpose and Scope ...................................................................................................1 1.2 Site Features .............................................................................................................1 1.3 River Gage ...............................................................................................................3 1.4 Flood History and 2011 Summary ...........................................................................4
2.0 Pre-Flood Actions from April 1 to May 29 ......................................................................7 2.1 Observations ............................................................................................................7 2.2 Action Items Completed ..........................................................................................8
3.0 Flood Actions May 30 to July 25 ......................................................................................9 3.1 Observations ............................................................................................................9 3.2 Action Items Completed ........................................................................................12
4.0 Post-Flood Actions July 26 to December 1 ....................................................................14 4.1 Snowpack/Hydrograph ..........................................................................................14 4.2 Action Items Completed ........................................................................................15
5.0 Lessons Learned ...............................................................................................................16 6.0 References .........................................................................................................................16
Figures
Figure 1. Moab Site Features ........................................................................................................2 Figure 2. Cisco Gage Colorado River Flow Versus On-Site Elevation ........................................3 Figure 3. Average Snow Water Equivalent Compared to 1983, 1984, 2008, and 2011 ...............4 Figure 4. Hydrograph Showing Runoff in 1983, 1984, 2008, and 2011 .......................................5 Figure 5. Moab Site Features, Colorado River Elevations and Flood Extent, and
Contamination Area Berms Elevations ..........................................................................6 Figure 6. Colorado River Cisco Hydrograph from April 1 to May 29 ..........................................8 Figure 7. Cisco Gaging Station Hydrograph for May 30 to July 25 .............................................9 Figure 8. Colorado River Cisco Hydrograph from July 26 to September 1 ................................14
Photos Photo 1. Extent of Moab Site Flooded Areas (blue) at 33,800 cfs on June 3 ............................10 Photo 2. Extent of Flooded Water at 33,000 cfs on June 6 ........................................................11 Photo 3. Aerial View of Moab site at 48,600 cfs on June 9 .......................................................11 Photo 4. Colorado River Surface Water Locations ....................................................................13
Tables
Table 1. Notable Events During 2011 Runoff and Flood ............................................................5 Table 2. Pre-Flood Actions ..........................................................................................................8 Table 3. Flood Actions ...............................................................................................................12 Table 4. Surface Water Sample Results .....................................................................................13 Table 5. Post-Flood Actions.......................................................................................................15

U.S. Department of Energy Moab UMTRA Project 2011 Flood Response Summary Revision 0 November 2011 DOE-EM/GJTAC2007
Page iv
Appendices Appendix A. Pre-Flood Photos .............................................................................................. A-1 Appendix B. Flood Photos .....................................................................................................B-1 Appendix C. Post-Flood Photos .............................................................................................C-1
Attachment
Attachment 1. Electrofishing Results

U.S. Department of Energy Moab UMTRA Project 2011 Flood Response Summary Revision 0 November 2011 DOE-EM/GJTAC2007
Page v
Acronyms and Abbreviations CA Contamination Area CF Configuration cfs cubic feet per second DOE U.S. Department of Energy EPA U.S. Environmental Protection Agency ft feet gpm gallons per minute IA interim action in. inches msl above mean sea level mg/L milligrams per liter pCi/g picocuries per gram RAC Remedial Action Contractor TAC Technical Assistance Contractor UMTRA Uranium Mill Tailings Remedial Action USGS U.S. Geological Survey yd3 cubic yards
U.S. Department of Energy Moab UMTRA Project 2011 Flood Response Summary Revision 0 December 2011 DOE-EM/GJTAC2007
Page 1
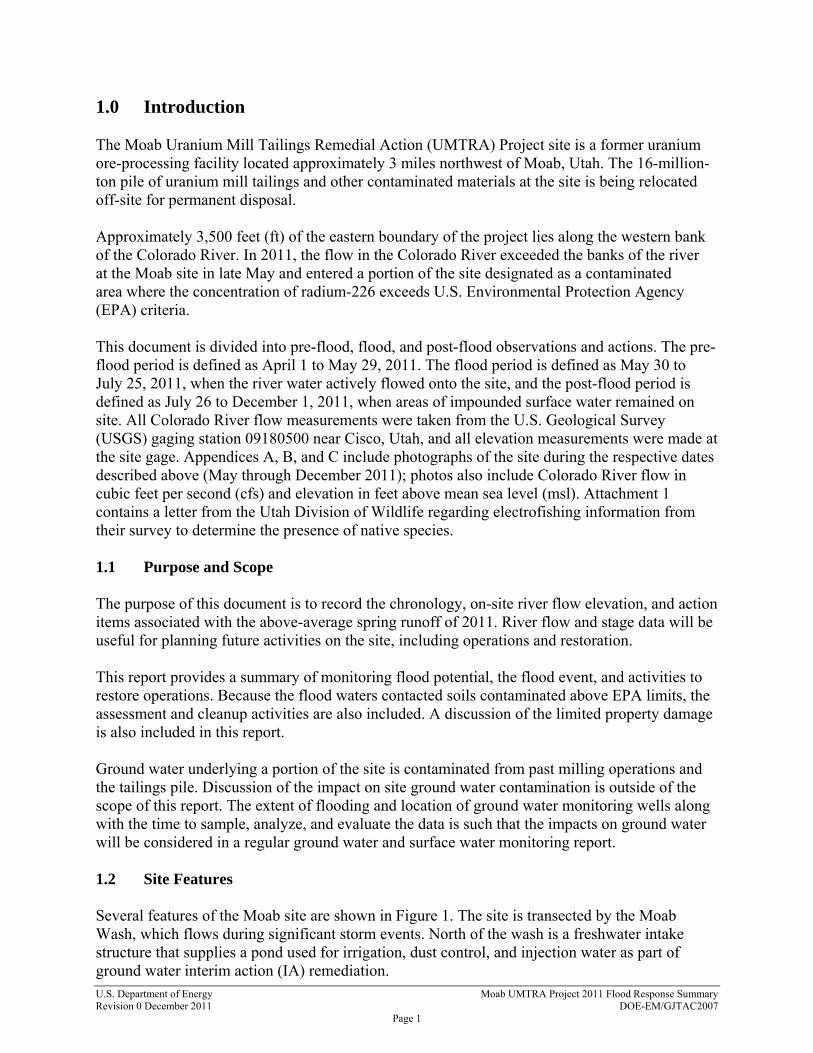
1.0 Introduction The Moab Uranium Mill Tailings Remedial Action (UMTRA) Project site is a former uranium ore-processing facility located approximately 3 miles northwest of Moab, Utah. The 16-million-ton pile of uranium mill tailings and other contaminated materials at the site is being relocated off-site for permanent disposal. Approximately 3,500 feet (ft) of the eastern boundary of the project lies along the western bank of the Colorado River. In 2011, the flow in the Colorado River exceeded the banks of the river at the Moab site in late May and entered a portion of the site designated as a contaminated area where the concentration of radium-226 exceeds U.S. Environmental Protection Agency (EPA) criteria. This document is divided into pre-flood, flood, and post-flood observations and actions. The pre-flood period is defined as April 1 to May 29, 2011. The flood period is defined as May 30 to July 25, 2011, when the river water actively flowed onto the site, and the post-flood period is defined as July 26 to December 1, 2011, when areas of impounded surface water remained on site. All Colorado River flow measurements were taken from the U.S. Geological Survey (USGS) gaging station 09180500 near Cisco, Utah, and all elevation measurements were made at the site gage. Appendices A, B, and C include photographs of the site during the respective dates described above (May through December 2011); photos also include Colorado River flow in cubic feet per second (cfs) and elevation in feet above mean sea level (msl). Attachment 1 contains a letter from the Utah Division of Wildlife regarding electrofishing information from their survey to determine the presence of native species. 1.1 Purpose and Scope The purpose of this document is to record the chronology, on-site river flow elevation, and action items associated with the above-average spring runoff of 2011. River flow and stage data will be useful for planning future activities on the site, including operations and restoration. This report provides a summary of monitoring flood potential, the flood event, and activities to restore operations. Because the flood waters contacted soils contaminated above EPA limits, the assessment and cleanup activities are also included. A discussion of the limited property damage is also included in this report. Ground water underlying a portion of the site is contaminated from past milling operations and the tailings pile. Discussion of the impact on site ground water contamination is outside of the scope of this report. The extent of flooding and location of ground water monitoring wells along with the time to sample, analyze, and evaluate the data is such that the impacts on ground water will be considered in a regular ground water and surface water monitoring report. 1.2 Site Features Several features of the Moab site are shown in Figure 1. The site is transected by the Moab Wash, which flows during significant storm events. North of the wash is a freshwater intake structure that supplies a pond used for irrigation, dust control, and injection water as part of ground water interim action (IA) remediation.
U.S. Department of Energy Moab UMTRA Project 2011 Flood Response Summary Revision 0 December 2011 DOE-EM/GJTAC2007
Page 2
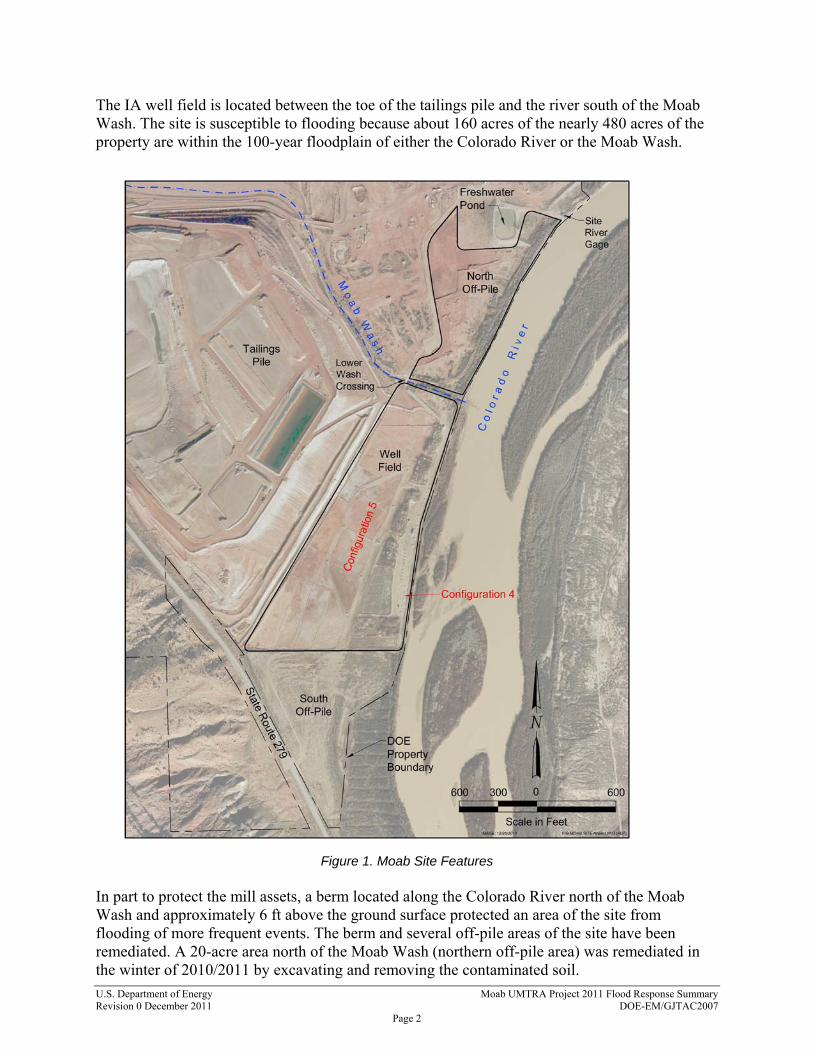
The IA well field is located between the toe of the tailings pile and the river south of the Moab Wash. The site is susceptible to flooding because about 160 acres of the nearly 480 acres of the property are within the 100-year floodplain of either the Colorado River or the Moab Wash.
Figure 1. Moab Site Features
In part to protect the mill assets, a berm located along the Colorado River north of the Moab Wash and approximately 6 ft above the ground surface protected an area of the site from flooding of more frequent events. The berm and several off-pile areas of the site have been remediated. A 20-acre area north of the Moab Wash (northern off-pile area) was remediated in the winter of 2010/2011 by excavating and removing the contaminated soil.

U.S. Department of Energy Moab UMTRA Project 2011 Flood Response Summary Revision 0 December 2011 DOE-EM/GJTAC2007
Page 3
As part of this remediation, the berm that was installed along the riverbank by the previous site owner was lowered. In addition, more than 158,000 cubic yards (yd3) of contaminated soil were removed from this area during the remediation, creating areas of lower elevation. As was anticipated, this off-pile area is now more susceptible to flooding at lower river stages. Above-normal snowfall in the Rocky Mountains during the 2010/2011 winter increased the likelihood of an excessive runoff in the Colorado River. 1.3 River Gage Since 1914, stream flow on the Colorado River has been collected by the USGS at gaging station 09180500 near Cisco, Utah. This station, located approximately 35 miles upstream of the site, is the closest station to Moab and provides the most complete data set representing river flow passing the site. There are no significant tributaries between the gaging station and the Moab site. Figure 2 shows the elevation at the Moab site gage compared to the river flow at the Cisco gage during 2011. This plot can be used to determine the Moab site flow elevation.
0
5,000
10,000
15,000
20,000
25,000
30,000
35,000
40,000
45,000
50,000
55,000
3952 3954 3956 3958 3960 3962 3964 3966 3968
Co
lora
do
Riv
er
Flo
w a
t C
isc
o (c
fs)
River Surface Elevation Measured at Site (ft msl)
Ascending Portion of Hydrograph
Descending Portion of Hydrograph
Figure 2. Cisco Gage Colorado River Flow Versus On-Site Elevation at the Site River Gage
In 2009, the project installed a standard USGS-style river staff gage at the freshwater intake structure, just west of the freshwater pond at the eastern (upstream) end of the site. The elevation of the Colorado River surface is recorded from the gage daily during times of high river flow. Metal stakes with measurement markings were installed on the western bank of the river adjacent to the southern end of the well field. The purpose of the stakes was to collect water elevation data and determine the change in elevation from the freshwater intake gage. The gradient of the river (the drop over a given distance divided by the distance) varies from the site gage to the southern well field. Therefore, to compare the river surface elevation at the site gage to other locations along the river at the site, the elevation must be adjusted.
U.S. Department of Energy Moab UMTRA Project 2011 Flood Response Summary Revision 0 December 2011 DOE-EM/GJTAC2007
Page 4
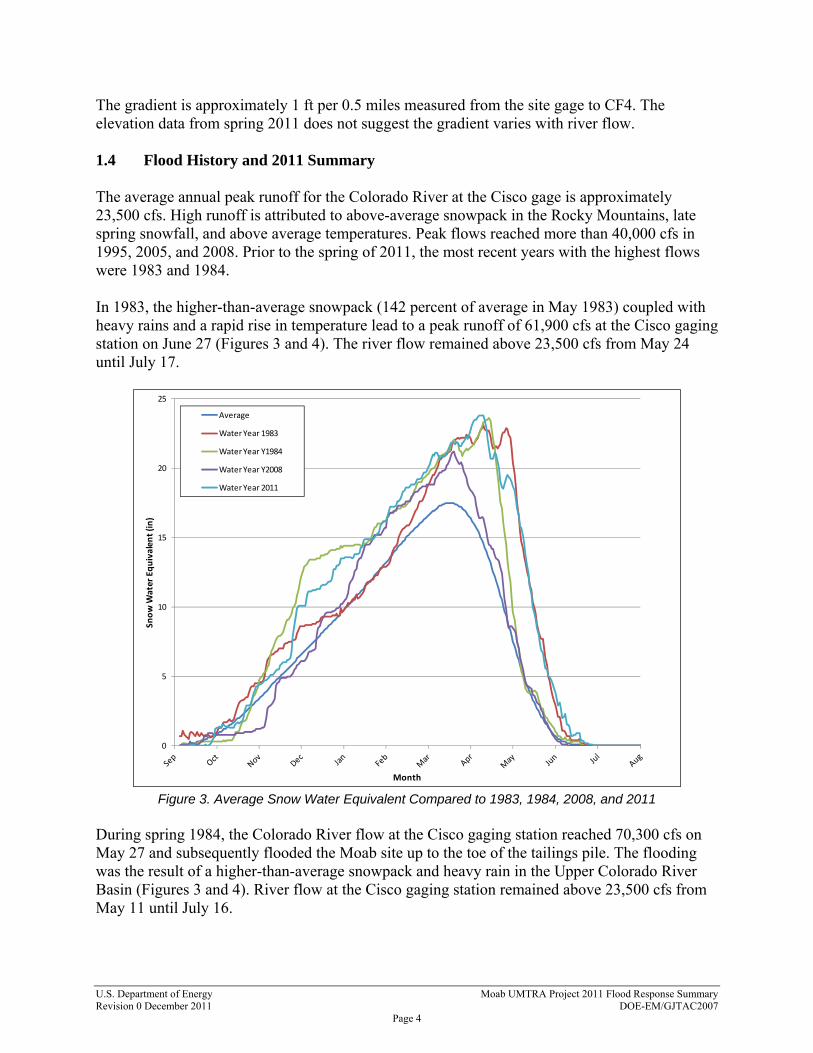
The gradient is approximately 1 ft per 0.5 miles measured from the site gage to CF4. The elevation data from spring 2011 does not suggest the gradient varies with river flow. 1.4 Flood History and 2011 Summary The average annual peak runoff for the Colorado River at the Cisco gage is approximately 23,500 cfs. High runoff is attributed to above-average snowpack in the Rocky Mountains, late spring snowfall, and above average temperatures. Peak flows reached more than 40,000 cfs in 1995, 2005, and 2008. Prior to the spring of 2011, the most recent years with the highest flows were 1983 and 1984. In 1983, the higher-than-average snowpack (142 percent of average in May 1983) coupled with heavy rains and a rapid rise in temperature lead to a peak runoff of 61,900 cfs at the Cisco gaging station on June 27 (Figures 3 and 4). The river flow remained above 23,500 cfs from May 24 until July 17.
0
5
10
15
20
25
Snow W
ater Equivalent (in)
Month
Average
Water Year 1983
Water Year Y1984
Water Year Y2008
Water Year 2011
Figure 3. Average Snow Water Equivalent Compared to 1983, 1984, 2008, and 2011
During spring 1984, the Colorado River flow at the Cisco gaging station reached 70,300 cfs on May 27 and subsequently flooded the Moab site up to the toe of the tailings pile. The flooding was the result of a higher-than-average snowpack and heavy rain in the Upper Colorado River Basin (Figures 3 and 4). River flow at the Cisco gaging station remained above 23,500 cfs from May 11 until July 16.
U.S. Department of Energy Moab UMTRA Project 2011 Flood Response Summary Revision 0 December 2011 DOE-EM/GJTAC2007
Page 5
0
10,000
20,000
30,000
40,000
50,000
60,000
70,000
80,000
Colorado River Flow (cfs)
Date
1983
1984
2008
2011
Average Annual Peak
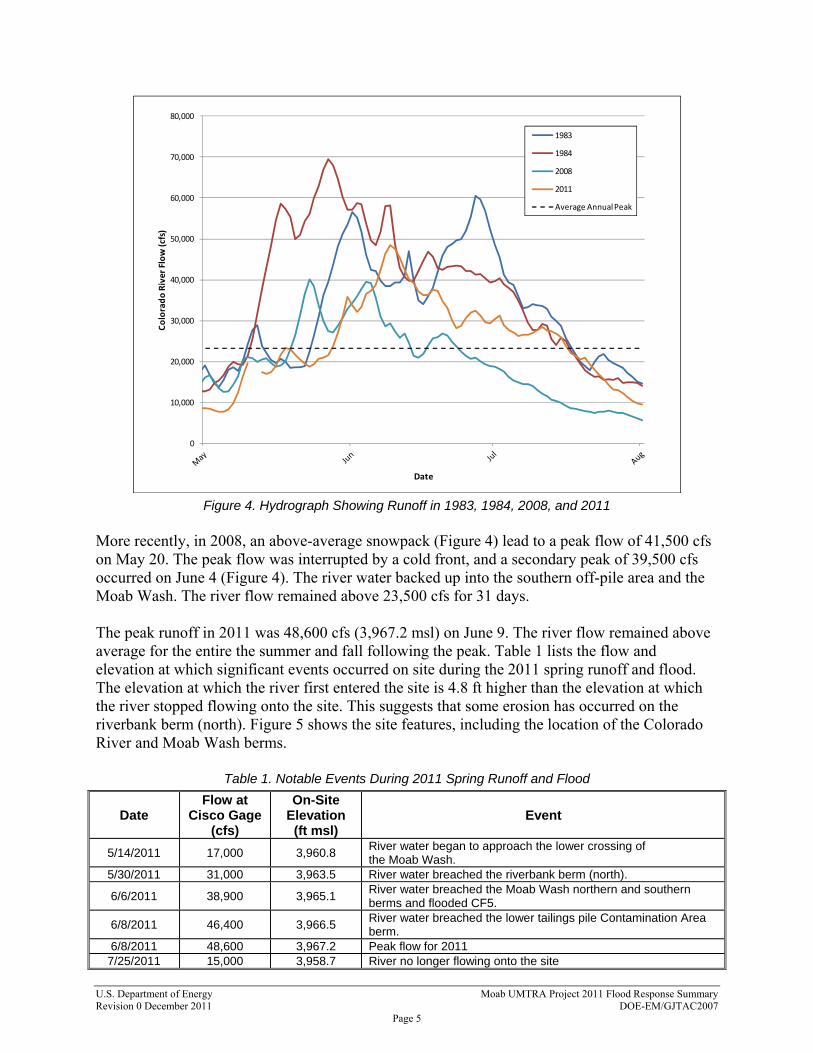
Figure 4. Hydrograph Showing Runoff in 1983, 1984, 2008, and 2011
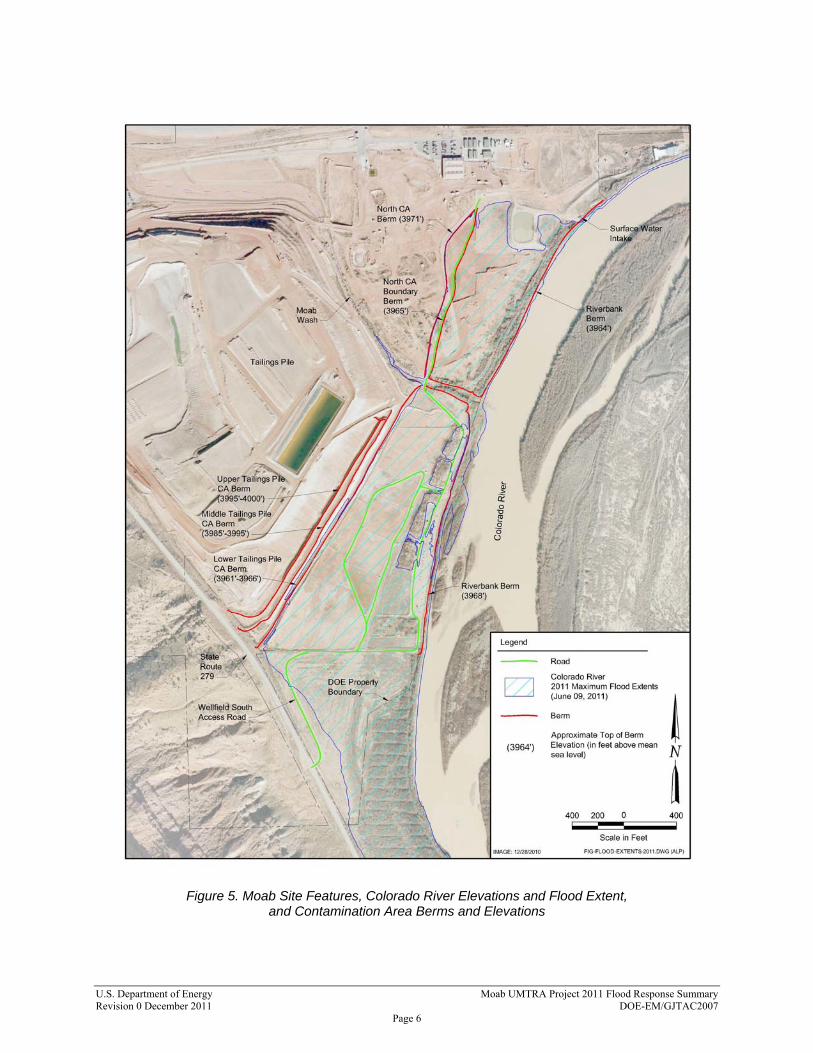
More recently, in 2008, an above-average snowpack (Figure 4) lead to a peak flow of 41,500 cfs on May 20. The peak flow was interrupted by a cold front, and a secondary peak of 39,500 cfs occurred on June 4 (Figure 4). The river water backed up into the southern off-pile area and the Moab Wash. The river flow remained above 23,500 cfs for 31 days. The peak runoff in 2011 was 48,600 cfs (3,967.2 msl) on June 9. The river flow remained above average for the entire the summer and fall following the peak. Table 1 lists the flow and elevation at which significant events occurred on site during the 2011 spring runoff and flood. The elevation at which the river first entered the site is 4.8 ft higher than the elevation at which the river stopped flowing onto the site. This suggests that some erosion has occurred on the riverbank berm (north). Figure 5 shows the site features, including the location of the Colorado River and Moab Wash berms.
Table 1. Notable Events During 2011 Spring Runoff and Flood
Date Flow at
Cisco Gage (cfs)
On-Site Elevation
(ft msl) Event
5/14/2011 17,000 3,960.8 River water began to approach the lower crossing of the Moab Wash.
5/30/2011 31,000 3,963.5 River water breached the riverbank berm (north).
6/6/2011 38,900 3,965.1 River water breached the Moab Wash northern and southern berms and flooded CF5.
6/8/2011 46,400 3,966.5 River water breached the lower tailings pile Contamination Area berm.
6/8/2011 48,600 3,967.2 Peak flow for 2011 7/25/2011 15,000 3,958.7 River no longer flowing onto the site
U.S. Department of Energy Moab UMTRA Project 2011 Flood Response Summary Revision 0 December 2011 DOE-EM/GJTAC2007
Page 6
Figure 5. Moab Site Features, Colorado River Elevations and Flood Extent, and Contamination Area Berms and Elevations
U.S. Department of Energy Moab UMTRA Project 2011 Flood Response Summary Revision 0 December 2011 DOE-EM/GJTAC2007
Page 7
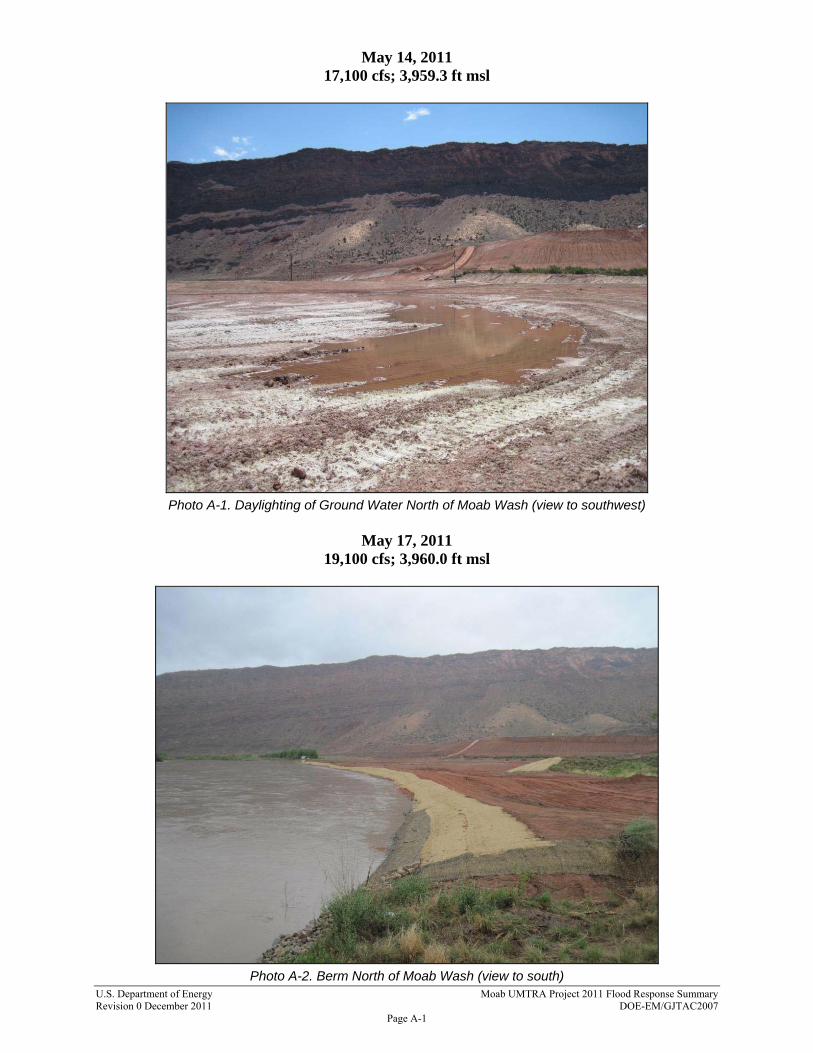
Even though the Colorado River water entered the Moab site and remained for nearly 2 months, the velocity of the river water was low enough that it did not erode much sediment or cause property damage. Several website resources were extremely useful in determining the extent and timing of the spring runoff (Section 6.0). With early monitoring of the data provided on these websites and the use of historical site information, it is possible to increase site preparedness for future high runoff events. 2.0 Pre-Flood Actions from April 1 to May 29 The Moab UMTRA Project Flood Mitigation Plan (DOE-EM/GJTAC1640) outlines flood preparation actions to be completed by the Technical Assistance Contractor (TAC) and Remedial Action Contractor (RAC). The document identifies three river flow action levels in which specific tasks must be completed to protect site property. The action levels were designated for Colorado River flows at the Cisco gage of 15,000 cfs, 25,000 cfs, and 30,000 cfs, when the 2-week prediction was 40,000 cfs or greater. During April and May, preparations for potential flooding were completed as the snowpack greatly increased in the Upper Colorado River Basin. Weekly updates on snowpack and forecasted river flow were distributed to key RAC, TAC, and U.S. Department of Energy (DOE) personnel, and the Colorado River surface water elevation at the site river gage was recorded on a daily basis. 2.1 Observations In early April, the Upper Colorado River basin snow water equivalent was 125 percent of average, and the river flow was between 4,170 and 10,900 cfs (elevations from 3,954.6 to 3,962.4 ft msl). From May 1 to May 29, the Upper Colorado River basin snow water equivalent increased to 161 percent of average, and the river flow was between 7,670 and 27,000 cfs (3955.4 to 3962.4 ft msl) (Figure 6). On May 14, when the river flow was 17,100 cfs (3,959.3 ft msl), the ground water began to surface, or “daylight” in several low-lying areas in the northern off-pile area (Appendix A, Photos A-1 and A-2). When the flow approached 19,000 cfs (3,959.8 ft msl) in early May, river water was within 15 ft of the lower Moab Wash crossing, and ground water continued to rise to the surface (Appendix A, Photos A-1 and A-2). By May 28, the low-lying areas of daylighted ground water north of the Moab Wash became one continuous area of impounded water, and the water in the Moab Wash began to approach the lower wash crossing (Figure 5) (Appendix A, Photo A-3). During the month of May, the area south of the Moab Wash remained dry. When the river flow increased to 16,200 cfs (3,958.8 ft msl) on May 9, the backwater channel that runs adjacent to the middle of the well field was inundated with water. The backwater channels on the northern end of the well field were inundated when the flow reached 20,100 cfs (3,960.1 ft msl) on May 10.

U.S. Department of Energy Moab UMTRA Project 2011 Flood Response Summary Revision 0 December 2011 DOE-EM/GJTAC2007
Page 8
0
10,000
20,000
30,000
40,000
50,000
Mean Daily Flow (cfs)
Date
River Water Approaching Lower Moab Wash
Figure 6. Colorado River Cisco Hydrograph from April 1 to May 29
2.2 Action Items Completed Table 2 summarizes the actions completed during the pre-flood period. In the IA well field, the well points along the riverbank were capped, and photographs were taken to document the channel morphology. Trash that had washed up from the river was cleared out of the channels. Injection was shut down in May when the river flow increased to 20,000 cfs (3,960.1 ft msl) to encourage the river water to migrate into the ground water system for natural dilution. Air-monitoring equipment was removed from the well field on May 11, and Revision 1 of the Flood Mitigation Plan was distributed to key personnel on May 19.
Table 2. Pre-Flood Actions
Action Item River Flow (cfs)
On-Site River
Elevation (ft msl)
Date Completed
Well points capped along riverbank 8,260 3,955.7 4/19/11 Water levels collected from well field observation wells 10,600 3,956.0 4/20/11
Injection shut down 20,100 3,960.1 5/09/11 Air monitoring equipment removed 19,100 3,960.0 5/11/11
Revised Flood Mitigation Plan distributed 22,900 3,961.2 5/19/11
U.S. Department of Energy Moab UMTRA Project 2011 Flood Response Summary Revision 0 December 2011 DOE-EM/GJTAC2007
Page 9
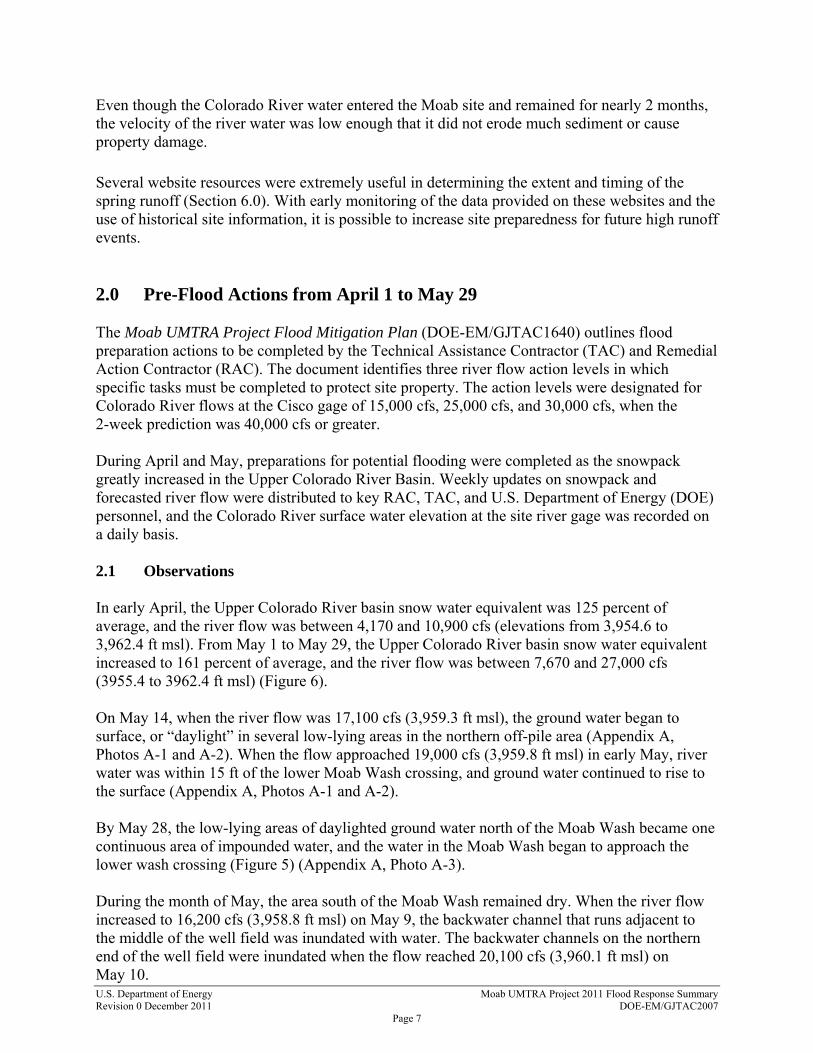
3.0 Flood Actions May 30 to July 25 The Colorado River breached the river berm north of the Moab Wash (Figure 7) on May 30. From May 30 to July 25, the river ran through the Moab site, flowing from the northeastern end of the northern off-pile and the Moab Wash, through the CF5 area of the IA well field, and out through the southern off-pile area (Figure 5).
0
10,000
20,000
30,000
40,000
50,000
Mean Daily
Flow (cfs)
Date
North Off‐Pile Flooded
South Off‐Pile and CF5 Flooded
CA Berm/Well Field Flooded
Figure 7. Cisco Gaging Station Hydrograph for May 30 to July 25
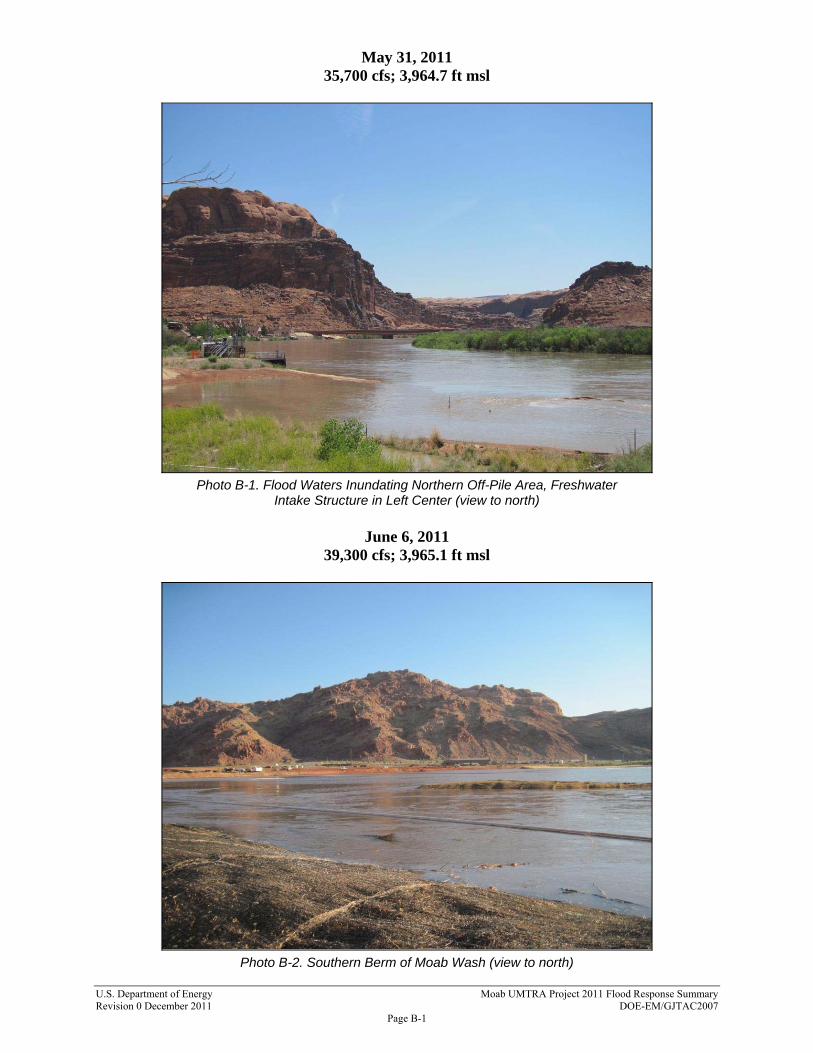
3.1 Observations From May 30 to July 25, the river flow at the Cisco gaging station ranged from 49,000 to 12,900 cfs (Figure 7). By late May, the Lake Powell Group snow water equivalent was 113 percent of average. On May 30, the river flow reached 29,700 cfs (3,963.5 ft msl) and breached the river berm/bank north of the wash. As a result, river water began to flow into the northern off-pile area (Figure 5) (Appendix B, Photos B-1 and B-2). River water had encroached into the Moab Wash, but had not overtopped the wash berm. Near CF5, ground water began to surface in some of the northeastern revegetation plots. Photo 1 shows the flooded areas (including the surfacing ground water in CF5) as of June 3, when the river flow was 33,800 cfs (3,963.9 ft msl) and the river water had breached a small portion of the northern Moab Wash berm.

U.S. Department of Energy Moab UMTRA Project 2011 Flood Response Summary Revision 0 December 2011 DOE-EM/GJTAC2007
Page 10
Photo 1. Extent of Moab Site Flooded Areas (blue) at 33,800 cfs on June 3
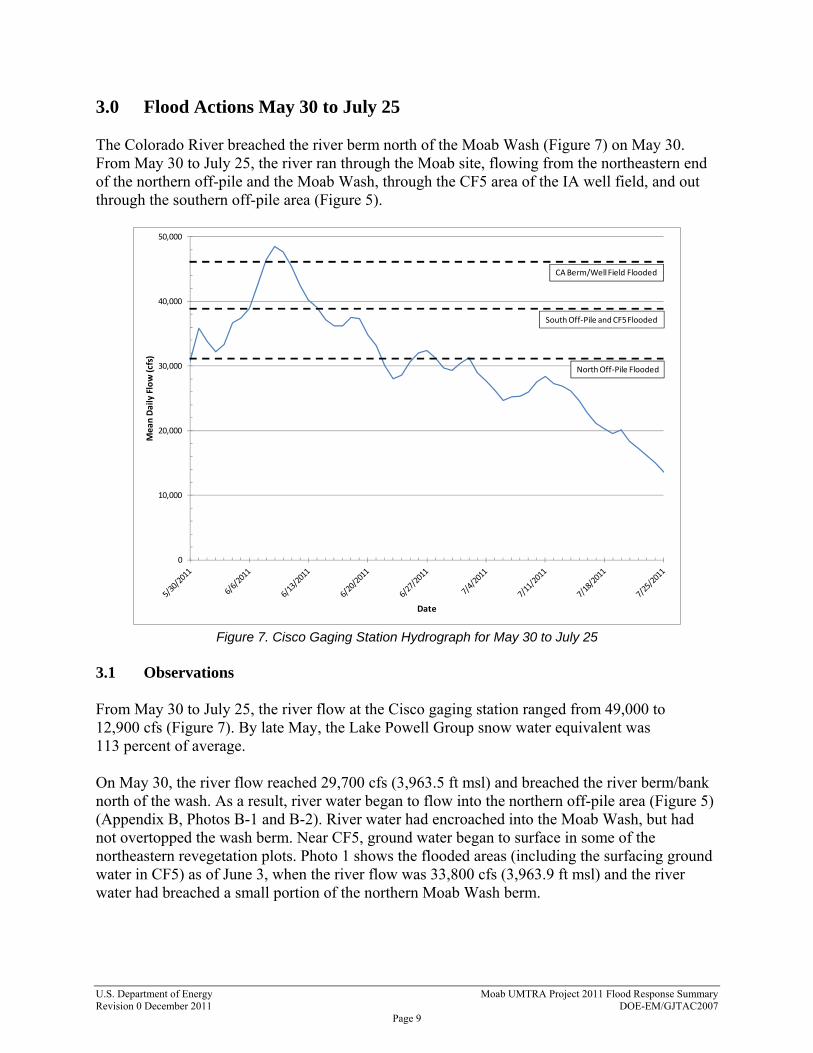
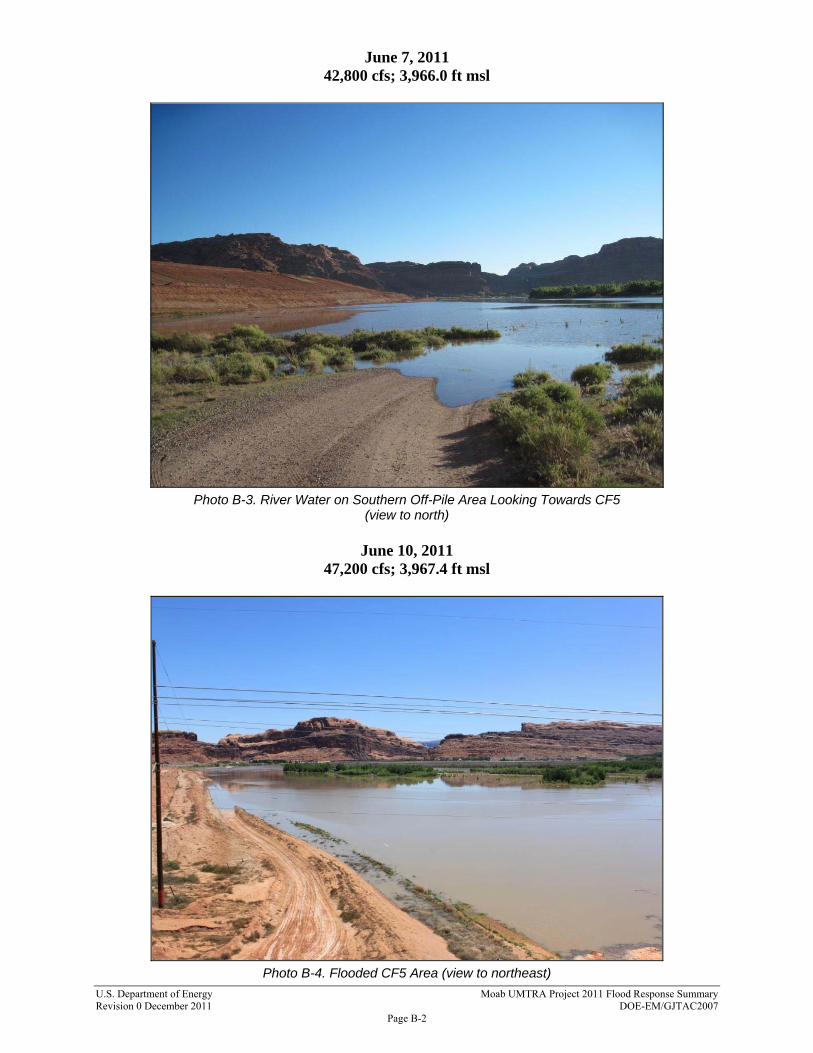
By June 6, the river water began to approach the southern off-pile area from the river bank and filled in a low-lying area (that flooded in 2008) (Appendix B, Photo B-3). The river elevation increased, and surface water in the Moab Wash approached the northern and southern berms of the channel. On the late evening of June 6, the river reached 39,300 cfs (3,965.1 ft msl), and water in the Moab Wash breached the southern berm (Photo 2). On June 8, the lower tailings pile Contamination Area (CA) berm was breached, and some floodwater began to enter the CA between the lower and middle tailings pile berm (Figure 5). It was noted that river water began to enter the southern portion of the IA well field up to approximately 1 ft in depth. The water entered the well field from the west (CF5 area) (Photo 3). It should be noted that in 2011, the river never topped the riverbank berm (south), but likely came within a few feet from the top of the berm (Figure 5). All of the floodwater in the southern off-pile area and CF5 had a very low velocity. By June 9, when the river flow peaked, one continuous channel had formed from the northern off-pile area, through CF5, to the southern off-pile area, and back to the river (Photo 3). Figure 5 shows the location of various berms in relation to site features, the extent of the flooded area, and the elevations of the river and CA berms as of June 9.
U.S. Department of Energy Moab UMTRA Project 2011 Flood Response Summary Revision 0 December 2011 DOE-EM/GJTAC2007
Page 11
Photo 2. Extent of Flooded Water at 39,300 cfs on June 6
Photo 3. Aerial View of Moab Site at 48,600 cfs on June 9
(view to southwest)

U.S. Department of Energy Moab UMTRA Project 2011 Flood Response Summary Revision 0 December 2011 DOE-EM/GJTAC2007
Page 12
3.2 Action Items Completed As the river water approached the site, many of the actions outlined in the Flood Mitigation Plan were completed (Table 3).
Table 3. Flood Actions
Action Item River Flow (cfs)
On-Site River
Elevation (ft msl)
Date Completed
Added a berm around the freshwater pond and to CA boundary berms
35,700 3,964.7 5/31/11 Removed variable frequency drives from CF5 wells
Shut down well field power Removed flow meters from extraction/injection wells 34,000 3,964.6 6/01/11
Placed sand bags around sand filter shed 32,300 3,963.7 6/02/11 Added signage to warn boaters 48,600 3,967.0 6/09/11
Performed radiological scan of accessible areas in southern off-pile area and well field 27,000 3,962.3 7/07/11
Assessed well field for water damage Sampled impounded and river water 27,500 3,963.0 7/13/11
Performed mosquito abatement 22,100 3,961.0 7/19/11
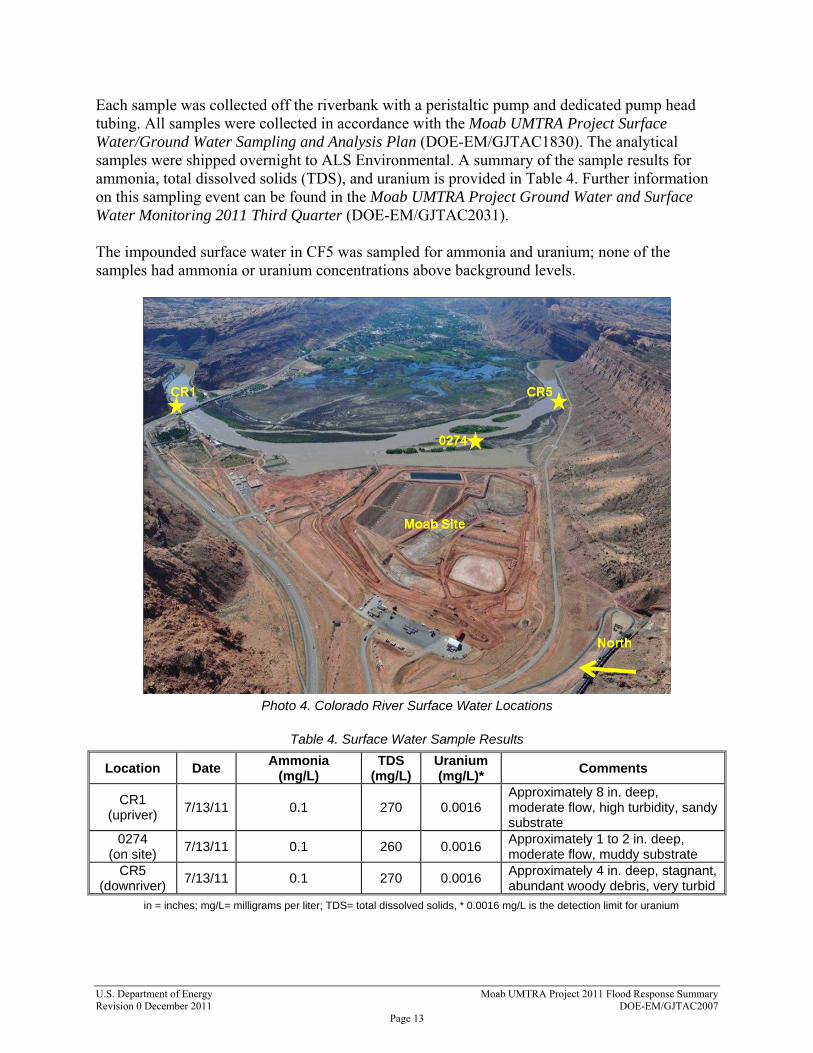
Additional soil was added to the northern CA boundary berm on May 31 in response to the breached northern riverbank berm. Material was also added around the freshwater pond to protect it from the rising floodwaters. The variable frequency drives were removed from the extraction wells in CF5. In addition, flood preparations, such as recording water levels from observation wells, removing flow meters from the remediation wells, and placing sandbags around the sand filter shed, were completed in early June. A solar-powered sign was added near the freshwater pond to warn boaters to stay out of the northern off-pile area because of submerged hazards, such as observation wells and irrigation piping. By early July, the river surface elevation decreased to 3962.3 ft msl, exposing some of the southern off-pile area. On July 7, RAC Radiological Control personnel scanned a path through the southern off-pile area and the well field. Blue flags were placed to indicate where a radiological evaluation had been performed. None of the radiological readings exceeded background levels. Once the well field was accessible, an assessment of water damage was completed. Erosion was noted near some of the well vaults and observation well cement pads. Surface water samples were collected from the river in three locations, upriver from the site (CR1), adjacent to on the site (0274), and downriver from the site (CR5) (Photo 4). In addition, surface water samples were collected from two areas of ponded water, one in CF5, and one near the Moab Wash southern bank berm. This sampling event took place on July 13, when the river flow was 27,500 cfs. Parameters, including temperature, pH, specific conductance, dissolved oxygen, oxidation-reduction potential, and turbidity, were recorded with a YSI water quality instrument and a digital field turbidimeter.
U.S. Department of Energy Moab UMTRA Project 2011 Flood Response Summary Revision 0 December 2011 DOE-EM/GJTAC2007
Page 13
Each sample was collected off the riverbank with a peristaltic pump and dedicated pump head tubing. All samples were collected in accordance with the Moab UMTRA Project Surface Water/Ground Water Sampling and Analysis Plan (DOE-EM/GJTAC1830). The analytical samples were shipped overnight to ALS Environmental. A summary of the sample results for ammonia, total dissolved solids (TDS), and uranium is provided in Table 4. Further information on this sampling event can be found in the Moab UMTRA Project Ground Water and Surface Water Monitoring 2011 Third Quarter (DOE-EM/GJTAC2031). The impounded surface water in CF5 was sampled for ammonia and uranium; none of the samples had ammonia or uranium concentrations above background levels.
Photo 4. Colorado River Surface Water Locations
Table 4. Surface Water Sample Results
Location Date Ammonia
(mg/L) TDS
(mg/L) Uranium (mg/L)*
Comments
CR1 (upriver)
7/13/11 0.1 270 0.0016 Approximately 8 in. deep, moderate flow, high turbidity, sandy substrate
0274 (on site)
7/13/11 0.1 260 0.0016 Approximately 1 to 2 in. deep, moderate flow, muddy substrate
CR5 (downriver)
7/13/11 0.1 270 0.0016 Approximately 4 in. deep, stagnant, abundant woody debris, very turbid
in = inches; mg/L= milligrams per liter; TDS= total dissolved solids, * 0.0016 mg/L is the detection limit for uranium
U.S. Department of Energy Moab UMTRA Project 2011 Flood Response Summary Revision 0 December 2011 DOE-EM/GJTAC2007
Page 14
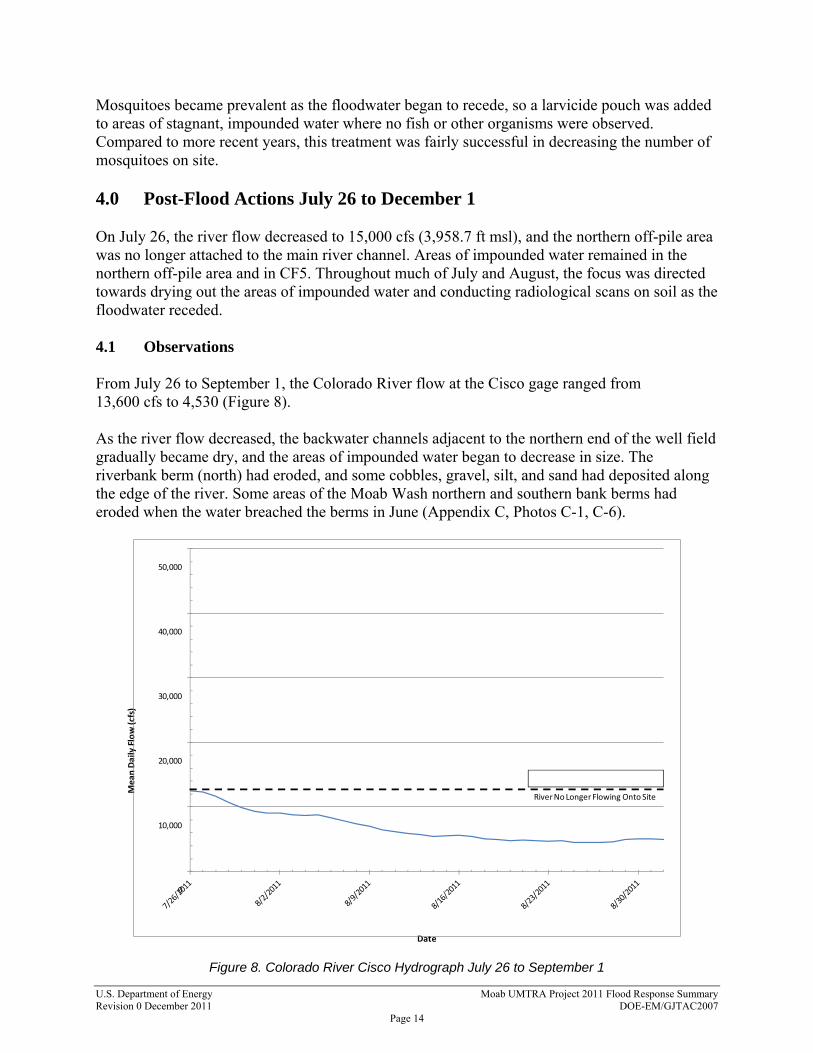
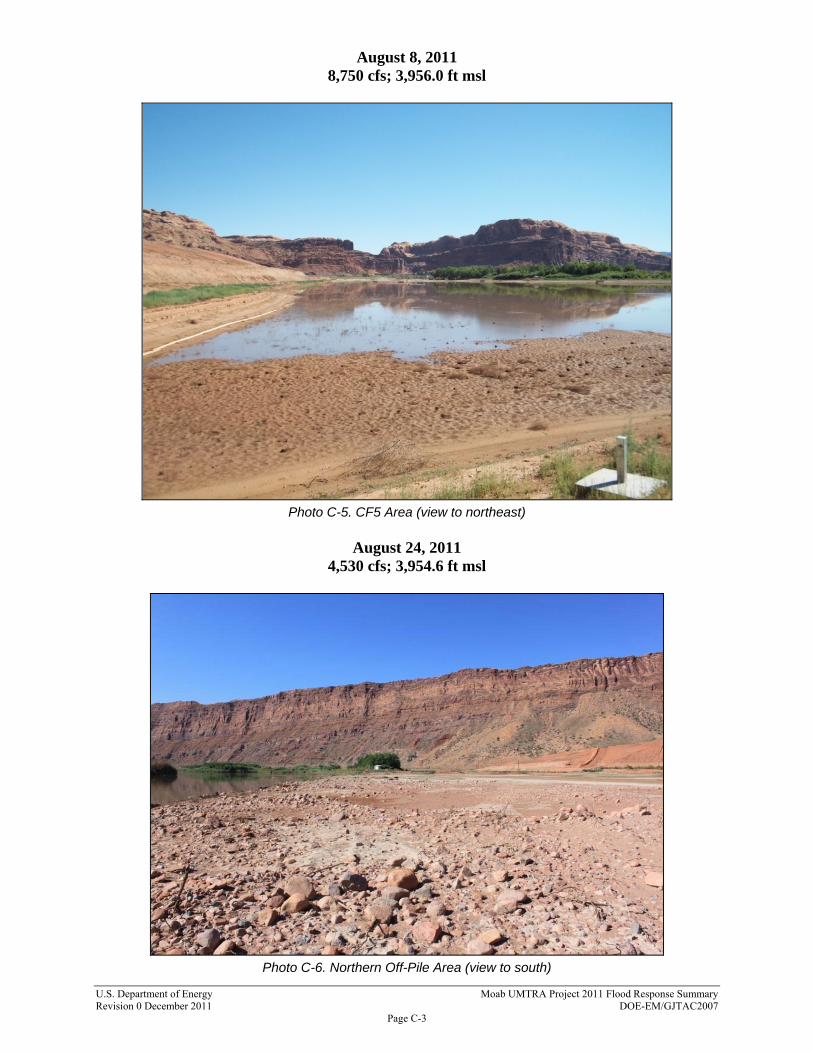
Mosquitoes became prevalent as the floodwater began to recede, so a larvicide pouch was added to areas of stagnant, impounded water where no fish or other organisms were observed. Compared to more recent years, this treatment was fairly successful in decreasing the number of mosquitoes on site. 4.0 Post-Flood Actions July 26 to December 1 On July 26, the river flow decreased to 15,000 cfs (3,958.7 ft msl), and the northern off-pile area was no longer attached to the main river channel. Areas of impounded water remained in the northern off-pile area and in CF5. Throughout much of July and August, the focus was directed towards drying out the areas of impounded water and conducting radiological scans on soil as the floodwater receded. 4.1 Observations From July 26 to September 1, the Colorado River flow at the Cisco gage ranged from 13,600 cfs to 4,530 (Figure 8). As the river flow decreased, the backwater channels adjacent to the northern end of the well field gradually became dry, and the areas of impounded water began to decrease in size. The riverbank berm (north) had eroded, and some cobbles, gravel, silt, and sand had deposited along the edge of the river. Some areas of the Moab Wash northern and southern bank berms had eroded when the water breached the berms in June (Appendix C, Photos C-1, C-6).
0
10,000
20,000
30,000
40,000
50,000
Mean Daily
Flow (cfs)
Date
River No Longer Flowing Onto Site
Figure 8. Colorado River Cisco Hydrograph July 26 to September 1
U.S. Department of Energy Moab UMTRA Project 2011 Flood Response Summary Revision 0 December 2011 DOE-EM/GJTAC2007
Page 15
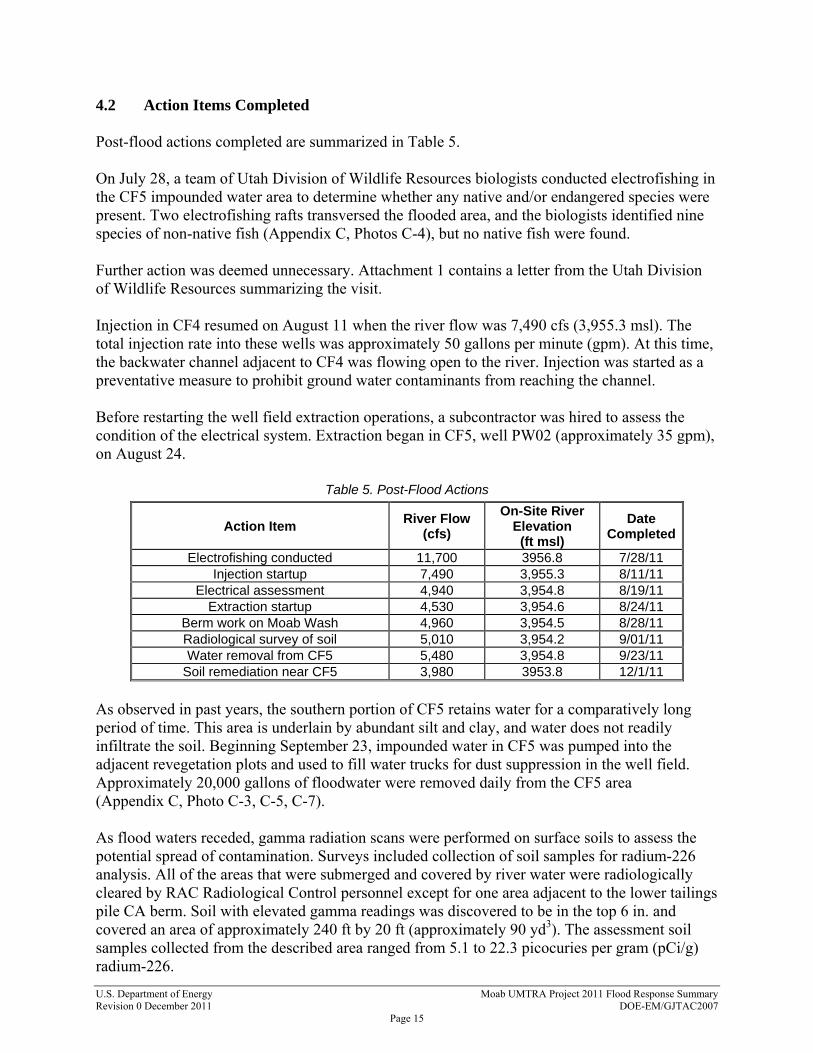
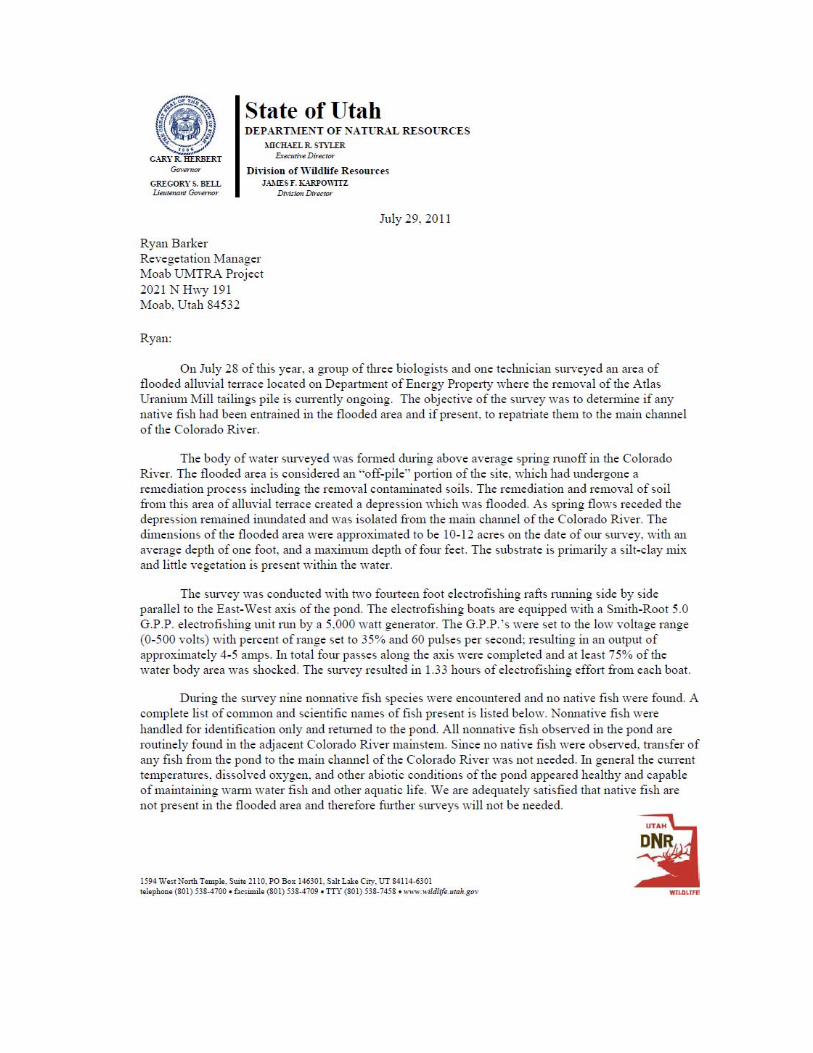
4.2 Action Items Completed Post-flood actions completed are summarized in Table 5. On July 28, a team of Utah Division of Wildlife Resources biologists conducted electrofishing in the CF5 impounded water area to determine whether any native and/or endangered species were present. Two electrofishing rafts transversed the flooded area, and the biologists identified nine species of non-native fish (Appendix C, Photos C-4), but no native fish were found. Further action was deemed unnecessary. Attachment 1 contains a letter from the Utah Division of Wildlife Resources summarizing the visit. Injection in CF4 resumed on August 11 when the river flow was 7,490 cfs (3,955.3 msl). The total injection rate into these wells was approximately 50 gallons per minute (gpm). At this time, the backwater channel adjacent to CF4 was flowing open to the river. Injection was started as a preventative measure to prohibit ground water contaminants from reaching the channel. Before restarting the well field extraction operations, a subcontractor was hired to assess the condition of the electrical system. Extraction began in CF5, well PW02 (approximately 35 gpm), on August 24.
Table 5. Post-Flood Actions
Action Item River Flow
(cfs)
On-Site River Elevation
(ft msl)
Date Completed
Electrofishing conducted 11,700 3956.8 7/28/11 Injection startup 7,490 3,955.3 8/11/11
Electrical assessment 4,940 3,954.8 8/19/11 Extraction startup 4,530 3,954.6 8/24/11
Berm work on Moab Wash 4,960 3,954.5 8/28/11 Radiological survey of soil 5,010 3,954.2 9/01/11 Water removal from CF5 5,480 3,954.8 9/23/11
Soil remediation near CF5 3,980 3953.8 12/1/11
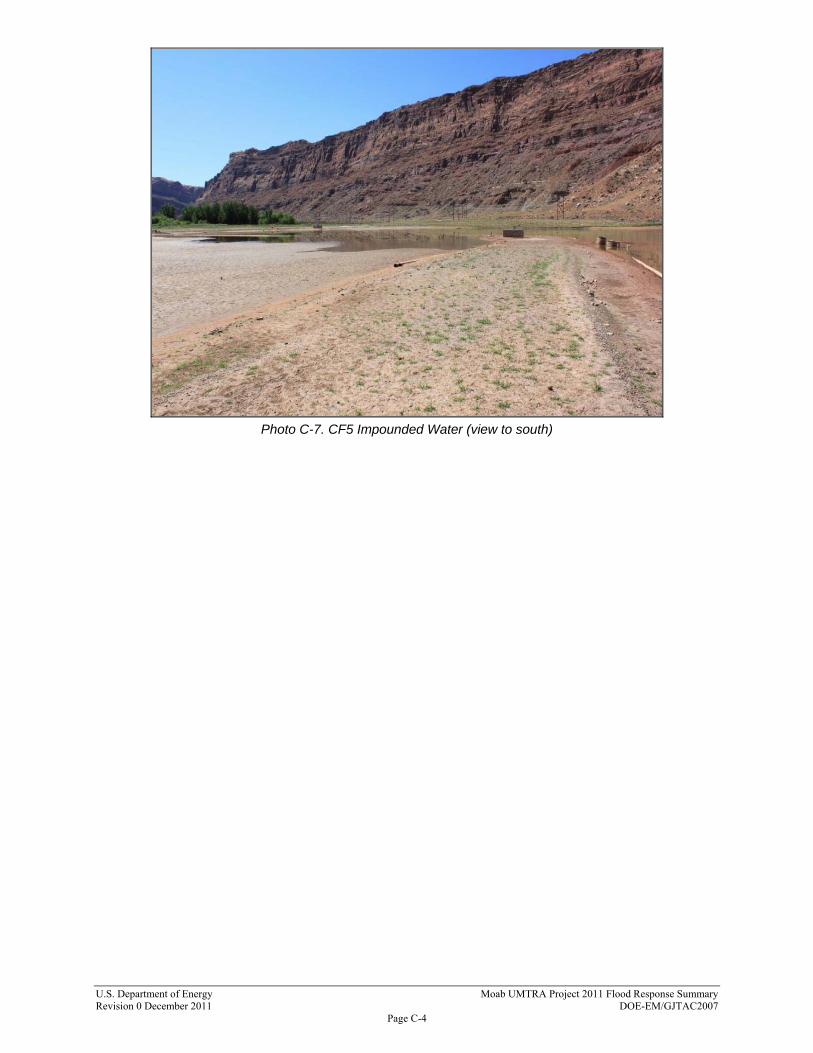
As observed in past years, the southern portion of CF5 retains water for a comparatively long period of time. This area is underlain by abundant silt and clay, and water does not readily infiltrate the soil. Beginning September 23, impounded water in CF5 was pumped into the adjacent revegetation plots and used to fill water trucks for dust suppression in the well field. Approximately 20,000 gallons of floodwater were removed daily from the CF5 area (Appendix C, Photo C-3, C-5, C-7). As flood waters receded, gamma radiation scans were performed on surface soils to assess the potential spread of contamination. Surveys included collection of soil samples for radium-226 analysis. All of the areas that were submerged and covered by river water were radiologically cleared by RAC Radiological Control personnel except for one area adjacent to the lower tailings pile CA berm. Soil with elevated gamma readings was discovered to be in the top 6 in. and covered an area of approximately 240 ft by 20 ft (approximately 90 yd3). The assessment soil samples collected from the described area ranged from 5.1 to 22.3 picocuries per gram (pCi/g) radium-226.

U.S. Department of Energy Moab UMTRA Project 2011 Flood Response Summary Revision 0 December 2011 DOE-EM/GJTAC2007
Page 16
One isolated, small hot spot that had a concentration of 127.6 pCi/g or radium-226 was also located. These values exceed EPA surface soil contamination standards of 5 pCi/g radium-226. The assessed contaminated soil was then excavated by RAC personnel and placed back in the CA. Excavation control for the remedial action of the area was performed by TAC personnel. The remediated area had a verification survey performed on completion that included a gamma exposure-rate survey and collection of verification soil samples to document the in situ radium-266 concentrations. The samples had radium-226 concentrations of 0.8 to 4.5 pCi/g, indicating that the soil contamination has been successfully removed. The total damage to the well field and southern off-pile was minimal. The velocity of river water was low enough that it did not erode much sediment or cause much property damage. However, due to recent disturbance to the northern off-pile area, significant erosion was noted. Plans were recently approved by the U.S. Army Corps of Engineers, U.S. Fish and Wildlife Service, and the Utah State Water Engineers Office to stabilize the area and create a riparian/wetland habitat. 5.0 Lessons Learned River flow forecasts are complex calculations taking into account many factors; however, they cannot account for variations in local weather conditions. Windy conditions created waves that led to the breach of the northern position of the riverbank berm. Flood preparations should account for local variations. The river breached a berm in the northern off-pile area on a holiday when most personnel were off site. The river forecast changed significantly from the previous Friday. Personnel scheduling should account for responsibilities that may be necessary. Equipment and supplies should be properly secured, and the work wasn’t completed before the river breached the northern riverbank berm. Where possible, electrical connections should be simplified so any susceptible equipment can be easily removed in flood-prone areas. 6.0 References Colorado SNOTEL Snow Water Equivalent Update Graph http://www.wcc.nrcs.usda.gov/cgibin/snowup-graph.pl?state=CO
Colorado River Basin Water Year Comparison Graph http://www.cpachecojr.com/cgi-bin/work/get_basin.cgi
National Oceanic and Atmospheric Administration Colorado River, Colorado River Basin Forecast Center, Cisco Hydrograph http://www.cbrfc.noaa.gov/river/station/flowplot/flowplot.cgi?CLRU1
National Weather Service Water Resources Outlook http://wateroutlook.nwrfc.noaa.gov/point/ranking
U.S. Department of Energy Moab UMTRA Project 2011 Flood Response Summary Revision 0 December 2011 DOE-EM/GJTAC2007
Page 17
Natural Resources Conservation Service Colorado Home Page http://www.co.nrcs.usda.gov/snow/snow/watershed/current/daily/maps_graphs/index.html
SNOTEL Basin Snow Water Equivalent Projection Maps with Selectable Future Conditions http://www.co.nrcs.usda.gov/snow/snow/watershed/current/daily/maps_graphs/swe_projections_05.html
United States Geological Survey Colorado River Cisco Gaging Station, real-time plot http://waterdata.usgs.gov/ut/nwis/uv/?site_no=09180500&agency_cd=USGS
DOE (U.S. Department of Energy), Moab UMTRA Project Surface Water/Ground Water Sampling and Analysis Plan (DOE-EM/GJTAC1830), November 2009.
DOE (U.S. Department of Energy), Moab UMTRA Project Flood Mitigation Plan (DOE-EM/GJ1640), May 2011.
DOE (U.S. Department of Energy), Moab UMTRA Project Ground Water and Surface Water Monitoring 2011 Third Quarter (DOE-EM/GJTAC2031) December 2011.

Appendix A.
Pre-Flood Photos
U.S. Department of Energy Moab UMTRA Project 2011 Flood Response Summary Revision 0 December 2011 DOE-EM/GJTAC2007
Page A-1
May 14, 2011 17,100 cfs; 3,959.3 ft msl
Photo A-1. Daylighting of Ground Water North of Moab Wash (view to southwest)
May 17, 2011
19,100 cfs; 3,960.0 ft msl
Photo A-2. Berm North of Moab Wash (view to south)

U.S. Department of Energy Moab UMTRA Project 2011 Flood Response Summary Revision 0 December 2011 DOE-EM/GJTAC2007
Page A-2
May 28, 2011 24,000 cfs; 3,961.6 ft msl
Photo A-3. River Water Backed Up in Moab Wash Almost to Lower Wash Crossing
(view to east)

Appendix B. Flood Photos
U.S. Department of Energy Moab UMTRA Project 2011 Flood Response Summary Revision 0 December 2011 DOE-EM/GJTAC2007
Page B-1
May 31, 2011 35,700 cfs; 3,964.7 ft msl
Photo B-1. Flood Waters Inundating Northern Off-Pile Area, Freshwater
Intake Structure in Left Center (view to north)
June 6, 2011
39,300 cfs; 3,965.1 ft msl
Photo B-2. Southern Berm of Moab Wash (view to north)
U.S. Department of Energy Moab UMTRA Project 2011 Flood Response Summary Revision 0 December 2011 DOE-EM/GJTAC2007
Page B-2
June 7, 2011 42,800 cfs; 3,966.0 ft msl
Photo B-3. River Water on Southern Off-Pile Area Looking Towards CF5
(view to north)
June 10, 2011 47,200 cfs; 3,967.4 ft msl
Photo B-4. Flooded CF5 Area (view to northeast)

Appendix C. Post-Flood Photos

U.S. Department of Energy Moab UMTRA Project 2011 Flood Response Summary Revision 0 December 2011 DOE-EM/GJTAC2007
Page C-1
July 26, 2011 13,900 cfs; 3,858.2 ft msl
Photo C-1. Northern Off-Pile Area (view to south)
Photo C-2. Northern Off-Pile Area (view from Moab Wash to north)

U.S. Department of Energy Moab UMTRA Project 2011 Flood Response Summary Revision 0 December 2011 DOE-EM/GJTAC2007
Page C-2
Photo C-3. Ponded Water in CF5 of Well Field (view to northeast)
July 28, 2011
11,700 cfs; 3,956.8 ft msl
Photo C-4. CF5 Electrofishing Operations (view to west towards tailings pile)
U.S. Department of Energy Moab UMTRA Project 2011 Flood Response Summary Revision 0 December 2011 DOE-EM/GJTAC2007
Page C-3
August 8, 2011 8,750 cfs; 3,956.0 ft msl
Photo C-5. CF5 Area (view to northeast)
August 24, 2011
4,530 cfs; 3,954.6 ft msl
Photo C-6. Northern Off-Pile Area (view to south)
U.S. Department of Energy Moab UMTRA Project 2011 Flood Response Summary Revision 0 December 2011 DOE-EM/GJTAC2007
Page C-4
Photo C-7. CF5 Impounded Water (view to south)

Attachment 1. Electrofishing Results


![WELCOME [] · 2016-09-22 · Path to EM Success in 2016 and Beyond Moderator: Stacy Charboneau, Associate Principal Deputy Assistant Secretary for Field Operations, DOE-EM Sue Cange,](https://img.pdfslide.us/doc/110x75/5f919b65d1159825f00f263d/welcome-2016-09-22-path-to-em-success-in-2016-and-beyond-moderator-stacy.jpg)