Embed Size (px)
Citation preview
Dodd-Frank Act Stress Test 2015:Supervisory Stress Test Methodology
and Results
March 2015
BOARD OF GOVERNOR S O F THE F EDERAL R E S ERV E SY S T EM

Dodd-Frank Act Stress Test 2015:Supervisory Stress Test Methodology
and Results
March 2015
BOARD OF GOVERNOR S O F THE F EDERAL R E S ERV E SY S T EM

This and other Federal Reserve Board reports and publications are available online at
www.federalreserve.gov/publications/default.htm.
To order copies of Federal Reserve Board publications offered in print,
see the Board’s Publication Order Form (www.federalreserve.gov/pubs/orderform.pdf)
or contact:
Publications Fulfillment
Mail Stop N-127
Board of Governors of the Federal Reserve System
Washington, DC 20551
(ph) 202-452-3245
(fax) 202-728-5886
(e-mail) [email protected]
Errata
The Federal Reserve revised this paper on March 11, 2015, to reflect corrected data received from four bank
holding companies after the original publication of this paper on March 5, 2015. The corrections relate to risk-
weighted assets for the third quarter of 2014, which impacted the calculation of their starting tier 1 common
capital ratios and by extension their post-stress minimum and ending tier 1 common capital ratios in the
severely adverse and adverse scenarios. No other capital ratios are affected by the corrected data. The revisions
are listed below.
On p. 2, under Executive Summary, the latter portion of the penultimate sentence has been revised from
“…before rising to 11.6 percent in the fourth quarter of 2016” to “…before rising to 11.7 percent in the fourth
quarter of 2016.”
On p. 20, under Table 2:
• Tier 1 common ratio (%), Stressed capital ratios, Minimum has been revised from 8.2 to 8.3.
• Risk-weighted assets (billions of dollars), Projected 2016:Q4, General approach has been revised from
9,141.2 to 9,103.4.
On p. 21, under Table 3:
• American Express Company, Tier 1 common ratio (%), Ending has been revised from 15.4 to 15.5.
• American Express Company, Tier 1 common ratio (%), Minimum has been revised from 12.5 to 12.6.
• The Goldman Sachs Group, Inc., Tier 1 common ratio (%), Actual has been revised from 14.4 to 15.2.
• The Goldman Sachs Group, Inc., Tier 1 common ratio (%), Ending has been revised from 9.3 to 9.9.
• The Goldman Sachs Group, Inc., Tier 1 common ratio (%), Minimum has been revised from 6.3 to 6.7.
• State Street Corporation, Tier 1 common ratio (%), Actual has been revised from 13.7 to 13.9.
• State Street Corporation, Tier 1 common ratio (%), Ending has been revised from 14.1 to 14.3.
• State Street Corporation, Tier 1 common ratio (%), Minimum has been revised from 11.8 to 12.0.
• Wells Fargo & Company, Tier 1 common ratio (%), Ending has been revised from 7.5 to 7.6.
• Wells Fargo & Company, Tier 1 common ratio (%), Minimum has been revised from 7.5 to 7.6.
• 31 participating bank holding companies, Tier 1 common ratio (%), Minimum has been revised from
8.2 to 8.3.
On p. 29, under “Stressed Capital Ratios and Risk-Weighted Assets,” the latter portion of the second sentence
has been revised from “…and to be 0.3 percentage points lower at the end of the planning horizon” to “…and
to be 0.2 percentage points lower at the end of the planning horizon.”
On p. 31, under Table 7:
• Tier 1 common ratio (%), Stressed capital ratios, Ending has been revised from 11.6 to 11.7.
• Risk-weighted assets (billions of dollars), Projected 2016:Q4, General approach has been revised from
9,468.8 to 9,430.4.
On p. 32, under Table 8:
• American Express Company, Tier 1 common ratio (%), Ending has been revised from 17.4 to 17.5.
• The Goldman Sachs Group, Inc., Tier 1 common ratio (%), Actual has been revised from 14.4 to 15.2.
• The Goldman Sachs Group, Inc., Tier 1 common ratio (%), Ending has been revised from 13.8 to 14.5.
iii
• The Goldman Sachs Group, Inc., Tier 1 common ratio (%), Minimum has been revised from 12.2 to 12.9.
• State Street Corporation, Tier 1 common ratio (%), Actual has been revised from 13.7 to 13.9.
• State Street Corporation, Tier 1 common ratio (%), Ending has been revised from 17.3 to 17.5.
• State Street Corporation, Tier 1 common ratio (%), Minimum has been revised from 12.7 to 12.8.
• Wells Fargo & Company, Tier 1 common ratio (%), Ending has been revised from 9.9 to 10.0.
• Wells Fargo & Company, Tier 1 common ratio (%), Minimum has been revised from 9.7 to 9.8.
• 31 participating bank holding companies, Tier 1 common ratio (%), Ending has been revised from 11.6 to
11.7.
On p. 68, under Table C.2.A.:
• Tier 1 common ratio (%), Stressed capital ratios, Ending has been revised from 15.4 to 15.5.
• Tier 1 common ratio (%), Stressed capital ratios, Minimum has been revised from 12.5 to 12.6.
• Risk-weighted assets (billions of dollars), Projected 2016:Q4, General approach has been revised from
133.2 to 132.6.
On p. 69, under Table C.2.B.:
• Tier 1 common ratio (%), Stressed capital ratios, Ending has been revised from 17.4 to 17.5.
• Risk-weighted assets (billions of dollars), Projected 2016:Q4, General approach has been revised from
138.0 to 137.4.
On p. 94, under Table C.15.A.:
• Tier 1 common ratio (%), Stressed capital ratios, Actual has been revised from 14.4 to 15.2.
• Tier 1 common ratio (%), Stressed capital ratios, Ending has been revised from 9.3 to 9.9.
• Tier 1 common ratio (%), Stressed capital ratios, Minimum has been revised from 6.3 to 6.7.
• Risk-weighted assets (billions of dollars), Projected 2016:Q4, General approach has been revised from
489.4 to 463.8.
On p. 95, under Table C.15.B.:
• Tier 1 common ratio (%), Stressed capital ratios, Actual has been revised from 14.4 to 15.2.
• Tier 1 common ratio (%), Stressed capital ratios, Ending has been revised from 13.8 to 14.5.
• Tier 1 common ratio (%), Stressed capital ratios, Minimum has been revised from 12.2 to 12.9.
• Risk-weighted assets (billions of dollars), Projected 2016:Q4, General approach has been revised from
496.0 to 470.0.
On p. 118, under Table C.27.A.:
• Tier 1 common ratio (%), Stressed capital ratios, Actual has been revised from 13.7 to 13.9.
• Tier 1 common ratio (%), Stressed capital ratios, Ending has been revised from 14.1 to 14.3.
• Tier 1 common ratio (%), Stressed capital ratios, Minimum has been revised from 11.8 to 12.0.
• Risk-weighted assets (billions of dollars), Projected 2016:Q4, General approach has been revised from 96.4 to
95.2.
On p. 119, under Table C.27.B.:
• Tier 1 common ratio (%), Stressed capital ratios, Actual has been revised from 13.7 to 13.9.
iv
• Tier 1 common ratio (%), Stressed capital ratios, Ending has been revised from 17.3 to 17.5.
• Tier 1 common ratio (%), Stressed capital ratios, Minimum has been revised from 12.7 to 12.8.
• Risk-weighted assets (billions of dollars), Projected 2016:Q4, General approach has been revised from
100.4 to 99.2.
On p. 124, under Table C.30.A.:
• Tier 1 common ratio (%), Stressed capital ratios, Ending has been revised from 7.5 to 7.6.
• Tier 1 common ratio (%), Stressed capital ratios, Minimum has been revised from 7.5 to 7.6.
• Risk-weighted assets (billions of dollars), Projected 2016:Q4, General approach has been revised from
1,265.8 to 1,255.4.
On p. 125, under Table C.30.B.:
• Tier 1 common ratio (%), Stressed capital ratios, Ending has been revised from 9.9 to 10.0.
• Tier 1 common ratio (%), Stressed capital ratios, Minimum has been revised from 9.7 to 9.8.
• Risk-weighted assets (billions of dollars), Projected 2016:Q4, General approach has been revised from
1,319.2 to 1,308.6.
The revisions to the tier 1 common ratios listed above are also reflected in figures 10 and 15, which are on pages
23 and 34, respectively.
v

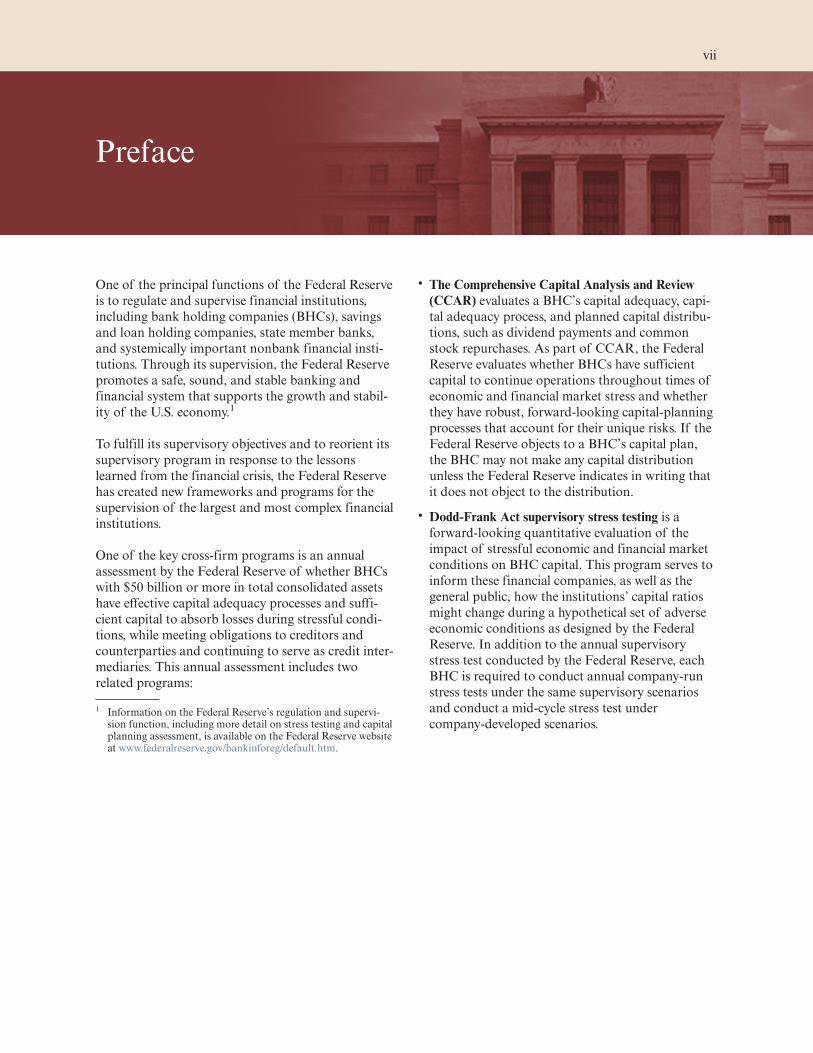
Preface
One of the principal functions of the Federal Reserve
is to regulate and supervise financial institutions,
including bank holding companies (BHCs), savings
and loan holding companies, state member banks,
and systemically important nonbank financial insti-
tutions. Through its supervision, the Federal Reserve
promotes a safe, sound, and stable banking and
financial system that supports the growth and stabil-
ity of the U.S. economy.1
To fulfill its supervisory objectives and to reorient its
supervisory program in response to the lessons
learned from the financial crisis, the Federal Reserve
has created new frameworks and programs for the
supervision of the largest and most complex financial
institutions.
One of the key cross-firm programs is an annual
assessment by the Federal Reserve of whether BHCs
with $50 billion or more in total consolidated assets
have effective capital adequacy processes and suffi-
cient capital to absorb losses during stressful condi-
tions, while meeting obligations to creditors and
counterparties and continuing to serve as credit inter-
mediaries. This annual assessment includes two
related programs:
• The Comprehensive Capital Analysis and Review
(CCAR) evaluates a BHC’s capital adequacy, capi-
tal adequacy process, and planned capital distribu-
tions, such as dividend payments and common
stock repurchases. As part of CCAR, the Federal
Reserve evaluates whether BHCs have sufficient
capital to continue operations throughout times of
economic and financial market stress and whether
they have robust, forward-looking capital-planning
processes that account for their unique risks. If the
Federal Reserve objects to a BHC’s capital plan,
the BHC may not make any capital distribution
unless the Federal Reserve indicates in writing that
it does not object to the distribution.
• Dodd-Frank Act supervisory stress testing is a
forward-looking quantitative evaluation of the
impact of stressful economic and financial market
conditions on BHC capital. This program serves to
inform these financial companies, as well as the
general public, how the institutions’ capital ratios
might change during a hypothetical set of adverse
economic conditions as designed by the Federal
Reserve. In addition to the annual supervisory
stress test conducted by the Federal Reserve, each
BHC is required to conduct annual company-run
stress tests under the same supervisory scenarios
and conduct a mid-cycle stress test under
company-developed scenarios.
1 Information on the Federal Reserve’s regulation and supervi-sion function, including more detail on stress testing and capitalplanning assessment, is available on the Federal Reserve websiteat www.federalreserve.gov/bankinforeg/default.htm.
vii

Executive Summary ................................................................................................................. 1
Background on Dodd-Frank Act Stress Testing ........................................................... 3
Supervisory Scenarios ............................................................................................................ 5
Severely Adverse Scenario .......................................................................................................... 5
Adverse Scenario ....................................................................................................................... 7
Global Market Shock and Counterparty Default Components ........................................................ 8
Supervisory Stress Test Framework and Model Methodology ................................ 9
Analytical Framework .................................................................................................................. 9
Modeling Approach ................................................................................................................... 10
Model Methodology and Validation ............................................................................................ 11
Data Inputs ............................................................................................................................... 14
Capital Action Assumptions and Regulatory Capital Ratios ......................................................... 14
Supervisory Stress Test Results ......................................................................................... 17
Severely Adverse Scenario ........................................................................................................ 17
Adverse Scenario ...................................................................................................................... 29
Appendix A: Supervisory Scenarios ................................................................................ 41
Data Notes ............................................................................................................................... 48
Appendix B: Models to Project Net Income and Stressed Capital ........................ 51Losses on the Accrual Loan Portfolio ......................................................................................... 51
Loan-Loss Provisions for the Accrual Loan Portfolio ................................................................... 56
Other Losses ............................................................................................................................ 56
Pre-provision Net Revenue ........................................................................................................ 61
Balance Sheet Items and Risk-Weighted Assets ......................................................................... 62
Equity Capital and Regulatory Capital ........................................................................................ 63
Appendix C: BHC-Specific Results ................................................................................. 65
Appendix D: Additional Aggregate Results ................................................................ 129
ix
Contents

Executive Summary
The Dodd-Frank Wall Street Reform and Consumer
Protection Act (Dodd-Frank Act) requires the Fed-
eral Reserve to conduct an annual stress test of BHCs
with $50 billion or more in total consolidated assets
and all nonbank financial companies designated by
the Financial Stability Oversight Council (FSOC) for
Federal Reserve supervision. The Board adopted
rules implementing this requirement in October 2012.
For this year’s stress test cycle (DFAST 2015), the
Federal Reserve conducted supervisory stress tests of
31 BHCs.
This report provides
• background on Dodd-Frank Act stress testing;
• details of the adverse and severely adverse supervi-
sory scenarios used in DFAST 2015;
• an overview of the analytical framework and meth-
ods used to generate the Federal Reserve’s projec-
tions, highlighting notable changes from last year’s
program; and
• the results of the supervisory stress tests under
adverse and severely adverse scenarios for the
BHCs that participated in the DFAST 2015 pro-
gram, presented both in the aggregate and for indi-
vidual institutions.
The adverse and severely adverse supervisory sce-
narios used in DFAST 2015 feature U.S. and global
recessions. In particular, the severely adverse scenario
is characterized by a substantial global weakening in
economic activity, including a severe recession in the
United States, large reductions in asset prices, signifi-
cant widening of corporate bond spreads, and a
sharp increase in equity market volatility. The
adverse scenario is characterized by a global weaken-
ing in economic activity and an increase in U.S. infla-
tionary pressures that, overall, result in a rapid
increase in both short- and long-term U.S. Treasury
rates.
In conducting its supervisory stress tests, the Federal
Reserve calculated its projections of a BHC’s balance
sheet, risk-weighted assets (RWAs), net income, and
resulting regulatory capital ratios under these sce-
narios using data provided by the BHCs and a set of
models developed or selected by the Federal Reserve.
As compared to DFAST 2014, the Federal Reserve
enhanced some of the supervisory models to incor-
porate more detailed data. These changes are high-
lighted in box 1. Specific descriptions of the supervi-
sory models and related assumptions can be found in
appendix B.
The results of the DFAST 2015 projections suggest
that, in the aggregate, the 31 BHCs would experience
substantial losses under both the adverse and the
severely adverse scenarios.
Over the nine quarters of the planning horizon,
losses at the 31 BHCs under the severely adverse sce-
nario are projected to be $490 billion. This includes
losses across loan portfolios, losses from credit
impairment on securities held in the BHCs’ invest-
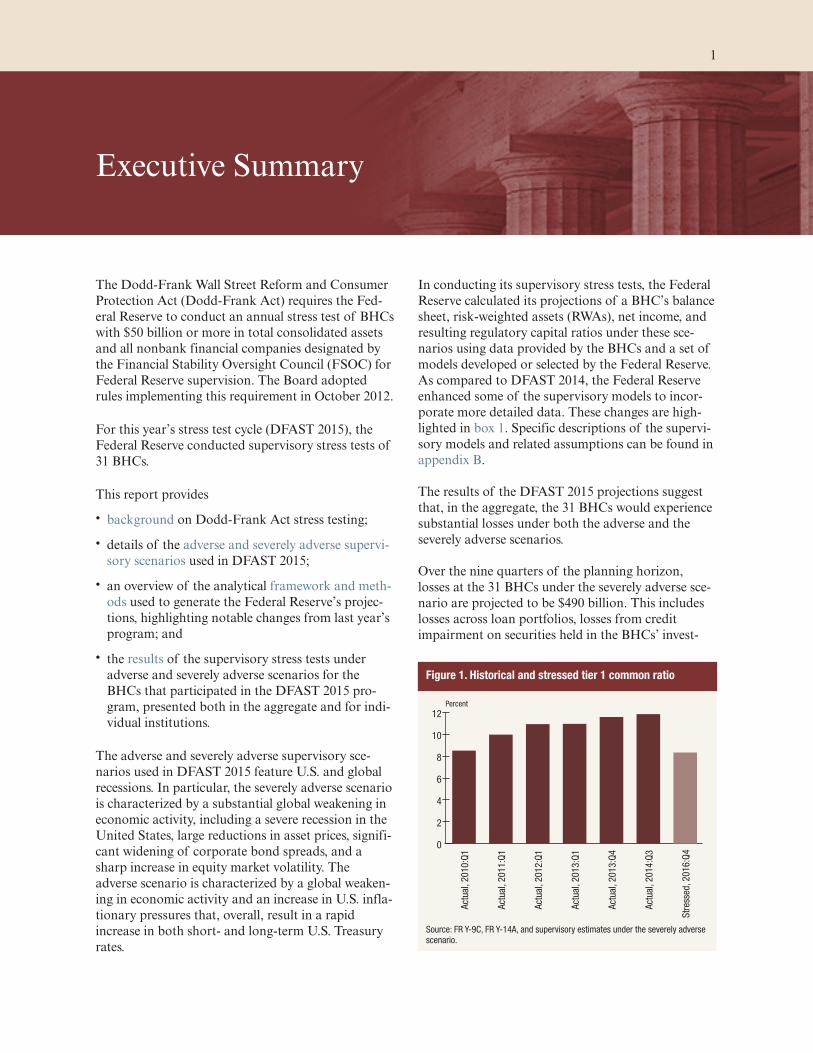
Figure 1. Historical and stressed tier 1 common ratio
Percent
0
2
4
6
8
10
12
Str
esse
d, 2
01
6:Q
4
Act
ual
, 20
14
:Q3
Act
ual
, 20
13
:Q4
Act
ual
, 20
13
:Q1
Act
ual
, 20
12
:Q1
Act
ual
, 20
11
:Q1
Act
ual
, 20
10
:Q1
Source: FR Y-9C, FR Y-14A, and supervisory estimates under the severely adversescenario.
1

ment portfolios, trading and counterparty credit
losses from a global market shock, and other losses.
Projected net revenue before provisions for loan and
lease losses (pre-provision net revenue, or PPNR) is
$310 billion, and net income before taxes is projected
to be –$222 billion.
As illustrated in figure 1, in the severely adverse sce-
nario, the aggregate tier 1 common capital ratio
would fall from an actual 11.9 percent in the third
quarter of 2014 to a post-stress level of 8.4 percent in
the fourth quarter of 2016.
In the adverse scenario, projected losses, PPNR, and
net income before taxes are $314 billion, $501 billion,
and $178 billion, respectively. The aggregate tier 1
common capital ratio under the adverse scenario
would fall 110 basis points to its minimum over the
planning horizon of 10.8 percent before rising to
11.7 percent in the fourth quarter of 2016.
Details of the results are provided in the Supervisory
Stress Test Results section of this report.
2 Supervisory Stress Test Methodology and Results
Background on Dodd-Frank Act StressTesting
In the wake of the recent financial crisis, Congress
enacted the Dodd-Frank Act.2 Under the Dodd-
Frank Act, the Federal Reserve is required to con-
duct an annual stress test of BHCs with total consoli-
dated assets of $50 billion or more as well as non-
bank financial companies designated by the FSOC
for supervision by the Board (supervisory stress
test).3
The Dodd-Frank Act also requires each of these “cov-
ered” companies to conduct its own stress tests and
report its results to the Federal Reserve twice a year
(company-run stress test).4 The Federal Reserve first
adopted rules implementing these requirements in
October 2012 and most recently modified these rules
in October 2014.5
In conducting the supervisory stress tests, the Federal
Reserve projects balance sheet, RWAs, net income, and
resulting post-stress capital levels and regulatory capi-
tal ratios over a nine-quarter “planning horizon,” gen-
erally using a set of capital action assumptions pre-
scribed in the Dodd-Frank Act stress test rules (see
Capital Action Assumptions and Regulatory Capital
Ratios). The projections are based on three supervi-
sory macroeconomic scenarios required by the
Dodd-Frank Act (baseline, adverse, and severely
adverse) and created annually by the Federal Reserve.
For the “annual” company-run stress test, the BHCs
use the same planning horizon, capital action
assumptions, and scenarios6 as those used in the
supervisory stress test.7 The use of common capital
action assumptions and scenarios enhances the com-
parability of the supervisory and company-run
results. The results of the company-run stress test
must be submitted to the Federal Reserve. In addi-
tion, covered companies must also conduct a “mid-
cycle” test and report the results to the Federal
Reserve.
Together, the Dodd-Frank Act supervisory stress
tests and the company-run stress tests are intended to
provide company management and boards of direc-
tors, the public, and supervisors with forward-
looking information to help gauge the potential effect
of stressful conditions on the ability of these large
banking organizations to absorb losses, while meet-
ing obligations to creditors and other counterparties,
and continuing to serve as credit intermediaries. To
ensure this information is readily available, the Dodd-
Frank Act requires each BHC to disclose a summary
of its company-run stress test results and also
requires the Federal Reserve to disclose a summary
of its supervisory stress test results.8
2 See 12 USC 5365(i)(1).3 The 31 BHCs that participated in the 2015 Dodd-Frank Act
supervisory stress test are Ally Financial Inc.; AmericanExpress Company; Bank of America Corporation; The Bank ofNew York Mellon Corporation; BB&T Corporation; BBVACompass Bancshares, Inc.; BMO Financial Corp.; Capital OneFinancial Corporation; Citigroup, Inc.; Citizens FinancialGroup, Inc.; Comerica Incorporated; Deutsche Bank TrustCorporation; Discover Financial Services; Fifth Third Bancorp;The Goldman Sachs Group, Inc.; HSBC North America Hold-ings Inc.; Huntington Bancshares Inc.; JPMorgan Chase & Co.;Keycorp; M&T Bank Corporation; Morgan Stanley; MUFGAmericas Holdings Corporation; Northern Trust Corp.; ThePNC Financial Services Group, Inc.; Regions Financial Corpo-ration; Santander Holdings USA, Inc.; State Street Corpora-tion; SunTrust Banks, Inc.; U.S. Bancorp; Wells Fargo & Com-pany; and Zions Bancorporation.
4 Under the Dodd-Frank Act, all financial companies with morethan $10 billion in total consolidated assets that are supervisedby a primary federal financial regulatory agency are required toconduct an annual company-run stress test. However, only thecovered companies are subject to the additional mid-cycle stresstest and the supervisory stress test.
5 12 CFR part 252, subparts E and F; see 77 FR 62378 (Octo-ber 12, 2012); 79 FR 64026 (October 27, 2014); 79 FR 13498(March 11, 2014); and 79 FR 64026 (October 27, 2014).
6 Under the stress test rules, the Federal Reserve was required toprovide the scenarios to companies no later than November 15,2014, for DFAST 2015. See 12 CFR 252.54(b)(1).
7 12 CFR 252.156(b).8 12 USC 5365(i)(1)(B)(v).
3

Supervisory Scenarios
On October 23, 2014, the Federal Reserve released
the three supervisory scenarios: baseline, adverse, and
severely adverse.9 This section describes the adverse
and severely adverse scenarios that were used for the
projections contained in this report. These scenarios
were developed using the approach described in the
Board’s Policy Statement on the Scenario Design
Framework for Stress Testing.10 The adverse and
severely adverse scenarios are not forecasts but rather
hypothetical scenarios designed to assess the strength
of banking organizations and their resilience to an
unfavorable economic environment.
Supervisory scenarios include trajectories for 28 vari-
ables. These include 16 variables that capture eco-
nomic activity, asset prices, and interest rates in the
U.S. economy and financial markets and three vari-
ables (real gross domestic product (GDP) growth,
inflation, and the U.S./foreign currency exchange
rate) in each of the four countries/country blocs.
Similar to last year, the Federal Reserve applied a
global market shock to the trading portfolio of six
BHCs with large trading and private equity expo-
sures, and a counterparty default scenario compo-
nent to eight BHCs with substantial trading, process-
ing, or custodial operations (see Global Market
Shock and Counterparty Default Components).
Severely Adverse Scenario
Figures 2 through 7 illustrate the hypothetical trajec-
tories for some of the key variables describing U.S.
economic activity and asset prices as well as global
economic growth under the severely adverse scenario.
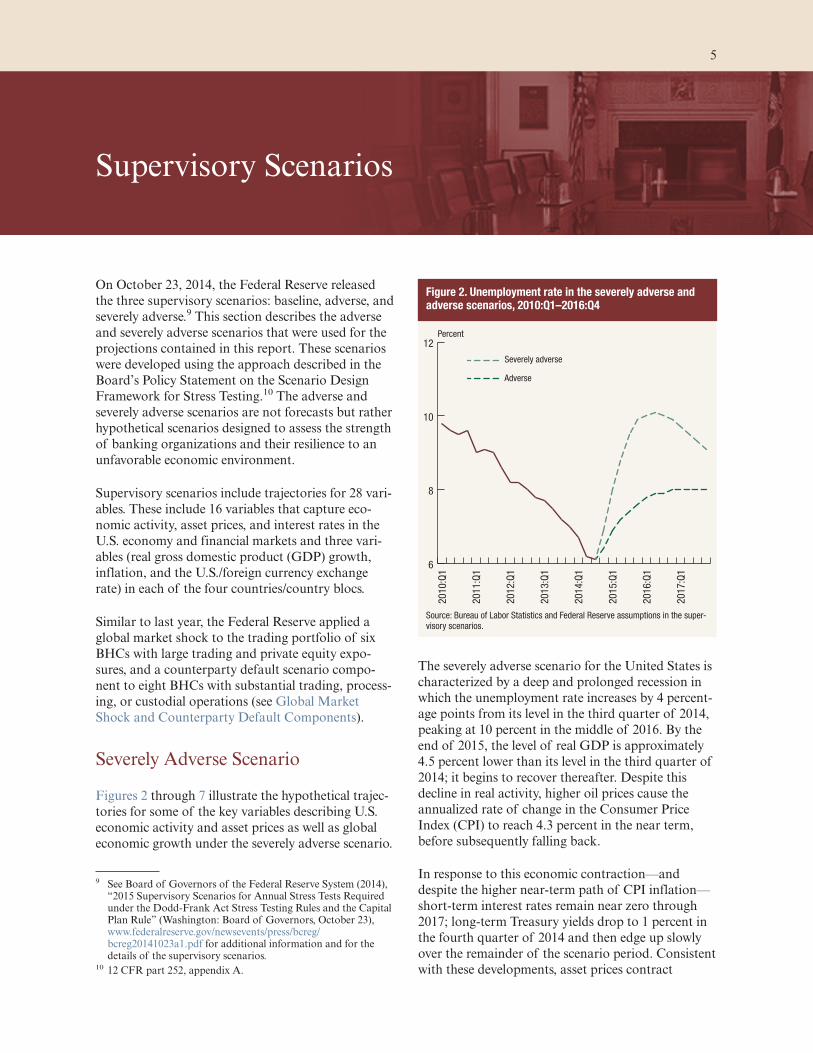
The severely adverse scenario for the United States is
characterized by a deep and prolonged recession in
which the unemployment rate increases by 4 percent-
age points from its level in the third quarter of 2014,
peaking at 10 percent in the middle of 2016. By the
end of 2015, the level of real GDP is approximately
4.5 percent lower than its level in the third quarter of
2014; it begins to recover thereafter. Despite this
decline in real activity, higher oil prices cause the
annualized rate of change in the Consumer Price
Index (CPI) to reach 4.3 percent in the near term,
before subsequently falling back.
In response to this economic contraction—and
despite the higher near-term path of CPI inflation—
short-term interest rates remain near zero through
2017; long-term Treasury yields drop to 1 percent in
the fourth quarter of 2014 and then edge up slowly
over the remainder of the scenario period. Consistent
with these developments, asset prices contract
9 See Board of Governors of the Federal Reserve System (2014),“2015 Supervisory Scenarios for Annual Stress Tests Requiredunder the Dodd-Frank Act Stress Testing Rules and the CapitalPlan Rule” (Washington: Board of Governors, October 23),www.federalreserve.gov/newsevents/press/bcreg/bcreg20141023a1.pdf for additional information and for thedetails of the supervisory scenarios.
10 12 CFR part 252, appendix A.
Figure 2. Unemployment rate in the severely adverse andadverse scenarios, 2010:Q1–2016:Q4
Severely adverse
Adverse
6
8
10
12
2017
:Q1
2016
:Q1
2015
:Q1
2014
:Q1
2013
:Q1
2012
:Q1
2011
:Q1
2010:Q
1
Percent
Source: Bureau of Labor Statistics and Federal Reserve assumptions in the super-visory scenarios.
5
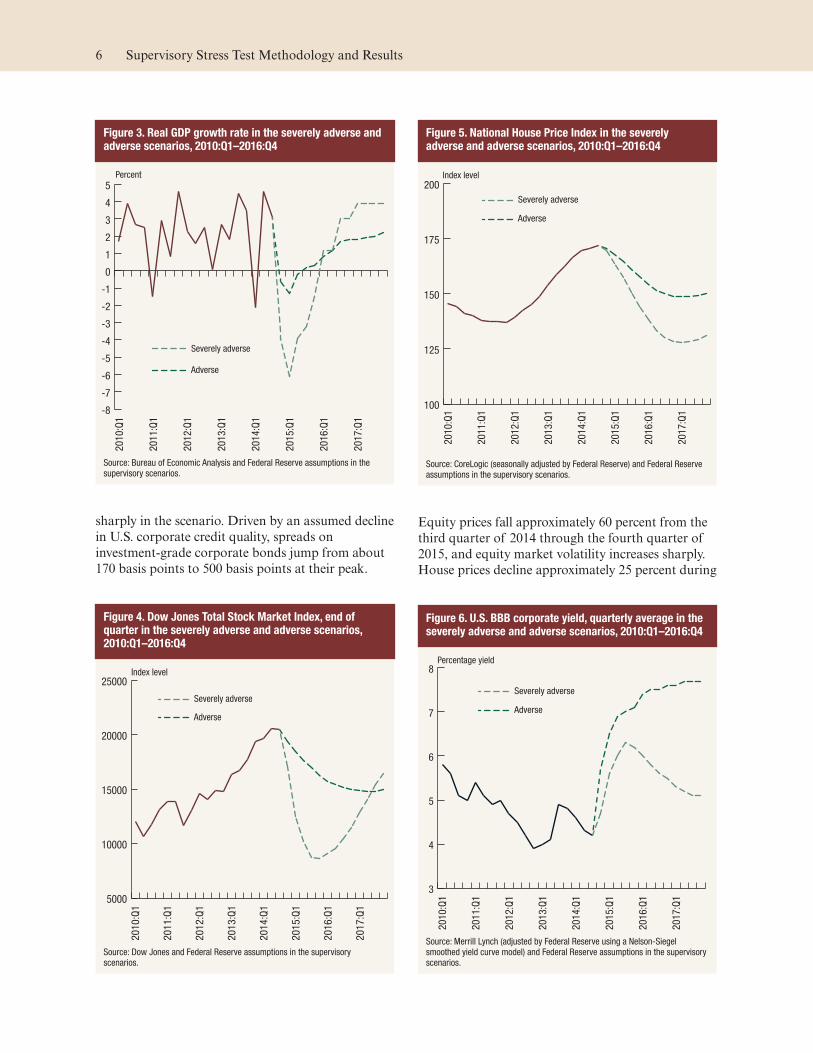
sharply in the scenario. Driven by an assumed decline
in U.S. corporate credit quality, spreads on
investment-grade corporate bonds jump from about
170 basis points to 500 basis points at their peak.
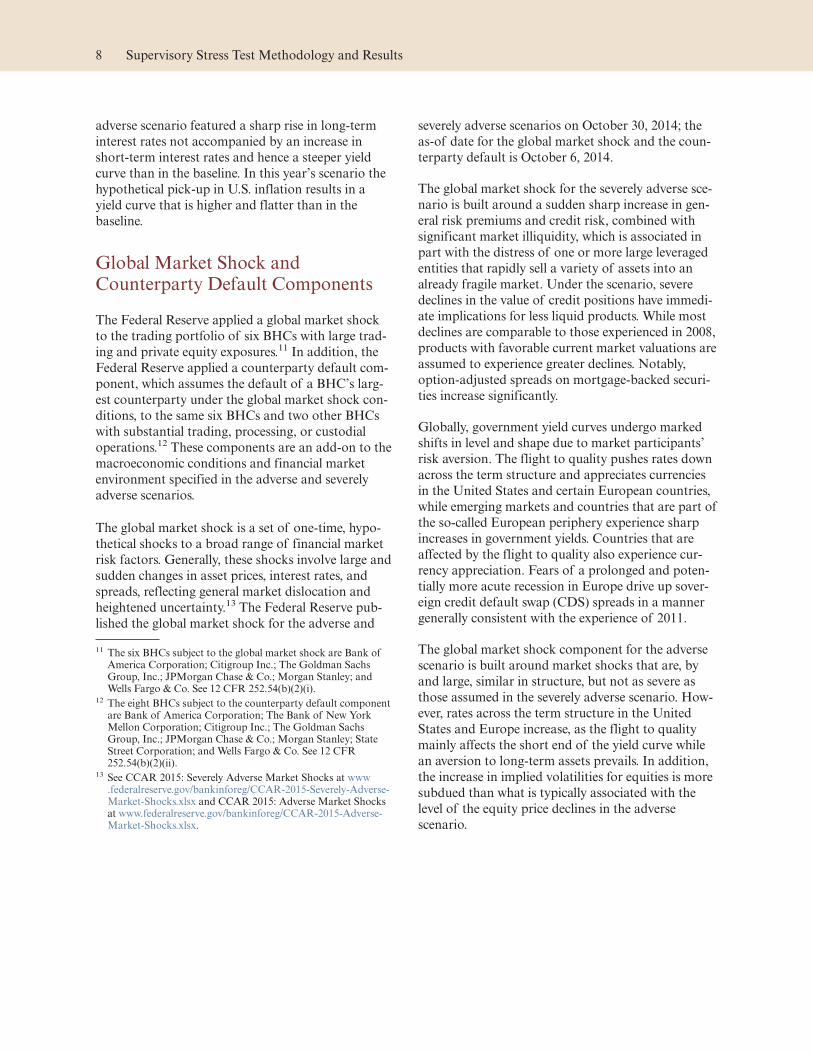
Equity prices fall approximately 60 percent from the
third quarter of 2014 through the fourth quarter of
2015, and equity market volatility increases sharply.
House prices decline approximately 25 percent during
Figure 3. Real GDP growth rate in the severely adverse andadverse scenarios, 2010:Q1–2016:Q4
Severely adverse
Adverse
-8
-7
-6
-5
-4
-3
-2
-1
0
1
2
3
4
5
2017:Q
1
2016:Q
1
2015:Q
1
2014:Q
1
2013:Q
1
2012:Q
1
2011:Q
1
2010:Q
1
Percent
Source: Bureau of Economic Analysis and Federal Reserve assumptions in thesupervisory scenarios.
Figure 4. Dow Jones Total Stock Market Index, end ofquarter in the severely adverse and adverse scenarios,2010:Q1–2016:Q4
Severely adverse
Adverse
5000
10000
15000
20000
25000
20
17
:Q1
20
16
:Q1
20
15
:Q1
20
14
:Q1
20
13
:Q1
20
12
:Q1
20
11
:Q1
20
10
:Q1
Index level
Source: Dow Jones and Federal Reserve assumptions in the supervisoryscenarios.
Figure 5. National House Price Index in the severelyadverse and adverse scenarios, 2010:Q1–2016:Q4
Severely adverse
Adverse
100
125
150
175
200
2017:Q
1
2016
:Q1
2015
:Q1
2014
:Q1
2013
:Q1
2012:Q
1
2011:Q
1
2010:Q
1
Index level
Source: CoreLogic (seasonally adjusted by Federal Reserve) and Federal Reserveassumptions in the supervisory scenarios.
Figure 6. U.S. BBB corporate yield, quarterly average in theseverely adverse and adverse scenarios, 2010:Q1–2016:Q4
3
4
5
6
7
82017:Q
1
2016:Q
1
2015:Q
1
2014:Q
1
2013:Q
1
2012:Q
1
2011:Q
1
2010:Q
1
Severely adverse
Adverse
Percentage yield
Source: Merrill Lynch (adjusted by Federal Reserve using a Nelson-Siegelsmoothed yield curve model) and Federal Reserve assumptions in the supervisoryscenarios.
6 Supervisory Stress Test Methodology and Results
the scenario period relative to their level in the third
quarter of 2014.
The international component of the severely adverse
scenario features severe recessions in the euro area,
the United Kingdom, and Japan, and below-trend
growth in developing Asia. For economies that are
heavily dependent on imported oil—including devel-
oping Asia, Japan, and the euro area—this economic
weakness is exacerbated by the rise in oil prices fea-
tured in this scenario. Reflecting flight-to-safety capi-
tal flows associated with the scenario’s global reces-
sion, the U.S. dollar is assumed to appreciate strongly
against the euro and the currencies of developing
Asia and to appreciate more modestly against the
pound sterling. The dollar is assumed to depreciate
modestly against the yen, also reflecting flight-to-
safety capital flows.
This year’s severely adverse scenario is similar to the
2014 severely adverse scenario. However, corporate
credit quality is assumed to worsen even more than
would be expected in a severe recession, resulting in a
greater widening in corporate bond spreads, decline
in equity prices, and increase in equity market volatil-
ity than in the 2014 severely adverse scenario.
Adverse Scenario
Figures 2 through 7 illustrate the hypothetical trajec-
tories for some of the key variables describing U.S.
economic activity and asset prices as well as global
economic growth under the adverse scenario. The
United States experiences a mild recession that
begins in the fourth quarter of 2014 and lasts
through the second quarter of 2015. During this
period, the level of real GDP falls approximately
0.5 percent relative to its level in the third quarter of
2014, and the unemployment rate increases to just
over 7 percent. At the same time, the U.S. economy
experiences a considerable rise in core inflation that
results in a headline CPI inflation rate of 4 percent
by the third quarter of 2015; headline inflation
remains elevated thereafter. Short-term interest rates
rise quickly as a result, reaching a little over 2.5 per-
cent by the end of 2015 and 5.3 percent by the end of
2017. Longer-term Treasury yields increase by less.
The recovery that begins in the second half of 2015 is
quite sluggish, and the unemployment rate continues
to increase, reaching 8 percent in the fourth quarter
of 2016, and flattens thereafter. Equity prices fall
both during and after the recession and by the end of
the scenario are about 25 percent lower than in the
third quarter of 2014. House prices and commercial
real estate prices decline by approximately 13 and
16 percent, respectively, relative to their level in the
third quarter of 2014.
Outside the United States, the adverse scenario fea-
tures recessions in the euro area, the United King-
dom, and Japan and below-trend growth in develop-
ing Asia. This weakness in economic activity results
in a period of deflation for some countries or coun-
try blocks. The exchange value of the dollar is little
changed vis-à-vis the euro, the pound sterling, and
the currencies of developing Asia. The dollar is
assumed to depreciate against the yen, reflecting
flight-to-safety capital flows.
This year’s adverse scenario is qualitatively different
from the 2014 adverse scenario. The main difference
lies in the evolution of Treasury yields. The 2014
Figure 7. U.S. Market Volatility Index (VIX) in the severelyadverse and adverse scenarios, 2010:Q1–2016:Q4
10
20
30
40
50
60
70
80
2017:Q
1
2016:Q
1
2015
:Q1
2014
:Q1
2013
:Q1
2012:Q
1
2011:Q
1
2010:Q
1
Severely adverse
Adverse
Index level
Source: Chicago Board Options Exchange (converted to quarterly by FederalReserve using the maximum quarterly close-of-day value) and Federal Reserveassumptions in the supervisory scenarios.
March 2015 7
adverse scenario featured a sharp rise in long-term
interest rates not accompanied by an increase in
short-term interest rates and hence a steeper yield
curve than in the baseline. In this year’s scenario the
hypothetical pick-up in U.S. inflation results in a
yield curve that is higher and flatter than in the
baseline.
Global Market Shock andCounterparty Default Components
The Federal Reserve applied a global market shock
to the trading portfolio of six BHCs with large trad-
ing and private equity exposures.11 In addition, the
Federal Reserve applied a counterparty default com-
ponent, which assumes the default of a BHC’s larg-
est counterparty under the global market shock con-
ditions, to the same six BHCs and two other BHCs
with substantial trading, processing, or custodial
operations.12 These components are an add-on to the
macroeconomic conditions and financial market
environment specified in the adverse and severely
adverse scenarios.
The global market shock is a set of one-time, hypo-
thetical shocks to a broad range of financial market
risk factors. Generally, these shocks involve large and
sudden changes in asset prices, interest rates, and
spreads, reflecting general market dislocation and
heightened uncertainty.13 The Federal Reserve pub-
lished the global market shock for the adverse and
severely adverse scenarios on October 30, 2014; the
as-of date for the global market shock and the coun-
terparty default is October 6, 2014.
The global market shock for the severely adverse sce-
nario is built around a sudden sharp increase in gen-
eral risk premiums and credit risk, combined with
significant market illiquidity, which is associated in
part with the distress of one or more large leveraged
entities that rapidly sell a variety of assets into an
already fragile market. Under the scenario, severe
declines in the value of credit positions have immedi-
ate implications for less liquid products. While most
declines are comparable to those experienced in 2008,
products with favorable current market valuations are
assumed to experience greater declines. Notably,
option-adjusted spreads on mortgage-backed securi-
ties increase significantly.
Globally, government yield curves undergo marked
shifts in level and shape due to market participants’
risk aversion. The flight to quality pushes rates down
across the term structure and appreciates currencies
in the United States and certain European countries,
while emerging markets and countries that are part of
the so-called European periphery experience sharp
increases in government yields. Countries that are
affected by the flight to quality also experience cur-
rency appreciation. Fears of a prolonged and poten-
tially more acute recession in Europe drive up sover-
eign credit default swap (CDS) spreads in a manner
generally consistent with the experience of 2011.
The global market shock component for the adverse
scenario is built around market shocks that are, by
and large, similar in structure, but not as severe as
those assumed in the severely adverse scenario. How-
ever, rates across the term structure in the United
States and Europe increase, as the flight to quality
mainly affects the short end of the yield curve while
an aversion to long-term assets prevails. In addition,
the increase in implied volatilities for equities is more
subdued than what is typically associated with the
level of the equity price declines in the adverse
scenario.
11 The six BHCs subject to the global market shock are Bank ofAmerica Corporation; Citigroup Inc.; The Goldman SachsGroup, Inc.; JPMorgan Chase & Co.; Morgan Stanley; andWells Fargo & Co. See 12 CFR 252.54(b)(2)(i).
12 The eight BHCs subject to the counterparty default componentare Bank of America Corporation; The Bank of New YorkMellon Corporation; Citigroup Inc.; The Goldman SachsGroup, Inc.; JPMorgan Chase & Co.; Morgan Stanley; StateStreet Corporation; and Wells Fargo & Co. See 12 CFR252.54(b)(2)(ii).
13 See CCAR 2015: Severely Adverse Market Shocks at www.federalreserve.gov/bankinforeg/CCAR-2015-Severely-Adverse-Market-Shocks.xlsx and CCAR 2015: Adverse Market Shocksat www.federalreserve.gov/bankinforeg/CCAR-2015-Adverse-Market-Shocks.xlsx.
8 Supervisory Stress Test Methodology and Results
Supervisory Stress Test Framework andModel Methodology
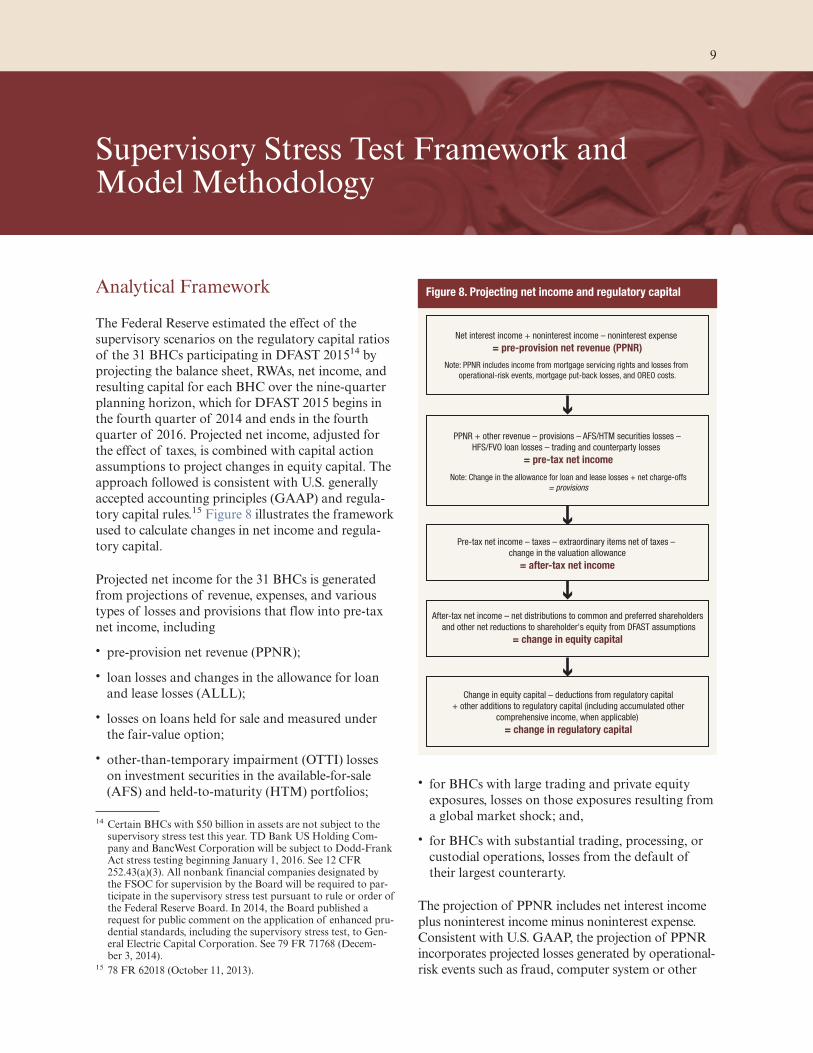
Analytical Framework
The Federal Reserve estimated the effect of the
supervisory scenarios on the regulatory capital ratios
of the 31 BHCs participating in DFAST 201514 by
projecting the balance sheet, RWAs, net income, and
resulting capital for each BHC over the nine-quarter
planning horizon, which for DFAST 2015 begins in
the fourth quarter of 2014 and ends in the fourth
quarter of 2016. Projected net income, adjusted for
the effect of taxes, is combined with capital action
assumptions to project changes in equity capital. The
approach followed is consistent with U.S. generally
accepted accounting principles (GAAP) and regula-
tory capital rules.15 Figure 8 illustrates the framework
used to calculate changes in net income and regula-
tory capital.
Projected net income for the 31 BHCs is generated
from projections of revenue, expenses, and various
types of losses and provisions that flow into pre-tax
net income, including
• pre-provision net revenue (PPNR);
• loan losses and changes in the allowance for loan
and lease losses (ALLL);
• losses on loans held for sale and measured under
the fair-value option;
• other-than-temporary impairment (OTTI) losses
on investment securities in the available-for-sale
(AFS) and held-to-maturity (HTM) portfolios;• for BHCs with large trading and private equity
exposures, losses on those exposures resulting from
a global market shock; and,
• for BHCs with substantial trading, processing, or
custodial operations, losses from the default of
their largest counterarty.
The projection of PPNR includes net interest income
plus noninterest income minus noninterest expense.
Consistent with U.S. GAAP, the projection of PPNR
incorporates projected losses generated by operational-
risk events such as fraud, computer system or other
14 Certain BHCs with $50 billion in assets are not subject to thesupervisory stress test this year. TD Bank US Holding Com-pany and BancWest Corporation will be subject to Dodd-FrankAct stress testing beginning January 1, 2016. See 12 CFR252.43(a)(3). All nonbank financial companies designated bythe FSOC for supervision by the Board will be required to par-ticipate in the supervisory stress test pursuant to rule or order ofthe Federal Reserve Board. In 2014, the Board published arequest for public comment on the application of enhanced pru-dential standards, including the supervisory stress test, to Gen-eral Electric Capital Corporation. See 79 FR 71768 (Decem-ber 3, 2014).
15 78 FR 62018 (October 11, 2013).
Figure 8. Projecting net income and regulatory capital
Net interest income + noninterest income – noninterest expense
= pre-provision net revenue (PPNR)
PPNR + other revenue – provisions – AFS/HTM securities losses –
HFS/FVO loan losses – trading and counterparty losses
= pre-tax net income
Pre-tax net income – taxes – extraordinary items net of taxes –
change in the valuation allowance
= after-tax net income
After-tax net income – net distributions to common and preferred shareholders
and other net reductions to shareholder's equity from DFAST assumptions
= change in equity capital
Change in equity capital – deductions from regulatory capital
+ other additions to regulatory capital (including accumulated other
comprehensive income, when applicable)
= change in regulatory capital
Note: Change in the allowance for loan and lease losses + net charge-offs
= provisions
Note: PPNR includes income from mortgage servicing rights and losses from
operational-risk events, mortgage put-back losses, and OREO costs.
9
operating disruptions, and litigation-related costs;
mortgage repurchase related losses; and expenses
related to the disposition of foreclosed properties
(other real estate owned (OREO) expenses).
Provisions for loan and lease losses equal projected
loan losses for the quarter plus the amount needed
for the ending ALLL to be at an appropriate level to
account for projected future loan losses. The amount
of provisions over and above loan losses may be
negative—representing a drawdown of the ALLL (an
ALLL release, increasing net income)—or positive—
representing a need to build the ALLL (an additional
provision, decreasing net income).
Because the loss projections follow U.S. GAAP and
regulatory guidelines, they incorporate any differences
in the way these guidelines recognize income and losses
based on where assets are held on the BHCs’ balance
sheets. As a result, losses projected for similar or iden-
tical assets held in different portfolios can sometimes
differ. For example, losses on loans held in accrual
portfolio equal credit losses due to failure to pay obli-
gations (cash flow losses resulting in net charge-offs).
For similar loans that are held for sale, projected losses
represent the change in fair value of the underlying
assets in the supervisory scenario.
Following this approach, changes in both the fair
value of AFS securities and OTTI losses on securities
are separately projected over the nine-quarter plan-
ning horizon. Under U.S. GAAP, changes in the fair
value of AFS securities are reflected in changes in
accumulated other comprehensive income (AOCI)
but do not flow through net income. In addition, if a
security becomes OTTI, all or a portion of the differ-
ence between the fair value and amortized cost of the
security must be recognized in earnings.16 Consistent
with U.S. GAAP, OTTI projections incorporate
other-than-temporary differences between book
value and fair value due to credit impairment but
generally do not incorporate differences reflecting
changes in liquidity or market conditions.
For the six BHCs subject to the global market shock,
the losses on trading and private equity positions as
well as the credit valuation adjustment are projected
assuming an instantaneous re-pricing of these posi-
tions under the global market shock (see Global
Market Shock and Counterparty Default Compo-
nents). Losses from the global market shock are
assumed to occur in the first quarter of the planning
horizon. No subsequent recoveries on these positions
are assumed, nor are there offsetting changes such as
reductions in compensation or other expenses in
reaction to the global market shock. In addition,
incremental losses from potential defaults of obligors
underlying BHCs’ trading positions are projected
over the planning horizon.
For the eight BHCs subject to the counterparty
default component, the losses associated with the
instantaneous and unexpected default of the largest
counterparty across derivatives and securities financ-
ing transaction (SFT) activities are projected. These
losses are assumed to occur in the first quarter of the
planning horizon.
Over the planning horizon, the Federal Reserve proj-
ects quarter-end amounts for the components of the
balance sheet. These projections are made under the
assumption that BHCs maintain credit supply at
long-run historical levels. Any new balances implied
by these projections are assumed to have the same
risk characteristics as those held by the BHC at the
start of the planning horizon except for loan age.
Where applicable, new loans are assumed to be cur-
rent, and BHCs are assumed not to originate types of
loans that are no longer allowed under various regu-
lations. The Federal Reserve also incorporates mate-
rial changes in a BHC’s business plan, such as a
planned merger, acquisition, or divestiture.17 Only
divestitures that had been completed or contractually
agreed to prior to January 5, 2015, were incorpo-
rated. Once adjusted, assets are assumed to grow at
the same rate as the pre-adjusted balance sheet.
Modeling Approach
The Federal Reserve’s projections of revenue,
expenses, and various types of losses and provisions
that flow into pre-tax net income are based on data
provided by the 31 BHCs participating in DFAST
2015 and on models developed or selected by Federal
Reserve staff and reviewed by an independent group
of Federal Reserve economists and analysts. The
models are intended to capture how the balance
sheet, RWAs, and net income of each BHC are
affected by the macroeconomic and financial condi-
tions described in the supervisory scenarios, given the
16 A security is considered impaired when the fair value of thesecurity falls below its amortized cost.
17 The inclusion of the effects of such expected changes to aBHC’s business plan does not—and is not intended to—expressa view on the merits of such proposals and is not an approval ornon-objection to such plans.
10 Supervisory Stress Test Methodology and Results
characteristics of the BHCs’ loans and securities
portfolios; trading, private equity, and counterparty
exposures from derivatives and SFTs; business activi-
ties; and other relevant factors.18
Detail of model-specific methodology is provided in
appendix B.
The Federal Reserve’s approach to model design
reflects the desire to produce supervisory stress test
projections that
• are based on the same set of models and assump-
tions across BHCs;
• reflect an independent supervisory perspective;
• are forward-looking and may incorporate out-
comes outside of historical experience; and
• are appropriately conservative and consistent with
the purpose of a stress testing exercise.
With these objectives in mind, the models were devel-
oped using pooled historical data from many financial
institutions and multiple data sources. As a result, the
estimated parameters are the same for all BHCs and
reflect the industrywide, portfolio-specific, and
instrument-specific response to variation in the macro-
economic and financial market variables. This indus-
trywide approach reflects both the challenge in esti-
mating separate, statistically robust models for each of
the 31 BHCs and the desire of the Federal Reserve not
to assume that historical BHC-specific results will pre-
vail in the future. This means that the projections made
by the Federal Reserve will not necessarily match simi-
lar projections made by individual BHCs.
The Federal Reserve deviated from the industrywide
modeling approach only in a very limited number of
cases in which the historical data used to estimate the
model were not sufficiently granular. In these cases,
BHC-specific indicator variables (fixed effects) were
included in the models. Additionally, in some cases,
the projections of certain types of losses use sensitivi-
ties generated by the BHCs from their internal risk-
measurement models.
Model Methodology and Validation
A large majority of the models used for the supervi-
sory stress test were developed by Federal Reserve
analysts and economists, but a few are third-party
models.19 Internally developed models draw on eco-
nomic research and analysis as well as industry prac-
tice in modeling the effect of borrower, instrument,
collateral characteristics, and macroeconomic factors
on revenue, expenses, and losses. The approaches
mostly build on work done by the Federal Reserve in
previous stress tests. In some cases, the models repre-
sent significant refinement and advancement of ear-
lier work, reflecting advances in modeling technique,
richer and more detailed data, and longer histories of
performance in both adverse and more benign eco-
nomic settings (see box 1).
All models are reviewed each year by an independent
model validation team composed of economists and
analysts from across the Federal Reserve System with
a focus on the design, estimation, and implementa-
tion of the models. Model reviewers are primarily
Federal Reserve subject-matter experts who are not
involved in model development and who report to a
different oversight group than model developers.
Additionally, control procedures surrounding the
model design and implementation processes are
reviewed by process control experts.
Loan losses are estimated separately for different cat-
egories of loans, based on the type of obligor (e.g.,
consumer or commercial and industrial), collateral
(e.g., residential real estate, commercial real estate),
loan structure (e.g., revolving credit lines), and
accounting treatment (accrual or fair value). These
categories generally follow the classifications of the
Consolidated Financial Statements for Holding
Companies (FR Y-9C) regulatory report, though
some loss projections are made for more granular
loan categories.20
Two general approaches are taken to model losses on
the accrual loan portfolio. In the first approach, the
models estimate expected losses under the macroeco-
18 In some cases, the loss models estimated the effect of local-levelmacroeconomic data, which were projected based on their his-torical covariance with national variables included in the super-visory scenarios.
19 A list of providers of the proprietary models and data used bythe Federal Reserve in connection with DFAST 2015 is availablein appendix B.
20 The FR Y-9C report template is available on the FederalReserve website at www.federalreserve.gov.
March 2015 11
Box 1. Model Changes for DFAST 2015
Each year, the Federal Reserve has refined ele-
ments of both the substance and process of the
Dodd-Frank supervisory stress tests, including
the continued development and enhancement of
independent supervisory models. Revisions to
the Federal Reserve’s supervisory stress test
models generally reflect advances in modeling
techniques, richer and more detailed data, and
longer histories of performance in both adverse
and benign economic settings. Changes in the
quality of submitted data, portfolio risk charac-
teristics, and the macroeconomic scenario are
major factors that could lead to changes in the
Federal Reserve’s estimates. For example, this
year’s severely adverse scenario features a
greater decline in equity prices, the somewhat
greater widening of the corporate bond spread,
and a sharper increase in equity market volatility
than last year. These scenario features affect
various elements of net income, other compre-
hensive income, and market risk-weighted
assets.
In 2015, the Federal Reserve did not introduce
significant changes to its modeling framework,
and, overall, revisions to most supervisory mod-
els were relatively incremental. Changes to
accrual loan loss models were generally modest
and did not have a large net effect on aggregate
estimates of total loan losses for the 31 partici-
pating BHCs.
The net effect of changes to models for other
losses was somewhat larger, due in part to the
refinement of risk factors used in selected secu-
rities models. In addition, the Federal Reserve
changed two aspects of its methodology for
estimating PPNR.
• Other noninterest income and expense are
now modeled using a simpler approach that is
designed to reduce the volatility of the results
that stems from the historical volatility in the
underlying income and expense items.
• Interest expense on subordinated debt is now
modeled based on instrument-level informa-
tion and reflects an increase in the use of
more detailed data to project PPNR.
Supervisory Capital Model Enhancement
One key enhancement the Federal Reserve has
made this year is in the model it uses to project
regulatory capital and capital ratios (supervisory
capital model), incorporating more detailed data
now available on regulatory reports regarding
the Board’s revised regulatory capital frame-
work. The enhancements were made to better
align the the supervisory capital model projec-
tions with the revised regulatory capital frame-
work and related accounting guidance. The main
enhancements to this model include
• differentiating AOCI items that are not subject
to transition arrangements in the revised regu-
latory capital framework from those that are
subject to transition;
• refining the calculation of future taxable
income used to determine whether a deferred
tax asset will be realizable in the future based
on the type of deferred tax asset; and
• projecting changes in valuation allowances for
net deferred tax assets based on the macro-
economic scenarios, in response to changes
in the treatment of deferred tax assets in the
revised regulatory capital framework.
These enhancements are possible due to data
currently available on regulatory reports that
allow the Federal Reserve to better differentiate
between different types of deferred tax assets
and AOCI. The impact of these enhancements
varies across BHCs depending on the amount of
AOCI items not subject to transition arrange-
ments, projections of future taxable income, and
the composition and amount of projected net
deferred tax assets. The enhancements can
result in higher or lower capital ratios, depending
on the particular combination of such factors.
12 Supervisory Stress Test Methodology and Results
nomic scenario. These models generally involve projec-
tions of the probability of default, loss given default,
and exposure at default for each loan or segment of
loans in the portfolio, given conditions in the scenario.
In the second approach, the models capture the his-
torical behavior of net charge-offs relative to changes
in macroeconomic and financial market variables.
Accrual loan losses are projected using detailed loan
information, including borrower characteristics, col-
lateral characteristics, characteristics of the loans or
credit facilities, amounts outstanding and yet to be
drawn down (for credit lines), payment history, and
current payment status.
Data are collected on individual loans or credit facili-
ties for wholesale loan, domestic retail credit card,
and residential mortgage portfolios. For other
domestic and international retail loans, the data are
collected based on segments of the portfolio (e.g. seg-
ments defined by borrower credit score, geographic
location, and loan-to-value (LTV) ratio).
Losses on retail loans for which a BHC chose the
fair-value option accounting treatment and loans car-
ried at the lower of cost or market value (i.e. loans
held for sale and held for investment) are estimated
over the nine quarters of the planning horizon using
a duration-based approach. Losses on wholesale
loans held for sale or measured under the fair-value
option are estimated by revaluing each loan or com-
mitment each quarter of the planning horizon.
Losses on securities held in the AFS and HTM port-
folios are estimated using models that incorporate
other-than-temporary differences between amortized
cost and fair market value due to credit impairment
but generally do not incorporate differences reflecting
changes in liquidity or market conditions. Some secu-
rities, including U.S. Treasury and U.S. government
agency obligations and U.S. government agency
mortgage-backed securities, are assumed not to be at
risk for the kind of credit impairment that results in
OTTI charges. For securitized obligations, models
estimate delinquency, default, severity, and prepay-
ment on the underlying pool of collateral. OTTI on
direct obligations such as corporate bonds is based
on an assessment of the probability of default or
severe credit deterioration of the security issuer or
group of issuers over the planning horizon. The
models use securities data collected at the individual
security (CUSIP) level, including the amortized cost,
market value, and any OTTI taken on the security to
date.
Losses related to the global market shock and the
counterparty default components are estimated using
BHC-estimated sensitivities to various market factors
of trading positions, private equity, and other fair-
value assets held in the trading book and the revalua-
tions of counterparty exposures and credit valuation
adjustment based on the global market shock. These
estimates are based on BHCs’ internal models and
methodologies and are provided to the Federal
Reserve by the BHCs (see Global Market Shock and
Counterparty Default Components).
PPNR is projected using a series of models that
relate the components of a BHC’s revenues and non-
credit-related expenses, expressed as a share of rel-
evant asset or liability balances, to BHC characteris-
tics and to macroeconomic variables. Most compo-
nents are projected using data on historical revenues
and operating and other non-credit-related expenses
reported on the FR Y-9C report. Separate data are
collected about mortgage loans that were sold or
securitized but expose a BHC to potential put-back
risk and the BHCs’ historical losses related to
operational-risk events, which are modeled separately
from other components of PPNR.
The balance sheet projections are derived using a
common framework for determining the effect of the
scenarios on balance sheet growth, and, as noted,
incorporate assumptions about credit supply that
limit aggregate credit contraction. These sets of pro-
jections are based on historical data from the Federal
Reserve’s national flow of funds accounts, consoli-
dated balance sheet information for each BHC, and
additional data collected by the Federal Reserve.
Once pre-tax net income is determined using the
above components, a consistent tax rate is applied to
calculate after-tax net income.21 After-tax net income
also includes other tax effects, such as changes in the
valuation allowance applied to deferred tax assets,
and BHC-reported information about extraordinary
21 For a discussion of the effect of changing this tax rate assump-tion on the post-stress tier 1 common capital ratio, see box 2 ofBoard of Governors of the Federal Reserve System (2013),“Dodd-Frank Act Stress Test 2013: Supervisory Stress TestMethodology and Results.”
March 2015 13
income items and income attributable to minority
interests.
Data Inputs
The models are developed and executed with data col-
lected by the Federal Reserve on regulatory reports as
well as proprietary third-party industry data.
Certain projections rely on aggregate information
from the Financial Accounts of the United States
(Z.1) statistical release, which is a quarterly publica-
tion by the Federal Reserve of national flow of
funds; balance sheets; and integrated macroeconomic
accounts by sector, such as households and nonfi-
nancial corporate businesses.22 Others rely on the FR
Y-9C report, which contains consolidated income
statement and balance sheet information for each
BHC. Additionally, FR Y-9C includes off-balance
sheet items and other supporting schedules, such as
the components of RWA and regulatory capital.
Most of the data used in the Federal Reserve’s projec-
tions are collected through the Capital Assessments
and Stress Testing (FR Y-14A/Q/M) reports, which
include a set of annual, quarterly, or monthly sched-
ules.23 These reports collect detailed data on PPNR,
loans, securities, trading and counterparty risk, and
losses related to operational-risk events. Each of the 31
BHCs participating in DFAST 2015 submitted data as
of September 30, 2014, through the FR Y-14M and
FR Y-14Q schedules in October and November of
2014 and the FR Y-14A schedules, which also include
projected data, on January 5, 2015.
BHCs were required to submit detailed loan and
securities information for all material portfolios,
where the portfolio is deemed to be “material” if the
size of the portfolio exceeds either 5 percent of the
BHC’s tier 1 capital or $5 billion. The portfolio cat-
egories are defined in the FR Y-14M and Y-14Q
instructions. For portfolios falling below these thresh-
olds, the BHCs had the option to submit or not sub-
mit the detailed data. Portfolios for which the Federal
Reserve did not receive detailed data were assigned a
loss rate equal to a high percentile of the loss rates
projected for BHCs that did submit data for that cat-
egory of loan or security.
While BHCs are responsible for ensuring the com-
pleteness and accuracy of data reported on the FR
Y-14, the Federal Reserve made considerable efforts
to validate BHC-reported data and requested resub-
missions of data where errors were identified. In cer-
tain instances, loans with insufficient or unreliable
data were assigned a loss rate at or near the 90th per-
centile of the loss rates projected for the relevant loan
segment for the BHCs that did provide reliable data.
Where certain data elements were unreported, con-
servative values were assigned (e.g., high LTV values
or low credit scores).24 These assumptions are
intended to reflect a conservative view of the risk
characteristics of the portfolios, given insufficient
information to make more risk-sensitive projections.
Capital Action Assumptions andRegulatory Capital Ratios
After-tax net income and AOCI are combined with
prescribed capital actions to estimate components of
equity capital. Changes in the equity capital compo-
nents are the primary drivers in changes in capital lev-
els and ratios over the planning horizon. In addition to
the equity capital components, the calculation of capi-
tal ratios accounts for taxes and items subject to
adjustment or deduction, limits the recognition of cer-
tain intangible assets, and imposes other restrictions as
specified in the Board’s regulatory capital rules.
The Dodd-Frank Act company-run stress test rules
prescribe consistent capital action assumptions for all
BHCs. In its supervisory stress tests, the Board gener-
ally followed these capital action assumptions. For
the first quarter of the planning horizon, capital
actions for each BHC are assumed to be the actual
actions taken by the BHC during that quarter. Over
the remaining eight quarters, common stock dividend
payments are assumed to be the average of the first
quarter of the planning horizon and the three pre-
ceding calendar quarters. Also, BHCs are assumed to
pay scheduled dividend, interest, or principal pay-
ments on any other capital instrument eligible for
inclusion in the numerator of a regulatory capital
ratio. However, repurchases of such capital instru-
ments and issuance of stock are assumed to be zero,
except for common-stock issuance associated with
22 Financial Accounts of the United States (Z.1) is available at www.federalreserve.gov/releases/z1/.
23 The FR Y-14 schedules are available at www.federalreserve.gov/apps/reportforms/default.aspx.
24 The method of applying conservative assumptions to certainrisk segments was used only in cases in which the data-relatedissues were isolated in such a way that the remainder of theportfolio could be readily modeled using the existing supervi-sory framework.
14 Supervisory Stress Test Methodology and Results
expensed employee compensation or in connection
with a planned merger or acquisition.
The four regulatory capital ratios in DFAST 2015 are
common equity tier 1, tier 1 risk-based capital, total
risk-based capital, and tier 1 leverage. A BHC’s regula-
tory capital ratios are calculated in accordance with the
Board’s regulatory capital rules using Federal Reserve
projections of assets and RWAs. In 2013, the Board
adopted revisions to its regulatory capital framework
to address shortcomings in capital requirements that
became apparent during the financial crisis.25 The revi-
sions to the regulatory capital framework introduce a
new common equity tier 1 capital ratio, strengthen the
eligibility criteria for capital, and otherwise increase
the quantity and quality of capital that banking orga-
nizations are required to hold. These revisions are
being phased in between 2014 and 2019. Calculations
of regulatory capital for a given BHC are in accor-
dance with the regulatory requirements that will be in
effect during a particular quarter of the planning hori-
zon for that BHC.
The applicable transition arrangements for the regu-
latory capital ratios vary depending on whether a
BHC is an “advanced approaches BHC,” which is
defined as a BHC that has total consolidated assets
greater than or equal to $250 billion, or total consoli-
dated on-balance sheet foreign exposures of at least
$10 billion. Specifically, advanced approaches BHCs
became subject to a common equity tier 1 ratio and
an increased tier 1 risk-based capital ratio in 2014,
while all other BHCs became subject to these require-
ments beginning in 2015.26
Starting in 2015, the regulatory capital framework
introduces a new standardized approach for calculat-
ing risk-weighted assets, which replaces the calcula-
tion of risk weights using the general risk-based capi-
tal approach set forth in the Board’s capital adequacy
guidelines (general risk-based capital approach).27
For this stress test cycle, the denominator of each
BHC’s regulatory capital ratios was calculated using
the general risk-based capital approach for the first
quarter of the planning horizon (the fourth quarter
of 2014) and using the standardized approach for the
remaining quarters of the planning horizon.
Notably, eight BHCs began calculating their risk-
weighted assets using the advanced approaches rule
in the second quarter of 2014.28 Under the regula-
tory capital rules, these firms are required to meet the
minimum risk-based capital ratios under both the
advanced approaches rules and under the generally
applicable risk-based capital rules. However, DFAST
2015 does not incorporate measures of risk-weighted
assets using the advanced approaches rules.29
In addition to the four regulatory capital ratios,
DFAST 2015 includes projections of a BHC’s tier 1
common capital ratio. The tier 1 common capital
ratio equals the common equity portion of tier 1
capital divided by RWAs calculated under the general
risk-based capital approach.
Preserving the tier 1 common capital ratio maintains
consistency with previous stress testing cycles during
the phase-in of the new common equity tier 1 capital
ratio. The tier 1 common capital ratio differs from the
common equity tier 1 ratio in the following ways:
• For advanced approaches BHCs, most elements of
AOCI flow through to common equity tier 1 but
not to tier 1 common capital.
• More assets are subject to deduction from common
equity tier 1 capital than from tier 1 common capi-
tal, including investments in unconsolidated finan-
cial institutions and all deferred tax assets that arise
from operating losses and tax credit carryforwards.
• Beginning in 2015 (the second quarter of the plan-
ning horizon), the denominators of the two ratios
use different approaches for calculating RWAs.
Table 1 shows the rules used to calculate the numera-
tors and denominators of the capital ratios as well as
the timing of implementation of these rules for
advanced approaches and non-advanced approaches
BHCs.
25 See 12 CFR part 217.26 As of 2014:Q3, MUFG Americas Holdings Corporation was an
advanced approaches BHC because it had opted into theadvanced approaches rule, even though it did not meet therule’s numerical thresholds. In December 2014, the Boardapproved the MUFG’s request to no longer use the advancedapproaches rule, and the BHC ceased to qualify as an advancedapproaches BHC. Accordingly, for all projected quarters ofDFAST 2015, the BHC was treated as a non-advancedapproaches BHC for purposes of calculating capital levels andratios.
27 12 CFR 225, appendix A.
28 Federal Reserve Board (2014), “Agencies Permit Certain Bank-ing Organizations to Begin Using Advanced ApproachesFramework to Determine Risk-Based Capital Requirements,”press release, February 21, www.federalreserve.gov/newsevents/press/bcreg/20140221a.htm.
29 79 FR 13498, 13502 (March 11, 2014).
March 2015 15
Table 1. Applicable capital ratios and calculations in the 2015 Dodd-Frank Act stress tests
Capital ratio Aspect of ratio 2014:Q4 2015–16
Advanced approaches BHCs
Common equity tier 1 ratio
Capital in numerator Revised capitalframework
Revised capitalframework
Denominator Generalapproach RWAs
Standardizedapproach RWAs
Tier 1 ratio
Capital in numerator Revised capitalframework
Revised capitalframework
Denominator Generalapproach RWAs
Standardizedapproach RWAs
Total capital ratio
Capital in numerator Revised capitalframework
Revised capitalframework
Denominator Generalapproach RWAs
Standardizedapproach RWAs
Tier 1 leverage ratio
Capital in numerator Revised capitalframework
Revised capitalframework
Denominator Average assets Average assets
Tier 1 common ratio
Capital in numerator Basel I-basedcapital
Basel I-basedcapital
Denominator Generalapproach RWAs
Generalapproach RWAs
Other BHCs
Common equity tier 1 ratio
Capital in numerator n/a Revised capitalframework
Denominator n/a Standardizedapproach RWAs
Tier 1 ratio
Capital in numerator Basel I-basedcapital
Revised capitalframework
Denominator Generalapproach RWAs
Standardizedapproach RWAs
Total capital ratio
Capital in numerator Basel I-basedcapital
Revised capitalframework
Denominator Generalapproach RWAs
Standardizedapproach RWAs
Tier 1 leverage ratio
Capital in numerator Basel I-basedcapital
Revised capitalframework
Denominator Average assets Average assets
Tier 1 common ratio
Capital in numerator Basel I-basedcapital
Basel I-basedcapital
Denominator Generalapproach RWA
Generalapproach RWA
“Basel I-based capital” indicates that regulatory capital is calculated under the rules in place before the implementation of the revised capital framework (see 12 CFR part 225,appendix A). “Revised capital framework” indicates that regulatory capital is calculated under the revised capital framework. “General Approach RWAs” indicates thatrisk-weighted assets are calculated using the approach under the general risk-based capital rules (see 12 CFR part 225, appendix A), while “Standardized approach RWAs”indicates that risk-weighted assets are calculated using the standardized approach under the revised capital framework. Not applicable (n/a) indicates that the capital ratio wasnot calculated for that time period. An advanced approaches BHC includes any BHC that has consolidated assets greater than or equal to $250 billion or total consolidatedon-balance sheet foreign exposure of at least $10 billion as of December 31, 2014. See 12 CFR 217.100(b)(1). Other BHCs include any BHC that is subject to 12 CFR 225.8 andis not an advanced approaches BHC.
16 Supervisory Stress Test Methodology and Results
Supervisory Stress Test Results
This section describes the Federal Reserve’s projec-
tions of RWAs, losses, revenues, expenses, and capital
positions for the 31 BHCs participating in DFAST
2015 under the severely adverse and adverse sce-
narios. Results are presented both in the aggregate
for the 31 BHCs and for individual BHCs. The aggre-
gate results provide a sense of the stringency of the
adverse and severely adverse scenario projections and
the sensitivities of losses, revenues, and capital at
these BHCs as a group to the stressed economic and
financial market conditions contained in those sce-
narios. The range of results across individual BHCs
reflects differences in business focus, asset composi-
tion, revenue and expense sources, as well as differ-
ences in portfolio risk characteristics. The compre-
hensive results for individual BHCs are reported in
appendix C.
Severely Adverse Scenario
Stressed Regulatory Capital Ratios and
Risk-Weighted Assets
The projections suggest significant declines in capital
ratios for nearly all the BHCs under the severely
adverse scenario. In the aggregate, each of the four
capital ratios calculated in the third quarter of 2014
declines over the course of the planning horizon,
with year-end 2016 levels ranging from 2.9 percent-
age points to 5.2 percentage points lower than at the
start of the planning horizon (see table 2). Table 3
presents these ratios for each of the 31 BHCs.
The changes in post-stress capital ratios vary consid-
erably across BHCs (see figure 10). Overall, post-
stress capital ratios decline from the beginning to the
end of the planning horizon for all but four of the
BHCs. The post-stress capital ratios incorporate Fed-
eral Reserve projections of the levels of total average
assets and RWAs over the planning horizon. Declines
in capital ratios in part reflect an increase in pro-
jected RWAs over the planning horizon. The increase
in RWAs reflects projected asset and loan growth in
the scenario and the impact of the scenario’s
assumed increase in equity market volatility on mar-
ket risk RWAs at firms with large trading portfolios.
The shift from general approach RWA to standard-
ized approach RWA in the first quarter of 2015 for
the calculation of regulatory capital ratios resulted in
a significant increase in the level of credit-related
RWAs for some BHCs.
Projected Losses
The Federal Reserve projects that the 31 BHCs as a
group would experience significant losses under the
severely adverse scenario. In this scenario, losses are
projected to be $490 billion for the 31 BHCs in the
aggregate over the nine quarters of the planning
horizon. These losses include
• $340 billion in accrual loan portfolio losses,
• $18 billion in OTTI and other realized securities
losses,
• $103 billion in trading and/or counterparty losses
at the eight BHCs with substantial trading, pro-
cessing, or custodial operations, and
• $29 billion in additional losses from items such as
loans booked under the fair-value option (see
table 2).
The biggest sources of loss are accrual loan portfo-
lios and trading and counterparty positions subject
to the global market shock and counterparty default
component. Together, these account for 90 percent of
the projected losses for the 31 BHCs (figure 9).
Loan Losses
Projected losses on consumer-related lending—do-
mestic residential mortgages, credit cards, and other
consumer loans—represent 56 percent of projected
loan losses and 39 percent of total projected losses
for the 31 BHCs (see table 4). This is consistent with
the severely adverse scenario, which features high
unemployment rates and significant declines in hous-
17
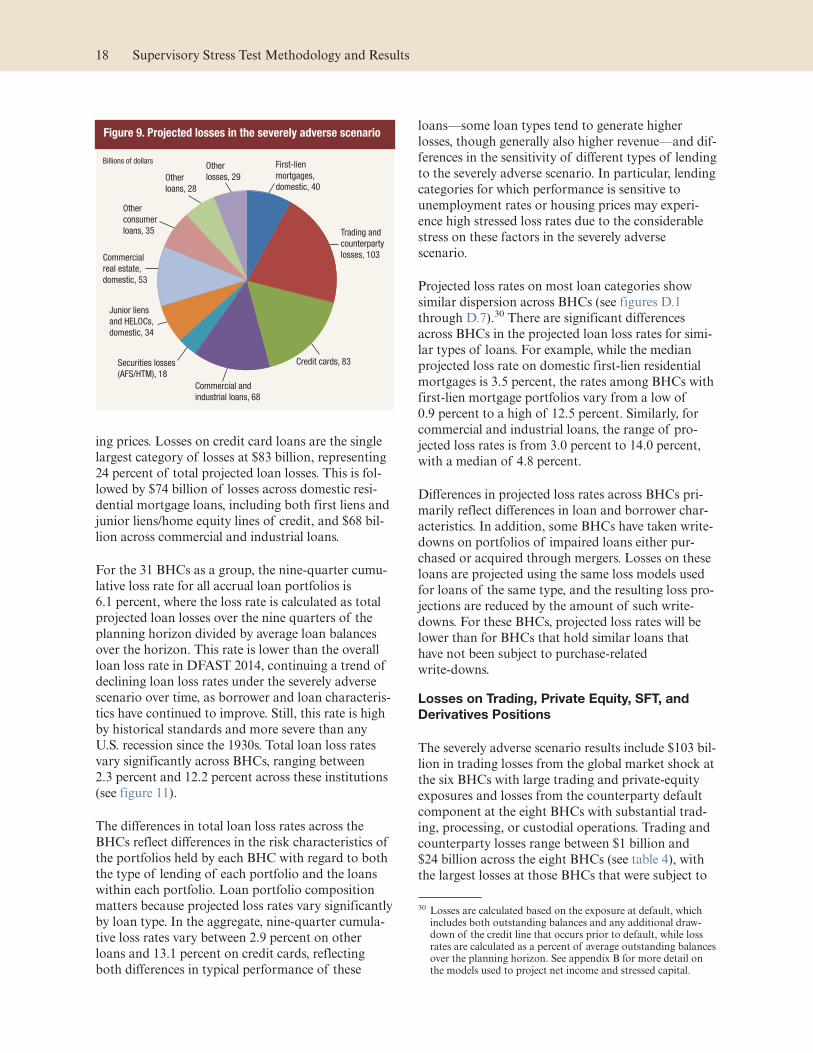
ing prices. Losses on credit card loans are the single
largest category of losses at $83 billion, representing
24 percent of total projected loan losses. This is fol-
lowed by $74 billion of losses across domestic resi-
dential mortgage loans, including both first liens and
junior liens/home equity lines of credit, and $68 bil-
lion across commercial and industrial loans.
For the 31 BHCs as a group, the nine-quarter cumu-
lative loss rate for all accrual loan portfolios is
6.1 percent, where the loss rate is calculated as total
projected loan losses over the nine quarters of the
planning horizon divided by average loan balances
over the horizon. This rate is lower than the overall
loan loss rate in DFAST 2014, continuing a trend of
declining loan loss rates under the severely adverse
scenario over time, as borrower and loan characteris-
tics have continued to improve. Still, this rate is high
by historical standards and more severe than any
U.S. recession since the 1930s. Total loan loss rates
vary significantly across BHCs, ranging between
2.3 percent and 12.2 percent across these institutions
(see figure 11).
The differences in total loan loss rates across the
BHCs reflect differences in the risk characteristics of
the portfolios held by each BHC with regard to both
the type of lending of each portfolio and the loans
within each portfolio. Loan portfolio composition
matters because projected loss rates vary significantly
by loan type. In the aggregate, nine-quarter cumula-
tive loss rates vary between 2.9 percent on other
loans and 13.1 percent on credit cards, reflecting
both differences in typical performance of these
loans—some loan types tend to generate higher
losses, though generally also higher revenue—and dif-
ferences in the sensitivity of different types of lending
to the severely adverse scenario. In particular, lending
categories for which performance is sensitive to
unemployment rates or housing prices may experi-
ence high stressed loss rates due to the considerable
stress on these factors in the severely adverse
scenario.
Projected loss rates on most loan categories show
similar dispersion across BHCs (see figures D.1
through D.7).30 There are significant differences
across BHCs in the projected loan loss rates for simi-
lar types of loans. For example, while the median
projected loss rate on domestic first-lien residential
mortgages is 3.5 percent, the rates among BHCs with
first-lien mortgage portfolios vary from a low of
0.9 percent to a high of 12.5 percent. Similarly, for
commercial and industrial loans, the range of pro-
jected loss rates is from 3.0 percent to 14.0 percent,
with a median of 4.8 percent.
Differences in projected loss rates across BHCs pri-
marily reflect differences in loan and borrower char-
acteristics. In addition, some BHCs have taken write-
downs on portfolios of impaired loans either pur-
chased or acquired through mergers. Losses on these
loans are projected using the same loss models used
for loans of the same type, and the resulting loss pro-
jections are reduced by the amount of such write-
downs. For these BHCs, projected loss rates will be
lower than for BHCs that hold similar loans that
have not been subject to purchase-related
write-downs.
Losses on Trading, Private Equity, SFT, and
Derivatives Positions
The severely adverse scenario results include $103 bil-
lion in trading losses from the global market shock at
the six BHCs with large trading and private-equity
exposures and losses from the counterparty default
component at the eight BHCs with substantial trad-
ing, processing, or custodial operations. Trading and
counterparty losses range between $1 billion and
$24 billion across the eight BHCs (see table 4), with
the largest losses at those BHCs that were subject to
30 Losses are calculated based on the exposure at default, whichincludes both outstanding balances and any additional draw-down of the credit line that occurs prior to default, while lossrates are calculated as a percent of average outstanding balancesover the planning horizon. See appendix B for more detail onthe models used to project net income and stressed capital.
Figure 9. Projected losses in the severely adverse scenario
Other
losses, 29Other
loans, 28
Other
consumer
loans, 35
Commercial
real estate,
domestic, 53
Junior liens
and HELOCs,
domestic, 34
Securities losses
(AFS/HTM), 18
Commercial and
industrial loans, 68
Credit cards, 83
Trading and
counterparty
losses, 103
First-lien
mortgages,
domestic, 40
Billions of dollars
18 Supervisory Stress Test Methodology and Results
both the global market shock and the counterparty
default component. Even so, the relative size of
losses across firms depends not on nominal portfolio
size but rather on the specific risk characteristics of
each BHC’s trading positions, inclusive of hedges.
Importantly, these projected losses are based on the
trading positions and counterparty exposures held by
these firms on a single date (October 6, 2014) and
could have differed if they had been based on a dif-
ferent date.
Projected Pre-provision Net Revenue and
Net Income
In the aggregate, the 31 BHCs are projected to gener-
ate $310 billion in PPNR cumulatively over the nine
quarters of the planning horizon, equal to 2.1 per-
cent of their combined average assets (see table 2).
Relatively low PPNR projections reflect low levels of
net interest income because of the effect of low inter-
est rates and flattening of the yield curve in the early
part of the severely adverse scenario, given the
BHCs’ current and projected balance sheet composi-
tion. The results also reflect low levels of noninterest
income, consistent with the falling asset prices, rising
equity market volatility, and sharply contracting eco-
nomic activity in the severely adverse scenario. In
addition, the PPNR projections incorporate expenses
stemming from estimates of elevated levels of losses
from operational-risk events such as fraud, employee
lawsuits, litigation-related expenses, or computer
system or other operating disruptions, and expenses
related to put-backs of mortgages netted against
actual mortgage put-back reserves reported by the
BHCs.31
The ratio of projected cumulative PPNR to average
assets varies across BHCs (see figure 12). A signifi-
cant portion of this variation reflects differences in
business focus across the institutions. For instance,
the ratio of PPNR to assets tends to be higher at
BHCs focusing on credit card lending, reflecting the
higher net interest income that credit cards generally
produce relative to other forms of lending.32 Impor-
tantly, lower PPNR rates do not necessarily imply
lower net income, since the same business focus and
revenue risk characteristics determining differences in
PPNR across firms could also result in offsetting dif-
ferences in projected losses across BHCs.
Projected PPNR and losses are the primary determi-
nants of projected pre-tax net income. Table 4 pres-
ents projections of the components of pre-tax net
income, including provisions into the ALLL and one-
time income and expense and extraordinary items,
under the severely adverse scenario for each of the 31
BHCs (see table 2 for aggregate). The projections are
cumulative for the nine quarters of the planning
horizon.
Of note, following U.S. GAAP, the net income pro-
jections incorporate loan losses indirectly through
provisions, which equal projected loan losses plus the
amount needed for the ALLL to be at an appropriate
level at the end of each quarter. The $382 billion in
total provisions includes $340 billion in net charge-
offs, with the remainder being the reserve build.
These amounts are cumulative over the planning
horizon and mask variation in the ALLL during the
course of the nine quarters. Specifically, the projected
ALLL increases during the early quarters of the
planning horizon, given the increased economic
stress in the severely adverse scenario, and then par-
tially retraces this increase as the economic stress
abates.
The Federal Reserve’s projections of pre-tax net
income under the severely adverse scenario imply
negative net income at most of the 31 BHCs indi-
vidually and for the BHCs as a group over the nine-
quarter planning horizon. Projected net income
before taxes (pre-tax net income) is an aggregate net
loss of $222 billion over the planning horizon for the
31 BHCs.
The ratio of pre-tax net income to average assets for
each of the 31 BHCs ranges between –5.0 percent
and 6.3 percent (see figure 13). Projected cumulative
net income for most of the BHCs (24 of 31) is nega-
tive over the planning horizon. Differences across the
firms reflect differences in the sensitivity of the vari-
ous components of net income to the economic and
financial market conditions in the supervisory sce-
narios. Projected net income for the eight BHCs sub-
ject to global market shock and/or the counterparty
default component includes the effect of those addi-
tional scenario components in the adverse and
severely adverse scenarios, introducing some addi-
tional variation in projected net income between
these eight BHCs and the other firms participating in
DFAST 2015.
31 These estimates are conditional on the hypothetical adverse andseverely adverse scenario and on conservative assumptions.They are not a supervisory estimate of the BHCs’ current orexpected legal liability.
32 As noted, credit card lending also tends to generate relativelyhigh loss rates, so the higher PPNR rates at these BHCs do notnecessarily indicate higher profitability.
March 2015 19

Table 2. 31 participating bank holding companies
Projected stressed capital ratios, risk-weighted assets, losses, revenues, net income beforetaxes, and loan lossesFederal Reserve estimates: Severely adverse scenario
Actual 2014:Q3 projected stressed capital ratios through2016:Q4
Actual2014:Q3
Stressed capital ratios1
Ending Minimum
Tier 1 common ratio (%) 11.9 8.4 8.3
Common equity tier 1 capital ratio (%)2 n/a 7.8 7.6
Tier 1 risk-based capital ratio (%) 13.5 8.6 8.4
Total risk-based capital ratio (%) 16.2 11.0 10.8
Tier 1 leverage ratio (%) 8.8 5.9 5.9
1 The capital ratios are calculated using capital action assumptions providedwithin the Dodd-Frank Act stress testing rule. These projections representhypothetical estimates that involve an economic outcome that is more adversethan expected. These estimates are not forecasts of expected losses, revenues,net income before taxes, or capital ratios. The minimum capital ratio presentedis for the period 2014:Q4 to 2016:Q4.
2 Advanced approaches bank holding companies (BHCs) are subject to thecommon equity tier 1 ratio for the third and fourth quarter of 2014. All bankholding companies are subject to the common equity tier 1 ratio for eachquarter of 2015 and 2016. An advanced approaches BHC includes any BHCthat has consolidated total assets greater than or equal to $250 billion orconsolidated total on-balance sheet foreign exposure of at least $10 billion.See 12 CFR 217.100(b)(1). Other BHCs include any BHC that is subject to12 CFR 225.8 and is not an advanced approaches BHC.
n/a Not applicable.
Projected loan losses, by type of loan, 2014:Q4–2016:Q4
Billions ofdollars
Portfolio lossrates (%)1
Loan losses 340.3 6.1
First-lien mortgages, domestic 39.7 3.6
Junior liens and HELOCs, domestic 34.0 8.0
Commercial and industrial2 67.8 5.4
Commercial real estate, domestic 52.8 8.6
Credit cards 82.9 13.1
Other consumer3 35.1 5.8
Other loans4 28.0 2.9
1 Average loan balances used to calculate portfolio loss rates exclude loans heldfor sale and loans held for investment under the fair-value option and arecalculated over nine quarters.
2 Commercial and industrial loans include small- and medium-enterprise loansand corporate cards.
3 Other consumer loans include student loans and automobile loans.4 Other loans include international real estate loans.
Actual 2014:Q3 and projected 2016:Q4 risk-weightedassets
Actual2014:Q3
Projected 2016:Q4
Generalapproach
Standardizedapproach
Risk-weighted assets(billions of dollars)1 8,790.2 9,103.4 9,948.4
1 For each quarter in 2014, risk-weighted assets are calculated using thegeneral risk-based capital approach set forth in 12 CFR 225, appendix A. Foreach quarter in 2015 and 2016, risk-weighted assets are calculated under theBoard’s standardized capital risk-based approach in 12 CFR 217, subpart D,except for the risk-weighted assets used to calculate the tier 1 common ratio,which uses the general risk-based capital approach for all quarters.
Projected losses, revenue, net income and othercomprehensive income through 2016:Q4
Billions ofdollars
Percent ofaverage assets1
Pre-provision net revenue2 309.6 2.1
Other revenue3 0.0
less
Provisions 381.9
Realized losses/gains on securities (AFS/HTM) 17.8
Trading and counterparty losses4 102.7
Other losses/gains5 29.3
equals
Net income before taxes -222.2 -1.5
Memo items
Other comprehensive income6 -12.4
Other effects on capital Actual 2014:Q3 2016:Q4
AOCI included in capital (billions of dollars)7 n/a -27.9
1 Average assets is the nine-quarter average of total assets.2 Pre-provision net revenue includes losses from operational-risk events,
mortgage repurchase expenses, and other real estate owned (OREO) costs.3 Other revenue includes one-time income and (expense) items not included in
pre-provision net revenue.4 Trading and counterparty losses include mark-to-market and credit valuation
adjustments (CVA) losses and losses arising from the counterparty defaultscenario component applied to derivatives, securities lending, and repurchaseagreement activities.
5 Other losses/gains includes projected change in fair value of loans held for saleand loans held for investment measured under the fair-value option, andgoodwill impairment losses.
6 Other comprehensive income (OCI) is only calculated for advanced approachesBHCs, and other BHCs that opt into the advanced approaches treatment ofAOCI.
7 Certain AOCI items are subject to transition into projected regulatory capital.Those transitions are 20 percent included in projected regulatory capital for2014, 40 percent included in projected regulatory capital for 2015, and60 percent included in projected regulatory capital for 2016.
20 Supervisory Stress Test Methodology and Results
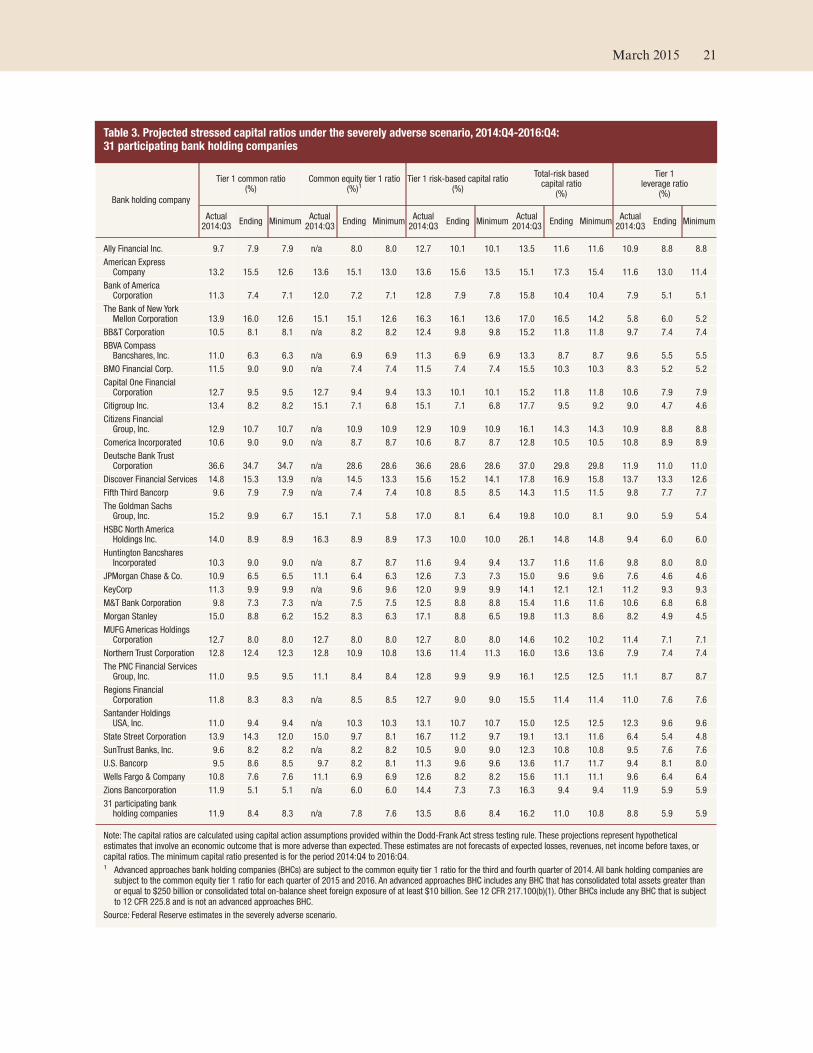
Table 3. Projected stressed capital ratios under the severely adverse scenario, 2014:Q4-2016:Q4:31 participating bank holding companies
Bank holding company
Tier 1 common ratio(%)
Common equity tier 1 ratio(%)1
Tier 1 risk-based capital ratio(%)
Total-risk basedcapital ratio
(%)
Tier 1leverage ratio
(%)
Actual2014:Q3
Ending MinimumActual2014:Q3
Ending MinimumActual2014:Q3
Ending MinimumActual2014:Q3
Ending MinimumActual2014:Q3
Ending Minimum
Ally Financial Inc. 9.7 7.9 7.9 n/a 8.0 8.0 12.7 10.1 10.1 13.5 11.6 11.6 10.9 8.8 8.8
American ExpressCompany 13.2 15.5 12.6 13.6 15.1 13.0 13.6 15.6 13.5 15.1 17.3 15.4 11.6 13.0 11.4
Bank of AmericaCorporation 11.3 7.4 7.1 12.0 7.2 7.1 12.8 7.9 7.8 15.8 10.4 10.4 7.9 5.1 5.1
The Bank of New YorkMellon Corporation 13.9 16.0 12.6 15.1 15.1 12.6 16.3 16.1 13.6 17.0 16.5 14.2 5.8 6.0 5.2
BB&T Corporation 10.5 8.1 8.1 n/a 8.2 8.2 12.4 9.8 9.8 15.2 11.8 11.8 9.7 7.4 7.4
BBVA CompassBancshares, Inc. 11.0 6.3 6.3 n/a 6.9 6.9 11.3 6.9 6.9 13.3 8.7 8.7 9.6 5.5 5.5
BMO Financial Corp. 11.5 9.0 9.0 n/a 7.4 7.4 11.5 7.4 7.4 15.5 10.3 10.3 8.3 5.2 5.2
Capital One FinancialCorporation 12.7 9.5 9.5 12.7 9.4 9.4 13.3 10.1 10.1 15.2 11.8 11.8 10.6 7.9 7.9
Citigroup Inc. 13.4 8.2 8.2 15.1 7.1 6.8 15.1 7.1 6.8 17.7 9.5 9.2 9.0 4.7 4.6
Citizens FinancialGroup, Inc. 12.9 10.7 10.7 n/a 10.9 10.9 12.9 10.9 10.9 16.1 14.3 14.3 10.9 8.8 8.8
Comerica Incorporated 10.6 9.0 9.0 n/a 8.7 8.7 10.6 8.7 8.7 12.8 10.5 10.5 10.8 8.9 8.9
Deutsche Bank TrustCorporation 36.6 34.7 34.7 n/a 28.6 28.6 36.6 28.6 28.6 37.0 29.8 29.8 11.9 11.0 11.0
Discover Financial Services 14.8 15.3 13.9 n/a 14.5 13.3 15.6 15.2 14.1 17.8 16.9 15.8 13.7 13.3 12.6
Fifth Third Bancorp 9.6 7.9 7.9 n/a 7.4 7.4 10.8 8.5 8.5 14.3 11.5 11.5 9.8 7.7 7.7
The Goldman SachsGroup, Inc. 15.2 9.9 6.7 15.1 7.1 5.8 17.0 8.1 6.4 19.8 10.0 8.1 9.0 5.9 5.4
HSBC North AmericaHoldings Inc. 14.0 8.9 8.9 16.3 8.9 8.9 17.3 10.0 10.0 26.1 14.8 14.8 9.4 6.0 6.0
Huntington BancsharesIncorporated 10.3 9.0 9.0 n/a 8.7 8.7 11.6 9.4 9.4 13.7 11.6 11.6 9.8 8.0 8.0
JPMorgan Chase & Co. 10.9 6.5 6.5 11.1 6.4 6.3 12.6 7.3 7.3 15.0 9.6 9.6 7.6 4.6 4.6
KeyCorp 11.3 9.9 9.9 n/a 9.6 9.6 12.0 9.9 9.9 14.1 12.1 12.1 11.2 9.3 9.3
M&T Bank Corporation 9.8 7.3 7.3 n/a 7.5 7.5 12.5 8.8 8.8 15.4 11.6 11.6 10.6 6.8 6.8
Morgan Stanley 15.0 8.8 6.2 15.2 8.3 6.3 17.1 8.8 6.5 19.8 11.3 8.6 8.2 4.9 4.5
MUFG Americas HoldingsCorporation 12.7 8.0 8.0 12.7 8.0 8.0 12.7 8.0 8.0 14.6 10.2 10.2 11.4 7.1 7.1
Northern Trust Corporation 12.8 12.4 12.3 12.8 10.9 10.8 13.6 11.4 11.3 16.0 13.6 13.6 7.9 7.4 7.4
The PNC Financial ServicesGroup, Inc. 11.0 9.5 9.5 11.1 8.4 8.4 12.8 9.9 9.9 16.1 12.5 12.5 11.1 8.7 8.7
Regions FinancialCorporation 11.8 8.3 8.3 n/a 8.5 8.5 12.7 9.0 9.0 15.5 11.4 11.4 11.0 7.6 7.6
Santander HoldingsUSA, Inc. 11.0 9.4 9.4 n/a 10.3 10.3 13.1 10.7 10.7 15.0 12.5 12.5 12.3 9.6 9.6
State Street Corporation 13.9 14.3 12.0 15.0 9.7 8.1 16.7 11.2 9.7 19.1 13.1 11.6 6.4 5.4 4.8
SunTrust Banks, Inc. 9.6 8.2 8.2 n/a 8.2 8.2 10.5 9.0 9.0 12.3 10.8 10.8 9.5 7.6 7.6
U.S. Bancorp 9.5 8.6 8.5 9.7 8.2 8.1 11.3 9.6 9.6 13.6 11.7 11.7 9.4 8.1 8.0
Wells Fargo & Company 10.8 7.6 7.6 11.1 6.9 6.9 12.6 8.2 8.2 15.6 11.1 11.1 9.6 6.4 6.4
Zions Bancorporation 11.9 5.1 5.1 n/a 6.0 6.0 14.4 7.3 7.3 16.3 9.4 9.4 11.9 5.9 5.9
31 participating bankholding companies 11.9 8.4 8.3 n/a 7.8 7.6 13.5 8.6 8.4 16.2 11.0 10.8 8.8 5.9 5.9
Note: The capital ratios are calculated using capital action assumptions provided within the Dodd-Frank Act stress testing rule. These projections represent hypotheticalestimates that involve an economic outcome that is more adverse than expected. These estimates are not forecasts of expected losses, revenues, net income before taxes, orcapital ratios. The minimum capital ratio presented is for the period 2014:Q4 to 2016:Q4.1 Advanced approaches bank holding companies (BHCs) are subject to the common equity tier 1 ratio for the third and fourth quarter of 2014. All bank holding companies are
subject to the common equity tier 1 ratio for each quarter of 2015 and 2016. An advanced approaches BHC includes any BHC that has consolidated total assets greater thanor equal to $250 billion or consolidated total on-balance sheet foreign exposure of at least $10 billion. See 12 CFR 217.100(b)(1). Other BHCs include any BHC that is subjectto 12 CFR 225.8 and is not an advanced approaches BHC.
Source: Federal Reserve estimates in the severely adverse scenario.
March 2015 21
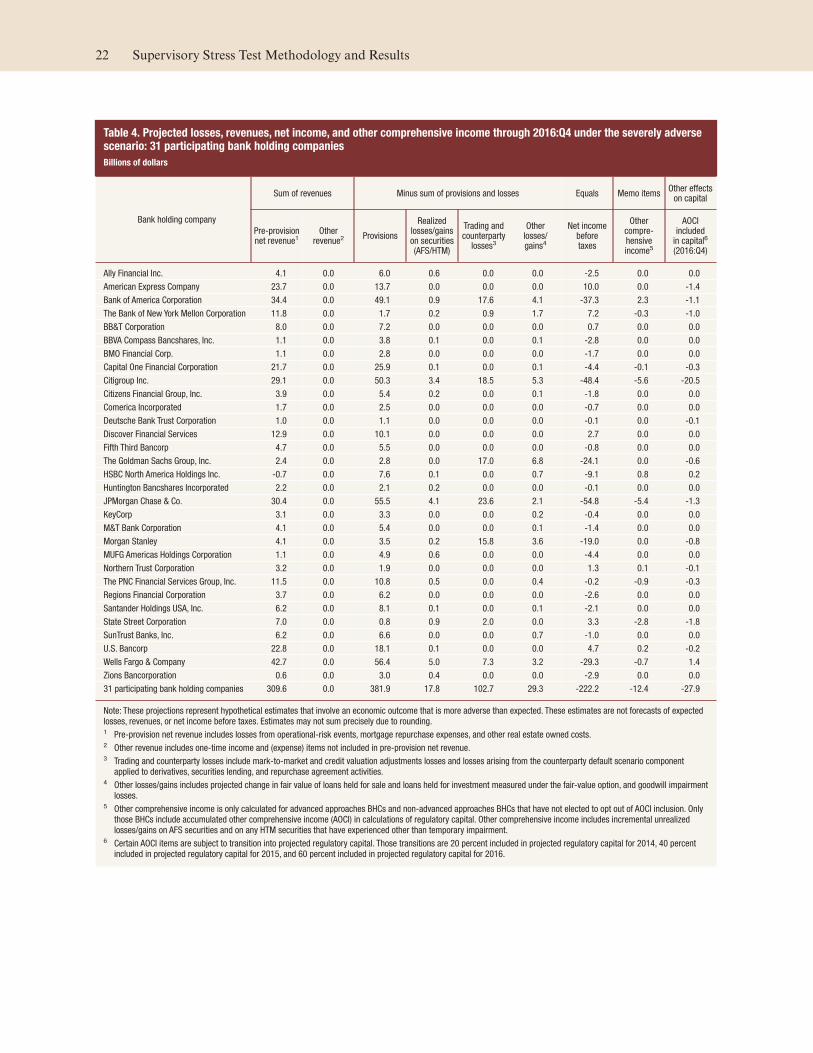
Table 4. Projected losses, revenues, net income, and other comprehensive income through 2016:Q4 under the severely adversescenario: 31 participating bank holding companies
Billions of dollars
Bank holding company
Sum of revenues Minus sum of provisions and losses Equals Memo itemsOther effectson capital
Pre-provisionnet revenue1
Otherrevenue2
Provisions
Realizedlosses/gainson securities(AFS/HTM)
Trading andcounterpartylosses3
Otherlosses/gains4
Net incomebeforetaxes
Othercompre-hensiveincome5
AOCIincludedin capital6
(2016:Q4)
Ally Financial Inc. 4.1 0.0 6.0 0.6 0.0 0.0 -2.5 0.0 0.0
American Express Company 23.7 0.0 13.7 0.0 0.0 0.0 10.0 0.0 -1.4
Bank of America Corporation 34.4 0.0 49.1 0.9 17.6 4.1 -37.3 2.3 -1.1
The Bank of New York Mellon Corporation 11.8 0.0 1.7 0.2 0.9 1.7 7.2 -0.3 -1.0
BB&T Corporation 8.0 0.0 7.2 0.0 0.0 0.0 0.7 0.0 0.0
BBVA Compass Bancshares, Inc. 1.1 0.0 3.8 0.1 0.0 0.1 -2.8 0.0 0.0
BMO Financial Corp. 1.1 0.0 2.8 0.0 0.0 0.0 -1.7 0.0 0.0
Capital One Financial Corporation 21.7 0.0 25.9 0.1 0.0 0.1 -4.4 -0.1 -0.3
Citigroup Inc. 29.1 0.0 50.3 3.4 18.5 5.3 -48.4 -5.6 -20.5
Citizens Financial Group, Inc. 3.9 0.0 5.4 0.2 0.0 0.1 -1.8 0.0 0.0
Comerica Incorporated 1.7 0.0 2.5 0.0 0.0 0.0 -0.7 0.0 0.0
Deutsche Bank Trust Corporation 1.0 0.0 1.1 0.0 0.0 0.0 -0.1 0.0 -0.1
Discover Financial Services 12.9 0.0 10.1 0.0 0.0 0.0 2.7 0.0 0.0
Fifth Third Bancorp 4.7 0.0 5.5 0.0 0.0 0.0 -0.8 0.0 0.0
The Goldman Sachs Group, Inc. 2.4 0.0 2.8 0.0 17.0 6.8 -24.1 0.0 -0.6
HSBC North America Holdings Inc. -0.7 0.0 7.6 0.1 0.0 0.7 -9.1 0.8 0.2
Huntington Bancshares Incorporated 2.2 0.0 2.1 0.2 0.0 0.0 -0.1 0.0 0.0
JPMorgan Chase & Co. 30.4 0.0 55.5 4.1 23.6 2.1 -54.8 -5.4 -1.3
KeyCorp 3.1 0.0 3.3 0.0 0.0 0.2 -0.4 0.0 0.0
M&T Bank Corporation 4.1 0.0 5.4 0.0 0.0 0.1 -1.4 0.0 0.0
Morgan Stanley 4.1 0.0 3.5 0.2 15.8 3.6 -19.0 0.0 -0.8
MUFG Americas Holdings Corporation 1.1 0.0 4.9 0.6 0.0 0.0 -4.4 0.0 0.0
Northern Trust Corporation 3.2 0.0 1.9 0.0 0.0 0.0 1.3 0.1 -0.1
The PNC Financial Services Group, Inc. 11.5 0.0 10.8 0.5 0.0 0.4 -0.2 -0.9 -0.3
Regions Financial Corporation 3.7 0.0 6.2 0.0 0.0 0.0 -2.6 0.0 0.0
Santander Holdings USA, Inc. 6.2 0.0 8.1 0.1 0.0 0.1 -2.1 0.0 0.0
State Street Corporation 7.0 0.0 0.8 0.9 2.0 0.0 3.3 -2.8 -1.8
SunTrust Banks, Inc. 6.2 0.0 6.6 0.0 0.0 0.7 -1.0 0.0 0.0
U.S. Bancorp 22.8 0.0 18.1 0.1 0.0 0.0 4.7 0.2 -0.2
Wells Fargo & Company 42.7 0.0 56.4 5.0 7.3 3.2 -29.3 -0.7 1.4
Zions Bancorporation 0.6 0.0 3.0 0.4 0.0 0.0 -2.9 0.0 0.0
31 participating bank holding companies 309.6 0.0 381.9 17.8 102.7 29.3 -222.2 -12.4 -27.9
Note: These projections represent hypothetical estimates that involve an economic outcome that is more adverse than expected. These estimates are not forecasts of expectedlosses, revenues, or net income before taxes. Estimates may not sum precisely due to rounding.1 Pre-provision net revenue includes losses from operational-risk events, mortgage repurchase expenses, and other real estate owned costs.2 Other revenue includes one-time income and (expense) items not included in pre-provision net revenue.3 Trading and counterparty losses include mark-to-market and credit valuation adjustments losses and losses arising from the counterparty default scenario component
applied to derivatives, securities lending, and repurchase agreement activities.4 Other losses/gains includes projected change in fair value of loans held for sale and loans held for investment measured under the fair-value option, and goodwill impairment
losses.5 Other comprehensive income is only calculated for advanced approaches BHCs and non-advanced approaches BHCs that have not elected to opt out of AOCI inclusion. Only
those BHCs include accumulated other comprehensive income (AOCI) in calculations of regulatory capital. Other comprehensive income includes incremental unrealizedlosses/gains on AFS securities and on any HTM securities that have experienced other than temporary impairment.
6 Certain AOCI items are subject to transition into projected regulatory capital. Those transitions are 20 percent included in projected regulatory capital for 2014, 40 percentincluded in projected regulatory capital for 2015, and 60 percent included in projected regulatory capital for 2016.
22 Supervisory Stress Test Methodology and Results
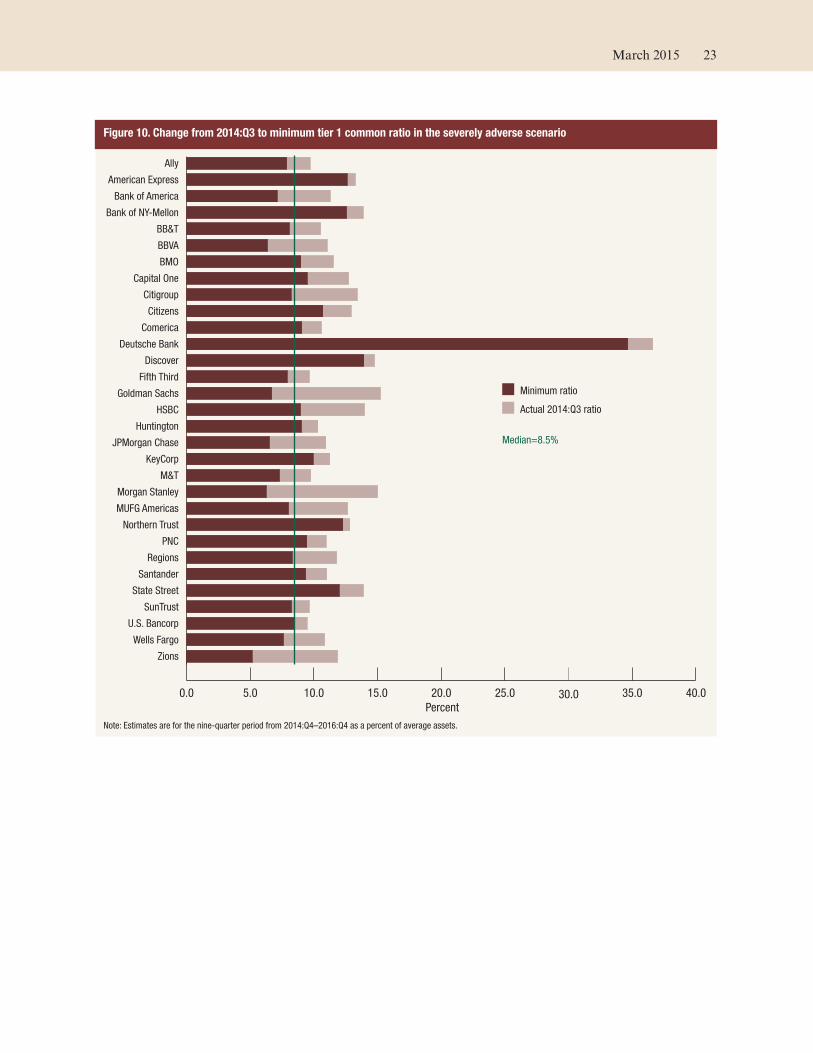
Figure 10. Change from 2014:Q3 to minimum tier 1 common ratio in the severely adverse scenario
0.0 5.0 10.0 15.0 20.0 25.0 30.0 35.0 40.0
Zions
Wells Fargo
U.S. Bancorp
SunTrust
State Street
Santander
Regions
PNC
Northern Trust
MUFG Americas
Morgan Stanley
M&T
KeyCorp
JPMorgan Chase
Huntington
HSBC
Goldman Sachs
Fifth Third
Discover
Deutsche Bank
Comerica
Citizens
Citigroup
Capital One
BMO
BBVA
BB&T
Bank of NY-Mellon
Bank of America
American Express
Ally
Minimum ratio
Percent
Median=8.5%
Actual 2014:Q3 ratio
Note: Estimates are for the nine-quarter period from 2014:Q4–2016:Q4 as a percent of average assets.
March 2015 23
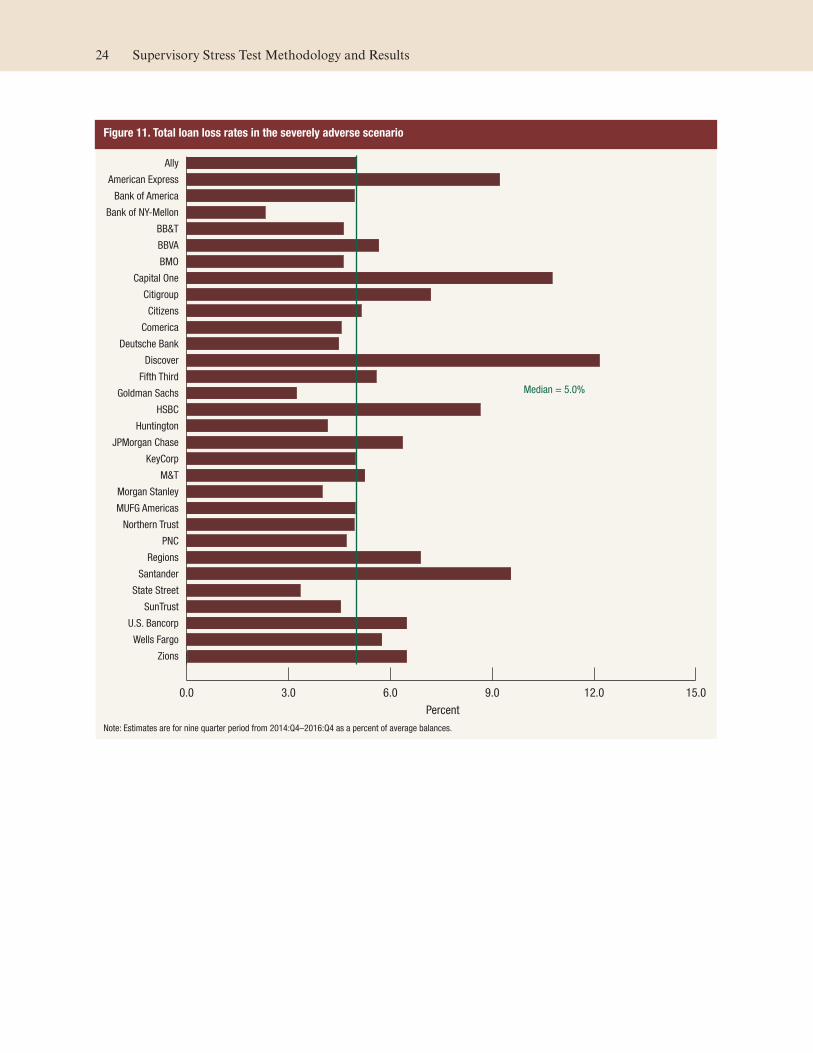
Figure 11. Total loan loss rates in the severely adverse scenario
0.0 3.0 6.0 9.0 12.0 15.0
Zions
Wells Fargo
U.S. Bancorp
SunTrust
State Street
Santander
Regions
PNC
Northern Trust
MUFG Americas
Morgan Stanley
M&T
KeyCorp
JPMorgan Chase
Huntington
HSBC
Goldman Sachs
Fifth Third
Discover
Deutsche Bank
Comerica
Citizens
Citigroup
Capital One
BMO
BBVA
BB&T
Bank of NY-Mellon
Bank of America
American Express
Ally
Percent
Median = 5.0%
Note: Estimates are for nine quarter period from 2014:Q4–2016:Q4 as a percent of average balances.
24 Supervisory Stress Test Methodology and Results
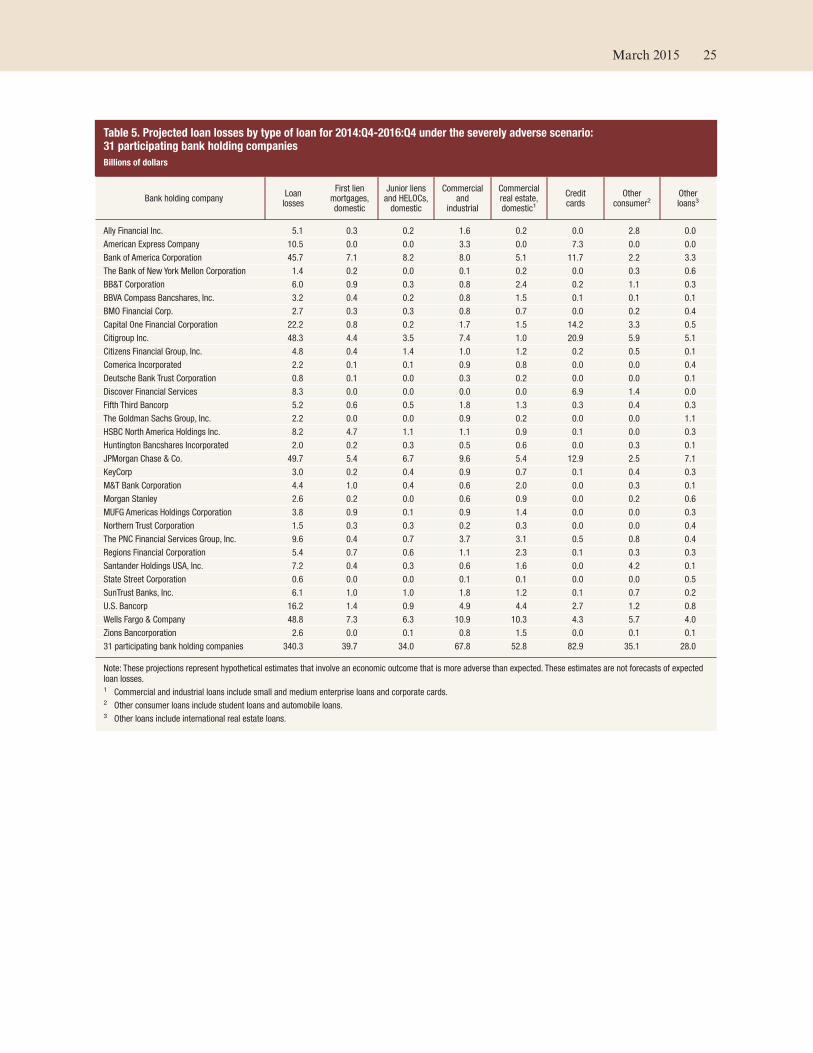
Table 5. Projected loan losses by type of loan for 2014:Q4-2016:Q4 under the severely adverse scenario:31 participating bank holding companies
Billions of dollars
Bank holding companyLoanlosses
First lienmortgages,domestic
Junior liensand HELOCs,domestic
Commercialand
industrial
Commercialreal estate,domestic1
Creditcards
Otherconsumer2
Otherloans3
Ally Financial Inc. 5.1 0.3 0.2 1.6 0.2 0.0 2.8 0.0
American Express Company 10.5 0.0 0.0 3.3 0.0 7.3 0.0 0.0
Bank of America Corporation 45.7 7.1 8.2 8.0 5.1 11.7 2.2 3.3
The Bank of New York Mellon Corporation 1.4 0.2 0.0 0.1 0.2 0.0 0.3 0.6
BB&T Corporation 6.0 0.9 0.3 0.8 2.4 0.2 1.1 0.3
BBVA Compass Bancshares, Inc. 3.2 0.4 0.2 0.8 1.5 0.1 0.1 0.1
BMO Financial Corp. 2.7 0.3 0.3 0.8 0.7 0.0 0.2 0.4
Capital One Financial Corporation 22.2 0.8 0.2 1.7 1.5 14.2 3.3 0.5
Citigroup Inc. 48.3 4.4 3.5 7.4 1.0 20.9 5.9 5.1
Citizens Financial Group, Inc. 4.8 0.4 1.4 1.0 1.2 0.2 0.5 0.1
Comerica Incorporated 2.2 0.1 0.1 0.9 0.8 0.0 0.0 0.4
Deutsche Bank Trust Corporation 0.8 0.1 0.0 0.3 0.2 0.0 0.0 0.1
Discover Financial Services 8.3 0.0 0.0 0.0 0.0 6.9 1.4 0.0
Fifth Third Bancorp 5.2 0.6 0.5 1.8 1.3 0.3 0.4 0.3
The Goldman Sachs Group, Inc. 2.2 0.0 0.0 0.9 0.2 0.0 0.0 1.1
HSBC North America Holdings Inc. 8.2 4.7 1.1 1.1 0.9 0.1 0.0 0.3
Huntington Bancshares Incorporated 2.0 0.2 0.3 0.5 0.6 0.0 0.3 0.1
JPMorgan Chase & Co. 49.7 5.4 6.7 9.6 5.4 12.9 2.5 7.1
KeyCorp 3.0 0.2 0.4 0.9 0.7 0.1 0.4 0.3
M&T Bank Corporation 4.4 1.0 0.4 0.6 2.0 0.0 0.3 0.1
Morgan Stanley 2.6 0.2 0.0 0.6 0.9 0.0 0.2 0.6
MUFG Americas Holdings Corporation 3.8 0.9 0.1 0.9 1.4 0.0 0.0 0.3
Northern Trust Corporation 1.5 0.3 0.3 0.2 0.3 0.0 0.0 0.4
The PNC Financial Services Group, Inc. 9.6 0.4 0.7 3.7 3.1 0.5 0.8 0.4
Regions Financial Corporation 5.4 0.7 0.6 1.1 2.3 0.1 0.3 0.3
Santander Holdings USA, Inc. 7.2 0.4 0.3 0.6 1.6 0.0 4.2 0.1
State Street Corporation 0.6 0.0 0.0 0.1 0.1 0.0 0.0 0.5
SunTrust Banks, Inc. 6.1 1.0 1.0 1.8 1.2 0.1 0.7 0.2
U.S. Bancorp 16.2 1.4 0.9 4.9 4.4 2.7 1.2 0.8
Wells Fargo & Company 48.8 7.3 6.3 10.9 10.3 4.3 5.7 4.0
Zions Bancorporation 2.6 0.0 0.1 0.8 1.5 0.0 0.1 0.1
31 participating bank holding companies 340.3 39.7 34.0 67.8 52.8 82.9 35.1 28.0
Note: These projections represent hypothetical estimates that involve an economic outcome that is more adverse than expected. These estimates are not forecasts of expectedloan losses.1 Commercial and industrial loans include small and medium enterprise loans and corporate cards.2 Other consumer loans include student loans and automobile loans.3 Other loans include international real estate loans.
March 2015 25
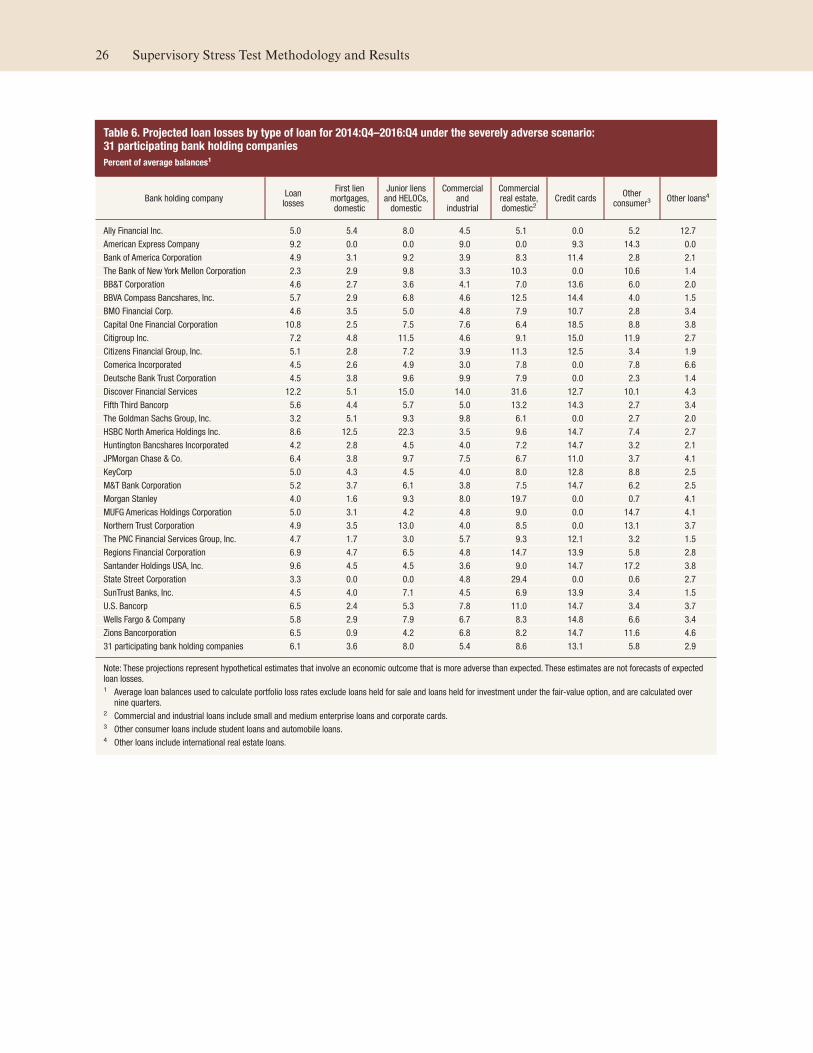
Table 6. Projected loan losses by type of loan for 2014:Q4–2016:Q4 under the severely adverse scenario:31 participating bank holding companies
Percent of average balances1
Bank holding companyLoanlosses
First lienmortgages,domestic
Junior liensand HELOCs,domestic
Commercialand
industrial
Commercialreal estate,domestic2
Credit cardsOther
consumer3Other loans4
Ally Financial Inc. 5.0 5.4 8.0 4.5 5.1 0.0 5.2 12.7
American Express Company 9.2 0.0 0.0 9.0 0.0 9.3 14.3 0.0
Bank of America Corporation 4.9 3.1 9.2 3.9 8.3 11.4 2.8 2.1
The Bank of New York Mellon Corporation 2.3 2.9 9.8 3.3 10.3 0.0 10.6 1.4
BB&T Corporation 4.6 2.7 3.6 4.1 7.0 13.6 6.0 2.0
BBVA Compass Bancshares, Inc. 5.7 2.9 6.8 4.6 12.5 14.4 4.0 1.5
BMO Financial Corp. 4.6 3.5 5.0 4.8 7.9 10.7 2.8 3.4
Capital One Financial Corporation 10.8 2.5 7.5 7.6 6.4 18.5 8.8 3.8
Citigroup Inc. 7.2 4.8 11.5 4.6 9.1 15.0 11.9 2.7
Citizens Financial Group, Inc. 5.1 2.8 7.2 3.9 11.3 12.5 3.4 1.9
Comerica Incorporated 4.5 2.6 4.9 3.0 7.8 0.0 7.8 6.6
Deutsche Bank Trust Corporation 4.5 3.8 9.6 9.9 7.9 0.0 2.3 1.4
Discover Financial Services 12.2 5.1 15.0 14.0 31.6 12.7 10.1 4.3
Fifth Third Bancorp 5.6 4.4 5.7 5.0 13.2 14.3 2.7 3.4
The Goldman Sachs Group, Inc. 3.2 5.1 9.3 9.8 6.1 0.0 2.7 2.0
HSBC North America Holdings Inc. 8.6 12.5 22.3 3.5 9.6 14.7 7.4 2.7
Huntington Bancshares Incorporated 4.2 2.8 4.5 4.0 7.2 14.7 3.2 2.1
JPMorgan Chase & Co. 6.4 3.8 9.7 7.5 6.7 11.0 3.7 4.1
KeyCorp 5.0 4.3 4.5 4.0 8.0 12.8 8.8 2.5
M&T Bank Corporation 5.2 3.7 6.1 3.8 7.5 14.7 6.2 2.5
Morgan Stanley 4.0 1.6 9.3 8.0 19.7 0.0 0.7 4.1
MUFG Americas Holdings Corporation 5.0 3.1 4.2 4.8 9.0 0.0 14.7 4.1
Northern Trust Corporation 4.9 3.5 13.0 4.0 8.5 0.0 13.1 3.7
The PNC Financial Services Group, Inc. 4.7 1.7 3.0 5.7 9.3 12.1 3.2 1.5
Regions Financial Corporation 6.9 4.7 6.5 4.8 14.7 13.9 5.8 2.8
Santander Holdings USA, Inc. 9.6 4.5 4.5 3.6 9.0 14.7 17.2 3.8
State Street Corporation 3.3 0.0 0.0 4.8 29.4 0.0 0.6 2.7
SunTrust Banks, Inc. 4.5 4.0 7.1 4.5 6.9 13.9 3.4 1.5
U.S. Bancorp 6.5 2.4 5.3 7.8 11.0 14.7 3.4 3.7
Wells Fargo & Company 5.8 2.9 7.9 6.7 8.3 14.8 6.6 3.4
Zions Bancorporation 6.5 0.9 4.2 6.8 8.2 14.7 11.6 4.6
31 participating bank holding companies 6.1 3.6 8.0 5.4 8.6 13.1 5.8 2.9
Note: These projections represent hypothetical estimates that involve an economic outcome that is more adverse than expected. These estimates are not forecasts of expectedloan losses.1 Average loan balances used to calculate portfolio loss rates exclude loans held for sale and loans held for investment under the fair-value option, and are calculated over
nine quarters.2 Commercial and industrial loans include small and medium enterprise loans and corporate cards.3 Other consumer loans include student loans and automobile loans.4 Other loans include international real estate loans.
26 Supervisory Stress Test Methodology and Results
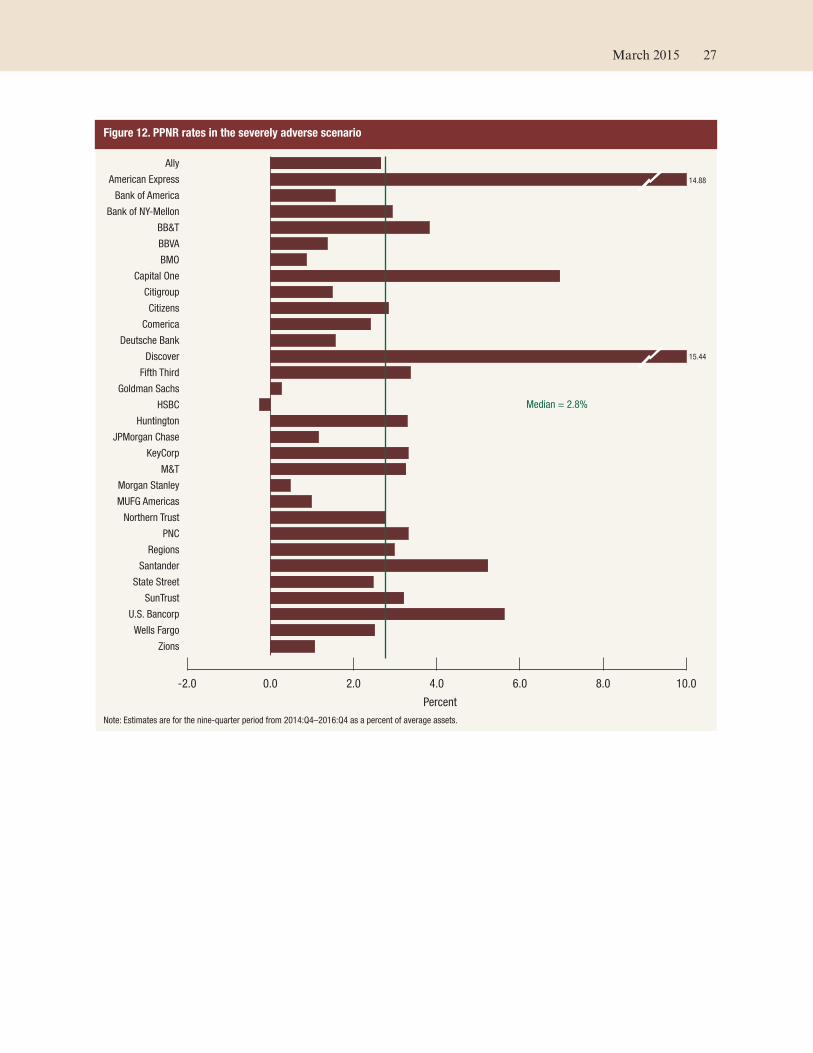
Figure 12. PPNR rates in the severely adverse scenario
-2.0 0.0 2.0 4.0 6.0 8.0 10.0
Zions
Wells Fargo
U.S. Bancorp
SunTrust
State Street
Santander
Regions
PNC
Northern Trust
MUFG Americas
Morgan Stanley
M&T
KeyCorp
JPMorgan Chase
Huntington
HSBC
Goldman Sachs
Fifth Third
Discover
Deutsche Bank
Comerica
Citizens
Citigroup
Capital One
BMO
BBVA
BB&T
Bank of NY-Mellon
Bank of America
American Express
Ally
Percent
Median = 2.8%
14.88
15.44
Note: Estimates are for the nine-quarter period from 2014:Q4–2016:Q4 as a percent of average assets.
March 2015 27
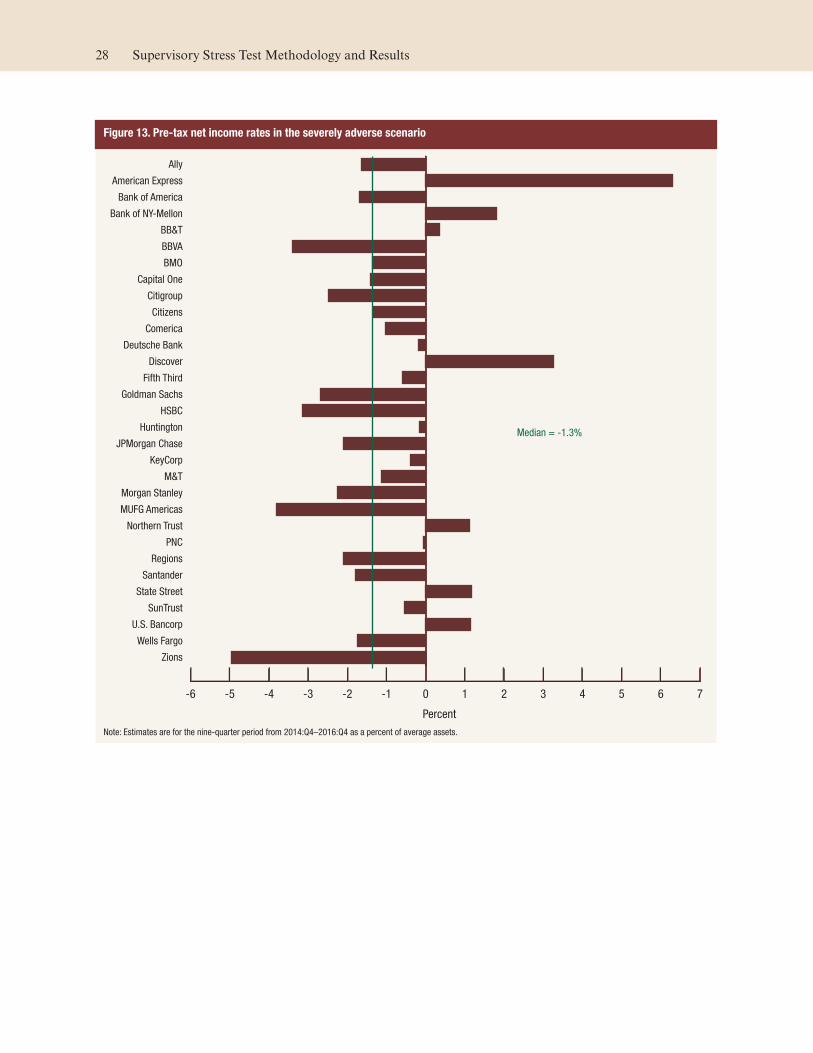
Figure 13. Pre-tax net income rates in the severely adverse scenario
-6 -5 -4 -3 -2 -1 0 1 2 3 4 5 6 7
Zions
Wells Fargo
U.S. Bancorp
SunTrust
State Street
Santander
Regions
PNC
Northern Trust
MUFG Americas
Morgan Stanley
M&T
KeyCorp
JPMorgan Chase
Huntington
HSBC
Goldman Sachs
Fifth Third
Discover
Deutsche Bank
Comerica
Citizens
Citigroup
Capital One
BMO
BBVA
BB&T
Bank of NY-Mellon
Bank of America
American Express
Ally
Percent
Median = -1.3%
Note: Estimates are for the nine-quarter period from 2014:Q4–2016:Q4 as a percent of average assets.
28 Supervisory Stress Test Methodology and Results
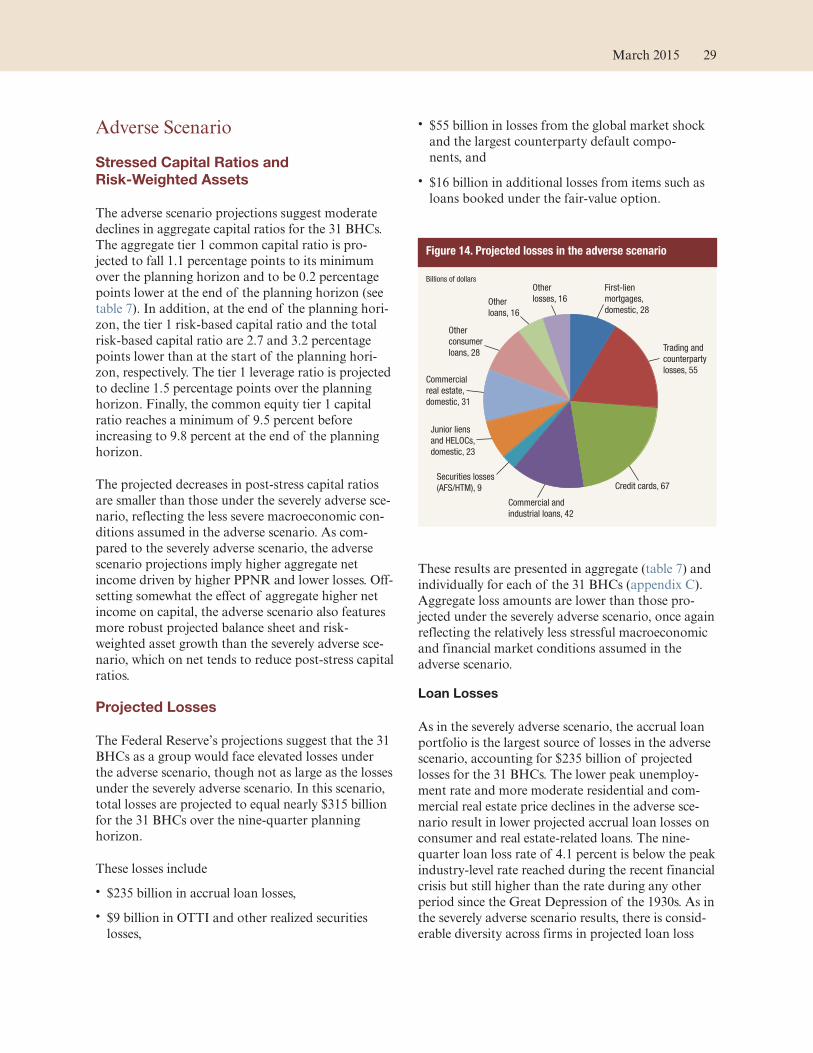
Adverse Scenario
Stressed Capital Ratios and
Risk-Weighted Assets
The adverse scenario projections suggest moderate
declines in aggregate capital ratios for the 31 BHCs.
The aggregate tier 1 common capital ratio is pro-
jected to fall 1.1 percentage points to its minimum
over the planning horizon and to be 0.2 percentage
points lower at the end of the planning horizon (see
table 7). In addition, at the end of the planning hori-
zon, the tier 1 risk-based capital ratio and the total
risk-based capital ratio are 2.7 and 3.2 percentage
points lower than at the start of the planning hori-
zon, respectively. The tier 1 leverage ratio is projected
to decline 1.5 percentage points over the planning
horizon. Finally, the common equity tier 1 capital
ratio reaches a minimum of 9.5 percent before
increasing to 9.8 percent at the end of the planning
horizon.
The projected decreases in post-stress capital ratios
are smaller than those under the severely adverse sce-
nario, reflecting the less severe macroeconomic con-
ditions assumed in the adverse scenario. As com-
pared to the severely adverse scenario, the adverse
scenario projections imply higher aggregate net
income driven by higher PPNR and lower losses. Off-
setting somewhat the effect of aggregate higher net
income on capital, the adverse scenario also features
more robust projected balance sheet and risk-
weighted asset growth than the severely adverse sce-
nario, which on net tends to reduce post-stress capital
ratios.
Projected Losses
The Federal Reserve’s projections suggest that the 31
BHCs as a group would face elevated losses under
the adverse scenario, though not as large as the losses
under the severely adverse scenario. In this scenario,
total losses are projected to equal nearly $315 billion
for the 31 BHCs over the nine-quarter planning
horizon.
These losses include
• $235 billion in accrual loan losses,
• $9 billion in OTTI and other realized securities
losses,
• $55 billion in losses from the global market shock
and the largest counterparty default compo-
nents, and
• $16 billion in additional losses from items such as
loans booked under the fair-value option.
These results are presented in aggregate (table 7) and
individually for each of the 31 BHCs (appendix C).
Aggregate loss amounts are lower than those pro-
jected under the severely adverse scenario, once again
reflecting the relatively less stressful macroeconomic
and financial market conditions assumed in the
adverse scenario.
Loan Losses
As in the severely adverse scenario, the accrual loan
portfolio is the largest source of losses in the adverse
scenario, accounting for $235 billion of projected
losses for the 31 BHCs. The lower peak unemploy-
ment rate and more moderate residential and com-
mercial real estate price declines in the adverse sce-
nario result in lower projected accrual loan losses on
consumer and real estate-related loans. The nine-
quarter loan loss rate of 4.1 percent is below the peak
industry-level rate reached during the recent financial
crisis but still higher than the rate during any other
period since the Great Depression of the 1930s. As in
the severely adverse scenario results, there is consid-
erable diversity across firms in projected loan loss
Figure 14. Projected losses in the adverse scenario
Other
losses, 16Other
loans, 16
Other
consumer
loans, 28
Commercial
real estate,
domestic, 31
Junior liens
and HELOCs,
domestic, 23
Securities losses
(AFS/HTM), 9
Commercial and
industrial loans, 42
Credit cards, 67
Trading and
counterparty
losses, 55
First-lien
mortgages,
domestic, 28
Billions of dollars
March 2015 29
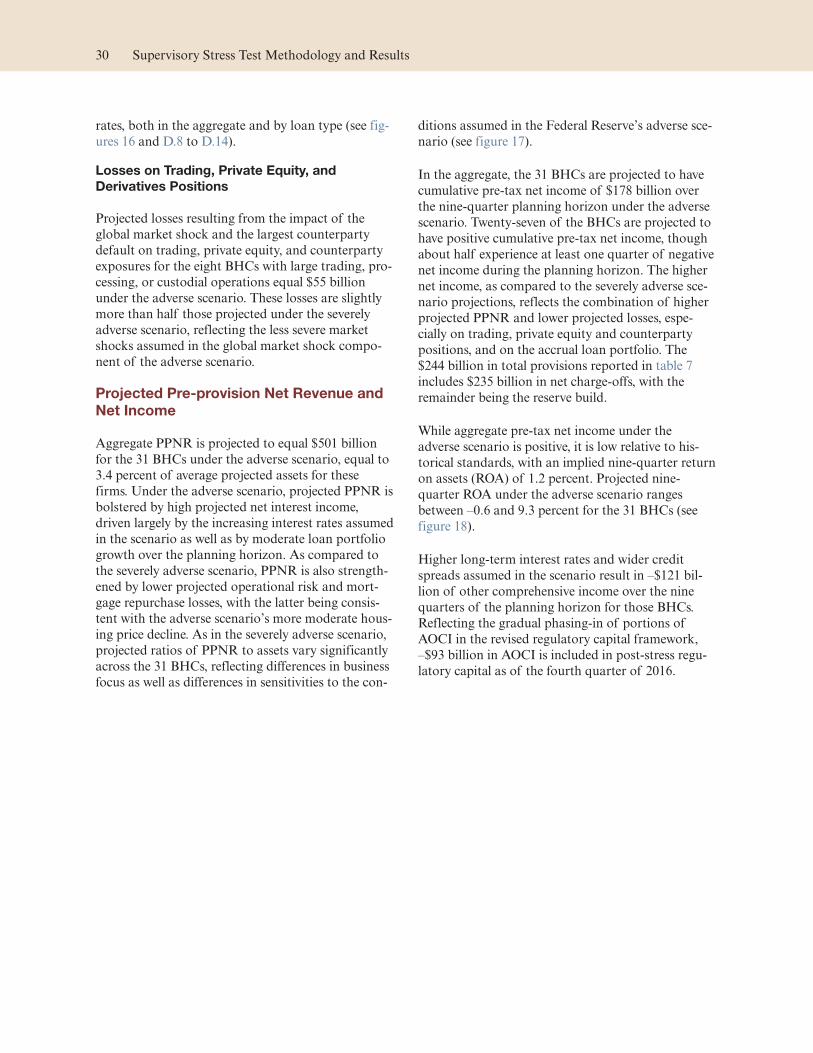
rates, both in the aggregate and by loan type (see fig-
ures 16 and D.8 to D.14).
Losses on Trading, Private Equity, and
Derivatives Positions
Projected losses resulting from the impact of the
global market shock and the largest counterparty
default on trading, private equity, and counterparty
exposures for the eight BHCs with large trading, pro-
cessing, or custodial operations equal $55 billion
under the adverse scenario. These losses are slightly
more than half those projected under the severely
adverse scenario, reflecting the less severe market
shocks assumed in the global market shock compo-
nent of the adverse scenario.
Projected Pre-provision Net Revenue and
Net Income
Aggregate PPNR is projected to equal $501 billion
for the 31 BHCs under the adverse scenario, equal to
3.4 percent of average projected assets for these
firms. Under the adverse scenario, projected PPNR is
bolstered by high projected net interest income,
driven largely by the increasing interest rates assumed
in the scenario as well as by moderate loan portfolio
growth over the planning horizon. As compared to
the severely adverse scenario, PPNR is also strength-
ened by lower projected operational risk and mort-
gage repurchase losses, with the latter being consis-
tent with the adverse scenario’s more moderate hous-
ing price decline. As in the severely adverse scenario,
projected ratios of PPNR to assets vary significantly
across the 31 BHCs, reflecting differences in business
focus as well as differences in sensitivities to the con-
ditions assumed in the Federal Reserve’s adverse sce-
nario (see figure 17).
In the aggregate, the 31 BHCs are projected to have
cumulative pre-tax net income of $178 billion over
the nine-quarter planning horizon under the adverse
scenario. Twenty-seven of the BHCs are projected to
have positive cumulative pre-tax net income, though
about half experience at least one quarter of negative
net income during the planning horizon. The higher
net income, as compared to the severely adverse sce-
nario projections, reflects the combination of higher
projected PPNR and lower projected losses, espe-
cially on trading, private equity and counterparty
positions, and on the accrual loan portfolio. The
$244 billion in total provisions reported in table 7
includes $235 billion in net charge-offs, with the
remainder being the reserve build.
While aggregate pre-tax net income under the
adverse scenario is positive, it is low relative to his-
torical standards, with an implied nine-quarter return
on assets (ROA) of 1.2 percent. Projected nine-
quarter ROA under the adverse scenario ranges
between –0.6 and 9.3 percent for the 31 BHCs (see
figure 18).
Higher long-term interest rates and wider credit
spreads assumed in the scenario result in –$121 bil-
lion of other comprehensive income over the nine
quarters of the planning horizon for those BHCs.
Reflecting the gradual phasing-in of portions of
AOCI in the revised regulatory capital framework,
–$93 billion in AOCI is included in post-stress regu-
latory capital as of the fourth quarter of 2016.
30 Supervisory Stress Test Methodology and Results

Table 7. 31 participating bank holding companies
Projected stressed capital ratios, risk-weighted assets, losses, revenues, net income beforetaxes, and loan lossesFederal Reserve estimates: Adverse scenario
Actual 2014:Q3 projected stressed capital ratios through2016:Q4
Actual2014:Q3
Stressed capital ratios1
Ending Minimum
Tier 1 common ratio (%) 11.9 11.7 10.8
Common equity tier 1 capital ratio (%)2 n/a 9.8 9.5
Tier 1 risk-based capital ratio (%) 13.5 10.8 10.4
Total risk-based capital ratio (%) 16.2 13.0 12.8
Tier 1 leverage ratio (%) 8.8 7.3 7.2
1 The capital ratios are calculated using capital action assumptions providedwithin the Dodd-Frank Act stress testing rule. These projections representhypothetical estimates that involve an economic outcome that is more adversethan expected. These estimates are not forecasts of expected losses, revenues,net income before taxes, or capital ratios. The minimum capital ratio presentedis for the period 2014:Q4 to 2016:Q4.
2 Advanced approaches bank holding companies (BHCs) are subject to thecommon equity tier 1 ratio for the third and fourth quarter of 2014. All bankholding companies are subject to the common equity tier 1 ratio for eachquarter of 2015 and 2016. An advanced approaches BHC includes any BHCthat has consolidated total assets greater than or equal to $250 billion orconsolidated total on-balance sheet foreign exposure of at least $10 billion.See 12 CFR 217.100(b)(1). Other BHCs include any BHC that is subject to12 CFR 225.8 and is not an advanced approaches BHC.
n/a Not applicable.
Projected loan losses, by type of loan, 2014:Q4–2016:Q4
Billions ofdollars
Portfolio lossrates (%)1
Loan losses 234.9 4.1
First-lien mortgages, domestic 27.9 2.5
Junior liens and HELOCs, domestic 22.7 5.3
Commercial and industrial2 42.5 3.4
Commercial real estate, domestic 30.9 5.0
Credit cards 67.1 10.5
Other consumer3 27.6 4.5
Other loans4 16.3 1.7
1 Average loan balances used to calculate portfolio loss rates exclude loans heldfor sale and loans held for investment under the fair-value option and arecalculated over nine quarters.
2 Commercial and industrial loans include small- and medium-enterprise loansand corporate cards.
3 Other consumer loans include student loans and automobile loans.4 Other loans include international real estate loans.
Actual 2014:Q3 and projected 2016:Q4 risk-weightedassets
Actual2014:Q3
Projected 2016:Q4
Generalapproach
Standardizedapproach
Risk-weighted assets(billions of dollars)1 8,790.2 9,430.4 10,262.0
1 For each quarter in 2014, risk-weighted assets are calculated using thegeneral risk-based capital approach set forth in 12 CFR 225, appendix A. Foreach quarter in 2015 and 2016, risk-weighted assets are calculated under theBoard’s standardized capital risk-based approach in 12 CFR 217, subpart D,except for the risk-weighted assets used to calculate the tier 1 common ratio,which uses the general risk-based capital approach for all quarters.
Projected losses, revenue, net income and othercomprehensive income through 2016:Q4
Billions ofdollars
Percent ofaverage assets1
Pre-provision net revenue2 501.3 3.4
Other revenue3 0.0
less
Provisions 244.0
Realized losses/gains on securities (AFS/HTM) 8.6
Trading and counterparty losses4 54.9
Other losses/gains5 16.0
equals
Net income before taxes 177.8 1.2
Memo items
Other comprehensive income6 -120.5
Other effects on capital Actual 2014:Q3 2016:Q4
AOCI included in capital (billions of dollars)7 n/a -92.7
1 Average assets is the nine-quarter average of total assets.2 Pre-provision net revenue includes losses from operational-risk events,
mortgage repurchase expenses, and other real estate owned (OREO) costs.3 Other revenue includes one-time income and (expense) items not included in
pre-provision net revenue.4 Trading and counterparty losses include mark-to-market and credit valuation
adjustments (CVA) losses and losses arising from the counterparty defaultscenario component applied to derivatives, securities lending, and repurchaseagreement activities.
5 Other losses/gains includes projected change in fair value of loans held for saleand loans held for investment measured under the fair-value option, andgoodwill impairment losses.
6 Other comprehensive income (OCI) is only calculated for advanced approachesBHCs, and other BHCs that opt into the advanced approaches treatment ofAOCI.
7 Certain AOCI items are subject to transition into projected regulatory capital.Those transitions are 20 percent included in projected regulatory capital for2014, 40 percent included in projected regulatory capital for 2015, and60 percent included in projected regulatory capital for 2016.
March 2015 31
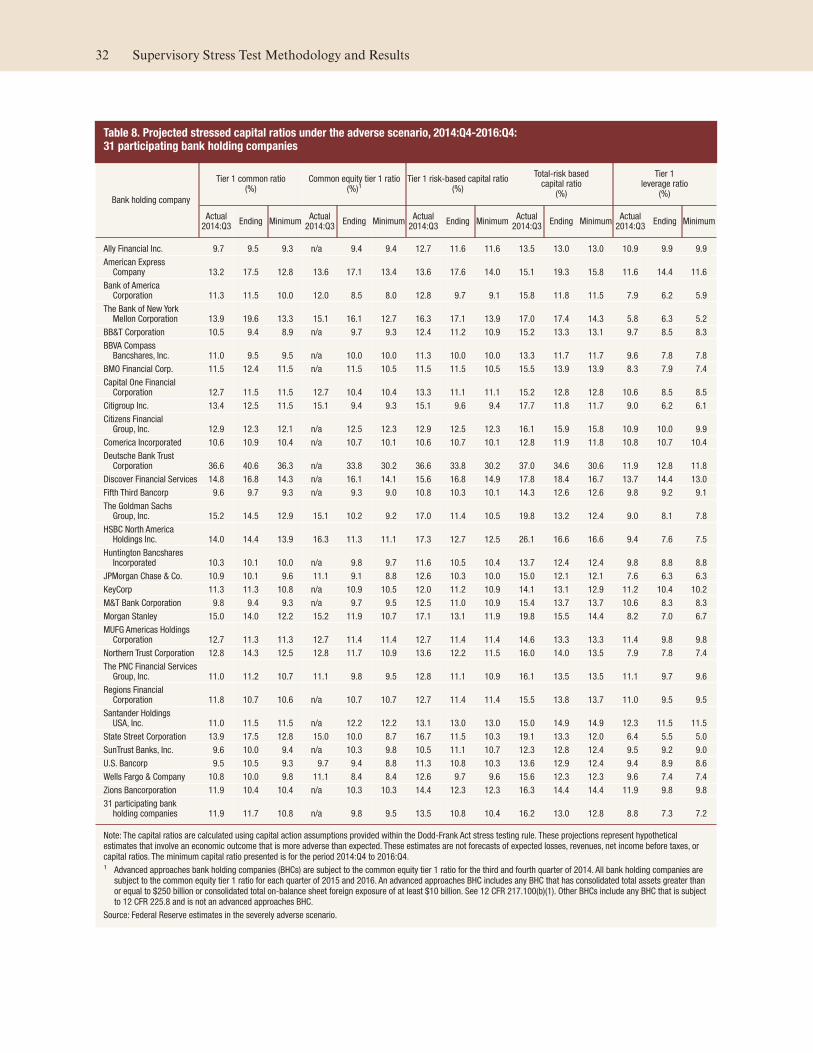
Table 8. Projected stressed capital ratios under the adverse scenario, 2014:Q4-2016:Q4:31 participating bank holding companies
Bank holding company
Tier 1 common ratio(%)
Common equity tier 1 ratio(%)1
Tier 1 risk-based capital ratio(%)
Total-risk basedcapital ratio
(%)
Tier 1leverage ratio
(%)
Actual2014:Q3
Ending MinimumActual2014:Q3
Ending MinimumActual2014:Q3
Ending MinimumActual2014:Q3
Ending MinimumActual2014:Q3
Ending Minimum
Ally Financial Inc. 9.7 9.5 9.3 n/a 9.4 9.4 12.7 11.6 11.6 13.5 13.0 13.0 10.9 9.9 9.9
American ExpressCompany 13.2 17.5 12.8 13.6 17.1 13.4 13.6 17.6 14.0 15.1 19.3 15.8 11.6 14.4 11.6
Bank of AmericaCorporation 11.3 11.5 10.0 12.0 8.5 8.0 12.8 9.7 9.1 15.8 11.8 11.5 7.9 6.2 5.9
The Bank of New YorkMellon Corporation 13.9 19.6 13.3 15.1 16.1 12.7 16.3 17.1 13.9 17.0 17.4 14.3 5.8 6.3 5.2
BB&T Corporation 10.5 9.4 8.9 n/a 9.7 9.3 12.4 11.2 10.9 15.2 13.3 13.1 9.7 8.5 8.3
BBVA CompassBancshares, Inc. 11.0 9.5 9.5 n/a 10.0 10.0 11.3 10.0 10.0 13.3 11.7 11.7 9.6 7.8 7.8
BMO Financial Corp. 11.5 12.4 11.5 n/a 11.5 10.5 11.5 11.5 10.5 15.5 13.9 13.9 8.3 7.9 7.4
Capital One FinancialCorporation 12.7 11.5 11.5 12.7 10.4 10.4 13.3 11.1 11.1 15.2 12.8 12.8 10.6 8.5 8.5
Citigroup Inc. 13.4 12.5 11.5 15.1 9.4 9.3 15.1 9.6 9.4 17.7 11.8 11.7 9.0 6.2 6.1
Citizens FinancialGroup, Inc. 12.9 12.3 12.1 n/a 12.5 12.3 12.9 12.5 12.3 16.1 15.9 15.8 10.9 10.0 9.9
Comerica Incorporated 10.6 10.9 10.4 n/a 10.7 10.1 10.6 10.7 10.1 12.8 11.9 11.8 10.8 10.7 10.4
Deutsche Bank TrustCorporation 36.6 40.6 36.3 n/a 33.8 30.2 36.6 33.8 30.2 37.0 34.6 30.6 11.9 12.8 11.8
Discover Financial Services 14.8 16.8 14.3 n/a 16.1 14.1 15.6 16.8 14.9 17.8 18.4 16.7 13.7 14.4 13.0
Fifth Third Bancorp 9.6 9.7 9.3 n/a 9.3 9.0 10.8 10.3 10.1 14.3 12.6 12.6 9.8 9.2 9.1
The Goldman SachsGroup, Inc. 15.2 14.5 12.9 15.1 10.2 9.2 17.0 11.4 10.5 19.8 13.2 12.4 9.0 8.1 7.8
HSBC North AmericaHoldings Inc. 14.0 14.4 13.9 16.3 11.3 11.1 17.3 12.7 12.5 26.1 16.6 16.6 9.4 7.6 7.5
Huntington BancsharesIncorporated 10.3 10.1 10.0 n/a 9.8 9.7 11.6 10.5 10.4 13.7 12.4 12.4 9.8 8.8 8.8
JPMorgan Chase & Co. 10.9 10.1 9.6 11.1 9.1 8.8 12.6 10.3 10.0 15.0 12.1 12.1 7.6 6.3 6.3
KeyCorp 11.3 11.3 10.8 n/a 10.9 10.5 12.0 11.2 10.9 14.1 13.1 12.9 11.2 10.4 10.2
M&T Bank Corporation 9.8 9.4 9.3 n/a 9.7 9.5 12.5 11.0 10.9 15.4 13.7 13.7 10.6 8.3 8.3
Morgan Stanley 15.0 14.0 12.2 15.2 11.9 10.7 17.1 13.1 11.9 19.8 15.5 14.4 8.2 7.0 6.7
MUFG Americas HoldingsCorporation 12.7 11.3 11.3 12.7 11.4 11.4 12.7 11.4 11.4 14.6 13.3 13.3 11.4 9.8 9.8
Northern Trust Corporation 12.8 14.3 12.5 12.8 11.7 10.9 13.6 12.2 11.5 16.0 14.0 13.5 7.9 7.8 7.4
The PNC Financial ServicesGroup, Inc. 11.0 11.2 10.7 11.1 9.8 9.5 12.8 11.1 10.9 16.1 13.5 13.5 11.1 9.7 9.6
Regions FinancialCorporation 11.8 10.7 10.6 n/a 10.7 10.7 12.7 11.4 11.4 15.5 13.8 13.7 11.0 9.5 9.5
Santander HoldingsUSA, Inc. 11.0 11.5 11.5 n/a 12.2 12.2 13.1 13.0 13.0 15.0 14.9 14.9 12.3 11.5 11.5
State Street Corporation 13.9 17.5 12.8 15.0 10.0 8.7 16.7 11.5 10.3 19.1 13.3 12.0 6.4 5.5 5.0
SunTrust Banks, Inc. 9.6 10.0 9.4 n/a 10.3 9.8 10.5 11.1 10.7 12.3 12.8 12.4 9.5 9.2 9.0
U.S. Bancorp 9.5 10.5 9.3 9.7 9.4 8.8 11.3 10.8 10.3 13.6 12.9 12.4 9.4 8.9 8.6
Wells Fargo & Company 10.8 10.0 9.8 11.1 8.4 8.4 12.6 9.7 9.6 15.6 12.3 12.3 9.6 7.4 7.4
Zions Bancorporation 11.9 10.4 10.4 n/a 10.3 10.3 14.4 12.3 12.3 16.3 14.4 14.4 11.9 9.8 9.8
31 participating bankholding companies 11.9 11.7 10.8 n/a 9.8 9.5 13.5 10.8 10.4 16.2 13.0 12.8 8.8 7.3 7.2
Note: The capital ratios are calculated using capital action assumptions provided within the Dodd-Frank Act stress testing rule. These projections represent hypotheticalestimates that involve an economic outcome that is more adverse than expected. These estimates are not forecasts of expected losses, revenues, net income before taxes, orcapital ratios. The minimum capital ratio presented is for the period 2014:Q4 to 2016:Q4.1 Advanced approaches bank holding companies (BHCs) are subject to the common equity tier 1 ratio for the third and fourth quarter of 2014. All bank holding companies are
subject to the common equity tier 1 ratio for each quarter of 2015 and 2016. An advanced approaches BHC includes any BHC that has consolidated total assets greater thanor equal to $250 billion or consolidated total on-balance sheet foreign exposure of at least $10 billion. See 12 CFR 217.100(b)(1). Other BHCs include any BHC that is subjectto 12 CFR 225.8 and is not an advanced approaches BHC.
Source: Federal Reserve estimates in the severely adverse scenario.
32 Supervisory Stress Test Methodology and Results
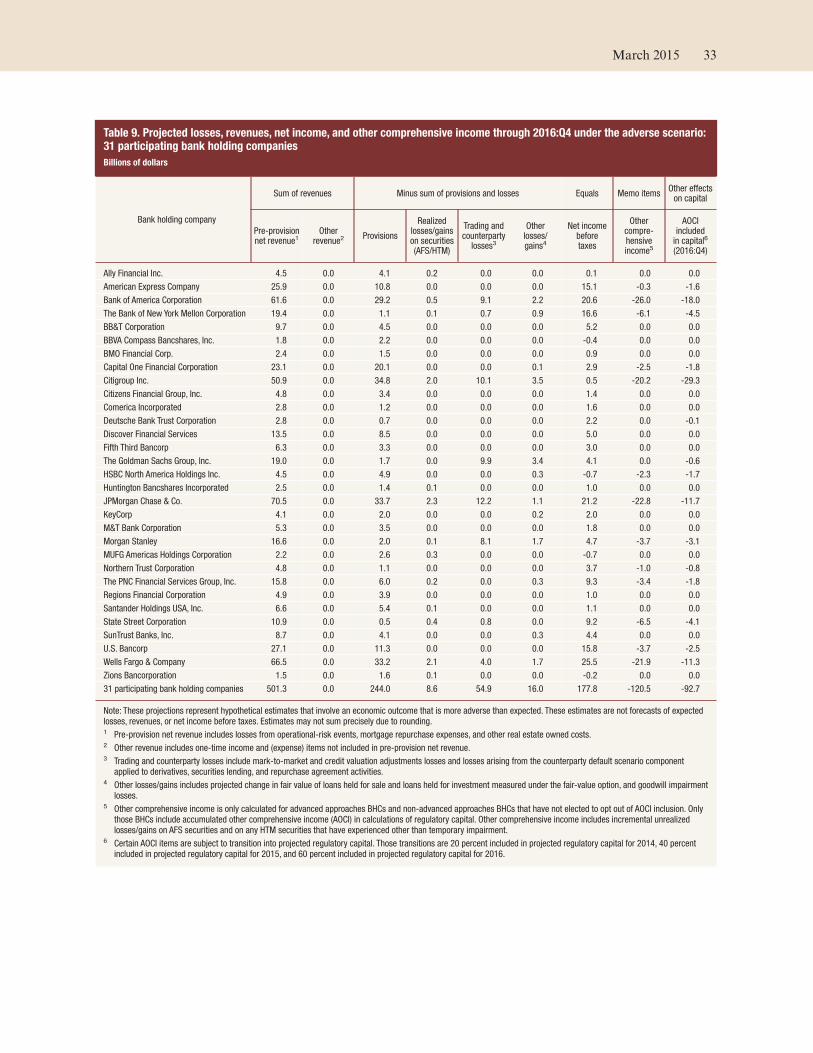
Table 9. Projected losses, revenues, net income, and other comprehensive income through 2016:Q4 under the adverse scenario:31 participating bank holding companies
Billions of dollars
Bank holding company
Sum of revenues Minus sum of provisions and losses Equals Memo itemsOther effectson capital
Pre-provisionnet revenue1
Otherrevenue2
Provisions
Realizedlosses/gainson securities(AFS/HTM)
Trading andcounterpartylosses3
Otherlosses/gains4
Net incomebeforetaxes
Othercompre-hensiveincome5
AOCIincludedin capital6
(2016:Q4)
Ally Financial Inc. 4.5 0.0 4.1 0.2 0.0 0.0 0.1 0.0 0.0
American Express Company 25.9 0.0 10.8 0.0 0.0 0.0 15.1 -0.3 -1.6
Bank of America Corporation 61.6 0.0 29.2 0.5 9.1 2.2 20.6 -26.0 -18.0
The Bank of New York Mellon Corporation 19.4 0.0 1.1 0.1 0.7 0.9 16.6 -6.1 -4.5
BB&T Corporation 9.7 0.0 4.5 0.0 0.0 0.0 5.2 0.0 0.0
BBVA Compass Bancshares, Inc. 1.8 0.0 2.2 0.0 0.0 0.0 -0.4 0.0 0.0
BMO Financial Corp. 2.4 0.0 1.5 0.0 0.0 0.0 0.9 0.0 0.0
Capital One Financial Corporation 23.1 0.0 20.1 0.0 0.0 0.1 2.9 -2.5 -1.8
Citigroup Inc. 50.9 0.0 34.8 2.0 10.1 3.5 0.5 -20.2 -29.3
Citizens Financial Group, Inc. 4.8 0.0 3.4 0.0 0.0 0.0 1.4 0.0 0.0
Comerica Incorporated 2.8 0.0 1.2 0.0 0.0 0.0 1.6 0.0 0.0
Deutsche Bank Trust Corporation 2.8 0.0 0.7 0.0 0.0 0.0 2.2 0.0 -0.1
Discover Financial Services 13.5 0.0 8.5 0.0 0.0 0.0 5.0 0.0 0.0
Fifth Third Bancorp 6.3 0.0 3.3 0.0 0.0 0.0 3.0 0.0 0.0
The Goldman Sachs Group, Inc. 19.0 0.0 1.7 0.0 9.9 3.4 4.1 0.0 -0.6
HSBC North America Holdings Inc. 4.5 0.0 4.9 0.0 0.0 0.3 -0.7 -2.3 -1.7
Huntington Bancshares Incorporated 2.5 0.0 1.4 0.1 0.0 0.0 1.0 0.0 0.0
JPMorgan Chase & Co. 70.5 0.0 33.7 2.3 12.2 1.1 21.2 -22.8 -11.7
KeyCorp 4.1 0.0 2.0 0.0 0.0 0.2 2.0 0.0 0.0
M&T Bank Corporation 5.3 0.0 3.5 0.0 0.0 0.0 1.8 0.0 0.0
Morgan Stanley 16.6 0.0 2.0 0.1 8.1 1.7 4.7 -3.7 -3.1
MUFG Americas Holdings Corporation 2.2 0.0 2.6 0.3 0.0 0.0 -0.7 0.0 0.0
Northern Trust Corporation 4.8 0.0 1.1 0.0 0.0 0.0 3.7 -1.0 -0.8
The PNC Financial Services Group, Inc. 15.8 0.0 6.0 0.2 0.0 0.3 9.3 -3.4 -1.8
Regions Financial Corporation 4.9 0.0 3.9 0.0 0.0 0.0 1.0 0.0 0.0
Santander Holdings USA, Inc. 6.6 0.0 5.4 0.1 0.0 0.0 1.1 0.0 0.0
State Street Corporation 10.9 0.0 0.5 0.4 0.8 0.0 9.2 -6.5 -4.1
SunTrust Banks, Inc. 8.7 0.0 4.1 0.0 0.0 0.3 4.4 0.0 0.0
U.S. Bancorp 27.1 0.0 11.3 0.0 0.0 0.0 15.8 -3.7 -2.5
Wells Fargo & Company 66.5 0.0 33.2 2.1 4.0 1.7 25.5 -21.9 -11.3
Zions Bancorporation 1.5 0.0 1.6 0.1 0.0 0.0 -0.2 0.0 0.0
31 participating bank holding companies 501.3 0.0 244.0 8.6 54.9 16.0 177.8 -120.5 -92.7
Note: These projections represent hypothetical estimates that involve an economic outcome that is more adverse than expected. These estimates are not forecasts of expectedlosses, revenues, or net income before taxes. Estimates may not sum precisely due to rounding.1 Pre-provision net revenue includes losses from operational-risk events, mortgage repurchase expenses, and other real estate owned costs.2 Other revenue includes one-time income and (expense) items not included in pre-provision net revenue.3 Trading and counterparty losses include mark-to-market and credit valuation adjustments losses and losses arising from the counterparty default scenario component
applied to derivatives, securities lending, and repurchase agreement activities.4 Other losses/gains includes projected change in fair value of loans held for sale and loans held for investment measured under the fair-value option, and goodwill impairment
losses.5 Other comprehensive income is only calculated for advanced approaches BHCs and non-advanced approaches BHCs that have not elected to opt out of AOCI inclusion. Only
those BHCs include accumulated other comprehensive income (AOCI) in calculations of regulatory capital. Other comprehensive income includes incremental unrealizedlosses/gains on AFS securities and on any HTM securities that have experienced other than temporary impairment.
6 Certain AOCI items are subject to transition into projected regulatory capital. Those transitions are 20 percent included in projected regulatory capital for 2014, 40 percentincluded in projected regulatory capital for 2015, and 60 percent included in projected regulatory capital for 2016.
March 2015 33
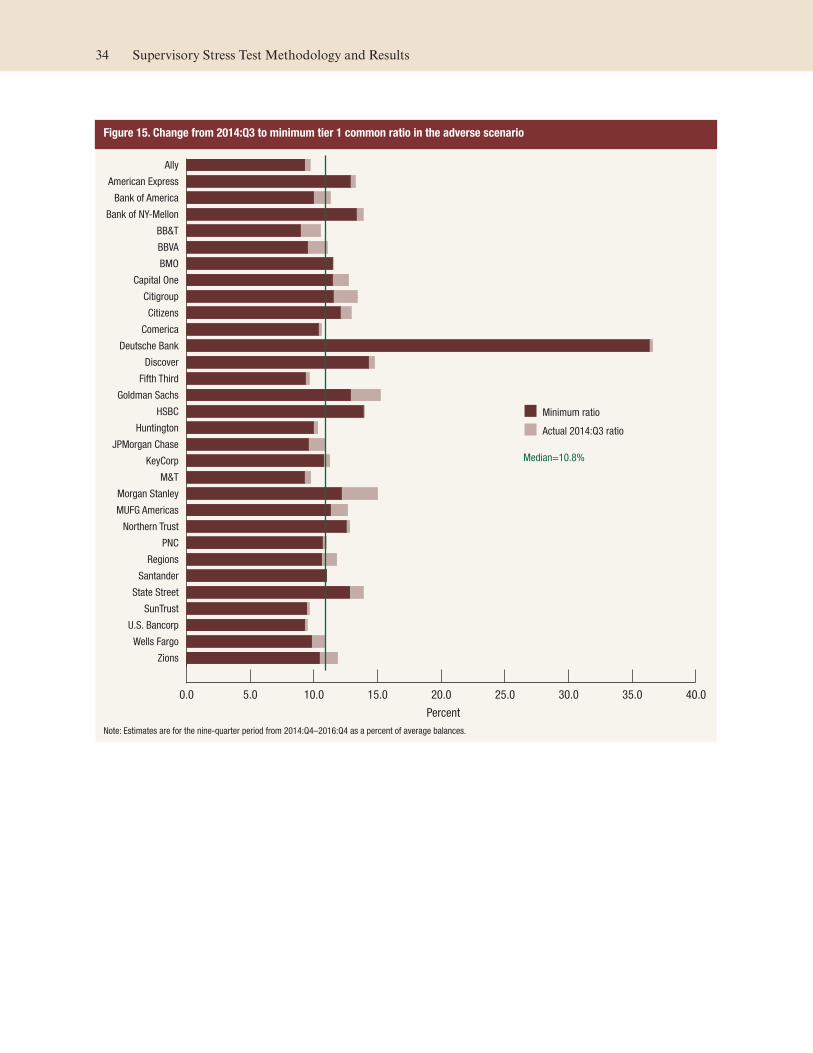
Figure 15. Change from 2014:Q3 to minimum tier 1 common ratio in the adverse scenario
0.0 5.0 10.0 15.0 20.0 25.0 30.0 35.0 40.0
Zions
Wells Fargo
U.S. Bancorp
SunTrust
State Street
Santander
Regions
PNC
Northern Trust
MUFG Americas
Morgan Stanley
M&T
KeyCorp
JPMorgan Chase
Huntington
HSBC
Goldman Sachs
Fifth Third
Discover
Deutsche Bank
Comerica
Citizens
Citigroup
Capital One
BMO
BBVA
BB&T
Bank of NY-Mellon
Bank of America
American Express
Ally
Percent
Median=10.8%
Minimum ratio
Actual 2014:Q3 ratio
Note: Estimates are for the nine-quarter period from 2014:Q4–2016:Q4 as a percent of average balances.
34 Supervisory Stress Test Methodology and Results
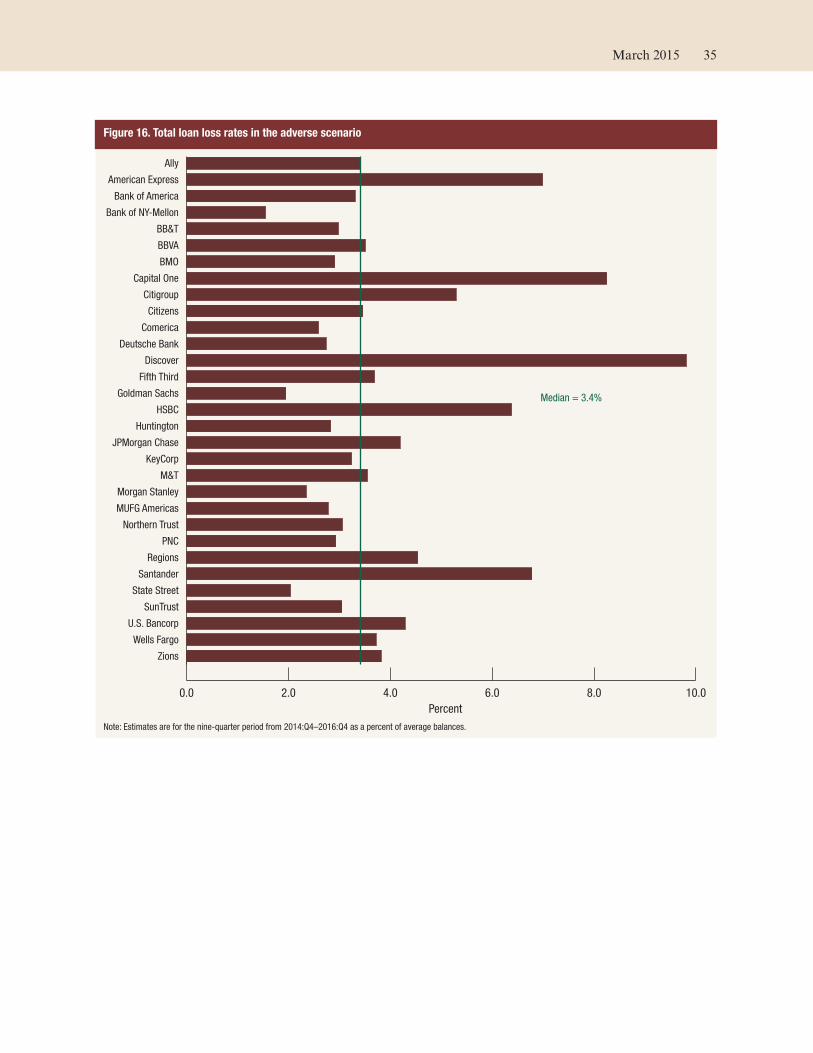
Figure 16. Total loan loss rates in the adverse scenario
0.0 2.0 4.0 6.0 8.0 10.0
Zions
Wells Fargo
U.S. Bancorp
SunTrust
State Street
Santander
Regions
PNC
Northern Trust
MUFG Americas
Morgan Stanley
M&T
KeyCorp
JPMorgan Chase
Huntington
HSBC
Goldman Sachs
Fifth Third
Discover
Deutsche Bank
Comerica
Citizens
Citigroup
Capital One
BMO
BBVA
BB&T
Bank of NY-Mellon
Bank of America
American Express
Ally
Percent
Median = 3.4%
Note: Estimates are for the nine-quarter period from 2014:Q4–2016:Q4 as a percent of average balances.
March 2015 35
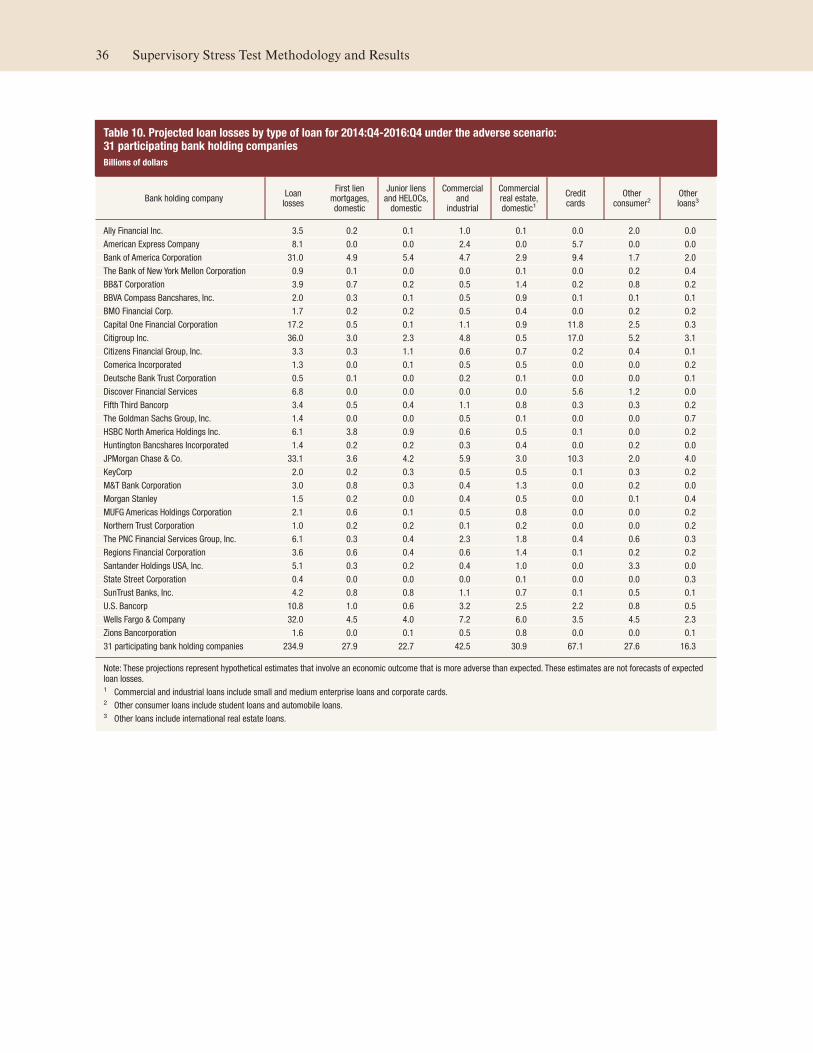
Table 10. Projected loan losses by type of loan for 2014:Q4-2016:Q4 under the adverse scenario:31 participating bank holding companies
Billions of dollars
Bank holding companyLoanlosses
First lienmortgages,domestic
Junior liensand HELOCs,domestic
Commercialand
industrial
Commercialreal estate,domestic1
Creditcards
Otherconsumer2
Otherloans3
Ally Financial Inc. 3.5 0.2 0.1 1.0 0.1 0.0 2.0 0.0
American Express Company 8.1 0.0 0.0 2.4 0.0 5.7 0.0 0.0
Bank of America Corporation 31.0 4.9 5.4 4.7 2.9 9.4 1.7 2.0
The Bank of New York Mellon Corporation 0.9 0.1 0.0 0.0 0.1 0.0 0.2 0.4
BB&T Corporation 3.9 0.7 0.2 0.5 1.4 0.2 0.8 0.2
BBVA Compass Bancshares, Inc. 2.0 0.3 0.1 0.5 0.9 0.1 0.1 0.1
BMO Financial Corp. 1.7 0.2 0.2 0.5 0.4 0.0 0.2 0.2
Capital One Financial Corporation 17.2 0.5 0.1 1.1 0.9 11.8 2.5 0.3
Citigroup Inc. 36.0 3.0 2.3 4.8 0.5 17.0 5.2 3.1
Citizens Financial Group, Inc. 3.3 0.3 1.1 0.6 0.7 0.2 0.4 0.1
Comerica Incorporated 1.3 0.0 0.1 0.5 0.5 0.0 0.0 0.2
Deutsche Bank Trust Corporation 0.5 0.1 0.0 0.2 0.1 0.0 0.0 0.1
Discover Financial Services 6.8 0.0 0.0 0.0 0.0 5.6 1.2 0.0
Fifth Third Bancorp 3.4 0.5 0.4 1.1 0.8 0.3 0.3 0.2
The Goldman Sachs Group, Inc. 1.4 0.0 0.0 0.5 0.1 0.0 0.0 0.7
HSBC North America Holdings Inc. 6.1 3.8 0.9 0.6 0.5 0.1 0.0 0.2
Huntington Bancshares Incorporated 1.4 0.2 0.2 0.3 0.4 0.0 0.2 0.0
JPMorgan Chase & Co. 33.1 3.6 4.2 5.9 3.0 10.3 2.0 4.0
KeyCorp 2.0 0.2 0.3 0.5 0.5 0.1 0.3 0.2
M&T Bank Corporation 3.0 0.8 0.3 0.4 1.3 0.0 0.2 0.0
Morgan Stanley 1.5 0.2 0.0 0.4 0.5 0.0 0.1 0.4
MUFG Americas Holdings Corporation 2.1 0.6 0.1 0.5 0.8 0.0 0.0 0.2
Northern Trust Corporation 1.0 0.2 0.2 0.1 0.2 0.0 0.0 0.2
The PNC Financial Services Group, Inc. 6.1 0.3 0.4 2.3 1.8 0.4 0.6 0.3
Regions Financial Corporation 3.6 0.6 0.4 0.6 1.4 0.1 0.2 0.2
Santander Holdings USA, Inc. 5.1 0.3 0.2 0.4 1.0 0.0 3.3 0.0
State Street Corporation 0.4 0.0 0.0 0.0 0.1 0.0 0.0 0.3
SunTrust Banks, Inc. 4.2 0.8 0.8 1.1 0.7 0.1 0.5 0.1
U.S. Bancorp 10.8 1.0 0.6 3.2 2.5 2.2 0.8 0.5
Wells Fargo & Company 32.0 4.5 4.0 7.2 6.0 3.5 4.5 2.3
Zions Bancorporation 1.6 0.0 0.1 0.5 0.8 0.0 0.0 0.1
31 participating bank holding companies 234.9 27.9 22.7 42.5 30.9 67.1 27.6 16.3
Note: These projections represent hypothetical estimates that involve an economic outcome that is more adverse than expected. These estimates are not forecasts of expectedloan losses.1 Commercial and industrial loans include small and medium enterprise loans and corporate cards.2 Other consumer loans include student loans and automobile loans.3 Other loans include international real estate loans.
36 Supervisory Stress Test Methodology and Results
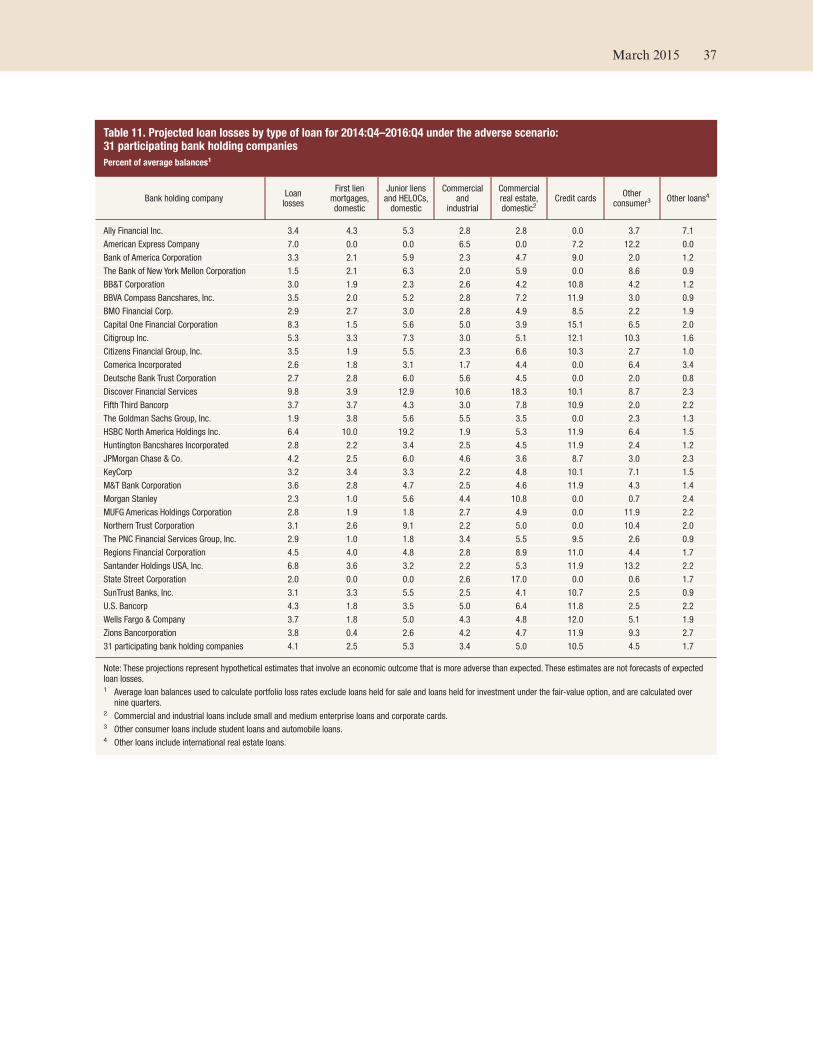
Table 11. Projected loan losses by type of loan for 2014:Q4–2016:Q4 under the adverse scenario:31 participating bank holding companies
Percent of average balances1
Bank holding companyLoanlosses
First lienmortgages,domestic
Junior liensand HELOCs,domestic
Commercialand
industrial
Commercialreal estate,domestic2
Credit cardsOther
consumer3Other loans4
Ally Financial Inc. 3.4 4.3 5.3 2.8 2.8 0.0 3.7 7.1
American Express Company 7.0 0.0 0.0 6.5 0.0 7.2 12.2 0.0
Bank of America Corporation 3.3 2.1 5.9 2.3 4.7 9.0 2.0 1.2
The Bank of New York Mellon Corporation 1.5 2.1 6.3 2.0 5.9 0.0 8.6 0.9
BB&T Corporation 3.0 1.9 2.3 2.6 4.2 10.8 4.2 1.2
BBVA Compass Bancshares, Inc. 3.5 2.0 5.2 2.8 7.2 11.9 3.0 0.9
BMO Financial Corp. 2.9 2.7 3.0 2.8 4.9 8.5 2.2 1.9
Capital One Financial Corporation 8.3 1.5 5.6 5.0 3.9 15.1 6.5 2.0
Citigroup Inc. 5.3 3.3 7.3 3.0 5.1 12.1 10.3 1.6
Citizens Financial Group, Inc. 3.5 1.9 5.5 2.3 6.6 10.3 2.7 1.0
Comerica Incorporated 2.6 1.8 3.1 1.7 4.4 0.0 6.4 3.4
Deutsche Bank Trust Corporation 2.7 2.8 6.0 5.6 4.5 0.0 2.0 0.8
Discover Financial Services 9.8 3.9 12.9 10.6 18.3 10.1 8.7 2.3
Fifth Third Bancorp 3.7 3.7 4.3 3.0 7.8 10.9 2.0 2.2
The Goldman Sachs Group, Inc. 1.9 3.8 5.6 5.5 3.5 0.0 2.3 1.3
HSBC North America Holdings Inc. 6.4 10.0 19.2 1.9 5.3 11.9 6.4 1.5
Huntington Bancshares Incorporated 2.8 2.2 3.4 2.5 4.5 11.9 2.4 1.2
JPMorgan Chase & Co. 4.2 2.5 6.0 4.6 3.6 8.7 3.0 2.3
KeyCorp 3.2 3.4 3.3 2.2 4.8 10.1 7.1 1.5
M&T Bank Corporation 3.6 2.8 4.7 2.5 4.6 11.9 4.3 1.4
Morgan Stanley 2.3 1.0 5.6 4.4 10.8 0.0 0.7 2.4
MUFG Americas Holdings Corporation 2.8 1.9 1.8 2.7 4.9 0.0 11.9 2.2
Northern Trust Corporation 3.1 2.6 9.1 2.2 5.0 0.0 10.4 2.0
The PNC Financial Services Group, Inc. 2.9 1.0 1.8 3.4 5.5 9.5 2.6 0.9
Regions Financial Corporation 4.5 4.0 4.8 2.8 8.9 11.0 4.4 1.7
Santander Holdings USA, Inc. 6.8 3.6 3.2 2.2 5.3 11.9 13.2 2.2
State Street Corporation 2.0 0.0 0.0 2.6 17.0 0.0 0.6 1.7
SunTrust Banks, Inc. 3.1 3.3 5.5 2.5 4.1 10.7 2.5 0.9
U.S. Bancorp 4.3 1.8 3.5 5.0 6.4 11.8 2.5 2.2
Wells Fargo & Company 3.7 1.8 5.0 4.3 4.8 12.0 5.1 1.9
Zions Bancorporation 3.8 0.4 2.6 4.2 4.7 11.9 9.3 2.7
31 participating bank holding companies 4.1 2.5 5.3 3.4 5.0 10.5 4.5 1.7
Note: These projections represent hypothetical estimates that involve an economic outcome that is more adverse than expected. These estimates are not forecasts of expectedloan losses.1 Average loan balances used to calculate portfolio loss rates exclude loans held for sale and loans held for investment under the fair-value option, and are calculated over
nine quarters.2 Commercial and industrial loans include small and medium enterprise loans and corporate cards.3 Other consumer loans include student loans and automobile loans.4 Other loans include international real estate loans.
March 2015 37
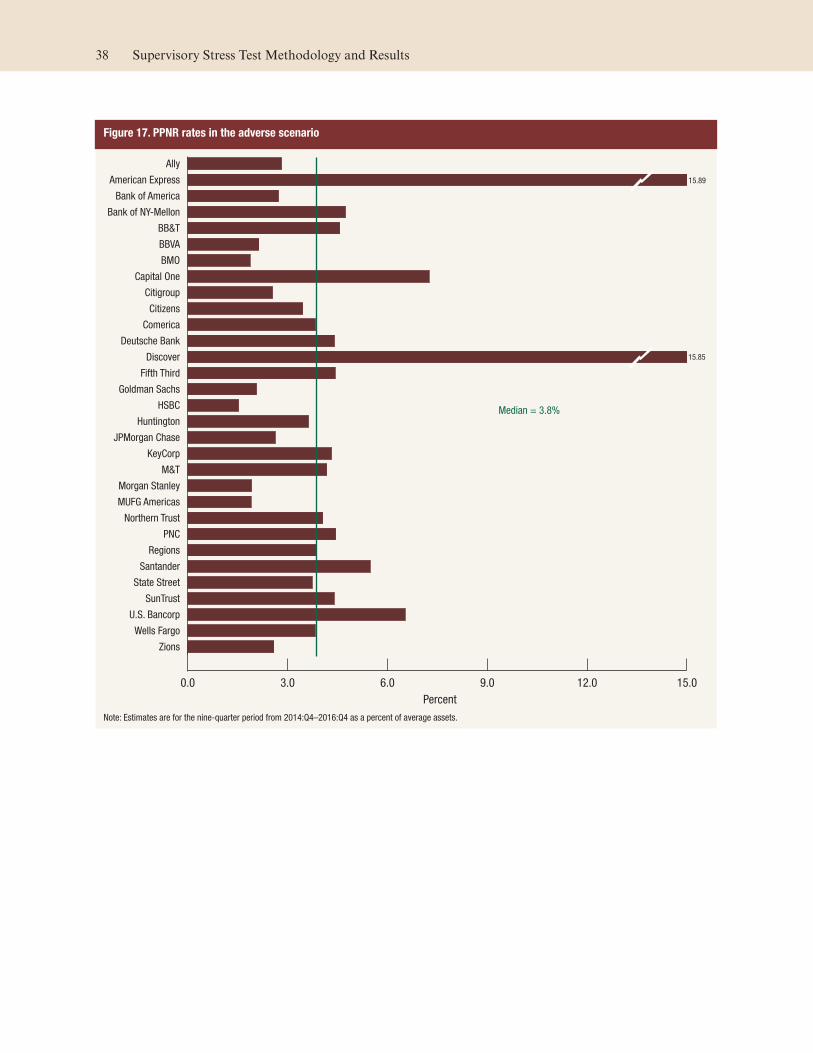
Figure 17. PPNR rates in the adverse scenario
0.0 3.0 6.0 9.0 12.0 15.0
Zions
Wells Fargo
U.S. Bancorp
SunTrust
State Street
Santander
Regions
PNC
Northern Trust
MUFG Americas
Morgan Stanley
M&T
KeyCorp
JPMorgan Chase
Huntington
HSBC
Goldman Sachs
Fifth Third
Discover
Deutsche Bank
Comerica
Citizens
Citigroup
Capital One
BMO
BBVA
BB&T
Bank of NY-Mellon
Bank of America
American Express
Ally
Percent
Median = 3.8%
15.89
15.85
Note: Estimates are for the nine-quarter period from 2014:Q4–2016:Q4 as a percent of average assets.
38 Supervisory Stress Test Methodology and Results
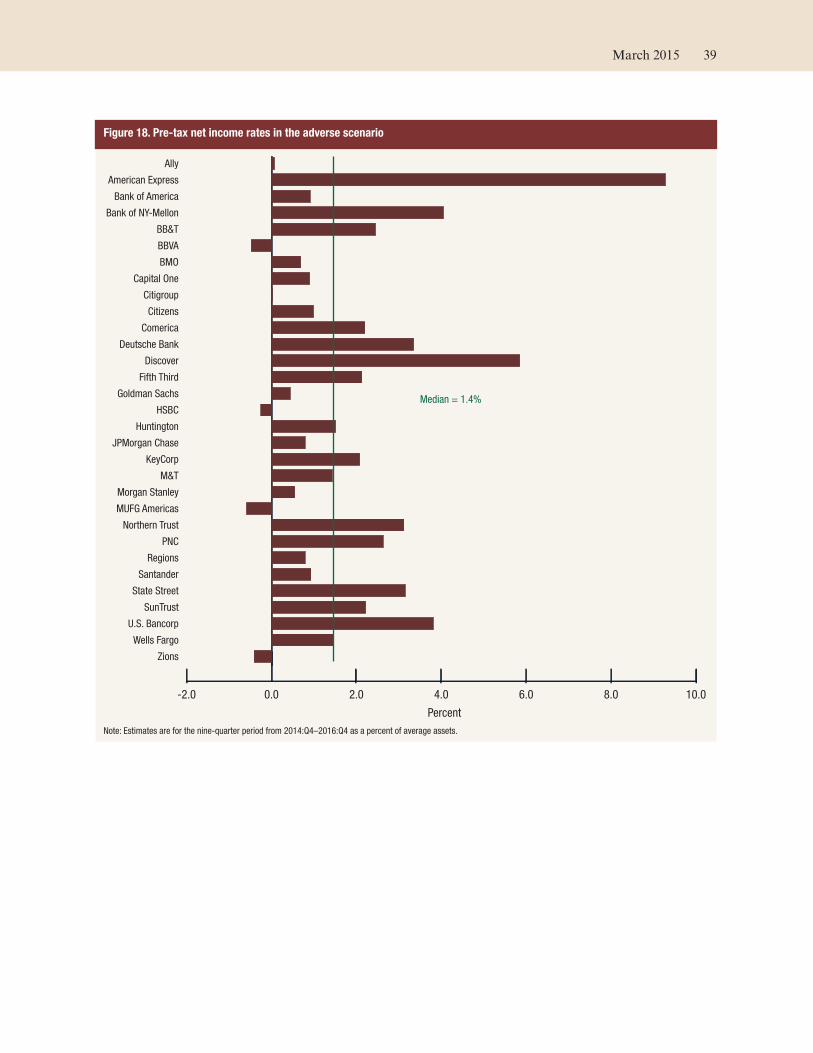
Figure 18. Pre-tax net income rates in the adverse scenario
-2.0 0.0 2.0 4.0 6.0 8.0 10.0
Zions
Wells Fargo
U.S. Bancorp
SunTrust
State Street
Santander
Regions
PNC
Northern Trust
MUFG Americas
Morgan Stanley
M&T
KeyCorp
JPMorgan Chase
Huntington
HSBC
Goldman Sachs
Fifth Third
Discover
Deutsche Bank
Comerica
Citizens
Citigroup
Capital One
BMO
BBVA
BB&T
Bank of NY-Mellon
Bank of America
American Express
Ally
Percent
Median = 1.4%
Note: Estimates are for the nine-quarter period from 2014:Q4–2016:Q4 as a percent of average assets.
March 2015 39

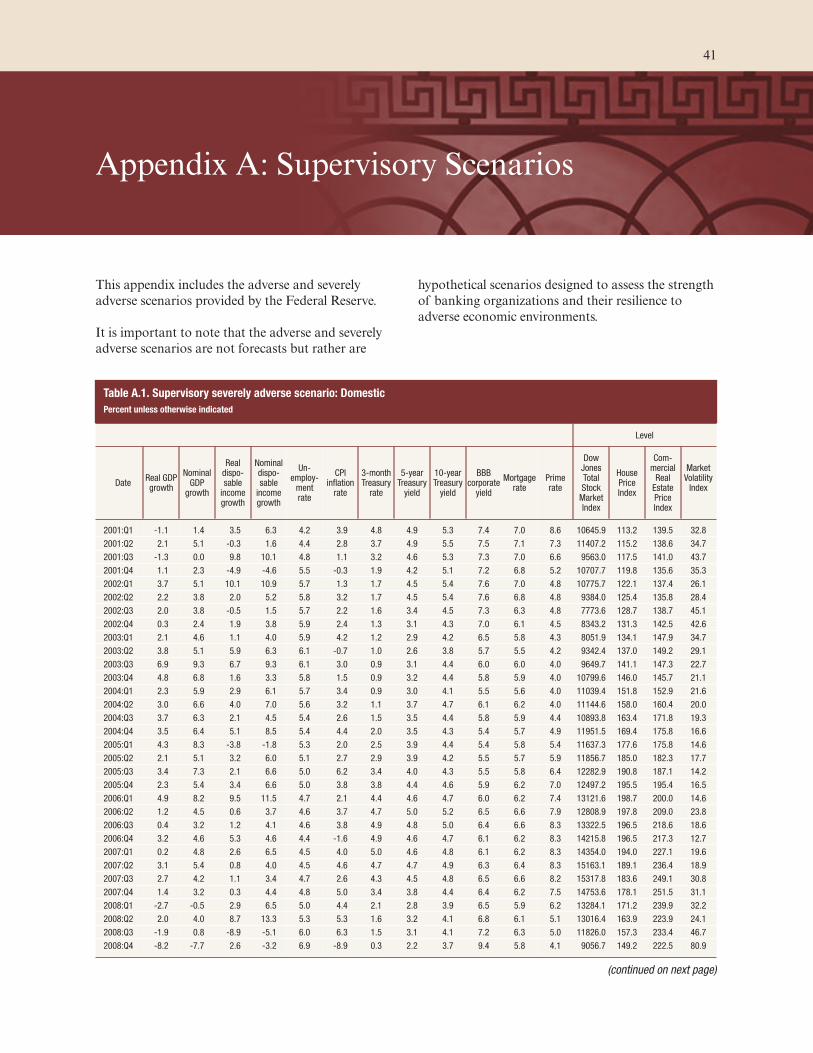
Appendix A: Supervisory Scenarios
This appendix includes the adverse and severely
adverse scenarios provided by the Federal Reserve.
It is important to note that the adverse and severely
adverse scenarios are not forecasts but rather are
hypothetical scenarios designed to assess the strength
of banking organizations and their resilience to
adverse economic environments.
Table A.1. Supervisory severely adverse scenario: Domestic
Percent unless otherwise indicated
Level
DateReal GDPgrowth
NominalGDPgrowth
Realdispo-sableincomegrowth
Nominaldispo-sableincomegrowth
Un-employ-mentrate
CPIinflationrate
3-monthTreasuryrate
5-yearTreasuryyield
10-yearTreasuryyield
BBBcorporateyield
Mortgagerate
Primerate
DowJonesTotalStockMarketIndex
HousePriceIndex
Com-mercialRealEstatePriceIndex
MarketVolatilityIndex
2001:Q1 -1.1 1.4 3.5 6.3 4.2 3.9 4.8 4.9 5.3 7.4 7.0 8.6 10645.9 113.2 139.5 32.8
2001:Q2 2.1 5.1 -0.3 1.6 4.4 2.8 3.7 4.9 5.5 7.5 7.1 7.3 11407.2 115.2 138.6 34.7
2001:Q3 -1.3 0.0 9.8 10.1 4.8 1.1 3.2 4.6 5.3 7.3 7.0 6.6 9563.0 117.5 141.0 43.7
2001:Q4 1.1 2.3 -4.9 -4.6 5.5 -0.3 1.9 4.2 5.1 7.2 6.8 5.2 10707.7 119.8 135.6 35.3
2002:Q1 3.7 5.1 10.1 10.9 5.7 1.3 1.7 4.5 5.4 7.6 7.0 4.8 10775.7 122.1 137.4 26.1
2002:Q2 2.2 3.8 2.0 5.2 5.8 3.2 1.7 4.5 5.4 7.6 6.8 4.8 9384.0 125.4 135.8 28.4
2002:Q3 2.0 3.8 -0.5 1.5 5.7 2.2 1.6 3.4 4.5 7.3 6.3 4.8 7773.6 128.7 138.7 45.1
2002:Q4 0.3 2.4 1.9 3.8 5.9 2.4 1.3 3.1 4.3 7.0 6.1 4.5 8343.2 131.3 142.5 42.6
2003:Q1 2.1 4.6 1.1 4.0 5.9 4.2 1.2 2.9 4.2 6.5 5.8 4.3 8051.9 134.1 147.9 34.7
2003:Q2 3.8 5.1 5.9 6.3 6.1 -0.7 1.0 2.6 3.8 5.7 5.5 4.2 9342.4 137.0 149.2 29.1
2003:Q3 6.9 9.3 6.7 9.3 6.1 3.0 0.9 3.1 4.4 6.0 6.0 4.0 9649.7 141.1 147.3 22.7
2003:Q4 4.8 6.8 1.6 3.3 5.8 1.5 0.9 3.2 4.4 5.8 5.9 4.0 10799.6 146.0 145.7 21.1
2004:Q1 2.3 5.9 2.9 6.1 5.7 3.4 0.9 3.0 4.1 5.5 5.6 4.0 11039.4 151.8 152.9 21.6
2004:Q2 3.0 6.6 4.0 7.0 5.6 3.2 1.1 3.7 4.7 6.1 6.2 4.0 11144.6 158.0 160.4 20.0
2004:Q3 3.7 6.3 2.1 4.5 5.4 2.6 1.5 3.5 4.4 5.8 5.9 4.4 10893.8 163.4 171.8 19.3
2004:Q4 3.5 6.4 5.1 8.5 5.4 4.4 2.0 3.5 4.3 5.4 5.7 4.9 11951.5 169.4 175.8 16.6
2005:Q1 4.3 8.3 -3.8 -1.8 5.3 2.0 2.5 3.9 4.4 5.4 5.8 5.4 11637.3 177.6 175.8 14.6
2005:Q2 2.1 5.1 3.2 6.0 5.1 2.7 2.9 3.9 4.2 5.5 5.7 5.9 11856.7 185.0 182.3 17.7
2005:Q3 3.4 7.3 2.1 6.6 5.0 6.2 3.4 4.0 4.3 5.5 5.8 6.4 12282.9 190.8 187.1 14.2
2005:Q4 2.3 5.4 3.4 6.6 5.0 3.8 3.8 4.4 4.6 5.9 6.2 7.0 12497.2 195.5 195.4 16.5
2006:Q1 4.9 8.2 9.5 11.5 4.7 2.1 4.4 4.6 4.7 6.0 6.2 7.4 13121.6 198.7 200.0 14.6
2006:Q2 1.2 4.5 0.6 3.7 4.6 3.7 4.7 5.0 5.2 6.5 6.6 7.9 12808.9 197.8 209.0 23.8
2006:Q3 0.4 3.2 1.2 4.1 4.6 3.8 4.9 4.8 5.0 6.4 6.6 8.3 13322.5 196.5 218.6 18.6
2006:Q4 3.2 4.6 5.3 4.6 4.4 -1.6 4.9 4.6 4.7 6.1 6.2 8.3 14215.8 196.5 217.3 12.7
2007:Q1 0.2 4.8 2.6 6.5 4.5 4.0 5.0 4.6 4.8 6.1 6.2 8.3 14354.0 194.0 227.1 19.6
2007:Q2 3.1 5.4 0.8 4.0 4.5 4.6 4.7 4.7 4.9 6.3 6.4 8.3 15163.1 189.1 236.4 18.9
2007:Q3 2.7 4.2 1.1 3.4 4.7 2.6 4.3 4.5 4.8 6.5 6.6 8.2 15317.8 183.6 249.1 30.8
2007:Q4 1.4 3.2 0.3 4.4 4.8 5.0 3.4 3.8 4.4 6.4 6.2 7.5 14753.6 178.1 251.5 31.1
2008:Q1 -2.7 -0.5 2.9 6.5 5.0 4.4 2.1 2.8 3.9 6.5 5.9 6.2 13284.1 171.2 239.9 32.2
2008:Q2 2.0 4.0 8.7 13.3 5.3 5.3 1.6 3.2 4.1 6.8 6.1 5.1 13016.4 163.9 223.9 24.1
2008:Q3 -1.9 0.8 -8.9 -5.1 6.0 6.3 1.5 3.1 4.1 7.2 6.3 5.0 11826.0 157.3 233.4 46.7
2008:Q4 -8.2 -7.7 2.6 -3.2 6.9 -8.9 0.3 2.2 3.7 9.4 5.8 4.1 9056.7 149.2 222.5 80.9
(continued on next page)
41
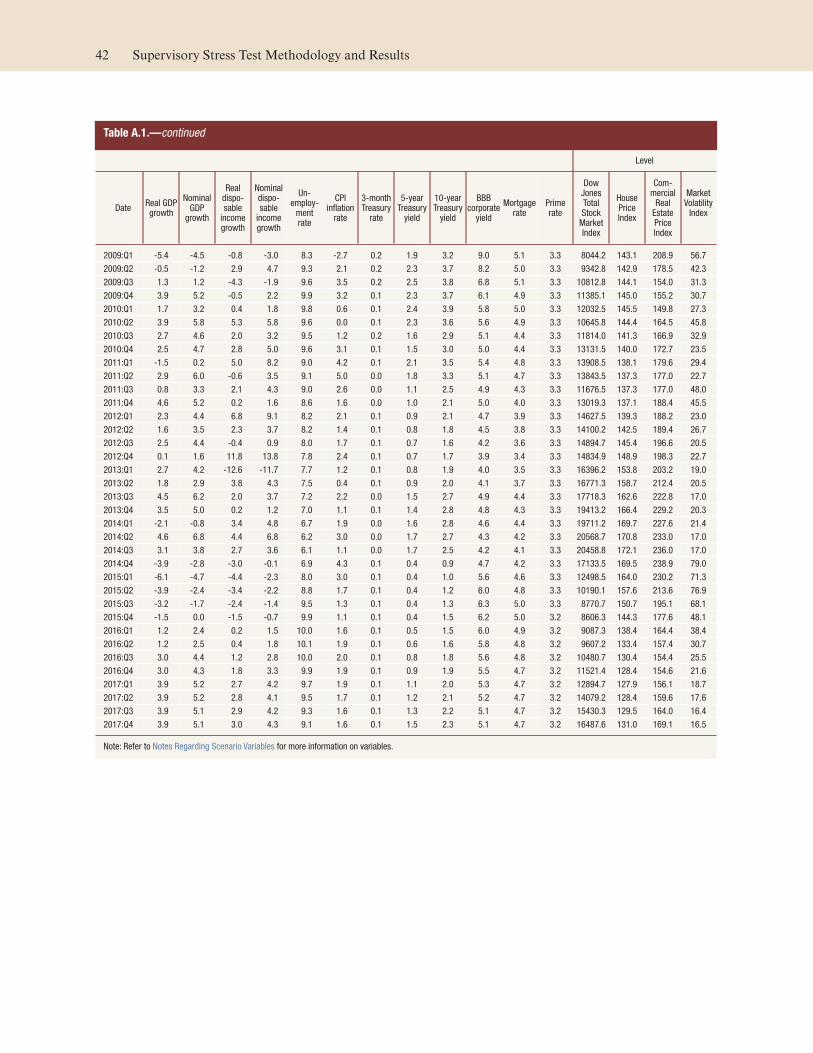
Table A.1.—continued
Level
DateReal GDPgrowth
NominalGDPgrowth
Realdispo-sableincomegrowth
Nominaldispo-sableincomegrowth
Un-employ-mentrate
CPIinflationrate
3-monthTreasuryrate
5-yearTreasuryyield
10-yearTreasuryyield
BBBcorporateyield
Mortgagerate
Primerate
DowJonesTotalStockMarketIndex
HousePriceIndex
Com-mercialRealEstatePriceIndex
MarketVolatilityIndex
2009:Q1 -5.4 -4.5 -0.8 -3.0 8.3 -2.7 0.2 1.9 3.2 9.0 5.1 3.3 8044.2 143.1 208.9 56.7
2009:Q2 -0.5 -1.2 2.9 4.7 9.3 2.1 0.2 2.3 3.7 8.2 5.0 3.3 9342.8 142.9 178.5 42.3
2009:Q3 1.3 1.2 -4.3 -1.9 9.6 3.5 0.2 2.5 3.8 6.8 5.1 3.3 10812.8 144.1 154.0 31.3
2009:Q4 3.9 5.2 -0.5 2.2 9.9 3.2 0.1 2.3 3.7 6.1 4.9 3.3 11385.1 145.0 155.2 30.7
2010:Q1 1.7 3.2 0.4 1.8 9.8 0.6 0.1 2.4 3.9 5.8 5.0 3.3 12032.5 145.5 149.8 27.3
2010:Q2 3.9 5.8 5.3 5.8 9.6 0.0 0.1 2.3 3.6 5.6 4.9 3.3 10645.8 144.4 164.5 45.8
2010:Q3 2.7 4.6 2.0 3.2 9.5 1.2 0.2 1.6 2.9 5.1 4.4 3.3 11814.0 141.3 166.9 32.9
2010:Q4 2.5 4.7 2.8 5.0 9.6 3.1 0.1 1.5 3.0 5.0 4.4 3.3 13131.5 140.0 172.7 23.5
2011:Q1 -1.5 0.2 5.0 8.2 9.0 4.2 0.1 2.1 3.5 5.4 4.8 3.3 13908.5 138.1 179.6 29.4
2011:Q2 2.9 6.0 -0.6 3.5 9.1 5.0 0.0 1.8 3.3 5.1 4.7 3.3 13843.5 137.3 177.0 22.7
2011:Q3 0.8 3.3 2.1 4.3 9.0 2.6 0.0 1.1 2.5 4.9 4.3 3.3 11676.5 137.3 177.0 48.0
2011:Q4 4.6 5.2 0.2 1.6 8.6 1.6 0.0 1.0 2.1 5.0 4.0 3.3 13019.3 137.1 188.4 45.5
2012:Q1 2.3 4.4 6.8 9.1 8.2 2.1 0.1 0.9 2.1 4.7 3.9 3.3 14627.5 139.3 188.2 23.0
2012:Q2 1.6 3.5 2.3 3.7 8.2 1.4 0.1 0.8 1.8 4.5 3.8 3.3 14100.2 142.5 189.4 26.7
2012:Q3 2.5 4.4 -0.4 0.9 8.0 1.7 0.1 0.7 1.6 4.2 3.6 3.3 14894.7 145.4 196.6 20.5
2012:Q4 0.1 1.6 11.8 13.8 7.8 2.4 0.1 0.7 1.7 3.9 3.4 3.3 14834.9 148.9 198.3 22.7
2013:Q1 2.7 4.2 -12.6 -11.7 7.7 1.2 0.1 0.8 1.9 4.0 3.5 3.3 16396.2 153.8 203.2 19.0
2013:Q2 1.8 2.9 3.8 4.3 7.5 0.4 0.1 0.9 2.0 4.1 3.7 3.3 16771.3 158.7 212.4 20.5
2013:Q3 4.5 6.2 2.0 3.7 7.2 2.2 0.0 1.5 2.7 4.9 4.4 3.3 17718.3 162.6 222.8 17.0
2013:Q4 3.5 5.0 0.2 1.2 7.0 1.1 0.1 1.4 2.8 4.8 4.3 3.3 19413.2 166.4 229.2 20.3
2014:Q1 -2.1 -0.8 3.4 4.8 6.7 1.9 0.0 1.6 2.8 4.6 4.4 3.3 19711.2 169.7 227.6 21.4
2014:Q2 4.6 6.8 4.4 6.8 6.2 3.0 0.0 1.7 2.7 4.3 4.2 3.3 20568.7 170.8 233.0 17.0
2014:Q3 3.1 3.8 2.7 3.6 6.1 1.1 0.0 1.7 2.5 4.2 4.1 3.3 20458.8 172.1 236.0 17.0
2014:Q4 -3.9 -2.8 -3.0 -0.1 6.9 4.3 0.1 0.4 0.9 4.7 4.2 3.3 17133.5 169.5 238.9 79.0
2015:Q1 -6.1 -4.7 -4.4 -2.3 8.0 3.0 0.1 0.4 1.0 5.6 4.6 3.3 12498.5 164.0 230.2 71.3
2015:Q2 -3.9 -2.4 -3.4 -2.2 8.8 1.7 0.1 0.4 1.2 6.0 4.8 3.3 10190.1 157.6 213.6 76.9
2015:Q3 -3.2 -1.7 -2.4 -1.4 9.5 1.3 0.1 0.4 1.3 6.3 5.0 3.3 8770.7 150.7 195.1 68.1
2015:Q4 -1.5 0.0 -1.5 -0.7 9.9 1.1 0.1 0.4 1.5 6.2 5.0 3.2 8606.3 144.3 177.6 48.1
2016:Q1 1.2 2.4 0.2 1.5 10.0 1.6 0.1 0.5 1.5 6.0 4.9 3.2 9087.3 138.4 164.4 38.4
2016:Q2 1.2 2.5 0.4 1.8 10.1 1.9 0.1 0.6 1.6 5.8 4.8 3.2 9607.2 133.4 157.4 30.7
2016:Q3 3.0 4.4 1.2 2.8 10.0 2.0 0.1 0.8 1.8 5.6 4.8 3.2 10480.7 130.4 154.4 25.5
2016:Q4 3.0 4.3 1.8 3.3 9.9 1.9 0.1 0.9 1.9 5.5 4.7 3.2 11521.4 128.4 154.6 21.6
2017:Q1 3.9 5.2 2.7 4.2 9.7 1.9 0.1 1.1 2.0 5.3 4.7 3.2 12894.7 127.9 156.1 18.7
2017:Q2 3.9 5.2 2.8 4.1 9.5 1.7 0.1 1.2 2.1 5.2 4.7 3.2 14079.2 128.4 159.6 17.6
2017:Q3 3.9 5.1 2.9 4.2 9.3 1.6 0.1 1.3 2.2 5.1 4.7 3.2 15430.3 129.5 164.0 16.4
2017:Q4 3.9 5.1 3.0 4.3 9.1 1.6 0.1 1.5 2.3 5.1 4.7 3.2 16487.6 131.0 169.1 16.5
Note: Refer to Notes Regarding Scenario Variables for more information on variables.
42 Supervisory Stress Test Methodology and Results
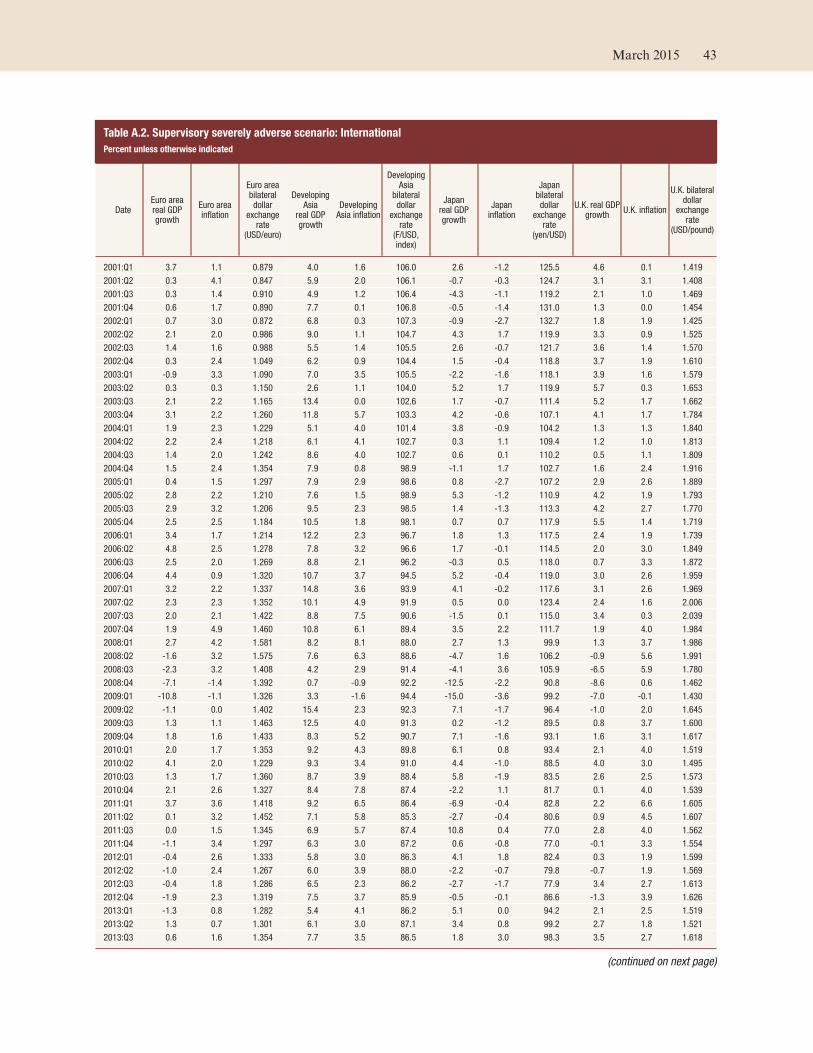
Table A.2. Supervisory severely adverse scenario: International
Percent unless otherwise indicated
DateEuro areareal GDPgrowth
Euro areainflation
Euro areabilateraldollar
exchangerate
(USD/euro)
DevelopingAsia
real GDPgrowth
DevelopingAsia inflation
DevelopingAsia
bilateraldollar
exchangerate
(F/USD,index)
Japanreal GDPgrowth
Japaninflation
Japanbilateraldollar
exchangerate
(yen/USD)
U.K. real GDPgrowth
U.K. inflation
U.K. bilateraldollar
exchangerate
(USD/pound)
2001:Q1 3.7 1.1 0.879 4.0 1.6 106.0 2.6 -1.2 125.5 4.6 0.1 1.419
2001:Q2 0.3 4.1 0.847 5.9 2.0 106.1 -0.7 -0.3 124.7 3.1 3.1 1.408
2001:Q3 0.3 1.4 0.910 4.9 1.2 106.4 -4.3 -1.1 119.2 2.1 1.0 1.469
2001:Q4 0.6 1.7 0.890 7.7 0.1 106.8 -0.5 -1.4 131.0 1.3 0.0 1.454
2002:Q1 0.7 3.0 0.872 6.8 0.3 107.3 -0.9 -2.7 132.7 1.8 1.9 1.425
2002:Q2 2.1 2.0 0.986 9.0 1.1 104.7 4.3 1.7 119.9 3.3 0.9 1.525
2002:Q3 1.4 1.6 0.988 5.5 1.4 105.5 2.6 -0.7 121.7 3.6 1.4 1.570
2002:Q4 0.3 2.4 1.049 6.2 0.9 104.4 1.5 -0.4 118.8 3.7 1.9 1.610
2003:Q1 -0.9 3.3 1.090 7.0 3.5 105.5 -2.2 -1.6 118.1 3.9 1.6 1.579
2003:Q2 0.3 0.3 1.150 2.6 1.1 104.0 5.2 1.7 119.9 5.7 0.3 1.653
2003:Q3 2.1 2.2 1.165 13.4 0.0 102.6 1.7 -0.7 111.4 5.2 1.7 1.662
2003:Q4 3.1 2.2 1.260 11.8 5.7 103.3 4.2 -0.6 107.1 4.1 1.7 1.784
2004:Q1 1.9 2.3 1.229 5.1 4.0 101.4 3.8 -0.9 104.2 1.3 1.3 1.840
2004:Q2 2.2 2.4 1.218 6.1 4.1 102.7 0.3 1.1 109.4 1.2 1.0 1.813
2004:Q3 1.4 2.0 1.242 8.6 4.0 102.7 0.6 0.1 110.2 0.5 1.1 1.809
2004:Q4 1.5 2.4 1.354 7.9 0.8 98.9 -1.1 1.7 102.7 1.6 2.4 1.916
2005:Q1 0.4 1.5 1.297 7.9 2.9 98.6 0.8 -2.7 107.2 2.9 2.6 1.889
2005:Q2 2.8 2.2 1.210 7.6 1.5 98.9 5.3 -1.2 110.9 4.2 1.9 1.793
2005:Q3 2.9 3.2 1.206 9.5 2.3 98.5 1.4 -1.3 113.3 4.2 2.7 1.770
2005:Q4 2.5 2.5 1.184 10.5 1.8 98.1 0.7 0.7 117.9 5.5 1.4 1.719
2006:Q1 3.4 1.7 1.214 12.2 2.3 96.7 1.8 1.3 117.5 2.4 1.9 1.739
2006:Q2 4.8 2.5 1.278 7.8 3.2 96.6 1.7 -0.1 114.5 2.0 3.0 1.849
2006:Q3 2.5 2.0 1.269 8.8 2.1 96.2 -0.3 0.5 118.0 0.7 3.3 1.872
2006:Q4 4.4 0.9 1.320 10.7 3.7 94.5 5.2 -0.4 119.0 3.0 2.6 1.959
2007:Q1 3.2 2.2 1.337 14.8 3.6 93.9 4.1 -0.2 117.6 3.1 2.6 1.969
2007:Q2 2.3 2.3 1.352 10.1 4.9 91.9 0.5 0.0 123.4 2.4 1.6 2.006
2007:Q3 2.0 2.1 1.422 8.8 7.5 90.6 -1.5 0.1 115.0 3.4 0.3 2.039
2007:Q4 1.9 4.9 1.460 10.8 6.1 89.4 3.5 2.2 111.7 1.9 4.0 1.984
2008:Q1 2.7 4.2 1.581 8.2 8.1 88.0 2.7 1.3 99.9 1.3 3.7 1.986
2008:Q2 -1.6 3.2 1.575 7.6 6.3 88.6 -4.7 1.6 106.2 -0.9 5.6 1.991
2008:Q3 -2.3 3.2 1.408 4.2 2.9 91.4 -4.1 3.6 105.9 -6.5 5.9 1.780
2008:Q4 -7.1 -1.4 1.392 0.7 -0.9 92.2 -12.5 -2.2 90.8 -8.6 0.6 1.462
2009:Q1 -10.8 -1.1 1.326 3.3 -1.6 94.4 -15.0 -3.6 99.2 -7.0 -0.1 1.430
2009:Q2 -1.1 0.0 1.402 15.4 2.3 92.3 7.1 -1.7 96.4 -1.0 2.0 1.645
2009:Q3 1.3 1.1 1.463 12.5 4.0 91.3 0.2 -1.2 89.5 0.8 3.7 1.600
2009:Q4 1.8 1.6 1.433 8.3 5.2 90.7 7.1 -1.6 93.1 1.6 3.1 1.617
2010:Q1 2.0 1.7 1.353 9.2 4.3 89.8 6.1 0.8 93.4 2.1 4.0 1.519
2010:Q2 4.1 2.0 1.229 9.3 3.4 91.0 4.4 -1.0 88.5 4.0 3.0 1.495
2010:Q3 1.3 1.7 1.360 8.7 3.9 88.4 5.8 -1.9 83.5 2.6 2.5 1.573
2010:Q4 2.1 2.6 1.327 8.4 7.8 87.4 -2.2 1.1 81.7 0.1 4.0 1.539
2011:Q1 3.7 3.6 1.418 9.2 6.5 86.4 -6.9 -0.4 82.8 2.2 6.6 1.605
2011:Q2 0.1 3.2 1.452 7.1 5.8 85.3 -2.7 -0.4 80.6 0.9 4.5 1.607
2011:Q3 0.0 1.5 1.345 6.9 5.7 87.4 10.8 0.4 77.0 2.8 4.0 1.562
2011:Q4 -1.1 3.4 1.297 6.3 3.0 87.2 0.6 -0.8 77.0 -0.1 3.3 1.554
2012:Q1 -0.4 2.6 1.333 5.8 3.0 86.3 4.1 1.8 82.4 0.3 1.9 1.599
2012:Q2 -1.0 2.4 1.267 6.0 3.9 88.0 -2.2 -0.7 79.8 -0.7 1.9 1.569
2012:Q3 -0.4 1.8 1.286 6.5 2.3 86.2 -2.7 -1.7 77.9 3.4 2.7 1.613
2012:Q4 -1.9 2.3 1.319 7.5 3.7 85.9 -0.5 -0.1 86.6 -1.3 3.9 1.626
2013:Q1 -1.3 0.8 1.282 5.4 4.1 86.2 5.1 0.0 94.2 2.1 2.5 1.519
2013:Q2 1.3 0.7 1.301 6.1 3.0 87.1 3.4 0.8 99.2 2.7 1.8 1.521
2013:Q3 0.6 1.6 1.354 7.7 3.5 86.5 1.8 3.0 98.3 3.5 2.7 1.618
(continued on next page)
March 2015 43
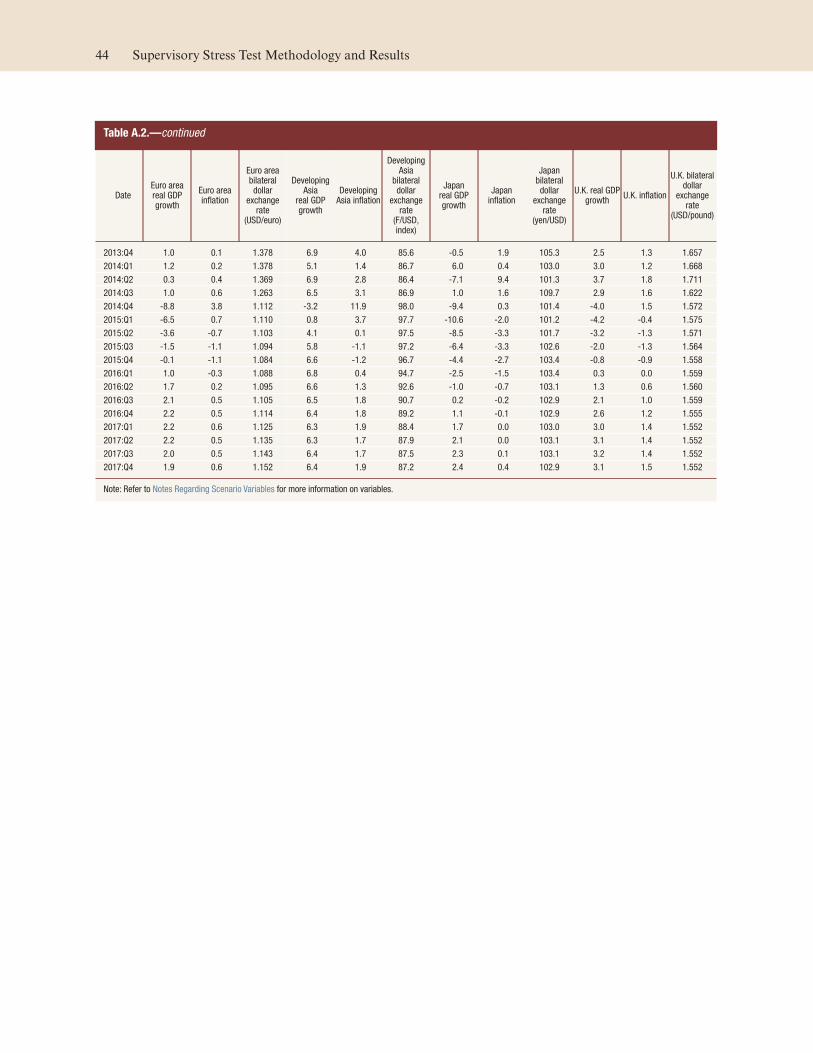
Table A.2.—continued
DateEuro areareal GDPgrowth
Euro areainflation
Euro areabilateraldollar
exchangerate
(USD/euro)
DevelopingAsia
real GDPgrowth
DevelopingAsia inflation
DevelopingAsia
bilateraldollar
exchangerate
(F/USD,index)
Japanreal GDPgrowth
Japaninflation
Japanbilateraldollar
exchangerate
(yen/USD)
U.K. real GDPgrowth
U.K. inflation
U.K. bilateraldollar
exchangerate
(USD/pound)
2013:Q4 1.0 0.1 1.378 6.9 4.0 85.6 -0.5 1.9 105.3 2.5 1.3 1.657
2014:Q1 1.2 0.2 1.378 5.1 1.4 86.7 6.0 0.4 103.0 3.0 1.2 1.668
2014:Q2 0.3 0.4 1.369 6.9 2.8 86.4 -7.1 9.4 101.3 3.7 1.8 1.711
2014:Q3 1.0 0.6 1.263 6.5 3.1 86.9 1.0 1.6 109.7 2.9 1.6 1.622
2014:Q4 -8.8 3.8 1.112 -3.2 11.9 98.0 -9.4 0.3 101.4 -4.0 1.5 1.572
2015:Q1 -6.5 0.7 1.110 0.8 3.7 97.7 -10.6 -2.0 101.2 -4.2 -0.4 1.575
2015:Q2 -3.6 -0.7 1.103 4.1 0.1 97.5 -8.5 -3.3 101.7 -3.2 -1.3 1.571
2015:Q3 -1.5 -1.1 1.094 5.8 -1.1 97.2 -6.4 -3.3 102.6 -2.0 -1.3 1.564
2015:Q4 -0.1 -1.1 1.084 6.6 -1.2 96.7 -4.4 -2.7 103.4 -0.8 -0.9 1.558
2016:Q1 1.0 -0.3 1.088 6.8 0.4 94.7 -2.5 -1.5 103.4 0.3 0.0 1.559
2016:Q2 1.7 0.2 1.095 6.6 1.3 92.6 -1.0 -0.7 103.1 1.3 0.6 1.560
2016:Q3 2.1 0.5 1.105 6.5 1.8 90.7 0.2 -0.2 102.9 2.1 1.0 1.559
2016:Q4 2.2 0.5 1.114 6.4 1.8 89.2 1.1 -0.1 102.9 2.6 1.2 1.555
2017:Q1 2.2 0.6 1.125 6.3 1.9 88.4 1.7 0.0 103.0 3.0 1.4 1.552
2017:Q2 2.2 0.5 1.135 6.3 1.7 87.9 2.1 0.0 103.1 3.1 1.4 1.552
2017:Q3 2.0 0.5 1.143 6.4 1.7 87.5 2.3 0.1 103.1 3.2 1.4 1.552
2017:Q4 1.9 0.6 1.152 6.4 1.9 87.2 2.4 0.4 102.9 3.1 1.5 1.552
Note: Refer to Notes Regarding Scenario Variables for more information on variables.
44 Supervisory Stress Test Methodology and Results
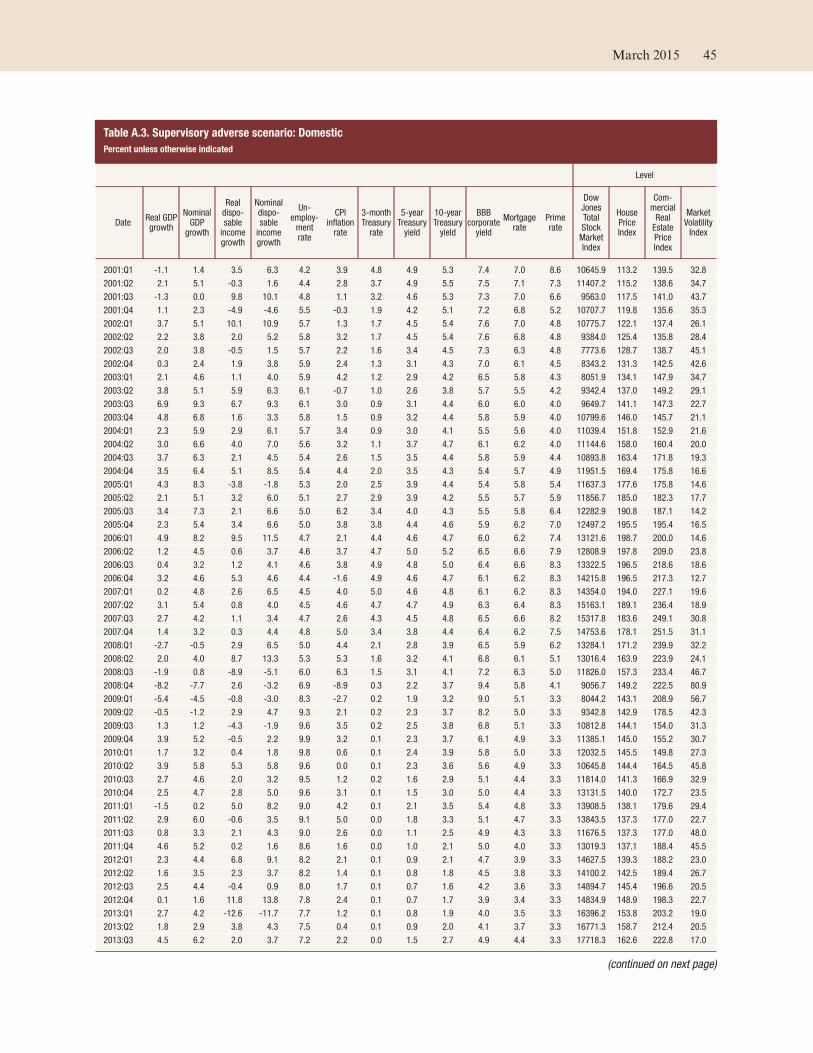
Table A.3. Supervisory adverse scenario: Domestic
Percent unless otherwise indicated
Level
DateReal GDPgrowth
NominalGDPgrowth
Realdispo-sableincomegrowth
Nominaldispo-sableincomegrowth
Un-employ-mentrate
CPIinflationrate
3-monthTreasuryrate
5-yearTreasuryyield
10-yearTreasuryyield
BBBcorporateyield
Mortgagerate
Primerate
DowJonesTotalStockMarketIndex
HousePriceIndex
Com-mercialRealEstatePriceIndex
MarketVolatilityIndex
2001:Q1 -1.1 1.4 3.5 6.3 4.2 3.9 4.8 4.9 5.3 7.4 7.0 8.6 10645.9 113.2 139.5 32.8
2001:Q2 2.1 5.1 -0.3 1.6 4.4 2.8 3.7 4.9 5.5 7.5 7.1 7.3 11407.2 115.2 138.6 34.7
2001:Q3 -1.3 0.0 9.8 10.1 4.8 1.1 3.2 4.6 5.3 7.3 7.0 6.6 9563.0 117.5 141.0 43.7
2001:Q4 1.1 2.3 -4.9 -4.6 5.5 -0.3 1.9 4.2 5.1 7.2 6.8 5.2 10707.7 119.8 135.6 35.3
2002:Q1 3.7 5.1 10.1 10.9 5.7 1.3 1.7 4.5 5.4 7.6 7.0 4.8 10775.7 122.1 137.4 26.1
2002:Q2 2.2 3.8 2.0 5.2 5.8 3.2 1.7 4.5 5.4 7.6 6.8 4.8 9384.0 125.4 135.8 28.4
2002:Q3 2.0 3.8 -0.5 1.5 5.7 2.2 1.6 3.4 4.5 7.3 6.3 4.8 7773.6 128.7 138.7 45.1
2002:Q4 0.3 2.4 1.9 3.8 5.9 2.4 1.3 3.1 4.3 7.0 6.1 4.5 8343.2 131.3 142.5 42.6
2003:Q1 2.1 4.6 1.1 4.0 5.9 4.2 1.2 2.9 4.2 6.5 5.8 4.3 8051.9 134.1 147.9 34.7
2003:Q2 3.8 5.1 5.9 6.3 6.1 -0.7 1.0 2.6 3.8 5.7 5.5 4.2 9342.4 137.0 149.2 29.1
2003:Q3 6.9 9.3 6.7 9.3 6.1 3.0 0.9 3.1 4.4 6.0 6.0 4.0 9649.7 141.1 147.3 22.7
2003:Q4 4.8 6.8 1.6 3.3 5.8 1.5 0.9 3.2 4.4 5.8 5.9 4.0 10799.6 146.0 145.7 21.1
2004:Q1 2.3 5.9 2.9 6.1 5.7 3.4 0.9 3.0 4.1 5.5 5.6 4.0 11039.4 151.8 152.9 21.6
2004:Q2 3.0 6.6 4.0 7.0 5.6 3.2 1.1 3.7 4.7 6.1 6.2 4.0 11144.6 158.0 160.4 20.0
2004:Q3 3.7 6.3 2.1 4.5 5.4 2.6 1.5 3.5 4.4 5.8 5.9 4.4 10893.8 163.4 171.8 19.3
2004:Q4 3.5 6.4 5.1 8.5 5.4 4.4 2.0 3.5 4.3 5.4 5.7 4.9 11951.5 169.4 175.8 16.6
2005:Q1 4.3 8.3 -3.8 -1.8 5.3 2.0 2.5 3.9 4.4 5.4 5.8 5.4 11637.3 177.6 175.8 14.6
2005:Q2 2.1 5.1 3.2 6.0 5.1 2.7 2.9 3.9 4.2 5.5 5.7 5.9 11856.7 185.0 182.3 17.7
2005:Q3 3.4 7.3 2.1 6.6 5.0 6.2 3.4 4.0 4.3 5.5 5.8 6.4 12282.9 190.8 187.1 14.2
2005:Q4 2.3 5.4 3.4 6.6 5.0 3.8 3.8 4.4 4.6 5.9 6.2 7.0 12497.2 195.5 195.4 16.5
2006:Q1 4.9 8.2 9.5 11.5 4.7 2.1 4.4 4.6 4.7 6.0 6.2 7.4 13121.6 198.7 200.0 14.6
2006:Q2 1.2 4.5 0.6 3.7 4.6 3.7 4.7 5.0 5.2 6.5 6.6 7.9 12808.9 197.8 209.0 23.8
2006:Q3 0.4 3.2 1.2 4.1 4.6 3.8 4.9 4.8 5.0 6.4 6.6 8.3 13322.5 196.5 218.6 18.6
2006:Q4 3.2 4.6 5.3 4.6 4.4 -1.6 4.9 4.6 4.7 6.1 6.2 8.3 14215.8 196.5 217.3 12.7
2007:Q1 0.2 4.8 2.6 6.5 4.5 4.0 5.0 4.6 4.8 6.1 6.2 8.3 14354.0 194.0 227.1 19.6
2007:Q2 3.1 5.4 0.8 4.0 4.5 4.6 4.7 4.7 4.9 6.3 6.4 8.3 15163.1 189.1 236.4 18.9
2007:Q3 2.7 4.2 1.1 3.4 4.7 2.6 4.3 4.5 4.8 6.5 6.6 8.2 15317.8 183.6 249.1 30.8
2007:Q4 1.4 3.2 0.3 4.4 4.8 5.0 3.4 3.8 4.4 6.4 6.2 7.5 14753.6 178.1 251.5 31.1
2008:Q1 -2.7 -0.5 2.9 6.5 5.0 4.4 2.1 2.8 3.9 6.5 5.9 6.2 13284.1 171.2 239.9 32.2
2008:Q2 2.0 4.0 8.7 13.3 5.3 5.3 1.6 3.2 4.1 6.8 6.1 5.1 13016.4 163.9 223.9 24.1
2008:Q3 -1.9 0.8 -8.9 -5.1 6.0 6.3 1.5 3.1 4.1 7.2 6.3 5.0 11826.0 157.3 233.4 46.7
2008:Q4 -8.2 -7.7 2.6 -3.2 6.9 -8.9 0.3 2.2 3.7 9.4 5.8 4.1 9056.7 149.2 222.5 80.9
2009:Q1 -5.4 -4.5 -0.8 -3.0 8.3 -2.7 0.2 1.9 3.2 9.0 5.1 3.3 8044.2 143.1 208.9 56.7
2009:Q2 -0.5 -1.2 2.9 4.7 9.3 2.1 0.2 2.3 3.7 8.2 5.0 3.3 9342.8 142.9 178.5 42.3
2009:Q3 1.3 1.2 -4.3 -1.9 9.6 3.5 0.2 2.5 3.8 6.8 5.1 3.3 10812.8 144.1 154.0 31.3
2009:Q4 3.9 5.2 -0.5 2.2 9.9 3.2 0.1 2.3 3.7 6.1 4.9 3.3 11385.1 145.0 155.2 30.7
2010:Q1 1.7 3.2 0.4 1.8 9.8 0.6 0.1 2.4 3.9 5.8 5.0 3.3 12032.5 145.5 149.8 27.3
2010:Q2 3.9 5.8 5.3 5.8 9.6 0.0 0.1 2.3 3.6 5.6 4.9 3.3 10645.8 144.4 164.5 45.8
2010:Q3 2.7 4.6 2.0 3.2 9.5 1.2 0.2 1.6 2.9 5.1 4.4 3.3 11814.0 141.3 166.9 32.9
2010:Q4 2.5 4.7 2.8 5.0 9.6 3.1 0.1 1.5 3.0 5.0 4.4 3.3 13131.5 140.0 172.7 23.5
2011:Q1 -1.5 0.2 5.0 8.2 9.0 4.2 0.1 2.1 3.5 5.4 4.8 3.3 13908.5 138.1 179.6 29.4
2011:Q2 2.9 6.0 -0.6 3.5 9.1 5.0 0.0 1.8 3.3 5.1 4.7 3.3 13843.5 137.3 177.0 22.7
2011:Q3 0.8 3.3 2.1 4.3 9.0 2.6 0.0 1.1 2.5 4.9 4.3 3.3 11676.5 137.3 177.0 48.0
2011:Q4 4.6 5.2 0.2 1.6 8.6 1.6 0.0 1.0 2.1 5.0 4.0 3.3 13019.3 137.1 188.4 45.5
2012:Q1 2.3 4.4 6.8 9.1 8.2 2.1 0.1 0.9 2.1 4.7 3.9 3.3 14627.5 139.3 188.2 23.0
2012:Q2 1.6 3.5 2.3 3.7 8.2 1.4 0.1 0.8 1.8 4.5 3.8 3.3 14100.2 142.5 189.4 26.7
2012:Q3 2.5 4.4 -0.4 0.9 8.0 1.7 0.1 0.7 1.6 4.2 3.6 3.3 14894.7 145.4 196.6 20.5
2012:Q4 0.1 1.6 11.8 13.8 7.8 2.4 0.1 0.7 1.7 3.9 3.4 3.3 14834.9 148.9 198.3 22.7
2013:Q1 2.7 4.2 -12.6 -11.7 7.7 1.2 0.1 0.8 1.9 4.0 3.5 3.3 16396.2 153.8 203.2 19.0
2013:Q2 1.8 2.9 3.8 4.3 7.5 0.4 0.1 0.9 2.0 4.1 3.7 3.3 16771.3 158.7 212.4 20.5
2013:Q3 4.5 6.2 2.0 3.7 7.2 2.2 0.0 1.5 2.7 4.9 4.4 3.3 17718.3 162.6 222.8 17.0
(continued on next page)
March 2015 45
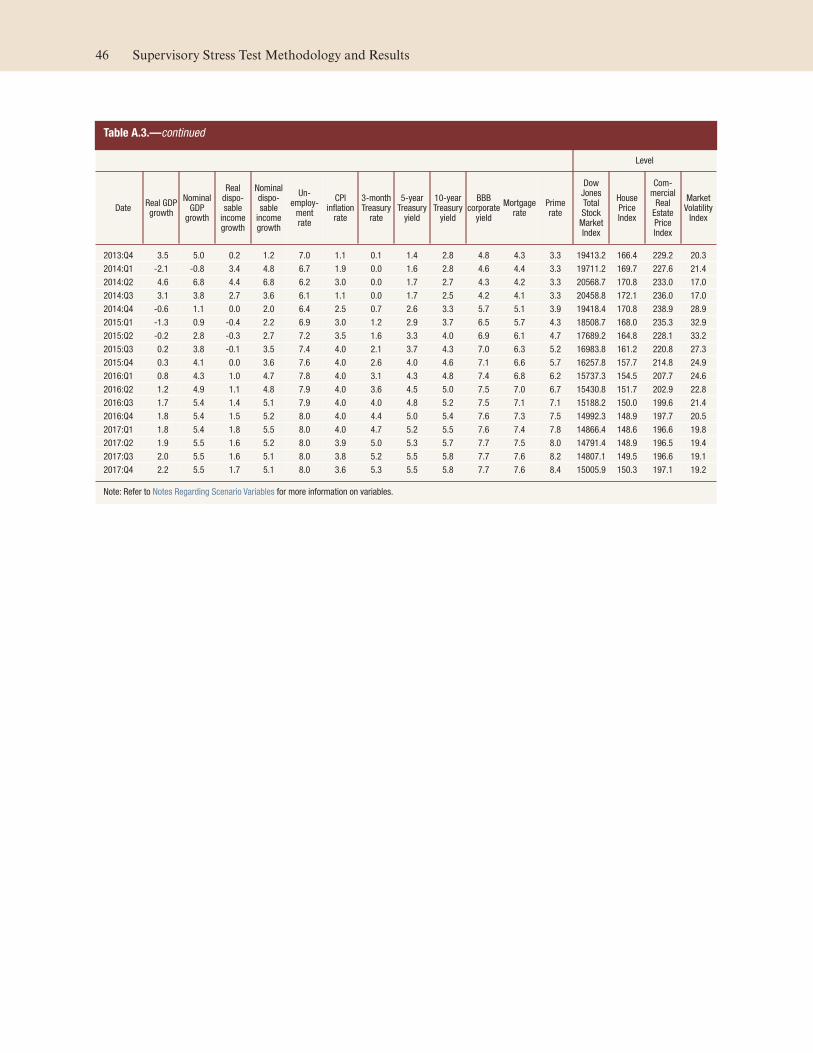
Table A.3.—continued
Level
DateReal GDPgrowth
NominalGDPgrowth
Realdispo-sableincomegrowth
Nominaldispo-sableincomegrowth
Un-employ-mentrate
CPIinflationrate
3-monthTreasuryrate
5-yearTreasuryyield
10-yearTreasuryyield
BBBcorporateyield
Mortgagerate
Primerate
DowJonesTotalStockMarketIndex
HousePriceIndex
Com-mercialRealEstatePriceIndex
MarketVolatilityIndex
2013:Q4 3.5 5.0 0.2 1.2 7.0 1.1 0.1 1.4 2.8 4.8 4.3 3.3 19413.2 166.4 229.2 20.3
2014:Q1 -2.1 -0.8 3.4 4.8 6.7 1.9 0.0 1.6 2.8 4.6 4.4 3.3 19711.2 169.7 227.6 21.4
2014:Q2 4.6 6.8 4.4 6.8 6.2 3.0 0.0 1.7 2.7 4.3 4.2 3.3 20568.7 170.8 233.0 17.0
2014:Q3 3.1 3.8 2.7 3.6 6.1 1.1 0.0 1.7 2.5 4.2 4.1 3.3 20458.8 172.1 236.0 17.0
2014:Q4 -0.6 1.1 0.0 2.0 6.4 2.5 0.7 2.6 3.3 5.7 5.1 3.9 19418.4 170.8 238.9 28.9
2015:Q1 -1.3 0.9 -0.4 2.2 6.9 3.0 1.2 2.9 3.7 6.5 5.7 4.3 18508.7 168.0 235.3 32.9
2015:Q2 -0.2 2.8 -0.3 2.7 7.2 3.5 1.6 3.3 4.0 6.9 6.1 4.7 17689.2 164.8 228.1 33.2
2015:Q3 0.2 3.8 -0.1 3.5 7.4 4.0 2.1 3.7 4.3 7.0 6.3 5.2 16983.8 161.2 220.8 27.3
2015:Q4 0.3 4.1 0.0 3.6 7.6 4.0 2.6 4.0 4.6 7.1 6.6 5.7 16257.8 157.7 214.8 24.9
2016:Q1 0.8 4.3 1.0 4.7 7.8 4.0 3.1 4.3 4.8 7.4 6.8 6.2 15737.3 154.5 207.7 24.6
2016:Q2 1.2 4.9 1.1 4.8 7.9 4.0 3.6 4.5 5.0 7.5 7.0 6.7 15430.8 151.7 202.9 22.8
2016:Q3 1.7 5.4 1.4 5.1 7.9 4.0 4.0 4.8 5.2 7.5 7.1 7.1 15188.2 150.0 199.6 21.4
2016:Q4 1.8 5.4 1.5 5.2 8.0 4.0 4.4 5.0 5.4 7.6 7.3 7.5 14992.3 148.9 197.7 20.5
2017:Q1 1.8 5.4 1.8 5.5 8.0 4.0 4.7 5.2 5.5 7.6 7.4 7.8 14866.4 148.6 196.6 19.8
2017:Q2 1.9 5.5 1.6 5.2 8.0 3.9 5.0 5.3 5.7 7.7 7.5 8.0 14791.4 148.9 196.5 19.4
2017:Q3 2.0 5.5 1.6 5.1 8.0 3.8 5.2 5.5 5.8 7.7 7.6 8.2 14807.1 149.5 196.6 19.1
2017:Q4 2.2 5.5 1.7 5.1 8.0 3.6 5.3 5.5 5.8 7.7 7.6 8.4 15005.9 150.3 197.1 19.2
Note: Refer to Notes Regarding Scenario Variables for more information on variables.
46 Supervisory Stress Test Methodology and Results
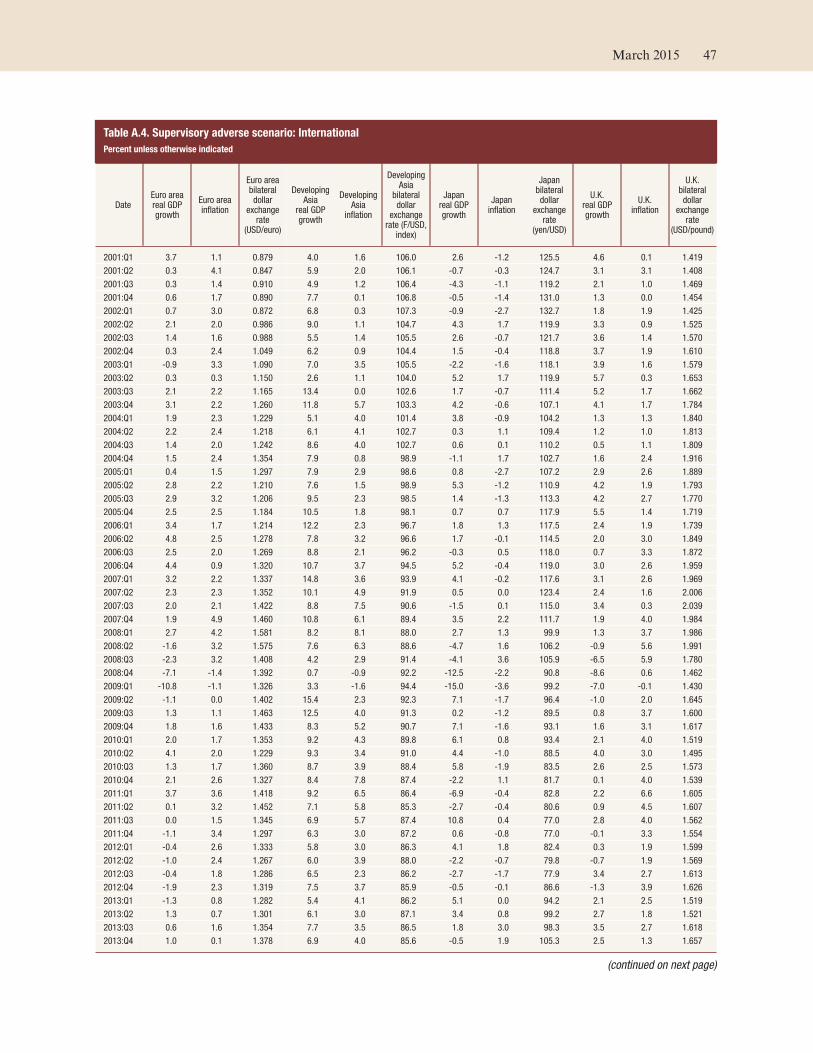
Table A.4. Supervisory adverse scenario: International
Percent unless otherwise indicated
DateEuro areareal GDPgrowth
Euro areainflation
Euro areabilateraldollar
exchangerate
(USD/euro)
DevelopingAsia
real GDPgrowth
DevelopingAsia
inflation
DevelopingAsia
bilateraldollar
exchangerate (F/USD,
index)
Japanreal GDPgrowth
Japaninflation
Japanbilateraldollar
exchangerate
(yen/USD)
U.K.real GDPgrowth
U.K.inflation
U.K.bilateraldollar
exchangerate
(USD/pound)
2001:Q1 3.7 1.1 0.879 4.0 1.6 106.0 2.6 -1.2 125.5 4.6 0.1 1.419
2001:Q2 0.3 4.1 0.847 5.9 2.0 106.1 -0.7 -0.3 124.7 3.1 3.1 1.408
2001:Q3 0.3 1.4 0.910 4.9 1.2 106.4 -4.3 -1.1 119.2 2.1 1.0 1.469
2001:Q4 0.6 1.7 0.890 7.7 0.1 106.8 -0.5 -1.4 131.0 1.3 0.0 1.454
2002:Q1 0.7 3.0 0.872 6.8 0.3 107.3 -0.9 -2.7 132.7 1.8 1.9 1.425
2002:Q2 2.1 2.0 0.986 9.0 1.1 104.7 4.3 1.7 119.9 3.3 0.9 1.525
2002:Q3 1.4 1.6 0.988 5.5 1.4 105.5 2.6 -0.7 121.7 3.6 1.4 1.570
2002:Q4 0.3 2.4 1.049 6.2 0.9 104.4 1.5 -0.4 118.8 3.7 1.9 1.610
2003:Q1 -0.9 3.3 1.090 7.0 3.5 105.5 -2.2 -1.6 118.1 3.9 1.6 1.579
2003:Q2 0.3 0.3 1.150 2.6 1.1 104.0 5.2 1.7 119.9 5.7 0.3 1.653
2003:Q3 2.1 2.2 1.165 13.4 0.0 102.6 1.7 -0.7 111.4 5.2 1.7 1.662
2003:Q4 3.1 2.2 1.260 11.8 5.7 103.3 4.2 -0.6 107.1 4.1 1.7 1.784
2004:Q1 1.9 2.3 1.229 5.1 4.0 101.4 3.8 -0.9 104.2 1.3 1.3 1.840
2004:Q2 2.2 2.4 1.218 6.1 4.1 102.7 0.3 1.1 109.4 1.2 1.0 1.813
2004:Q3 1.4 2.0 1.242 8.6 4.0 102.7 0.6 0.1 110.2 0.5 1.1 1.809
2004:Q4 1.5 2.4 1.354 7.9 0.8 98.9 -1.1 1.7 102.7 1.6 2.4 1.916
2005:Q1 0.4 1.5 1.297 7.9 2.9 98.6 0.8 -2.7 107.2 2.9 2.6 1.889
2005:Q2 2.8 2.2 1.210 7.6 1.5 98.9 5.3 -1.2 110.9 4.2 1.9 1.793
2005:Q3 2.9 3.2 1.206 9.5 2.3 98.5 1.4 -1.3 113.3 4.2 2.7 1.770
2005:Q4 2.5 2.5 1.184 10.5 1.8 98.1 0.7 0.7 117.9 5.5 1.4 1.719
2006:Q1 3.4 1.7 1.214 12.2 2.3 96.7 1.8 1.3 117.5 2.4 1.9 1.739
2006:Q2 4.8 2.5 1.278 7.8 3.2 96.6 1.7 -0.1 114.5 2.0 3.0 1.849
2006:Q3 2.5 2.0 1.269 8.8 2.1 96.2 -0.3 0.5 118.0 0.7 3.3 1.872
2006:Q4 4.4 0.9 1.320 10.7 3.7 94.5 5.2 -0.4 119.0 3.0 2.6 1.959
2007:Q1 3.2 2.2 1.337 14.8 3.6 93.9 4.1 -0.2 117.6 3.1 2.6 1.969
2007:Q2 2.3 2.3 1.352 10.1 4.9 91.9 0.5 0.0 123.4 2.4 1.6 2.006
2007:Q3 2.0 2.1 1.422 8.8 7.5 90.6 -1.5 0.1 115.0 3.4 0.3 2.039
2007:Q4 1.9 4.9 1.460 10.8 6.1 89.4 3.5 2.2 111.7 1.9 4.0 1.984
2008:Q1 2.7 4.2 1.581 8.2 8.1 88.0 2.7 1.3 99.9 1.3 3.7 1.986
2008:Q2 -1.6 3.2 1.575 7.6 6.3 88.6 -4.7 1.6 106.2 -0.9 5.6 1.991
2008:Q3 -2.3 3.2 1.408 4.2 2.9 91.4 -4.1 3.6 105.9 -6.5 5.9 1.780
2008:Q4 -7.1 -1.4 1.392 0.7 -0.9 92.2 -12.5 -2.2 90.8 -8.6 0.6 1.462
2009:Q1 -10.8 -1.1 1.326 3.3 -1.6 94.4 -15.0 -3.6 99.2 -7.0 -0.1 1.430
2009:Q2 -1.1 0.0 1.402 15.4 2.3 92.3 7.1 -1.7 96.4 -1.0 2.0 1.645
2009:Q3 1.3 1.1 1.463 12.5 4.0 91.3 0.2 -1.2 89.5 0.8 3.7 1.600
2009:Q4 1.8 1.6 1.433 8.3 5.2 90.7 7.1 -1.6 93.1 1.6 3.1 1.617
2010:Q1 2.0 1.7 1.353 9.2 4.3 89.8 6.1 0.8 93.4 2.1 4.0 1.519
2010:Q2 4.1 2.0 1.229 9.3 3.4 91.0 4.4 -1.0 88.5 4.0 3.0 1.495
2010:Q3 1.3 1.7 1.360 8.7 3.9 88.4 5.8 -1.9 83.5 2.6 2.5 1.573
2010:Q4 2.1 2.6 1.327 8.4 7.8 87.4 -2.2 1.1 81.7 0.1 4.0 1.539
2011:Q1 3.7 3.6 1.418 9.2 6.5 86.4 -6.9 -0.4 82.8 2.2 6.6 1.605
2011:Q2 0.1 3.2 1.452 7.1 5.8 85.3 -2.7 -0.4 80.6 0.9 4.5 1.607
2011:Q3 0.0 1.5 1.345 6.9 5.7 87.4 10.8 0.4 77.0 2.8 4.0 1.562
2011:Q4 -1.1 3.4 1.297 6.3 3.0 87.2 0.6 -0.8 77.0 -0.1 3.3 1.554
2012:Q1 -0.4 2.6 1.333 5.8 3.0 86.3 4.1 1.8 82.4 0.3 1.9 1.599
2012:Q2 -1.0 2.4 1.267 6.0 3.9 88.0 -2.2 -0.7 79.8 -0.7 1.9 1.569
2012:Q3 -0.4 1.8 1.286 6.5 2.3 86.2 -2.7 -1.7 77.9 3.4 2.7 1.613
2012:Q4 -1.9 2.3 1.319 7.5 3.7 85.9 -0.5 -0.1 86.6 -1.3 3.9 1.626
2013:Q1 -1.3 0.8 1.282 5.4 4.1 86.2 5.1 0.0 94.2 2.1 2.5 1.519
2013:Q2 1.3 0.7 1.301 6.1 3.0 87.1 3.4 0.8 99.2 2.7 1.8 1.521
2013:Q3 0.6 1.6 1.354 7.7 3.5 86.5 1.8 3.0 98.3 3.5 2.7 1.618
2013:Q4 1.0 0.1 1.378 6.9 4.0 85.6 -0.5 1.9 105.3 2.5 1.3 1.657
(continued on next page)
March 2015 47
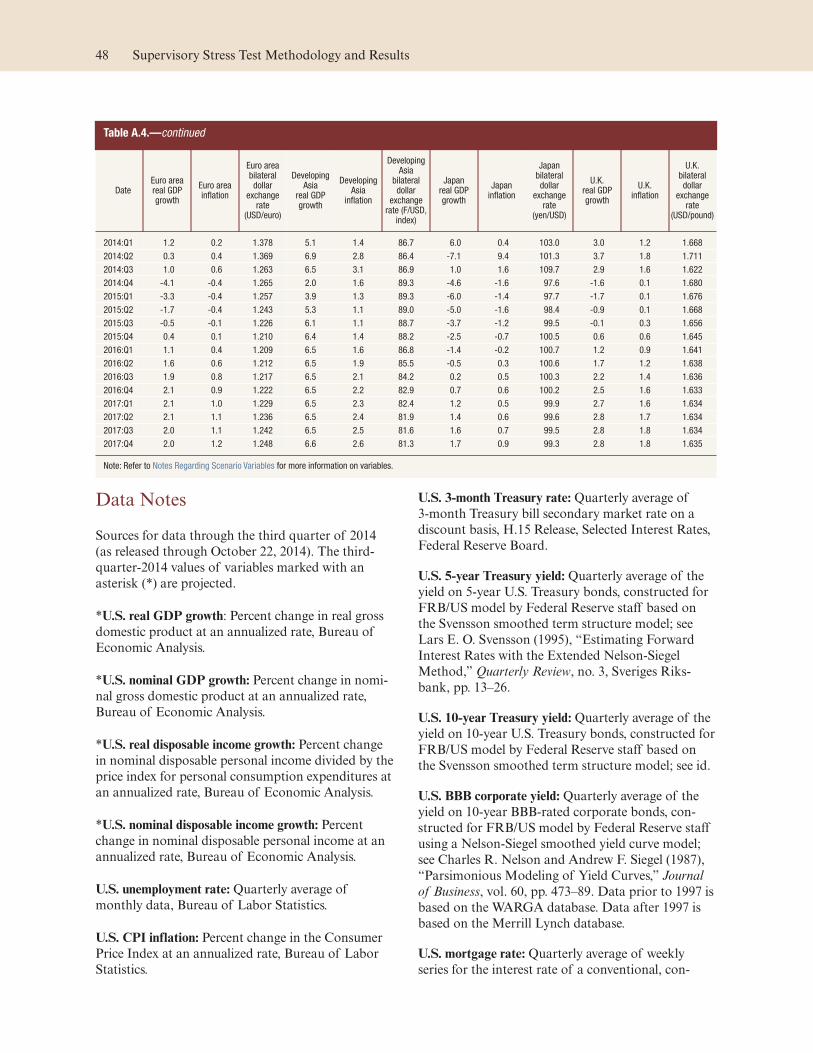
Table A.4.—continued
DateEuro areareal GDPgrowth
Euro areainflation
Euro areabilateraldollar
exchangerate
(USD/euro)
DevelopingAsia
real GDPgrowth
DevelopingAsia
inflation
DevelopingAsia
bilateraldollar
exchangerate (F/USD,
index)
Japanreal GDPgrowth
Japaninflation
Japanbilateraldollar
exchangerate
(yen/USD)
U.K.real GDPgrowth
U.K.inflation
U.K.bilateraldollar
exchangerate
(USD/pound)
2014:Q1 1.2 0.2 1.378 5.1 1.4 86.7 6.0 0.4 103.0 3.0 1.2 1.668
2014:Q2 0.3 0.4 1.369 6.9 2.8 86.4 -7.1 9.4 101.3 3.7 1.8 1.711
2014:Q3 1.0 0.6 1.263 6.5 3.1 86.9 1.0 1.6 109.7 2.9 1.6 1.622
2014:Q4 -4.1 -0.4 1.265 2.0 1.6 89.3 -4.6 -1.6 97.6 -1.6 0.1 1.680
2015:Q1 -3.3 -0.4 1.257 3.9 1.3 89.3 -6.0 -1.4 97.7 -1.7 0.1 1.676
2015:Q2 -1.7 -0.4 1.243 5.3 1.1 89.0 -5.0 -1.6 98.4 -0.9 0.1 1.668
2015:Q3 -0.5 -0.1 1.226 6.1 1.1 88.7 -3.7 -1.2 99.5 -0.1 0.3 1.656
2015:Q4 0.4 0.1 1.210 6.4 1.4 88.2 -2.5 -0.7 100.5 0.6 0.6 1.645
2016:Q1 1.1 0.4 1.209 6.5 1.6 86.8 -1.4 -0.2 100.7 1.2 0.9 1.641
2016:Q2 1.6 0.6 1.212 6.5 1.9 85.5 -0.5 0.3 100.6 1.7 1.2 1.638
2016:Q3 1.9 0.8 1.217 6.5 2.1 84.2 0.2 0.5 100.3 2.2 1.4 1.636
2016:Q4 2.1 0.9 1.222 6.5 2.2 82.9 0.7 0.6 100.2 2.5 1.6 1.633
2017:Q1 2.1 1.0 1.229 6.5 2.3 82.4 1.2 0.5 99.9 2.7 1.6 1.634
2017:Q2 2.1 1.1 1.236 6.5 2.4 81.9 1.4 0.6 99.6 2.8 1.7 1.634
2017:Q3 2.0 1.1 1.242 6.5 2.5 81.6 1.6 0.7 99.5 2.8 1.8 1.634
2017:Q4 2.0 1.2 1.248 6.6 2.6 81.3 1.7 0.9 99.3 2.8 1.8 1.635
Note: Refer to Notes Regarding Scenario Variables for more information on variables.
Data Notes
Sources for data through the third quarter of 2014
(as released through October 22, 2014). The third-
quarter-2014 values of variables marked with an
asterisk (*) are projected.
*U.S. real GDP growth: Percent change in real gross
domestic product at an annualized rate, Bureau of
Economic Analysis.
*U.S. nominal GDP growth: Percent change in nomi-
nal gross domestic product at an annualized rate,
Bureau of Economic Analysis.
*U.S. real disposable income growth: Percent change
in nominal disposable personal income divided by the
price index for personal consumption expenditures at
an annualized rate, Bureau of Economic Analysis.
*U.S. nominal disposable income growth: Percent
change in nominal disposable personal income at an
annualized rate, Bureau of Economic Analysis.
U.S. unemployment rate: Quarterly average of
monthly data, Bureau of Labor Statistics.
U.S. CPI inflation: Percent change in the Consumer
Price Index at an annualized rate, Bureau of Labor
Statistics.
U.S. 3-month Treasury rate: Quarterly average of
3-month Treasury bill secondary market rate on a
discount basis, H.15 Release, Selected Interest Rates,
Federal Reserve Board.
U.S. 5-year Treasury yield: Quarterly average of the
yield on 5-year U.S. Treasury bonds, constructed for
FRB/US model by Federal Reserve staff based on
the Svensson smoothed term structure model; see
Lars E. O. Svensson (1995), “Estimating Forward
Interest Rates with the Extended Nelson-Siegel
Method,” Quarterly Review, no. 3, Sveriges Riks-
bank, pp. 13–26.
U.S. 10-year Treasury yield: Quarterly average of the
yield on 10-year U.S. Treasury bonds, constructed for
FRB/US model by Federal Reserve staff based on
the Svensson smoothed term structure model; see id.
U.S. BBB corporate yield: Quarterly average of the
yield on 10-year BBB-rated corporate bonds, con-
structed for FRB/US model by Federal Reserve staff
using a Nelson-Siegel smoothed yield curve model;
see Charles R. Nelson and Andrew F. Siegel (1987),
“Parsimonious Modeling of Yield Curves,” Journal
of Business, vol. 60, pp. 473–89. Data prior to 1997 is
based on the WARGA database. Data after 1997 is
based on the Merrill Lynch database.
U.S. mortgage rate: Quarterly average of weekly
series for the interest rate of a conventional, con-
48 Supervisory Stress Test Methodology and Results

forming, 30-year fixed rate mortgage, obtained from
the Primary Mortgage Market Survey of the Federal
Home Loan Mortgage Corporation.
U.S. prime rate: Quarterly average of monthly series,
H.15 Release, Selected Interest Rates, Federal
Reserve Board.
U.S. Dow Jones Total Stock Market (Float Cap)
Index: End of quarter value, Dow Jones.
*U.S. House Price Index: CoreLogic, index level, sea-
sonally adjusted by Federal Reserve staff.
*U.S. Commercial Real Estate Price Index: From the
Financial Accounts of the United States, Federal
Reserve Board (Z.1 release); the series corresponds to
the data for price indexes: Commercial Real Estate
Price Index (series FL075035503.Q divided by 1,000).
U.S. Market Volatility Index (VIX): Chicago Board
Options Exchange, converted to quarterly by using
the maximum close-of-day value in any quarter.
*Euro area real GDP growth: Staff calculations based
on Statistical Office of the European Communities
via Haver, extended back using ECB Area Wide
Model dataset (ECBWorking Paper series no. 42).
Euro area inflation: Staff calculations based on Statis-
tical Office of the European Community via Haver.
*Developing Asia real GDP growth: Staff calculations
based on Bank of Korea via Haver; Chinese National
Bureau of Statistics via CEIC; Indian Central Statis-
tical Organization via CEIC; Census and Statistics
Department of Hong Kong via CEIC; and Taiwan
Directorate-General of Budget, Accounting, and Sta-
tistics via CEIC.
*Developing Asia inflation: Staff calculations based
on Chinese National Bureau of Statistics via CEIC;
Indian Ministry of Statistics and Programme Imple-
mentation via Haver; Labour Bureau of India via
CEIC; National Statistical Office of Korea via CEIC;
Census and Statistic Department of Hong Kong via
CEIC; and Taiwan Directorate-General of Budget,
Accounting, and Statistics via CEIC.
*Japan real GDP growth: Cabinet Office via Haver.
Japan inflation:Ministry of Internal Affairs and
Communications via Haver.
U.K. real GDP growth: Office for National Statistics
via Haver.
U.K. inflation: Staff calculations based on Office for
National Statistics (uses Retail Price Index to extend
series back to 1960) via Haver.
*Exchange rates: Bloomberg.
March 2015 49

Appendix B: Models to Project Net Incomeand Stressed Capital
This appendix describes the models used to project
stressed capital ratios and pre-tax net income and its
components for the 31 bank holding companies
(BHCs) subject to DFAST 2015.33 The models fall
into five broad categories:
1. Models to project losses on loans held in the
accrual loan portfolio. Loans in the accrual loan
portfolio are those measured under accrual
accounting, rather than fair-value accounting.
2. Models to project other types of losses, including
those from changes in fair value on loans held for
sale or measured under the fair-value option;
losses on securities, trading, and counterparty
exposures; losses related to operational-risk
events; and mortgage repurchase/put-back losses.
3. Models to project the components of pre-
provision net revenue (PPNR) (revenues and non-
credit-related expenses).
4. Models to project balance sheet items and risk-
weighted assets (RWA).
5. The model to project capital ratios, given projec-
tions of pre-tax net income, assumptions for
determining provisions into the allowance for
loan and lease losses (ALLL), and prescribed
capital actions.
A majority of the models described here were refined
incrementally over the past year. However, the Fed-
eral Reserve enhanced its methods for estimating
PPNR and regulatory capital and capital ratios (see
box 1).
Losses on the Accrual Loan Portfolio
More than a dozen individual models are used to
project losses on loans held in the accrual loan port-
folio. The individual loan types modeled can broadly
be divided into wholesale loans, such as commercial
and industrial (C&I) loans and commercial real estate
(CRE) loans, and retail loans, including various types
of residential mortgages, credit cards, student loans,
auto loans, small business loans, and other consumer
lending. In some cases, these major categories com-
prise several subcategories, each with its own loss
projection model, but the models within a subcat-
egory are similar in structure and approach. The
models project losses using detailed loan portfolio
data provided by the BHCs on the Capital Assess-
ments and Stress Testing (FR Y-14) report.
Two general approaches are taken to model losses on
the accrual loan portfolio. In the first approach—an
approach broadly used for DFAST 2015—the models
estimate expected losses under the macroeconomic
scenario; that is, they project the probability of
default (PD), loss given default (LGD), and exposure
at default (EAD) for each quarter of the planning
horizon. Expected losses in quarter t are the product
of these three components:
Loss t = PD t * LGD t * EAD t
PD is generally modeled as part of a transition pro-
cess in which loans move from one payment status to
another (e.g., from current to delinquent) in response
to economic conditions. Default is the last possible
33 In connection with DFAST 2015, and in addition to the modelsdeveloped and data collected by the Federal Reserve, the Fed-eral Reserve used proprietary models or data licensed from thefollowing providers: Andrew Davidson & Co., Inc.; Bank ofAmerica Corporation; BlackRock Financial Management, Inc.;Bloomberg Finance L.P.; CB Richard Ellis, Inc.; CoreLogicInc.; CoStar Group, Inc.; Equifax Information Services LLC;Kenneth French; Intex Solutions, Inc.; McDash Analytics, LLC,a wholly owned subsidiary of Lender Processing Services, Inc.;Markit Group; Moody’s Analytics, Inc.; Moody’s Investors Ser-vice, Inc.; Mergent, Inc.; Morningstar, Inc.; MSCI, Inc.; Stata-Corp LP; the Organisation for Economic Co-operation andDevelopment; and Standard & Poor’s Financial Services LLC.In addition, with respect to the global market shock componentof the adverse and severely adverse scenarios, the FederalReserve used proprietary data licensed from the following pro-viders: Bank of America Corporation; Barclays Bank PLC;Bloomberg Finance L.P.; CoreLogic, Inc.; Intex Solutions, Inc.;JPMorgan Chase & Co.; Lender Processing Services, Inc.;Markit Group; Moody's Investors Service, Inc.; New York Uni-versity; and Standard & Poor’s Financial Services LLC.
51
transition, and PD represents the likelihood that a
loan will default during a given period. The number
of payment statuses and the transition paths modeled
differ by loan type.
LGD is typically defined as a percentage of EAD
and is based on historical data. For some loan types,
LGD is modeled as a function of borrower, collat-
eral, or loan characteristics and the macroeconomic
variables from the supervisory scenarios. For other
loan types, LGD is assumed to be a fixed percentage
for all loans in a category. Finally, the approach to
EAD varies by loan type and depends on whether the
outstanding loan amount can change between the
current period and the period in which the loan
defaults (e.g., for lines of credit).
In the second approach, the models capture the his-
torical behavior of net charge-offs relative to changes
in macroeconomic and financial market variables and
loan portfolio characteristics.
The loss models primarily focus on losses arising
from loans in the accrual loan portfolio as of Sep-
tember 30, 2014. The loss projections also incorpo-
rate losses on loans originated after the planning
horizon begins. These incremental loan balances are
calculated based on the Federal Reserve’s projections
of loan balances over the planning horizon. These
balances are assumed to have the same risk charac-
teristics as those of the loan portfolio as of Septem-
ber 30, 2014, with the exception of loan age in the
retail and CRE portfolios, where seasoning is incor-
porated. Where applicable, new loans are assumed to
be current, and BHCs are assumed not to originate
types of loans that are no longer allowed under vari-
ous regulations. This is a simple, but generally conser-
vative, assumption. Loss projections also incorporate
losses on loans acquired through mergers or pur-
chase after the planning horizon begins. Additional
information provided by the BHCs about the size
and composition of acquired loan portfolios was
used to estimate losses on acquired portfolios.
Loss projections generated by the models are
adjusted to take account of purchase accounting
treatment, which recognizes discounts on impaired
loans acquired during mergers and any other write-
downs already taken on loans held in the accrual loan
portfolio. This latter adjustment ensures that losses
related to these loans are not double counted in the
projections.
Wholesale Lending: Corporate Loans
Losses stemming from default on corporate loans are
projected at the loan level using an expected loss
modeling framework. Corporate loans consist of a
number of different categories of loans, as defined by
the Consolidated Financial Statements for Holding
Companies—FR Y-9C report (FR Y-9C). The larg-
est group of these loans include C&I loans, which are
generally defined as loans to corporate or commercial
borrowers with more than $1 million in committed
balances that are “graded” using a BHC’s corporate
loan rating process.34
The PD for a C&I loan is projected over the planning
horizon by first calculating the loan’s PD at the
beginning of the planning horizon and then project-
ing it forward using an equation that relates historical
changes in PD to changes in the macroeconomic
environment. The PD as of September 30, 2014, is
calculated for every C&I loan in a BHC’s portfolio
using detailed, loan-level information submitted by
the BHC. For publicly traded borrowers, a borrower-
specific PD, based on the expected default frequency,
is used. For other borrowers, the PD is estimated
based on the BHC’s internal credit rating, which is
converted to a standardized rating scale. Loans that
are 90 days past due, in non-accrual status, or that
have a Financial Accounting Standards Board
Accounting Standards Codification Subtopic 310-10
(ASC 310-10) reserve as of September 30, 2014, are
assigned a PD of 100 percent.
Quarterly changes in the PD after the third quarter
of 2014 are projected over the planning horizon
using a series of equations that relate historical
changes in the average PD as a function of changes
in macroeconomic variables, including changes in
real gross domestic product (GDP), the unemploy-
ment rate, and the spread on BBB-rated corporate
bonds. The equations are estimated separately by
borrower industries, credit quality categories, and
countries.
The LGD for a C&I loan at the beginning of the
planning horizon is determined by the line of busi-
ness, seniority of lien (if secured), country, and ASC
310-10 reserve, if applicable. The LGD is then pro-
34 All definitions of loan categories and default in this appendixare definitions used for the purposes of the supervisory stresstest models and do not necessarily align with general industrydefinitions or classifications.
52 Supervisory Stress Test Methodology and Results
jected forward by relating the change in the LGD to
changes in the PD. In the model, the PD is used as a
proxy for economic conditions, and, by construct,
increases in PD generally lead to higher LGDs.
The EAD for C&I loans equals the sum of the
funded balance and a portion of the unfunded com-
mitment, which reflects the amount that is likely to
be drawn down by the borrower in the event of
default. This drawdown amount was estimated based
on the historical drawdown experience for defaulted
U.S. syndicated revolving lines of credit that are in
the Shared National Credit (SNC) database.35 In the
case of closed-end C&I loans, the funded balance
and the corresponding EAD equals the outstanding
balance. The EAD for standby letters of credit and
trade finance credit are conservatively assumed to
equal the total commitment.
Other corporate loans that are similar in some
respects to C&I loans are modeled using the same
framework. These loans include owner-occupied
CRE loans, capital equipment leases, loans to deposi-
tories, and other loans.36 Projected losses on owner-
occupied CRE loans are disclosed in total CRE
losses, while projected losses for the remaining other
corporate loans are disclosed in the other loans
category.
Wholesale Lending: CRE Mortgages
CRE mortgages are loans collateralized by domestic
and international multifamily or nonfarm, nonresi-
dential properties, and construction and land devel-
opment loans (C&LD), as defined by the FR Y-9C
report. Losses stemming from default on CRE mort-
gages are projected at the loan level using an
expected-loss modeling framework.
The PD model for CRE mortgages is a hazard model
of the probability that a loan transitions from cur-
rent to default status, given the characteristics of the
loan as well as macroeconomic variables such as
house prices and CRE vacancy rates, at both the geo-
graphic market and national level. Once defaulted,
the model assumes the loan does not re-perform; the
effect of re-performance on the estimated loan loss is
captured in the LGD model. A CRE mortgage loan
is considered in default if it is 90 days past due, in
non-accrual status, has an ASC 310-10 reserve, or
had a very low internal credit rating at the most
recent time its maturity was extended. The PD model
also incorporates a nonlinear increase in PD as the
loan maturity nears. The effect of loan maturity on
the PD is estimated to be different for income-
producing and C&LD loans, and is estimated sepa-
rately for each loan type using historical Capital
Assessments and Stress Testing (FR Y-14Q) data.
However, the effect of other loan characteristics and
the macroeconomic variables is assumed to be the
same for income-producing properties and C&LD
loans and is estimated using a single model for both
types of loans using historical commercial mortgage-
backed security data.
The LGD for CRE mortgages is estimated using FR
Y-14Q data on ASC 310-10 reserves. The model first
estimates the probability that a defaulted loan will
have losses as a function of loan characteristics and
macroeconomic variables, and then, using loans with
losses, estimates the loss on the CRE mortgage as a
function of the expected probability of loss, charac-
teristics of the loan, and macroeconomic variables.
Finally, the EAD for CRE mortgages is assumed to
equal the loan’s full committed balance for both
income producing and C&LD loans. As was the case
with closed-end C&I loans, for amortizing income-
producing loans the EAD equals the outstanding
balance.
Retail Lending: Residential Mortgages
Residential mortgages held in BHC portfolios include
first and junior liens—both closed-end loans and
revolving credits—that are secured by one- to four-
family residential real estate as defined by the FR
Y-9C report. Losses stemming from default on resi-
dential mortgages are projected at the loan level using
an expected-loss modeling framework.37
The PD model for first-lien residential mortgages
estimates the probability that a loan transitions to
different payment statuses, including current, delin-
quent, default, and paid off. Separate PD models are
estimated for three types of closed-end, first-lien
35 SNCs have commitments of greater than $20 million and areheld by three or more regulated participating entities. For addi-tional information, see “Shared National Credit Program,”Board of Governors, www.federalreserve.gov/bankinforeg/snc.htm.
36 The corporate loan category also includes loans that are dis-similar from typical corporate loans, such as securities lendingand farmland loans, which are generally a small share of BHCportfolios. For these loans, a conservative and uniform loss ratebased on analysis of historical data was assigned.
37 To predict losses on new originations over the planning horizon,newly originated loans are assumed to have the same risk char-acteristics as the existing portfolio, with the exception of theloan age and delinquency status.
March 2015 53
mortgages: fixed-rate, adjustable-rate, and option
adjustable-rate mortgages. The PD model specifica-
tion varies somewhat by loan type; however, in gen-
eral, each model estimates the probability that a loan
transitions from one payment state to another (e.g.,
from current to delinquent or from delinquent to
default) over a single quarter, given the characteris-
tics of the loan, borrower, and underlying property as
well as macroeconomic variables such as local house
prices, the statewide unemployment rate, and interest
rates.38
Origination vintage effects are also included in the
estimation in part to capture unobserved characteris-
tics of loan quality. The historical data used to esti-
mate this model are industrywide, loan-level data
from many banks and mortgage loan originators.
These estimated PD models are used to simulate
default for each loan reported by each BHC under
the supervisory scenarios. Loans that are 180 days or
more past due as of September 30, 2014, are consid-
ered in default and are assigned a PD of 100 percent.
The LGD for residential mortgages is estimated using
two models. One model estimates the amount of time
that elapses between default and real estate owned
(REO) disposition (timeline model), while the other
relates characteristics of the defaulted loan, such as
the property value at default, to one component of
losses net of recoveries—the proceeds from the sale
of the property net of foreclosure expenses (loss
model).39
These net proceeds are calculated from historical data
on loan balances, servicer advances, and losses from
defaulted loans in private-label, residential mortgage-
backed securities (RMBS). These RMBS data are
also used to estimate the LGD loss model separately
for prime jumbo loans, subprime, and alt-A loans.40
Finally, using the elapsed time between default and
REO disposition estimated in the timeline model,
total estimated losses are allocated into credit losses
on the defaulted loans, which are fully written down
at the time of default, or net losses arising from the
eventual sale of the underlying property (other real
estate owned—or OREO—expenses), which flow
through PPNR. House price changes from the time
of default to foreclosure completion (REO acquisi-
tion) are captured in LGD, while house price changes
after foreclosure completion and before sale of the
property are captured in OREO expenses. The LGD
for loans already in default as of September 30, 2014,
includes further home price declines through the
point of foreclosure.
Home equity loans (HELs) are junior-lien, closed-
end loans, and home equity lines of credit (HELOCs)
are revolving open-end loans extended under lines of
credit, both secured by one- to four-family residential
real estate as defined by the FR Y-9C report. Losses
stemming from default on HELs and HELOCs are
projected at the loan level in an expected loss frame-
work that is similar to first-lien mortgages, with a few
differences.
For second-lien HELs and HELOCs that are current
as of September 30, 2014, but are behind a seriously
delinquent first-lien, the model assumes elevated
default rates under the supervisory scenarios. In
addition, most HELOC contracts require only pay-
ment of interest on the outstanding line balance dur-
ing the period when the line can be drawn upon
(draw period). When the line reaches the end of its
draw period (end-of-draw), the outstanding line bal-
ance either becomes immediately payable or converts
to a fully amortizing loan. HELOCs that reach the
end-of-draw period are assumed to prepay at a higher
rate just prior to end-of-draw and to default at a
higher rate just after end-of-draw than HELOCs that
are still in their draw period.
The LGD for HELs and HELOCs is estimated using
data from private-label mortgage-backed securities,
using the same models used for closed-end first-lien,
but the estimated total mortgage losses for properties
with a defaulted HEL or HELOC are allocated based
on the lien position. Finally, for HELOCs, EAD is
conservatively assumed to equal the credit limit.
Retail Lending: Credit Cards
Credit cards include both general purpose and
private-label credit cards, as well as charge cards, as
defined by the FR Y-9C report. Credit card loans
extended to individuals are included in retail credit
38 The effects of loan modification and evolving modificationpractices are captured in the probability that a delinquent loantransitions back to current status (re-performing loans).
39 Other components of losses net of recoveries are calculateddirectly from available data. Private mortgage insurance is notincorporated into the LGD models. Industry data suggest thatinsurance coverage on portfolio loans is infrequent and cancel-lation or nullification of guarantees was a common occurrenceduring the recent downturn.
40 The differences between characteristics of mortgages in RMBSand mortgages in bank portfolios, such as loan-to-value (LTV)ratio, are controlled for by including various risk characteristicsin the LGD model, such as original LTV ratio, credit score, andcredit quality segment (prime, alt-A, and subprime).
54 Supervisory Stress Test Methodology and Results
cards, while credit cards loans extended to businesses
and corporations are included in other retail lending
and are modeled separately. Losses stemming from
defaults on credit cards are projected at the loan level
using an expected-loss modeling framework.
The PD model for credit cards estimates the prob-
ability that a loan transitions from delinquency status
to default status, given the characteristics of the
account and borrower as well as macroeconomic
variables such as unemployment. When an account
defaults, it is assumed to be closed and does not
return to current status. Credit card loans are consid-
ered in default when they are 120 days past due.
Because the relationship between the PD and its
determinants can vary with the initial status of the
account, separate transition models are estimated for
accounts that are current and active, current and
inactive accounts, and delinquent accounts. In addi-
tion, because this relationship can also vary with time
horizons, separate transition models are estimated for
short-, medium-, and long-term horizons. The his-
torical data used to estimate this model are industry-
wide, loan-level data from many banks, and separate
models were estimated for bank cards and charge
cards. The PD model is used to forecast the PD for
each loan reported by each BHC in the Capital
Assessments and Stress Testing (FR Y-14M) report.
The LGD for credit cards is assumed to be a
fixed percentage and is calculated separately for bank
cards and charge cards based on historical industry
data on LGD during the most recent economic
downturn. The EAD for credit cards equals the sum
of the amount outstanding on the account and a
portion of the credit line, which reflects the amount
that is likely to be drawn down by the borrower
between the beginning of the planning horizon and
the time of default. This drawdown amount is esti-
mated as a function of account and borrower charac-
teristics. Because this relationship can vary with the
initial status of the account and time to default, sepa-
rate models are estimated for current and delinquent
accounts and for accounts with short-, medium-, and
long-term transition to default. For accounts that are
current, separate models were also estimated for dif-
ferent credit-line-size segments.
Retail Lending: Auto
Auto loans are consumer loans extended for the pur-
pose of purchasing new and used automobiles and
light motor vehicles as defined by the FR Y-9C
report. Losses stemming from default in auto retail
loan portfolios are projected at the portfolio segment
level using an expected loss framework.
The PD model for auto loans estimates the probabil-
ity that a loan transitions from either a current or
delinquent status to default status, given the charac-
teristics of the loan and borrower as well as macro-
economic variables such as house prices and the
unemployment rate (which, in some cases, are inter-
acted with loan and borrower characteristics to allow
for greater sensitivity to stressful conditions in high-
risk segments). Default on auto loans is defined
based on either the payment status (120 days past
due), actions of the borrower (bankruptcy), or the
lender (repossession). Because the relationship
between the PD and its determinants can vary with
the initial status of the account, separate transition
models are estimated for accounts that are current
and delinquent accounts. The historical data used to
estimate this model are loan-level, credit bureau data.
The LGD for auto loans is estimated given the char-
acteristics of the loan as well as macroeconomic vari-
ables. The historical data used to estimate this model
are pooled, segment-level data provided by the BHCs
on the FR Y-14Q reports. The EAD for auto loans is
based on the typical pattern of amortization of loans
that ultimately defaulted in historical credit bureau
data. The estimated EAD model captures the average
amortization by loan age for current and delinquent
loans over nine quarters.
Retail Lending: Other Retail Lending
Other retail lending includes the small business loan
portfolio, the other consumer loan portfolio, the stu-
dent loan portfolio, the business and corporate credit
card portfolio, and international retail portfolio.
Losses due to default on other retail lending are fore-
cast by modeling net charge-off rates as a function of
portfolio risk characteristics and macroeconomic
variables. This model is then used to predict future
charge-offs consistent with the macroeconomic vari-
ables provided in the supervisory scenarios.41 The
predicted net charge-off rate is applied to balances
projected by the Federal Reserve to estimate pro-
jected losses. Default is defined as 90 days or more
past due for domestic and international other con-
sumer loans and 120 days or more past due for stu-
dent loans, small business loans, corporate cards, and
41 An exception is made for the government-guaranteed portion ofBHCs’ student loan portfolios, to which an assumed monthlyPD of 1.5 percent and LGD of 3 percent is applied.
March 2015 55
international retail portfolios. The net charge-off rate
is modeled in a system of equations that also includes
the delinquency rate and the default rate. In general,
each rate is modeled in an autoregressive specifica-
tion that also includes the rate in the previous delin-
quency state, characteristics of the underlying loans,
macroeconomic variables and, in some cases, sea-
sonal factors. The models are specified to implicitly
capture roll-rate dynamics. In some cases, the charac-
teristics of the underlying loans, such as dummy vari-
ables for each segment of credit score at origination,
are also interacted with the macroeconomic variables
to capture differences in sensitivities across risk seg-
ments to changes in the macroeconomic environ-
ment. Each retail product type is modeled separately
and, for each product type, economic theory and the
institutional characteristics of the product guide the
inclusion and lag structure of the macroeconomic
variables in the model.
Because of data limitations and the relatively small
size of these portfolios, the net charge-off rate for
each loan type is modeled using industry-
wide, monthly data at the segment level. For most
portfolios, these data are collected on the FR Y-14Q
Retail schedule, which segments each portfolio by
characteristics such as borrower credit score; loan
vintage; type of facility (e.g., installment versus
revolving); and, for international portfolios, geo-
graphic region.42
Charge-off rates are projected by applying the esti-
mated system of equations to each segment of the
BHC’s loan portfolio as of September 30, 2014. The
portfolio level charge-off rate equals the dollar-
weighted average of the segment-level charge-off
rates.43 These projected charge-off rates are applied
to the balances projected by the Federal Reserve to
calculate portfolio losses.
Loan-Loss Provisions for the AccrualLoan Portfolio
Losses on the accrual loan portfolio flow into net
income through provisions for loan and lease losses.
Provisions for loan and lease losses equal projected
loan losses for the quarter plus the amount needed
for the ALLL to be at an appropriate level at the end
of the quarter, which is a function of projected future
loan losses. The appropriate level of ALLL at the end
of a given quarter is generally assumed to be the
amount needed to cover projected loan losses over
the next four quarters.44 Because this calculation of
ALLL is based on projected losses under the adverse
or severely adverse scenarios, it may differ from a
BHC’s actual level of ALLL at the beginning of the
planning horizon, which is based on the BHC’s
assessment of future losses in the current economic
environment. Any difference between these two
measures of ALLL is smoothed into the provisions
projection over the nine quarters of the planning
horizon. Because projected loan losses include off-
balance sheet commitments, the BHC’s allowance at
the beginning of the planning horizon for credit
losses on off-balance sheet exposures (as reported on
the FR Y-9C report) is subtracted from the provi-
sions projection in equal amounts each quarter.
Other Losses
Loans Held for Sale or Measured under the
Fair-Value Option
Certain loans are not accounted for on an accrual
basis. Loans to which the fair-value option (FVO) is
applied are valued as mark-to-market assets. Loans
under the held-for-sale (HFS) and some loans under
the held-for-investment (HFI) accounting classifica-
tions are carried at the lower of cost or market value.
FVO, HFS, and HFI loan portfolios are identified by
the BHCs and reported on the FR Y-14Q report.
Losses related to FVO, HFS, and HFI loans are rec-
ognized in the income statement at the time of the
devaluation.
Losses are estimated by applying the macroeconomic
scenario to loans held in portfolio under FVO, HFS,
and HFI accounting. Losses on C&I and CRE loans
and commitments are estimated by revaluing each
loan or commitment each quarter using a stressed
discount yield (and spread for floating rate loans).
The initial discount yield is based on the loan or
commitment’s initial fair value, settlement date,
maturity date, and interest rate for fixed rate loans
42 Business and corporate credit card portfolio data, which previ-ously were collected on the FR Y-14Q Retail schedule, are nowcollected at the loan level on the FR Y-14M Credit Card sched-ule and subsequently aggregated to the segment level.
43 The dollar weights used are based on the distribution reportedduring the previous observation period. This method assumesthat the distribution of loans across risk segments, other thandelinquency status segments, remains constant over the projec-tion period.
44 For loan types modeled in a charge-off framework, the appro-priate level of ALLL was adjusted to reflect the difference intiming between the recognition of expected losses and that ofcharge-offs.
56 Supervisory Stress Test Methodology and Results
and the fair value, settlement date, maturity date, and
interest rate spread for floating rate loans. Quarterly
movements in the discount yield over the planning
horizon are assumed to equal the stressed change in
corporate bond yields of the same credit rating and
maturity, adjusted for potential changes in credit rat-
ings. The models estimate changes in the fair value of
the loan in a given scenario on a committed-balance
basis. Gains on FVO loan hedges were modeled using
a similar methodology as one used for comparable
assets in the trading portfolio, using the FVO-specific
sensitivities reported by the BHC, and were netted
from estimated losses on the FVO loans.
Losses on retail loans held under FVO, HFS, and
HFI accounting are estimated over the nine quarters
of the planning horizon using a duration-based
approach. This approach uses balances on these
loans reported on the FR Y-14Q report, estimates of
portfolio-weighted duration, and quarterly changes
in stressed spreads from the macroeconomic scenario.
Estimates are calculated separately by vintage and
loan type. No losses are assumed for residential mort-
gage loans under forward contract with the
government-sponsored enterprises (GSEs).
In addition, under the revised regulatory capital
rules, the difference between the amortized cost
(accounting for any OTTI charges) and fair value of
AFS securities as well as HTM securities that have
taken OTTI is phased into the calculation of tier 1
capital for advanced approaches BHCs.45 To address
this issue, a separate fair-value model is used to proj-
ect quarterly changes in the prices of AFS securities
under the supervisory scenarios, as described below.
Securities in the Available-for-Sale and
Held-to-Maturity Portfolios
If a security becomes OTTI, then all or a portion of
the difference between the fair value and amortized
cost of the security must be recognized in earnings.46
Losses on OTTI securities are projected using a suite
of models reflecting differences in the basic structure
of the securities (i.e., securitized versus direct obliga-
tion) and differences in underlying collateral and
obligor type.
The OTTI models are designed to incorporate other-
than-temporary differences between amortized cost
and fair market value due to credit impairment but
not differences reflecting changes in liquidity or mar-
ket conditions unless the firm will be required to sell
the security. Some AFS/HTM securities, including
U.S. Treasury and U.S. government agency obliga-
tions and U.S. government agency or GSE mortgage-
backed securities, are assumed not to be at risk for
the kind of credit impairment that results in OTTI
charges. The remaining securities can be grouped into
three basic categories: securitizations, where the value
of the security depends on the value of an underlying
pool of collateral; direct debt obligations, such as
corporate and sovereign bonds, where the value of
the security depends primarily on the credit quality
of the issuer; and equity securities.47
For securitized obligations, credit and prepayment
models estimate delinquency, default, severity, and
prepayment vectors on the underlying pool of collat-
eral under the supervisory scenarios. Where feasible,
these projections incorporate detailed information on
the underlying collateral characteristics for each indi-
vidual security, derived from commercial databases
that contain collateral and security structure infor-
mation. Delinquency, default, severity, and prepay-
ment vectors are projected either using econometric
models developed by the Federal Reserve or third-
party models used by Federal Reserve analysts that
are designed to project these estimates in stressed
economic environments. The models used vary with
the type of underlying collateral but generally esti-
mate the relationship between the collateral’s perfor-
mance vectors and economic variables, such as the
unemployment rate and house prices. These vectors
are then applied to a cash flow engine that captures
the specific structure of each security (e.g., tranche,
subordination, and payment rules) to calculate the
present value of the cash flows (intrinsic value) for
that security. If the projected intrinsic value is less
than amortized cost, then the security is considered
45 An advanced approaches BHC includes any BHC that has con-solidated assets greater than or equal to $250 billion or totalconsolidated on-balance sheet foreign exposure of at least$10 billion as of December 31, 2014. The advanced approachesBHCs in DFAST 2015 are American Express Company; Bankof America Corporation; The Bank of New York Mellon Cor-poration; Capital One Financial Corporation; Citigroup, Inc.;The Goldman Sachs Group, Inc.; HSBC North America Hold-ings, Inc.; JPMorgan Chase & Co.; Morgan Stanley; NorthernTrust Corporation; The PNC Financial Services Group, Inc.;State Street Corporation; U.S. Bancorp; and Wells Fargo & Co.Non-advanced approaches BHCs may elect to opt out ofincluding AOCI in capital. For DFAST 2015, all other BHCs(other than Deutsche Bank Trust Corporation) opted out ofincluding AOCI in capital. For DBTC, the Federal Reserveincluded AOCI in its capital calculations.
46 A security is considered impaired when the fair value of thesecurity falls below its amortized cost.
47 Equities are also held in the AFS portfolios, although in smallamounts. Losses on these positions under each scenario are cal-culated based on projected equity price changes.
March 2015 57
to be other than temporarily impaired, and OTTI is
calculated as the difference between amortized cost
and intrinsic value.
For direct obligations, the predominant approach is
to assess the PD or severe credit deterioration for
each security issuer or group of security issuers over
the planning horizon. PD is either modeled directly
or inferred by modeling changes in expected fre-
quency of default or CDS spreads for the bonds in
question. A security is considered other than tempo-
rarily impaired if the projected value of the PD or
CDS spread crosses a predetermined threshold
level—generally the level consistent with a CCC/Caa
rating—at any point during the planning horizon.
LGD on these securities is based on historical data
on bond recovery rates. OTTI is calculated as the dif-
ference between the bond’s amortized cost and its
projected recovery value under the supervisory
scenarios.
For certain securitized obligations with smaller levels
of exposure and municipal bonds, the OTTI is esti-
mated as a fraction of projected unrealized losses on
the security from the fair-value model.
After a security is written down as OTTI, the differ-
ence between its original value and the post-OTTI
value is assumed to be invested in securities with the
same risk characteristics. Increases projected by the
Federal Reserve in a BHC’s securities portfolio after
September 30, 2014, are assumed to be in short-term,
riskless assets, and no OTTI charges are assigned to
these securities.
In addition, under the revised regulatory capital
rules, the difference between the amortized cost
(accounting for any OTTI charges) and fair value of
AFS securities as well as non-credit-loss OTTI on
HTM securities is phased into the calculation of tier
1 capital for advanced approaches BHCs.48 To
address this issue, a separate fair-value model is used
to project quarterly changes in the prices of AFS and
HTM securities under the supervisory scenarios, as
described below.
In order to project fair-value changes for AFS securi-
ties, each security is re-priced using one of three
methods depending on the asset class of the secu-
rity—a duration-based approach, generic revalua-
tion, or model-based revaluation.
• Duration-based approach—The duration-based
approach is taken for all AFS securities except
Treasury securities and agency RMBS. This
approach approximates the quarterly price path for
a security over a nine-quarter planning horizon
using projected changes in the security’s yield and
its initial interest rate and spread durations. The
yields used in the approximation vary over the pro-
jection period with changes in Treasury yields and
the securities’ option-adjusted spread. Separate
yield projections were estimated for securities in
different asset classes and with different credit rat-
ings and maturities.
• Generic revaluation—U.S. Treasury securities are
directly re-priced using a simple present-value cal-
culation that incorporates the timing and amount
of contractual cash flows and quarterly Treasury
yields from the macroeconomic scenario.
• Model-based revaluation—Agency RMBS are
revalued using a security-specific pricing model to
capture the effect of embedded options on the cash
flows of each security.
Trading and Private Equity
Total potential mark-to-market losses stemming from
trading positions under a stressed market environ-
ment can be broken into two primary types. The first
type of loss arises from a decrease in the market
value of trading positions, regardless of the default
of credit instruments (e.g., loans or bonds) or the
BHC’s counterparties. The second type is the loss
associated with the risk of default—both the risk of
the default of obligors and the counterparty credit
risk associated with changes in counterparty expo-
sures as well as the deterioration of counterparties’
creditworthiness under stressed market conditions,
which adversely affects the riskiness of positively val-
ued trading positions. The models used to project
losses on trading positions under the global market
shock account for both sources of potential losses,
generally relying on information provided by firms
48 An advanced approaches BHC includes any BHC that has con-solidated assets greater than or equal to $250 billion or totalconsolidated on-balance sheet foreign exposure of at least$10 billion as of December 31, 2014. The advanced approachesBHCs in DFAST 2015 are: American Express Company; Bankof America Corporation; The Bank of New York Mellon Cor-poration; Capital One Financial Corporation; Citigroup, Inc.;The Goldman Sachs Group, Inc.; HSBC North America Hold-ings, Inc.; JPMorgan Chase & Co.; Morgan Stanley; NorthernTrust Corporation; The PNC Financial Services Group, Inc.;State Street Corporation; U.S. Bancorp; and Wells Fargo & Co.Non-advanced approaches BHCs may elect to opt out ofincluding AOCI in capital. For DFAST 2015, Deutsche Bank &Trust Co. did not opt out of including AOCI, and so the Fed-eral Reserve included AOCI in their capital calculations.
58 Supervisory Stress Test Methodology and Results
on estimated sensitivities of their exposures to spe-
cific risk-factor shocks. Because positions in the trad-
ing account are marked to market on a daily basis,
the approach used to generate loss projections on
trading positions is intended to capture the market-
value effect of the global market shock. Losses on
trading positions as a result of a global market shock
were estimated only for the six BHCs with large trad-
ing operations, since trading operations determine
risk and performance to a larger extent at these firms
than at any other BHCs participating in DFAST
2015.
Losses on trading positions, such as equities, foreign
exchange, interest rates, commodities, credit prod-
ucts, private equity, and other fair-value assets arising
from the global market shock are calculated using
position values or the BHCs’ own estimates of the
sensitivity of the position values to changes in a wide
range of market rates, prices, spreads, and volatilities.
Trading losses are calculated by multiplying these
sensitivities by the risk-factor changes included in the
global market shock developed by the Federal
Reserve or by interpolating the change in position
values from BHC-supplied profit/(loss) grids. These
shocks are assumed to be instantaneous and no addi-
tional hedging, recovery in value, or changes in posi-
tions are incorporated into the loss calculation.
Losses in the global market shock include losses from
credit valuation adjustments (CVA) and trading
incremental default risk (IDR) of the six BHCs with
large trading positions. CVAs are adjustments above
and beyond the mark-to-market valuation of the
BHCs’ trading portfolios that capture changes in the
risk that a counterparty to derivatives transaction or
other trading position will default on its obligations.
Using detailed data provided by the six trading
BHCs on the FR Y-14Q Counterparty schedule, each
trading firm’s baseline and stressed CVA for each
counterparty is calculated as a function of unstressed
and stressed values of exposure, PD, and LGD. CVA
losses equal the difference between the baseline and
the stressed CVAs.
In addition to CVA and other mark-to-market losses
on trading positions, default risk of credit instru-
ments in the trading book is captured through IDR.
IDR estimates the potential additional loss stemming
from the default of issuers in excess of the mark-to-
market losses in the trading book. IDR estimates the
losses from jump-to-default in the tail of the distribu-
tion of defaults, where the tail percentile is calibrated
to the severity of the macroeconomic scenario.
The IDR models estimate losses from jump-to-
default for various exposure types, including single-
name, index and index-tranche, and securitizations,
at different levels of granularity depending on expo-
sure type. The loss estimates are based on simulation
models of issuer-level defaults. The IDR loss models
rely on position and exposure data provided by the
firms. IDR losses occur over nine quarters.
Largest Counterparty Default
To estimate losses from the default of counterparties
to derivatives and securities financing agreements, the
Federal Reserve applied a counterparty default sce-
nario component to the eight BHCs that have sub-
stantial trading or custodial operations. The loss is
based on the assumed instantaneous and unexpected
default of a BHC’s largest counterparty, defined as
the counterparty that would produce the largest total
net stressed loss if it were to default on all of its
derivative and securities financing agreements. Net
stressed loss was estimated using net stressed current
exposure (CE), which is derived by applying the
global market shock to the unstressed positions as
well as any collateral posted or received. For deriva-
tive agreements, applicable CDS hedges and CVA
were netted from the net stressed current exposure. A
recovery rate of 10 percent was assumed for both net
stressed CE and applicable CDS hedges.
Similar to the global market shock component, the
loss associated with the counterparty default compo-
nent occurs in the first quarter of the projection and
is an add-on to the macroeconomic conditions and
financial market environment in the supervisory sce-
narios. Certain sovereign entities (Canada, France,
Germany, Italy, Japan, the United Kingdom, and the
United States) and designated clearing counterparties
were excluded when selecting the largest
counterparty.
Losses Related to Operational-Risk Events
Losses related to operational-risk events are a com-
ponent of PPNR and include losses stemming from
events such as fraud, employee lawsuits, or computer
system or other operating disruptions. Operational-
risk loss estimates include historically based loss esti-
mates, based on the average of three approaches, and
estimates of potential costs from unfavorable litiga-
tion outcomes, which reflect elevated litigation risk
and the associated increase in legal reserves observed
in recent years. In all three models—a panel regres-
sion model, a loss distribution approach, and a his-
March 2015 59
torical simulation approach—projections of
operational-risk-related losses for the 31 BHCs are
modeled for each of seven operational-risk categories
identified in the Board’s advanced approaches rule.49
All three models are based on historical operational-
loss data submitted by the BHCs on the FR Y-14Q
report.
In the panel regression model, projections of losses
related to operational-risk events are the product of
two primary components: loss frequency and loss
severity. The expected loss frequency is the estimated
number of operational-loss events in the supervisory
scenario, while loss severity is the estimated loss per
event in each category. Loss frequency is modeled as
a function of macroeconomic variables and BHC-
specific characteristics. Macroeconomic variables,
such as the real GDP growth rate, stock market
return and volatility, credit spread, and the unem-
ployment rate, are included directly in the panel
regression model and/or used to project certain firm-
specific characteristics. Loss is projected as a product
of projected loss frequency from the panel regression
model and loss severity, which equals the average his-
torical dollar loss per event in each operational-risk
category. Total losses related to operational-risk
events equal losses summed across operational-risk
categories. Because the relationship between the fre-
quency of operational-risk events and macroeco-
nomic conditions varies across the categories, sepa-
rate models were estimated for each category.50
In the loss distribution approach model, losses at dif-
ferent percentiles of simulated, annualized loss distri-
butions are used as a proxy for the expected losses
related to operational risk conditional on the macro-
economic scenarios. The loss frequency is assumed to
follow a Poisson distribution, in which the estimated
intensity parameter of the Poisson distribution is spe-
cific to each event type and BHC. A loss severity dis-
tribution is also fit to each event type for each
BHC.51 The distribution of aggregate annual losses is
simulated, and the macroeconomic scenario is implic-
itly incorporated in the results through the percentile
choice, which was based on analysis of historical loss
data for all BHCs taken together. The approach used
to choose the percentile for each scenario essentially
targets the total loss forecast for all BHCs and allows
the loss distribution approach to split this loss among
the individual BHCs and event types. Loss forecasts
for an individual BHC are the sum of the BHCs’ loss
estimates for each event type.
In the third approach—the historical simulation
approach—the distribution of aggregate annual
losses are simulated by repeatedly drawing the annual
event frequency from the same distribution used in
the loss distribution approach, but the severity of
those events was drawn from historical realized loss
data rather than an estimated loss severity distribu-
tion. Losses from the same percentile of the distribu-
tion as in the loss distribution approach are used to
approximate the supervisory scenarios.
Mortgage Repurchase Losses
Mortgage repurchase expenses are a component of
PPNR and are related to litigation, or to demands by
mortgage investors to repurchase loans deemed to
have breached representations and warranties, or to
loans insured by the U.S. government for which cov-
erage could be denied if loan defects are identified.
Mortgage repurchase losses for loans sold with repre-
sentations and warranties liability are estimated in
two parts.
The first part is to estimate credit losses for all loans
sold by a BHC that have outstanding representations
and warranties liability, including loans sold as whole
loans, into private-label securities (PLS) or to a GSE
(Fannie Mae and Freddie Mac) or loans insured by
the government. This part takes into account both
losses recognized to date and future losses projected
over the remaining lifetime of the loans.
The second part is to estimate the share of this credit
loss that may be ultimately put back to the selling
BHC (whether through contractual repurchase, a
settlement agreement, or litigation loss).
49 The seven operational-loss event type categories identified in theFederal Reserve’s advanced approaches rule are internal fraud;external fraud; employment practices and workplace safety; cli-ents, products, and business practices; damage to physicalassets; business disruption and system failures; and execution,delivery, and process management. See 12 CFR 217.101(b).
50 Operational-risk losses due to damage to physical assets, andbusiness disruption and system failure, employment practices,and workplace safety are not expected to be dependent on themacroeconomic environment and therefore were set equal toeach BHC’s average nine-quarter operational-risk loss in thatcategory. External fraud losses of firms focused on credit cardactivities were modeled using each BHC’s average quarterlylosses during the period from the beginning of the financial cri-sis in the third quarter of 2007 through the second quarter of2009.
51 Multiple candidate specifications for the distribution were fit tothe data, and the final specification was chosen based on a num-ber of criteria, including a measure of goodness-of-fit.
60 Supervisory Stress Test Methodology and Results
Future credit loss rates for mortgages (grouped by
vintage and investor type) are projected using indus-
trywide data and models that incorporate the house
price assumptions in the supervisory scenario.52 For
GSE loans, industrywide credit loss rates are
adjusted to reflect the relative credit performance of
loans sold by each BHC and are applied to the
BHC’s outstanding balances. These estimates are
based on vintage-level data on original and current
unpaid balances, current delinquency status, and
losses recognized to date.
The share of past and future credit losses likely to be
ultimately put back to the selling BHCs (the put-back
rate) is estimated separately for each investor type.
• Whole loans and loans sold into PLS—The esti-
mated put-back rate is based on information from
recent settlement activities in the banking industry
and incorporates adjustments for supervisory
assessments of BHC-specific put-back risk.
• Government-insured loans—The estimated put-back
rate is also based on information from recent settle-
ment activities.
• GSE loans—The estimated put-back rate is based
on historical information on the repurchases of
loans sold to Fannie Mae or Freddie Mac, with
consideration given to the relative seasoning of
each vintage and the time interval between default
and demand.
Mortgage repurchase expenses are netted against
actual mortgage put-back reserves as reported by the
BHCs.
Pre-provision Net Revenue
PPNR is forecast with a mix of structural models
using granular data on individual positions: autore-
gressive models that relate the components of a
BHC’s revenues and non-credit-related expenses,
expressed as a share of relevant asset or liability bal-
ances, to BHC characteristics and to macroeconomic
variables; and simple models based on recent firm-
level performance.
Autoregressive models are estimated using historical,
merger-adjusted data from the FR Y-9C report.
Separate models are estimated for 22 different com-
ponents of PPNR, including eight components of
interest income, five components of interest expense,
five components of noninterest non-trading income,
three components of noninterest expenses, and trad-
ing revenue.
When choosing the level of detail at which to model
the components of PPNR, consideration is given
both to the BHCs’ business models and the ability to
accurately model small components of revenue.
Movements in PPNR stemming from operational-
risk events, mortgage repurchases, or OREO are
modeled in separate frameworks, described earlier in
this document.
The PPNR model estimates and projections are
adjusted where appropriate to avoid double counting
movements associated with these items. In addition,
gains or losses associated with debt valuation adjust-
ments (DVA) for firms’ own liabilities are removed
from the historical PPNR data series used to estimate
the model, and, as a result, PPNR projections do not
include DVA gains or losses under the supervisory
scenarios.
The autoregressive model specifications vary some-
what by PPNR component. But, in general, each
component is related to characteristics of the BHCs,
including, in some cases, total assets, asset composi-
tion, funding sources, and liabilities. In some PPNR
components, these measures of BHC portfolio and
business activity do not adequately capture the sig-
nificant variation across BHCs, so BHC-specific con-
trols are included in the models for these compo-
nents. Macroeconomic variables used to project
PPNR include yields on Treasury securities, corpo-
rate bond yields, mortgage rates, real GDP, and stock
market price movements and volatility. The specific
macroeconomic variables differ across equations
based on statistical predictive power and economic
interpretation.
Trading revenues are volatile because they include
both changes in the market value of trading assets
and fees from market-making activities. Forecasts of
PPNR from trading activities at the six BHCs subject
to the global market shock are modeled in the aggre-
gate and then allocated to each BHC based on a
measure of the BHC’s market share. In addition,
because forecasts of trading revenues are intended to
include the effect of the relevant macroeconomic
52 The data used to model credit losses for government-insuredloans and loans sold to GSEs were loans randomly selectedfrom an industry database. The data used to model credit lossesfor loans sold into private-label securities and as whole loanswere loans in proxy deals chosen based on the dealer, issuer, andoriginator information contained in the database.
March 2015 61
variables and to exclude the effect of the global mar-
ket shock, net trading revenue is modeled using a
median regression approach to lessen the influence of
extreme movements in trading revenue associated
with the recent financial crisis. Trading revenues for
the remaining BHCs are modeled in a framework
similar to that of other PPNR components.
For other volatile components of PPNR, we follow
alternative approaches to the autoregressive model.
For example, some noninterest income and noninter-
est expense components that are highly volatile
quarter-to-quarter but do not exhibit a clear cyclical
pattern are modeled as a constant forecast ratio to
reflect a most recent eight-quarter median perfor-
mance. Finally, the forecast of interest expenses on
subordinated debt is based on security-level informa-
tion and takes into account differences across firms
in their maturity schedule and debt pricing in each of
the supervisory scenarios.
Balance Sheet Items andRisk-Weighted Assets
The BHC balance sheet is projected based on a
model that relates industrywide loan and non-loan
asset growth to each other and to broader economic
variables including a proxy for loan supply. The
model allows for both long-run relationships between
the industry aggregates and macroeconomic vari-
ables, as well as short-term dynamics that cause
deviations from these relationships. It is estimated
using aggregate data from the Federal Reserve’s
Financial Accounts of the United States (Z.1) and
the Bureau of Economic Analysis’s National Income
and Product Accounts.
Industry loan and asset growth rates are projected
over the planning horizon using the macroeconomic
variables prescribed in the supervisory scenario. Over
this horizon, each BHC is assumed to maintain a
constant share of the industry’s total assets, total
loans, and total trading assets. In addition, each
BHC is assumed to maintain a constant mix within
their loan and trading asset categories. These
assumptions are applied as follows:
• Each category of loans at a BHC is assumed to
grow at the projected rate of total loans in the
industry.
• Each category of trading assets at a BHC is
assumed to grow as a function of both the pro-
jected rate of total assets and the projected market
value of trading assets in the industry.
• All other assets of a BHC, including securities, are
assumed to grow at the projected rate of non-loan
assets in the industry.
• A BHC’s cash holdings is the residual category,
and its level is set such that the sum of cash and
noncash assets grows at the projected rate of total
assets.
• Growth in securities is assumed to be in short-
term, riskless assets.
Balance sheet projections incorporated expected
changes to a BHC’s business plan, such as mergers,
acquisition, and divestitures, that are likely to have a
material impact on the its capital adequacy and fund-
ing profile.
BHC-submitted data were used to adjust the pro-
jected balance sheet in the quarter when the change
was expected to occur. Once adjusted, assets were
assumed to grow at the same rate as the pre-adjusted
balance sheet. Only divestitures that were either com-
pleted or contractually agreed upon before January 5,
2015, were incorporated.
Estimating RWA under the two different regulatory
capital regimes in place over the planning horizon
requires the calculation of four RWA components:
market risk-weighted assets (MRWA) and credit
RWA as computed under both the general approach
that was in effect as of October 1, 2014, and the stan-
dardized approach of the revised regulatory capital
framework.
For asset categories subject to the market risk rule,
the seven components of MRWA are value at risk
(VaR), stressed VaR (SVaR), incremental risk charge,
correlation trading, non-modeled securitization, spe-
cific risk charge, and other risk charge.
VaR and the incremental risk charge are updated
using the estimated volatility of the trading portfolio,
which is a function of stock market volatility in the
supervisory scenarios, and the projected change in
trading assets. The remaining categories are assumed
to evolve according to projections of a BHC’s trad-
ing assets.
For all asset categories not subject to the market risk
rule, generalized risk weights are imputed from FR
Y-9C report data. These weights are held fixed
62 Supervisory Stress Test Methodology and Results
throughout the forecast horizon to reflect an assump-
tion that the credit portfolio’s underlying risk fea-
tures remain constant throughout the horizon. In
computing standardized RWA, we apply the general-
ized RWA growth path to the standardized RWA
as-of date value reported by the BHCs. Estimates of
the additional capital requirements for past-due
exposures under the standardized approach are con-
sistent with the estimated loss forecast for that
exposure.
Equity Capital and RegulatoryCapital
The final modeling step translates the projections of
revenues, expenses, losses, provisions, balances, and
RWAs from the models described above into esti-
mates of tier 1 common and regulatory capital for
each BHC under the supervisory scenarios. The
supervisory projections of total losses and revenues
are combined to estimate taxable income.
A consistent tax rate across all BHCs is applied to
taxable income to calculate after-tax net income over
the projection period.53 The consistent tax rate is also
used to generate projections of deferred tax assets
(DTAs) from temporary timing differences and net
operating losses. A valuation allowance is estimated
to determine whether a BHC will have sufficient tax-
able income in the future to realize the DTAs, with
changes in the valuation allowance factored into
after-tax net income. Finally, projected after-tax
income incorporates each BHC’s reported one-time
revenue and expense items and adjusts for income
attributable to minority interests. Projected after-tax
net income, combined with common capital action
assumptions, are used to project quarter-by-quarter
changes in equity capital components.54
The quarterly change in the components of equity
capital equals projected after-tax net income minus
capital distributions (dividends and any other actions
that disperse equity), plus any employee
compensation-related issuance or other corporate
actions that increase equity, plus other reported
changes in equity capital such as other comprehen-
sive income, where applicable, and changes incident
to business combinations.
Projected changes in equity capital components
determine changes in equity capital (for tier 1 com-
mon and regulatory capital ratios) and common
equity tier 1 capital before adjustments and deduc-
tions (for regulatory capital ratios), which in turn
drive changes in tier 1 common and regulatory capi-
tal. Tier 1 common capital is calculated using the
definition of capital in the Board’s prior capital
adequacy guidelines.55 Regulatory capital is calcu-
lated consistent with the requirements that are in
effect during the projected quarter of the planning
horizon.56 The definition of regulatory capital
changes throughout the planning horizon in accor-
dance with the transition arrangements in the revised
regulatory capital framework.57
Projected capital levels are calculated using the appli-
cable capital rules to incorporate, as appropriate, pro-
jected levels of non-common capital and certain
items that are subject to adjustment or deduction in
capital. Some items, such as DVA, goodwill, and
intangible assets (other than mortgage and non-
mortgage servicing assets), and components of accu-
mulated other comprehensive income (AOCI) other
than unrealized gains (losses) on AFS securities, are
assumed to remain constant at their starting value
over the planning horizon. For other items, BHC
projections were factored into capital calculations.
Those items include the reported path of additional
tier 1 and tier 2 capital and significant investments in
the capital of unconsolidated financial institutions in
the form of common stock. The Federal Reserve also
included the effects of certain planned mergers,
53 For a discussion of the effect of changing this tax rate assump-tion on the post-stress tier 1 common ratio, see box 2 of Boardof Governors of the Federal Reserve System (2012), “Dodd-Frank Act Stress Test 2013: Supervisory Stress Test Methodol-ogy and Results.”
54 The Federal Reserve used the following capital action assump-tions in projecting post-stress capital levels and ratios: (1) for thefourth quarter of 2014, each company’s actual capital actions asof the end of that quarter; (2) for each quarter from the firstquarter of 2015 through the end of 2016, each company’s pro-jections of capital included: (i) common stock dividends equalto the quarterly average dollar amount of common stock divi-dends that the company paid in the previous year (that is, fromfirst through the fourth quarter of 2014); (ii) payments on anyother instrument that is eligible for inclusion in the numeratorof a regulatory capital ratio equal to the stated dividend, inter-est, or principal due on such instrument during the quarter; and
(iii) an assumption of no redemption, repurchase, or issuance ofany capital instrument that is eligible for inclusion in thenumerator of a regulatory capital ratio, except for commonstock issuances associated with expensed employee compensa-tion and planned mergers. These assumptions are generally con-sistent with the capital action assumptions BHCs are requiredto use in their Dodd-Frank Act company-run stress tests. See12 CFR 252.56(b)(2).
55 12 CFR part 225, appendix A.56 See 79 FR 13498 (March 11, 2014).57 See 12 CFR part 217.
March 2015 63
acquisitions, or divestitures in its projections of capi-
tal and the components of capital.
The projections of capital levels are combined with
Federal Reserve projections of average total assets
and risk-weighted assets to calculate capital ratios
after adjusting for capital deductions. The tier 1 com-
mon ratio is calculated based on the general
approach for calculating risk-weighted assets in all
quarters of the planning horizon. All other risk-
based capital ratios incorporate the general approach
for calculating risk-weighted assets in projections of
the first quarter of the planning horizon (fourth
quarter 2014) and the standardized approach for cal-
culating risk-weighted assets in projections of the fol-
lowing eight quarters of the planning horizon (first
quarter 2015 through fourth quarter 2016). Projected
capital levels and ratios are not adjusted to account
for any differences between projected and actual per-
formance of the BHCs during the time the supervi-
sory stress test results were being produced in the
fourth quarter of 2014 and the first quarter of 2015.
64 Supervisory Stress Test Methodology and Results

Appendix C: BHC-Specific Results
Tables begin on next page.
65

Table C.1.A. Ally Financial Inc.
Projected stressed capital ratios, risk-weighted assets, losses, revenues, net income beforetaxes, and loan lossesFederal Reserve estimates: Severely adverse scenario
Actual 2014:Q3 projected stressed capital ratios through2016:Q4
Actual2014:Q3
Stressed capital ratios1
Ending Minimum
Tier 1 common ratio (%) 9.7 7.9 7.9
Common equity tier 1 capital ratio (%)2 n/a 8.0 8.0
Tier 1 risk-based capital ratio (%) 12.7 10.1 10.1
Total risk-based capital ratio (%) 13.5 11.6 11.6
Tier 1 leverage ratio (%) 10.9 8.8 8.8
1 The capital ratios are calculated using capital action assumptions providedwithin the Dodd-Frank Act stress testing rule. These projections representhypothetical estimates that involve an economic outcome that is more adversethan expected. These estimates are not forecasts of expected losses, revenues,net income before taxes, or capital ratios. The minimum capital ratio presentedis for the period 2014:Q4 to 2016:Q4.
2 Advanced approaches bank holding companies (BHCs) are subject to thecommon equity tier 1 ratio for the third and fourth quarter of 2014. All bankholding companies are subject to the common equity tier 1 ratio for eachquarter of 2015 and 2016. An advanced approaches BHC includes any BHCthat has consolidated total assets greater than or equal to $250 billion orconsolidated total on-balance sheet foreign exposure of at least $10 billion.See 12 CFR 217.100(b)(1). Other BHCs include any BHC that is subject to12 CFR 225.8 and is not an advanced approaches BHC.
n/a Not applicable.
Projected loan losses, by type of loan, 2014:Q4–2016:Q4
Billions ofdollars
Portfolio lossrates (%)1
Loan losses 5.1 5.0
First-lien mortgages, domestic 0.3 5.4
Junior liens and HELOCs, domestic 0.2 8.0
Commercial and industrial2 1.6 4.5
Commercial real estate, domestic 0.2 5.1
Credit cards 0.0 0.0
Other consumer3 2.8 5.2
Other loans4 0.0 12.7
1 Average loan balances used to calculate portfolio loss rates exclude loans heldfor sale and loans held for investment under the fair-value option and arecalculated over nine quarters.
2 Commercial and industrial loans include small- and medium-enterprise loansand corporate cards.
3 Other consumer loans include student loans and automobile loans.4 Other loans include international real estate loans.
Actual 2014:Q3 and projected 2016:Q4 risk-weightedassets
Actual2014:Q3
Projected 2016:Q4
Generalapproach
Standardizedapproach
Risk-weighted assets(billions of dollars)1 128.2 133.3 138.9
1 For each quarter in 2014, risk-weighted assets are calculated using thegeneral risk-based capital approach set forth in 12 CFR 225, appendix A. Foreach quarter in 2015 and 2016, risk-weighted assets are calculated under theBoard’s standardized capital risk-based approach in 12 CFR 217, subpart D,except for the risk-weighted assets used to calculate the tier 1 common ratio,which uses the general risk-based capital approach for all quarters.
Projected losses, revenue, net income and othercomprehensive income through 2016:Q4
Billions ofdollars
Percent ofaverage assets1
Pre-provision net revenue2 4.1 2.7
Other revenue3 0.0
less
Provisions 6.0
Realized losses/gains on securities (AFS/HTM) 0.6
Trading and counterparty losses4 0.0
Other losses/gains5 0.0
equals
Net income before taxes -2.5 -1.6
Memo items
Other comprehensive income6 0.0
Other effects on capital Actual 2014:Q3 2016:Q4
AOCI included in capital (billions of dollars)7 n/a 0.0
1 Average assets is the nine-quarter average of total assets.2 Pre-provision net revenue includes losses from operational-risk events,
mortgage repurchase expenses, and other real estate owned (OREO) costs.3 Other revenue includes one-time income and (expense) items not included in
pre-provision net revenue.4 Trading and counterparty losses include mark-to-market and credit valuation
adjustments (CVA) losses and losses arising from the counterparty defaultscenario component applied to derivatives, securities lending, and repurchaseagreement activities.
5 Other losses/gains includes projected change in fair value of loans held for saleand loans held for investment measured under the fair-value option, andgoodwill impairment losses.
6 Other comprehensive income (OCI) is only calculated for advanced approachesBHCs, and other BHCs that opt into the advanced approaches treatment ofAOCI.
7 Certain AOCI items are subject to transition into projected regulatory capital.Those transitions are 20 percent included in projected regulatory capital for2014, 40 percent included in projected regulatory capital for 2015, and60 percent included in projected regulatory capital for 2016.
66 Supervisory Stress Test Methodology and Results

Table C.1.B. Ally Financial Inc.
Projected stressed capital ratios, risk-weighted assets, losses, revenues, net income beforetaxes, and loan lossesFederal Reserve estimates: Adverse scenario
Actual 2014:Q3 projected stressed capital ratios through2016:Q4
Actual2014:Q3
Stressed capital ratios1
Ending Minimum
Tier 1 common ratio (%) 9.7 9.5 9.3
Common equity tier 1 capital ratio (%)2 n/a 9.4 9.4
Tier 1 risk-based capital ratio (%) 12.7 11.6 11.6
Total risk-based capital ratio (%) 13.5 13.0 13.0
Tier 1 leverage ratio (%) 10.9 9.9 9.9
1 The capital ratios are calculated using capital action assumptions providedwithin the Dodd-Frank Act stress testing rule. These projections representhypothetical estimates that involve an economic outcome that is more adversethan expected. These estimates are not forecasts of expected losses, revenues,net income before taxes, or capital ratios. The minimum capital ratio presentedis for the period 2014:Q4 to 2016:Q4.
2 Advanced approaches bank holding companies (BHCs) are subject to thecommon equity tier 1 ratio for the third and fourth quarter of 2014. All bankholding companies are subject to the common equity tier 1 ratio for eachquarter of 2015 and 2016. An advanced approaches BHC includes any BHCthat has consolidated total assets greater than or equal to $250 billion orconsolidated total on-balance sheet foreign exposure of at least $10 billion.See 12 CFR 217.100(b)(1). Other BHCs include any BHC that is subject to12 CFR 225.8 and is not an advanced approaches BHC.
n/a Not applicable.
Projected loan losses, by type of loan, 2014:Q4–2016:Q4
Billions ofdollars
Portfolio lossrates (%)1
Loan losses 3.5 3.4
First-lien mortgages, domestic 0.2 4.3
Junior liens and HELOCs, domestic 0.1 5.3
Commercial and industrial2 1.0 2.8
Commercial real estate, domestic 0.1 2.8
Credit cards 0.0 0.0
Other consumer3 2.0 3.7
Other loans4 0.0 7.1
1 Average loan balances used to calculate portfolio loss rates exclude loans heldfor sale and loans held for investment under the fair-value option and arecalculated over nine quarters.
2 Commercial and industrial loans include small- and medium-enterprise loansand corporate cards.
3 Other consumer loans include student loans and automobile loans.4 Other loans include international real estate loans.
Actual 2014:Q3 and projected 2016:Q4 risk-weightedassets
Actual2014:Q3
Projected 2016:Q4
Generalapproach
Standardizedapproach
Risk-weighted assets(billions of dollars)1 128.2 138.3 143.4
1 For each quarter in 2014, risk-weighted assets are calculated using thegeneral risk-based capital approach set forth in 12 CFR 225, appendix A. Foreach quarter in 2015 and 2016, risk-weighted assets are calculated under theBoard’s standardized capital risk-based approach in 12 CFR 217, subpart D,except for the risk-weighted assets used to calculate the tier 1 common ratio,which uses the general risk-based capital approach for all quarters.
Projected losses, revenue, net income and othercomprehensive income through 2016:Q4
Billions ofdollars
Percent ofaverage assets1
Pre-provision net revenue2 4.5 2.8
Other revenue3 0.0
less
Provisions 4.1
Realized losses/gains on securities (AFS/HTM) 0.2
Trading and counterparty losses4 0.0
Other losses/gains5 0.0
equals
Net income before taxes 0.1 0.1
Memo items
Other comprehensive income6 0.0
Other effects on capital Actual 2014:Q3 2016:Q4
AOCI included in capital (billions of dollars)7 n/a 0.0
1 Average assets is the nine-quarter average of total assets.2 Pre-provision net revenue includes losses from operational-risk events,
mortgage repurchase expenses, and other real estate owned (OREO) costs.3 Other revenue includes one-time income and (expense) items not included in
pre-provision net revenue.4 Trading and counterparty losses include mark-to-market and credit valuation
adjustments (CVA) losses and losses arising from the counterparty defaultscenario component applied to derivatives, securities lending, and repurchaseagreement activities.
5 Other losses/gains includes projected change in fair value of loans held for saleand loans held for investment measured under the fair-value option, andgoodwill impairment losses.
6 Other comprehensive income (OCI) is only calculated for advanced approachesBHCs, and other BHCs that opt into the advanced approaches treatment ofAOCI.
7 Certain AOCI items are subject to transition into projected regulatory capital.Those transitions are 20 percent included in projected regulatory capital for2014, 40 percent included in projected regulatory capital for 2015, and60 percent included in projected regulatory capital for 2016.
March 2015 67
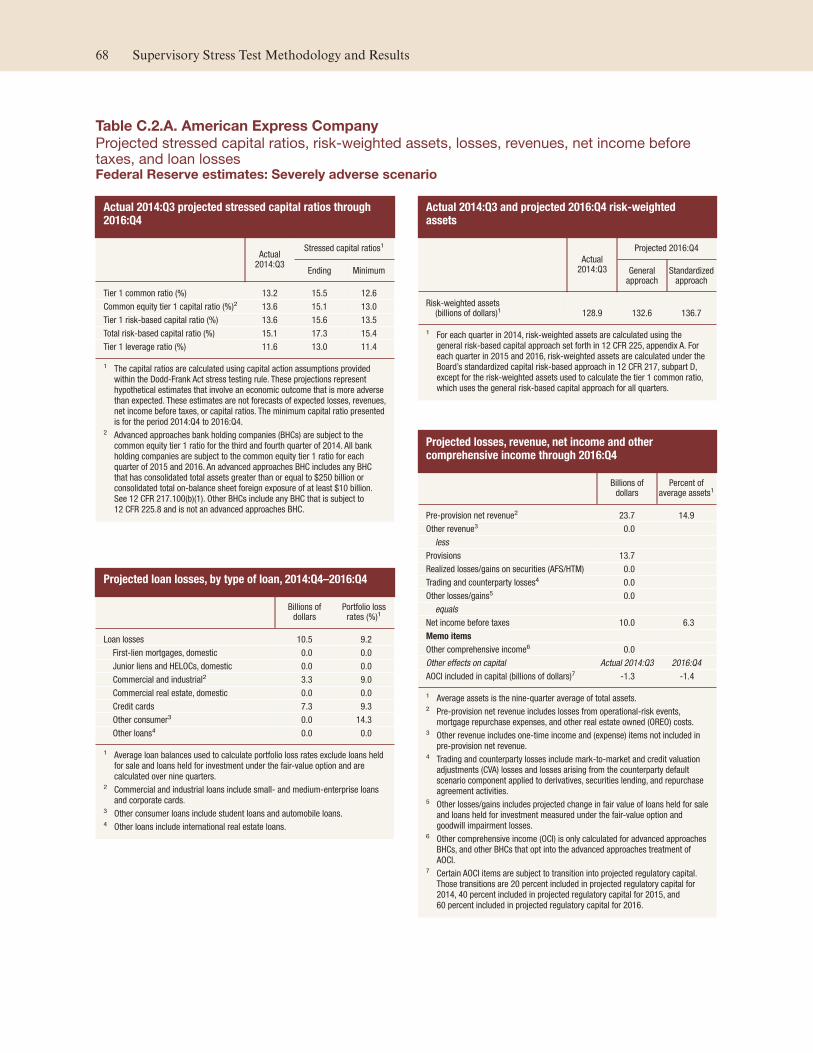
Table C.2.A. American Express Company
Projected stressed capital ratios, risk-weighted assets, losses, revenues, net income beforetaxes, and loan lossesFederal Reserve estimates: Severely adverse scenario
Actual 2014:Q3 projected stressed capital ratios through2016:Q4
Actual2014:Q3
Stressed capital ratios1
Ending Minimum
Tier 1 common ratio (%) 13.2 15.5 12.6
Common equity tier 1 capital ratio (%)2 13.6 15.1 13.0
Tier 1 risk-based capital ratio (%) 13.6 15.6 13.5
Total risk-based capital ratio (%) 15.1 17.3 15.4
Tier 1 leverage ratio (%) 11.6 13.0 11.4
1 The capital ratios are calculated using capital action assumptions providedwithin the Dodd-Frank Act stress testing rule. These projections representhypothetical estimates that involve an economic outcome that is more adversethan expected. These estimates are not forecasts of expected losses, revenues,net income before taxes, or capital ratios. The minimum capital ratio presentedis for the period 2014:Q4 to 2016:Q4.
2 Advanced approaches bank holding companies (BHCs) are subject to thecommon equity tier 1 ratio for the third and fourth quarter of 2014. All bankholding companies are subject to the common equity tier 1 ratio for eachquarter of 2015 and 2016. An advanced approaches BHC includes any BHCthat has consolidated total assets greater than or equal to $250 billion orconsolidated total on-balance sheet foreign exposure of at least $10 billion.See 12 CFR 217.100(b)(1). Other BHCs include any BHC that is subject to12 CFR 225.8 and is not an advanced approaches BHC.
Projected loan losses, by type of loan, 2014:Q4–2016:Q4
Billions ofdollars
Portfolio lossrates (%)1
Loan losses 10.5 9.2
First-lien mortgages, domestic 0.0 0.0
Junior liens and HELOCs, domestic 0.0 0.0
Commercial and industrial2 3.3 9.0
Commercial real estate, domestic 0.0 0.0
Credit cards 7.3 9.3
Other consumer3 0.0 14.3
Other loans4 0.0 0.0
1 Average loan balances used to calculate portfolio loss rates exclude loans heldfor sale and loans held for investment under the fair-value option and arecalculated over nine quarters.
2 Commercial and industrial loans include small- and medium-enterprise loansand corporate cards.
3 Other consumer loans include student loans and automobile loans.4 Other loans include international real estate loans.
Actual 2014:Q3 and projected 2016:Q4 risk-weightedassets
Actual2014:Q3
Projected 2016:Q4
Generalapproach
Standardizedapproach
Risk-weighted assets(billions of dollars)1 128.9 132.6 136.7
1 For each quarter in 2014, risk-weighted assets are calculated using thegeneral risk-based capital approach set forth in 12 CFR 225, appendix A. Foreach quarter in 2015 and 2016, risk-weighted assets are calculated under theBoard’s standardized capital risk-based approach in 12 CFR 217, subpart D,except for the risk-weighted assets used to calculate the tier 1 common ratio,which uses the general risk-based capital approach for all quarters.
Projected losses, revenue, net income and othercomprehensive income through 2016:Q4
Billions ofdollars
Percent ofaverage assets1
Pre-provision net revenue2 23.7 14.9
Other revenue3 0.0
less
Provisions 13.7
Realized losses/gains on securities (AFS/HTM) 0.0
Trading and counterparty losses4 0.0
Other losses/gains5 0.0
equals
Net income before taxes 10.0 6.3
Memo items
Other comprehensive income6 0.0
Other effects on capital Actual 2014:Q3 2016:Q4
AOCI included in capital (billions of dollars)7 -1.3 -1.4
1 Average assets is the nine-quarter average of total assets.2 Pre-provision net revenue includes losses from operational-risk events,
mortgage repurchase expenses, and other real estate owned (OREO) costs.3 Other revenue includes one-time income and (expense) items not included in
pre-provision net revenue.4 Trading and counterparty losses include mark-to-market and credit valuation
adjustments (CVA) losses and losses arising from the counterparty defaultscenario component applied to derivatives, securities lending, and repurchaseagreement activities.
5 Other losses/gains includes projected change in fair value of loans held for saleand loans held for investment measured under the fair-value option andgoodwill impairment losses.
6 Other comprehensive income (OCI) is only calculated for advanced approachesBHCs, and other BHCs that opt into the advanced approaches treatment ofAOCI.
7 Certain AOCI items are subject to transition into projected regulatory capital.Those transitions are 20 percent included in projected regulatory capital for2014, 40 percent included in projected regulatory capital for 2015, and60 percent included in projected regulatory capital for 2016.
68 Supervisory Stress Test Methodology and Results

Table C.2.B. American Express Company
Projected stressed capital ratios, risk-weighted assets, losses, revenues, net income beforetaxes, and loan lossesFederal Reserve estimates: Adverse scenario
Actual 2014:Q3 projected stressed capital ratios through2016:Q4
Actual2014:Q3
Stressed capital ratios1
Ending Minimum
Tier 1 common ratio (%) 13.2 17.5 12.8
Common equity tier 1 capital ratio (%)2 13.6 17.1 13.4
Tier 1 risk-based capital ratio (%) 13.6 17.6 14.0
Total risk-based capital ratio (%) 15.1 19.3 15.8
Tier 1 leverage ratio (%) 11.6 14.4 11.6
1 The capital ratios are calculated using capital action assumptions providedwithin the Dodd-Frank Act stress testing rule. These projections representhypothetical estimates that involve an economic outcome that is more adversethan expected. These estimates are not forecasts of expected losses, revenues,net income before taxes, or capital ratios. The minimum capital ratio presentedis for the period 2014:Q4 to 2016:Q4.
2 Advanced approaches bank holding companies (BHCs) are subject to thecommon equity tier 1 ratio for the third and fourth quarter of 2014. All bankholding companies are subject to the common equity tier 1 ratio for eachquarter of 2015 and 2016. An advanced approaches BHC includes any BHCthat has consolidated total assets greater than or equal to $250 billion orconsolidated total on-balance sheet foreign exposure of at least $10 billion.See 12 CFR 217.100(b)(1). Other BHCs include any BHC that is subject to12 CFR 225.8 and is not an advanced approaches BHC.
Projected loan losses, by type of loan, 2014:Q4–2016:Q4
Billions ofdollars
Portfolio lossrates (%)1
Loan losses 8.1 7.0
First-lien mortgages, domestic 0.0 0.0
Junior liens and HELOCs, domestic 0.0 0.0
Commercial and industrial2 2.4 6.5
Commercial real estate, domestic 0.0 0.0
Credit cards 5.7 7.2
Other consumer3 0.0 12.2
Other loans4 0.0 0.0
1 Average loan balances used to calculate portfolio loss rates exclude loans heldfor sale and loans held for investment under the fair-value option and arecalculated over nine quarters.
2 Commercial and industrial loans include small- and medium-enterprise loansand corporate cards.
3 Other consumer loans include student loans and automobile loans.4 Other loans include international real estate loans.
Actual 2014:Q3 and projected 2016:Q4 risk-weightedassets
Actual2014:Q3
Projected 2016:Q4
Generalapproach
Standardizedapproach
Risk-weighted assets(billions of dollars)1 128.9 137.4 140.5
1 For each quarter in 2014, risk-weighted assets are calculated using thegeneral risk-based capital approach set forth in 12 CFR 225, appendix A. Foreach quarter in 2015 and 2016, risk-weighted assets are calculated under theBoard’s standardized capital risk-based approach in 12 CFR 217, subpart D,except for the risk-weighted assets used to calculate the tier 1 common ratio,which uses the general risk-based capital approach for all quarters.
Projected losses, revenue, net income and othercomprehensive income through 2016:Q4
Billions ofdollars
Percent ofaverage assets1
Pre-provision net revenue2 25.9 15.9
Other revenue3 0.0
less
Provisions 10.8
Realized losses/gains on securities (AFS/HTM) 0.0
Trading and counterparty losses4 0.0
Other losses/gains5 0.0
equals
Net income before taxes 15.1 9.3
Memo items
Other comprehensive income6 -0.3
Other effects on capital Actual 2014:Q3 2016:Q4
AOCI included in capital (billions of dollars)7 -1.3 -1.6
1 Average assets is the nine-quarter average of total assets.2 Pre-provision net revenue includes losses from operational-risk events,
mortgage repurchase expenses, and other real estate owned (OREO) costs.3 Other revenue includes one-time income and (expense) items not included in
pre-provision net revenue.4 Trading and counterparty losses include mark-to-market and credit valuation
adjustments (CVA) losses and losses arising from the counterparty defaultscenario component applied to derivatives, securities lending, and repurchaseagreement activities.
5 Other losses/gains includes projected change in fair value of loans held for saleand loans held for investment measured under the fair-value option andgoodwill impairment losses.
6 Other comprehensive income (OCI) is only calculated for advanced approachesBHCs, and other BHCs that opt into the advanced approaches treatment ofAOCI.
7 Certain AOCI items are subject to transition into projected regulatory capital.Those transitions are 20 percent included in projected regulatory capital for2014, 40 percent included in projected regulatory capital for 2015, and60 percent included in projected regulatory capital for 2016.
March 2015 69

Table C.3.A. Bank of America Corporation
Projected stressed capital ratios, risk-weighted assets, losses, revenues, net income beforetaxes, and loan lossesFederal Reserve estimates: Severely adverse scenario
Actual 2014:Q3 projected stressed capital ratios through2016:Q4
Actual2014:Q3
Stressed capital ratios1
Ending Minimum
Tier 1 common ratio (%) 11.3 7.4 7.1
Common equity tier 1 capital ratio (%)2 12.0 7.2 7.1
Tier 1 risk-based capital ratio (%) 12.8 7.9 7.8
Total risk-based capital ratio (%) 15.8 10.4 10.4
Tier 1 leverage ratio (%) 7.9 5.1 5.1
1 The capital ratios are calculated using capital action assumptions providedwithin the Dodd-Frank Act stress testing rule. These projections representhypothetical estimates that involve an economic outcome that is more adversethan expected. These estimates are not forecasts of expected losses, revenues,net income before taxes, or capital ratios. The minimum capital ratio presentedis for the period 2014:Q4 to 2016:Q4.
2 Advanced approaches bank holding companies (BHCs) are subject to thecommon equity tier 1 ratio for the third and fourth quarter of 2014. All bankholding companies are subject to the common equity tier 1 ratio for eachquarter of 2015 and 2016. An advanced approaches BHC includes any BHCthat has consolidated total assets greater than or equal to $250 billion orconsolidated total on-balance sheet foreign exposure of at least $10 billion.See 12 CFR 217.100(b)(1). Other BHCs include any BHC that is subject to12 CFR 225.8 and is not an advanced approaches BHC.
Projected loan losses, by type of loan, 2014:Q4–2016:Q4
Billions ofdollars
Portfolio lossrates (%)1
Loan losses 45.7 4.9
First-lien mortgages, domestic 7.1 3.1
Junior liens and HELOCs, domestic 8.2 9.2
Commercial and industrial2 8.0 3.9
Commercial real estate, domestic 5.1 8.3
Credit cards 11.7 11.4
Other consumer3 2.2 2.8
Other loans4 3.3 2.1
1 Average loan balances used to calculate portfolio loss rates exclude loans heldfor sale and loans held for investment under the fair-value option and arecalculated over nine quarters.
2 Commercial and industrial loans include small- and medium-enterprise loansand corporate cards.
3 Other consumer loans include student loans and automobile loans.4 Other loans include international real estate loans.
Actual 2014:Q3 and projected 2016:Q4 risk-weightedassets
Actual2014:Q3
Projected 2016:Q4
Generalapproach
Standardizedapproach
Risk-weighted assets(billions of dollars)1 1,271.7 1,309.2 1,433.9
1 For each quarter in 2014, risk-weighted assets are calculated using thegeneral risk-based capital approach set forth in 12 CFR 225, appendix A. Foreach quarter in 2015 and 2016, risk-weighted assets are calculated under theBoard’s standardized capital risk-based approach in 12 CFR 217, subpart D,except for the risk-weighted assets used to calculate the tier 1 common ratio,which uses the general risk-based capital approach for all quarters.
Projected losses, revenue, net income and othercomprehensive income through 2016:Q4
Billions ofdollars
Percent ofaverage assets1
Pre-provision net revenue2 34.4 1.6
Other revenue3 0.0
less
Provisions 49.1
Realized losses/gains on securities (AFS/HTM) 0.9
Trading and counterparty losses4 17.6
Other losses/gains5 4.1
equals
Net income before taxes -37.3 -1.7
Memo items
Other comprehensive income6 2.3
Other effects on capital Actual 2014:Q3 2016:Q4
AOCI included in capital (billions of dollars)7 -1.3 -1.1
1 Average assets is the nine-quarter average of total assets.2 Pre-provision net revenue includes losses from operational-risk events,
mortgage repurchase expenses, and other real estate owned (OREO) costs.3 Other revenue includes one-time income and (expense) items not included in
pre-provision net revenue.4 Trading and counterparty losses include mark-to-market and credit valuation
adjustments (CVA) losses and losses arising from the counterparty defaultscenario component applied to derivatives, securities lending, and repurchaseagreement activities.
5 Other losses/gains includes projected change in fair value of loans held for saleand loans held for investment measured under the fair-value option andgoodwill impairment losses.
6 Other comprehensive income (OCI) is only calculated for advanced approachesBHCs, and other BHCs that opt into the advanced approaches treatment ofAOCI.
7 Certain AOCI items are subject to transition into projected regulatory capital.Those transitions are 20 percent included in projected regulatory capital for2014, 40 percent included in projected regulatory capital for 2015, and60 percent included in projected regulatory capital for 2016.
70 Supervisory Stress Test Methodology and Results

Table C.3.B. Bank of America Corporation
Projected stressed capital ratios, risk-weighted assets, losses, revenues, net income beforetaxes, and loan lossesFederal Reserve estimates: Adverse scenario
Actual 2014:Q3 projected stressed capital ratios through2016:Q4
Actual2014:Q3
Stressed capital ratios1
Ending Minimum
Tier 1 common ratio (%) 11.3 11.5 10.0
Common equity tier 1 capital ratio (%)2 12.0 8.5 8.0
Tier 1 risk-based capital ratio (%) 12.8 9.7 9.1
Total risk-based capital ratio (%) 15.8 11.8 11.5
Tier 1 leverage ratio (%) 7.9 6.2 5.9
1 The capital ratios are calculated using capital action assumptions providedwithin the Dodd-Frank Act stress testing rule. These projections representhypothetical estimates that involve an economic outcome that is more adversethan expected. These estimates are not forecasts of expected losses, revenues,net income before taxes, or capital ratios. The minimum capital ratio presentedis for the period 2014:Q4 to 2016:Q4.
2 Advanced approaches bank holding companies (BHCs) are subject to thecommon equity tier 1 ratio for the third and fourth quarter of 2014. All bankholding companies are subject to the common equity tier 1 ratio for eachquarter of 2015 and 2016. An advanced approaches BHC includes any BHCthat has consolidated total assets greater than or equal to $250 billion orconsolidated total on-balance sheet foreign exposure of at least $10 billion.See 12 CFR 217.100(b)(1). Other BHCs include any BHC that is subject to12 CFR 225.8 and is not an advanced approaches BHC.
Projected loan losses, by type of loan, 2014:Q4–2016:Q4
Billions ofdollars
Portfolio lossrates (%)1
Loan losses 31.0 3.3
First-lien mortgages, domestic 4.9 2.1
Junior liens and HELOCs, domestic 5.4 5.9
Commercial and industrial2 4.7 2.3
Commercial real estate, domestic 2.9 4.7
Credit cards 9.4 9.0
Other consumer3 1.7 2.0
Other loans4 2.0 1.2
1 Average loan balances used to calculate portfolio loss rates exclude loans heldfor sale and loans held for investment under the fair-value option and arecalculated over nine quarters.
2 Commercial and industrial loans include small- and medium-enterprise loansand corporate cards.
3 Other consumer loans include student loans and automobile loans.4 Other loans include international real estate loans.
Actual 2014:Q3 and projected 2016:Q4 risk-weightedassets
Actual2014:Q3
Projected 2016:Q4
Generalapproach
Standardizedapproach
Risk-weighted assets(billions of dollars)1 1,271.7 1,361.6 1,477.1
1 For each quarter in 2014, risk-weighted assets are calculated using thegeneral risk-based capital approach set forth in 12 CFR 225, appendix A. Foreach quarter in 2015 and 2016, risk-weighted assets are calculated under theBoard’s standardized capital risk-based approach in 12 CFR 217, subpart D,except for the risk-weighted assets used to calculate the tier 1 common ratio,which uses the general risk-based capital approach for all quarters.
Projected losses, revenue, net income and othercomprehensive income through 2016:Q4
Billions ofdollars
Percent ofaverage assets1
Pre-provision net revenue2 61.6 2.7
Other revenue3 0.0
less
Provisions 29.2
Realized losses/gains on securities (AFS/HTM) 0.5
Trading and counterparty losses4 9.1
Other losses/gains5 2.2
equals
Net income before taxes 20.6 0.9
Memo items
Other comprehensive income6 -26.0
Other effects on capital Actual 2014:Q3 2016:Q4
AOCI included in capital (billions of dollars)7 -1.3 -18.0
1 Average assets is the nine-quarter average of total assets.2 Pre-provision net revenue includes losses from operational-risk events,
mortgage repurchase expenses, and other real estate owned (OREO) costs.3 Other revenue includes one-time income and (expense) items not included in
pre-provision net revenue.4 Trading and counterparty losses include mark-to-market and credit valuation
adjustments (CVA) losses and losses arising from the counterparty defaultscenario component applied to derivatives, securities lending, and repurchaseagreement activities.
5 Other losses/gains includes projected change in fair value of loans held for saleand loans held for investment measured under the fair-value option andgoodwill impairment losses.
6 Other comprehensive income (OCI) is only calculated for advanced approachesBHCs, and other BHCs that opt into the advanced approaches treatment ofAOCI.
7 Certain AOCI items are subject to transition into projected regulatory capital.Those transitions are 20 percent included in projected regulatory capital for2014, 40 percent included in projected regulatory capital for 2015, and60 percent included in projected regulatory capital for 2016.
March 2015 71

Table C.4.A. The Bank of New York Mellon Corporation
Projected stressed capital ratios, risk-weighted assets, losses, revenues, net income beforetaxes, and loan lossesFederal Reserve estimates: Severely adverse scenario
Actual 2014:Q3 projected stressed capital ratios through2016:Q4
Actual2014:Q3
Stressed capital ratios1
Ending Minimum
Tier 1 common ratio (%) 13.9 16.0 12.6
Common equity tier 1 capital ratio (%)2 15.1 15.1 12.6
Tier 1 risk-based capital ratio (%) 16.3 16.1 13.6
Total risk-based capital ratio (%) 17.0 16.5 14.2
Tier 1 leverage ratio (%) 5.8 6.0 5.2
1 The capital ratios are calculated using capital action assumptions providedwithin the Dodd-Frank Act stress testing rule. These projections representhypothetical estimates that involve an economic outcome that is more adversethan expected. These estimates are not forecasts of expected losses, revenues,net income before taxes, or capital ratios. The minimum capital ratio presentedis for the period 2014:Q4 to 2016:Q4.
2 Advanced approaches bank holding companies (BHCs) are subject to thecommon equity tier 1 ratio for the third and fourth quarter of 2014. All bankholding companies are subject to the common equity tier 1 ratio for eachquarter of 2015 and 2016. An advanced approaches BHC includes any BHCthat has consolidated total assets greater than or equal to $250 billion orconsolidated total on-balance sheet foreign exposure of at least $10 billion.See 12 CFR 217.100(b)(1). Other BHCs include any BHC that is subject to12 CFR 225.8 and is not an advanced approaches BHC.
Projected loan losses, by type of loan, 2014:Q4–2016:Q4
Billions ofdollars
Portfolio lossrates (%)1
Loan losses 1.4 2.3
First-lien mortgages, domestic 0.2 2.9
Junior liens and HELOCs, domestic 0.0 9.8
Commercial and industrial2 0.1 3.3
Commercial real estate, domestic 0.2 10.3
Credit cards 0.0 0.0
Other consumer3 0.3 10.6
Other loans4 0.6 1.4
1 Average loan balances used to calculate portfolio loss rates exclude loans heldfor sale and loans held for investment under the fair-value option and arecalculated over nine quarters.
2 Commercial and industrial loans include small- and medium-enterprise loansand corporate cards.
3 Other consumer loans include student loans and automobile loans.4 Other loans include international real estate loans.
Actual 2014:Q3 and projected 2016:Q4 risk-weightedassets
Actual2014:Q3
Projected 2016:Q4
Generalapproach
Standardizedapproach
Risk-weighted assets(billions of dollars)1 128.8 130.5 142.4
1 For each quarter in 2014, risk-weighted assets are calculated using thegeneral risk-based capital approach set forth in 12 CFR 225, appendix A. Foreach quarter in 2015 and 2016, risk-weighted assets are calculated under theBoard’s standardized capital risk-based approach in 12 CFR 217, subpart D,except for the risk-weighted assets used to calculate the tier 1 common ratio,which uses the general risk-based capital approach for all quarters.
Projected losses, revenue, net income and othercomprehensive income through 2016:Q4
Billions ofdollars
Percent ofaverage assets1
Pre-provision net revenue2 11.8 2.9
Other revenue3 0.0
less
Provisions 1.7
Realized losses/gains on securities (AFS/HTM) 0.2
Trading and counterparty losses4 0.9
Other losses/gains5 1.7
equals
Net income before taxes 7.2 1.8
Memo items
Other comprehensive income6 -0.3
Other effects on capital Actual 2014:Q3 2016:Q4
AOCI included in capital (billions of dollars)7 -0.8 -1.0
1 Average assets is the nine-quarter average of total assets.2 Pre-provision net revenue includes losses from operational-risk events,
mortgage repurchase expenses, and other real estate owned (OREO) costs.3 Other revenue includes one-time income and (expense) items not included in
pre-provision net revenue.4 Trading and counterparty losses include mark-to-market and credit valuation
adjustments (CVA) losses and losses arising from the counterparty defaultscenario component applied to derivatives, securities lending, and repurchaseagreement activities.
5 Other losses/gains includes projected change in fair value of loans held for saleand loans held for investment measured under the fair-value option andgoodwill impairment losses.
6 Other comprehensive income (OCI) is only calculated for advanced approachesBHCs, and other BHCs that opt into the advanced approaches treatment ofAOCI.
7 Certain AOCI items are subject to transition into projected regulatory capital.Those transitions are 20 percent included in projected regulatory capital for2014, 40 percent included in projected regulatory capital for 2015, and60 percent included in projected regulatory capital for 2016.
72 Supervisory Stress Test Methodology and Results

Table C.4.B. The Bank of New York Mellon Corporation
Projected stressed capital ratios, risk-weighted assets, losses, revenues, net income beforetaxes, and loan lossesFederal Reserve estimates: Adverse scenario
Actual 2014:Q3 projected stressed capital ratios through2016:Q4
Actual2014:Q3
Stressed capital ratios1
Ending Minimum
Tier 1 common ratio (%) 13.9 19.6 13.3
Common equity tier 1 capital ratio (%)2 15.1 16.1 12.7
Tier 1 risk-based capital ratio (%) 16.3 17.1 13.9
Total risk-based capital ratio (%) 17.0 17.4 14.3
Tier 1 leverage ratio (%) 5.8 6.3 5.2
1 The capital ratios are calculated using capital action assumptions providedwithin the Dodd-Frank Act stress testing rule. These projections representhypothetical estimates that involve an economic outcome that is more adversethan expected. These estimates are not forecasts of expected losses, revenues,net income before taxes, or capital ratios. The minimum capital ratio presentedis for the period 2014:Q4 to 2016:Q4.
2 Advanced approaches bank holding companies (BHCs) are subject to thecommon equity tier 1 ratio for the third and fourth quarter of 2014. All bankholding companies are subject to the common equity tier 1 ratio for eachquarter of 2015 and 2016. An advanced approaches BHC includes any BHCthat has consolidated total assets greater than or equal to $250 billion orconsolidated total on-balance sheet foreign exposure of at least $10 billion.See 12 CFR 217.100(b)(1). Other BHCs include any BHC that is subject to12 CFR 225.8 and is not an advanced approaches BHC.
Projected loan losses, by type of loan, 2014:Q4–2016:Q4
Billions ofdollars
Portfolio lossrates (%)1
Loan losses 0.9 1.5
First-lien mortgages, domestic 0.1 2.1
Junior liens and HELOCs, domestic 0.0 6.3
Commercial and industrial2 0.0 2.0
Commercial real estate, domestic 0.1 5.9
Credit cards 0.0 0.0
Other consumer3 0.2 8.6
Other loans4 0.4 0.9
1 Average loan balances used to calculate portfolio loss rates exclude loans heldfor sale and loans held for investment under the fair-value option and arecalculated over nine quarters.
2 Commercial and industrial loans include small- and medium-enterprise loansand corporate cards.
3 Other consumer loans include student loans and automobile loans.4 Other loans include international real estate loans.
Actual 2014:Q3 and projected 2016:Q4 risk-weightedassets
Actual2014:Q3
Projected 2016:Q4
Generalapproach
Standardizedapproach
Risk-weighted assets(billions of dollars)1 128.8 137.5 150.2
1 For each quarter in 2014, risk-weighted assets are calculated using thegeneral risk-based capital approach set forth in 12 CFR 225, appendix A. Foreach quarter in 2015 and 2016, risk-weighted assets are calculated under theBoard’s standardized capital risk-based approach in 12 CFR 217, subpart D,except for the risk-weighted assets used to calculate the tier 1 common ratio,which uses the general risk-based capital approach for all quarters.
Projected losses, revenue, net income and othercomprehensive income through 2016:Q4
Billions ofdollars
Percent ofaverage assets1
Pre-provision net revenue2 19.4 4.7
Other revenue3 0.0
less
Provisions 1.1
Realized losses/gains on securities (AFS/HTM) 0.1
Trading and counterparty losses4 0.7
Other losses/gains5 0.9
equals
Net income before taxes 16.6 4.0
Memo items
Other comprehensive income6 -6.1
Other effects on capital Actual 2014:Q3 2016:Q4
AOCI included in capital (billions of dollars)7 -0.8 -4.5
1 Average assets is the nine-quarter average of total assets.2 Pre-provision net revenue includes losses from operational-risk events,
mortgage repurchase expenses, and other real estate owned (OREO) costs.3 Other revenue includes one-time income and (expense) items not included in
pre-provision net revenue.4 Trading and counterparty losses include mark-to-market and credit valuation
adjustments (CVA) losses and losses arising from the counterparty defaultscenario component applied to derivatives, securities lending, and repurchaseagreement activities.
5 Other losses/gains includes projected change in fair value of loans held for saleand loans held for investment measured under the fair-value option andgoodwill impairment losses.
6 Other comprehensive income (OCI) is only calculated for advanced approachesBHCs, and other BHCs that opt into the advanced approaches treatment ofAOCI.
7 Certain AOCI items are subject to transition into projected regulatory capital.Those transitions are 20 percent included in projected regulatory capital for2014, 40 percent included in projected regulatory capital for 2015, and60 percent included in projected regulatory capital for 2016.
March 2015 73
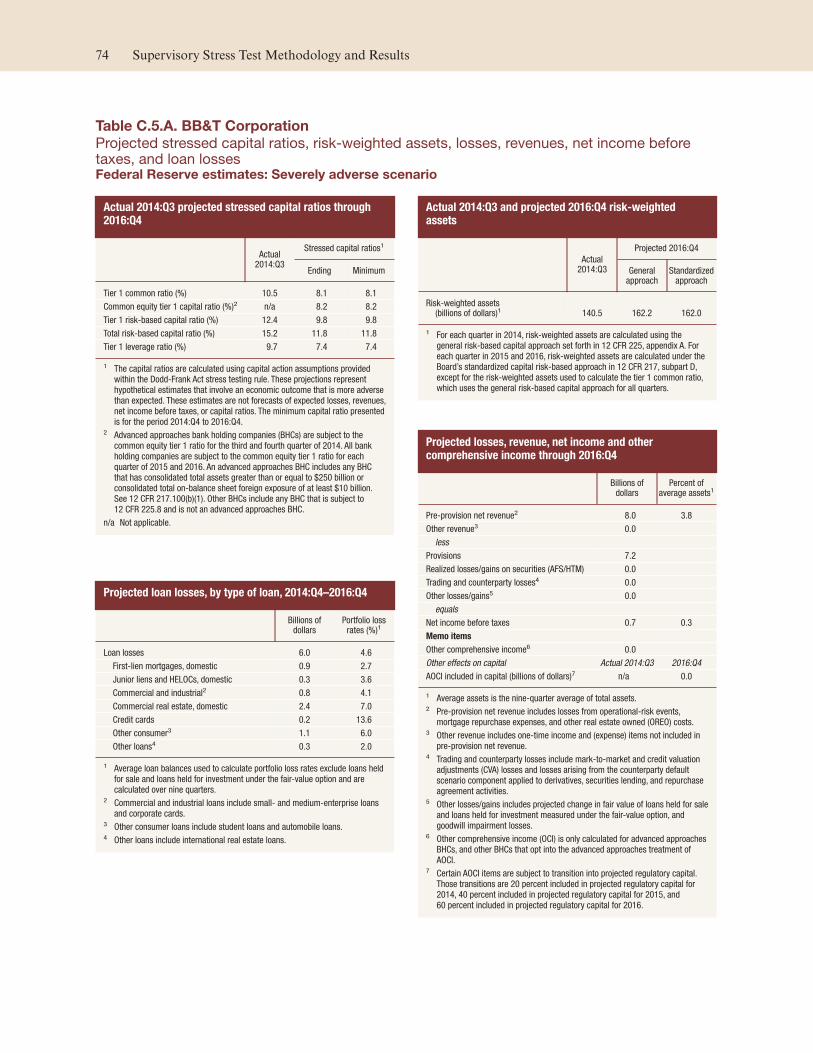
Table C.5.A. BB&T Corporation
Projected stressed capital ratios, risk-weighted assets, losses, revenues, net income beforetaxes, and loan lossesFederal Reserve estimates: Severely adverse scenario
Actual 2014:Q3 projected stressed capital ratios through2016:Q4
Actual2014:Q3
Stressed capital ratios1
Ending Minimum
Tier 1 common ratio (%) 10.5 8.1 8.1
Common equity tier 1 capital ratio (%)2 n/a 8.2 8.2
Tier 1 risk-based capital ratio (%) 12.4 9.8 9.8
Total risk-based capital ratio (%) 15.2 11.8 11.8
Tier 1 leverage ratio (%) 9.7 7.4 7.4
1 The capital ratios are calculated using capital action assumptions providedwithin the Dodd-Frank Act stress testing rule. These projections representhypothetical estimates that involve an economic outcome that is more adversethan expected. These estimates are not forecasts of expected losses, revenues,net income before taxes, or capital ratios. The minimum capital ratio presentedis for the period 2014:Q4 to 2016:Q4.
2 Advanced approaches bank holding companies (BHCs) are subject to thecommon equity tier 1 ratio for the third and fourth quarter of 2014. All bankholding companies are subject to the common equity tier 1 ratio for eachquarter of 2015 and 2016. An advanced approaches BHC includes any BHCthat has consolidated total assets greater than or equal to $250 billion orconsolidated total on-balance sheet foreign exposure of at least $10 billion.See 12 CFR 217.100(b)(1). Other BHCs include any BHC that is subject to12 CFR 225.8 and is not an advanced approaches BHC.
n/a Not applicable.
Projected loan losses, by type of loan, 2014:Q4–2016:Q4
Billions ofdollars
Portfolio lossrates (%)1
Loan losses 6.0 4.6
First-lien mortgages, domestic 0.9 2.7
Junior liens and HELOCs, domestic 0.3 3.6
Commercial and industrial2 0.8 4.1
Commercial real estate, domestic 2.4 7.0
Credit cards 0.2 13.6
Other consumer3 1.1 6.0
Other loans4 0.3 2.0
1 Average loan balances used to calculate portfolio loss rates exclude loans heldfor sale and loans held for investment under the fair-value option and arecalculated over nine quarters.
2 Commercial and industrial loans include small- and medium-enterprise loansand corporate cards.
3 Other consumer loans include student loans and automobile loans.4 Other loans include international real estate loans.
Actual 2014:Q3 and projected 2016:Q4 risk-weightedassets
Actual2014:Q3
Projected 2016:Q4
Generalapproach
Standardizedapproach
Risk-weighted assets(billions of dollars)1 140.5 162.2 162.0
1 For each quarter in 2014, risk-weighted assets are calculated using thegeneral risk-based capital approach set forth in 12 CFR 225, appendix A. Foreach quarter in 2015 and 2016, risk-weighted assets are calculated under theBoard’s standardized capital risk-based approach in 12 CFR 217, subpart D,except for the risk-weighted assets used to calculate the tier 1 common ratio,which uses the general risk-based capital approach for all quarters.
Projected losses, revenue, net income and othercomprehensive income through 2016:Q4
Billions ofdollars
Percent ofaverage assets1
Pre-provision net revenue2 8.0 3.8
Other revenue3 0.0
less
Provisions 7.2
Realized losses/gains on securities (AFS/HTM) 0.0
Trading and counterparty losses4 0.0
Other losses/gains5 0.0
equals
Net income before taxes 0.7 0.3
Memo items
Other comprehensive income6 0.0
Other effects on capital Actual 2014:Q3 2016:Q4
AOCI included in capital (billions of dollars)7 n/a 0.0
1 Average assets is the nine-quarter average of total assets.2 Pre-provision net revenue includes losses from operational-risk events,
mortgage repurchase expenses, and other real estate owned (OREO) costs.3 Other revenue includes one-time income and (expense) items not included in
pre-provision net revenue.4 Trading and counterparty losses include mark-to-market and credit valuation
adjustments (CVA) losses and losses arising from the counterparty defaultscenario component applied to derivatives, securities lending, and repurchaseagreement activities.
5 Other losses/gains includes projected change in fair value of loans held for saleand loans held for investment measured under the fair-value option, andgoodwill impairment losses.
6 Other comprehensive income (OCI) is only calculated for advanced approachesBHCs, and other BHCs that opt into the advanced approaches treatment ofAOCI.
7 Certain AOCI items are subject to transition into projected regulatory capital.Those transitions are 20 percent included in projected regulatory capital for2014, 40 percent included in projected regulatory capital for 2015, and60 percent included in projected regulatory capital for 2016.
74 Supervisory Stress Test Methodology and Results

Table C.5.B. BB&T Corporation
Projected stressed capital ratios, risk-weighted assets, losses, revenues, net income beforetaxes, and loan lossesFederal Reserve estimates: Adverse scenario
Actual 2014:Q3 projected stressed capital ratios through2016:Q4
Actual2014:Q3
Stressed capital ratios1
Ending Minimum
Tier 1 common ratio (%) 10.5 9.4 8.9
Common equity tier 1 capital ratio (%)2 n/a 9.7 9.3
Tier 1 risk-based capital ratio (%) 12.4 11.2 10.9
Total risk-based capital ratio (%) 15.2 13.3 13.1
Tier 1 leverage ratio (%) 9.7 8.5 8.3
1 The capital ratios are calculated using capital action assumptions providedwithin the Dodd-Frank Act stress testing rule. These projections representhypothetical estimates that involve an economic outcome that is more adversethan expected. These estimates are not forecasts of expected losses, revenues,net income before taxes, or capital ratios. The minimum capital ratio presentedis for the period 2014:Q4 to 2016:Q4.
2 Advanced approaches bank holding companies (BHCs) are subject to thecommon equity tier 1 ratio for the third and fourth quarter of 2014. All bankholding companies are subject to the common equity tier 1 ratio for eachquarter of 2015 and 2016. An advanced approaches BHC includes any BHCthat has consolidated total assets greater than or equal to $250 billion orconsolidated total on-balance sheet foreign exposure of at least $10 billion.See 12 CFR 217.100(b)(1). Other BHCs include any BHC that is subject to12 CFR 225.8 and is not an advanced approaches BHC.
n/a Not applicable.
Projected loan losses, by type of loan, 2014:Q4–2016:Q4
Billions ofdollars
Portfolio lossrates (%)1
Loan losses 3.9 3.0
First-lien mortgages, domestic 0.7 1.9
Junior liens and HELOCs, domestic 0.2 2.3
Commercial and industrial2 0.5 2.6
Commercial real estate, domestic 1.4 4.2
Credit cards 0.2 10.8
Other consumer3 0.8 4.2
Other loans4 0.2 1.2
1 Average loan balances used to calculate portfolio loss rates exclude loans heldfor sale and loans held for investment under the fair-value option and arecalculated over nine quarters.
2 Commercial and industrial loans include small- and medium-enterprise loansand corporate cards.
3 Other consumer loans include student loans and automobile loans.4 Other loans include international real estate loans.
Actual 2014:Q3 and projected 2016:Q4 risk-weightedassets
Actual2014:Q3
Projected 2016:Q4
Generalapproach
Standardizedapproach
Risk-weighted assets(billions of dollars)1 140.5 167.9 165.9
1 For each quarter in 2014, risk-weighted assets are calculated using thegeneral risk-based capital approach set forth in 12 CFR 225, appendix A. Foreach quarter in 2015 and 2016, risk-weighted assets are calculated under theBoard’s standardized capital risk-based approach in 12 CFR 217, subpart D,except for the risk-weighted assets used to calculate the tier 1 common ratio,which uses the general risk-based capital approach for all quarters.
Projected losses, revenue, net income and othercomprehensive income through 2016:Q4
Billions ofdollars
Percent ofaverage assets1
Pre-provision net revenue2 9.7 4.6
Other revenue3 0.0
less
Provisions 4.5
Realized losses/gains on securities (AFS/HTM) 0.0
Trading and counterparty losses4 0.0
Other losses/gains5 0.0
equals
Net income before taxes 5.2 2.5
Memo items
Other comprehensive income6 0.0
Other effects on capital Actual 2014:Q3 2016:Q4
AOCI included in capital (billions of dollars)7 n/a 0.0
1 Average assets is the nine-quarter average of total assets.2 Pre-provision net revenue includes losses from operational-risk events,
mortgage repurchase expenses, and other real estate owned (OREO) costs.3 Other revenue includes one-time income and (expense) items not included in
pre-provision net revenue.4 Trading and counterparty losses include mark-to-market and credit valuation
adjustments (CVA) losses and losses arising from the counterparty defaultscenario component applied to derivatives, securities lending, and repurchaseagreement activities.
5 Other losses/gains includes projected change in fair value of loans held for saleand loans held for investment measured under the fair-value option, andgoodwill impairment losses.
6 Other comprehensive income (OCI) is only calculated for advanced approachesBHCs, and other BHCs that opt into the advanced approaches treatment ofAOCI.
7 Certain AOCI items are subject to transition into projected regulatory capital.Those transitions are 20 percent included in projected regulatory capital for2014, 40 percent included in projected regulatory capital for 2015, and60 percent included in projected regulatory capital for 2016.
March 2015 75

Table C.6.A. BBVA Compass Bancshares, Inc.
Projected stressed capital ratios, risk-weighted assets, losses, revenues, net income beforetaxes, and loan lossesFederal Reserve estimates: Severely adverse scenario
Actual 2014:Q3 projected stressed capital ratios through2016:Q4
Actual2014:Q3
Stressed capital ratios1
Ending Minimum
Tier 1 common ratio (%) 11.0 6.3 6.3
Common equity tier 1 capital ratio (%)2 n/a 6.9 6.9
Tier 1 risk-based capital ratio (%) 11.3 6.9 6.9
Total risk-based capital ratio (%) 13.3 8.7 8.7
Tier 1 leverage ratio (%) 9.6 5.5 5.5
1 The capital ratios are calculated using capital action assumptions providedwithin the Dodd-Frank Act stress testing rule. These projections representhypothetical estimates that involve an economic outcome that is more adversethan expected. These estimates are not forecasts of expected losses, revenues,net income before taxes, or capital ratios. The minimum capital ratio presentedis for the period 2014:Q4 to 2016:Q4.
2 Advanced approaches bank holding companies (BHCs) are subject to thecommon equity tier 1 ratio for the third and fourth quarter of 2014. All bankholding companies are subject to the common equity tier 1 ratio for eachquarter of 2015 and 2016. An advanced approaches BHC includes any BHCthat has consolidated total assets greater than or equal to $250 billion orconsolidated total on-balance sheet foreign exposure of at least $10 billion.See 12 CFR 217.100(b)(1). Other BHCs include any BHC that is subject to12 CFR 225.8 and is not an advanced approaches BHC.
n/a Not applicable.
Projected loan losses, by type of loan, 2014:Q4–2016:Q4
Billions ofdollars
Portfolio lossrates (%)1
Loan losses 3.2 5.7
First-lien mortgages, domestic 0.4 2.9
Junior liens and HELOCs, domestic 0.2 6.8
Commercial and industrial2 0.8 4.6
Commercial real estate, domestic 1.5 12.5
Credit cards 0.1 14.4
Other consumer3 0.1 4.0
Other loans4 0.1 1.5
1 Average loan balances used to calculate portfolio loss rates exclude loans heldfor sale and loans held for investment under the fair-value option and arecalculated over nine quarters.
2 Commercial and industrial loans include small- and medium-enterprise loansand corporate cards.
3 Other consumer loans include student loans and automobile loans.4 Other loans include international real estate loans.
Actual 2014:Q3 and projected 2016:Q4 risk-weightedassets
Actual2014:Q3
Projected 2016:Q4
Generalapproach
Standardizedapproach
Risk-weighted assets(billions of dollars)1 62.0 63.7 61.5
1 For each quarter in 2014, risk-weighted assets are calculated using thegeneral risk-based capital approach set forth in 12 CFR 225, appendix A. Foreach quarter in 2015 and 2016, risk-weighted assets are calculated under theBoard’s standardized capital risk-based approach in 12 CFR 217, subpart D,except for the risk-weighted assets used to calculate the tier 1 common ratio,which uses the general risk-based capital approach for all quarters.
Projected losses, revenue, net income and othercomprehensive income through 2016:Q4
Billions ofdollars
Percent ofaverage assets1
Pre-provision net revenue2 1.1 1.4
Other revenue3 0.0
less
Provisions 3.8
Realized losses/gains on securities (AFS/HTM) 0.1
Trading and counterparty losses4 0.0
Other losses/gains5 0.1
equals
Net income before taxes -2.8 -3.4
Memo items
Other comprehensive income6 0.0
Other effects on capital Actual 2014:Q3 2016:Q4
AOCI included in capital (billions of dollars)7 n/a 0.0
1 Average assets is the nine-quarter average of total assets.2 Pre-provision net revenue includes losses from operational-risk events,
mortgage repurchase expenses, and other real estate owned (OREO) costs.3 Other revenue includes one-time income and (expense) items not included in
pre-provision net revenue.4 Trading and counterparty losses include mark-to-market and credit valuation
adjustments (CVA) losses and losses arising from the counterparty defaultscenario component applied to derivatives, securities lending, and repurchaseagreement activities.
5 Other losses/gains includes projected change in fair value of loans held for saleand loans held for investment measured under the fair-value option, andgoodwill impairment losses.
6 Other comprehensive income (OCI) is only calculated for advanced approachesBHCs, and other BHCs that opt into the advanced approaches treatment ofAOCI.
7 Certain AOCI items are subject to transition into projected regulatory capital.Those transitions are 20 percent included in projected regulatory capital for2014, 40 percent included in projected regulatory capital for 2015, and60 percent included in projected regulatory capital for 2016.
76 Supervisory Stress Test Methodology and Results

Table C.6.B. BBVA Compass Bancshares, Inc.
Projected stressed capital ratios, risk-weighted assets, losses, revenues, net income beforetaxes, and loan lossesFederal Reserve estimates: Adverse scenario
Actual 2014:Q3 projected stressed capital ratios through2016:Q4
Actual2014:Q3
Stressed capital ratios1
Ending Minimum
Tier 1 common ratio (%) 11.0 9.5 9.5
Common equity tier 1 capital ratio (%)2 n/a 10.0 10.0
Tier 1 risk-based capital ratio (%) 11.3 10.0 10.0
Total risk-based capital ratio (%) 13.3 11.7 11.7
Tier 1 leverage ratio (%) 9.6 7.8 7.8
1 The capital ratios are calculated using capital action assumptions providedwithin the Dodd-Frank Act stress testing rule. These projections representhypothetical estimates that involve an economic outcome that is more adversethan expected. These estimates are not forecasts of expected losses, revenues,net income before taxes, or capital ratios. The minimum capital ratio presentedis for the period 2014:Q4 to 2016:Q4.
2 Advanced approaches bank holding companies (BHCs) are subject to thecommon equity tier 1 ratio for the third and fourth quarter of 2014. All bankholding companies are subject to the common equity tier 1 ratio for eachquarter of 2015 and 2016. An advanced approaches BHC includes any BHCthat has consolidated total assets greater than or equal to $250 billion orconsolidated total on-balance sheet foreign exposure of at least $10 billion.See 12 CFR 217.100(b)(1). Other BHCs include any BHC that is subject to12 CFR 225.8 and is not an advanced approaches BHC.
n/a Not applicable.
Projected loan losses, by type of loan, 2014:Q4–2016:Q4
Billions ofdollars
Portfolio lossrates (%)1
Loan losses 2.0 3.5
First-lien mortgages, domestic 0.3 2.0
Junior liens and HELOCs, domestic 0.1 5.2
Commercial and industrial2 0.5 2.8
Commercial real estate, domestic 0.9 7.2
Credit cards 0.1 11.9
Other consumer3 0.1 3.0
Other loans4 0.1 0.9
1 Average loan balances used to calculate portfolio loss rates exclude loans heldfor sale and loans held for investment under the fair-value option and arecalculated over nine quarters.
2 Commercial and industrial loans include small- and medium-enterprise loansand corporate cards.
3 Other consumer loans include student loans and automobile loans.4 Other loans include international real estate loans.
Actual 2014:Q3 and projected 2016:Q4 risk-weightedassets
Actual2014:Q3
Projected 2016:Q4
Generalapproach
Standardizedapproach
Risk-weighted assets(billions of dollars)1 62.0 66.4 63.3
1 For each quarter in 2014, risk-weighted assets are calculated using thegeneral risk-based capital approach set forth in 12 CFR 225, appendix A. Foreach quarter in 2015 and 2016, risk-weighted assets are calculated under theBoard’s standardized capital risk-based approach in 12 CFR 217, subpart D,except for the risk-weighted assets used to calculate the tier 1 common ratio,which uses the general risk-based capital approach for all quarters.
Projected losses, revenue, net income and othercomprehensive income through 2016:Q4
Billions ofdollars
Percent ofaverage assets1
Pre-provision net revenue2 1.8 2.1
Other revenue3 0.0
less
Provisions 2.2
Realized losses/gains on securities (AFS/HTM) 0.0
Trading and counterparty losses4 0.0
Other losses/gains5 0.0
equals
Net income before taxes -0.4 -0.5
Memo items
Other comprehensive income6 0.0
Other effects on capital Actual 2014:Q3 2016:Q4
AOCI included in capital (billions of dollars)7 n/a 0.0
1 Average assets is the nine-quarter average of total assets.2 Pre-provision net revenue includes losses from operational-risk events,
mortgage repurchase expenses, and other real estate owned (OREO) costs.3 Other revenue includes one-time income and (expense) items not included in
pre-provision net revenue.4 Trading and counterparty losses include mark-to-market and credit valuation
adjustments (CVA) losses and losses arising from the counterparty defaultscenario component applied to derivatives, securities lending, and repurchaseagreement activities.
5 Other losses/gains includes projected change in fair value of loans held for saleand loans held for investment measured under the fair-value option, andgoodwill impairment losses.
6 Other comprehensive income (OCI) is only calculated for advanced approachesBHCs, and other BHCs that opt into the advanced approaches treatment ofAOCI.
7 Certain AOCI items are subject to transition into projected regulatory capital.Those transitions are 20 percent included in projected regulatory capital for2014, 40 percent included in projected regulatory capital for 2015, and60 percent included in projected regulatory capital for 2016.
March 2015 77

Table C.7.A. BMO Financial Corp.
Projected stressed capital ratios, risk-weighted assets, losses, revenues, net income beforetaxes, and loan lossesFederal Reserve estimates: Severely adverse scenario
Actual 2014:Q3 projected stressed capital ratios through2016:Q4
Actual2014:Q3
Stressed capital ratios1
Ending Minimum
Tier 1 common ratio (%) 11.5 9.0 9.0
Common equity tier 1 capital ratio (%)2 n/a 7.4 7.4
Tier 1 risk-based capital ratio (%) 11.5 7.4 7.4
Total risk-based capital ratio (%) 15.5 10.3 10.3
Tier 1 leverage ratio (%) 8.3 5.2 5.2
1 The capital ratios are calculated using capital action assumptions providedwithin the Dodd-Frank Act stress testing rule. These projections representhypothetical estimates that involve an economic outcome that is more adversethan expected. These estimates are not forecasts of expected losses, revenues,net income before taxes, or capital ratios. The minimum capital ratio presentedis for the period 2014:Q4 to 2016:Q4.
2 Advanced approaches bank holding companies (BHCs) are subject to thecommon equity tier 1 ratio for the third and fourth quarter of 2014. All bankholding companies are subject to the common equity tier 1 ratio for eachquarter of 2015 and 2016. An advanced approaches BHC includes any BHCthat has consolidated total assets greater than or equal to $250 billion orconsolidated total on-balance sheet foreign exposure of at least $10 billion.See 12 CFR 217.100(b)(1). Other BHCs include any BHC that is subject to12 CFR 225.8 and is not an advanced approaches BHC.
n/a Not applicable.
Projected loan losses, by type of loan, 2014:Q4–2016:Q4
Billions ofdollars
Portfolio lossrates (%)1
Loan losses 2.7 4.6
First-lien mortgages, domestic 0.3 3.5
Junior liens and HELOCs, domestic 0.3 5.0
Commercial and industrial2 0.8 4.8
Commercial real estate, domestic 0.7 7.9
Credit cards 0.0 10.7
Other consumer3 0.2 2.8
Other loans4 0.4 3.4
1 Average loan balances used to calculate portfolio loss rates exclude loans heldfor sale and loans held for investment under the fair-value option and arecalculated over nine quarters.
2 Commercial and industrial loans include small- and medium-enterprise loansand corporate cards.
3 Other consumer loans include student loans and automobile loans.4 Other loans include international real estate loans.
Actual 2014:Q3 and projected 2016:Q4 risk-weightedassets
Actual2014:Q3
Projected 2016:Q4
Generalapproach
Standardizedapproach
Risk-weighted assets(billions of dollars)1 78.3 81.1 81.4
1 For each quarter in 2014, risk-weighted assets are calculated using thegeneral risk-based capital approach set forth in 12 CFR 225, appendix A. Foreach quarter in 2015 and 2016, risk-weighted assets are calculated under theBoard’s standardized capital risk-based approach in 12 CFR 217, subpart D,except for the risk-weighted assets used to calculate the tier 1 common ratio,which uses the general risk-based capital approach for all quarters.
Projected losses, revenue, net income and othercomprehensive income through 2016:Q4
Billions ofdollars
Percent ofaverage assets1
Pre-provision net revenue2 1.1 0.9
Other revenue3 0.0
less
Provisions 2.8
Realized losses/gains on securities (AFS/HTM) 0.0
Trading and counterparty losses4 0.0
Other losses/gains5 0.0
equals
Net income before taxes -1.7 -1.4
Memo items
Other comprehensive income6 0.0
Other effects on capital Actual 2014:Q3 2016:Q4
AOCI included in capital (billions of dollars)7 n/a 0.0
1 Average assets is the nine-quarter average of total assets.2 Pre-provision net revenue includes losses from operational-risk events,
mortgage repurchase expenses, and other real estate owned (OREO) costs.3 Other revenue includes one-time income and (expense) items not included in
pre-provision net revenue.4 Trading and counterparty losses include mark-to-market and credit valuation
adjustments (CVA) losses and losses arising from the counterparty defaultscenario component applied to derivatives, securities lending, and repurchaseagreement activities.
5 Other losses/gains includes projected change in fair value of loans held for saleand loans held for investment measured under the fair-value option, andgoodwill impairment losses.
6 Other comprehensive income (OCI) is only calculated for advanced approachesBHCs, and other BHCs that opt into the advanced approaches treatment ofAOCI.
7 Certain AOCI items are subject to transition into projected regulatory capital.Those transitions are 20 percent included in projected regulatory capital for2014, 40 percent included in projected regulatory capital for 2015, and60 percent included in projected regulatory capital for 2016.
78 Supervisory Stress Test Methodology and Results

Table C.7.B. BMO Financial Corp.
Projected stressed capital ratios, risk-weighted assets, losses, revenues, net income beforetaxes, and loan lossesFederal Reserve estimates: Adverse scenario
Actual 2014:Q3 projected stressed capital ratios through2016:Q4
Actual2014:Q3
Stressed capital ratios1
Ending Minimum
Tier 1 common ratio (%) 11.5 12.4 11.5
Common equity tier 1 capital ratio (%)2 n/a 11.5 10.5
Tier 1 risk-based capital ratio (%) 11.5 11.5 10.5
Total risk-based capital ratio (%) 15.5 13.9 13.9
Tier 1 leverage ratio (%) 8.3 7.9 7.4
1 The capital ratios are calculated using capital action assumptions providedwithin the Dodd-Frank Act stress testing rule. These projections representhypothetical estimates that involve an economic outcome that is more adversethan expected. These estimates are not forecasts of expected losses, revenues,net income before taxes, or capital ratios. The minimum capital ratio presentedis for the period 2014:Q4 to 2016:Q4.
2 Advanced approaches bank holding companies (BHCs) are subject to thecommon equity tier 1 ratio for the third and fourth quarter of 2014. All bankholding companies are subject to the common equity tier 1 ratio for eachquarter of 2015 and 2016. An advanced approaches BHC includes any BHCthat has consolidated total assets greater than or equal to $250 billion orconsolidated total on-balance sheet foreign exposure of at least $10 billion.See 12 CFR 217.100(b)(1). Other BHCs include any BHC that is subject to12 CFR 225.8 and is not an advanced approaches BHC.
n/a Not applicable.
Projected loan losses, by type of loan, 2014:Q4–2016:Q4
Billions ofdollars
Portfolio lossrates (%)1
Loan losses 1.7 2.9
First-lien mortgages, domestic 0.2 2.7
Junior liens and HELOCs, domestic 0.2 3.0
Commercial and industrial2 0.5 2.8
Commercial real estate, domestic 0.4 4.9
Credit cards 0.0 8.5
Other consumer3 0.2 2.2
Other loans4 0.2 1.9
1 Average loan balances used to calculate portfolio loss rates exclude loans heldfor sale and loans held for investment under the fair-value option and arecalculated over nine quarters.
2 Commercial and industrial loans include small- and medium-enterprise loansand corporate cards.
3 Other consumer loans include student loans and automobile loans.4 Other loans include international real estate loans.
Actual 2014:Q3 and projected 2016:Q4 risk-weightedassets
Actual2014:Q3
Projected 2016:Q4
Generalapproach
Standardizedapproach
Risk-weighted assets(billions of dollars)1 78.3 83.9 85.2
1 For each quarter in 2014, risk-weighted assets are calculated using thegeneral risk-based capital approach set forth in 12 CFR 225, appendix A. Foreach quarter in 2015 and 2016, risk-weighted assets are calculated under theBoard’s standardized capital risk-based approach in 12 CFR 217, subpart D,except for the risk-weighted assets used to calculate the tier 1 common ratio,which uses the general risk-based capital approach for all quarters.
Projected losses, revenue, net income and othercomprehensive income through 2016:Q4
Billions ofdollars
Percent ofaverage assets1
Pre-provision net revenue2 2.4 1.9
Other revenue3 0.0
less
Provisions 1.5
Realized losses/gains on securities (AFS/HTM) 0.0
Trading and counterparty losses4 0.0
Other losses/gains5 0.0
equals
Net income before taxes 0.9 0.7
Memo items
Other comprehensive income6 0.0
Other effects on capital Actual 2014:Q3 2016:Q4
AOCI included in capital (billions of dollars)7 n/a 0.0
1 Average assets is the nine-quarter average of total assets.2 Pre-provision net revenue includes losses from operational-risk events,
mortgage repurchase expenses, and other real estate owned (OREO) costs.3 Other revenue includes one-time income and (expense) items not included in
pre-provision net revenue.4 Trading and counterparty losses include mark-to-market and credit valuation
adjustments (CVA) losses and losses arising from the counterparty defaultscenario component applied to derivatives, securities lending, and repurchaseagreement activities.
5 Other losses/gains includes projected change in fair value of loans held for saleand loans held for investment measured under the fair-value option, andgoodwill impairment losses.
6 Other comprehensive income (OCI) is only calculated for advanced approachesBHCs, and other BHCs that opt into the advanced approaches treatment ofAOCI.
7 Certain AOCI items are subject to transition into projected regulatory capital.Those transitions are 20 percent included in projected regulatory capital for2014, 40 percent included in projected regulatory capital for 2015, and60 percent included in projected regulatory capital for 2016.
March 2015 79

Table C.8.A. Capital One Financial Corporation
Projected stressed capital ratios, risk-weighted assets, losses, revenues, net income beforetaxes, and loan lossesFederal Reserve estimates: Severely adverse scenario
Actual 2014:Q3 projected stressed capital ratios through2016:Q4
Actual2014:Q3
Stressed capital ratios1
Ending Minimum
Tier 1 common ratio (%) 12.7 9.5 9.5
Common equity tier 1 capital ratio (%)2 12.7 9.4 9.4
Tier 1 risk-based capital ratio (%) 13.3 10.1 10.1
Total risk-based capital ratio (%) 15.2 11.8 11.8
Tier 1 leverage ratio (%) 10.6 7.9 7.9
1 The capital ratios are calculated using capital action assumptions providedwithin the Dodd-Frank Act stress testing rule. These projections representhypothetical estimates that involve an economic outcome that is more adversethan expected. These estimates are not forecasts of expected losses, revenues,net income before taxes, or capital ratios. The minimum capital ratio presentedis for the period 2014:Q4 to 2016:Q4.
2 Advanced approaches bank holding companies (BHCs) are subject to thecommon equity tier 1 ratio for the third and fourth quarter of 2014. All bankholding companies are subject to the common equity tier 1 ratio for eachquarter of 2015 and 2016. An advanced approaches BHC includes any BHCthat has consolidated total assets greater than or equal to $250 billion orconsolidated total on-balance sheet foreign exposure of at least $10 billion.See 12 CFR 217.100(b)(1). Other BHCs include any BHC that is subject to12 CFR 225.8 and is not an advanced approaches BHC.
Projected loan losses, by type of loan, 2014:Q4–2016:Q4
Billions ofdollars
Portfolio lossrates (%)1
Loan losses 22.2 10.8
First-lien mortgages, domestic 0.8 2.5
Junior liens and HELOCs, domestic 0.2 7.5
Commercial and industrial2 1.7 7.6
Commercial real estate, domestic 1.5 6.4
Credit cards 14.2 18.5
Other consumer3 3.3 8.8
Other loans4 0.5 3.8
1 Average loan balances used to calculate portfolio loss rates exclude loans heldfor sale and loans held for investment under the fair-value option and arecalculated over nine quarters.
2 Commercial and industrial loans include small- and medium-enterprise loansand corporate cards.
3 Other consumer loans include student loans and automobile loans.4 Other loans include international real estate loans.
Actual 2014:Q3 and projected 2016:Q4 risk-weightedassets
Actual2014:Q3
Projected 2016:Q4
Generalapproach
Standardizedapproach
Risk-weighted assets(billions of dollars)1 228.8 234.6 241.9
1 For each quarter in 2014, risk-weighted assets are calculated using thegeneral risk-based capital approach set forth in 12 CFR 225, appendix A. Foreach quarter in 2015 and 2016, risk-weighted assets are calculated under theBoard’s standardized capital risk-based approach in 12 CFR 217, subpart D,except for the risk-weighted assets used to calculate the tier 1 common ratio,which uses the general risk-based capital approach for all quarters.
Projected losses, revenue, net income and othercomprehensive income through 2016:Q4
Billions ofdollars
Percent ofaverage assets1
Pre-provision net revenue2 21.7 7.0
Other revenue3 0.0
less
Provisions 25.9
Realized losses/gains on securities (AFS/HTM) 0.1
Trading and counterparty losses4 0.0
Other losses/gains5 0.1
equals
Net income before taxes -4.4 -1.4
Memo items
Other comprehensive income6 -0.1
Other effects on capital Actual 2014:Q3 2016:Q4
AOCI included in capital (billions of dollars)7 -0.1 -0.3
1 Average assets is the nine-quarter average of total assets.2 Pre-provision net revenue includes losses from operational-risk events,
mortgage repurchase expenses, and other real estate owned (OREO) costs.3 Other revenue includes one-time income and (expense) items not included in
pre-provision net revenue.4 Trading and counterparty losses include mark-to-market and credit valuation
adjustments (CVA) losses and losses arising from the counterparty defaultscenario component applied to derivatives, securities lending, and repurchaseagreement activities.
5 Other losses/gains includes projected change in fair value of loans held for saleand loans held for investment measured under the fair-value option andgoodwill impairment losses.
6 Other comprehensive income (OCI) is only calculated for advanced approachesBHCs, and other BHCs that opt into the advanced approaches treatment ofAOCI.
7 Certain AOCI items are subject to transition into projected regulatory capital.Those transitions are 20 percent included in projected regulatory capital for2014, 40 percent included in projected regulatory capital for 2015, and60 percent included in projected regulatory capital for 2016.
80 Supervisory Stress Test Methodology and Results

Table C.8.B. Capital One Financial Corporation
Projected stressed capital ratios, risk-weighted assets, losses, revenues, net income beforetaxes, and loan lossesFederal Reserve estimates: Adverse scenario
Actual 2014:Q3 projected stressed capital ratios through2016:Q4
Actual2014:Q3
Stressed capital ratios1
Ending Minimum
Tier 1 common ratio (%) 12.7 11.5 11.5
Common equity tier 1 capital ratio (%)2 12.7 10.4 10.4
Tier 1 risk-based capital ratio (%) 13.3 11.1 11.1
Total risk-based capital ratio (%) 15.2 12.8 12.8
Tier 1 leverage ratio (%) 10.6 8.5 8.5
1 The capital ratios are calculated using capital action assumptions providedwithin the Dodd-Frank Act stress testing rule. These projections representhypothetical estimates that involve an economic outcome that is more adversethan expected. These estimates are not forecasts of expected losses, revenues,net income before taxes, or capital ratios. The minimum capital ratio presentedis for the period 2014:Q4 to 2016:Q4.
2 Advanced approaches bank holding companies (BHCs) are subject to thecommon equity tier 1 ratio for the third and fourth quarter of 2014. All bankholding companies are subject to the common equity tier 1 ratio for eachquarter of 2015 and 2016. An advanced approaches BHC includes any BHCthat has consolidated total assets greater than or equal to $250 billion orconsolidated total on-balance sheet foreign exposure of at least $10 billion.See 12 CFR 217.100(b)(1). Other BHCs include any BHC that is subject to12 CFR 225.8 and is not an advanced approaches BHC.
Projected loan losses, by type of loan, 2014:Q4–2016:Q4
Billions ofdollars
Portfolio lossrates (%)1
Loan losses 17.2 8.3
First-lien mortgages, domestic 0.5 1.5
Junior liens and HELOCs, domestic 0.1 5.6
Commercial and industrial2 1.1 5.0
Commercial real estate, domestic 0.9 3.9
Credit cards 11.8 15.1
Other consumer3 2.5 6.5
Other loans4 0.3 2.0
1 Average loan balances used to calculate portfolio loss rates exclude loans heldfor sale and loans held for investment under the fair-value option and arecalculated over nine quarters.
2 Commercial and industrial loans include small- and medium-enterprise loansand corporate cards.
3 Other consumer loans include student loans and automobile loans.4 Other loans include international real estate loans.
Actual 2014:Q3 and projected 2016:Q4 risk-weightedassets
Actual2014:Q3
Projected 2016:Q4
Generalapproach
Standardizedapproach
Risk-weighted assets(billions of dollars)1 228.8 245.0 249.5
1 For each quarter in 2014, risk-weighted assets are calculated using thegeneral risk-based capital approach set forth in 12 CFR 225, appendix A. Foreach quarter in 2015 and 2016, risk-weighted assets are calculated under theBoard’s standardized capital risk-based approach in 12 CFR 217, subpart D,except for the risk-weighted assets used to calculate the tier 1 common ratio,which uses the general risk-based capital approach for all quarters.
Projected losses, revenue, net income and othercomprehensive income through 2016:Q4
Billions ofdollars
Percent ofaverage assets1
Pre-provision net revenue2 23.1 7.3
Other revenue3 0.0
less
Provisions 20.1
Realized losses/gains on securities (AFS/HTM) 0.0
Trading and counterparty losses4 0.0
Other losses/gains5 0.1
equals
Net income before taxes 2.9 0.9
Memo items
Other comprehensive income6 -2.5
Other effects on capital Actual 2014:Q3 2016:Q4
AOCI included in capital (billions of dollars)7 -0.1 -1.8
1 Average assets is the nine-quarter average of total assets.2 Pre-provision net revenue includes losses from operational-risk events,
mortgage repurchase expenses, and other real estate owned (OREO) costs.3 Other revenue includes one-time income and (expense) items not included in
pre-provision net revenue.4 Trading and counterparty losses include mark-to-market and credit valuation
adjustments (CVA) losses and losses arising from the counterparty defaultscenario component applied to derivatives, securities lending, and repurchaseagreement activities.
5 Other losses/gains includes projected change in fair value of loans held for saleand loans held for investment measured under the fair-value option andgoodwill impairment losses.
6 Other comprehensive income (OCI) is only calculated for advanced approachesBHCs, and other BHCs that opt into the advanced approaches treatment ofAOCI.
7 Certain AOCI items are subject to transition into projected regulatory capital.Those transitions are 20 percent included in projected regulatory capital for2014, 40 percent included in projected regulatory capital for 2015, and60 percent included in projected regulatory capital for 2016.
March 2015 81
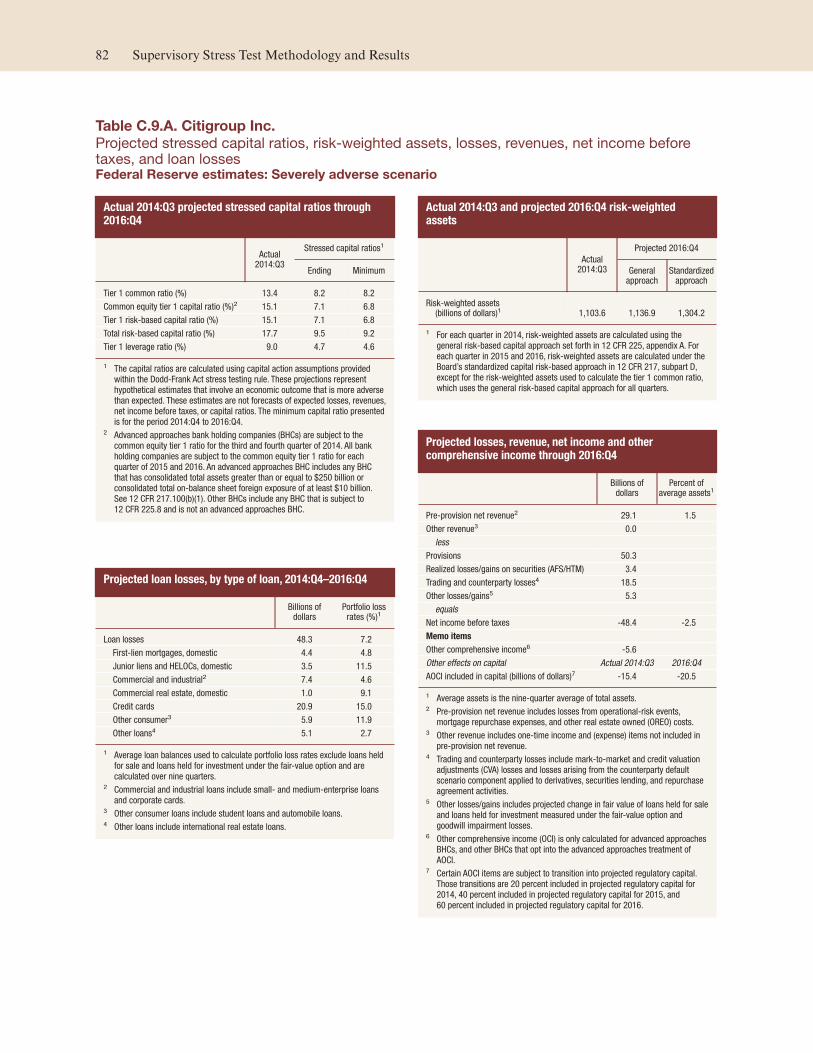
Table C.9.A. Citigroup Inc.
Projected stressed capital ratios, risk-weighted assets, losses, revenues, net income beforetaxes, and loan lossesFederal Reserve estimates: Severely adverse scenario
Actual 2014:Q3 projected stressed capital ratios through2016:Q4
Actual2014:Q3
Stressed capital ratios1
Ending Minimum
Tier 1 common ratio (%) 13.4 8.2 8.2
Common equity tier 1 capital ratio (%)2 15.1 7.1 6.8
Tier 1 risk-based capital ratio (%) 15.1 7.1 6.8
Total risk-based capital ratio (%) 17.7 9.5 9.2
Tier 1 leverage ratio (%) 9.0 4.7 4.6
1 The capital ratios are calculated using capital action assumptions providedwithin the Dodd-Frank Act stress testing rule. These projections representhypothetical estimates that involve an economic outcome that is more adversethan expected. These estimates are not forecasts of expected losses, revenues,net income before taxes, or capital ratios. The minimum capital ratio presentedis for the period 2014:Q4 to 2016:Q4.
2 Advanced approaches bank holding companies (BHCs) are subject to thecommon equity tier 1 ratio for the third and fourth quarter of 2014. All bankholding companies are subject to the common equity tier 1 ratio for eachquarter of 2015 and 2016. An advanced approaches BHC includes any BHCthat has consolidated total assets greater than or equal to $250 billion orconsolidated total on-balance sheet foreign exposure of at least $10 billion.See 12 CFR 217.100(b)(1). Other BHCs include any BHC that is subject to12 CFR 225.8 and is not an advanced approaches BHC.
Projected loan losses, by type of loan, 2014:Q4–2016:Q4
Billions ofdollars
Portfolio lossrates (%)1
Loan losses 48.3 7.2
First-lien mortgages, domestic 4.4 4.8
Junior liens and HELOCs, domestic 3.5 11.5
Commercial and industrial2 7.4 4.6
Commercial real estate, domestic 1.0 9.1
Credit cards 20.9 15.0
Other consumer3 5.9 11.9
Other loans4 5.1 2.7
1 Average loan balances used to calculate portfolio loss rates exclude loans heldfor sale and loans held for investment under the fair-value option and arecalculated over nine quarters.
2 Commercial and industrial loans include small- and medium-enterprise loansand corporate cards.
3 Other consumer loans include student loans and automobile loans.4 Other loans include international real estate loans.
Actual 2014:Q3 and projected 2016:Q4 risk-weightedassets
Actual2014:Q3
Projected 2016:Q4
Generalapproach
Standardizedapproach
Risk-weighted assets(billions of dollars)1 1,103.6 1,136.9 1,304.2
1 For each quarter in 2014, risk-weighted assets are calculated using thegeneral risk-based capital approach set forth in 12 CFR 225, appendix A. Foreach quarter in 2015 and 2016, risk-weighted assets are calculated under theBoard’s standardized capital risk-based approach in 12 CFR 217, subpart D,except for the risk-weighted assets used to calculate the tier 1 common ratio,which uses the general risk-based capital approach for all quarters.
Projected losses, revenue, net income and othercomprehensive income through 2016:Q4
Billions ofdollars
Percent ofaverage assets1
Pre-provision net revenue2 29.1 1.5
Other revenue3 0.0
less
Provisions 50.3
Realized losses/gains on securities (AFS/HTM) 3.4
Trading and counterparty losses4 18.5
Other losses/gains5 5.3
equals
Net income before taxes -48.4 -2.5
Memo items
Other comprehensive income6 -5.6
Other effects on capital Actual 2014:Q3 2016:Q4
AOCI included in capital (billions of dollars)7 -15.4 -20.5
1 Average assets is the nine-quarter average of total assets.2 Pre-provision net revenue includes losses from operational-risk events,
mortgage repurchase expenses, and other real estate owned (OREO) costs.3 Other revenue includes one-time income and (expense) items not included in
pre-provision net revenue.4 Trading and counterparty losses include mark-to-market and credit valuation
adjustments (CVA) losses and losses arising from the counterparty defaultscenario component applied to derivatives, securities lending, and repurchaseagreement activities.
5 Other losses/gains includes projected change in fair value of loans held for saleand loans held for investment measured under the fair-value option andgoodwill impairment losses.
6 Other comprehensive income (OCI) is only calculated for advanced approachesBHCs, and other BHCs that opt into the advanced approaches treatment ofAOCI.
7 Certain AOCI items are subject to transition into projected regulatory capital.Those transitions are 20 percent included in projected regulatory capital for2014, 40 percent included in projected regulatory capital for 2015, and60 percent included in projected regulatory capital for 2016.
82 Supervisory Stress Test Methodology and Results

Table C.9.B. Citigroup Inc.
Projected stressed capital ratios, risk-weighted assets, losses, revenues, net income beforetaxes, and loan lossesFederal Reserve estimates: Adverse scenario
Actual 2014:Q3 projected stressed capital ratios through2016:Q4
Actual2014:Q3
Stressed capital ratios1
Ending Minimum
Tier 1 common ratio (%) 13.4 12.5 11.5
Common equity tier 1 capital ratio (%)2 15.1 9.4 9.3
Tier 1 risk-based capital ratio (%) 15.1 9.6 9.4
Total risk-based capital ratio (%) 17.7 11.8 11.7
Tier 1 leverage ratio (%) 9.0 6.2 6.1
1 The capital ratios are calculated using capital action assumptions providedwithin the Dodd-Frank Act stress testing rule. These projections representhypothetical estimates that involve an economic outcome that is more adversethan expected. These estimates are not forecasts of expected losses, revenues,net income before taxes, or capital ratios. The minimum capital ratio presentedis for the period 2014:Q4 to 2016:Q4.
2 Advanced approaches bank holding companies (BHCs) are subject to thecommon equity tier 1 ratio for the third and fourth quarter of 2014. All bankholding companies are subject to the common equity tier 1 ratio for eachquarter of 2015 and 2016. An advanced approaches BHC includes any BHCthat has consolidated total assets greater than or equal to $250 billion orconsolidated total on-balance sheet foreign exposure of at least $10 billion.See 12 CFR 217.100(b)(1). Other BHCs include any BHC that is subject to12 CFR 225.8 and is not an advanced approaches BHC.
Projected loan losses, by type of loan, 2014:Q4–2016:Q4
Billions ofdollars
Portfolio lossrates (%)1
Loan losses 36.0 5.3
First-lien mortgages, domestic 3.0 3.3
Junior liens and HELOCs, domestic 2.3 7.3
Commercial and industrial2 4.8 3.0
Commercial real estate, domestic 0.5 5.1
Credit cards 17.0 12.1
Other consumer3 5.2 10.3
Other loans4 3.1 1.6
1 Average loan balances used to calculate portfolio loss rates exclude loans heldfor sale and loans held for investment under the fair-value option and arecalculated over nine quarters.
2 Commercial and industrial loans include small- and medium-enterprise loansand corporate cards.
3 Other consumer loans include student loans and automobile loans.4 Other loans include international real estate loans.
Actual 2014:Q3 and projected 2016:Q4 risk-weightedassets
Actual2014:Q3
Projected 2016:Q4
Generalapproach
Standardizedapproach
Risk-weighted assets(billions of dollars)1 1,103.6 1,175.6 1,351.3
1 For each quarter in 2014, risk-weighted assets are calculated using thegeneral risk-based capital approach set forth in 12 CFR 225, appendix A. Foreach quarter in 2015 and 2016, risk-weighted assets are calculated under theBoard’s standardized capital risk-based approach in 12 CFR 217, subpart D,except for the risk-weighted assets used to calculate the tier 1 common ratio,which uses the general risk-based capital approach for all quarters.
Projected losses, revenue, net income and othercomprehensive income through 2016:Q4
Billions ofdollars
Percent ofaverage assets1
Pre-provision net revenue2 50.9 2.5
Other revenue3 0.0
less
Provisions 34.8
Realized losses/gains on securities (AFS/HTM) 2.0
Trading and counterparty losses4 10.1
Other losses/gains5 3.5
equals
Net income before taxes 0.5 0.0
Memo items
Other comprehensive income6 -20.2
Other effects on capital Actual 2014:Q3 2016:Q4
AOCI included in capital (billions of dollars)7 -15.4 -29.3
1 Average assets is the nine-quarter average of total assets.2 Pre-provision net revenue includes losses from operational-risk events,
mortgage repurchase expenses, and other real estate owned (OREO) costs.3 Other revenue includes one-time income and (expense) items not included in
pre-provision net revenue.4 Trading and counterparty losses include mark-to-market and credit valuation
adjustments (CVA) losses and losses arising from the counterparty defaultscenario component applied to derivatives, securities lending, and repurchaseagreement activities.
5 Other losses/gains includes projected change in fair value of loans held for saleand loans held for investment measured under the fair-value option andgoodwill impairment losses.
6 Other comprehensive income (OCI) is only calculated for advanced approachesBHCs, and other BHCs that opt into the advanced approaches treatment ofAOCI.
7 Certain AOCI items are subject to transition into projected regulatory capital.Those transitions are 20 percent included in projected regulatory capital for2014, 40 percent included in projected regulatory capital for 2015, and60 percent included in projected regulatory capital for 2016.
March 2015 83

Table C.10.A. Citizens Financial Group, Inc.
Projected stressed capital ratios, risk-weighted assets, losses, revenues, net income beforetaxes, and loan lossesFederal Reserve estimates: Severely adverse scenario
Actual 2014:Q3 projected stressed capital ratios through2016:Q4
Actual2014:Q3
Stressed capital ratios1
Ending Minimum
Tier 1 common ratio (%) 12.9 10.7 10.7
Common equity tier 1 capital ratio (%)2 n/a 10.9 10.9
Tier 1 risk-based capital ratio (%) 12.9 10.9 10.9
Total risk-based capital ratio (%) 16.1 14.3 14.3
Tier 1 leverage ratio (%) 10.9 8.8 8.8
1 The capital ratios are calculated using capital action assumptions providedwithin the Dodd-Frank Act stress testing rule. These projections representhypothetical estimates that involve an economic outcome that is more adversethan expected. These estimates are not forecasts of expected losses, revenues,net income before taxes, or capital ratios. The minimum capital ratio presentedis for the period 2014:Q4 to 2016:Q4.
2 Advanced approaches bank holding companies (BHCs) are subject to thecommon equity tier 1 ratio for the third and fourth quarter of 2014. All bankholding companies are subject to the common equity tier 1 ratio for eachquarter of 2015 and 2016. An advanced approaches BHC includes any BHCthat has consolidated total assets greater than or equal to $250 billion orconsolidated total on-balance sheet foreign exposure of at least $10 billion.See 12 CFR 217.100(b)(1). Other BHCs include any BHC that is subject to12 CFR 225.8 and is not an advanced approaches BHC.
n/a Not applicable.
Projected loan losses, by type of loan, 2014:Q4–2016:Q4
Billions ofdollars
Portfolio lossrates (%)1
Loan losses 4.8 5.1
First-lien mortgages, domestic 0.4 2.8
Junior liens and HELOCs, domestic 1.4 7.2
Commercial and industrial2 1.0 3.9
Commercial real estate, domestic 1.2 11.3
Credit cards 0.2 12.5
Other consumer3 0.5 3.4
Other loans4 0.1 1.9
1 Average loan balances used to calculate portfolio loss rates exclude loans heldfor sale and loans held for investment under the fair-value option and arecalculated over nine quarters.
2 Commercial and industrial loans include small- and medium-enterprise loansand corporate cards.
3 Other consumer loans include student loans and automobile loans.4 Other loans include international real estate loans.
Actual 2014:Q3 and projected 2016:Q4 risk-weightedassets
Actual2014:Q3
Projected 2016:Q4
Generalapproach
Standardizedapproach
Risk-weighted assets(billions of dollars)1 103.2 107.1 105.8
1 For each quarter in 2014, risk-weighted assets are calculated using thegeneral risk-based capital approach set forth in 12 CFR 225, appendix A. Foreach quarter in 2015 and 2016, risk-weighted assets are calculated under theBoard’s standardized capital risk-based approach in 12 CFR 217, subpart D,except for the risk-weighted assets used to calculate the tier 1 common ratio,which uses the general risk-based capital approach for all quarters.
Projected losses, revenue, net income and othercomprehensive income through 2016:Q4
Billions ofdollars
Percent ofaverage assets1
Pre-provision net revenue2 3.9 2.8
Other revenue3 0.0
less
Provisions 5.4
Realized losses/gains on securities (AFS/HTM) 0.2
Trading and counterparty losses4 0.0
Other losses/gains5 0.1
equals
Net income before taxes -1.8 -1.3
Memo items
Other comprehensive income6 0.0
Other effects on capital Actual 2014:Q3 2016:Q4
AOCI included in capital (billions of dollars)7 n/a 0.0
1 Average assets is the nine-quarter average of total assets.2 Pre-provision net revenue includes losses from operational-risk events,
mortgage repurchase expenses, and other real estate owned (OREO) costs.3 Other revenue includes one-time income and (expense) items not included in
pre-provision net revenue.4 Trading and counterparty losses include mark-to-market and credit valuation
adjustments (CVA) losses and losses arising from the counterparty defaultscenario component applied to derivatives, securities lending, and repurchaseagreement activities.
5 Other losses/gains includes projected change in fair value of loans held for saleand loans held for investment measured under the fair-value option, andgoodwill impairment losses.
6 Other comprehensive income (OCI) is only calculated for advanced approachesBHCs, and other BHCs that opt into the advanced approaches treatment ofAOCI.
7 Certain AOCI items are subject to transition into projected regulatory capital.Those transitions are 20 percent included in projected regulatory capital for2014, 40 percent included in projected regulatory capital for 2015, and60 percent included in projected regulatory capital for 2016.
84 Supervisory Stress Test Methodology and Results

Table C.10.B. Citizens Financial Group, Inc.
Projected stressed capital ratios, risk-weighted assets, losses, revenues, net income beforetaxes, and loan lossesFederal Reserve estimates: Adverse scenario
Actual 2014:Q3 projected stressed capital ratios through2016:Q4
Actual2014:Q3
Stressed capital ratios1
Ending Minimum
Tier 1 common ratio (%) 12.9 12.3 12.1
Common equity tier 1 capital ratio (%)2 n/a 12.5 12.3
Tier 1 risk-based capital ratio (%) 12.9 12.5 12.3
Total risk-based capital ratio (%) 16.1 15.9 15.8
Tier 1 leverage ratio (%) 10.9 10.0 9.9
1 The capital ratios are calculated using capital action assumptions providedwithin the Dodd-Frank Act stress testing rule. These projections representhypothetical estimates that involve an economic outcome that is more adversethan expected. These estimates are not forecasts of expected losses, revenues,net income before taxes, or capital ratios. The minimum capital ratio presentedis for the period 2014:Q4 to 2016:Q4.
2 Advanced approaches bank holding companies (BHCs) are subject to thecommon equity tier 1 ratio for the third and fourth quarter of 2014. All bankholding companies are subject to the common equity tier 1 ratio for eachquarter of 2015 and 2016. An advanced approaches BHC includes any BHCthat has consolidated total assets greater than or equal to $250 billion orconsolidated total on-balance sheet foreign exposure of at least $10 billion.See 12 CFR 217.100(b)(1). Other BHCs include any BHC that is subject to12 CFR 225.8 and is not an advanced approaches BHC.
n/a Not applicable.
Projected loan losses, by type of loan, 2014:Q4–2016:Q4
Billions ofdollars
Portfolio lossrates (%)1
Loan losses 3.3 3.5
First-lien mortgages, domestic 0.3 1.9
Junior liens and HELOCs, domestic 1.1 5.5
Commercial and industrial2 0.6 2.3
Commercial real estate, domestic 0.7 6.6
Credit cards 0.2 10.3
Other consumer3 0.4 2.7
Other loans4 0.1 1.0
1 Average loan balances used to calculate portfolio loss rates exclude loans heldfor sale and loans held for investment under the fair-value option and arecalculated over nine quarters.
2 Commercial and industrial loans include small- and medium-enterprise loansand corporate cards.
3 Other consumer loans include student loans and automobile loans.4 Other loans include international real estate loans.
Actual 2014:Q3 and projected 2016:Q4 risk-weightedassets
Actual2014:Q3
Projected 2016:Q4
Generalapproach
Standardizedapproach
Risk-weighted assets(billions of dollars)1 103.2 110.8 109.1
1 For each quarter in 2014, risk-weighted assets are calculated using thegeneral risk-based capital approach set forth in 12 CFR 225, appendix A. Foreach quarter in 2015 and 2016, risk-weighted assets are calculated under theBoard’s standardized capital risk-based approach in 12 CFR 217, subpart D,except for the risk-weighted assets used to calculate the tier 1 common ratio,which uses the general risk-based capital approach for all quarters.
Projected losses, revenue, net income and othercomprehensive income through 2016:Q4
Billions ofdollars
Percent ofaverage assets1
Pre-provision net revenue2 4.8 3.5
Other revenue3 0.0
less
Provisions 3.4
Realized losses/gains on securities (AFS/HTM) 0.0
Trading and counterparty losses4 0.0
Other losses/gains5 0.0
equals
Net income before taxes 1.4 1.0
Memo items
Other comprehensive income6 0.0
Other effects on capital Actual 2014:Q3 2016:Q4
AOCI included in capital (billions of dollars)7 n/a 0.0
1 Average assets is the nine-quarter average of total assets.2 Pre-provision net revenue includes losses from operational-risk events,
mortgage repurchase expenses, and other real estate owned (OREO) costs.3 Other revenue includes one-time income and (expense) items not included in
pre-provision net revenue.4 Trading and counterparty losses include mark-to-market and credit valuation
adjustments (CVA) losses and losses arising from the counterparty defaultscenario component applied to derivatives, securities lending, and repurchaseagreement activities.
5 Other losses/gains includes projected change in fair value of loans held for saleand loans held for investment measured under the fair-value option, andgoodwill impairment losses.
6 Other comprehensive income (OCI) is only calculated for advanced approachesBHCs, and other BHCs that opt into the advanced approaches treatment ofAOCI.
7 Certain AOCI items are subject to transition into projected regulatory capital.Those transitions are 20 percent included in projected regulatory capital for2014, 40 percent included in projected regulatory capital for 2015, and60 percent included in projected regulatory capital for 2016.
March 2015 85
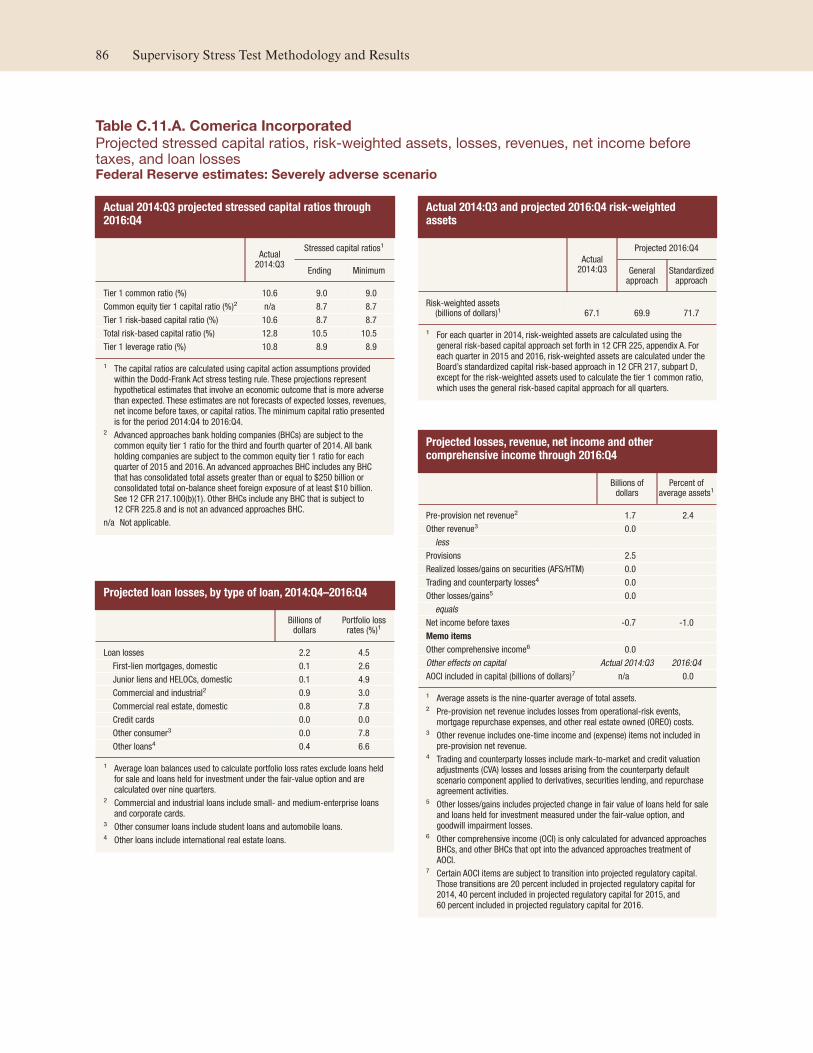
Table C.11.A. Comerica Incorporated
Projected stressed capital ratios, risk-weighted assets, losses, revenues, net income beforetaxes, and loan lossesFederal Reserve estimates: Severely adverse scenario
Actual 2014:Q3 projected stressed capital ratios through2016:Q4
Actual2014:Q3
Stressed capital ratios1
Ending Minimum
Tier 1 common ratio (%) 10.6 9.0 9.0
Common equity tier 1 capital ratio (%)2 n/a 8.7 8.7
Tier 1 risk-based capital ratio (%) 10.6 8.7 8.7
Total risk-based capital ratio (%) 12.8 10.5 10.5
Tier 1 leverage ratio (%) 10.8 8.9 8.9
1 The capital ratios are calculated using capital action assumptions providedwithin the Dodd-Frank Act stress testing rule. These projections representhypothetical estimates that involve an economic outcome that is more adversethan expected. These estimates are not forecasts of expected losses, revenues,net income before taxes, or capital ratios. The minimum capital ratio presentedis for the period 2014:Q4 to 2016:Q4.
2 Advanced approaches bank holding companies (BHCs) are subject to thecommon equity tier 1 ratio for the third and fourth quarter of 2014. All bankholding companies are subject to the common equity tier 1 ratio for eachquarter of 2015 and 2016. An advanced approaches BHC includes any BHCthat has consolidated total assets greater than or equal to $250 billion orconsolidated total on-balance sheet foreign exposure of at least $10 billion.See 12 CFR 217.100(b)(1). Other BHCs include any BHC that is subject to12 CFR 225.8 and is not an advanced approaches BHC.
n/a Not applicable.
Projected loan losses, by type of loan, 2014:Q4–2016:Q4
Billions ofdollars
Portfolio lossrates (%)1
Loan losses 2.2 4.5
First-lien mortgages, domestic 0.1 2.6
Junior liens and HELOCs, domestic 0.1 4.9
Commercial and industrial2 0.9 3.0
Commercial real estate, domestic 0.8 7.8
Credit cards 0.0 0.0
Other consumer3 0.0 7.8
Other loans4 0.4 6.6
1 Average loan balances used to calculate portfolio loss rates exclude loans heldfor sale and loans held for investment under the fair-value option and arecalculated over nine quarters.
2 Commercial and industrial loans include small- and medium-enterprise loansand corporate cards.
3 Other consumer loans include student loans and automobile loans.4 Other loans include international real estate loans.
Actual 2014:Q3 and projected 2016:Q4 risk-weightedassets
Actual2014:Q3
Projected 2016:Q4
Generalapproach
Standardizedapproach
Risk-weighted assets(billions of dollars)1 67.1 69.9 71.7
1 For each quarter in 2014, risk-weighted assets are calculated using thegeneral risk-based capital approach set forth in 12 CFR 225, appendix A. Foreach quarter in 2015 and 2016, risk-weighted assets are calculated under theBoard’s standardized capital risk-based approach in 12 CFR 217, subpart D,except for the risk-weighted assets used to calculate the tier 1 common ratio,which uses the general risk-based capital approach for all quarters.
Projected losses, revenue, net income and othercomprehensive income through 2016:Q4
Billions ofdollars
Percent ofaverage assets1
Pre-provision net revenue2 1.7 2.4
Other revenue3 0.0
less
Provisions 2.5
Realized losses/gains on securities (AFS/HTM) 0.0
Trading and counterparty losses4 0.0
Other losses/gains5 0.0
equals
Net income before taxes -0.7 -1.0
Memo items
Other comprehensive income6 0.0
Other effects on capital Actual 2014:Q3 2016:Q4
AOCI included in capital (billions of dollars)7 n/a 0.0
1 Average assets is the nine-quarter average of total assets.2 Pre-provision net revenue includes losses from operational-risk events,
mortgage repurchase expenses, and other real estate owned (OREO) costs.3 Other revenue includes one-time income and (expense) items not included in
pre-provision net revenue.4 Trading and counterparty losses include mark-to-market and credit valuation
adjustments (CVA) losses and losses arising from the counterparty defaultscenario component applied to derivatives, securities lending, and repurchaseagreement activities.
5 Other losses/gains includes projected change in fair value of loans held for saleand loans held for investment measured under the fair-value option, andgoodwill impairment losses.
6 Other comprehensive income (OCI) is only calculated for advanced approachesBHCs, and other BHCs that opt into the advanced approaches treatment ofAOCI.
7 Certain AOCI items are subject to transition into projected regulatory capital.Those transitions are 20 percent included in projected regulatory capital for2014, 40 percent included in projected regulatory capital for 2015, and60 percent included in projected regulatory capital for 2016.
86 Supervisory Stress Test Methodology and Results

Table C.11.B. Comerica Incorporated
Projected stressed capital ratios, risk-weighted assets, losses, revenues, net income beforetaxes, and loan lossesFederal Reserve estimates: Adverse scenario
Actual 2014:Q3 projected stressed capital ratios through2016:Q4
Actual2014:Q3
Stressed capital ratios1
Ending Minimum
Tier 1 common ratio (%) 10.6 10.9 10.4
Common equity tier 1 capital ratio (%)2 n/a 10.7 10.1
Tier 1 risk-based capital ratio (%) 10.6 10.7 10.1
Total risk-based capital ratio (%) 12.8 11.9 11.8
Tier 1 leverage ratio (%) 10.8 10.7 10.4
1 The capital ratios are calculated using capital action assumptions providedwithin the Dodd-Frank Act stress testing rule. These projections representhypothetical estimates that involve an economic outcome that is more adversethan expected. These estimates are not forecasts of expected losses, revenues,net income before taxes, or capital ratios. The minimum capital ratio presentedis for the period 2014:Q4 to 2016:Q4.
2 Advanced approaches bank holding companies (BHCs) are subject to thecommon equity tier 1 ratio for the third and fourth quarter of 2014. All bankholding companies are subject to the common equity tier 1 ratio for eachquarter of 2015 and 2016. An advanced approaches BHC includes any BHCthat has consolidated total assets greater than or equal to $250 billion orconsolidated total on-balance sheet foreign exposure of at least $10 billion.See 12 CFR 217.100(b)(1). Other BHCs include any BHC that is subject to12 CFR 225.8 and is not an advanced approaches BHC.
n/a Not applicable.
Projected loan losses, by type of loan, 2014:Q4–2016:Q4
Billions ofdollars
Portfolio lossrates (%)1
Loan losses 1.3 2.6
First-lien mortgages, domestic 0.0 1.8
Junior liens and HELOCs, domestic 0.1 3.1
Commercial and industrial2 0.5 1.7
Commercial real estate, domestic 0.5 4.4
Credit cards 0.0 0.0
Other consumer3 0.0 6.4
Other loans4 0.2 3.4
1 Average loan balances used to calculate portfolio loss rates exclude loans heldfor sale and loans held for investment under the fair-value option and arecalculated over nine quarters.
2 Commercial and industrial loans include small- and medium-enterprise loansand corporate cards.
3 Other consumer loans include student loans and automobile loans.4 Other loans include international real estate loans.
Actual 2014:Q3 and projected 2016:Q4 risk-weightedassets
Actual2014:Q3
Projected 2016:Q4
Generalapproach
Standardizedapproach
Risk-weighted assets(billions of dollars)1 67.1 72.2 73.7
1 For each quarter in 2014, risk-weighted assets are calculated using thegeneral risk-based capital approach set forth in 12 CFR 225, appendix A. Foreach quarter in 2015 and 2016, risk-weighted assets are calculated under theBoard’s standardized capital risk-based approach in 12 CFR 217, subpart D,except for the risk-weighted assets used to calculate the tier 1 common ratio,which uses the general risk-based capital approach for all quarters.
Projected losses, revenue, net income and othercomprehensive income through 2016:Q4
Billions ofdollars
Percent ofaverage assets1
Pre-provision net revenue2 2.8 3.8
Other revenue3 0.0
less
Provisions 1.2
Realized losses/gains on securities (AFS/HTM) 0.0
Trading and counterparty losses4 0.0
Other losses/gains5 0.0
equals
Net income before taxes 1.6 2.2
Memo items
Other comprehensive income6 0.0
Other effects on capital Actual 2014:Q3 2016:Q4
AOCI included in capital (billions of dollars)7 n/a 0.0
1 Average assets is the nine-quarter average of total assets.2 Pre-provision net revenue includes losses from operational-risk events,
mortgage repurchase expenses, and other real estate owned (OREO) costs.3 Other revenue includes one-time income and (expense) items not included in
pre-provision net revenue.4 Trading and counterparty losses include mark-to-market and credit valuation
adjustments (CVA) losses and losses arising from the counterparty defaultscenario component applied to derivatives, securities lending, and repurchaseagreement activities.
5 Other losses/gains includes projected change in fair value of loans held for saleand loans held for investment measured under the fair-value option, andgoodwill impairment losses.
6 Other comprehensive income (OCI) is only calculated for advanced approachesBHCs, and other BHCs that opt into the advanced approaches treatment ofAOCI.
7 Certain AOCI items are subject to transition into projected regulatory capital.Those transitions are 20 percent included in projected regulatory capital for2014, 40 percent included in projected regulatory capital for 2015, and60 percent included in projected regulatory capital for 2016.
March 2015 87

Table C.12.A. Deutsche Bank Trust Corporation
Projected stressed capital ratios, risk-weighted assets, losses, revenues, net income beforetaxes, and loan lossesFederal Reserve estimates: Severely adverse scenario
Actual 2014:Q3 projected stressed capital ratios through2016:Q4
Actual2014:Q3
Stressed capital ratios1
Ending Minimum
Tier 1 common ratio (%) 36.6 34.7 34.7
Common equity tier 1 capital ratio (%)2 n/a 28.6 28.6
Tier 1 risk-based capital ratio (%) 36.6 28.6 28.6
Total risk-based capital ratio (%) 37.0 29.8 29.8
Tier 1 leverage ratio (%) 11.9 11.0 11.0
1 The capital ratios are calculated using capital action assumptions providedwithin the Dodd-Frank Act stress testing rule. These projections representhypothetical estimates that involve an economic outcome that is more adversethan expected. These estimates are not forecasts of expected losses, revenues,net income before taxes, or capital ratios. The minimum capital ratio presentedis for the period 2014:Q4 to 2016:Q4.
2 Advanced approaches bank holding companies (BHCs) are subject to thecommon equity tier 1 ratio for the third and fourth quarter of 2014. All bankholding companies are subject to the common equity tier 1 ratio for eachquarter of 2015 and 2016. An advanced approaches BHC includes any BHCthat has consolidated total assets greater than or equal to $250 billion orconsolidated total on-balance sheet foreign exposure of at least $10 billion.See 12 CFR 217.100(b)(1). Other BHCs include any BHC that is subject to12 CFR 225.8 and is not an advanced approaches BHC.
n/a Not applicable.
Projected loan losses, by type of loan, 2014:Q4–2016:Q4
Billions ofdollars
Portfolio lossrates (%)1
Loan losses 0.8 4.5
First-lien mortgages, domestic 0.1 3.8
Junior liens and HELOCs, domestic 0.0 9.6
Commercial and industrial2 0.3 9.9
Commercial real estate, domestic 0.2 7.9
Credit cards 0.0 0.0
Other consumer3 0.0 2.3
Other loans4 0.1 1.4
1 Average loan balances used to calculate portfolio loss rates exclude loans heldfor sale and loans held for investment under the fair-value option and arecalculated over nine quarters.
2 Commercial and industrial loans include small- and medium-enterprise loansand corporate cards.
3 Other consumer loans include student loans and automobile loans.4 Other loans include international real estate loans.
Actual 2014:Q3 and projected 2016:Q4 risk-weightedassets
Actual2014:Q3
Projected 2016:Q4
Generalapproach
Standardizedapproach
Risk-weighted assets(billions of dollars)1 19.3 20.2 24.5
1 For each quarter in 2014, risk-weighted assets are calculated using thegeneral risk-based capital approach set forth in 12 CFR 225, appendix A. Foreach quarter in 2015 and 2016, risk-weighted assets are calculated under theBoard’s standardized capital risk-based approach in 12 CFR 217, subpart D,except for the risk-weighted assets used to calculate the tier 1 common ratio,which uses the general risk-based capital approach for all quarters.
Projected losses, revenue, net income and othercomprehensive income through 2016:Q4
Billions ofdollars
Percent ofaverage assets1
Pre-provision net revenue2 1.0 1.6
Other revenue3 0.0
less
Provisions 1.1
Realized losses/gains on securities (AFS/HTM) 0.0
Trading and counterparty losses4 0.0
Other losses/gains5 0.0
equals
Net income before taxes -0.1 -0.2
Memo items
Other comprehensive income6 0.0
Other effects on capital Actual 2014:Q3 2016:Q4
AOCI included in capital (billions of dollars)7 n/a -0.1
1 Average assets is the nine-quarter average of total assets.2 Pre-provision net revenue includes losses from operational-risk events,
mortgage repurchase expenses, and other real estate owned (OREO) costs.3 Other revenue includes one-time income and (expense) items not included in
pre-provision net revenue.4 Trading and counterparty losses include mark-to-market and credit valuation
adjustments (CVA) losses and losses arising from the counterparty defaultscenario component applied to derivatives, securities lending, and repurchaseagreement activities.
5 Other losses/gains includes projected change in fair value of loans held for saleand loans held for investment measured under the fair-value option, andgoodwill impairment losses.
6 Other comprehensive income (OCI) is only calculated for advanced approachesBHCs, and other BHCs that opt into the advanced approaches treatment ofAOCI.
7 Certain AOCI items are subject to transition into projected regulatory capital.Those transitions are 20 percent included in projected regulatory capital for2014, 40 percent included in projected regulatory capital for 2015, and60 percent included in projected regulatory capital for 2016.
88 Supervisory Stress Test Methodology and Results

Table C.12.B. Deutsche Bank Trust Corporation
Projected stressed capital ratios, risk-weighted assets, losses, revenues, net income beforetaxes, and loan lossesFederal Reserve estimates: Adverse scenario
Actual 2014:Q3 projected stressed capital ratios through2016:Q4
Actual2014:Q3
Stressed capital ratios1
Ending Minimum
Tier 1 common ratio (%) 36.6 40.6 36.3
Common equity tier 1 capital ratio (%)2 n/a 33.8 30.2
Tier 1 risk-based capital ratio (%) 36.6 33.8 30.2
Total risk-based capital ratio (%) 37.0 34.6 30.6
Tier 1 leverage ratio (%) 11.9 12.8 11.8
1 The capital ratios are calculated using capital action assumptions providedwithin the Dodd-Frank Act stress testing rule. These projections representhypothetical estimates that involve an economic outcome that is more adversethan expected. These estimates are not forecasts of expected losses, revenues,net income before taxes, or capital ratios. The minimum capital ratio presentedis for the period 2014:Q4 to 2016:Q4.
2 Advanced approaches bank holding companies (BHCs) are subject to thecommon equity tier 1 ratio for the third and fourth quarter of 2014. All bankholding companies are subject to the common equity tier 1 ratio for eachquarter of 2015 and 2016. An advanced approaches BHC includes any BHCthat has consolidated total assets greater than or equal to $250 billion orconsolidated total on-balance sheet foreign exposure of at least $10 billion.See 12 CFR 217.100(b)(1). Other BHCs include any BHC that is subject to12 CFR 225.8 and is not an advanced approaches BHC.
n/a Not applicable.
Projected loan losses, by type of loan, 2014:Q4–2016:Q4
Billions ofdollars
Portfolio lossrates (%)1
Loan losses 0.5 2.7
First-lien mortgages, domestic 0.1 2.8
Junior liens and HELOCs, domestic 0.0 6.0
Commercial and industrial2 0.2 5.6
Commercial real estate, domestic 0.1 4.5
Credit cards 0.0 0.0
Other consumer3 0.0 2.0
Other loans4 0.1 0.8
1 Average loan balances used to calculate portfolio loss rates exclude loans heldfor sale and loans held for investment under the fair-value option and arecalculated over nine quarters.
2 Commercial and industrial loans include small- and medium-enterprise loansand corporate cards.
3 Other consumer loans include student loans and automobile loans.4 Other loans include international real estate loans.
Actual 2014:Q3 and projected 2016:Q4 risk-weightedassets
Actual2014:Q3
Projected 2016:Q4
Generalapproach
Standardizedapproach
Risk-weighted assets(billions of dollars)1 19.3 20.9 25.2
1 For each quarter in 2014, risk-weighted assets are calculated using thegeneral risk-based capital approach set forth in 12 CFR 225, appendix A. Foreach quarter in 2015 and 2016, risk-weighted assets are calculated under theBoard’s standardized capital risk-based approach in 12 CFR 217, subpart D,except for the risk-weighted assets used to calculate the tier 1 common ratio,which uses the general risk-based capital approach for all quarters.
Projected losses, revenue, net income and othercomprehensive income through 2016:Q4
Billions ofdollars
Percent ofaverage assets1
Pre-provision net revenue2 2.8 4.4
Other revenue3 0.0
less
Provisions 0.7
Realized losses/gains on securities (AFS/HTM) 0.0
Trading and counterparty losses4 0.0
Other losses/gains5 0.0
equals
Net income before taxes 2.2 3.4
Memo items
Other comprehensive income6 0.0
Other effects on capital Actual 2014:Q3 2016:Q4
AOCI included in capital (billions of dollars)7 n/a -0.1
1 Average assets is the nine-quarter average of total assets.2 Pre-provision net revenue includes losses from operational-risk events,
mortgage repurchase expenses, and other real estate owned (OREO) costs.3 Other revenue includes one-time income and (expense) items not included in
pre-provision net revenue.4 Trading and counterparty losses include mark-to-market and credit valuation
adjustments (CVA) losses and losses arising from the counterparty defaultscenario component applied to derivatives, securities lending, and repurchaseagreement activities.
5 Other losses/gains includes projected change in fair value of loans held for saleand loans held for investment measured under the fair-value option, andgoodwill impairment losses.
6 Other comprehensive income (OCI) is only calculated for advanced approachesBHCs, and other BHCs that opt into the advanced approaches treatment ofAOCI.
7 Certain AOCI items are subject to transition into projected regulatory capital.Those transitions are 20 percent included in projected regulatory capital for2014, 40 percent included in projected regulatory capital for 2015, and60 percent included in projected regulatory capital for 2016.
March 2015 89

Table C.13.A. Discover Financial Services
Projected stressed capital ratios, risk-weighted assets, losses, revenues, net income beforetaxes, and loan lossesFederal Reserve estimates: Severely adverse scenario
Actual 2014:Q3 projected stressed capital ratios through2016:Q4
Actual2014:Q3
Stressed capital ratios1
Ending Minimum
Tier 1 common ratio (%) 14.8 15.3 13.9
Common equity tier 1 capital ratio (%)2 n/a 14.5 13.3
Tier 1 risk-based capital ratio (%) 15.6 15.2 14.1
Total risk-based capital ratio (%) 17.8 16.9 15.8
Tier 1 leverage ratio (%) 13.7 13.3 12.6
1 The capital ratios are calculated using capital action assumptions providedwithin the Dodd-Frank Act stress testing rule. These projections representhypothetical estimates that involve an economic outcome that is more adversethan expected. These estimates are not forecasts of expected losses, revenues,net income before taxes, or capital ratios. The minimum capital ratio presentedis for the period 2014:Q4 to 2016:Q4.
2 Advanced approaches bank holding companies (BHCs) are subject to thecommon equity tier 1 ratio for the third and fourth quarter of 2014. All bankholding companies are subject to the common equity tier 1 ratio for eachquarter of 2015 and 2016. An advanced approaches BHC includes any BHCthat has consolidated total assets greater than or equal to $250 billion orconsolidated total on-balance sheet foreign exposure of at least $10 billion.See 12 CFR 217.100(b)(1). Other BHCs include any BHC that is subject to12 CFR 225.8 and is not an advanced approaches BHC.
n/a Not applicable.
Projected loan losses, by type of loan, 2014:Q4–2016:Q4
Billions ofdollars
Portfolio lossrates (%)1
Loan losses 8.3 12.2
First-lien mortgages, domestic 0.0 5.1
Junior liens and HELOCs, domestic 0.0 15.0
Commercial and industrial2 0.0 14.0
Commercial real estate, domestic 0.0 31.6
Credit cards 6.9 12.7
Other consumer3 1.4 10.1
Other loans4 0.0 4.3
1 Average loan balances used to calculate portfolio loss rates exclude loans heldfor sale and loans held for investment under the fair-value option and arecalculated over nine quarters.
2 Commercial and industrial loans include small- and medium-enterprise loansand corporate cards.
3 Other consumer loans include student loans and automobile loans.4 Other loans include international real estate loans.
Actual 2014:Q3 and projected 2016:Q4 risk-weightedassets
Actual2014:Q3
Projected 2016:Q4
Generalapproach
Standardizedapproach
Risk-weighted assets(billions of dollars)1 70.1 70.9 75.4
1 For each quarter in 2014, risk-weighted assets are calculated using thegeneral risk-based capital approach set forth in 12 CFR 225, appendix A. Foreach quarter in 2015 and 2016, risk-weighted assets are calculated under theBoard’s standardized capital risk-based approach in 12 CFR 217, subpart D,except for the risk-weighted assets used to calculate the tier 1 common ratio,which uses the general risk-based capital approach for all quarters.
Projected losses, revenue, net income and othercomprehensive income through 2016:Q4
Billions ofdollars
Percent ofaverage assets1
Pre-provision net revenue2 12.9 15.4
Other revenue3 0.0
less
Provisions 10.1
Realized losses/gains on securities (AFS/HTM) 0.0
Trading and counterparty losses4 0.0
Other losses/gains5 0.0
equals
Net income before taxes 2.7 3.3
Memo items
Other comprehensive income6 0.0
Other effects on capital Actual 2014:Q3 2016:Q4
AOCI included in capital (billions of dollars)7 n/a 0.0
1 Average assets is the nine-quarter average of total assets.2 Pre-provision net revenue includes losses from operational-risk events,
mortgage repurchase expenses, and other real estate owned (OREO) costs.3 Other revenue includes one-time income and (expense) items not included in
pre-provision net revenue.4 Trading and counterparty losses include mark-to-market and credit valuation
adjustments (CVA) losses and losses arising from the counterparty defaultscenario component applied to derivatives, securities lending, and repurchaseagreement activities.
5 Other losses/gains includes projected change in fair value of loans held for saleand loans held for investment measured under the fair-value option, andgoodwill impairment losses.
6 Other comprehensive income (OCI) is only calculated for advanced approachesBHCs, and other BHCs that opt into the advanced approaches treatment ofAOCI.
7 Certain AOCI items are subject to transition into projected regulatory capital.Those transitions are 20 percent included in projected regulatory capital for2014, 40 percent included in projected regulatory capital for 2015, and60 percent included in projected regulatory capital for 2016.
90 Supervisory Stress Test Methodology and Results

Table C.13.B. Discover Financial Services
Projected stressed capital ratios, risk-weighted assets, losses, revenues, net income beforetaxes, and loan lossesFederal Reserve estimates: Adverse scenario
Actual 2014:Q3 projected stressed capital ratios through2016:Q4
Actual2014:Q3
Stressed capital ratios1
Ending Minimum
Tier 1 common ratio (%) 14.8 16.8 14.3
Common equity tier 1 capital ratio (%)2 n/a 16.1 14.1
Tier 1 risk-based capital ratio (%) 15.6 16.8 14.9
Total risk-based capital ratio (%) 17.8 18.4 16.7
Tier 1 leverage ratio (%) 13.7 14.4 13.0
1 The capital ratios are calculated using capital action assumptions providedwithin the Dodd-Frank Act stress testing rule. These projections representhypothetical estimates that involve an economic outcome that is more adversethan expected. These estimates are not forecasts of expected losses, revenues,net income before taxes, or capital ratios. The minimum capital ratio presentedis for the period 2014:Q4 to 2016:Q4.
2 Advanced approaches bank holding companies (BHCs) are subject to thecommon equity tier 1 ratio for the third and fourth quarter of 2014. All bankholding companies are subject to the common equity tier 1 ratio for eachquarter of 2015 and 2016. An advanced approaches BHC includes any BHCthat has consolidated total assets greater than or equal to $250 billion orconsolidated total on-balance sheet foreign exposure of at least $10 billion.See 12 CFR 217.100(b)(1). Other BHCs include any BHC that is subject to12 CFR 225.8 and is not an advanced approaches BHC.
n/a Not applicable.
Projected loan losses, by type of loan, 2014:Q4–2016:Q4
Billions ofdollars
Portfolio lossrates (%)1
Loan losses 6.8 9.8
First-lien mortgages, domestic 0.0 3.9
Junior liens and HELOCs, domestic 0.0 12.9
Commercial and industrial2 0.0 10.6
Commercial real estate, domestic 0.0 18.3
Credit cards 5.6 10.1
Other consumer3 1.2 8.7
Other loans4 0.0 2.3
1 Average loan balances used to calculate portfolio loss rates exclude loans heldfor sale and loans held for investment under the fair-value option and arecalculated over nine quarters.
2 Commercial and industrial loans include small- and medium-enterprise loansand corporate cards.
3 Other consumer loans include student loans and automobile loans.4 Other loans include international real estate loans.
Actual 2014:Q3 and projected 2016:Q4 risk-weightedassets
Actual2014:Q3
Projected 2016:Q4
Generalapproach
Standardizedapproach
Risk-weighted assets(billions of dollars)1 70.1 73.1 77.3
1 For each quarter in 2014, risk-weighted assets are calculated using thegeneral risk-based capital approach set forth in 12 CFR 225, appendix A. Foreach quarter in 2015 and 2016, risk-weighted assets are calculated under theBoard’s standardized capital risk-based approach in 12 CFR 217, subpart D,except for the risk-weighted assets used to calculate the tier 1 common ratio,which uses the general risk-based capital approach for all quarters.
Projected losses, revenue, net income and othercomprehensive income through 2016:Q4
Billions ofdollars
Percent ofaverage assets1
Pre-provision net revenue2 13.5 15.8
Other revenue3 0.0
less
Provisions 8.5
Realized losses/gains on securities (AFS/HTM) 0.0
Trading and counterparty losses4 0.0
Other losses/gains5 0.0
equals
Net income before taxes 5.0 5.8
Memo items
Other comprehensive income6 0.0
Other effects on capital Actual 2014:Q3 2016:Q4
AOCI included in capital (billions of dollars)7 n/a 0.0
1 Average assets is the nine-quarter average of total assets.2 Pre-provision net revenue includes losses from operational-risk events,
mortgage repurchase expenses, and other real estate owned (OREO) costs.3 Other revenue includes one-time income and (expense) items not included in
pre-provision net revenue.4 Trading and counterparty losses include mark-to-market and credit valuation
adjustments (CVA) losses and losses arising from the counterparty defaultscenario component applied to derivatives, securities lending, and repurchaseagreement activities.
5 Other losses/gains includes projected change in fair value of loans held for saleand loans held for investment measured under the fair-value option, andgoodwill impairment losses.
6 Other comprehensive income (OCI) is only calculated for advanced approachesBHCs, and other BHCs that opt into the advanced approaches treatment ofAOCI.
7 Certain AOCI items are subject to transition into projected regulatory capital.Those transitions are 20 percent included in projected regulatory capital for2014, 40 percent included in projected regulatory capital for 2015, and60 percent included in projected regulatory capital for 2016.
March 2015 91

Table C.14.A. Fifth Third Bancorp
Projected stressed capital ratios, risk-weighted assets, losses, revenues, net income beforetaxes, and loan lossesFederal Reserve estimates: Severely adverse scenario
Actual 2014:Q3 projected stressed capital ratios through2016:Q4
Actual2014:Q3
Stressed capital ratios1
Ending Minimum
Tier 1 common ratio (%) 9.6 7.9 7.9
Common equity tier 1 capital ratio (%)2 n/a 7.4 7.4
Tier 1 risk-based capital ratio (%) 10.8 8.5 8.5
Total risk-based capital ratio (%) 14.3 11.5 11.5
Tier 1 leverage ratio (%) 9.8 7.7 7.7
1 The capital ratios are calculated using capital action assumptions providedwithin the Dodd-Frank Act stress testing rule. These projections representhypothetical estimates that involve an economic outcome that is more adversethan expected. These estimates are not forecasts of expected losses, revenues,net income before taxes, or capital ratios. The minimum capital ratio presentedis for the period 2014:Q4 to 2016:Q4.
2 Advanced approaches bank holding companies (BHCs) are subject to thecommon equity tier 1 ratio for the third and fourth quarter of 2014. All bankholding companies are subject to the common equity tier 1 ratio for eachquarter of 2015 and 2016. An advanced approaches BHC includes any BHCthat has consolidated total assets greater than or equal to $250 billion orconsolidated total on-balance sheet foreign exposure of at least $10 billion.See 12 CFR 217.100(b)(1). Other BHCs include any BHC that is subject to12 CFR 225.8 and is not an advanced approaches BHC.
n/a Not applicable.
Projected loan losses, by type of loan, 2014:Q4–2016:Q4
Billions ofdollars
Portfolio lossrates (%)1
Loan losses 5.2 5.6
First-lien mortgages, domestic 0.6 4.4
Junior liens and HELOCs, domestic 0.5 5.7
Commercial and industrial2 1.8 5.0
Commercial real estate, domestic 1.3 13.2
Credit cards 0.3 14.3
Other consumer3 0.4 2.7
Other loans4 0.3 3.4
1 Average loan balances used to calculate portfolio loss rates exclude loans heldfor sale and loans held for investment under the fair-value option and arecalculated over nine quarters.
2 Commercial and industrial loans include small- and medium-enterprise loansand corporate cards.
3 Other consumer loans include student loans and automobile loans.4 Other loans include international real estate loans.
Actual 2014:Q3 and projected 2016:Q4 risk-weightedassets
Actual2014:Q3
Projected 2016:Q4
Generalapproach
Standardizedapproach
Risk-weighted assets(billions of dollars)1 116.9 121.1 125.4
1 For each quarter in 2014, risk-weighted assets are calculated using thegeneral risk-based capital approach set forth in 12 CFR 225, appendix A. Foreach quarter in 2015 and 2016, risk-weighted assets are calculated under theBoard’s standardized capital risk-based approach in 12 CFR 217, subpart D,except for the risk-weighted assets used to calculate the tier 1 common ratio,which uses the general risk-based capital approach for all quarters.
Projected losses, revenue, net income and othercomprehensive income through 2016:Q4
Billions ofdollars
Percent ofaverage assets1
Pre-provision net revenue2 4.7 3.4
Other revenue3 0.0
less
Provisions 5.5
Realized losses/gains on securities (AFS/HTM) 0.0
Trading and counterparty losses4 0.0
Other losses/gains5 0.0
equals
Net income before taxes -0.8 -0.6
Memo items
Other comprehensive income6 0.0
Other effects on capital Actual 2014:Q3 2016:Q4
AOCI included in capital (billions of dollars)7 n/a 0.0
1 Average assets is the nine-quarter average of total assets.2 Pre-provision net revenue includes losses from operational-risk events,
mortgage repurchase expenses, and other real estate owned (OREO) costs.3 Other revenue includes one-time income and (expense) items not included in
pre-provision net revenue.4 Trading and counterparty losses include mark-to-market and credit valuation
adjustments (CVA) losses and losses arising from the counterparty defaultscenario component applied to derivatives, securities lending, and repurchaseagreement activities.
5 Other losses/gains includes projected change in fair value of loans held for saleand loans held for investment measured under the fair-value option, andgoodwill impairment losses.
6 Other comprehensive income (OCI) is only calculated for advanced approachesBHCs, and other BHCs that opt into the advanced approaches treatment ofAOCI.
7 Certain AOCI items are subject to transition into projected regulatory capital.Those transitions are 20 percent included in projected regulatory capital for2014, 40 percent included in projected regulatory capital for 2015, and60 percent included in projected regulatory capital for 2016.
92 Supervisory Stress Test Methodology and Results

Table C.14.B. Fifth Third Bancorp
Projected stressed capital ratios, risk-weighted assets, losses, revenues, net income beforetaxes, and loan lossesFederal Reserve estimates: Adverse scenario
Actual 2014:Q3 projected stressed capital ratios through2016:Q4
Actual2014:Q3
Stressed capital ratios1
Ending Minimum
Tier 1 common ratio (%) 9.6 9.7 9.3
Common equity tier 1 capital ratio (%)2 n/a 9.3 9.0
Tier 1 risk-based capital ratio (%) 10.8 10.3 10.1
Total risk-based capital ratio (%) 14.3 12.6 12.6
Tier 1 leverage ratio (%) 9.8 9.2 9.1
1 The capital ratios are calculated using capital action assumptions providedwithin the Dodd-Frank Act stress testing rule. These projections representhypothetical estimates that involve an economic outcome that is more adversethan expected. These estimates are not forecasts of expected losses, revenues,net income before taxes, or capital ratios. The minimum capital ratio presentedis for the period 2014:Q4 to 2016:Q4.
2 Advanced approaches bank holding companies (BHCs) are subject to thecommon equity tier 1 ratio for the third and fourth quarter of 2014. All bankholding companies are subject to the common equity tier 1 ratio for eachquarter of 2015 and 2016. An advanced approaches BHC includes any BHCthat has consolidated total assets greater than or equal to $250 billion orconsolidated total on-balance sheet foreign exposure of at least $10 billion.See 12 CFR 217.100(b)(1). Other BHCs include any BHC that is subject to12 CFR 225.8 and is not an advanced approaches BHC.
n/a Not applicable.
Projected loan losses, by type of loan, 2014:Q4–2016:Q4
Billions ofdollars
Portfolio lossrates (%)1
Loan losses 3.4 3.7
First-lien mortgages, domestic 0.5 3.7
Junior liens and HELOCs, domestic 0.4 4.3
Commercial and industrial2 1.1 3.0
Commercial real estate, domestic 0.8 7.8
Credit cards 0.3 10.9
Other consumer3 0.3 2.0
Other loans4 0.2 2.2
1 Average loan balances used to calculate portfolio loss rates exclude loans heldfor sale and loans held for investment under the fair-value option and arecalculated over nine quarters.
2 Commercial and industrial loans include small- and medium-enterprise loansand corporate cards.
3 Other consumer loans include student loans and automobile loans.4 Other loans include international real estate loans.
Actual 2014:Q3 and projected 2016:Q4 risk-weightedassets
Actual2014:Q3
Projected 2016:Q4
Generalapproach
Standardizedapproach
Risk-weighted assets(billions of dollars)1 116.9 125.3 128.9
1 For each quarter in 2014, risk-weighted assets are calculated using thegeneral risk-based capital approach set forth in 12 CFR 225, appendix A. Foreach quarter in 2015 and 2016, risk-weighted assets are calculated under theBoard’s standardized capital risk-based approach in 12 CFR 217, subpart D,except for the risk-weighted assets used to calculate the tier 1 common ratio,which uses the general risk-based capital approach for all quarters.
Projected losses, revenue, net income and othercomprehensive income through 2016:Q4
Billions ofdollars
Percent ofaverage assets1
Pre-provision net revenue2 6.3 4.4
Other revenue3 0.0
less
Provisions 3.3
Realized losses/gains on securities (AFS/HTM) 0.0
Trading and counterparty losses4 0.0
Other losses/gains5 0.0
equals
Net income before taxes 3.0 2.1
Memo items
Other comprehensive income6 0.0
Other effects on capital Actual 2014:Q3 2016:Q4
AOCI included in capital (billions of dollars)7 n/a 0.0
1 Average assets is the nine-quarter average of total assets.2 Pre-provision net revenue includes losses from operational-risk events,
mortgage repurchase expenses, and other real estate owned (OREO) costs.3 Other revenue includes one-time income and (expense) items not included in
pre-provision net revenue.4 Trading and counterparty losses include mark-to-market and credit valuation
adjustments (CVA) losses and losses arising from the counterparty defaultscenario component applied to derivatives, securities lending, and repurchaseagreement activities.
5 Other losses/gains includes projected change in fair value of loans held for saleand loans held for investment measured under the fair-value option, andgoodwill impairment losses.
6 Other comprehensive income (OCI) is only calculated for advanced approachesBHCs, and other BHCs that opt into the advanced approaches treatment ofAOCI.
7 Certain AOCI items are subject to transition into projected regulatory capital.Those transitions are 20 percent included in projected regulatory capital for2014, 40 percent included in projected regulatory capital for 2015, and60 percent included in projected regulatory capital for 2016.
March 2015 93
Table C.15.A. The Goldman Sachs Group, Inc.
Projected stressed capital ratios, risk-weighted assets, losses, revenues, net income beforetaxes, and loan lossesFederal Reserve estimates: Severely adverse scenario
Actual 2014:Q3 projected stressed capital ratios through2016:Q4
Actual2014:Q3
Stressed capital ratios1
Ending Minimum
Tier 1 common ratio (%) 15.2 9.9 6.7
Common equity tier 1 capital ratio (%)2 15.1 7.1 5.8
Tier 1 risk-based capital ratio (%) 17.0 8.1 6.4
Total risk-based capital ratio (%) 19.8 10.0 8.1
Tier 1 leverage ratio (%) 9.0 5.9 5.4
1 The capital ratios are calculated using capital action assumptions providedwithin the Dodd-Frank Act stress testing rule. These projections representhypothetical estimates that involve an economic outcome that is more adversethan expected. These estimates are not forecasts of expected losses, revenues,net income before taxes, or capital ratios. The minimum capital ratio presentedis for the period 2014:Q4 to 2016:Q4.
2 Advanced approaches bank holding companies (BHCs) are subject to thecommon equity tier 1 ratio for the third and fourth quarter of 2014. All bankholding companies are subject to the common equity tier 1 ratio for eachquarter of 2015 and 2016. An advanced approaches BHC includes any BHCthat has consolidated total assets greater than or equal to $250 billion orconsolidated total on-balance sheet foreign exposure of at least $10 billion.See 12 CFR 217.100(b)(1). Other BHCs include any BHC that is subject to12 CFR 225.8 and is not an advanced approaches BHC.
Projected loan losses, by type of loan, 2014:Q4–2016:Q4
Billions ofdollars
Portfolio lossrates (%)1
Loan losses 2.2 3.2
First-lien mortgages, domestic 0.0 5.1
Junior liens and HELOCs, domestic 0.0 9.3
Commercial and industrial2 0.9 9.8
Commercial real estate, domestic 0.2 6.1
Credit cards 0.0 0.0
Other consumer3 0.0 2.7
Other loans4 1.1 2.0
1 Average loan balances used to calculate portfolio loss rates exclude loans heldfor sale and loans held for investment under the fair-value option and arecalculated over nine quarters.
2 Commercial and industrial loans include small- and medium-enterprise loansand corporate cards.
3 Other consumer loans include student loans and automobile loans.4 Other loans include international real estate loans.
Actual 2014:Q3 and projected 2016:Q4 risk-weightedassets
Actual2014:Q3
Projected 2016:Q4
Generalapproach
Standardizedapproach
Risk-weighted assets(billions of dollars)1 456.1 463.8 665.9
1 For each quarter in 2014, risk-weighted assets are calculated using thegeneral risk-based capital approach set forth in 12 CFR 225, appendix A. Foreach quarter in 2015 and 2016, risk-weighted assets are calculated under theBoard’s standardized capital risk-based approach in 12 CFR 217, subpart D,except for the risk-weighted assets used to calculate the tier 1 common ratio,which uses the general risk-based capital approach for all quarters.
Projected losses, revenue, net income and othercomprehensive income through 2016:Q4
Billions ofdollars
Percent ofaverage assets1
Pre-provision net revenue2 2.4 0.3
Other revenue3 0.0
less
Provisions 2.8
Realized losses/gains on securities (AFS/HTM) 0.0
Trading and counterparty losses4 17.0
Other losses/gains5 6.8
equals
Net income before taxes -24.1 -2.7
Memo items
Other comprehensive income6 0.0
Other effects on capital Actual 2014:Q3 2016:Q4
AOCI included in capital (billions of dollars)7 -0.5 -0.6
1 Average assets is the nine-quarter average of total assets.2 Pre-provision net revenue includes losses from operational-risk events,
mortgage repurchase expenses, and other real estate owned (OREO) costs.3 Other revenue includes one-time income and (expense) items not included in
pre-provision net revenue.4 Trading and counterparty losses include mark-to-market and credit valuation
adjustments (CVA) losses and losses arising from the counterparty defaultscenario component applied to derivatives, securities lending, and repurchaseagreement activities.
5 Other losses/gains includes projected change in fair value of loans held for saleand loans held for investment measured under the fair-value option andgoodwill impairment losses.
6 Other comprehensive income (OCI) is only calculated for advanced approachesBHCs, and other BHCs that opt into the advanced approaches treatment ofAOCI.
7 Certain AOCI items are subject to transition into projected regulatory capital.Those transitions are 20 percent included in projected regulatory capital for2014, 40 percent included in projected regulatory capital for 2015, and60 percent included in projected regulatory capital for 2016.
94 Supervisory Stress Test Methodology and Results

Table C.15.B. The Goldman Sachs Group, Inc.
Projected stressed capital ratios, risk-weighted assets, losses, revenues, net income beforetaxes, and loan lossesFederal Reserve estimates: Adverse scenario
Actual 2014:Q3 projected stressed capital ratios through2016:Q4
Actual2014:Q3
Stressed capital ratios1
Ending Minimum
Tier 1 common ratio (%) 15.2 14.5 12.9
Common equity tier 1 capital ratio (%)2 15.1 10.2 9.2
Tier 1 risk-based capital ratio (%) 17.0 11.4 10.5
Total risk-based capital ratio (%) 19.8 13.2 12.4
Tier 1 leverage ratio (%) 9.0 8.1 7.8
1 The capital ratios are calculated using capital action assumptions providedwithin the Dodd-Frank Act stress testing rule. These projections representhypothetical estimates that involve an economic outcome that is more adversethan expected. These estimates are not forecasts of expected losses, revenues,net income before taxes, or capital ratios. The minimum capital ratio presentedis for the period 2014:Q4 to 2016:Q4.
2 Advanced approaches bank holding companies (BHCs) are subject to thecommon equity tier 1 ratio for the third and fourth quarter of 2014. All bankholding companies are subject to the common equity tier 1 ratio for eachquarter of 2015 and 2016. An advanced approaches BHC includes any BHCthat has consolidated total assets greater than or equal to $250 billion orconsolidated total on-balance sheet foreign exposure of at least $10 billion.See 12 CFR 217.100(b)(1). Other BHCs include any BHC that is subject to12 CFR 225.8 and is not an advanced approaches BHC.
Projected loan losses, by type of loan, 2014:Q4–2016:Q4
Billions ofdollars
Portfolio lossrates (%)1
Loan losses 1.4 1.9
First-lien mortgages, domestic 0.0 3.8
Junior liens and HELOCs, domestic 0.0 5.6
Commercial and industrial2 0.5 5.5
Commercial real estate, domestic 0.1 3.5
Credit cards 0.0 0.0
Other consumer3 0.0 2.3
Other loans4 0.7 1.3
1 Average loan balances used to calculate portfolio loss rates exclude loans heldfor sale and loans held for investment under the fair-value option and arecalculated over nine quarters.
2 Commercial and industrial loans include small- and medium-enterprise loansand corporate cards.
3 Other consumer loans include student loans and automobile loans.4 Other loans include international real estate loans.
Actual 2014:Q3 and projected 2016:Q4 risk-weightedassets
Actual2014:Q3
Projected 2016:Q4
Generalapproach
Standardizedapproach
Risk-weighted assets(billions of dollars)1 456.1 470.0 680.2
1 For each quarter in 2014, risk-weighted assets are calculated using thegeneral risk-based capital approach set forth in 12 CFR 225, appendix A. Foreach quarter in 2015 and 2016, risk-weighted assets are calculated under theBoard’s standardized capital risk-based approach in 12 CFR 217, subpart D,except for the risk-weighted assets used to calculate the tier 1 common ratio,which uses the general risk-based capital approach for all quarters.
Projected losses, revenue, net income and othercomprehensive income through 2016:Q4
Billions ofdollars
Percent ofaverage assets1
Pre-provision net revenue2 19.0 2.1
Other revenue3 0.0
less
Provisions 1.7
Realized losses/gains on securities (AFS/HTM) 0.0
Trading and counterparty losses4 9.9
Other losses/gains5 3.4
equals
Net income before taxes 4.1 0.4
Memo items
Other comprehensive income6 0.0
Other effects on capital Actual 2014:Q3 2016:Q4
AOCI included in capital (billions of dollars)7 -0.5 -0.6
1 Average assets is the nine-quarter average of total assets.2 Pre-provision net revenue includes losses from operational-risk events,
mortgage repurchase expenses, and other real estate owned (OREO) costs.3 Other revenue includes one-time income and (expense) items not included in
pre-provision net revenue.4 Trading and counterparty losses include mark-to-market and credit valuation
adjustments (CVA) losses and losses arising from the counterparty defaultscenario component applied to derivatives, securities lending, and repurchaseagreement activities.
5 Other losses/gains includes projected change in fair value of loans held for saleand loans held for investment measured under the fair-value option andgoodwill impairment losses.
6 Other comprehensive income (OCI) is only calculated for advanced approachesBHCs, and other BHCs that opt into the advanced approaches treatment ofAOCI.
7 Certain AOCI items are subject to transition into projected regulatory capital.Those transitions are 20 percent included in projected regulatory capital for2014, 40 percent included in projected regulatory capital for 2015, and60 percent included in projected regulatory capital for 2016.
March 2015 95

Table C.16.A. HSBC North America Holdings Inc.
Projected stressed capital ratios, risk-weighted assets, losses, revenues, net income beforetaxes, and loan lossesFederal Reserve estimates: Severely adverse scenario
Actual 2014:Q3 projected stressed capital ratios through2016:Q4
Actual2014:Q3
Stressed capital ratios1
Ending Minimum
Tier 1 common ratio (%) 14.0 8.9 8.9
Common equity tier 1 capital ratio (%)2 16.3 8.9 8.9
Tier 1 risk-based capital ratio (%) 17.3 10.0 10.0
Total risk-based capital ratio (%) 26.1 14.8 14.8
Tier 1 leverage ratio (%) 9.4 6.0 6.0
1 The capital ratios are calculated using capital action assumptions providedwithin the Dodd-Frank Act stress testing rule. These projections representhypothetical estimates that involve an economic outcome that is more adversethan expected. These estimates are not forecasts of expected losses, revenues,net income before taxes, or capital ratios. The minimum capital ratio presentedis for the period 2014:Q4 to 2016:Q4.
2 Advanced approaches bank holding companies (BHCs) are subject to thecommon equity tier 1 ratio for the third and fourth quarter of 2014. All bankholding companies are subject to the common equity tier 1 ratio for eachquarter of 2015 and 2016. An advanced approaches BHC includes any BHCthat has consolidated total assets greater than or equal to $250 billion orconsolidated total on-balance sheet foreign exposure of at least $10 billion.See 12 CFR 217.100(b)(1). Other BHCs include any BHC that is subject to12 CFR 225.8 and is not an advanced approaches BHC.
Projected loan losses, by type of loan, 2014:Q4–2016:Q4
Billions ofdollars
Portfolio lossrates (%)1
Loan losses 8.2 8.6
First-lien mortgages, domestic 4.7 12.5
Junior liens and HELOCs, domestic 1.1 22.3
Commercial and industrial2 1.1 3.5
Commercial real estate, domestic 0.9 9.6
Credit cards 0.1 14.7
Other consumer3 0.0 7.4
Other loans4 0.3 2.7
1 Average loan balances used to calculate portfolio loss rates exclude loans heldfor sale and loans held for investment under the fair-value option and arecalculated over nine quarters.
2 Commercial and industrial loans include small- and medium-enterprise loansand corporate cards.
3 Other consumer loans include student loans and automobile loans.4 Other loans include international real estate loans.
Actual 2014:Q3 and projected 2016:Q4 risk-weightedassets
Actual2014:Q3
Projected 2016:Q4
Generalapproach
Standardizedapproach
Risk-weighted assets(billions of dollars)1 159.3 161.5 187.0
1 For each quarter in 2014, risk-weighted assets are calculated using thegeneral risk-based capital approach set forth in 12 CFR 225, appendix A. Foreach quarter in 2015 and 2016, risk-weighted assets are calculated under theBoard’s standardized capital risk-based approach in 12 CFR 217, subpart D,except for the risk-weighted assets used to calculate the tier 1 common ratio,which uses the general risk-based capital approach for all quarters.
Projected losses, revenue, net income and othercomprehensive income through 2016:Q4
Billions ofdollars
Percent ofaverage assets1
Pre-provision net revenue2 -0.7 -0.3
Other revenue3 0.0
less
Provisions 7.6
Realized losses/gains on securities (AFS/HTM) 0.1
Trading and counterparty losses4 0.0
Other losses/gains5 0.7
equals
Net income before taxes -9.1 -3.1
Memo items
Other comprehensive income6 0.8
Other effects on capital Actual 2014:Q3 2016:Q4
AOCI included in capital (billions of dollars)7 -0.1 0.2
1 Average assets is the nine-quarter average of total assets.2 Pre-provision net revenue includes losses from operational-risk events,
mortgage repurchase expenses, and other real estate owned (OREO) costs.3 Other revenue includes one-time income and (expense) items not included in
pre-provision net revenue.4 Trading and counterparty losses include mark-to-market and credit valuation
adjustments (CVA) losses and losses arising from the counterparty defaultscenario component applied to derivatives, securities lending, and repurchaseagreement activities.
5 Other losses/gains includes projected change in fair value of loans held for saleand loans held for investment measured under the fair-value option andgoodwill impairment losses.
6 Other comprehensive income (OCI) is only calculated for advanced approachesBHCs, and other BHCs that opt into the advanced approaches treatment ofAOCI.
7 Certain AOCI items are subject to transition into projected regulatory capital.Those transitions are 20 percent included in projected regulatory capital for2014, 40 percent included in projected regulatory capital for 2015, and60 percent included in projected regulatory capital for 2016.
96 Supervisory Stress Test Methodology and Results

Table C.16.B. HSBC North America Holdings Inc.
Projected stressed capital ratios, risk-weighted assets, losses, revenues, net income beforetaxes, and loan lossesFederal Reserve estimates: Adverse scenario
Actual 2014:Q3 projected stressed capital ratios through2016:Q4
Actual2014:Q3
Stressed capital ratios1
Ending Minimum
Tier 1 common ratio (%) 14.0 14.4 13.9
Common equity tier 1 capital ratio (%)2 16.3 11.3 11.1
Tier 1 risk-based capital ratio (%) 17.3 12.7 12.5
Total risk-based capital ratio (%) 26.1 16.6 16.6
Tier 1 leverage ratio (%) 9.4 7.6 7.5
1 The capital ratios are calculated using capital action assumptions providedwithin the Dodd-Frank Act stress testing rule. These projections representhypothetical estimates that involve an economic outcome that is more adversethan expected. These estimates are not forecasts of expected losses, revenues,net income before taxes, or capital ratios. The minimum capital ratio presentedis for the period 2014:Q4 to 2016:Q4.
2 Advanced approaches bank holding companies (BHCs) are subject to thecommon equity tier 1 ratio for the third and fourth quarter of 2014. All bankholding companies are subject to the common equity tier 1 ratio for eachquarter of 2015 and 2016. An advanced approaches BHC includes any BHCthat has consolidated total assets greater than or equal to $250 billion orconsolidated total on-balance sheet foreign exposure of at least $10 billion.See 12 CFR 217.100(b)(1). Other BHCs include any BHC that is subject to12 CFR 225.8 and is not an advanced approaches BHC.
Projected loan losses, by type of loan, 2014:Q4–2016:Q4
Billions ofdollars
Portfolio lossrates (%)1
Loan losses 6.1 6.4
First-lien mortgages, domestic 3.8 10.0
Junior liens and HELOCs, domestic 0.9 19.2
Commercial and industrial2 0.6 1.9
Commercial real estate, domestic 0.5 5.3
Credit cards 0.1 11.9
Other consumer3 0.0 6.4
Other loans4 0.2 1.5
1 Average loan balances used to calculate portfolio loss rates exclude loans heldfor sale and loans held for investment under the fair-value option and arecalculated over nine quarters.
2 Commercial and industrial loans include small- and medium-enterprise loansand corporate cards.
3 Other consumer loans include student loans and automobile loans.4 Other loans include international real estate loans.
Actual 2014:Q3 and projected 2016:Q4 risk-weightedassets
Actual2014:Q3
Projected 2016:Q4
Generalapproach
Standardizedapproach
Risk-weighted assets(billions of dollars)1 159.3 168.2 194.6
1 For each quarter in 2014, risk-weighted assets are calculated using thegeneral risk-based capital approach set forth in 12 CFR 225, appendix A. Foreach quarter in 2015 and 2016, risk-weighted assets are calculated under theBoard’s standardized capital risk-based approach in 12 CFR 217, subpart D,except for the risk-weighted assets used to calculate the tier 1 common ratio,which uses the general risk-based capital approach for all quarters.
Projected losses, revenue, net income and othercomprehensive income through 2016:Q4
Billions ofdollars
Percent ofaverage assets1
Pre-provision net revenue2 4.5 1.5
Other revenue3 0.0
less
Provisions 4.9
Realized losses/gains on securities (AFS/HTM) 0.0
Trading and counterparty losses4 0.0
Other losses/gains5 0.3
equals
Net income before taxes -0.7 -0.2
Memo items
Other comprehensive income6 -2.3
Other effects on capital Actual 2014:Q3 2016:Q4
AOCI included in capital (billions of dollars)7 -0.1 -1.7
1 Average assets is the nine-quarter average of total assets.2 Pre-provision net revenue includes losses from operational-risk events,
mortgage repurchase expenses, and other real estate owned (OREO) costs.3 Other revenue includes one-time income and (expense) items not included in
pre-provision net revenue.4 Trading and counterparty losses include mark-to-market and credit valuation
adjustments (CVA) losses and losses arising from the counterparty defaultscenario component applied to derivatives, securities lending, and repurchaseagreement activities.
5 Other losses/gains includes projected change in fair value of loans held for saleand loans held for investment measured under the fair-value option andgoodwill impairment losses.
6 Other comprehensive income (OCI) is only calculated for advanced approachesBHCs, and other BHCs that opt into the advanced approaches treatment ofAOCI.
7 Certain AOCI items are subject to transition into projected regulatory capital.Those transitions are 20 percent included in projected regulatory capital for2014, 40 percent included in projected regulatory capital for 2015, and60 percent included in projected regulatory capital for 2016.
March 2015 97

Table C.17.A. Huntington Bancshares Incorporated
Projected stressed capital ratios, risk-weighted assets, losses, revenues, net income beforetaxes, and loan lossesFederal Reserve estimates: Severely adverse scenario
Actual 2014:Q3 projected stressed capital ratios through2016:Q4
Actual2014:Q3
Stressed capital ratios1
Ending Minimum
Tier 1 common ratio (%) 10.3 9.0 9.0
Common equity tier 1 capital ratio (%)2 n/a 8.7 8.7
Tier 1 risk-based capital ratio (%) 11.6 9.4 9.4
Total risk-based capital ratio (%) 13.7 11.6 11.6
Tier 1 leverage ratio (%) 9.8 8.0 8.0
1 The capital ratios are calculated using capital action assumptions providedwithin the Dodd-Frank Act stress testing rule. These projections representhypothetical estimates that involve an economic outcome that is more adversethan expected. These estimates are not forecasts of expected losses, revenues,net income before taxes, or capital ratios. The minimum capital ratio presentedis for the period 2014:Q4 to 2016:Q4.
2 Advanced approaches bank holding companies (BHCs) are subject to thecommon equity tier 1 ratio for the third and fourth quarter of 2014. All bankholding companies are subject to the common equity tier 1 ratio for eachquarter of 2015 and 2016. An advanced approaches BHC includes any BHCthat has consolidated total assets greater than or equal to $250 billion orconsolidated total on-balance sheet foreign exposure of at least $10 billion.See 12 CFR 217.100(b)(1). Other BHCs include any BHC that is subject to12 CFR 225.8 and is not an advanced approaches BHC.
n/a Not applicable.
Projected loan losses, by type of loan, 2014:Q4–2016:Q4
Billions ofdollars
Portfolio lossrates (%)1
Loan losses 2.0 4.2
First-lien mortgages, domestic 0.2 2.8
Junior liens and HELOCs, domestic 0.3 4.5
Commercial and industrial2 0.5 4.0
Commercial real estate, domestic 0.6 7.2
Credit cards 0.0 14.7
Other consumer3 0.3 3.2
Other loans4 0.1 2.1
1 Average loan balances used to calculate portfolio loss rates exclude loans heldfor sale and loans held for investment under the fair-value option and arecalculated over nine quarters.
2 Commercial and industrial loans include small- and medium-enterprise loansand corporate cards.
3 Other consumer loans include student loans and automobile loans.4 Other loans include international real estate loans.
Actual 2014:Q3 and projected 2016:Q4 risk-weightedassets
Actual2014:Q3
Projected 2016:Q4
Generalapproach
Standardizedapproach
Risk-weighted assets(billions of dollars)1 53.2 55.0 57.3
1 For each quarter in 2014, risk-weighted assets are calculated using thegeneral risk-based capital approach set forth in 12 CFR 225, appendix A. Foreach quarter in 2015 and 2016, risk-weighted assets are calculated under theBoard’s standardized capital risk-based approach in 12 CFR 217, subpart D,except for the risk-weighted assets used to calculate the tier 1 common ratio,which uses the general risk-based capital approach for all quarters.
Projected losses, revenue, net income and othercomprehensive income through 2016:Q4
Billions ofdollars
Percent ofaverage assets1
Pre-provision net revenue2 2.2 3.3
Other revenue3 0.0
less
Provisions 2.1
Realized losses/gains on securities (AFS/HTM) 0.2
Trading and counterparty losses4 0.0
Other losses/gains5 0.0
equals
Net income before taxes -0.1 -0.2
Memo items
Other comprehensive income6 0.0
Other effects on capital Actual 2014:Q3 2016:Q4
AOCI included in capital (billions of dollars)7 n/a 0.0
1 Average assets is the nine-quarter average of total assets.2 Pre-provision net revenue includes losses from operational-risk events,
mortgage repurchase expenses, and other real estate owned (OREO) costs.3 Other revenue includes one-time income and (expense) items not included in
pre-provision net revenue.4 Trading and counterparty losses include mark-to-market and credit valuation
adjustments (CVA) losses and losses arising from the counterparty defaultscenario component applied to derivatives, securities lending, and repurchaseagreement activities.
5 Other losses/gains includes projected change in fair value of loans held for saleand loans held for investment measured under the fair-value option, andgoodwill impairment losses.
6 Other comprehensive income (OCI) is only calculated for advanced approachesBHCs, and other BHCs that opt into the advanced approaches treatment ofAOCI.
7 Certain AOCI items are subject to transition into projected regulatory capital.Those transitions are 20 percent included in projected regulatory capital for2014, 40 percent included in projected regulatory capital for 2015, and60 percent included in projected regulatory capital for 2016.
98 Supervisory Stress Test Methodology and Results

Table C.17.B. Huntington Bancshares Incorporated
Projected stressed capital ratios, risk-weighted assets, losses, revenues, net income beforetaxes, and loan lossesFederal Reserve estimates: Adverse scenario
Actual 2014:Q3 projected stressed capital ratios through2016:Q4
Actual2014:Q3
Stressed capital ratios1
Ending Minimum
Tier 1 common ratio (%) 10.3 10.1 10.0
Common equity tier 1 capital ratio (%)2 n/a 9.8 9.7
Tier 1 risk-based capital ratio (%) 11.6 10.5 10.4
Total risk-based capital ratio (%) 13.7 12.4 12.4
Tier 1 leverage ratio (%) 9.8 8.8 8.8
1 The capital ratios are calculated using capital action assumptions providedwithin the Dodd-Frank Act stress testing rule. These projections representhypothetical estimates that involve an economic outcome that is more adversethan expected. These estimates are not forecasts of expected losses, revenues,net income before taxes, or capital ratios. The minimum capital ratio presentedis for the period 2014:Q4 to 2016:Q4.
2 Advanced approaches bank holding companies (BHCs) are subject to thecommon equity tier 1 ratio for the third and fourth quarter of 2014. All bankholding companies are subject to the common equity tier 1 ratio for eachquarter of 2015 and 2016. An advanced approaches BHC includes any BHCthat has consolidated total assets greater than or equal to $250 billion orconsolidated total on-balance sheet foreign exposure of at least $10 billion.See 12 CFR 217.100(b)(1). Other BHCs include any BHC that is subject to12 CFR 225.8 and is not an advanced approaches BHC.
n/a Not applicable.
Projected loan losses, by type of loan, 2014:Q4–2016:Q4
Billions ofdollars
Portfolio lossrates (%)1
Loan losses 1.4 2.8
First-lien mortgages, domestic 0.2 2.2
Junior liens and HELOCs, domestic 0.2 3.4
Commercial and industrial2 0.3 2.5
Commercial real estate, domestic 0.4 4.5
Credit cards 0.0 11.9
Other consumer3 0.2 2.4
Other loans4 0.0 1.2
1 Average loan balances used to calculate portfolio loss rates exclude loans heldfor sale and loans held for investment under the fair-value option and arecalculated over nine quarters.
2 Commercial and industrial loans include small- and medium-enterprise loansand corporate cards.
3 Other consumer loans include student loans and automobile loans.4 Other loans include international real estate loans.
Actual 2014:Q3 and projected 2016:Q4 risk-weightedassets
Actual2014:Q3
Projected 2016:Q4
Generalapproach
Standardizedapproach
Risk-weighted assets(billions of dollars)1 53.2 56.8 58.8
1 For each quarter in 2014, risk-weighted assets are calculated using thegeneral risk-based capital approach set forth in 12 CFR 225, appendix A. Foreach quarter in 2015 and 2016, risk-weighted assets are calculated under theBoard’s standardized capital risk-based approach in 12 CFR 217, subpart D,except for the risk-weighted assets used to calculate the tier 1 common ratio,which uses the general risk-based capital approach for all quarters.
Projected losses, revenue, net income and othercomprehensive income through 2016:Q4
Billions ofdollars
Percent ofaverage assets1
Pre-provision net revenue2 2.5 3.6
Other revenue3 0.0
less
Provisions 1.4
Realized losses/gains on securities (AFS/HTM) 0.1
Trading and counterparty losses4 0.0
Other losses/gains5 0.0
equals
Net income before taxes 1.0 1.5
Memo items
Other comprehensive income6 0.0
Other effects on capital Actual 2014:Q3 2016:Q4
AOCI included in capital (billions of dollars)7 n/a 0.0
1 Average assets is the nine-quarter average of total assets.2 Pre-provision net revenue includes losses from operational-risk events,
mortgage repurchase expenses, and other real estate owned (OREO) costs.3 Other revenue includes one-time income and (expense) items not included in
pre-provision net revenue.4 Trading and counterparty losses include mark-to-market and credit valuation
adjustments (CVA) losses and losses arising from the counterparty defaultscenario component applied to derivatives, securities lending, and repurchaseagreement activities.
5 Other losses/gains includes projected change in fair value of loans held for saleand loans held for investment measured under the fair-value option, andgoodwill impairment losses.
6 Other comprehensive income (OCI) is only calculated for advanced approachesBHCs, and other BHCs that opt into the advanced approaches treatment ofAOCI.
7 Certain AOCI items are subject to transition into projected regulatory capital.Those transitions are 20 percent included in projected regulatory capital for2014, 40 percent included in projected regulatory capital for 2015, and60 percent included in projected regulatory capital for 2016.
March 2015 99

Table C.18.A. JPMorgan Chase & Co.
Projected stressed capital ratios, risk-weighted assets, losses, revenues, net income beforetaxes, and loan lossesFederal Reserve estimates: Severely adverse scenario
Actual 2014:Q3 projected stressed capital ratios through2016:Q4
Actual2014:Q3
Stressed capital ratios1
Ending Minimum
Tier 1 common ratio (%) 10.9 6.5 6.5
Common equity tier 1 capital ratio (%)2 11.1 6.4 6.3
Tier 1 risk-based capital ratio (%) 12.6 7.3 7.3
Total risk-based capital ratio (%) 15.0 9.6 9.6
Tier 1 leverage ratio (%) 7.6 4.6 4.6
1 The capital ratios are calculated using capital action assumptions providedwithin the Dodd-Frank Act stress testing rule. These projections representhypothetical estimates that involve an economic outcome that is more adversethan expected. These estimates are not forecasts of expected losses, revenues,net income before taxes, or capital ratios. The minimum capital ratio presentedis for the period 2014:Q4 to 2016:Q4.
2 Advanced approaches bank holding companies (BHCs) are subject to thecommon equity tier 1 ratio for the third and fourth quarter of 2014. All bankholding companies are subject to the common equity tier 1 ratio for eachquarter of 2015 and 2016. An advanced approaches BHC includes any BHCthat has consolidated total assets greater than or equal to $250 billion orconsolidated total on-balance sheet foreign exposure of at least $10 billion.See 12 CFR 217.100(b)(1). Other BHCs include any BHC that is subject to12 CFR 225.8 and is not an advanced approaches BHC.
Projected loan losses, by type of loan, 2014:Q4–2016:Q4
Billions ofdollars
Portfolio lossrates (%)1
Loan losses 49.7 6.4
First-lien mortgages, domestic 5.4 3.8
Junior liens and HELOCs, domestic 6.7 9.7
Commercial and industrial2 9.6 7.5
Commercial real estate, domestic 5.4 6.7
Credit cards 12.9 11.0
Other consumer3 2.5 3.7
Other loans4 7.1 4.1
1 Average loan balances used to calculate portfolio loss rates exclude loans heldfor sale and loans held for investment under the fair-value option and arecalculated over nine quarters.
2 Commercial and industrial loans include small- and medium-enterprise loansand corporate cards.
3 Other consumer loans include student loans and automobile loans.4 Other loans include international real estate loans.
Actual 2014:Q3 and projected 2016:Q4 risk-weightedassets
Actual2014:Q3
Projected 2016:Q4
Generalapproach
Standardizedapproach
Risk-weighted assets(billions of dollars)1 1,462.2 1,525.7 1,608.4
1 For each quarter in 2014, risk-weighted assets are calculated using thegeneral risk-based capital approach set forth in 12 CFR 225, appendix A. Foreach quarter in 2015 and 2016, risk-weighted assets are calculated under theBoard’s standardized capital risk-based approach in 12 CFR 217, subpart D,except for the risk-weighted assets used to calculate the tier 1 common ratio,which uses the general risk-based capital approach for all quarters.
Projected losses, revenue, net income and othercomprehensive income through 2016:Q4
Billions ofdollars
Percent ofaverage assets1
Pre-provision net revenue2 30.4 1.2
Other revenue3 0.0
less
Provisions 55.5
Realized losses/gains on securities (AFS/HTM) 4.1
Trading and counterparty losses4 23.6
Other losses/gains5 2.1
equals
Net income before taxes -54.8 -2.1
Memo items
Other comprehensive income6 -5.4
Other effects on capital Actual 2014:Q3 2016:Q4
AOCI included in capital (billions of dollars)7 0.6 -1.3
1 Average assets is the nine-quarter average of total assets.2 Pre-provision net revenue includes losses from operational-risk events,
mortgage repurchase expenses, and other real estate owned (OREO) costs.3 Other revenue includes one-time income and (expense) items not included in
pre-provision net revenue.4 Trading and counterparty losses include mark-to-market and credit valuation
adjustments (CVA) losses and losses arising from the counterparty defaultscenario component applied to derivatives, securities lending, and repurchaseagreement activities.
5 Other losses/gains includes projected change in fair value of loans held for saleand loans held for investment measured under the fair-value option andgoodwill impairment losses.
6 Other comprehensive income (OCI) is only calculated for advanced approachesBHCs, and other BHCs that opt into the advanced approaches treatment ofAOCI.
7 Certain AOCI items are subject to transition into projected regulatory capital.Those transitions are 20 percent included in projected regulatory capital for2014, 40 percent included in projected regulatory capital for 2015, and60 percent included in projected regulatory capital for 2016.
100 Supervisory Stress Test Methodology and Results

Table C.18.B. JPMorgan Chase & Co.
Projected stressed capital ratios, risk-weighted assets, losses, revenues, net income beforetaxes, and loan lossesFederal Reserve estimates: Adverse scenario
Actual 2014:Q3 projected stressed capital ratios through2016:Q4
Actual2014:Q3
Stressed capital ratios1
Ending Minimum
Tier 1 common ratio (%) 10.9 10.1 9.6
Common equity tier 1 capital ratio (%)2 11.1 9.1 8.8
Tier 1 risk-based capital ratio (%) 12.6 10.3 10.0
Total risk-based capital ratio (%) 15.0 12.1 12.1
Tier 1 leverage ratio (%) 7.6 6.3 6.3
1 The capital ratios are calculated using capital action assumptions providedwithin the Dodd-Frank Act stress testing rule. These projections representhypothetical estimates that involve an economic outcome that is more adversethan expected. These estimates are not forecasts of expected losses, revenues,net income before taxes, or capital ratios. The minimum capital ratio presentedis for the period 2014:Q4 to 2016:Q4.
2 Advanced approaches bank holding companies (BHCs) are subject to thecommon equity tier 1 ratio for the third and fourth quarter of 2014. All bankholding companies are subject to the common equity tier 1 ratio for eachquarter of 2015 and 2016. An advanced approaches BHC includes any BHCthat has consolidated total assets greater than or equal to $250 billion orconsolidated total on-balance sheet foreign exposure of at least $10 billion.See 12 CFR 217.100(b)(1). Other BHCs include any BHC that is subject to12 CFR 225.8 and is not an advanced approaches BHC.
Projected loan losses, by type of loan, 2014:Q4–2016:Q4
Billions ofdollars
Portfolio lossrates (%)1
Loan losses 33.1 4.2
First-lien mortgages, domestic 3.6 2.5
Junior liens and HELOCs, domestic 4.2 6.0
Commercial and industrial2 5.9 4.6
Commercial real estate, domestic 3.0 3.6
Credit cards 10.3 8.7
Other consumer3 2.0 3.0
Other loans4 4.0 2.3
1 Average loan balances used to calculate portfolio loss rates exclude loans heldfor sale and loans held for investment under the fair-value option and arecalculated over nine quarters.
2 Commercial and industrial loans include small- and medium-enterprise loansand corporate cards.
3 Other consumer loans include student loans and automobile loans.4 Other loans include international real estate loans.
Actual 2014:Q3 and projected 2016:Q4 risk-weightedassets
Actual2014:Q3
Projected 2016:Q4
Generalapproach
Standardizedapproach
Risk-weighted assets(billions of dollars)1 1,462.2 1,577.7 1,658.4
1 For each quarter in 2014, risk-weighted assets are calculated using thegeneral risk-based capital approach set forth in 12 CFR 225, appendix A. Foreach quarter in 2015 and 2016, risk-weighted assets are calculated under theBoard’s standardized capital risk-based approach in 12 CFR 217, subpart D,except for the risk-weighted assets used to calculate the tier 1 common ratio,which uses the general risk-based capital approach for all quarters.
Projected losses, revenue, net income and othercomprehensive income through 2016:Q4
Billions ofdollars
Percent ofaverage assets1
Pre-provision net revenue2 70.5 2.6
Other revenue3 0.0
less
Provisions 33.7
Realized losses/gains on securities (AFS/HTM) 2.3
Trading and counterparty losses4 12.2
Other losses/gains5 1.1
equals
Net income before taxes 21.2 0.8
Memo items
Other comprehensive income6 -22.8
Other effects on capital Actual 2014:Q3 2016:Q4
AOCI included in capital (billions of dollars)7 0.6 -11.7
1 Average assets is the nine-quarter average of total assets.2 Pre-provision net revenue includes losses from operational-risk events,
mortgage repurchase expenses, and other real estate owned (OREO) costs.3 Other revenue includes one-time income and (expense) items not included in
pre-provision net revenue.4 Trading and counterparty losses include mark-to-market and credit valuation
adjustments (CVA) losses and losses arising from the counterparty defaultscenario component applied to derivatives, securities lending, and repurchaseagreement activities.
5 Other losses/gains includes projected change in fair value of loans held for saleand loans held for investment measured under the fair-value option andgoodwill impairment losses.
6 Other comprehensive income (OCI) is only calculated for advanced approachesBHCs, and other BHCs that opt into the advanced approaches treatment ofAOCI.
7 Certain AOCI items are subject to transition into projected regulatory capital.Those transitions are 20 percent included in projected regulatory capital for2014, 40 percent included in projected regulatory capital for 2015, and60 percent included in projected regulatory capital for 2016.
March 2015 101

Table C.19.A. KeyCorp
Projected stressed capital ratios, risk-weighted assets, losses, revenues, net income beforetaxes, and loan lossesFederal Reserve estimates: Severely adverse scenario
Actual 2014:Q3 projected stressed capital ratios through2016:Q4
Actual2014:Q3
Stressed capital ratios1
Ending Minimum
Tier 1 common ratio (%) 11.3 9.9 9.9
Common equity tier 1 capital ratio (%)2 n/a 9.6 9.6
Tier 1 risk-based capital ratio (%) 12.0 9.9 9.9
Total risk-based capital ratio (%) 14.1 12.1 12.1
Tier 1 leverage ratio (%) 11.2 9.3 9.3
1 The capital ratios are calculated using capital action assumptions providedwithin the Dodd-Frank Act stress testing rule. These projections representhypothetical estimates that involve an economic outcome that is more adversethan expected. These estimates are not forecasts of expected losses, revenues,net income before taxes, or capital ratios. The minimum capital ratio presentedis for the period 2014:Q4 to 2016:Q4.
2 Advanced approaches bank holding companies (BHCs) are subject to thecommon equity tier 1 ratio for the third and fourth quarter of 2014. All bankholding companies are subject to the common equity tier 1 ratio for eachquarter of 2015 and 2016. An advanced approaches BHC includes any BHCthat has consolidated total assets greater than or equal to $250 billion orconsolidated total on-balance sheet foreign exposure of at least $10 billion.See 12 CFR 217.100(b)(1). Other BHCs include any BHC that is subject to12 CFR 225.8 and is not an advanced approaches BHC.
n/a Not applicable.
Projected loan losses, by type of loan, 2014:Q4–2016:Q4
Billions ofdollars
Portfolio lossrates (%)1
Loan losses 3.0 5.0
First-lien mortgages, domestic 0.2 4.3
Junior liens and HELOCs, domestic 0.4 4.5
Commercial and industrial2 0.9 4.0
Commercial real estate, domestic 0.7 8.0
Credit cards 0.1 12.8
Other consumer3 0.4 8.8
Other loans4 0.3 2.5
1 Average loan balances used to calculate portfolio loss rates exclude loans heldfor sale and loans held for investment under the fair-value option and arecalculated over nine quarters.
2 Commercial and industrial loans include small- and medium-enterprise loansand corporate cards.
3 Other consumer loans include student loans and automobile loans.4 Other loans include international real estate loans.
Actual 2014:Q3 and projected 2016:Q4 risk-weightedassets
Actual2014:Q3
Projected 2016:Q4
Generalapproach
Standardizedapproach
Risk-weighted assets(billions of dollars)1 83.5 87.0 90.8
1 For each quarter in 2014, risk-weighted assets are calculated using thegeneral risk-based capital approach set forth in 12 CFR 225, appendix A. Foreach quarter in 2015 and 2016, risk-weighted assets are calculated under theBoard’s standardized capital risk-based approach in 12 CFR 217, subpart D,except for the risk-weighted assets used to calculate the tier 1 common ratio,which uses the general risk-based capital approach for all quarters.
Projected losses, revenue, net income and othercomprehensive income through 2016:Q4
Billions ofdollars
Percent ofaverage assets1
Pre-provision net revenue2 3.1 3.3
Other revenue3 0.0
less
Provisions 3.3
Realized losses/gains on securities (AFS/HTM) 0.0
Trading and counterparty losses4 0.0
Other losses/gains5 0.2
equals
Net income before taxes -0.4 -0.4
Memo items
Other comprehensive income6 0.0
Other effects on capital Actual 2014:Q3 2016:Q4
AOCI included in capital (billions of dollars)7 n/a 0.0
1 Average assets is the nine-quarter average of total assets.2 Pre-provision net revenue includes losses from operational-risk events,
mortgage repurchase expenses, and other real estate owned (OREO) costs.3 Other revenue includes one-time income and (expense) items not included in
pre-provision net revenue.4 Trading and counterparty losses include mark-to-market and credit valuation
adjustments (CVA) losses and losses arising from the counterparty defaultscenario component applied to derivatives, securities lending, and repurchaseagreement activities.
5 Other losses/gains includes projected change in fair value of loans held for saleand loans held for investment measured under the fair-value option, andgoodwill impairment losses.
6 Other comprehensive income (OCI) is only calculated for advanced approachesBHCs, and other BHCs that opt into the advanced approaches treatment ofAOCI.
7 Certain AOCI items are subject to transition into projected regulatory capital.Those transitions are 20 percent included in projected regulatory capital for2014, 40 percent included in projected regulatory capital for 2015, and60 percent included in projected regulatory capital for 2016.
102 Supervisory Stress Test Methodology and Results

Table C.19.B. KeyCorp
Projected stressed capital ratios, risk-weighted assets, losses, revenues, net income beforetaxes, and loan lossesFederal Reserve estimates: Adverse scenario
Actual 2014:Q3 projected stressed capital ratios through2016:Q4
Actual2014:Q3
Stressed capital ratios1
Ending Minimum
Tier 1 common ratio (%) 11.3 11.3 10.8
Common equity tier 1 capital ratio (%)2 n/a 10.9 10.5
Tier 1 risk-based capital ratio (%) 12.0 11.2 10.9
Total risk-based capital ratio (%) 14.1 13.1 12.9
Tier 1 leverage ratio (%) 11.2 10.4 10.2
1 The capital ratios are calculated using capital action assumptions providedwithin the Dodd-Frank Act stress testing rule. These projections representhypothetical estimates that involve an economic outcome that is more adversethan expected. These estimates are not forecasts of expected losses, revenues,net income before taxes, or capital ratios. The minimum capital ratio presentedis for the period 2014:Q4 to 2016:Q4.
2 Advanced approaches bank holding companies (BHCs) are subject to thecommon equity tier 1 ratio for the third and fourth quarter of 2014. All bankholding companies are subject to the common equity tier 1 ratio for eachquarter of 2015 and 2016. An advanced approaches BHC includes any BHCthat has consolidated total assets greater than or equal to $250 billion orconsolidated total on-balance sheet foreign exposure of at least $10 billion.See 12 CFR 217.100(b)(1). Other BHCs include any BHC that is subject to12 CFR 225.8 and is not an advanced approaches BHC.
n/a Not applicable.
Projected loan losses, by type of loan, 2014:Q4–2016:Q4
Billions ofdollars
Portfolio lossrates (%)1
Loan losses 2.0 3.2
First-lien mortgages, domestic 0.2 3.4
Junior liens and HELOCs, domestic 0.3 3.3
Commercial and industrial2 0.5 2.2
Commercial real estate, domestic 0.5 4.8
Credit cards 0.1 10.1
Other consumer3 0.3 7.1
Other loans4 0.2 1.5
1 Average loan balances used to calculate portfolio loss rates exclude loans heldfor sale and loans held for investment under the fair-value option and arecalculated over nine quarters.
2 Commercial and industrial loans include small- and medium-enterprise loansand corporate cards.
3 Other consumer loans include student loans and automobile loans.4 Other loans include international real estate loans.
Actual 2014:Q3 and projected 2016:Q4 risk-weightedassets
Actual2014:Q3
Projected 2016:Q4
Generalapproach
Standardizedapproach
Risk-weighted assets(billions of dollars)1 83.5 90.0 93.4
1 For each quarter in 2014, risk-weighted assets are calculated using thegeneral risk-based capital approach set forth in 12 CFR 225, appendix A. Foreach quarter in 2015 and 2016, risk-weighted assets are calculated under theBoard’s standardized capital risk-based approach in 12 CFR 217, subpart D,except for the risk-weighted assets used to calculate the tier 1 common ratio,which uses the general risk-based capital approach for all quarters.
Projected losses, revenue, net income and othercomprehensive income through 2016:Q4
Billions ofdollars
Percent ofaverage assets1
Pre-provision net revenue2 4.1 4.3
Other revenue3 0.0
less
Provisions 2.0
Realized losses/gains on securities (AFS/HTM) 0.0
Trading and counterparty losses4 0.0
Other losses/gains5 0.2
equals
Net income before taxes 2.0 2.1
Memo items
Other comprehensive income6 0.0
Other effects on capital Actual 2014:Q3 2016:Q4
AOCI included in capital (billions of dollars)7 n/a 0.0
1 Average assets is the nine-quarter average of total assets.2 Pre-provision net revenue includes losses from operational-risk events,
mortgage repurchase expenses, and other real estate owned (OREO) costs.3 Other revenue includes one-time income and (expense) items not included in
pre-provision net revenue.4 Trading and counterparty losses include mark-to-market and credit valuation
adjustments (CVA) losses and losses arising from the counterparty defaultscenario component applied to derivatives, securities lending, and repurchaseagreement activities.
5 Other losses/gains includes projected change in fair value of loans held for saleand loans held for investment measured under the fair-value option, andgoodwill impairment losses.
6 Other comprehensive income (OCI) is only calculated for advanced approachesBHCs, and other BHCs that opt into the advanced approaches treatment ofAOCI.
7 Certain AOCI items are subject to transition into projected regulatory capital.Those transitions are 20 percent included in projected regulatory capital for2014, 40 percent included in projected regulatory capital for 2015, and60 percent included in projected regulatory capital for 2016.
March 2015 103

Table C.20.A. M&T Bank Corporation
Projected stressed capital ratios, risk-weighted assets, losses, revenues, net income beforetaxes, and loan lossesFederal Reserve estimates: Severely adverse scenario
Actual 2014:Q3 projected stressed capital ratios through2016:Q4
Actual2014:Q3
Stressed capital ratios1
Ending Minimum
Tier 1 common ratio (%) 9.8 7.3 7.3
Common equity tier 1 capital ratio (%)2 n/a 7.5 7.5
Tier 1 risk-based capital ratio (%) 12.5 8.8 8.8
Total risk-based capital ratio (%) 15.4 11.6 11.6
Tier 1 leverage ratio (%) 10.6 6.8 6.8
1 The capital ratios are calculated using capital action assumptions providedwithin the Dodd-Frank Act stress testing rule. These projections representhypothetical estimates that involve an economic outcome that is more adversethan expected. These estimates are not forecasts of expected losses, revenues,net income before taxes, or capital ratios. The minimum capital ratio presentedis for the period 2014:Q4 to 2016:Q4.
2 Advanced approaches bank holding companies (BHCs) are subject to thecommon equity tier 1 ratio for the third and fourth quarter of 2014. All bankholding companies are subject to the common equity tier 1 ratio for eachquarter of 2015 and 2016. An advanced approaches BHC includes any BHCthat has consolidated total assets greater than or equal to $250 billion orconsolidated total on-balance sheet foreign exposure of at least $10 billion.See 12 CFR 217.100(b)(1). Other BHCs include any BHC that is subject to12 CFR 225.8 and is not an advanced approaches BHC.
n/a Not applicable.
Projected loan losses, by type of loan, 2014:Q4–2016:Q4
Billions ofdollars
Portfolio lossrates (%)1
Loan losses 4.4 5.2
First-lien mortgages, domestic 1.0 3.7
Junior liens and HELOCs, domestic 0.4 6.1
Commercial and industrial2 0.6 3.8
Commercial real estate, domestic 2.0 7.5
Credit cards 0.0 14.7
Other consumer3 0.3 6.2
Other loans4 0.1 2.5
1 Average loan balances used to calculate portfolio loss rates exclude loans heldfor sale and loans held for investment under the fair-value option and arecalculated over nine quarters.
2 Commercial and industrial loans include small- and medium-enterprise loansand corporate cards.
3 Other consumer loans include student loans and automobile loans.4 Other loans include international real estate loans.
Actual 2014:Q3 and projected 2016:Q4 risk-weightedassets
Actual2014:Q3
Projected 2016:Q4
Generalapproach
Standardizedapproach
Risk-weighted assets(billions of dollars)1 75.8 93.1 93.1
1 For each quarter in 2014, risk-weighted assets are calculated using thegeneral risk-based capital approach set forth in 12 CFR 225, appendix A. Foreach quarter in 2015 and 2016, risk-weighted assets are calculated under theBoard’s standardized capital risk-based approach in 12 CFR 217, subpart D,except for the risk-weighted assets used to calculate the tier 1 common ratio,which uses the general risk-based capital approach for all quarters.
Projected losses, revenue, net income and othercomprehensive income through 2016:Q4
Billions ofdollars
Percent ofaverage assets1
Pre-provision net revenue2 4.1 3.3
Other revenue3 0.0
less
Provisions 5.4
Realized losses/gains on securities (AFS/HTM) 0.0
Trading and counterparty losses4 0.0
Other losses/gains5 0.1
equals
Net income before taxes -1.4 -1.1
Memo items
Other comprehensive income6 0.0
Other effects on capital Actual 2014:Q3 2016:Q4
AOCI included in capital (billions of dollars)7 n/a 0.0
1 Average assets is the nine-quarter average of total assets.2 Pre-provision net revenue includes losses from operational-risk events,
mortgage repurchase expenses, and other real estate owned (OREO) costs.3 Other revenue includes one-time income and (expense) items not included in
pre-provision net revenue.4 Trading and counterparty losses include mark-to-market and credit valuation
adjustments (CVA) losses and losses arising from the counterparty defaultscenario component applied to derivatives, securities lending, and repurchaseagreement activities.
5 Other losses/gains includes projected change in fair value of loans held for saleand loans held for investment measured under the fair-value option, andgoodwill impairment losses.
6 Other comprehensive income (OCI) is only calculated for advanced approachesBHCs, and other BHCs that opt into the advanced approaches treatment ofAOCI.
7 Certain AOCI items are subject to transition into projected regulatory capital.Those transitions are 20 percent included in projected regulatory capital for2014, 40 percent included in projected regulatory capital for 2015, and60 percent included in projected regulatory capital for 2016.
104 Supervisory Stress Test Methodology and Results

Table C.20.B. M&T Bank Corporation
Projected stressed capital ratios, risk-weighted assets, losses, revenues, net income beforetaxes, and loan lossesFederal Reserve estimates: Adverse scenario
Actual 2014:Q3 projected stressed capital ratios through2016:Q4
Actual2014:Q3
Stressed capital ratios1
Ending Minimum
Tier 1 common ratio (%) 9.8 9.4 9.3
Common equity tier 1 capital ratio (%)2 n/a 9.7 9.5
Tier 1 risk-based capital ratio (%) 12.5 11.0 10.9
Total risk-based capital ratio (%) 15.4 13.7 13.7
Tier 1 leverage ratio (%) 10.6 8.3 8.3
1 The capital ratios are calculated using capital action assumptions providedwithin the Dodd-Frank Act stress testing rule. These projections representhypothetical estimates that involve an economic outcome that is more adversethan expected. These estimates are not forecasts of expected losses, revenues,net income before taxes, or capital ratios. The minimum capital ratio presentedis for the period 2014:Q4 to 2016:Q4.
2 Advanced approaches bank holding companies (BHCs) are subject to thecommon equity tier 1 ratio for the third and fourth quarter of 2014. All bankholding companies are subject to the common equity tier 1 ratio for eachquarter of 2015 and 2016. An advanced approaches BHC includes any BHCthat has consolidated total assets greater than or equal to $250 billion orconsolidated total on-balance sheet foreign exposure of at least $10 billion.See 12 CFR 217.100(b)(1). Other BHCs include any BHC that is subject to12 CFR 225.8 and is not an advanced approaches BHC.
n/a Not applicable.
Projected loan losses, by type of loan, 2014:Q4–2016:Q4
Billions ofdollars
Portfolio lossrates (%)1
Loan losses 3.0 3.6
First-lien mortgages, domestic 0.8 2.8
Junior liens and HELOCs, domestic 0.3 4.7
Commercial and industrial2 0.4 2.5
Commercial real estate, domestic 1.3 4.6
Credit cards 0.0 11.9
Other consumer3 0.2 4.3
Other loans4 0.0 1.4
1 Average loan balances used to calculate portfolio loss rates exclude loans heldfor sale and loans held for investment under the fair-value option and arecalculated over nine quarters.
2 Commercial and industrial loans include small- and medium-enterprise loansand corporate cards.
3 Other consumer loans include student loans and automobile loans.4 Other loans include international real estate loans.
Actual 2014:Q3 and projected 2016:Q4 risk-weightedassets
Actual2014:Q3
Projected 2016:Q4
Generalapproach
Standardizedapproach
Risk-weighted assets(billions of dollars)1 75.8 96.4 95.2
1 For each quarter in 2014, risk-weighted assets are calculated using thegeneral risk-based capital approach set forth in 12 CFR 225, appendix A. Foreach quarter in 2015 and 2016, risk-weighted assets are calculated under theBoard’s standardized capital risk-based approach in 12 CFR 217, subpart D,except for the risk-weighted assets used to calculate the tier 1 common ratio,which uses the general risk-based capital approach for all quarters.
Projected losses, revenue, net income and othercomprehensive income through 2016:Q4
Billions ofdollars
Percent ofaverage assets1
Pre-provision net revenue2 5.3 4.2
Other revenue3 0.0
less
Provisions 3.5
Realized losses/gains on securities (AFS/HTM) 0.0
Trading and counterparty losses4 0.0
Other losses/gains5 0.0
equals
Net income before taxes 1.8 1.4
Memo items
Other comprehensive income6 0.0
Other effects on capital Actual 2014:Q3 2016:Q4
AOCI included in capital (billions of dollars)7 n/a 0.0
1 Average assets is the nine-quarter average of total assets.2 Pre-provision net revenue includes losses from operational-risk events,
mortgage repurchase expenses, and other real estate owned (OREO) costs.3 Other revenue includes one-time income and (expense) items not included in
pre-provision net revenue.4 Trading and counterparty losses include mark-to-market and credit valuation
adjustments (CVA) losses and losses arising from the counterparty defaultscenario component applied to derivatives, securities lending, and repurchaseagreement activities.
5 Other losses/gains includes projected change in fair value of loans held for saleand loans held for investment measured under the fair-value option, andgoodwill impairment losses.
6 Other comprehensive income (OCI) is only calculated for advanced approachesBHCs, and other BHCs that opt into the advanced approaches treatment ofAOCI.
7 Certain AOCI items are subject to transition into projected regulatory capital.Those transitions are 20 percent included in projected regulatory capital for2014, 40 percent included in projected regulatory capital for 2015, and60 percent included in projected regulatory capital for 2016.
March 2015 105

Table C.21.A. Morgan Stanley
Projected stressed capital ratios, risk-weighted assets, losses, revenues, net income beforetaxes, and loan lossesFederal Reserve estimates: Severely adverse scenario
Actual 2014:Q3 projected stressed capital ratios through2016:Q4
Actual2014:Q3
Stressed capital ratios1
Ending Minimum
Tier 1 common ratio (%) 15.0 8.8 6.2
Common equity tier 1 capital ratio (%)2 15.2 8.3 6.3
Tier 1 risk-based capital ratio (%) 17.1 8.8 6.5
Total risk-based capital ratio (%) 19.8 11.3 8.6
Tier 1 leverage ratio (%) 8.2 4.9 4.5
1 The capital ratios are calculated using capital action assumptions providedwithin the Dodd-Frank Act stress testing rule. These projections representhypothetical estimates that involve an economic outcome that is more adversethan expected. These estimates are not forecasts of expected losses, revenues,net income before taxes, or capital ratios. The minimum capital ratio presentedis for the period 2014:Q4 to 2016:Q4.
2 Advanced approaches bank holding companies (BHCs) are subject to thecommon equity tier 1 ratio for the third and fourth quarter of 2014. All bankholding companies are subject to the common equity tier 1 ratio for eachquarter of 2015 and 2016. An advanced approaches BHC includes any BHCthat has consolidated total assets greater than or equal to $250 billion orconsolidated total on-balance sheet foreign exposure of at least $10 billion.See 12 CFR 217.100(b)(1). Other BHCs include any BHC that is subject to12 CFR 225.8 and is not an advanced approaches BHC.
Projected loan losses, by type of loan, 2014:Q4–2016:Q4
Billions ofdollars
Portfolio lossrates (%)1
Loan losses 2.6 4.0
First-lien mortgages, domestic 0.2 1.6
Junior liens and HELOCs, domestic 0.0 9.3
Commercial and industrial2 0.6 8.0
Commercial real estate, domestic 0.9 19.7
Credit cards 0.0 0.0
Other consumer3 0.2 0.7
Other loans4 0.6 4.1
1 Average loan balances used to calculate portfolio loss rates exclude loans heldfor sale and loans held for investment under the fair-value option and arecalculated over nine quarters.
2 Commercial and industrial loans include small- and medium-enterprise loansand corporate cards.
3 Other consumer loans include student loans and automobile loans.4 Other loans include international real estate loans.
Actual 2014:Q3 and projected 2016:Q4 risk-weightedassets
Actual2014:Q3
Projected 2016:Q4
Generalapproach
Standardizedapproach
Risk-weighted assets(billions of dollars)1 390.6 409.8 482.2
1 For each quarter in 2014, risk-weighted assets are calculated using thegeneral risk-based capital approach set forth in 12 CFR 225, appendix A. Foreach quarter in 2015 and 2016, risk-weighted assets are calculated under theBoard’s standardized capital risk-based approach in 12 CFR 217, subpart D,except for the risk-weighted assets used to calculate the tier 1 common ratio,which uses the general risk-based capital approach for all quarters.
Projected losses, revenue, net income and othercomprehensive income through 2016:Q4
Billions ofdollars
Percent ofaverage assets1
Pre-provision net revenue2 4.1 0.5
Other revenue3 0.0
less
Provisions 3.5
Realized losses/gains on securities (AFS/HTM) 0.2
Trading and counterparty losses4 15.8
Other losses/gains5 3.6
equals
Net income before taxes -19.0 -2.2
Memo items
Other comprehensive income6 0.0
Other effects on capital Actual 2014:Q3 2016:Q4
AOCI included in capital (billions of dollars)7 -0.6 -0.8
1 Average assets is the nine-quarter average of total assets.2 Pre-provision net revenue includes losses from operational-risk events,
mortgage repurchase expenses, and other real estate owned (OREO) costs.3 Other revenue includes one-time income and (expense) items not included in
pre-provision net revenue.4 Trading and counterparty losses include mark-to-market and credit valuation
adjustments (CVA) losses and losses arising from the counterparty defaultscenario component applied to derivatives, securities lending, and repurchaseagreement activities.
5 Other losses/gains includes projected change in fair value of loans held for saleand loans held for investment measured under the fair-value option andgoodwill impairment losses.
6 Other comprehensive income (OCI) is only calculated for advanced approachesBHCs, and other BHCs that opt into the advanced approaches treatment ofAOCI.
7 Certain AOCI items are subject to transition into projected regulatory capital.Those transitions are 20 percent included in projected regulatory capital for2014, 40 percent included in projected regulatory capital for 2015, and60 percent included in projected regulatory capital for 2016.
106 Supervisory Stress Test Methodology and Results

Table C.21.B. Morgan Stanley
Projected stressed capital ratios, risk-weighted assets, losses, revenues, net income beforetaxes, and loan lossesFederal Reserve estimates: Adverse scenario
Actual 2014:Q3 projected stressed capital ratios through2016:Q4
Actual2014:Q3
Stressed capital ratios1
Ending Minimum
Tier 1 common ratio (%) 15.0 14.0 12.2
Common equity tier 1 capital ratio (%)2 15.2 11.9 10.7
Tier 1 risk-based capital ratio (%) 17.1 13.1 11.9
Total risk-based capital ratio (%) 19.8 15.5 14.4
Tier 1 leverage ratio (%) 8.2 7.0 6.7
1 The capital ratios are calculated using capital action assumptions providedwithin the Dodd-Frank Act stress testing rule. These projections representhypothetical estimates that involve an economic outcome that is more adversethan expected. These estimates are not forecasts of expected losses, revenues,net income before taxes, or capital ratios. The minimum capital ratio presentedis for the period 2014:Q4 to 2016:Q4.
2 Advanced approaches bank holding companies (BHCs) are subject to thecommon equity tier 1 ratio for the third and fourth quarter of 2014. All bankholding companies are subject to the common equity tier 1 ratio for eachquarter of 2015 and 2016. An advanced approaches BHC includes any BHCthat has consolidated total assets greater than or equal to $250 billion orconsolidated total on-balance sheet foreign exposure of at least $10 billion.See 12 CFR 217.100(b)(1). Other BHCs include any BHC that is subject to12 CFR 225.8 and is not an advanced approaches BHC.
Projected loan losses, by type of loan, 2014:Q4–2016:Q4
Billions ofdollars
Portfolio lossrates (%)1
Loan losses 1.5 2.3
First-lien mortgages, domestic 0.2 1.0
Junior liens and HELOCs, domestic 0.0 5.6
Commercial and industrial2 0.4 4.4
Commercial real estate, domestic 0.5 10.8
Credit cards 0.0 0.0
Other consumer3 0.1 0.7
Other loans4 0.4 2.4
1 Average loan balances used to calculate portfolio loss rates exclude loans heldfor sale and loans held for investment under the fair-value option and arecalculated over nine quarters.
2 Commercial and industrial loans include small- and medium-enterprise loansand corporate cards.
3 Other consumer loans include student loans and automobile loans.4 Other loans include international real estate loans.
Actual 2014:Q3 and projected 2016:Q4 risk-weightedassets
Actual2014:Q3
Projected 2016:Q4
Generalapproach
Standardizedapproach
Risk-weighted assets(billions of dollars)1 390.6 416.5 489.3
1 For each quarter in 2014, risk-weighted assets are calculated using thegeneral risk-based capital approach set forth in 12 CFR 225, appendix A. Foreach quarter in 2015 and 2016, risk-weighted assets are calculated under theBoard’s standardized capital risk-based approach in 12 CFR 217, subpart D,except for the risk-weighted assets used to calculate the tier 1 common ratio,which uses the general risk-based capital approach for all quarters.
Projected losses, revenue, net income and othercomprehensive income through 2016:Q4
Billions ofdollars
Percent ofaverage assets1
Pre-provision net revenue2 16.6 1.9
Other revenue3 0.0
less
Provisions 2.0
Realized losses/gains on securities (AFS/HTM) 0.1
Trading and counterparty losses4 8.1
Other losses/gains5 1.7
equals
Net income before taxes 4.7 0.5
Memo items
Other comprehensive income6 -3.7
Other effects on capital Actual 2014:Q3 2016:Q4
AOCI included in capital (billions of dollars)7 -0.6 -3.1
1 Average assets is the nine-quarter average of total assets.2 Pre-provision net revenue includes losses from operational-risk events,
mortgage repurchase expenses, and other real estate owned (OREO) costs.3 Other revenue includes one-time income and (expense) items not included in
pre-provision net revenue.4 Trading and counterparty losses include mark-to-market and credit valuation
adjustments (CVA) losses and losses arising from the counterparty defaultscenario component applied to derivatives, securities lending, and repurchaseagreement activities.
5 Other losses/gains includes projected change in fair value of loans held for saleand loans held for investment measured under the fair-value option andgoodwill impairment losses.
6 Other comprehensive income (OCI) is only calculated for advanced approachesBHCs, and other BHCs that opt into the advanced approaches treatment ofAOCI.
7 Certain AOCI items are subject to transition into projected regulatory capital.Those transitions are 20 percent included in projected regulatory capital for2014, 40 percent included in projected regulatory capital for 2015, and60 percent included in projected regulatory capital for 2016.
March 2015 107

Table C.22.A. MUFG Americas Holdings Corporation
Projected stressed capital ratios, risk-weighted assets, losses, revenues, net income beforetaxes, and loan lossesFederal Reserve estimates: Severely adverse scenario
Actual 2014:Q3 projected stressed capital ratios through2016:Q4
Actual2014:Q3
Stressed capital ratios1
Ending Minimum
Tier 1 common ratio (%) 12.7 8.0 8.0
Common equity tier 1 capital ratio (%)2 12.7 8.0 8.0
Tier 1 risk-based capital ratio (%) 12.7 8.0 8.0
Total risk-based capital ratio (%) 14.6 10.2 10.2
Tier 1 leverage ratio (%) 11.4 7.1 7.1
1 The capital ratios are calculated using capital action assumptions providedwithin the Dodd-Frank Act stress testing rule. These projections representhypothetical estimates that involve an economic outcome that is more adversethan expected. These estimates are not forecasts of expected losses, revenues,net income before taxes, or capital ratios. The minimum capital ratio presentedis for the period 2014:Q4 to 2016:Q4.
2 Advanced approaches bank holding companies (BHCs) are subject to thecommon equity tier 1 ratio for the third and fourth quarter of 2014. All bankholding companies are subject to the common equity tier 1 ratio for eachquarter of 2015 and 2016. An advanced approaches BHC includes any BHCthat has consolidated total assets greater than or equal to $250 billion orconsolidated total on-balance sheet foreign exposure of at least $10 billion.See 12 CFR 217.100(b)(1). Other BHCs include any BHC that is subject to12 CFR 225.8 and is not an advanced approaches BHC.
Projected loan losses, by type of loan, 2014:Q4–2016:Q4
Billions ofdollars
Portfolio lossrates (%)1
Loan losses 3.8 5.0
First-lien mortgages, domestic 0.9 3.1
Junior liens and HELOCs, domestic 0.1 4.2
Commercial and industrial2 0.9 4.8
Commercial real estate, domestic 1.4 9.0
Credit cards 0.0 0.0
Other consumer3 0.0 14.7
Other loans4 0.3 4.1
1 Average loan balances used to calculate portfolio loss rates exclude loans heldfor sale and loans held for investment under the fair-value option and arecalculated over nine quarters.
2 Commercial and industrial loans include small- and medium-enterprise loansand corporate cards.
3 Other consumer loans include student loans and automobile loans.4 Other loans include international real estate loans.
Actual 2014:Q3 and projected 2016:Q4 risk-weightedassets
Actual2014:Q3
Projected 2016:Q4
Generalapproach
Standardizedapproach
Risk-weighted assets(billions of dollars)1 96.2 99.3 99.7
1 For each quarter in 2014, risk-weighted assets are calculated using thegeneral risk-based capital approach set forth in 12 CFR 225, appendix A. Foreach quarter in 2015 and 2016, risk-weighted assets are calculated under theBoard’s standardized capital risk-based approach in 12 CFR 217, subpart D,except for the risk-weighted assets used to calculate the tier 1 common ratio,which uses the general risk-based capital approach for all quarters.
Projected losses, revenue, net income and othercomprehensive income through 2016:Q4
Billions ofdollars
Percent ofaverage assets1
Pre-provision net revenue2 1.1 1.0
Other revenue3 0.0
less
Provisions 4.9
Realized losses/gains on securities (AFS/HTM) 0.6
Trading and counterparty losses4 0.0
Other losses/gains5 0.0
equals
Net income before taxes -4.4 -3.8
Memo items
Other comprehensive income6 0.0
Other effects on capital Actual 2014:Q3 2016:Q4
AOCI included in capital (billions of dollars)7 0.4 0.0
1 Average assets is the nine-quarter average of total assets.2 Pre-provision net revenue includes losses from operational-risk events,
mortgage repurchase expenses, and other real estate owned (OREO) costs.3 Other revenue includes one-time income and (expense) items not included in
pre-provision net revenue.4 Trading and counterparty losses include mark-to-market and credit valuation
adjustments (CVA) losses and losses arising from the counterparty defaultscenario component applied to derivatives, securities lending, and repurchaseagreement activities.
5 Other losses/gains includes projected change in fair value of loans held for saleand loans held for investment measured under the fair-value option andgoodwill impairment losses.
6 Other comprehensive income (OCI) is only calculated for advanced approachesBHCs, and other BHCs that opt into the advanced approaches treatment ofAOCI.
7 Certain AOCI items are subject to transition into projected regulatory capital.Those transitions are 20 percent included in projected regulatory capital for2014, 40 percent included in projected regulatory capital for 2015, and60 percent included in projected regulatory capital for 2016.
108 Supervisory Stress Test Methodology and Results

Table C.22.B. MUFG Americas Holdings Corporation
Projected stressed capital ratios, risk-weighted assets, losses, revenues, net income beforetaxes, and loan lossesFederal Reserve estimates: Adverse scenario
Actual 2014:Q3 projected stressed capital ratios through2016:Q4
Actual2014:Q3
Stressed capital ratios1
Ending Minimum
Tier 1 common ratio (%) 12.7 11.3 11.3
Common equity tier 1 capital ratio (%)2 12.7 11.4 11.4
Tier 1 risk-based capital ratio (%) 12.7 11.4 11.4
Total risk-based capital ratio (%) 14.6 13.3 13.3
Tier 1 leverage ratio (%) 11.4 9.8 9.8
1 The capital ratios are calculated using capital action assumptions providedwithin the Dodd-Frank Act stress testing rule. These projections representhypothetical estimates that involve an economic outcome that is more adversethan expected. These estimates are not forecasts of expected losses, revenues,net income before taxes, or capital ratios. The minimum capital ratio presentedis for the period 2014:Q4 to 2016:Q4.
2 Advanced approaches bank holding companies (BHCs) are subject to thecommon equity tier 1 ratio for the third and fourth quarter of 2014. All bankholding companies are subject to the common equity tier 1 ratio for eachquarter of 2015 and 2016. An advanced approaches BHC includes any BHCthat has consolidated total assets greater than or equal to $250 billion orconsolidated total on-balance sheet foreign exposure of at least $10 billion.See 12 CFR 217.100(b)(1). Other BHCs include any BHC that is subject to12 CFR 225.8 and is not an advanced approaches BHC.
Projected loan losses, by type of loan, 2014:Q4–2016:Q4
Billions ofdollars
Portfolio lossrates (%)1
Loan losses 2.1 2.8
First-lien mortgages, domestic 0.6 1.9
Junior liens and HELOCs, domestic 0.1 1.8
Commercial and industrial2 0.5 2.7
Commercial real estate, domestic 0.8 4.9
Credit cards 0.0 0.0
Other consumer3 0.0 11.9
Other loans4 0.2 2.2
1 Average loan balances used to calculate portfolio loss rates exclude loans heldfor sale and loans held for investment under the fair-value option and arecalculated over nine quarters.
2 Commercial and industrial loans include small- and medium-enterprise loansand corporate cards.
3 Other consumer loans include student loans and automobile loans.4 Other loans include international real estate loans.
Actual 2014:Q3 and projected 2016:Q4 risk-weightedassets
Actual2014:Q3
Projected 2016:Q4
Generalapproach
Standardizedapproach
Risk-weighted assets(billions of dollars)1 96.2 103.3 103.1
1 For each quarter in 2014, risk-weighted assets are calculated using thegeneral risk-based capital approach set forth in 12 CFR 225, appendix A. Foreach quarter in 2015 and 2016, risk-weighted assets are calculated under theBoard’s standardized capital risk-based approach in 12 CFR 217, subpart D,except for the risk-weighted assets used to calculate the tier 1 common ratio,which uses the general risk-based capital approach for all quarters.
Projected losses, revenue, net income and othercomprehensive income through 2016:Q4
Billions ofdollars
Percent ofaverage assets1
Pre-provision net revenue2 2.2 1.9
Other revenue3 0.0
less
Provisions 2.6
Realized losses/gains on securities (AFS/HTM) 0.3
Trading and counterparty losses4 0.0
Other losses/gains5 0.0
equals
Net income before taxes -0.7 -0.6
Memo items
Other comprehensive income6 0.0
Other effects on capital Actual 2014:Q3 2016:Q4
AOCI included in capital (billions of dollars)7 0.4 0.0
1 Average assets is the nine-quarter average of total assets.2 Pre-provision net revenue includes losses from operational-risk events,
mortgage repurchase expenses, and other real estate owned (OREO) costs.3 Other revenue includes one-time income and (expense) items not included in
pre-provision net revenue.4 Trading and counterparty losses include mark-to-market and credit valuation
adjustments (CVA) losses and losses arising from the counterparty defaultscenario component applied to derivatives, securities lending, and repurchaseagreement activities.
5 Other losses/gains includes projected change in fair value of loans held for saleand loans held for investment measured under the fair-value option andgoodwill impairment losses.
6 Other comprehensive income (OCI) is only calculated for advanced approachesBHCs, and other BHCs that opt into the advanced approaches treatment ofAOCI.
7 Certain AOCI items are subject to transition into projected regulatory capital.Those transitions are 20 percent included in projected regulatory capital for2014, 40 percent included in projected regulatory capital for 2015, and60 percent included in projected regulatory capital for 2016.
March 2015 109

Table C.23.A. Northern Trust Corporation
Projected stressed capital ratios, risk-weighted assets, losses, revenues, net income beforetaxes, and loan lossesFederal Reserve estimates: Severely adverse scenario
Actual 2014:Q3 projected stressed capital ratios through2016:Q4
Actual2014:Q3
Stressed capital ratios1
Ending Minimum
Tier 1 common ratio (%) 12.8 12.4 12.3
Common equity tier 1 capital ratio (%)2 12.8 10.9 10.8
Tier 1 risk-based capital ratio (%) 13.6 11.4 11.3
Total risk-based capital ratio (%) 16.0 13.6 13.6
Tier 1 leverage ratio (%) 7.9 7.4 7.4
1 The capital ratios are calculated using capital action assumptions providedwithin the Dodd-Frank Act stress testing rule. These projections representhypothetical estimates that involve an economic outcome that is more adversethan expected. These estimates are not forecasts of expected losses, revenues,net income before taxes, or capital ratios. The minimum capital ratio presentedis for the period 2014:Q4 to 2016:Q4.
2 Advanced approaches bank holding companies (BHCs) are subject to thecommon equity tier 1 ratio for the third and fourth quarter of 2014. All bankholding companies are subject to the common equity tier 1 ratio for eachquarter of 2015 and 2016. An advanced approaches BHC includes any BHCthat has consolidated total assets greater than or equal to $250 billion orconsolidated total on-balance sheet foreign exposure of at least $10 billion.See 12 CFR 217.100(b)(1). Other BHCs include any BHC that is subject to12 CFR 225.8 and is not an advanced approaches BHC.
Projected loan losses, by type of loan, 2014:Q4–2016:Q4
Billions ofdollars
Portfolio lossrates (%)1
Loan losses 1.5 4.9
First-lien mortgages, domestic 0.3 3.5
Junior liens and HELOCs, domestic 0.3 13.0
Commercial and industrial2 0.2 4.0
Commercial real estate, domestic 0.3 8.5
Credit cards 0.0 0.0
Other consumer3 0.0 13.1
Other loans4 0.4 3.7
1 Average loan balances used to calculate portfolio loss rates exclude loans heldfor sale and loans held for investment under the fair-value option and arecalculated over nine quarters.
2 Commercial and industrial loans include small- and medium-enterprise loansand corporate cards.
3 Other consumer loans include student loans and automobile loans.4 Other loans include international real estate loans.
Actual 2014:Q3 and projected 2016:Q4 risk-weightedassets
Actual2014:Q3
Projected 2016:Q4
Generalapproach
Standardizedapproach
Risk-weighted assets(billions of dollars)1 61.0 63.5 72.0
1 For each quarter in 2014, risk-weighted assets are calculated using thegeneral risk-based capital approach set forth in 12 CFR 225, appendix A. Foreach quarter in 2015 and 2016, risk-weighted assets are calculated under theBoard’s standardized capital risk-based approach in 12 CFR 217, subpart D,except for the risk-weighted assets used to calculate the tier 1 common ratio,which uses the general risk-based capital approach for all quarters.
Projected losses, revenue, net income and othercomprehensive income through 2016:Q4
Billions ofdollars
Percent ofaverage assets1
Pre-provision net revenue2 3.2 2.8
Other revenue3 0.0
less
Provisions 1.9
Realized losses/gains on securities (AFS/HTM) 0.0
Trading and counterparty losses4 0.0
Other losses/gains5 0.0
equals
Net income before taxes 1.3 1.1
Memo items
Other comprehensive income6 0.1
Other effects on capital Actual 2014:Q3 2016:Q4
AOCI included in capital (billions of dollars)7 0.0 -0.1
1 Average assets is the nine-quarter average of total assets.2 Pre-provision net revenue includes losses from operational-risk events,
mortgage repurchase expenses, and other real estate owned (OREO) costs.3 Other revenue includes one-time income and (expense) items not included in
pre-provision net revenue.4 Trading and counterparty losses include mark-to-market and credit valuation
adjustments (CVA) losses and losses arising from the counterparty defaultscenario component applied to derivatives, securities lending, and repurchaseagreement activities.
5 Other losses/gains includes projected change in fair value of loans held for saleand loans held for investment measured under the fair-value option andgoodwill impairment losses.
6 Other comprehensive income (OCI) is only calculated for advanced approachesBHCs, and other BHCs that opt into the advanced approaches treatment ofAOCI.
7 Certain AOCI items are subject to transition into projected regulatory capital.Those transitions are 20 percent included in projected regulatory capital for2014, 40 percent included in projected regulatory capital for 2015, and60 percent included in projected regulatory capital for 2016.
110 Supervisory Stress Test Methodology and Results

Table C.23.B. Northern Trust Corporation
Projected stressed capital ratios, risk-weighted assets, losses, revenues, net income beforetaxes, and loan lossesFederal Reserve estimates: Adverse scenario
Actual 2014:Q3 projected stressed capital ratios through2016:Q4
Actual2014:Q3
Stressed capital ratios1
Ending Minimum
Tier 1 common ratio (%) 12.8 14.3 12.5
Common equity tier 1 capital ratio (%)2 12.8 11.7 10.9
Tier 1 risk-based capital ratio (%) 13.6 12.2 11.5
Total risk-based capital ratio (%) 16.0 14.0 13.5
Tier 1 leverage ratio (%) 7.9 7.8 7.4
1 The capital ratios are calculated using capital action assumptions providedwithin the Dodd-Frank Act stress testing rule. These projections representhypothetical estimates that involve an economic outcome that is more adversethan expected. These estimates are not forecasts of expected losses, revenues,net income before taxes, or capital ratios. The minimum capital ratio presentedis for the period 2014:Q4 to 2016:Q4.
2 Advanced approaches bank holding companies (BHCs) are subject to thecommon equity tier 1 ratio for the third and fourth quarter of 2014. All bankholding companies are subject to the common equity tier 1 ratio for eachquarter of 2015 and 2016. An advanced approaches BHC includes any BHCthat has consolidated total assets greater than or equal to $250 billion orconsolidated total on-balance sheet foreign exposure of at least $10 billion.See 12 CFR 217.100(b)(1). Other BHCs include any BHC that is subject to12 CFR 225.8 and is not an advanced approaches BHC.
Projected loan losses, by type of loan, 2014:Q4–2016:Q4
Billions ofdollars
Portfolio lossrates (%)1
Loan losses 1.0 3.1
First-lien mortgages, domestic 0.2 2.6
Junior liens and HELOCs, domestic 0.2 9.1
Commercial and industrial2 0.1 2.2
Commercial real estate, domestic 0.2 5.0
Credit cards 0.0 0.0
Other consumer3 0.0 10.4
Other loans4 0.2 2.0
1 Average loan balances used to calculate portfolio loss rates exclude loans heldfor sale and loans held for investment under the fair-value option and arecalculated over nine quarters.
2 Commercial and industrial loans include small- and medium-enterprise loansand corporate cards.
3 Other consumer loans include student loans and automobile loans.4 Other loans include international real estate loans.
Actual 2014:Q3 and projected 2016:Q4 risk-weightedassets
Actual2014:Q3
Projected 2016:Q4
Generalapproach
Standardizedapproach
Risk-weighted assets(billions of dollars)1 61.0 66.2 74.7
1 For each quarter in 2014, risk-weighted assets are calculated using thegeneral risk-based capital approach set forth in 12 CFR 225, appendix A. Foreach quarter in 2015 and 2016, risk-weighted assets are calculated under theBoard’s standardized capital risk-based approach in 12 CFR 217, subpart D,except for the risk-weighted assets used to calculate the tier 1 common ratio,which uses the general risk-based capital approach for all quarters.
Projected losses, revenue, net income and othercomprehensive income through 2016:Q4
Billions ofdollars
Percent ofaverage assets1
Pre-provision net revenue2 4.8 4.1
Other revenue3 0.0
less
Provisions 1.1
Realized losses/gains on securities (AFS/HTM) 0.0
Trading and counterparty losses4 0.0
Other losses/gains5 0.0
equals
Net income before taxes 3.7 3.1
Memo items
Other comprehensive income6 -1.0
Other effects on capital Actual 2014:Q3 2016:Q4
AOCI included in capital (billions of dollars)7 0.0 -0.8
1 Average assets is the nine-quarter average of total assets.2 Pre-provision net revenue includes losses from operational-risk events,
mortgage repurchase expenses, and other real estate owned (OREO) costs.3 Other revenue includes one-time income and (expense) items not included in
pre-provision net revenue.4 Trading and counterparty losses include mark-to-market and credit valuation
adjustments (CVA) losses and losses arising from the counterparty defaultscenario component applied to derivatives, securities lending, and repurchaseagreement activities.
5 Other losses/gains includes projected change in fair value of loans held for saleand loans held for investment measured under the fair-value option andgoodwill impairment losses.
6 Other comprehensive income (OCI) is only calculated for advanced approachesBHCs, and other BHCs that opt into the advanced approaches treatment ofAOCI.
7 Certain AOCI items are subject to transition into projected regulatory capital.Those transitions are 20 percent included in projected regulatory capital for2014, 40 percent included in projected regulatory capital for 2015, and60 percent included in projected regulatory capital for 2016.
March 2015 111

Table C.24.A. The PNC Financial Services Group, Inc.
Projected stressed capital ratios, risk-weighted assets, losses, revenues, net income beforetaxes, and loan lossesFederal Reserve estimates: Severely adverse scenario
Actual 2014:Q3 projected stressed capital ratios through2016:Q4
Actual2014:Q3
Stressed capital ratios1
Ending Minimum
Tier 1 common ratio (%) 11.0 9.5 9.5
Common equity tier 1 capital ratio (%)2 11.1 8.4 8.4
Tier 1 risk-based capital ratio (%) 12.8 9.9 9.9
Total risk-based capital ratio (%) 16.1 12.5 12.5
Tier 1 leverage ratio (%) 11.1 8.7 8.7
1 The capital ratios are calculated using capital action assumptions providedwithin the Dodd-Frank Act stress testing rule. These projections representhypothetical estimates that involve an economic outcome that is more adversethan expected. These estimates are not forecasts of expected losses, revenues,net income before taxes, or capital ratios. The minimum capital ratio presentedis for the period 2014:Q4 to 2016:Q4.
2 Advanced approaches bank holding companies (BHCs) are subject to thecommon equity tier 1 ratio for the third and fourth quarter of 2014. All bankholding companies are subject to the common equity tier 1 ratio for eachquarter of 2015 and 2016. An advanced approaches BHC includes any BHCthat has consolidated total assets greater than or equal to $250 billion orconsolidated total on-balance sheet foreign exposure of at least $10 billion.See 12 CFR 217.100(b)(1). Other BHCs include any BHC that is subject to12 CFR 225.8 and is not an advanced approaches BHC.
Projected loan losses, by type of loan, 2014:Q4–2016:Q4
Billions ofdollars
Portfolio lossrates (%)1
Loan losses 9.6 4.7
First-lien mortgages, domestic 0.4 1.7
Junior liens and HELOCs, domestic 0.7 3.0
Commercial and industrial2 3.7 5.7
Commercial real estate, domestic 3.1 9.3
Credit cards 0.5 12.1
Other consumer3 0.8 3.2
Other loans4 0.4 1.5
1 Average loan balances used to calculate portfolio loss rates exclude loans heldfor sale and loans held for investment under the fair-value option and arecalculated over nine quarters.
2 Commercial and industrial loans include small- and medium-enterprise loansand corporate cards.
3 Other consumer loans include student loans and automobile loans.4 Other loans include international real estate loans.
Actual 2014:Q3 and projected 2016:Q4 risk-weightedassets
Actual2014:Q3
Projected 2016:Q4
Generalapproach
Standardizedapproach
Risk-weighted assets(billions of dollars)1 277.3 287.3 301.1
1 For each quarter in 2014, risk-weighted assets are calculated using thegeneral risk-based capital approach set forth in 12 CFR 225, appendix A. Foreach quarter in 2015 and 2016, risk-weighted assets are calculated under theBoard’s standardized capital risk-based approach in 12 CFR 217, subpart D,except for the risk-weighted assets used to calculate the tier 1 common ratio,which uses the general risk-based capital approach for all quarters.
Projected losses, revenue, net income and othercomprehensive income through 2016:Q4
Billions ofdollars
Percent ofaverage assets1
Pre-provision net revenue2 11.5 3.3
Other revenue3 0.0
less
Provisions 10.8
Realized losses/gains on securities (AFS/HTM) 0.5
Trading and counterparty losses4 0.0
Other losses/gains5 0.4
equals
Net income before taxes -0.2 -0.1
Memo items
Other comprehensive income6 -0.9
Other effects on capital Actual 2014:Q3 2016:Q4
AOCI included in capital (billions of dollars)7 0.1 -0.3
1 Average assets is the nine-quarter average of total assets.2 Pre-provision net revenue includes losses from operational-risk events,
mortgage repurchase expenses, and other real estate owned (OREO) costs.3 Other revenue includes one-time income and (expense) items not included in
pre-provision net revenue.4 Trading and counterparty losses include mark-to-market and credit valuation
adjustments (CVA) losses and losses arising from the counterparty defaultscenario component applied to derivatives, securities lending, and repurchaseagreement activities.
5 Other losses/gains includes projected change in fair value of loans held for saleand loans held for investment measured under the fair-value option andgoodwill impairment losses.
6 Other comprehensive income (OCI) is only calculated for advanced approachesBHCs, and other BHCs that opt into the advanced approaches treatment ofAOCI.
7 Certain AOCI items are subject to transition into projected regulatory capital.Those transitions are 20 percent included in projected regulatory capital for2014, 40 percent included in projected regulatory capital for 2015, and60 percent included in projected regulatory capital for 2016.
112 Supervisory Stress Test Methodology and Results

Table C.24.B. The PNC Financial Services Group, Inc.
Projected stressed capital ratios, risk-weighted assets, losses, revenues, net income beforetaxes, and loan lossesFederal Reserve estimates: Adverse scenario
Actual 2014:Q3 projected stressed capital ratios through2016:Q4
Actual2014:Q3
Stressed capital ratios1
Ending Minimum
Tier 1 common ratio (%) 11.0 11.2 10.7
Common equity tier 1 capital ratio (%)2 11.1 9.8 9.5
Tier 1 risk-based capital ratio (%) 12.8 11.1 10.9
Total risk-based capital ratio (%) 16.1 13.5 13.5
Tier 1 leverage ratio (%) 11.1 9.7 9.6
1 The capital ratios are calculated using capital action assumptions providedwithin the Dodd-Frank Act stress testing rule. These projections representhypothetical estimates that involve an economic outcome that is more adversethan expected. These estimates are not forecasts of expected losses, revenues,net income before taxes, or capital ratios. The minimum capital ratio presentedis for the period 2014:Q4 to 2016:Q4.
2 Advanced approaches bank holding companies (BHCs) are subject to thecommon equity tier 1 ratio for the third and fourth quarter of 2014. All bankholding companies are subject to the common equity tier 1 ratio for eachquarter of 2015 and 2016. An advanced approaches BHC includes any BHCthat has consolidated total assets greater than or equal to $250 billion orconsolidated total on-balance sheet foreign exposure of at least $10 billion.See 12 CFR 217.100(b)(1). Other BHCs include any BHC that is subject to12 CFR 225.8 and is not an advanced approaches BHC.
Projected loan losses, by type of loan, 2014:Q4–2016:Q4
Billions ofdollars
Portfolio lossrates (%)1
Loan losses 6.1 2.9
First-lien mortgages, domestic 0.3 1.0
Junior liens and HELOCs, domestic 0.4 1.8
Commercial and industrial2 2.3 3.4
Commercial real estate, domestic 1.8 5.5
Credit cards 0.4 9.5
Other consumer3 0.6 2.6
Other loans4 0.3 0.9
1 Average loan balances used to calculate portfolio loss rates exclude loans heldfor sale and loans held for investment under the fair-value option and arecalculated over nine quarters.
2 Commercial and industrial loans include small- and medium-enterprise loansand corporate cards.
3 Other consumer loans include student loans and automobile loans.4 Other loans include international real estate loans.
Actual 2014:Q3 and projected 2016:Q4 risk-weightedassets
Actual2014:Q3
Projected 2016:Q4
Generalapproach
Standardizedapproach
Risk-weighted assets(billions of dollars)1 277.3 298.9 311.6
1 For each quarter in 2014, risk-weighted assets are calculated using thegeneral risk-based capital approach set forth in 12 CFR 225, appendix A. Foreach quarter in 2015 and 2016, risk-weighted assets are calculated under theBoard’s standardized capital risk-based approach in 12 CFR 217, subpart D,except for the risk-weighted assets used to calculate the tier 1 common ratio,which uses the general risk-based capital approach for all quarters.
Projected losses, revenue, net income and othercomprehensive income through 2016:Q4
Billions ofdollars
Percent ofaverage assets1
Pre-provision net revenue2 15.8 4.5
Other revenue3 0.0
less
Provisions 6.0
Realized losses/gains on securities (AFS/HTM) 0.2
Trading and counterparty losses4 0.0
Other losses/gains5 0.3
equals
Net income before taxes 9.3 2.6
Memo items
Other comprehensive income6 -3.4
Other effects on capital Actual 2014:Q3 2016:Q4
AOCI included in capital (billions of dollars)7 0.1 -1.8
1 Average assets is the nine-quarter average of total assets.2 Pre-provision net revenue includes losses from operational-risk events,
mortgage repurchase expenses, and other real estate owned (OREO) costs.3 Other revenue includes one-time income and (expense) items not included in
pre-provision net revenue.4 Trading and counterparty losses include mark-to-market and credit valuation
adjustments (CVA) losses and losses arising from the counterparty defaultscenario component applied to derivatives, securities lending, and repurchaseagreement activities.
5 Other losses/gains includes projected change in fair value of loans held for saleand loans held for investment measured under the fair-value option andgoodwill impairment losses.
6 Other comprehensive income (OCI) is only calculated for advanced approachesBHCs, and other BHCs that opt into the advanced approaches treatment ofAOCI.
7 Certain AOCI items are subject to transition into projected regulatory capital.Those transitions are 20 percent included in projected regulatory capital for2014, 40 percent included in projected regulatory capital for 2015, and60 percent included in projected regulatory capital for 2016.
March 2015 113
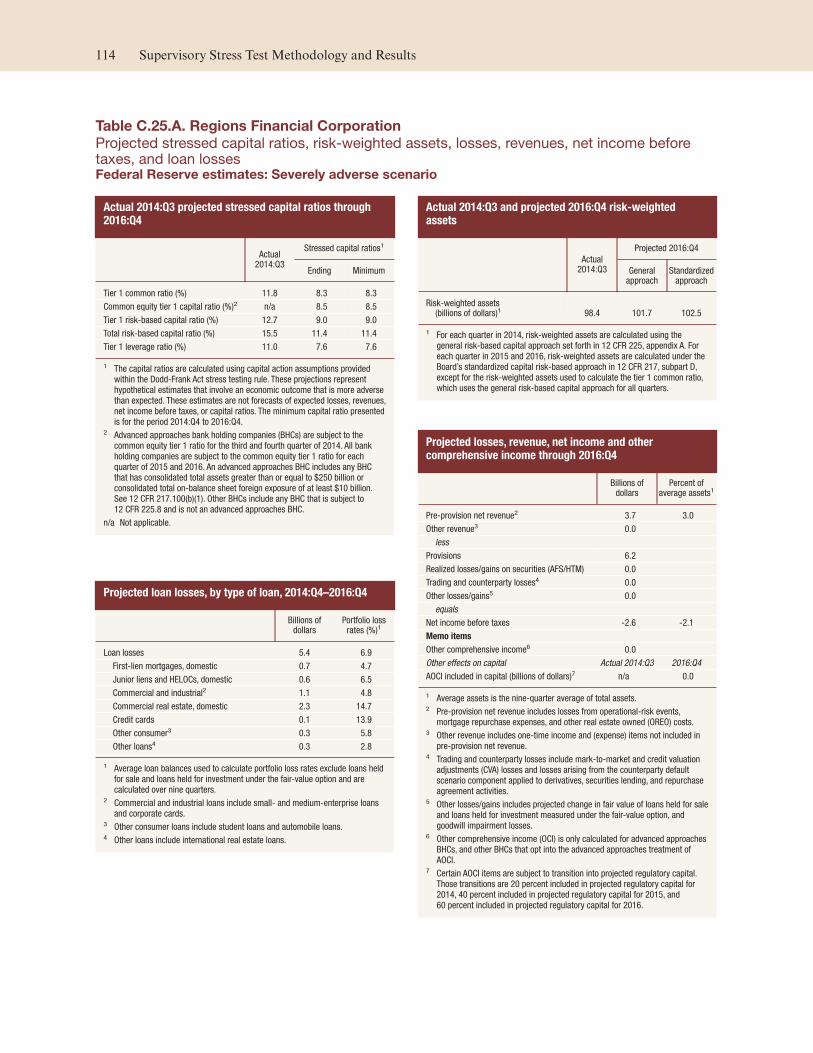
Table C.25.A. Regions Financial Corporation
Projected stressed capital ratios, risk-weighted assets, losses, revenues, net income beforetaxes, and loan lossesFederal Reserve estimates: Severely adverse scenario
Actual 2014:Q3 projected stressed capital ratios through2016:Q4
Actual2014:Q3
Stressed capital ratios1
Ending Minimum
Tier 1 common ratio (%) 11.8 8.3 8.3
Common equity tier 1 capital ratio (%)2 n/a 8.5 8.5
Tier 1 risk-based capital ratio (%) 12.7 9.0 9.0
Total risk-based capital ratio (%) 15.5 11.4 11.4
Tier 1 leverage ratio (%) 11.0 7.6 7.6
1 The capital ratios are calculated using capital action assumptions providedwithin the Dodd-Frank Act stress testing rule. These projections representhypothetical estimates that involve an economic outcome that is more adversethan expected. These estimates are not forecasts of expected losses, revenues,net income before taxes, or capital ratios. The minimum capital ratio presentedis for the period 2014:Q4 to 2016:Q4.
2 Advanced approaches bank holding companies (BHCs) are subject to thecommon equity tier 1 ratio for the third and fourth quarter of 2014. All bankholding companies are subject to the common equity tier 1 ratio for eachquarter of 2015 and 2016. An advanced approaches BHC includes any BHCthat has consolidated total assets greater than or equal to $250 billion orconsolidated total on-balance sheet foreign exposure of at least $10 billion.See 12 CFR 217.100(b)(1). Other BHCs include any BHC that is subject to12 CFR 225.8 and is not an advanced approaches BHC.
n/a Not applicable.
Projected loan losses, by type of loan, 2014:Q4–2016:Q4
Billions ofdollars
Portfolio lossrates (%)1
Loan losses 5.4 6.9
First-lien mortgages, domestic 0.7 4.7
Junior liens and HELOCs, domestic 0.6 6.5
Commercial and industrial2 1.1 4.8
Commercial real estate, domestic 2.3 14.7
Credit cards 0.1 13.9
Other consumer3 0.3 5.8
Other loans4 0.3 2.8
1 Average loan balances used to calculate portfolio loss rates exclude loans heldfor sale and loans held for investment under the fair-value option and arecalculated over nine quarters.
2 Commercial and industrial loans include small- and medium-enterprise loansand corporate cards.
3 Other consumer loans include student loans and automobile loans.4 Other loans include international real estate loans.
Actual 2014:Q3 and projected 2016:Q4 risk-weightedassets
Actual2014:Q3
Projected 2016:Q4
Generalapproach
Standardizedapproach
Risk-weighted assets(billions of dollars)1 98.4 101.7 102.5
1 For each quarter in 2014, risk-weighted assets are calculated using thegeneral risk-based capital approach set forth in 12 CFR 225, appendix A. Foreach quarter in 2015 and 2016, risk-weighted assets are calculated under theBoard’s standardized capital risk-based approach in 12 CFR 217, subpart D,except for the risk-weighted assets used to calculate the tier 1 common ratio,which uses the general risk-based capital approach for all quarters.
Projected losses, revenue, net income and othercomprehensive income through 2016:Q4
Billions ofdollars
Percent ofaverage assets1
Pre-provision net revenue2 3.7 3.0
Other revenue3 0.0
less
Provisions 6.2
Realized losses/gains on securities (AFS/HTM) 0.0
Trading and counterparty losses4 0.0
Other losses/gains5 0.0
equals
Net income before taxes -2.6 -2.1
Memo items
Other comprehensive income6 0.0
Other effects on capital Actual 2014:Q3 2016:Q4
AOCI included in capital (billions of dollars)7 n/a 0.0
1 Average assets is the nine-quarter average of total assets.2 Pre-provision net revenue includes losses from operational-risk events,
mortgage repurchase expenses, and other real estate owned (OREO) costs.3 Other revenue includes one-time income and (expense) items not included in
pre-provision net revenue.4 Trading and counterparty losses include mark-to-market and credit valuation
adjustments (CVA) losses and losses arising from the counterparty defaultscenario component applied to derivatives, securities lending, and repurchaseagreement activities.
5 Other losses/gains includes projected change in fair value of loans held for saleand loans held for investment measured under the fair-value option, andgoodwill impairment losses.
6 Other comprehensive income (OCI) is only calculated for advanced approachesBHCs, and other BHCs that opt into the advanced approaches treatment ofAOCI.
7 Certain AOCI items are subject to transition into projected regulatory capital.Those transitions are 20 percent included in projected regulatory capital for2014, 40 percent included in projected regulatory capital for 2015, and60 percent included in projected regulatory capital for 2016.
114 Supervisory Stress Test Methodology and Results

Table C.25.B. Regions Financial Corporation
Projected stressed capital ratios, risk-weighted assets, losses, revenues, net income beforetaxes, and loan lossesFederal Reserve estimates: Adverse scenario
Actual 2014:Q3 projected stressed capital ratios through2016:Q4
Actual2014:Q3
Stressed capital ratios1
Ending Minimum
Tier 1 common ratio (%) 11.8 10.7 10.6
Common equity tier 1 capital ratio (%)2 n/a 10.7 10.7
Tier 1 risk-based capital ratio (%) 12.7 11.4 11.4
Total risk-based capital ratio (%) 15.5 13.8 13.7
Tier 1 leverage ratio (%) 11.0 9.5 9.5
1 The capital ratios are calculated using capital action assumptions providedwithin the Dodd-Frank Act stress testing rule. These projections representhypothetical estimates that involve an economic outcome that is more adversethan expected. These estimates are not forecasts of expected losses, revenues,net income before taxes, or capital ratios. The minimum capital ratio presentedis for the period 2014:Q4 to 2016:Q4.
2 Advanced approaches bank holding companies (BHCs) are subject to thecommon equity tier 1 ratio for the third and fourth quarter of 2014. All bankholding companies are subject to the common equity tier 1 ratio for eachquarter of 2015 and 2016. An advanced approaches BHC includes any BHCthat has consolidated total assets greater than or equal to $250 billion orconsolidated total on-balance sheet foreign exposure of at least $10 billion.See 12 CFR 217.100(b)(1). Other BHCs include any BHC that is subject to12 CFR 225.8 and is not an advanced approaches BHC.
n/a Not applicable.
Projected loan losses, by type of loan, 2014:Q4–2016:Q4
Billions ofdollars
Portfolio lossrates (%)1
Loan losses 3.6 4.5
First-lien mortgages, domestic 0.6 4.0
Junior liens and HELOCs, domestic 0.4 4.8
Commercial and industrial2 0.6 2.8
Commercial real estate, domestic 1.4 8.9
Credit cards 0.1 11.0
Other consumer3 0.2 4.4
Other loans4 0.2 1.7
1 Average loan balances used to calculate portfolio loss rates exclude loans heldfor sale and loans held for investment under the fair-value option and arecalculated over nine quarters.
2 Commercial and industrial loans include small- and medium-enterprise loansand corporate cards.
3 Other consumer loans include student loans and automobile loans.4 Other loans include international real estate loans.
Actual 2014:Q3 and projected 2016:Q4 risk-weightedassets
Actual2014:Q3
Projected 2016:Q4
Generalapproach
Standardizedapproach
Risk-weighted assets(billions of dollars)1 98.4 105.4 105.4
1 For each quarter in 2014, risk-weighted assets are calculated using thegeneral risk-based capital approach set forth in 12 CFR 225, appendix A. Foreach quarter in 2015 and 2016, risk-weighted assets are calculated under theBoard’s standardized capital risk-based approach in 12 CFR 217, subpart D,except for the risk-weighted assets used to calculate the tier 1 common ratio,which uses the general risk-based capital approach for all quarters.
Projected losses, revenue, net income and othercomprehensive income through 2016:Q4
Billions ofdollars
Percent ofaverage assets1
Pre-provision net revenue2 4.9 3.9
Other revenue3 0.0
less
Provisions 3.9
Realized losses/gains on securities (AFS/HTM) 0.0
Trading and counterparty losses4 0.0
Other losses/gains5 0.0
equals
Net income before taxes 1.0 0.8
Memo items
Other comprehensive income6 0.0
Other effects on capital Actual 2014:Q3 2016:Q4
AOCI included in capital (billions of dollars)7 n/a 0.0
1 Average assets is the nine-quarter average of total assets.2 Pre-provision net revenue includes losses from operational-risk events,
mortgage repurchase expenses, and other real estate owned (OREO) costs.3 Other revenue includes one-time income and (expense) items not included in
pre-provision net revenue.4 Trading and counterparty losses include mark-to-market and credit valuation
adjustments (CVA) losses and losses arising from the counterparty defaultscenario component applied to derivatives, securities lending, and repurchaseagreement activities.
5 Other losses/gains includes projected change in fair value of loans held for saleand loans held for investment measured under the fair-value option, andgoodwill impairment losses.
6 Other comprehensive income (OCI) is only calculated for advanced approachesBHCs, and other BHCs that opt into the advanced approaches treatment ofAOCI.
7 Certain AOCI items are subject to transition into projected regulatory capital.Those transitions are 20 percent included in projected regulatory capital for2014, 40 percent included in projected regulatory capital for 2015, and60 percent included in projected regulatory capital for 2016.
March 2015 115

Table C.26.A. Santander Holdings USA, Inc.
Projected stressed capital ratios, risk-weighted assets, losses, revenues, net income beforetaxes, and loan lossesFederal Reserve estimates: Severely adverse scenario
Actual 2014:Q3 projected stressed capital ratios through2016:Q4
Actual2014:Q3
Stressed capital ratios1
Ending Minimum
Tier 1 common ratio (%) 11.0 9.4 9.4
Common equity tier 1 capital ratio (%)2 n/a 10.3 10.3
Tier 1 risk-based capital ratio (%) 13.1 10.7 10.7
Total risk-based capital ratio (%) 15.0 12.5 12.5
Tier 1 leverage ratio (%) 12.3 9.6 9.6
1 The capital ratios are calculated using capital action assumptions providedwithin the Dodd-Frank Act stress testing rule. These projections representhypothetical estimates that involve an economic outcome that is more adversethan expected. These estimates are not forecasts of expected losses, revenues,net income before taxes, or capital ratios. The minimum capital ratio presentedis for the period 2014:Q4 to 2016:Q4.
2 Advanced approaches bank holding companies (BHCs) are subject to thecommon equity tier 1 ratio for the third and fourth quarter of 2014. All bankholding companies are subject to the common equity tier 1 ratio for eachquarter of 2015 and 2016. An advanced approaches BHC includes any BHCthat has consolidated total assets greater than or equal to $250 billion orconsolidated total on-balance sheet foreign exposure of at least $10 billion.See 12 CFR 217.100(b)(1). Other BHCs include any BHC that is subject to12 CFR 225.8 and is not an advanced approaches BHC.
n/a Not applicable.
Projected loan losses, by type of loan, 2014:Q4–2016:Q4
Billions ofdollars
Portfolio lossrates (%)1
Loan losses 7.2 9.6
First-lien mortgages, domestic 0.4 4.5
Junior liens and HELOCs, domestic 0.3 4.5
Commercial and industrial2 0.6 3.6
Commercial real estate, domestic 1.6 9.0
Credit cards 0.0 14.7
Other consumer3 4.2 17.2
Other loans4 0.1 3.8
1 Average loan balances used to calculate portfolio loss rates exclude loans heldfor sale and loans held for investment under the fair-value option and arecalculated over nine quarters.
2 Commercial and industrial loans include small- and medium-enterprise loansand corporate cards.
3 Other consumer loans include student loans and automobile loans.4 Other loans include international real estate loans.
Actual 2014:Q3 and projected 2016:Q4 risk-weightedassets
Actual2014:Q3
Projected 2016:Q4
Generalapproach
Standardizedapproach
Risk-weighted assets(billions of dollars)1 97.0 99.2 102.2
1 For each quarter in 2014, risk-weighted assets are calculated using thegeneral risk-based capital approach set forth in 12 CFR 225, appendix A. Foreach quarter in 2015 and 2016, risk-weighted assets are calculated under theBoard’s standardized capital risk-based approach in 12 CFR 217, subpart D,except for the risk-weighted assets used to calculate the tier 1 common ratio,which uses the general risk-based capital approach for all quarters.
Projected losses, revenue, net income and othercomprehensive income through 2016:Q4
Billions ofdollars
Percent ofaverage assets1
Pre-provision net revenue2 6.2 5.2
Other revenue3 0.0
less
Provisions 8.1
Realized losses/gains on securities (AFS/HTM) 0.1
Trading and counterparty losses4 0.0
Other losses/gains5 0.1
equals
Net income before taxes -2.1 -1.8
Memo items
Other comprehensive income6 0.0
Other effects on capital Actual 2014:Q3 2016:Q4
AOCI included in capital (billions of dollars)7 n/a 0.0
1 Average assets is the nine-quarter average of total assets.2 Pre-provision net revenue includes losses from operational-risk events,
mortgage repurchase expenses, and other real estate owned (OREO) costs.3 Other revenue includes one-time income and (expense) items not included in
pre-provision net revenue.4 Trading and counterparty losses include mark-to-market and credit valuation
adjustments (CVA) losses and losses arising from the counterparty defaultscenario component applied to derivatives, securities lending, and repurchaseagreement activities.
5 Other losses/gains includes projected change in fair value of loans held for saleand loans held for investment measured under the fair-value option, andgoodwill impairment losses.
6 Other comprehensive income (OCI) is only calculated for advanced approachesBHCs, and other BHCs that opt into the advanced approaches treatment ofAOCI.
7 Certain AOCI items are subject to transition into projected regulatory capital.Those transitions are 20 percent included in projected regulatory capital for2014, 40 percent included in projected regulatory capital for 2015, and60 percent included in projected regulatory capital for 2016.
116 Supervisory Stress Test Methodology and Results
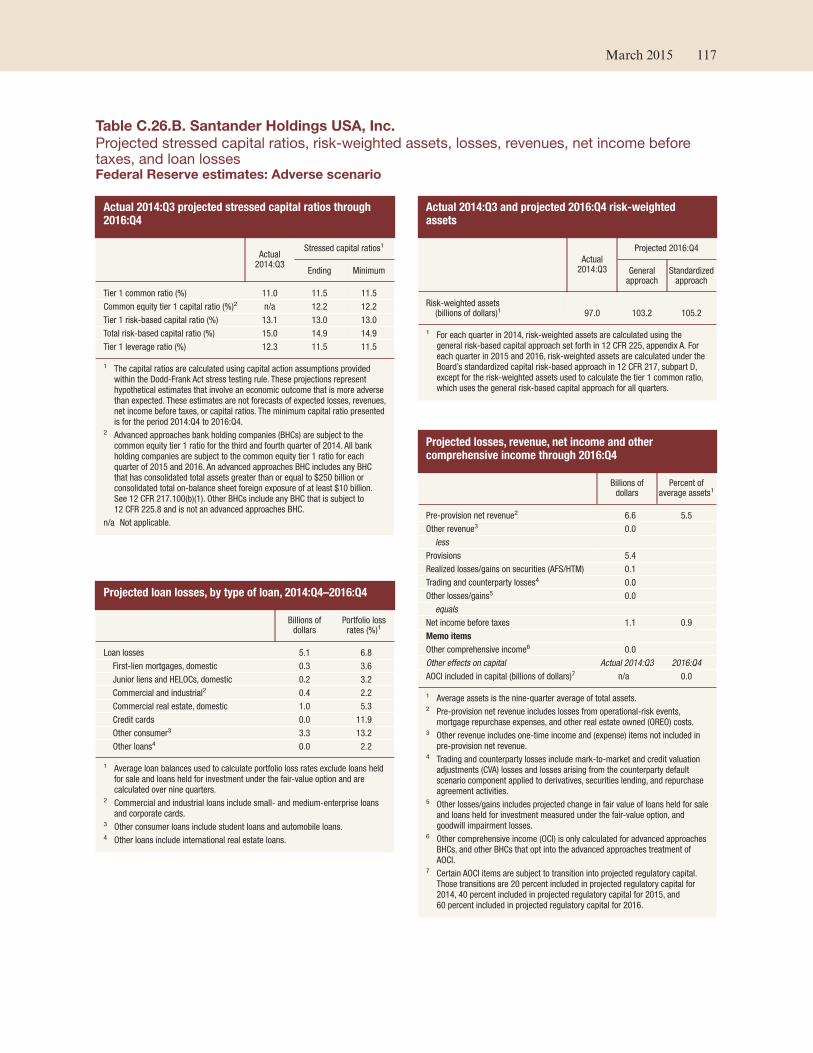
Table C.26.B. Santander Holdings USA, Inc.
Projected stressed capital ratios, risk-weighted assets, losses, revenues, net income beforetaxes, and loan lossesFederal Reserve estimates: Adverse scenario
Actual 2014:Q3 projected stressed capital ratios through2016:Q4
Actual2014:Q3
Stressed capital ratios1
Ending Minimum
Tier 1 common ratio (%) 11.0 11.5 11.5
Common equity tier 1 capital ratio (%)2 n/a 12.2 12.2
Tier 1 risk-based capital ratio (%) 13.1 13.0 13.0
Total risk-based capital ratio (%) 15.0 14.9 14.9
Tier 1 leverage ratio (%) 12.3 11.5 11.5
1 The capital ratios are calculated using capital action assumptions providedwithin the Dodd-Frank Act stress testing rule. These projections representhypothetical estimates that involve an economic outcome that is more adversethan expected. These estimates are not forecasts of expected losses, revenues,net income before taxes, or capital ratios. The minimum capital ratio presentedis for the period 2014:Q4 to 2016:Q4.
2 Advanced approaches bank holding companies (BHCs) are subject to thecommon equity tier 1 ratio for the third and fourth quarter of 2014. All bankholding companies are subject to the common equity tier 1 ratio for eachquarter of 2015 and 2016. An advanced approaches BHC includes any BHCthat has consolidated total assets greater than or equal to $250 billion orconsolidated total on-balance sheet foreign exposure of at least $10 billion.See 12 CFR 217.100(b)(1). Other BHCs include any BHC that is subject to12 CFR 225.8 and is not an advanced approaches BHC.
n/a Not applicable.
Projected loan losses, by type of loan, 2014:Q4–2016:Q4
Billions ofdollars
Portfolio lossrates (%)1
Loan losses 5.1 6.8
First-lien mortgages, domestic 0.3 3.6
Junior liens and HELOCs, domestic 0.2 3.2
Commercial and industrial2 0.4 2.2
Commercial real estate, domestic 1.0 5.3
Credit cards 0.0 11.9
Other consumer3 3.3 13.2
Other loans4 0.0 2.2
1 Average loan balances used to calculate portfolio loss rates exclude loans heldfor sale and loans held for investment under the fair-value option and arecalculated over nine quarters.
2 Commercial and industrial loans include small- and medium-enterprise loansand corporate cards.
3 Other consumer loans include student loans and automobile loans.4 Other loans include international real estate loans.
Actual 2014:Q3 and projected 2016:Q4 risk-weightedassets
Actual2014:Q3
Projected 2016:Q4
Generalapproach
Standardizedapproach
Risk-weighted assets(billions of dollars)1 97.0 103.2 105.2
1 For each quarter in 2014, risk-weighted assets are calculated using thegeneral risk-based capital approach set forth in 12 CFR 225, appendix A. Foreach quarter in 2015 and 2016, risk-weighted assets are calculated under theBoard’s standardized capital risk-based approach in 12 CFR 217, subpart D,except for the risk-weighted assets used to calculate the tier 1 common ratio,which uses the general risk-based capital approach for all quarters.
Projected losses, revenue, net income and othercomprehensive income through 2016:Q4
Billions ofdollars
Percent ofaverage assets1
Pre-provision net revenue2 6.6 5.5
Other revenue3 0.0
less
Provisions 5.4
Realized losses/gains on securities (AFS/HTM) 0.1
Trading and counterparty losses4 0.0
Other losses/gains5 0.0
equals
Net income before taxes 1.1 0.9
Memo items
Other comprehensive income6 0.0
Other effects on capital Actual 2014:Q3 2016:Q4
AOCI included in capital (billions of dollars)7 n/a 0.0
1 Average assets is the nine-quarter average of total assets.2 Pre-provision net revenue includes losses from operational-risk events,
mortgage repurchase expenses, and other real estate owned (OREO) costs.3 Other revenue includes one-time income and (expense) items not included in
pre-provision net revenue.4 Trading and counterparty losses include mark-to-market and credit valuation
adjustments (CVA) losses and losses arising from the counterparty defaultscenario component applied to derivatives, securities lending, and repurchaseagreement activities.
5 Other losses/gains includes projected change in fair value of loans held for saleand loans held for investment measured under the fair-value option, andgoodwill impairment losses.
6 Other comprehensive income (OCI) is only calculated for advanced approachesBHCs, and other BHCs that opt into the advanced approaches treatment ofAOCI.
7 Certain AOCI items are subject to transition into projected regulatory capital.Those transitions are 20 percent included in projected regulatory capital for2014, 40 percent included in projected regulatory capital for 2015, and60 percent included in projected regulatory capital for 2016.
March 2015 117

Table C.27.A. State Street Corporation
Projected stressed capital ratios, risk-weighted assets, losses, revenues, net income beforetaxes, and loan lossesFederal Reserve estimates: Severely adverse scenario
Actual 2014:Q3 projected stressed capital ratios through2016:Q4
Actual2014:Q3
Stressed capital ratios1
Ending Minimum
Tier 1 common ratio (%) 13.9 14.3 12.0
Common equity tier 1 capital ratio (%)2 15.0 9.7 8.1
Tier 1 risk-based capital ratio (%) 16.7 11.2 9.7
Total risk-based capital ratio (%) 19.1 13.1 11.6
Tier 1 leverage ratio (%) 6.4 5.4 4.8
1 The capital ratios are calculated using capital action assumptions providedwithin the Dodd-Frank Act stress testing rule. These projections representhypothetical estimates that involve an economic outcome that is more adversethan expected. These estimates are not forecasts of expected losses, revenues,net income before taxes, or capital ratios. The minimum capital ratio presentedis for the period 2014:Q4 to 2016:Q4.
2 Advanced approaches bank holding companies (BHCs) are subject to thecommon equity tier 1 ratio for the third and fourth quarter of 2014. All bankholding companies are subject to the common equity tier 1 ratio for eachquarter of 2015 and 2016. An advanced approaches BHC includes any BHCthat has consolidated total assets greater than or equal to $250 billion orconsolidated total on-balance sheet foreign exposure of at least $10 billion.See 12 CFR 217.100(b)(1). Other BHCs include any BHC that is subject to12 CFR 225.8 and is not an advanced approaches BHC.
Projected loan losses, by type of loan, 2014:Q4–2016:Q4
Billions ofdollars
Portfolio lossrates (%)1
Loan losses 0.6 3.3
First-lien mortgages, domestic 0.0 0.0
Junior liens and HELOCs, domestic 0.0 0.0
Commercial and industrial2 0.1 4.8
Commercial real estate, domestic 0.1 29.4
Credit cards 0.0 0.0
Other consumer3 0.0 0.6
Other loans4 0.5 2.7
1 Average loan balances used to calculate portfolio loss rates exclude loans heldfor sale and loans held for investment under the fair-value option and arecalculated over nine quarters.
2 Commercial and industrial loans include small- and medium-enterprise loansand corporate cards.
3 Other consumer loans include student loans and automobile loans.4 Other loans include international real estate loans.
Actual 2014:Q3 and projected 2016:Q4 risk-weightedassets
Actual2014:Q3
Projected 2016:Q4
Generalapproach
Standardizedapproach
Risk-weighted assets(billions of dollars)1 91.8 95.2 124.8
1 For each quarter in 2014, risk-weighted assets are calculated using thegeneral risk-based capital approach set forth in 12 CFR 225, appendix A. Foreach quarter in 2015 and 2016, risk-weighted assets are calculated under theBoard’s standardized capital risk-based approach in 12 CFR 217, subpart D,except for the risk-weighted assets used to calculate the tier 1 common ratio,which uses the general risk-based capital approach for all quarters.
Projected losses, revenue, net income and othercomprehensive income through 2016:Q4
Billions ofdollars
Percent ofaverage assets1
Pre-provision net revenue2 7.0 2.5
Other revenue3 0.0
less
Provisions 0.8
Realized losses/gains on securities (AFS/HTM) 0.9
Trading and counterparty losses4 2.0
Other losses/gains5 0.0
equals
Net income before taxes 3.3 1.2
Memo items
Other comprehensive income6 -2.8
Other effects on capital Actual 2014:Q3 2016:Q4
AOCI included in capital (billions of dollars)7 -0.3 -1.8
1 Average assets is the nine-quarter average of total assets.2 Pre-provision net revenue includes losses from operational-risk events,
mortgage repurchase expenses, and other real estate owned (OREO) costs.3 Other revenue includes one-time income and (expense) items not included in
pre-provision net revenue.4 Trading and counterparty losses include mark-to-market and credit valuation
adjustments (CVA) losses and losses arising from the counterparty defaultscenario component applied to derivatives, securities lending, and repurchaseagreement activities.
5 Other losses/gains includes projected change in fair value of loans held for saleand loans held for investment measured under the fair-value option andgoodwill impairment losses.
6 Other comprehensive income (OCI) is only calculated for advanced approachesBHCs, and other BHCs that opt into the advanced approaches treatment ofAOCI.
7 Certain AOCI items are subject to transition into projected regulatory capital.Those transitions are 20 percent included in projected regulatory capital for2014, 40 percent included in projected regulatory capital for 2015, and60 percent included in projected regulatory capital for 2016.
118 Supervisory Stress Test Methodology and Results

Table C.27.B. State Street Corporation
Projected stressed capital ratios, risk-weighted assets, losses, revenues, net income beforetaxes, and loan lossesFederal Reserve estimates: Adverse scenario
Actual 2014:Q3 projected stressed capital ratios through2016:Q4
Actual2014:Q3
Stressed capital ratios1
Ending Minimum
Tier 1 common ratio (%) 13.9 17.5 12.8
Common equity tier 1 capital ratio (%)2 15.0 10.0 8.7
Tier 1 risk-based capital ratio (%) 16.7 11.5 10.3
Total risk-based capital ratio (%) 19.1 13.3 12.0
Tier 1 leverage ratio (%) 6.4 5.5 5.0
1 The capital ratios are calculated using capital action assumptions providedwithin the Dodd-Frank Act stress testing rule. These projections representhypothetical estimates that involve an economic outcome that is more adversethan expected. These estimates are not forecasts of expected losses, revenues,net income before taxes, or capital ratios. The minimum capital ratio presentedis for the period 2014:Q4 to 2016:Q4.
2 Advanced approaches bank holding companies (BHCs) are subject to thecommon equity tier 1 ratio for the third and fourth quarter of 2014. All bankholding companies are subject to the common equity tier 1 ratio for eachquarter of 2015 and 2016. An advanced approaches BHC includes any BHCthat has consolidated total assets greater than or equal to $250 billion orconsolidated total on-balance sheet foreign exposure of at least $10 billion.See 12 CFR 217.100(b)(1). Other BHCs include any BHC that is subject to12 CFR 225.8 and is not an advanced approaches BHC.
Projected loan losses, by type of loan, 2014:Q4–2016:Q4
Billions ofdollars
Portfolio lossrates (%)1
Loan losses 0.4 2.0
First-lien mortgages, domestic 0.0 0.0
Junior liens and HELOCs, domestic 0.0 0.0
Commercial and industrial2 0.0 2.6
Commercial real estate, domestic 0.1 17.0
Credit cards 0.0 0.0
Other consumer3 0.0 0.6
Other loans4 0.3 1.7
1 Average loan balances used to calculate portfolio loss rates exclude loans heldfor sale and loans held for investment under the fair-value option and arecalculated over nine quarters.
2 Commercial and industrial loans include small- and medium-enterprise loansand corporate cards.
3 Other consumer loans include student loans and automobile loans.4 Other loans include international real estate loans.
Actual 2014:Q3 and projected 2016:Q4 risk-weightedassets
Actual2014:Q3
Projected 2016:Q4
Generalapproach
Standardizedapproach
Risk-weighted assets(billions of dollars)1 91.8 99.2 129.7
1 For each quarter in 2014, risk-weighted assets are calculated using thegeneral risk-based capital approach set forth in 12 CFR 225, appendix A. Foreach quarter in 2015 and 2016, risk-weighted assets are calculated under theBoard’s standardized capital risk-based approach in 12 CFR 217, subpart D,except for the risk-weighted assets used to calculate the tier 1 common ratio,which uses the general risk-based capital approach for all quarters.
Projected losses, revenue, net income and othercomprehensive income through 2016:Q4
Billions ofdollars
Percent ofaverage assets1
Pre-provision net revenue2 10.9 3.7
Other revenue3 0.0
less
Provisions 0.5
Realized losses/gains on securities (AFS/HTM) 0.4
Trading and counterparty losses4 0.8
Other losses/gains5 0.0
equals
Net income before taxes 9.2 3.2
Memo items
Other comprehensive income6 -6.5
Other effects on capital Actual 2014:Q3 2016:Q4
AOCI included in capital (billions of dollars)7 -0.3 -4.1
1 Average assets is the nine-quarter average of total assets.2 Pre-provision net revenue includes losses from operational-risk events,
mortgage repurchase expenses, and other real estate owned (OREO) costs.3 Other revenue includes one-time income and (expense) items not included in
pre-provision net revenue.4 Trading and counterparty losses include mark-to-market and credit valuation
adjustments (CVA) losses and losses arising from the counterparty defaultscenario component applied to derivatives, securities lending, and repurchaseagreement activities.
5 Other losses/gains includes projected change in fair value of loans held for saleand loans held for investment measured under the fair-value option andgoodwill impairment losses.
6 Other comprehensive income (OCI) is only calculated for advanced approachesBHCs, and other BHCs that opt into the advanced approaches treatment ofAOCI.
7 Certain AOCI items are subject to transition into projected regulatory capital.Those transitions are 20 percent included in projected regulatory capital for2014, 40 percent included in projected regulatory capital for 2015, and60 percent included in projected regulatory capital for 2016.
March 2015 119
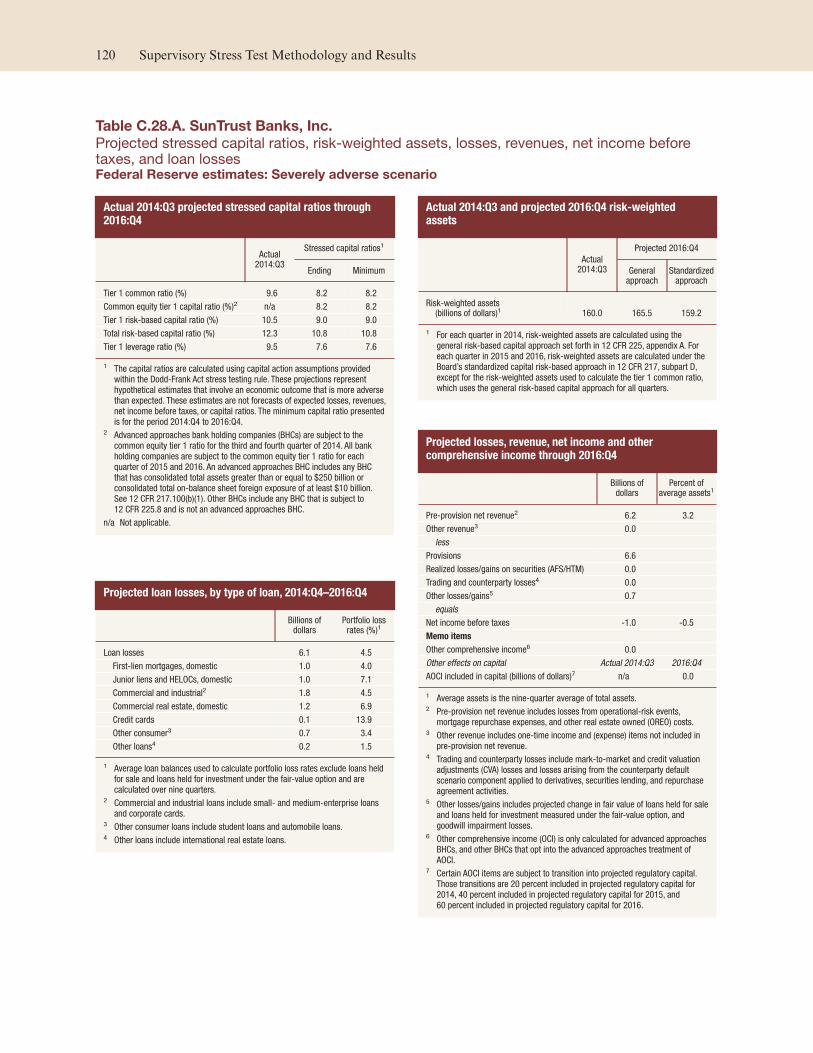
Table C.28.A. SunTrust Banks, Inc.
Projected stressed capital ratios, risk-weighted assets, losses, revenues, net income beforetaxes, and loan lossesFederal Reserve estimates: Severely adverse scenario
Actual 2014:Q3 projected stressed capital ratios through2016:Q4
Actual2014:Q3
Stressed capital ratios1
Ending Minimum
Tier 1 common ratio (%) 9.6 8.2 8.2
Common equity tier 1 capital ratio (%)2 n/a 8.2 8.2
Tier 1 risk-based capital ratio (%) 10.5 9.0 9.0
Total risk-based capital ratio (%) 12.3 10.8 10.8
Tier 1 leverage ratio (%) 9.5 7.6 7.6
1 The capital ratios are calculated using capital action assumptions providedwithin the Dodd-Frank Act stress testing rule. These projections representhypothetical estimates that involve an economic outcome that is more adversethan expected. These estimates are not forecasts of expected losses, revenues,net income before taxes, or capital ratios. The minimum capital ratio presentedis for the period 2014:Q4 to 2016:Q4.
2 Advanced approaches bank holding companies (BHCs) are subject to thecommon equity tier 1 ratio for the third and fourth quarter of 2014. All bankholding companies are subject to the common equity tier 1 ratio for eachquarter of 2015 and 2016. An advanced approaches BHC includes any BHCthat has consolidated total assets greater than or equal to $250 billion orconsolidated total on-balance sheet foreign exposure of at least $10 billion.See 12 CFR 217.100(b)(1). Other BHCs include any BHC that is subject to12 CFR 225.8 and is not an advanced approaches BHC.
n/a Not applicable.
Projected loan losses, by type of loan, 2014:Q4–2016:Q4
Billions ofdollars
Portfolio lossrates (%)1
Loan losses 6.1 4.5
First-lien mortgages, domestic 1.0 4.0
Junior liens and HELOCs, domestic 1.0 7.1
Commercial and industrial2 1.8 4.5
Commercial real estate, domestic 1.2 6.9
Credit cards 0.1 13.9
Other consumer3 0.7 3.4
Other loans4 0.2 1.5
1 Average loan balances used to calculate portfolio loss rates exclude loans heldfor sale and loans held for investment under the fair-value option and arecalculated over nine quarters.
2 Commercial and industrial loans include small- and medium-enterprise loansand corporate cards.
3 Other consumer loans include student loans and automobile loans.4 Other loans include international real estate loans.
Actual 2014:Q3 and projected 2016:Q4 risk-weightedassets
Actual2014:Q3
Projected 2016:Q4
Generalapproach
Standardizedapproach
Risk-weighted assets(billions of dollars)1 160.0 165.5 159.2
1 For each quarter in 2014, risk-weighted assets are calculated using thegeneral risk-based capital approach set forth in 12 CFR 225, appendix A. Foreach quarter in 2015 and 2016, risk-weighted assets are calculated under theBoard’s standardized capital risk-based approach in 12 CFR 217, subpart D,except for the risk-weighted assets used to calculate the tier 1 common ratio,which uses the general risk-based capital approach for all quarters.
Projected losses, revenue, net income and othercomprehensive income through 2016:Q4
Billions ofdollars
Percent ofaverage assets1
Pre-provision net revenue2 6.2 3.2
Other revenue3 0.0
less
Provisions 6.6
Realized losses/gains on securities (AFS/HTM) 0.0
Trading and counterparty losses4 0.0
Other losses/gains5 0.7
equals
Net income before taxes -1.0 -0.5
Memo items
Other comprehensive income6 0.0
Other effects on capital Actual 2014:Q3 2016:Q4
AOCI included in capital (billions of dollars)7 n/a 0.0
1 Average assets is the nine-quarter average of total assets.2 Pre-provision net revenue includes losses from operational-risk events,
mortgage repurchase expenses, and other real estate owned (OREO) costs.3 Other revenue includes one-time income and (expense) items not included in
pre-provision net revenue.4 Trading and counterparty losses include mark-to-market and credit valuation
adjustments (CVA) losses and losses arising from the counterparty defaultscenario component applied to derivatives, securities lending, and repurchaseagreement activities.
5 Other losses/gains includes projected change in fair value of loans held for saleand loans held for investment measured under the fair-value option, andgoodwill impairment losses.
6 Other comprehensive income (OCI) is only calculated for advanced approachesBHCs, and other BHCs that opt into the advanced approaches treatment ofAOCI.
7 Certain AOCI items are subject to transition into projected regulatory capital.Those transitions are 20 percent included in projected regulatory capital for2014, 40 percent included in projected regulatory capital for 2015, and60 percent included in projected regulatory capital for 2016.
120 Supervisory Stress Test Methodology and Results
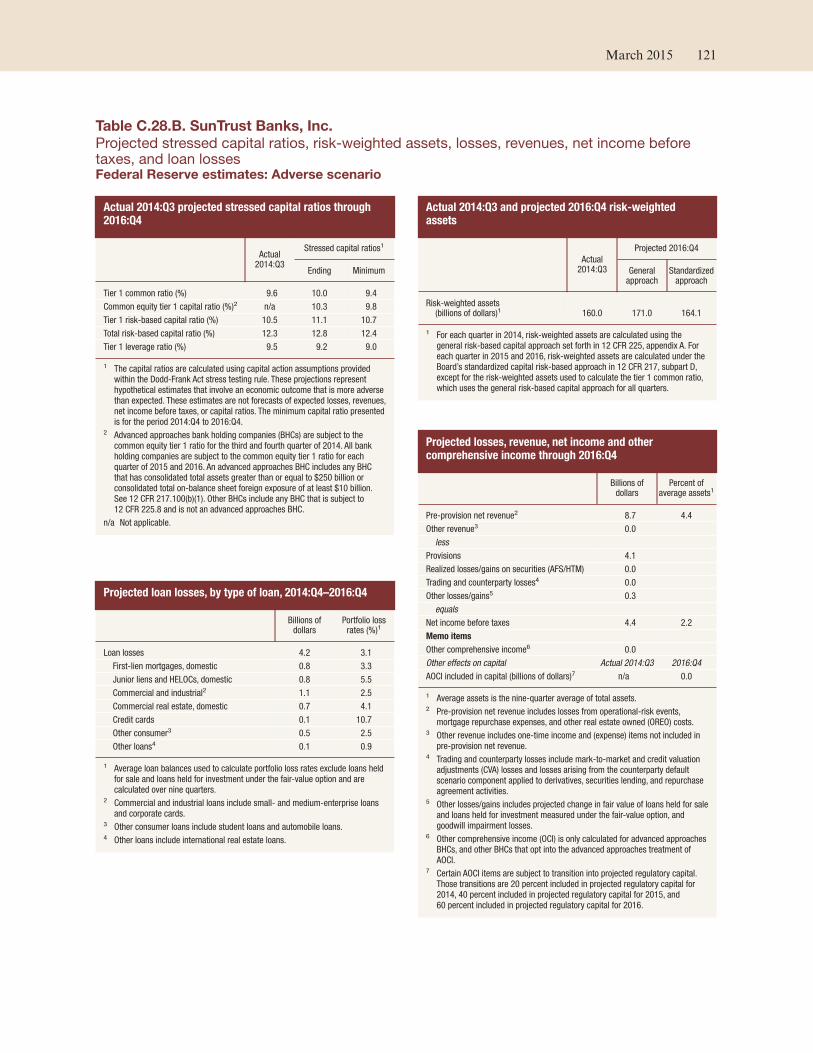
Table C.28.B. SunTrust Banks, Inc.
Projected stressed capital ratios, risk-weighted assets, losses, revenues, net income beforetaxes, and loan lossesFederal Reserve estimates: Adverse scenario
Actual 2014:Q3 projected stressed capital ratios through2016:Q4
Actual2014:Q3
Stressed capital ratios1
Ending Minimum
Tier 1 common ratio (%) 9.6 10.0 9.4
Common equity tier 1 capital ratio (%)2 n/a 10.3 9.8
Tier 1 risk-based capital ratio (%) 10.5 11.1 10.7
Total risk-based capital ratio (%) 12.3 12.8 12.4
Tier 1 leverage ratio (%) 9.5 9.2 9.0
1 The capital ratios are calculated using capital action assumptions providedwithin the Dodd-Frank Act stress testing rule. These projections representhypothetical estimates that involve an economic outcome that is more adversethan expected. These estimates are not forecasts of expected losses, revenues,net income before taxes, or capital ratios. The minimum capital ratio presentedis for the period 2014:Q4 to 2016:Q4.
2 Advanced approaches bank holding companies (BHCs) are subject to thecommon equity tier 1 ratio for the third and fourth quarter of 2014. All bankholding companies are subject to the common equity tier 1 ratio for eachquarter of 2015 and 2016. An advanced approaches BHC includes any BHCthat has consolidated total assets greater than or equal to $250 billion orconsolidated total on-balance sheet foreign exposure of at least $10 billion.See 12 CFR 217.100(b)(1). Other BHCs include any BHC that is subject to12 CFR 225.8 and is not an advanced approaches BHC.
n/a Not applicable.
Projected loan losses, by type of loan, 2014:Q4–2016:Q4
Billions ofdollars
Portfolio lossrates (%)1
Loan losses 4.2 3.1
First-lien mortgages, domestic 0.8 3.3
Junior liens and HELOCs, domestic 0.8 5.5
Commercial and industrial2 1.1 2.5
Commercial real estate, domestic 0.7 4.1
Credit cards 0.1 10.7
Other consumer3 0.5 2.5
Other loans4 0.1 0.9
1 Average loan balances used to calculate portfolio loss rates exclude loans heldfor sale and loans held for investment under the fair-value option and arecalculated over nine quarters.
2 Commercial and industrial loans include small- and medium-enterprise loansand corporate cards.
3 Other consumer loans include student loans and automobile loans.4 Other loans include international real estate loans.
Actual 2014:Q3 and projected 2016:Q4 risk-weightedassets
Actual2014:Q3
Projected 2016:Q4
Generalapproach
Standardizedapproach
Risk-weighted assets(billions of dollars)1 160.0 171.0 164.1
1 For each quarter in 2014, risk-weighted assets are calculated using thegeneral risk-based capital approach set forth in 12 CFR 225, appendix A. Foreach quarter in 2015 and 2016, risk-weighted assets are calculated under theBoard’s standardized capital risk-based approach in 12 CFR 217, subpart D,except for the risk-weighted assets used to calculate the tier 1 common ratio,which uses the general risk-based capital approach for all quarters.
Projected losses, revenue, net income and othercomprehensive income through 2016:Q4
Billions ofdollars
Percent ofaverage assets1
Pre-provision net revenue2 8.7 4.4
Other revenue3 0.0
less
Provisions 4.1
Realized losses/gains on securities (AFS/HTM) 0.0
Trading and counterparty losses4 0.0
Other losses/gains5 0.3
equals
Net income before taxes 4.4 2.2
Memo items
Other comprehensive income6 0.0
Other effects on capital Actual 2014:Q3 2016:Q4
AOCI included in capital (billions of dollars)7 n/a 0.0
1 Average assets is the nine-quarter average of total assets.2 Pre-provision net revenue includes losses from operational-risk events,
mortgage repurchase expenses, and other real estate owned (OREO) costs.3 Other revenue includes one-time income and (expense) items not included in
pre-provision net revenue.4 Trading and counterparty losses include mark-to-market and credit valuation
adjustments (CVA) losses and losses arising from the counterparty defaultscenario component applied to derivatives, securities lending, and repurchaseagreement activities.
5 Other losses/gains includes projected change in fair value of loans held for saleand loans held for investment measured under the fair-value option, andgoodwill impairment losses.
6 Other comprehensive income (OCI) is only calculated for advanced approachesBHCs, and other BHCs that opt into the advanced approaches treatment ofAOCI.
7 Certain AOCI items are subject to transition into projected regulatory capital.Those transitions are 20 percent included in projected regulatory capital for2014, 40 percent included in projected regulatory capital for 2015, and60 percent included in projected regulatory capital for 2016.
March 2015 121

Table C.29.A. U.S. Bancorp
Projected stressed capital ratios, risk-weighted assets, losses, revenues, net income beforetaxes, and loan lossesFederal Reserve estimates: Severely adverse scenario
Actual 2014:Q3 projected stressed capital ratios through2016:Q4
Actual2014:Q3
Stressed capital ratios1
Ending Minimum
Tier 1 common ratio (%) 9.5 8.6 8.5
Common equity tier 1 capital ratio (%)2 9.7 8.2 8.1
Tier 1 risk-based capital ratio (%) 11.3 9.6 9.6
Total risk-based capital ratio (%) 13.6 11.7 11.7
Tier 1 leverage ratio (%) 9.4 8.1 8.0
1 The capital ratios are calculated using capital action assumptions providedwithin the Dodd-Frank Act stress testing rule. These projections representhypothetical estimates that involve an economic outcome that is more adversethan expected. These estimates are not forecasts of expected losses, revenues,net income before taxes, or capital ratios. The minimum capital ratio presentedis for the period 2014:Q4 to 2016:Q4.
2 Advanced approaches bank holding companies (BHCs) are subject to thecommon equity tier 1 ratio for the third and fourth quarter of 2014. All bankholding companies are subject to the common equity tier 1 ratio for eachquarter of 2015 and 2016. An advanced approaches BHC includes any BHCthat has consolidated total assets greater than or equal to $250 billion orconsolidated total on-balance sheet foreign exposure of at least $10 billion.See 12 CFR 217.100(b)(1). Other BHCs include any BHC that is subject to12 CFR 225.8 and is not an advanced approaches BHC.
Projected loan losses, by type of loan, 2014:Q4–2016:Q4
Billions ofdollars
Portfolio lossrates (%)1
Loan losses 16.2 6.5
First-lien mortgages, domestic 1.4 2.4
Junior liens and HELOCs, domestic 0.9 5.3
Commercial and industrial2 4.9 7.8
Commercial real estate, domestic 4.4 11.0
Credit cards 2.7 14.7
Other consumer3 1.2 3.4
Other loans4 0.8 3.7
1 Average loan balances used to calculate portfolio loss rates exclude loans heldfor sale and loans held for investment under the fair-value option and arecalculated over nine quarters.
2 Commercial and industrial loans include small- and medium-enterprise loansand corporate cards.
3 Other consumer loans include student loans and automobile loans.4 Other loans include international real estate loans.
Actual 2014:Q3 and projected 2016:Q4 risk-weightedassets
Actual2014:Q3
Projected 2016:Q4
Generalapproach
Standardizedapproach
Risk-weighted assets(billions of dollars)1 311.9 321.0 335.1
1 For each quarter in 2014, risk-weighted assets are calculated using thegeneral risk-based capital approach set forth in 12 CFR 225, appendix A. Foreach quarter in 2015 and 2016, risk-weighted assets are calculated under theBoard’s standardized capital risk-based approach in 12 CFR 217, subpart D,except for the risk-weighted assets used to calculate the tier 1 common ratio,which uses the general risk-based capital approach for all quarters.
Projected losses, revenue, net income and othercomprehensive income through 2016:Q4
Billions ofdollars
Percent ofaverage assets1
Pre-provision net revenue2 22.8 5.6
Other revenue3 0.0
less
Provisions 18.1
Realized losses/gains on securities (AFS/HTM) 0.1
Trading and counterparty losses4 0.0
Other losses/gains5 0.0
equals
Net income before taxes 4.7 1.2
Memo items
Other comprehensive income6 0.2
Other effects on capital Actual 2014:Q3 2016:Q4
AOCI included in capital (billions of dollars)7 -0.1 -0.2
1 Average assets is the nine-quarter average of total assets.2 Pre-provision net revenue includes losses from operational-risk events,
mortgage repurchase expenses, and other real estate owned (OREO) costs.3 Other revenue includes one-time income and (expense) items not included in
pre-provision net revenue.4 Trading and counterparty losses include mark-to-market and credit valuation
adjustments (CVA) losses and losses arising from the counterparty defaultscenario component applied to derivatives, securities lending, and repurchaseagreement activities.
5 Other losses/gains includes projected change in fair value of loans held for saleand loans held for investment measured under the fair-value option andgoodwill impairment losses.
6 Other comprehensive income (OCI) is only calculated for advanced approachesBHCs, and other BHCs that opt into the advanced approaches treatment ofAOCI.
7 Certain AOCI items are subject to transition into projected regulatory capital.Those transitions are 20 percent included in projected regulatory capital for2014, 40 percent included in projected regulatory capital for 2015, and60 percent included in projected regulatory capital for 2016.
122 Supervisory Stress Test Methodology and Results

Table C.29.B. U.S. Bancorp
Projected stressed capital ratios, risk-weighted assets, losses, revenues, net income beforetaxes, and loan lossesFederal Reserve estimates: Adverse scenario
Actual 2014:Q3 projected stressed capital ratios through2016:Q4
Actual2014:Q3
Stressed capital ratios1
Ending Minimum
Tier 1 common ratio (%) 9.5 10.5 9.3
Common equity tier 1 capital ratio (%)2 9.7 9.4 8.8
Tier 1 risk-based capital ratio (%) 11.3 10.8 10.3
Total risk-based capital ratio (%) 13.6 12.9 12.4
Tier 1 leverage ratio (%) 9.4 8.9 8.6
1 The capital ratios are calculated using capital action assumptions providedwithin the Dodd-Frank Act stress testing rule. These projections representhypothetical estimates that involve an economic outcome that is more adversethan expected. These estimates are not forecasts of expected losses, revenues,net income before taxes, or capital ratios. The minimum capital ratio presentedis for the period 2014:Q4 to 2016:Q4.
2 Advanced approaches bank holding companies (BHCs) are subject to thecommon equity tier 1 ratio for the third and fourth quarter of 2014. All bankholding companies are subject to the common equity tier 1 ratio for eachquarter of 2015 and 2016. An advanced approaches BHC includes any BHCthat has consolidated total assets greater than or equal to $250 billion orconsolidated total on-balance sheet foreign exposure of at least $10 billion.See 12 CFR 217.100(b)(1). Other BHCs include any BHC that is subject to12 CFR 225.8 and is not an advanced approaches BHC.
Projected loan losses, by type of loan, 2014:Q4–2016:Q4
Billions ofdollars
Portfolio lossrates (%)1
Loan losses 10.8 4.3
First-lien mortgages, domestic 1.0 1.8
Junior liens and HELOCs, domestic 0.6 3.5
Commercial and industrial2 3.2 5.0
Commercial real estate, domestic 2.5 6.4
Credit cards 2.2 11.8
Other consumer3 0.8 2.5
Other loans4 0.5 2.2
1 Average loan balances used to calculate portfolio loss rates exclude loans heldfor sale and loans held for investment under the fair-value option and arecalculated over nine quarters.
2 Commercial and industrial loans include small- and medium-enterprise loansand corporate cards.
3 Other consumer loans include student loans and automobile loans.4 Other loans include international real estate loans.
Actual 2014:Q3 and projected 2016:Q4 risk-weightedassets
Actual2014:Q3
Projected 2016:Q4
Generalapproach
Standardizedapproach
Risk-weighted assets(billions of dollars)1 311.9 335.0 347.0
1 For each quarter in 2014, risk-weighted assets are calculated using thegeneral risk-based capital approach set forth in 12 CFR 225, appendix A. Foreach quarter in 2015 and 2016, risk-weighted assets are calculated under theBoard’s standardized capital risk-based approach in 12 CFR 217, subpart D,except for the risk-weighted assets used to calculate the tier 1 common ratio,which uses the general risk-based capital approach for all quarters.
Projected losses, revenue, net income and othercomprehensive income through 2016:Q4
Billions ofdollars
Percent ofaverage assets1
Pre-provision net revenue2 27.1 6.5
Other revenue3 0.0
less
Provisions 11.3
Realized losses/gains on securities (AFS/HTM) 0.0
Trading and counterparty losses4 0.0
Other losses/gains5 0.0
equals
Net income before taxes 15.8 3.8
Memo items
Other comprehensive income6 -3.7
Other effects on capital Actual 2014:Q3 2016:Q4
AOCI included in capital (billions of dollars)7 -0.1 -2.5
1 Average assets is the nine-quarter average of total assets.2 Pre-provision net revenue includes losses from operational-risk events,
mortgage repurchase expenses, and other real estate owned (OREO) costs.3 Other revenue includes one-time income and (expense) items not included in
pre-provision net revenue.4 Trading and counterparty losses include mark-to-market and credit valuation
adjustments (CVA) losses and losses arising from the counterparty defaultscenario component applied to derivatives, securities lending, and repurchaseagreement activities.
5 Other losses/gains includes projected change in fair value of loans held for saleand loans held for investment measured under the fair-value option andgoodwill impairment losses.
6 Other comprehensive income (OCI) is only calculated for advanced approachesBHCs, and other BHCs that opt into the advanced approaches treatment ofAOCI.
7 Certain AOCI items are subject to transition into projected regulatory capital.Those transitions are 20 percent included in projected regulatory capital for2014, 40 percent included in projected regulatory capital for 2015, and60 percent included in projected regulatory capital for 2016.
March 2015 123

Table C.30.A. Wells Fargo & Company
Projected stressed capital ratios, risk-weighted assets, losses, revenues, net income beforetaxes, and loan lossesFederal Reserve estimates: Severely adverse scenario
Actual 2014:Q3 projected stressed capital ratios through2016:Q4
Actual2014:Q3
Stressed capital ratios1
Ending Minimum
Tier 1 common ratio (%) 10.8 7.6 7.6
Common equity tier 1 capital ratio (%)2 11.1 6.9 6.9
Tier 1 risk-based capital ratio (%) 12.6 8.2 8.2
Total risk-based capital ratio (%) 15.6 11.1 11.1
Tier 1 leverage ratio (%) 9.6 6.4 6.4
1 The capital ratios are calculated using capital action assumptions providedwithin the Dodd-Frank Act stress testing rule. These projections representhypothetical estimates that involve an economic outcome that is more adversethan expected. These estimates are not forecasts of expected losses, revenues,net income before taxes, or capital ratios. The minimum capital ratio presentedis for the period 2014:Q4 to 2016:Q4.
2 Advanced approaches bank holding companies (BHCs) are subject to thecommon equity tier 1 ratio for the third and fourth quarter of 2014. All bankholding companies are subject to the common equity tier 1 ratio for eachquarter of 2015 and 2016. An advanced approaches BHC includes any BHCthat has consolidated total assets greater than or equal to $250 billion orconsolidated total on-balance sheet foreign exposure of at least $10 billion.See 12 CFR 217.100(b)(1). Other BHCs include any BHC that is subject to12 CFR 225.8 and is not an advanced approaches BHC.
Projected loan losses, by type of loan, 2014:Q4–2016:Q4
Billions ofdollars
Portfolio lossrates (%)1
Loan losses 48.8 5.8
First-lien mortgages, domestic 7.3 2.9
Junior liens and HELOCs, domestic 6.3 7.9
Commercial and industrial2 10.9 6.7
Commercial real estate, domestic 10.3 8.3
Credit cards 4.3 14.8
Other consumer3 5.7 6.6
Other loans4 4.0 3.4
1 Average loan balances used to calculate portfolio loss rates exclude loans heldfor sale and loans held for investment under the fair-value option and arecalculated over nine quarters.
2 Commercial and industrial loans include small- and medium-enterprise loansand corporate cards.
3 Other consumer loans include student loans and automobile loans.4 Other loans include international real estate loans.
Actual 2014:Q3 and projected 2016:Q4 risk-weightedassets
Actual2014:Q3
Projected 2016:Q4
Generalapproach
Standardizedapproach
Risk-weighted assets(billions of dollars)1 1,222.9 1,255.4 1,313.6
1 For each quarter in 2014, risk-weighted assets are calculated using thegeneral risk-based capital approach set forth in 12 CFR 225, appendix A. Foreach quarter in 2015 and 2016, risk-weighted assets are calculated under theBoard’s standardized capital risk-based approach in 12 CFR 217, subpart D,except for the risk-weighted assets used to calculate the tier 1 common ratio,which uses the general risk-based capital approach for all quarters.
Projected losses, revenue, net income and othercomprehensive income through 2016:Q4
Billions ofdollars
Percent ofaverage assets1
Pre-provision net revenue2 42.7 2.5
Other revenue3 0.0
less
Provisions 56.4
Realized losses/gains on securities (AFS/HTM) 5.0
Trading and counterparty losses4 7.3
Other losses/gains5 3.2
equals
Net income before taxes -29.3 -1.7
Memo items
Other comprehensive income6 -0.7
Other effects on capital Actual 2014:Q3 2016:Q4
AOCI included in capital (billions of dollars)7 0.6 1.4
1 Average assets is the nine-quarter average of total assets.2 Pre-provision net revenue includes losses from operational-risk events,
mortgage repurchase expenses, and other real estate owned (OREO) costs.3 Other revenue includes one-time income and (expense) items not included in
pre-provision net revenue.4 Trading and counterparty losses include mark-to-market and credit valuation
adjustments (CVA) losses and losses arising from the counterparty defaultscenario component applied to derivatives, securities lending, and repurchaseagreement activities.
5 Other losses/gains includes projected change in fair value of loans held for saleand loans held for investment measured under the fair-value option andgoodwill impairment losses.
6 Other comprehensive income (OCI) is only calculated for advanced approachesBHCs, and other BHCs that opt into the advanced approaches treatment ofAOCI.
7 Certain AOCI items are subject to transition into projected regulatory capital.Those transitions are 20 percent included in projected regulatory capital for2014, 40 percent included in projected regulatory capital for 2015, and60 percent included in projected regulatory capital for 2016.
124 Supervisory Stress Test Methodology and Results

Table C.30.B. Wells Fargo & Company
Projected stressed capital ratios, risk-weighted assets, losses, revenues, net income beforetaxes, and loan lossesFederal Reserve estimates: Adverse scenario
Actual 2014:Q3 projected stressed capital ratios through2016:Q4
Actual2014:Q3
Stressed capital ratios1
Ending Minimum
Tier 1 common ratio (%) 10.8 10.0 9.8
Common equity tier 1 capital ratio (%)2 11.1 8.4 8.4
Tier 1 risk-based capital ratio (%) 12.6 9.7 9.6
Total risk-based capital ratio (%) 15.6 12.3 12.3
Tier 1 leverage ratio (%) 9.6 7.4 7.4
1 The capital ratios are calculated using capital action assumptions providedwithin the Dodd-Frank Act stress testing rule. These projections representhypothetical estimates that involve an economic outcome that is more adversethan expected. These estimates are not forecasts of expected losses, revenues,net income before taxes, or capital ratios. The minimum capital ratio presentedis for the period 2014:Q4 to 2016:Q4.
2 Advanced approaches bank holding companies (BHCs) are subject to thecommon equity tier 1 ratio for the third and fourth quarter of 2014. All bankholding companies are subject to the common equity tier 1 ratio for eachquarter of 2015 and 2016. An advanced approaches BHC includes any BHCthat has consolidated total assets greater than or equal to $250 billion orconsolidated total on-balance sheet foreign exposure of at least $10 billion.See 12 CFR 217.100(b)(1). Other BHCs include any BHC that is subject to12 CFR 225.8 and is not an advanced approaches BHC.
Projected loan losses, by type of loan, 2014:Q4–2016:Q4
Billions ofdollars
Portfolio lossrates (%)1
Loan losses 32.0 3.7
First-lien mortgages, domestic 4.5 1.8
Junior liens and HELOCs, domestic 4.0 5.0
Commercial and industrial2 7.2 4.3
Commercial real estate, domestic 6.0 4.8
Credit cards 3.5 12.0
Other consumer3 4.5 5.1
Other loans4 2.3 1.9
1 Average loan balances used to calculate portfolio loss rates exclude loans heldfor sale and loans held for investment under the fair-value option and arecalculated over nine quarters.
2 Commercial and industrial loans include small- and medium-enterprise loansand corporate cards.
3 Other consumer loans include student loans and automobile loans.4 Other loans include international real estate loans.
Actual 2014:Q3 and projected 2016:Q4 risk-weightedassets
Actual2014:Q3
Projected 2016:Q4
Generalapproach
Standardizedapproach
Risk-weighted assets(billions of dollars)1 1,222.9 1,308.6 1,361.7
1 For each quarter in 2014, risk-weighted assets are calculated using thegeneral risk-based capital approach set forth in 12 CFR 225, appendix A. Foreach quarter in 2015 and 2016, risk-weighted assets are calculated under theBoard’s standardized capital risk-based approach in 12 CFR 217, subpart D,except for the risk-weighted assets used to calculate the tier 1 common ratio,which uses the general risk-based capital approach for all quarters.
Projected losses, revenue, net income and othercomprehensive income through 2016:Q4
Billions ofdollars
Percent ofaverage assets1
Pre-provision net revenue2 66.5 3.8
Other revenue3 0.0
less
Provisions 33.2
Realized losses/gains on securities (AFS/HTM) 2.1
Trading and counterparty losses4 4.0
Other losses/gains5 1.7
equals
Net income before taxes 25.5 1.5
Memo items
Other comprehensive income6 -21.9
Other effects on capital Actual 2014:Q3 2016:Q4
AOCI included in capital (billions of dollars)7 0.6 -11.3
1 Average assets is the nine-quarter average of total assets.2 Pre-provision net revenue includes losses from operational-risk events,
mortgage repurchase expenses, and other real estate owned (OREO) costs.3 Other revenue includes one-time income and (expense) items not included in
pre-provision net revenue.4 Trading and counterparty losses include mark-to-market and credit valuation
adjustments (CVA) losses and losses arising from the counterparty defaultscenario component applied to derivatives, securities lending, and repurchaseagreement activities.
5 Other losses/gains includes projected change in fair value of loans held for saleand loans held for investment measured under the fair-value option andgoodwill impairment losses.
6 Other comprehensive income (OCI) is only calculated for advanced approachesBHCs, and other BHCs that opt into the advanced approaches treatment ofAOCI.
7 Certain AOCI items are subject to transition into projected regulatory capital.Those transitions are 20 percent included in projected regulatory capital for2014, 40 percent included in projected regulatory capital for 2015, and60 percent included in projected regulatory capital for 2016.
March 2015 125

Table C.31.A. Zions Bancorporation
Projected stressed capital ratios, risk-weighted assets, losses, revenues, net income beforetaxes, and loan lossesFederal Reserve estimates: Severely adverse scenario
Actual 2014:Q3 projected stressed capital ratios through2016:Q4
Actual2014:Q3
Stressed capital ratios1
Ending Minimum
Tier 1 common ratio (%) 11.9 5.1 5.1
Common equity tier 1 capital ratio (%)2 n/a 6.0 6.0
Tier 1 risk-based capital ratio (%) 14.4 7.3 7.3
Total risk-based capital ratio (%) 16.3 9.4 9.4
Tier 1 leverage ratio (%) 11.9 5.9 5.9
1 The capital ratios are calculated using capital action assumptions providedwithin the Dodd-Frank Act stress testing rule. These projections representhypothetical estimates that involve an economic outcome that is more adversethan expected. These estimates are not forecasts of expected losses, revenues,net income before taxes, or capital ratios. The minimum capital ratio presentedis for the period 2014:Q4 to 2016:Q4.
2 Advanced approaches bank holding companies (BHCs) are subject to thecommon equity tier 1 ratio for the third and fourth quarter of 2014. All bankholding companies are subject to the common equity tier 1 ratio for eachquarter of 2015 and 2016. An advanced approaches BHC includes any BHCthat has consolidated total assets greater than or equal to $250 billion orconsolidated total on-balance sheet foreign exposure of at least $10 billion.See 12 CFR 217.100(b)(1). Other BHCs include any BHC that is subject to12 CFR 225.8 and is not an advanced approaches BHC.
n/a Not applicable.
Projected loan losses, by type of loan, 2014:Q4–2016:Q4
Billions ofdollars
Portfolio lossrates (%)1
Loan losses 2.6 6.5
First-lien mortgages, domestic 0.0 0.9
Junior liens and HELOCs, domestic 0.1 4.2
Commercial and industrial2 0.8 6.8
Commercial real estate, domestic 1.5 8.2
Credit cards 0.0 14.7
Other consumer3 0.1 11.6
Other loans4 0.1 4.6
1 Average loan balances used to calculate portfolio loss rates exclude loans heldfor sale and loans held for investment under the fair-value option and arecalculated over nine quarters.
2 Commercial and industrial loans include small- and medium-enterprise loansand corporate cards.
3 Other consumer loans include student loans and automobile loans.4 Other loans include international real estate loans.
Actual 2014:Q3 and projected 2016:Q4 risk-weightedassets
Actual2014:Q3
Projected 2016:Q4
Generalapproach
Standardizedapproach
Risk-weighted assets(billions of dollars)1 45.4 46.2 48.0
1 For each quarter in 2014, risk-weighted assets are calculated using thegeneral risk-based capital approach set forth in 12 CFR 225, appendix A. Foreach quarter in 2015 and 2016, risk-weighted assets are calculated under theBoard’s standardized capital risk-based approach in 12 CFR 217, subpart D,except for the risk-weighted assets used to calculate the tier 1 common ratio,which uses the general risk-based capital approach for all quarters.
Projected losses, revenue, net income and othercomprehensive income through 2016:Q4
Billions ofdollars
Percent ofaverage assets1
Pre-provision net revenue2 0.6 1.1
Other revenue3 0.0
less
Provisions 3.0
Realized losses/gains on securities (AFS/HTM) 0.4
Trading and counterparty losses4 0.0
Other losses/gains5 0.0
equals
Net income before taxes -2.9 -5.0
Memo items
Other comprehensive income6 0.0
Other effects on capital Actual 2014:Q3 2016:Q4
AOCI included in capital (billions of dollars)7 n/a 0.0
1 Average assets is the nine-quarter average of total assets.2 Pre-provision net revenue includes losses from operational-risk events,
mortgage repurchase expenses, and other real estate owned (OREO) costs.3 Other revenue includes one-time income and (expense) items not included in
pre-provision net revenue.4 Trading and counterparty losses include mark-to-market and credit valuation
adjustments (CVA) losses and losses arising from the counterparty defaultscenario component applied to derivatives, securities lending, and repurchaseagreement activities.
5 Other losses/gains includes projected change in fair value of loans held for saleand loans held for investment measured under the fair-value option, andgoodwill impairment losses.
6 Other comprehensive income (OCI) is only calculated for advanced approachesBHCs, and other BHCs that opt into the advanced approaches treatment ofAOCI.
7 Certain AOCI items are subject to transition into projected regulatory capital.Those transitions are 20 percent included in projected regulatory capital for2014, 40 percent included in projected regulatory capital for 2015, and60 percent included in projected regulatory capital for 2016.
126 Supervisory Stress Test Methodology and Results

Table C.31.B. Zions Bancorporation
Projected stressed capital ratios, risk-weighted assets, losses, revenues, net income beforetaxes, and loan lossesFederal Reserve estimates: Adverse scenario
Actual 2014:Q3 projected stressed capital ratios through2016:Q4
Actual2014:Q3
Stressed capital ratios1
Ending Minimum
Tier 1 common ratio (%) 11.9 10.4 10.4
Common equity tier 1 capital ratio (%)2 n/a 10.3 10.3
Tier 1 risk-based capital ratio (%) 14.4 12.3 12.3
Total risk-based capital ratio (%) 16.3 14.4 14.4
Tier 1 leverage ratio (%) 11.9 9.8 9.8
1 The capital ratios are calculated using capital action assumptions providedwithin the Dodd-Frank Act stress testing rule. These projections representhypothetical estimates that involve an economic outcome that is more adversethan expected. These estimates are not forecasts of expected losses, revenues,net income before taxes, or capital ratios. The minimum capital ratio presentedis for the period 2014:Q4 to 2016:Q4.
2 Advanced approaches bank holding companies (BHCs) are subject to thecommon equity tier 1 ratio for the third and fourth quarter of 2014. All bankholding companies are subject to the common equity tier 1 ratio for eachquarter of 2015 and 2016. An advanced approaches BHC includes any BHCthat has consolidated total assets greater than or equal to $250 billion orconsolidated total on-balance sheet foreign exposure of at least $10 billion.See 12 CFR 217.100(b)(1). Other BHCs include any BHC that is subject to12 CFR 225.8 and is not an advanced approaches BHC.
n/a Not applicable.
Projected loan losses, by type of loan, 2014:Q4–2016:Q4
Billions ofdollars
Portfolio lossrates (%)1
Loan losses 1.6 3.8
First-lien mortgages, domestic 0.0 0.4
Junior liens and HELOCs, domestic 0.1 2.6
Commercial and industrial2 0.5 4.2
Commercial real estate, domestic 0.8 4.7
Credit cards 0.0 11.9
Other consumer3 0.0 9.3
Other loans4 0.1 2.7
1 Average loan balances used to calculate portfolio loss rates exclude loans heldfor sale and loans held for investment under the fair-value option and arecalculated over nine quarters.
2 Commercial and industrial loans include small- and medium-enterprise loansand corporate cards.
3 Other consumer loans include student loans and automobile loans.4 Other loans include international real estate loans.
Actual 2014:Q3 and projected 2016:Q4 risk-weightedassets
Actual2014:Q3
Projected 2016:Q4
Generalapproach
Standardizedapproach
Risk-weighted assets(billions of dollars)1 45.4 48.3 49.2
1 For each quarter in 2014, risk-weighted assets are calculated using thegeneral risk-based capital approach set forth in 12 CFR 225, appendix A. Foreach quarter in 2015 and 2016, risk-weighted assets are calculated under theBoard’s standardized capital risk-based approach in 12 CFR 217, subpart D,except for the risk-weighted assets used to calculate the tier 1 common ratio,which uses the general risk-based capital approach for all quarters.
Projected losses, revenue, net income and othercomprehensive income through 2016:Q4
Billions ofdollars
Percent ofaverage assets1
Pre-provision net revenue2 1.5 2.6
Other revenue3 0.0
less
Provisions 1.6
Realized losses/gains on securities (AFS/HTM) 0.1
Trading and counterparty losses4 0.0
Other losses/gains5 0.0
equals
Net income before taxes -0.2 -0.4
Memo items
Other comprehensive income6 0.0
Other effects on capital Actual 2014:Q3 2016:Q4
AOCI included in capital (billions of dollars)7 n/a 0.0
1 Average assets is the nine-quarter average of total assets.2 Pre-provision net revenue includes losses from operational-risk events,
mortgage repurchase expenses, and other real estate owned (OREO) costs.3 Other revenue includes one-time income and (expense) items not included in
pre-provision net revenue.4 Trading and counterparty losses include mark-to-market and credit valuation
adjustments (CVA) losses and losses arising from the counterparty defaultscenario component applied to derivatives, securities lending, and repurchaseagreement activities.
5 Other losses/gains includes projected change in fair value of loans held for saleand loans held for investment measured under the fair-value option, andgoodwill impairment losses.
6 Other comprehensive income (OCI) is only calculated for advanced approachesBHCs, and other BHCs that opt into the advanced approaches treatment ofAOCI.
7 Certain AOCI items are subject to transition into projected regulatory capital.Those transitions are 20 percent included in projected regulatory capital for2014, 40 percent included in projected regulatory capital for 2015, and60 percent included in projected regulatory capital for 2016.
March 2015 127

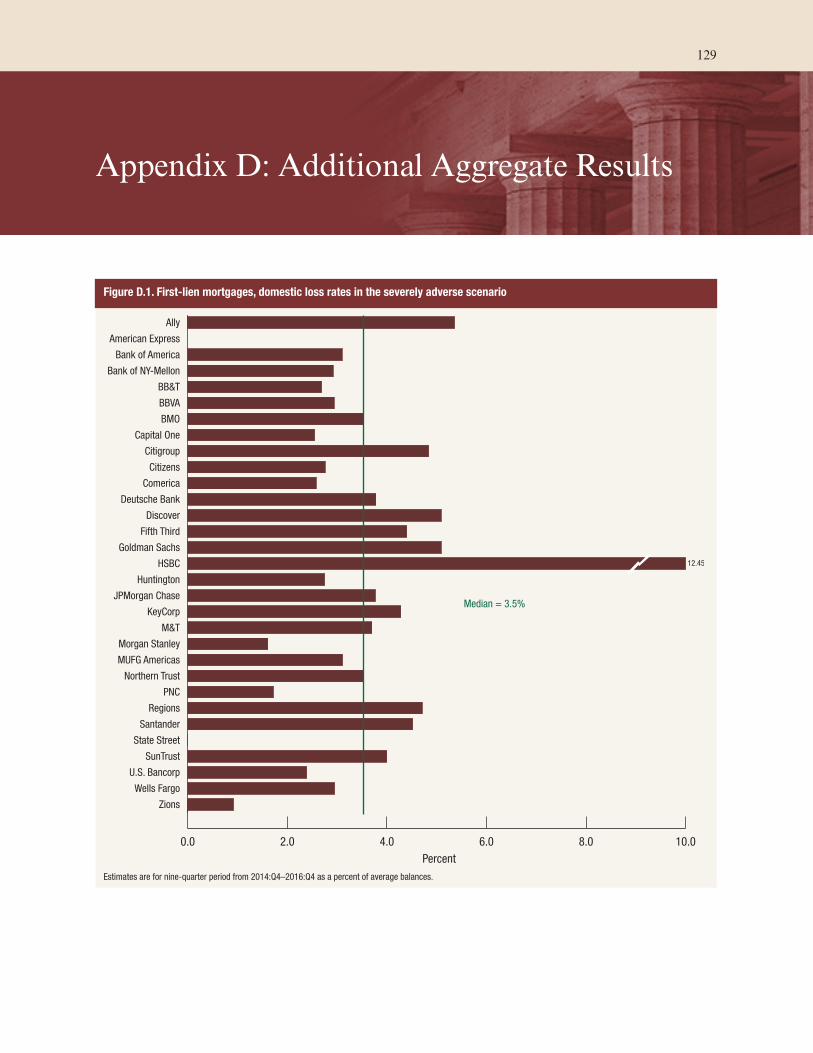
Appendix D: Additional Aggregate Results
Figure D.1. First-lien mortgages, domestic loss rates in the severely adverse scenario
0.0 2.0 4.0 6.0 8.0 10.0
Zions
Wells Fargo
U.S. Bancorp
SunTrust
State Street
Santander
Regions
PNC
Northern Trust
MUFG Americas
Morgan Stanley
M&T
KeyCorp
JPMorgan Chase
Huntington
HSBC
Goldman Sachs
Fifth Third
Discover
Deutsche Bank
Comerica
Citizens
Citigroup
Capital One
BMO
BBVA
BB&T
Bank of NY-Mellon
Bank of America
American Express
Ally
Percent
Median = 3.5%
12.45
Estimates are for nine-quarter period from 2014:Q4–2016:Q4 as a percent of average balances.
129
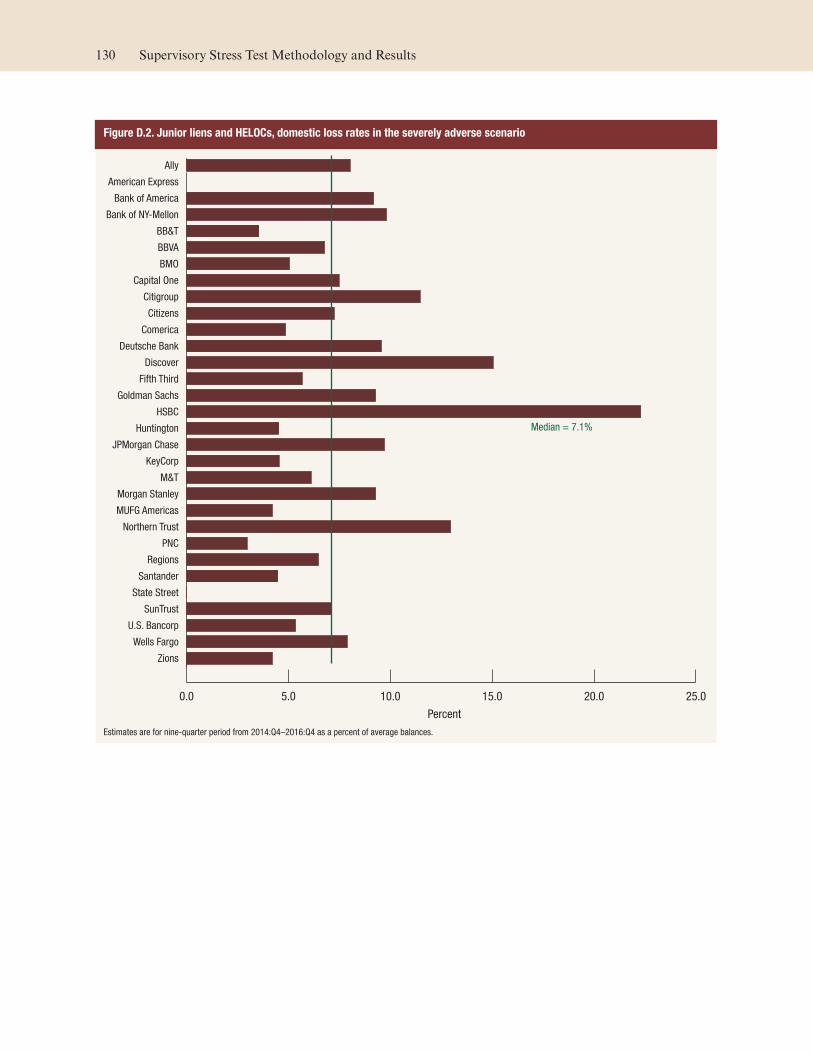
Figure D.2. Junior liens and HELOCs, domestic loss rates in the severely adverse scenario
0.0 5.0 10.0 15.0 20.0 25.0
Zions
Wells Fargo
U.S. Bancorp
SunTrust
State Street
Santander
Regions
PNC
Northern Trust
MUFG Americas
Morgan Stanley
M&T
KeyCorp
JPMorgan Chase
Huntington
HSBC
Goldman Sachs
Fifth Third
Discover
Deutsche Bank
Comerica
Citizens
Citigroup
Capital One
BMO
BBVA
BB&T
Bank of NY-Mellon
Bank of America
American Express
Ally
Percent
Median = 7.1%
Estimates are for nine-quarter period from 2014:Q4–2016:Q4 as a percent of average balances.
130 Supervisory Stress Test Methodology and Results
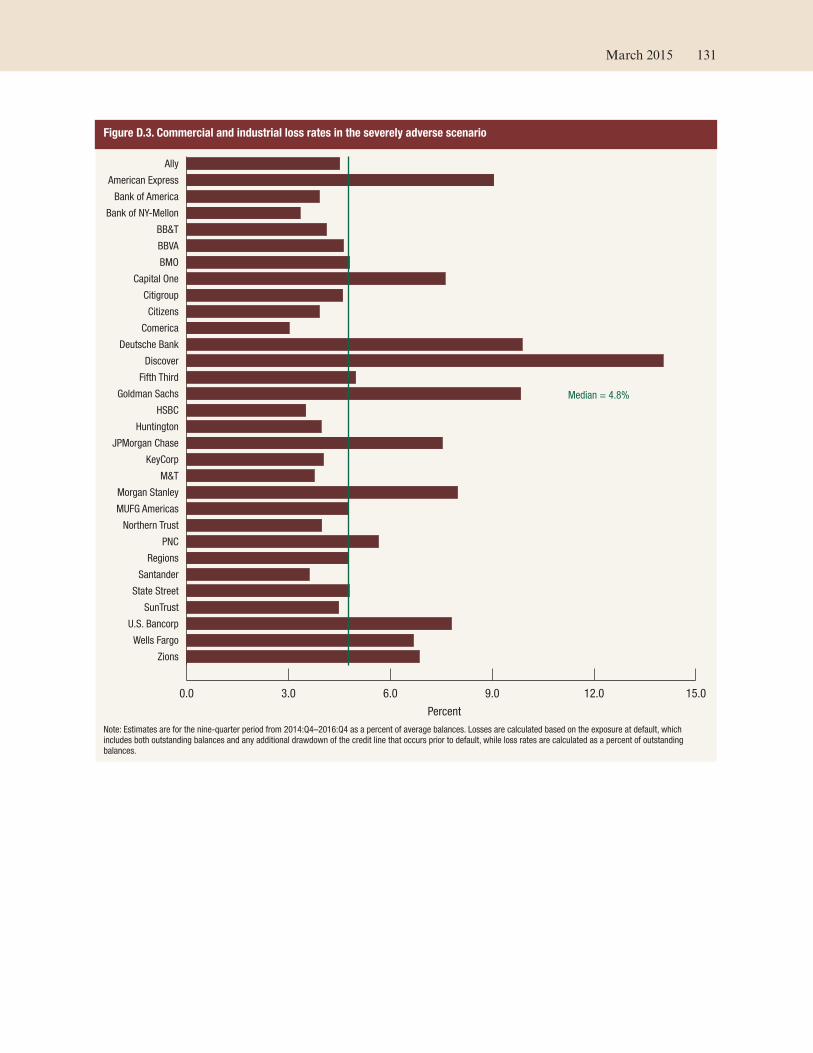
Figure D.3. Commercial and industrial loss rates in the severely adverse scenario
0.0 3.0 6.0 9.0 12.0 15.0
Zions
Wells Fargo
U.S. Bancorp
SunTrust
State Street
Santander
Regions
PNC
Northern Trust
MUFG Americas
Morgan Stanley
M&T
KeyCorp
JPMorgan Chase
Huntington
HSBC
Goldman Sachs
Fifth Third
Discover
Deutsche Bank
Comerica
Citizens
Citigroup
Capital One
BMO
BBVA
BB&T
Bank of NY-Mellon
Bank of America
American Express
Ally
Percent
Median = 4.8%
Note: Estimates are for the nine-quarter period from 2014:Q4–2016:Q4 as a percent of average balances. Losses are calculated based on the exposure at default, whichincludes both outstanding balances and any additional drawdown of the credit line that occurs prior to default, while loss rates are calculated as a percent of outstandingbalances.
March 2015 131

Figure D.4. Commercial real estate, domestic loss rates in the severely adverse scenario
0.0 5.0 10.0 15.0 20.0 25.0
Zions
Wells Fargo
U.S. Bancorp
SunTrust
State Street
Santander
Regions
PNC
Northern Trust
MUFG Americas
Morgan Stanley
M&T
KeyCorp
JPMorgan Chase
Huntington
HSBC
Goldman Sachs
Fifth Third
Discover
Deutsche Bank
Comerica
Citizens
Citigroup
Capital One
BMO
BBVA
BB&T
Bank of NY-Mellon
Bank of America
American Express
Ally
Percent
Median = 8.4%
31.64
29.37
Note: Estimates are for the nine-quarter period from 2014:Q4–2016:Q4 as a percent of average balances.
132 Supervisory Stress Test Methodology and Results

Figure D.5. Credit card loss rates in the severely adverse scenario
0.0 5.0 10.0 15.0 20.0 25.0
Zions
Wells Fargo
U.S. Bancorp
SunTrust
State Street
Santander
Regions
PNC
Northern Trust
MUFG Americas
Morgan Stanley
M&T
KeyCorp
JPMorgan Chase
Huntington
HSBC
Goldman Sachs
Fifth Third
Discover
Deutsche Bank
Comerica
Citizens
Citigroup
Capital One
BMO
BBVA
BB&T
Bank of NY-Mellon
Bank of America
American Express
Ally
Percent
Median = 14.1%
Note: Estimates are for the nine-quarter period from 2014:Q4–2016:Q4 as a percent of average balances.
March 2015 133
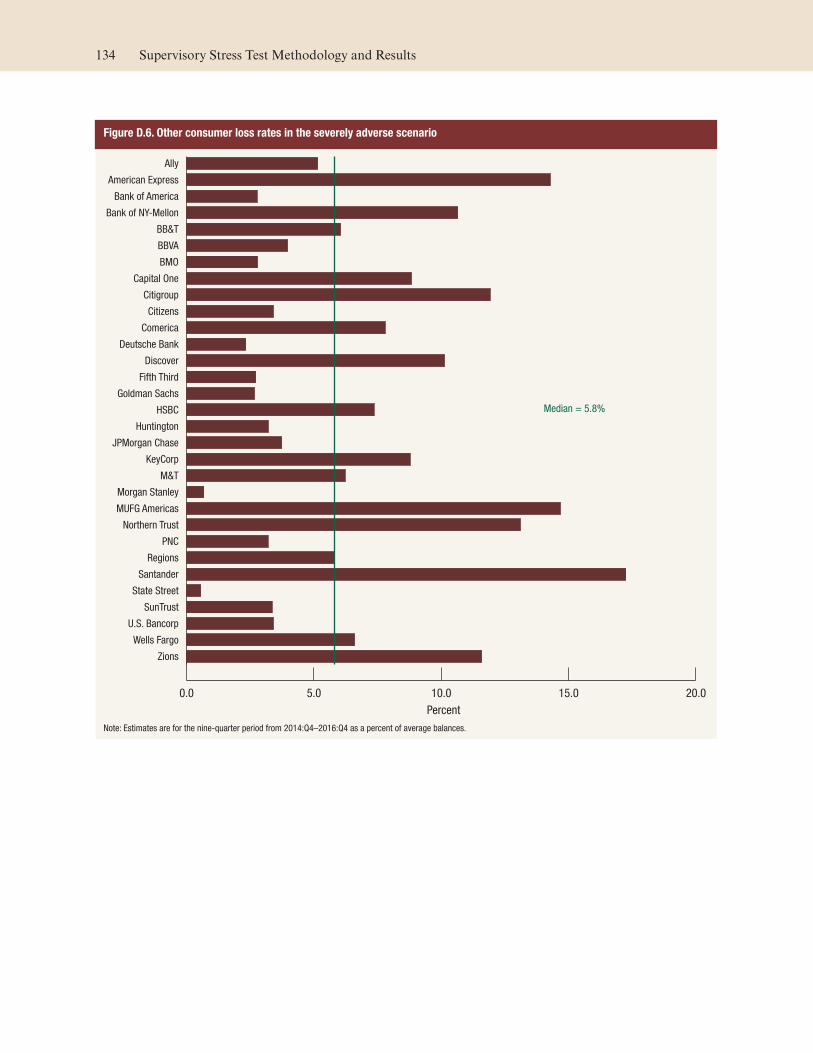
Figure D.6. Other consumer loss rates in the severely adverse scenario
0.0 5.0 10.0 15.0 20.0
Zions
Wells Fargo
U.S. Bancorp
SunTrust
State Street
Santander
Regions
PNC
Northern Trust
MUFG Americas
Morgan Stanley
M&T
KeyCorp
JPMorgan Chase
Huntington
HSBC
Goldman Sachs
Fifth Third
Discover
Deutsche Bank
Comerica
Citizens
Citigroup
Capital One
BMO
BBVA
BB&T
Bank of NY-Mellon
Bank of America
American Express
Ally
Percent
Median = 5.8%
Note: Estimates are for the nine-quarter period from 2014:Q4–2016:Q4 as a percent of average balances.
134 Supervisory Stress Test Methodology and Results

Figure D.7. Other loans loss rates in the severely adverse scenario
0.0 2.0 4.0 6.0 8.0 10.0
Zions
Wells Fargo
U.S. Bancorp
SunTrust
State Street
Santander
Regions
PNC
Northern Trust
MUFG Americas
Morgan Stanley
M&T
KeyCorp
JPMorgan Chase
Huntington
HSBC
Goldman Sachs
Fifth Third
Discover
Deutsche Bank
Comerica
Citizens
Citigroup
Capital One
BMO
BBVA
BB&T
Bank of NY-Mellon
Bank of America
American Express
Ally
Percent
Median = 3.2%
12.73
Note: Estimates are for the nine-quarter period from 2014:Q4–2016:Q4 as a percent of average balances.
March 2015 135
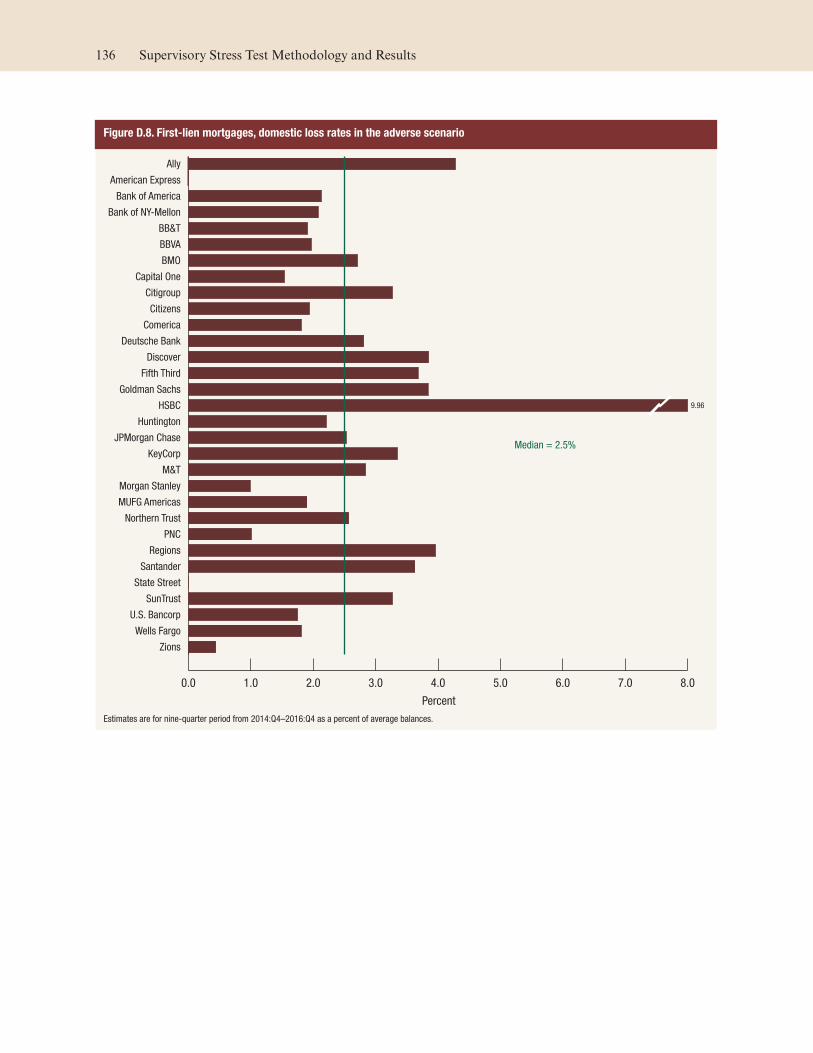
Figure D.8. First-lien mortgages, domestic loss rates in the adverse scenario
0.0 1.0 2.0 3.0 4.0 5.0 6.0 7.0 8.0
Zions
Wells Fargo
U.S. Bancorp
SunTrust
State Street
Santander
Regions
PNC
Northern Trust
MUFG Americas
Morgan Stanley
M&T
KeyCorp
JPMorgan Chase
Huntington
HSBC
Goldman Sachs
Fifth Third
Discover
Deutsche Bank
Comerica
Citizens
Citigroup
Capital One
BMO
BBVA
BB&T
Bank of NY-Mellon
Bank of America
American Express
Ally
Percent
Median = 2.5%
9.96
Estimates are for nine-quarter period from 2014:Q4–2016:Q4 as a percent of average balances.
136 Supervisory Stress Test Methodology and Results
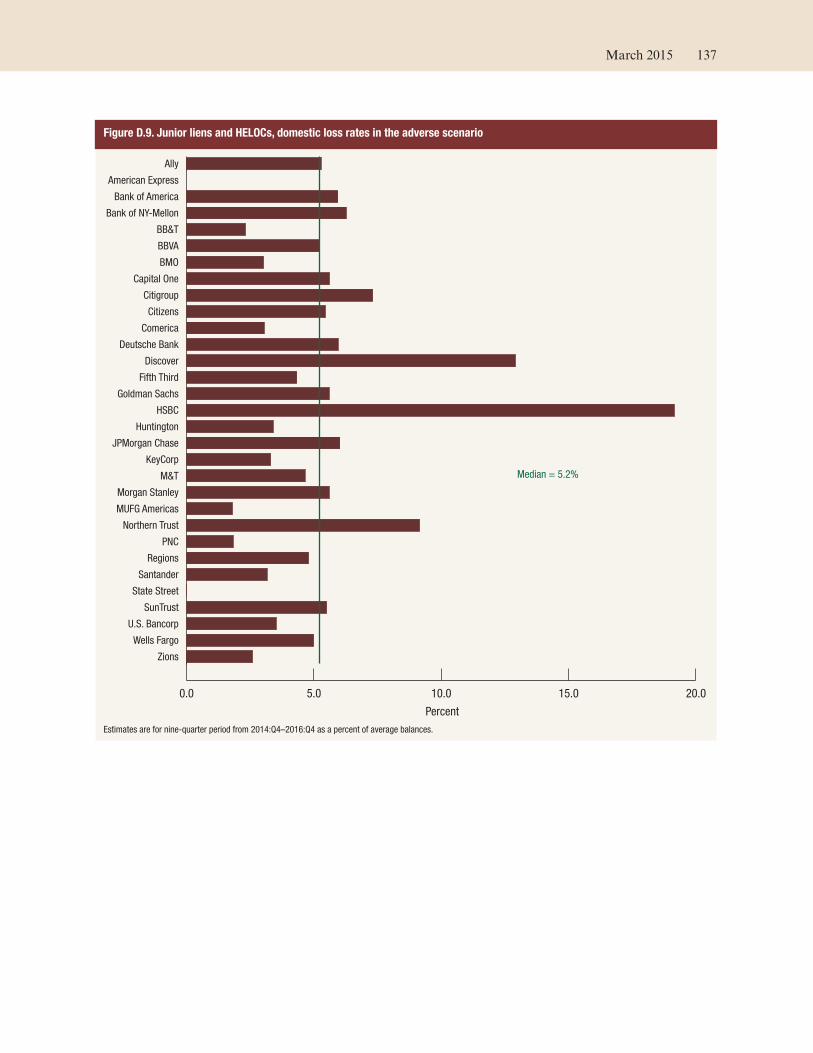
Figure D.9. Junior liens and HELOCs, domestic loss rates in the adverse scenario
0.0 5.0 10.0 15.0 20.0
Zions
Wells Fargo
U.S. Bancorp
SunTrust
State Street
Santander
Regions
PNC
Northern Trust
MUFG Americas
Morgan Stanley
M&T
KeyCorp
JPMorgan Chase
Huntington
HSBC
Goldman Sachs
Fifth Third
Discover
Deutsche Bank
Comerica
Citizens
Citigroup
Capital One
BMO
BBVA
BB&T
Bank of NY-Mellon
Bank of America
American Express
Ally
Percent
Median = 5.2%
Estimates are for nine-quarter period from 2014:Q4–2016:Q4 as a percent of average balances.
March 2015 137
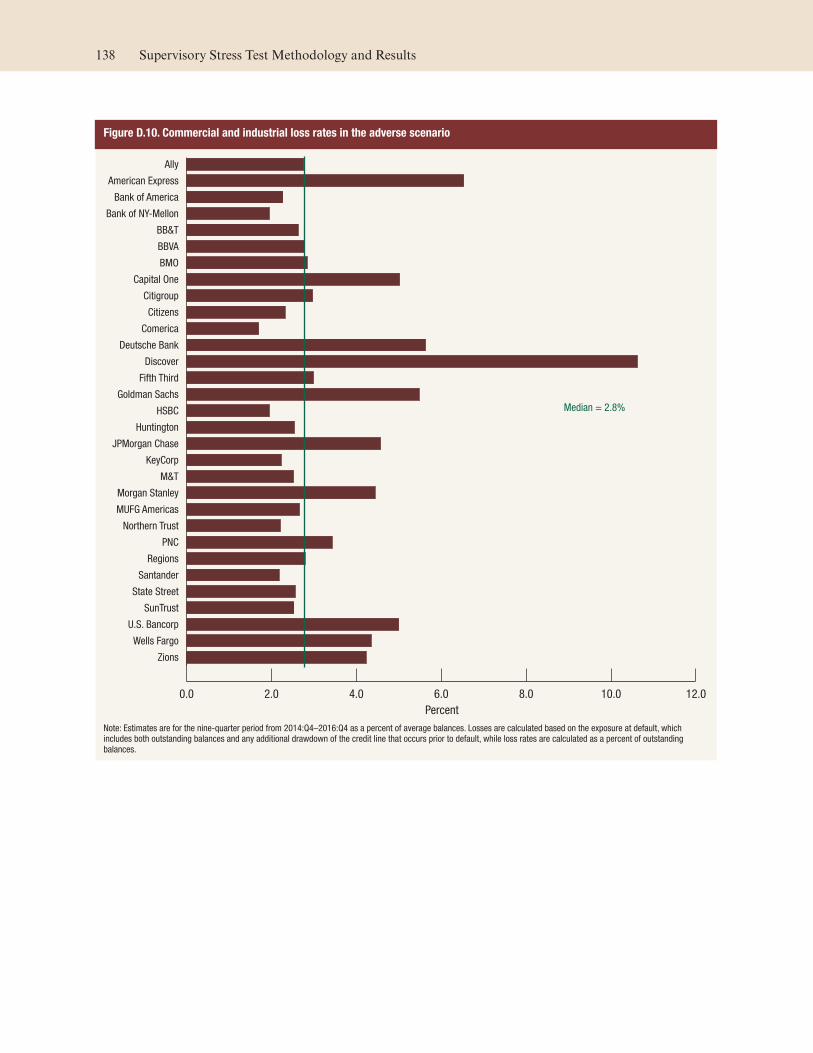
Figure D.10. Commercial and industrial loss rates in the adverse scenario
0.0 2.0 4.0 6.0 8.0 10.0 12.0
Zions
Wells Fargo
U.S. Bancorp
SunTrust
State Street
Santander
Regions
PNC
Northern Trust
MUFG Americas
Morgan Stanley
M&T
KeyCorp
JPMorgan Chase
Huntington
HSBC
Goldman Sachs
Fifth Third
Discover
Deutsche Bank
Comerica
Citizens
Citigroup
Capital One
BMO
BBVA
BB&T
Bank of NY-Mellon
Bank of America
American Express
Ally
Percent
Median = 2.8%
Note: Estimates are for the nine-quarter period from 2014:Q4–2016:Q4 as a percent of average balances. Losses are calculated based on the exposure at default, whichincludes both outstanding balances and any additional drawdown of the credit line that occurs prior to default, while loss rates are calculated as a percent of outstandingbalances.
138 Supervisory Stress Test Methodology and Results
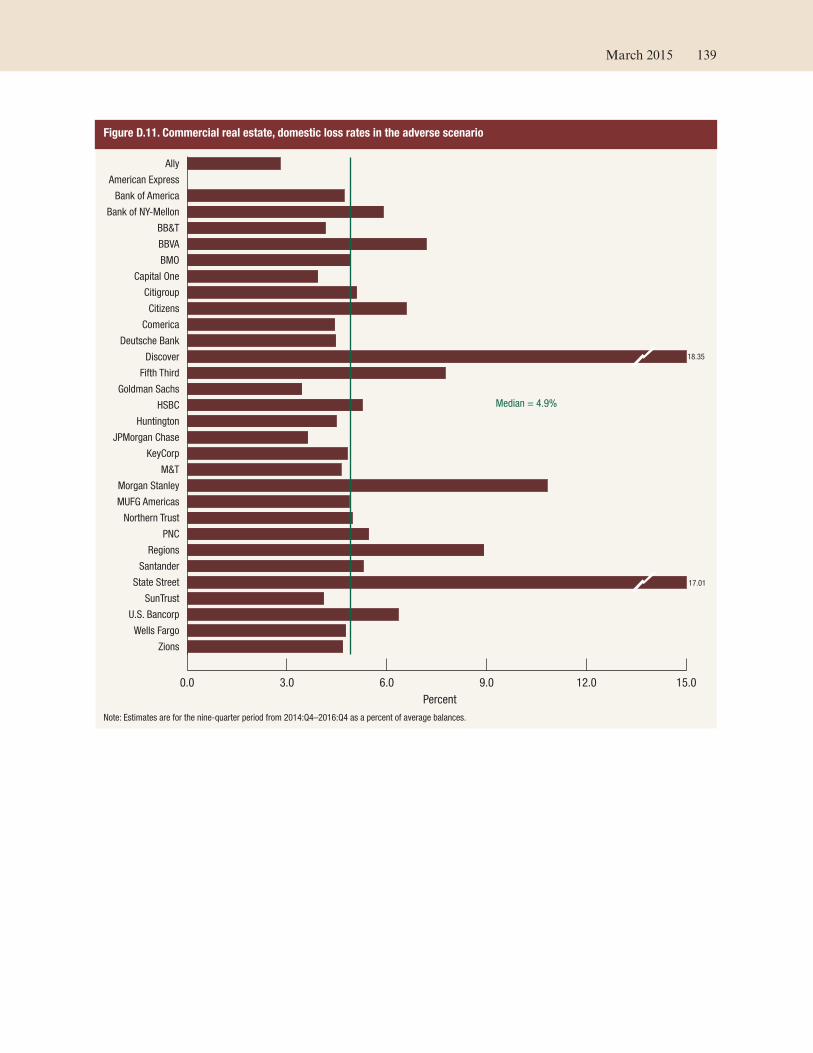
Figure D.11. Commercial real estate, domestic loss rates in the adverse scenario
0.0 3.0 6.0 9.0 12.0 15.0
Zions
Wells Fargo
U.S. Bancorp
SunTrust
State Street
Santander
Regions
PNC
Northern Trust
MUFG Americas
Morgan Stanley
M&T
KeyCorp
JPMorgan Chase
Huntington
HSBC
Goldman Sachs
Fifth Third
Discover
Deutsche Bank
Comerica
Citizens
Citigroup
Capital One
BMO
BBVA
BB&T
Bank of NY-Mellon
Bank of America
American Express
Ally
Percent
Median = 4.9%
18.35
17.01
Note: Estimates are for the nine-quarter period from 2014:Q4–2016:Q4 as a percent of average balances.
March 2015 139
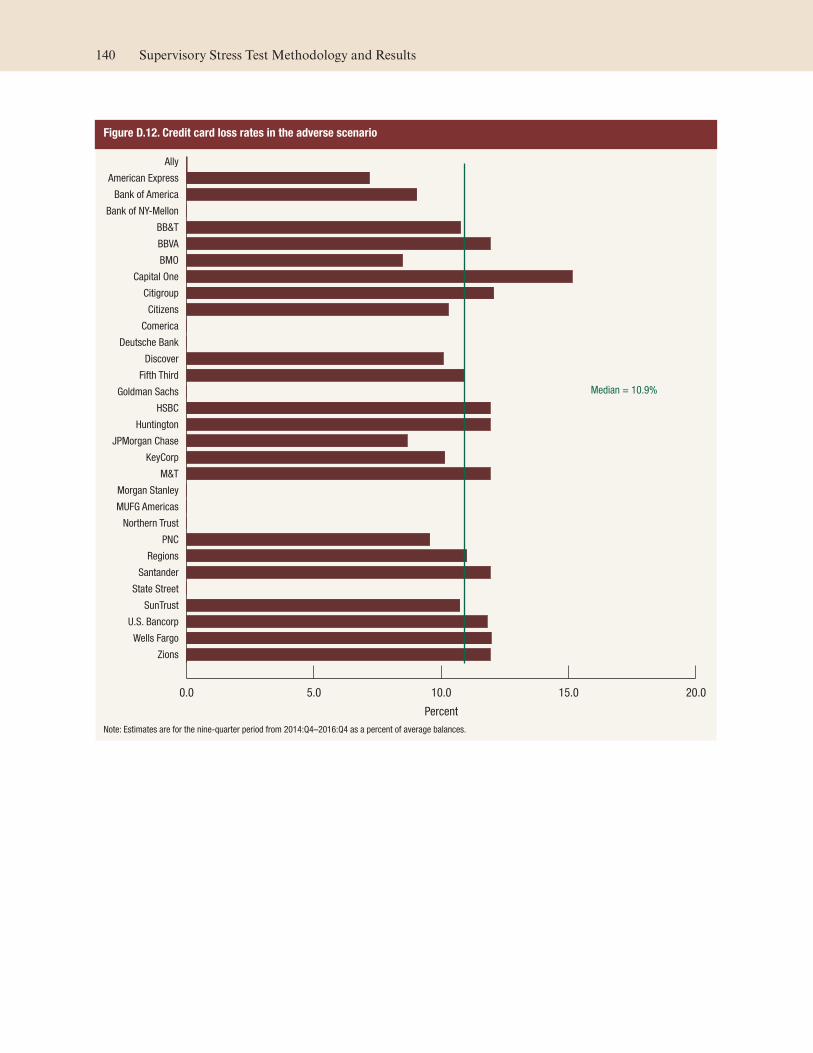
Figure D.12. Credit card loss rates in the adverse scenario
0.0 5.0 10.0 15.0 20.0
Zions
Wells Fargo
U.S. Bancorp
SunTrust
State Street
Santander
Regions
PNC
Northern Trust
MUFG Americas
Morgan Stanley
M&T
KeyCorp
JPMorgan Chase
Huntington
HSBC
Goldman Sachs
Fifth Third
Discover
Deutsche Bank
Comerica
Citizens
Citigroup
Capital One
BMO
BBVA
BB&T
Bank of NY-Mellon
Bank of America
American Express
Ally
Percent
Median = 10.9%
Note: Estimates are for the nine-quarter period from 2014:Q4–2016:Q4 as a percent of average balances.
140 Supervisory Stress Test Methodology and Results

Figure D.13. Other consumer loss rates in the adverse scenario
0.0 3.0 6.0 9.0 12.0 15.0
Zions
Wells Fargo
U.S. Bancorp
SunTrust
State Street
Santander
Regions
PNC
Northern Trust
MUFG Americas
Morgan Stanley
M&T
KeyCorp
JPMorgan Chase
Huntington
HSBC
Goldman Sachs
Fifth Third
Discover
Deutsche Bank
Comerica
Citizens
Citigroup
Capital One
BMO
BBVA
BB&T
Bank of NY-Mellon
Bank of America
American Express
Ally
Percent
Median = 4.2%
Note: Estimates are for the nine-quarter period from 2014:Q4–2016:Q4 as a percent of average balances.
March 2015 141
Figure D.14. Other loans loss rates in the adverse scenario
0.0 1.0 2.0 3.0 4.0 5.0
Zions
Wells Fargo
U.S. Bancorp
SunTrust
State Street
Santander
Regions
PNC
Northern Trust
MUFG Americas
Morgan Stanley
M&T
KeyCorp
JPMorgan Chase
Huntington
HSBC
Goldman Sachs
Fifth Third
Discover
Deutsche Bank
Comerica
Citizens
Citigroup
Capital One
BMO
BBVA
BB&T
Bank of NY-Mellon
Bank of America
American Express
Ally
Percent
Median = 1.8%
7.14
Note: Estimates are for the nine-quarter period from 2014:Q4–2016:Q4 as a percent of average balances.
142 Supervisory Stress Test Methodology and Results


0315
www.federalreserve.gov
@FederalReserve Flickr.com/FederalReserve YouTube.com/FedReserveBoard