Embed Size (px)
Citation preview
cameroonNutritioN
GLANCEat a
Technical Notes Stunting is low height for age (too short).
underweight is low weight for age (too small).
Wasting is low weight for height (too thin).
Current stunting, underweight, and wasting estimates are based on comparison of the most recent survey data with the WHO Child Growth Standards, released in 2006. They are not directly comparable to the wealth quintile data shown in Figure 2, which are calculated according to the previously-used NCHS/WHO reference population.
Low birth weight is a birth weight less than 2500g.
overweight is a body mass index (kg /m2) of ≥ 25; obesity is a BMI of ≥ 30.
The methodology for calculating nationwide costs of vitamin and mineral deficiencies, and interventions included in the cost of scaling up, can be found at: www.worldbank.org/nutrition/profiles
Annually, Cameroon loses over US$187 million in GDP to vitamin and mineral deficiencies.3,4 Scaling
up core micronutrient nutrition interventions would cost less than US$11 million per year.
(See Technical Notes for more information)
Key Actions to Address Malnutrition:increase nutrition capacity within the Ministries of Health and Agriculture.
improve infant and young child feeding through effective education and counseling services.
increase coverage of vitamin A supplementation and deworming for young children and iron supplementation for pregnant women.
Achieve universal salt iodization.
improve dietary diversity through promoting home production of a diversity of foods and market and infrastructure development.
Country Context HDi ranking: 153rd out of 182 countries1
Life expectancy at birth: 51 years2
Lifetime risk of maternal death: 1 in 242
under-five mortality rate: 131 per 1,000 live births2
Global ranking of stunting prevalence: 43rd highest out of 136 countries2
The Costs of Malnutrition • Overone-thirdofchilddeathsareduetoundernu-
trition,mostlyfromincreasedseverityofdisease.2• Childrenwhoareundernourishedbetweencon-
ceptionandagetwoareathighriskforimpairedcognitive development, which adversely affectsthecountry’sproductivityandgrowth.
• TheAfricaRegionisanticipatedtoloseatleastacumulativeUS$4.0billion tochronicdiseaseby2015.5
• Theeconomiccostsofundernutritionandover-weightincludedirectcostssuchastheincreasedburden on the health care system, and indirectcostsoflostproductivity.
• Childhood anemia alone is associated with a2.5%dropinadultwages.6
Where Does Cameroon Stand?• 36%ofchildrenundertheageoffivearestunted,
16%areunderweight,and7%arewasted.2
• 45%ofthoseaged15andaboveareoverweightorobese.7
• 11%ofinfantsarebornwithalowbirthweight.2
• CameroonwillnotmeetMDG1c(halving1990ratesofchildunderweightby2015)withbusinessasusual.8
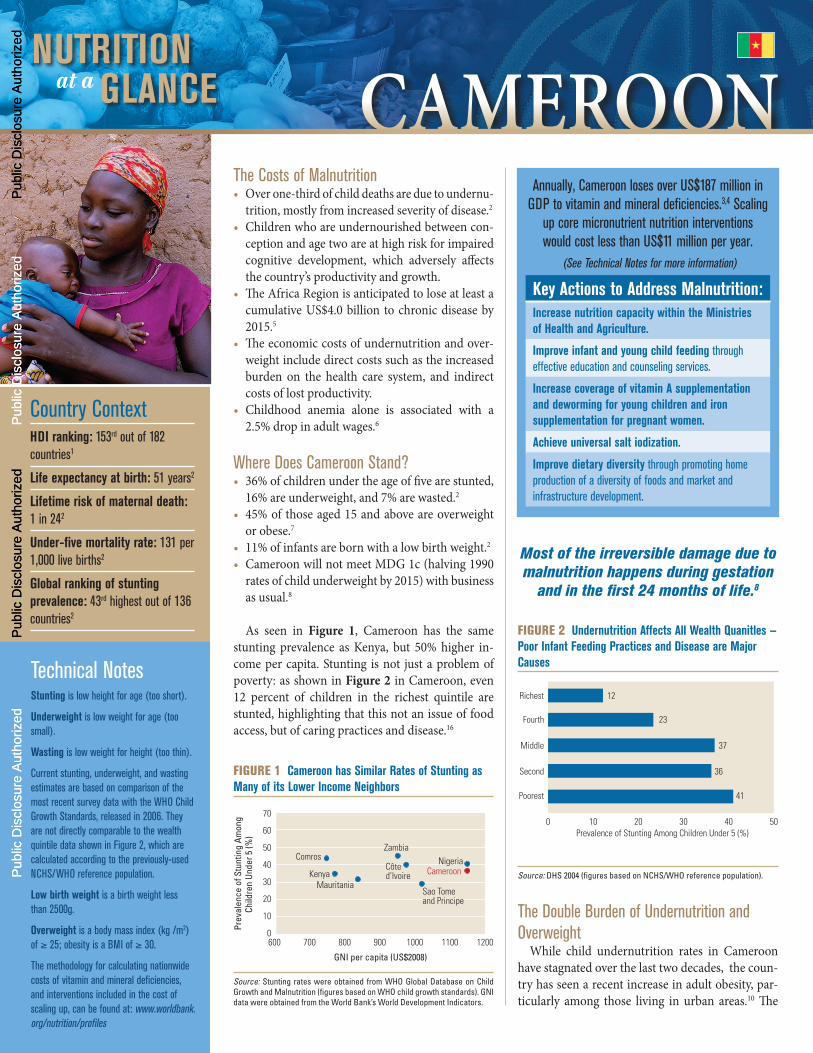
As seen in Figure 1, Cameroon has the samestunting prevalence as Kenya, but 50% higher in-comepercapita.Stunting isnot justaproblemofpoverty:asshowninFigure 2 inCameroon,even12 percent of children in the richest quintile arestunted,highlightingthatthisnotanissueoffoodaccess,butofcaringpracticesanddisease.16
Figure 1 Cameroon has Similar rates of Stunting as Many of its Lower income Neighbors
GNI per capita (US$2008)
Prev
alen
ce o
f Stu
ntin
g Am
ong
Child
ren
Unde
r 5 (%
)
600 700 800 900 1000 1100 12000
10
20
30
40
50
60
70
CameroonNigeria
Zambia
Côte d’Ivoire
Sao Tome and Principe
MauritaniaKenya
Comros
Source: Stunting rates were obtained from WHO Global Database on Child Growth and Malnutrition (figures based on WHO child growth standards). GNI data were obtained from the World Bank’s World Development Indicators.
The Double Burden of Undernutrition and Overweight
While child undernutrition rates in Cameroonhavestagnatedoverthelasttwodecades,thecoun-tryhasseenarecentincreaseinadultobesity,par-ticularly among those living in urban areas.10 The
Most of the irreversible damage due to malnutrition happens during gestation
and in the first 24 months of life.8
Figure 2 undernutrition Affects All Wealth Quanitles —Poor infant Feeding Practices and Disease are Major Causes
Poorest 41
Second 36
Middle 37
Richest 12
Fourth 23
10 20 30 40 500Prevalence of Stunting Among Children Under 5 (%)
Source: DHS 2004 (figures based on NCHS/WHO reference population).
Pub
lic D
iscl
osur
e A
utho
rized
Pub
lic D
iscl
osur
e A
utho
rized
Pub
lic D
iscl
osur
e A
utho
rized
Pub
lic D
iscl
osur
e A
utho
rized
Pub
lic D
iscl
osur
e A
utho
rized
Pub
lic D
iscl
osur
e A
utho
rized
Pub
lic D
iscl
osur
e A
utho
rized
Pub
lic D
iscl
osur
e A
utho
rized
THE WORLD BANK
Produced with support from the Japan trust Fund for Scaling up Nutrition
cameroonSolutions to Primary Causes of Undernutrition
Poor infant Feeding Practices• Only 20% of all newborns receive breast milk
within one hour of birth.2
• Four out of five infants under six months are not exclusively breastfed.2
• During the important transition period to a mix of breast milk and solid foods between six and nine months of age, more than one-third of infants are not fed appropriately with both breast milk and other foods.2
Solution: Support women and their families to practice optimal breastfeeding and ensure timely and adequate complementary feeding. Breast milk fulfills all nutri-tional needs of infants up to six months of age, boosts their immunity, and reduces exposure to infections. In high HIV settings, follow WHO 2009 HIV and infant feeding revised principles and recommendations.13
High Disease Burden• Undernutrition increases the likelihood of falling
sick and the severity of disease.• Undernourished children who fall sick are much
more likely to die from illness than well-nourished children.
• Parasitic infestation diverts nutrients from the body and can cause blood loss and anemia.
Solution: Prevent and treat childhood infection and other disease. Hand-washing, deworming, zinc sup-plements during and after diarrhea, and continued feeding during illness are important.
Limited Access to Nutritious Food• 23% of households are food insecure, according to
a measure of per capita access to calories.9 Many more households likely lack access to diverse diets year round, particularly in the North and Extreme North Regions.
• Achieving food security means ensuring quality and continuity of food access, in addition to quantity, for all household members.
• Dietary diversity is essential for food security.
Solution: Involve multiple sectors including agricul-ture, education, social protection, transport, gender, the food industry, health and other sectors, to ensure that diverse, nutritious diets are available and acces-sible to all household members.
coexistence of undernutrition and overnutritionmay lead toparticular risks:Low-birthweight in-fantsandstuntedchildrenmaybeatgreaterriskofchronicdiseasessuchasdiabetesandheartdiseasethanchildrenwhostartoutwell-nourished.11
This “double burden” is the result of variousfactors. Progress in improving community infra-structure and development of sound public healthsystems has been slow, thwarting efforts to reduceundernutrition; while rapid urbanization and theadoption of diets high in refined carbohydrates,saturated fats and sugars, combined with a moresedentary lifestyle are commonly cited as the ma-jor contributors to the increase in overweight andchronicdiseases.10,12
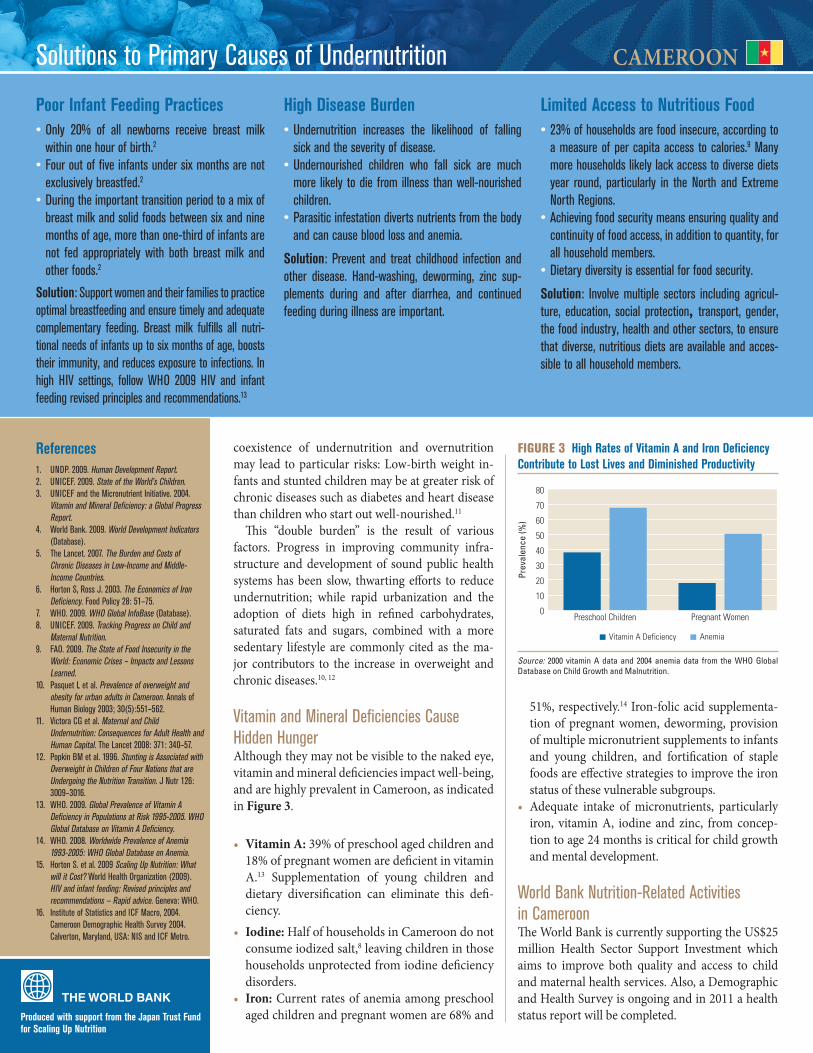
Vitamin and Mineral Deficiencies Cause Hidden HungerAlthoughtheymaynotbevisibletothenakedeye,vitaminandmineraldeficienciesimpactwell-being,andarehighlyprevalentinCameroon,asindicatedinFigure 3.
• Vitamin A:39%ofpreschoolagedchildrenand18%ofpregnantwomenaredeficientinvitaminA.13 Supplementation of young children anddietary diversification can eliminate this defi-ciency.
• Iodine:HalfofhouseholdsinCameroondonotconsumeiodizedsalt,8leavingchildreninthosehouseholdsunprotectedfromiodinedeficiencydisorders.
• Iron:Current ratesofanemiaamongpreschoolagedchildrenandpregnantwomenare68%and
51%,respectively.14Iron-folicacidsupplementa-tionofpregnantwomen,deworming,provisionofmultiplemicronutrientsupplementstoinfantsand young children, and fortification of staplefoodsareeffectivestrategiestoimprovetheironstatusofthesevulnerablesubgroups.
• Adequate intake of micronutrients, particularlyiron, vitamin A, iodine and zinc, from concep-tiontoage24monthsiscriticalforchildgrowthandmentaldevelopment.
World Bank Nutrition-Related Activities in CameroonTheWorldBankiscurrentlysupportingtheUS$25million Health Sector Support Investment whichaims to improve both quality and access to childandmaternalhealthservices.Also,aDemographicandHealthSurveyisongoingandin2011ahealthstatusreportwillbecompleted.
references1. UNDP. 2009. Human Development Report. 2. UNICEF. 2009. State of the World’s Children.3. UNICEF and the Micronutrient Initiative. 2004.
Vitamin and Mineral Deficiency: a Global Progress Report.
4. World Bank. 2009. World Development Indicators (Database).
5. The Lancet. 2007. The Burden and Costs of Chronic Diseases in Low-Income and Middle-Income Countries.
6. Horton S, Ross J. 2003. The Economics of Iron Deficiency. Food Policy 28: 51–75.
7. WHO. 2009. WHO Global InfoBase (Database).8. UNICEF. 2009. Tracking Progress on Child and
Maternal Nutrition. 9. FAO. 2009. The State of Food Insecurity in the
World: Economic Crises – Impacts and Lessons Learned.
10. Pasquet L et al. Prevalence of overweight and obesity for urban adults in Cameroon. Annals of Human Biology 2003; 30(5):551–562.
11. Victora CG et al. Maternal and Child Undernutrition: Consequences for Adult Health and Human Capital. The Lancet 2008: 371: 340–57.
12. Popkin BM et al. 1996. Stunting is Associated with Overweight in Children of Four Nations that are Undergoing the Nutrition Transition. J Nutr 126: 3009–3016.
13. WHO. 2009. Global Prevalence of Vitamin A Deficiency in Populations at Risk 1995-2005. WHO Global Database on Vitamin A Deficiency.
14. WHO. 2008. Worldwide Prevalence of Anemia 1993-2005: WHO Global Database on Anemia.
15. Horton S. et al. 2009 Scaling Up Nutrition: What will it Cost? World Health Organization (2009). HIV and infant feeding: Revised principles and recommendations — Rapid advice. Geneva: WHO.
16. Institute of Statistics and ICF Macro, 2004. Cameroon Demographic Health Survey 2004. Calverton, Maryland, USA: NIS and ICF Metro.
Figure 3 High rates of Vitamin A and iron Deficiency Contribute to Lost Lives and Diminished Productivity
Prev
alen
ce (%
)
0
20
10
30
40
50
60
80
70
AnemiaVitamin A Deficiency
Pregnant WomenPreschool Children
Source: 2000 vitamin A data and 2004 anemia data from the WHO Global Database on Child Growth and Malnutrition.