Embed Size (px)
Citation preview
Documentation in support of MARSOP 4 Version 2016-07-22
AMDAC manual
Preface Models of Yield Production is one of the fields covered by the Agriculture Project of the Institute for Remote Sensing Applications at the Joint Research Centre of the Commission of the European Communities in Ispra (Italy). The goal of one of the studies in this field (see operation 3.2 in the MARS Project Call for Proposals:General Conditions and Detailed Specifications of August 1990) was to provide the Agriculture Project with a software package able to perform decoding, filing and quality evaluation of actual meteorological data which are used as input for agro-meteorological models. For this purpose the Actual Meteorological Database Construction (AMDaC) package is developed by MeteoConsult (Wageningen, The Netherlands), which is described in this manual.
Contents
1. Introduction
2. Extraction and decoding of data 2.1 Introduction 2.2 Bulletin-checking
2.2.1 SYNOP-checking 2.2.2 METAR-checking 2.3 Data extraction 2.4 Data decoding 2.4.1 SYNOP-decoding 2.4.2 METAR-decoding 2.5 Messages
3. Data consistency checks 3.1 Introduction 3.2 Air temperature, maximum temperature and minimum temperature 3.3 Dewpoint temperature 3.4 Amounts of CL clouds (or CM clouds if no CL clouds present) 3.5 Amount of precipitation 3.6 Pressure at sea level 3.7 Wind speed 3.8 Duration of sunshine 3.9 Snow depth 3.10 Daily global radiation
3.11 Messages
4. Observation control 4.1 Introduction 4.2 Screen lay-outs 4.2.1 Station observations 4.2.2 Diagrams 4.2.3 Maps 4.2.4 Tables 4.3 Observation elements and derived elements
4.4 Commands 4.4.1 ADD 4.4.2 BACK 4.4.3 BEGIN 4.4.4 CHECK 4.4.5 DATE 4.4.6 DELETE 4.4.7 DIAGRAM 4.4.8 ELEMENT 4.4.9 END 4.4.10 EXIT/QUIT 4.4.11 FIRST 4.4.12 FOLLOWING 4.4.13 HELP 4.4.14 LAST 4.4.15 MAP 4.4.16 MODIFY 4.4.17 NEXT 4.4.18 OBSERVATION
4.4.19 PREVIOUS 4.4.20 SHOW 4.4.21 STATION 4.4.22 TABLE
5. Computation of missing values 5.1 Introduction 5.2 Interpolation in time 5.2.1 Air temperature, maximum temperature and minimum temperature 5.2.2 Dew-point temperature 5.2.3 Wind speed 5.2.4 Total cloud cover
5.2.5 Amounts of CL clouds (or CM clouds if no CL clouds present) 5.2.6 Pressure at sea level 5.3 Messages
6. Selection of AMD stations and calculation of AMD parameters
7. Final check of AMD parameter values
8. Installation procedure in Unix Environment
Appendix A: Station list
Appendix B: Calculations of derived parameters
1 Introduction The Actual Meteorological Database Construction (AMDaC) package is a software package developed for the decoding, filing and quality evaluation of meteorological data. In conformity with the functions specified in operation 3.2 of the MARS Project Call for Proposals: General Conditions and Detailed Specifications (August 1990) the AMDaC package is able to: - decode INTERMEDIATE-hour and MAIN-hour SYNOP-reports (FM 12-VIII) and
METAR-reports (FM 15-VIII) from weather stations in the EC-countries, circulating on the Global Telecommunication System (GTS);
- check the quality and correct the obvious errors in the received weather reports; - store the coded and decoded information in two separate databases with direct
access files; - perform time consistency checks to compare the values of reported parameters with
those previously or subsequently reported for the same station; - correct automatically obvious errors detected while performing consistency checks; - fill up automatically gaps in the database through interpolation based on time
consistency criteria; - flag errors and dubious observations which can not automatically be corrected, and
write these to a log file; - extraction or calculation and storage of the following parameters in a separate
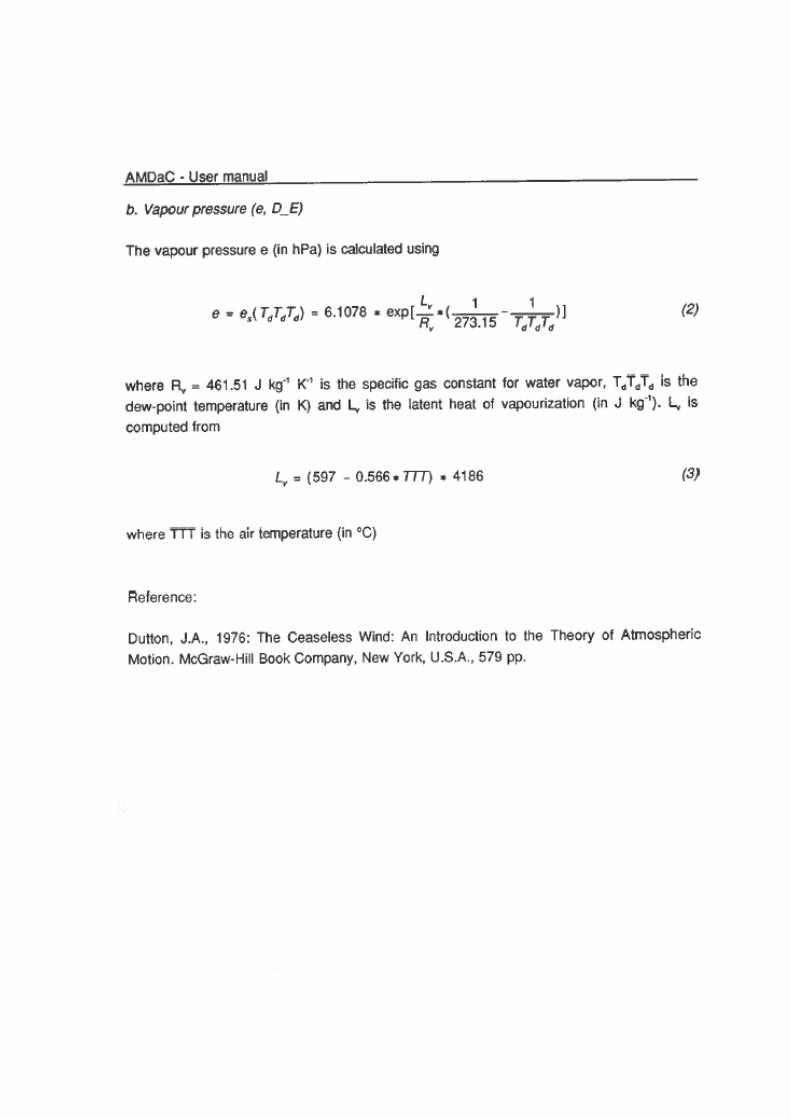
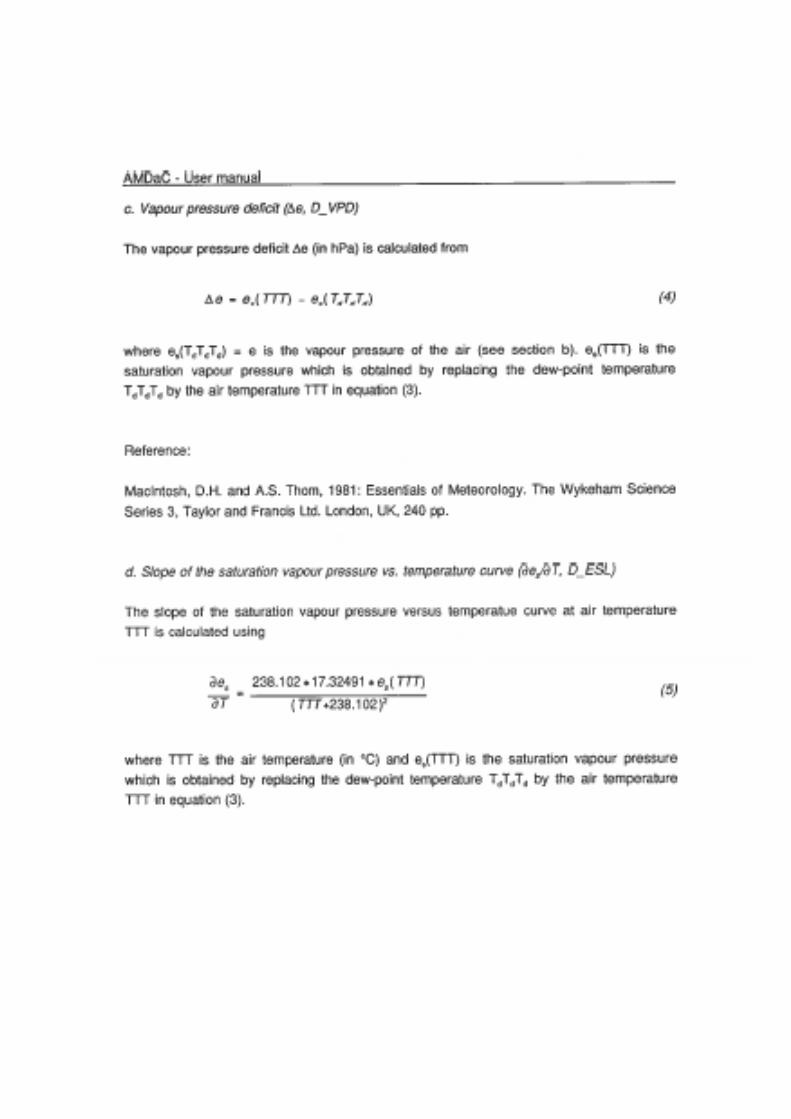
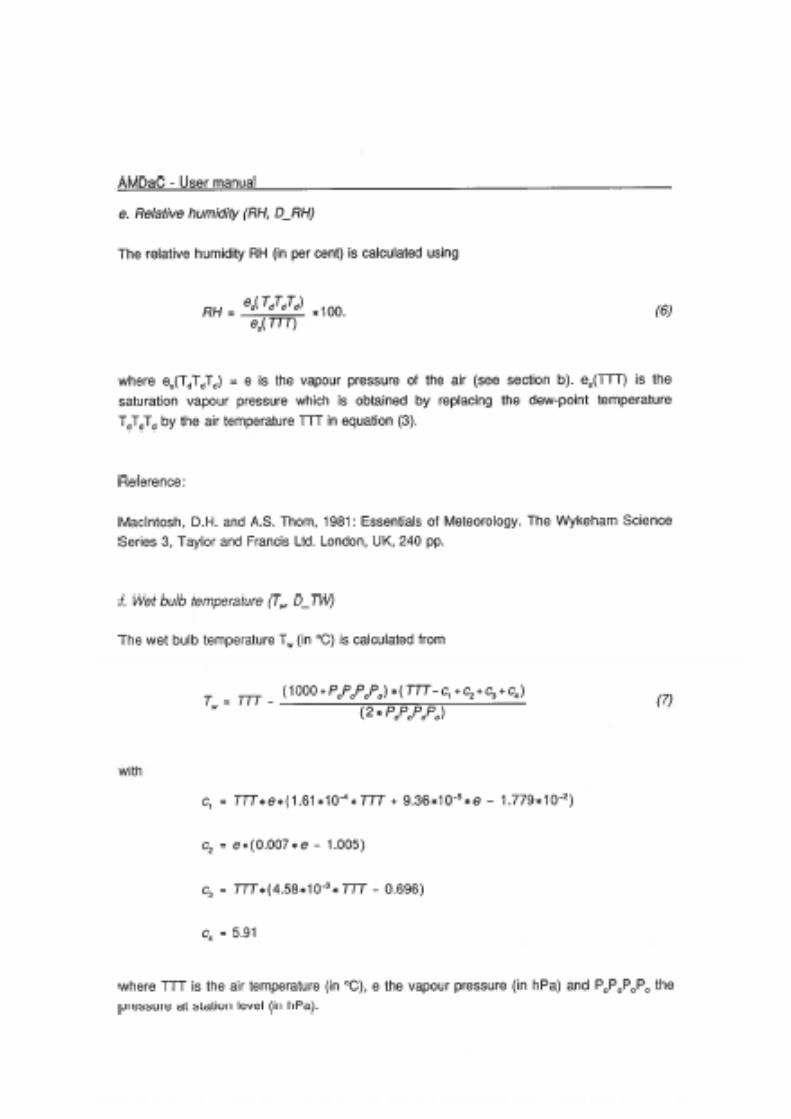
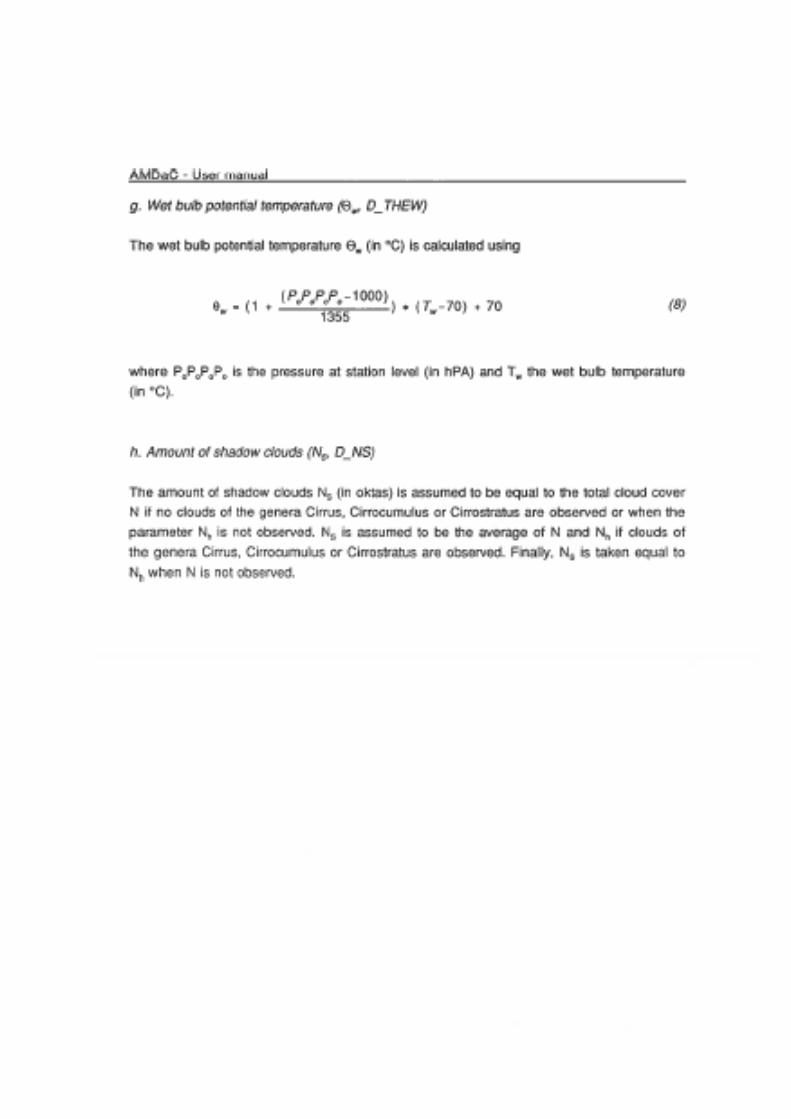
database: - sunshine duration; - total 24 hour precipitation (6 UTC - 6 UTC); - daily mean cloud cover; - daily mean wind speed at 10 metres; - daily mean vapour pressure; - air temperature and vapour pressure at 6, 9, 12, 15 and 18 UTC; - maximum and minimum temperature; - total cloud cover during daytime (i.e. 6-18 UTC); - mean daytime visibility; - state of the soil; - calculated daily mean vapour pressure deficit and slope of the saturated vapour
pressure vs. temperature curve; - calculated amount of shadow clouds during daytime (i.e. 6-18 UTC); - calculated sunshine duration; - calculated global radiation; - calculated evapotranspiration according to the modified Penman formula.
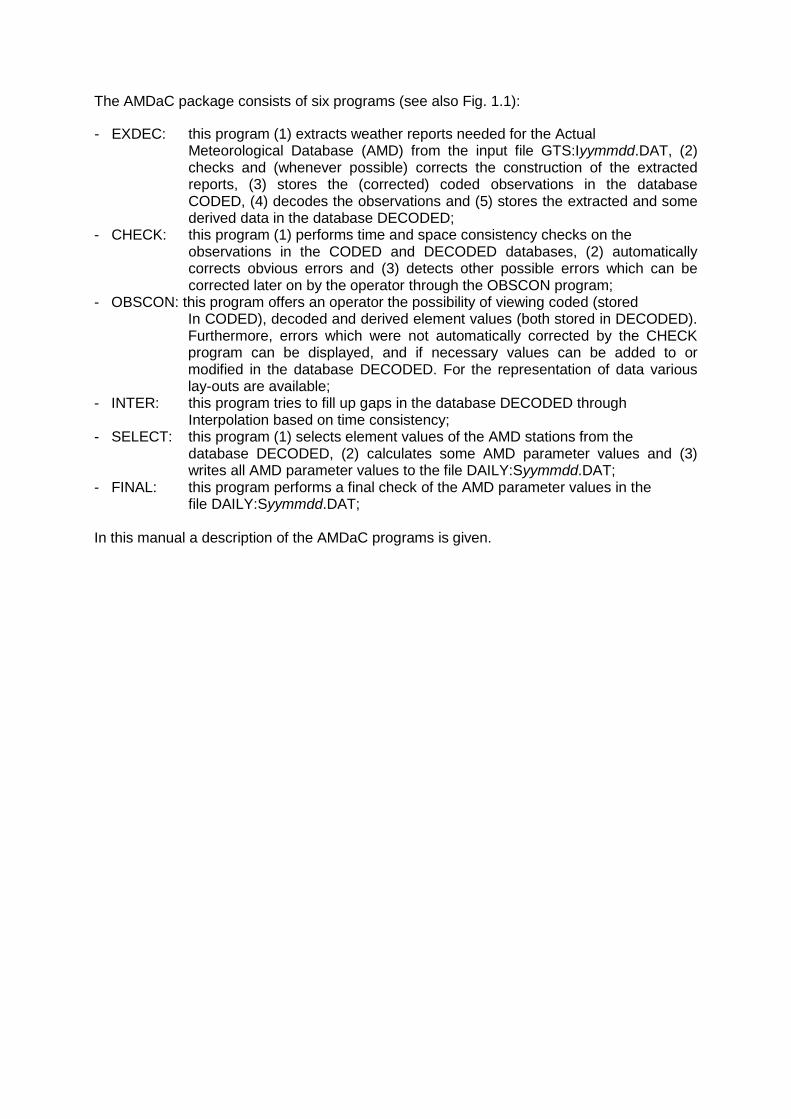
The AMDaC package consists of six programs (see also Fig. 1.1):
- EXDEC: this program (1) extracts weather reports needed for the Actual Meteorological Database (AMD) from the input file GTS:Iyymmdd.DAT, (2) checks and (whenever possible) corrects the construction of the extracted reports, (3) stores the (corrected) coded observations in the database CODED, (4) decodes the observations and (5) stores the extracted and some derived data in the database DECODED;
- CHECK: this program (1) performs time and space consistency checks on the observations in the CODED and DECODED databases, (2) automatically corrects obvious errors and (3) detects other possible errors which can be corrected later on by the operator through the OBSCON program;
- OBSCON: this program offers an operator the possibility of viewing coded (stored In CODED), decoded and derived element values (both stored in DECODED). Furthermore, errors which were not automatically corrected by the CHECK program can be displayed, and if necessary values can be added to or modified in the database DECODED. For the representation of data various lay-outs are available;
- INTER: this program tries to fill up gaps in the database DECODED through Interpolation based on time consistency; - SELECT: this program (1) selects element values of the AMD stations from the
database DECODED, (2) calculates some AMD parameter values and (3) writes all AMD parameter values to the file DAILY:Syymmdd.DAT;
- FINAL: this program performs a final check of the AMD parameter values in the file DAILY:Syymmdd.DAT;
In this manual a description of the AMDaC programs is given.
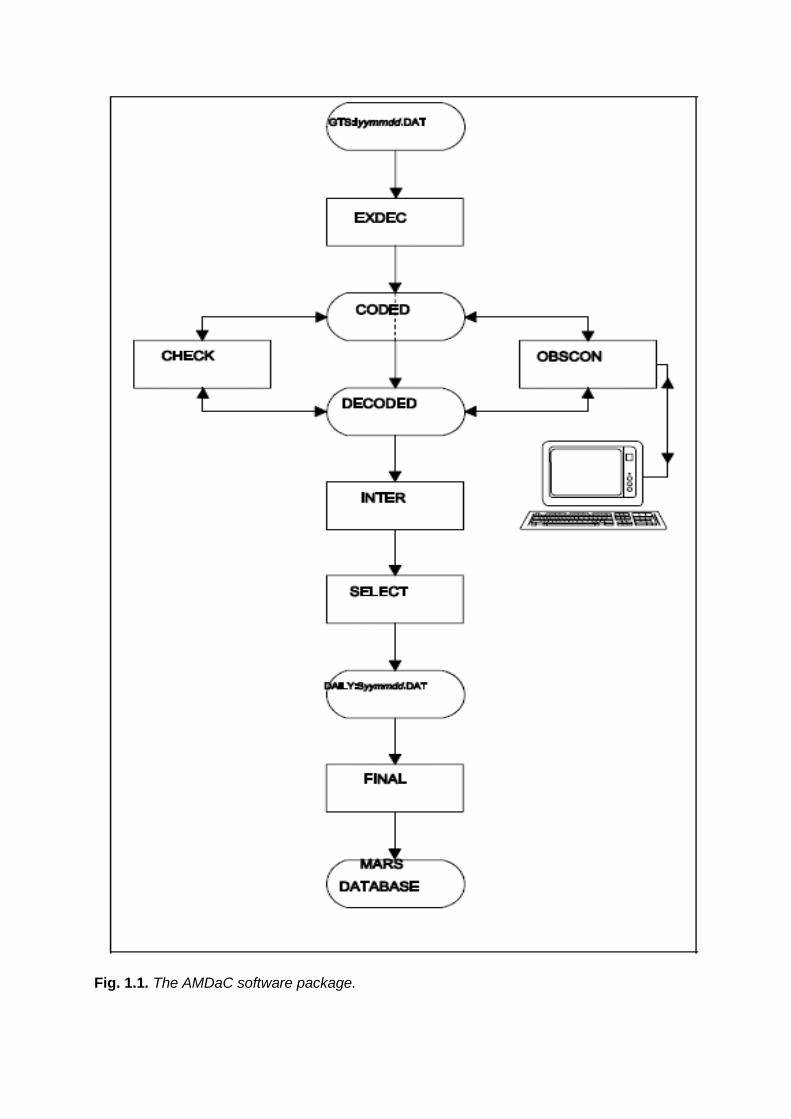
Fig. 1.1. The AMDaC software package.
2 Extraction and decoding of data
2.1 Introduction The program EXDEC takes care of the extraction and decoding of the weather reports needed for the construction of the Actual Meteorological Database (AMD). The input for the EXDEC program consists of a file named GTS:Iyymmdd.DAT (yy=year, mm=month, dd=day). This file contains the MAIN-hour and INTERMEDIATE-hour SYNOP (FM 12-VIII) and METAR (FM 15-VIII) reports of all countries of interest of one day, received through the GTS (Global Telecommunication System). In this chapter the tasks performed by the EXDEC program are described.
2.2 Bulletin-checking Before extracting the weather observations from the file GTS:Iyymmdd.DAT the EXDEC program checks the bulletins on specific errors and removes these errors. Note that this is not a check on the correctness of the observations (see chapter 3), but a check on the correctness of the bulletin construction. First a bulletin (regardless whether it is a SYNOP or METAR) is checked on: - the presence of empty lines, which are removed from the bulletin; - the presence of the NNNN sequence at the end of the bulletin, which is removed from
the bulletin; - the presence of lines which only contain an =-sign. The =-sign is moved to the end of
the previous line and the empty line thus created is removed from the bulletin; - the presence of single or multiple spaces at the beginning of a line, which are
removed from the bulletin. After this step the program checks whether the bulletin is a SYNOP-report or a METAR-report, and SYNOP-checking or METAR-checking is performed.
2.2.1 SYNOP-checking
The SYNOP-report is checked consecutively on: - the presence and correctness of the AAXX identification, which is added when
missing or modified when wrong; - the presence of the sequence 100EEE, which is removed; - the presence of alphabetical characters (except AAXX and NIL), which are converted
to their telex number equivalent; - the presence of commas, which are replaced by spaces; - the presence of strange characters in front or at the end of a group which does not
consist of 5 digits. These characters are replaced by spaces; - mutilation of the 333 identification group (e.g. '3 3 3' or ' 33 '), which is corrected; - the presence of single characters, which are replaced by a single space; - the presence of multiple spaces, which are reduced to a single space; - the presence of groups of 8, 10 and 11 characters (i.e. an identification group
attached to a normal group, two normal groups attached to each other or two normal groups not separated by a space), which are separated into two groups;
- the presence of a double =-sign at the end of a line, which is reduced to a ingle one. After this step the corrected SYNOP-report is ready for the actual data extraction.
2.2.2 METAR-checking
Since mistakes in a METAR-report are very rare, the METAR-report is only checked on: - the presence of multiple spaces, which are reduced to a single space. After this step the corrected METAR-report is ready for the data extraction.
2.3 Data extraction The objective of the data extraction process is to select only those observations from the bulletins which are of importanAce for the construction of the Actual Meteorological Database. In Appendix A a list of meteorological stations is given. Each station is marked with an F or an S which denotes its status concerning the construction of the database. Observations of stations marked with:
F: are not decoded because these stations are not located in the area of interest; S: are decoded and will become part of the AMD if on the day under
consideration: - at least the 6 and 18 UTC bulletins are provided; - at least values for air temperature, dew-point temperature, wind speed, total
cloud cover, pressure and precipitation are reported. The result of the data extraction process is that the coded observations of the stations marked with S extracted from the file GTS:Iyymmdd.DAT are added to an intermediate database named CODED. This database consists of three files: - an index file (REALDATA:CODED.IDX) - a data file (REALDATA:CODED.BIN) - a file with a pointer to the last written datarecord (REALDATA:CODED.PTR). In CODED the extracted MAIN-hour and INTERMEDIATE-hour observations of the past seven days are stored. The data extraction process follows the same steps for SYNOP-reports and METAR-reports, except for a date-time check on SYNOP-reports: reports older than three days are skipped. The date-time check is not possible for METAR-reports because these reports do not contain the date (only time is included). From the bulletin one line is read, which in principle contains the observations of one station. The program checks if the line contains a complete observation, which is assumed to be the case if one of the following criteria is met: - the line is the last line in the bulletin - the line ends with an =-sign - the line contains the string NIL (only for SYNOP-reports) - the next line contains the string NIL (only for SYNOP-reports) - the line and the next line contain together more than 132 characters in a METAR-
report and more than 172 characters in a SYNOP-report - the next line starts with a station number which is legal in this bulletin and the fourth
group (the temperature group) starts with '1' (only for SYNOP-reports) If the observation is complete and also proves to be a real observation (i.e. the line does not contain NIL) the station identification is checked. The station identification must: - have an integer value in a SYNOP-report or a code in a METAR-report - be a legal station identification - be permitted to occur in a bulletin from this country - not be denoted with an F in the station list (Appendix A) - not yet be decoded with the same coded observation, or in case of a METAR-report,
no SYNOP-report of the same station is decoded already Only if all foregoing criteria are met the observation is stored in the database CODED and submitted to the decoding procedure.
2.4 Data decoding The observations which are stored in the database CODED are also submitted to the decoding process. After this process the decoded observations are stored in the intermediate database DECODED. This database has the same structure as the database CODED (index file: REALDATA:DECODED.IDX, data file: REALDATA:DECODED.BIN, pointer file: DECODED.PTR) and contains the extracted decoded observations of the past seven days.
2.4.1 SYNOP-decoding
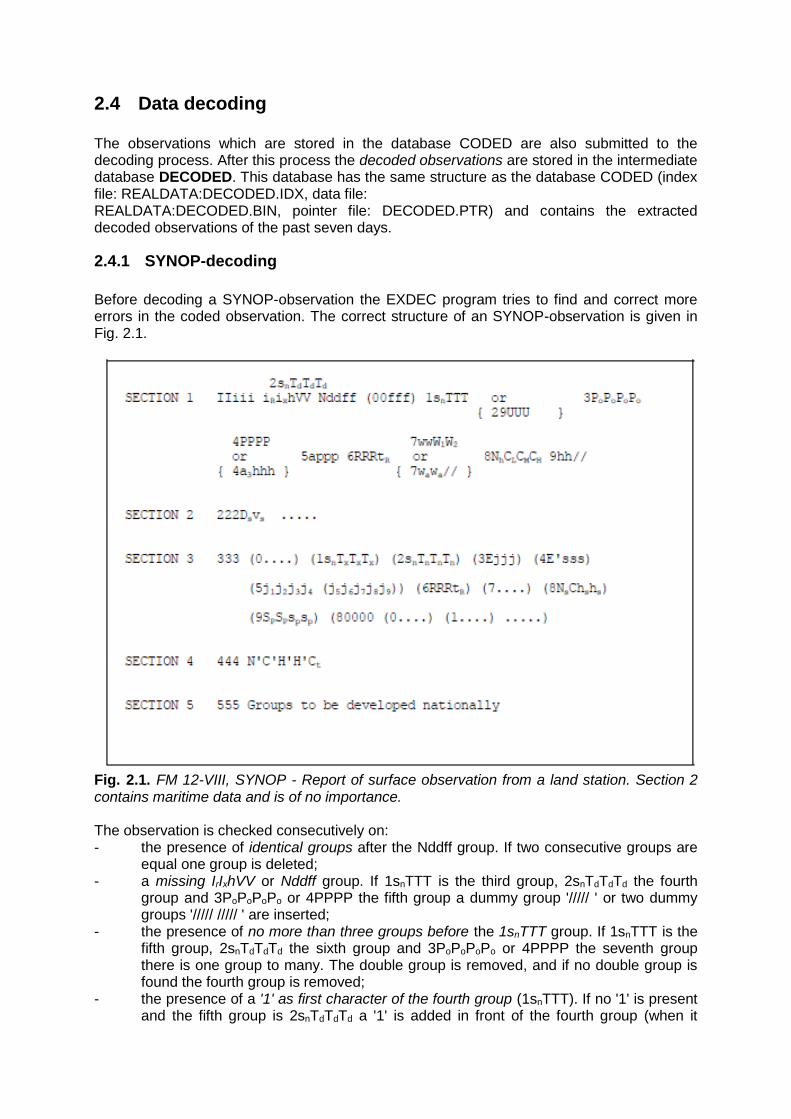
Before decoding a SYNOP-observation the EXDEC program tries to find and correct more errors in the coded observation. The correct structure of an SYNOP-observation is given in Fig. 2.1.
Fig. 2.1. FM 12-VIII, SYNOP - Report of surface observation from a land station. Section 2 contains maritime data and is of no importance. The observation is checked consecutively on: - the presence of identical groups after the Nddff group. If two consecutive groups are
equal one group is deleted; - a missing IrIxhVV or Nddff group. If 1snTTT is the third group, 2snTdTdTd the fourth
group and 3PoPoPoPo or 4PPPP the fifth group a dummy group '///// ' or two dummy groups '///// ///// ' are inserted;
- the presence of no more than three groups before the 1snTTT group. If 1snTTT is the fifth group, 2snTdTdTd the sixth group and 3PoPoPoPo or 4PPPP the seventh group there is one group to many. The double group is removed, and if no double group is found the fourth group is removed;
- the presence of a '1' as first character of the fourth group (1snTTT). If no '1' is present and the fifth group is 2snTdTdTd a '1' is added in front of the fourth group (when it
consists of four characters) or its first character is modified into '1' (when it consists of five characters);
- the presence of a '2' as first character of the fifth group (2snTdTdTd). If no '2' is present and the fourth group is 1snTTT and the sixth group is 3PoPoPoPo or 4PPPP a '2' added in front of the fifth group or its first character is modified into '2';
- the presence of a '3' as first character of the sixth group (3PoPoPoPo). If no '3' is present and the fourth group is 1snTTT, the fifth group is 2snTdTdTd and the seventh group is 4PPPP a '3' is added in front of the fifth group or its first character is modified into '3';
- the correctness of the sequence of the groups in section 1. A wrong sequence is modified whenever there is no doubt about the mistake, otherwise the groups at wrong positions are ignored;
- the presence and position of the 333 identification group. If this group is missing it is inserted, and if it is at a wrong position it is moved to the correct position;
- the presence of a 1snTxTxTx group or a 2snTnTnTn group in section 3 of the 6 UTC and 18 UTC bulletin and the correctness of the identifiers of these groups. A '1' as identifier in the 6 UTC bulletin is modified into a '2' when the next group does not start with a '2' (some countries provide both 1snTxTxTx and 2snTnTnTn in the 6 UTC bulletin). A '2' as identifier in the 18 UTC bulletin is always modified into a '1'.
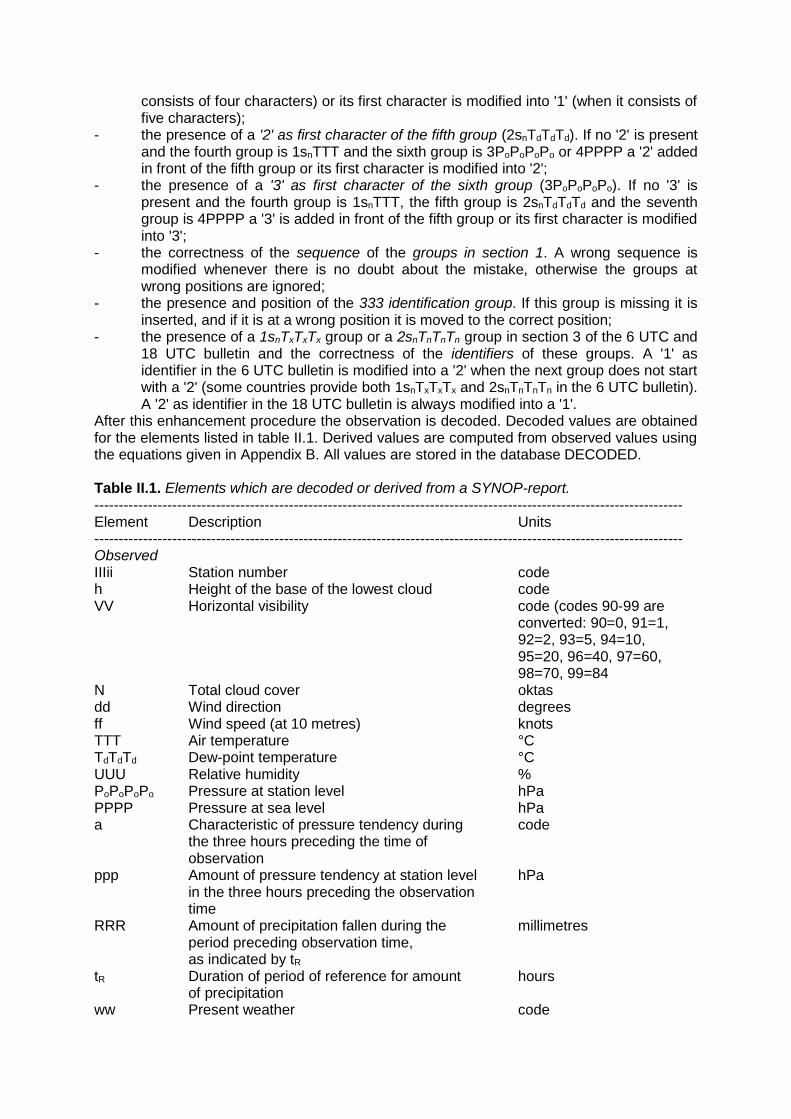
After this enhancement procedure the observation is decoded. Decoded values are obtained for the elements listed in table II.1. Derived values are computed from observed values using the equations given in Appendix B. All values are stored in the database DECODED. Table II.1. Elements which are decoded or derived from a SYNOP-report. ------------------------------------------------------------------------------------------------------------------------- Element Description Units ------------------------------------------------------------------------------------------------------------------------- Observed IIIii Station number code h Height of the base of the lowest cloud code VV Horizontal visibility code (codes 90-99 are
converted: 90=0, 91=1, 92=2, 93=5, 94=10, 95=20, 96=40, 97=60, 98=70, 99=84
N Total cloud cover oktas dd Wind direction degrees ff Wind speed (at 10 metres) knots TTT Air temperature °C TdTdTd Dew-point temperature °C UUU Relative humidity % PoPoPoPo Pressure at station level hPa PPPP Pressure at sea level hPa a Characteristic of pressure tendency during code
the three hours preceding the time of observation
ppp Amount of pressure tendency at station level hPa in the three hours preceding the observation time
RRR Amount of precipitation fallen during the millimetres period preceding observation time, as indicated by tR
tR Duration of period of reference for amount hours of precipitation
ww Present weather code
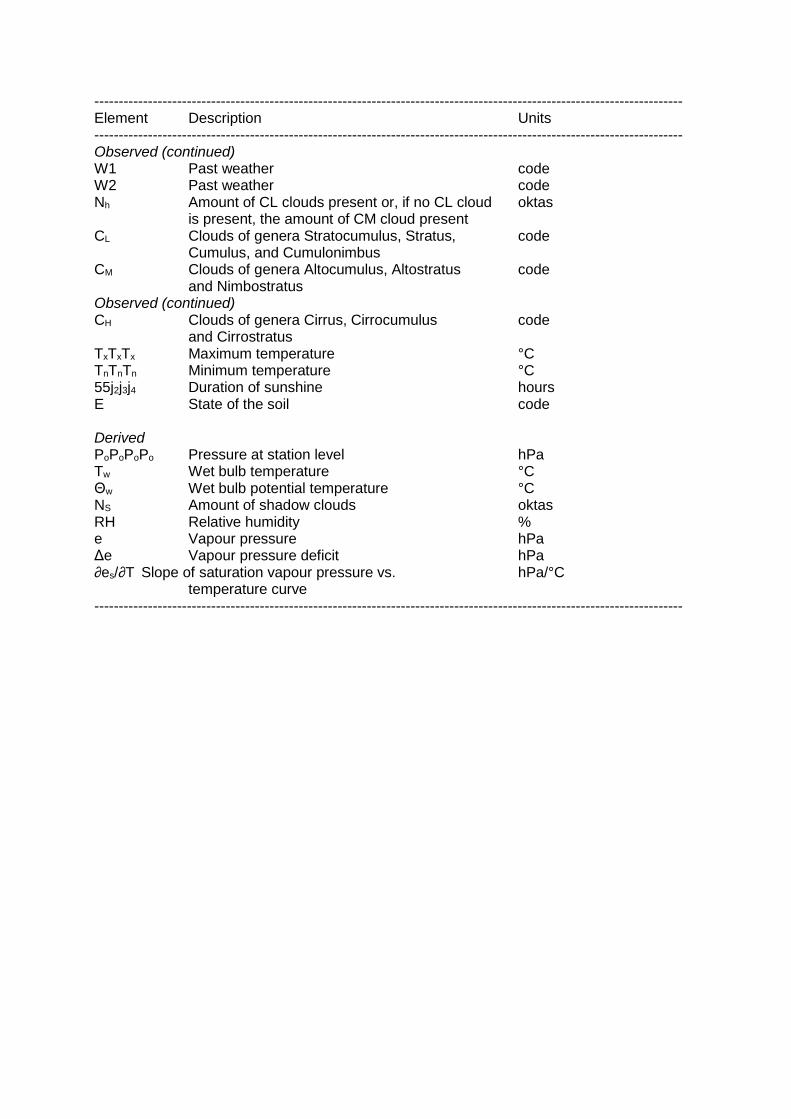
------------------------------------------------------------------------------------------------------------------------- Element Description Units ------------------------------------------------------------------------------------------------------------------------- Observed (continued) W1 Past weather code W2 Past weather code Nh Amount of CL clouds present or, if no CL cloud oktas
is present, the amount of CM cloud present CL Clouds of genera Stratocumulus, Stratus, code Cumulus, and Cumulonimbus CM Clouds of genera Altocumulus, Altostratus code
and Nimbostratus Observed (continued) CH Clouds of genera Cirrus, Cirrocumulus code
and Cirrostratus TxTxTx Maximum temperature °C TnTnTn Minimum temperature °C 55j2j3j4 Duration of sunshine hours E State of the soil code Derived PoPoPoPo Pressure at station level hPa Tw Wet bulb temperature °C Θw Wet bulb potential temperature °C NS Amount of shadow clouds oktas RH Relative humidity % e Vapour pressure hPa Δe Vapour pressure deficit hPa ∂es/∂T Slope of saturation vapour pressure vs. hPa/°C
temperature curve -------------------------------------------------------------------------------------------------------------------------
2.4.2 METAR-decoding
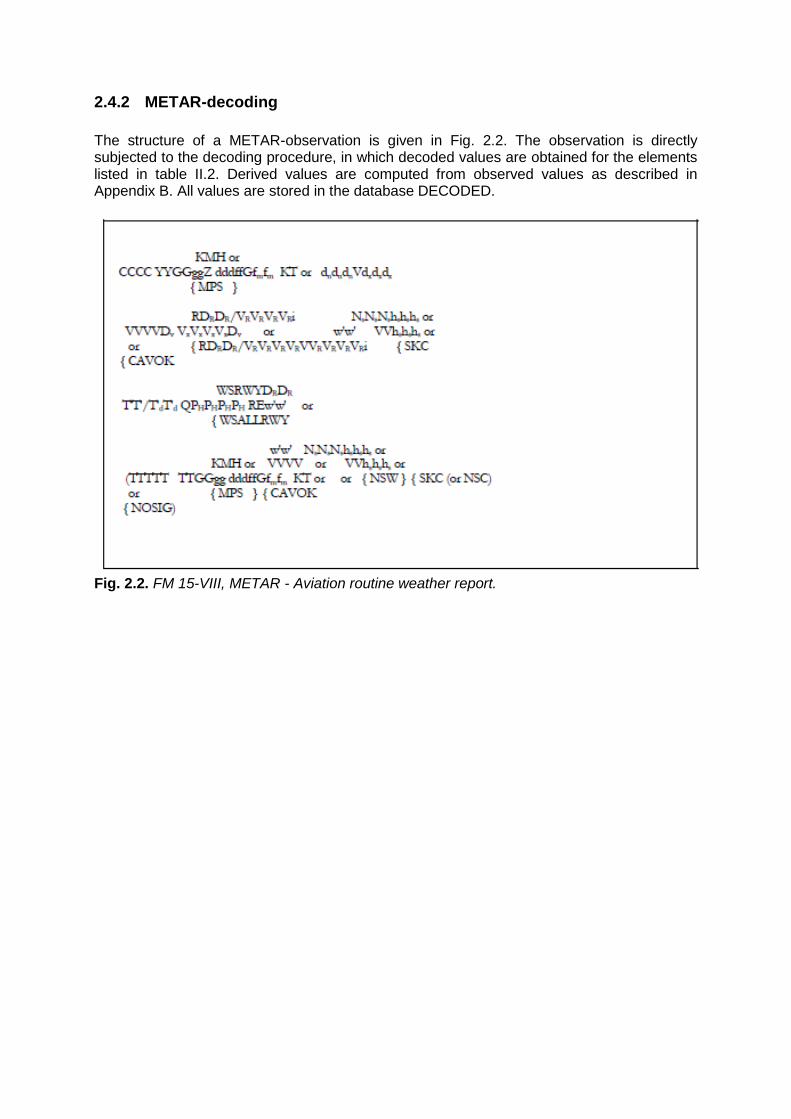
The structure of a METAR-observation is given in Fig. 2.2. The observation is directly subjected to the decoding procedure, in which decoded values are obtained for the elements listed in table II.2. Derived values are computed from observed values as described in Appendix B. All values are stored in the database DECODED.
Fig. 2.2. FM 15-VIII, METAR - Aviation routine weather report.
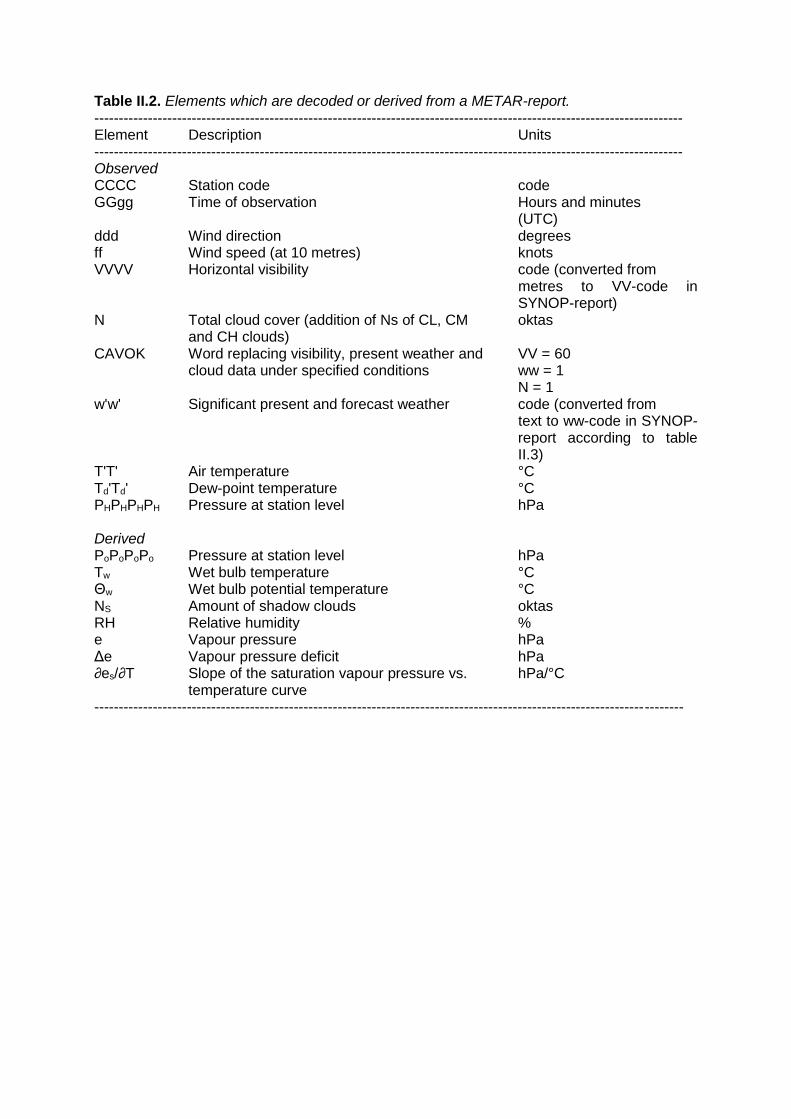
Table II.2. Elements which are decoded or derived from a METAR-report. ------------------------------------------------------------------------------------------------------------------------- Element Description Units ------------------------------------------------------------------------------------------------------------------------- Observed CCCC Station code code GGgg Time of observation Hours and minutes (UTC) ddd Wind direction degrees ff Wind speed (at 10 metres) knots VVVV Horizontal visibility code (converted from
metres to VV-code in SYNOP-report)
N Total cloud cover (addition of Ns of CL, CM oktas and CH clouds)
CAVOK Word replacing visibility, present weather and VV = 60 cloud data under specified conditions ww = 1
N = 1 w'w' Significant present and forecast weather code (converted from
text to ww-code in SYNOP-report according to table II.3)
T'T' Air temperature °C Td'Td' Dew-point temperature °C PHPHPHPH Pressure at station level hPa Derived PoPoPoPo Pressure at station level hPa Tw Wet bulb temperature °C Θw Wet bulb potential temperature °C NS Amount of shadow clouds oktas RH Relative humidity % e Vapour pressure hPa Δe Vapour pressure deficit hPa ∂es/∂T Slope of the saturation vapour pressure vs. hPa/°C
temperature curve -------------------------------------------------------------------------------------------------------------------------
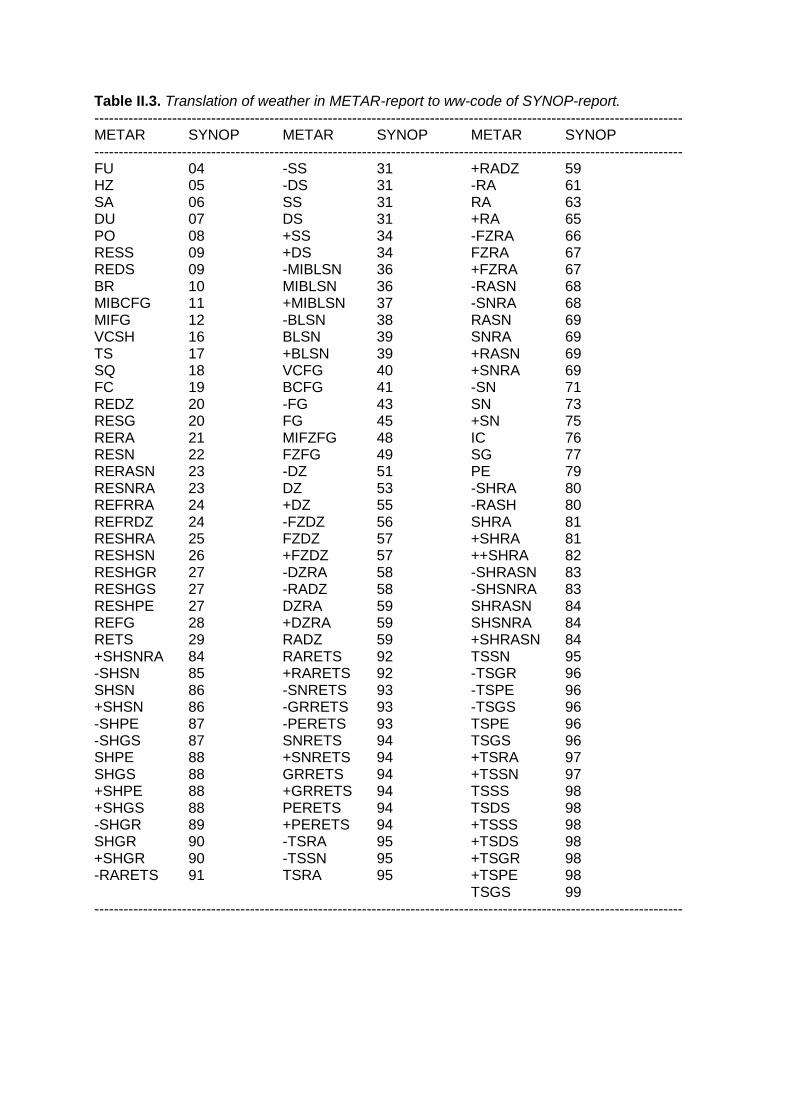
Table II.3. Translation of weather in METAR-report to ww-code of SYNOP-report. ------------------------------------------------------------------------------------------------------------------------- METAR SYNOP METAR SYNOP METAR SYNOP ------------------------------------------------------------------------------------------------------------------------- FU 04 -SS 31 +RADZ 59 HZ 05 -DS 31 -RA 61 SA 06 SS 31 RA 63 DU 07 DS 31 +RA 65 PO 08 +SS 34 -FZRA 66 RESS 09 +DS 34 FZRA 67 REDS 09 -MIBLSN 36 +FZRA 67 BR 10 MIBLSN 36 -RASN 68 MIBCFG 11 +MIBLSN 37 -SNRA 68 MIFG 12 -BLSN 38 RASN 69 VCSH 16 BLSN 39 SNRA 69 TS 17 +BLSN 39 +RASN 69 SQ 18 VCFG 40 +SNRA 69 FC 19 BCFG 41 -SN 71 REDZ 20 -FG 43 SN 73 RESG 20 FG 45 +SN 75 RERA 21 MIFZFG 48 IC 76 RESN 22 FZFG 49 SG 77 RERASN 23 -DZ 51 PE 79 RESNRA 23 DZ 53 -SHRA 80 REFRRA 24 +DZ 55 -RASH 80 REFRDZ 24 -FZDZ 56 SHRA 81 RESHRA 25 FZDZ 57 +SHRA 81 RESHSN 26 +FZDZ 57 ++SHRA 82 RESHGR 27 -DZRA 58 -SHRASN 83 RESHGS 27 -RADZ 58 -SHSNRA 83 RESHPE 27 DZRA 59 SHRASN 84 REFG 28 +DZRA 59 SHSNRA 84 RETS 29 RADZ 59 +SHRASN 84 +SHSNRA 84 RARETS 92 TSSN 95 -SHSN 85 +RARETS 92 -TSGR 96 SHSN 86 -SNRETS 93 -TSPE 96 +SHSN 86 -GRRETS 93 -TSGS 96 -SHPE 87 -PERETS 93 TSPE 96 -SHGS 87 SNRETS 94 TSGS 96 SHPE 88 +SNRETS 94 +TSRA 97 SHGS 88 GRRETS 94 +TSSN 97 +SHPE 88 +GRRETS 94 TSSS 98 +SHGS 88 PERETS 94 TSDS 98 -SHGR 89 +PERETS 94 +TSSS 98 SHGR 90 -TSRA 95 +TSDS 98 +SHGR 90 -TSSN 95 +TSGR 98 -RARETS 91 TSRA 95 +TSPE 98 TSGS 99 -------------------------------------------------------------------------------------------------------------------------
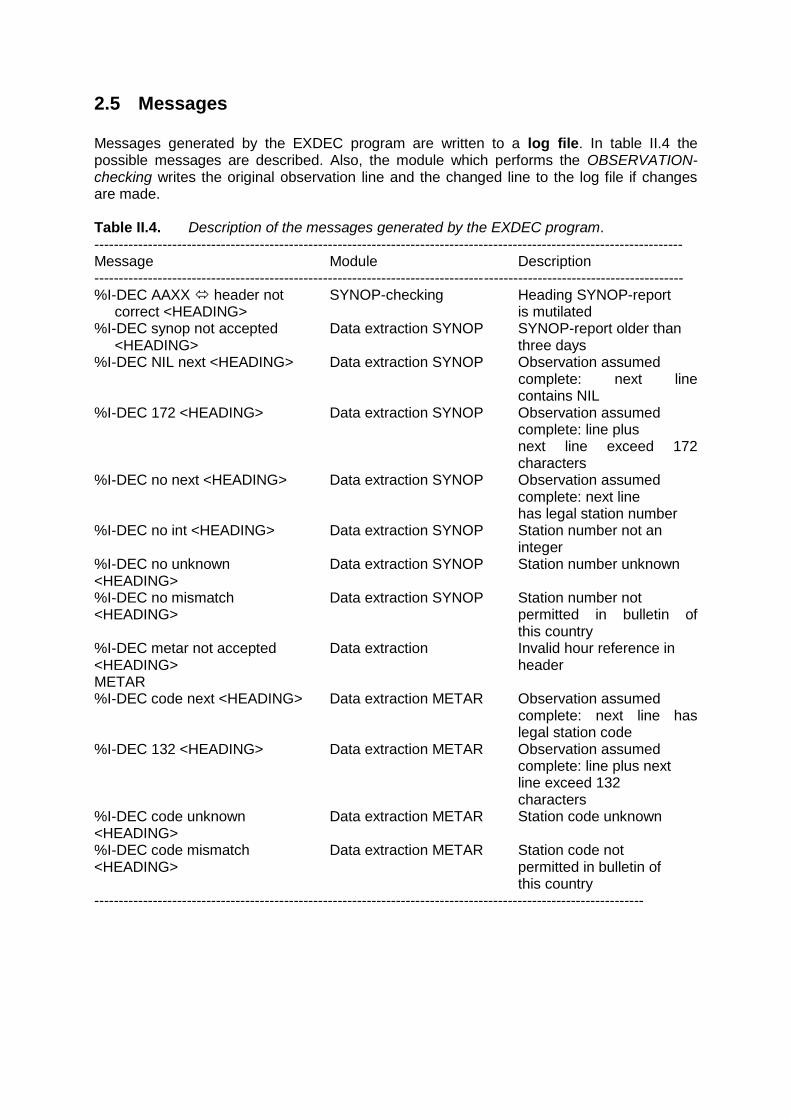
2.5 Messages Messages generated by the EXDEC program are written to a log file. In table II.4 the possible messages are described. Also, the module which performs the OBSERVATION-checking writes the original observation line and the changed line to the log file if changes are made. Table II.4. Description of the messages generated by the EXDEC program. ------------------------------------------------------------------------------------------------------------------------- Message Module Description ------------------------------------------------------------------------------------------------------------------------- %I-DEC AAXX header not SYNOP-checking Heading SYNOP-report correct <HEADING> is mutilated %I-DEC synop not accepted Data extraction SYNOP SYNOP-report older than <HEADING> three days %I-DEC NIL next <HEADING> Data extraction SYNOP Observation assumed
complete: next line contains NIL
%I-DEC 172 <HEADING> Data extraction SYNOP Observation assumed complete: line plus
next line exceed 172 characters
%I-DEC no next <HEADING> Data extraction SYNOP Observation assumed complete: next line
has legal station number %I-DEC no int <HEADING> Data extraction SYNOP Station number not an integer %I-DEC no unknown Data extraction SYNOP Station number unknown <HEADING> %I-DEC no mismatch Data extraction SYNOP Station number not <HEADING> permitted in bulletin of this country %I-DEC metar not accepted Data extraction Invalid hour reference in <HEADING> header METAR %I-DEC code next <HEADING> Data extraction METAR Observation assumed
complete: next line has legal station code
%I-DEC 132 <HEADING> Data extraction METAR Observation assumed complete: line plus next line exceed 132 characters %I-DEC code unknown Data extraction METAR Station code unknown <HEADING> %I-DEC code mismatch Data extraction METAR Station code not <HEADING> permitted in bulletin of this country -----------------------------------------------------------------------------------------------------------------
3 Data consistency checks
3.1 Introduction
The program CHECK performs consistency checks on the data in the database. To check
the data of a certain day, the observations from 18 UTC of the previous day until 06 UTC of
the next day are needed. Consequently, CHECK can only be used after the data of the next
day are added to the database with the program EXDEC. Only the data of the stations which
will be part of the database (i.e. the stations marked with S) are subjected to the consistency
checks. The values of the following observation elements are checked: air temperature, dew-
point temperature, pressure at sea level, wind speed, amount of precipitation, amount of CL
clouds (or CM clouds if no CL clouds are present), duration of sunshine, snow depth and
amount of global radiation. Obvious errors in the observations are automatically corrected
and a message is written to the log file REALDATA:CHECK.LOG. Other possible errors are
also written to this log file. These latter messages can be read by the OBSCON program,
which also offers an operator the possibility of modifying the data. After the observations of a
station are checked (and if necessary corrected) the derived parameters are recalculated
and the data are written back to the database DECODED.
For a number of weather elements, the observed values are checked against a first guess
that serves as reference values. For the first guess hight quality short range forecasts for the
particular location of weather station are sues. These forecasts are obtained through a
technique called MOS (Model Output Statistics).
Meteorological forecast models, e.g. the ECMWF model, compute the physical status of the
atmosphere on a grid, and the results represent the expected situation per grid box. A MOS
uses statistical relationships between the observations of a particular station and historic
model forecasts for surrounding grid points. Each observing location has its own statistics,
which are applied onto the grid point results of one or more physical models of the
atmosphere. That way, the very local situation on an observing station can be mimicked.
AMDAC uses these individual location forecasts to define time- and location-dependent
thresholds for the trustworthiness of station reports, for the elements air temperature
(including minimum and maximum), dew point (applies to all derived measures for the
humidity of the air), precipitation and wind speed, respectively. That way, the thresholds
consider season, climatology and even the actual weather pattern. A welcome side effect is
the high spatial consistency of the statistical MOS approach and therefore of the thresholds.
Individual MOS forecasts is used for all stations (4600, state June 2016) which are used
within MARSOP-4.
For the temperatures, the humidity measures and wind speed the consecutive reporting of a
value, e.g. due to broken equipment or data encoding issues, is usually detected by the daily
checks.
These first guess MOS data are kept in and read from a separate database. MOS data are
available for all weather stations that are included in the deliveries for Marsop-4.
Nevertheless, the checking algorithms are designed so that they also perform well in case of
absent MOS first guess data.
3.2 Air temperature, maximum temperature and minimum temperature
A number of checks are performed on the temperature values, both the hourly values and
the minimum and maximum values. Through effectively comparing and combining the
outcomes of the various checks, the subroutine is to a certain degree capable of drawing
conclusions on whether a value is right or wrong. Remaining doubtful cases are left for the
operator to decide on.
The following checks are performed:
1. The minimum and the maximum values of the observed hourly air temperature TTT of the latest 24-hour period (from 6 UTC until 6 UTC the next day) are calculated: TTmin and TTmax. If these are equal to each other while there is more than one observation of TTT, all temperature values are considered wrong and are discarded, i.e. changed into NOT DEFINED ('/').
2. Check the minimum temperature TnTnTn on possible sign errors using the observed hourly air temperatures TTT between 18 and 6 UTC. (a) If
i. the minimum value TTmin of TTT is positive and ii. TnTnTn is negative and iii. the difference between these two values is more than 4°C and iv. the opposite value of TnTnTn is less than TTmin, the minus sign of TnTnTn is changed into a plus sign.
(b) If i. the maximum value TTmax of TTT is less than 0°C and ii. TnTnTn is positive, the plus sign of TnTnTn is changed into a minus sign.
3. If no MOS temperature value is present, steps 4, 5 and 6 are skipped. 4. Compare TTT to the corresponding MOS value (TTmos).
(a) If the absolute value of the difference is greater than 10 °C, TTT is considered wrong and set to NOT DEFINED
(b) If the absolute value of the difference is greater than 8.5 °C but less than or equal to 10 °C, TTT is suspicious. A logical variable LTC is set to TRUE.
(c) If, in addition to (b), TTT is equal to the lowest value of TTT, this value is suspicious. A logical variable LTCN is set to TRUE.
(d) If, in addition to (b), TTT is equal to the highest value of TTT, this value is suspicious. A logical variable LTCX is set to TRUE.
(e) If, in addition to (b), all suspicious differences have the same sign, a logical variable LTCS is set to TRUE.
5. Compare TnTnTn to the corresponding MOS value (TNmos). (a) If the absolute value of the difference is greater than 10 °C, TnTnTn is considered
wrong and set to NOT DEFINED (b) If the absolute value of the difference is greater than 8.5 °C but less than or equal
to 10 °C, TnTnTn is suspicious. A logical variable LTN is set to TRUE. (c) If the difference has the same sign as in 4(e) and both LTN and LTCS are TRUE,
a logical variable LNS is set to TRUE. 6. Compare TxTxTx to the corresponding MOS value (TXmos).
(a) If the absolute value of the difference is greater than 10 °C, TxTxTx is considered wrong and set to NOT DEFINED
(b) If the absolute value of the difference is greater than 8.5 °C but less than or equal to 10 °C, TxTxTx is suspicious. A logical variable LTX is set to TRUE.
(c) If the difference has the same sign as in 4(e) and both LTX and LTCS are TRUE, a logical variable LXS is set to TRUE.
7. The value of TnTnTn is checked by comparing it to the air temperatures TTT between 18 and 6 UTC.
(a) If there are two or more values of TTT below the minimum temperature, the value of TnTnTn is changed into NOT DEFINED ('/').
(b) In case only one observation of TTT is below the minimum temperature, i. if the difference is less than 0.5°C: the value of TnTnTn is changed into this
value ii. if the lowest value for TTT occurs at 6 UTC and is not more than 3°C below
TnTnTn: the value of TnTnTn is changed into this value iii. if the lowest value for TTT is higher than the MOS value TNmos the TnTnTn is
substituted by the MOS value iv. in all other cases; a logical variable LNGT is set to TRUE.
8. Similarly, the maximum temperature TxTxTx is compared to the observed air temperatures TTT between 6 and 18 UTC.
(a) If there are two or more values of TTT above the maximum temperature, the value of TxTxTx is changed into NOT DEFINED ('/').
(b) In case only one observation of TTT is above the maximum temperature, i. if the difference is less than 0.5°C: the value of TxTxTx is changed into this
value ii. if the highest value for TTT occurs at 18 UTC and is not more than 3°C above
TxTxTx: the value of TxTxTx is changed into this value iii. if the highest value for TTT is lower than the MOS value TXmos the TxTxTx is
substituted by the MOS value iv. in all other cases; a logical variable LXLT is set to TRUE.
9. If no MOS value is available, the values of the air temperature TTT between 6 UTC of the day under consideration and 6 UTC of the next day are checked using a temperature curve. This curve is based on the two minimum temperatures and the maximum temperature reported in this period. If one or more of these values are not available they are simulated as follows:
(a) the minimum temperature TnTnTn is set at a value of 1°C below the air temperature TTT which is observed at the observation time closest to the time of sunrise plus half an hour. If this value is not available, TnTnTn is set at 1°C below the value observed three hours earlier. Furthermore, TnTnTn must be lower than all values of TTT between 18 and 6 UTC. If necessary, the value of TnTnTn is changed into the lowest observed value.
(b) the maximum temperature TxTxTx is set at 1°C above the air temperature TTT which is observed at the observation time closest to the time of high noon plus two hours. If this value is not available, TxTxTx is set at 2°C above the value of TTT observed three hours later. Furthermore, TxTxTx must exceed all values of TTT between 6 and 18 UTC. If necessary, the value of TxTxTx is changed into the highest observed value.
Note that these computed values of TnTnTn and TxTxTx are used only for the construction
of the temperature curve, but are not stored in the database. The temperature curve is
constructed only when values for both minimum temperatures and the maximum
temperature could be determined (i.e. none of these values is NOT DEFINED).
Two instants t1 and t2 are now defined as follows:
t1 the hour that lies closest to the instant “half an hour after sunrise”
t2 the hour closest to the instant that lies halfway between “two hours after high noon”
and sunset.
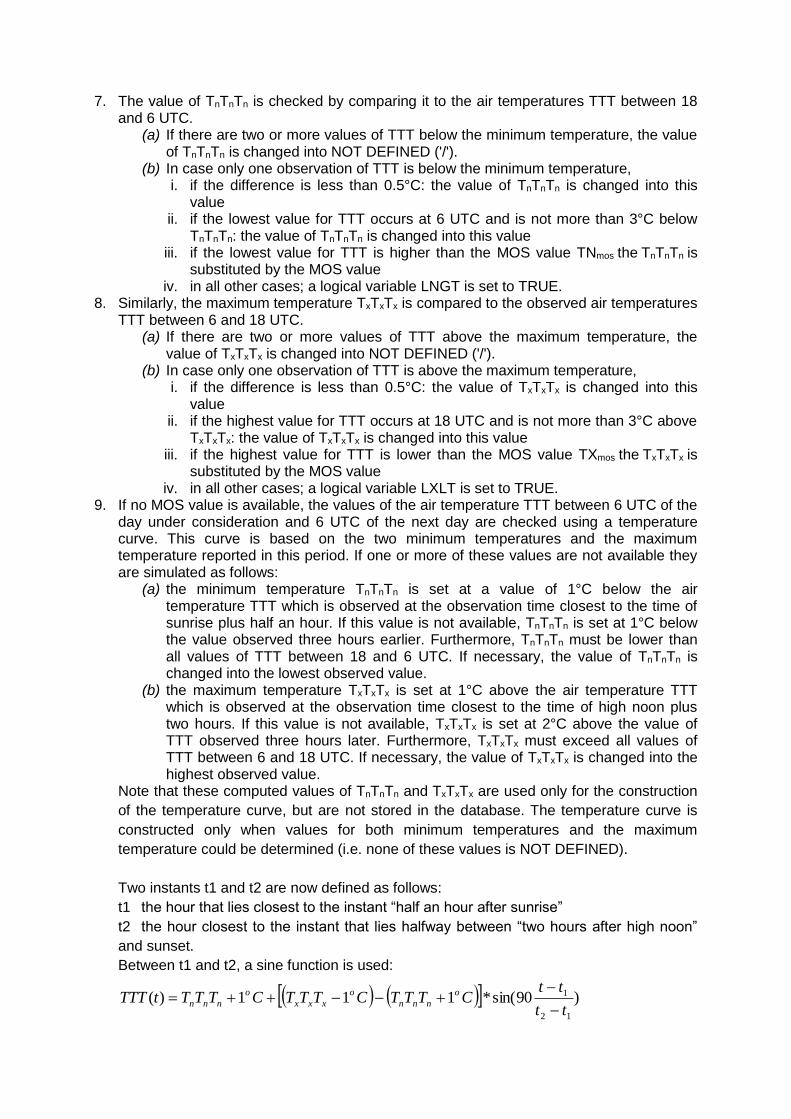
Between t1 and t2, a sine function is used:
)90sin(*111)(12
1
tt
ttCTTTCTTTCTTTtTTT o
nnn
o
xxx
o
nnn
where TTT(t) is the air temperature at time t (t1 ≤ t ≤ t2) and TnTnTn is the minimum
temperature observed at 6 UTC of the day under consideration.
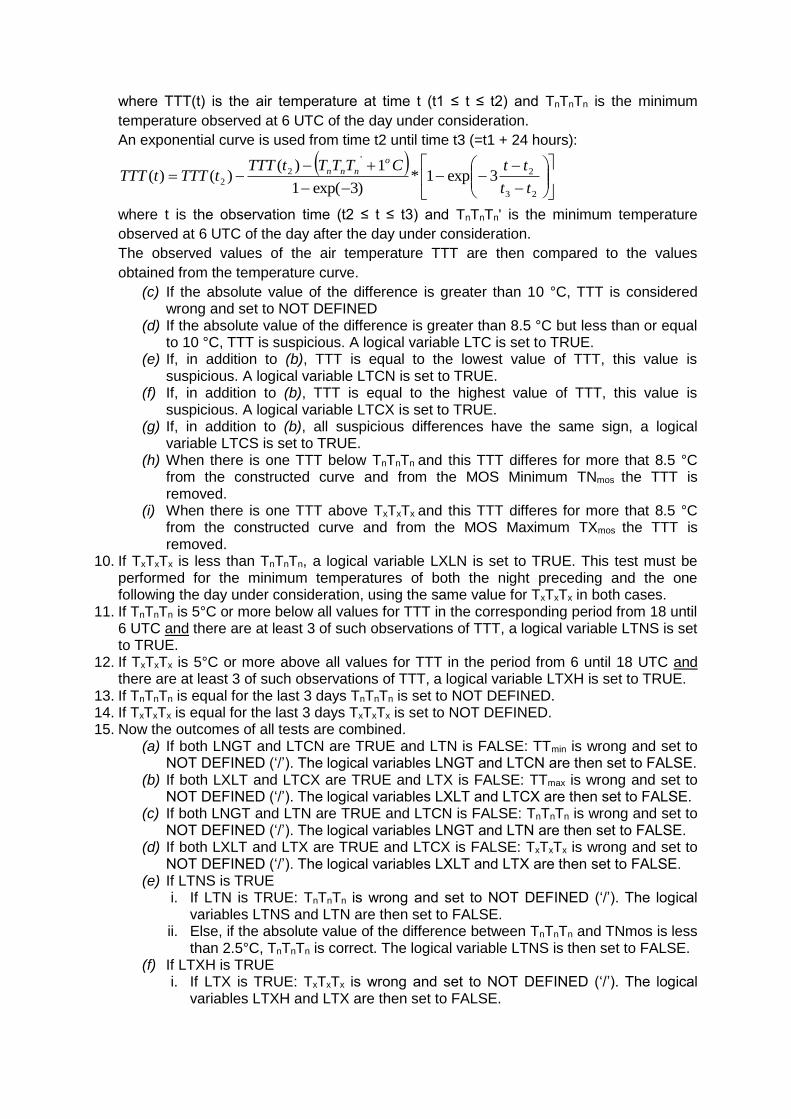
An exponential curve is used from time t2 until time t3 (=t1 + 24 hours):
23
2
'
2
2 3exp1*)3exp(1
1)()()(
tt
ttCTTTtTTTtTTTtTTT
o
nnn
where t is the observation time (t2 ≤ t ≤ t3) and TnTnTn' is the minimum temperature
observed at 6 UTC of the day after the day under consideration.
The observed values of the air temperature TTT are then compared to the values
obtained from the temperature curve.
(c) If the absolute value of the difference is greater than 10 °C, TTT is considered wrong and set to NOT DEFINED
(d) If the absolute value of the difference is greater than 8.5 °C but less than or equal to 10 °C, TTT is suspicious. A logical variable LTC is set to TRUE.
(e) If, in addition to (b), TTT is equal to the lowest value of TTT, this value is suspicious. A logical variable LTCN is set to TRUE.
(f) If, in addition to (b), TTT is equal to the highest value of TTT, this value is suspicious. A logical variable LTCX is set to TRUE.
(g) If, in addition to (b), all suspicious differences have the same sign, a logical variable LTCS is set to TRUE.
(h) When there is one TTT below TnTnTn and this TTT differes for more that 8.5 °C from the constructed curve and from the MOS Minimum TNmos the TTT is removed.
(i) When there is one TTT above TxTxTx and this TTT differes for more that 8.5 °C from the constructed curve and from the MOS Maximum TXmos the TTT is removed.
10. If TxTxTx is less than TnTnTn, a logical variable LXLN is set to TRUE. This test must be performed for the minimum temperatures of both the night preceding and the one following the day under consideration, using the same value for TxTxTx in both cases.
11. If TnTnTn is 5°C or more below all values for TTT in the corresponding period from 18 until 6 UTC and there are at least 3 of such observations of TTT, a logical variable LTNS is set to TRUE.
12. If TxTxTx is 5°C or more above all values for TTT in the period from 6 until 18 UTC and there are at least 3 of such observations of TTT, a logical variable LTXH is set to TRUE.
13. If TnTnTn is equal for the last 3 days TnTnTn is set to NOT DEFINED. 14. If TxTxTx is equal for the last 3 days TxTxTx is set to NOT DEFINED. 15. Now the outcomes of all tests are combined.
(a) If both LNGT and LTCN are TRUE and LTN is FALSE: TTmin is wrong and set to NOT DEFINED (‘/’). The logical variables LNGT and LTCN are then set to FALSE.
(b) If both LXLT and LTCX are TRUE and LTX is FALSE: TTmax is wrong and set to NOT DEFINED (‘/’). The logical variables LXLT and LTCX are then set to FALSE.
(c) If both LNGT and LTN are TRUE and LTCN is FALSE: TnTnTn is wrong and set to NOT DEFINED (‘/’). The logical variables LNGT and LTN are then set to FALSE.
(d) If both LXLT and LTX are TRUE and LTCX is FALSE: TxTxTx is wrong and set to NOT DEFINED (‘/’). The logical variables LXLT and LTX are then set to FALSE.
(e) If LTNS is TRUE i. If LTN is TRUE: TnTnTn is wrong and set to NOT DEFINED (‘/’). The logical
variables LTNS and LTN are then set to FALSE. ii. Else, if the absolute value of the difference between TnTnTn and TNmos is less
than 2.5°C, TnTnTn is correct. The logical variable LTNS is then set to FALSE. (f) If LTXH is TRUE
i. If LTX is TRUE: TxTxTx is wrong and set to NOT DEFINED (‘/’). The logical variables LTXH and LTX are then set to FALSE.
ii. Else, if the absolute value of the difference between TxTxTx and TXmos is less than 2.5°C, TxTxTx is correct. The logical variable LTXH is then set to FALSE.
(g) If LXLN is TRUE and LNGT or LTN is TRUE (or both): TnTnTn is wrong and set to NOT DEFINED (‘/’). The logical variables LXLN, LNGT and LTN are then set to FALSE.
(h) If LXLN is TRUE and LXLT or LTX is TRUE (or both): TxTxTx is wrong and set to NOT DEFINED (‘/’). The logical variables LXLN, LXLT and LTX are then set to FALSE.
(i) If LNS is TRUE: TnTnTn and TTT are correct. The logical variables LTN and LTC are then set to FALSE.
(j) If LXS is TRUE: TxTxTx and TTT are correct. The logical variables LTX and LTC are then set to FALSE.
(k) If LTC is TRUE: i. If LTN is TRUE and the deviations of TnTnTn and TTT from their corresponding
MOS values have the same sign: TnTnTn and TTT are correct. The logical variables LTN and LTC are then set to FALSE.
ii. If LTX is TRUE and the deviations of TxTxTx and TTT from their corresponding MOS values have the same sign: TxTxTx and TTT are correct. The logical variables LTX and LTC are then set to FALSE.
(l) If LTC is TRUE and LTCN or LTCX is TRUE (or both): TTT is wrong and set to NOT DEFINED (‘/’). The logical variables LTC, LTCN and LTCN are then set to FALSE.
(m) If LNGT is TRUE and TTmin - 1 < TNmos < TTmin and LTN is FALSE: TnTnTn is replaced by TNmos. The logical variable LNGT is then set to FALSE.
(n) If LXLT is TRUE and TTmax + 1 > TXmos > TTmax and LTX is FALSE: TxTxTx is replaced by TXmos. The logical variable LXLT is then set to FALSE.
(o) In all remaining cases: i. LTN, LNGT or LTNS is TRUE: TN is suspicious. An error message is written
to the log file for the operator to check the value. ii. LTX, LXLT or LTXH is TRUE: TX is suspicious. An error message is written to
the log file for the operator to check the value. iii. LTC is TRUE: TT is suspicious. An error message is written to the log file for
the operator to check the value. iv. LXLN is TRUE: TN or TX is suspicious. An error message is written to the log
file for the operator to check the values.
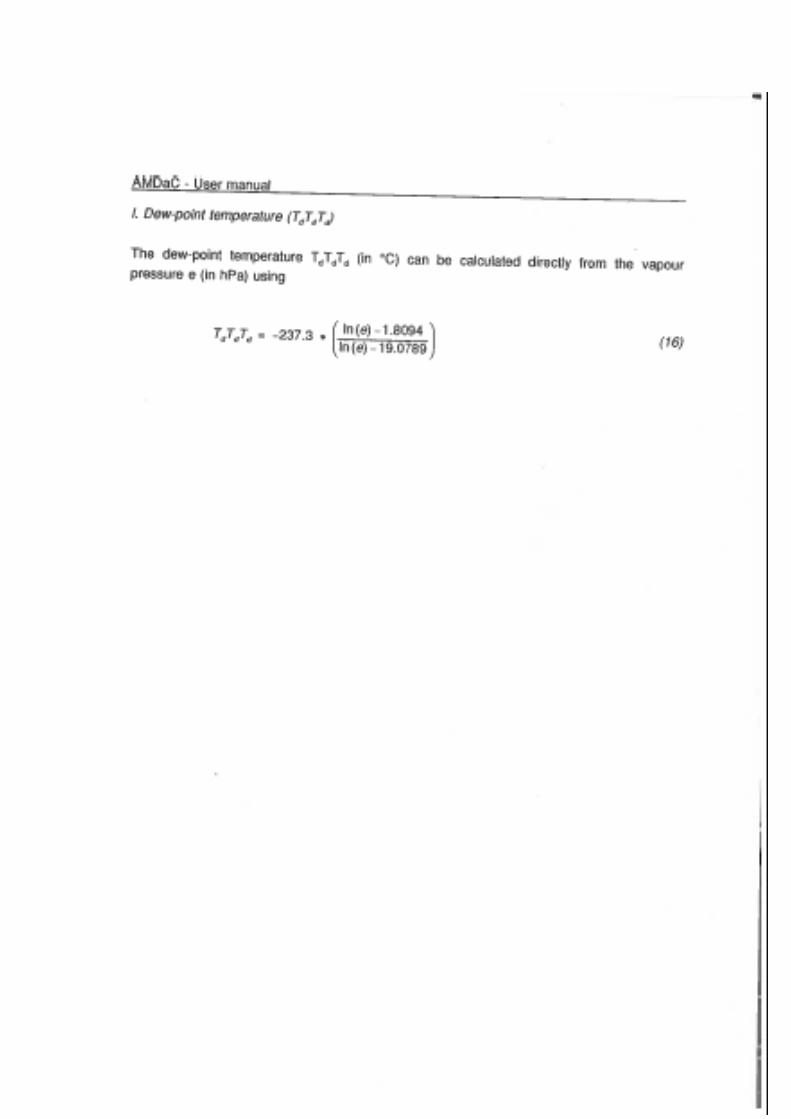
3.3 Dew point temperature
A number of checks is performed on the dew point temperature values. Through effectively
comparing and combining the outcomes of the various checks, the subroutine is to a certain
degree capable of drawing conclusions on whether a value is right or wrong. Remaining
doubtful cases are left for the operator to decide on.
The following checks are performed:
1. The minimum and the maximum values of the observed hourly dew point temperature TdTdTd of the latest 24-hour period (from 6 UTC until 6 UTC the next day) are calculated: TDmin and TDmax. If these are equal to each other while there is more than one observation of TdTdTd, all dew point values are considered wrong and are discarded, i.e. changed into NOT DEFINED ('/').
2. The observed dew point TdTdTd is checked against the corresponding MOS value, if present.
(a) If the absolute value of the difference is greater than 15°C, TdTdTd is considered wrong and set to NOT DEFINED.
(b) If the absolute value of the difference is greater than 11°C but less than or equal to 15°C, TdTdTd is suspicious. The value of priority variable PR is set to ‘5’.
3. The observed dew point (now called TD2) is checked for great jumps. (a) If the observations of both 3 hours earlier (TD1) and 3 hours later (TD3) are present
i. If these differ by 8°C or more in absolute value from TD2 a. If TD1 and TD3 differ less than 8°C: TD2 is considered wrong and set to NOT
DEFINED. b. Else, TD2 is suspicious. The value of priority variable PR is set to ‘2’.
(b) If only TD1 is present and it differs by more than 8°C from TD2 (more than 10°C for stations above altitude 750m), TD2 is suspicious. The value of priority variable PR is set to ‘3’.
(c) If only TD3 is present and it differs by more than 8°C from TD2 (more than 10°C for stations above altitude 750m), TD2 is suspicious. The value of priority variable PR is set to ‘4’.
4. The observed dew point TdTdTd is compared to the air temperature TTT at the same time: TdTdTd must be less than or equal to TTT. If not, and: (a) TdTdTd exceeds TTT by less than 1.0°C, the value is set equal to the value of TTT. (b) Else, the operator must decide whether TdTdTd or TTT is wrong. The value of priority
variable PR is set to ‘1’. 5. An error message is written to the log file. If for a certain hour more than one message
should be generated, only the one with the lowest value for PR is written.
3.4 Amount of CL clouds (or CM clouds if no CL clouds present)
The program checks whether the amount of CL clouds (or CM clouds if no CL clouds are
present) Nh is less than or equal to the total cloud cover N. When this is not the case the
value of Nh is changed to the value of N.
3.5 Amount of precipitation
A number of checks are performed on the precipitation values. The structure of the check is
that there are done some basic checks of the precipitation amount and then an analysis is
made over the data we have. From several points of few booleans are (re)set. At the end
depending on these Booleans messages are generated.
Through effectively comparing and combining the outcomes of the various checks, the
subroutine is to a certain degree capable of drawing conclusions on whether a value is right
or wrong. Remaining doubtful cases are left for the operator to decide on. The following
checks are performed:
1) Precipitation values are checked for all 3-hourly time stamps, both at so-called Main and Intermediate Hours.
2) If a negative precipitation sum is reported, this value is set to NOT DEFINED. 3) When 2 to 5 consecutive observations have the same value (larger than 0.05 mm) a
logical variable SUSPICIOUS is set to TRUE. 4) When 6 or more consecutive observations have the same value (larger than .05mm) they
are set to NOT DEFINED. 5) If MOS values for the precipitation are not available (RRRMOS for the expected value and
RRRXMOS for the maximum expected value): a logical variable LMOS is set to FALSE.
6) Otherwise: a) LMOS is set to TRUE. b) Calculate SD = 5 * max(0.2mm , RRRMOS). c) Then calculate SD = min(SD , max(1.0mm , abs(RRRXMOS – RRRMOS))). d) If, with RRROBS being the observed precipitation value:
i) abs(RRROBS - RRRMOS) > 6 * SD and ii) RRROBS > 20mm and iii) (RRROBS - RRRMOS) / RRRMOS > 5 RRROBS is wrong and set to NOT DEFINED; a logical variable WRONG is set to
TRUE. An error message is written to the log file.
e) Otherwise, if abs(RRROBS - RRRMOS) > 6 * SD: i) If
(1) RRROBS > RRRMOS and (2) (RRROBS ≤ 10mm and RRRMOS ≥ 0.5mm) or (RRROBS ≤ 15mm and RRRMOS ≥
2.5mm) RRROBS is correct; the logical variable SUSPICIOUS is set to FALSE.
ii) Otherwise, RRROBS is possibly wrong; a logical variable SUSPICIOUS is set to TRUE.
7) If RRROBS reported for the six hour period (i.e. tR =6) is equal to the amount reported for the twelve hour period (tR = 12), no further checking is done, as it is unlikely that the same mistake was made twice. A logical variable L12 is set to TRUE. An exception is made for precipitation amounts above 30 millimetres: these amounts must always be checked. In that case, L12 remains FALSE.
8) If there has only been fog in the period tR and no other source of precipitation (i.e. all ww-codes present are between 40 and 49 and all W1-codes are less than or equal to 4), no more than 1 millimetre of precipitation is allowed. When RRROBS exceeds this value in such a case, it is set to 0.5mm. An error message is written to the log file.
9) The observed weather conditions (i.e. ww, W1 and W2) are used for some more checks. a) If observations for neither ww, W1 nor W2 are available, a logical variable LWW is set
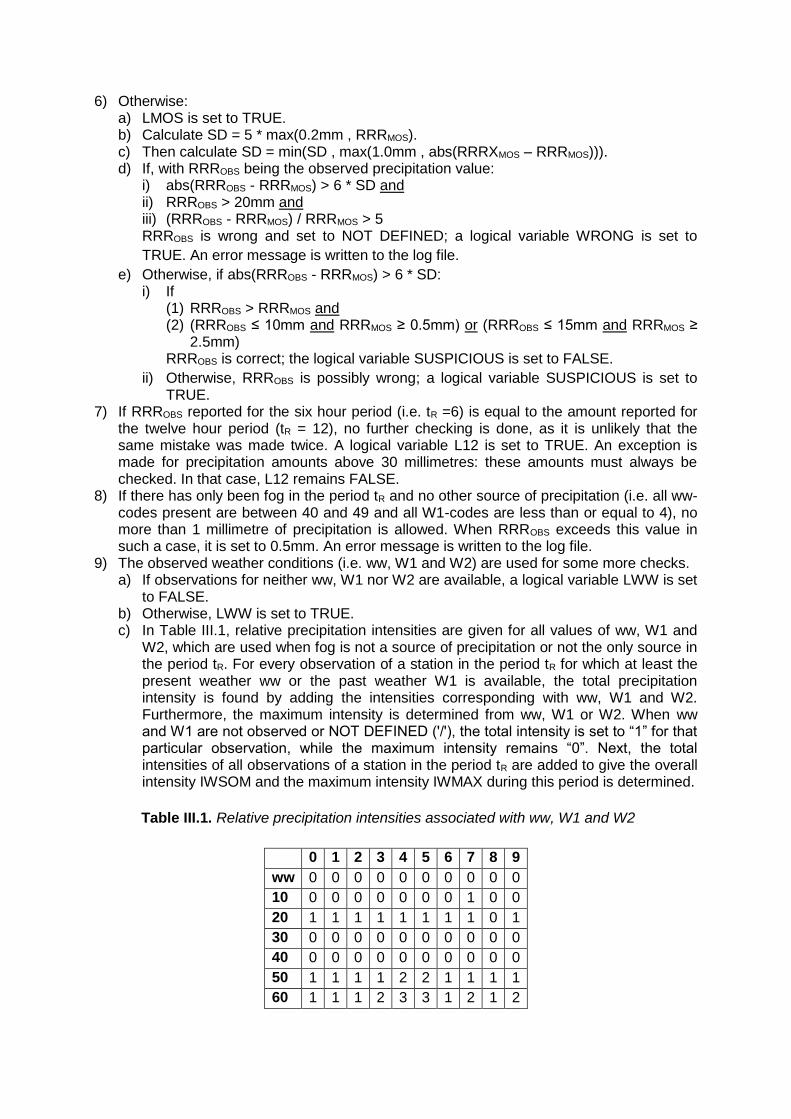
to FALSE. b) Otherwise, LWW is set to TRUE. c) In Table III.1, relative precipitation intensities are given for all values of ww, W1 and
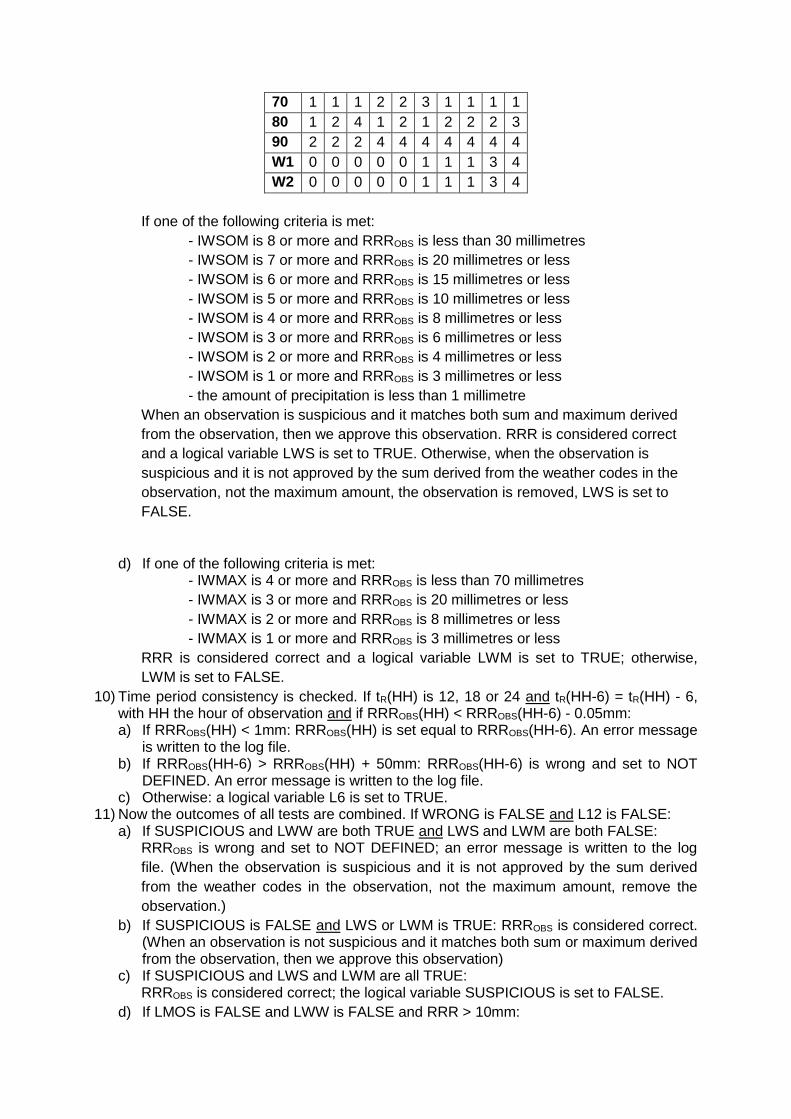
W2, which are used when fog is not a source of precipitation or not the only source in the period tR. For every observation of a station in the period tR for which at least the present weather ww or the past weather W1 is available, the total precipitation intensity is found by adding the intensities corresponding with ww, W1 and W2. Furthermore, the maximum intensity is determined from ww, W1 or W2. When ww and W1 are not observed or NOT DEFINED ('/'), the total intensity is set to “1” for that particular observation, while the maximum intensity remains “0”. Next, the total intensities of all observations of a station in the period tR are added to give the overall intensity IWSOM and the maximum intensity IWMAX during this period is determined.
Table III.1. Relative precipitation intensities associated with ww, W1 and W2
0 1 2 3 4 5 6 7 8 9
ww 0 0 0 0 0 0 0 0 0 0
10 0 0 0 0 0 0 0 1 0 0
20 1 1 1 1 1 1 1 1 0 1
30 0 0 0 0 0 0 0 0 0 0
40 0 0 0 0 0 0 0 0 0 0
50 1 1 1 1 2 2 1 1 1 1
60 1 1 1 2 3 3 1 2 1 2
70 1 1 1 2 2 3 1 1 1 1
80 1 2 4 1 2 1 2 2 2 3
90 2 2 2 4 4 4 4 4 4 4
W1 0 0 0 0 0 1 1 1 3 4
W2 0 0 0 0 0 1 1 1 3 4
If one of the following criteria is met:
- IWSOM is 8 or more and RRROBS is less than 30 millimetres
- IWSOM is 7 or more and RRROBS is 20 millimetres or less
- IWSOM is 6 or more and RRROBS is 15 millimetres or less
- IWSOM is 5 or more and RRROBS is 10 millimetres or less
- IWSOM is 4 or more and RRROBS is 8 millimetres or less
- IWSOM is 3 or more and RRROBS is 6 millimetres or less
- IWSOM is 2 or more and RRROBS is 4 millimetres or less
- IWSOM is 1 or more and RRROBS is 3 millimetres or less
- the amount of precipitation is less than 1 millimetre
When an observation is suspicious and it matches both sum and maximum derived
from the observation, then we approve this observation. RRR is considered correct
and a logical variable LWS is set to TRUE. Otherwise, when the observation is
suspicious and it is not approved by the sum derived from the weather codes in the
observation, not the maximum amount, the observation is removed, LWS is set to
FALSE.
d) If one of the following criteria is met: - IWMAX is 4 or more and RRROBS is less than 70 millimetres
- IWMAX is 3 or more and RRROBS is 20 millimetres or less
- IWMAX is 2 or more and RRROBS is 8 millimetres or less
- IWMAX is 1 or more and RRROBS is 3 millimetres or less
RRR is considered correct and a logical variable LWM is set to TRUE; otherwise,
LWM is set to FALSE.
10) Time period consistency is checked. If tR(HH) is 12, 18 or 24 and tR(HH-6) = tR(HH) - 6, with HH the hour of observation and if RRROBS(HH) < RRROBS(HH-6) - 0.05mm: a) If RRROBS(HH) < 1mm: RRROBS(HH) is set equal to RRROBS(HH-6). An error message
is written to the log file. b) If RRROBS(HH-6) > RRROBS(HH) + 50mm: RRROBS(HH-6) is wrong and set to NOT
DEFINED. An error message is written to the log file. c) Otherwise: a logical variable L6 is set to TRUE.
11) Now the outcomes of all tests are combined. If WRONG is FALSE and L12 is FALSE: a) If SUSPICIOUS and LWW are both TRUE and LWS and LWM are both FALSE:
RRROBS is wrong and set to NOT DEFINED; an error message is written to the log
file. (When the observation is suspicious and it is not approved by the sum derived
from the weather codes in the observation, not the maximum amount, remove the
observation.)
b) If SUSPICIOUS is FALSE and LWS or LWM is TRUE: RRROBS is considered correct. (When an observation is not suspicious and it matches both sum or maximum derived from the observation, then we approve this observation)
c) If SUSPICIOUS and LWS and LWM are all TRUE: RRROBS is considered correct; the logical variable SUSPICIOUS is set to FALSE.
d) If LMOS is FALSE and LWW is FALSE and RRR > 10mm:
the operator must decide; an error message is written to the log file. (When there is
no mos to compare the observation and there is no weather code defined to derive an
amount, let the meteorologist decide)
e) If SUSPICIOUS is TRUE: the operator must decide; an error message is written to the log file.
f) If L6 is TRUE: the operator must decide; an error message is written to the log file. g) When the observation is 70mm or more, let the meteorologist decide.
3.6 Pressure at sea level
The value of the pressure at sea level PPPP must lie between 950 hPa and 1060 hPa. When
PPPP is less than 950 hPa or more than 1060 hPa, the value of PPPP is changed to NOT
DEFINED ('/'). Furthermore, the values of the amount of pressure tendency ppp and of the
pressure at station level PoPoPoPo are also changed to NOT DEFINED.
If the pressure at sea level is between 950 and 1060 hPa the pressure tendency ppp is
checked: when the absolute value of ppp exceeds 15 hPa per three hours, ppp is changed to
NOT DEFINED. Since it is very likely that there are also errors in the pressure at sea level
and the pressure at station level, the values of PPPP and PoPoPoPo are also changed to NOT
DEFINED.
Finally, if the pressure at sea level is between 950 and 1060 hPa and the pressure tendency
is less than 15 hPa per three hours, PPPP is compared to the observation of three hours
before. When the difference between the PPPP of three hours before and the PPPP under
consideration exceeds the pressure tendency ppp more than 2 hPa, the values of PPPP,
PoPoPoPo and ppp are changed to NOT DEFINED.
3.7 Wind speed
The actual observations of the wind speed (FF) are compared with the observations that are
nearest in time at the same station and with MOS reference values, if available.
First, FF is compared with the observed value of three hours before (or, if not present, 6
hours before). The program checks on a difference (absolute value) in FF of more than 40
knots (or, for stations at a height of more than 750m above mean sea level, 80 knots). If such
a difference occurs, FF is considered wrong and is set to NOT DEFINED ('/'). An error
message is written to the log file.
If this is not the case, FF is compared to the corresponding MOS value. If the difference
(absolute value) is more than 40 knots, FF is considered wrong and is set to NOT DEFINED
('/'). An error message is written to the log file.
In the following of the remaining cases, FF is marked as suspicious:
- the absolute difference with the previous observation (3 or 6 hours before) is more than 25 knots (or, for stations at a height of more than 750m above mean sea level, 40 knots)
- the absolute difference with the corresponding MOS value is more than 25 knots - FF = 0 and at least one of the following conditions is met:
o the previous observation (3 or 6 hours before) is greater than 18 knots o the following observation (3 or 6 hours after) is greater than 18 knots o the corresponding MOS value is greater than 18 knots
- the ratio between FF and the corresponding MOS value lies between 1.75 and 2.25, indicating there could be a coding error concerning the unit of wind speed (meters per second instead of knots or vice versa)
In such cases, the operator must check FF; an error message is written to the log file.
In case no wind speed of three/six hours before/after is known and no MOS value is
available, FF is only checked on its value:
- If FF > 80 knots, FF is considered wrong and is set to NOT DEFINED; an error message is written to the log file.
- If FF > 40 knots, FF is considered suspicious and must be checked by the operator; an error message is written to the log file.
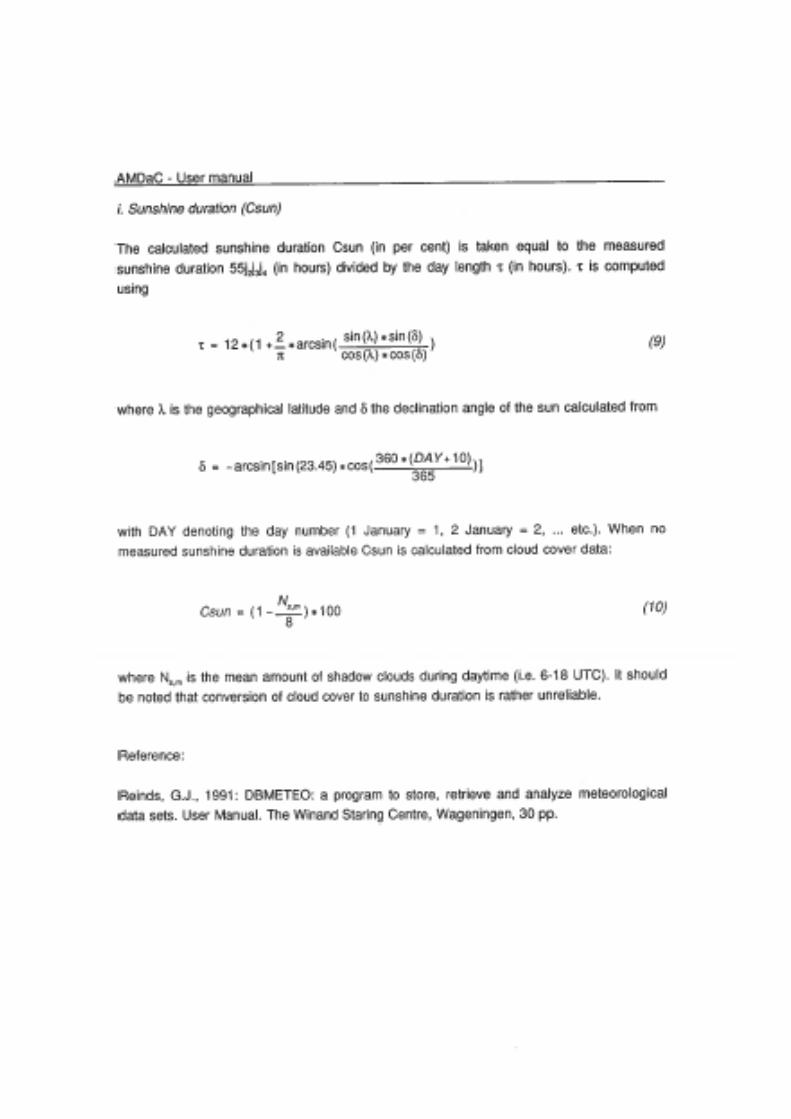
3.8 Duration of sunshine
The program checks whether the observed duration of sunshine 55j2j3j4 exceeds the
calculated time between sunrise and sunset.
If the observed sunshine duration is more than 25% longer than this computed day length,
the sunshine duration is set at NOT DEFINED ('/'). An error message is written to the log file.
Otherwise, if the observed sunshine duration is more than 6% longer than this computed day
length, the sunshine duration is suspicious and has to be checked by the operator. An error
message is written to the log file.
If the observed sunshine duration is less than 0.1 hours, the following additional tests are
performed:
- If at least one cloud cover observation during the daytime period is less than 7 oktas, the sunshine duration is suspicious and has to be checked by the operator. An error message is written to the log file.
- If no cloud cover observations are available during the daytime period and: o The observed daily amount of global radiation is more than 35% of the calculated
theoretical maximum for the day and station under consideration, the sunshine duration is suspicious and has to be checked by the operator. An error message is written to the log file.
o The difference between the minimum and maximum temperature is more than 5C, the sunshine duration is suspicious and has to be checked by the operator. An error message is written to the log file.
3.9 Snow depth
The program checks whether the snow depth value matches either the temperature or the
precipitation or the previous observation.
First, the following elements are determined from observations made during the preceding
24-hour period:
TTave: average temperature, calculated as the mean of the minimum and maximum
temperature
TN: observed minimum temperature
TX: observed maximum temperature
RRR12: amount of precipitation accumulated during the preceding 12 hours
RRR24: amount of precipitation accumulated during the preceding 24 hours
RRR36: amount of precipitation accumulated during the preceding 36 hours
RRR48: amount of precipitation accumulated during the preceding 48 hours
SNOW: observed actual snow depth
D_SNOW: difference between the actual snow depth and the observation made 24 hours
earlier; if the latter is not available, the actual snow depth is taken
Next, the following tests are done:
- If D_SNOW > 0cm and: o TN > 5C: an error message is written to the log file. If the observation time is
18:00 UTC, an additional criterion must be fulfilled, demanding that the actual temperature equals 1C or more. Background: it is not likely that snow is accumulated while temperatures are constantly well above freezing.
o TTave > 10C: an error message is written to the log file. Background: it is not likely that snow is accumulated while the average temperature lies far above freezing.
o If all of the following conditions are met: no snow depth observation 24, 36 or 48 hours earlier is available SNOW < 100cm RRR24 < 0.05mm
the observation is approved, else: If D_SNOW < 0.2*RRR and both TN and TX are less than 0C, an error
message is written to the log file. Background: when temperatures are constantly below freezing, all precipitation must result in a corresponding fresh snow layer, not just a small fraction. Normally, 1mm precipitation results in 1cm snow.
If D_SNOW > 4*RRR, an error message is written to the log file. Background: fresh snow must originate from precipitation. Normally, 1mm precipitation results in 1cm snow. It is not likely that this ratio is highly exceeded.
o If D_SNOW < -50cm, the observation is discarded and an information message is written to the log file. Background: a decrease of snow depth of more than 50cm is very unlikely under any circumstance.
o If SNOW ≥ 900cm and RRR ≥ 200mm, the observation is discarded and an information message is written to the log file. Background: both values are unusually high, which is very unlikely to coincide.
o If either of the following conditions is met: SNOW ≥ 500cm D_SNOW ≥ 200cm SNOW ≥ 200cm and RRR ≥ 100cm
SNOW will be marked as suspicious. An information message is written to the log file. Background: the values are unusually high but yet possible.
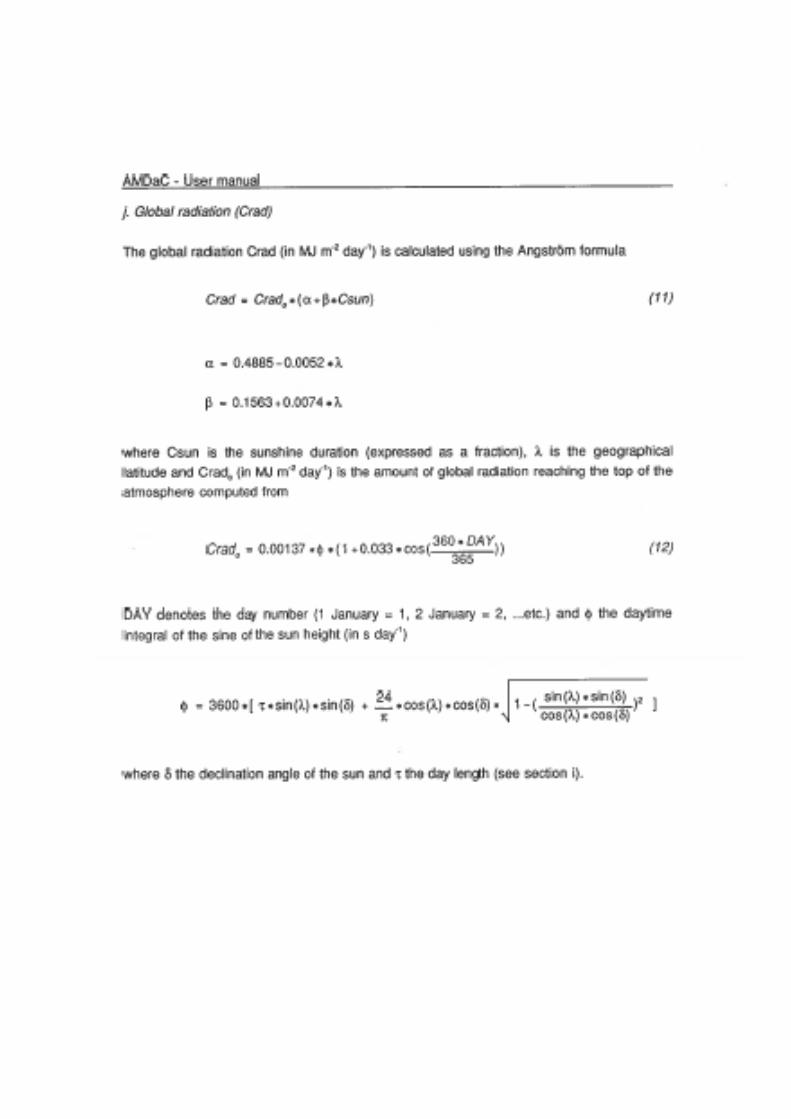
3.10 Daily global radiation
The program checks whether the observed daily amount of global radiation (RAD24) is in
accordance with the minimum and maximum possible amounts. First, the maximum radiation
(CRAD), which should occur if the sky would be constantly clear during the day of the
observation, is calculated. For this, a formula is used that takes both the date and the
geographical latitude into account.
Then, the following tests are performed:
- If RAD24 > 1.25*CRAD, the observation is discarded and an information message is written to the log file. Background: it is unlikely that the amount of radiation exceeds the calculated maximum by more than 25%. Else:
o If RAD24 < 0.06*CRAD, the observation is discarded and an information message is written to the log file. Background: even under a constantly cloudy sky, it is unlikely that the amount of radiation is less than 6% of the calculated maximum possible amount.
o If RAD24 > 1.10*CRAD If the observed duration of sunshine (if available) is less than the
calculated length of the daylight period minus one hour, RAD24 is wrong and discarded. An error message is written to the log file.
If the daytime mean cloud cover (if available) is greater than 4 oktas, RAD24 is wrong and discarded. An error message is written to the log file
Otherwise: the operator has to check RAD24. An error message is written to the log file. Background: under certain conditions it is possible that RAD24 exceeds CRAD somewhat.
3.11 Messages
The messages generated by the CHECK program are written to the file
REALDATA:CHECK.LOG. In table III.2, the possible messages are described. Note the
difference between %I-messages (information messages on automatically corrected errors)
and %E-messages (error messages to be handled by an operator).
Table III.2. Description of the messages generated by the CHECK program
Message Description
@I-Check TT: constant
Date: <DTG>
No : <NO>
TTmin : <TTMN>
TTmax : <TTMX>
TT : <TT>
All temperature values exactly the same
(there is more than one value): all discarded
and changed to '/'.
@I-Check TN: - sign
Date : <DTG>
No : <NO>
TNold : <TNOLD>
TTmin : <TTMIN>
TNnew : <TNNEW>
Sign error in minimum temperature: minus
sign is automatically changed to plus sign.
Message Description
@I-Check TN: + sign
Date : <DTG>
No : <NO>
TNold : <TNOLD>
TTmin : <TTMIN>
TNnew : <TNNEW>
Sign error in minimum temperature: plus sign
is automatically changed to minus sign.
@I-Check TT: TT-mos>12
Date : <DTG>
No : <NO>
TT : <TT>
TTmos: <MOS.TT>
Temperature deviates from MOS value by
more than 12 degrees. Observation
discarded: changed to '/'.
@I-Check TN: TN-mos>12
Date : <DTG>
No : <NO>
TN : <TN>
TNmos: <MOS.TN>
Minimum temperature deviates from MOS
value by more than 12 degrees. Observation
discarded: changed to '/'.
@I-Check TX: TX-mos>12
Date : <DTG>
No : <NO>
TX : <TX>
TXmos: <MOS.TX>
Maximum temperature deviates from MOS
value by more than 12 degrees. Observation
discarded: changed to '/'.
@I-Check TN: 2*TT<Tn
Date : <DTG>
No : <NO>
TN : <TN>
TTmin: <TTMIN>
At least two hourly temperature values lower
than reported minimum. Observed minimum
discarded: changed to '/'.
@I-Check TN: 1*TT<Tn
Date : <DTG>
No : <NO>
TN : <TN>
TTmin: <TTMIN>
One hourly temperature value lower than
reported minimum; difference less than 0.5C.
Minimum changed to this hourly value.
@I-Check TN: 1*TT<Tn
Date : <DTG>
No : <NO>
TN : <TN>
TTmin: <TTMIN>
TT : <TT>
One hourly temperature value lower than
reported minimum; observation hour 06 UTC
and difference less than 3C. Minimum
changed to this hourly value.
@I-Check TX: 2*TT>Tx
Date : <DTG>
No : <NO>
TX : <TX>
TTmax: <TTMAX>
At least two hourly temperature values higher
than reported maximum. Maximum
discarded: changed to '/'.
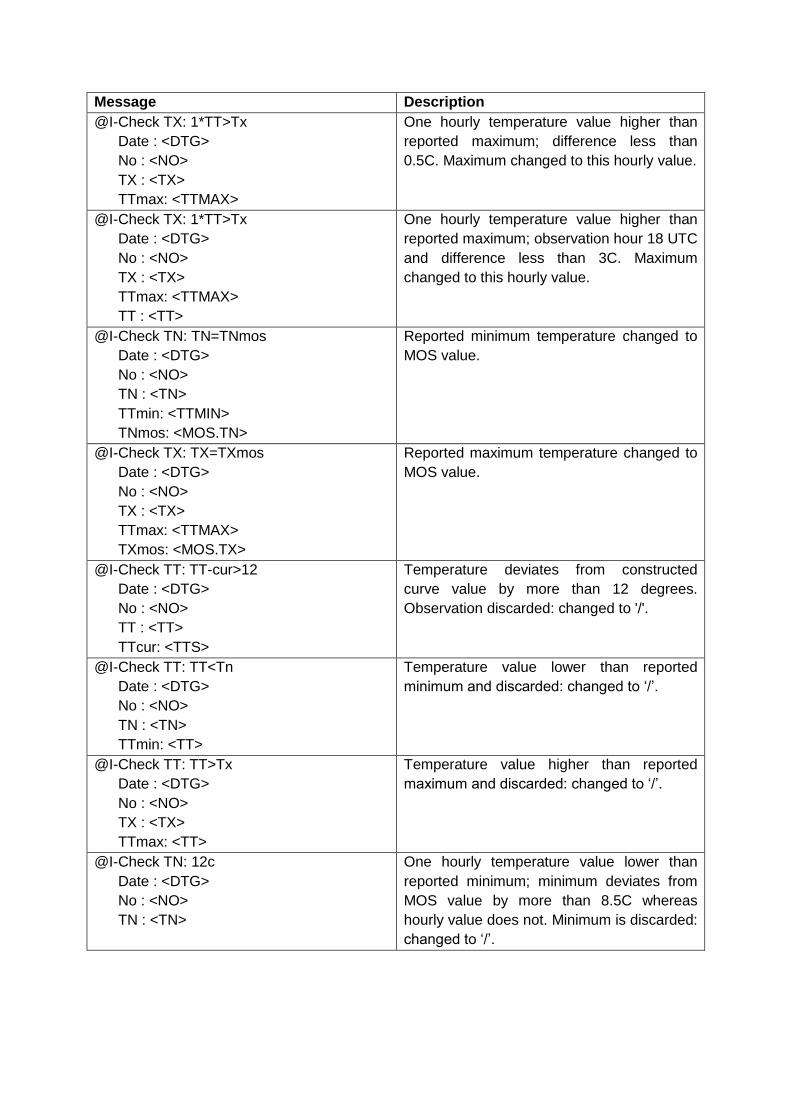
Message Description
@I-Check TX: 1*TT>Tx
Date : <DTG>
No : <NO>
TX : <TX>
TTmax: <TTMAX>
One hourly temperature value higher than
reported maximum; difference less than
0.5C. Maximum changed to this hourly value.
@I-Check TX: 1*TT>Tx
Date : <DTG>
No : <NO>
TX : <TX>
TTmax: <TTMAX>
TT : <TT>
One hourly temperature value higher than
reported maximum; observation hour 18 UTC
and difference less than 3C. Maximum
changed to this hourly value.
@I-Check TN: TN=TNmos
Date : <DTG>
No : <NO>
TN : <TN>
TTmin: <TTMIN>
TNmos: <MOS.TN>
Reported minimum temperature changed to
MOS value.
@I-Check TX: TX=TXmos
Date : <DTG>
No : <NO>
TX : <TX>
TTmax: <TTMAX>
TXmos: <MOS.TX>
Reported maximum temperature changed to
MOS value.
@I-Check TT: TT-cur>12
Date : <DTG>
No : <NO>
TT : <TT>
TTcur: <TTS>
Temperature deviates from constructed
curve value by more than 12 degrees.
Observation discarded: changed to '/'.
@I-Check TT: TT<Tn
Date : <DTG>
No : <NO>
TN : <TN>
TTmin: <TT>
Temperature value lower than reported
minimum and discarded: changed to ‘/’.
@I-Check TT: TT>Tx
Date : <DTG>
No : <NO>
TX : <TX>
TTmax: <TT>
Temperature value higher than reported
maximum and discarded: changed to ‘/’.
@I-Check TN: 12c
Date : <DTG>
No : <NO>
TN : <TN>
One hourly temperature value lower than
reported minimum; minimum deviates from
MOS value by more than 8.5C whereas
hourly value does not. Minimum is discarded:
changed to ‘/’.
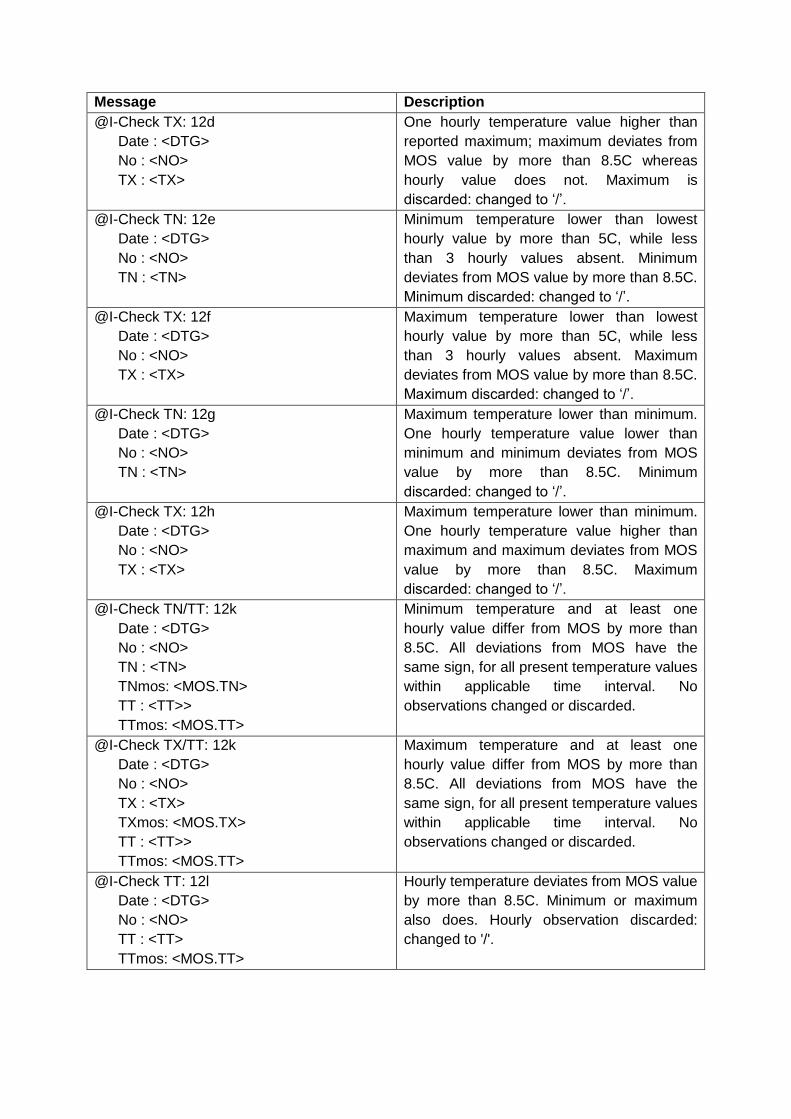
Message Description
@I-Check TX: 12d
Date : <DTG>
No : <NO>
TX : <TX>
One hourly temperature value higher than
reported maximum; maximum deviates from
MOS value by more than 8.5C whereas
hourly value does not. Maximum is
discarded: changed to ‘/’.
@I-Check TN: 12e
Date : <DTG>
No : <NO>
TN : <TN>
Minimum temperature lower than lowest
hourly value by more than 5C, while less
than 3 hourly values absent. Minimum
deviates from MOS value by more than 8.5C.
Minimum discarded: changed to ‘/’.
@I-Check TX: 12f
Date : <DTG>
No : <NO>
TX : <TX>
Maximum temperature lower than lowest
hourly value by more than 5C, while less
than 3 hourly values absent. Maximum
deviates from MOS value by more than 8.5C.
Maximum discarded: changed to ‘/’.
@I-Check TN: 12g
Date : <DTG>
No : <NO>
TN : <TN>
Maximum temperature lower than minimum.
One hourly temperature value lower than
minimum and minimum deviates from MOS
value by more than 8.5C. Minimum
discarded: changed to ‘/’.
@I-Check TX: 12h
Date : <DTG>
No : <NO>
TX : <TX>
Maximum temperature lower than minimum.
One hourly temperature value higher than
maximum and maximum deviates from MOS
value by more than 8.5C. Maximum
discarded: changed to ‘/’.
@I-Check TN/TT: 12k
Date : <DTG>
No : <NO>
TN : <TN>
TNmos: <MOS.TN>
TT : <TT>>
TTmos: <MOS.TT>
Minimum temperature and at least one
hourly value differ from MOS by more than
8.5C. All deviations from MOS have the
same sign, for all present temperature values
within applicable time interval. No
observations changed or discarded.
@I-Check TX/TT: 12k
Date : <DTG>
No : <NO>
TX : <TX>
TXmos: <MOS.TX>
TT : <TT>>
TTmos: <MOS.TT>
Maximum temperature and at least one
hourly value differ from MOS by more than
8.5C. All deviations from MOS have the
same sign, for all present temperature values
within applicable time interval. No
observations changed or discarded.
@I-Check TT: 12l
Date : <DTG>
No : <NO>
TT : <TT>
TTmos: <MOS.TT>
Hourly temperature deviates from MOS value
by more than 8.5C. Minimum or maximum
also does. Hourly observation discarded:
changed to '/'.
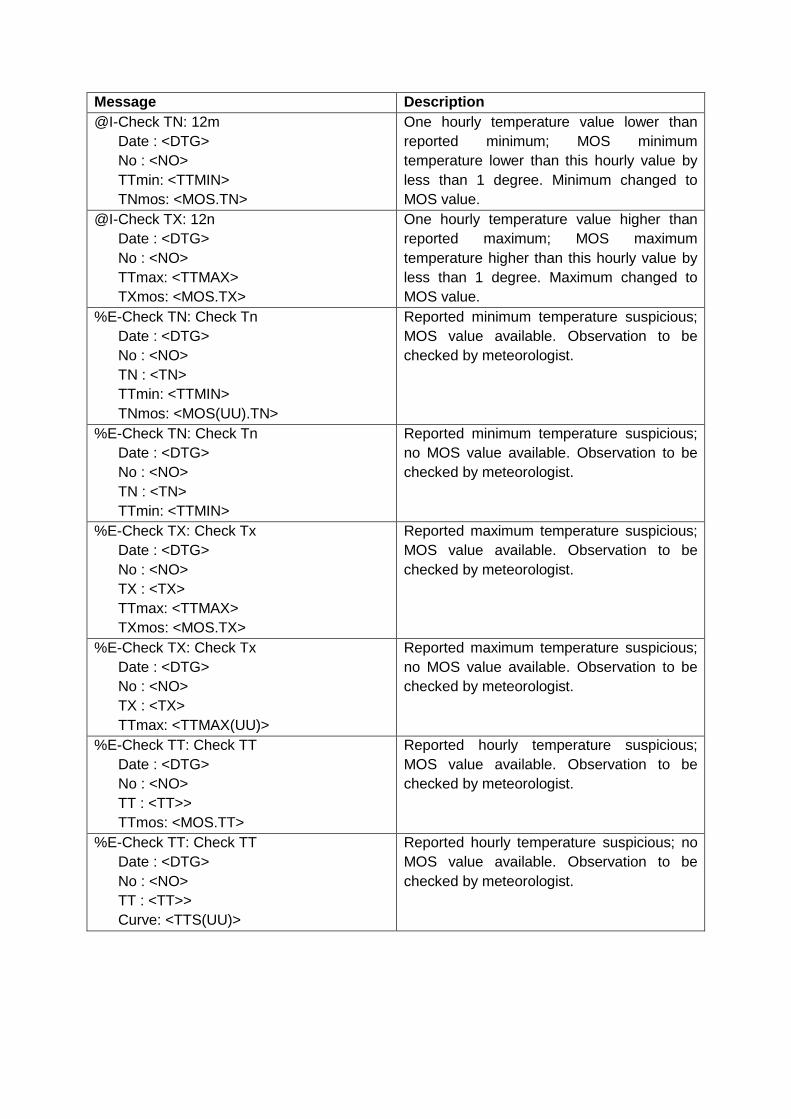
Message Description
@I-Check TN: 12m
Date : <DTG>
No : <NO>
TTmin: <TTMIN>
TNmos: <MOS.TN>
One hourly temperature value lower than
reported minimum; MOS minimum
temperature lower than this hourly value by
less than 1 degree. Minimum changed to
MOS value.
@I-Check TX: 12n
Date : <DTG>
No : <NO>
TTmax: <TTMAX>
TXmos: <MOS.TX>
One hourly temperature value higher than
reported maximum; MOS maximum
temperature higher than this hourly value by
less than 1 degree. Maximum changed to
MOS value.
%E-Check TN: Check Tn
Date : <DTG>
No : <NO>
TN : <TN>
TTmin: <TTMIN>
TNmos: <MOS(UU).TN>
Reported minimum temperature suspicious;
MOS value available. Observation to be
checked by meteorologist.
%E-Check TN: Check Tn
Date : <DTG>
No : <NO>
TN : <TN>
TTmin: <TTMIN>
Reported minimum temperature suspicious;
no MOS value available. Observation to be
checked by meteorologist.
%E-Check TX: Check Tx
Date : <DTG>
No : <NO>
TX : <TX>
TTmax: <TTMAX>
TXmos: <MOS.TX>
Reported maximum temperature suspicious;
MOS value available. Observation to be
checked by meteorologist.
%E-Check TX: Check Tx
Date : <DTG>
No : <NO>
TX : <TX>
TTmax: <TTMAX(UU)>
Reported maximum temperature suspicious;
no MOS value available. Observation to be
checked by meteorologist.
%E-Check TT: Check TT
Date : <DTG>
No : <NO>
TT : <TT>>
TTmos: <MOS.TT>
Reported hourly temperature suspicious;
MOS value available. Observation to be
checked by meteorologist.
%E-Check TT: Check TT
Date : <DTG>
No : <NO>
TT : <TT>>
Curve: <TTS(UU)>
Reported hourly temperature suspicious; no
MOS value available. Observation to be
checked by meteorologist.
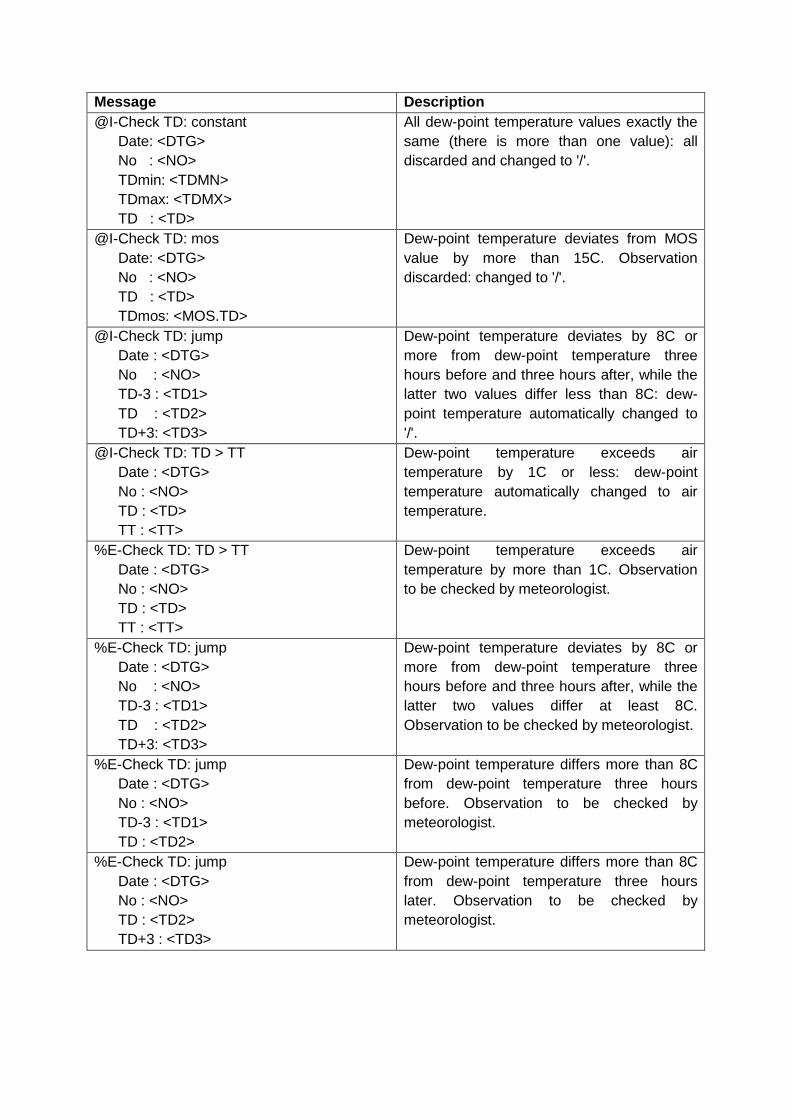
Message Description
@I-Check TD: constant
Date: <DTG>
No : <NO>
TDmin: <TDMN>
TDmax: <TDMX>
TD : <TD>
All dew-point temperature values exactly the
same (there is more than one value): all
discarded and changed to '/'.
@I-Check TD: mos
Date: <DTG>
No : <NO>
TD : <TD>
TDmos: <MOS.TD>
Dew-point temperature deviates from MOS
value by more than 15C. Observation
discarded: changed to '/'.
@I-Check TD: jump
Date : <DTG>
No : <NO>
TD-3 : <TD1>
TD : <TD2>
TD+3: <TD3>
Dew-point temperature deviates by 8C or
more from dew-point temperature three
hours before and three hours after, while the
latter two values differ less than 8C: dew-
point temperature automatically changed to
'/'.
@I-Check TD: TD > TT
Date : <DTG>
No : <NO>
TD : <TD>
TT : <TT>
Dew-point temperature exceeds air
temperature by 1C or less: dew-point
temperature automatically changed to air
temperature.
%E-Check TD: TD > TT
Date : <DTG>
No : <NO>
TD : <TD>
TT : <TT>
Dew-point temperature exceeds air
temperature by more than 1C. Observation
to be checked by meteorologist.
%E-Check TD: jump
Date : <DTG>
No : <NO>
TD-3 : <TD1>
TD : <TD2>
TD+3: <TD3>
Dew-point temperature deviates by 8C or
more from dew-point temperature three
hours before and three hours after, while the
latter two values differ at least 8C.
Observation to be checked by meteorologist.
%E-Check TD: jump
Date : <DTG>
No : <NO>
TD-3 : <TD1>
TD : <TD2>
Dew-point temperature differs more than 8C
from dew-point temperature three hours
before. Observation to be checked by
meteorologist.
%E-Check TD: jump
Date : <DTG>
No : <NO>
TD : <TD2>
TD+3 : <TD3>
Dew-point temperature differs more than 8C
from dew-point temperature three hours
later. Observation to be checked by
meteorologist.
Message Description
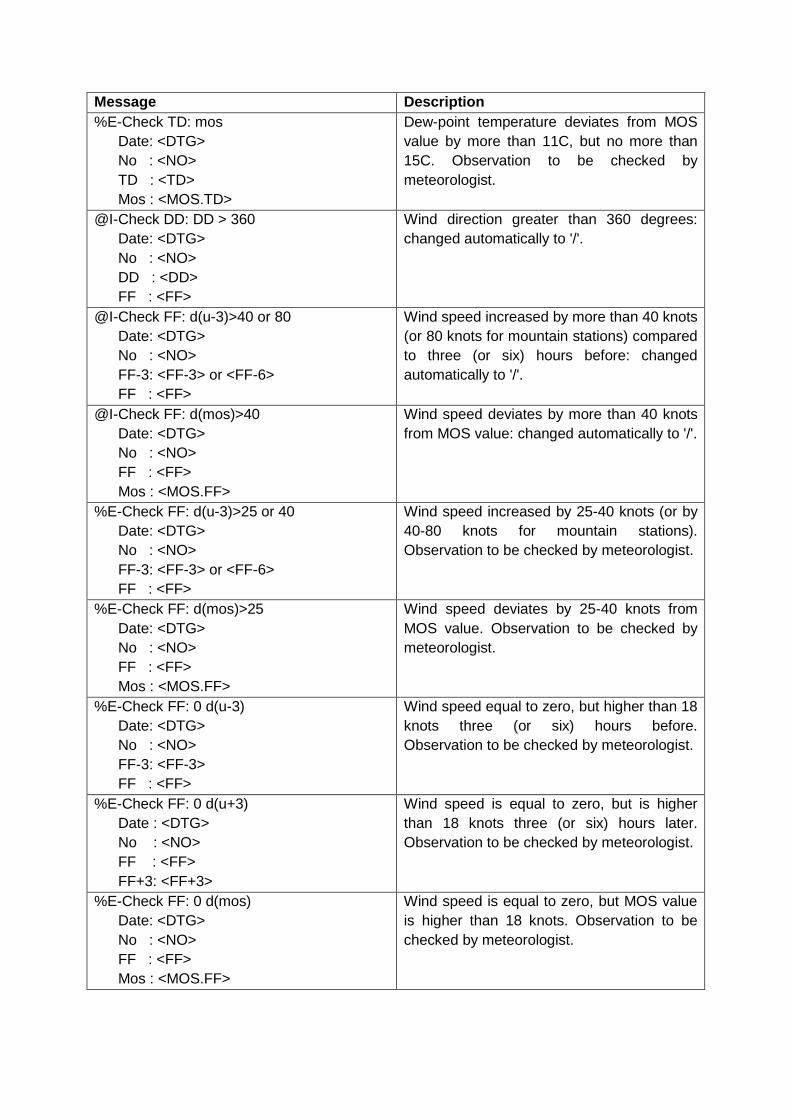
%E-Check TD: mos
Date: <DTG>
No : <NO>
TD : <TD>
Mos : <MOS.TD>
Dew-point temperature deviates from MOS
value by more than 11C, but no more than
15C. Observation to be checked by
meteorologist.
@I-Check DD: DD > 360
Date: <DTG>
No : <NO>
DD : <DD>
FF : <FF>
Wind direction greater than 360 degrees:
changed automatically to '/'.
@I-Check FF: d(u-3)>40 or 80
Date: <DTG>
No : <NO>
FF-3: <FF-3> or <FF-6>
FF : <FF>
Wind speed increased by more than 40 knots
(or 80 knots for mountain stations) compared
to three (or six) hours before: changed
automatically to '/'.
@I-Check FF: d(mos)>40
Date: <DTG>
No : <NO>
FF : <FF>
Mos : <MOS.FF>
Wind speed deviates by more than 40 knots
from MOS value: changed automatically to '/'.
%E-Check FF: d(u-3)>25 or 40
Date: <DTG>
No : <NO>
FF-3: <FF-3> or <FF-6>
FF : <FF>
Wind speed increased by 25-40 knots (or by
40-80 knots for mountain stations).
Observation to be checked by meteorologist.
%E-Check FF: d(mos)>25
Date: <DTG>
No : <NO>
FF : <FF>
Mos : <MOS.FF>
Wind speed deviates by 25-40 knots from
MOS value. Observation to be checked by
meteorologist.
%E-Check FF: 0 d(u-3)
Date: <DTG>
No : <NO>
FF-3: <FF-3>
FF : <FF>
Wind speed equal to zero, but higher than 18
knots three (or six) hours before.
Observation to be checked by meteorologist.
%E-Check FF: 0 d(u+3)
Date : <DTG>
No : <NO>
FF : <FF>
FF+3: <FF+3>
Wind speed is equal to zero, but is higher
than 18 knots three (or six) hours later.
Observation to be checked by meteorologist.
%E-Check FF: 0 d(mos)
Date: <DTG>
No : <NO>
FF : <FF>
Mos : <MOS.FF>
Wind speed is equal to zero, but MOS value
is higher than 18 knots. Observation to be
checked by meteorologist.
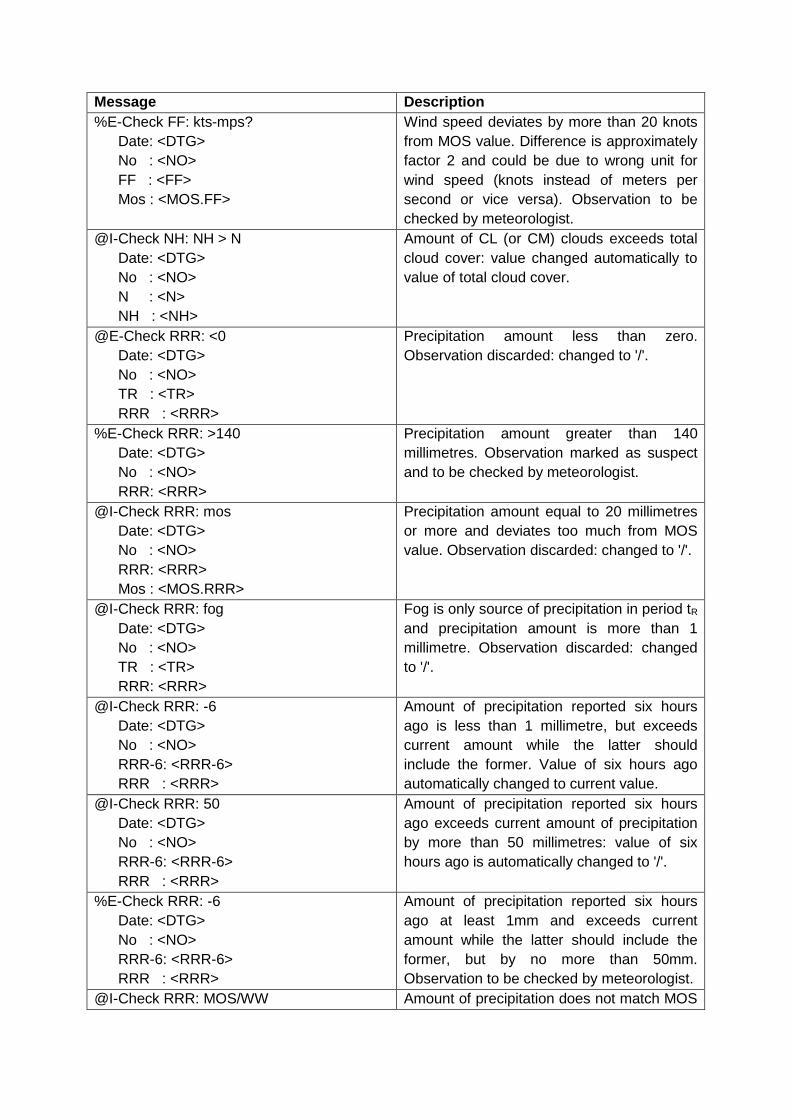
Message Description
%E-Check FF: kts-mps?
Date: <DTG>
No : <NO>
FF : <FF>
Mos : <MOS.FF>
Wind speed deviates by more than 20 knots
from MOS value. Difference is approximately
factor 2 and could be due to wrong unit for
wind speed (knots instead of meters per
second or vice versa). Observation to be
checked by meteorologist.
@I-Check NH: NH > N
Date: <DTG>
No : <NO>
N : <N>
NH : <NH>
Amount of CL (or CM) clouds exceeds total
cloud cover: value changed automatically to
value of total cloud cover.
@E-Check RRR: <0
Date: <DTG>
No : <NO>
TR : <TR>
RRR : <RRR>
Precipitation amount less than zero.
Observation discarded: changed to '/'.
%E-Check RRR: >140
Date: <DTG>
No : <NO>
RRR: <RRR>
Precipitation amount greater than 140
millimetres. Observation marked as suspect
and to be checked by meteorologist.
@I-Check RRR: mos
Date: <DTG>
No : <NO>
RRR: <RRR>
Mos : <MOS.RRR>
Precipitation amount equal to 20 millimetres
or more and deviates too much from MOS
value. Observation discarded: changed to '/'.
@I-Check RRR: fog
Date: <DTG>
No : <NO>
TR : <TR>
RRR: <RRR>
Fog is only source of precipitation in period tR
and precipitation amount is more than 1
millimetre. Observation discarded: changed
to '/'.
@I-Check RRR: -6
Date: <DTG>
No : <NO>
RRR-6: <RRR-6>
RRR : <RRR>
Amount of precipitation reported six hours
ago is less than 1 millimetre, but exceeds
current amount while the latter should
include the former. Value of six hours ago
automatically changed to current value.
@I-Check RRR: 50
Date: <DTG>
No : <NO>
RRR-6: <RRR-6>
RRR : <RRR>
Amount of precipitation reported six hours
ago exceeds current amount of precipitation
by more than 50 millimetres: value of six
hours ago is automatically changed to '/'.
%E-Check RRR: -6
Date: <DTG>
No : <NO>
RRR-6: <RRR-6>
RRR : <RRR>
Amount of precipitation reported six hours
ago at least 1mm and exceeds current
amount while the latter should include the
former, but by no more than 50mm.
Observation to be checked by meteorologist.
@I-Check RRR: MOS/WW Amount of precipitation does not match MOS
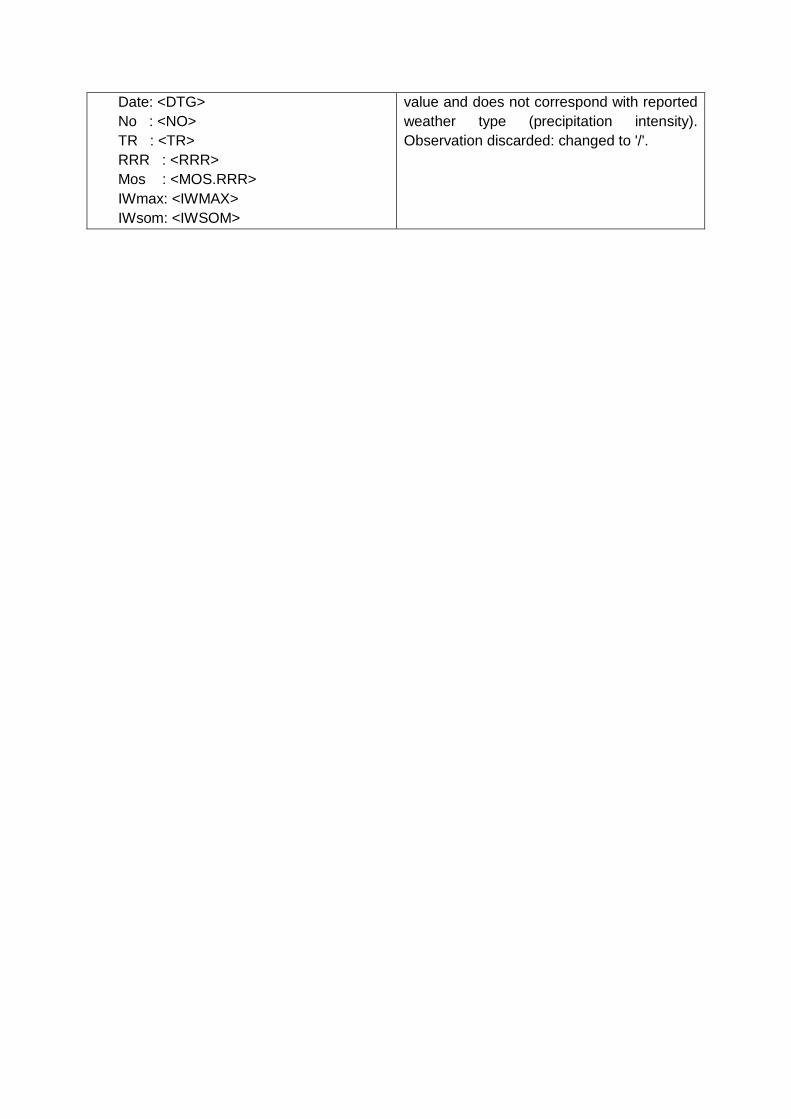
Date: <DTG>
No : <NO>
TR : <TR>
RRR : <RRR>
Mos : <MOS.RRR>
IWmax: <IWMAX>
IWsom: <IWSOM>
value and does not correspond with reported
weather type (precipitation intensity).
Observation discarded: changed to '/'.
Message Description
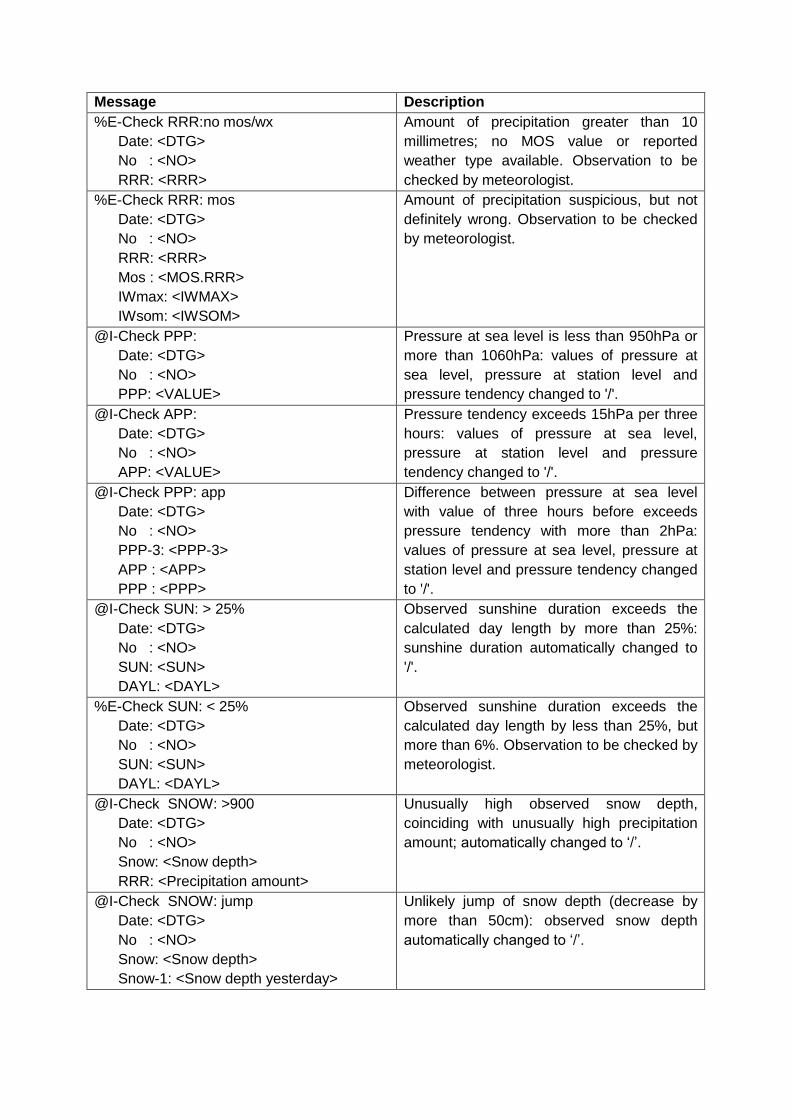
%E-Check RRR:no mos/wx
Date: <DTG>
No : <NO>
RRR: <RRR>
Amount of precipitation greater than 10
millimetres; no MOS value or reported
weather type available. Observation to be
checked by meteorologist.
%E-Check RRR: mos
Date: <DTG>
No : <NO>
RRR: <RRR>
Mos : <MOS.RRR>
IWmax: <IWMAX>
IWsom: <IWSOM>
Amount of precipitation suspicious, but not
definitely wrong. Observation to be checked
by meteorologist.
@I-Check PPP:
Date: <DTG>
No : <NO>
PPP: <VALUE>
Pressure at sea level is less than 950hPa or
more than 1060hPa: values of pressure at
sea level, pressure at station level and
pressure tendency changed to '/'.
@I-Check APP:
Date: <DTG>
No : <NO>
APP: <VALUE>
Pressure tendency exceeds 15hPa per three
hours: values of pressure at sea level,
pressure at station level and pressure
tendency changed to '/'.
@I-Check PPP: app
Date: <DTG>
No : <NO>
PPP-3: <PPP-3>
APP : <APP>
PPP : <PPP>
Difference between pressure at sea level
with value of three hours before exceeds
pressure tendency with more than 2hPa:
values of pressure at sea level, pressure at
station level and pressure tendency changed
to '/'.
@I-Check SUN: > 25%
Date: <DTG>
No : <NO>
SUN: <SUN>
DAYL: <DAYL>
Observed sunshine duration exceeds the
calculated day length by more than 25%:
sunshine duration automatically changed to
'/'.
%E-Check SUN: < 25%
Date: <DTG>
No : <NO>
SUN: <SUN>
DAYL: <DAYL>
Observed sunshine duration exceeds the
calculated day length by less than 25%, but
more than 6%. Observation to be checked by
meteorologist.
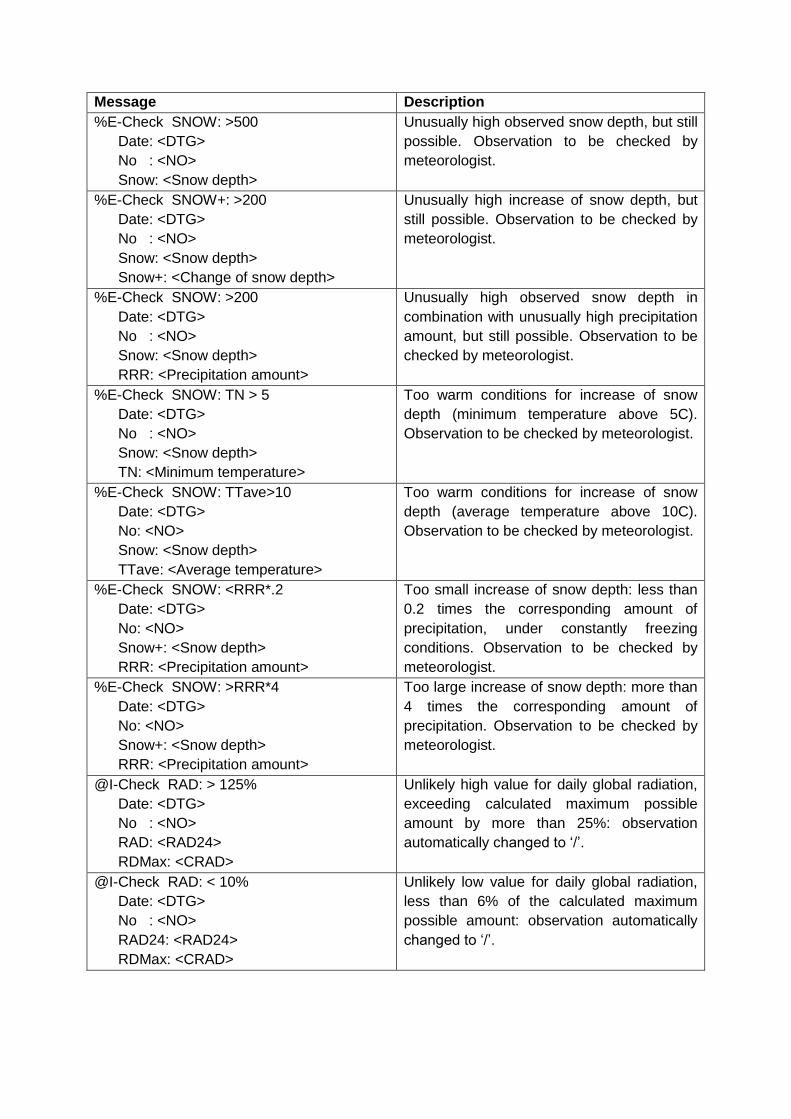
@I-Check SNOW: >900
Date: <DTG>
No : <NO>
Snow: <Snow depth>
RRR: <Precipitation amount>
Unusually high observed snow depth,
coinciding with unusually high precipitation
amount; automatically changed to ‘/’.
@I-Check SNOW: jump
Date: <DTG>
No : <NO>
Snow: <Snow depth>
Snow-1: <Snow depth yesterday>
Unlikely jump of snow depth (decrease by
more than 50cm): observed snow depth
automatically changed to ‘/’.
Message Description
%E-Check SNOW: >500
Date: <DTG>
No : <NO>
Snow: <Snow depth>
Unusually high observed snow depth, but still
possible. Observation to be checked by
meteorologist.
%E-Check SNOW+: >200
Date: <DTG>
No : <NO>
Snow: <Snow depth>
Snow+: <Change of snow depth>
Unusually high increase of snow depth, but
still possible. Observation to be checked by
meteorologist.
%E-Check SNOW: >200
Date: <DTG>
No : <NO>
Snow: <Snow depth>
RRR: <Precipitation amount>
Unusually high observed snow depth in
combination with unusually high precipitation
amount, but still possible. Observation to be
checked by meteorologist.
%E-Check SNOW: TN > 5
Date: <DTG>
No : <NO>
Snow: <Snow depth>
TN: <Minimum temperature>
Too warm conditions for increase of snow
depth (minimum temperature above 5C).
Observation to be checked by meteorologist.
%E-Check SNOW: TTave>10
Date: <DTG>
No: <NO>
Snow: <Snow depth>
TTave: <Average temperature>
Too warm conditions for increase of snow
depth (average temperature above 10C).
Observation to be checked by meteorologist.
%E-Check SNOW: <RRR*.2
Date: <DTG>
No: <NO>
Snow+: <Snow depth>
RRR: <Precipitation amount>
Too small increase of snow depth: less than
0.2 times the corresponding amount of
precipitation, under constantly freezing
conditions. Observation to be checked by
meteorologist.
%E-Check SNOW: >RRR*4
Date: <DTG>
No: <NO>
Snow+: <Snow depth>
RRR: <Precipitation amount>
Too large increase of snow depth: more than
4 times the corresponding amount of
precipitation. Observation to be checked by
meteorologist.
@I-Check RAD: > 125%
Date: <DTG>
No : <NO>
RAD: <RAD24>
RDMax: <CRAD>
Unlikely high value for daily global radiation,
exceeding calculated maximum possible
amount by more than 25%: observation
automatically changed to ‘/’.
@I-Check RAD: < 10%
Date: <DTG>
No : <NO>
RAD24: <RAD24>
RDMax: <CRAD>
Unlikely low value for daily global radiation,
less than 6% of the calculated maximum
possible amount: observation automatically
changed to ‘/’.
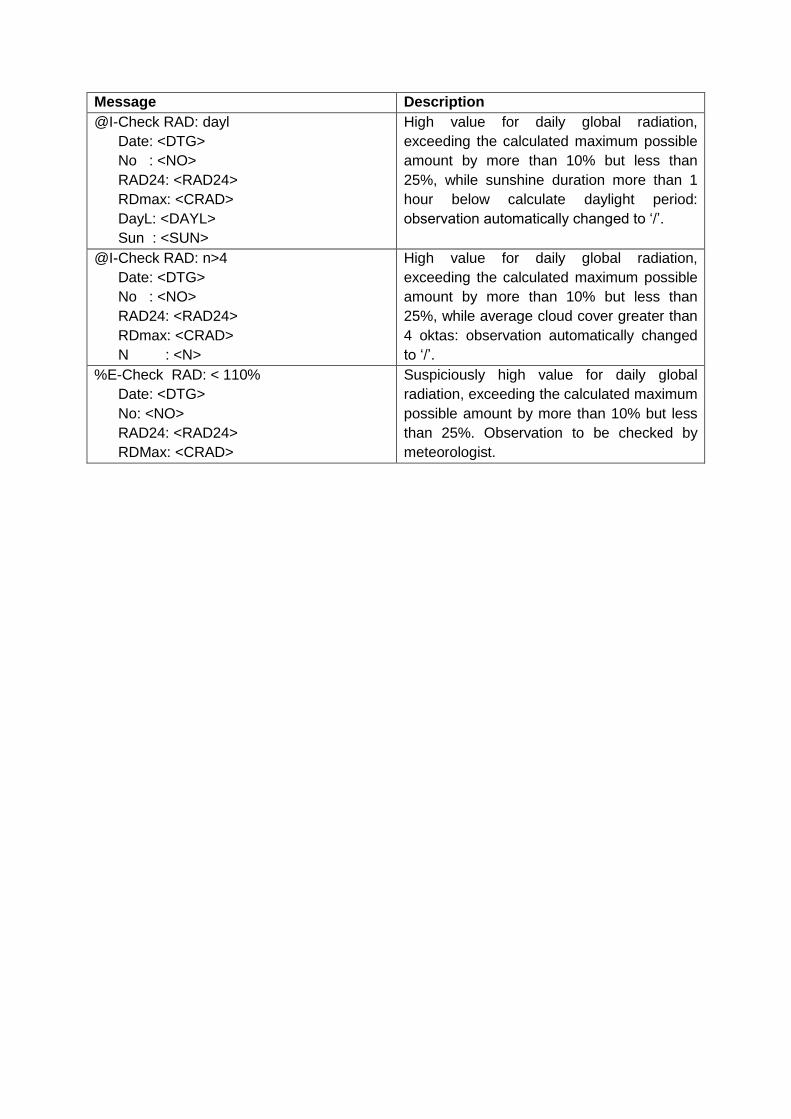
Message Description
@I-Check RAD: dayl
Date: <DTG>
No : <NO>
RAD24: <RAD24>
RDmax: <CRAD>
DayL: <DAYL>
Sun : <SUN>
High value for daily global radiation,
exceeding the calculated maximum possible
amount by more than 10% but less than
25%, while sunshine duration more than 1
hour below calculate daylight period:
observation automatically changed to ‘/’.
@I-Check RAD: n>4
Date: <DTG>
No : <NO>
RAD24: <RAD24>
RDmax: <CRAD>
N : <N>
High value for daily global radiation,
exceeding the calculated maximum possible
amount by more than 10% but less than
25%, while average cloud cover greater than
4 oktas: observation automatically changed
to ‘/’.
%E-Check RAD: < 110%
Date: <DTG>
No: <NO>
RAD24: <RAD24>
RDMax: <CRAD>
Suspiciously high value for daily global
radiation, exceeding the calculated maximum
possible amount by more than 10% but less
than 25%. Observation to be checked by
meteorologist.
4 Observation control
4.1 Introduction
The program OBSCON offers the operator the possibility of viewing coded (stored in the
database CODED), decoded and derived element values (both stored in the database
DECODED). Furthermore, errors which were not automatically corrected by the CHECK
program can be displayed, and if necessary values can be added to or modified in the
database DECODED. For the representation of the data it is possible to choose various lay-
outs.
4.2 Screen lay-outs
Four lay-out types are available for the representation of the decoded and derived element
values: station observation, diagram, map and table.
4.2.1 Station observations
This lay-out displays the decoded and derived element values of a single station for a
selected date and time on the screen. An example is given in Fig. 4.1.
At the top of the screen the date and time of the observation is given (YYMMDDHH in UTC).
Below this some station information is listed: station name, number, code, geographical
coordinates (N.L. and E.L. are positive) and the altitude above sea level (H in metres). Next
the (enhanced) coded observation (stored in the database CODED) and the decoded
observation (stored in the database DECODED) are given. Finally, the derived parameters
are listed (also stored in the database DECODED).
Observations coded with NO OBSERVATION (POSSIBLE) and parameters which could not
be derived due to these missing data are represented by forward slashes '///'. The symbols c,
s and t behind element values denote that the coded value is automatically corrected by the
program CHECK (c) or the value is obtained through interpolation in time (t). Observation
elements which are not coded get no value at all.
Note that it is possible to have a decoded observation without a corresponding coded
observation because of the interpolations performed.
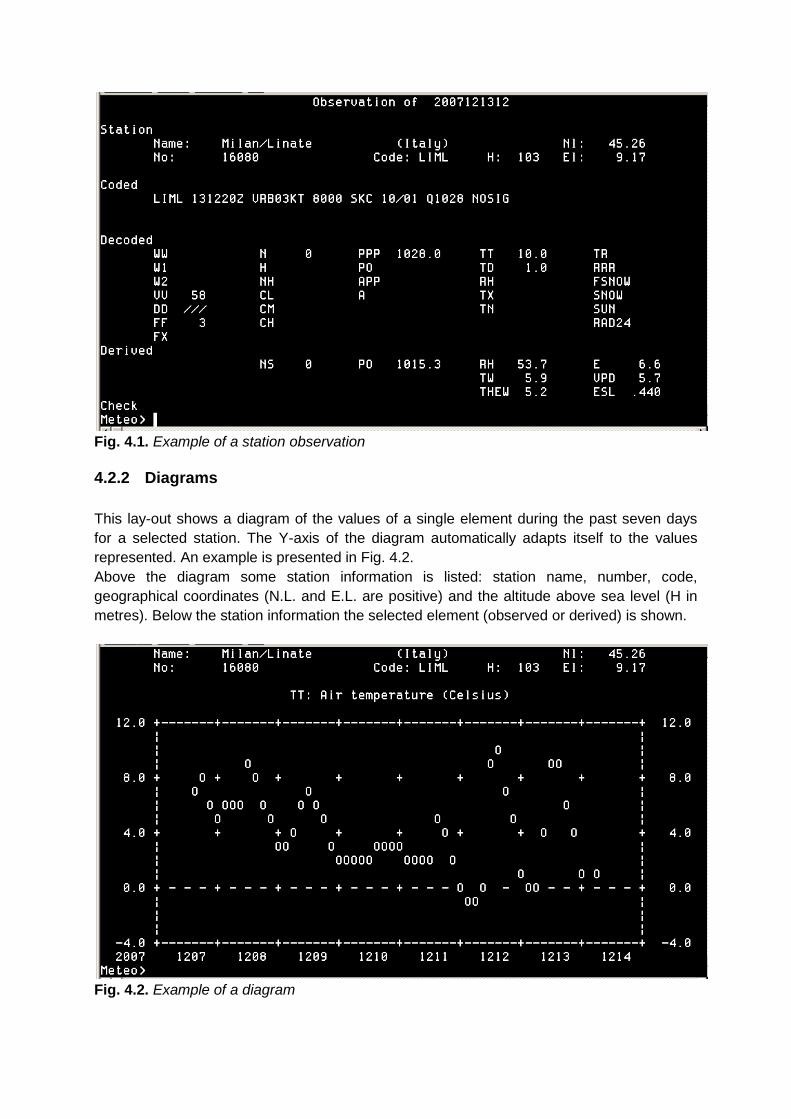
Fig. 4.1. Example of a station observation
4.2.2 Diagrams
This lay-out shows a diagram of the values of a single element during the past seven days
for a selected station. The Y-axis of the diagram automatically adapts itself to the values
represented. An example is presented in Fig. 4.2.
Above the diagram some station information is listed: station name, number, code,
geographical coordinates (N.L. and E.L. are positive) and the altitude above sea level (H in
metres). Below the station information the selected element (observed or derived) is shown.
Fig. 4.2. Example of a diagram
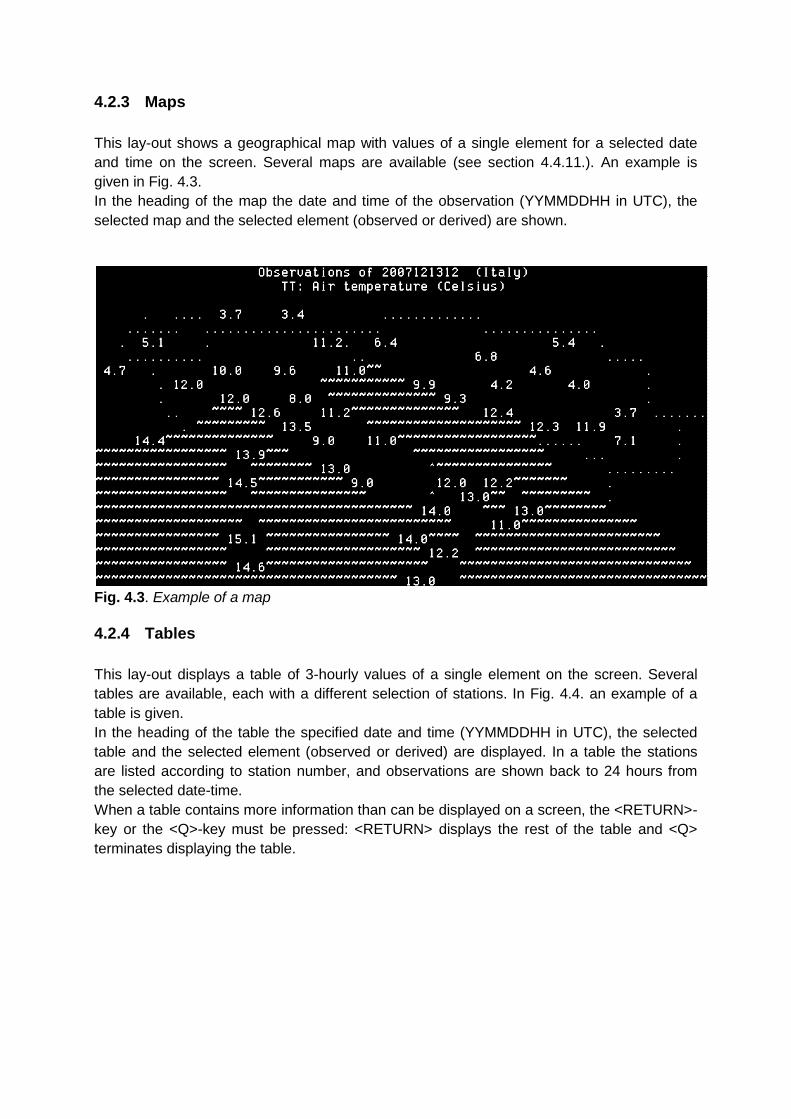
4.2.3 Maps
This lay-out shows a geographical map with values of a single element for a selected date
and time on the screen. Several maps are available (see section 4.4.11.). An example is
given in Fig. 4.3.
In the heading of the map the date and time of the observation (YYMMDDHH in UTC), the
selected map and the selected element (observed or derived) are shown.
Fig. 4.3. Example of a map
4.2.4 Tables
This lay-out displays a table of 3-hourly values of a single element on the screen. Several
tables are available, each with a different selection of stations. In Fig. 4.4. an example of a
table is given.
In the heading of the table the specified date and time (YYMMDDHH in UTC), the selected
table and the selected element (observed or derived) are displayed. In a table the stations
are listed according to station number, and observations are shown back to 24 hours from
the selected date-time.
When a table contains more information than can be displayed on a screen, the <RETURN>-
key or the <Q>-key must be pressed: <RETURN> displays the rest of the table and <Q>
terminates displaying the table.
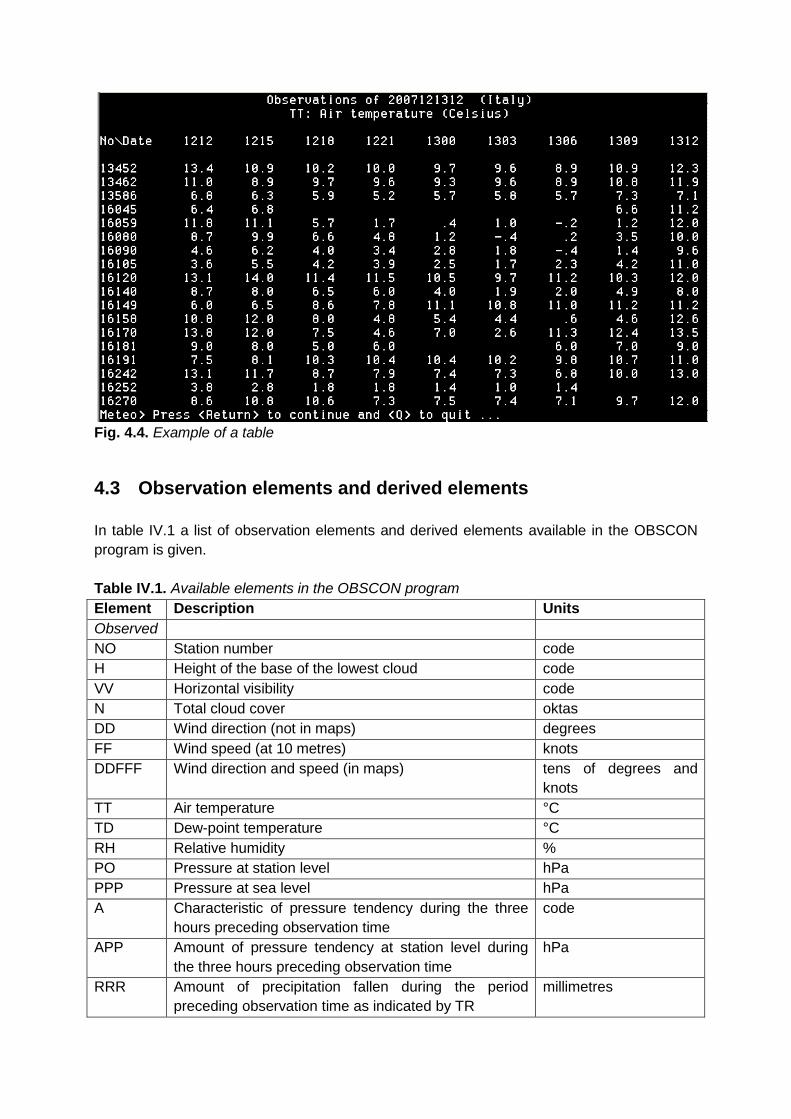
Fig. 4.4. Example of a table
4.3 Observation elements and derived elements
In table IV.1 a list of observation elements and derived elements available in the OBSCON
program is given.
Table IV.1. Available elements in the OBSCON program
Element Description Units
Observed
NO Station number code
H Height of the base of the lowest cloud code
VV Horizontal visibility code
N Total cloud cover oktas
DD Wind direction (not in maps) degrees
FF Wind speed (at 10 metres) knots
DDFFF Wind direction and speed (in maps) tens of degrees and
knots
TT Air temperature °C
TD Dew-point temperature °C
RH Relative humidity %
PO Pressure at station level hPa
PPP Pressure at sea level hPa
A Characteristic of pressure tendency during the three
hours preceding observation time
code
APP Amount of pressure tendency at station level during
the three hours preceding observation time
hPa
RRR Amount of precipitation fallen during the period
preceding observation time as indicated by TR
millimetres
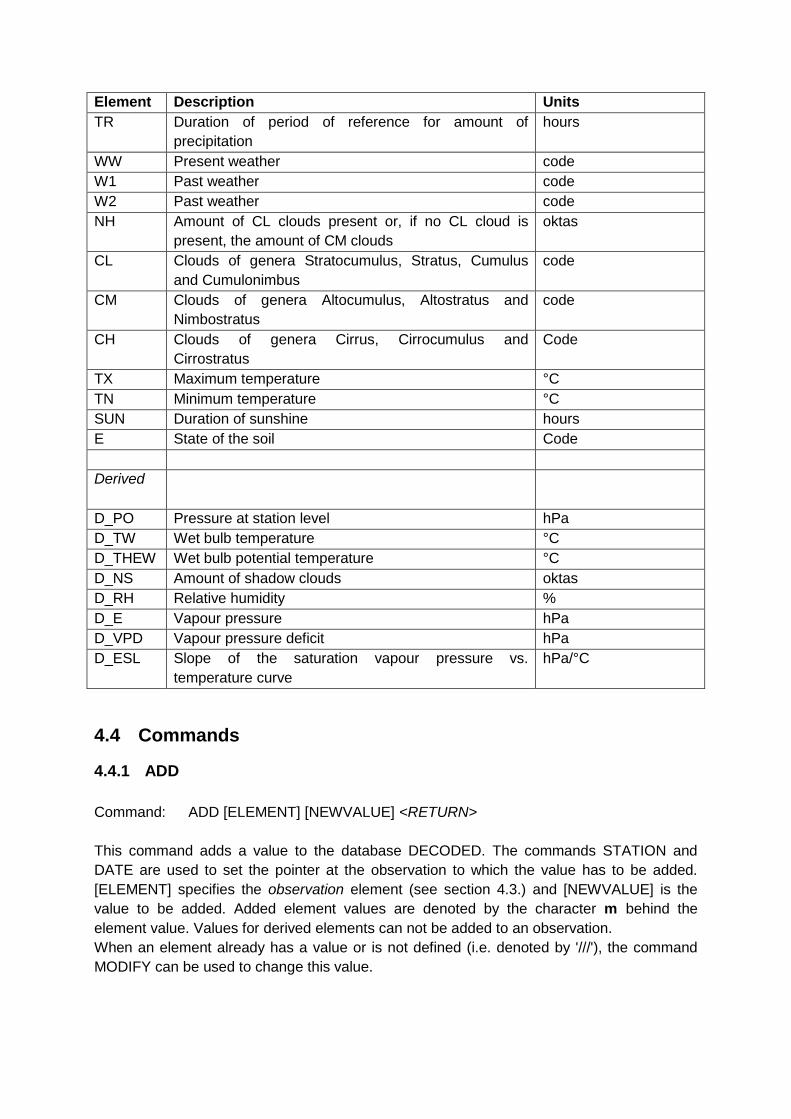
Element Description Units
TR Duration of period of reference for amount of
precipitation
hours
WW Present weather code
W1 Past weather code
W2 Past weather code
NH Amount of CL clouds present or, if no CL cloud is
present, the amount of CM clouds
oktas
CL Clouds of genera Stratocumulus, Stratus, Cumulus
and Cumulonimbus
code
CM Clouds of genera Altocumulus, Altostratus and
Nimbostratus
code
CH Clouds of genera Cirrus, Cirrocumulus and
Cirrostratus
Code
TX Maximum temperature °C
TN Minimum temperature °C
SUN Duration of sunshine hours
E State of the soil Code
Derived
D_PO Pressure at station level hPa
D_TW Wet bulb temperature °C
D_THEW Wet bulb potential temperature °C
D_NS Amount of shadow clouds oktas
D_RH Relative humidity %
D_E Vapour pressure hPa
D_VPD Vapour pressure deficit hPa
D_ESL Slope of the saturation vapour pressure vs.
temperature curve
hPa/°C
4.4 Commands
4.4.1 ADD
Command: ADD [ELEMENT] [NEWVALUE] <RETURN>
This command adds a value to the database DECODED. The commands STATION and
DATE are used to set the pointer at the observation to which the value has to be added.
[ELEMENT] specifies the observation element (see section 4.3.) and [NEWVALUE] is the
value to be added. Added element values are denoted by the character m behind the
element value. Values for derived elements can not be added to an observation.
When an element already has a value or is not defined (i.e. denoted by '///'), the command
MODIFY can be used to change this value.
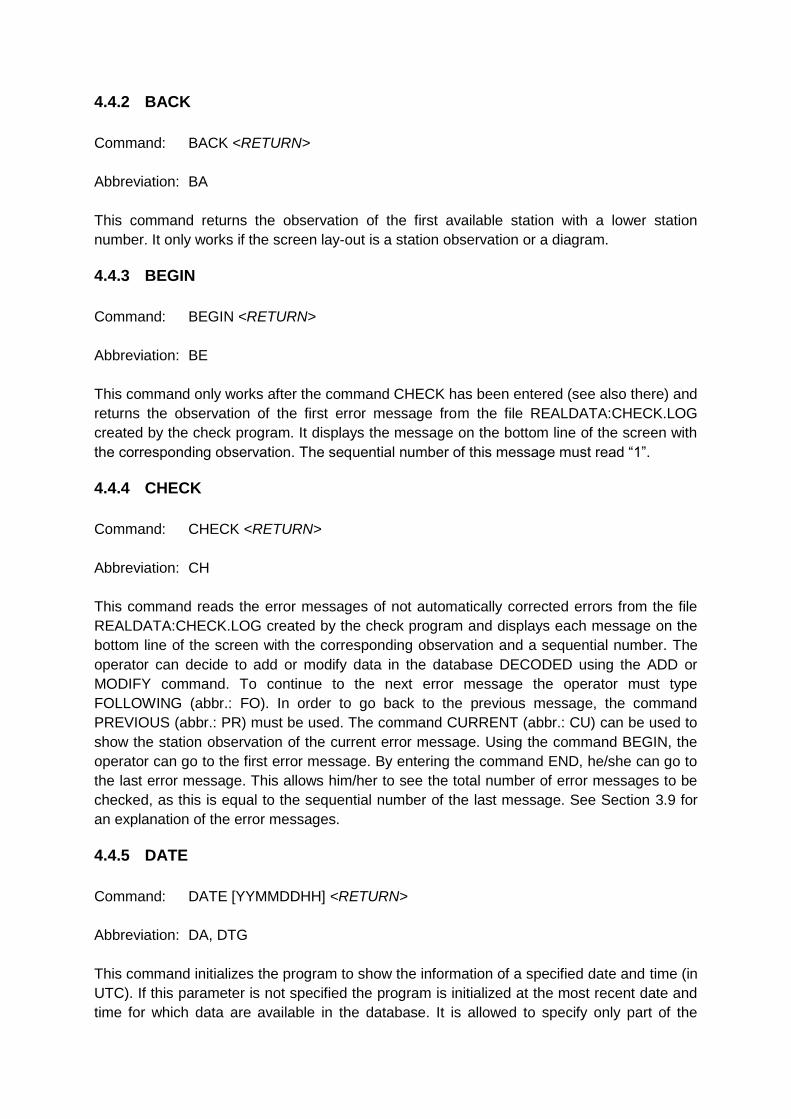
4.4.2 BACK
Command: BACK <RETURN>
Abbreviation: BA
This command returns the observation of the first available station with a lower station
number. It only works if the screen lay-out is a station observation or a diagram.
4.4.3 BEGIN
Command: BEGIN <RETURN>
Abbreviation: BE
This command only works after the command CHECK has been entered (see also there) and
returns the observation of the first error message from the file REALDATA:CHECK.LOG
created by the check program. It displays the message on the bottom line of the screen with
the corresponding observation. The sequential number of this message must read “1”.
4.4.4 CHECK
Command: CHECK <RETURN>
Abbreviation: CH
This command reads the error messages of not automatically corrected errors from the file
REALDATA:CHECK.LOG created by the check program and displays each message on the
bottom line of the screen with the corresponding observation and a sequential number. The
operator can decide to add or modify data in the database DECODED using the ADD or
MODIFY command. To continue to the next error message the operator must type
FOLLOWING (abbr.: FO). In order to go back to the previous message, the command
PREVIOUS (abbr.: PR) must be used. The command CURRENT (abbr.: CU) can be used to
show the station observation of the current error message. Using the command BEGIN, the
operator can go to the first error message. By entering the command END, he/she can go to
the last error message. This allows him/her to see the total number of error messages to be
checked, as this is equal to the sequential number of the last message. See Section 3.9 for
an explanation of the error messages.
4.4.5 DATE
Command: DATE [YYMMDDHH] <RETURN>
Abbreviation: DA, DTG
This command initializes the program to show the information of a specified date and time (in
UTC). If this parameter is not specified the program is initialized at the most recent date and
time for which data are available in the database. It is allowed to specify only part of the
parameter (i.e. HH, DDHH or MMDDHH). Then the program completes the parameter
requiring the result to be the most recent date-time group compared to the last date and time
for which data are available in the database. Furthermore, time can be changed by adding or
subtracting hours from the current time using
Input: DTG [II] <RETURN>
where [II] represents a positive or a negative integer value.
Examples: DTG 91030112, DA 6, DTG -3, DA +18
4.4.6 DELETE
Command: DELETE [ELEMENT] [OLDVALUE] <RETURN>
Abbreviation: DEL
This command removes the value [OLDVALUE] of observation element [ELEMENT] of the
observation selected with the commands STATION and DATE from the database
DECODED. Values of derived elements can not be removed. To delete the complete
observation [ELEMENT] must be set to ALL, in which case [OLDVALUE] needs not to be
specified.
4.4.7 DIAGRAM
Command: DIAGRAM <RETURN>
Abbreviation: DI
This command initializes the program to show a diagram of the observations of the past
seven days selected with the commands STATION and ELEMENT. Default a diagram of the
air temperature is displayed.
4.4.8 ELEMENT
Command: ELEMENT [ELEMENT] <RETURN>
Abbreviation: EL
This command returns the values of the element specified by [ELEMENT] (see section 4.3.),
and is used for diagrams, maps and tables.
4.4.9 END
Command: END <RETURN>
Abbreviation: EN
This command only works after the command CHECK has been entered (see also there) and
returns the observation of the last error message from the file REALDATA:CHECK.LOG
created by the check program. It displays the message on the bottom line of the screen with
the corresponding observation. The sequential number of this message is equal to the total
number of error messages to be checked.
4.4.10 EXIT/QUIT
Command: EXIT <RETURN>
QUIT <RETURN>
Abbreviation: EX, QU
These commands end the program.
4.4.11 FIRST
Command: FIRST <RETURN>
Abbreviation: FI
This command returns the observation of the first station in the database DECODED for the
date-time specified with the command DATE. It only works if the screen lay-out is a station
observation or a diagram.
4.4.12 FOLLOWING
Command: FOLLOWING <RETURN>
Abbreviation: FO
This command only works after the command CHECK has been entered (see also there) and
returns the observation of the following error message from the file REALDATA:CHECK.LOG
created by the check program.
4.4.13 HELP
Command: HELP <RETURN>
Abbreviation: HE
This command returns general information about the program OBSCON. Specific information
about the commands can be obtained by typing
Input: HELP [COMMAND] <RETURN>
4.4.14 LAST
Command: LAST <RETURN>
Abbreviation: LA
This command returns the observation of the last station in the database DECODED for the
date-time specified with the command DATE. It only works if the screen lay-out is a station
observation or a diagram.
4.4.15 MAP
Command: MAP [NAME] <RETURN>
This command initializes the program to display a geographical map with observations for
the date and time specified with the command DATE. Default a map with air temperatures is
displayed, but other elements can be chosen using the command ELEMENT. A particular
map is selected with [NAME]. The options are listed in table IV.2.
Table IV.2. Available maps
[NAME] Map
AUS Austria
BEL Belgium and Luxemburg
FRA France
GER Federal Republic of Germany
GRE Greece
ITA Italy
NET The Netherlands
SCA Scandinavia
SPA Spain and Portugal
SWI Switzerland
UK United Kingdom and Ireland
4.4.16 MODIFY
Command: MODIFY [ELEMENT] [OLDVALUE] [NEWVALUE] <RETURN>
Abbreviation: M
This command modifies a value in the database DECODED. The commands STATION and
DATE are used to set the pointer at the observation in which a value has to be modified.
[ELEMENT] specifies the observation element (see section 4.3.), and [OLDVALUE] is the old
value which has to be changed into the new value [NEWVALUE]. Values of derived elements
can not be modified. Modified element values are denoted by the character m behind the
value. If no correct value is available for a wrong element value, it is better to modify it into
NOT DEFINED using the forward slash '/' than to delete it from the decoded observation. In
case an observation element is not present (i.e. has no value and is not denoted by '///'), the
command ADD can be used to add this element to the database.
4.4.17 NEXT
Command: NEXT <RETURN>
Abbreviation: NE
This command returns the observation of the first available station with a higher station
number. It only works if the screen lay-out is a station observation or a diagram.
4.4.18 OBSERVATION
Command: OBSERVATION <RETURN>
Abbreviation: OB
This command initializes the program to show the observation of a single station selected
with the command STATION for the date and time specified with the command DATE.
4.4.19 PREVIOUS
Command: PREVIOUS <RETURN>
Abbreviation: PR
This command only works after the command CHECK has been entered (see also there) and
returns the observation of the previous error message from the file REALDATA:CHECK.LOG
created by the check program.
4.4.20 SHOW
Command: SHOW <RETURN>
Abbreviation: SH
This command returns the last requested data back on the screen. It is especially
implemented to return from the help facility to the data.
4.4.21 STATION
Command: STATION [IDENTIFICATION] <RETURN>
Abbreviation: ST
This command returns the observation of a particular station selected with the parameter
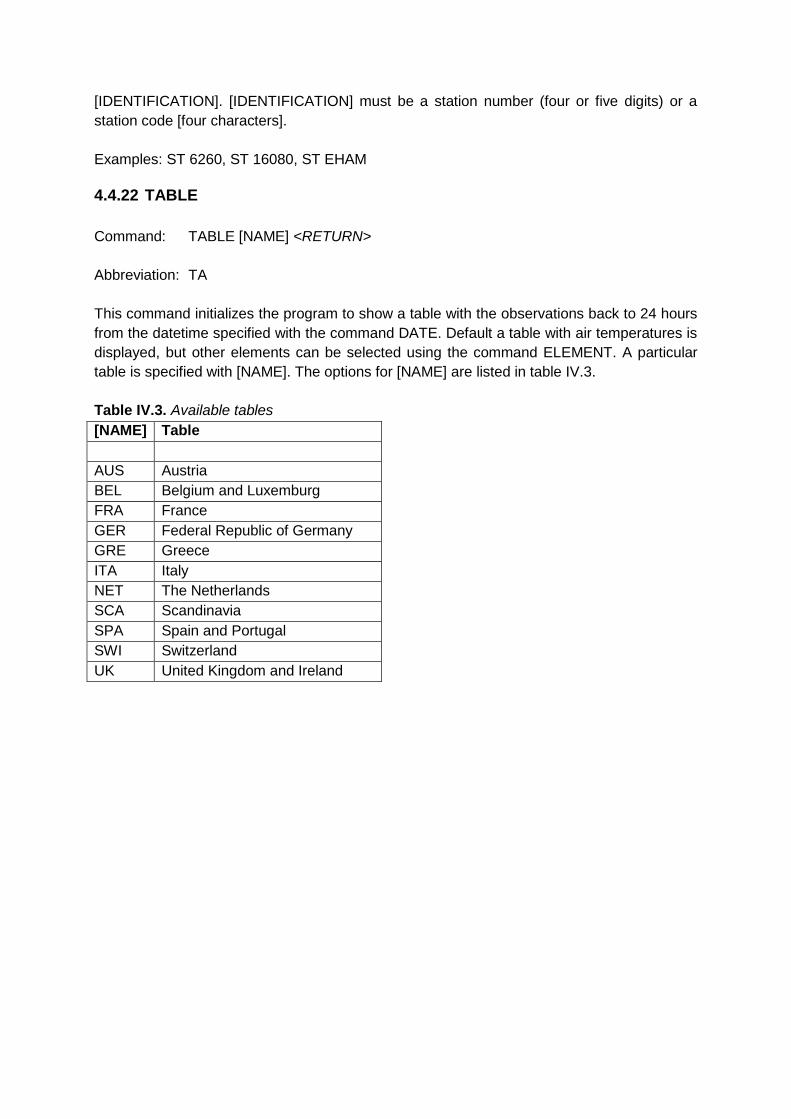
[IDENTIFICATION]. [IDENTIFICATION] must be a station number (four or five digits) or a
station code [four characters].
Examples: ST 6260, ST 16080, ST EHAM
4.4.22 TABLE
Command: TABLE [NAME] <RETURN>
Abbreviation: TA
This command initializes the program to show a table with the observations back to 24 hours
from the datetime specified with the command DATE. Default a table with air temperatures is
displayed, but other elements can be selected using the command ELEMENT. A particular
table is specified with [NAME]. The options for [NAME] are listed in table IV.3.
Table IV.3. Available tables
[NAME] Table
AUS Austria
BEL Belgium and Luxemburg
FRA France
GER Federal Republic of Germany
GRE Greece
ITA Italy
NET The Netherlands
SCA Scandinavia
SPA Spain and Portugal
SWI Switzerland
UK United Kingdom and Ireland
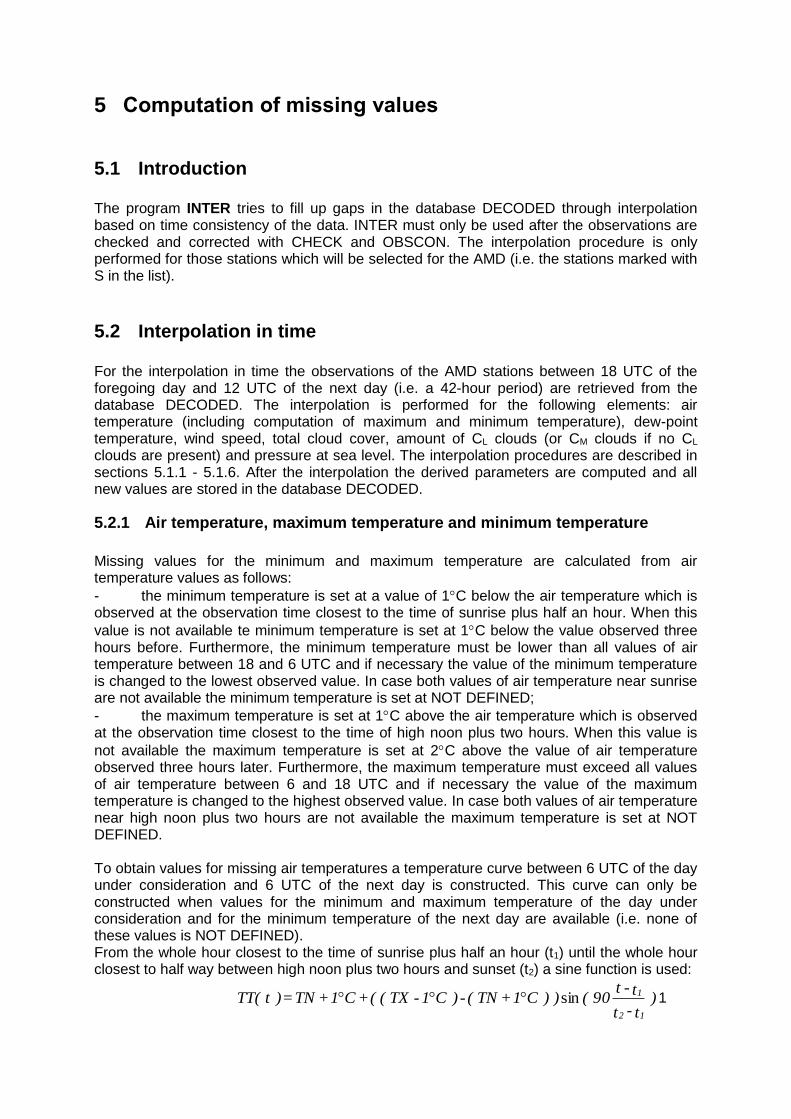
5 Computation of missing values
5.1 Introduction The program INTER tries to fill up gaps in the database DECODED through interpolation based on time consistency of the data. INTER must only be used after the observations are checked and corrected with CHECK and OBSCON. The interpolation procedure is only performed for those stations which will be selected for the AMD (i.e. the stations marked with S in the list).
5.2 Interpolation in time For the interpolation in time the observations of the AMD stations between 18 UTC of the foregoing day and 12 UTC of the next day (i.e. a 42-hour period) are retrieved from the database DECODED. The interpolation is performed for the following elements: air temperature (including computation of maximum and minimum temperature), dew-point temperature, wind speed, total cloud cover, amount of CL clouds (or CM clouds if no CL clouds are present) and pressure at sea level. The interpolation procedures are described in sections 5.1.1 - 5.1.6. After the interpolation the derived parameters are computed and all new values are stored in the database DECODED.
5.2.1 Air temperature, maximum temperature and minimum temperature
Missing values for the minimum and maximum temperature are calculated from air temperature values as follows:
- the minimum temperature is set at a value of 1C below the air temperature which is observed at the observation time closest to the time of sunrise plus half an hour. When this
value is not available te minimum temperature is set at 1C below the value observed three hours before. Furthermore, the minimum temperature must be lower than all values of air temperature between 18 and 6 UTC and if necessary the value of the minimum temperature is changed to the lowest observed value. In case both values of air temperature near sunrise are not available the minimum temperature is set at NOT DEFINED;
- the maximum temperature is set at 1C above the air temperature which is observed at the observation time closest to the time of high noon plus two hours. When this value is
not available the maximum temperature is set at 2C above the value of air temperature observed three hours later. Furthermore, the maximum temperature must exceed all values of air temperature between 6 and 18 UTC and if necessary the value of the maximum temperature is changed to the highest observed value. In case both values of air temperature near high noon plus two hours are not available the maximum temperature is set at NOT DEFINED. To obtain values for missing air temperatures a temperature curve between 6 UTC of the day under consideration and 6 UTC of the next day is constructed. This curve can only be constructed when values for the minimum and maximum temperature of the day under consideration and for the minimum temperature of the next day are available (i.e. none of these values is NOT DEFINED). From the whole hour closest to the time of sunrise plus half an hour (t1) until the whole hour closest to half way between high noon plus two hours and sunset (t2) a sine function is used:
) t - t
t - t 90 ( ) ) C1 + TN ( - ) C1 - TX ( ( + C1 + TN = ) t TT(
12
1sin 1
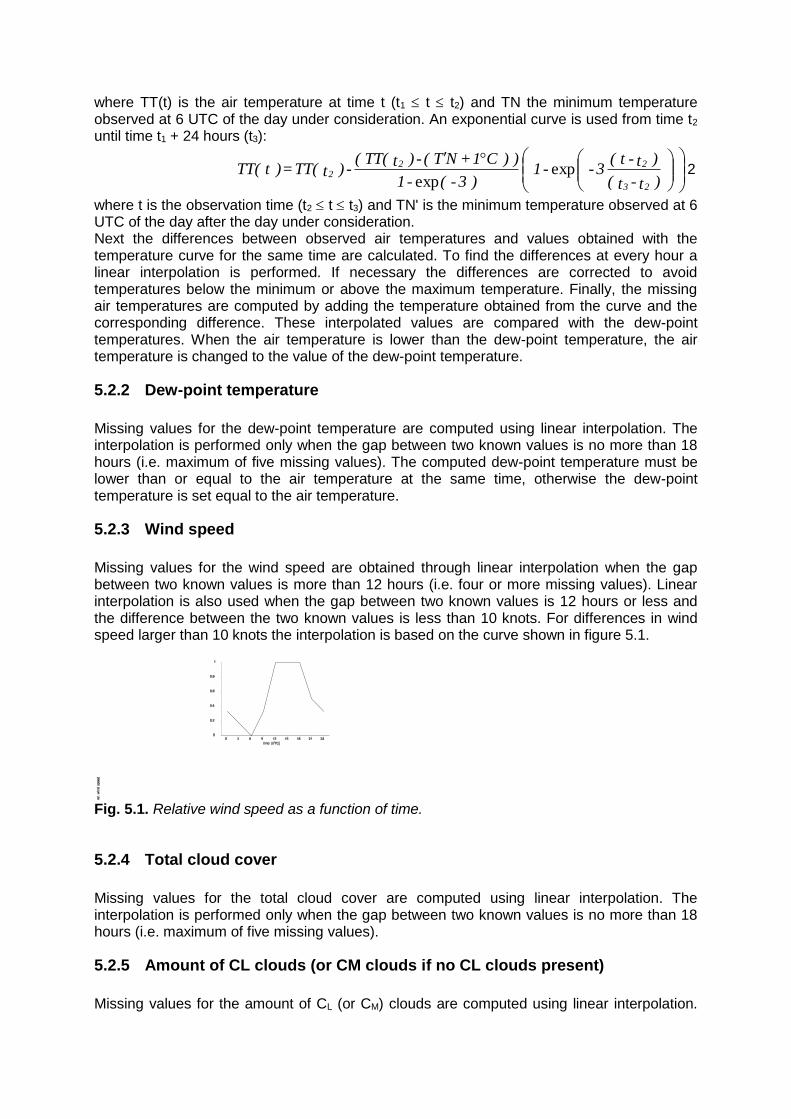
where TT(t) is the air temperature at time t (t1 t t2) and TN the minimum temperature observed at 6 UTC of the day under consideration. An exponential curve is used from time t2 until time t1 + 24 hours (t3):
) t - t (
) t - t ( 3- - 1
) 3- ( - 1
) ) C1 + NT ( - ) t TT( ( - ) t TT( = ) t TT(
23
222 exp
exp2
where t is the observation time (t2 t t3) and TN' is the minimum temperature observed at 6 UTC of the day after the day under consideration. Next the differences between observed air temperatures and values obtained with the temperature curve for the same time are calculated. To find the differences at every hour a linear interpolation is performed. If necessary the differences are corrected to avoid temperatures below the minimum or above the maximum temperature. Finally, the missing air temperatures are computed by adding the temperature obtained from the curve and the corresponding difference. These interpolated values are compared with the dew-point temperatures. When the air temperature is lower than the dew-point temperature, the air temperature is changed to the value of the dew-point temperature.
5.2.2 Dew-point temperature
Missing values for the dew-point temperature are computed using linear interpolation. The interpolation is performed only when the gap between two known values is no more than 18 hours (i.e. maximum of five missing values). The computed dew-point temperature must be lower than or equal to the air temperature at the same time, otherwise the dew-point temperature is set equal to the air temperature.
5.2.3 Wind speed
Missing values for the wind speed are obtained through linear interpolation when the gap between two known values is more than 12 hours (i.e. four or more missing values). Linear interpolation is also used when the gap between two known values is 12 hours or less and the difference between the two known values is less than 10 knots. For differences in wind speed larger than 10 knots the interpolation is based on the curve shown in figure 5.1.
Fig. 5.1. Relative wind speed as a function of time.
5.2.4 Total cloud cover
Missing values for the total cloud cover are computed using linear interpolation. The interpolation is performed only when the gap between two known values is no more than 18 hours (i.e. maximum of five missing values).
5.2.5 Amount of CL clouds (or CM clouds if no CL clouds present)
Missing values for the amount of CL (or CM) clouds are computed using linear interpolation.
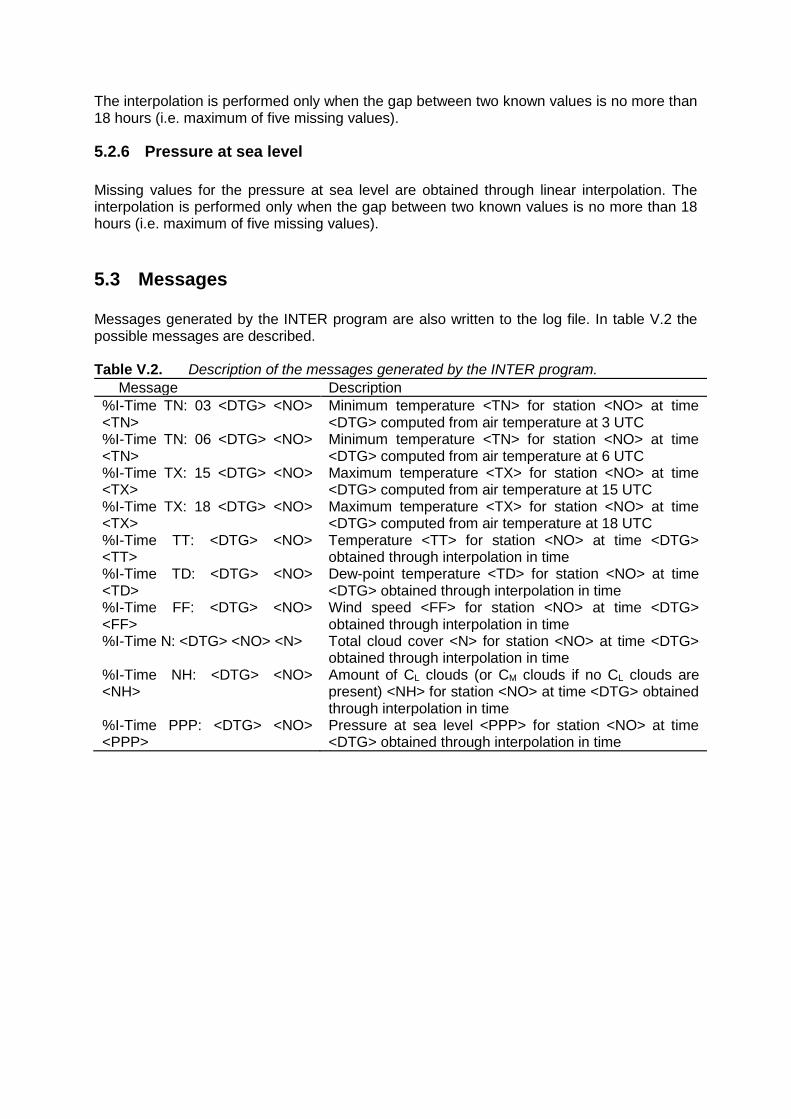
The interpolation is performed only when the gap between two known values is no more than 18 hours (i.e. maximum of five missing values).
5.2.6 Pressure at sea level
Missing values for the pressure at sea level are obtained through linear interpolation. The interpolation is performed only when the gap between two known values is no more than 18 hours (i.e. maximum of five missing values).
5.3 Messages Messages generated by the INTER program are also written to the log file. In table V.2 the possible messages are described. Table V.2. Description of the messages generated by the INTER program.
Message Description
%I-Time TN: 03 <DTG> <NO> <TN>
Minimum temperature <TN> for station <NO> at time <DTG> computed from air temperature at 3 UTC
%I-Time TN: 06 <DTG> <NO> <TN>
Minimum temperature <TN> for station <NO> at time <DTG> computed from air temperature at 6 UTC
%I-Time TX: 15 <DTG> <NO> <TX>
Maximum temperature <TX> for station <NO> at time <DTG> computed from air temperature at 15 UTC
%I-Time TX: 18 <DTG> <NO> <TX>
Maximum temperature <TX> for station <NO> at time <DTG> computed from air temperature at 18 UTC
%I-Time TT: <DTG> <NO> <TT>
Temperature <TT> for station <NO> at time <DTG> obtained through interpolation in time
%I-Time TD: <DTG> <NO> <TD>
Dew-point temperature <TD> for station <NO> at time <DTG> obtained through interpolation in time
%I-Time FF: <DTG> <NO> <FF>
Wind speed <FF> for station <NO> at time <DTG> obtained through interpolation in time
%I-Time N: <DTG> <NO> <N> Total cloud cover <N> for station <NO> at time <DTG> obtained through interpolation in time
%I-Time NH: <DTG> <NO> <NH>
Amount of CL clouds (or CM clouds if no CL clouds are present) <NH> for station <NO> at time <DTG> obtained through interpolation in time
%I-Time PPP: <DTG> <NO> <PPP>
Pressure at sea level <PPP> for station <NO> at time <DTG> obtained through interpolation in time
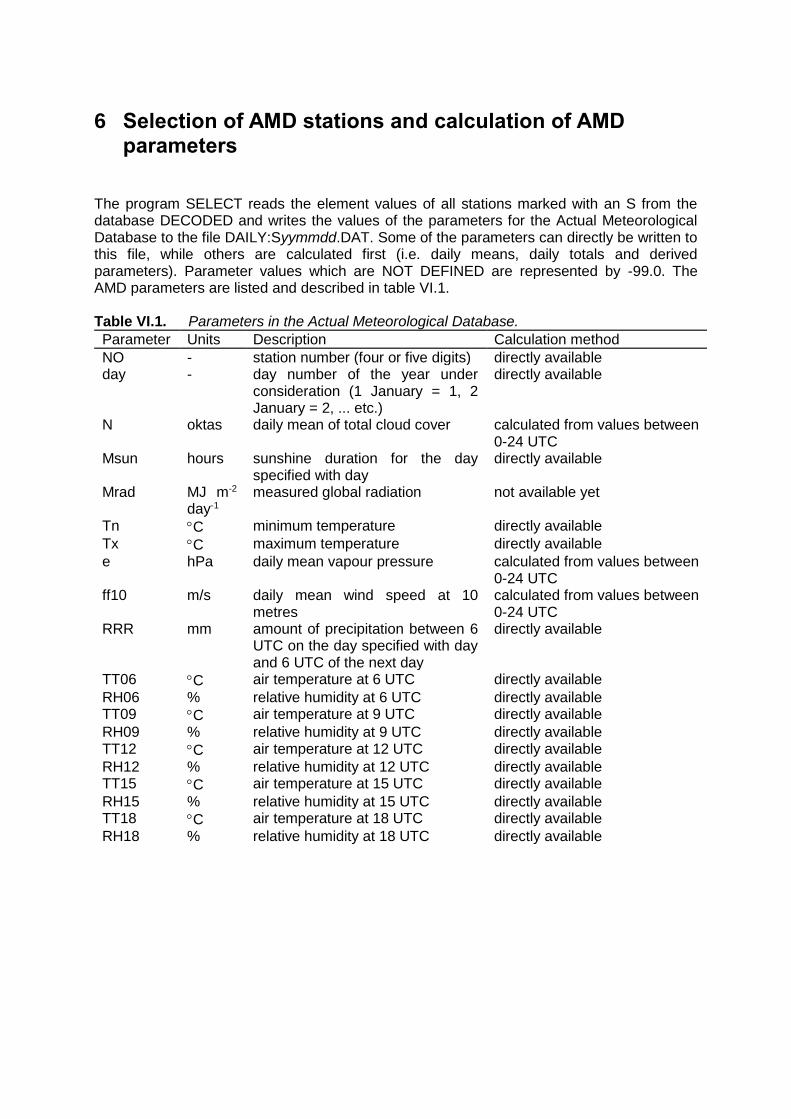
6 Selection of AMD stations and calculation of AMD parameters
The program SELECT reads the element values of all stations marked with an S from the database DECODED and writes the values of the parameters for the Actual Meteorological Database to the file DAILY:Syymmdd.DAT. Some of the parameters can directly be written to this file, while others are calculated first (i.e. daily means, daily totals and derived parameters). Parameter values which are NOT DEFINED are represented by -99.0. The AMD parameters are listed and described in table VI.1. Table VI.1. Parameters in the Actual Meteorological Database.
Parameter Units Description Calculation method
NO - station number (four or five digits) directly available day - day number of the year under
consideration (1 January = 1, 2 January = 2, ... etc.)
directly available
N oktas daily mean of total cloud cover calculated from values between 0-24 UTC
Msun hours sunshine duration for the day specified with day
directly available
Mrad MJ m-2 day-1
measured global radiation not available yet
Tn C minimum temperature directly available
Tx C maximum temperature directly available
e hPa daily mean vapour pressure calculated from values between 0-24 UTC
ff10 m/s daily mean wind speed at 10 metres
calculated from values between 0-24 UTC
RRR mm amount of precipitation between 6 UTC on the day specified with day and 6 UTC of the next day
directly available
TT06 C air temperature at 6 UTC directly available
RH06 % relative humidity at 6 UTC directly available TT09 C air temperature at 9 UTC directly available
RH09 % relative humidity at 9 UTC directly available TT12 C air temperature at 12 UTC directly available
RH12 % relative humidity at 12 UTC directly available TT15 C air temperature at 15 UTC directly available
RH15 % relative humidity at 15 UTC directly available TT18 C air temperature at 18 UTC directly available
RH18 % relative humidity at 18 UTC directly available
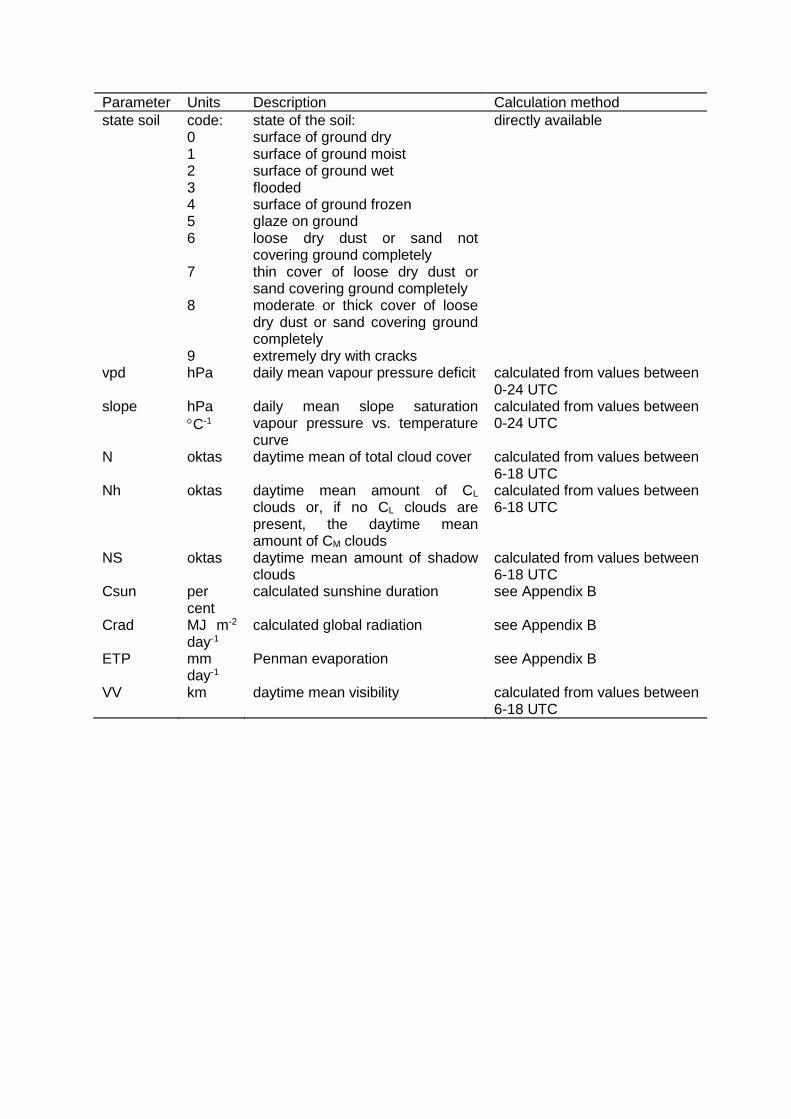
Parameter Units Description Calculation method
state soil code: 0 1 2 3 4 5 6 7 8 9
state of the soil: surface of ground dry surface of ground moist surface of ground wet flooded surface of ground frozen glaze on ground loose dry dust or sand not covering ground completely thin cover of loose dry dust or sand covering ground completely moderate or thick cover of loose dry dust or sand covering ground completely extremely dry with cracks
directly available
vpd hPa daily mean vapour pressure deficit calculated from values between 0-24 UTC
slope hPa
C-1
daily mean slope saturation vapour pressure vs. temperature curve
calculated from values between 0-24 UTC
N oktas daytime mean of total cloud cover calculated from values between 6-18 UTC
Nh oktas daytime mean amount of CL clouds or, if no CL clouds are present, the daytime mean amount of CM clouds
calculated from values between 6-18 UTC
NS oktas daytime mean amount of shadow clouds
calculated from values between 6-18 UTC
Csun per cent
calculated sunshine duration see Appendix B
Crad MJ m-2 day-1
calculated global radiation see Appendix B
ETP mm day-1
Penman evaporation see Appendix B
VV km daytime mean visibility calculated from values between 6-18 UTC
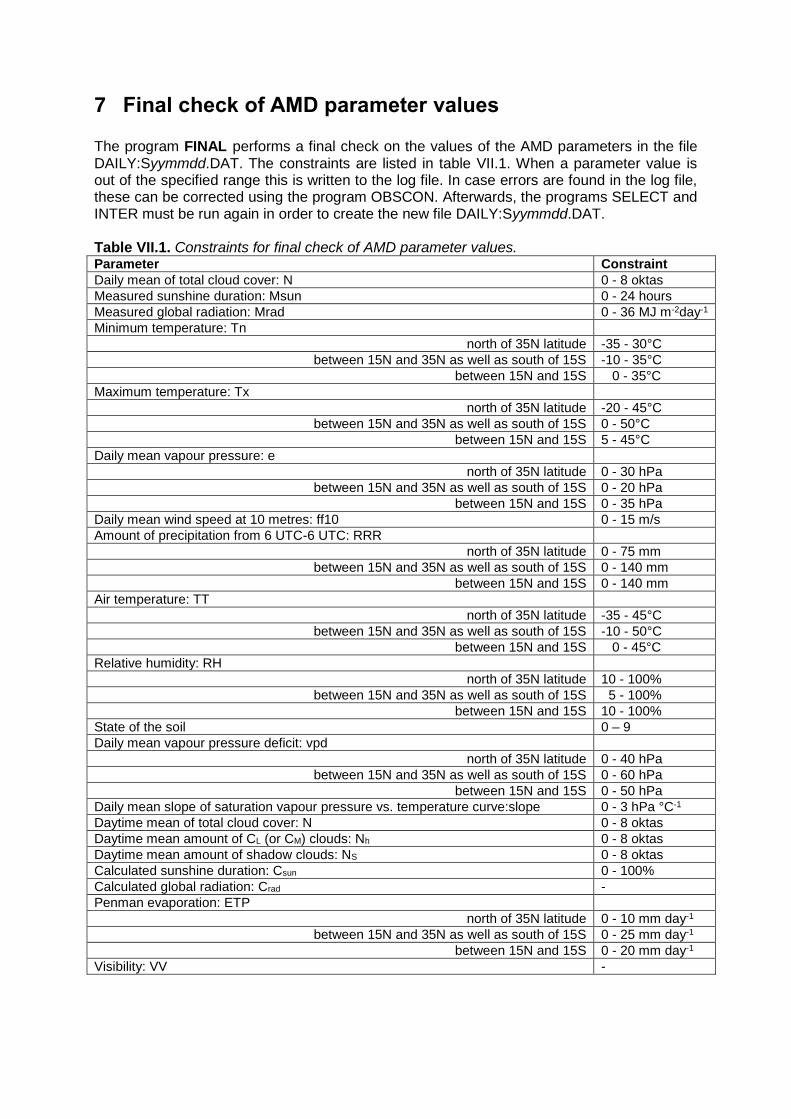
7 Final check of AMD parameter values The program FINAL performs a final check on the values of the AMD parameters in the file DAILY:Syymmdd.DAT. The constraints are listed in table VII.1. When a parameter value is out of the specified range this is written to the log file. In case errors are found in the log file, these can be corrected using the program OBSCON. Afterwards, the programs SELECT and INTER must be run again in order to create the new file DAILY:Syymmdd.DAT. Table VII.1. Constraints for final check of AMD parameter values. Parameter Constraint
Daily mean of total cloud cover: N 0 - 8 oktas
Measured sunshine duration: Msun 0 - 24 hours
Measured global radiation: Mrad 0 - 36 MJ m-2day-1
Minimum temperature: Tn
north of 35N latitude -35 - 30°C
between 15N and 35N as well as south of 15S -10 - 35°C
between 15N and 15S 0 - 35°C
Maximum temperature: Tx
north of 35N latitude -20 - 45°C
between 15N and 35N as well as south of 15S 0 - 50°C
between 15N and 15S 5 - 45°C
Daily mean vapour pressure: e
north of 35N latitude 0 - 30 hPa
between 15N and 35N as well as south of 15S 0 - 20 hPa
between 15N and 15S 0 - 35 hPa
Daily mean wind speed at 10 metres: ff10 0 - 15 m/s
Amount of precipitation from 6 UTC-6 UTC: RRR
north of 35N latitude 0 - 75 mm
between 15N and 35N as well as south of 15S 0 - 140 mm
between 15N and 15S 0 - 140 mm
Air temperature: TT
north of 35N latitude -35 - 45°C
between 15N and 35N as well as south of 15S -10 - 50°C
between 15N and 15S 0 - 45°C
Relative humidity: RH
north of 35N latitude 10 - 100%
between 15N and 35N as well as south of 15S 5 - 100%
between 15N and 15S 10 - 100%
State of the soil 0 – 9
Daily mean vapour pressure deficit: vpd
north of 35N latitude 0 - 40 hPa
between 15N and 35N as well as south of 15S 0 - 60 hPa
between 15N and 15S 0 - 50 hPa
Daily mean slope of saturation vapour pressure vs. temperature curve:slope 0 - 3 hPa °C-1
Daytime mean of total cloud cover: N 0 - 8 oktas
Daytime mean amount of CL (or CM) clouds: Nh 0 - 8 oktas
Daytime mean amount of shadow clouds: NS 0 - 8 oktas
Calculated sunshine duration: Csun 0 - 100%
Calculated global radiation: Crad -
Penman evaporation: ETP
north of 35N latitude 0 - 10 mm day-1
between 15N and 35N as well as south of 15S 0 - 25 mm day-1
between 15N and 15S 0 - 20 mm day-1
Visibility: VV -
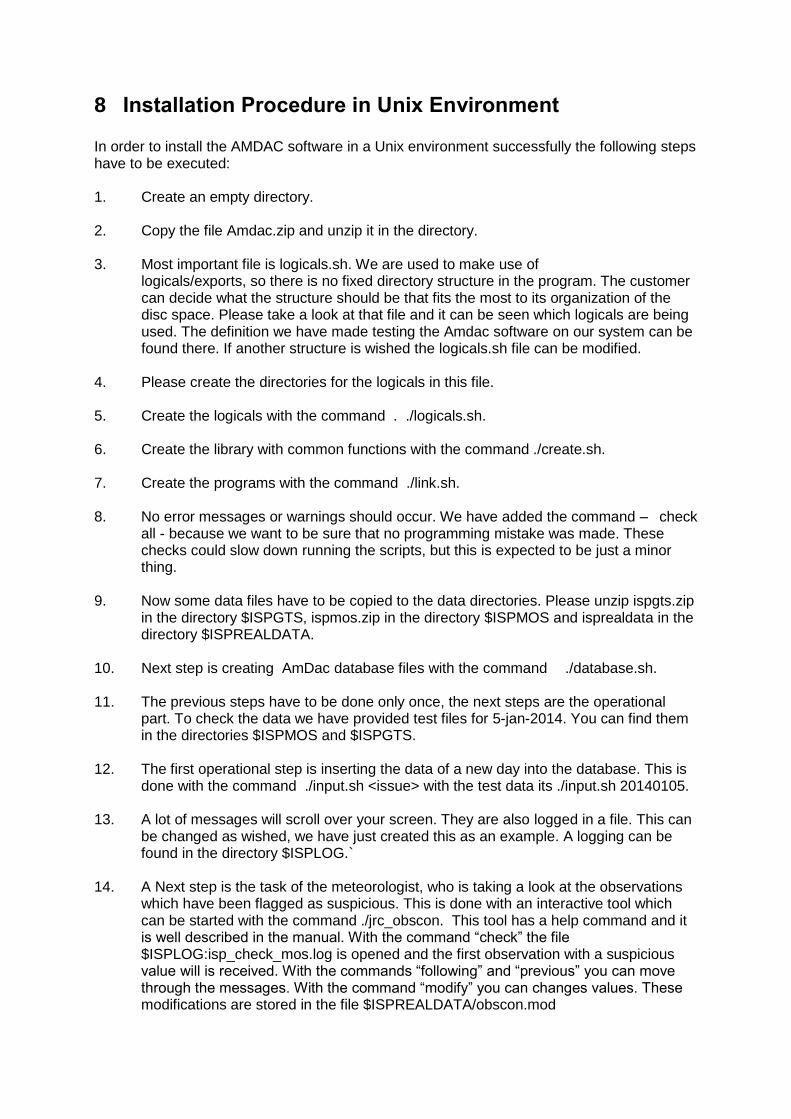
8 Installation Procedure in Unix Environment In order to install the AMDAC software in a Unix environment successfully the following steps have to be executed: 1. Create an empty directory. 2. Copy the file Amdac.zip and unzip it in the directory. 3. Most important file is logicals.sh. We are used to make use of
logicals/exports, so there is no fixed directory structure in the program. The customer can decide what the structure should be that fits the most to its organization of the disc space. Please take a look at that file and it can be seen which logicals are being used. The definition we have made testing the Amdac software on our system can be found there. If another structure is wished the logicals.sh file can be modified.
4. Please create the directories for the logicals in this file. 5. Create the logicals with the command . ./logicals.sh. 6. Create the library with common functions with the command ./create.sh. 7. Create the programs with the command ./link.sh. 8. No error messages or warnings should occur. We have added the command – check
all - because we want to be sure that no programming mistake was made. These checks could slow down running the scripts, but this is expected to be just a minor thing.
9. Now some data files have to be copied to the data directories. Please unzip ispgts.zip
in the directory $ISPGTS, ispmos.zip in the directory $ISPMOS and isprealdata in the directory $ISPREALDATA.
10. Next step is creating AmDac database files with the command ./database.sh. 11. The previous steps have to be done only once, the next steps are the operational
part. To check the data we have provided test files for 5-jan-2014. You can find them in the directories $ISPMOS and $ISPGTS.
12. The first operational step is inserting the data of a new day into the database. This is
done with the command ./input.sh <issue> with the test data its ./input.sh 20140105. 13. A lot of messages will scroll over your screen. They are also logged in a file. This can
be changed as wished, we have just created this as an example. A logging can be found in the directory $ISPLOG.`
14. A Next step is the task of the meteorologist, who is taking a look at the observations
which have been flagged as suspicious. This is done with an interactive tool which can be started with the command ./jrc_obscon. This tool has a help command and it is well described in the manual. With the command “check” the file $ISPLOG:isp_check_mos.log is opened and the first observation with a suspicious value will is received. With the commands “following” and “previous” you can move through the messages. With the command “modify” you can changes values. These modifications are stored in the file $ISPREALDATA/obscon.mod
15. When these values have been approved or corrected the daily output file can be
created with the command ./output.sh <issue>. In this case ./output.sh 20140105. 16. There are several steps done in that command file. First a time interpolation of
missing observations is made, second step is creating the daily output file and at last a final check is performed on this file. The output file is $ISPDAILY/s<issue>.dat and the logging of the final check is $ISPLOG/f<issue>.log.
Appendix A: Station list The station list has been excluded from the documentation and can be found in the separate document AMDAC_manual_stationlist.pdf.
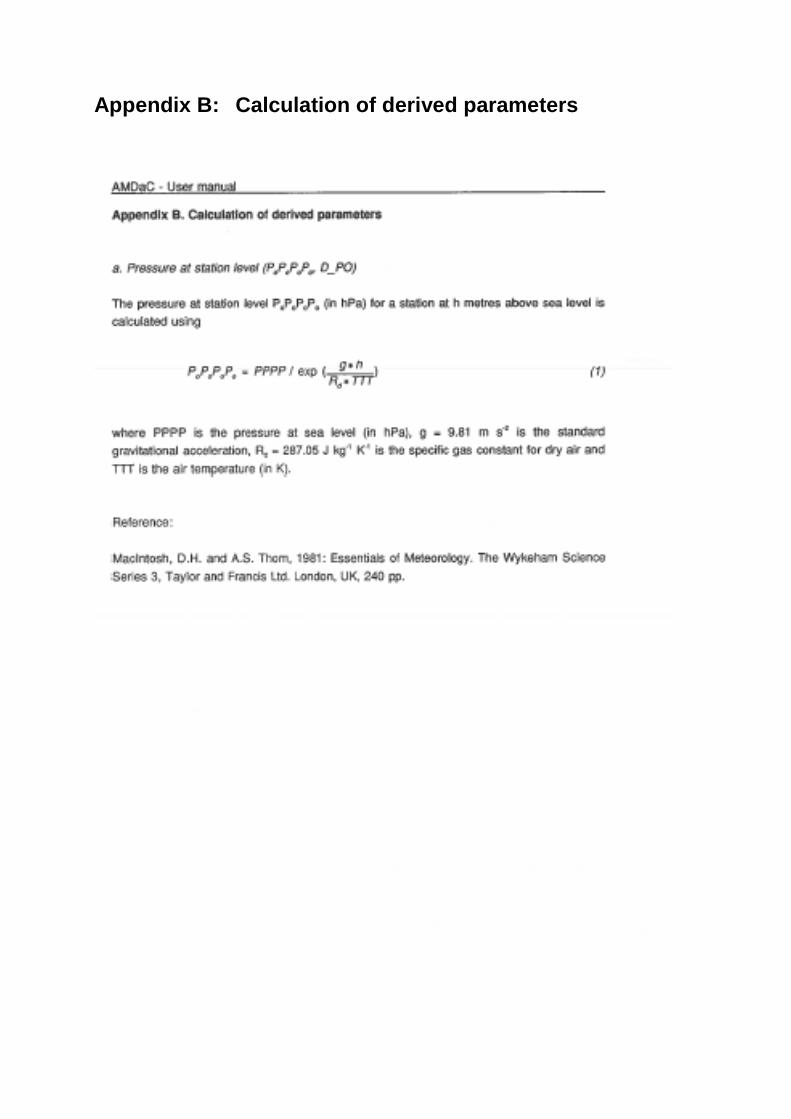
Appendix B: Calculation of derived parameters