Embed Size (px)
Citation preview

le
ED 258 974
AUTHORTITLE
INSTITUTIONREPORT NOPUB DATENOTEPUB TYPE
EDRS.PRICEDESCRIPTORS
IDENTIFIERS
DOCUMENT RESUME
TM 850 201
Goertz, Margaret E.; Pitcher, BarbaraThe Impact of NTE Use by States on TeacherSelection.Educational Testing Service, Princeton, N.J.ETS-RR-85-1Jan 85111p.Reports - Research/Technical (143)
MF01/PC05 Plus Postage.Cutting Scores; Minimum Competency Testing; MinorityGroups; State Licensing Boards; *State Standards;*Teacher Certification; Teacher Qualifications;*Teacher Selection; Test Bias; *Test UseNational Teacher Examinations
ABSTRACTThis study was designed to investigate the impact of
the National Teacher Examination (NTE) Core Battery and SpecialtyArea tests on the selection of teachers. The areas examined were howstates use the NTE Programs Tests; distribution of test takers andtest scores by racial/ethnic group; impact of qualifying scores onpassing rates of these groups; and implications for the compositionof the future teaching force. Most states set qualifying scores foreach test they use. Test scores may be used to screen candidates forteacher education programs; evaluate student performance; screencandidates for initial certification; provide an alternative to the
approved program approach for certification; and/or select teachers'for participation in special programs. Passing rates differ -
significantly among racial/ethnic groups when qualifying scores setby states are applied to the national pool of NTE examinees. Statepolicies have a direct impact on minorities. Current efforts aredirected toward enacting more, or stricter, standards rather thanaddressing problems of equity. (DwH)
A
V
***********************************************************************Reprodu7tions supplied by EDRS are the best that can be made
from the original docume'zt.***********.k***********************************************************
BEST COPY AVAILABLE
THE IMPACT OF NTE USE
BY STATES ON, TEACHER SELECTION
Margaret E. GoertzBarbaro Pitcher
Educational Testing ServicePrinceton, New Jena'
January 1985
, RF:1851
U.S. DEPARTMENT Of EDUCATIONNATIONAL INSTITUTE OF EDUCATION
EDUCATIONAL RESOURCES INFORMATIONCENTER (ERIC)
The document has been tsptOthiCad IPS
received from the person or organizationoriginating it.
Cl Minor changes have been made to improvereproduction quality.
Points of view or opinions stated m this documint do not necessarily represent official NIEPosition or policy.
"PERMISSION TO REPRODUCE THISMATEROL HAS BEEN GRANTED BY
/deiciovvv46A)
TO THE EDUCATIONAL RESOURCESINFORMATION CENTER (ERIC)."
111114b

a
Copyright j 1985. Edu-:ational Testing Service. All rights reserved.
3

The Impact of NTE Use by States on Teacher Selection
Executive Summary
In the last few years, concern over the quality of America's school
teachers'has led policymakers to search for ways to' make the teaching
force better. By 1984, 24 states required aspiring teachers to pass a
state-prescribed, standardized test before entering a teacher education
program and/or before being certified to teach. Similar requirements will
\
become effective in 9 more states by 1988.
As more states use tests to screen prospective teachers, concern
has grown over the differential impact of these policies. Statistics
collected by states using teacher testing programs show significantly
higher rates of passing for White than for minority candidates. The
'purpose of this study is to examine the impact of the three NTE Programs
Core Battery tests and 21 of the NTE Specialty Area tests on the selection
of teachers. Specifically,.the'study looks at (1) how states use the NTE
Programs tests, (2) the distribution of test-takers and test scores by
racial/ethnic group, (3) the impact of qualifying scores. on passing rates
of different racial/ethnic groups, and (4) implications of these findings
for the composition of the future teaching force. Data for these analyses
are drawn from the NTE Programs files. Core Battery data cover a two-year
period (1982-84) and data on the Specialty Area tests cover a three-year
period (1981-84). Special attention is paid to examinees who identify..
themselves as White, Black or Hispanic.
Sixteen states use the NTE Programs tests to (1) admit students into
teacher education programs, (2) evaluate student performance in these

t
programs, (3) screen candidates for initial certification, (4) provide an
alternative to the approved program approach for certification and/or (5)
select teachers to participate in Master Teacher or Career Ladder programs.
Most states set qualifying scores for each test they use. These scores,
which vary by state, tend to fall below the mean test score for White and
Hispanic examinees, but in most cases are above the mean score for Black
test - takers.
Average performance on both the Core Battery and the Specialty Areil
tests varies by racial/ethnic group. Given the distribUtion for all
examinees, Blacks scored from 1.4 to 1.5 standard deviations below the
average score for Whites on the Core Battery tests, and Hispanics
scored 0.6 to 0.8 standard deviations below White test-takers. The mean
scores for Blacks on selected Specialty Area tests were 0.9 to 1.7
standard deviations lower than those of Whites, again using the total
group distribution as the base.
When qualifying scores set by states for initial certification are
applied to the national pool of NTE examinees, the passingjates differ
significantly among racial/ethnic groups. For example, using the lowest
qualifying score set by a state on the Test of Communication Skills,
98 percent of the White, 69 percent of the Black and 85 percent of
the Hispanic examinees would qualify to become teachers. The highest
qualifying score set by a state would eliminate nearly 70 percent of the
Black and 45 percent of the Hispanic candidates, but only 14 percent of
the White candidates. The lowest qualifying score. for the Biology and
General Science test eliminates one percent of the White and 21 percent
ii
P 1
alt
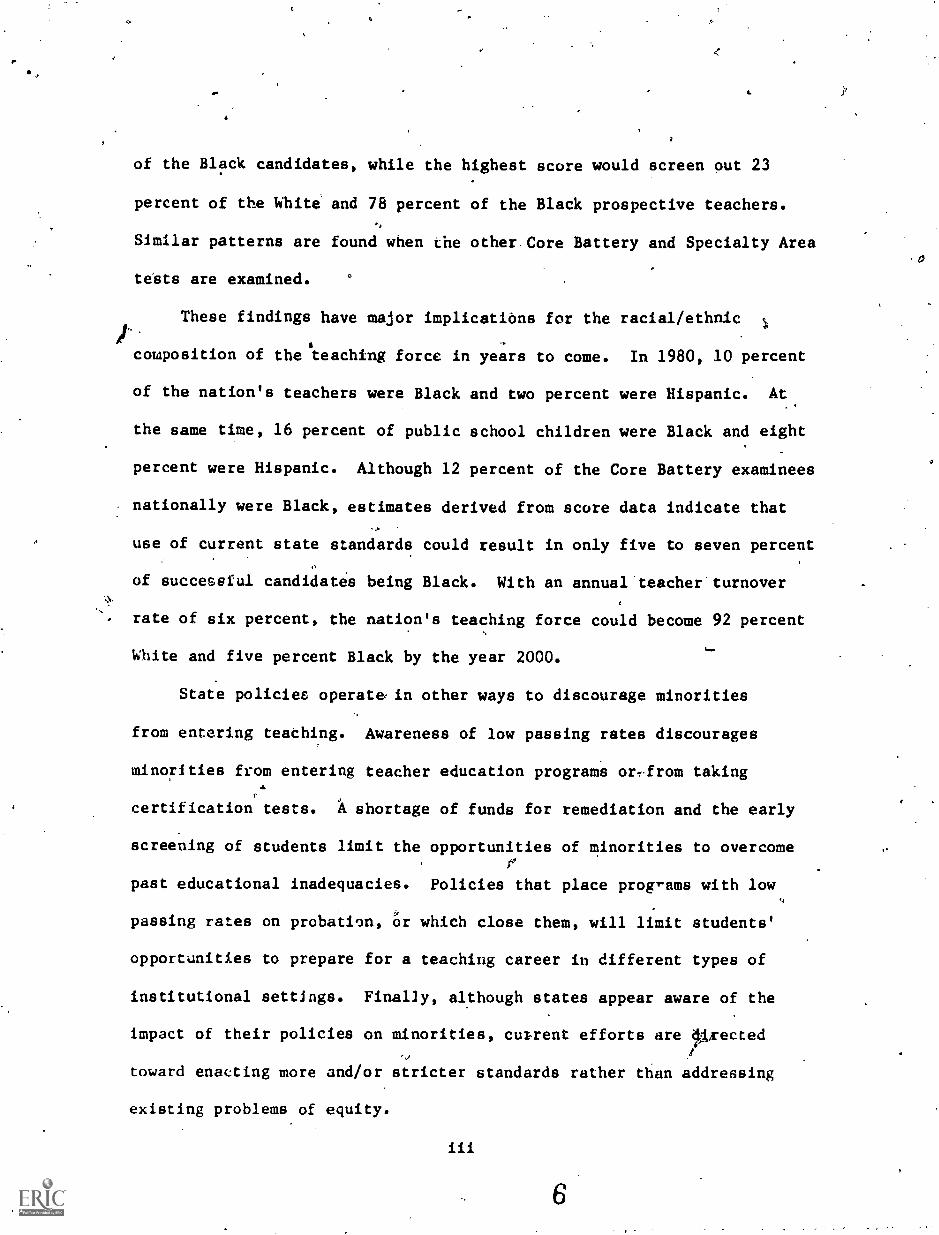
of the Black candidates, while the highest score would screen out 23
percent of the White and 78 percent of the Black prospective teachers.
Similar patterns are found when the other. Core Battery and Specialty Area
teats are examined.
These findings have major implications for the racial/ethnic 1
composition of the 'teaching force in years to come. In 1980, 10 percent
of the nation's teachers were Black and two percent were Hispanic. At
the same time, 16 percent of public school children were Black and eight
percent were Hispanic. Although 12 percent of the Core Battery examinees
nationally were Black, estimates derived from score data indicate that
use of current state standards could result in only five to seven percentJ
of successful candidates being Black. With an annual teacher turnover
rate of six percent, the nation's teaching force could become 92 percent
White and five percent Black by the year 2000.I-
State policies operate, in other ways to discourage minorities
from entering teaching. Awareness of low passing rates discourages
minorities from entering teacher education programs or -from taking
certification tests. A shortage of funds for remediation and the early
screening of students limit the opportunities of minorities to overcome
past educational inadequacies. Policies that place programs with low
passing rates on probation, or which close them, will limit students'
opportunities to prepare for a teaching career in different types of
institutional settings. Finally, although states appear aware of the
impact of their policies on minorities, current efforts are dt,rected
toward enacting more and/or stricter standards rather than addressing
existing problems of equity.
iii

Table of Contpnts
Page
Executive Summary. f
Introduction 1
Equity Issues 3
Purpose of the Study 6
Methodblogy 7
How,States Use the NTE 9
Description. of NTE Examinees and Test Scores 13
The Core Battery 13Specialty Area Tests 17
The Impact of Qualifying Scores on Passing Rates 2The Core Battery: A State-by-State Analysis 24
The Core Battery: A Look at Examinees Nationally 28The Specialty Area Tests 33
Implications for the Future 41
Referents 45
Appendix A: List of States Requiring NTE Programs 49Tests, 1984-85
Appendix B: Number of Test Records for Core Battgry 51
Tests, 1982-84, by Racial/Ethnic Group
Appendix C: Number of Examinees for Specialty Area . . . 55
Tests, 1981-84, by Racial/Ethnic Group
Appendix D: Number of Test-takers and Mean Scores for 79
Core Battery Tests, by Racial/Ethnic Group.
Appendix E: Percent of Test-takers Scoring at or above 81
Three Hypothetical Qualifying Scores, CoreBattery Tests, 1982-84, by Racial/Ethnic Group

.01.
The Impact of NTE Use by States,on Teacher Selection
Introductiona
tti
Control over the cektification and licensing of teachers dates
back to colonial times when local school boards tasted and interviewed.5,
_ teacher candidates to ensure the intellectual qualifications of those
instructing the young. Such "local" certification was not transferable.
howeller, and as state governance. of education grew, state agencies
assumed a central role in the certification of teachers. Initially,
C..
states required the completion of an approved teacher education program.
Later,, completion of a prescribed number of credit hours in specified
areas became the criteria for certification. Most recently, states have
begun to require more qualitative proof of teacher quality, most often in
the form of testing. In 1984, 24 states required aspiring teachers toLr
pass a state prescribed, standardized test before entering a teacher
education program and/or before being certified to teach. Similar
requirements will become effective in 9 more states by 1988.
(See Figure 1.)
These states vary considerably, however, iu the point(s) at which
teaching candidates are tested (e.g., admission to teacher education
programs, completion of these programs, certification, etc.), the areas
tested (such as basic skills, general knowledge, professional knowledge
and/or knowledge of teaching specialty), the tests used, and the minimum
standards set for passing. For example, 17 states require students to
pass a test before entering a teacher education program, usually a
college entrance test or an achievement test focusing on basic skills.

) FIGURE 1: STATES REQUIRING TESTING OF PROSPECTIVE TEACHERS, 0
.......WASHiNG p was,,
ON 1 r.. ...., ,.....io "ONYAN4 ....."1" "ma ....... ,.,ej it. i a a ox, s =ft . am op Two
1
16.1144 6.4.11. 41kWORTH DAKOTA ;
..I ..
M
(0. i ...* .1
0 mum
' MICHIGAN14,
104H0 in mmi mine mi. . )41. .-. SOUTH DAKOTA .1I. ""IlaY-LiMi
ii.
.....44/ 11..10.NA
S
OMA
MI -
t=)
7
as
--A=m-2ter:
Ilbra.Pr
LIN
woe
LORIO
In Operation, 3984
To be Implemented by 1988
AJ (
CLE01
A YRTPE1 MA" FA. MI
STATE QUTLINE
UNITED STATESScale of Wes
°100 100 app
MAP NO. If
ammoAMMO tat COMVILITIOM
1 :104 041.01.041wady,W11.1.0111 P11 .15. tear II
Oen 6. !wattle. 1.111 C.)
{ }ST COPY AVAILABLE

Twelve of these states, and another 16 states, have a testing requirement (
1
for certification. (See Figure 2.) Applicants for-certification are
tested in basic skills states),. general knowledge (9 states), profes-
sional knowledge(12 states), and/or knowledge of the teacher's specialty
area (14 states). Nine states also evaluate a beginning teacher's
classroom performance before venting regular certificatiOnt
States use different test,instruneni:s to evaluate the capabilities"
of aspiring teachers and often a..t different passing scores for the same
test. The 17 states that test candidates for admission to teacher
education programs use otie or more of the following: the Scholastic
Aptitude Test (SAT) (5); the American.College Testing Program (Ad) (5);
the California Achievement Test (CAT) (5); the Pre-Professional Skills
Telst (PPST) (2); the NTE Programs Core Battery (1); and state-developed
examinations (5). The qualifying scores for the SAT range from a combined
score of 745 to 1000, chile ACT scores vary from 16 to i8. Passing
sccres on the CAT vary as well. In the area of certhication, six states
use their own tests, one uses the PPST, 10 use the NTE Core Battery and
10 use NTE SpecialtyArea tests. (See Figure 3.) Again, qualifyitg
scores on the national tests vary. For example, thelpassing scores on
the NTE Programs Test of Communication Skills range from a low of 637 to
a high of 650 on a scale that can extend fr.m 600 to about 690. The
passing scores on the Specialty Area test, Education in, the EleMentary
School, range from a low of 480 to a high of 600 on a.scale that can
extend from 25Q to 990.
Equity Issues
As more states use tests to arreen prospectiVe teachers, concern
has grown over the differential impact of these policies. Statistics
v."

I i I V I iI , 1 I i
f16
FikiURE 2: STATES REQUIRING TESTING OF PROSPECTIVE TEACHERS, BY TYPE OF USE
I
" .:NORTH DAKOTA
i
(MINNESOTA 1.1% 0 gmsi
I
1
.SOUTH DAKOTA .,I
i 6\
NEBRASKA % \-\\"")k\
lNr-"''''II
....n.".. ..".41
\
\ \\ \1 \
MISSOURII
OKLAHOMA
Admission into TeacherEducation Programs
Completion of TeacherEduc. Programs orInitial Certification
Admission ipto Teacher Educ.Programs and Certification
RI
CLEARTYPE10.01 Y.Y. % al flit
STATE OU1L1NE
UNITED STATESScale of Mots100 20i10 3 0
M %P NO. 119
arrmonAMERKAM MAP CORPONATIOM
AT;10.11..0.."11
w mrepft. Ports ree.mlw. lel001.1111011.4 vim*.11. &MO ILO. WIN C.
13.

FIGURE 34 TYPE OF TEST USED FOR COMPLETION OF TEACHER EDUCATION AND/nR INITIAL CERTIFICATION
%la s481.41.1G:
'ON Ver.PolloNTZ,441
as
1110.,
IL. \ . NORTH DAKOTA : igloo i-
i Iet .174;;;:4716.."...""4
. SOUTH DAKOTA
1
1
'No*...........,.. ' )i 1044;
/I j
a-z-. 4 t74EBFizzi,r.--%-- t 6"------C
i4 x ..._..F.7..::-.)71476
I * * )4- 44. .i .....7.. ,.l.
i i COL-ORAN, ......- ..."1 * X kr. .1
""'"'" .L. * 44 *i"'e"'" . MISSOURI
VAO4
MICHIGAN
WISCONSIN k
Wk4Exico
KANSAS
w. Yr )ke
I-04. 40 44 )14 $ P..44% hakrucK
41e SARKANSAS
sr012-457...polt,svo"144 )t
44 4(
it I
'TEXAS TENNESSE
SCAR LINA
ALASKA
HAWAII
11011.14
14
State-developedNTE Core Battdry OnlyNTE Specialty Area Test- OnlyNTE Core Battery and Specialty.
Area TestsPre-Professioval Skills TestNot yet Determined
BEST COPY AVAILABLE
CLEARTYPE11101 WM% 1;f: % Ott
STATE OUTLINE
UNITED STATESkale of Man
?......20(==.400MAP NO. IIII
mfflowANIERICAll YAP COIPOIATKIII
lin AS =op S 11061111010INI 41.., 11. w wr w.1.1% 4.,00%10e0 MAIM% 1Vorp.aws./110% poems 11do.ninn *OW101 ...WO MM.& WNW dr.1404 FM*
AMMO blop easy
15

-6-
collected by states using, teacher testing programs show-significantly
higher rates of passing for White than for minority candidates. For
example, "in California, 38 percent of all teacher candidates, but 71
percent of Blacks and Hispanics failed the college level basic skills'
test. Eighty-three percent of those who took Florida's teacher certifi-
cation examination in 1982 passed each of its four parts. Among Blacks
the figure was 35 percent, When students took a competency test required
for admission to colleges of education in Texas, 62 percent of the Whites
passed all three sections-of the test compared with 10 percent of the Black
and 19 percent of the Hispanic test-takers. The overall pass rate on
Oklahoma's subject matter exams is 80 percent. The rate for Blacks is 48
percent; Hispanics, 58 percent. These figures have led one educator to
predict that "within the decade, the minority teaching forces will be
less than 5 percent, compared to 12 percent in 1980." (Education USA,
July 30, 1984).
Purpose of the Study
The purpose of this study is to examine the impact of two sets of
NTE Programs tests--the Core Battery and the Specialty Area tests--on the
selection of teachers. Specifically, the study looks at:
. how states use the NTE Programs Tests,
. the distribution'of test-takers and test scores by racial/ethnic
group, 4
. the impact of qualifying scores on passing rates of different
racial/ethnic groups, and
. implications of these findings for the composition of the future
teaching force.

43
-7-
Methodology
e.
Data for these analyses were drawn from the NTE Progams files and
are the same data used for score interpretation leaflets. The Core
Battery data were aggregated over a two-year period (1982-84), covering
all natior'l and special administrations held between November 1982 and
June 1984. This data base includes multiple test records for individuals
who were tested more than once. Data on the Specialty Area tests were
aggregated over a three-year period (1981-1984), covering all national
and special administrations between November 1981 and June 1984. This
data base includes, to the extent possible within the computer-processing
system, only the first score during the three-year period for individuals
who took the test more than once. For most of the Specialty Area tests,
the data are restricted to seniors and examinees with a bachelor's
degree. For five tests.(Audiology, Educational Administration and
Supervision, Guidance Counselor, Reading Specialist and Speech-Language
Pathology), the data include only those with master's or doctoral degrees
or who are enrolled in graduate school. The following tests are excluded
from this data base: Speech Communication, Media Specialist, and those
tests used by only one or two states (two agriculture tests and Texas
Government and Politics).1
Examinees are grouped into four racial/ethnic groups, based on a
self-reported description: White, Black, Hispanic and Other.2
The
1The Speech Communication test is excluded because, new in 1983, it does
not have three years of data. Since the Media:Specialist test isappropriate at both the undergraduate and graduate levels, it wouldrequire special processing to extract information from this data file.
2lndividuals are asked: "How do you describe yourself?" 1) Black,Afro-American, or Negro; 2) Mexican American or Chicano; 3) NativeAmerican, Eskimo or Aleut; 4) Oriental or Asian-American, 5) Puerto
Rican; 6) Other Hispanic or Latin American; 7) White; or 8) Other.

-8-
Hispanic category includes those individuals who described themselves as
Mexican American or ChiEano, Puerto Rican, or Other Hispanic or Latin
American. The Other category includes those who described themselves as
Native American, Eskimo. or Aleut, Oriental. or Asian-American, or Other.
About six percent of the Core Battery test examinees did not report their
racial/ethnic background. For the Specialty Area tests, the percents
that did not respond range from about five for Germah and Music Education
to about 25 for Educational Administration and Supervision,.with a medians*
of about 0Ale percent.
Two types of analyses are presented in this report. One type
includes all individuals who took a particular NTE test. The other
type focuses on states that require one'or more of the NTE Programs Core
Battery or the Specialty Area tests for certification.- Analyses by state
include all ,those individuals tested at a center located in that state.
These are not necessarily all of the examinees applying for teacher
certification in that state, however. Test scores are presented by
racial/ethnic group by state if more than 25 Black examinees took the
test being analyzed.
Each of the three Core Battery tests and 21 of the Specialty Area
tests are examined here. The following nationally-administered Specialty
Area tests were excluded-German, Spanish, Speech Communication and Media
Specialist--as well as tests used by only one or two states.
8

-9-
How States Use the NTE
The NTE Programs include the NTE Core. Battery tests in Comohnication
Skills, General Knowledge and Professional Knowledge; the Pre-Professional
Skills Test (PPST) of basic skills in reading, writing and niathematicd;
and 25 nationally-administered (plus others used by one or two states
only) Specialty Area tests that measure a prospective teacher's mastery
of specific subject areas. Sixteen states use these tests to (1) admit
students into teacher education programs; (2) evaluate student performance
in these programs; (3) screen candidates for initial certification; (4)
provide an alternative to the approved program approach for certification;
and/or (5) select teachers to participate in Master Teacher or Career
Ladder programs.3
As shown in Table .,most of these states use the
Core Battery and/or Specialty Area tests for certification. Another six
states are considering the use of these tests for certification.
As noted earlier, states usually set their own qualifying scores for
each test they require, and these scores vary among the states. Qualifying
scores are recommended by a panel of educators within a state, reflecting
what they believe aspiring teachers should know at a minimum to qualify
for certification in their state. -Policymakers, however, may set qualifying
scores at a level above or below those recommended. Table 2 shows the
range of qualifying scores in effect in those states requiring use.of the
test.
3NTE tests may be used in Master Teacher or Career Ladder programsonly if the programs meet six specific criteria, including that theyare voluntary, are non-punitive, involve new dales, and are in fact,if not in name, new certifications for expanded responsibilities.
19

-10-
Table 1
eHow States Use the NTE, 1984-85
Admission '
into leacher Complete Alternative Select TeachersEducation
,
Teacher Initial to Approved for Master Teacher,Program Career-Ladder*Programs Education Certification
1. Arkansas
2. California
3. Delaware
4. Florida
5. Kentucky
6. Louisiana
.. Mississippi
8. New Mexico
9. New York
10. No. Carolina Comm. Skills,General Knowl.
11. So. Carolina
12. Tennessee
'3. Texas
14. Virginia
15. W. Virginia***
PPST
Core Battery,. Specialty Area
PPST
Core BatterySpecialty Area
Core BatterySpecialty Area
Core BatterySpecialty Area
Core Battery,Specialty Area
Core Battery
Prof. Knowl.,Specialty Are'a
Specialty Area
Core Battery,Specialty Area
Core BattQry,Specialt, Area
Core Battery,SpecialtyArea
General Knowl.,Specialty Area
sl
Specialty Area
Core Battery,Specialty Area**
NTE tests may be used in Master Teacher or Career Ladder programs only if the programs meetsix specific criteria, including that they are voluntary, are non-punitive, involve newduties, and are in fact, if not in name, new certifications for expanded responsibilities.
**In use for this purpose only in 1984-85.***In 1985-86, West Virginia will use the PPST and State-developed specialty area tests.

-11-
Table 2
Qualifying Score for Selected NTE Tests
Test Low
Qualifying Score*
O
Mediati High
core Battery
637
636
630
500
480
470
470
460
480
510
440
490
470
480.
470
644 ,
641
641
,
5p0
530
. 530
5'J.)
490
520
520
490
500
490
500
550
650
649
646
530
590
590
580
520
600
5flu
510
610
550
570
580
Communication Skills
General Ynowledge
Professional Knowledge
Specialty Area
Art Education
Biology and General Sciences
Business Edveation
Chemistry, Physics, andGeneral Sc;12nce
Early Childhood Education ,
Education in theElementAry School
Education of the MentallyRetarded
English Language andLiterature
French .
German
Home Economics Education
. industlial Arts Education
*The reported storedon the Core Battery tests may range. from 600 toabout 690. Each Specialty Area test has its own reporting scale;scores may range from 250 to 990, with the third digit always zero.Some state preliminary qualifying scores for the Specialty Area testsdid not end in zero. For purposes of analysis, these qualifying scoreswere consistently rounded downward, The stores included in this tableare those available as of October 1984..
21
O

-12-
Table 2 (cont.)
Qualifying Score for Selected NTE Tests
Qualifying Score
F-cr
Test Low Median High
EEtELE11tEl
Introduction to the Teachingof heading
470
,
500
Mathematics .510 550 610
Music Education 470 490 530'
Ph/sir:J.1 Education 480 540 , 590
Social Studies 480 520 560
Spanish 470 500 590
Speech Communication 460 - -- 480.
Graduate Level
Audiolgy 440 500 570** °
Edl:cational Administrationand Supervision
480 530 590
Guidance Counselor 490 540 550
Reading Specialist 480 480 500
Speech-Language Pathology 460 510 550***
Ippropriate at Both Levels
Meea Specialiet-Library and AV Services
490 510 640
**The American Speech-Language-Hearing Association (ASHA) sets a qualifying
score of 600 as its certification standard for audiologists.
The ASHA sets a califying score of 600 as its certification standard
for speech-language pathologists.
,
-13-4
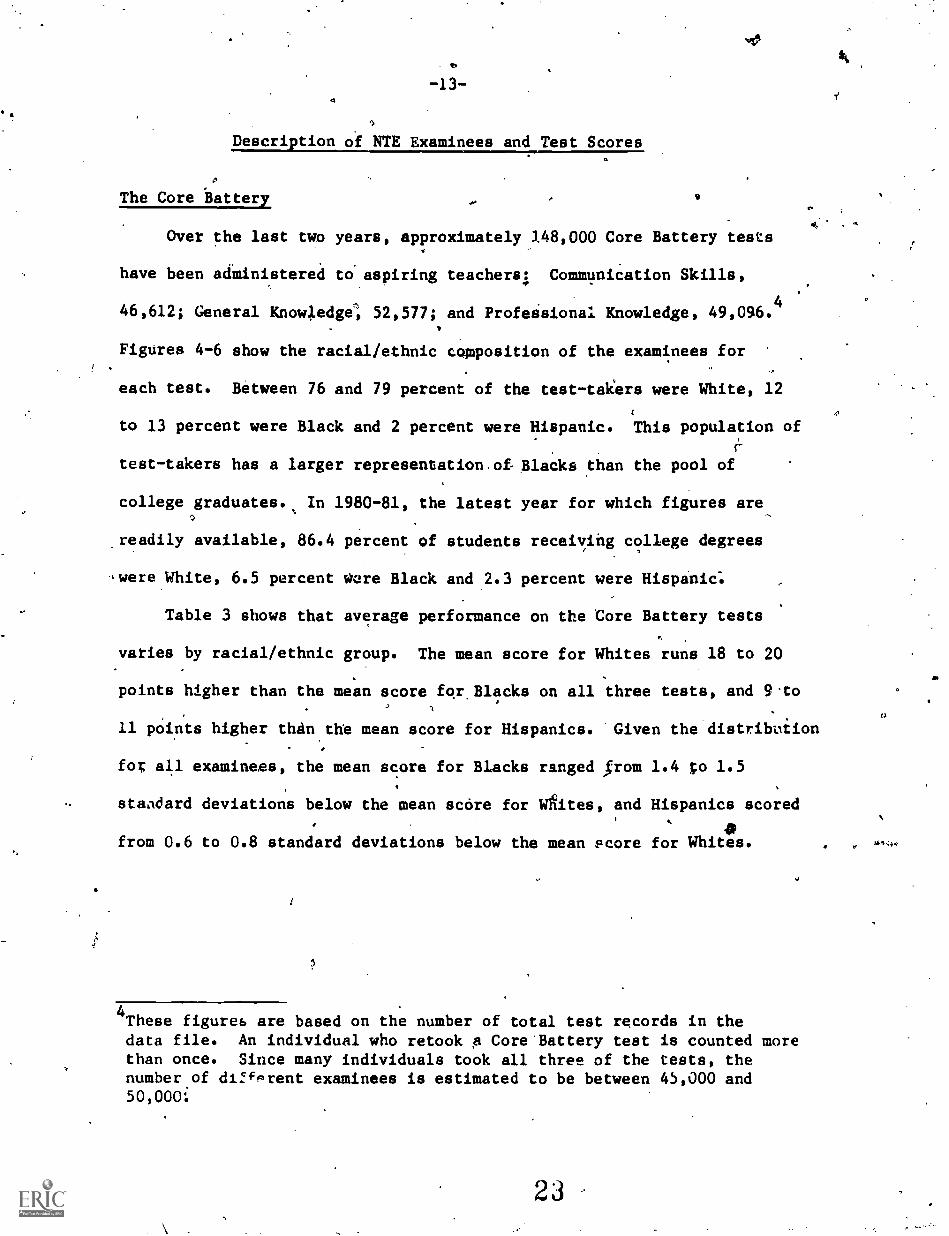
Descri tion of NTE Examinees and Test Scores
The Core Battery
Over the last two years, approximately 148,000 Core Battery tests
have been administered to aspiring teachersi Communication Skills,
46,612; General Knowledge; 52,577; and Professional Knowledge, 49,096.4
Figures 4-6 show the racial/ethnic copposition of the examinees for
each test. Between 76 and 79 percent of the test-takers were White, 12
to 13 percent were Black and 2 percent were Hispanic. This population of
test-takers has a larger representation.of Blacks than the pool of
college graduates., In 1980-81, the latest year for which figures are
.readily available, 86.4 percent of students receiving college degrees
,were White, 6.5 percent were Black and 2.3 percent were Hispanic".
Table 3 shows that average performance on the Core Battery tests
varies by racial/ethnic group. The mean score for Whites runs 18 to 20
a
points higher than the mean score for, Blacks on all three tests, and 9to
11 points higher than th mean score for Hispanics. Given the distribution
fo; all examinees, the mean score for Blacks ranged prom 1.4 to 1.5
standard deviations below the mean score for Whites, and Hispanics scored
from 0.6 to 0.8 standard deviations below the mean score for Whites.
4These figureb are based on the number of total test records in thedata file. An individual who retook A Core'Battery test is counted morethan once. Since many individuals took all three of the tests, thenumber of diffPrent examinees is estimated to be between 45,000 and50,000:
O

Figure 4a
Test of Comii4nicat ion SkiiIs.Racial/Ethnic, Composition of Examinees
6% No Code
12% Black
2% Hispanic
24

Figure 5,
6_ //
, Pest ofteneral Knowledge..R6cidl/Ethnic Composition of Examinees
7% No Code
Id% Black
3% 'Hispanic
C
02%. ,Other
76% White
4P
4
41".
0

Ficwre 6
Test Professional Knowledge
Racial/Ethnic.Composition of Examinees
A
6% No Cade
12% Block
.2% Hispanic
0
.( 2fi
2% Other
ON
79% White

-17 -
Table 3
Scores on Three Core Battery Tests
A by Racial/Ethnic Group
Communication General' Professional, Racial/ Skills Knowledge Knowledge
Ethnic Std. Std. Std.
Group.,' Mean Dev. , Mean Dev. Mean Dev.---m.-
White 662 11 659. 12 659 11, ,
Black 643 12 639 11 641. .13
Hispanic 651 14 650 13 650 13
All Examinees 659 '13 655 14 656 13
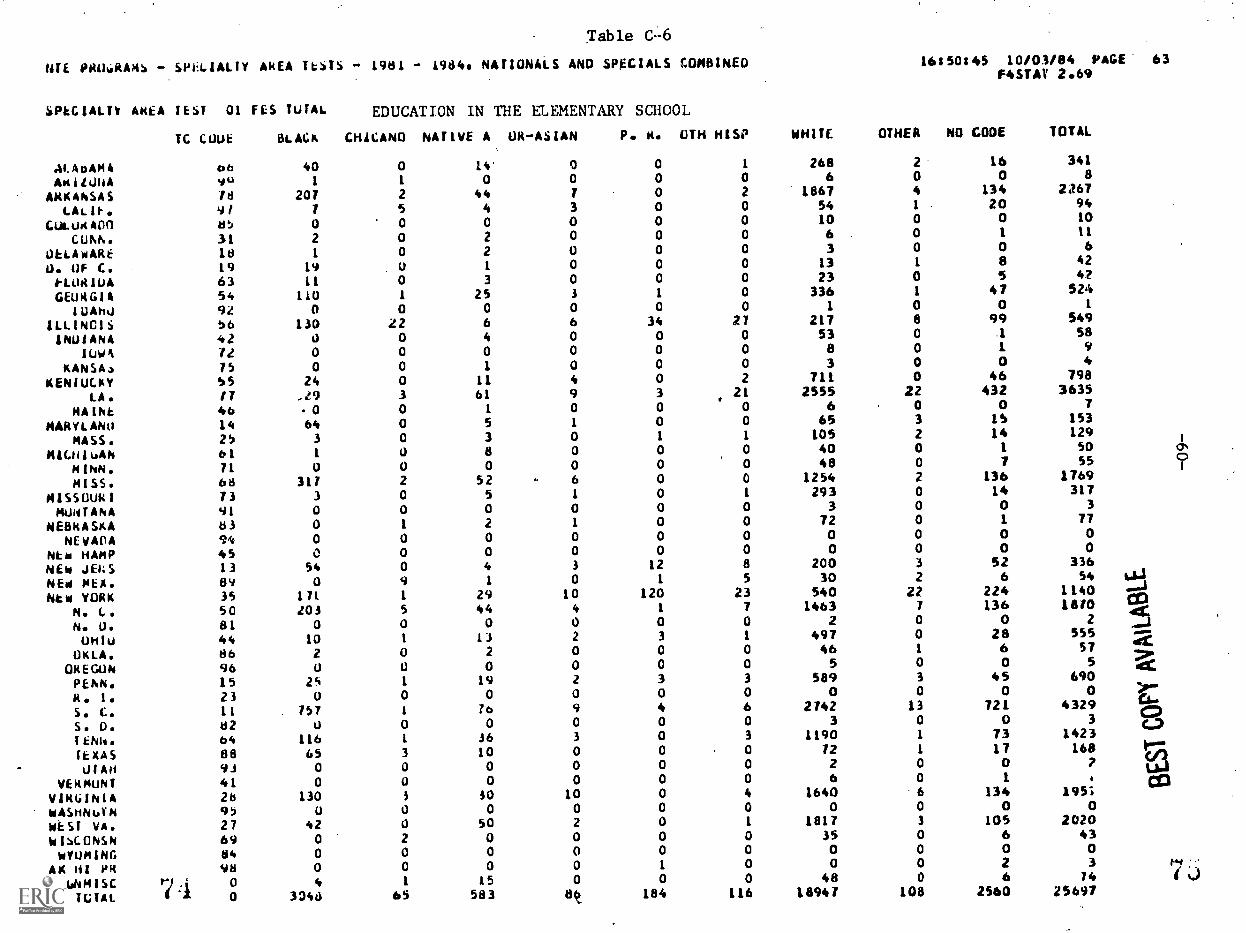
Specialty Area Tests
The number and racial/ethnic composition of individuals taking
the Speci^lty Area tests vary widely by test. For example, in the period
1981-1984, more than 25,000 persons took the test for Education in the
Elementary school, while only 79 took the test for German. ,Nearly 25
percent of Business Education examinees were Black compared with one
percent of individuals taking the German test.
Figures 7 through 10 show the racial/ethnic makeup of persons taking
four Specialty Area tests: Education in the Elementary School (Figure
7); Early Childhood Education (Figure 8); Biology and General Science
(Figure 9); and English Language and Literature (Figure 10). These
Specialty Area tests were chosen because they have a relatively large
volume, are required by most of the states using the NTE Specialty
Area tests, have a relatively large number of minority test-takers and
represent different kinds of teaching specialties. The percentage

Figure 7
Education in the Elementary School
:10% No Code
12% Back
1% Hispanic.
'3% Other
74% White'

10% No Code
16% Black
1% Hispanic
Figute 8
ti
0
Early Childhood Education
29
3% Other
69% White

O0
Figure 9 .
Biology and General Science
9% No Code
9% Black
1% Hispanic
33
4% Other
78% Whit()

Figure 10 P'
English Language and Literature
9% No Code 4% Other
9% Black
1% Hispanic
?"
76% White

of test-takers who were Black ranged from 16.2 percent for Early Childhood
Education to 8.8 perc.ait for Biology and General Science. One to 1.4
percent of the examinees were Hispanic, figures below their par4cipation
rate on the Core Battery tests.
Table,4 shows that average performance on the 21 Specialty Area
tests selected for analysis varies by raciallethnic group. The mean
score for the Blacks is generally :00 to 130 points lower than that Of
the Whites. This translates into a difference of 0.9 to 1.7 standard
deviations, using the distribution for all examinees.
The Impadt of Qualifying Scores on Passing Rates
Seven states have established initial certification qualifying
scores for the Tests of Communication Skills and General Knowledge, and
eight states have established qualifying scores for the Test of Profes-
sional Knowledge. Based on information currently available at ETS, seven
states have qualifying scores for nine of the Specialty Area tests
(Biology and General Science; Business Educatjon; Chemistry, Physic° and
General Science; Early Childhood Education; Education in the Elementary
School; Home Economica Education; Mathematics; Physical Education and
Spanish); six on English Language and Literature, French, Music Education
and Social Studies; five on Education of the Mentally Retarded, German
and Industrial. Arts Education; and four or fewer on the remaining tests.
These qualifying scores (as shown in Table 2, page 11) tend to fall below
the mean test score for White and Hispanic examinees, but in most cases
are above the mean scorn for Black test-takers. This section of the
report examines the impact of these states' decisions on the passing
rates of White and minority teaching candidates.

-23-
Table 4
Scores on 21 Specialty Area Tests,
by Racial/Ethnic Groups*
9
Test
White Black All Examinees
Mean S.D.-y Mean .D. Mean S.D.
Art Education' 595 77 472 85 . 582 86
Biology and General Science 638 74 531 66 625 82
Businesk Education 629 65, 520 61 594 81
Chemistry, Physics, and General Science 587 79 463 57 576 87
Early Childhood Educ'ation .626 78 483 82 591 100
Education in the Elementary School 621 71 489 77 596 88
Education of the Mentally Retarded 617 71 507 77 588 87
English Language and Literature 603 73 470 76 585 87,
French 603 95 472 88 .593 101
Home Economics Education 635 63 500 74 609 83
Industrial Arts Education 636 57 510 486 606 77
Introduction to the Teaching of, Reading 624 81 448 80 587 108
Mathematics 592 77 493 61 578 83
Music Education 608 78 488 79 591 88
Physical Education 625 66 517 70 604 79
Social Studies 597 77 482 72 579 88
Audiology 644 52 597 51 640 53
Educational Administrationand Supervision
659 83 555 80 616 96
Guidance Counselor 659 71 544 74 622 90
Reading Specialist 631 77 479 87 610 92
Speech-Language Pathology 668 71 581 74 662 74
Hispanics are excluded from this analysisbcEaJse of the relatively small
number of examinees for each test.

-24-
The Corelattyry: A Statezia:StatelTalysis
Figures 11-13 show the estimated impact of each state's qualifying
scores for the three Core Battery tests. States are ranked from low to
high on the qualifying scores for the specific test. Thus state A in
Figure 11 is the state with the lowest qualifying score for the Test of
4
Communication Skills, State A in Figure 2 is the state with the lowest
qualifying score for the Test of Knowledge and so forth.
Between 88 and 97 percent of Whiteiexaminees who took the Test of
Communication Skills in the seven..statea with qualifying scores, passed.
(Figure 11). The passing rates for Blacks ranged from a low of 41
percent to a high of 88 percent, and\th?,,ie for Hispanics ranged from 39
'ercent to 78 percent. The lowest passing rates for all three groups are
generally found in States E-G which he the highest qualifying scores.
Figure 12 shows the passing rates for states with qualifying scores
on the Test of General Knowledge. The rates ranged from 76 to 98 percent
for Whites, 26 to 60 percent for Blacks and 24 to 89 percent for Hispanics.
The percent of examinees passing was generally highest in the states with
low qualifying scores and lowest in the states with high qualifying
scores.
The estimated impact of state qualifying scores for the Test of
Professional Knowledge on racial/ethnic groups Is shown in Figure 13.
Once again, in most states, substantially larger percentages of Whites
than Blacks or Hispanics passed the test. Passing rates for Whites
ranged from 82 to 99.6 percent. Between 35 and 92 percent of the Blacks
passed, while 50 to 96 percent of the Hispanics scored at or above the
qualifying score.
3

Figure 11
Test of Communication Skills
Examinees by State
White
Black
Hispanic
A B C D
State
F

Figure 12
TeS1 of General Knowledge
Examinees by State
A B C D
State
t
LIA While
Black
HispanicI
f
E F G

U
100
90
80
71 60
U)
50
40
JO
20.
1,)
0
A
F::.gure 13 .
Test of Professional Knowledge
Examinees by State
B
State
E
White
Z1 Black
Hispanic
f
37
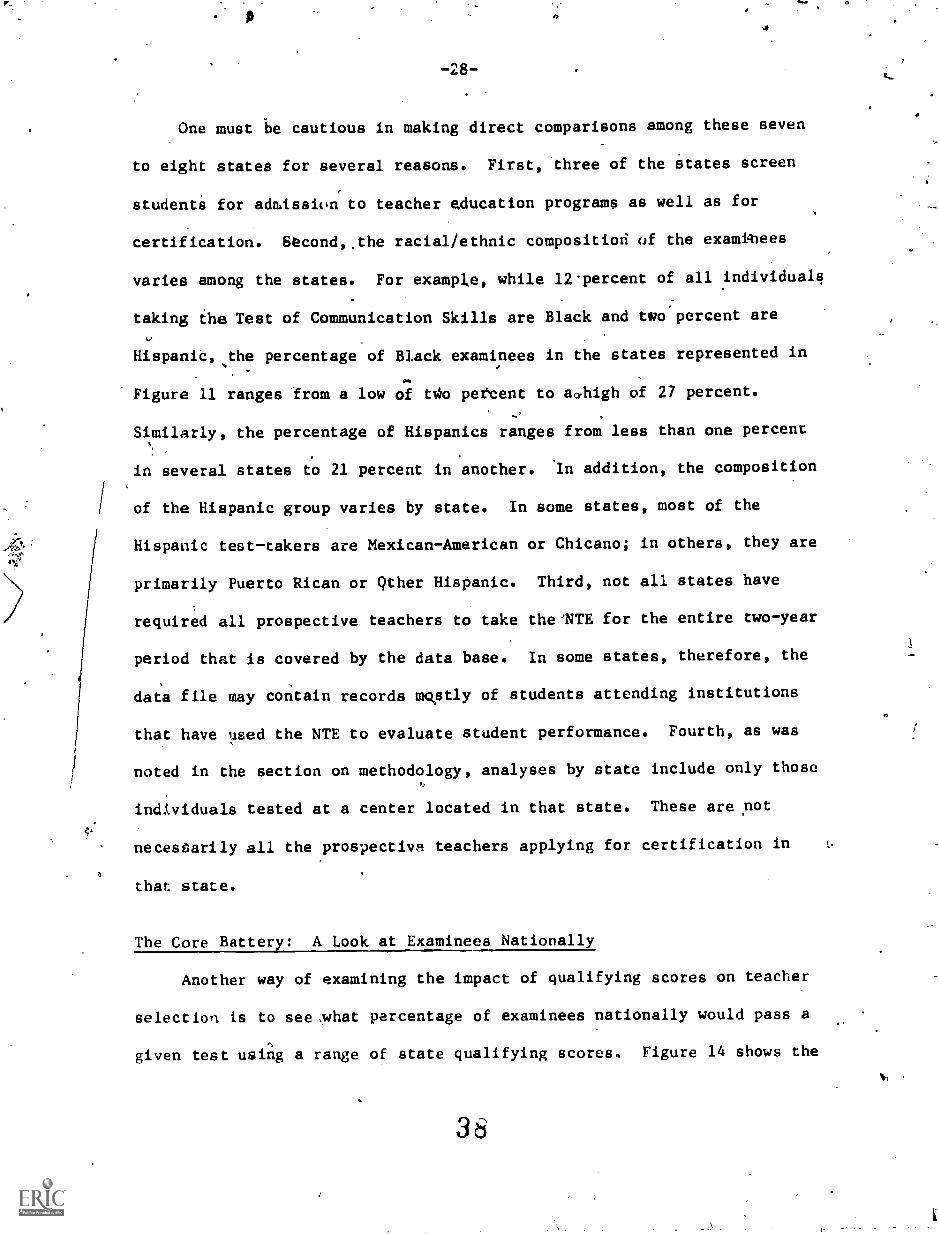
-2g-
One must be cautious in making direct comparisons among these seven
to eight states for several reasons. First, three of the states screen
studenti for admission to teacher education programs as well as for
certification. Second,,the racial/ethnic compositiod of the exami4iees
varies among the states. For example, while 12-percent of all individuals
taking the Test of Communication Skills are Black and two percent are
Hispanid,the percentage of Black examinees in the states represented in
Figure 11 ranges from a low of No percent to ao.high of 27 percent.
Similarly, the percentage of Hispanics ranges from less than one percent
in several states to 21 percent in another. 'In addition, the composition
of the Hispanic group varies by state. In some states, most of the
Hispanic test-takers are Mexican-American or Chicano; in others, they are
primarily Puerto Rican or Qther Hispanic. Third, not all states have
required all prospective teachers to take the'NTE for the entire two-year
period that is covered by the data base. In some states, therefore, the
data file may contain records mokstly of students attending institutions
that have used the NTE to evaluate student performance. Fourth, as was
noted in the section on methodology, analyses by state include only those
individuals tested at a center located in that state. These are not
necessarily all the prospective teachers applying for certification in
4
that state.
The Core Battery: A Look at Examinees Nationall
Another way of examining the impact of qualifying scores on teacher
selection is to see ,what percentage of examinees nationally would pass a
given test using a range of state qualifying scores. Figure 14 shows the
38

100 -=
90 -I
80
60
cn
cl.°1 50-
40
c13 30
20
10
A
o,
figure 14
lest of Communication.Skills-
All)
Examinees°
LOW
(6S7)MEDIAINt
(644)
Hypothetical Qualifying Scores
-39
HIGH
,(650)
White
E722 Black
0
i
Hispanic
N.

0
-30-
percent of examinees in each racial/ethnic group that would pass the Test
of Communication Skills if the qualifying.score were set.atcthe lowest
'score currently used, at the median of those currently used, and at the
highest score. The passing rates differ significantly among thee groups,
Using the lowest qualifying score (637), 98 percent of the White,
69 percent of the Black and 85 percen-. of the Hispanic examinees would
qualify to beome teachers. At the median qualifying score (644),. learly
all White examinees continue to qualify (94 percent), but the passing
rate drops to 48 percent for Blacks and 70 percent for Hispanics. The
highest qualifying score (650) eliminates nearly 70 percent of the Black
and 45 percent of the Hispanic candidates, but only 14 percent of the
White candidates.
More students are screened out generally by the Test of General
Knowledge, but the impact is greatest on Blacks. (See Figure 15.)
Using the lowest qualifying score (636), 56 percent of Black examinees
pass, compared with 86 percent of the Hispanic and 97 percent of the
1" White test-takers. The highest qualifying score (649) eliminates
more than 80 percent of the Black and nearly half of the Hispanic test-
,'--takers, but only about.20 percent of the White examinees.
Figure 16 shows that 99 percent of White and 92 /percent of Hispanic
examinees pass the Test of Professional Knowledge, while about 82 percent
of Black examinees qualify at the lowest score (630). Once again, the
passing rate drops dramatically for Blacks as the qualifying score is
raised. At the median qualifying score (641), 52 percent of the Blacks,
76 percent of the Hispanic and 94 percent of the White candidates qualify.
The highest score (646) eliminates nearly 64 percent of prospective Black

Figure 15
fr
Test of General Knowledge
All Examinees
LOW
(636)
MEDIAN
(641)
Hypothetical Quolitying Scores
A 1
HIGH
(649)
White
Black
Hispanic

Figure 16
Test of Professional Knowledge
All Examinees
LUI
(630)
MEDIAN
(641)
Hypothetical Qualify' g Scrn
HIGH
(646)
Li White
W7 Black
Hispanic.

-33-
teacherb, 36 percent of prospective Hispanic teachers and 12 percent of
prospective White teachers.
The Specialty Area Tests
Although we have information on state qualifying scores for the
Specialty Area tests, the number of minorities taking any one twit in
each state i.e too small to Make a state-by-state analysis possible.
Instead, the range of qualifying scores reported in Table 2 will be
applied to the national group of examinees in order to examine the impact
of these standards by racial/ethnic group. Since fewer than 25 Hispanics
took many of the tests, the analysis will be limited to White and Black
examinees.
Figures.17 through 20 show the percent of White and Black examinees
nationally that would pass four Specialty Area tests using the lowest,
middle and highest qualifying scores set by states for each test. Once
again, the passing rates differ significantly for the two groups. On the
test for Education in the Elementary School (Figure 17), 97 percent of
the White and 53 percent of the L.ack examinees score at or above the
lowest qualifying score (480). The highest qualifying score (600)
eliminates nearly 90 percent of Black candidates, but .only 34 percent of
White teaching candidates. The range of qualifying scopes for the Early
Childhood Education test (from a low of 460 to a high of 520). allows
93 to 98 percent of the White test-takers to pass the test compared with
36 to 62 percent of the Black examinees. (See Figure 18.) Figure 19
presents the figures for the Biology and General Science test. The
lowest qualifying score (480) eliminates one percent of the White and 21
43

et
C)O
L.C)
ifTilliTiriv TT II1T..I.. -fr. III. iiri
CZ) CZ) CZ) c CZ) CZ) Cc CD CZ)C31 c.cp r-r7 c.1
bulssod luaoiad

CO'-4
a)
bC
Z4
$4
III
<=) <=) <=) C=) <=f <=f C=)'CT) CC/ r"-- CC) Lr.) -c:r f--) (""4
luaJiad
C=,

0 0 0 0 0 0 0a-)
r--
6u(sspd inoladcv

-37-
percent of the Black candidateg, while the highest qualifying score (590)
would screen out 23 percent'otthe,White and 78 percent of the Black
prospective teachers.. Ninety percent oz more of the White examinees
would pass the English Language and Literature test under any state
qualifying Score (Figure 20). The passing rate for Black examinees would
range from 30 to 65 percept.
Table 5 shows the passing rates for other Specialty Area tests
using three hypothetical qualifying scores. In almost all cases, the
passing rate-for Black teaching candidates is significantly lower than
the rate for White candidates. It is interesting to note, that at a time
when many school districts face a shortage of mathematics and physical
science teachers, the passing rate for both Aits'and Black candidates is
lowest on the tests of Mathematics and Chemistry, Physics, and General
Science.

eol
bCri
tic=i
CD CD CD CD CD CD CDCT1 ...r) 1--)
61.11SSDd lUgOlad
C=I

-39- \.
.Table 5.
Percent of Test-takers Scoring at or above Three Hypothetical
Qualifying Scores on 21 Specialty Area Tests', 1981-84, by Racial/Ethnic Group,
.
Low Median HighTest White
Art Education* ---
Biology and General Science 98.6%
BusinessEducation 99.2
Chemistry, Physics, and General Science 94.2
Early Childhood Education 97.9
Education in the Elementary School 97.2
g
Educatitin of the Mentally Retarded 94.3
English Language and Literature 98.7
French 88.2
Home Economics Education 98.5
Industrial Arts Education 99.7
Introduction to the Teaching of Reading 95.7
Mathematics 86.6
Music Education 96.6
Physical Education 98.6
Social Studies 94.0
Audiology** 99.9
Educational Administrationand Supervision
98.3
Black /White Black White Black
-- 91.1% 33.82 -- --
78.9% 92.8 51.6 76.6% 21.5%
80.9 94.4 46.5 .75.3 15.4
45.7 77.2 8.7 53.6 2.2
62.1 '96.0 48.1 22.5. 35.6
53.3 91.9 35:4 66.3 10.4
49.6 92.2 43.1 68.1 15.9
64.9 94.4 39.5 90.0 29.5
52.0 85.2 48.0 49.3 12.0it.
62.7 97.8 50.0 87.5 21.4
83.6 94.1 18.6 84.6 9.6
37.5 -- -- . 92.9 : 23.8
36.7 71.7 19.7 41.3 5.2
60.1 93.8 46.6 84.3 30.7
71.7 90.9 36.6 73.4 15.5
50.1 85.4 31.0 70.4 16.4
100.0 93.1 70.9
82.1 95.0 62.6 80.7 36.1
*The several states that set qualifying scores for Art Education all use thesame score.
**Using the qualifying score used by ASHA, 86.1 percent of the White and 50.9percent of the Black examinees would pass the Audiolcgy test.

-40-
lable 5
.
Percent of Test-takers Scoring at or above Three Hypothetical .
Qualifying Scores on 21 Specialty Area Tests, 1981-84, by Racial/Ethnic Group
a
Test
Low .Median High
White Black White Black White Black
Guidance Counselor .98.2 78..3 94.6 52.4 93.5 46.2
Reading Specialist 96.7 48.0 4=0 MN -- 94.8 42.0
Speech Language Pathology*** 99.7 95.1 -- MO MIMI 94.9 69.1
***Using the qualifying score set by ASEA, 86.3 percent of the White and
46.2 of the Black examinees would pass the Speech-Language Pathology test.

-41-
Implications for the .Future
. The analyses presented in the preceding section haye major
implications for the racial/ethnic composition of the teaching force in4
years to come. In1980, 87.3 percent of the nation's teachers were
White, 9,8 percent wereoBlack, and 2.1 percent were Hispanic. TLe group4 ._
of test records for aspiring teachers who took the Core Battery testst.
between 1982 and 1984 had a slightly larger representation of Blacks and
a similar'percentage of Hispanics. Estimates derived from these test -----
records indicate that the use of the current state standards could result'
in a lower percentage of Blacks coming into the teaching force. If we
assume that future groups of examinees would achieve Core Battery test'
scores like those achieved by test-takers during the first two years of0
the Coreihatery and that the qualifying scores are the medians used in
this study, then 91 percent of those passing would be White, seven
percent would be Black and two percent would be Hispanic. (See Table 6).
If the highest scores were used as a staidards 93 to 94 percent of new
teachers would be White, four to five percent would be Black and 2
percent would be Hispanic. If we couple this latter passing rate with an
annual teacher turnover rate of six percent, the teaching force would
become 92 percent White and five percent Black by the year 2000.
Unfortunately, fewer minority teachers would be entering the classroom
at a time when the number of minority studerq-s is grosiing. Between 1970,
and 1980, the percent of minority put, school children increased from
20.7 to 26.8 percent. In that latter year, 16.1 percent of public
elementary and secondary school children were Black, 8.0 percent were

-42-
Table 6
Composition of Examinee Group Estimated to Pass NTE Core Battery Tests
at Three Hypothetical Qualif ng Scores, by Racial/Ethnic Groups*
CompositIon of droup**Passing atLowest Qualifyin Score
White
,
.
Black
Hispanic
Composition of Group**
Passing atMedian Qualifying Score
White
Black
Hispanic
Composition of Group**Passing atHithest Qualifying Score
White
Black
Hispanic
Test
CommunicatiOSkills
General Professional'
Knowledge Knowledge
87.9%
9.9
ak13%
8.5\
87 :4%
10.5
a.
f
. 2.2 2.7 2.1
90.9% 90.8% 90.7%
7.2 6.7 7.4
1.9 2.5 1.9,
93.1% 94.0% 92.6%
5.2 3.9 5.6
1.6 2.2 1.7
*These estimates are based on all test records available from the first
two years (1982-84) of the Core Battery tests and on the qualifying
scores currently in use by seven states (eight for the Test of Professional
Knowledge).
**Group does not include Other Category and those examinees not reporting
racial/ethnic identity.
52

-43-
Hispanic and 2.7 percent were from other minority groups. The racial/
ethnic mismatch of teachers and children is more disturbing Li certain
;states. In California, fbr example,144 percent of the students are
non-White, while only 17 percent of the teachers are non-White. The
Hispanic population is growing so rapidly that, by the year 2000, Hispanics
will comprise the largest single segment of the school-age population in
the state. Yet, only five percent of prospective teachers passing the
California Basic Educational Skills Test (CHEST) in,1981re Hispanic
and two percent were Black (Goertz, Ekstrom and,Coley,.1984).
Although teacher testing could be used to identify the need for .
remediation and to develop more fully the talents of individuals who wish7,-
e
to teach, a recent study of state.teacher preparati6n policies found
that most state testing policies focus instead on screening out people
(Goertz, Ekstrom, and Coley, 1984). For example, when students are
scteened prior to entrance into teacher education, colleges have little
opportunity to provide instruction to compensate for students' past
educational inadequacies. While some state policies encourage the
provision of remediation, funding is often lacking and there. is limited
information on which to design effective remedial programs. There
appears to,be little effort to coordinate remedial programs available for
all higher education students and those for students in teacher education.
State testing policies are operating in other ways to discourage
f
minorities from entering teaching. It appears that an awareness that
minority candidates have a lower passing rate on certification tebs is
discouraging many minority students from entering teacher education

-44-
sc,
programs or from applying for certification., This is happening at a time
when the pnol of minority college students is shrinking. In addition,
-several states have, or are considering, policies that would close
teacher education programs with low passing rates. These policies could
result in teacher education programs being available only in institutions
with selective admission policies and the abolishing of such programs in
institutions with open admissions policies.
Although many states appear aware of the impact of their testing
policies on minority teaching candidates, current efforts are being
directed toward enacting more and/or stricter standards rather than
addressing existing problems of equity.

-45-
References
stin American-statesman, July 14, 1984.
Education Week, January 1983.
Education USA, July 30, 1984.
Goertz, M. E., Ekstrom, R. B., and Coley, R. J. The impact of statepolicy on entrance into the teaching rofession. Princeton, N.J.:Educational Testing Service, 1984.
San Jose News, January 21, 1983.

-47--
APPENDICES
Appendix A: List of States Requiring NTE Programs Tests, 1984-85
Appendix B: :Number of Test Records for Core Battery Tests, 1982-84, byRacial/EthnApProup
Appendix C: hImber of Examinees for Specialty Area Tests, 1981-84, byRacial/Ethnic Group
Appendix D: Number of Test-takers and Mean Scores for Core Battery Tests,by Racial/Ethnic Group
Appendix E: Percent of Test-takers Scoring at or about Three HypotheticalQualifying Scores, Core Battery Tests, 1982 -84, by Racial/EthnicGroup

1. Arkansas
2. California
3. Delaware
4. Florida
5. Indiana
6. Kansas
7. Kentucky
8. Louisiana
9. Maryland
10. Mississippi
11. Nebraska
12. New Jersey
13. New Mexico
14. No, rk
15. Nor. : Carolina
16. South Carolina
17. Tennessee
18. Texas
19. Virginia
20. West Virginia
sfc
9/20/84
-49 -
Table A
States Requiring NTE Programs Tests1984-85
- requires two Core Battery tests plus a SpecialtyArea test for initial certification
- uses the Test of General Knowledge and some NTESpecialty Area tests as an alternative to theapproved program approach for certification
- uses PPST for initial certification
- uses 5 NTE Specialty Area tests in its Master TeacherProgram
- currently studying NTE Core Battery and SpecialtyArea tests as a requirement for initial certification
- currently studying NTE Core Battery and Spec altyArea tests for initial certification
- has validated NTE Core Battery and Specialty Area tests
- requires Core Battery and Specialty Area tests forcertification
- studying NTE Core Battery and Specialty Area testsas a requirement for initial certification
- requires NTE Core Battery and Specialty Area tests forinitial certification
- currently studying NTE tests as a requirement forinitial certification
- currently studying NTE Core Battery and SpecialtyArea tests as a requirement for initial certification
- requires Core Battery and Specialty Area tests forinitial certification
- requires Core Battery tests--currently studying theSpecialty Area tests
- requires one Core Battery and Specialty Area testsfor initial certification; requires two Core Batterytests for admission into teacher education
- requires Specialty Area tests for initial certification
- requires Core Battery and Specialty Area tests forinitial certification; also uses these tests as partof its Career Ladder Program
- uses PPST for screening
- requires NTE Core Battery and Specialty Area testsfor initial certification
- uses NTE Core Battery and Specialty Area tests.
57

Table B-1
041L PkU6NAHS L014 114ITIRY 1134. NAI1GNALS ANu SPECIAI6 COMBINFO 10134:36 9/28/84' PAGE 237F4STAT 2.69
JLST t. LUMIUNILAIIIIN SKILLS
IC COUt IkkALK CHICANO NATIVE A OAASIAN P. R. 0TH HI SP WHITE OTHER NO CODE TOTAL
ALABAMA 66 155 0 0 1 0 2 416 18 31 623'AKI1UNA 94 0 1 0 1 0 0 3 0 2 7'
AkKANSAS 18 295 6 19 3 2 3 2322 14 64 2728'CAA_ IF. 9 / 44 45 4 35 1 13 455 15 48 650*
LLICRAJ0 d5 0 3 0 0 0 0 32 0 0 35CJPN. 31 6 0 0 1 0 0 7 1 1 16'
DELAhAkE 18 4 0 0 0 0 0 13 0 - 0 17'U. OF C. 19 17 0 1 2 0 1 159 2 13 195'FLORIDA 63 2 0 0 0 0 0 75 1 .3 81'UtlikUlA 54 121 0 1 2 1 4 626 2 34 791'
'OAHU 92 0 0 C 0 0 . 0 0 0 0 0'ILLINCIS 56 194 ld 2 8 6 12 293 8 101 642'/NJIANA 42 6 1 0 1 0 0 75 1 0 84'
ILWA 72 0 0 0 1 0 0 91 0 3 95'KANSAS 15 0 0 0 0 0 0 0 0 0 0
KENTUCKY 55 49 0 15 5 0 3 1915 6 48 2041'LA.
MAINE7146
14940
100
3M0
420
7
0
550
52984
520
7610
7753*4'
MAKYLANU 14 136 0 2 0 0 1 167 3 16 275'MASS. 25 8 0 1 0 2 2 292 5 28 338'
MICH16AN 61 9 0 1 1 0 0 92 0 4 107'MINN. 71 1 0 1 1 0 0 86 0 1 90'11155. 68 41U 0 1 3 4 0 4 1262 4 113 1810'
MISSGUKI 73 r 0 3 0 0 0 210 3 3 226MuNTANA 91 0 0 1 0 0 0 40 0 1. 42'
NEbkASKA A3 1 1 1 U C 3 77 0 0 83'NLVAUA 94 0 0 0 i. 0 0 0 0 0 0 0
NEw HAM') 45 O 0 0 0 0 0 44 0 1 45'
NEw JLRS 13 61 0 0 10 18 20 952 5 47 413'NEW MEX. 89 28 229 44 6 5 131 1224 38 104 1809'NEw YukK
N. C.355u
319944
2
4
1047
30
16
2.12
6
6521
16814087
3838
415284
2772'544
N. U.UHIC
8144
U
15
0
1
07
0
2
U3
04
0601
0
5
038
(7'
676'UKLA. db 1 0 C 0 0 1 19 0 0. 21'
UktGON 96 0 0 0 0 0 0 6 0 0 6,PENN. 15 41 0 4 4 0 2 867 8 71 997R. 1. 23 0 0 0 0 0 0 0 0 0 0
S. C. 11 79 0 0 0 0 0 234 1 11 275'S. U. a2 0 0 0 0 0 0 1 0 0 1,TENN. 64 450 1 35 12 2 15 4334 16 157 5022'TEXAS ;i d oo r 6 0 1 3 495 6 14 592UTAH ($3 O 0 0 0 0 0 3 0 0 3'
VERAuNI 41 0 0 0 U C 0 11 0 1 12'
VIruINIA 1d bi.I'l 14 21 24 13 19 6032 42 307 7157'h ASHNGTNwESt VA.
95?/
1
bb0
1
01P
0
2
0o
0
2
0
23210
11
069
1'
2480'wISLLNSN 64 0 1 0 0 0 0 38 1 2 42'1.Y0MINU A4 0 0 0 0 0 0 0 0 0 0
AK HI Nit 9H 0 0 0 0 1 0 2 0 0 3'
U hGliM I Sl. tl 8 U 0 ? 0 0 91 0 4 105TOTAL u 56U f 33' 291 216 280 386 36353 344 2800 46612
5859

Table l3.2
ti 1t PRUGACI. CO%1 3AIICKY - 1982 - 1984. NATILNALS AND SI'FCIAIS COMBINED
TEST Uf 6LNIKAL NNunLE:)Gi
10:34136 9/28/84 PAGE 238F4STAT 2.69
TL LULA 8LACK CHICANO NATIVE A OR-ASIAN P. R. 0TH HISP WHITE OTHER NO CODE TOTAL
ALABAMA 66 10 0 0 1 0 2 424 19 32 645
40411uNA Lpi 0 1 0 1 0 0 5 0 3 10
ARKANSAS 18 31; 6 19 .s 2 3 2368 14 73 2801
CALIF. 9/ 163 228 2S 164 12 83 3157 92 372 4496
CULUKAUC 85 0 5 0 0 0 0 33 0 0 38
CHNN. 31 b 0 0 0 1 0 7 0 1 15
LALAftAM Id 3 0 0 0 0 0 12 0 0 15
U. Of C. 19 25 0 1 2 0 1 164 2 20 215
FLo0.10/6 6.. 3 0 0 0 0 0 75 1 2 81
(,tOR.,01A 54 141 0 2 3 1 5 701 2 41 896
'DAHL 92 0 0 0 0 0 0 0 0 0 0
1CLINLIS 56 ar 5 3 4 6 4 219 3 38 369
INDIANA 42 6 1 0 1 C 0 78 1 0 87
114hA 12 0 u 0 1 0 0 91 0 3 95
KANSAS 75 0 9 0 0 0 0 0 0 0 0
KENTUCKY 55 51 0 14 5 0 3 1920 6 58 2057
LA. 11 2418 8 34 42 7 , 52 5583 66 923 9193
MAINE 46 0 0 0 0 0 0 5 0 0 5
MARYLAt.0 14 91 0 2 0 0 1 184 2 15 295
MASS. 25 8 0 1 0 4 2 , 295 5 29 344
MILH1GAN 61 10 0 1 1 0 0 91 0 6 109
MINN. 71 2 0 1 1 0 0 87 0 0 91
MISS. 68 4$? 0 13 4 0 4 1281 5 115 1859
MISSOURI 73 4 0 3 0 0 0 209 2 6 224
MONTANA 91 0 0 1 0 0 0 40 0 2 43
NL6KASKA 83 1 1 1 0 0 3 75 0 1 82
NEVADA 94 0 0 C 0 0 0 0 0 0 0
NE% RAMP 45 0 0 0 0 0 0 47 0 1 48
NE% JEIkS 13 60 0 1 1 13 17 263 4 ta 416
NEn MEX. 89 30 244 49 b 4 135 1237 41 110 1856
Nth YG.4K 35 239 1 11 33 235 75 1759 39 464 2956
N. C. 50 939 4 48 16 6 22 4140 38 295 5528
N. U. 81 0 0 0 0 0 0 0 0 0 0
GHiL 44 13 0 5 1 3 2 479 4 19 526
OKLA. 86 20 0 0 0 0 1 27 1 1 50
UREGUN 96 0 0 1 0 0 0 8 o 0 9
PENN. 15 16 0 2 3 0 NV 710 6 47 785
K. 1. 23 0 0 0 0 0 0 0 0 0 0
S. L. 11 37 0 0 0 0 0 248 1 14 300
S. U. 82 U 0 0 0 0 0 1 0 0 1
TENN. 64 459 1 36 12 2 15 4371 16 161 5073
TEXAS 88 68 25 7 0 0 3 519 11 18 651
UTAH 43 0 0 0 0 0 0 4 0 0 4
VEkMUNT 41 1 i 0 1 0 0 35 1 3 42
V1PWANIA 7ti 64/ 14 22 24 13 19 6075 42 308 7214
hAlitION 95 2 2 C 2 0 ? 77 5 14 104
REST VA. 21 59 1 18 2 0 2 2324 9 71 2485
WiSUJN5N 64 0 1 0 0 0 0 44 1 3 49
HYuM1NG (14 0 I) 0 0 0 0 0 0 0 0
AK HI PA )d u . 0 0 0 2 0 2 0 0 4
iMGhAISC 0 2i6 i 0 2 0 0 85 9 79 411
toTAt 0 !,,4 )1 544 321 342 311 457 39759 448 3399 52577
6J
4C

.
Table B-3
NTE Osuu4A4S 7. lAint OATIENY 19132 1984 NATIONALS ANU SPECIALS COMBINED
TEST OF PRUIESSIuNAL KNOWLE061.
TC (.00E illAuK CHICANO NATIVE A ORASIAN P. R. 0TH HISP WHITE OTHER
ALA6A4A 66 151 U 0 2 0 2 483 18ARINNA 94 0 1 0 1 0 0 3 0ARKANSAS /8 403 1 34 6 4 8 .3754 20
(ALIO-.CULCRA00
9185
31
0
295
2
0280
00
7
033366
151
CUNN. 31 6 0 0 1 1 0 6 1ULLAwARE 18 4 0 0 0 0 0 12 00. OF C. 19 22 0 1 2 0 I 157 2FLUAI0A 63 2 0 0 0 0 0 79 1GEORCIA 54 209 0 3 5 1 6 746 3WAHL 92 0 0 0 0 1 0 26 1
ILLINUIS 56 196 16 2 9 7 11 327 71NOIANA 42 6 1 0 1 0 0 76 1
I UWAKANSAS
1275
U
0
0
000
1
0
00
0
0930
00
KENIUCKY 55 59 0 19 5 ..0 3 2201 7LA. 71 1489 11 34 40 7 57 5442 54
MAINE 46 0 0 0 0 0 0 Ft 0MARYLANU. 14 117 0 2 0 0 2 183 2
MASS. 25 9 0 2 0 3 3 317 4MILHIOAN 61 9 0 1 1 0 0 97 0
MINN. 71 2 0 1 1 0 0 89 0MISS.
MISSOURI6673
41612
0
1
124
4
0
0
1
4
1
1269347
42
MONTANA 91 0 0 1 0 0 0 40 0NEBRASKA 83 1 1 1 0 0 2 132 0
NEVADA 94 0 0 0 0 0 0 0 0NEw HAMP 45 0 0 0 0 0 0 25 0NEW JERS 13 25 0 0 3 6 7 153 1
New MEX. 89 26 209 43 6 3 120 1148 35NE YORK
N. C.j550
317812
21
8
453218
2158
7217 4392
3838
N. U. dl 0 0 0 0 0 0 0 0UHIG 44 14 0 6 3 3 2 563 4
UKLA.,uRtGON
8696
3
00
01
000
00
1
0
1166
2
0PENN. 15 40 0 3 0 2 848 8R. I. 23 0 0 0 0 0 0 0 0S. C. 11 30 0 0 0 0 0 257 2S. U. 42 0 0 0 0 0 0 1 0TENN. 64 442 1 36 12 2 15 433 1 17TEKAS ad tin 41 7 0 1 4 534 9UTAH 43 0 u 0 0 0 0 3 0
VERMuNT 41 u 0 0 0 0 0 12 0VIiu,INIA
NmASHNG1wEST VA.
2d.9521
u5U1
58
1401
220
18
2402
130
0
1902
60320
2335
430
10tITS4UNSN 69 t) 1 0 0 0 0 45 1
wYuM1Au 84 0 0 0 o 0 0 0 0AK HI PA ,ifi U 0 0 0 2 P 2 0FROMISC 0 1 0 0 2 0 c 73 0
TUIAL U 5665 144 309 212 .27.3 3o8 38668 351
62
10;34:36 9/28/84 PAGE 239F4STAT 2.69
NO CODE TOTAL
32 6941 6
104 434040 487
1 731 160 16
21 2062 84
53a 1
1'026
100 6770. 852 960 0
62 2356780 7914
0 816 32231 3694 1120 93 1
118 1829 VIU61
6 374 I
1 476 1430 00 25
23 218104
2672::/4475598
0 018 613
1 1240 6
66 9710 012 3010 1
16624
5022706
0 30 12c
\311
74
71270 \
25001
25:8
0 00 45 87
2901 49096
63

Nib PkuukAMS
Table C-1SPE:LIAM AREA TESTS 1981 1984. NATIONALS AND SPECIALS COMBINED 16350g45 10/03/84 PAGE 337
F4STAT 2.69
SPECIALIV AIIEJA TEST 13 At TUIAL ART EDUCATION
ALAUANAAKIUNAAkhANSASCALIF.
COLOsADOCuNN.
UELAwAREO. OF C.FLOKIDAGEukGIA
10AHCILLINCI SINDIANA
10wAKANSAS
KEMUCKVLA.
MAINEMAkvIANJ
MASS.MICHIGAN
MINN.MISS.
MISSOUk1MuNTANANEbkASKANEVADA
NEw HAMPNEw JEmSNEW MEX.NEW VOkK
N. C.N. O.OHIO
OKLA.WI CO NPENN.R. I.SO COS. 0.tEhN.TEXASUtAH
VEkAuNIVIILANIAwASHAGINWEST VA.wISCONSNWYOMINGAK HI PRFAGNAISL
EUTAL
.TL CuUt BLACK CHICANO NATIVE, A URASIAN P. K. OTH Ht WHITESP OTHER NO CODE TOTAL.
64
66 1 0 0 0 0 0 16 0 1 1899 0 0 0 0 ,0 0 0 0 1 178 11 0 2 1 0 1 137 0 10 16297 2 2 1 0 1 3 59 3 12 8385 0 0 0 0 0 0 0 0 0 031 0 0 0 0 0 0 0 0 0 018 0 i 0 0 0 0 0 0 0 0 019 U 0 0 0 0 0 o 0 0 063 0 0 0 0 0 0 2 0 1 354 s. 5 0 3 0 0 0 57 0 2 h592 0 0 0 0 0 0 0 0 0 056 2 0' 0 1 0 0 7 0 2 1242 o 0 0 0 0 0 2 0 0 272 0 0 \ 0 0 0 0 0 0 0 015 0 0 0 0 0 0 1 0 0 155 0 0 0 0 0 0 37 0 2 3'.11 .1 4 0 1 0 0 1 49 0 9 6446 0 0 0 0 0 0 0 0 0 . o14 5 0 0 0 0 0 7 0 0 1225 0 0 1 0 0 0 4 o 1 661 0 0 0 0 0 0 4 1 0 571 0 0 0 , 0 0 0 0 0 0 068 9 0 0 0 0 0 60 0 4 73/3 2 0 0 1 0 0 26 0 0 2991 0 0 0 0 0 0 0 0 0 083 0 0 2 1 0 0 ,,,............ 0 1 1394 0 0 0 0 0 0 0 0" 0 045 0 0 0 0 0 0 ' 0 0 0 013 2 0 0 0 1 0 16 0 2 2189 0 2 0 0 0 0 3 0 3 835 5 0 0 1 1 0 30 3 8 4850 41 1 2 0 2 1 221 1 14 28381 0 0 0 0 0 1 0 0 144 0 0 2 0 0 0 27 0 3 3286 1 0 0 0 0 0 2 0 0 3.96 0 0 0 0 0 0 2 0 0 215 1 0 1 0 0 0 51 1 3 5723 0 0 0 0 0 0 0 0 0 011 23 0 7 1 0 1 146 2 23 20382 0 0 0 0 0 0 1 0 0 164 2 0 4 0 0 0 38 0 4 7.88 1 0 0 0 0 0 3 0 0 493 0 0 0 0 0 0` 0 0 0 041 o 0 o 0 0 0 u o 0 0L8 16 0 3 0 0 3 176 1 20 21995 0 0 0 0 0 0 0 0 0 027 2 0 4 0 0 1 102 0 5 11464 0 0 0 0 0 0 3 0 0 384 0 0 0 0 0 0 0 0 0 098 0 0 e 0 0 o 0 0 0 0 0o 0 0 1 0 0 0 1 0 a 30 133 5 A4 6 5 11 1300 12 .132 1638 c' 65

1
Table C-2
NIL PRUGKAMS SPLC I AL IY AREA US'S 1981 1984 NATIONALS ANO SPECIALS COMBINED
SPEC IALTY AREA !LSI ti 8GS 10TAL BIOLOGY AND GENERAL SCIENCE
TG CUL* BLACK , CHICANO NATIVE A ORASIAN P. R. 0TH HI SP
ALABAMA 66 51) 0 * 0 0 0 0
AKIZUNA V9 0 0 0 0 0 0
ARKANSAS Id 19 0 i o 0 2
CALIF. 97 4 4 40 6 1 5
COL Ok A00 45 0 0 0 t 0 0GUNN . 31 0 0 0 1 0 0
DELAAAAt Id 0 0 0 0 0 0O. dF L. - 14. 1 0 0 0 o , aFLUK 10A bi i o 1 0 0 0
,GEURGI A , !I4 6 0 1 0 0 0
I CAHO 91 0' 0 0 o 0 0
ILL I NCI S 5o 2 0 0 0. 0 0
INDIANA 42 0 0 0 1.0 0
IOWA 72 ' 0 0 0 0 0 0KUISAS 75 U 0 . 0 0- 'o 0
KENTUCKY 55 . 0 0 0 0 0 0
LA. ' 71 16 c 2 2 1 1 3
MAINE 46 a 0 0 0 0 0 0
MAAYL AN U 14 0 0 0 1 0 0MASS. 25 0 '° 0 0 0 El 0 0
MICHIGAN 61 r 0 0 1 0 0 0MINN. 71 0 0 0 0 0 0M 155. 68 26 0 0 0 0 1
'UMW I 13 0 0..
2 0 0 0
AUNT ANA )1 0 0 0 0 0 0
NEBRASKA 83 0 0 0 0 0 0
Nt VAUA , 94 0 0 0 0 0 0
NEw RAMP 45 ' 0 0 0 0 0 0
NtW *JCRS 13 0 0 0 1 1 1
NEW.MEX. 89 0 2 0 o 0 0
NEW YORK 35 5 0 0 0 0 1
N. C. 50 28 0 6 2 0 0
N. O. 81 0 0 0 0 0 0
OHIU 44 1 0 0 0 0 0.OKLA. 86 0 0 0 o 0 00AtGUN 96 0 0 0 0 0 0PENN. 15 0 0 0 o a 0A. I. 23 0 o 0 o 0 0
SO CO 11 105 0 15 3 0 ..- 0.
S. 0. 82 0 0 0 oo
oo 0i TENN. 64 7 0 2 0
TEXAS 88 6 1 0 0 0 0UTAH 43 .0 / 0 0 0 0 0
VERMONT 41 '0 . 0 0 0 0 0VIRGINIA 28 13 0 5 1 0 0WASHNGIN 95 0 0 0 o . 0 0WEST VA. 2/ 0 0 1 0 0 0WI SLUNSN 69 0 0 0 0 t 0AVUMING 84 0 0 0 o 0, 0AK HI Ps 98 0 0 0 0 0 0FAGNMI SL U 0' 0 2 0 0 0
TOTAL 0 246 9 52 17 4 13
WHITE
152
318273
0001
241
03
1
00
35175
4,4'68
4; 013424
014
007
415
2650
23100
220
3001
913
01
2346
1163o1
52161
,.1
16:50845 10/03/84 PAGEF4 STA! 2.69
OTHER NO CODE TOTAL
0 ' 1 .2'0 1 3
3 22 36814 54 372
0 0 00 0 1
0 0 o0 o 2ci 0 40 4 520 3 00 1 60 0 20 0 00 0 00 - 4 394 20 2240 0 40 1 60 1 70 0 90. 0 90 . 12 173r 0 270 0 '01 3 18
0 0 00 0 .00 0 100 0 6
,
0 4 254 15 3200 0 00 3 270 1 110 0 01 3 26Q 0 02 52 4770 1 20 5 1050 2 12o - 0 00 0 1
0 23 2760 0 60 10 1270 I 50 0 00 0 1
0 0 7
30 244 2782
6u
127

Table -C-3
Nit PROGRAMS - SPtCIALTY AKtA TESTS - 1981 - 1984 NATIONALS ANO SPECIALS COMBINED
SKEIALIV AREA TEST 10 tot TOTAL BUSINESS EDUCATION
IC LUDt ULACK CHICANO NATIVE A OR-ASIAN P. R. OTH HISF WHITE OTHER NO CODE TOTAL
ALABAMA&ILONA
ARIU.NSACALIF.
CULOAPCCONN.
DELAWINEU. OF C.WAWAOtORGIAI0AHU
ILLINOISINUIANA
!IAAKANSAS
ALNIUCKVLA.
MAINt:MARYLAND
MASS.MICHIGAN
MINN.MISS.
MISSUtiv1Ow4TANA
NEUKASKANLVADA
NEW HARPNEW JEWS?dm MEX.NEW YORK
N. C.N. U.UHICUKLA.
OREGuNPENN.R. I.S. C.S. D.TENN.TEXASUTAH
VERMON1VIRGINIAwASHNONTEST VA.WISCUNSNWYUMINC
AK HI PRMINIMISE
TOIAL 68
16;50:45 10/03/84 PAGE 285F4STAT 2.69
bb 6 0 1 0 0 0 14 0 0 2199 0 0 0 0 0 0 0 0 0 07d 40 0 4 1 0 0 221 1 14 2819/ 9 6 .6 2 0 0 53 3 11 9085 0 0 0 0 0 0 0 0 U 031 0 0 0 0 0 0 0 0 0 018 1 0 0 0 0 0 0 r 0 1
19 2 0 0 0 0 0 0 0 1 3
63 1 0 0 0 c u 1 0 0 2. 54 41 0 1 0 0 1 66 0 8 12392 0 0 0 0 0 0 0 0 0 0
'56 6 1 1 0 0 1 3 0 3 if.
42 0 0 0 0 0 0 1 0 0 1
72 0 0 0 0 0 0 1 0 0 :15 0: 0 0 0 0 0 1 0 0 i
55 1 0 0 0 0 0 55 1 5 62.
11 78 0 3 0 0 0 158 3 41 28340 0" 0 0 0 0 0 0 0 0 014 7 0 0 0 0 0 4 0 2 1325 0 0 0 0 0 0 4 1 0 561 0 0 0 0 0 0 1 0 0 1
71 0 0 0 0 0 0 1 0 0 1
68 60 1 2 0 0 0 108 1 9 18171 0 C O. 0 0 0 47 0 3 SO91 0 0 0 0 0 0 0 0 0 083 0 0 0 0 0 0 7 0 1 8
94 0 0 0 0 0 0 0 0 0 045 0 0 0 0 0 a 0 0 0 013 4 0 0 0 0 0 2 0 0 689 0 2 0 a o 0 1 0 2 11
35 b 0 0 1 0 0 6 0 1 1450 /0 0 5 0 0 0 140 3 19 23781 0 0 0 0 0 0 1 0 0 1
44 1 0 1 0 0 0 28 0 1 3186 0 0 0 0 0 0 6 0 I 7
96 0 0 0 0 0 0 0 0 0 015 2 0 1 0 0 0 16 0 2 2123 0 0 0 0 0 0 0 0 0 0II 130 0 3 1 0 0 89 1 51 27582 0 0 0 0 0 0 0 0 0 064 11 0 3 0 0 0 95 1 6 12?88 19 0 0 0 0 0 3 0 1 2393 0 n 0 0 0 0 0 0 0 n41 0 0 0 0 0 0 0 0 0 02d 42 0 1 0 0 1 130 1 11 18695 0 0 0 0 0 0 0 0 0 021 2 0 3 0 0 0 125 0 5 13569 0 0 0 0 0 0 1 0 0 1
84 0 0 0 0 0 0 0 0 Cl 098 0 0 0 0 0 0 0 0 0
0 u 0 3 0 o 0 1 0 1 s
0 551 10 38 5 0 3 1396 16 199 2218.69

Tab le C-4
NIL PROGRAMS SPECIALTY AAkA TESTS 19111 1984. NATIONALS AND SPECIALS COMBINED 16150;45 10/03/84 PAGE 186F4STAT 2.69
SPECIALTY ARIA t\Si 01 CPS lUfAL CHEMISTRY, PHYSICS, AND GENERAL SCIENCE
ALABAMAAKILUNAARKANSAS
I.ALII.COLORADO
0#41 .UL1AWARtD. UF C.FLORIDAOtURGIA
WAHL)ILLINCISIWIANA
10wAKANSAS
KENTUCKYLA.
MAINtMARYLANU
MASS.MICHIGAN
MINN.MISS.
MISSOURIMUNTANANEBRASKA
NtVADANEW WOONtw JtHSNEw MEX.NEw YORK
N. C.N. D.OHAO
UKLA.LIAEG1,4
PENN.M. 1.S. c .
S. U.TEhm.TEXASUTAH
VtRMONIVIRGINIAwASHNGINwtST VA.wISLONsNwYOMING
AK HI PmFROM SC
IUTAL
TC LUut BLACK CHICANO NATIVE A OKASIAN P. R. 0TH HI SP WHITE OTHER NO CODE TOTAL
66 0 0 0 1 0. 0 2 0 0 3
99 0 0 0 0 0 0 1 0 0 1
/8 6 0 2 1 0 0 90 0 3 102
9/ 3 1.
2 4 0 2 100 3 18 133
85 0 0 0 0 0 0 1 0 0 1
31 0 0 0 0 0 0 0 0 0 0
18 0 0 0 0 0 0,7 0 0 0 0
19 1 0 0 0 0 0 0 0 0 1
63 0 0 0 0 0 0 0 0 0 0
54 1 0 0 0 0 0 5 0 1 7
92 0 0 0 0 0 0 0 0 0 0
56 1 0 0 1 1 0 4 1 0 8
42 0 0 0 0 0 0 0 0 0 0
72 0 0 0 0 0 0 1 0 0 1
75 0 0 0 0 0 0 0 0 0 0
55 0 0 0 0 0 0 15 0 1 16
il 12 0 1 0 1 0 35 1 9 59
46 0 0 0 0 0 0 1 0 0 1
14 0 0 0 0 0 0 2 0 0 2
25 0 0 0 0 0 0 2 0 0 2
61 0 0 0 0 0 0 0 0 0 0
/1 0 0 0 0 0 0 0 0 0 0
68 3 0 0 0 0 0 17 0 3 23
73 0 0 0 0 . 0 0 3 0 0 3
9183
00
. ___/ 00
00
00
0
0
0
0
013
00
02
015
94 0 0 0 0 0 0 0 0 0 0
45 0 0 0 0 0 0 0 0 0 0
13 0 0 0 0 0 0 4 0 1 5
89 0 0 0 0 0 0 3 0 0 3
35 3 0 0 0 1 0 2 0 2 8
50 2 0 4 0 0 0 46 0 4 58
81 0 0 0 0 0 0 0 0 0 0
44 0 0 0 0 0 0 2 0 0 2
86 0 0 0 0 0 0 1 0 0 1
96 0 0 0 t1 0 0 0 0 0 0
15 0 0 0 0 0 0 9 0 0
23 0 0 0 0 0 0 0 0 0 0
11 IL 0 3 0 0 0 41 0 13 68
82 0 0 0 0 0 0 0 0 1 1
64 2 0 0 0 0 0 10 0 1 13
kid 0 0 0 0 0 0 2 0 0 2
93 0 0 0 0 0 0 0 0 0 0
41 0 0 0 0 0 0 0 0 0 0
28 1 0 0 0 0 0 57 0 4 62
9) 0 0 0 0 0 0 0 0 0 0
21 0 0 1 1 0 0 28 0 1 31
69 0 0 0 0 0 0 0 0 0 0
84 0 0 0 0 0 0 0 0 0 0
98 0 U 0 1 . 0 0 0 0 0 1
0 0 0 0 0 0 1 0 0 1
0 46 1 13 9 3 2 500 5 64 643 r"
I .J. 1 .....
t*: i
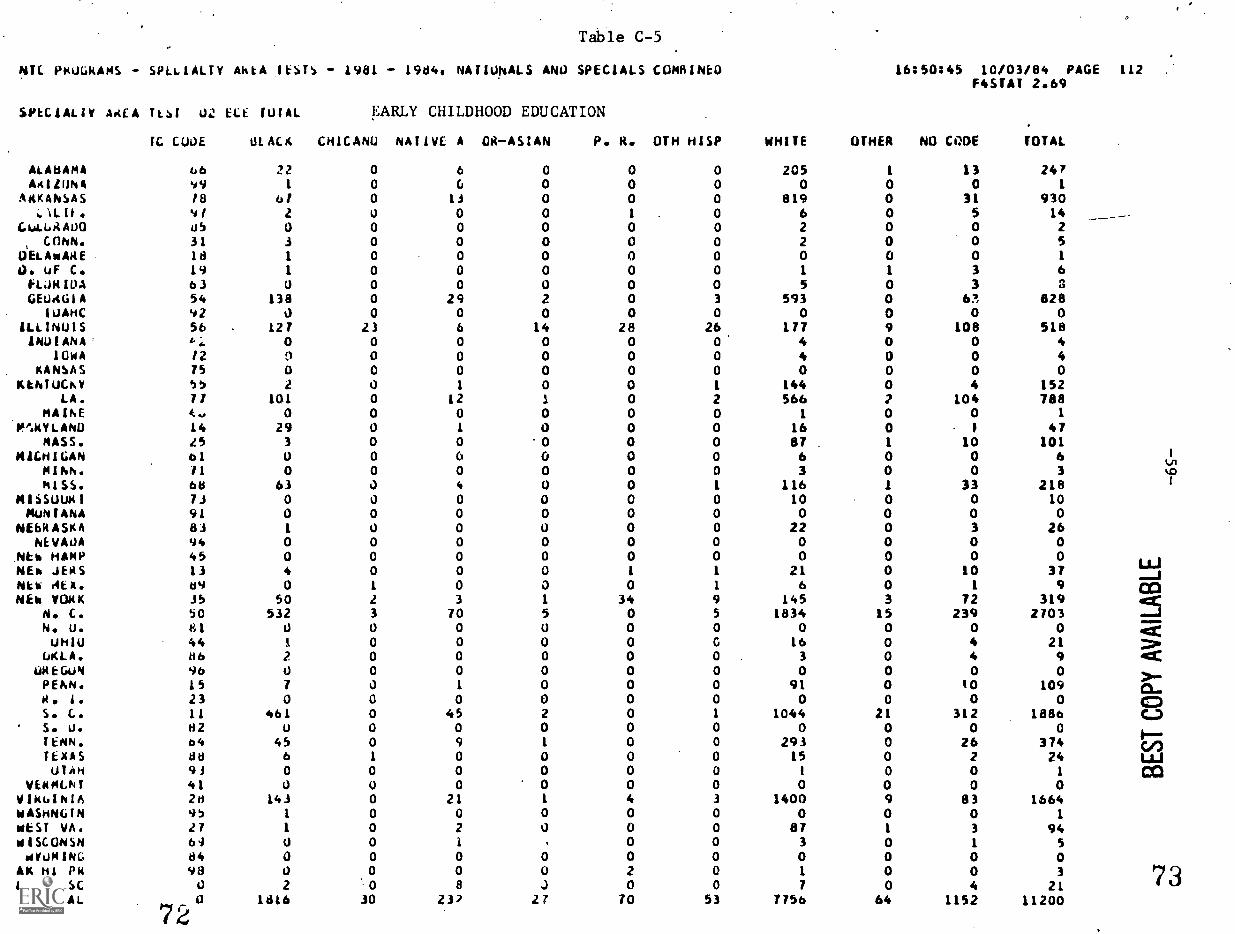
Table C-5
NFL PRUGRAMS SPI.I,IALTY AktA IESTS 1981 1984, NATIUNALS ANO SPECIALS COMBINE() 16:50:45 10/03/84 PAGE 112 .
SPECIALLY AWIA TLSI OZ ECE
IC CUOE
ALABAMA 66AAILUNA 119
AKKANSAS /8:.1LIF. 41
C4r.URAU0 85COMM. 31
OELAWAKE IdO. OF C. 19fLUHIOA 63GEUAGIA 54
1UAHC 421LLINU1S 56INDIANA ". ..
IOWA 12KANSAS 75
WITUCKV 55LA. 71
MAINE k...
WAYLAND 14MASS. 15
MICHIGAN 61MIlds. 11MISS. 68
MISSUUM1 73MuNTANA 91
NE6RASKA 83NEVADA 94
Nt8 HAMP 45NEh JENS 13NO: AEA. 89NE8 VOW( 35
N. C. 50N.U. 81util0 44
UKLA. 66UREGuN 96PE104. 15R. I. 23S. G. 11S. U. H2TENN. b4TEXAS tld
UTAH 93VERMIN! 41VIkulhIA 28WASHNGIN 45KIST VA. 27815CONSM 64mVuK1NG 84
AK HI PK 93fAGNM1SC 0
TOTAL
720
fUIAL
ULACK
EARLY CHILDHOOD EDUCATION
CHICANU NATIVE A 0a ASIAN P. R. 0TH HISP WHITE OTHER
F4STAT
NO CODE
2.69
TOTAL
22 0 6 0 0 0 205 1 13 247.1 0 G 0 0 0 0 0 0 1
8/ 0 13 0 0 0 819 0 31 9302 0 0 0 1 0 6 0 5 140 0 0 0 0 0 2 0 0 2
3 0 0 0 0 0 2 0 0 51 0 0 0 0 0 0 0 0 1
1 0 0 0 0 0 1 1 3 60 0 0 0 0 0 5 0 3
na
138 0 29 2 0 3 593 0 67 8280 0 0 0 0 0 0 0 0 0
127 23 6 14 28 26 177 9 108 5180 0 0 0 0 0 4 0 0 49 0 0 0 0 0 4 0 0 40 0 0 0 0 0 0 0 0 02 0 1 0 0 1 144 0 4 152
101 0 12 1 0 2 566 ? 104 7880 0 0 0 0 0 1 0 0 1
29 0 1 0 0 0 16 0 1 473 0 0 0 0 0 87 1 10 1010 0 6 0 0 0 6 0 0 60 0 0 0 0 0 3 0 0 3
63 a 4 0 0 1 116 1 33 2180 0 0 0 0 0 10 0 0 100 0 0 0 0 0 0 0 0 01 u 0 0 0 0 22 0 3 260 0 0 0 0 0 0 0 0 00 0 0 0 0 0 0 0 0 04 0 0 0 1 1 21 0 10 370 1 0 0 0 1 6 0 1 9
50 2 3 1 34 9 145 3 72 319532 3 70 5 0 5 1834 15 239 2703
0 0 0 0 0 0 0 0 0 01 0 0 0 0 G 16 0 4 212 0 0 0 0 0 3 0 4 90 0 0 0 0 0 0 0 0 07 0 1 0 0 0 91 0 10 1090 0 0 0 0 0 0 0 0 0
461 0 45 2 0 1 1044 21 312 1886u 0 0 0 0 0 0 0 0 0
45 0 9 1 0 0 293 0 26 3746 1 0 0 0 0 15 0 2 240 0 0 0 0 0 I 0 0 1
0 0 0 0 0 0 0 0 0 0143 0 21 1 4 3 1400 9 83 1664
1 0 0 0 0 0 0 0 0 1
1 0 2 U o 0 87 1 3 940 0 1 0 0 3 0 1 5
0 0 0 0 0 0 0 0 0 00 0 0 0 2 0 1 0 0 3
2 0 8 J 0 0 7 0 4 211816 30 232 27 70 53 7756 64 1152 11200
Ln1/40
73
Tab le C 6
NIL PrilkiRAPIS -
SPECIALTV 14E14
SPH.IALIY
TEST 01
IC CU0k
AkEA TtSTS - 1981 - 1984, NATIONALS AND SPECIALS COMBINED
FES TOTAL EDUCATION IN THE ELEMENTARY SCHOOL
BLACK CHICANO NATIVE A ORASIAN P. H. 0TH HIS? WHITE
16:50:45 10/03/84F4STA1' 2.69
OTHER NO CODE TOTAL
ALAnAMA bb 40 0 14 0 0 1 268 2 16 341
ARIZONA vu 1 1 0 0 0 0 6 0 0 8
ARKANSAS hi 207 2 44 7 0 2 1867 4 134 2267
LALIF. 91 7 5 4 3 0 0 54 1. 20 94
GULuRADO d5 0 0 0 0 0 0 10 0 0 10
CUNN. 31 2 0 2 0 0 0 6 0 1 11
OkLAwARE 18 1 0 2 0 0 0 3 0 0 6
O. OF C. 19 19 U 1 0 0 0 13 1 8 42
E-LORIOA 63 11 0 3 0 0 0 23 0 5 4.2
GEURGIA 54 110 1 25 3 1 0 336 1 47 524
IUAhd 92 0 0 0 0 0 0 1 0 0 1
ILLINOIS 56 130 22 6 6 34 27 217 8 99 549
INDIANA 42 0 0 4 0 0 0 53 0 .1 58
1UWA 72 0 0 0 0 0 0 8 0 1 9
KANSA.) 75 0 0 1 0 0 0 3 0 0 4
KENIUCKY 55 24 0 11 4 0 2 711 0 46 798
LA. 17 ,29 3 61 9 3 21 2555 22 432 3635
MAINE 46 .0 0 1 0 0 0 6 0 0 7
MARYLAND 14 64 0 5 1 0 0 65 3 LS 153
MASS. 25 3 0 3 0 1 1 105 2 14 129
MILHluAN 61 1 0 8 0 0 0 40 0 1 50
MINN. 71 0 0 0 0 0 0 48 0 7 55
MISS. 68 311 2 52 - 6 0 0 1254 2 136 1769
MISSOURI 73 3 0 5 1 0 1 293 0 14 317
MONTANA 91 0 0 0 0 0 0 3 0 0 3
NEBRASKA 83 0 1 2 1 0 0 72 0 1 77
NEVADA 94 0 0 0 0 0 0 0 0 0 0
NEw HAMP 45 0 t,.. 0 0 0 0 0 0 0 0 0
NEW JERS 13 54 0 4 3 12 8 200 3 52 336
NEw PEA. 89 0 9 1 0 1 5 30 2 6 54
Ntw YORK 35 171 1 29 10 120 23 540 22 224 1140
N. L. 50 203 5 44 4 1 7 1463 7 136 18/0
N. U. 81 0 0 0 0 0 0 2 0 0 2
UHlu 44 10 1 13 2 3 1 497 0 28 555
OKLA. 86 2 0 2 0 0 0 46 1 6 57
OREGON 96 U U 0 0 0 0 5 0 0 5
PENN. 15 25 1 19 2 3 3 589 3 45 690
R. 1. 23 u 0 0 0 0 0 0 0 0 0
S. C. 11 757 1 rb 9 4 6 2742 13 721 4329
S. O. 82 U 0 0 0 0 0 3 0 0 3
TENN. b4 116 1 36 3 0 3 1190 1 73 1423
tEXAS 88 65 3 10 0 0 0 72 1 17 168
UTAH 9i 0 0 0 0 0 0 2 0 0 7
VERMONT 41 0 0 0 0 0 0 6 0 1 b
VIRGINIA 26 130 3 30 10 0 4 1640 6 134 1951
wASHNGTN 95 (1 0 0 0 0 0 0 0 0 0
WESI VA. 27 42 0 50 2 0 1 1817 3 105 2020
WIsCONSN 69 0 2 0 0 0 0 35 0 6 43
WYOMING 84 0 0 0 0 0 0 0 0 0 0
AK HI PR 98 0 0 0 0 1 0 0 0 2 3
Fr 4NM1SC rl 0 4 1 15 0 0 0 48 0 6 74
TOTAL 0 3041 65 583 at 184 116 18947 108 2560 25697
PAGE* 63
ioo1

NIL PAUtAAMS'- SPLLIALIY AkEA TESTS
SPECIALTY AREA TtST 32 (Mk MAL.
ALABAMAARI2UNA
ARKANSASCALIF.
COEUKAJOCUNN.
ULLAwAREU. uF C.FLUNIUAGEuRGIA
IJAHuILL1NUISINUIANA
ILWAKANSAS
KENTUCKYLA.
MAINEMARVLANI.h
MASS.MICHIGAN
MINN.MISS.
MISSOUkIMONTANANEBRASKANEVAJA
NEw RAMPNE ARSNEw MEX.NEW VOkK
N. G.N. D.UHIU
OKLA.UREGUNPENN.A. I.S. C.S. D.TENN.TEXAS
VERMONT'VIRGINIAWASANGTNWEST VA.WISCUNSNwYOMING
AK HI PkFRGAMISC
. FUTAL
TL LULA bLACK
76
66 2b99 078 53
.
V7 1
85 031 3
18 0,19 1
63 1
S4 6292 056 12142 072 075 055 277 8146 014 3
25 061 471 068 16473 291 083 094 045 013 1489 035 1150 13981 044 386 096 015 923 011 10782 064 3988 693 041 028 12095 021 1
69 284 o518 00 2O 917
- 1981
CHICANO
Table C-7
- 1984 NATIONALS AND SPECIALS COMBINED
EDUCATION OF THE MENTALLY RETARDED
NATIVE A OR-ASIAN P. R. 0TH HISP WHITE OTHER
16250:45 10/03/84 PAGEF4STAT 2.69
NO CODE TOTAL
0 3 0 0 0 80 G 7 1160 0 0 0 0 1 0 0 1
u 14 2 0 0 149 0 19 2370 0 0 0 0 3 0 0 40 0 0 0 0 0 0 0 00 0 0 0 0 1 0 1 50 0 0 0 0 0 0 0 00 0 0 0 0 1 0 0 .0 0 0 0 0 6 0 0 7
0 9 1 0 0 126 1 25 2240 0 0 0 0 0 0 0 02 11 4 1 3 44 3 57 2460 1 0 0 0 18 0 2 210
0
00
00
00
00
60
00
00
60
0 0 0 0 0 40 0 1 431 7 3 0 0 143 5 47 2870 0 0 0 0 0 0 0 00 1 0 0 0 20 0 5 290 4 0 2 1 87 0 7 10100
3
000
0
000
8
000
00
150
4 19 0 0 0 331 1 44 5630 1 0 0 0 9 0 2 140 0 0 0 0 0 0 0 000
00
00
00
00
270
00
1
02b0
0 0 0 0 0 0 0 0 00 2 2 1 3 90 1 14 1270 0 0 0 0 0 0 0 00 1 0 3 2 60 3 14 9400
180
2
000
50
7392
30
560
9622
0 7 0 2 0 65 1 5 830 0 0 0 .0 11 0 0 110 0 0 0 0 0 0 0 00 5 0 0 '0 239 2 13 2680 0 0 0 0 0 0 0 000
180
00
1
000
4100
40
850
6250
0 3 1 0 0 200 1 7 2510 0 0 0 0 12 0 0 180 0 0 0 0 0 0. 0 00 0 0 0 0 0 0. 0 01
0
130
2
01
01
0526
1
5
n480
7171
0 5 0 0 0 34 0 4 440
000
00
0o
00
8
000
00
100
0 0 0 0 0 0 0 0 00 3 0 0 0 5 0 3 138 148 17 11 15 3502 30 467 5175
427
77

Table C-8
NIL PRU4RAMs SOECIALIV ARiA TESTS 1481 1984. NAIIUNALS AND SPECIALS COMBINED 16150145 10/03/84 PAGE,. 149F'STAT 2.69
SPECIALTY AREA TEST 04 ill TOIAL ENGLISH LANGUAGE AND LITERATURE
ALABAMAARIZUNAARKANSASCALIF.
COLURADOCUNN.
DELAwARIO. OF C.FLuRIOAGEuNGIA
luAHOILLINUISINWANA
IUMAKANSAS
ahrucKvLA.
MAINEMARYLAND
MASS.MICHIGAN
AIM.MISS.
MISSOURIMUNIANA
NEBRASKANEVADA
NEm HARPNEW JERSAtm Rix.NEW VURK
N. C.N. D.OHIO
OKLA.uREGVNPENN.R. I.S. C.S. U.TENN.TEXASUTAH
VERMONTVIRGINIAwASHNUTNWEST VA.MISCUNSNliVUNING
AK HI PRFRGNMISC
TOTAL
7 _
TC CODE MACK CH1CANU NATIV-A ORASIAN P. R. UTH H1SP WHITE OTHER NO CODE TOTAL
66 11 0 1 0 0 0 42 0 0 54
99 0 0 0 0 0 0 7 0 4 11
7d 35 1 15 1 1 0 396 3 24 476
97 24 19 30 11 3 8 544 15 115 769
85 0 0 0 0 0 0 1 0 0 1
31 0 0 0 0 0 0 0 0 0 0 \
18 0 0 0 0 0 0 1 0 0 1
196354
3 .
0,13
001
1
03
0
00
000
000
24
84
000
1
016.
74
117
42 0 0 0 0 0 0 0 0 0 0
S6 0 . 1 2 0 1 1 15 0 3 21
4e o . 0 0 0 t 0 5 0 1 7
7275
0 i
000
1
00
0
00
00
00
00
00
1
0,
55 0 0 1 0 0 0 70 0 6 77
71 41 0 11 2 0 2 297 0 48 401
4b 0 0 0 0 0 0 3 1 2 6
14 2 0 0 0 0 0 3 0 0 5
25 0 0 0 0 0 0 8 0 3 11
61 0 0 0 0 0 0 4 0 0 4 i
cr,
71 0 0 0 0 0 0 1 0 0 1 IV
od 26 0 1 1 0 0 182 1 20 237 i
73 1 0 2 0 0 0 .. 53 0 2 58
91 0 0 0 0 0 0 0 0 0 0
83 0 0 0 0 0 0 32 0 1 33
94 0 0 0 0 0 0 0 0 0 0
4513
04
00
01
0
001
01
1
16o0
02
1,25
84 0 0 0 0 0 0 4 0 0 4
35 10 0 0 0 2 0 23 1 20 56
50 5d 0 . 10 0 0 1 390 1 30 490
81 0 0 0 0 0 0 0 0 0 0 LA.1
44 2 0 0 1 0 0 64 1 3 71 ...I
8696
00
00
00
00
00
00
7
2
.o0
1
01 8
2
Cinae
15 2 0 1 0 0 0 62 0 6 71
23 0 0 0 0 0 0 0 0 0 0 deC
11 112 0 27 1 1 0 304 3 58 506
82 0 0 0 0 0 0 0 0 0 0
b4 13 0 4 0 0 0 145 1 8 171 >"'
88 2 0 1 0 0 0 15 o 1 19 O.'
9341
00
00
00
00
00
00
00
0o
00
00
C;)c,
2d 23 2 8 1 0 1 399 3 24 461 10-
95 0 0 0 0 0 0 2 0 0 2 CA27 3 0 5 0 0 0 138 3 11 160 L.1.1
69 0 0 0 0 0 0 4 0 0 4 CC1
84 0 0 0 0 0 0 0 0 0 0
48 1 0 0 0 0 0 0 0 1 2
0 1 0 5 0 0 0 6 0 0 12
0 381 24 136 18 10 14 3336 33 411 .4369

NIE PRUGKANS SPECIALTY ANLA TESIS 1981 1984, NATIONALS AND SPECIALS COMBINED
SPECIALLY AREA
ALABAMAAKINNA
ARKANSASCALIF.
CULuRA00CONN.
DELAWAREI. Of C.fLUkluAGEORGIA
IDAHOILLINUISINDIANA
IUWAKANSAS
IKENTUCKYLA.
MAINESAMVLANO
MASS.MICHIGAN
MINN.MISS.
MISSOUKIMuNTANANEBRASKA
NEVADANEW HAMPNEW JENSNEw MEX.NEW YORK
N. L.N. O.uH10
UKLA.LIFIEGWN
PENN.R. 1,S. C.S. 0.TENN.TEXASUTAH
VERMUNTVIRGINIAWASHNGINWEST VA.wISCONSNWYOINGAK HI PRFAGNMISC
TOTAL 80
TEST 11
IL LOOE
FR TOTAL
BLACK CHICANO
66 0 099 0 018 2 097 0 1
85 0 031 0 018 0 019 0 063 0 054 1 092 0 056 1 042- 0 072 0 075 - 0 055 1 017 4 0
,461 0 014 0 1
25 1 061 U 011 0 0bd 0 073 0 091 0 083 0 094 0 045 0 013 2 089 0 035 2 05 D 3 081 0 044 0 086 0 096 0 015 0 023 0 011 7 082 0 064 L 088 0 093 0 041 0 028 0 095 0 027 0 069 0 084 0 098 C 0o 0 00 15 -- 1
FRENCH
NATIVE A
, 002
3
0
00
0- 0
0
00
. 0
00
01
0-00
00
0
0
000
/0! 0
1 0
00
0
0
1 013
1
1 I/
1
00
0
- 00
1
0
00
0
00
,. 9
A450245 10/03/84 PAGE 347F4STAT 2.69
ORASIAN P. R. 0TH HISP WHITE OTHER NO CODE. TOTAL
0 0.. 0 2 0 0 20 0 0 0 / 0 0 01 0 0 26 0 2 333 0 0 41 / 2 11 610 0 0 0 / 0 0 00 0 0 0 / 0 0 00 0 0 0 /
/0 0 0
0 0 0 0 0 0 00 0 0 .0 0 0 G0 0 0 11 0 1 130 0 0 0 0 0 0
. 0 0 1 3 0 0 50 0 0 0 0 0 00 0 0 0 0 0 00 0 0 0 0 0 00 0 0 5 0 0 61 0 1 53 0 3 630 0 0 0 0 0 00 0 0 14 0 1 160 0 0 2 0 1 40 0 0 0 0 0 00' 0 0 0 0 0 00 0 0 8 0 0 80 0 0. 0 0 0 U0 0 0 1 0 0 10 0 0 0 0 0 0
c 0 0 0 0 0 0 00 0 0 0 0 0 00 0 0 2 0 1 50 0 0 0 0° 0. 0
.0 0 0 1 0 I 4.
1 0 0 64 1 4 730 0 0 0 0 0 0
c ,
0 0 C 3 0 0 30 3 0 1 0 0 10 0 0 '0 0 0 00 0 0 9 0 0 100 0 0 0 0 0 01 0 0 39 1 4 530 0 0 0 0 01 0 0 7 0 1 100 0 1 I 0 1 30 0 0 0 0 0 00 0 0 0 0 0 00 0 A 0 5G 0 6 570 0 0 0 0 0 00 0 0 12 1 0 130 0 0 1 0 0 10 0 0 0 0 0 00 0 0 0 0 0 00 0 0 1 0 0 18 0 3 357 5 37 446

Table C-10
NIL PRUuRAMS 5Ptt:IALTY AREA I *5 1981 198'. NATIONALS AND SPECIALS COMBINED 14:50:45 10103/84 PAGE 353
PtLIALTY AREA TESL Id GER
TC I.UaE
TUIAL
SLACK CHICANO
GERMAN
NATIVE A UK ASIAN P. A. 0TH HISP WHITE OTHER
F4STAT
NO CODE
2.69
TOTAL
ALAba 'A 66 0 0 0 0 0 0 0 0 0 0481/UNA 99 0 0 0 0 0 0 0 0 0 0
ARKANSAS lb 1 0 0 0 0 0 7 0 0 8
CALIF. 9/ 0 0 1 2 0 0 21 0 3 27CULUNAUU 85 u 0 0 0 0 0 0 0 0 0
(JAN. 31 0 0 0 0 0 0 0 0 0 0UtLAWARE Id 0 o U 0 o 0 0 0 0 0CI. UP L. i9 0 0 0 0 0 0 0 0 0 0FLUI4 1L)A 63 0 0 0 0 0 0 -0 0 0 00Eom0LA 54 0 0 0 0 0 0 0 0 0 0
IUAHU 92 0 o 0 0 0 0 0 0 0 0ILLINOIS 56 0 0 0 0 0 0 0 0 0 0INDIANA 42 0 0 0 u 0 0 0 0 0 0
IOWA 72 0 0 0 0 0 0 0 0 0 0KANSAS /5 0 0 0 0 0 0 0 0 0 0
/KENTUCKY 55 0 0 0 0 0 0 2 0 0 2
LA. 1! 0 0 0 0 0 0 1 0 0 1
MAINE 46 0 0 0 0 0 0 0 0 0 0MARYLAND 14 0 0 0 0 0 1 0 0 1
MASS. 25 0 0 0 0 0 0 1 0 0 1
MICHIGANMINN.
61?I
00
00
00
0
000
00
00
00
00
00
a
cr,4--
MISS. 6d 0 C 0 0 0 0 0 0 0 0a i SSL11.4N I 73 0 0 0 0 0 0 0 0 0 0MuhlANA 91 0 0 0 0 0 0 0 0 0 0
NE114ASKA 83 0 0 0 0 0 0 2 0 1 3
NtVA0A 94 0 u 0 0 0 n 0 0 0 0 11.1
NEw RAMP 45 0 0 0 0 0 0 0 0 0 0 ---1
New JtRSNEw MEX.
1389
U
000
00
01)
00
00
00
00
;0
u0
COAce....1
NEW YOgok 35 a 0 0 0 0 0 0 0 0 n
N. C. 50 V 0 1 0 0 0 8 0 0 914 . a . d1 0 0 0 0 0 C 0 0 0 0 QOHIO 44 0 0 0 0 0 0 0 0 0 0.
uKLA bo 0 0 0 0 0 0 1 .., 0 1 >m"UREGCN rat, 0 0 0 0 0 0 0 a 0 0 CL.
1
PEN?..K. 1.
1523
00
00
00
00
00
00
00
00
00
00 C..,
S. C. II 0 0 0 0 0 0 0 0 0 0 1.--S.D.it PIN.
TEXAS
8264db
000
000
000
000
000
000
020
000
000
02
0
Cl)LWCO
ufAH 93 U 0 0 0 0 0 0 0 0 0VERMoN1 41 0 0 0 0 0 0 0 0 0 0VIRGINIA 2f. 0 U 1 0 0 0 2i 0 0 22wASHNGIN 95 0 0 0 0 0 0 * 0 0 0 0WEST VA. 21 0 0 0 0 3 0 1 0 0 1
M1SCUNSN 69 0 0 0 0 0 0 0 0 0 0WYOMING
,d4 0 0 0 0 0 0 0 0 0 0
1/4.3AK .41 PRf144N141 SC
; 980
00
00
0
0
0
G
00
0
001
00
00
01
TWA'. 0 1 0 3 2 0 0 69 0 4 79
7

Table C-11
NIL PRd6RAPIS SnLIALIV AREA It STS - 1481 - 19H4, NATIONALS AND .PLCIALS COM8INE0 16:50:45 10/03/84 PAGE 327i4STAT 2.69
SPECIAvlY ARIA ILSI 12 HtE 10IAL HOME ECONOMICS EDUCATION
IC COOL BLACK CHICANO NATIVE A UR-ASIAN P. R 0TH HISP WHITE OTHER NO CODE TOTAL
ALAWAMAAKIZUNA
ARKANSASuAL1f.
CULURADOLUNN.
DELAWAREU. 0F. C.fLOMIUAGEJAGIA
luAriC
ILIANUISIhuIANA
IUhAKANSAS
ALN1ULKYLA.
MAINEMAkYL AND
MASS.MICHIGAN
MIhN.MISS.
MISSUU01MUNTANA
NkORArKANEVADA
NEw HAmPNEw JERSNkw MEX.NEW VOKK
N. C.N. O.OHIO
OKLA.URtGONPENN.R. I.
S. C.S. U.!INN.TtxASUTAH
VERMUNTV IkuINIAwASHeiGENwISI VA.wISLUNSNoVUMING
AK HI PKFAGNMISC
10 TAI 84
66 6 0 0 0 0 0 8 2 1 1799 0 0 0 0 0 0 0 0 0 078 19 0 3 1 0 0 146 0 13 1829/ 7 2 6 5 0 1 90 2 22 13585 0 0 0 0 0 0 1 0 0 1
31 0 0 0 0 0 0 0 0 0 018 0 0 0 0 0 0 0 0 0 019 0 0 0 0 o 0 1 0 0 1
63 0 0 0 0 0 0 0 0 4 o 054 26 0 2 0 0 0 41 1 7 .7792 0 0 0 0 1 0 ::I 0 0 056 2 0 0 0 0 0 1 0 1 442 0 0 0 0 0 0 4 0 0 4ll U U 0 0 0 0 1 0 0 1
75 0 0 0 0 0 0 0 0 0 055 1 0 1 0 0 .0 35 0 2 3971 le 0 4 0 0 1 126 1 16 16446 0 0 0 0 0 0 0 0 0 014 3 0 0 0 0 0 5 0 2 10b 0 0 0 0 0 0 7 1 0 861 0 0 a 0 0 0 1 r o 1
71 0 0 0 0 0 0 0 0 0 068 21 0 4 0 0 0 109 1 5 14073 0 0 1 1 0 0 18 1 0 21SI 0 0 0 0 0 0 0 0 0 083 0 0 0 0 0 0 1 .. 1 294 0 0 0 0 0 0 0 0 0 04' 0 0 0 0 0 0 1 0 0 1
13 1 0 0 3 0 0 1 0 0 589 0 1 0 0 0 0 1 0 0 2i5 0 0 0 0 0 0 2 0 1 3SO 36 0 5 0 0 0 134 0 9 18481 0 0 0 0 0 0 0 0 0 044 0 0 0 0 0 0 20 0 0 2086 0 0 1 0 0 0 4 0 0 S96 0 0 0 0 0 0 0 0 0 015 2 0 0 0 0 0 22 0 0 242i 0 0 0 0 0 0 1 0 0 1
11 44 0 2 0 0 0 99 0 36 18182 0 0 0 0 0 0 0 0 0 06* 9 0 3 0 0 0 90 0 7 109d8 8 0 0 0 1 C 3 0 2 14I 1 0 0 0 0 0 0 0 0 0 041 0 0 0 0 0 0 1 0 0 1
20 19 0 0 0 0 1 118 0 6 1449S 0 0 0 0 0 0 1 0 1 227 0 0 1 U 0 1 81 1 4 8869 0 0 0 0 0 0 6 0 1 784 0 0 0 0 0 0 0 0 0 098 0 0 0 0 0 0 0 0 0 0U 0 0 2 0 0 0 3 0 0 50 220 3 35 10 1 4 1183 10 137 1603
85

Table C-12
NIL PrtliumAmS
SPECIALTY AMEA
SPECIALLY
TEST 0
TC i.OUt
AkF.A TESTS,
IAE TOTAL
BLACK
- 19d1
CHICANO
- 1984 NATIONALS AND SPECIALS COMBINED
INDUSTRIAL ARTS EDUCATION
NATIVE 'A OM -ASIAN P. R. 0TH HISP WHITE
16:50345 10/03/84 PAGEF4STAT 2.69
OTHER NO CODE TOTAL
164
ALAI AMA 66 29 0 3 0 0 0 2 6 3 43
AKIZONA 99 0 0 0 0 0 0 0 0 0 0
AKKANSAS 7d 12 0 3 0 0 0 38 2 4 59
CALIF.CULURAu0
9785
4U
L
000
i
0
00
00
220
1
0
60
350
COIN. di 0 0 0 0 0 0 0 0 0 0
VELA WAKE 1 0 0 0 0 0 0 0 0 0 0
O. UF C. 19 0 - 0 0 0 0 0 0 0 0
FLuml0A 63 0 0 0 0 0 0 0 0 0 0
GEORGIA 54 6 0 0 0 0 0 14 0 4 24
liJAHO 02 0 0 0 0 0 0 0 0 0 0
ILLINCIS 56 8 u 0 0 0 0 3 0 6 17
INU1ANAIOWA
4272
00
00
00
00
0
00
0
00
00
00
00
KANSAS 75 0 o 0 0 0 0 1 0 0 1
KENTUCKY 55 0 0 2 0 0 0 83 0 11 96
LA. 11 5 0 1 0 0 0 8 1 3 18
MAINE 4o 0 0 0 0 0 0 0 0 0 0
MAKYLANU 14 1 0 0 0 0 0 4 0 0 5
MASS.MICHIGAN
2561
00
00
00
00
00
00
21
00
1
03
1 I
MINN. /1 0 0 0 0 0 0 0 0 0 0 crN
MISS. 68 22 1 4 0 0 0 30 0 14 71
MISSOuka 73 2 0 0 o 0 .0 31 0 0 33
MONTANA 91 0 0 0 ,./ 0 0 0 0 0 0
NEBRASKA d3 0 0 0 0 0 0 1 0 0 1
NEvAuA 94 0 0 0 0 0 0 0 0 0 0
NEw HAMP 45 0 0 0 0 0 0 0 0 0 0
NEw JLKS li 2 0 0 0 0 0 3 0 0 5
NEW Mt*. 89 0 0 0 0 0 0 2 0 0 2
hkm YORK 35 1 0 0 0 0 0 3 0 0 4
N. C. 50 28 0 5 0 0 0 164' 2 9 208
N, Ei. 81 0 0 0 0 0 0 0 0 0 0
CHAD 44 3 0 0 0 0 0 4 0 3 7
uKLA. Ho 1 0 0 0 0 0 4 0 1 6
OME6014 90 0 0 0 0 0 0' 1 0 0 1
Pd044. 15 0 0 0 0 0 0 8 0 2 10
A. 1. 23 0 0 0 0 0 0 0 0 0 0
S. L.. 11 17 0 1 0 0 0 27 0 9 54
S. 0. 82 0 0 0 0 0 0 1 0 0 1
TENN. 64 5 0 0 0 0 0 18 1 2 26
TEXAo 88 6 0 0 0 0 0 1 0 0 7
UTAH 93 0 0 1 0 0 0 35 1 6 43
V;KMLINT 41 0 0 0 0 0 0 0 0 0 0
VIKUINIAW4SHNGIN
2L
'62
a0o
5
a00
0o
00
880
2
0IS
0136
o
WEST VA. 21 1 0 1 0 0 0 42 C 2 46
wISCCNON 69 0 0 0 0 0 0 1 0 0 1
WYOMING 84 0 U 0 0 0 0 1 0 0 1
AK HI PA C lid 0 0 0 0 0 0 0 0 0 0 r
I-KGNMISC L'a ,) 0 1 0 0 0 0 0 1 0 0 2 C..0
TOTAL 0 1'; 2 26 1 0 0 644 16 101 967

Table C-13
NTt PRWRAMS - SPECIALIW AMtA TESTS - 1981 - 1984 NATIONALS ANO SPECIALS COMBINED
INTRODUCTION TO THE TEACHING OF READINGSPELIALIV AAIA ILSI 20 ITK TOTAL
Ti.
16:50:45 10/03/84 PAGE MeF4STAT 2.69
LULA OIALK CHICANO NATIVE A OR-ASIAN P. A. 0TH HISP WHITE OTHER NO CODE
66 1 0 0 0 0 0 0 0 099 0 0 0 0 0 0 0 0 078 55 0 5 0 0 0 131 1 1791 3 5 5 13 1 1 138 3 2505 o 1 a 0 0 0 0 0 031 o o 0 0 0 0 0 0 010 0 0 0 0 0 0 0 0 019 0 U 0 0 0 0 0 o 0b3 0 0 0 0 0 0 0 0 054 0 0 0 0 0 0 1 0 092 0 0 o 0 0 0 0 0 056 0 0 0 0 0 0 2 0 142 0 o 0 0 0 0 1 0 072 3 0 0 0 0 0 0 0 075 0 0 0 0 0 0 0 0 055 0 0 0 0 0 0 0 C 077 1 0 0 0 0 0 1 0 046 0 0 0 0 0 0 1 0 014 0 0 0 0 0 0 0 0 025 0 0 0 0 0 0 6 0 061 0 0 0 () 0 0 13 0 071 0 0 0 0 0 0 0 0 065 o 0 0 0 0 0 1 0 113 0 0 0 0 0 0 0 0 091 0 0 0 0 0 0 0 0 083 0 0 0 0 0 0 1 0 094 0 0 0 0 0 0 0 *0 045 0 0 0 0 0 o 0 0 013 3 0 0 0 0 0 0 0 0e9 0 0 0 0 0 0 0 0 035 J 0 0 0 1 0 0 0 15U 9 0 2 0 0 0 22 0 381 0 0 0 0 0 0 0 0 044 0 0 0 0 0 0 2 0 0dt,
coU0
00
0
000
0
000
01
00
00
15 0 0 0 0 0 0 0 0 023 0 0 0 0 0 0 0 0 0
3 0 0 0 0 0 0 0 182 r 0 0 0 0 0 , 0 0 064 2 0 0 0 0 3 i 0 0tid 2 0 0 0 0 0 2 0 I93 0 0 0 0 0 0 0 0 041 0 0 0 0 0 0 0 0 028 0 0 0 C 0 0 2 0 095 0 0 0 0 o.. '0 0 0 12? 0 0. 0 3 0 a 0 0 069 0 0 0 0 0 0 u 0 0U4 U 0 0 0 0 0 0 0 093 0 0 0 0 0 0 0 0 00 1 0 2 1 0 0 0 0 o0 80 6 14 14 2 1 326 4 50
ALA8AMAAKI/UNA
A3KANSASCALIF.
LOLUAAa0,CoNN.
CIELAIIAKEO. OF C.flUdiJAGEimulA
IDAHJILLINOIS1N0IANA
MO,KANSAS
KENTUCKYLA.
MAINEMAKYLAND
MA;S.MIC,116AN
NI/sac,
MISS.MISSUOKIMONTANA
NEbAASKANLVAUA
NEW HAmPNEsi ARSNEA MEX.NEw YOLK
N. C.N.C.OH16.,
OKLA.O Luom'LW..M. 1.
S. 11S. O.TENN.TEXASUTAH
VLAPIONTVIkulNIAwAsHNUINWEST VA.w!SuoNsNWYOMING
AK Hl PRFAEAMISC
IUTAL 88
TOTAL
1
0209194
1
00001
03
1
0002
1
06
1302
001
00005
3602
01
004
03
4002
1
0*
000
4
497

Table C-14
NTE PRO6AAAS SOELIALIV AREA ItSTS
SPLL1AL TV At4 A 11 SI Oh MAI TOTAL
TC CODE BLACK
- 1981
CHICANO
19848 NATIONALS AND
MATHEMATICS
NATIVE A OR ASIAN
SPECIALS COMBINED
P. B. 0TH HISP WHITE OTHER
16850845 10/03/84F4STAT 2.69
NO CODE TOTAL
PAGE 180
ALABAMA 66 3 0 0 0 0 0 13 0 1 17AHILUNA 99 0 0 0 0 0 0 2 0 5 7
ARKANSAS 78 21 2 7 2 D 0 271 3 24 330CALIF. 9l 22 22 24 47 1 18 680- 31 117 962
CIJI,Uit AO C 85 0 0 0 0 0 0 0 0 0 0CUNN. 31 0 0 0 0 0 0 0 0 0 0
OELAWAM F 18 0 0 0 0 0 0 0 0 0 011. UE C . 19 0 0 1 1 0 0 0 0 1 3
fL17H104 63 1 0 0 0 0 0 5 0 1 7CIEUHG1 A 54 14 0 1 1 0 0 45 0 9 70
104140 92 0 0 0 0 0 0 0 0 0 0ILL 1Nul S 56 4 0 0 1 2 0 13 0 9 29
11441) (ANA 42 0 0 1 0 0 0 6 1 0 8!CNA 72 0 0 0 0 0 0 1 0 0 1
KANSAS 75 .. 0 0 0 0 0 0 0 0 0 0KENTUCKY .55 0 0 1 0 0 0 46 2 2 51
LA. 11 30 0 4 3 0 3 167 2 23 232MAINE 46 0 0 1 0 0 0 3 0 0 4
MAAYL AND 14 0 0 0 0 0 0 5 0 C 5MASS. 25 0 0 1 0 0 0 15 0 1 17
MICHIGAN 61 0 0 1 0 0 0 3 0 1 5MILAN. 71 0 0 0 0 0 0 0 0 0 0 0,
coHISS. 68 24 0 5 0 0 0 130 0 6 165 i
-----441VSUUR I ' 73 1 0 0 0 0 0 17 0 0 18PINTANA 91 0 0 0 0 0 0 0 0 0 0
NEBRASKA 83 0 0 1 0 0 0 21 0 1 23NgVA0A 94 0 0 0 0 0 0 0 0 0 0
)Niii MAMA 45 0 0 0 0 0 0 0 0 0 0
i NE. JEAS 13 2 0 0 0 0 0 16 1 2 21NE. MEX. 89 0 1 0 0 0 0 15 1 1 18NEIN YUMA 35 4 0 0 0 1 3 13 1 9 31
N. C. 50 43 0 9 2 1 0 326 4 24 409N. O. 81 0 0 0 0 0 0 0 0 0 0
OHIO 44 0 0 1 0 0 0 21 1 2 25LALA . 86 0 0 0 0 0 0 2 0 1 3
UR k GU 1. 96 0 0 0 0 0 0 2 0 0 2PENN. 15 4 0 1 1 0 0 30 0 1 37K I 23 0 0 0 0 0 0 0 0 0 0S. C, 11 103 0 8 3 1 0 259 1 51 426S. D. 82 0 0 0 0 0 ' 0 2 0 1 3T ENN. 64 8 0 2 0 0 0 8q 1 8 108TEXAS 88 1 0 0 0 0 0 . 1 0 9
UTAH 93 0 0 0 0 0 0 1 0 0 1
VERMONT 41 0 0 0 0 0 0 2 0 0 2V1801814 28 20 2 1 0 0 0 299 1 ,.8 347vsASHNG1 h 95 0 0 0 0 0 0 1 0 0 1
WEST VA. 2 0 0 3 0 0 0 82 '' 1 8 94NISCONSN 69 0 0 0 0 0 0 3 0 0 3
WYOMING 84 0 0 0 0 0 0 0 0 0 0AK HI PR 98 0 0 0 0 0 , 0 3 0 0 3 0!FI4GNMISC 0 0 0 2 0 0 0 3 1 5 11 J L
TOTAL r0 1J0 305 27 81 61 6 21. 2619 53 332 3508

V/
Table C-15
NIL PWAAAMS - SPELIALIY AkEA TESTS - 1981 - 1984 NATIONALS AND SPECIALS COMBINED 16250:45 10/03/84 PAGE 311
SPECIALTY AKEA ILSI 11 ME TOTAL MUSIC EDUCATION
ALABAMAAMILuNA
ANKANSASLALIF.
COLUMA00CLAN.
ULLAwAREU. OF C.FLORIDAGEoRGIt
lUAH(4ILLINOISINOIANA
IUmAKANSAS
KENTUCKYI.A.
MAINEMAIO/LAND
MASS.NILOluAN
INN.' MISS.NISSCUwlAUNTANA
NEWIASKANIVAOA
NEw RAMPNEw JERSNLA MEX.NE6 YORK
N. C.N. O.UHIJ
OKLA.OkEGUNPENN.K. 1.
S. C.S. U.TENN.TEXASUTAH
VEKMUNTVIRGINIAWASHNGTNWEST VA.WI:oLONfik6YOMINt;
AK HI PRFAGMAISC
tyrAL
F4STAT 2.69
TL LOUL ULALK CHICANO NATIVE A OR -ASIAN P. R. 0TH HISP WHITE OTHER NO CODE TOTAL
92
tab 2 0 0 0 .13 0 17 0 2 2199 0 0 0 0 0 0 0 0 0 0-78 25 0 7 0 1 0 340 2 15 3909/ 1 4 2 0 0 0 57 2 a 74.85 0 0 0 0 0 0 2 0 0 2.31 1 0 0 0 0 0 1 0 0 218 0 0 0 0 0 O 0 0 0 019 0 0 0 0 0 0 0 0 0 0b3 4 0 0. 0 0 0 1 0 1 6-54 21 0 7 1 0 0 70 0 8" 10792 0 0 0 0 0 0 0 0 0 056 3 0 1 0 0 0 34 0 3 41.42 0 0 0 0 0 0 5 o s:., 0 572 0 0 0 0 0 0 0 0 0 075 0 . 0 0 0 0 0 3 0 0 355 a 0 1 0 0 1 63 0 3 7611 48 2 9 1 0 0 206 1 29 29646 0 0 0 0 0 0 0 0 0 014 2 0 3 0 0 0 25 0 1 3125 0 0 t 0 0 o 8 0 0 961 2 0 0 0 0 0 23 0 1 2671 0 0 0 0 0 o 1 0 0 1
68 43 0 15 3 0 0 206 0 13 28073 4 0 0 0 0 0 36 0 0 4091 o 0 0 0 0 0 0 0 0 0di 0. 0 0 0 0 0 12 0 0 1294 0 0' 0 0 0 0 0 0 0 045 0 0 0 0 0 0 0 0 0 013 1 . 0 0 0 0 1 16 0 2 2089 0 0 0 0 0 0 7 0 0 7
35 4 0 1 0 3 0 7 0 9 24SO 72 0 16 2 0 0 481 1 22 59481 0 0 0 0 0 0 0 0 0 , 044 0 0 1 1 0 0 37 0 0 3986 1 0 1 0 0 0 6 0 . 0 896 0 0 0 0 0 0 0 0 0 015 1 0 3 0 0 , 0 45 0 5 5423 0 0 0 0 0 0 n 0 0 011 /5 0 11 0 0 0 343 2 26 45762 0 0 0 0 0 0 0 0 0 064 15 0 6 1 1 0 165 1 7 19688 3 2 0 0 0 0 7 0 2 149 i 0 0 0 0 0 0 0 0 0 041 0 0 0 o, 0 0 0 0 0 02d95
470
0o
120
1
000
1
0373 .
01
021
'K1 o.. 456
027 3 0 6 0 0 0 234 1 7. 25169 1 0 0 0 0 0 6 0 0 7
84 () 0 0 0 0^ 0 0 0 0 098 v 0 0 0 0 0 0 0 0 0 0o0
1
3880a
1
1040
1005
03 2842
0
11
01185
7
1,556 93.

Table C-16
NIL PRAICAANS - 4PECLALIV AKLA TESTS - 1981 - 1984 NATIONALS ANI) SPECIALS COMBINED 16:50145 10/03/84 PAGE 258
SPL4.1A1 !Y. AREA LEST U9
IC CUUL
PE
BLACK
TOTAL PHYSICAL EDUCATION
CHICANO NATIVE A UR-ASIAN P. R. UTH HISP WHITE OTHER
ALAHAmA 66 26 0 4 0 0 1 92 2
ARILUNA 99 0 0 1 0 0 0 1 0
ARKANSAS 78 134 3 22 0 0 1 819 2
LAUF.CULORAJG
9185
130
30
100
3
02 ..o m
1
0193
0
60
CoNN. .11 0 0 0 0 0 0 0 0
OtLAARt 18 1 0 10 0 0 0 0
U.,uF L. 19 o 0.,
1 0 0 0 0 0
I-LuRIOA 63 2 0 1 0 1 0 6z 0
GEORGIA 54 63 a 14 0 o L 200 1
IDAHO 92 0 0 0 0 0 0 0 0
ILLINOISINUIANA
5642
a2
1
01,
l'
1
000
00 23
1
.0
10+A 12 0 0 0 0 0 0 0 0.?
KANSAS 75 0 0 0 0 o 0 1 0
KENTUCKY 55 9 0 3 0 0 0 I4T 1
LA. /1 110 3 13 0 0 5 685 2
MAINE 46c, 0 0 0 0 0 0 3 0
MAWVLANU 14 12 0 1 0 0 0 29 0
MASS. 25 0 0 0 0 o 0 7 0
MICHIGAN 61 14 0 1 0 0 0 22 0
MINN. 71 I 0 0 0 0 0 0 2 1
MISS. 08 117 0 18 1 0 1 318 1
MISSOURI 73 12 0 1 0 o 0 104 0
MONTANA 91 0 0 0 0 o 0 0 0
NE8RASKA 83 0 0 0 0 o 0 11 0
NEVADA 94 0 0 0 0 o 0 0. o
NEwstutmP 45 0 0 0 0 0..
-o 0 0
Nt+ JEhS 13 2 0 1 0 o 0 .. 29 1
NEw MEX. 89. 0 5 0 ' 0 o 3 18 0
NEW YORK 35 1 0 0 L 5 1 20 2
N. L. 50 198 1 20 1 1 2 763 3
N. O. ' 81 0 ' 0 0 0 o 0 o o
OHIO 44 2 0 1 0 o 0 105 , 0
OKLA., 06 0 0 3 0 o o. 10' 0
UREGCN 96 0 00
0 0 0 0 1 U.PENN. 15 8 0 1 0 0 0 83 / o i
.4. 1. 23 0 0 0 0 0 0 0 1 0 !
S. C. 11 184 0 23 0 1 4 526 6 .
S. U. U2 0 0 0 0 0 0 . 0 o .
TENN. 64 it 0 13 0 o 0 '" 283 0
TEXAS 88 26 1 4 0 0 0 22 0
UT Al' 93 0 0 0 0 o 0 1 0.
VERMONT 41 0 0 0 0 0 0 S 0
VIRGINIA 28 73 1 22 0 3 2 61T 2
KASHNON 9) 0 0 0 0 0 9. 1 0
WEST VA. 2r 34 0 10 t 0 0 474 0
KISCO/45N U 0 0 0 0 0 6 o '.
wYoMIN6 L4 0 0 0 0 o 0 0 , o
AK HI PPfmGNM1.3C
I 980
05.
C
0
0
4
00 10 0
01G
0
10,A1 0 1091 18 195 8 13 22 5675 3.1
660
I 6 114i
1 14O I3 95O 0
114 8580 0
23 3562 55
,...... 0. 1
0 '.551 7710 1
34 5580 60 0 (1..;
C, 0 /
lot ......
1 20577 76.30
F4STAT' 2.69
NO CODE
50
614b
TOTAL
130
10422277
0 00 , 00 2 D
0 1
1 1112 2910 . o3 39'1 41 .
0 , o0, 1
10 17076 8940 3
i
2 .- . 441
0- '7
5 29 -...1
.0 3 o4
33 4898 1250 01 12o n0 u
i 5 380 26T 43
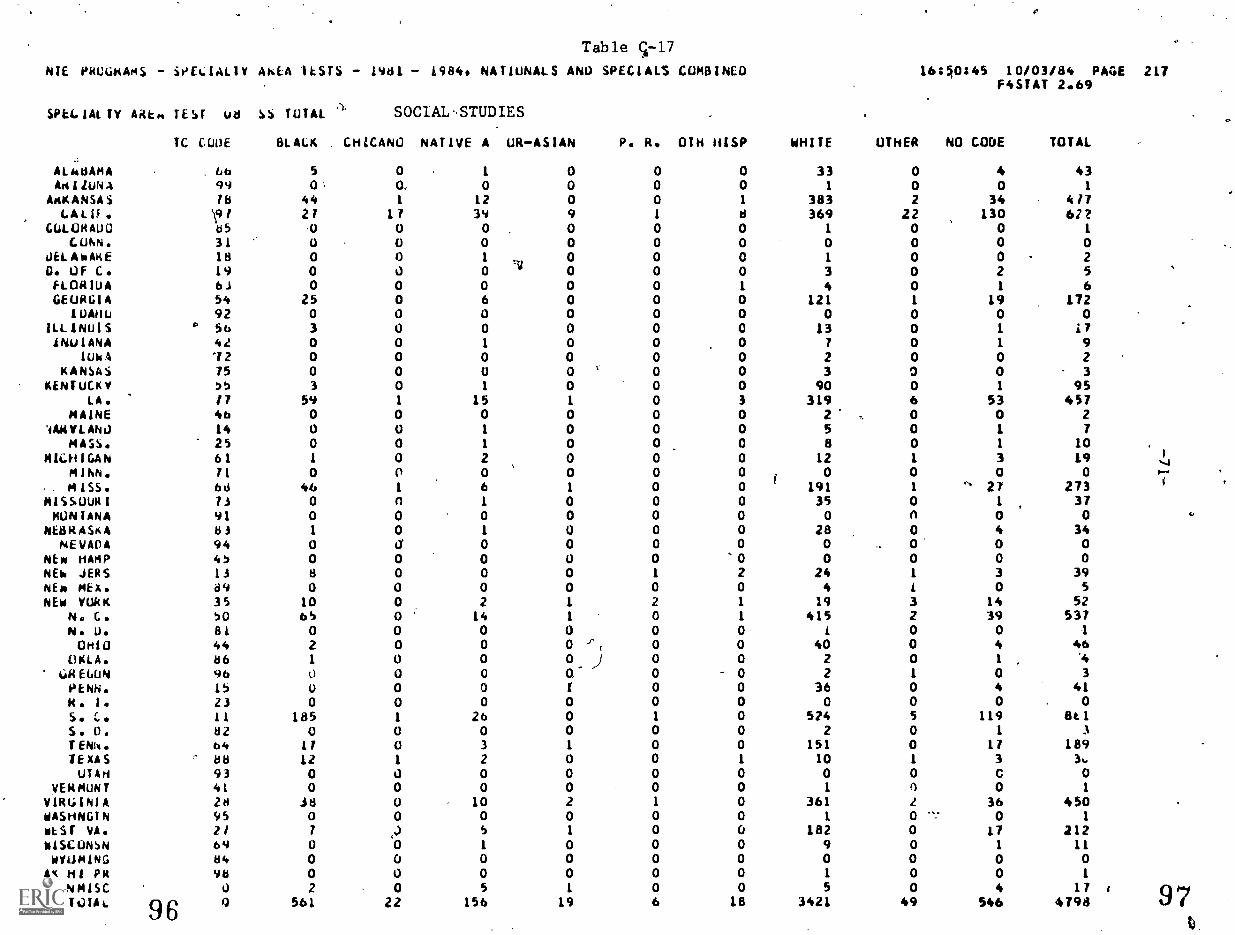
Table c-l7
NIE PROGsAmS - SOIL IALI ANEA 1 ESTS - 1981 - 1984 NATIONALS ANU SPECIALS COMBINED 16;p:45 10/03/84 PAGE 217F4STAT 2.69
SPELIA1 TY AMEN TEST ud SS TOTAL SOCIAL -STUDJES
TC COLE BLACK . CHICANO NATIVE A UR-ASIAN P. R. 0TH HISP WHITE OTHER NO CODE TOTAL
ALNUAMAAA I luN A
AAK ANSA S
LAL if .
COLORAU0CONN.
JELAwAmEO. OF C .FLOM IUAGEURGIA
I OAHU
ILL 1NUI S
1Nul ANAIUW A
KANSASKENTUCKY
.
LA.MAINE
IAWYLANOMASS.
$1011GANMINN.MISS.
MISSUUM IMONTANANtBRASKANEVADA
NE's HAMPNEw JERSNEW MEA.NEw YURI(
N. C.N. U.OHIOM.A.
' GR EGONPENN.M. 1 .
S. C.S.D.TENN.TEXASUTAH
VEKMuNTVIRGINIAWASHNONwESI VA.KISCONSNWYOMINGAK Hi PmFAGNMISC
TAL 96
Lib 5 0 1 0 0 0 33 0 4 4399 0' 0, 0 0 0 0 1 0 0 1
18 44 1 12 0 0 1 383 2 34 4 77
\91 21 17 39 9 1 8 369 22 130 622u5 0 0 0 0 0 0 1 0 0 1
31 0 0 0 0 0 0 0 0 0 018 0 0 1 0 0 0 1 0 0 219 0 0 0 111 0 0 0 3 0 2 56.1 0 0 0 0 0 1 4 0 1 654 25 0 6 0 0 0 121 1 19 17292 0 0 0 0 0 0 0 0 0 0
0 56 3 0 0 0 0 0 13 0 1 1742 0 0 1 0 0 0 7 0 1 972 0 0 0 0 0 0 2 0 0 275 0 0 0 0 , 0 0 3 0 0 3
55 3 0 1 0 0 0 90 0 1 9517 59 1 15 1 0 3 319 6 53 45746 0 0 0 0 0 0 2 , 0 0 2
14 0 0 1 0 0 0 5 0 1 7
25 0 0 1 0 0 0 8 0 1 1061 1 0 2 0 0 0 12 1 3 1971 0 0 0 0 0 0 0 0 0 0
ibd 46 1 6 1 0 0 191 1 ''' 27 27373 0 n 1 0 0 0 35 0 1 3791 0 0 0 0 0 0 0 n 0 083 1 0 1 0 0 0 28 0 4 3494 0 a 0 0 0 0 0 0. 0 045 0 0 0 0 0 0 0 0 0 0
13 a 0 0 0 1 2 24 1 3 39d9 0 0 0 0 0 0 4 1 0 5
35 10 0 2 1 2 1 19 3 14 5250 bh 0 14 1 0 1 415 2 39 53781 0 0 0 0 0 0 1 0 0 1
44 2 0 0 0 P ( 0 0 40 0 4 4686 1 0 0 0 ) 0 0 2 0 1 '4
96 0 0 0 0- 0 0 2 1 0 3
15 0 0 0 1 0 0 36 0 4 4123 0 0 0 0 0 0 0 0 0 0
11 185 1 26 0 1 0 524 5 119 8E182 0 0 0 0 0 0 2 0 1 3
64 11 0 3 1 0 0 151 0 17 189dd 12 1 2 0 0 1 10 1 3 3..
93 0 0 0 0 0 0 0 0 C 041 0 0 0 0 0 0 1 0 0 1
28 38 0 10 2 1 0 361 2 36 45095 0 0 0 0 0 0 1 0 -: 0 1
21 7 0 5 1 0 0 182 0 17 21269 0 0 1 0 0 0 9 0 1 11
84 0 0 0 0 0 0 0 0 0 098 0 0 0 0 0 0 1 0 0 1
0 2 0 5 1 0 0 5
34210 4 17 1
TQ0 561 22 156 19 6 18 49 546 4798

Table C-18 /
NIE PR64AAMS SPECIALLY AREA TESTS 1981 1984, NATIUNALS ANU SPECIALS COMB1NEU1,
SPECIALTY AREA TEST 19 SPA IUTAL SPANISH
ALABAMAAK1iONA
ARKANSASCALIF.
COLURADOLUNN.
DELAWAREO. ul- C.FLORIDAGEOmulA
luAMU11.1.1NUIS
INDIANAIOWA
KANSASKENTUCKY
LA.MAINE
MARYLAND
16250245 10/03/84 PAGE 359F4STAT 2.69
U. GUDE BLACK CHICANO NATIVE A Uk ASIAN P. R. 0TH HISP WHITE OTHER NO CODEow
TOTAL
66 0 0 0 0 0 1 1 0 o 2
99 0 0 0 0 0 0 0 0 . 1 1
Its 2 1 2 0 1 3 34 0 3 46
9/ 2 25 3 2 5 28 72 ' 1 24 161
85 0 0 0 0 0 0 0 0 0 0
31 0 0 0 0 0 0 0 0 0 0
18 0 0 0 0 0 0 0 0 0 0
19 0 0 0 0 0 0 0 0 0 0
63 0 0 0 0 0 0 0 0 0 0
54 0 0 0 0 2, 2 10
_o 0 14
92 0 0 0 0 0 0 0 0 _0 0
So 1 0 1 0 0 0 2 0 1 5
4272
00
1, 00
00
00
00
00
00
00
00
00
75 0 0 0 0 0 0 0 0 0 0
55 0 0 0 0 0 0 2 0 1 3
17 J 0 0 0 2 4 22 0 3 34
46 0 0 0 0 0 0 0 0 0 0
14 0 0 0 t 0 I 13 O 2 17
25 ,
6100
00
00
00
1
00.0
21
00
00
3
1 I.4
71 0 0. 0 0 0 0 0 0 0 0 n)
68 0 0 0 0 0 3 12 0 2 17
73 0 0 0 0 0 0 0 0 0 0
91 0 0 0 0 0 0 0 0 0 0
83 0 0 0 0 0 0 4 0 0 4
9445
00
00
00
00
00
00
00
00
00
00
!3 1 0 0 0 3 6 4 0 6 20
ti 9 0 0 0 0 0 1 1 0 0 2
35 1 2 1 2 68 28 7 2 27 138
5 0 0 1 2 3 2 11 54. ( 1 4 78
81 U 0 0 0 0 0 0 ._.1 0 0
44 0 0 0 "0 0 1 2 0 1 4
86 0 0 0 0 0 0 0 0 0 0
96 0 0 0 0 0 0 0 0 0 0
!S 0 0 0 0 0 0 10 1 1 12
23 0 0 0 0 0 0 0 0 0 - o
1 0 1 0 3 5 53 . 0 6 69
82 0 0 0 0 0 0 1 0 6 1
64 2 0 0 0 I 1 13 0 0 17
88 1 0 0 0 0 0 1 0 2 4
9J 0 0 '0 0 , 0 0 0 0 0 0
41 0 0 0 0 0 0 0 0 0 0
2d 0 2 1 0 1 6 44 0 2 56
95 0 0 0 0 0 0 0 0 0 0
2/ 0 U 0 0 1 0 9 0 0 10
69 0 0 0 0 0 0 0 0 0 0
84 0 0 0 a 0 0 0 0 0 0
9d 0 0 0 2 0 0 0 ft 0 3
0 0 0 0 0 1 0 0 0 0 1
0 14 31 12 8 93 101 374 5 65 723 00
MASS.MICHIGAN
MINN.M; SS.
MISSOUR IAuNTANANEBRASKANEVADA
NEW HAMPNEW JEASNEW REA.NE.1 YORK
N. C.N. U.OHIO
OKLA.GMEGUNPENN.R. 1.S. 11
'-S. U.TENN.TEXASUTAH
VERMONTV1ACINIAWASHNGTNWESI VA.wISCONSNWYOMINGAKIIPRFRGNMISt.
TOTAL9 ...J

Table C-19tat OROURAMS SPELIALTP AREA TESTS - 1981 - 1984, NATIONALS AND SPECIALS COMBINED
SPECIALTY AkkA TEST
IC I.
ALABAMAARILLANA
ARKANSASCALIF.
COLORADbCUNN.
UELAwAktD. Of L.FLUAIOAGEUkulA
luAHUILLINOISINDIANA
IOWAKANSAS
KENTUCKYLA.
MAINEMARYLAND
MASS.MICH1GAN
MINN.MISS.
MISSUUkIMUNTANA
NEBRASKANEVAuA
NEW HAMPNEW JENSNkw MEX.NEw YORK
N. C.U. O.OHMOKLA.
00LGUNPENN.R. I.S. 11S. U.TENN.TEXAS ,
UTAHVERMUNT
VIRGINIAUASHNUINWEST VA.
16350:15 10/03/84 PAGE 449
34''AUU TOTAL
BLACK
AUDIOLOGY
CHICANU NATIVE. A
iC
OR-ASIAN
6
P. R. OTH UISP WHITE QiHER
F4STAT
NO CODE
2.69
TOTAL
66 0 0, 0 0 0 0 29 2 3 3449 0 f) 0 0 0 0_ 26 d 1 2770 0 0 0 0 4 4 13 0 1 1491 3 1 1 9 0 1 127 ,
1 18 161U5' 0 1 2 2 0 - 1 54 0 3 6331 1 0 1 0 i 0 0 13 0 0 ISId 0 0 0 0 0 0 0 0 0 014 3 0 0 0 0 0 7 0 4 146354
21
00
1
021
00
1
1
7130
1
0 1
3
08133
42 0 0 1 0 0 0 0 0 0 1
56 6 0 1 0 1 1 107 3 ? 13 13242 0 0 1 1 0 0 S2 0 5 5972 0 0 1 1 0 1 28 0 3 3475 .0 0 0 1 0 0 19 0 1 2155 0 0 0 0 0 1 13 0 1 1577 1 0 0 0 0 0 32 0 2 3546 0 0 0 0 0 0 1 0 0 . 1
14 2 0 0 0 0 0 31 2 4 3925 2 0 2 0 0 0 33 1 3 4161 2 0 1 1 0 0
%68 1 8 81
71 0 0 0 0 C 0 18 1 1 2068 3 0 0 0 0 0 17 0 6 2673 3 0 1 1 0 0 51 0 1 5791 0 0 1 0 0 0 10 0 1 1283 0 0 0 0 0 0 14 0 2 1694 0 0 0 0 0 0 2 0 0 245 0 0 0 C 0 0 3 0 0 313 2 0 1 2 0 0 58 0 9 7289 0 0 1 0 0 0 11 0 I. 1335 4 0 1 2 1 3 97 1 25 13450 1 0 0 0 0 0 25 0 4 3081 0 0 0 0 1 0 7 0 1 94.. 3 0 1 1 0 0 107 3 11 12686 0 0 1 0 0 0 14 0 2 1r96 0 0 0 0 0 0 13. 0 0 1315 4 0 1 0 0 1 100 0 12 11823 0 0 0 0 0 0 4 0 0 4
4 0 0 0 0 0 12 0 4 2082 0 0 0 0 0 0 ''' 6 0 I 7
64 1 0 1 4 0 0 50 2 5 6388, 4 2 2 0 0 0 87 3 4 10293 0 0 0 2 0 0 28 0 3 3341 0 0 1 0 0 0 12 0 0 1328 2 0 0 0 0 - 0 65 0 4 ,7I95 1 0 0 0 0 0 40 1 3 4521 0 0
. 0 0 0 0 30 0 0 3069 0 0 0 0 0 0 33 0 4 3784 0 0 i 0 0 u 3 0 0 498 0 0 1 2 0 0 2 0 1 60 0 0 0 1 0 0 14 3 2 200 55 4 26 33 3 11 1681 25 180 2024
WISCUNSNWYUMINO
AK HI PMFRONMISC
IUTAL
100
C.
.101

Table C-20
NtE PROGRAMS - SPECIALTY AREA TESTS - 1981 - 1984c NATIONALS4NO SPECIALS COMBINED
SPECIALTY AREA TEST 41 EAS IUTAL EDUCATIONAL ADMINISTRATION AND SUPERVISION
ALABAMAARIZONA
ARKANSASCALIF.
CULUM ADOCUNN.
VELAR/414EO. OF C.FLum10AGEURGIA
IJAHOILLINOIS-INDIANA
IOWAKANSAS
KENTUCKYLA.
MAINEMARYLAND
MASS.MICHIGAN
MINN.MISS.
MISSOURIMONTANA
tft8RASKANEVADA
NEW HAM!,NEW JERSNEW MEX.NEW YORK
N. C.N. U.OHIOOKLA.
URECONPENN.A. 1.
S. C.S. O.TENN.TEXASUTAH
VERMUNIVIRUINIAWASHNGINWEST VA.wIJCONSNwyUMING
AK HI PitFRGNMISC
TUTU I
16150145 10/03/84 PAGE 488F4STAT 2.69
TC CODE BLACK CHICANO NATIVE A UR-ASIAN P. R. 0TH HISP WHITE OTHER NO CODE TOTAL
66 3 0 . 0 . 0 0 0 5 0 0 8
99 0 0 0 0 0 0 0 0 0 0
78 56 1 10 0 0 0 429 0 41 537
91 64 4 2 10 0 3 95 0 45 223
85 0 0 0 0 0 0 1 o 0 1
31 0 o I a 0 0 9' 0 2 12
18 0 0 0 0 0 0 0 0 0
19 10 0 (1 1 0 0 2 0 2 16
63 0 0 '0 0 0 .0 0 0 0 0
54 14 0 5 0 0 0 98 0 23 140
92 0 0 0 0 0 0 0 0 0 0
56 19 1 0 1 0 0 73 0 3 97
42 1 0 0 0 0 0 9 0 0 1!"
12 0 0 0 0 0 0 0 0 0 0
75 0 0 0 0 0 0 0 0 0 0
55 0 0 0 0 0 0 1 0 0 1
71 80 0° 10 0 0 3 150 0 40 283
46 0 0 0 0 0 0 0 0 0 0
14 307 0 31 2 0 0 261 2 116 719
25 6 0 0 0 0 0 97 0 13 116
61 33° 0 4 0 I 0 0 6 0 604 544
71 0 0 0 0 0 0 0 0 0 0
68 21 0 1 1 0 0 36 0 4 63
73 0 0 -0 0 0 0 9 0,
0 9
91 0 0 0 0 0 0 2 0 0 2
83 0 0 0 0 0 0 0 00 0 t.
94 12 1 0 0 0 2 22 o s *VAftiL
45 0 0 0 0 0 0 0 0 0 0
13 Z3 0 I 0 4 2 107 0 SO 187
8i 0 3 C 0 0 1 7 1 1 13
35 2 0 0 0 1 0 4 0 1 .. 8
50 6 0 0 0 0 0 9 0 3 1.8
81 0 0 0 0 0 0 0 0 0 0
44 0 0 0 0 0 0 0 0 0 0
86 16 0 0 0 0 0 IC 0 0_ '34
96 0 0 0 0 0 0 0 0 1 1
15 0 0 1 0 0 0 0 0 0 1
23 4 0 0 o 0 0 42 0 7 53
11 37 0 3 0 0 0 164 1 IS 220
82 0 0 0 0 0 0 0 0 0 0
64 36 0 0 0 0(,%
30 0 § TS
88 104 44 4 0 1
2117 3 14 293
93 0 0 0 0 0 0 0 0 0 . 0
41 0 0 0 O. 0 0 0 0 0 0
28 0 0 0 0 0 0 16 0 1 17
95 0 0 0 0 0 0 - 0 0 0 0
27 0 0 0 0 0 0 4 0 0 4
69 25 1 0 0 3 3 48 1 10 91
84 0 0 0 o 0 0 1 0 0 1
98 0 0 0 0 0 0 0 0 0 0
0 3 1 2 J 0 0 1 0 2 9 s
0 882 58 74 16 9 18 1873 8 1012 3948

NIL PAOuttANS - SPECIALTY AREA TESTS - 1%1 - 19849.NAT1pNACS ANU SPECIALS COMBINED 16550:45 10/03/84 PAGE 498
ALABAMAAKIZUNA
ARKANSASCALIF. '
CUL.UKAUU.CUNN.
OELAwAXFu. Uf C.IFLUA10AGEUKGIA
IOAHU1LLINGISINUIANA
IONAKANSAS
KENTUCKYLA.
MAINEMAN LAND
MASS.MICHIGAN
MISS.MISSUUk1MUNfANA
MESKASKANEVADA'
NEW. HAM'NEW JEWShkw MEX.NEW YORK
N. C.N. 0.CHICOKLA.
GAE6UNPENN.K. 1.S. C.S. D.TENN.TEXASUTAH
VERMONTVIAGINIAWASHNONWEST VA.WISCUNS4WYJMIN6
AK HI PAIFKG4NMISC
fUTAL
SPLL1ALTY AMEA fEST 42 GC TUTAL GUIDANCE COUNSELORC
IC CURE 81ALK CHICANO NAME A 0A-ASIAN P. R. UTH HISP WHITE OTHER
66 O. 0 0 1.....
0.
o(4
0 2 099 0 U 0 0 0 0 0 0Id 21 0 .8 1 0 0 175 2.91 / 0 0 0 0 1 3 005 0 0 0 0 0 0 0 031 1 0 0 0 0 0 16 018 0 0 0 b 0 0 0 019 0 0 0 o 0 0 0 o63 1 0 0 0 0 0 0 054 4 0 1 0 0 0 22 .. 092 0 0 ( 0 0 0 0 0 056 0 0 L. 0 o, 0 - 0 042 0 0 P
0 0 0 0 0 .. o12 0 , 0 0 o 0 0 0 015 0 0 0 4-0 0 0 0 055 0 0 0 0 0 0 0 077 1 0 1 U 0 0 13 1
46 0 0 0 0 0 0 0 014 .. ii
0 0 0. 0 0 a 025- 40 0, 0 0 0 0 0 061 0 0 0 0 0 0 ' 1 071 0 0 0 0 0 ,0 ' 0 068 6 6 1 0 0 0 8 013 0 U 0 0 0 0 1 091 0 0 0 0 0 0 0 083 0 0 0 0 0 0 1 094 0 0 0 0 0 0 0 045 0 0 0 0 0 0 0 013 0 0 0 0 0 0 1 089 . 1 5 1 0 0 1 4 1
35 7 0 3 0 0 0 13 0SO 61 0 2 0 1 2 103 1
81 e? 0 0 , 0 0 0 0 0 044 0 0 0 0 0 0 0 0d6 0 0 0 0 0 0 0 ' 0
90 0 0 0 0 0 0 0 015 0 0 0 0 0 0 3 1
23 0 0 0 0 0 0 0 o11 16 0 a o 1 o 10 082 0 0 0 0 0 0 0 064 b 0 0 0 0 0 7 088 2 3 , 0 0 0 0 12 093 0 0 0 0 0 0 0 041 0 0 0 0 0 0 0 02d' 8 0 : 0 0 1 38 095 0 0 0 0 0 0 0 02-1 '0 0 0 0 0 0 4 069 0 0 0 0 0 0 0 0
O''84 0 0 0 0 0 0 098 0 0 0 0 0 0 0 0
O 0 0 0 0 0 0 1 0u 143 8 18 1 2 S 446 6
104
.
F4STAT 2.69
NO CORE TOTAL
it 30 0
17 2241 60 07 24
,
0 00 00 1
9 , 360 01 1
0 0o ,,, 00 0.0 0'
6 280 o ,
1 100 00 1 1
-.10 .A 0 til3 18 4
0 1
0 00 30 no 02 3
0 137 -10 .
23 1930 01 1
1 1
0 00 40 0
12 39
0 01 143 200 00 02 500 01 S0 00 00 0 105.1 2
100-4-
729.,.

L. row%
Table C-22
MTh PRWRAMS SPECIALTY AREA TESTS 19$1 ..-.19114,-NATIONALS ANO SPECIALS COMBINED 161501.115 10/03/04 PAGE 385F4STAT 2:69 .
SPECIALTY AREA TEST 30 AS TOTAL
4AM/1MAAAILUNA
,AAMANSASCALIF.
tilLUMA01GUNN.
UELAWAwEO. OF C.FL4R1UA
) GEORGIAWAHL)
ILLINUISINDIANA
14wA
Kt TUCKYLA.
NAIPHARYLAND
MASS.NICHIGAN
MINN.MISS.
missugolMUNTANA
NalwASKANEVADA
NEW RAMPNEW JERSNEW MEX.NEw YORK
;4.. C.
N. 0.OHIOUKLA.MECUM?EhN.-Ii 1.S. C.S. U.TENN.TEXASUTAH
VERMONTVIAGINIAWASI(NGT NWES1 VA.WISCONSNWILMING
AK HI PIFAGNMISC
TOTALI
READING SPECIALIST40
...
TC CODE BLACK .CHICAO KAT1VE A 0R -ASIAN P. R. 0TH AiSP ,:.L.
66 0 0 0 0 0 , 0
99 O. 0 0 0 0 0
78 29 '0 4 0 0 0
97 6 5 1 3 0 1
85 0 0 0 0 0 0
31. 0 0 0 0 0 0
18 0 0. 0 0 0 0
19 1 0 0 0 0 0
b."I41
0 0 0 0 0 0
54 1 o 0 0 0 0
92 0 0 0 0 0 0
56 0 o A 0 A0 042 0 0 0 0' 0 0
72 0 ; 0 0 0 0 0
75 0 0 0 0 0. 0
55 0 0 0. 0 . 0 0
71' 0 0 0 0 0 0
46 0 0 0 0 0 0
14) 0 0 0 0 0 0
25.
1 0 0 0 0 0
61 O. 0 0 0 0 0
71- 0,0 0 0 0 0
48 2 0 0 ' 0 0 0
73 0 C 0 '0 0 ' 0
91 0 0 0 0 0 0
d3 0 0 0 0 ' 0 0
94 0 0 0 0 0 0-
45 '0 0 0 0 0 0
13 0 0 0 0 0 0
89 0 0 0 0 0 0
35 5 0 ' (3 0 1 1
501
2 0 0 1 0 0
81 0 0 0 0 0 0
44 0 0 0 0 0 0
Ow ., 0 0 0 0 0 0
96 0 0 0 U 0 0
15 0 p 0 0 0 0
23 0 0 0 0 0 0
11 i 0 0 0 0 0Si
0
82 0 0 0 0 0 , 0
64 1 0 0 0 0 0
B8 1 0 0 0 0 0
93 0 0 0 0 0 0
41 d 0 0 . 0 0 0
28 1 1 0 0 0 0
95 0 0 0 Co 0 0
21 0 0 0 0 0 0
69 0 0 1 0 0 0
84 0 0 0 0 0 0
iiti 0 0 n 0 0 0b 0 0 0 u 0 0 0
0 50 6 9 4 1 2
WHITE OTHER NO CODE . TOTAL1 . i
4 0 -.1 0 I 4 - ,
O 0 0 0159 1 16 , 209
....
99 3 17 135 ,
O 0 1 o 0 s.0 - 0 ...
O o , 0 , oO 0 o 1 ,
4 4 0, 0 . 415 1 6 23
O o . 0 ' 0O - 0 2 2 )0 V 0 0 0 a
O 0 0 0O 0 0 - 0
..-1 0 0
.21F
I.10 0 0 .2 0 , 0O 0 .% 0s 0 2,2 0 . 0
2 0 2
1 0.O 0' ' 02 0 0o 0 0O o . '07 6 0I 0- 0
34 2 17
21 0 3
o 0 01 0 0O 0 0O 0 0
...
44 0 4
O 0 51 1 1
O 0 04 0 1
4 0 0O 0 0I 0 0
53 0 1
O 0 03 0 1
1 0O 0o . 0 01 1 0
482 9 77 .
.
10 ,20 4
8 , 1.-.2 .
41
.
r, c,6 't
102 ..
0071
6327
01
o0
4853
0650I
5603 ,
00 1 fl 72 ...)
640

NTE PAUJRAHS SPLCIALIV AkiA TESIS 1981
SPELLALIV AREA TEST 33 SLP TUIAL
TC CUOt BLACK CHICANO
1984, NATIONALS ANO SPECIALS COMBINED
SPEECHLANGUAGE PATHOLOGY
NATIVE A ORASIAN P. k. 0114 HISPce
WHITE
16:50:45 10/03/84F4STAT 2.69
OTHER NO CODE TOTAL
PAGE 443
ALAUAMA 66 0 0 1 0 0 0 76 0 3 86Ai ILuNA 99 2. 5 3 z 0 0 . 91 0 7 110
ANK4NSAs 78 1 0 0 0 0 2 115 0 4 128CALIF. 91 21 23 16 46 3 15 878 20 121
IlfilCULukAOU 86 2 0 2 1 0 r ,4 145 2 7LUNN. 31 5 0 3 0 0 0 102 1 9 120
DELANAKE Id 0 0 1 0 0 0 2 0 1 40. OF C. 19 11 0 1 ... 1 0 3 11 0 7 34FLURIDA 63 12 0 3 1 1 5 175 0 20 217GEuRGIA 54 .8 1 2 0 0 1 181 1 15 229NANO 92 0 .0 0 0 0 0 . 4 0 0 4
ILLINOIS 56 30 3 3 5 1 3 428 4 43 S20INUIANw 42 3 0 2 0 0 1 147 1 8 162
IOWA 72 1 1 0 2 0 0 95 0 2 101KO0SAS 75 0 0 1 0 0 0 109 0 112
KENTUCKY 55 5 0 3 1 0 0 107 0..
122LA. 77 21 0 3 0 1 0 142 1 12 180
MAINE 46 0 1 0 0 0 0 34 0 4 39HAKVLANU 14 15 0 3 1 0 1 122 0 18 i 160 /1
MASS. 25 2 0 5 t 0 2 262 1 43 / 316MICHIGAN 61 6 2 2 0 I ....- 0 277 0 24 312 .4
MINN. 71 1 1 3 0 0 s 0 171 0 7 183 .4
MISS. 68 4 0 1 1 0 %\ 0 52 0 13 71MISSUUx1 /3 14 0 6 1 2 ? 2 254 0 20 299MuNTANA 91 0 0 0 0 0 0 24 0 1 25
NEBRASKA 83 2 0 0 0 0 1 98 0 1 102NEVADA 94 0 0 1 0 0 0 6 0 0 .
.
NEw VAMP 45 0 0 0 0 0 0 14 0 0 14NEW JEki 13 10 0 4 3 1 4 309 2 41 374NEW MEX. 89 3 9 2 0 0 6 71 1' 9 54NEN VOKK 35 .4 1 9 5 7 7 755 7 139 954
N. L. 50 15 0 2 4 1 1 1415 1 16 205M.D.(AMC
8144
,
800
i 24
04
00
02
9/344
04
5
22104388
LIKLA. 86 2 0 2 0 0 0 91 0 6 407OREGON 96 , 1 2 0 0 0 94 1 10 109PENN. 15 6 0 4 0 2 0 391 0 21 430d 10. 23 0 0 0 0 0 0 38 0 2 40S.C. 11 29 0 2 0 0 0 51 S IS 102S. D. d2 0 0 0 0 'II 0 29 0 1 30fLNN. 64 6 0 2 0 0 0 121 2 6 137TEXAS 88 10 17 9 1' & 8 324 1 21 393UTAH 93 a, 0 1. 2 0 1 70 2 3 79
VEMMUNT 41 0 0 1 0 0 0 36 0 4 41VIOWINIA 28 15 1 1 0 0 0 173 1 IS 206wASW4GTN, 95 0 1 1 4 0 0 1,06 3 IJ 173WEST VA. 27 1 1 0 0 0 0 89 1 2 94WISCUNSN 69 1 0 G 1 0 1 282 1 14 300kIWAING: 84 0 0 0 0 0 0 6 0 0 6
AK HI ett 98 0 0 1 17 1 0 28 1 2 50FAGNMISC 0 1 0 5 1 0 A 62 4 12 86' lurAL 0 327 68 119 105 23 71 7900 68 788 9469
108 . 1 (1 0:1

b.
-79-
Table D
Number of Test-takers and Mean Scores
Core Battery, 1982-84
Communication Skills
Mean SD
°General Knowledge
N % Mean SD
Professional Knowledge
N % Mean SD
White 36,353 78.0 662 11 39,759 75.6. 659 12 38,668 78.8 659 .11
Black 5,607 12,,0 643 12 6,991 13.3 639 11 5.665 11.5 641 13
Hispanic 1,001 2.1 651 14 1,317 2.5. 650 13 990 2.0 650 13
Other 851 1.8 654 15 1,111. 2.1 654 15 872 1.8 653 15
No Code 2,800 6.0 652 15 3,399 6.5 649 16 2,901 ,5.9. 651 15
Total 46,612. 99.9 659 13 52,577 100.0 655 14 49,096 100.0 656 13
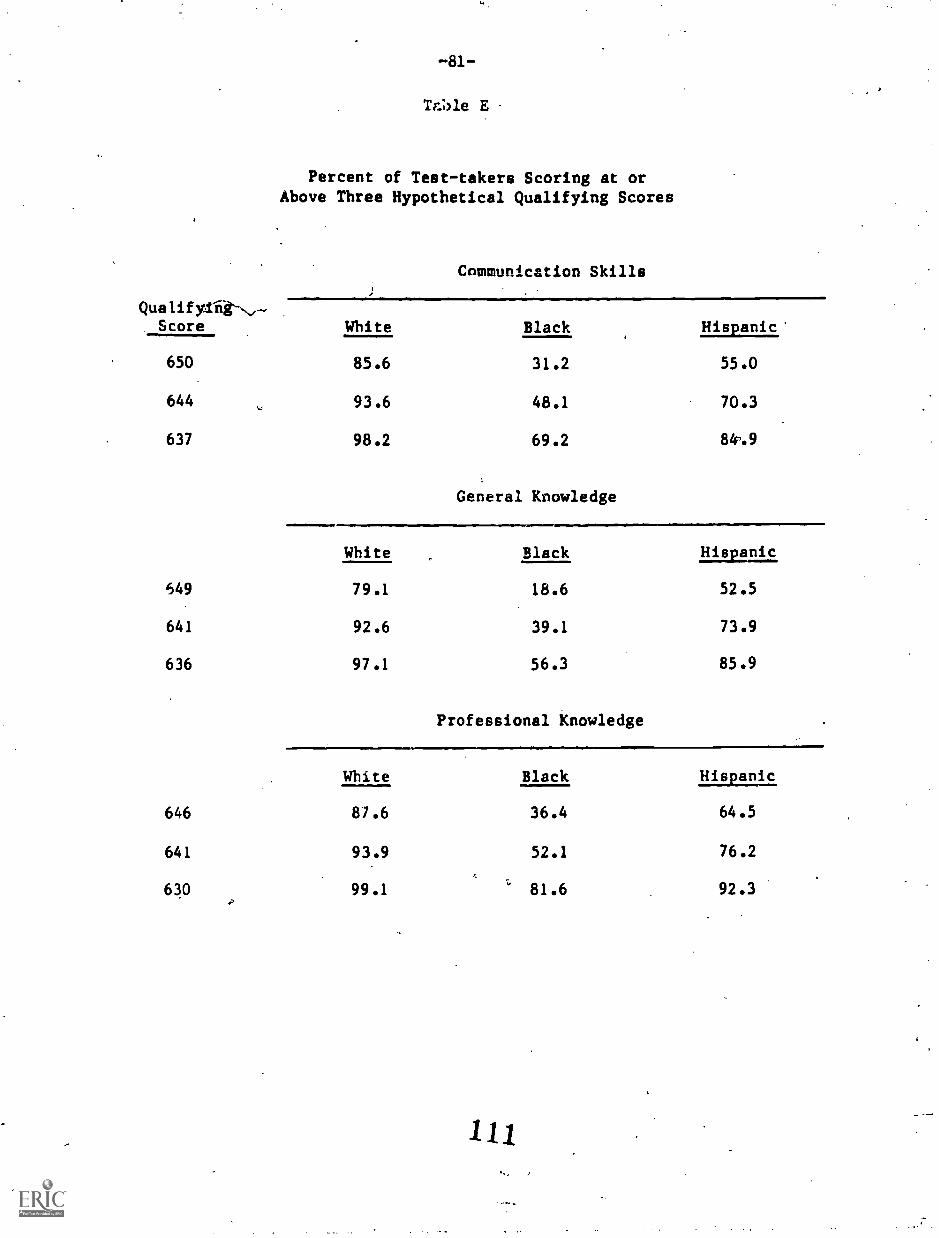
-81-
Teale E
Percent of Test-takers Scoring at orAbove Three Hypothetical Qualifying Scores
Qualify
Communication Skills
Score White Black Hispanic:
650 85.6 31.2 55.0
644 93.6 48.1 70.3
637 98.2 69.2 81e.9
General Knowledge
White Black Hispanic
549 79.1 18.6 52.5
641 92.6 39.1 73.9
636 97.1 56.3 85.9
Professional Knowledge
White Black Hispanic
646 87.6 36.4 64.5
641 93.9 52.1 76.2
630 99.1 81.6 92.3
111