Embed Size (px)
Citation preview

ED 416 890,
AUTHOR e
TITLEINSTITUTION \
PUB DATENOTE
?e
EDR5 PRICEDESCRIPTORS
- :
LDENT1FIERS
a
DOCUMENT RESUME
SE 037.812
Crowley, MichaelF.;*And OthersWomen' and Minorities' in Science and Engineering.National Science Foundation, OTshington,.D.C. Div. OfScience Resouices Studies.Jan .82163p.
4
MF01/PC07 Plus Postage.' .
College Science; EMployed Women;"*EmploymentPatterns;\*Engineering; Engineering Education';*Engineers;.*Females; Higher Education;.*MinorityGrodPs; NatuKal Sciences P?ofessiorial Education;Professional Recognition; Racial Differences; ScienceEducation; *Scientists; Secondary Education; SexDifferences; Social SciencesNational Science Foundafion
ABSTRACTCongress, as part dUthe Fiscal Year 1981 National
, Science Foundation Authorization Act (Public Caw 96-516), called forthe Director of the National\Scfence Foundation, to transmit to theCorwress and certain Federal agencies a biennial statistical reporton the participation of women and midorities in science andengineering employment and training. This-report responds to the,Congressional directive. Chapter 1, a descriptive overview of theparticipation of nhen4and minorities in 'the natural and' socialsciences and engifibering, highlights,differekes in, employmentpattern's hotween women and,men and between whites and racial
Chaptfir 2 reviews a series of indicators, suck asunemployment rates and,salary,diffeFentials, to assess relative labor
. market conditions for scientists and engineers. Chapter 3 examines'. the acquisition of esciehce'and engineering°4S/E),skills'. Data are
pregented-on the number and kopottion of women and minoritiesearning S7E-degrees add on," the acquisition of mathematici andscientific,skills by womeh and racial minorities prior to college-.'entry. Statistics indicate that although employment of female andminority scientists and, engineers increased between 1974 and 1978,women and blaCks are still, underrepresented than males and whites.respectively. (AuthoWDC) °
.1
° 41
0
0.
*********it***,C************4t************************If******************'Reproductions supplied by EDRS are the best that' can be made
* 0from the or dodument. *-
***********;**********************************************************
'a

N4,
4..
-Foreword1
The human resources of this country constitute one of its-most important assetsr Thisis especially true of individuals with science and engineering skills, who expand thefrontiers of knowledge, cleyelop nejv techpologies, and teach future generations. Theimportance of these activities makes it essential that the best tarent be drawn to science andepgjneering actiyityfrbm every available pool.
Women and members of minority groups traditionally have had low rates of partic-.ipation in science and engineering;, this, has been a cause for concern.
A, clear factttal pictutT of tilfe current situation and recent trends in participation is animportant .prerequisite to ratitnal and effective policy formulation. The 1981 NationalScience Foundation Authorization Act (Public Law`96,516) calls for the Directoi of theNational Science Foundation to transmit to Congrgs and selected Government officials abiennial statistical report on the pa-rticipation of women and minorities in science andengineering employment and training.
I am pteased to be submitting the first volume of this series. This report is unique in itscomprehensivenessboth in scope, and in data sources used. I am especially gratified bythe extensive amount of data that we have been able to bring to bear on these issues. It
,indicates that we have a substantial amount of statistical capability for identifying theproblems and for providing clues to their origin.,
The report confirms that the level of participation of women and of_several racial andethnic minorities in science and engineering is low. It also suggests that the problems of lowparticipation may be related to the extent to which these groups participate in math andscience training at all school levels precollege,, college, and pokgraduate. This fact andothers presented in this report will provide a sound basis for informed debate andconstructive development of policies and programs to assure full use of the Nation'sresources in scienceand engineering.
I welcome your criticism andsugg4tions for this new endeavor. We hope that thisand futu4e volumes will provide information needed by the Congress and others concernedwith the vitality of U.S. science and technology and with the furtherance of equalopporlunity for women and minorities in science and engineering;
-"..
Ole .
k
ti
JOHN B. SLAUGHTERDirectorNational Science Foundation

4
,.
e
. ..-
..5,..
e . ...
s
fi
r
Is
It
V
s
t.
4
C
,
s
t
.
1
1 tAcknoviedginents .v.
This report was developed within the Div)sion of Sctence Resources Studies by.Michael F. Crowley, Senior Staff Associate for Methods. and Analysis, ScientifiC andTechnical Personnel Studies Section (STPSS), with the assistance or Melissa J. Lane.Significant contributions to the overall development of 'the reptirt were provided byNancy-M. Conlon (STPSS). Barbara G, Lucas of the Directoratedf Scientific, Technolog-
ical and Ititernational Affairs assisted in the drafting of the relior.3. John A. Scopinoprovided technical assistance. The report also benefited from useful comments providedby external fevievvers and the National Science Foundation's Committee on Equal °Ivor-
,tuniti8 in science and Technology.
Supervision, review, and guidance were provided by: Alan FechteroHead, Scientific
and Technical Persdhnel Studies' Section; Charles E. Falk, Director, Division of SCience°Resources Studies; and Harvey Aveich, Assistant Director of NSF for Scientific, Techno,
...logical and International Affairs,
$
..
t . )
r
4
if
ss
t
.
,"4
I:
Na4
. e
4
.Y.-...vak
.
e . r 15..
.

. .
.
' s ,
p
1
ContentsI
1*.
Page
EXectitive Summary
sIntroduction 't 4 ix-.'
Chapter 1.I-
.
EMPLOYMENT OF WOMEN AND MINORITIES INSCIENCE AND ENGINEERING ,
Women iri Science and EngineeringEmployment Levels an TrendsField ,
Work Activities and Se or of Employtnent .
Minority Women in Science and EngineeringEmployment Levels and Trends , . .
v Field °
Racial Minorities in Science-and Engineering'
. 1
1
1
2z88
-10
10Employment Levels arid Tr di , . 10
. Fidd 12Work Activities and Sect& of mployment 13
Hispanic Scientists and Engineer 15Employinent Level I 15.Field ,
Sex, Race, Age1515
Work Activities and Sector of Employment'r.
15' 0,
.
'
,,
l
.
.
C
.
-
9
5
Chapter 2.
.
Chapter 3,
LABOR' MARKET INDICATORS. Women Scientists and Engineers
T- Labor Force Participation Rates.
1 unemployment RatesUnemployment-S/E Utilization Rates .
Salaries -,
UnderemploymentRacial Minority Scientists and Engineers
Labor Force Participation RatesLinemplOyment RatesS/E Utilization Rates ,---.
SalariesUnderemployment
Hispanic Scientists and Engineei.
EDUCATION AND TRAINING .Women
Earned Degrees iii Science and EngineeringGraduate'Degree Atiainment Rates
. Postdoeforai Appointments .
Malherriatics and Science Training .
/
-
,,
.
.
$
:.-
-
ft
.
,
.
°
171717182122242626
26262728
:.29
.
31313132
1'32 ..
33
*4
'1
RaciarMinorities I 4 34Earned Degrtes in Science and Engineering 34PostdoctoralAppOintments . 35
. . Mathematics and Scierice Training 35
5
"te

-
iv
Hispanics .
Earned Degfees inScience andngineeringMathematics and Scienev Training
TECHNICAL NOTES
APPENDIXTABLES.
c 37a.
.3737
47
0 .
.+
1
a
9
-0
,a
t.
-)
v
1'
9
e" 7
o
%
o
6
0.
. O.
v4.
aecutive SummaryWOMEN
Representation ,
Employment of female scientists and engineers rose al-most 32 pe'Ycent between 1974 and 1978, increasing, thefemale share of the total science and engineering (S/E) work.force from 7.8 to 9.4 percent. Despite tiiis increase, worrienwere still underrepresented since they constituted over 40perCent of all professional and related workers in 1975.
Representation of women in the total S/E work force variedconsiderably by field. Roughly one-half of the men, but only10'percent of the women, were engineers. Women, on theother hand, were concentrated in.the fields of social science,life-science, psychology, and computer specialties. As a re-sult, the female strare of the S/E work force 'varied from about2 percent in the fields of engineering and physict to over 20percent in the social and life sciences and psychology.
'There was little difference between men and women in S/Elabor force`participatOn. Almost 90 percent of the,women inthe S/E population were iri the labor force (i.e., either workingor looking for Work). In contrast, affty two-thirds of all womenwho had completed-16 or more years of schooling were in thelabor force.
4.%
Part -Time -Employmen- it.
The proportion of S/E womervemployed park time wasseven times as large as that of men, 14.percent vs. 2 percent.About 2 percent Of the female S/ ork force.and less'thanQ.5 percent of the male work fqrce vre working part timebutseeking full-time employment.
Employment in S/E Jobs
The proportion of working female scientists and engineersbolding non-S/E jobs-was about three times larger than thatof men, 43 percent vs. 14 percent. The sex differential wasconsiderably smaller for those in the doctoral work force-13 percent for women vs. 9 percent fOrmen. Of the femaleS/E work forde, 4 percent, as compared to 1 percent of themale S/E work force, reported that they were looking for S/Ejobs but had to settle for non-S/E positions: Except for com-puter specialties, this sex difference persisted within mostfields of science and engineering.
IS
Salaries'
411
.
Women scientists and engineers received lower salariesthan men. Among experienced scientists and engineers,Women received rougtfli, 80 percent of the salaries of men.The differential persisted within fields, types of employer, and.types of primary work activity. Women with doctorates in S/Efields also receivet roughly 80 percent othe salaries re-
.-.
ceiyed by men ($23,100 vs. $29,900). The ratio, however,increased to about 90 percent when adjustments were madefor field, age, race, and sector of employment.
a'Unemployment
,
Unemployment rates for female scientists and engineerswere higher than those for males (2.4 percent vs. 1.3 percent).Except for life science's and'computer specialties, the differ-ence persisted within fields of science and engineering.
Career Advancement
The proportion of female scientists and engineers report-trig management as their primary work activity was less thanone-half that of men (12 percent vs. 27 percent). The sexdifference persisted within each major field*of science andengineering. Within the sciences, roughly,12 percent of thewomen and 23 percent of the menreported management astheir primary work activity. In engineering, the percentageswere 10 and 30 percent, respectively. It should be noted thatthe average age of female scientists and engineers was lowerthan that of their- male counterparts.
Within' educational institutions, women with doctorates inS/E fields were less likely to be tenured or, in tenure-trackpositions (59 percent vs. 78 percent)..Of tenured faculty, 53percent of the females and 7tspercent of the males held therank of associate or full professor. These differences per-
'sisted after adjustments were made,for field, year of receipt ofdoctorate, and quality of institution from which the doctoratewas granted. ,
Minority Women
Minority women represented 9 percent of the total female'S/E population: compared to a 3 percent ratio for minoritymen: Minority women and men were about equally repre-sented in their respective doctoral S/E work. forces (9 per-cent). Black women represented a larger proportion of thefemale S/E population than black men of the male S/E pop-
.ulation (5,percent vs. about 1 Percent),
Training
Although still underrepresented, women havel been in-creasing {hei participation in S/E training. They earned 36-percent of the S/E bachelorls degrees awarded'in 1980, upfrom 26 percent in 1970; 27 percent of the master's degrees,up from 17 percent': and 22 percent of doctorates, up from9 percent. To provide some perspective, roughly 50 percentof the 1976 class of high school graduates were women. -ryagains in S/E degrees occurred within almost all fields of sal-
4).
,
INV

"ence and engineering, although there was still considerablefield variation in female rates or participation. For example,
- in engineering, relatively few degrees were awarded to women(10 percent of the bachelor's degrees), while in.the Social'sciances a substantial fraction (51 percent) were awarded to
women. ,
'The loWer female rate of participatiOnin S/E training maybedue to differences in precollege preparation, role models,
. expected job opportunities, And a hosi of sOcial, cultural, andpsydho logical variables.-Data available on the first of theseshow that between 1972 and 1978, fewer,female high school
,students took 4 years of 'mathematics': but the differencebetween female (22 percent) and male (39 perdent) studentshas been narrowing. Rough.ly similar proportionsof college-b6und male and female high school seniors took 2 or more,years of biological science in 19.817, but female seniors wereonlyone-half as likely as males to have taken 3 or more yearsof physical science (15 percent vs. 30percent),
These variations in precollege preparation may affect
"-4female-male differences in scores achieved on nationalmathematics and science tests. Differences in-mathematicsscores at thee age's of 9.and 13 have been slight; however,
. .by age 17, test scores of males Were higher, than those offemales. On science tests, however,' females scored con-sistently lower than males at ages 9, 13, and 17.
Female scores on the mathematicS Component of theScholastic Aptitude Test,s were slightly below those of males:Women and, men who majored in science and engineering atthe undergraduate level earned roughly similar scores onthe quantitative and analytic portionsof the Graduate RecordExam ination.f
- RACIAL MINORITIES
,ReprentationEmployment of scientists and engineers belonging to racial
,minorijygraups rose by almost 25 perce"nt between 1974 and1978 (to 90,000), increasing their share of the S/E work forceto about 4 percent!
.Despite this gain, blacks were still
.Underrepresented. Al-
though blackstonstitutedab-obt 7 peicent of all professionaland related workers, they represented only 1.6 percent oflheSIE wqrk force. Asians, who represented about 2 percent ofthe S/E work force, were not underrepresented. A Considerablefraction of Asian scientists and engineers (for example, over90 percent of those in the doctoral S/E work force) were
foreign born.
Representation bf racial minority scientists a9d engineersIn the S/E work forceparticularly blacksvaried considerablyby field. Blacks were concentrated the.sobiel sciences and
.psychOlogy, where they 'represented almost 5 percent of thetotal. At the otheilextieme, blacks represented only 1, percent'of the engineering work force; Native Americans with doctorateswere also concentrated in the social sciences acid aychology;about one-half were in these fields.
.a 44
vi t_0 e
a 'ts
4
IRegardless of race, scientists and engineers showed strong
attachment to the labor force; however, the ties for membersr'Of racial minorities were somewhat stronger than those for
whites. About 95 percent ofboth blacks and Asians in the S/E.population we k in the labor force in 1978, compared with 91percent of the whites.
Part-Time and S/E Employment
Among experienced scientists and engineers, there waslittle difference among racial groups in pert-timeemploymentpatterns. A slightly ,smaller proportion of blacks, however,was emp yed in S/E jobs (88 percent for black doctorates vs.92 percent whites and 94 percent for Asians).
Salaries
. Scientists and engineers in the experienced S/E labor forcewho were members of racial minorities received lower sala-ries than whites ($24,900 for blacks and $25,800 for. Asiansvs. $27,300 for whites). There were, howeyer, some notableexceptions to this general pattern Black engineers, for example,generally received higher salaries than white engineers
Unemployment 1
Unemployment rates did not generally differ in 1978 amongracial groups in the S/E labor force, the rates hovered around'1.5 percoint. In 1980, however, Onemployment rates for blackscientists and engineers with little -experience (4.7 percent)were considerably higher than those of other racial, groups
Career Advancementti
There was little ditference among racial groups either in theprOportion of the experiperced S/E work force reporting man-agement as their primary work activity or in the proportion ofacademically employed S/E doctorates at the associate and
prOfessor level..
Training
Members of racial minorities earned a small fraction.of theS/E degrees awarded. In 1979, blacks earned 6 percent of thebachelor's degrees, almost 4 percent of the master's degrees,and less han,3 percent of the doctorates.By comparison,blacks Constituted about 12 percent of the 1978 class.of highschool graduates. Although Asians earned 2 percent 44theN,,S/E bachelor's degrees and almost 4 percent- of master'sdegre4 and doctorates, they represented. only 1 percent ofthe 19781rhgh school graduates. Of those Asians eerning.S/Edoctorates in 1979, however, a large fraction (84 percent)were not U.S. citizens.
Although black participation in engineering training' hasbeen increasing rapidlyby over 100 percent between 1972and 1980 (lo 1,300) blacks were awarded Only 2 percent of,the engineering degrees Jn 1980.
.
he lower participation on the part orttie blacks in S/Etraining may be a result of differences between blacks andmembers of other racial groups in their precollege prepare--, tion in mathematics and science, role models, expected job
1

%,
opportunities, and a variety oil social, cilltural, and psycholog-iCal variables. Data available oiii the first of these shOw that in1978, black high school seniors took fewer courses in math-ematics than whites. Three-quarters of the whites had takenAlgebra I, for example, compared with 55 epercent of theblacks. In the sciences, blacks took aboth the same amount ofphysics as yhites (20 percent), but relatively fewer blackstook chemistry (28 percent of blacks vs. 39 percent of whites).
The differences in precollege.preparation were partiallyreflected in racial differences in scoresAchieved on mathe-matics and science tests. The average sdCreof blacks at age 9(55 percent correct, responses) was .13 percentage 'pointslower than that of whites of comparable Age (68 percentcorrebt.,,sponses) on mathematics kno edge tests adminis-tered as part of the National Assessment of Education Prog-ress. The difference widened to 18 p rcentage points byage 17 (56 percent vs. 74 percent). At age 17, there wag:an 18percentage point difference (38'percent vs. 56 percent) on
science tests.
Blacks scpred lower than whites on the mathematics por-tion of the Scholattic AptitUde Test (355 vs. 490),-A.nd lower onthe Graduate Record Examination than either whites or Asians.For example, on the quantitative component of the GRE,blacks who.majored in engineering at the undergraduatelevetscored 521, compared to 675 for bbth whites and Asians.
. ,
HISPANICS ,
Representation
t
, ,
- Hispanics constituted less than 1 percent (2,500) of thedoctoral S/E work force in 1979, but over 2 percent-of the pro-lessional and related workforce.
.
/
r ..
...
J.
...
v..
al
,
The field distribution of doctoral S/E Hispanics was similiartohat of all doctoral scientists and engineers. A slightly largerproportion ofi Hispanics were psychologists and slightly smallerproportions were engineers and environmental scientists.
.
,Career Advancement - , -Relatively fewer academically employed Hispanics with
SI-E doctorates were tenured. Of S/E doctorates receivingdegrees between 1960 and 1978, 64 percent of the Hispanicsand 62 percent of the total were tenured in i979.
\1
c
.
ITraining
. . -Hispanics earnedUbout 3 percent of the bachelOr's degrees
in science and engineering fields, 2 percent of the master'sdegrees and 1.4 percent of the doctorates. In comparison, -slightly over 4 percent of the 1978 cohort of high schoolgraduates Was Hispanic.
Hispanic high school students at age 17 scored below thenational average on mathematics tests (60 percent vs. 72percent) and on science tests (43 percent vs. 54 percent).
Hispanicsate Recordmajor. Therthe different
s ed lower than non-Hispanics on the,Grad u-...amination within each field of undergraduate
was substantial variation in test scores'imongispanic subgroups. For example, on the quanti-
r
tative portion of the exam,'whites whose undergraduate majorwas in the mathematical sciences scored -682, while LatinAmericans scored 620, Mexican-Americans scored 595, and
MPuerto Ricans scored O. '.\ .
1
$
v
r. rii
se' rin
C ItI.
A.
I ' r
. .
i
\
.1
Tle
vii
.
*A

"'
IntioductionCongress, as partof the Fiscal Year 1981
National Sciehce Ftiundation AuthorizationAct (Public Ltiw 96-516), called for theDirector of the National Science Founda-tion to transmit to the Congress and cer-tain Feder4agencies a biennial statistical'report on the participation of women andminorities in science,and engineering em-ploment and training. This reportlrespo'ndsto that Congressional directive.
Chapter 1, a descfifyive overview of theparticipation of women and minorities inthe natural and social sciences and engi-neering, highlights differences in employ-ment patterns between Armen and men.and between whites and racial minorities.Chapter 2 reviews a series of indicatorg,suchsas unemployment rates and salarydifferentials, to assess relative labor marketconditions (i.e., employment relative to avail-able supply) tor scientists and engineers.Chapter 3 examines"' the acquisition of sci-ence and engineering .(S/E) skills. Dataare presented on the number and propor-tion of women and minorities earning S/Edegrees and on the acquisition of mathe-matics and scientific skills by women and'racial minorities prior to college entry.
Generally, the National Science Foun-dation (NSF) definitio. n of scientists orengi-
. neers jncludes those who hold at least amaster's degree in Mathematics, biological
'sciences, psychology, or the social sciences,those- who hold' nly a bachelor's degreein these fields and are employed in a sci-
rl 1
4
11
ence or engineering job, and those whohold at least 'a bachelor's degree in engi-neering orin any'science fieldotherthanthose listed abOve. A more complete dis-cussion of these criteria can be tfound inthe technical notes at the end:of this report
Much of the information presented inthis report is derived from sample surveysand is subject to limitations of samplingand less than full or inaccurate respohses.Because of the relatiVely small number ofwomen andminorities in science and engi-neering, data for these groups are not asStatistically reliable as those for males andwhites.. However, any-comparisons betweenwomen and men between Minorities Adthe majority presented in -the text of thisreport are statystically significant at leastat the .05 confidence level (i.e., the reporteddifference could be due to chance only 5 orfewer times in 100). 1pformation pertain-ing to the statistical reliability of.mucil ofthe data in this report can be found in'thetechnical notes.
In all chapters, data are presented, first,for women and then for minorities. Thisorder does not reflect pribrities, rather it.reflects the fact that there are more statis-tically reliable data available for women.Statistital information on the participa-tion of native Americans and Hispani,ls inscience and engineering is particularly lim-ited because of sample size and high levelsof nonresponse to survey questions relat-
e
t,
a
ing to Hispanic status, Thus, much of the,data preseMed on racial ufmorities arefocused on blacks and ilsians. Hispanicsare treated separately since they are anethnic gather than racial group. CompariAsons are made between Hispanics and allScientists and engineers:'
..
Most data are for the 1978:79 period.In some cases more current dab- are notavailable because the 4vanksurveys ;Ton-sgrecf by NSF' are .Lt-Mclucted bienniallyand because the activities associated withthe 1980 Ce,Psus of. the populgtion imposedconstraints on data collection activities. Indesigning NSF d to collection systems forthe eighties,, em hasis has been given toiriereasing the samples for women_ andminorities so that more statistically reliableInformation will be available-1n the future.`Iri particular, sex and race will be used assampling strata ni The NSF-supported Post-
. censal Survey of Scientists and Engineers.This survey will form the lope for theoverall national estimates of employmentof scientists and engineers._..v.,
. .There 4:e some differences in concepts,
data collection techniques, and reportingproi.eduresamons the statistics presentedin this report. Primary data sources listedin the references, technical notes, and ap-
,....paiadix tables will provide full informationon these technical aspects and on the limi-tations of the statistics.
,
e
ix

CHAPTER I
Employment of Women and Minorities-in Science andIngineering .
I
This chapter focuses on two broad topics(1) the representation of women and min-orities in S/E employment; and (2) differ-ences in employment characteristicfbe-tween sex or racial groups independent ofthee overall employment levels. Policycations of underrepresentattrare differ-ent from policy implications of differencesin employment characteristics.. Representation of women and minori-.
f ties in the labor market canbe determinedby comparing the proportion of employedscientists and engineers who ace wonitn ormembers of racial or ethnic minority groups,with the proportion of these/groups insome relevant population, generally-all pro-fessional, technical, and related workers.Level of representation in the labor market,however, tells nothing about the .experi-ences of women and mi'noritie's once theyare in the labor mallet. It is also necessaryto have information about the characteristicsor nature of their involvement in the labgrmarketwhether they are unemployed oremployed in stience or engineering jobsand what lypoof work activity (i.e., maria-,gerial or nonmanagerial) they are involvedin Observed differences between the ex-periences of, women and minorities and4he relevant population can highlightpotential areas of concern. These differ-ences can reflect (1) differences in field,work experience, or sector of employ-ment, (2) differences in worker decisions
/about the nature of their work involve -'ment, (3) differences in employei person-.net practices, such as hiring, training, andpromotion, or (4) some combination Ofthese factors.
This report examines labor market ex -*of scientists -and engineers in
terms of two employmenr characteristics.field of employment and career progres-sion /promotion opportiinity. The lattercharacteristic is measured by examiningwork activities, especially the propensity'to be in management, and for those ihacademia, rank and tenure status.
Information on field of employment isof value for a number of reasons. First, it
lshows whether women and minorities areunderreprdsented in some fields relative tomen and the majority. Second, it reveals-field differences by sex and racial /ethnicgroup. Since employment opportunitiesvary by field, field digerences carrplay asignificant role in tletermining dif ferencesin such work.characteristics as emplo,ymentin S/E jobs, unemployment, or salaries
,haracteristics tnat are frequently used as
indii:ators of labor market experiences.Women and minorities arcOncentraled infields with relatively lower-salaries, lowerrates of Sa employment, and 'higher ratesof unemployment.
Type of work activity can be viewed asan indicator of career development Forthose employed' in business or industry,management positions can be a measure ofpromotional treatment, for those employedin academisarank and tenure status can be'indicators of career progression.
The data in this chapter and chapter 2are based largely on the NSF ScientifioandTechnical cer'sonnel Data System (STPDS),
,which includes three sample surveys Thefirst si,mple consists of scientists and engi-neers In the labor force at the time of the
.1970 Census of Population (ExperiencedSample Survey). The second consists of.recent S /E- graduates from U.S*. collegesand universities (NeW Entrants Survey) .4The third nnsists of scienti6ts,dnd engi-neers holding doctorate's (Survey of Doc-torate Recipients). Where feasible infor-mation from these three major surveys areaggregated to produce overall national totalsfor scientists and' engineers and for thecharacteristics of their employment.
The experience of recent S/E graduatescar\ be a sensitive barometerleof changingpatterns of labor market behavior. Anychanges in employer decisions nqrnially'are reflected first in employer hiring actions.In addition, since recent graduates consti-tute the major source of new supply forthe Si .riketfitheir experiences area le4d chSnges in thechards,.;. 45:ittnployed scientists andengineerg: lefgeiriformation pertaining
4
1
to recent graduates is included whereverappropriate and available.
r.WOMEN tN SCIENCE AND°ENGINEERING
Employment Levels and Tr'ends
. Women are underrepresented in syenceand engineering. In '1978, women repre-sented about 43 percent of of professionaland related workers': but only 9.4 perceritof all employed scientists and engineers,up from e.8 percent in 1974. Between 1974and 197.8, employment, of women seen;tests 'and' engineers at all degree 'levelsincreased from 17o,000 to 232,000almostfour times as fast as employment of men(almost 32 peiLent vs. 8 percent). Thistrend has accelerated' ov er the more recentpast. Between 197o and 1978, employmentof women increased by 17 percent (from197,000'), While employment of,men grewby about 3 percent (from 2,180,000 to2,212,000).
Women scientists have, on average, alower level of educational attainment thanmen scientists. Among all women scien-tists, 15 percent hull dm tbrates for men,the comparable figure is 23 percent. Dif-ferences betwee hie sexes in level of attain-ment vary sign by field (figure.1-1), with the largest female-male differ-ences in mathematical, environmental, andlife sciences. Among engineers about 4percent of the nien and 2,5 .pezierkt of thewomen hold doctorates! .
Among doctoral scientists and engineers,employment of women has been increas-
e ing almost twice Is rapidly as employmentof men-during the c -year period ending in1979. Between 1973 and -1979, employ-ment of women doctoral scientists andengineers alritost doubled (from 17,000 toover 33,000a 97 percent increase), whileemployment of men increased by only about38 percent (from 204,000 to 280,000). The33,000 employed womerl doctoral scientistsand engineers in f979 leprtsente about
1

Figure 1-1. Proportion of employed scientists and engineers withdoctorates bylield and sex-
.Percent.40
,30
20
10
0Psychos- Life Physical Social Environ-, Mathe Engl. Computer
ogy sciences sciences sciences Mental matical. *ring specialties
Men..
sciences sciences
446 Women
arna;
Note Based on 1979 data to doctorate scientists and engineers, 1978 data for all scientists and engineers =
SOURCES: AppendF tables 8a and 9a
11 percentof all doctoral scientists andengineers, up from 7.7 perc'ent in 1973.
Field
Women areconcentrated In-differentQselds2 of science and engineering than men.In 1978, women represented about one-fifth of employed social, life,, and mathe-
,matIcal scientists and about one-sixth ofalleinployed computer specialists.-Less than2 percent of all engineers were women(figure,l-k
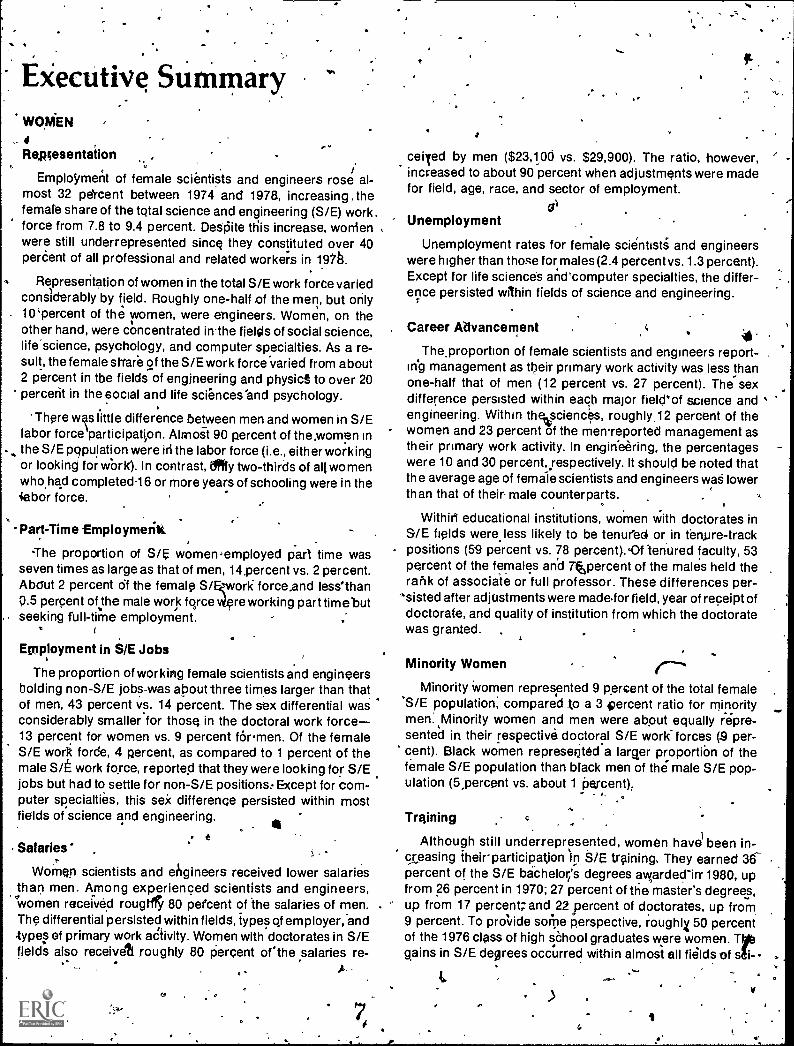
Figaire 1-3 shows the field distributionof employed female and male scientistsandehgineers. An index.of dissimilarity':(Isummary measure of overall differences .Between two distributions) can be use to
quantify the field differences betweengroups.' Amor;g male and female scien-tists and engineers, the 1978 index of dis-similarity was 52. This figure means that'52 percent of .the women would have tochange fields or occupations to have a dis-tribution identical to that of men.
There have been Zhanges. in .the field ,
distribution of employed female scientistsand engineers cher time, most notably 'inengineering andthe social sciences; In 1976,
2o .
- ing: where employmentof women increasedfrom 100 in 1973,to 500 in 1979, and com-puter specialties,' where the increase. wasfrom 100 to 400. Fo? men, the fastest grOw-ing fields <re tornputersspecialties, socialscierices,and psychology. Between 1973and 1979, field differences between womenand men at the'doctoral level narrowed.
Despite rapid increase4 in employment,less tnn 3 percent of wiathen holding doc-torates were-engineers or computer spe-cialists in 1979. Almost 85 percent of thegrowth in employment of women doctofalscientists aaengineers took place in threemajor fieldslife sciences, social sciences,and psychology. Over the 1973-79 period,the proportion of women holding doctorates.in these three major fields bas remainedrelatiiely constant (figure 4 3).
The differe-nces between sexes in fielddistribution for doctofal scientists and erigi;peers were smaller than those found in thetotal SfEmoTk force. in 1979, the index oG
dissimilarity for doctoral scientists and engis-.neers was 3§, compared with 52 for scien-tists and engineers al all degree levels. Foe
. doctoral scientists, the index was 30, com-, pared with 16 for those at all degree levels.
less than 4 -percent of the women wereengineers; by 1978, this ptOpoetion hadincreased lo almost 9 percent,"and womenas a proportion of all engineers increasedfrom 0.5 to 1.6,percent. ConverseLy, theproportion of women who were social sci-entists declined from 23 to 16 percent be-tween 1976 and 1978, and the prpportionof social scientists who werewOrnen declinedfrom 23to 20 percent (appendixitable 4).
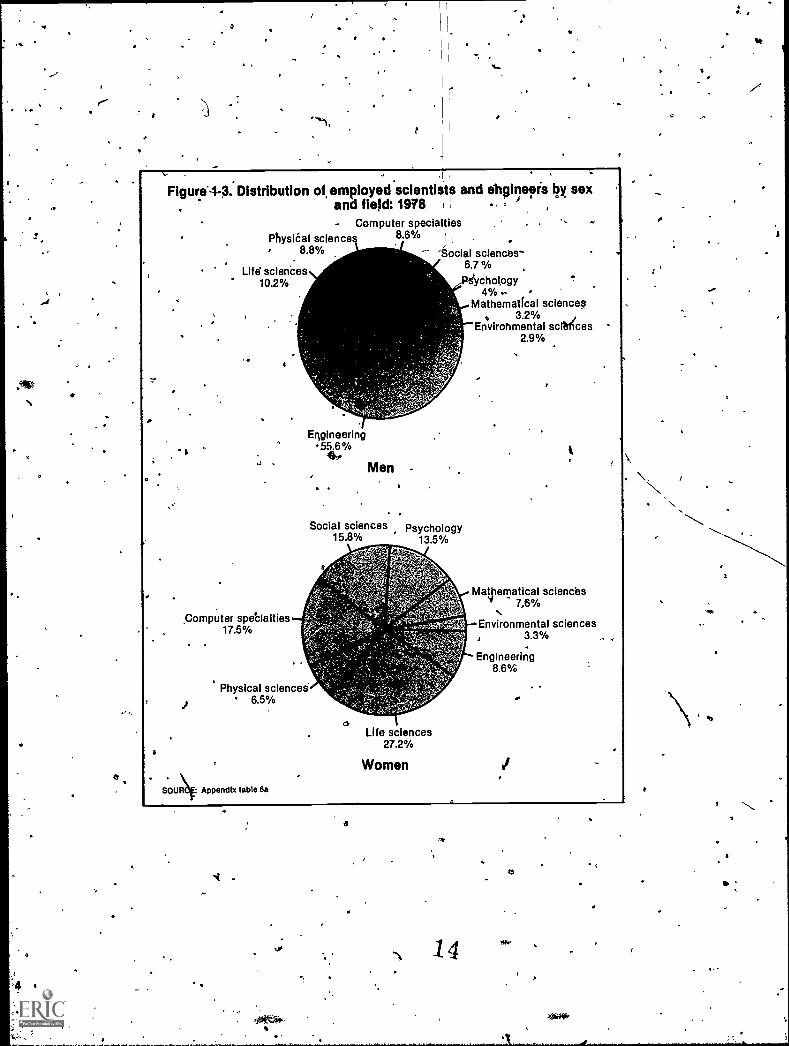
A different picturedevelops if engineers(primarily i male occupation) are eliminatedfrom the analysis (figure 1-4): yifferencegnarrow, and the index falls from 52 to 16..But men are more heavily concentrated inthe physical sciences, and women are stillmore likely to be life and social scientistsor psychologists! Although the relativelysmall number- of women'engineers andphysical scientists istgtriking, women arenow earning an increasing proporti9n ofdegrees in these fields (seeChapter 3).
Women scientists land engine-e-rs hold-ing doctorates are concentrated in the lifeand social sciences and psychology. Menare most likely to be life or ph ysicaltscien-fists and engingeLt (figure 1-3). #mongwaingn, the fa test growing employment
- fields at the doctoral level were engineer-- - J
Work Activities and Sectorof Employment
- .
Some work activities can be viewed asindicators of career ,development or pro-gression. the number and proportiOn ofwomen in buiness and industry primarilyengaged in na,anagement activities are arough proxy for one type of -promotionalopportunity Likewise, for those in aca-demia, faculty and tenure status can be'indicators of career progression
*Roughly-equal proportions- bf womenand men cite research and development(R&D) as their primary work activity, withwomen .(primarily 'scientists) more likelythan men (primarily engineers),to cite re-ksearch rather than development. Next toR&D, the most frequently reported activ-ity for mete is management': for women, itis a combination of report writing, statisti-
ocal work, and computing activities 4figure1-6).
The proportion of men in 1978 report-ing_rminagenient as their primary workactivity was more than twice that of Women(27 percent vs. 12 percent). Althoughthenumbers of both women andThen in man-agement have increased since 1974, theproportions have remained constant.
't
O

-
\
Figure 1-2. Employed scientists and engineek by sex and field
Percent. 100
90
80
70
60
50
,40
30
20
10
100
90
80
70
6
50
40
-30
20
10
0
All scientists and engineer% (1978)
Totak% Physical Mathe- Computer Environ- Engi- Life Psychol- Social.sciences matical specialties. mental neering sciences ogy sciences
sciences sciences
I Ph.D. scientists and engineers (1979)Percent
4
Total' Phyfical Mathe- Computer Environ- Engl., Life Psychol- Socialsciences matical specialties mental neering sciences ogy sciences
sciences sciences
SOURCES: -based on appendix tables 6a and 9ba
Field
Women r Men
IMO
13
1
, . -.
Figura4-3. Distribution of, employed scientlets and ahoinepis by sexand field: 1978 1
. :- Computer specialties -
PhysiCal science 8.6% II
8.8% 'Social7 %sciences-
Life' sciences6.
10.2% ycholpgy4 %.
Mathematical sciences. 3.2%
Envirohmental scildces2.9%
Computer spebialties17.5%
Engineering55.6 %4,
Men -
Social sciences Psychology15.8% 13.5%
Mathematical sciences7..6%
Environmental sciences3.3%
Engineering8.6%
Physical sciences6.5%
SOUR QE: Appendix table 6a
life sciences27.2%
Women
0
r4,
14
7
a
z?
4
9
..Figure 1.4. Employed scientists by sex and field: 1978-
Social sciences. '15%
Computer specialties19:5%
Physical sciences20%
Social sciences17.2%
Computer specialties19.2%
Men
,
Psychology ,
fMathematical sciences
7.1%
Environmental6.5%,
Life sciences22.9%
Psychology14.724
Mathematical sciences. 8.3 %-
EnvirOnmental sciences
Life sciencesPhysical sciences 29.9%
SOURCE: Appendix table ea
7.1%
Women
3.6%
ON
15
.
O

it
lb /I Figure 1.5. Disjribution of employed Ph.D. scientists and engineers by sex and field: 1973 an 1'979
Men Women
Social sciences Psychology 9 9%12.4% Mathematical =fences
5.6%
Engineering. 17.5%
lysical sciences22.8%
Environmental sciences5%
Social sciences, 14.7%
Engineering'.17.7
Physical sciences203%
1973
Men
Social sciences.17.1%
Computer specialties1% .- Engineering
06%
Life sciences25.5%
gy 10.3%
Mathematical sciences5.1%
Envirdnmental sciences5%
Computer specialties2.3%
SOURCE. Appendix obit 71979
Life sciences24 6% '
Psychology28.2%Mathematical sciences
4.7%
Environmental sciences1.8%
Computer specialties06%
Physibal sciences11,2%
Social sciences21.7%
1973
Women
0
Life sciences358%
Psychology4°*****27.7 %
Mathematicalsciences
Environmental sciences1.8%
Computer specialties1.2%
Engineering15%
Physical sciences.9.4%
1979
Life sciences33.4%
I,
se.
Figure 1.6. Employed scientists and engineersly sex and od; ary wort activity: 1978
ScientistsOthqr 70° /q
Reporting/statisticallcomputin15.9%
Production/Inspection8.7%
Consulting4:7%
Teaching 156%
Rtsearch anddeveloment .s, 25.4%
Reporting/statistical/Computing25.9%
Production/inspection.445/.
Consulting 4.0%
Other6.6%
Scientists
Men
Management of researchand development
9.5%
Management of other thanresearch and development
13.2
Research anddevelopment" 259%
SOURCE. Appendix table It
Reporting/statistical/computing7.2%
Women
V
Management of researchand development
4 0%
Management of other than.,,,Apsearch'and development
Teaching21.3%
Productionfinspection20 2%
Engineers
Consulting 5.4%
Teaching2.0%
Other 5.6%Reporting/statisticaUcomputing
23.7%
Prodoctionlinspection26.8%
, Engineers
Research anddevelopment
298%
Managertient ofresearch and
development 9.8%
Management of other thanresearch and development
198%
Research anddevelopment
31.3%
Management of researchand development
6.8%Management of other thanresearch and development
3.0%Teaching 0.5%
Consulting 2.5%
16- 4
/4

Figure 14. Employed Ph.D. scientists and engineers by sex and primary3 work activity: 1973 and 1979
, .
Percent50
A
30
10
0Teaching Research Manage-
and mentdevelopment
Men
mmr",r1 PliConsulting Production/ Reporting/
inspection statistical/computing
Other
Teaching Research Manage- Consulting Production/ Reporting/and ment inspection statistical/
.development computing
SOURCE: Appendix table 19
1973
Primary work activity
1979
Other
Among men, engineers are more likelythan scientists to be in management. Amongwomen, the reverse is true (figure 1-6).These diffgrences partially reflect theyounger age of women as compared tomen in the S/E work forCe. In 1978, forexample] 70 percent of the women, butonly 38. percent of the men, were under 35years of age.
One way of standardizing for-age dif-ferences i toexamine the work activitiesof -men"and women of roughly comparableages. Among recent (1978 and 1979) S/Egraduates at both the bachelor.; and mas-ter's levels, the proportions of women andmen in management activities are nearlyequal. In 1980, about 13 percent of recentgraduates of both sexes at the bachelor's
7
- o
level reported management as their pri-mary activity, at the master's level, thefigures were 12 percent fol. men and 10percerit for women.
Work activities of b th women and mendoctoral scientists an engiiwers have shiftedover time (figure 1-7). For both sexes, theproportion reporting teaching has declined,while the proportion reporting manage-ment has increased. These trends reflect,.in part, a sectoral shift in job opportunitiesfrom educational institutions to businessand Industry, which, in turn, reflects theslower rate of growth in the age of thepopulation group likely to enroll in insti-tutions of higher education. One way, tocontrol for this shift is to focus on theacademic sector.
Within educational institutions,-a smallerfraction of women doctoral scientists andenginers hold tenure or are in tenure-track positions. In 1979, 35 percent of thewomen held tenu;e, and an additional 24,percent were in tenure -track positions;among men, 63 percent held tenure, andtian additional 15 percent were in tenure-track positions (figure 1-8). A smaller frac-tion of women held full or associate pro--otessorships. In 1979, almost 75 percent ofeerten, but only 47 percent of the women,were flit associate professors. Most ofthis dif eretwe was ,at the full professorrather than thk;Osoaate professor level.'
iktecerit.kudy s orted by NSFshowedthat sex differenc iii rank . and tenure
'status persist even. when samples arematched for field and years since receiptof doctorate. Among those receiving theirdoctorates between 1970 and 1974, one-third of the women and one-half of themen held sekor faculty posts. In everyfield, there was a greater concentration ofwomen among assistant professor and non-faculty appointees.5
Sector of employment affects a numberof employment characteristics, includingsalaries and work activities. Women areless likely than men to work in businessand industry and more likely to be employedby educational'-institutions and governmentagencies igrimarily State and local). In 1978,about 36 percent of women scientists andengineers, compared to almOst 65 percentof men, were in business and industry(figure41. -9). The participation of womenin business and Industry, however, is chang-ing. Among recent bachelor's recipients inscience and engineering, about one-half of
7. f

/7.
Flgure-8. Ph.D. scientists and enghieers in educational 19tItutions bytenure status and sex: 1979
Tenured lot tenured. ,
Tenure status
Men
SOURCE. National Science Foundation, unpublished data
Women
Non-tenuretrack
the womennd 70 Orcent of the men werein business and industry.
The higher proportion of men scientistsand engineers in busine4s and industry'results largely from the concentration ofengineers in industry. In 1978, over two-thirds of the men in this sector were engi-neers, and most engineers (80 percent)worked in business and industry. If engi-neers are excluded, the differences in ern;ployment sector between women and mennarrow (figure 1-10 . The remaining dif-ference is partly a iNsult of the differentfields of science i9 which women and menare employed. For example, more men thanwomen are physical scientists, and morephysical scientists work in industry thanin other sectors. With the exception ofmathematical and environmental scientists,however, mgn ar.e more likely than womento work in bUsiness and industryregardlessof field of science.
Theigpt,propor Von of both male and, female ctoral scientists and engineers
found employment in educationginstitu-. tions. There is a disparity, however, in the
sectoral distributions of doctoral womenand,men (figure 1-11). A larger proportion
, of the women than men are employed by,educational institutions, and a smaller
8
proportion are employed in business and'industry. In 1979, two-thirds of the womenwere in educational institutions, as com-,,pared to somewhat more thanone-half of
, the men. Within universities women wereless likely than men to be in research-oriented institutions. A study by the Na-tional ,Academy of Sciences found thatalmost 26 percen of doctoral men butonly)21 percent of th women were in the top 50institutions, (k,s, measured by .R&D ex-p,enditures).6 Within educational institu-tions a larger proportion of the women were
....in 2-year colleges and elementary and sec-ondary schools (8 percent of the womenvs. 3.4 percent of the men). The propor-tion of women employed by business andindustry was half that of men.
Business and industry was the fastestgrowing employment sector for doctoralscientists and engineers of both sexes overthe 6-year peribd ending in 1979. Womenat the doctoral level have been increasing..their share of industrial employment.BetWeen 1973 and 1979, employment ofwomen doctoral scientists and engineersin business and industry,iccreased at, amuch faster rate (from,1,400 to 4,600, or22 percent per year) than foramen (from52,000 to 78,000, or 7 percent per year)(appendix table 26).
18
. ,
'MINORITY WOMEN IN, SCIENCEAND ENGINEERING,
Em7ploymerit Levels/and Trends
Among scientists and emsineers, minor-ity women were more hig.lty 'representedthan minority men. For example, amongmen scientist; and engineers in,1978, 96percent were white, about 1 percent'wereblack, "--and about 2 percent were Asian(text table 1-1). In 1978, about 91 percent
Table 1-1. -Scientists and engineers by raceanstsex: 1978
(percent) ,
Race Men Women
White 100.0 90.8 9.2 .Black 100.0 67.0 33.0Asian 100.0 85.5 - 14.5
White 96.1 91.0Black ... . 1.1 5.2Asian . 4,.. 1.8 '2.9Other ... 0.9 0.9
oisA
Total 100.0 100.0
Note Detail may not add tototalcheforoundIng,
Source Appendix tables 3b and 15
of women scientists and engineers werewhite, 5 percent (13,800) were black, and
_almost 3.percent (7,800) were Asian. Theremaining men and women (less than 1percent) were members of other racialgroups or did not report their racial status.
Among employed doctoral women sci-'entists and engineers, relatively few weremembers of racial minority groups. How-ever, for some groups, the proportion ofminority women Was higher than the pro-portion of minority men. Black womenmade up a larger share of all S/E doctoralwomen than did black men of all S/E doc-toral men. Black women represented 2.4percent (785) of all employed doctoralwomen, while black men represented onlyfpercent of employed doctoral men. Among.Asians, the proportions for men and womenwere similar: Asian women made up 6percent (2,030) of all employed doctoral,,women, and Asian men made up 7 percentof all employed doctoral men. Less thanone-half of 1 percent (117) of employeddoctoral women- scientists and engintersWere native Americans. t
Since the early seventies, employmentof minority women doctoral scientists andengineers increased more 'rapidly thanemployment for similar white women.Benyeen 4973 and 1979, employment ofwhite women increased by 90 percent (from

j
.fr
16,
Figure 1.9. Employed scientists and engineers by sex and type-of employer1978
Educational institutions13.6% Federal government
8.3%
State/local governments5.5%
Nonprofit organiptions 2.6%
Other governments2.5%
Other3.0%
Business/industry64.5%
Federal goveinement
Educational institutions32.8%
S OURCE: Appendix table 25
8%.
IStatellocal governments
9.9%
Nonprofit orgbnizations8.5%
Other governments 1.2%..Other'3.8%
Women
Business/Industry35.8%
4.

0
Figure-1-10. Employed scientists by sex and type of employer 1978
Educational institutions26.6%
Federal government10.2%
Stake /local governments' 7.2% 'Nonprofit organizations
4.40/0
Other governmigts2.2%
Other0.1 %-
Federal government,8.1%
Educational institutions35.5%
SOURCE.fAppend)x table 25
Men
Business/inthiotrii49.3%
State/local governments10.7%
.=Nonprof it organizations
9.2%
Other government1.1%
Other.4.0%
Women
Business/industry31.4%
4'
Table 1-2. Women scientists and engineers by field and race(percent) I
Field
Physicalsciences ..//mathematical scieridesComputer specialties
,EnvironmentalsciencesEngineeringLife sciencesPsychologySoFialsciences
.Total 7
S/E population (1978)
White Blade Asian
1387.5
16.4.3.38.3
28.113.8
'14.0
2.9 12.87.20.7 ,\_35.92.9 2.66.5
1
8.7'17.4
54.3
7.729.5
11.5
Employeddoctordl S/E's (1979)
White_i Black Asian
.8.5' 5:7 23.73.8 .. 1.41 4 d.9
is -1.Q 1.0 2.8
1. 0.5 1.7'1.4 0.6 4.6
33.0, , 33.4 44.6.28.7' 29.6 7.322.1 27.8 10.3
100.0 100.0 100.0 100.0 -loom
Nose: Detail maynot add to total due to rounding
Source: AppendiVables 13 and 15:
10
20
2
15,400 to 29,300), while employment ofminority women increased by over 200
percent, albeit from very small bases-from255 to 785 for blacks, from 640 to 2,03Qfor Asians, and from 34 to 117 for nativeAmericans.
Field
The Field distribution of women scien-tists and engineers varies considerably by
*race (text table 1-2), For example, 54 per-cent of black women, 12 Percent of Asianwomen, and 14 percent of white womenwere ,ncial scientists.
Text table 1-2 also shows the field dis-tribution of employed black and Asianwomen doctoral scientistsand engineers.The field distribution of black women fe-
sembles that of all women at the doctorallevel: roughly one -third of the black woto41/4_7'were Life scientists, about 30 percent- Were
psychologists, and 28 percentkere socialscientists. Asian women (85 percent ofwhom were foreign born) show a fielddistribution different, from that of non-Asian women. They were, for example,more highly represented among physicalscientists.
RACIAL MINORITIES IN SCIENCEAND ENGINEERING
Any analysis of minorities in scienceand engineering should distinguiSh, wheri-ever possible, between blacks, Asians, andother minorities, as these groups diff,er interms of representation among scientistsand engineers, representation in thgen-era-Vpopulation, and employment charac-teristics. Among employed scientists andengineers in 1978, 3.6 percent (90,000) weremembers of racial minority groups. Of theseminorities, 56 percent were of Asian extrac-, 1.
tion, lid 44 percent were black.It shoulei be noted that, in 1979, slightly
over one-half of the doctoral level Asianscientists and engineers were non-U.S. cit-izens, and of those who were U.S. citizens,over 80 percent were foreign born. Thus,91 percent of theAsian doctoral scientistsand engineers in 1979 were foreign born,although roughly 40 percent of these wereU.S. citizens. In contrast, arming black doc-toral scientists and engineers; about 2 per;cent wereforeign born, and among-whites,about 10 percot, were foreign born.
lEmployment Levels antarends
During the mid- to late-197,0's, employ-ment of. black and Asian scientists attd
,
4.. 4

,
Figure 1-11. Employed Ph.D. scientists and engineers by se*, and type of.employer: 1979
Percent70
-60
50
40
30
20
10
0Educational Business/ Federalinstitutions industry 4Govern-
ment
SOURCE Appendix table 27
Men
Nonprofit State/loca/- Otherorganiza- govern- govern.
4 tions ments ments-
Women
Other
..ti
Figure 1.12. percent increase in employment of scientists and engineersby race
Percent140
130
120
:; 110
100
90
80
70
60
50
40
3 0
20
10
0
.jer -
Ian Black White
All scientists and engineers , Ph.D. scientists and engineers(1974-78)
SOURCE% Appendik tables.5 and 8
(1973.79)
engin at all educational levels increased at .;a much ster rate than employment oir
whites (figure 1-12). Between 1974 and1978, employment of black scientists andengineers grew 20 percent (f,rom 32,500 to39,000) twiceas fast as employment ofwhites, which grew onjy- 10 percent (from2,153,000 to 2,361,000). Employment ofAsians increased even more rapidly (25percent, from 40,300 to 50;500). This
:faster growth in minority employment,'however, did not significantly alter theoverall representation of minorities amongscientists and engineers. Asians and blacks'represented 2.0 percent and 1.6 percent,respectively, df emplOyed Scientists andengineers in 1978, up from 1.8 percent and1.4 percent in 1974.
0
Blacks are clearly underrepresented inscience and engineering jobs. Asians, whomake up a smaller, percentage of the pop-.ulation, are not. In 1978, blacks and otherminorities represented almost 9 percent ofall professional and refANtworkers.7 Ofthese minorities in profiassidnal and relatedjobs, over three-fourths were black. Thus,j"lacks rePresented 7 percent of tho4erin allprofessional and related jobs, but less than
CAP 2 percent of the S- /E work force.In 1979, AsiansAhad a higher level of
eddcational attainment tln their white orblack colleagues Among all Asian tcien-.tists*and engineers, about two-fifths helddoctorates. Most (about 90 percent), how-
!) ever, were foreign born. In coptrast, be-tween 9 percent and, 12 perceli of bothblack and white scientists and engin'eers
'held doctorates.
21.
,Employment of both black and Asionscientists and engineers with doctorateshas increased more,rapidlY than employ -'ment of whites. Between 1973 and .1979,Asian employment more than doubled (from
-9,100 to 21,0011);.thnong blacks,*employ-ment increased by almost two-thirds (from2,100 to 3,400); among-whites, employ-ment increased by 38 percent (from 200,000'
g to 277,000) (appendix table 8). Despitethis rapid growth, the3,400 blacks employedin 1979 represented only 1 percent of allemployed doctoral iscientists and engineers,up slightly from 1973The 24,00Q employedAsian scientists and engineers repmentedalmost 7 percent of the total, uP:,candy from about 4 percent in 1973. Be-
. teen 1973 and 1979, the employment ofnative Americans increased from 390 to925. The 925 native AMerican doctoraP'

scientists and engineers employe in 1979represented 0.3 percent Of ,the.total., 4 .
',Field
Data for 1978 show bla;k, Asian, andwhite scientists and engineers concentratedin differentifields of science-and engirieep-ing (figure 1-13). Bla,cks:wefe morl likelythan whites to be scientists than engineers;over hX of the whites but only 27 percentof the blacks were enginders, and blacksrepresented less than percent of allengi-neers (figured -14). In science', blacks weremore likely than whites to social sci-eRtisq or psychologists; 37 pe cent pf theblacks were social scientists a d almost 12percent were psychologists.. For whites,the comparable figures were 15 and 10-percent. °
. The field distribution of Asian scientistsand engineers, is similar to that for whites(figure1-1,3). Over half of both whites andAsians were engineers rather than'scien-4ists.1
indexadissimilarity can be usedosummarize overall field differences among
-:,4-4-racial groups TNe index of 4issimilarityhetwgen _whites and blicks, at all degreelevels in1978 was 38. This figure 'meansthat roughly 38 percent ufithe blacks wouldhave to chamikiJields or occupations tohave a distribation identical to that forwhites. The index -Of4issimilarity betweenAsians and whites was 13.
Regardless of race, about one-fourth of
VE doctorates in.1979 were life scientists(text table 1-3). This was the only Field forwhich such similarity existed. The various
Table 1-3. Employed doctoral scientists andengineers by field and race: 1979
(percent)
'Physicalsciences .... 19.2 14.8 20.7 17.3
Mathematicalsciences .... 4.8 4.5 4.5 5.6
Computer ,specialties... 1.0 0.2 2.4
Environmentalsciences .... 4.9 1.9 2.3 3.0.4
Engineering ... 14.8 5.4 35.6 7.1
Lite science, .. 25.74 27.1 23.1 23.8PsYchology, 12.7 17.5 1.9 23.3Social
sciences .... 15.7 28.5 9.7 17.5
3
1-13.,Employed scientists, and engineers by rice and field: 1978..,.
cflOpe)et spOtaltle's
tends
.
Physical sciences8.6%
,
Social sciences,70/0
Psychology. 5%
Nativere
AmerkField White Black Asian can
Total 100.0. 100.0 100.0 100.0
Note: ,Detailmaynotaddtototilduetoro
gikitai: Appendix table 9b and unpublishe data.
:>;%4
12
I
. .
Engineering52%
4
Social sancesO 27.3%
Vipysital science§7.9% 4
Computer specialties2.8%
.4'
White. .
A.
Mathematical sciences 3.5%
Environmental sciences 3%
Psychqlogy8.5%
Mathematical sciences7.5%
Life sciences16,9%
lack.
omputer spkcialtles13.6%
.
Life sciences.9%
SOURCE: Append( le 1512
Environmental sciences1.8%
Engineering27.3%
Physical sciences10.4%
'Social sciences10.1%
Mathematical sciences 3.5%
Environmental sciences1%
EntObring5 %
Asian
2

Figbre 1:14. Midst minorities as a perbentof all employed.scientistiand
16
14
12
' 10
6
4
2
s0
Percent
. engineers by field
Total Engi- Physical Computer Life Mathe- Social Environ Psychos-neering sciences specialties sciences maticat sciences mental ogy
sciences sciences
Percent
Total Engi Physical Computer Life Mathe- Social .Environ Psycho'.neering sciences specialties sciences matical sciences mental ogy
sciences, sciencee
aToo few caul to ei.tImate,
SOURCES: Appendlres:60 and 9b
Black Asian
racial groups were distributed quite de'f erently between engineering Ind scienceand across fields of science. A larger pro-portion of blacks and native Americanswere social scientsts and psychologists, whilea larger share of the Asians were engineers,and physical scientists. At the doctorallevel,the index of dissimilarity between blacksanti iwhites in 1979 was 20, between AsiansArid whites, it was 26.
The relatively high proportion of womenamong black doctoral scientists and engi-
neers (23 percent in 1979) does norappearto affect the fieiti distribution of blacks.Although black men were more ely t5erijblack women to be physical, mathematical,and environmental scientists and engineers,over 70 percent of the black male doctoralscientists and engineers were still in thelife and social sciences and psychology.Among whites, 54 percent were in thesefields. .
The proportions of both blacks andwhites in the social sciences and psychol-
op increased between 1973 and 1979. For *"example, the proiVetion of blackg .0)19 weFe
social scientists increased from)8 percent .
in 1973 to 28 percent in 1979, when lacksrepresented 2 percept of all social scien-tists. Over thc same period, the proportionOf whites increased from 13 to 16 percent.Among Asians, the field distribution showed.relatively little change between 1973 and1979. Slight propoTtiortal declines werenoted foi most science fields,' while pro-portional increases were noted for engi-neering anctcompu ter specialties. in 1979,Asians represented 15 percent of all doc-toral-lever engineers and 7 peicent of alldo'ctoral physical scientists (figure 1-14).
Among native Ainerican doctoral scien-tists and engineers in 1979, almost 24 'per-cent were life -scientists, 24 percent werepsychologists, 17 percent were physicalscientists, and 18 percent were social sci-entists (tex''table 1-3).
.Work 'Activities and Sector of .
Employment
Data on wor/activities oy race are notavailable for all scientists and engineers.Hoavever, some identiAcation of differ-ences in work af thrities by race can begained by examining the activities of ex-perienced scientists and engineers (thosein the labor force at the time of the 1970
`Census of the Population), recent gradu-ates, and doctoral scientists and engineers.
Among experienced scientists and engi-neers, 30 percent of both blacks and whiteswere likely to-work in some aspect of man-
-agement (appendix table 23). Asians, how-ever, did !lot participate in management tothe same extent as their white or blackcialleagues; only 19 percent heldmanage-ment positions.
Among recent graduates at the bache%-lor's level, however, the findings havebeen mixed. Whites more often reportedmanagement as their primary wokactiv-ity than blacks or Asians (13 percent vS.-9 percent). Among recent master's degreeholders, blacks were more likely thanwhites or Asians to be.in management (17percent, 12 percent, and 6 percent; respec-tively).
Workactivities, Of doctoral scientists andengineers have shifted over time-. Forallraces, the proportions citing teaching astheir prim'ary activity have declined, whilethe proportions reporting management haveincreased. The most significant proportionalgains ikmanagernent were reported by
13

Asians, ftoin 12 percent in 1973 to 24.percent in 1979. Tor whites, the propor-tion in management remained stable ataround 23 percent; for blacks, the increasewas from 24 to percent. In part, thesechanges .ref.lect:sectorS1 shifts in employ -ment opportunities from educational institu-tions to business and industry.
Within educational institutions, however,whites' were more likely than blacks prHispanic's to be tenured.9 Of those whoreceived the,ir doctorates in science andengineering between 1900 and 1978 andwhp were academiCally @mployed in1,979,about 62.percent ofthe whites, 47 percent
...-of theblaats, and 64 percent of the Asianswere tenure{. racks were less likely thanwhites or Asians Co hold full professpr-slitp;:-Of these who earned \their degreesbetween -1960 and'1978, 28 p'ercent of the,whites and'Asians were at tbis rank in1979 compared to 19 percent of the blacks.it is interesting to note that most (9b per-cent) of the Asians holding full professor-ships were foreign born. Much smallerpercentages of whites, (13 percent) andblacks (27 percent) were foreign born.
Sector of employment affects a numberof employment characteristics, includingwork aciiVities and salaries. Reliable dataare not available by race fo all scientistsand engineers. Data by race, owever, areavailable- for some ssigments of the. WEwork force.
Among experienced'sciewists and engi-neers in 1978, almost two,thirdso of tIWwhites, one-third of theoblAks, and over'i'half of the Asians were in business andindustry. Among recent graduates at boththe bachelor's ancmaster's levels, Asianswere more likely than whites and whiteswere more likely than blacks to be in busi-ness and industry.
Most doctOral scientists and engineerswere in educational institutions in 1979: -although the proportion in educational insti-tutions has been declining for all racessince the early 1970's. Blacks, however,are still more likely than whites or Asiansto'be in educational institutions. Over two-fifths of the Asians and over one-quarter,.of -the whites were in business and indus-=try in 1979. Among blacks, only 12 per, ,cent were in this sector (figure 1-15).
Between 1973 and .979, emplliyment of.Asian doCtoral scientists and engineers inbusiness and industry more than tripled,while employment; of blacks vvas up one-
Imo
14
Figure 1.1iEmployed Ph.D. scientists and engineers by race and type ofemployer 1979
Nr
Business/Industry25.6%
Federal government7.9%
Nonprofit organizations 4.1%Statellocal governments 1.4%Other governments 1.5%
Other6.9%
Educational institutions63.3%
C.
Businesslindustry12.1%
White
Federalgovernment11.0%
Nonprofit organizations 4.4%Statellocal governments 0.8%
Other governments 1.5%
EduCational institutions63.3%
....Buslness/industry.
e41.7%
SOUBCE: Appendix table 29
Black
Other6.9%
S.
Other governments 0.3%Federal gdvernment 4.7%
Nonprofit.organrations 2.6%State/local governments
0 t1.1%
2.6%
Educational institutions 47% '
. Asian

.
REFERENCES
`-#. I1. U S. 110artment of Labcn?Employment and
Training Report of the President; 1979, p. 201.
2. See technical Notes for definitions of the fieldsof science and engineering-as well as methods used to
two grOups had tie same distributions of occupations,the index ocdissithilarity would be 0.0...." (p. 44).
4...For a.complete discussion of women in aca-deme, see National Academy of Sciences, Climbingthe Academic Ladder. Dqctorcil Women Scientists inIll&rdeme, Washington, 1979. ,5See Commission on Human Resources, "CareerOutcOmes In a Matched Sample tif Men and Women
D 's An Analytical Report, Washington, Na-tional Research Council, National Academy of So-/-ences, 1981.
o. Climbing the,Academic tidder, table 4.3, p. 60.
cla;s1Ey persons as scientists ancr engineers.
3 U S. Commission on civil Rights, So<ial Indi-cators of Equality for Minorities and Women, Wash-
. ington, August 1978,.p. 39. -The index_ representsthl percentage of a grip who would haye to changeoctupatiOns in order for the group to have the identical
.occupational distributions of a comparison group. If
4
16
4
A
I
t"
v
p
2
t
.
7.' U.S. Defartment of, Labor,.Bureau of LaborStatiSliCs, Employient and Earnings, Vol 26,No. 1,Washington, 1972, p. 172:
8 Social Indicat'ors of Equality for Minoritiesand Wbineri, p 39 lir
9 Data on tenure and rank are from the NationalResearch Council, EpploAtent of Minority Ph.D.'s:Changes Over Tide, Washington, NationetrAcad-emy of Sciences, 1981, pp 31and 32.
10. U S Department of tabor, Bureau of LaborStatistics, Employment arid Earnings, Vol. 27, No. 1,Washington, 1980, pp 191-193
11 Employment of Minority Ph D.'s, pp 3I-32.
4
I
1
:4*
ft

third, and white eniploymentwas up 45Rercept. .
The relatively high proportion of whites'and Asians in *business and industry re-sults from the concentration of engineersin industry. Whites and Asians are muchmore likely than black to be ,engineersrather tRaii scientists (text table 1-3).
Over 70 percent of the blacks are inthose fields of scienceSocial science, lifescience, and psychologyswhere employ-ment opportunities are concentrated in theacademic sector.
,HISPAN1C SCIENTISTS ANDtst NGINEER9
'
Staiistiea) information on the participa-tion of Hispanics in-science and'engineer-ing is limited beca USr of small sample sizesand high levels of nonresponse to clues-tifts relating to Hispanic status. For exam -'pie, in the NSF-sponsored 1979 Survey ofDoctorate Recipients, less than 1 percetitof the 'respondents reported they were His-
., panic, while 18 percent did not answer the
question.
Employment Level
Hispanics are as diverse ethnic group,and as the socioeconomic Vackgroundsand reasons for underrepresentation maydiffer among these groups, it is desirableto distinguish between Mexican- Ameri-cans", Puerto Ricans, and other Hispanics.UnfoOunately, because of data constraints,this report has had to treat Hispanics as anaggregate, and discUssion must be limitedto Hispanic scientists and engineers hold-.ing doctorates,
Persons of Hispanic origin are under-represented among the doctoral SZE pop-ulation. Although almost 5 pe.i.cent of allemployed persons5 years of age or olderclaim Hispanic origins, and-over 2 percentof all professional and related workers wereHispanic in 1979, Hispanics make up lessthan ..1 percent_of doctoral scientists anderlgineers.0 Among employed Hispanic doc-toral scientists and engineers, about 20 per-,cent wereribt-U,S. citizens in 1979, and anadditional 16' percent were foreign bornalthough"rolding U.S. citizenship. Almost2,600 doCtoial s'cielitists and engineers re-ported Hispanic origins in 1979. Most(2,460) were employed.
By most measures, the employment char-.actenstics of Hispanic scientists and engi-
e
neers at the doctoral level are similar tothose of their non-Hispanic colleagues.
4Field
The field distribution for Hispanic sci-'entists and engineers is Jorughly similar to'that for All- doctoral scientists and engi-neers (figure 1-16). Hispanics, however,are somewhat less likely than notilirspanicsto be environmental scientists=or engineers.
IP 1
Sex, Race, Age
About14 percent of doctoral Hispanicscientists and 'engineers were women in1979,,a higher peeeentagt than among alldoctoral scientists and, engineers (about 11percent) (a dix table 36).
N
Over onetird of those reporting His-panic origins did not report -their race in'1979, 58 percent reported their race aswhite.
Hispanic scientists are, on averageyouriget than their non-Hispanic'col-leagues in 1979, about 32 percent of theHispanics were under. 35 years ()rage,compared to`19 percent of all doctoral so-entists and engineers.
Work Activities and Sectorof Employment
Work act ities of HiNianic.and non-Hispanic doctoral scientists andengineersdo not differ significantly. Simillr propor-tions of both report teaching (30 percentvs. 29 percent) and R&D (34 percent vs.32 percent) as their primary work activities.
As with all doctoraLscien fists and engi-neers, over half 3 percent) of the Hispanicswere employedlry educational institutions,primarily 4-year colleges and imiverSities.Hispanics, however, are less likely thannon-Hispanics to be employed in buines5and industry (20 percent vs. 26 percents.
Within educational institutions, Hispanics'ry less likely than non-Hispanics to betenured." Of those who earned doctorate'Sbetween 1960 and 1978, 54 percedt of the.Hispanics were tenured in 1979, as com-pared .'rti 62 percent of all ratialiettinicgroups combined..About 22 percent of.the tenured Hispanics were foreign born.Hispanics also are less likely to hold fullprofessorships. In 1979, lo percent of theHispanics held this rank, as compared to28 percent of all racial/ethnic groups com-bined.
Figure 1-16. Field ditstributions of Ph.D. scientists and engineers:Hispanics and top!, 1979
Percent32
28
24
20
16
12
8
d 4
v.
0Life' Physical Social , Engi-
sciences sciences sciences nearing
SOURCES. Appendix teeters 7 and 36
All.Ph.D'i
Psycho) Mathe Environ...Computerogy matiaal mental .spectalties
sciences, sciences
Hispanic Ph.D.s
s-
./'
4
15
N
4

CHAPTER 2
Labor Market Indicators
'A ntimber of statistical measures are,useftil in assessing relative labor marketconditions (i.e., employment relative toavailable supply) for scientists and engi-neers.. These measures include standard
marketarket indicators such as labor forcep articipation rates, unemployment rates,salaries, measures of potential underem-ployment such as part -time employment,5nd-a measure ,,uniqiie to scientists andngineersthe S/E utilization. rate.
Labor force participation rates Measurethe fraction or the population of scientistsand engineers in the l*or- force, that is,working or seeking employment. Low laborforce participation rates imply that a sig-nificant fraction of those ri,iik!SiE train-ing and skills are not using their 'Skills inS/E jobs or any other jots. ,
Unemployment rates measure the prod-'portion bf those'in the labbk force who are, not employed but :seeking employment.Uneritployment rates can indicate labormarket problems$ and the different laborMarket experientes of men and womenand of minorities and the majority. Higherunemployment rates for w6men and min-orities may indicate That these groups facelabor market problems different from thoseIA men and the majority in the scientificand technical work force. Unemployment.
`fates,_however, are incomplete indicatorsof market Conditions fin:scientists and engi-neers. They do net measure underutiliza-tion, that is, the number of scie \tists and
'engineers in positiorts requiring skills below_':t lose that the job holders actually possess.More importantly, they do not indicate howsuccepsful those with education and train-ing in science and engineering are in find-
,
ing jobs inxience and engineering, nor do-they count "discouraged" workers whofiave,lat the labor force altogether becausethey could find no suitable work at all.
To help measure the mallet conditions.for scientists and engineers performing sci-ence and engipeering work, NSF has devel-oped the S/E utilization rate. This rate is ameasure of the degree to which scientistsand engineers who are working_in anyoccupation or looking for work (i.e., in the
labor force) actually have jobs in science onengineering.'
Degree of underemployment is also usefulas an indicator of thsextent to which sci-entists and engineers Mize their trainingand skills. When full-time jobs are notavailable, many accept part-time jobs, andwen jobs in science or engineering are notavItiable, some accept jobs outside'of sci-ence or engineering. Thus, some part-timeemploymente.g., working part-time butseeking full-time employmentis an,indi-cator of underemployment. Working in anon-S/E job when S/E work would bepreferred is another measure, although thelatter is necessarily subjective since itdepends on the perception of individualswho respond to survey questionnaires.
Salary lomparisons between men andwomen and between minority and major-ity scientists and engineers reflect differ-ent labor force, experiences among thesegroups.
The experience of recent S/E graduatescan also provide a sensitive barometer ortabor market conditions, since any changesin demand or employment practices arenormally. reflected in employer-hiringdecisions..Therefore, where available, in-formation pertaining to recent graduatesis included as part of the overall discussionof the various measures pf labor marketconditions.
Disparities in these labor market vari-ables between groups can reflect differ-ences in labor market behavior, differencesin demographic characteristics among thegroups, differences in behavior of employ-ers, or some combination of these factors..Depending on their causes, disparities canexaggerate problems or, filternatively, canmask subtle differences that have largerconsequences.
One question that arises for racial.mi-norities is the degree to which labor marketindicators are influenced by the relativelylarge number of minority women. I n.1e9,for example, abaft 23 percentof the.blackdoctoral scientists and engineers werewomen,Where data,are available and wlierethere are differences by sex within the racial
11,
or ethnic group, labOr market indicators arepresented for both men and women.
WOMEN SCIENTISTS ANDENGINEERS
Labor Force Participation Rates
Women scientists and engineers have astrong attachment to the labor force. In1978,; almost 90 percent Were in the laborforcethat is, working or seeking employ-ment. For men, the comparable rate was 92percent. Since the mid-seventies, labor forceparticipation of women scientists and engi-neers has risen 4 percentage points, whilethe rate for men remained essentially con-stant. The increasing participation of womenin the labor force partially reflects the gen-erally younger ages of women comparedto menyoung cohorts tend to participatein the labor force more than other age'cohorts.
Labor force participation rates for bothwomen and men vary by field. Withinfields, the rates, for women are generallyonly slightly. lower than those for men,(e.g., 89 percent vs. 91 percent in the lifesciences, 90 percent vs. 93 percent in thesocial sciences). There are, however, someexceptions. Female physical scientists aresignificantly less likely to be in 'the laborforce (70 percent) than their male coun-terparts (87.percent). Female mathemati-cal scientists and engineers are more likelythan their male colleagues to be workingor ,looking for work .(01. tcent vs. 82percent for mathematical scie ists, 94 per-cent vs. 92 percent for engineers) (figure2-1).
While female and male scientists andengineers show roughly similar participa-tion in the labor force, the participation ofwomen, scientists and engineers inthe laborforce is greater than that of all college-.educated women. In 1978, 63 percent of allwomen and 90 percent of all men with 4years of colltge were in the labor force.2
4mong doctoral scientists and engineers,the proportion of women participating inthe labor force is lower than that of men.
17
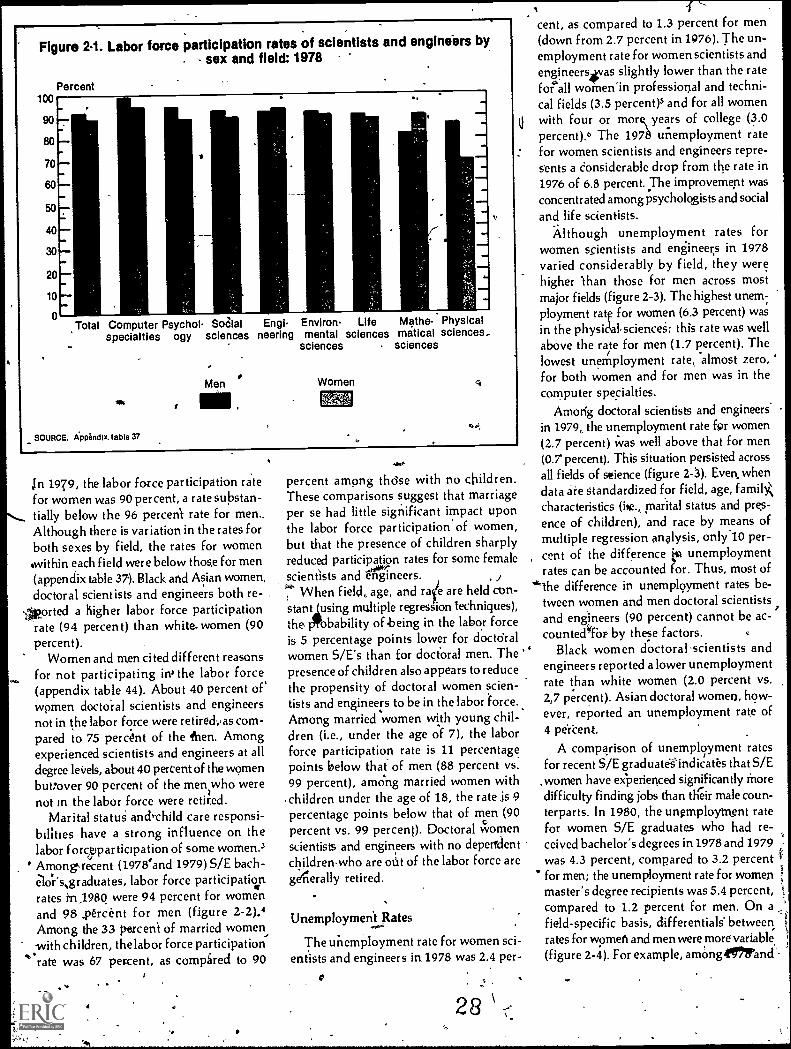
Figure 2.1. Labor force participation rates of scientists and engineers by. sex and field: 1978
100
90
80
70
60
50
40
30
20
10
0
Percent
Total Computer Psycho' Sala'specialties ogy sciences neering
Engi
SOURCE. ippendlx. table 37
Men
,
Environ Life Mathe- Physicalmental sciences matical sciences..
sciences sciences
Women
jn 1979, the labor force participation ratefor women was 90 percent, a rate substan-tially below the 96 percent rate for men..Although there is variation in the rates forboth sexes by field, the rates for women*within each field were below those for men(appendix table 37). Black and Asian women,doctoral scientists and engineers both re-
Aorted a higher labor force participationrate (94 percent) than white.. women (90percent).
Women and men cited different reasonsfor not participating inc the labor force(appendix table 44). About 40 percent ofwomen doctoral scientists and engineersnot in the labor force were retiredvas com-pared to 75 percent of the *hen. Amongexperienced scientists and engineers at alldegree levels, about 40 percent of the womenbutrover 90 percent of the men who werenot in the labor force were retired.
Marital status and,thild care responsi-bilities have a strong influence on thelabor forcswarticipation of some women.3
' Amongrecent (1978'and 1979) S/E bach-elor's,graduates, labor force participationrates in 1980 were 94 percent for womenand 98 .percent for men (figure 2-2).4Among the 33 percent of married womenwith children, the labor force participationrate was 67 percent, as compared to 90
percent among those with no children.These comparisons suggest that marriageper se had little significant impact uponthe labor force participation of women,but that the presence of children sharplyreduced participation rates for some female
.mg<scientists and engineers.
When field,, age, and rlie are held con-...
stantlusing multiple regression techniques),the prbbability of being in the labor forceis 5 percentage points lower for doctdralwomen 5/E's than for doctoral men. Thepresence of children also appears to reducethe propensity of doctoral women scien-tists and engineers to be in the labor force.Among married women with young chil-dren (i.e., under the age of 7), the laborforce participation rate is 11 percentagepoints below that of men (88 percent vs.99 percent), among married women with
.children under the age of 18, the rate is 9percentage points below that of men (90percent vs. 99 percent). Doctoral Women
scientists and engineers with no dependentchildren who are oOt of the labor force aregeeilerally retired.
1cent, as compared to 1.3 percent for men(down from 2.7 percent in 1976). The un-employment rate for women scientists andengineers vas slightly lower than the ratefor all women to professional and techni-cal fields (3.5 percent)5 and for all womenwith four or more\ years of college (3.0percent).6 The 1978 unemployment ratefor women scientists and engineers repre-sents a considerable drop from the rate in1976 of 6.8 percent. The improvement wasconcentrated among psychologists and socialand life scientists.
Although unemployment rates forwomen scientists and engineers in 1978varied considerably by field, they werehigher 'than those for men across mostmajor fields (figure 2-3). The highest unem;ployment rate for women (6.3 percent) wasin the physickascience; this rate was wellabove the rate for men (1.7 percent). Thelowest unemployment rate,, almost zero, 'for both women and for men was in thecomputer specialties.
Among doctoral scientists and engineersin 1979,, the unemployment rate for women(2.7 percent) was well above that for men(0.7percent). This situation persisted acrossall fields of science (figure 2-3). Even, whendata are standardized for field, age, family',characteristics (ice.,, marital status and pres-ence of children), and race by means ofmultiple regression analysis, on1110 per-cent of the difference unemploymentrates can be accounted for. Thus, most of
'"the difference in unemployment rates be-tween women and men doctoral scientistsand engineers (90 percent) cannot be ac-counted"Tio by these factors.
` Black women doctoral cientists andengineers reported a lower unemploymentrate than white women (2.0 percent vs.2,7 percent). Asian doctoral women, how-ever, reported an unemployment rate of4 peitent.
A comparison of unemployment ratesfor recent S/E graduatglndicares that S/E
,women have experienced significantly moredifficulty finding jobs than their male coun-terparts. In 1980, the unemployment ratefor women S/E graduates who had re-ceived bachelor's degrees in 1978 and 1979was 4.3 percent, compared to 3.2 percent C
for men; the unemployment rate for womenmaster's degree recipients was 5.4 percent,compared to 1.2 percent for men. On afield-specific basis, differentials' betweenrates for women and men were more'variable(figure 2-4). For example, amongenrand'
Unemployment Rates
The unemployment rate for women sci-entists and engineers in 1978 was 2.4 per-

9.
Figure 2-2. Labor force participation rates for recent" science andengineering graduate,s by sex and field: 1980
Bachelor's100
Percent
90.
80
70
60
50
4D
30
20
10
0ti to to ti -
Total Computer° Engi- i3sychol-specialties nearing ogy
100Percent
90
80
70
60
50
4
30
20
10
0
Mathe- Environ- Physicir Life Socialmatical mental sciences sciences sciences
sciences sciences
Master's
Total Computer Engi- Psychol Mathe- Environ- Physical Life Socialspecialties neering ogy matiCal mental sciences sciences sciences
science, sciences°
*Men Women
1 Recent graduates are those who received a bachelor's or master's degree in 1978 or 1979.
SOURCE: Appendix table 50
f
29 ;;;z4119::
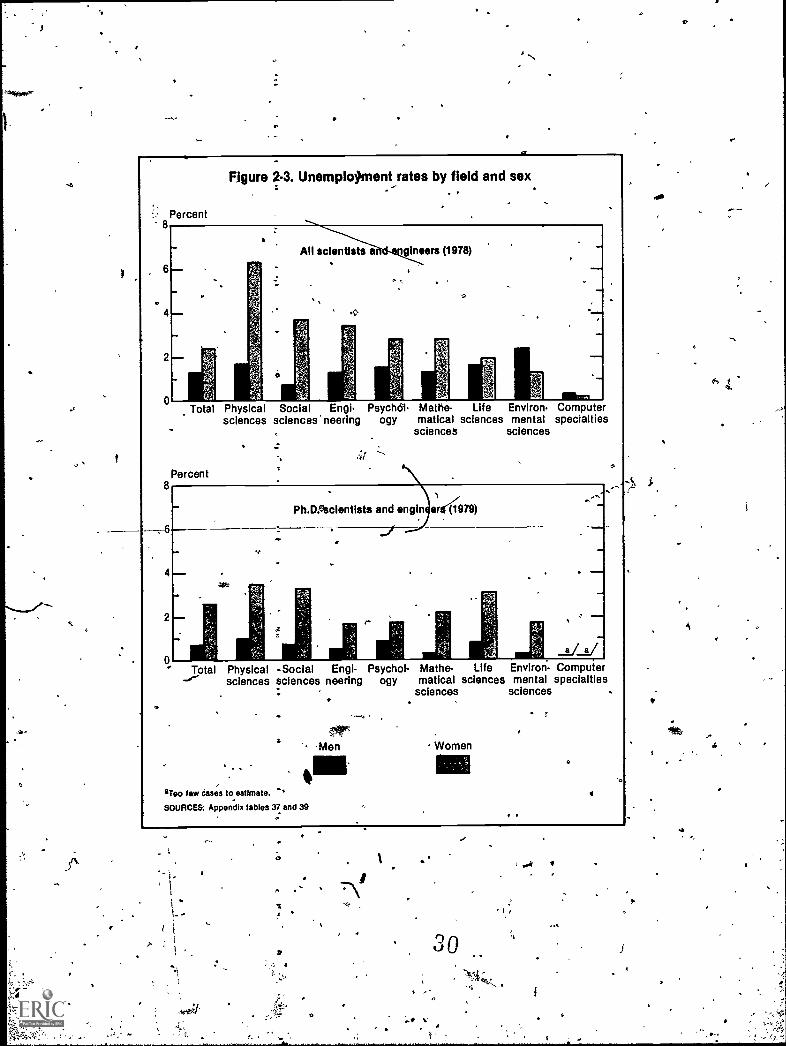
0Total Physical Social Engi- Psychdi Mathe- Life Environ Computer
sciences sciences' neering ogy matical sciences mental specialtiessciences sciences
Figure 2-3. Unemplo9ment rates by field and sex
tf
40
Total Physical -Social Engi- Psychol- Mathe- Life Environ- Computesciences sciences neering ogy matical sciences mental specialties
sciences sciences
aToo faw cases to estimate. .4
SOURCES: Appendix tables 37 and 39
ffirMen Women
1 .
30
J

Figure 24. Unemployment rates of recent' S/E baccalaureates by sex andfield: 1980'
Percent9
8
7
6
5
4
3
2
1
0Total Environ- Life Social Psychol- Computer Mathe- Physical
mental ,sciences sciences ogy specialties matical sciencessciences sciences
Men
1 Recent baccalaureates are those (tom the classes of 1970 and 1979.
SOURCE: Appendix table 50
Women
Engi-neering
Figure 2-5. S/E utilizatir rates by field and sex: 1978
.
Total COmptiter Engl- Physical Environ- Life. Psychol- Social Mathe 'specialties veering sciences mental sciences ogy sciences matical
sciences sciences .
sotm Appendix table 37
Men ,Women
31....7tIA-7.
. .1979 bachelor's degree gra' duates surveyed'in 1980, women experienced higher unem-ployment rates in the computer specialtiesand life sciences, and lower unemploy-ment rates in engineering and the ma the-maticarand social sciences.
S/E Utilization Rates
The S/E utilization rate measures theextent to which scientists and engineers inthe labor force are employed in science orengineering occupations. A low S/E utili-
. zatjon rate could be an indicator of under-utilizationdepending on the reasons fornon-S/E employment And the' extent ofunemploymeut. Pictors relating to non-S/Eemployment inckdelleck of available S/Ejobs, higher pay for non-S/E employmentand loalicital preference.
Among all scientists and engineers inthe labor force in 1978men were muchinore, likely than women to have jobs inscience or engineering; the S/E utilizationrate for men was 86 percent, compared'to57 percent for women.
S/E utilization rates for women in 1978were lower than the rates for men in allfields except computer specialties (figure2-5). The ,difference was greatest amongsocial s iendsts (59 percent vs. 19 percent)ands allest among engineers (94 percentvs. 87 percent).Differences in field distri-
. buti exprain 'bout 40 percent of theJiff e,nce in
`the overall male and female '
utilizatio rates, but theIther 60 pef-celsLlaamains u ained. Even if the fielddistribution for women and men Were identi,cal, the SZE ,utilization rate for women,which would then increase from 57 to 74
c percent, would stilt remain below the 86 *.---pefcent rate for men:
Ainong doctoral scientists and engineersin 1979, the S/E utilization rates for womenand men were closer (87 percent and 91percent) than were the rates for other cohortsstudied. However, rates for women werelower that those for men across -all majorfields except computer specialties and en-vironmental sciefkei, where they wereessentially equal. . ,
.As measured by the S/E utilization rate
black warten doctoral scientists and engi-tteers:werk less likelY.than their white and,Asian counterparts to heiliibs in science 7or engineering. In 1979, the S/Eptilizationrate for these black women wAs 83 per-cent, as compared to 87 and 90 percent forwhites and Asians.,In most fields, however,minority doctoral women reported rates
". 21

similar to or higher than those of theirwhite colleaguss'(text table 24). Notable
-exceptions were black women in the phys-ical sciences and psychology and Asianwomen in psychoRty.
Tafi le 2-1. S/E utilization rates fo r doctoralwomen scientists and engineers by
fief and race: 1979
Field . White Black Asiari.
All fields 87 , 83 90Physical sciences 86 80 85mathematicdt
sciences 90 100 93Computer
specialties 99' 100 . 100Environmental
sciences 96 - 100 100Engineering 91 100 96Life sciences 91 90 95Psychology 90 81 74Social sciences 77 76 83
Source Appendixteble41,
Among recent S/E graduates, the S/Eutilization rate for women was considera-bly below that for men at both the bache-lor's and master's levels (appendix table60). Among 1978 and 1979 bachelor's degFeerecipients, the S/E utilization rate for womenin 1980 was 37 percent, compared topercent for men. This difference was partly areflection of the fact that over a third ofthe men: engineers and over one-halfof the women were social scientists. If.engineering graduates ire-eliminated fromthe analyis and only seience graduates areconsidered, the S/E utilization rates formen and women are more similar (4i4,er-cent and 34 percent) (figures 2-6). n'Withiindividual fields, differences in S/E utili-zation ratesbetven men and women weresmall, although the rates for women weregenerally below those for men.\Only amongcomputer specialists was the rate fot womenabove that for men (figure 2-6).
For bOth men and women, S/E utiliza-tion rates inceease with additional years ofeducation, but ththe for 'women remainberow those for men across all major fields.At the master's level, the -S/E utilization,r e in 1980 for recent male degree recipi-ent was 84 percent: up from 58 percentfor b elor's recipients, for recent femalemaster's. graduates, the rate was 67 per-ce t, up from 37 percent for_bachelor's.T sq relatively low ccalaureate ratesfor oth sexes in som cience fields (e.g.,psyc ology and soc I sciences) suggestthat for these fields the bachelor's is not anadequate entry, level degree in rpost Jabor
.markets.
22
f.
. -Figure 2.6. SIE utilization rates.for recent' graduates by
sex and field: 1980
Bachelor's
3r.
100
90
80
70
60
50
40
30
Tot I Engi- Computer Physical Mathe- Environ- Life Social Psycholneering specialties sciences matical mental sciences sciences ogy
, sciences sciences
Master's
10
0Total Engi- Cernputer Phys I
neering specialties scienc
Men
Math& Environ Life Social Psychol-matical mental sciences sciences ogy
sciences sciences
ME %men
1Recent graduates are those who' received a bachelor's degree in 1978 or 1979.
SOURCE: Appendix table 50
Salaries *.
Salary differences between male andfemale scientipts and engineers reflect dif-ferences in labor Market behavior, demo-graphic, characteristics, employer behavior,or some combination of these.factors.
Among doctoral scientists and engineersin 1979: average salaries paid to womenwere 77 'percent of those paid to men (fi ure2-7). For all fields combinscl,, the av ageannual salary for men with S/E do orates
t;32,
' ,
.
Was $29,900; e average for women was$23,100. This pattern appears across allS/E occupations and across all types ofemployer and work activities. If data arestandardized for occupation, race, sectorof employment, and years of professionalexperience, the'differenti narrows from23 to 10 percent. Thus, over of the sexdifferential in salaries canbattributed tothese factors, but almost half remains unex-plained.
.
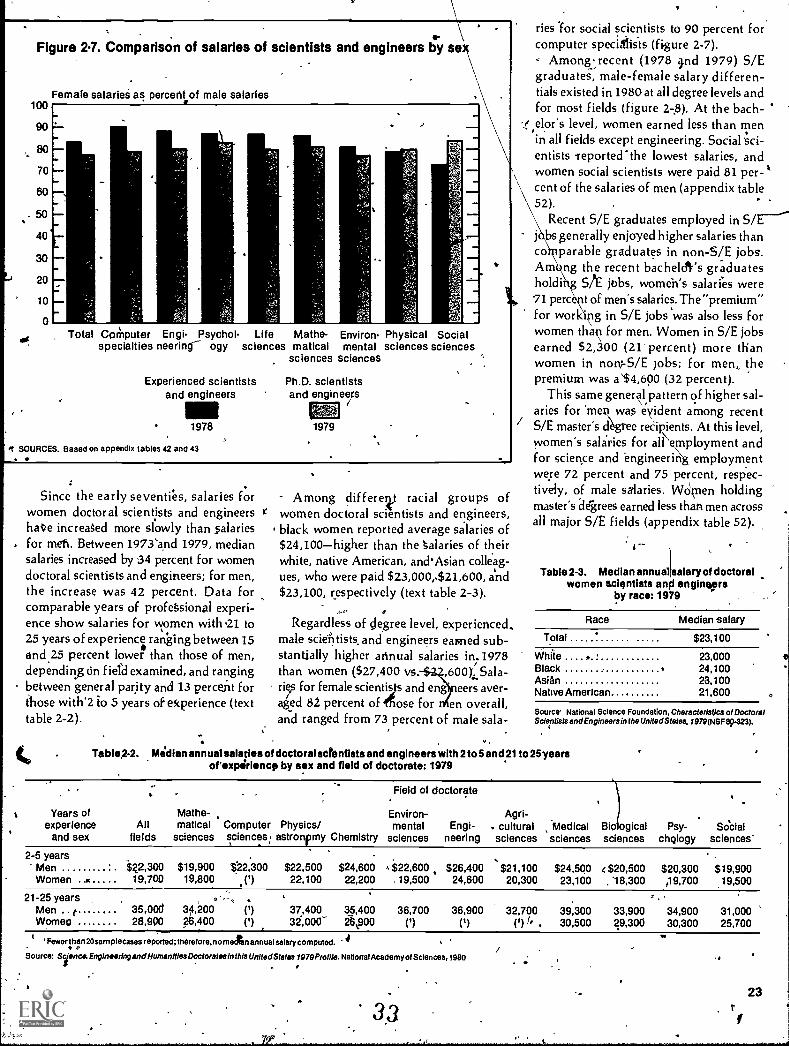
Figure 2.7. Comparison of salaries of scientists and engineers by se
100
90
80
70
60
50
40
30
20
10
0
Female salariei as percent of male salaries
Total Cor)nputer Engi- Psychol- Life Mathe-specialties neering ogy sciences matical
sciences
Experienced scientistsand engineers
1978
K SOURCES. Based on appendix tables 42 and 43.
Environ- Physical Socialmental sciences sciences
sciences
Ph.D. scientistsand enginer
1979
Since the early seventies, salaries forwomen doctoral scientists and engineershate increased more slowly than ;salariesfor theft. Between 1973'and 1979, mediansalaries increased by 34 percent for womendoctoral scientists and engineers; for men,the increase was 42 percent. Data forcomparable years of prof8sional experi-ence show salaries for women with .21 to25 years of experience ranging between 15and 25 percent lower than those of men,depending On field examined, and rangingbetween general parity and 13 percent forthose with'2 to 5 years of ekperience (texttable 2-2).
Among different racial groups ofwomen doctoral scientists and engineers,black women reported average salaries of$24,100-higher than the Salaries of theirwhite, native American, andAsian colleag-ues, who were paid $23,000,.$21,600, and$23,100, respectively (text table 2-3).
Regardless of degree level, experienced,male scientists. and engineers earned sub-stantially higher annual salaries in. 1978than women ($27,400 vs. ,600);...Sala-ri7 for female scientists and eng eers aver-aged 82 percent of dose for __en overall,and ranged from 73 percent of male sala-
.. ,
Table2-2. Median annual salaries of doctoral sCrentlstsand engineers with 2to 5 and 21 to 25yearsof 'experience by sex and field of doctorate: 1979
ries Tor social scientists to 90 percent forcomputer specialists (figure 2-7).
Amoncrecent (1978 ind 1979) S/Egraduates, male-female salary differen-tials existed in 1980 at all degree levels andfor most fields (figure 2-8). At the bach-
./. elor's level, women earned less than menin all fields except engineering. Social sci-entists Teporter the lowest salaries, andwomen social scientists were paid 81 per- `cent of the salaries of men (appendix table52). .
. .
Recent S/E graduates employed in S/E---j bs generally enjoyed higher salaries thanco parable graduates in non-5/E jobs.Am ng the recent bacheldVs graduatesholdi SA jobs, women's salaries were71 percent of men's salaries. The "premium"for working in S/E jobs was also less forwomen than for men. Women in S/E jobsearned $2,300 (21' percent) more thanwomen in non;-5/E jobs; for men,, thepremium was a'$4,600 (32 percent).
This same general pattern of higher sal-aries for 'men was evident among recentS/E master's Agree recipients. At this level,women's salaries for al \I employment andfor science and engineering employmentwere 72 percent and 75 percent, respec-tively, of male salaries. WOrnen holdingmaster's degrees earned less than men acrossall major S/E fields (appendix table 52).
Table 2-3. Median annualwomen scientists ani
by race: 19
salary of doctoralengineers
9
Race Median salary
Total $23,100
White 23,000Black 24,100Asian 23,100Native American 21,600
Source' National Science Foundation. Characteristics of DoctoralScientists and Engineers in the United States. 1979(NSF89-323).
Years ofexperience
and sexAll
fields
Field of doctorate
Mathe- Environ-matical Computer Physics/ mental
sciences sciences; astronpmy Chemistry sciences
Agri-Engi- . cultural Medical
neering sciences sciencesBiologicalsciences
Psy- &id&chglogy sciences'
2-5 years'$21,100Men $22,300 $19,900 $22,300 $22,500 $24,600 s $22,600 $26A00 $24,500 $20,500 $20,300 $19,900
Women 19,700 19,800 (') 22,100 22,200 19,500 24,600 20,300 23,100 18,300 .19,700 19,500
21-25 years -,Men ..t 35,000 34,200 37,400 35,400 36,700 36,900 32,700 39,300 33,900 34,900 31,000Womee 28,900 26,400 C) 32.000' 21,900 (I) (I) (') I. . 30,500 29,300 30,300 25,700
t' Fewer t han 20 sam ple cases reported; therefore. no mectan annual salary com puled..
Source: Science, Enginswing and Humanities Doctorates In this United States 1979Proille. National Academy of Sciences, 1980States;
.4
23

C
110
100
90
80
70
60
50
40
30
20
10
0
Figure 2.8. Comparison of salaries of recent' graduate scientistsand engineers by sex
Female salaries as percent of male salaries
Total Engi- lAathe Computer Physical Life Psycho!. Environ Socialneering matical specialtiesziences sciences ogy mental sciences
sciences sciences
fa,0*it .4
Bachelor's Master's
Recent S/E graduates are those4ho received a bachelors or master's degree in 1978 or 1979.
SOURCE: Appendix table 52.
As
Table 2-4. Reasons for non-S/E employment by sex(percent)
cent of the women in non-S/E'jobs.saidthey were hi such jobs becauseof personalpreference, promotions, or higher pay, but alarger proportion of wothen (r percent)''than men (7 percent) said th y were innon-S/E jobs because they beAvA;d jobs inscience and engineering were not available.In'adaition, women were almost twice aslikely as men to cite locational prefegenceas the reason for working outside of sci-ence or engineering (13 percent vs. al:most.7 percent). Among both sexes, however,:..30 percent'did not report reasonsfor non-S/E employment.
Total innon4S/E
.Prefernon-S/E
Pro-motion
Betterpay
Loca-
pref-erence
S/..Ejobnot
available
'
Other'
.Experienced scientists andengineers (1978)
Men 100 15 35 if 7 7 29
' Women, 100 17 8 19 13 13 30
Doctoral/scientists andengineers (1979)
1/4
Men 100 21 23 6 1 8 41
Women s.... , 100 19 14 5 3 23 37
Bachelor's (1978 and 1979classes in 1980)
Men ....Women /
100100
5158
1610,
45
2123
73
',
Master's (1978 and 1979classes in 1980)
Men 100 -73 44. 2 7 2 12 5
Women 100 734, 1 .4 5 17 .1,.
'Includes no report.
Source. Appendix tables 44 and 53.
Underemployment
t9epencling upon the reason (e.g., pref-
erence for an SiE job but perceiving thatnone is avaflable), non -S/ employmeritmay be an indidetor of uifderutilization.
24
4.
Women are more likely than men to bein non -S /E jobs. Reasons. cited for work-ing outside of silence and engineering differbetween} the sexes (text table 2-4). Among.experienced scientists and engineers, almost60 percent of the men and almost 45 per-
34
Among doctoral scientists and engineers,more women than men (23 percent vs. 8
percent) reported the perception that a jobin science or engineering was not availableas the principal reason for workineout-side of science or engineering (text table2-4). Women were also more likely thanmen to cite locational preference as thereason for non -S/E employment, but thepercent for both sexes was very low. Non -SAE preference, promotions, or better paywere more often cited by men than womenas reasons for non -S /E employment (50percent vs. almost 40 percent). Roughly40 percent of both men and women, how-ever, did not report their .reasons for (oS/E employment.
Among recent S/E graduates at the bath-ekes level, women were somewhat morelikelYe, than men to cite preference as thereason for non -SE employment (text table2-4); whereas men were more likely thanwomen to it better pay and promotion.At the hipster's level, reasons for non-S/Eemployment for women and men were sim-ilar. Over 80 percent of both men andwomen cited preference, promotion, payorlocation as reason for working outsideof science and engineering.
Depending on the reason for acceptingthe job, part-time work may be an indica-tor of underutilization. Some peopleworkpart time because they choose to; otherswork part time but would prefer full -timeemployment. This latter group could be .considered underutilized..
In the.total U.S. work force, women aremore than twice as likely as men to holdpart-time jobs. In 1980, about 25percentof-employed women and 9 percent ofemployed men were working part time.7' 4Scientists and engineers were less likely forbe employed part time. Among experiencedscientists and engineers,8 women were morelikely than men to hold part-time jobs; of
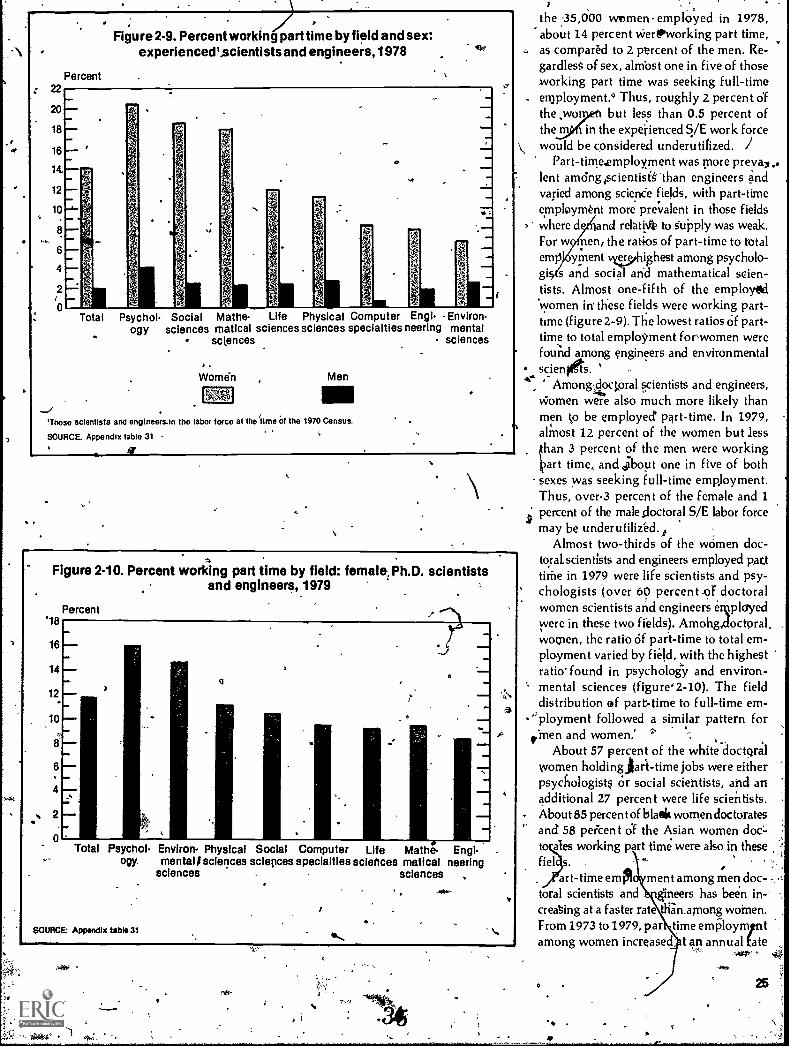
20
18
16
14
12
10
Figure 2-9. Percent working parttime by field and sex:experiencedi,scientists and engineers, 1978
Total Psychol- Social Mather- Life Physical Computer Engi- Environ-ogy sciences matical sciences sciences specialties neering mental
sciences sciences
Womdn Men
'Those scientists and engineersln the labor force at the time of the 1970 Census.
SOURCE. Appendix table 31
.4
Figure 2.10. Percent working part time by field: female, Ph.D. scientistsand engineers, 1979
Percent18
16
14
12
10
8
6
4
2
0Total Psychol- Environ Physical Social Computer Life Mathe- Engi-
ogy mental/ sciences sciences specialties sciences matical neeringsciences sciences ,
SOURCE: Appendix table 31 .4
the 35,600 women emplOyed in 1978,about 14 percent Wert working part time,as compared to 2 percent of the men. Re-gardless of sex, almbst one in five of thoseworking part time was seeking full-timeen3ployment.o Thus, roughly 2 percent ofthe ,wo but less than 0.5 percent ofthe in the expetienced S/E work forcewould be considered underutilized. I
Part-tirne.kmployment was more preva,.lent amOng,scientisf4' than engineers andvaried among science fields, with part-timeemployment more prevalent in those fields
, where d and relati* to supply was weak.For w en, the ratios of part-time to total.emp yment ozas- hiOest among psycholo-gi s and social and mathematical scien-tists. Almost one-fifth of the employod'women in these fields were working part-time (figure 2-9). The lowest ratios of part-time to total employment for-women werefound among engineers and environmental
.. scienets. ' r,
A .- Amon4doctoral scientists and engineers,Women were also much more likely thanmen ko be employed part-time. In 1979,alinost 12 percent of the women but lesshan 3 percent of the men were workingart time, and ;bout one in five of both
sexes was seeking full-time employment.Thus, over3 percent of the female and 1
ipercent of the male loctoral S/E labor forcemay be underutilized.,
Almost two-thirds of the women doc-toralscientists and engineers employed panttime in 1979 were life scientists and psy-chologists (over 60 percent -of doctoralwomen scientists and engineers erqplo'yedwere in these two fields). Amohaoctoral,women, the ratio of part-time to total em-ployment varied by field, with the highestratio' found in psychology and environ-mental sciences (figure'2-10). The fielddistribution of part-time to full-time em-
"ployment followed a similar pattern forR.,linen and women.'
4 ,
About 57 percent of the white-doctoralwomen holding jari-time jobs were eitherpsycimlogists Or social scientists, and anadditional 27 percent were life scientists.About 85 percent of blatit women doctoratesand 58 per-cent of the Asian women doc-t ales working part time were also in thesefiel s.
c
.,,
art-time emOl men t among men doc- 'toral scientists and gineers has been in-creating at a faster rat drill among women.From 1973 to 1979, par time employmintamong women increased t an annual fate
-..m. 4
-4 .

of about 7 percent, for men, the increasewas slightly over 10 percent.
RACIAL MINORITY SCIENTIfTSAND ENGINEERS
Labor Force Participation Rates -
Regardless of race, scientists and engi-neers have high rates of participation inthe labor force. Both black and Asian sci-entists and engineers reported laborforceparticipation rates of 95 percent or highervitin 1978. For whites, the rate was 91#4r-cent. Since the mid-1970's, the lab; r fdrce -V
participation rate has remained relativelyconstant for whites while rising slightlyfor blacks and Asians. Generally, blackand Asian scientists and engineers wereyounger than their white colleagues andwere therefore less likely to be out of thelabor force because of retirement or poorhealth. Higher labor force participation ratesfor blacks and Asians, compared to therates for whites, were evident across mpstS/E fields (figure 2-14/ Minority scientists and engineers were
. more likely to participate in the labor forcethan minority collegesraduates in general.
Roughly 88 percent of all minority grad-uates were in the labor force;!0 somewhatbelow the rate repSrted for minority scien-tists and crieneers. '
Labor force participation rates for min,ority doctoral scientists and engineers werehigher than the 'rates for those at otherdegree,levels. In 1179, slack doctoral.sci-erinsts arid engineers reported a rate Of 95.percent, the same as the rate for whites,While Asians reported a rote of 08 percent.There was little variation by field (appen-dix table 40). Native American doctoralscientists and engineers, of whoin therewere almOsi 1,1:10 in 1979, reported a. laborforce partiCipation rate of 97 percent.-
Cabor force participation was also strongfor S/E graduates At both the bachelor'sand `Master's degree levels. Only blackbachelor's degree recipients.in mathemati:'cal sciences, black master's degree recipi-ents in engineering, and Asian master'sdegree recipients in socialscierire's showedlabor force participation rates below 90percent (appendix - ;table 51).
Unemployment Rates '
Over l unemploymerycrates for scien-tists and engineers did not, on average,
Figure 2-11. Laor force participation rates by field and race: 1978
Percent100
90
80
70
60
50
40
30
20
10
0'Total
rt1.4
Environ- Computer Engi- Social Physical Mathe- Lifemental specialties fleeting sciences sciences matical sciences
sciences sciences.
al: few cases to estimate.
s Ace Appendix table 38
White Black ,Astalg,
Psychol-
4 .
1- 36et
vary by race. Black, white and Asian scien-fists and engineers experienced about the.same unemployment rates in 1978, 1.5 per-cent, compared to, for "'example, 4.7 per-cent forT11 blacks with 4 or more years ofcollege.it\, Among doctoral scientists and engineers,blacks reported higher unemploymentiatesthan their Asian or white colleagues.(2.8percent, representing 100-individuals, vs.about 1 percent, representing 2,700 indi-viduals). The largest number of unemployedblack doctoral scientists (43) were socialscientists. Among blacks, the unemploy-ment rate for men (3 percent) was abovethat for women 1;2 percent).
Among recent'Sjsradtiates, blacks havesignificantly higher unemployment ratesthan either whites or other minorities atboth the bachelor's and master's degreelevels. In 1980, the black unemploymentrate was over 9 percent at the bachelor'slevel, compared to 3 3 percent for white.and 4.8 percent for other minorities Atthe master's level, black S/E gradautes hadan unemployment rate of almost 13 pier-
t, compared to 2.6 percent for whites(appendix table 51).
If adjustments are made for iield differ-ences, the unemployment rate for blackrecent graduates,at the bachelor's leveldetnes to.,_?bout 7 i)ercent. (from 9 per-cen ),.still fonsiderably above the rate forwhites.
S/E Utilization Rates
° The S/E utilizatioan rate is a measureofthe degree to which those scientists or engi-neers whoare working in any occupationor Looking for work (i.e. the labor force)have jobs in science or engineering. Amongexperienced scientists and engineers,12blacks, Asians, and whites had similar S/Eutilization rates in 1978 (.98 percent forAsians, 93 percent f-or blacks, and 95 per-cent for whites).
, Among doctoral scientists and engineers;blacks were slightly less likely than othersto hold dijobs in science or engineering, whilenative Americans and Asians were the mostlikely to holcf,such jobs. In 1979; the S/Eutilization rate was'86 percent fof blacks,93 percent for native Americans and ASiaris,and 91 percent for whites (appendix table40). S/E Utilization rates in 'most fieldswere lower for black doctoral scientistsand engineers than for whites; the excep-tions were in the mathematical and. envi-ronmental sciences and computer special-
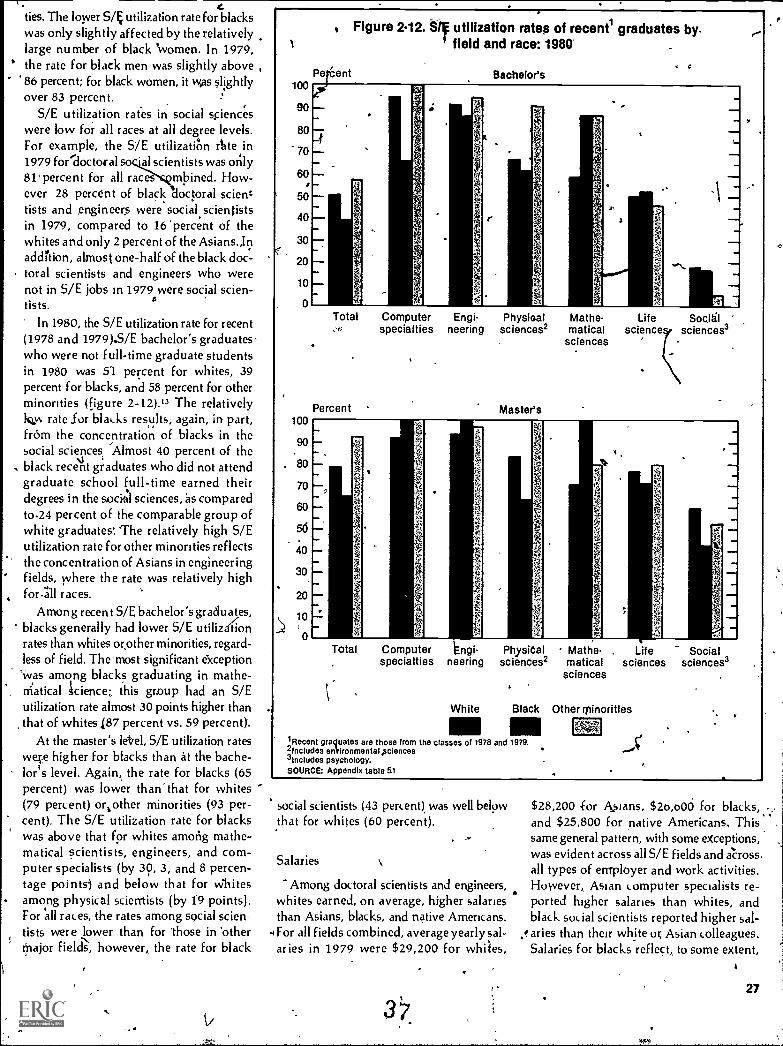
ties. The lower S/k utilization rate for blackswas only slightly affected by the relativelylarge number of black 'women. In 1979,the rate for black men was slightly above
' 86 percent; for black women, it was slightlyover 83 percent.
S/E utilization rates in social scienceswere low for all races at all degree levels.For example, the 5/E utilizatiOn rte in1979 for'cloctoral so al scientists was wily81' percent for all races mbined. How-ever 28 percent of black doctoral scienttists and engineers were social scientistsin 1979, compared to 16 'percent of thewhites and only 2 percent of the Asians.,Inaddition, almost one-half of the black doc-toral scientists and engineers who werenot in S/E jobs in 1979 were social scien-tists.
In 1980, the S/E utilization rate for recent(1978 and 1979).S/E bachelor's graduates'who were not full-time graduate studentsin 1980 was 51 percent for whites, 39percent for blacks, and 58 percent for otherminorities (figure 2-12).13 The relatively
rate for blacks results, again, in part,from the concentration of blacks in thesocial sciences Almost 40 percent of theb lack recent giaduates who did not attendgraduate school full-time earned theirdegrees in the social sciences, as comparedto.24 percent of the comparable group ofwhite graduates.. The relatively high S/Eutilization rate for other minorities reflectsthe concentration of Asians in engineeringfields, where the rate was relatively highfora races.
Among recent S/E bachelor's graduates,blacks generally had lower S/E utiliz onrates than whites or other minorities, regard-less of field. The most significant exceptionwas among blacks graduating in mathe-
', niatical science;, this group had an S/Eutilization rate almost 30 points higher thanthat of whites187 percent vs. 59 percent).
At the master's letel, S/E utilization rateswere higher for blacks than at the bache-lor's level. Again, the rate for blacks (65percent) was lower than' that for whites(79 percent) orother minorities (93 per-cent). The S/E utilization rate for blackswas above that for whites amorig mathe-matical scientists, engineers, and com-puter specialists (by 30, 3, and 8 percen-tage points') and below that for Whitesamong physical scierrtists (by 19 points).For all races, the rates among social scien-tists were lower than for those in 'otherMajor fiel&, however, the rate for black
100
90
80
70
60
50
40
30
20
10
0
Figure 2.12. ttf utilization rates of recent' graduates by.field and race: 1980
Pe ent Bachelor's
r-
Total
Percent100
90
. 80
70
60
5d
40
30.
20
10
0
Computerspecialties
Engi-neering
Physicalsciences2
Master's
Mathe-matical
sciences
Lifescience
Sociglsciences3
'*.
lli
Ir
Po
.1
Total Computer kngi-specialties neering
White
Physidal Mathe- , Life Socialsciences2 matical sciences sciences3
sciences
Black Other minorities
1Recent graquates are those from the classes of 1978 and 1979.2lncludes enVironmental.sciences3lncludes psychology.SOURCE: Appendix table 51
social scientists (43 percent) was well belowthat for whites (60 percent).
Salaries
"Among doctoral scientists and engineers,whites earned, on average, higher salariesthan Asians, blacks, and native Americans.For all fields combined, average yearly sal-aries in 1979 were $29,200 for whiies,
$28,200 for Asians, $26,600 for blacks,and $25,800 for native Americans. Thissame general pattern, with some exceptions,was evident across all S/E fields and across.all types of employer and work activities.However, Asian computer specialists re-.ported higher salaries than whites, andblack social scientists reported higher sal-aries than their white or Asian colleagues.Salaries for blacks reflect to some extent,
27

the relatively large number of black womenamong blacks holding doctorates (23 per-cent in 19,79). Among black doctoral sci-entists and engineers, annual salaries were$27,500 for men and $24,100 for women.
'Among recent (1978 and 1979) S/E grad-uates at the bachelor's level; whites, onaverage, earned $2,000 more than blacks
;in 1980, while other minorities (primarilyAsians) earned almost $4,000 more thanblacks. Among this group, blacks earnedhigher salaries tlin whites,isri engineeringand mathematical sciences (figure 2-13),and other minorities earned slightly highersalaries than whites in the life and socialsciences.
Underemployment
Unem.gloyrniht rates and S/E utilizationrates are only partial indicators of the ex-tent to which those with S/E training utilizetheir training and skills in their work ac-tivities. Some scientists and engineers areemployed part-time. Moreover; amongscientists and engineers who are eitheremploye'd part time or tt1 non-S/E jobs,some are so employed by choice and othersare so-employed igyvoluntarill. In order to.assess the extent ti,which non-S/E-and'part-time employment may representunder-employment, therefore, one must furtherinvestiga te.the reasons for These employ-ment statistics..
The reasons for non -S /E employmentamong doctorates vary somewhat by race(text table 2-5). Although AsianS/E doc-torates were more likely than either whitesor blacks to hold jobs in science or engi-neering, Asians were more likely than otherracial groups to report that S/E jobs werenot available and least likely to cite promo-tion as the reason for working ,outside ofscience and elipeering. For each racialgroup, howe 0 to 50 percent of thoseworking outside of science and engineer-ing did not report reasons for this non-S/E
,employment.Among recent (1978 and 1979) S/E grad-
uates, the reasons for employment outsidescience and engineering also varied amongthe racial groups. Blacksat the bachelor'slevel were more ikely than whites to reportthat S/E positi ns were not availableltexttable 2-5). For xarnple, of the recent bach-elor s graduatenot in S/E jobs in 1980,over one-third of the blacks, compared to21 percent of whites, said they believed
.S/E jobs were not available.
Figure4213. Saliries of racial minorities (as a percent of white) for receotl1 S/E baccalaureates by field: 1980
percent140
130
120
110
100
90
80
70
60
50
40
30
20
10
0Total Mathe-
maticalsciences
Engl.neering
Blacks
1Recent baccalaureates are those from the classes of 1978 and 19792Includes environmental sciences.3lncludes psychology.SOURCE. Appendix table 52
Life Computer Physicalsciences specialties sciences`
Other races
Socialsciences'
/Table 2-5. Reasons for non-S/E employment by race(percent)
a
Total in a Prefer,non-S/E non-VIE
Pro- Bettermotion pay
Loca-tionalpref-
erence
S/Ejobnot
available Other'
Dottoral scientists andengineer41979)
White 100 20 23 6 1 9 40
`Black 100 19 30 4 3 6 39
Asian 100 21 0.3 9 1 12 49
Bachelor's (1978 and 1979classes in 1980) .
White 100 . 55 13 4 21 '5Black 100 , 45 7 5 35 -6Asian 100 43 27 11 19 __
Master's (1978 and 1979classes in 1980)
,White 100 72 2 5 3 14 4
Black 100 89 11
Asian 100 58 27 15
'Includes no report.
Source: Appendix table;45 and 54.
Scientists and engineers hold part-timejobs for a varietyof reasons., but part-timeemployment where rulrtime work, is pre-ferred is an indicator of underutiliiarion.The levels of and racial differences in thepropensity to work part time werecsmall.
t 38
Among experienced scientists and enginters,roughly 2 percent were working Nit time,with both whites and Asians slightly morelikely than blacks totbe employed on apart-time basis. At the doctoral level, blacksand whites were more likely than Asians
O

to work part time. For example, in 1979,4.5 percent of the blacks, 3.6,4aercent ofthe whites, and 1.3 percent of the Asianswere - working part time (appendix table32).
HISPANIC SCIENTISTS AND
Among those doctoral scientists and engi-neers reporting Hispanic heritage, the laborforce participation rate in 1979 was 98.percent, comparable' to that for Asians.The S/E utilization rate for Hispanic doc-toral scientists and enginessi(89 percent)was higher than that for blacks (86 percent), but lower than that for Asians, whites,and native Americans` (all above 90 per-cent). ,
ENGUEERS
ft
,REFERENCES
1. The S/E utilization rate is computed by divid-ing the number employed in science and engineeringjobs by the labor forcethat is, those employed inany job or seeking employment.
S/E utilization rate = S/ i emPkYmEnC 100labor force
2 The U.S. DepaRrnent of Labor, Buceau of LaborStatistics, Educational Attainment o f Wjrkers: SomeTrends from 1973 to 1978, Special Labor Fee ReportNo. 225, Wash., p. A-8.
3 See Jacob Mincer and Solomoeatn Polackiak,"Family h;vestmens in Human Capital Earnings of,W4amen,7ournal of Political Economy, Vol 82, Not'2, Pt. 2 (1974), pp. 76-108, Working Mothers in the1970 Monthly Labor-Review, October 1979, pp.39-49, "Labor Force Patterns of Single Women,"Monthly Labor Review, August 1979, pp. 46-49;James E. Long and Ethel B. Jones, "Labor Force Entryand Exit by Married Women," Review of ECOPIOM-ws and Statistics, Febrtiary 1980, pp. 1-6; and "BackTo School at 35 and Over, Monthly Labor Review,August,1979.
4. Excluding full-time graduate students. Full-timegraduate students are also excluded from the remainderof this analysis.
5. U.S Department of Labor, Bureau of LaborStatistics, Employment and Earnings, Vol. 27, No.-1,Washington, 1980, p. 167.
j2. Educational Attainment of Workers, p. A:8.
7. Ups department of Labor, Bureau of Labor...5.tetv tics, Employment atitlaritings, Vol. 28, No. 1,Washington, 1981, p. 34
8 those scientists and engineers in the laborforce at the time of the 1970 Census of Population.'For a complete description of this population, seeChartteristics of Experienced Scientists and Engi-neers, 1978, NSF 79-322
9. National Science Foundation, unpublished data.
10. Educational Attainment of Workers, p. A-9.. ^11. Ibid.
12 Experienced scientists and engineers are detit4das those who were in the tabus force at the time of the1970 Census of Population
13 An estimated 84 percent of the other minori-ties were Asians
'I
A
I
IWO
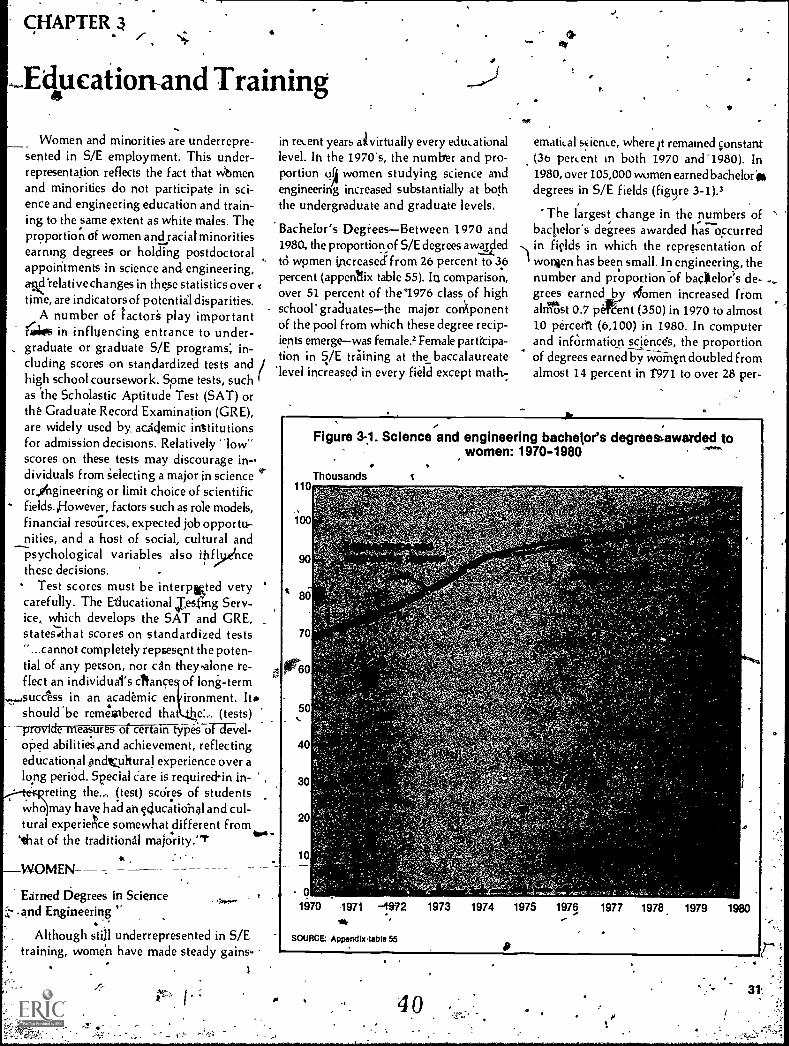
CHAPTER.Sc
Education-and Training
Women and minorities are underrepre-sented in S/E employment. This under-representation reflects the fact that womenand minorities do not participate in sci-ence and engineering education and train-ing to the same extent as white males. The
-proportion of women and raciatminoritiesearning degrees or holding postdoctoralappointments in science and engineering,mad 'relative changes in these statistics overtime, are indicators of potentiil disparities.
A number of factors play importantKokes in influencing entrance to under-graduate or graduate S/E programs; in-cluding scores on standardized tests andhigh school coursework. Some tests, suchas the Scholastic Aptitude Test (SAT) orthe Graduate Record Examination (GRE),are widely used by. academic institutionsfor admission decisions. Relatively "low"scores on these tests may discourage in-dividuals from selecting a major in scienceoringineering or limit choice of scientificfields.,Howevel, factors such as role models,financial resources, expected job opportu-nities, and a host of social, cultural andpsychological variables also itlfivincethese decisions. .
Test scores must be intermted verycarefully. The Educational.Tes.ang Serv-ice, which develops the SAT and GRE,statethat scores on standardized tests"...cannot completely repseKnt the poten-tial of any person, nor can they-alone re-flect an individual's chance of long-term
,,,,,.,success in an academic en ironment.should be remewbered tha (tests)
provktFrtfasures of certain types of devel-oped abilities And achievement, reflectingeducational pndtuktural experience over along period. Special care is requiredin in-to r.preting the..-. (test) sail-es of studentswho)may have had an cclucatiohal and cul-tural experience somewhat different from
swi -that of the traditional majority.':
in recent years att virtually every educationallevel. In the 1970's, the number and pro-portion women studying science andengineering increased substantially at boththe undergraduate and graduate levels.
'Bachelor's DegieesBetween 1970 and1980, the proportion of S/E degrees a wasidedto women increased from 26 percent to 36percent (appendix table 55). 113 comparison,over 51 percent of the'1976 class of high
- school- graduates the major cot4onentof the pool from which these degree recip-ients emergewas female.2 Female partkipa-tion in S/E training at the baccalaureate
'level increased in every field except math-
WOMEN-
Earned Degrees in Science.and Engineering
Although still underrepresented in S/Etraining, women have made steady gains
Ye*
ematical science, where It remained ;onstant(3o percent in both 1970 and-1980). In1980, over 105,000 women earned bachelor*degrees in S/E fields (fig9re 3-1).3
The largest change in the numbers ofbachelor's degrees awarded has occurredin fields in which the representation ofwomen has been small. In engineering, thenumber and proportion-of badlelor's de-grees earnedl:y) vfomen increased fromalmost 0.7 percent (350) in 1970 to almost10 percent (6,100) in 1980. In computerand infOrmation sciences, the proportionof degrees earned by woman doubled fromalmost 14 percent in t971 to over 28 per-
Figure 3.1. Science and engineering bachelor's degrees5awarded towomen: 1970-1980
.Thousands
110
90
80
70
6
501/4
40
30
20
10
1970 971 1972
SOURCE: Appendlx,table 55
1973 1974 1975 1976 1977 1978 1979 1980
D
4 031:

cent in 1979, and the nunker iftreasedf 1)am 300 to 2,500.
In 1980, women received '39' percentlalmost 28,000) of the bachelor's degrees,in.the life sciences and over half (58,000)of the devees,in the social sciences, upsubstantially from 1970,'v'vhen,these pro-portions were 23 percent and 37 percent,respectively.
,,,Advahced DegreesSignificantin-creases;41, have also.octurred in both tile number andt..fpNportiqn of women receiving master's
arid_kctorates in science and engineering- (appendix tables 56-and 57). In 1970, ap-
proximately 10000 women received ad-vanced degrees4 in science and engineer-ing, accounting for just over 15 peicentof the advanced S/E degrees awarded inthese fields. By 1980; the numberof womenreceiving advanced sa degrees had in-creased to over 18,000, or 25 percent ofthe advanced S/E.Aegrees awarded. These.incTeases;must be placed in perspective,f Or women e'trned almost 50 percent ofall master's degre and almost 30 per-cent of all doctorates arded in 1980.
Between 1970 and 19 0, the number of-women reaeiving,master's degrees in S/Efields increased by 69 percent, from about8,600 to 14,500 (appendix table 56). Ex-pressed as a pereaLage of all S/E master'sdegrees, women accounte-afor 17 percentin 1970 and almost 27 percent in 1980 (texttable 3-1).
Table 3.1. Women S/E master's degreerecipients as a pefcent of total S/E. master's degree recipients 'by
selected year and field
Field 1970 .1975 1980
Totalscience andengineering 17 20 27
Physical and environ-mental sciences ''' 14 !' 15 19
Mathematical and rcomputerstiences , 25 ; 27 28
Engineering 1 ' 3 7
Life sciences 26 't 25 32Social science's ..,' 2b i 34 46
Source; Appendbltable56
Figure 3.2. Percent of all WE master's degrees awarded to women:1970-1980
1971 1972 197. 1974 1975 1976 1977 1978 1979 1980
SOURCE: Appendix table 56
Although the proportion of women re-ceiving master's degrees increased in all
S/E'fields, the most significant increaseengineering,(from 1 percent in 1970
to 7 percene.in 1980) (figur0-2 and text. table 311). '
The number of women receiving doc-toral degrees in S/E fields more ihan doubled
32.
between 1970 (1,600) and 1980 (3,8Q0)(appendix table 57). By comparison, thenumber of men receiving doctorates in thesefields decreased from 16,000 to 13,400. In1970, women accounted for 9 percent ofdoctoral degrees awarded in science andengineering; in 1980, they accounted for22 percent.
Tho.percentages of women awarded doc-torates increased in all S/E fields exceptthe mathematical sciences. fn11980, 54 per-cent (2,100) of the doctorates earned bywomen were in the social sciences includ-ing psychology. By comparison, less than30 percent (3;800) of doctorates received.by men were in the social sciences. Theproportion, of women earning doctofatesin engineering continued to be small.Although the number increased from 24to 90 between 1970 and 1980, womenaccounted for only 3.6 peryent of.all 1980doctorates awarded in this field.
Graduate Degree Attainment Iltes
Graduate degree attainment rates aredefined as S/E mister's degrees expressedas atper:cent of S/E bachelor's degreesawarded 2 years earlier and S/E doctoral
41
degrees expressed as a percent of S/Ebachelor's degrees awarded 7 years earlier.
Graduate degree attainment rates varyconsiderably by sex (appendix table 58).The 1980 S/E master's degree attainmentrate was 14.4 percent for women and 21.3percent for men. For S/E doctor'ates, therate differential for men and women hasnarrowed considerably since 172. The ratefor men in 1972 was 12.8 percent; by 1980, ithad fallen to 6.3 percent. For ,women, thedecline has been much less severe, fallingless than a percentage point from 5.3 per-cent in 1972 to 4.5 percent in 1980.
Postdoctoral Appdintments5-
-
Along withi the increasing number ofwomen earning doctorates has been a cor-responding increase in the number ofWbmen taking postdoctoral appointments.The number of wOjnen graduates takingthese appointments "rose nearly $0 percentbetween 1972 and 1978 (from 501 to 899)while the number of men dropped by 14.percent (from 3,750 to 3,207). Consequently,the proportion of all potdoctoral appoint-ments held by women graduates increasedfrom 12 to 22 percent. The largest increases
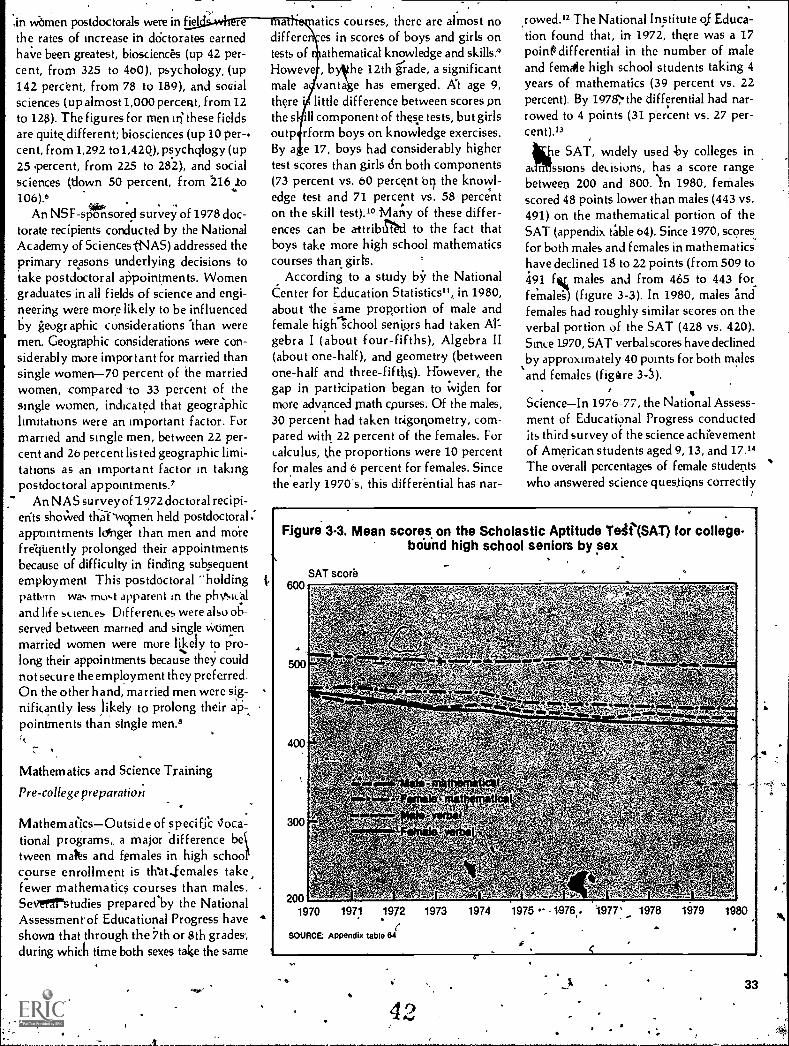
in women postdoctorals were in fielthe rates of increase in dOctorates earnedhave been greatest, biosciences (up 42 per-cent, from 325 to 460), psychology. (up142 perc'ent, from 78 to 189), and socialsciences (up almost 1,000 percent, from 12to 128). The figures for men trj these fieldsare quitesdifferent; biosciences (up 10 per-.cent, from 1,292 to 1,420), psychqlogy (up25 percent, from 225 to 282), and socialsciences (down 50 percent, from 216 lo106).6
An NSF-sponsored survey of 1978 doc-torate recipients conducted by the NationalAcademy of SciencesINAS) addressed theprimary reasons underlying decisions totake postdoctoral appointments. Womengraduates in all fields of science and engi-neering were more likely to be influencedby geographic considerations Than weremen. Geographic considerations were con-siderably more important for married thansingle women-70 percent of the marriedwomen, compared to 33 percent of thesingle women, indicated that geograsphiclimitations were an important factor. Formarried and single men, between 22 per-cent and 26 percent listed geographic limi-tations as an important factor in takingpostdoctoral appointments!
An NAS survey of 1972 doctoral recipi-ents shaved thkwopen held postdoctoral,appointments ldnger than men and morefrequently prolonged their appointmentsbecause of difficulty in finding subsequentemployment This postdoctoral -holdingpattcrn was must apparent in the physicaland life sciences Differences were also ob-served between married and single womenmarried women were more likely to pro-long their appointments because they couldnot secure the employment they preferred.On the other hand, married men were sig-nificantly less likely to prolong their aP-,pointments than single men.8
Mathematics and Science Training
Pre-college preparation
MathematicsOutside of specific Nioca-tional programs,, a major difference between maks and females in high schoocourse enrollment is th'at,lemales take,fewer mathematics courses than males.Sevrerstudies preparecrby the NationalAssessment of Educational Progress haveshown that through the 7th or 8th grades',during which time both sexes take the same
ma atics courses, there are almost nodiffere es in scores of boys and girls ontests of athematical knowledge and skills :9Howeve , b he 12th grade, a significantmale a' vanta e has emerged. Al age 9,there little difference between scores pnthe s ill component of these tests, but girlsoutp rform boys on knowledge exercises.By a e 17, boys had considerably highertest scores than girls do both components(73 percent vs. 60 percent WI the knowl-edge test and 71 percent vs. 58 percenton the skill test).1° Many of these differ-ences can be attribtNI to the fact thatboys take more high school mathematicscourses than girls.
According to a study by the NationalCenter for Education Statistics", in 1980,about the same proportion of male andfemale highlchool seniors had taken Al'gebra I (about four-fifths), Algebra II(about one-half), and geometry (betweenone-half and three - fifths). However, thegap in participation began to widen formore advanced math cpurses. Of the males,30 percent had taken tragotymetry, com-pared with 22 percent of the females. Forcalculus, the proportions were 10 percentfor males and 6 percent for females. Sincethe early 1970's, this differential has nar-
rowed." The National Institute of Educa-tion found that, in 1972, there was a 17point$ differential in the number of maleand femdle high school students taking 4years of mathematics (39 percent vs. 22percent). By 1978'; the differential had nar-rowed to 4 points (31 percent vs. 27 per-cent)."
iikeSAT, widely used by colleges in
a ssions decisions, has a score rangebetween 200 and 800. )11 1980, femalesscored 48 points lower than males (443 vs.491) on the mathematical portion of theSAT (appendix table 64). Since 1970, scoresfor both males and females in mathematicshave declined 18 to 22 points (from 509 to491 f males and from 465 to 443 forfe'male's) (figure 3-3). In 1980, males andfemales had roughly similar scores on theverbal portion of the SAT (428 vs. 420).Since 1970, SAT verbal scores have declined
,by approximately 40 points for both malesand females (figure 3-).
ScienceIn 1976-77, the National Assess-ment of Educatiynal Progress conductedits third survey of the science achievementof American students aged 9, 13, and 17."The overall percentages of female studentswho answered science questions correctly
Figure 3-3. Mean scores, on the Scholastic Aptitude Tee(SAT) for college-boUnd high school seniors by sex
2001970 1971 1972
- .
SAT score
SOURCE: Appendix table 84
1973 1974 1975 -1976,, 1977' 1978 1979 1980
<
-
4233

-
were consistently below males in these agegroups. At age 17,
°for example, the per-
(' centage of fem4sanswering questionscorrectly (51 percent) was 5 percentagepoints below the percentage for males (56percent).
As in the case with mathematics, fe-males teAd to take less coursework in thesciences than.males. A 1980 survey of col-.lege-bound,seniors indicated that, in thebiological sciences, s.imilar proportions ofmares (33 ptite9t) and females (35 per-cent) had taken 2 or more years of course-work. In the physical sciences, however,.two-thirds of the males had studied phys-ical science for 2 or more years, comparedto:about half of the females. Only 15 per-cent of the females, compared with 30 per-
*cent of the males, had studied physicalsciences for 3 or more years by the end ofhigh school.'
Undergraduate preparation
Women who majored in science or engi-neering,atthe undergraduate level, hadscores roughly-similar to their male Eoun-terparts on the GRE in1978-79.I6
On the i/erbal section, women scoredhigher than men across all undergraduateS/E majors, with the exception of math-eniatical science (figure 3-4). For both sexes,the highest scores were recorded by thosemajoring in the physical sciences (534 forwomen and 514 for men).
On the quantitative sectio:'ffien scoredhigher than women across the major S/Efields (figure 34). For both sexes, the highestquantitative scores were recorded by thosemajoring in the mathematical sciences (682for men and 636 for women)...
On the analytical portion of the test, the. results were mixed by sex' (figure 3-4).
Women majoring in the physical or bio-logical sciences or engineering scored slightlyhigher than men. The highest scores for
- both men and women Were fecal-tied-fathose who majored.in mathematicatscience(568 and '565-,resieaien- Ff-fatte-62).
Test scores on the GRE suggest thatwomen .and men who major in science orengineering are equally qualified, educa-tionally, to'go op to graduate study. Dif-ferences,between the sexes in specific fieldsdo norvary by a standard deviation (i.e.,scores for men and women areclenselYdispersed around the overall Mean scorefor each field).
47,
34
Figure 3.4. GRE scores by undergraduate major and sex: 1978179
' Score Verbal800,
700
600
500
.400
300
200
800
700
600
500
400
300
200
800
700
600
500
& 400
300
200,
Physicalsciences
C
Mathe Engi Biological Behavioral Socialmatical neering sciences sciences sciences
sciences
\. Quantitative
Physicalsciences
Mathe-matical
sciences
Engi Biological Behavioral , Socialneering sciences sciences sciences
Analytical
Physicalsciences.
SOURCE: Appendix table 62
Mathe-matical
sciences
Men
Engi-neering
Biological Behavioralsciences sciences
ti Women
Socialsciences'
..
RACIAL MINORITIES
Earned Degrees in Science. and Engineering
Blacks, Asians, and other racial minori-ties earn a small fraction of the degreesawarded-in science and engineering (Ap-,pendix table 59). In 1979, blacks earned
6 percent of the S/E bachelor:s degreesand less than 3 percent of thedoctorates."Comparatively, they constituted 12 per-c,cent of the 1976 high school graduates."Asians represented only 1 percent of the .1976 high school graduates", but earnedslightly over 2 percent of the S/E bach:elor's degrees and over 4 percent of theS/E doctorates. Of the Asians who earned
. "kvarxrate'

doctorates fronq.S. universities, 84 per-cent were not U.S..citizens.
Blacks who earned S/E bachelor's degrees*ere concentrated in the social sciencesand pSychology. TwErthirds Of the s/rbachelor's degrees earned by blacks in 1979were in these fields. For whites, the com-parable figure was 45 percent.
The number of blacks earning degreesin engineering has increased signiWntlysince the early 1970's. Between 1912 and1980, the number more than doubled, fromalmost 600, to over 1300.20 Despite thisincrease; only_ 2 percent of the S/E degreesearned by blacks were in engineering.
Asians, on the other hand, tended toearn stheir degrees in engineering and thelife sciences. Over one-fourth of the S/Ebachelot's degrees awarded to Asian's in1979 were in engineering fields, and one-fourth were in the life sciences. Relativelyfew' sians (34 percent) compared to blacks
.(65 percent) earned degrees in psythologyand the social sciences.
Differences in field also exist at advanceddegree levels. Slightly more than threefifths of the S/E master's and doctoratesearned by blacks were in the social sci-ences and psychology, compared with 38percent for whites (appendix table 59).Among Asians, 45.percent of those receiv-ing master's degrees earned them in'engi-neering; at the doctorate level, the propor-tion was 31'percent. A significant fraction'of Asians also earned advanced degrees inthe life sciences.
Postdoctoral Appointments
In 1979, blacks held less than 1 percentof the total S/E postdoctorates, while Asiansheld 11 percent (87 Percent of the Asianpostdoctorates were foreign born). TileAsian share has, increased from about 8percent in 1973 to about '13 per.cent in1979. Although the number of blacks inpostdoctoral appointments doubled bretween1973 and 19.79 (31 to 66), their relative
. share has 'remained virtually constant(appendix table 61). Again, it should be-noted that blacks are heavily concentratedin the social sciencesa discipline with his-torically few postdoctorates. About three-
' fifths of both white's and blacks tvfit Post-doctOral appointmenls and 45 percent ofthe Asians in 1979 were life scientists.
The number of minority S/E graduatestaking postdoctoral appointments declinedby 19 percent (from 234 to 190) between1972 and 1978, whilethe numbetaliariting
S/E doctorates increased by 21 percent (from716 to 865). Among whites, the nutnbertaking postdoctoral appointments declinedby 3 percent during this period, while thenumber earning degree's declined by 10percent.2) In 1972, 33 percent of the mi:rtorities receiving S/E doctorates took post-doctoral appointments; in 1978, the pro-portion was 22 percent.tn all major fieldsexcept the social sciences, the proportion
minorities taking postdoctoral appoint-ments fell, while the proportion for whitesincreased. The largest declines occurred inthe physical and mathematical sciences,Where '48 percent took' postdoctorates in1-972, compared to 26 percent in 1978.22.7.. An important reasoMor the decline in
the number of minority postdoctorates maybe the availability of alternative employ-ment opportunities. For example, minor-ity graduatks generally have been moresuccessful than others in obtaining offersof faculty positions. There is some con-cern, however, that the lack of post-doctoral experience may limit the careeraChievement'of Minority scientists, espe-cially in fields such as bioscience, physics,and chemistry, in which such experience isgenerally regarded as valuable for carIersin tademic research.23
.
Mathematics and Science Training
Pee-college preparation
MathematicsIn 1978, the National Assess-ment of Educational PrOgress" found thatthe average scores of Itt,hites on tests de-signed to measure mathematical knowl-edge and skills were higher than those ofblacks.The differences appear to increaseWith age. For example, at age 9, the gapktween whites (68 percent) and blacks(55 percent) for mathematical knowledgewas 13 percentage points. By age 13, thegap was 17 percentage points (70 percentfOr whites versiis'53 percent for blacks).At age 17, the gap between whites andblacks was 18 percentage points for math-errlatical knowledge (74 percent vs. 56 per-cent) and 20 percentage points for mathe=matical skills (61 percent vs. 41 percent).25
The scores of blacks.on mathematicaltests have increased Over time. The scoresof 9- year -old blacks increased betweeh1973and -1978, while those of whites declinedor remained constant; Among 13-year-olds,black test scores,remained constant, whilethoseOf whites showed an overall decline.
44
By age 17, scores for both blacks and whitesshowed declines between 1973 and 1978,but the gap that existed at age 13 remained '';'-...latively cons tan t.26
As noted earlier, high school course-work has an impact on test scores. White.high school student were more likely thanblackson average, to take academic mathe-matics courses. In 1978, three-fourths ofthe 17-year-oid whites had taken Algebra I,compared with 55, percent of the 170car-old blacks. The percentages of 17-year-oldwhites and blacks who had taken geometryweie 55 percent and 31 percent, respec-tively. FOr Algebrarll,the differential be-tween whites and blacks narrowed, with38 percent of the whites and 24 percent ofthe blacks taking this subject.27
,Over tne period 1972-73 to X976 -77,
scores of blacks on the SAT weie an aver-age of 119 points lower than the scores ofwhites on the verbal section and 134 pointslower on the mathematics section.26 Forthose taking the SAT in 1976-77, scores ofwhites were higher than scores of blackson both the verbal (459 vs. 329) and math'-ematics sections (490 vs. 355) (figure 3-5).
ScienceThe scores of blacks on science.tests between 1969 and 1977 were consis-tently lower than scores of whites. In 1977,the scores were 38 percent for blacks and56 percent for whites.29 For all races, thescores of 17-year-olds continued tq decline..However, the stores of whites were higher'than those of blacks in each of the threeassessments conducted between 1969 and1977.30
Figure4B5. Scholastic AptitudeTest (SAT) scores by rate:
1976177
White Chicano
-*Verbal Mathematical
Black
SOURCE: Appendix table 65

In science coursework in high school,about the same proportion of whites andblacks took physics (20 percent); however, t39 percent of the whites and only 28 per-cent of theblacks took chemistry.J' -
.Undegraduate prepara 'tionAfs.
GRE scores of whites who majored in ascience or engineering field at the under-graduate level were consistently higher'than those of blacks in 1978-79'(appendixtable 622
Scoies on the verbal section were higherfor whites Than for blacks across all S/Efields. The highest score for whites wasrecorded for those who majored in the phys-ical sciences (541), and the highest for blacksthose who majored in engineering (403)(figure 3-6). The largest differential betweenscores of Hacks and whites was foundamong those who majored in the mathe-matical sciences where the two races wereseparated by 1.5 to 2 standard deviations(537 for whites and 364 for blacks).
`On the quantitative component of theGRE, blacks generally scored 1 standarddeviation lower than whites in each of themajor S/E fields (figure 3-6). For blacks,the highest score was recorded-by thosewho majored in engineering (521). Thehighest score for whites was for thosb whosemajor was mathematical science (682)thefield which also showed the largest black/'white differentjal (bjacks'scored 486).
On the analytical test, scores for whiteswere generally more than 1 standard devi-ation above those for blacks across an rnajorfields (figure 3-6). As with the quantita-tive component, the highest score for blackswas for engineering majors (437), and the
'h'ighest for 'whites was for .maihema ticalscience majors (602), Where the black/whitedifferential was again the highest (blacksscored 401).
Lower scores for blacks on tests of_mathematics and science achievement'arenot a reflection of -lack of inherent ability.These test,scores can reflect a .nUmber ofsocial, demographic,and economic factors.For example, a disprdportionite amberof black families are at lowereconomiclevels. Thus, gross comparisOns betweenwhites and blacks can give a distorted plc-ture of inherent ability,because other Val-abks, such as family income and educa:tion of parents, are not controlled.33,.
Figure 3.6. Mean scores on the Graduate Record Examination (GRE) byundergraduate field and race: 1978/79
700GREScore
650
600
550
500
450
400
350
300
700
650
600
550
500
450
400
350
300
700
"650
600
550
500
450
400
350
300
Verbal
Physicalsciences
Mathematical Engineering Biologicalsciences sciences
Quantitative
Behavioralsciences
Socialsciences
Physicalsciences
Mathematical Engineeringsciences
Biologicalsciences
Analytical
Behavioralsciences
Socialsciences
Physical Mathematical Engineeringsciences, .sciences
SOURCE: Appendix tablt82
Biologicalsciences
White Black Asian
Behavioralsciences
Socialsciences
. s.

HISPANICS
Earned Degrees in Scienceand Engineering
Although Hisphics are a diVerse ethniCgroup, they are treated in the aggregate inthis report befause of data limitations.
In 1979, Hispanics earned about 10,300bachelor's degrees in science and engineer-ing, representing 3.2 percent of all S/Ebachelor's degrees. This numbei was a sub-stantial increase from the 6,700 (2 percentof total) earned in 1976. About 4 percentof high school graduates in 1976 were His-panics.34 About 55 percent of the Hispanicseafned degrees in the social sciences andpsychology, compared to 47 percent for allgroups combined.
Hispanics earned almost 2 percent of themaster's degrees awarded in science andengineering and about 1.4 percent of theS/E doctorates. At all three levels, His-panicscomparedio the national averagewere somewhat more likely to earn theirdegrees in thesocia sciences and psychol-ogy (figure 3-7).
Differences in fie d of degree betweenHispanics and non-Hi anics widened withthe level of degree. For example, 5 percentof the Hispanics earning S/E'bachelbr'sdegrees and 7 krcent of all S/E under-graduate's received their degrees in thephysical sciences. At the doctoral level,12 percent of the degrees earned by His-panics were in the physical sciences, corn-pared to 18 percent awarded overall:
Mathematics and Science Training
Pre-college preparation ; .
MathematicsThe National Assessment ofEducational Progress found that, at age17, the average scores of Hispanics were12 points below the national average ontests of mathematical knowledge and skills;they scored 60 percent on tests of knowl-edge and 47 percent on skill tests.35 Thedifferences increased with age. At age 9,
\. for example, Hispanics scored between 8and 9 percentage points, (35 percent 'onskilltest's and 57 percent on knowledge test's),
kbelow the national aver'age.36Hispanics genetally took fewer years of
high school mathematics than all high schoolseniors. In 1980, 33 percent of all highschool seniors, but only 27 percent of the
Hispanics, reported taking 3 or more yearsof mathematics.37
. -
Figure 3-7. Distribution of earned S/E degrees by degree level and field:total and Hispanics, 1978119
Percent40
30
20
10
0Social Life Engintering Psychology Physical Mathe tical Computer
'sciences sciences sciences sciences specialtiesMaster's
Bachelor's
40
30
20
10
Socialsciences
40
30
20
10
Life Engineering Psychology Physical Mathematical Computersciences . sciences sciences specialties
Doctorate's
Social ,sciences
Lifesciences
"SOURCE:Appendlx table Si
Engineering psychology Physical Mathematical Computersciences sciences specialties
All scientistsand engineert
Field
Hispanic:sdientistsand engfneert
111111

SAT data are not available for all His-panics. These data, however, ate availablefor Chicanos.38 For Chicanos taking jheSAT in 1971-77, scores on the'verbal por-tion were 71-' points below those foi. non-Chicano whites (374 vs. 449). Chicanosscored 78 points lower on the mathematicsportion (412 vs. 490) (figure 3,5).
Science-Hispanic students have tended toperform below the national average on sci-ence tests. At age 17, for example, Hispan-ics scored 11 percentage points below thenational average of 54 percent.39 Like thedifference in mathematical achievement,the difference in science achievemenebe-
-tween Hispanics and others increased withage. At age 9, for example, Hispanics scored9 percentage points below the national aver-age of 51 percent.
Hispanics also took significantly feweryears of high school science than did allhigh school seniors. Only 14.percent ofthe 1980 Hispanic high school seniors took 3
or more years of science;, overall, 22 per-cent of the seniors took 3 or, more years.4°
Undergraduate preparation
On average, Hispanics who'majored inscience and engineering in college scoredlower than the total group on the threecomponents-verbal, quantitative, andanalytical-of the GRE in 1978_79.41 Ofthe three major groups classified as His-panics-Mexican,-AmericAs, Pifrierto Ricans,andiatin Americans-Puerto Ricans showedthe lowest scores, 1.5 to 2 standard devia-tions below those f9r the total.
On the verbal component, the largest_differential appeared for those' who .ma-,jored in. mathematics at the undergraduatelevel. Puerto Ricans scored 375, while theoverall score was 524.42 Mexican-Americansand Latin Americans scored in the low tomid-400's.
Among Hispanics who majored in sci-rTh4c,e e and engineering at the undereaduatelevel; quantitative test scores were higherthan scores on the verbal test. AlthoughMexican-Americans, Puerto Ricans, andLatin Americans scored lower than theoverall average, those who majored inphysical and Mathematical sciences, orengineering showed average score differ-ences of less than 1 standard deviationAnengine6ring, for example, the overall score
_
.38
was 666; Mexican - Americans scored 595;
Puerto Ricans scored 583; and Latin Amer-icans scored
On the analytical test, scores were gen-erally separated by 1 to 1.5 standard devia-tions. Scores of Latin Americans weremuch closer to (wend averages than werescores of either Mexican-Americans, orPuerto Ricans. For example, for those who
. majored in mathematical sciences, theoverall score' was 585; Latin Americansscored 530; Mexican-Americans scored467; and Puerto Ricans scored 44 N
REFERENCES
1. Educational Testing Service, Guide to the Use
of the Graduate Record Examination, 1981-82, Prince-
ton, N J , pp. 9-10
2 U.S Department of Education, National Centerfor Education Statistics, The Condition of Education1981, Washington; p. 112
3. George H Brown, Degree Awards To Women -1979 Update, Washington, U.S Department of Edu-cation, National Center for Education Statistics, Jan-uary 1981, p 5.
4 Includes master's and doctoral degrees but ex-
cludes professional degrees such as law'and medicine.
5. This section has been drawn primarily from Na-tional Academy of Sciences, Postdoctoral Appoint-ments and Disappointments, Washington, 1981.
6. ltstdoctoral AppOintinents and Disappoint-ments, p. 148.
7. Ibid., p. 1518. 1b4, pp: 149 and 153.9 N tonal Commission for Employment Policy,
Increasilig the Earnings of Disadvantaged Women,Washington, January 1981, p. 4'7
10. National Assessment of Educational Progress,Mathematical Knowledge and Skills, Report No. 09-MA -02, Denver, Colorado, National Institute ofEducation, 1970, pp. 42 and 60-70, Unless noted,information on mathematical achievement test scoresare from this source
11. U.S, Departme.nt of Education, National Center
for ,Education Statistics, High School and Beyond.A National Longitudinal Study for the 1980's (pre-
publication edition),Washington 1981, 9.
12. Susan F, Chipman and Veronica G. Thomas,Women's Participation in Mathematics: Outliningthe Problem, National Institute of Education, August1980.
15 AdmissionsATeSng Program of the CollegeBoard, Educational Testing Service, National Col-lege-Bound St5mors 1980, Princeton, N.J., p. 14.
16. All GRE test scores are from Cheryl L. Wild, A'Summary of Data Collected From Graduate Rec6rdEaaminations.Test-Takers During 1978-79, DataSummary Report No 4, Printeton,'N J , EduationalTesting Service, 1980,pp 76-81
17 Data on earned degrees by race are not avail-able for earlier years Thus, an analysis of the numbeiof degrees earned by the various racial/ethnic groupsover time is not possible.
18 U,S. Department of Education, Officeof CivilCivil Rights Siirvey of Elementary ail! Sec-
ondary Schools While it would be more appropriateto use 1975 data, the racial/ethnic coMposition ofhigh school graduates are only collected for evennumbered years
-19" !beZO. Engineering Manpower Commission, Amer--
Jan Association of Engineering Societies, Engineer-tug and Techtio,logical Degrees 1980, New York,November 1980.
21 This portion of the discussion of minoritiesluOng postdoctoral appointMents is'from Postdoc-toral Appointments and Disappointmelits.4 ".
t Poildoceral.Appointments and pisappOint-;mans, pp 142-146
23 Ibid., pp 143 and 14o. '
24, tAtufrial Assessment of Educational Progre;s,Mathpiaticp1Knowledge and Skills, Report No. 09-
s MA-02, April, 1979, Changes n; MathematicaMc-bievement 1973-'1978, Report No 09-MA-01, August,
4979, Mgthematical Technical Report: Summary'Volume, Repoit No 09-MA-21, April, 1980, Denver,,
. Colorado, National Institute of Education
S. Mathematical Knowledge and Skids, pp. 68-70.
26. Changes in Mathematical Achievement 1973-78, p. 22.
27. Mathematical Knowledge aral Skills,, p. 45.
28. Robert L. Jacobsen, -Blacks Lag in SAT Scores,The Chronicle of Higher Education, Vol. XIX, No. 16
(1980), p.
13. J. M. Armstrong, A,National Assessment ofAchiev,;ment and Participation in Mathematics, Re-
port-No. 10-MA-60, National Institute of Frducation,1979. .0
14. Unless otherwise noted, data on science achieve-
ment are from the National Assessment of Educa-tional Progress, Science Achievement in the Schools,Report No. 08-S-01, Denver,, Colorado, National In,-stitute'of Education, 1978, pp. 49=51, and unpUb-.lished data.
47
, 29. Actievement in scien`c'e was assessed for threeagt- groups, ages 9, 13, and 17, during three dif ferenttime frames, 1,969-70, 1972-73, and 1976-77. Thetests were designed to establish how students "respondto science exercises, rather than the level of individualstudeak;'National Asse5sment of Edaatonat Pro-gress, Three National Assessments of Science; Changes.in Achievement, 1969-77, Report No. 08-S-00, for the
National Center for Education Statistics, June 1978.
i0. Ibid., P. 14.,, .-
31. 'High School and Beyinut, p: 9 -0
32 All jest semis ate from A Summary.of DitaCollected From Gtiduate Record ExaminationTakeri, pp. 76-81. .y
33. National Assessment of Educational Progress,Suence ALIneverneAt in the Schools, ReporrNo.pa-S-91, Denyer, Colorado, National Institute ofEducation 1078, p 19
34. Cud/ Rights..S4ervey:af Elementary and Sec-ondary Stho6g.
35. Mathematical Knotogdge and Skills, pp.tilitiql
36; Ibid. "-eV
v.
4.

37 U S Department of Education, Digest of Edu-cation Statistics, 1981 (pre-publication copy).
.
38 Of those Hispanics taking the SAT in 1978-79,almost two-thirds were Mexican-American (Chicano).The remainder was Puerto Rican. National College:-Bound Seniors, 1980, p 15
e..
1
Si
0
.30-Science Achievement in the Schools and un-
published data.40. Digest of Education Statistig, 1981.41 f A Summary of Data CollectedFrom-18G e,raduat
Record Examinations Test-Takers, pp Unlessotherwise stated, data on Hispanic test scores on theGRE are from this source.
r .
ti
"0
A
0
0
'
,
42. It should be noted that English was reportedas the best language for over 90 percent of the whites,blacks, and Mexican-Americans, 86 percent of theAsians, 76 percent of the Latin Americans, and only36 percent of the Puerto Ricans among the 1978-79GRE test-takers. A Summary of Data Collected FromGraduate Record Examinations Test-Takers, p. 74.
alb
t
4.
-r
4
_a
30'

Technical Notes
CONCEPTS AND DEFINITIONS
The National Science Foundation NSef)publishes estimates of the number, typeof employer, work activity, and other'eco-nomic and demographic characteristics ofpersons who meet its particular definition .
of a scientist or engineer. Broadly speak-ing, a person is considered a '.,scientist or.engineer if at least two of the followingcristieria are met:
1. Highest deiree held in a science (in-cluiling social sciences) or engineer:ing field;
2.bEmployed in a science or engineeringoccupation; or
3. Prafesstnal identification as a scien-tis t or engineer based on total educa-tion End work experience.
,.-Coniposire E4imates
The composite estimates which depictnational totals are developed as part of theNSF Scientific .and Technical PersonnelData System- (STI)DS). Thesysl7m drawsprimarily from three data sources, eachdesigned to measure the characteristics ofa particuly subpopulation: ,.
The Experienced Sample of ScientistsapdEngineersconsiitinhof about
80,000 individuals (3.5 percent sam-ple), \vas drawn from-scientists andengineers4vho were in the labor forceat the time olthe,1970 decennial census.Information on ,thisgroup was col-lected f\ 1 r NSP,in".1967-2, 1974,,1976,and 197 9 by the Bureau of theCensus.
, The Newt Entrants Surveysare de-signed to measure The magnitude and
' characteristics Of scientists and engi-neers wlicrhave entered the S/E laborface since the 1970 decennial census.Samples (about 2 percent) of the grad-uatingclasses 41971, 1972:and 1973were surveyed in 1974 by theliabora-tory for Research in Higher ,Educa-tion, -University of California, LosAngeles. Westat, Inc., sampled the
, classes,of 1g74, and 1975 (about 2 per-cent4 in 19ittthe classes of 1972 and
.1976 (about tf percent). in 1978, andr .1 4.-
the classes of 1978 and 1979 (about2 percent) in 1980.
The Roster of Doctoral Scientists minEngineersmaintained by the Com-mission on Human Resources, National'Research Council, National Academyof Sciences, consists of all knowndoctorascientts and engineers inthe United States since 1930. The rosterserves as,a panel from which a sample of60,000 scientists and engineers (20 per-cent) covering the years 1936-78 yvereselected to provide data on the doc-toral population of the Nation.
Occupation/Field of Science.,or Engineering
Data on field of science or engineeringare derived from responses to questions onthe various surveys. Fields are classifiedas follows:
Physical SciencesChemistry, Physics,astronomy, and other physical sciences;including metallurgy
Environmenttil Sciences Earth, attmos phe ric, and ocnnogila ph ic 'sci-ences, including geophysics, geology,seismology, meteorology
Life SciencesAgrictAtural biological,and medical sciences (excluding thoseprimarily engaged in patient care)
Matheinatical SciencesMathematics
field of their degree and for those with less.than a doctorate, ,their professional self-identification.
Primary Work Activity
Data presented on the work activitiesof scientists and engineers represent theirprimary work activities. The data are de-riviiifromresponses to a series of ques-tions on the survey instruments that askinlviduals: (1) fo specify their primarywork activity, and (2) to provide a per-centage distribution of. their work tiamong 10 to 15 listed activities.
Other Variables
Information on other economic and d e-mographiC variables, such as, type of em-ployer, race, and sex are based on individualresponses to survey questions. Tfie varioussurvey instruments used by the Division,of Science Resour es Studies are similarand are shown in Guide to NSF Science
-Resources Data (s e "Data'Source Publi-"cations" below).
Reliability of Sci tist andEngineer Estima s
Since the data onscientists and engi-neers are derived from sample surveys, theestimates are subject to both sampling andnonsampling errors. ;
The sample use7rMta survey is only oneof a large number of possible samples ofthe same size that could have been selectedusing the tame sample design. Even if thesame questionnaire and instructions wereused, the estimates from the samples would.,differ from each other. The deviation Of`asample estimate from the average of all
' possible samples is defined as samplingerror. TINstandard error of,a survey esti-mate attempts to provide a measure of thisvariation and thus is a measure of, the pre-cision with which an estimate from thesample approximates the average resultsof all possible samples. Technical infor-mation on the computation of the standard
pho selected an employment specialty not,vrrors for the major S/E data series ousedin science or engineering are assigned to a`in this report can be found in the appropriatefield of science or engineering based on the publications listed ate the end of this. sec-
.
sand statistics
Social SciencesEconomics. (includ-ing agricultural economics), sociology,anthropology, and all other social sci-ences
Psychology
Computer sciences
Engineering
Data on field of employmerrra7e derivedfrom responses to questions that request,based en employment specialties lists in-cluded with the questionnairethe nameof the fpecialty most closely related to theh;spondent's yrincipsal employment. Those

tion. Selected tables of standard errors forthe various surveys are contained on thefollowing pages and listed below..
Survey Table
1978 Composite estimates oftotal scientists and
I' engineers 1
1979 Doctoral scientists andengineers 2
1978 Experienced scientistsand engineers 3
1980 Recent S/E graduates' 4,5
,
The sampling errors shown were gener-ated on the basis of approximations andMust, therefore, be considered estimatesrather than precise measurements,Thestandard error maybe used to constructa confidence interval about a given estimate.Thus, when the reported standard error isadded to and Subtracted from an estimate,the resulting range of values reflects 'aninterval within which about 64 percent ofall sample estimates, surveyed under thesame conditions, '11 fall. Intervals reflecting
a higherconfide e level mvbe,Constructedby increastik t umberd standard errorsfor a shred estimate; Thus, ±1.6 standarderrors define a°90 pgrcentpnfidence in-terval; 12'sta and errors, a percent
.confidence -interval.
ao ,
tg
Nonsampling rors can be attributed tomany sources: i a lity to obtain infor-;nation aboutell ses, difficulties of defi-'nition, differences in the interpretation ofquestions, inability or unwillingness onthe part of regponderas to provide correctinformation, mistakg in recording or codingthe information, ary otherlerrors of collec-tion, response, processing, coverage, andinputation. Nu,nsampling errors are notunique to saiiiple surveys since they can,and do, occur in complete canvasses aswell. Nosystematic attempt has been made4to idenfily or-approximate the `magnitude
' of the nonsariipling errors associated withthe estimates of scientists and engineers,presented in this report.
Statistical Measures
Labor Foree Participation RitesThelabor force. is defined- as those employedand those seekirvemployment. The laborforce participation rate (LFPR) is the ratio,of those employed (E) and those unem-gloyed but seeking employment (U) to the
pulation (P).
LFPR + 1:)-
P
Utilization Rates iThe /E utiliza-(ES/Rmeasures the ratio of thoge
ng tobsIn science or. engineering (S/4)tion r
-11
.0totat'sA gunce and envering laborinrce'(°LF) is t Inclirdes those'scientists
'In this report sampling errors. for recent S/Egraduates are adapted fiom those presented inWestat, Inc. Methodological Approach to 1979/80New Entrants Suiveys, Rockville, Maryland, May ,1981, where the standard errors reflect the errorsassociated with estimates of one graduating cohort.Sure the data presented herein- reflect the com-bined 1978 and 1979 raduating cohorts, the stand-ard errors have b recalculated by assuming adoubling in sampl size. The net'effect of this'process is a reduction pf about 30 percent in thesize of the standafeterror. 0
'
and'engin s eppluyed in any job andfhose.seek' effployment:
° - .A a a-WEES/E .= -..< LF
.
S/E EhtOpyMent Ratessihe S/Epldyment rate (es/e) measures the ratio ofthose holding jobs in science or engineer-ing (S/E) to the total employment (E) ofscientists ancr7litgi eers, which includes
those holding nonscience and nonengi-neering jobs.
es/e = S/EI'
Unemployment Rates The unemploy-ment ratikUE/R) shows the ratio of thosewho are unemployed but seeking employ-ment to the total labor force,(Lt = E + U).
UE/RE + U
DATA SOURCE PUBLICATIONS
Details on survey methods, coverage,corfepts, definitions, and reliability of thed ed inthis report are contained inth lowing publications of the NationalScience Foundation:
U.S. Scientists and Engineers: 1978 (De-tailed Statistical Tables) (NSF 80-304)
U.S. Scientists and Engineers: 1976-(De-tailed Statistical Tables) (NSF 79-305)
Characteristics of Doctoral Stientisl andEngineers in the United States: 1979
- (Detailed Statistical Tables) (NSF 80:323)
Characteristics of Doctoral Scientists andEngineers in'the United States: 1977(Detailed Statistical Tables) (NSF 79-306)
Characteristics of Experienced Scientistsand Engineers: 1978 (Detailed Statis-deal Tableg) (NSF 79-322)
' For a brief description of each surveyand copis of, the survey instruments, seeA uicl'e io NSF Science Resources Data,available from the Editorial and InquiriesUnit,.Division Of Science Resources Stud-ies (Rm. L-611), National Science Founda-tion, Washington, D.C. 20550.

a
Table 1. 'Standard errors for composite estimates of total scientists engineeTs: 1978
Size of estimate
Totalscientists
andengineers
e.'
Physicalscientists,
Mathe-matical
scientistsComputerspecialists
Environ-mental
scientists
0
EngineersLife .,
scientistsPsychol-
°gistsSocial
scientists
100 25 i 45 . 60 -, 40 55 75 60 110200 45 -, 0 75 50 80 95 95 80 160500 90 12 120 130 120 150 150 120 , 250700 . 120 . 140 140 150 150 180 180 150 290
1,000 170 160 180 160 220 210 160 3502,500 380 270 240, 250 260 340 330 240 5505,000 610 380 330 ' 340 340 , 490 470 320 780
10,000 1,100 ' 500 470 480 410 670 640 430 1,10025,000 2,300 730 6 740 770 640 1,000 930 560 _ 1,65050,000 3,800 1,050 1,050 1,150 910 1,250 1,100 1,000 2,15075,000 5,000 1,300 )450 1,300 1,100 1,550 1,300 1,350 2,50080,000 5,100 1,350 1,350 1 ,-b-6 1,350 1,600 1,400 1',400 2,550
100,000 5,450 '1:500 1,550 1,500 1,750 1,600 1,600 2,700125,000 6,500 / 1,900.--J 1,550 1,950 1,750 1,700 2,900150,000 .6,550 2,300 1,600 2;150 2,000 3,050175,000 ',750 , 2,600 1,750 2,300 2,250 3,350200,000 6,950 2,900 1,900 2,450 2,450 3,600225,000 - 7,650 3,200 2,050 2,600 2,600250,000 8,350 3,500 2.200 2,700 2,900275,000 8,450 2,850 3,000300,000 8,550 f 2,950 3,300
. 400,000 9,000 3,350500,000 9,400 3,650600,000 e 10,200 6 3,950
_ 700,000 11,100 4,150800,000 12,200 . 4,200900,000 13,100 4,250
1,000,000 13,500 4,3001,200,000 14,700 4,4501,300,000 15,200 4,5001,500,0002,000,000
16,40020,700
2,500,000 25,800 ---.-2,700,000 26,30d
Source.NationalScience'Foundation
14t
,$)
r
51
a
4
43
a

Tabla 2. Standard errors for doctoral sclentlitteand engineers: 1979
Estimated Estimated percentSize of - sampling Base of
estimate error percent 1 /99 5/95 10/902/98
100200500
1,000.2,0005,000
10,00015,00020,00030,00040,00050,00075,000
100,000150,000200,000250,000300,000
35 500 . 1.650 1,000 1.280 2,000 .8i 120 5,000 .5
160 10,000 .4
260 181000 .3
360 20,000 .2430 30,000 .2500 40,000 .2600 50,000 .2680 75,000 .1
750 109,000 , .1
. 870 , 10000 .1
960 200,000 .1
1,050 250,000 .1
1,000 275,000, .1
900 300,000 .1
620 325,000 .1
Total population
2.21.61.2
.7
.5
.4
.4
.3
.2
.2
.2
.2
.1
.1
.1
.1
.1'
.1
3:5 -) 4.92.5 3.51.8 - 2.41.1 1.5
.8 1.1
.7 .9
.5 .8
.4 .6
.4 .5
.4 .5
.3 .4' .5
.2 .4
.2 .a
.2 .2
.2 .2
.1 .2.1 .2.1 .2 .
25/75 50
7.05.03.52.21.61.31.1
.9.8.7
.5.4.4
*:3
.3
.3
.3
8:15.74.12.61.81.51.31.0
.9
.8
.7
.5
.5
.4
.4
.4
.3
.3
EstimatedSrze of sampling Base of
estimate error percent
100 20 ' 500 1.0 1.4 2.1 2.9
200 30 1,000 ..7 1.0 1t5 2.1
500 50 2,000 .5 .7 1.1 1.5
1,000 70 5,000* 8 .4 .7 .9
2,000 95 10,000 .2 .3 .5 '-' .7
5,000 140 15,000 .2 , .2 .4 5
10,000 180 20,000 4 .2 .2 .3 .5
15,060 200 25,000 .1 .2 .3 .4
20,000 300 .30,000 .1 .2 .3 .4
30,000 120
Employed women
Estimated percent
1/99 2/98 5/95 10/90 25/75 50
4.2 4.93.0 3.2.1 2.41.3 1.5
.9 1.1
.8 .9
.7 .8
.6 .75 .6
Physical ?dentistsMathematical
scientistsCompdter specialistsEnvironmental
scientistsEngineersLifescientistsPsychologistsSocial scientists'
Field
a
Employed by field
Size of estimate
100 200 500 1,090' 2,000 5,000 10,000 15,000 20,000 30,000444,.
40 55 90 125 175 no 360 x420 460 490.
30 45 70 95 130 180 190
35 50 80' 110 140 130
30 45 70' 95 130 180 180
50 JO 110 160 220 340 450 520 560_ 560
30 45 70 95 140 210 290,, 340 380' 420
40. 55 85 120 160. 250 320 360 370, 300
40 60 95 130 180 260 380 `"`" 430 460 450
40,000 50,000 60,000 70,000
460 370
460 -
430 ;420 380 290
3'50
Source: National Science Foundation
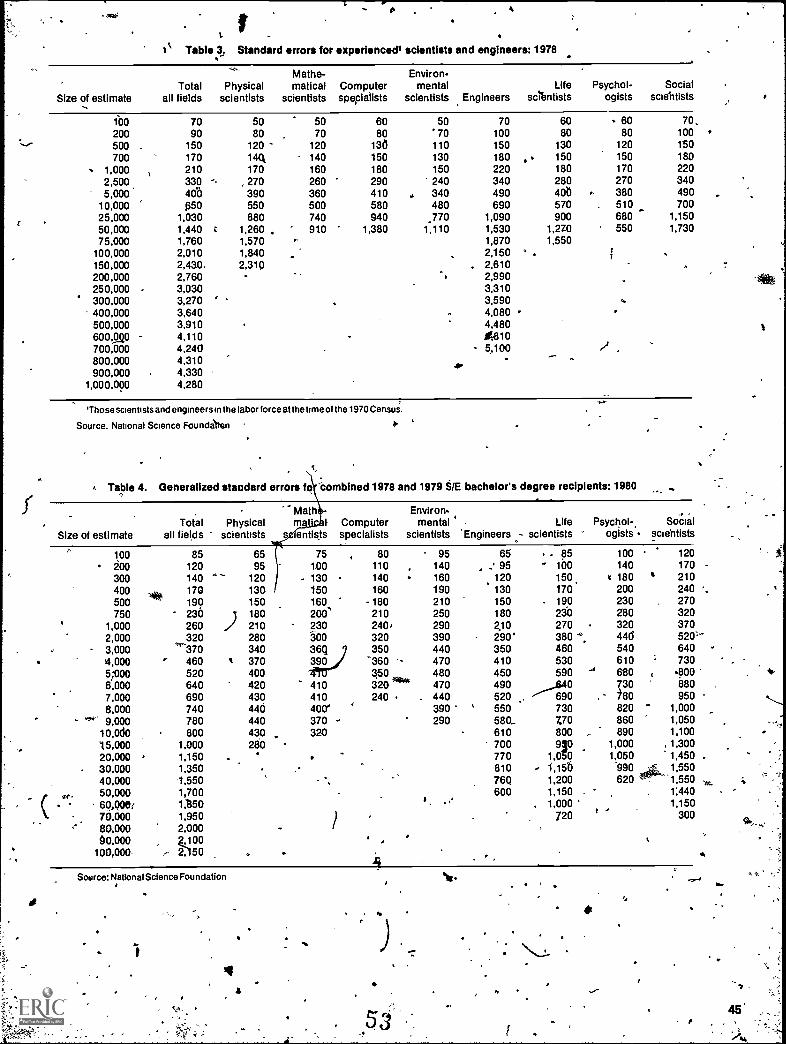
I
sr6
1"1 Table 3. Standard errors for experienced' scientists and engineers: 1978.
Size of estimateTotal
all fieldsPhysical
scientists
Mathe-matical
scientistsComputerspeplailsts
Environ-mental
scientists EngineersLife
scibntistsPsychol-
ogistsSocial
scientists
100 70 50 50 60 50 70 60 60 70,200 90 80 70 80 70 100 80 80 100
500 150 120 120 136 110 150 130 120 150700 170 144 140 150 130 180 , . 150 150 180
, 1,000 210 170 160 180 150 220 180 170 2202,500 330 , 270 260 290 '240 340 280 270 3405,000 40.6 390 360 410 ,,, 340 490 406 .. 380 490
10,000 650 550 500 580 480 690 570 510 70025,000 1,030 880 740 940 770 1,090 900 680 1,150
50,000 1,440 1,260 910 1,380 1,110 1,530 1,270 550 1,73075,000 1,760 1,570 . 1,870 1,550
100,000 2,010 1,840 2,150 ° ;;
150,000 2,430. 2,310 2,610 .200,000 2,760 2,990250,000 3,030 3,310300,000 3,270 ° 3,590 .,
400,000 3,640 4,080500,000 3,910 4,480600,90 4,110 4810700,000 4,240 5,100 ,i800,000 4,310
ow.
900,000 4,3301,000,090 4,280
'Those scientists and engineers in the labor force at the time of the 1970 Censu
Source. National Science FoundAen
Table 4. Generalized standard errors fo combined 1978 and 1979 S/E bachelor's degree recipients: 1980
Math Environ-Total Physical m 1 Computer mental Life Psychol- Social
Size of estimate all fields scientists ientists specialists scientists 'Engineers ,- scientists ogists scientists
100 85 65 75 80 95 65 - 85 100 120
200 120 95 100 110 , 140 .' 95 - 100 140 170
300 140 - 120 130 140 160 120 150. r 180 ' 210400 170 130 150 160 190 130 170 200 240At500 190 150 160 180 210 150 190 230 270750 236 ) 180 200' 210 250 180 230 280 320
1,000 260 ./ 210 230 240, 290 210 270 320 3702,000 320 280 300 320 390 290 380 -0 44d 520'--3,000 '4-370 340 36Q 350 440 350 460 540 640 -4,000 " 460 ' 370 390 -360 470 410 530 610 : 730spoo 520 400 350 480 450 590 ... 680 .8006,000 640 420 410 320 470 490 0 730 8807,000 690 430 410 240 440 520 ,----f6t0 ,° X80 950
.
8,000 740 440 400" 390 ' 550 730 820 1,0009,000 780 440 370 - 290 580. Z70 860 1,050
10,0d0 800 430 , 320 610 800 890 1,100`15,000 1,000 280 700 910 1,000 , 1,30020,000 , 1,150 770 1,030 1,050 1,45030,000 1,350 810 - 1,156 '990 1,550
40,000 1,550 760. 1,200 620 1,550 .....
50,000 1,700 600 1,150 _ 1;440
60,008: 1;650 , 1,000 1,150
80,000 2,000 - )720 t . 300
.-70,000 1,950
at
60,000 Z100100,000- 2150
Source: National Science Foundation
1e,
7
45.. .
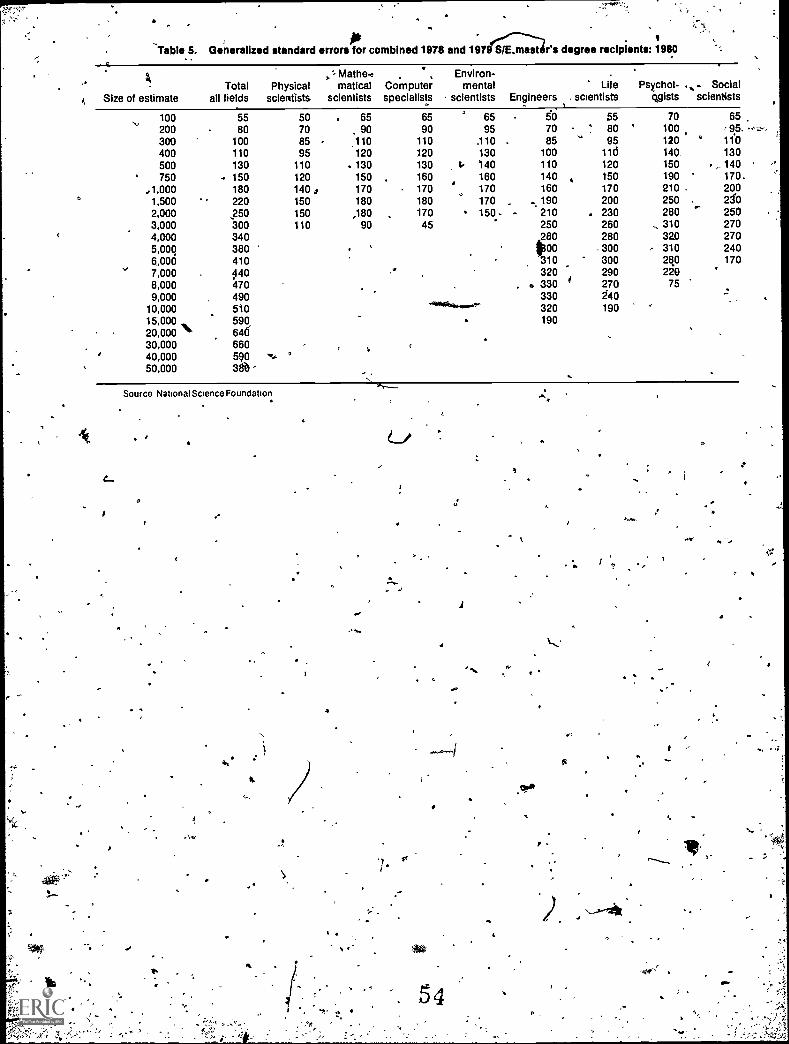
.;:e"
'Table 5. Generalized standard errors for combined 1978 and 197eS/E.ThThiast r's degree recipients: 19800
Total Physical, Size of estimate all fields scientists
Mathe-.matical
scientistsComputerspecialists
Environ-mental
scientists EngineersLife
scientistsPsychol-
ggistsSocial
scientists
100 55 50 65 65 65 6::I 55 70 65200 80 70 90 90 95 70 80 ' 100 9.5. '' ''-'300 100 85 110 110 .110 85 95 120 4 110400 110 95 120 120 130 100 11d 140 130500 130 110 130 130 1. '140 110 120 150 . 140750 150 120 150 , 160 160 140 150 190 170.
.. 1,000 180 140 ,2 170 170 170 160 170 210 2001,500 220 150 180 180 170 . , 190 200 250 2S0
2,000 250 150 ,180 170 150 . - 210 . 230 280 2503,000 300 110 90 45 250 260 , 310 2704,000 340 280 280 320 2705,000 380 1300 ,300 ,. 310 2406,,000 410 '310 300 280 1707,000 440 .° 320 290 220 '8,000 470
33270 75
9,000 490.
003 3 No .10,000 510 320 19015,000 590 19020,000 64630,000 66040,00050,000 53:3:1-
Source National Science Foundation
a
,
Aerr
or.
e
r
.4,
r
,
P.
. 54
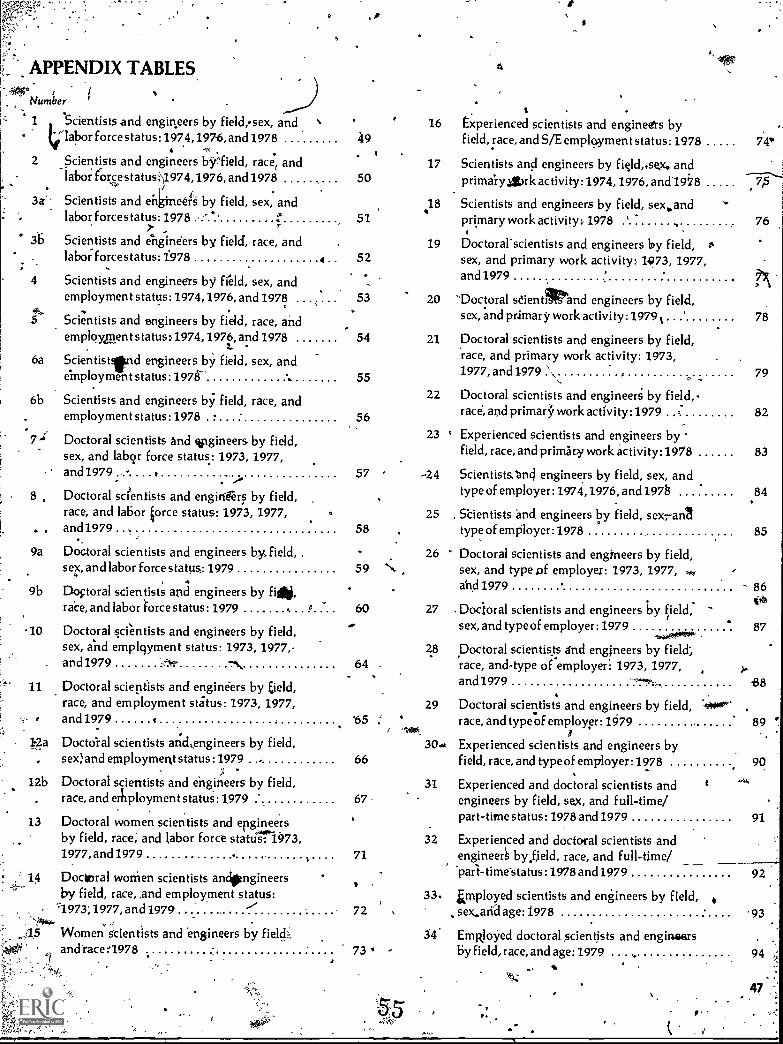
;. ". APPENDIX TABLES.
Number
1.
Scientists and engineers by field;sex, and("labor force status: 1974,1976, and 1978
2 Scientists and engineers byfield, race, and.labor forcestatus ')1974, 1976, and 1978
3d Scientists and eninee ls by field, sex, andlabor forces tatus: 1978
3b Scientists and engineers by field, race, andlabor forcestatus: 1'978
4 Scientists and engineers by field, sex, andemployment status: 1974,1976, and 1978
5 Scientists and engineers by field, race, andemployment status : 1974, 1976, and 1978
7..
6a Scientistfnd engineers by field, sex, andemployment status: 1978
Scientists and engineers by field, race, andemployment status: 1978
7 Doctoral scientists and ttngineers by field,sex, and labqr force status: 1973, 1977,and1979 .
.
8 , Doctoral scientists and enginrers by field,race, and labor force status: 1973, 1977,and 1979
9a Doctoral scientists and engineers by field,sex, and labor force status: 1979
9b Doctoral scientists and engineers by fib,race, and labor force status: 1979
10 Doctoral scientists and engineers by field,sex, and emplqyment status: 1973, 1977,
. and1979
11 Doctoral scientists and engineers by field,race, and employment status: 1973, 1977,
e and1979
Na Doctoral scientists and engineers by field,, sex) and employment status :1979
;12b Doctoral scientists and engineers by field,
race, and erhployment status : 1979
13 Doctoral women scientists and engineersby field, race, and labor force status-1973,1977, and 1979
14 DoCkoral women scientists anclongineersby field, race, .and employment status:
'1973;1977, and 1979 ./.45 Women scientists and engineers by field
andracen978
49s
16
1750
1851
194 52
.
53 20
54 21
5522
5623
57 -24
2558
2659 N
60 27..
2864 -
- .
29'65
30.466
3167
3271
33.72
34'73 ' -
A
s
Experienced scientists and engineers byfield, race, and S/E employment status: 1978
Scientists and engineers by figld,.sex, andprimalyAbrk activity: 1974, 1976, and1978
Scientists and engineers by field, sex.andprimary work activity: 1978 '
74,
75
Doctorascientists and engineers by field, osex, and primary work activity:. 1973, 1977,and 1979
'Doctoral seientStand engineers by field,sex, and primary work activity: 1979
76
Pk
78
Doctoral scientists and engineers by field,race, and primary work activity: 1973,1977, and 1979 79
Doctoral scientists and engineers by field,-race, and primary work activity: 1979 82
Experienced scientists and engineers byfield, race, and primary work activity: 1978 83
Scientists.nd engineers by field, sex, andtype of employer: 1974,1976, and 197$ .84
, Scientistsientists and engineers by field, sexratype of employer: 1978 85
Doctoral scientists and engineers by field,sex, and type DE employer: 1973, 1977,aitd 1979 86
i416Doctoral scientists and engineers by field,sex, and typeof employer: 1979 87
Doctoral scientists and engineers by field;race, and-type of employer: 1973, 1977,and 1979
Doctoral scientists and engineers by field,
88
race, and type'of employer: 1979 89 "
Experienced scientists and engineers byfield, race, and type of employer: 1978 90
Experienced and doctoral scientists andengineers by field, sex, and full-time/part-time status : 1978 and 1979 91
Experienced and doctoral scientists andengineer by .field, race, and full-time/part-time status : 1978 and1979 92'
mployed scientists and engineers by field,sex..add age: 1978 93
Employed doctoral scientists and engineersby field, race, and age: 1979
4
, -;
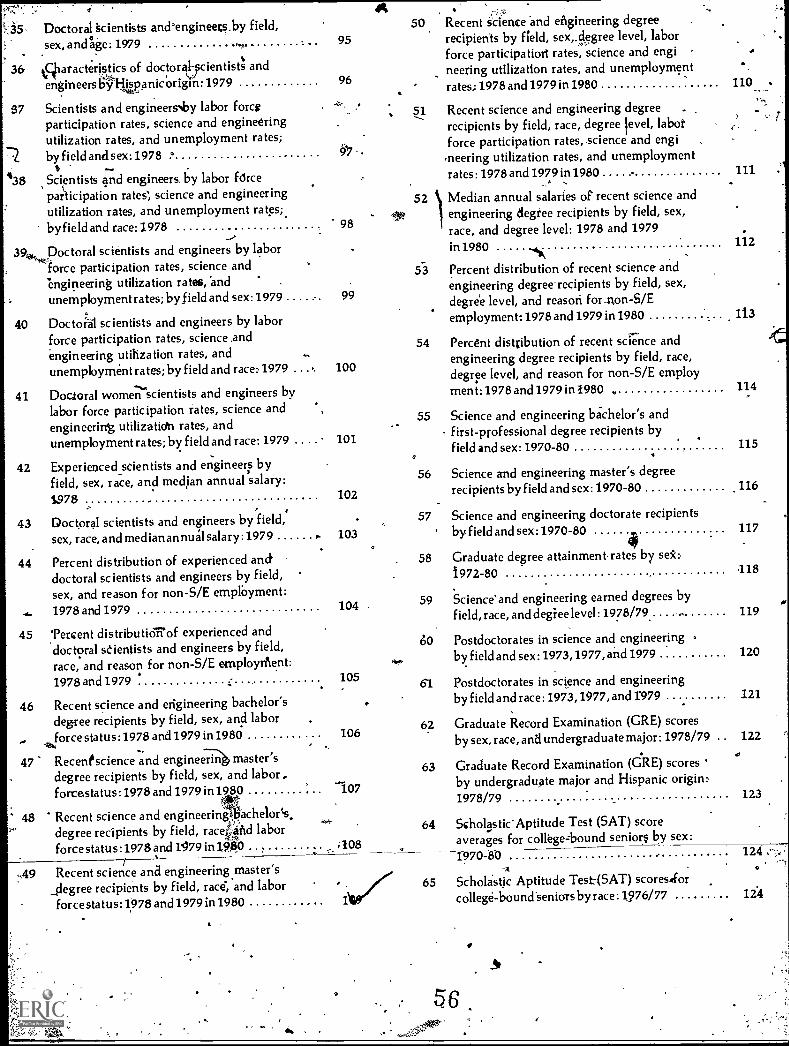
Doctoral gcientists andengineets.by field,sex, and;ge: 1979
,aracteristics of doctoral dentists and
engineers by Hispanic or igin: 1979
37 Scientists and engineersby labor forceparticipation rates, science and engineeringutilization rates, and unemployment rates;
R by fieldandsex: 1978 °I.
Scientists and engineers. by labor forceparticipation rates, science and engineeringutilization rates, and unemployment rates:,
438
by field and race: 1978
39 Doctoral scientists and engineers by laborforce participation rates, science andengineering utilization rates, and .
unemployment rates; by field and sex: 1979
95
96
50
51
9.7 .
52
98
53
99
54
. . 100
55
. . . 1010
56
102
57103
58
104 59
6.0
105 61
10662
63
107
64
;108
65
-A197
40 Doctjal scientists and engineers by laborforce participation rates, science Andengineering utilization rates, andunemployment rates; by field and race: 1979
41 Doctoral women scientists and engineers by
labor force participation rates, science andengineering utilization rates, andunemployment rates; by field and race: 1979 .
42 Experienced scientists and engineers byfield, sex, race, and median annual salary:1978
43 Doctoral scientists and engineers by field,'sex, race, and median annual salary: 1979
44 Percent distribution of experienced anddoctoral scientists and engineers by field,sex, and reason for non-S/E employment:
.. 1978 and 1979
45 Percent distribution of experienced anddoctoral scientists and engineers by field,race, and reason for non-S/E einploynent:1978 and 1979
46 Recent science and engineering bachelor'sdegree recipients by field, sex, and laborforce status : 1978 and 1979 in 1980
At14
47 Recenescience and engineer-14 master'sdegree recipients by field, sex, and labor,forcestatus: 1978 and 1979 in 1980
48 Recent science and engineering bachelor'sdegree recipients by field, race; id labor
4'4'4forcestatus: 978 and 1979 in 1,980
,49 Recent science ana engineering master's,slegree recipients by field, race, and laborforcestatus: 1978 and 1979 in 1980
Recent Science and engineering degreerecipients by field, sex,.degree level, laborforce participatiort rates, science and engineering utilization rates, and unemploymentrates; 1978 and 1979 in 1980 110
Recent science and engineering degree .recipients by field, race, degree level, laborforce participation rates, science and engi,neering utilization rates, and unemploymentrates: 1978 and 1979 in 1980
Median annual salaries of recent science andengineering degree recipients by field, sex,race, and degree level: 1978 and 1979
111 :
in 1980 112'4161/4
Percent distribution of recent science andengineering degree recipients by field, sex,degree level, and reason for-ton -S/Eemployment: 1978 and 1979 in 1980 113
Percent distribution of recent science anddegree recipients byengineering field, race,
degree level, and reason for non-S/E employmen t:1978 and 1979 in 1980 114
Science and engineering bachelor's andfirst-professional degree recipients byfield and sex: 1970-80 115
Science and engineering master's degreerecipients by field and sex: 1970-80 116
Science and engineering doctorate recipientsby field and sex: 1970-80
Graduate degree attainmentrates by se*:1972-80
Science and engineering earned degrees by
117
118
field, race, and degiee level: 1978/79.. 119
Postdoctorates in science and engineeringby field and sex: 1973,1977, and 1979 120
Postdoctorates in science and engineeringby field and race: 1973, 1977, and 1'979 121
Graduate Record Examination (GRE) scoresby sex, race, and undergraduate major: 1978/79 122
Graduate Record Examination (GRE) scores 'by undergraduate major and Hispanic origin:1978/79 123
ScholasticAptitude Test (SAT) scoreaverages for college -bound seniors by sex:
1970-80
Scholastic Aptitude Test-(SAT) scores.forcollege-bound-seniors by race :1 .976/77 124
124
56
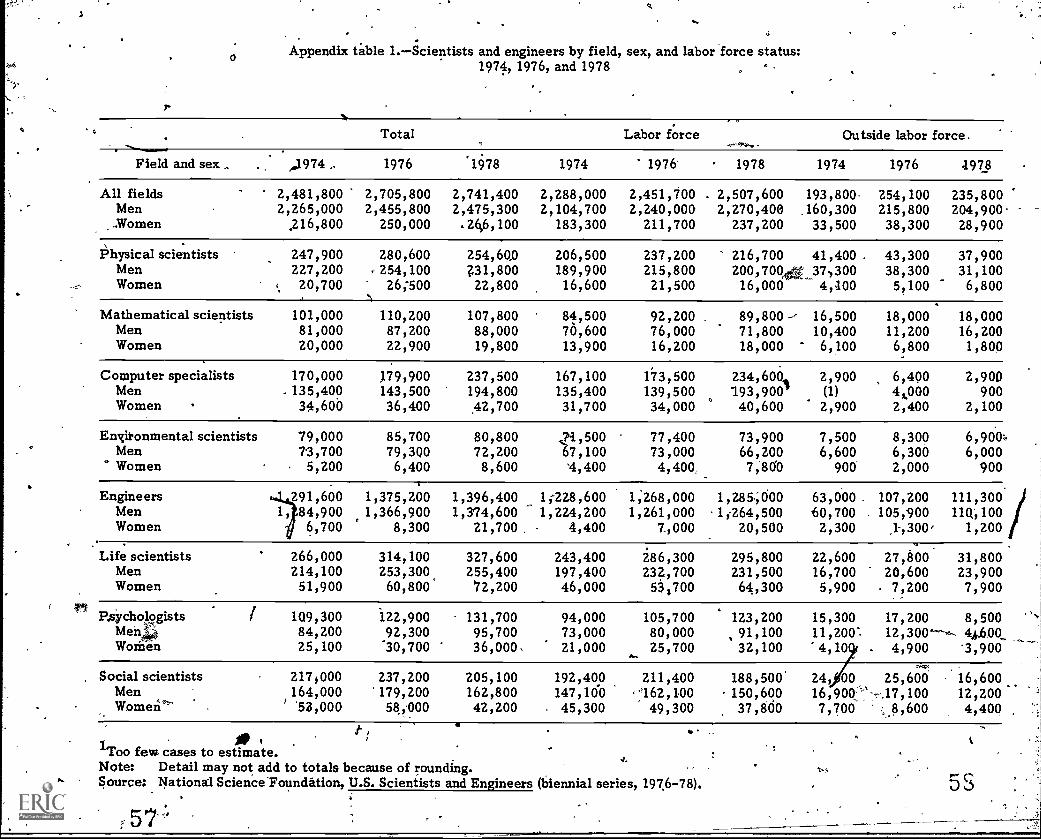
Appendix table 1.- Scientists and engineers by field, sex, and labor "force status:1974,1976, and 1978
Total Labor force Outside labor force.
Field and sex 1976 '108 1974 1976' 1978 1974 1976 1978
All fields 2,481,800 2,705,800 2,741,400 2,288,000 2,451,700 . 2,507,600 193,800 254,100 235,800Men 2,265,000 2,455,800 2,475,300 2,104,700 2,240,000 2,270,400 160,300 215,800 204,900
..Women .216,800 250,000 .246,100 183,300 211,700 237,200 33,500 38,300 28,900
Physical scientists 247,900 280,600 254,60 206,500 237,200 216,700 41,400 . 43,300 37,900Men 227,200 254,100 ?31,800 189,900 215,800 200,700 , 37,300 38,300 31,100Women 20,700 26;500 22,800 16,600 21,500 16,000 4,400 5,100 6,800
Mathematical scientists 101,000 110,200 107,800 84,500 92,200 89,800 -p 16,500 18,000 18,000Men 81,000 87,200 88,000 70,600 76,000 71,800 10,400 11,200 16,200Women 20,000 22,900 19,800 13,900 16,200 18,000 6,100 6,800 1,800
,
Computer specialists 170,000 J79,900 237,500 167,100 173,500 234,60Q, 2,900 6,490 2,90DMen .135,400 143,500 194,800 135,400 139,500 193,900 (1) 4,,000,.. 900Women 34,600 36,400 42,700 31,700 34,000
040,600 2,900 2,400 2,100
En' itonmental scientists 79,000 85,700 80,800 77,400 73,900 7,500 8,300 6,9004Men 73,700 79,300 72,200 67,100 73,000 66,200 6,600 6,300 6,000Women 5,200 6,400 8,600 '4,400 4,400 7,800 900 2,000 900
Engineers 291,600 1,375,200 1,396,400 1;228,600 1;268,000 1,285,000 63,000 107,200 111,300Men 1, 84,900 1,374,600 1,224,200 1,261,000 264,500 60,700 105,900 11Q;100Women 6,700
1,366,9008,300 21,700, 4,400 7,000 20,500 2,300 1-,300 1,200
Life scientists 266,000 314,100 327,600 243,400 286,300 295,800 22,600 27,800 31,800Men 214,100 253,300 255,400 197,400 232,700 231,500 16,700 20,600 23,900Women 51,900 60,800' '72,200 46,000 53,700 64,300 5,900 7,200 7,900
rt P.sy chologists 1Q9,300 122,900 131,700 94,000 105,700 123,200 15,300 17,200 8,500Men ,t' 84,200 92,300 95,700 73,000 80,000 91,100 11,200' 12,300 44.600Women 25,100 -30,700 36,000, 21,000 25,700 32,100 4,10 4,900 '3,900
r'r*Social scientists 217,000 237,200 205,100 192,400 211,400 188,500 24/00 25,600 16,600
Men 164,000 179,200 162,800 147,100 62,100 150,600 16,90C: .17,100 12,200Women woo 58;000 42,200 45,300 49,300 37,800 7,700 ..8,600 4,400
ACD
'111.
'Too few cases to estimate.Note: Detail may not add to totals because of rounding.Source: National Science'Foundation, U.S. Scientists and Engineers (biennial series, 1976-78). 5
.

ut
- 'Appendix table 2.-Scientists and engineers by field, race, and labor force status:'
1974, 1976, and 1978
Total( Labor force Outside labor force
Field Total White Black Asian Other' Total White Black Asian Other Total White/ Black Asian Other'
1974
All fields 2,481,800 , 2,375.,600 38,500 43,900 23,800 2,288,000 2,188,500 35,500 41,200 22,800 193,800 187,100 3,000 2,7Q0 1,000Physical scientists 247,900 235,400 4,100 6,200 2,200 206,500 195,000 4,100 6,006 1,400 41,406 40,400 (2) 200 800Mathematical scientists 101,000 96,700 2,500 1,5015 400 84,500 80,600 2,200 1,300 400 16,500 16,100 300 200 (2)
l'°11 Computer specialists 170,000 162,500 3,300 .3,500 700 167,100 160,000 3,000 3,400 700 2,900 2,500 300 100 (2)Environmental V
scientists 79,000 77,300 200 700 700 , 71,500 70,000 200 700 600 7,500 , 7,300 (2) (2) 100Engineers 1,291,600 1,246,700 11,800 22,300 10,800 1,2.28,600 1,184,900 10,900 22,000 10,800 63,000 61,800 900 300 (2)Life scientists 266,000 255,700 3,200 3,700 3,400 243,400 233,900 '2,700 3,400 3,400 22,600 21,800 500 300 (2)Psychologists 109,300 103,500 1,800 3,000 1,000 94,000 88,800 1,700 2,500 1,000 15,300 14,700 100 500 (2)Social scientists 217,000 197,800 11,600 3,000 4,600 192,400
Ch.175,400 10,700 1,900 4;400 24,600 22,400 900 1,100 200
1976
All fields 2705,800 2,593,600 40,400 45,400 26,400 2,451,700 2,348,200 36,000 42,600 24,800 254,100 245,400 4,400 2,800 1,600'Physical scientists 280,600 266,300 4,400 5,900 4,000 237,200 224,800 3,400 5,600 3,600 43,300 41,500 1/,000 300 500Mathematical scientists 110,200 105,300 2,700 1,600 500 92,200 88;000 2,400 1,200 500 18,000 17,300 300 400- (2)Computer specialists 179,900 171,800 3,700 3,700 800 173,500 165,400 3,700 3,600 800 6,400 6,400 .(2) , (2) (2)Environmental -
scientists ' 85,1700 , .84,600 100 500 500 77,400 .76,300 100 500 500 8,300 8,300 (2) , (2) (2)Engineers 1,375,200 1,327,300 12,600 23,000 12,400 1,268,000 1,222,400 12,200 21,400 12,100 107,200, 104,900 400 1,600 300Life scientists 314,100 302,100 3,600 4,100 4,200 286,300 275,600 3,000 3,900 3,800 27,800 26,500 600 300 '400PsychologistsSocial scientists
122,900237,200
116,900219,400'
1,60011,600
3,3003,400
1,1002,800
105,700211,400
100,100195,700
1,5009,800
3,2003,300
1,100 17,20025,600
, 16,80023,700
2001,800
100roo
100100
1978
All fields 2,741,400 2,621,200 41,800 53,700 24,760 2,507,600 2,393,000 -39,600 51,300 23,200 233,800 227,600 2,200 2,500 1,500Physical scientists 254,600 243,300 3,700 5,700 1,900 216,700 206,800 3,200 5,300 1,400 37,900 36,500 , 500 400 500Mathematical scientists 107,800 101,300 3,060 2,000 1,400 89,800 83,900 2,900 1,800 " 1,200 18,000 17,400 100 100 200Computer specialists 237,500 229,100 1,400 6,900 100 234,600 226,300 .44,,300 6,900 100 2.900 2.800 100 100 (2)
Environmentalscientists 80,800 78,900 700 600 500 73.0.00 72,200 700 600 -500 6,900 6,700 (2) 100 100
Engineers 1,396,400 1,344,000 11,400 27,000 13,900 1,285;000 1,234,400 10,600 26,400 13,600 111,300 109,600 800 700 300
'Life scientists 327,606 313;100 6,700, 5,900 1,900 295,800 282,400 6,600 5,200 1,600 31,g00 30,700 100 700 200
Psychologists 131,700, 127,000 3,700 100 860 123,200 119,000 3,500' (2) 700 8,500 8,000 .300 200 (2)
Social scientists 205;100 184,600 11,000 5,400 .4,000 188,500 168,700 10,700 5,100 4,000 16,600 15,900 300 300 100.
1lncludes American Indians, "Other," and "No report."
2Too few cases to estimate.Note: Detail may not add to totals because of rounding.Source: National Science Foundation, U.S. Scientists ancrEngineers (biennial series, 1976-78).
.

I
.
411t
,..EnvironmentajscieatistSEarth scientistsOceanographersAtmospheric scientists
411
Appendit table 3a.--Scientists and engineers by field, sex, aneflaborforce status: 1978 .
Field /MenTotal Labor. forct-
.cititside labor force
Women Men Women Men Women
All fields
Physical scientistsChemistsPhysicists/AstronomersOther physical scientists
`Mathematical scientistsMathematiciansStatistician"
Computer specialists
Engineers
Life scientists 'Biological scientistsAgricultural scientistsMedical scientists
Psychologists
Social scientists-OconomistsSociologists/ .
. AnthropologistsOther social scientists
2,475,300 266,100 2,270,400- 237, 00' :4's 204,800 ' 28,900.
231,800 22,800 200;700 16,000 31,100 6,800154,7.00 19,000 133;400 '*131 200 , '21,300 5;70059,300 2,200 50,900. 1,400*. 8,500 SOO17,700 1,500 16,500 ° 1,300 1,300 200
'
88,000 19,800 71,800 18,000 16,400. 1,80079,400 17,800 65,100 16,600 14,200 1,2008,600 2,100 6,700 °' 1,500* 1,900 , 600.
194,800 42,700 113,10- 40,600 ° .900, 2,100
72;i200. ,8,600 . ".. 66,200. . 7,800, - 6,000 - 9004 -62,400 '8,500 57,000 7,700 .5,400 9001,600 (1) 1,400 . (1) 100 (1)'8,200 100 7,804 100 4 500
1,3741600 21,700 '1,264,500 20,500 110,100, 1,200
255,400 72,200 231,500, 64,31/0 23,900 7,900110,700 42,800 95,400 37,500 15,300 . 5,300121,700 .8,700 113,400 .7,000 8,300* . 1,700
23,13400 20,700 22,700 19,800 200 8Q0' '
95,700 36,000 I ." 91,100 32,100. 4,600 3,900
162,800 42,200 150,600 37,800 12,200 4,40052.300 6,600 47,700 . 5,400 4,700 1,300.
-29,100 15,400 26,300 13,200 2,800 2,20Q81,400 20,200 76,700 19;300 4,70Q 100
Too few cases to estimate.Note: Detail may not add to totals beOause a rounding.Source: National science Foundation, U.S. Scientists and Engineers: 1978 (NSF 80304).

-
Appendix table 3b.-Scientists and engineers by field, race, and labor force status: 1978
r'Engineers
Field
.
llncludes American Indians, "Other," and "No report."
Total
0
Labor force
Total White Black Asian Other' Total White Black Asian
:All fields 2,741,400 2,621,200 41,800 53,700 24,700 2,507,600 2,393,600 39,600 51,300
Physical scientists . 254,660 243,300 3,700 5,7.00 1,900 2164,700 206,800 3,200 5,300Chemists 173,700 164,900 3,500 3,800 1,500 146,600 139,000 3;100 3,400Physicists/.
Astronomers 61,600 59,500 . 200 1,600 300 52,300 50,400 100 1,500' Other physical r
scientists 19,300 18,800 (2) 300 200 17,80 17,400 (2) 300
Mathematical scientists 107,800 101,300 3,00042,000
1,400 89,800 83,900 2,900 1,800Mathematicians 97,100 91,200 2,800' 1,800 1,300 81,700 -76,200 2,700 1,700.Statistidians 10,700 .10,100 200. 200 100 8,100 7,700 200 .. 200
Computer specialists 237,500 229,100 1,400 6,900 100 1. 231,600 . 226,300 1,306. 6,900,c-
Eariironmenialscientists 80,800 78,900 700 600 500 73,900 72,200 700 600
. Earth scientists 70,900 69,100 ., 700 500 500 64,600 63,000 700 400Oceanographers 1,600 1,400 (2) 400 (2) 1,1190 1,3Q0 2) . 100Atmospheric scientists 8,300 8,300' (2) (2) (2) 7,900 7,900 -41), (2) ,
1,396,400 1,344,000 11,406 27,000 13,900 1,285,000 1,234,400 10,600 26,400
Life scientists 327,600 313,100 6,700 5,900 1,900 295,800 282,400 6,600 5,200Biological scientists 153,500 145,000 2,800 4,500 1,100 132,900 125,100 2,700 3,900Agricultural-scientists. 130,400 125,200 3,600 1,000 600 120,400 115,400 3,600- 1,000
Medical scientists 43,600 42,900 200 400 200 42,500 41,900 200 300
Psychologists 131,700 127,000 3,700 100 800 123,200 119,000 3,500 (2)
oCial scientists%. 205,100 Oitt ,6013 11,000 5,400 4,000 188,500 168,700 10,700 5;100
Economists t59,000 7,500 TOO 800 500 - 53,000 51,900 (2):, 660So ciokigists/ ''is'
Anthropologists 44,500 36,400 5,400% 400 2,300 39,500 31,500 5,400 400Other social -scientists . 101,600 90,700 5,500 4,200 1,200 96,000 85,300 5,300 4,200
2Too few cases to estimate.Sourcei National Science Foundation, U.S. Scientists and Engineers (NSF 80-304).
t
a
0
Outside labor force
Oth Total White ,Black t Asian 'Other'
23, 00 233,800.
1,400 37,9001,100 27,100\.
200 9,200. :*
100 1,500
1,200 18,0001,100 15,400
0 100 2,500
100 2,900
.500 6,900500 6,300
(2) 100(2) 500
13,6001141,300
1,600 31,8001,000 20,700
500 10,000100 1,100
700 8,500,4,000, 16,600, 500 2'5 ,1:0 0
2,200 5,100
1,20Q 5,600
..
227,600 2,200 2,500 1,500
,..36;500 500 400 500262060 400 i00 300
9,100 100 (2) 100
1,400 .(2) (2) (2)
17,400 100 100 20015,000 100 100 200
2,500 (2) (2) (2)
2,800 100 100 (2)
6,700 (2) 100(.6,100 AZ) 1 0 100
100 (2) (2) ' (2) .500 (2) (2) (2)
109,600 800 700 300
30,700 100 700 20019,900 100 600 100
9,800 (2) (2) 2001,000 (2) 100 (2) ....
8,000 300. 200 (2 ,--.
15,960 300 300 100'5,600 100 200 (2)
.5,000 (2), (2) , 100
1
5;400 200 (2) (2)
-,
n r A

7
Appendix table 4.-Scientists and engineers by field, sex, and employ ent status:1974,1976, and 1978
Total employed
Total In S/E . Outside S/E Unemployed, seeking
1_78Field and sex 1974 1976 1978 1974 1976 1978 1974 1976 1978 1974 1976
All fields 2,248,200 2,377,100 2,473,200 NA 2,090,300 2,091,900 NA 286,800 381,300 39,800 74,600Men 2,072,100 2,179,900 2,241,700 NA 1,914,500 1,957,400 NA 26,600 284,300 32,600 60,100Women 176,100- 197,200 231,500 NA 175,900 134,600 NA 21,300 97,000 7,200 14,500
. Physic scientists 201,400.
227,400-
212,400 NA 1801400 184,700 NA 38,000 27,000 5,100 9,900Me, 185;500 207,500 197,400 NA 176,400 174,400 NA 31,100 22,900 4,400 8,400
.W9men .- 15,900 1,9,900 15,000 NA 13,100 10,300 NA 6,900 4,700 700 1,500
Mathematical scientists 82;800 88,300 88,400 NA 85,700 42,900 NA 2,600 45,600 '1,700 '3,900Men' 69,300 72,700 70,900 , NA . 710,300 38,100 NA 2,300 32,700 1,300 3,300Women 13,600 15,600 17;500 NA 4 15,300 4,800 NA 300 12,800 400 600
Computer specialists 166,200 172,300 233,900 NA 167,200 231,400 NA 5,200 2,500 900 1,200Men 134,900 138,700 193,400 NA 134,400 191,100 NA 4,300 .' 2,200 500 800
4 Women 31,300 33,600 40,600 NA 32,700 40,300 NA 900 300 400 400
Environmentalscientists 69,100 74,800 72,200 ..NA 52,000 62,400 NA 22,900 9,900 2,400 2,606
Men 64,800 71,100 64,600 NA 49,900 57,500 NA 21,200 7,100 2,300 1,806Women 4,300 3,700 7,700 NA 2,100 5,000 NA 1,600 2_23300 100 700
Engineers 1,212,600 1,240,700 1,268,400 NA *1403,400 1-,101,200 NA 117,300 67,200 16,000* 27,200Men 1,208,300 1,234,000 1,248,500 NA 1,117,600 1,183,400 NA 116,500 ,,,,65,100 15,900 26,900Women 4,300 6,700 " 19,800 NA 5,00 17,800 NA 900. -2,100 100 300
.Life scientists 238,600. 277,500 291,000 NA 224,900 201,800 NA 62,600 89,100 4,800 8,800
Men 193,400 226,000 227,800 NA 176,400 165,600 NA 49,600 62,100" '4,000 .6,600Women- 45,200 51,400 63,200 NA 48,500 36,200 NA 2,900 26,900 800 2,200
Psychologists 89, 60's 97,800 ,20,900 NA 84,200 71,200 NA 13;500 49, 0 4,400 8,0e0Men, 71,500,. 76,700 89,700 NA 64,600 58,200 NA 12,100 31,500 1,500 3,300Women 18,100 21,100 . 31,200 NA 19,70Q 13,100 NA 1,400 18,200 2,900 4;700
Sociaisaentists 187,900 198,300 186,000 NA 163,600 96,200 NA 34,700 89,800 4,500. 13,100Men 144,500 153,200 149,500 NA 124,900 89,000 NA 28,300 60,500 2',700 0,000
'Women 43,400 45,200 36,400 NA 38,700 7,200 NA 6,400. 29,300 1,800 4,200
NA: got available.b Note: Detail may not add to totals because of rounding.
Sotirce: National Science Foundation, U.S. Scientists and Engineere(biennial series, 1976-78).,
34,40028,7005,700
4;1003,4001,000
1,400900500
600600100
1,7001,600
100
16,70616,000
700 -
-..
149003;8001,200
2,3001,400
900'
2,5001,1001,400
A 65eC
6

Appendix table 5.-Scientists and engineers jay. field, race,and employment status: 1974,1976, and 1978
Total employedr
Unemployed, seeking
Field T'otal White Black Asian
. 1974
All fields - 2,248,200 2,152,900 32,sop 40,50QPhysical scientists 201,400 190,100, 4;0(0 5,900Mathematical scientists $2,800 79,300 11800 1,300Computer specialists 166,200 159,300 2,800 3,400Environmental scientists ,100 67,700 200 700Engineers 41111 1,212,600 1;169,800, 10,400 21,800Lifejigentists 238,600 229,100 2,600 3,300PsyrFlogists 89,600 £14,600 1,500 2,500Social'scientists, 187,900 172,9Q0 9,100 1,800
1976
All fields 2,377,100 2,278,800 33,000 41,400Physical scientists '227;400 215,300 3,300 5,400Mathematical scientists 88,300 84,900 2,000 1,100Computer specialists 172,400 164,400 : 3,500 3,600Environmental scientftts 74,800 73:700 100 500Engineers 1,240,800 1,196,800 11,700 20,600Life scientists 277,500 267,000 2,900 3,900Psychologists 97,700 92,400 1,300 3,100.Sociil scientists 198,300 184,300 8,200 3,300
197$
All fields 2,473,200 2,360,900 39,000 50,500Physical scientists 212,400 202,500 3,100 5,300
44dathematical scientists ' 88,400 82,600 2,900 1,800Computer specialists 233,900 225,800 1,100 6,900Environmental scientists 72,200 70,600 700 '00Engineers .1 1,268,400 1,217,900 10,600 26,400,Life scientists 291,000 278,200 6,600 4,600'Psychologists 120,900 117,000 -3,300 (2)Social scientists 186,0.00 166,300 10,600 5,100
1Includes AMerican Indians, 'Other," and "No Report."2Too few cases to estimate,Note: Detail may.not add to totals because of rounding.Sotifce: National Science Foundation, U.S. Scientists and Engineers (biennial series, 1976-1978).
Other 1 Total .,White Black' Asian- Other 1
22;500 39,8001,4001 5,100.400 1,700
700 900''600 ' 2,400
10,800 16,0003,400 4,800.1,000 4,4004,400 4,590
35;6004,900.1,300
7002,300
15,1004,6004,2002,500
!'700.,A:. 300-106:-.03 -(2)
0 (2) .:(2)op.. (2) (2) -
(21 (2). (2)500 200 (2)100 100 (2)240 (2) (2) .
1,600 100 (2) all
23,800 74,6003, 0 9,900
20 3,900800 1,100
0 500 2,60011,80Q 003,700 ,8001,000 8042,500 13, 00
22,8001,300'
,1,1200100
:,,1 40013,500
69,4009,5003,1001,0002,600
25,6008,600
11,400
3,000100
400200
(a)500100200
1,600
3400 32,700 , 600 ,.4,300 4,200 - 1001,400 1,300. (2).
600 500 ZOO
1,700* 1,600 (2)16,600 6,500 (2)
1,400 4,900700 2,300
4,000 2,500
4,200 (2),000 '1,200
,400 100
<
1,200 1,000200 100 A
100 300(2) (2)
(2) (2)800 a 300
(2) '10o100 , (2)
(2). . 100
/ 800 400(2) 100(2) (2)(2) (2)(2) ,100(2) 100600 200
(2) (2)(2) (2)
6!
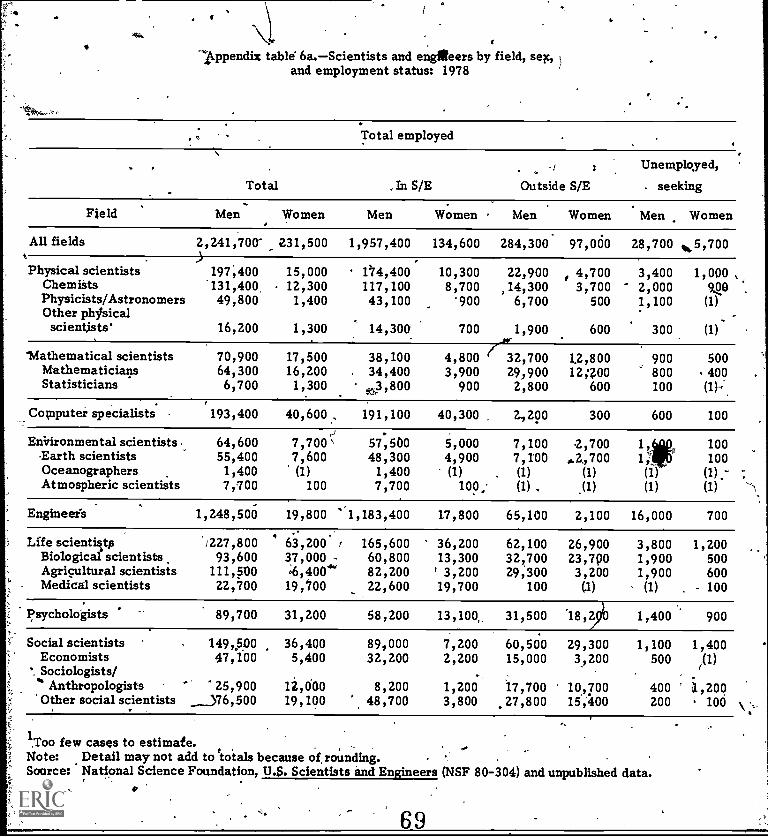
-7Lppendix table 6a.-Scientists and engtieers by field, sec,and employment status: 1978
Total employed
Total In S/E Outside S/E
Unemployed,
seeking
Field Men Women Men Women Men Women Men Women
All fields 2,241,700- 231,500 1,957,400 134,600 284,300 97,000 28,700 Ib.5,700
Physical scientists 197,400 15,000 174,400 10,300 22,900 4,700 3,400 1,000Clemists 131,400 12,300 117,100 8,700 ,14,300 3,700 2,000 906Physicists/Astronomers 49,800 1,400 43,100 '900 6,700 500 1,100 (1)Other phjsicalscientists' 16,200 1,300 14,300 700 1,900 600 300
,(1)
'Mathematical scientists 70,900 17,500 38,100 4,800 32,700 1.2,800 900 500Mathematicians 64,300 16,200 . 34,400 3,900 29,900 12;200 800 400Statisticians 6,700 1,300 3 800, 900 2,800 600 100 (1)-
Computer specialists 193,400 40,600 191,100 40,300 2,290 300 600 100,./ .
EiAironmental scientists 64,600 7,700 \ 57,500 5,000 7,100 2,700 100-Earth scientists 55,400 7,600 48,300 4,900 7,100 *24700 1; 100Oceanographers 1,400 (1) 1,400 (1) , (1) (1) (1) (1),-Atmospheric scientists 7,700 100 7,700 100; (1) , ,(1) (1) (1)
Engineeirs 1,248,500 19,800 '1,183,400 17,800 65,100 2,100 16,000 700
Life scientistp '227,800 63,200 165,600 36,200 62,100 26,900 3,800 1,200Biological' scientists 93,600 37,000 - 60,800 13,300 32,700 23,700 1,900 500Agricultural scientists 111,500 ;6,4004° 82,200 ' 3,200 29,300 3,200 1,900 600Medical scientists 22,700 19,1700 22,600 19,700 100 (.1) (1) - 100
Psychologists 89,700 31,200 58,200 13,100, 31,500 '18,20 1,400 900
Social scientists 149,500 36,400 89,000 7,200 60,500 29,300 1,100 1,400Economists 47,100 5,400 32,200 2,200 15,000 3,200 500Sociologists/
f(1)
Anthropologists "25,900 12,000 8,200 1,200 17,700 10,700 400 ` x,200Other social scientists )76,500 19,100 48,700 3,800 27 800, 15,400 200 . 100
1. few cases to estimate.Note: Detail may not add to `totals because of, rounding.Soarce: National Science Foundation, U.S Scientists and. Engineers (NSF 80-304) and unpublished data.
69

elat
4044,
Appendix table 6b.- Scientists and engineers by field, race,and employment status: 1978
-
Total employ6dv
Field Total . White Black 11. Asian Other 1 * .4'otal
All fields 2,473,200 2,360,900 39,000 50,500 22,800 34,400-
Physical scientists .212,400 202,500 3,100 5,300 1,300 4,300Chemists 143,800 136,200 3,000 3,400 1,100 2,900 ,Physicists/Astronomers 51,200 49,300 100 1,500 200 1,100Other physical scientists 17,500 17,100 (2) 300 (2) 300
MathemSstkcal scientists 88,40Q 82,600 2,900 .1,800 1,200 1,400Mith,ematicians ft.., 80,400 - 75;000 2,700 1,700 1,100 1,300Statisticians 8,0(50 7,600 200 , 200 100 100
Computer specialists 225,800 1;00 6,900 100 600
Environmental scientists 72,200 70,600 700 6.' 400 1,700Earth scientists 62,900 61,400 700 400 400 1,700Oceanographers `` 1,400 1,300 (2) 100 (2) (2)N
Atmospheric scientists . -7,900 7,900' (2) (2) (2) (2)
Engineers 1,268,400 1,217,900 10,00 26,400 13,500 16,600
"Life scientists 291,600 278,200 6,600 4,600 1,400 4,900Biological sciendsts 130,600 123,600 2,700 3,300 :8O0. 2,,30pAgricultural scientists 117,900 . .112,900 3,600 1,000 500' 2,500Medical scientists 42,400 41,800 200 300 100 100
Psychologists 120,900 117,000 3,300 (2); 700 2,300
Social scientists 186,000 166,300 10,600 5,100 4,000 2,500Economists 52,500 51,400' (2) 600. "500 SOO
Sociologists/Alithropologists 37,90Qr 30,000 5;300 400 2,i to 1;600 '
Other socialscientists - 95,600 85,000 5,300 4,200 1,200 400
'Includes American Indian% "Other," and "No Report."2Too few cases to estimate.Note: Detail may not add to. totals because of rounding.Source: ''Nitional Science Foundationn, U.S. Scientists and Engineers (NSF 80-102
Unemployed, seeking
White Black Asian Other .1
32,700 ' 600 , 800 400,
4,2002,8001,100
. ) 300
100, (2) 100
.100 "/,' (2) (2)
(2) (2) (2)(2) (2) 100
10,300 (2) (2) (2)-1,200 (2) (2) (2)
100 4 (2) (2) (2)
500 200 (2) (2)
1,600 .'(2) (2) 100
1,600 , (2) . (2) . 10b(2) . . (2) (2) (2)
- (2) (2) !(2) (2)
16;500 (2) (2) 100
4,2001,5002,500
100
(2) 600(2) 600(2) (2)(2) (2)'
200200(2)
(2)*
2,000 . 200 . (:2) (2)
2,400 00 (2) (2)
500 (2) (2) . (2)'
1,500 100 CZY (2)
300 (2):. (2)' . (2) .

Appendix table 7.-Doctoral scientists and engineers by field, sex, and labor force status:1973,1977, and 1979
Or
Totall Labor force Total employed Outside labor force
Field and sex 1973 1977 1979 * 1973 1977 1979 1973 1977 1979 1973 1977 14479
All fields 238,900 .303,300 332;300 221,900 287,600- 316,700 220,400 284,300 313,700 10,700 .13,100 14,800Men 218,000 :1/1,600 294,400 205,300 259,100 282,400 203,500 256,800 280,400 8,300 10,200 11,300Women 20,900 31,700 37,900 17,600 28,500' 34,300 17,000., 37,500 33;300 2,400 2,900 3,500
Physical scientists 53,000 63,000 64,300 49,300 58,200 60,900 48,500 57,500 , 60,200 3,700 3;30Q, 3,300Men 50,500 58,500 60,600 47,300 55,200 57,600 46,600 54,600 57,000 2,300Women 2,500 3,500 3,700 2,000 3,100 3,200 1,900 2,900 3,100 400
c2,900
400 400
Mathematical scientists 13,100- 15,400 16,100 12,300 14,800 15,;100 12,100 14,600 15,300 500 500 300. Men 12,100 14,200 14,800 11,500 13,700 14,200 11,400 13,50.0 14,200- 400 400 500
Women 1,000 1,200 1,300 800 .'1,100 1,200 800 1,000 1,100 100 100 100.
Computer specialists 2,700 5;800 6,800 2,700 5,800 6,800 2,700 5,800 6,700 (2) (2) (2)Men 2,600 .5,600 6,400 2,600 5,500 6,400' 2,600 5,500 6,400 (2) (2) (2)
-WOmen 100 ... 200 400 100 200 400 100 200 400 (2). (21-,.. (2)
Environmental scientists 10,900 13,500 15,100 1,0,400 13,400 14,700 10,300 13,000 14,600 300 400 400Men 10,600 13,100 14,400 10,200 12,700 14,000 .10,100 12,600 14,000 300 300 300Women 100 500 7.00 300 500. 600 300 409 600 (2) (2) (2)
Engineers 37,300 46,500 51,600 36,000 45,306 50,500 35;800 45,000 50,200. 700 900 1,000Men 37,100 46,200 51,000 35,900 45,000 49,900 35,600 44,800- 49,700 700 900 900Women 200 300 600 100 .300 500' .100 300 500 (2) (2) (2)
Life scientists 63,600 78;300 86,300 58,600 71,900 81,000 58,000 71,900 80,100 3,500 4,700 5,200. Men 55,800 67,600 73;200 52, 0 63,600 69,500 51,900 63,000 68,900 2,500 3,400 3,700
Women 7,800 10,800 13,100 6,4 0 9,300 11,500 .6,400 9,000 11,100 1,000' 1,400 1,500. -
.Psychologists 27,20 35,700 40,300 .25,100 34,200, . 24,900 33,700 38,000 1;200 1,200 1,700. . Men ' 21,500 27;200 30,100 20,2.00 26,300 29,000 . 20,100 °26,100 28,8,00 700 000 1,000
Women 5-,600 8,500 10,200 4,900 WOO 9,400 4,800 7,600 9,200 -500. 600 \t 700 tSocial scientists 31,200 . 45,800 52,000 28,40D 43,300 49,200 28,100 42,100 48,600 1,700 2,100 2,600
Men . 27,700 39;200 43,800 25,400 37,100 11,700 25,200 36,800 41,400 1;400 T,700 2,000 fWomen 3,500 6,600 8,100.` '3,000
11-
6,200 '7,500 2,900. 6,000 7,200 300 400. .600
1"Labor force" plus "Outside labor force" will not add to total poNlation because "No repOrt" is not included.2r .Too few cases to 'estimate.Note: Detail may not add to totals because of rounding.Source: National Science Foundation, Characteristics of Doctoral Scientists and Engineers in the United States (biennial seiks, 1977 -79) and
unpublished data.4

A..Appendix table 8.-Doctoral scientists and engineers by field, race, and labor force status:
1973, 1977, and 1979
Total Labor force Total employed Outside.labor force 1
Field and race 1973 1977 1979 1973 1977 1979 1973 1977 1979 1973 1977 1979
All fields 238,900 303;300 332,300 222,900 287,600 316,700 220,400 284,300 313,700 10,700 13,100 14,800
White 217,100 270,600 293,500 203,100 256,400 279,300 200,900 253,604 276,900 9,500 11;900 13,500
Black 2,200 2,900 3,700 2,100 2,800 3,500 .2,100 2,800 3,400 100 o(2) 200
Asian 9,600 15, 800 21,700 9,300 15,600 24300 9,100 15,300 21,000 100 200 , 400
Other3 9,900 14,100 13,400 8,400 12,900 12,600 8,300. 12,600 12,400 1,000 1,000 800
Physical scientists 53,000 62,000 64,300 49,300 58,200 60,900 48,500 57,500 60,200 2,700 3,300 3,300White 47,900 55,300 56,900 44,700 51,900 53,600 44,000 51,300 53,100 2,400, 3,000 3,100Black 500 600 600 500 600 500 500 600 500 (2) ''''' (2) (2)
Asian 2,200 3,400 4,500 2,200 3,300 4,400 2,100 3,200 4,300 (2) 100 100
Other 2,300 2,700 2,400 1,900 2,400 2,300 1,900 2,400 2,200 200 300,P
100
Mathematical scientists 13,100 15,400 16,100 12,300 14,800 15,400 12,100 14,600 15,300 500 500 700
White 11,800 13,600 13,900 11,200 13,100 13,300 11,000 12,900 13,200 500 500 600
Black 100 .100 200 100 100 ' 200 100 100 200 (2) (2)
...Asian 500 700 1,000 500 700 900 . 5004(42e)(
700 900 (2) (2)
' Other 600 900 1,000 500 800 1,000 500 800 900 (2) 100 (2)
Computer specialists 2,700 5,800 6,800 2,700 5,800 6,700 2,700 5,800 6,700* (2) (2) (2)
White 2,500 5,000 6,000 2,500 5,000 6,000 2,500 5,000 6,000 (2) (2) (2)
Black (2) (2) (2) (2) (2) y (2) (2) (2) (2) (2) (2) (2)
4,Ittp,, 100 600 500 100 600 500 100 600 , 500 (2) (2) (2)
Other 100 200 300 100 200 300 100 ZOO ; 300 (2) (2) (2)
Environmental.
scientists olior 10,900 13,500 15,100 10,400 13,000 14,700 10,300 13,000 14,600 300 400 4 0
White 10,200 12,500 14,000 9,700 12,100 13,600 9,700 12,100 13,600 300 400 0
Black (2) (2) 100 (2) (2) 100 ° (2) (2) 100 (2) (2) (2
Asian 300 -500 500 300 500 500 300 500 500 (2) t2) (2)
Other . 400 , 500 500 400 400 500 400 ,, 400 500 (2) (2) (2)
/Engineers ,37,300 46,500 51,500 36,000 45,300 50,500 35,800 45,000 50,200 700 uk 900 1,000
' White '3h100 39¢700 42,100 32,0d0 38,600 41,200 31,800 38,300 41,000 600 800 800
Black 100 -- 400 200 100 100 200 100 100 200 (2) (2) (2)
Asian 2,800 49'900 7,700 ' 2,700 4,900 7,600 2,700 4,800 7,500 (2) (2) 100
Other 1,200. 1,800 1,600 ,1,000 1,700 1,500 . 1,100, 1,700 1,500 100 100 100
Life scientists 63,600 86,300 58,600 72,900 81,000 58,000 71,900 80,100 3,500 4,700 5,200
White 58,000
.78,300.70,200 77,000 53,600 65,300 72,200 53,100 64,500 71,500 3,100 4;300 4,600
Blatk 700 800 1,000 700 800 900 700 800 900 (2) - (2) 100
Asian 2,500 . 3,900 5,100 2,400 3,800 4,900 2,300 3,800 4,900 100 100 100 .
Other 2,500 3,400 3,200 2,000 3,000 2,900 2,000 2,9b0 2,800 300 400 300
-Psychologistsr
27,200 3.5,700 40,300 25,100 341,200 38,400 24,900 33,700 38,000 1,200 1,200,- 1,700White 25,2d0 32 -,900 37,200 23,500, 31,500 35,500 23,200 31,100 35,100 1,100 1,100' 1;500Black , 300 500 600 300 500 600 300 500 600 . (2) (2) ''` (2)
Asian 200 300 400 200 300 400- 200 300 400 - (2) (2) - (2)
Other 1,400 2,100 2,000 1,200 1,900 1,900 1,100 1,900 1,900 100 100 100
Social scientists 31,200 45,800 52,000 28,400 43,300 49400 28,100 42,1100 48,600 1;700 . 2,100' 2,600,White 28,400 41,300 46,400 25,900 39,000 .41,t00 25,700' 38;500 43,400 1,500 1,900 2,400Black 400 700 1,100 400 .,600 Y,000 400 600 1,000 (2) (2) (2)
Asian 1,000 1,400 2,100 900 1,400 2,100 .. 900 1,400 2,000 (2) (2) (2)
Other 1,400 2,500 2,400 1,200 2,300 2,200 1,100 2,300 2;200. , 200 100 100
1Detail will notadd to total population because "No report" is not included.10.
ZToo few cases to estimate.3Includes American Indians and "No report."Note: Detail may not add to totals because of rounding.Source: National Science Foundation, Characteristics of Doctoral Scientists and Engineers in the United States (biennial series, 1977-79) and
unpublished data.
58
.a
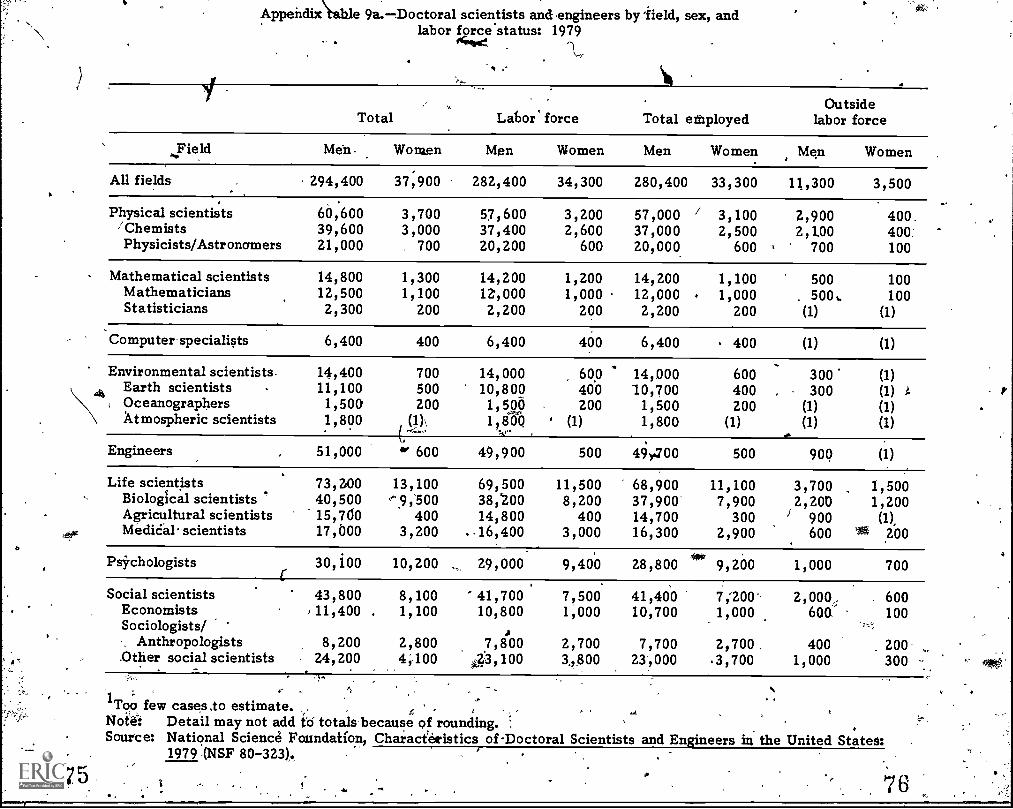
Appendix Kahle 9a.- Doctoral scientists and engineers by 'field, sex, andlabor force status: 1979
'494
Total
All fields 294,400.
Physical scientists 66,600'Chemists 39,600Physicists/Astronomers 21,000
Mathematical scientists 14,800Mathematicians 12,500Statisticians 2,300
Computer specialists 6,400
Environmental scientists. 14,400Earth scientists0, ceanographers
11,1001,50C,
Atmospheric scientists 1,800
Engineers
Life scientists 73,200Biological scientists ' 40,500Agricultural scientists 15,700MediCal scientists 17,600
Psychologists
Social scientists 43,800Economists ' 11,400 .Sociologists/
Anthropologists 8,200.Other social scientists 24,200
Field Men.
51,000
30,100
Women
37,900
3,7003,000
700
1,3001,100
200
400
700
200500
T" 600
13,100e".9;500
4003,200
10,200
8,1001,100
2,8004;100
282,400 34,300 280,400 33,300 11,300 3,500
57,600 3,200 57,000 / 3,100 2,900 400.37,400 2,600 37,000 2,500 2,1.00 40020,200 600 20,000 600 , 700 100
14,200 1,200 14,200 1,100 500 10012,000 1,000 12,000 1,000 . 500.. 1002,200 200 2,200 200 (1) (1)
6,400 400 6,400 400 (1) (1)
14,000 600 14,000 600 300 (1)10,8001,590
400 10,700 400 , 300 (1) i200
1,800200 (1) (1)
1800 ' (1) (1) (1) (1)
69,500 11,500 68,900 11,100 3,700 1,50038;200 8,200 37,900 7,900 2,200 1,20014,800 400 14,700 300 ) 900 (1),
.16,400 3,000 16,300 2,900 600 4* 200
, .
41,700 7,500 41,400 7;200' 2,000. 60010,800 1,000 10,700 1,000 6600' 100
7,8°00 2,700 7,700 2,700 . 400 2002.3 100 34.800 23,000 .3,700 1,000*. , 300 --
Labor' force Total eMployedOutside
labor force
Mon Women Men Women Men Women
49,900 500 49).700 500 900 (1)
29,000 9,400 28,800 14ir 9,200 1,000 700
1 .Too few cases .to estimate. . , ' t
Note: Detail may not add to totals because of rounding. .
Source: National Science Foundation, Characteristics of -Doctoral Scientists and Engineers in the United States:1979 IMF 80-323). .
r.

Appendix table 9b.-Doctoral scientists and engineers by, field,race, and labor force status: 1979
All fieldsWhite
'BlackAsianOtherl
Field and race Total . Labor fcirCe
Physical scientistsWhiteBlack .AsianOther
ChemistsWhiteBlackAsianOther
ft
....;-
332,300 316,700293,500 279,300
,....- 3,700 3,50021,700 21,30013,400 12,600'
64,300 60,90056,900' 53,600
600 5004,500 4,4002,400 2,300
42;700 40,00037,600 35,100
400 4003,200 3,1001,400 -,1,400
Physicists/Astronomers .21,700 20,800White 19,200 18,500Black 200 200Asian . 1,3Q0 1,300Other . ( 1,000 1,000
Mathematical scientists 16,100 15,400White 1:3,900 13,300Black 200 200Asian 1,000( 900Othen 1,000 900.,
MithematieiansWhite.BlackAsianOther
StatisticiansWhite
AsianOther
.047
13,600. 11,900
100700,900
2,4002,120(2)
20010QI L
,
13,00011,300. 100,
700909/
J
2,4002 00(2 ,
go
t00
Total Outsideemployed labor force
.313,700 14,800276,900 13,500
1 3,400 20021,000 40012,400 800
....
60,200 3,30053,100 3,100 .
500 . (2) .
4,300 1002,200 100
39,600 2,50034,800 3.4400e 400 (2)-3;100 1001, 00 t 100..
20,600 800. 18,300, ' 700 ..
100 " (2)1,300 (2)
,1,000 . 100.15,300 700'13,200 . 600
,200 (2) $. .
900 -) (2)900 (2)
.12,900 600
11,200 . 6004 100 (2)
700 (2)' ;900' ,(2)"
2,400 100'. ) 2;000 l' :100
- - (2) , e'. 200 ' '(2)
100' la.
If
6
7.
7'
1
$6,

(
Appendix table 9b.7-(con.)
r
. Field and race
Computer specialistsWhiteBlack "AsianOther
I-
Environmental scientists
g.WhiteBlack ..si
Asiane Other : .
*' Earth scien tists, _WhiteBlack '
-, Asian:. Other
' TotalTotal Labor force employed
!' 6,800 6,800 6,7,001;6,060 6,000 6,000
0 , (2) (2) (2) ,
. 500 500 .. 500, 300 300 300
15,100 14,760 t4;600.14,000 -, . 13,60-0 -- 13,600
100" 106 s ' . 100-400 500 500
e* 509. 500 500:
ig11,600 11,200 11,100
., 10,800' 10,400 '10,400 .
100 -.. 100 , no300 , 300 goo--400 4_ '400 -400
I
1,700 01;700 ti 1,7001°,600 1,606 , 1,600
-Oceanographers ../,y1' White . ,
Outsidelabor force
-(2)(2)
a(2)(2)
V400400
(2).
(2)
(2) 4
400400
(2)(2)(2)
.: v (2) q(2
Black , a) , . ; (2) J (2) )Asian 100 100 . k 100 (2)
-.4" Other (2) : (2) (2) (2) ti ..
*o' , i. _ ,C
...-
..4" - AtmosDheric scientists 1,806' ' 1 ,800 , 1,800 (Z1White _ 1,600 , '*1:,600 - 1,600 (2)-5.. . Black , ,.(2)° ',,: .,(2) (2) :- (Z) r'.Asian t
. . Other . ..,,,..
,. Engineersyilite
... Black .
'" 100 '. 100 . 100: no Q -. 100 100 .
.
.51,-$00 ..50,5.00 50,26042,100 , 41,200 ' " 1.41'000
- .- no . nog -'t ° 200
. - (2), (2) .
I.:. . 1,000
.:' 800 '
. (2)-.Asian 7,700 -. .7,600 ,; '7,500 100
a r1Other 1,600.* - 1,500*, "' 1,500 100'°
.; -
,..
.1
e ry
Life scientists. White
BlackAsian .
1,1 Other
86,300 11' $1;00b- )"°(,, 80,100 5;20 /77,000 12,200 . 71;500 '4,600.41,000 --, 4 - 940 ,- 900. e ifi'sod :. .- 4,90o . - 4,900 loo3,200. .2,900 - 2004 ' -Up-
r
;
.
9
4. , ...., ' a ,'..' 1.
- .e
.,-1 47
78 : ''.1`
°
.1
S
%
e
Si'e 4
t
44I.
1

a.
. Appendix table 9b.-- (con.)
-.Total Outside
Field and rate - Total Labor force employed labor foice
Biblogical.bcientists'WhiteBlackAsian .Other r
4Dt
50,000 46,400 45,700 3;50t44;400 41,2,00 40,600 3,200 ----4
600 '-C.- 600 600 (24- - ... .4.." '
3,100 ' C 3,000 3,000 ° roo1,9.00, (- : 1,700 1,600 E00
0
. _
--4 Agrict Rural-scieniiits ... 16,100.9 ; 15,200' 11,100 900
9 Vhite 14,700 13,900 13,800 800
' 4 , Black 200 1.00 ° 100 (2)
-Asian. 7.00 700 . 700 - (2)
, , v.-Other 500 400 '- 400 . 100.. r .v
Medical scientistsWhiteBlackAsian,0t'her
rr 20,200 19,400 19,300 80017,800- 17,100 17,100 700
300 Z,,00 200 (Z)
. 1,300 1;200 1,200 '.100800 8-00 800 (2)
0 -. * .
Psycioldgists 40,300 38,400 38,000 1,7001 'White 37,200 35,100 1,500
Black-
- 600-35,500
600 600 ' (2)
o 1 Asian..Other , ' 1,q00 . 1,9b0
.400 , .12).- 100C?,,=
'9400
r '.? , ,
, Social scientists 52;000 . 49;200 "- 4.8,600/ : ;2;600.White 46,400 - 43,800 43,400 .. .: 2,40b,Black.
....
1,100 . 1, 000 1,00s) -, (2)
Asian et 2,100 2,1p0 / ----z000 - (2) s
. , Other .- 2,400 1,200 ----- .2,p0 100
EconomistsWhiteBlackAsianOther '14, '4
. .
1Z,500 `.11,800 41. 11,700 , 7001,1,,710,0
200700500
10,500 10,400 . 600, -
200 200 (2) .700,s . '7,00 .. -(2). ' '-
400 ...41'..- o ' 400 (2)'0.
), . A .. ,A S9 60 r t g Anthropologists 11,100s - Ii ,
. -9,900200
t 0 Isla. 400Other 500
10,460 .,. 10,200 6009,400 .. 9,200 500
200 , ZOO (2)
' 300 -300 (2).500 400
o-(2)
-.
yr je,
6g.
4
79

Appen table 9b.(con.)I
9,
O
IP-
-1
Field and race Total ,Labor forceTotal
employedOutside
labor force
Other golwcial scientistsWhite .Back
. Asian 1.
Other. , _4.
28,40025,300
6001,1001,400
1,
,
' 27,000'24,000
6001,1001,400
26,70023,800
500'1,1001,300
,
.
1,3001,200 i
(2)
(2) ':,
(2) ,b
.4
'1inch:des American Indians and "No report".
'(2Too few cdses to estimate.Note: Detail may riot add to tot because of rounding.,*:
'SOurce: Nitional Science-Foun tion, Characteristics of Doctoral Scientists andEngineers in the Ifni bbd States: 1979 (NSF 80-3)23).
s
1 -
4
SO
IEC
;
63

Appendli table 10.-Doctoral scientists and engineers by field, sex/ and employment status:1973,1977, and 1979
. Total employed
Employed in S/E , ninEmployed n on-S/E , Postdoctorates Unemployed, seeking
Field and sex 1973 1977 1979 1973 v1977 1979 1973 . 1977 .1974- 1973 1977 1979
AU fields 100,600 251,600 271,200 14,10r 22;900 26,400 5,700 ,800 10,200 -2,5004,..,3000 2,900'Men 185,900 228,709 249,400 12,760 20,400 _23,000 - 4,800 7,700 8,000 1,80q, 2,300 2,000Women 14,700 22,900 27,700 1 ,i0b 1600 3,400 900 2'000 2,200 700 1,000 900
Physical scientists . 42,400 48,800 52,200 4,200 6,000 5,800 1,90b 2,600 2,200 9,00 800 700
Men 40,900 46,600 49,700 4,000 5,700 5,400 1,700 2,300 1,960 700 600 600
Women 1,500 2,200 2,500- 300 400 400 100 300 300 100 200 - 100.
`Mathematical scientists HA() 13,500 13,900 400 1,000 1;200 100 100 200 200 200 100
- Men 10,900 12,500 12,900 400 900 1,100 100 100 200 100 200 1)Women 700- 1,000 1,000 (1) 100 .400 (1) (1) (1) ay (1) (1)
Computer specialists 2,700 5,600 6,600 (1) 100 100. (1) (1) (1) (1) (1) (1)
Men 2;600 5,400 6,200 (1) 100 100 (1) (1) (1) (1) (1) (lrWomen 100 200 400 (1) -(1) ,(1) (1) (1) (1) (1), (1) ,(1)
- Environmental scientists 9,7900 12,200 13,800 300 500 500 200 400 300 100 100 (1)
Men I 9,600 11,800 13,200 300 . 400 500 200 300 00 100 100 (1)
Women ZOO 400 V* 600 - (1) (11 (1) (I) (1) (1) (1) (1)
Engineers 33,900 42,100 46,900 1,600 2,600 3,100 200 400 300 300 300 300,Men 33,800 41,800 46,400 1,600 2,600 3,000 200 400 200 ' 300 300 300
Women 100 -300. 500 (1) \ (1) (1) (1) (1) (1) (1) (1) (1) .
Life scientists 52,800 62,900 69,900 2,400 3,800 4,000 2,800 5,200 6,00 '600 ; 1'000 900
Men 47,700 55,800 60,900 2,000 3,200 3,300 2,200 3,900 4,700 300 ! 700' 500
Women 5;100 7,100 9,000 400 500 700 600 1,300, 1,500 300 300 400
Psychologists 23,100 30,800 .34,500 500 2,400 2,900 300 .600 600 300 400 400
Men 18,700 24,000 -26,300 1 0 1,800 2,100 200 400 400 . '100. - 200 300
Jiomen A 4,400 * 6,900 8,200 30 600 800 100 200 200 .100 200 200
Social scientists 24,200 35,600 39,400 3,700 6,700 '8,800 200 500 500 300 '60b 500
Men 21,700 30,700 33,700 3,300 5,700 7,300 200 400 300 goo 400 300'L., Women 2,400 4,900 5,600 400 f-,000' 1,500 (1) 400 100 100 200 200
I Too few cases to estimate. 11- ,
Note: Detail may not add to totals because of rounding. .....,.
Source: National Science Foundation, Characteristics of Doctoral Scientists.and Engineers in the United ttateObiennial series,1977-79) and unpUblished. data.
, ,
,
-a
t
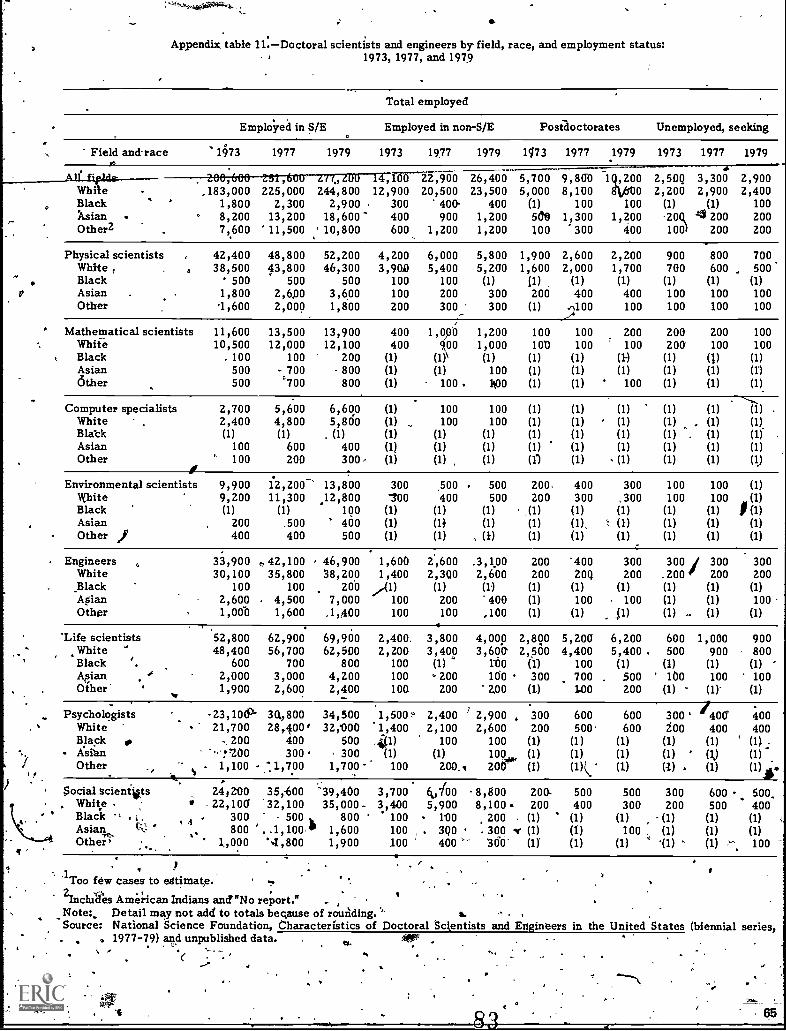
Appendix table 11.-Doctoral scientists and engineers by field, race, and employment status:1973,1977, and 1979
Field and-race
Whi eBlackAsian .OtherZ
'
Physical scientistsWhite ,BlackAsianOther
o Mathematical scientistsWhiteBlackAsianOther
Computer specialistsWhite ,
BlaticAsianOther
Environmental scientistsWhiteBlackAsianOther if
EngineersWhite,Black/1.0anOther
'Life scientistsWhiteBlack '.
Other'
Psycholog- istsWhiteBlackAsianOther
' Social scientilts. White .
' Black , .. , s 4Asian,* k"':: . .Others
Total employed
Employed in S/E Employed in non-S/E Post-doctorates Unemployed, seeking
1473 1977 1979 1973 1477 1979 1473 1977 1979 1973 1977 1979sis
9,800 101,200 2,50Q 3,300 2,900,16i)--22,900 26,400 5,700,183,000 225,000 244,800 12,900 20,500 23,500 5,000 8,100 4600 2,200 2,900 2,400
1,800 2,300 2,900 300 400> 400 (1) 100 100 (1) (1) 1008,200 13,200 18,600 400 900 1,200 5(1"8 1,300 1,200 -20Q 45 200 2007,600 '11,500 10,800 600 1,200 1,200 100 300 400 100 200 200
42,400 48,800 52,200 4,200 6,000 5,800 1,900 2,600 2,200 900 800 70038,500 43,800 46,300 3,900 5,400 5,200 1,600 2,000 1,700 700 600 500
' 500 500 500 100 100 (1) 11) (1) (1) (1) (1) (1)1,800 2,600 3,600 100 200 300 200 400 400 100 100 1001,600 2,000 1,800 200 300 300 (1) 3100 100 100 100 100
11,600 13,500 13,900 400 1 , 0 b 1,200 100 100 200 200 200 10010,500 12,000 12,100 400 00 1,000 100 100 100 206 100 100
. 100 100 200 (1) (1) (1) (1) (1) (I) (1) (1) (1)500 - 700 800 (1) (1) 100 (1) (1) (1) (1) (1) (1)500 °700 800 (1) 100 . 100 (1) (1) 100 (1) (1) (1)
2,700 5,600 6,600 (1) 100 100 (1) (1) (1) (1) (1) (i) .
2,400 4,800 5,800 (1) 100 100 (1) (1) (1) (1) (1) (1).(1) (1) . (1) (1) (1) (1) (1) (1) (1) (1) . (1) (1)
100 600 400 (1) (1) (1) (1) (1) (1) (1) (1) (1)' 100 200 300 (1) (1) (1) (II (1) (1) (1) (1) (1.)
9,900 12,200- 13,800 300 500 500 200. 400 300 100 100 (1)9,200 11,300 100 400 500 200 300 ,300 100 100 (I).12,800(1) (1) 100 (1) (1) (1) (1) (1) (1) (1) (1) 7 (1)
200 .500 400 (1) (11 (1) (1) (1), ": (1) (1) (1) (1)400 400 500 (1) (1) -. (I) (1) (1) (1) (1) (1) (1)
33,900 42,100 46,900 1,600 2.9600 .3,1.00 200 '400 300 300 300 30030,100 35,800 38,20.0 1,400 2,300 2,600 200 20Q 200 .200 200 200
100 100 200 "(1) (1) (1) (1) (1) (1) (1) (1) (1)2,600 4,500 7,000 100 200 400 (1) 100 100 (1) (1) 1001,00b 1,600 .1,400 100 100 100 (1) (1) 41) (1) - (1) (1)
52,800 62,900 69,960 2,400, 3,800 4,000 2,800 5,200 6,200 600 1,000 90048,400 56,700 62,500 2,200 3,400 3,606 2,500 4,400 5,400 < 500 900 800
600 700 800 100 (1) MO (1) 100 (1) (I) (1) (1)2,000 3,000 4,200 100 200 100 300 700 Soo tho loo 1001,900 2,600 2,400 100 200 2,00 (1) 140 zoo (1) (1)- (1)
-23,106' 30,800 34,500 1,500° 2,400 ' 2,900 , 300 600 600 300' 406 40021,700 28,400' 32,000 1,400 2,100 2,600 200 500' 600 200 400 400
200 400 5007700 300 300
, 441) 100 100 (1)(1) (1) 100 (1)
(1)(1)
(1) (1) (1)(1) (1) ' (1)
(1)(1)
1,100 4- -.1,700 1,700' 100 zoo.. zor (1) (1)L (1) RI (1) (1),V
24,200 35,-600 '39,400 3,700 6,100 8,800 200- 500 500 300 600 500- 22,100 32,100 35,000- 3,400 5,900 8,100 200 400 300 200 500 400
300 500 k 800 100 100 200 (1) ' (1) (1) (1) (1) (1)800 ..1,100, 1,600
1,000 '.1,800 1,900100 3Q0 . 300 "r (I)100 400 60' (l
(1)(1)
loo , (1) (1)(1) -(1) - (1) .s.^.
(1)100
Too few cases to estimate.
ZInchges Americaz: Indians and'"No report." -- Note:. Detail may not add to totals because of rounding. "
Source: National Science Foundation, Characteristics of Doctoral 'Scientists and Engineers in the United States (biennial series,. s 1977-79) and unpublished data.
. . cr. IkT( -
.
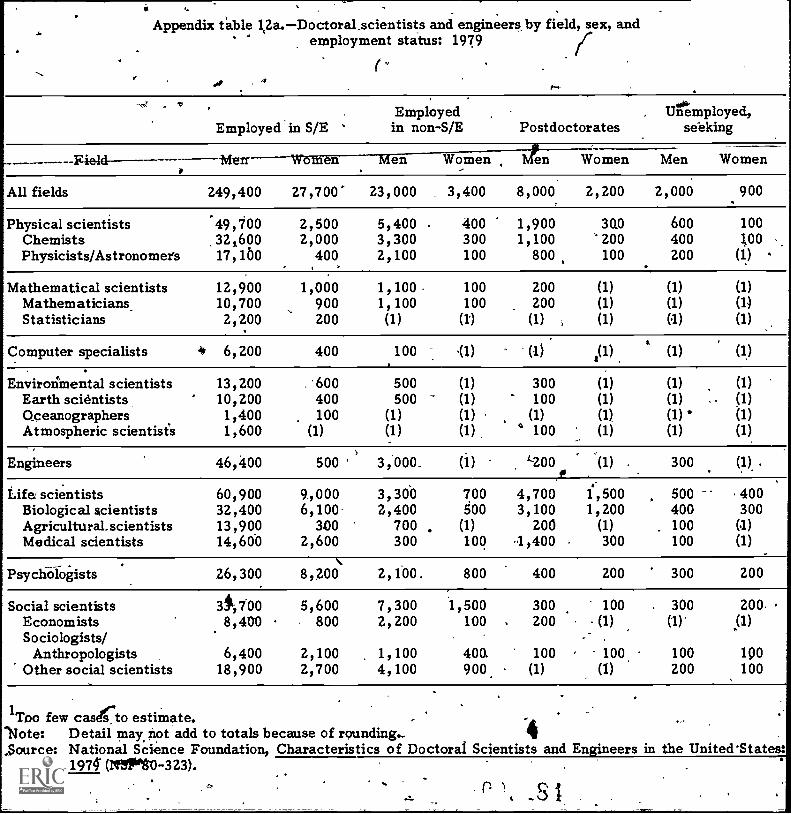
Appendix table 12a.-Doctoral_ scientists and engineers by field, sex, andemployment status: 1979
Employed-in S/EEmployedin non-S/E Postdoctorates
Unemployed,seeking
Womenv en Women Men Women Men----Field
All fields 249,400 27,700' 23,000 3,400 8,000. 2,200 2,000 900
Physical scientists 49,700 2,500 5,400 400 1,900 3Q0 600 100Chemists 32,600 2,000 3,300 300 1,100 200 400 ;00 ..Physicists/Astronomers 17,160 400 2,100 100 800 100 200 (1)
Mathematical scientists 12,900 1,000 1,100 100 200 (1) (1) (1)Mathematicians_ 10,700 900 1,100 100 200 (1) (1) (1)Statisticians 2,200 200 (1) () (1) (1) () (1)
Computer specialists 4 6,200 400 100 '(1) (1) l(1) (1) (1)
Envirotimental scientists 13,200 600 500 (1) 300 (1) (1) (1)Earth scientists 10,200 400 500 (1) 100 (1) (1) . (1)Oceanographers 1,400 100 (1) (1) (1) (1) (1) (1)Atmospheric scientist's 1,600 (1) (1) (1) 4 100 (1) (1) (1)
Engineers 46,400 500 ' 3,000. (1) '200to
(1) . 300 (1) .
Life scientists 60,900 9,000 3,300 700 4,700 i,500 500 400Biological scientists 32,400 6,100 2,400 500 3,100 1,200 400 300Agricultural scientists 13,900 300 700 (1) 200 (1) 100 1)Medical scientists 14,600 2,600 300 100 1,400 300 100 (1)
Psychologists 26,300 8,200 2,100. 800 400 200 300 200
Social scientists 3$,700 5,600 7,300 1,500 300 100 300 200Economists 8,400 800 2,200 100 - 200 (1) (1) (1)Sociologists/
Anthropologists 6,400 2,100 1,100 400. 100 100 100 100Other social scientists 18,900 2,700 4,100 900. (1) (1) 200 100
1Too few case,to estimate.`'Note: Detail may not add to totals because of rounding.- 4*Source: National Science Foundation, Characteristics of Doctoral Scientists and Engineers in the United 'States:
P )t---- 1974' (IfS1010-323).

Appendix table 12b.-Doctoral scientists and engineers by field,race, and employment status: 1979
A
Field and race,
All fieldsWhiteBlackAsian 4
Otherl
Physical scientists 2WhiteBlackAsianOther
ChemistsWhiteBlackAsianOther
Employedin S7
Employed innon-S/E
Post-doctorates
Unemployed,- ---seeking
277,200244,800
£ 2,900r8,60010,800
26,400. 23,500
4001,200-1,200
.
1.0,200.Y 2,9008,600 2,400
1007'. / 10.0'1,200 200
400 , 200
52,200 5,800 2,20 , 700_ 46,300 5,200 1,700 500
500 (2) (2) (2)3,600 300 400 1001,800 300 100 100
34,600 3,600- 1,400 50030,600. 3,200 1,000 300
Physicists /AstronomersWhiteSlackAsian \Other ,
300' 2.,600
(2)(2)
(2) x
, 300 N
(2)100
1,000 200 100 , (2).
17,600 2,200 900 20015,6P0 1,900 700 200
100 ° (2) (2) (2)1,000 100 100 (2)
800 100 -(2) (2)
Mathematical scientistsWhiteBlackAsian .1
Other
MathematiciansWhiteBlack,.AsianOther
13;900- 12,100
200800
_ 800
1,2001,000(2)
100` 1000.. 200
100(2)-(2)
100100
(2)(2)(2)
' i
11,6,0010,100
100600700
..
%,
1,2001,000(2)
100100 ...
200100
(2)(2)
100.
100100
4(2)(2)
, (2)
, 2,300 .
2,000(2)
2d0100
'^
4) '*'
(2)(2).(2)(2)
(.2T(2)(2)(2)(2)
, (2)-(2)(2)(2)
.'
Statisticians .iWhit,.
BlackAsian .4
. . Other
S
4

AppeAdix table 12b.(con.)
Field and raceEmployed Employed in Post- Unemployed,
in S/E non-S/E doctorates seeking- .. ,
Computer specialists 6,600 ..
White -5,800Black (2)Asian 400
*Other 300
100 (2)100 (2)
(2) (2)(2)
. (2)(2)6 (2)
Environmental scientists .13,800 . 500 300 (2)White
..12,800 ../500 300
Clack -100Asian . 400 .Other,
J,, 500
10,500Earth scientists-White 9,800
Black c, 100Asian , 300Other 300
OceanographersWhiteBlackAsianOther.
1,6001,500-(2)
100(2)
Atmospheric scientists 1,700White 1,500Black (2)Asian . 100Other 4 100
(2)(2)
; (2)'(2)-(2)
(2)(2)(2)
500 .400
(2)' .(2)(2)(2)
(2)(2)(Z)(2)
, (2) ,
u.
12) -(2)(2)
100100
,
(2)(2)
100100
(2)(2)(2)
(2)(2)(2)(2)
4
I
\
(2)
(2). (2)
..\(2)(2)
(2). (2)
(2)(2)
. (2)
. (2)(2)(2)(2)(2)
Engineers . 46,900 3,100 .300 ;300, White 38,200 2,600 . 200 200
Black 200 (2) (2)- '(2),Asian 7,000 4p0 100 100Othef , 1,400 " 100 . (2) '(2)
Life scientistsWhiteBlackAsianOther
69,90t162;5007 800
2,400
A
.
4,000% 6,200.3,600 5,400
100 (2) .
100 500 -200 200
900800
100. (2)

'Appendix table 12b.(con.)
-Employed
in Se/E
Employed in ,.nOn-S/E
Post- Unemployed;Field and race doctorates s-e-elcint
Biological scientistsWhiteBlackAsianOther
38,60034,200
5002,5001,400
2,9002,600(2) t
100200
,4,3003,800(2)
400100
700, 600
(2)'100(2)
Agricultural scientistsWhiteBlackAsian
r Other.
4 14,10013,000
100600400
. 700700
()2)
(2)
200100
(2)100
(?,)
, 100100
2)
(2) .
(2)
-
MedicalrScientists. 17,200 " 30d 1,700 100White 15,300 300 1,50Q 00Black 200 (2) (2) (2)
Asian 1,100 (2) 100 (2)
Other, 600 (2) 100 (2)
Psychologists 34,500 2,900 600, 400White .321000 2,600 600 .400Black 500 100 (2) (2)
Asian 300 100' (2) A (2)
Other 1,700 200 (2) (2) 1
41.Social scientists 39,400. 8,800 500 500.
,ti 9
. White*Black. 1
" 35;000806,
8,100200
' 400(2)
.4, 400(2)
Asian 1,600 300 100 (2)
Other -1,900 306 It . (2) 100
Economists 9,300 2,300' 200 (2) .
Whit eBlack .
8', 200 4
no!.2,2oo-
100 N
100(2)
(2)(2) ,
Q
Asian. 600: (2) 100 (2)
Other' h 400V (t) (2) (2)
Sociologists /Anthropologists 8,500 4 1,500. ZOO 200
v. White.445
Z,40015 .1,400 200 260'6 Black WO pi, (2). (2) (2) ,
.Asian .360 (2) (2)Other ;, '400 100P. (2) (2)
.
A
0
0
4r
w.
4
a
Ts...
sis

Appendix table 12b..(con.)
-raceEmployed Employed in
doctoratesUnemployed,
seeking-Field and in SfE -non-7S/E
Other social scientists 21,600 5,000 . o 100 3Q0White 19;200 4,500 100 200Black 400 - 100 .(2) (2)
-'Asian 800 300 (2) . .(2)Other 1,100 200 (2) (2)
1 Includes American Indians and "No report."tt;2Too few cases to estimgte.
Note: Detail may not add to totals becaus pf. rounding.Source: National Science Foundation, Characteristics of Doctoral Scientists' and
. Engineers in the United States: 1979 (NSF 80-323)a
"a411/1.r.
lt
111
4-
I
4
IP .
1
. 8 3
I.
1
I

,
Appendix table 13.-Doctoral women scientists and engineers by field, race, and labor force status:1973,-1977, and 1979
Total . LabOr force ''Total employed Outside labor force 1
Field and race 1973 1977 1979 1973 1977 1979 1973 1977 1979 1973 1977 1979
AU fieldsWhiteBlackAsiandtherZ
20,870 31,670 37,91018,830 28,120 33,320
300 560 850810 1,510 2,250930 1,480 1,490
17,620 28,480° 34,270 16,960 27,500 33,34015,940 25,220 30,030 15,380 24,390 29,230
260 530 800 260- 520 790720 1,410 2,110 640 1,310 t 2,030700 1,320 1,330 680 1,280 1,310
2,42021160
2070
160
2,930 3,4902,700 3,170
10 5090 120
130 150
Physical scientistsWhite
' Black`AsianOther
2,540 3,5302,210 2,990
30 40'200 380110 130
3,6902,990
50550110
2,040 ; 43', 0701,760 2,570
20 40180 34070 120
3,2402,580
50520
90
1,9001,660
2015060
2,910 3,1202,460 2,510
40 50300 480110 90
410 440 430380 390 380
(3) (3) (3)10 30 4030 10 20
Mathematical scientistsWhiteBlack
. AsianOther
950850206030
1,210 .1,3001,060 1,110
20 1070 11060 60
806710205020
1,080940
207060
1,160990
10:110060
780700
204020
1,050 ,140910 970
20 1060 10060 60
140130
(3)1010
120 130MO 110
(3) (3)10 10
(3) 10
Computer specialistsWhiteBlackAsianOther
. 90 24080 200
(3) (3
(3) 20(3) 20
370290.10.6020
90 230$0 190
43) (3)(3) 20(3) 20
370290
106020
9080
(3).,(3)(3)
230 370190. . 290
(3) 1020 6020, 20
(3)(3)(3)(3)
43)
10'10
(3)(3)(3) ,
Environmental scientists
BlackAdtanOther
.300 . 490 660 2704 - 460 620 260 440 610280 450 610 25(2. 420 570 250 400, 560
(3) - (3) 1 . (3) 13) (3) (3) . (3)?' (3) (3)10 20 ' 40 10 2Q - 40 ,10 20 4010 20 ; 10 10 10 10 10 10 10
30 4030 30 40
(3) (3) (3)(3 ,(3) (3)(3) (3). (3)
EngineersWhiteBlackAsianOther
170130
(3)3010
320260
(3)4020
560430
1010020
150 290110 230
(3) (3)30 \100 \10
540 140 280. -530420 100 230 410
10 (3) (3) s 10
100 20 40 10020 10- , IQ 20
10 2010' 20
(3) (3)(3) (3)(3) (3)
2010
(3)(3)(3)
Life scientistsWhiteBl.;ckAsianOther
7,750'7,000
100410250
10,7609,460
170740400
13,07011,360
3001-9010
410
6,380 9,310 11,4905,780 8,160 9,940
90 160 Z70350 680 930160 , 320. 350
6,1205,560
90320160
8,9807,880
150650310
11,1'409,650
260900330
1,040 -,1,370 1,520920 1,230 1,370
(3) 10- 2040 40 6070 O. .70 .
sychologistsWhiteBlackAsian -
Other
.k10 8,480 .10,150.,1,10 7,690 9,26.
110 190 250,'60 100 160330 no: 480
4,920-4, 5.10
8050
270
"4,8407,080
190,100470
90908,550
230. 1'50
450
4,7804,380
8050
270
2,650 9,2206,910r.w.8,380
180 230100 , 150460 450
Social scientistsWhite _
BlackAsianOther
3,470Is 3,170
5050
Zbo
6,6506,030
140130340
8,110 2,990 6,1907,240 - 2,750 5,620
240 - 40 130.,220 50 130
370 1601? , 320'
7,470 2,900 5,960 7,2206,700 e 2,660 53.10 6,470
220 40' 130 220220 40 120 210330 '160 300 . 330
460 550420 530
10' (3)
(3) 13)30. 204
730680
10 .11
(3)20
310 400280 390
' 10 (3)(3) (3)'
20 10
610560
,(3),(3)
40
..-1.
1Detail may, not add total population because "No re ort" isnot included. ,
ilIncludes .ican Indians and ItNci repot." .3
4 .o few cases t estimate.
N te: -Detail m y not add to to.tals,because of rounding. 414'Source: Nafional cience Foundation; Characteristics of Doctoral Scientists and Engineers in the ly:dted States (biennial Aeries;
1977-7 d unpublished data.O'
89C 71

* Appendix table 14.-Doctoral women scientist's and engineers by field, race, andemployment status: 1973,1977, and 1979
9.
Y .
:Total employed
0
1' ,Employed in S/E Employed in non -S /E Postdoctorates Unemployed eking
Field and race 1973
All fields. White
Black, AsianOther2 it
14,611013,330
220530620
Physical scientists 1,500White . 1,310Black .., 20Asian 120Other ° 50
Makhematical scientists 730White . 650Black 20Asian Is 40Other 20
Computer specialists 90White 80Black (1)Asian . t..(1)Other (1)
Environmental scientists 240White 130Black . (1)Asian . 10Other 10
Engineers 130White 100Black (1)Asian 20Other 10
Life scientists 5,140. White 4,690
Black 80Asian 249Other 130..
:. 72
Psychologists 4;420'White 4,050Black 70Asian ; 50Other : 230
Social scientistsWhiteBlackAsianOther
2,4502,230'
4040
, 150
1 Too few, e cases to estimate.
1977 1979; 1973 1977 1979 1974. 1977 1979 1973 1977 1979
22,930 27,720 1;4,00 2,560 3,4iO 88'0 2,020 2,210 .670- 980 93020,460 24,370 1,300 2,290 3,010 750 1,640 1,850 560 830 810
420 640 30 70 120 10 30 30 (1) 10 , 20. 940 11,620 30 70 130 . 80 300 270 80 100 901,110 1,090 40 130 . 160 ,30 40 50 20 40 20
2,230 2,490 256) 360 350 140 320 280 140 170 ; 11,0
.:1,c/10 2,030 240 . 300 280 110 240 200 100 120 8030 30 (1) 10 '10 (1) (1) (1) (1) (1) (1)
220 360 10 20 40 20 70 80 N 30. 40 4080 80 10 30,r 20 10 (1) (1) '
,10 ' 10 (1)
970 1,050 50 70 80 (1) 10 10 20 30 3080 po - 50 70 80 (1) 10 10 20 30 20
' 20 10 1) ,_ (1) (1) (1) (1) (1) (1) (1) (1)60 100 (1) -N(1) (1) (1) (1) ' (1) (1) '10 (1)50 50 (1) 10 (1) (1)' (1) (1) (1) (1) (1)
230 350 (1) (1) (1) (1) (1) 10 (1) 4,(1) (1)190 .280 (1) (1) (1) (1) i (1) 10 (1) (1) (1)
(1) - 10 (1) (1) (1) (1) (1) (1) (1) (1) (1)
20 60 fl) (1) (1) (1) (1) '(1) (1) (1) (1)
20 zo (1). (1) (1) (1) (1) (1) (1) (1) (1)
400370
560 '' 10.520 / 10
10.10
.1010
1010
'3020
4030
(1)(11
206. 1020 10
(1) (1) (1) (1) (1) (1) (1) (1) (1) (1) (1)20 20 (1) (1) (1) (1) 10 10 (1) (1) (1),10 10 (1) (1) (1) (1) (1) (1) (1) (1). (1)
260 480 , 10 (1) 30 (1) 20 20 10 10 10220 370 10 (1) 30 (1) b 10 10 10 10 10
(1) 10 (1) , (1) (1) (1) (1) (1) (1) 4 (1) (1)30 80 (1) (1) (1) (1) . 10 10 (1) (1) (1)10 20 (1) (1) (1) (1) (1) . (1) (1) (1) (1)
7,110 9,000 380 540 660 600 1,330 1,480 260 330 3506,3.30 7,780 350 480 610 530 1,060 1,270 220 280 300
120 23g (1) 10, 20 10 20 20 (1) 10 10400 ill) 20 30 20 60 220 170 t 40 30 30270 4'290 , 20 20 10 . 10 / 30 30 (1) 10 20
6,850 8;160 280 620 830 90 180 230 130 200 17b6,180 7,4470 250 570 690 80 160 220 130 170 170
150 180 20 20 40 (1) 10 10 (1) 10 (1)90 110 (1) (1) 40 (1) 10 (1) Clr 10 (1)
430 390 10 30 60 10, (1) - 10 10 10 41), .
4,870 5,630 420 950 1,460 , '30 140 140 100 230 . 2504,420 5,040 %, 400 850 1,310 30 140 120 c90 210 '230
100 170 (1) 30 50 (1) (1) (1)' (1 ( (1) 101.00 180 (1) 20 30 (1) (1) (1) 10 10 10240 240 10 60 70 (1) (1) 10 (1) 20 10
..
--- -..t .
21nchides American Indians and "No report." .,Note: Detail may not add to totals because of rounding. .
Source: Natio ce Foundation, Characteristics of Doctoral' Scientists and Engineers in the United States (biennialseries, - 9) ar}d unalblished data.
t
)
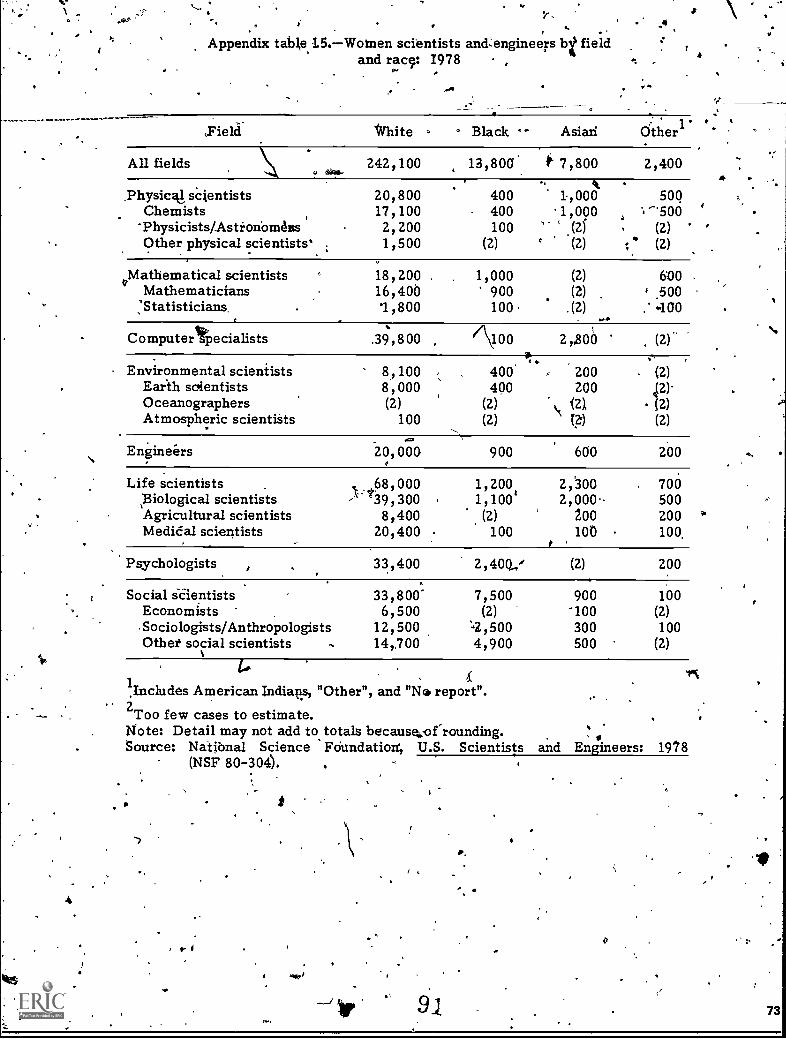
.Appendix table 1.5.Women scientists and:engineers bi field
and rac9: 1978
.40
a
;
Yield White - Black Asian Otheri
All fields 242,100 13,800' I" 7,800 2,400
.Physic4 scientistsChemists
'Physicists/Astionom4itsOther physical scientists`
20,80017,1002,2001,500
400400100
(2)
,0001,000
(2)(2) 1*
500'500
(2)(2)
oMathematical scientistsMathematicians'Statisticians
18,200.16,4001,800
1,000900100
(2)
(2).(2) .
600,500400
Computertpecialists .39,800 7\100 2,300 (2)
Environmental scientistsEarth scientistsOceanographersAtmospheric scientists
8,100 ,,,
8,000(2)
100
, 400400
(2)
,..(2)
200200
(2),
()
(2)(2)(2)(2)
Engineers 20,000 900 600
Life scientists .,68,000 1,200 2,300 700Biological scientists '39,300 1,100' 2,000.- 500Agricultural scientists 8,400 (2) 200 200 'Medit'al scientists 20,400 100 100 100
Psychologists
p
33,400 2,40Q,/ (2) 200
Social scientists 33,800' 7,500 900 100Economists 6,500 (2) 100 (2).Sociologists/Anthropologists 12,500 .4,500 300 100Othei social scientists ., 14,700 4,900 500 (2)
1Includes American Indians, "Other", and "NG report".2 Too few cases to estimate.Note: Detail may not add to totals becaus4of-rounding.source: National Science Foundation, U.S. Scientists and Engineers: 1978
(NSF 80-304).
7.
a.
0
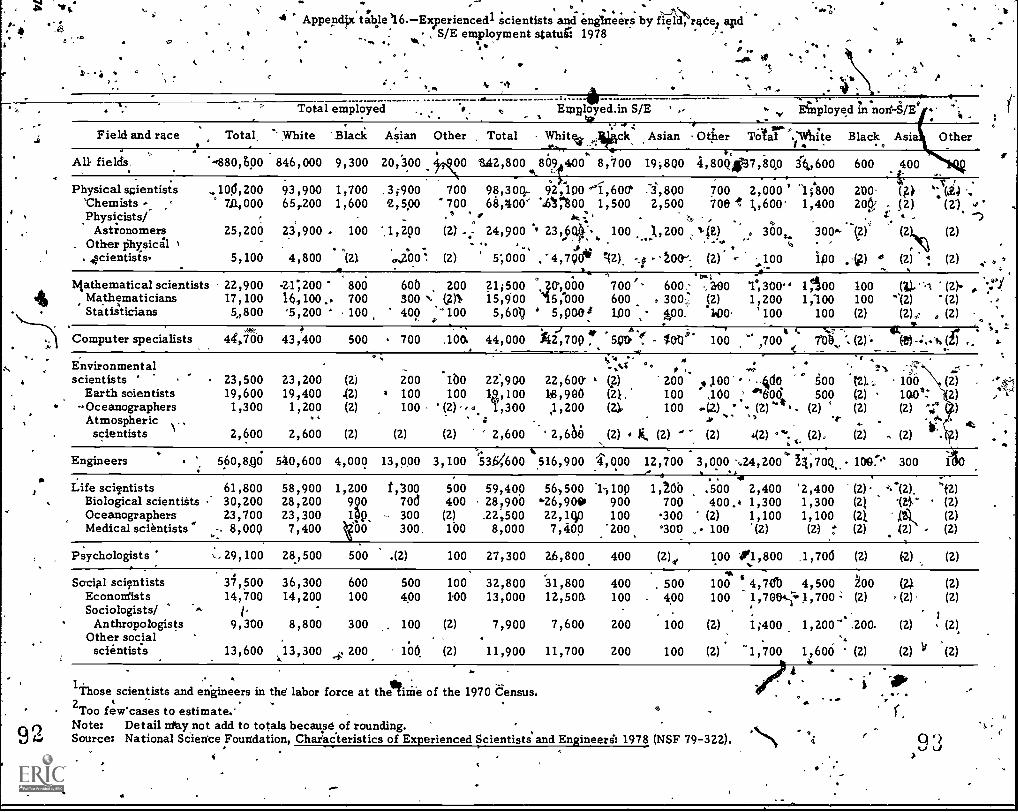
46
4.
i . . . _,\Nk .4 Appepdpctable16.-Exiperiencedi scientists and engineers by field, race aid. ?a111
... , S/E employment statue 1978-... .. v., -
.. a* ft ,.4seg'
."67,'
o ,
. %%
''-3--- 46 n 4.. Total employed . ., Employed.in S/E .. ...... Employed in non-S/E
. .' . t . :to _-' .7
.Z.Field and race
.Total ' White 'Black Aiian Other Total Whitet ,likck Asian Other TOtat .1,Vlte Black Asia Other1
0 1, 00 . .1-.., t. '
t-,880 SOO 846000 9300 20300 400 SiI2800 0.91400 8,-700 19;800 4,800437,8OP '60600 600 400
-
.All fields
. . . '. 't- 'C ,Physical scientists 100,200 93,900 1,700 , 3 ;900 700 98,30q- 92,100 --.1 ,600` -4,800 700 2,000' ;800 210- (2). -.(,t.) -,'Chemists ,. 7,6,000 65,200 1,600 '2,500 "700 68,1100' '407800 1,500 2,500 roe 1 1,, 600' 1,400 20! . (2) (21 4Physicists/ ..
.s i. Art ...
., ' .1 . , -,. . .:25,200 23,900. 100 '.1,290 (2) .; 24,900 ' 23,..604".,. 100 1,200 aqE) 3(50,,, 306 (2) (2), (2)
. ... ..
Astronomers. Other Physicil 1 , . - ., . 45
4
r NIScientists 5,100 4,800 (2) ,200 '. (2) 5;000 , '4,404 12) -...a 't00' (2) 100 ipo ..v) . (2) 1 (2)
= , --, _ ... ,. 11,.;
Mathematical scientists 22,900 2.1;200 800 60b 200 21;500 _pa,obo 700'' 600: -, HO 1°,300 1:100 100 (4)..-1 (2) '.,:V.4 Mathematicians 17,100 16,100 .. 700 300 (..2)1, 15,900 15,"000 600 . 300,; (2) 1,200 1,100 100 "'(2) (2) .,Statisticians 5,,800 '5,200 100409 ;100 5,60 ' 5,00e, 100 400, 10 '100 100 (2) (2).c a (2) .
. Computer specialists 44,460 43,400 500 700 .100. 44,000 f42.1,700 4! 50'1:),*. - In' 100 700 70b ',. (2)- (.10-4(f) ._ ,..
s 4P
7
, e ,-,,6 ''' 0
`Environmental_ .,,ct °. ,.. .. : ...:.
scientists ' 23,500 23,200 (2) 200 1b0 22`,900 22,600' (g) 200 ..,100. . 44.60 500 (2).,.. 106 (2) .04-5..\-_,Earth scientists 19,600 19,400 42) 100 100 1,A,100 1)8,990 (2) , 100 ,100 ''''60Ci, 500 (2) 10e." 2) .
. ' Oceanographers 1,300 1,200 (2) 100 (2) ,d. i,300 ,1,200 (2,1,,
100 ,-(2) (2)".4. (2)'a-
(2) (2) ":: ),. ,,Atmospheric .. .v ... -scientists 2,600 2,600 (2) (2) (2) 2,600 2,660 (2) A (2) ' (2) 4(2) ''''. (2). (2) - (2) 11°' .
Engineers 560,896 540,600 4,000 13,000 3,100 536400 %516,900 .4000 12,700 3,000 -524,2004' /4,70Q.. 100." 300. - ' "4 .. N
Life scientists 61,800 58,900 1,200 t,300 500 59,400 56,500 1-, 10() 1 , /00 .500 2,400 '2,400 (2) ''.12). ''f2)Biological scientists ' 30,200 28,200 990 70d 400 , 28,900 26,901110 900 700 400.4 1,300 1,300 (2) *(2')" (2)Oceanographers 23,700 23,300 1ps - 300 (2) 22,500 22,140 100 -300 (2) 1,100 1,100 (2). ,(2k (2)Medical scientists` -. 8,000 7,400 V00 300, 100 8,000 7,400 '200 '300 , 100 '(2),.. (2) :* (2) (2) - (2)
Psychologists 29,100 28,500 500 .(2) 100 27,300 21,800 400 (2) , 100 01,800 .1,700 (2) (2) (2). .
Social scientists 37,500 36,300 600 500 100 32,800 31,800 400 . 500 100 4,70 4,500 '200 (7) (2)Economists 14,700 14,200 100 400 HO 13,000 12,50a 100 400 100 1,7004-1;1,700 (2) , (2) (2)Sociologists/ 1
1
Anthropologists 9,300 8,800 300 , 100 (2) 7,900 7,600 200 100 (2) 1;400 1,200' .200. (2) (2)Other social '4scientists '13,600 13,300
.-0200 ' lbb (2) 11,900 11,700 200 100 (2) "1,700 1,600 (2) (2) V (2)
...
1Those scientists and engineers in the labor force at thetrife of the 1970 Census.2Too few'cases to estimate.Note: Detail akty not add to totals because of rounding.Source: National Science Foundation, Charadteristics of Experienced Scientists and Engineeri: 1978 (NSF 79-322).
4
-
4
.
4'
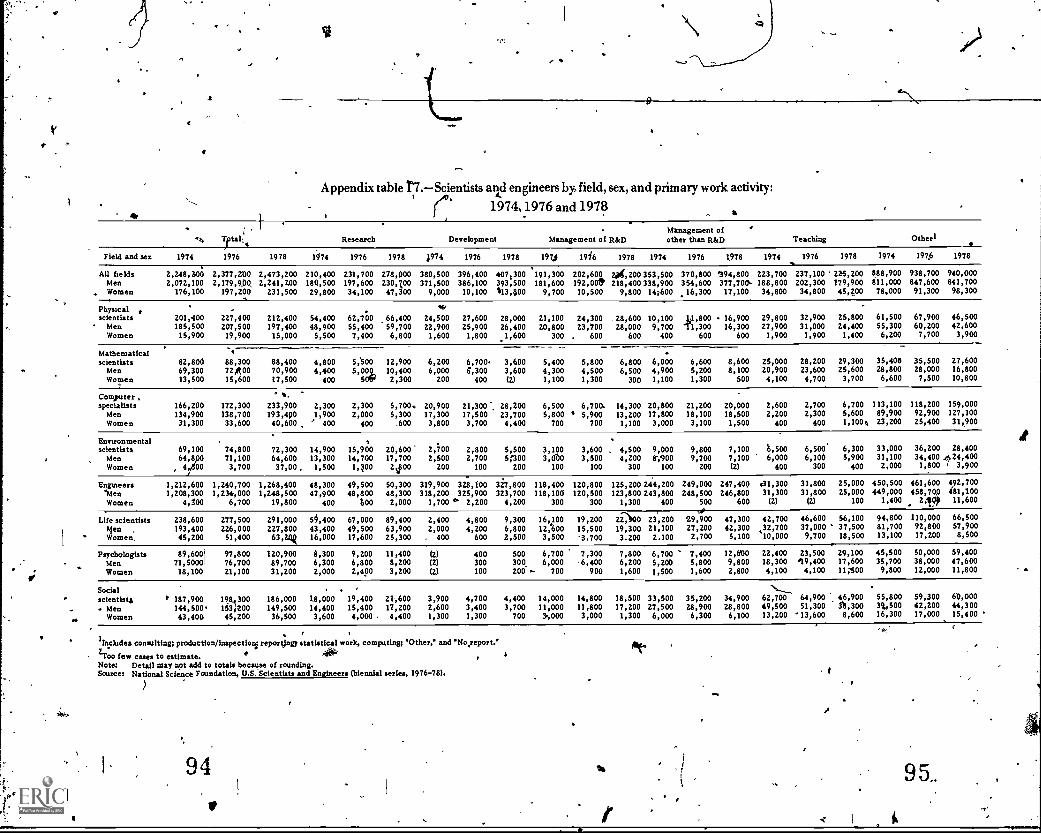
I;
Cl
a
a
sit
9
I
Appendix table t'7.- Scientists and engineers by field, sex, and primary work activity:/10, A.
1974, 1976 and 1978%
C'a, Tptal Research
Field and sex 1974 1976 1978 1174 1976 1978
AU fields 2,248,200 2,377,200 2,473,200 210,400 231,700 278,000Men 2,072,100 2,179,900 2,241,200 180,500 197,600 230,200Women 176,100 197,200 231,500 29,800 34,100 47,300
Physical t
scientists 201,400 227,400 212,400 54,400 62,700Men 185,500 207,500 197,400 48,900 55,400
.66,40059,700
Women 15,900 19,900 15,000 5,500 7,400 6,800
Mathematical 1
scientists 82,800 88,300 88,400 4,800 5;500 12,900Men 69,300 72,400 70,900 4,400 5,000 10,400Women 13,500 15,600 17,500 400 5019 2,300
Computer,specialists 166,200 172,300 233,900 2,300 2,300 5,700.Men 134,900 138,700 193,400 1,900 2,000 5,300Women 31,300 33,600 40,600 ' 400 400 .600
Environmental a
scientists 69,100 74,800 72,300 14,900 15,900 20,600Men 71,100 64,600 13,300 14,700 17,700Women 4 00 3,700 37,00. 1,500 1,100 2 800
Engineers 1,212,600 1,240,700 1,268,400 48,300 49,500 50,300'men 1,208,300 1,234000 1,248,500 47,900 48,800 48,300
Women 4,100 6,700 19,800 400 200 2,000
Life scientists 238,600 277,500 291,000 59,400 67,000 89,400I4en 193,400 226,000 227,800 43,400 49,500 63,900Women, 45,200 51,400 63,20k 16,000 17,600 25,300
Psychologists 89,6001 97,800 120,900 8,300 9,200 11,400Men 71,5000 76,700 89,700 6,300 6,800 8,200
Women 18,100 21,100 31,200 2,000 2,400 3,200
Social '
scientists, r 187,900 198,300 186,000 18,000 19,400 21,600
. Men 144,500 1534-200 149,500 14,400 15,400 12,200
esWomen 43,400 45,200 36,500 3,600 4,000 4,400
Management ofDevelopment Management of R&D other than R&D Teaching Other'
4974 1976
380,500 396,400371,500 386,100
9,000 10,100
24,500 27,60022,900 25,9001,600 1,800
6,200 6,7006,000 6,300
200 400
20,900 21,300'.17,300 17,5003,800 3,700
2,700 2,800
2,500 2,700200 100
319,900 328,100318,200 325,900
1,700 e' 2,200
2,400 4,8002,000 4,200400 600
(2) 400(2) 300
(2) 100
3,900 4,7002,600 3,400
1,300 1,300
1978 1974 1916 1978 1974 1976 1.978 1974 1976 1978 1974 197,6 1978
407,300393,5001113,800
191,300181,600
9,700
202,600192,00"10,500
2;4,200353,500218,400338,9009,800 14i600
370,800354,600.16,300
394,800377,700.17,100
223,700188,80034,800
237,100 '225,200202,300 179,90034,800 45,200
888,900
811,00078,000
938,700
847,60091,300
940,000
841,70098,300
28,000 21,100 24,300 28,600 10,100 L1,800 16,900 29,800 32,900 25,800 61,500 67,900 46,500
26,400 20,800 23,700 28,000 9,700 11o00 16,300 27,900 31,000 24,400 55,300 60,200 42,600
1 600, 300 . 600 600 400 600 600 1,900 1,900 1,400 6,200 7,700 3,900
3,600 5,400 5,800 6,800 6,000 6,600 8,600 25,000 28,200 29,300 35,400 35,500 27,600
3,600 4,300 4,500 6,500 4,900 5,200 8,100 20,900 23,600 25,600 28,800 28,000 16,800
(2) 1,100 1,300 300 1,100 1,300 500 4,100 4,700 3,700 6,600 7,500 10,800
28,200 6,500 6,700. 14,300 20,800 21,200 20,000 2,600 2,700 6,700 113,100 118,200 159,000
23,700 5,800 4 5,900 13,200 17,800 18,100 18,500 2,200 2,300 5,600 89,900 92,900 127,100
4,400 700 700 1,100 3,000 3,100 1,500 400 400 1,1004 23,200 25,400 31,900
5,500 3,100 3,600 4,500 9,000 9,800 7,100 '6,500 6,500' 6,300 33,000 36,200 28,400
5:300 3,60 3,500 4,200 1000 9,700 7,100 6,000 6,100 5,900 31,100 34,400 ..24,400
200 100 100 300 100 200 (2) 400 300 400 2,000 1,800 ( 3,900
327,800 118,400 120,800 125,200 244,200 249,000 247,400 .31,300 31,800 25,000 450,500 461,600 492,700
323,700 118,100 120,500 123,800 243,800 248,500 246,800 31,300 31,800 25,000 449,000 458,700 481,100
4,200 300 300 1,300 400 500 600 (2) (2) 100 1,400 2;so, 11,600
9,300 16,100 19,200 221,100 23,200 29,900 47,300 42,700 46,600 56,100 94,800 110,000 66,500
6,800 12:600 15,500 19,300 21,100 27,200 42,300 32,700 37,000 ' 37,500 81,700 92,800 57,900
2,500 3,500 3.700 3.200 2.100 2,700 5,100 10,000 9,700 18,500 13,100 17,200 8,500
500 6,700 7,300 7,800 6,700 ' 7,400 12,e00 22,400 23,500 29,100 45,500 50,000 59,400
300 6,000 '6,400 6,200 5,200 5,800 9,800 18,300 *19,400 17,600 35,700 38,000 47,600
200 700 900 1,600 1,500 1,600 2,800 4,100 4,100 114500 9,800 12,000 11,800
4,400 14,000 14,800 18,500 33,500 35,200 34,900 62,700 64,900 46,900 55,800 59,300 60,000
3,700 11,000 11,800 17,200 27,500 28,900 28,800 49,500 51,300 38,300 39,,500 42,200 44,300
700 3,000 3,000 1,300 6,000 6,300 6,100 13,200 '13,600 8,600 16,300 17,000 15,400
.
'Includes consulting; produttion/inspectiorg reportirigystattsticalwork, computing; 'Other," and'llo.report."
zToo few cases to estimate.
Note: Detail may not add to totals because of rounding.
Source: National Science Foundation, U.S. Scientists and Engineers (biennial series, 1976-78).
94 95,.

47) .
C Appendix fable 18.-Scientits and engineers by field sex, and primary work activity: 197.8
,
\
, .
Research and development Man ge-met
of R&D
Manage --:pent
of otherthan R&D
(
Teaching
*
Consulting
.
Production/.inspection
Reportlag,stat, work,.cpmputing
°tierand.
No reportBasic Applied
Field and sex ' Total ,research research Development
All4fields X73,200 '132,400 145,600 407 300 .228,200 394;800 225, \-00 122,800 353,206 307,000' 157,000Men 2,241,700 104;900 125,800 393,500 218,400 377,700 179,900 11,1,800 338,400 247,500 142,000Women 231,5.00 \-27,500 19,800. r3,800 9,800 17,100 45,200 8,900 44,14,900 59,500 15,000
... Physical scientists. 2.12;400 32,500 33,900 28,000 28,600. . 16,900 25,800 ;3;900 27,600 7,960 07,100
lien \-197,400 28,300. 31,400 26,400 28;000 16,300 , 24,400 3,300 25,500 17,100 6,700Women 15,000/ 4,00 2,500 1,600 606., 600, 1,400 600 2,100 .800 400
Mathematical scizntists 88,400 7,300 5,400 3,600 6,100 8,600 '29;300 1,800 2,600 20,900 2,300Men , 76,900 -7,200 3,200 \ 3,600 6,500 8,100 . 25,600 1,700 2,600 10,300 2,200
- Women , . 17,500 100 . 2,200 (1) 300 500 3,700 (1) (1) 10, 600! 200
Computer specialists 233,900 1,000 4,700 28,200 11,300 20,000 '6,700 11,500 9;20140 128,400 9,900Men 4. 193,400 1,000 ' 4,300 21,700 13,200 18,500 5,600 9,800 '8,500 101,700 . 7,;100Women 40,600 100 500 .4,400 1,100 1,500 1,100 1,700 700, , 26,700 2,800
Envirgnmental scientists 7,2,300 7,500 13,100 5,500 4,500 7,100 , 6,300 3,800 , 8,400 k 10,700 5;500Merl 64,600 6,800 10,900 ° 5,300 4,,200 7,100 5,900 3,800 7,000 - 8,400 5,200
- Women 7,700 700 2,100 200 300 (1) 400 ., (1) ly400 2,200 300
Engineers 1,268,400, ,8,500 41,800' 327,800 ., "125,200 247,400 25,000' 67,500 257,300 94 00 73;500Men 1,248$500 8,200 40,100 323,700 123,800 246,800 '25,000 67,000 25'2,600 89,700 7?,400 .
Women 19,8004,
300 1,700. 4,200 41;300 600 ° 100 500 5,300 4,700 , 1,100
Life scientists 291,00 59,500 29,900 19,300 2;2' ;500 47,300 56,100 7,700 33,400 . 9,100 16,300Men 4, 4,, 227,8Q0 40;100 23,800 19,300
4)42,300 37,500 6,100, 30,70Q 6,800 13,600
Women 63,200 19,300 6,000.6,8002,500 200 5,100 18,500 900 )2,600 2,400 2,600
Psychologists f20,900 4;000 7,400 500. 7,800 12,600 29,100 18,1004 ,6,000 I0,200 25,100 tMen 89,700 2 000 , 300 , 6,200 9,800 17,600 14,3,00 4,400 6,800 22,100Amen. . 31,200 1,500 **1,700 200 ` 1,600 2,800 11,500 3,900° 1,500 3,400 3,000
,Social scientists 186,000 12,100 9,400 ` 4,400 18,500 34,900 ' 46,900 8,500 8,800 25,400 17,300
Men 149,500 10,80Q' 6,400 3,700 - 17,200 28,800 38;300 7,100 7;800 16,700 11,700Women '36,500 1,400 = 3,000 700k 1,300 6,100 8,600 1,300
4-
° 1,000 8,600 4,50Q,
,
1Too few cases-to estimate.. ; .Note: Detail may not add to totals because of rounding. ,
Source: National ScienceFoundation,`U.S. Scientists and Engizieert: 1978 (NSF 80-304).
0 .), t
.
tt,
97,

I
11,Computer specialists >
Environmental scientistsEngineersLife scientistsPsychologists.Social scientists
-11
Appendix table 19-Doctoral scientists andipngineers by field, sex,and primarylvork activity: 1973, 1977, and 1979
. ,
Total,
ManagementRhea/eh and Management , of other
than R&Ddevelopment orR&D , Teaching Consulthig
Sales'andprofessional
services' Other '
ield 'Men Women Men WWomen Men Womeri Men Women Men Women Men Women Men Nombn Men Women "
All fieldsPhysical scieritM,tiii.'"
. Mathematical scientistsComputer specialistsEnvironmental scientistsEngineersLif,scientistsPsychologistsSocial scientists .
,
203,500 17,000 66,800 4,700k+ 31,90046,600 1,900 *19,300 600 8;600-11,400 800 2,500 100 500
2,600 100 1,000 (1)" 40010,100 300 3,600 100 1,900
:35,600 100 13,200 (1.) 8,300.51,900 6,100. 21,000 2,800 8,000
20,100 .4,800 2,800 500 2,100,25,200 2,900 3,400 400 2,000
1973
1,000 12,500:1 800 72,500 7,500 3,7()0 w 300 6,400 1,600 19,700 1,000100 2,100 100 13,400 900 400 (1) 500 (1) 2,200 200
(1). 400 (1) 7,500 -600 100 (1) 100 (1) ,. 200 (1) w
(>1) 200(1) 600(1) 2,209400 2,490300 2,200200 2,300
6
.(1) : 900 (1) 100 , (1)' (1) Cl) 100 . ( 1 )
(1) 3;000' 100 300 (1) ' (1) (1) 600 II)(1) 8,800 , (1) I 1 0 (1) . 200 ' (1). 4,1,7001° (I),'200 15,900 ,2,20 0 , 100' 1,400 .100 42,600 3Q0
,
400. 7,500 1,800 700 ,,200 3,900 1,500' 800 ' 2001.00 15,400 1,900 *400- 100 200 (1) 1,500 200,
1977
All fields 256,800 27,500 '85',900 i,6.00.36,600 1,7Q0 20,50Physicalscientists 54,600 ,2,900 23,600 1,210 '9,600 200 3,30Mathematical 13;500 1;000 3,100 200 600 (1) 800
5,500 200- 2,500 100 900 (1) 50012,600 400 4,700 200 1,900 100 1,10044,800 , 300 '0,000' 100 10,200 ' (1) .f 4,20063,000 9,000 25,500 4,100 ,8,700 600 3,90026,100 7,600 13,300' 800 2,1001, 400 2,80036,800 6,600 6,200 --900 400 30.00
1,700" '80,000 10,400 5,'6004,-100'.13,600 .1,100 , '400
(1) ".8,301) 700111,' 14,100(1) alai] 100,(1) , 8,800, 100 '6'00,500 - 1,6,300 2, 1,1600 8,6037' ,300 1,200
'.400 19.,9 '3,400,.. ,700
500' 12,000 3,200 -- 16,400 2,400
). 1,000 100 3,100 2001) 100' (1) 500 10Q
(1) lop 41), 1 300 ° *(1),
(1)' 100,- (1) *11;000-_(1L(1) 700 41) 2,200.100 300- 4,700 7.00300 64800, 1,400. # 500 '
400 100 '3,100 1004
O 4 1979\r-
All fieldsPhysical scientistsMathematic"al scientists,Coniputer specialistsEnvironmental scientistsEngineersLife scientistsPsychologistsSocial scientists
280,400 33,300 :`90,300,:,57,000 3,100 22,700
-14,200 1,100- 3,5006,400 100 2,900
14,000 600 5,30049,70Q 500 17,50068,900) 11,100 28,50028,800' 9,200 3,80041,400 , 7,200 6,100
9,400 41,0001,300 12,300
200 400200 '900300 2,300300 12,400
5000 .8,8001,000 1,3001,20Q 2,500
2,000 26,100 3 00 80,500 11,400 8,400 600300 3,400 ZOO 13,400 , 1,008 70Q (1)
(1) 1,200 100 8,100' .800 300 (i)(1) '700 (1) A 1,,100 100 300 (1)
1,200 1,200 100 2,800 100 800 .7 (V100 4,200 (1) 9,300 100 2,500 ' (1)80b 6,000. 800 4ik,900- 3,200 1,400 100300 4,000 1,000 , 8,000 2,400 1,200 300'400 5,500., 900 = 100
16,700 4,400 ,'17,400 ,5001,100, (1) 3,400 300
200 . (I-) 300 100100 (1) 400 100 .200 ',(1) x.1,300 1100 .
1,100 (1) '2,700 '1903,800 400 4,500 800 tr9,200 3,700 1,200 00
800 200 3,500 700"s
.1Too few cases to estimate.Note: Detail may not adcl to to' becausecA sle of Atriding.Sduice: National Science Foundatiori; Characteristics of Doctoral Scientists and Engineers in the United States (biennial ,aeries; 1977 -79).'
98'', .
I
4
f

..,
j
.
f.,
-'
( - °
Appexidixtable s*ntiits'an6ngineers by field, sex, and primary work activity:
.0
;
.1 ..
'Field and sex
;
1979'
1 i'' ...,: -4, '''' - 4.-. .s.
Reseaka'-aiid,deviii/pment......,_Sales and
. , ;went ' of other.meet
' professionil- Basic Applieci --. ,"Total research research' DevelopMent of 12,8tD than R &D Teaching, Consulting. services
..
. Manage-,
Otherand
No- report
All field;;-''MenWomen
.313,700 ''47,900 '56,800 215,000,` 43-,-000; 29,200 91,900280,400 -:41000 34,400 14,500 41;6,00 26,100 ' -80,500`'33,300 6,400 2,400 ' 500- 2,000 3,100 11,400
21,0008;400 ,
600' 4,400,
19,80017,9002,500
. .
. Physical scientists ;-... 60) 200, 12,100 9,000. /. 2,800 12,7/00, Men 57,006 11,200 8 ,700 ,2,700 - 12;300
WomenJ.
. -3,400. ,...-* 900. .300 100 300,.._
--
-, -
gailionat ic al scientisis., men
:Woolen_
-
15000 2.)100 10 ,i ;r- 50014,200 %,060 1;000 -500 4001,100 ::.100 -(1) (1) (1)
3,600' 14,400 '" e 1,2003,400 13,400 ` 70r,) 1,100
200 1,000 (1)
1,300 8,9001,200 8,100
800
3,400306 -
400 2011 400300 200 , -300
(1) (1) ," 40,9
C6mputer specialists'' Men.- -Women
. mental' scienfisis.
Min\Wainen
"Engineers,
Varten
6,7006,400
400
./400 500 -p 2,100'- 1,000-400 500 2,000 0
100
. -
70.Q 1,1QQ. . 3007'06" '1,100 3'00 ,
(1) 100 (1),
200 .
100(1)
400',
'100
1
..2-4...A., --.---
14,600 2,700 2,50014,000 . 2,500 : 2,400
600 206- 100 : (1)I-1,
4 0 0'400
2,4002,300
100
1,2001,200
( -1)
3,000 800 2002,800, 800 200
100 (1) (1)
1,400,1,306
100
50,200 f 1,900 8,000 - 7,80049,700_1 1,9-06 ' 7,900- 7,700
-500. 100 100
12,50012,400f 106,
4,200 9,300 2,600 1;1004,200 9,300 2,500 1,100 .
(1).- 100 (1/) (1)
2,7002,700
. 1,00
Life',-
scientists .
}Men rWoffien
80,100 '23400'10.; 9,20068,90.0._ .19,464 . 8,300,11,1,00 .4,000 90Q
900700200
9,500 68008,800 6,000
800 800
19)20015,9003,200
1,600 %1,400 `
100
4,200 5,400 7,3,800 4,500
400 800
Psychologists-Men-W-amen
38,0011 -, 2,000 30028,800 1 9.00 ' 2009;200 660 (1)
1,6001,300 -
3 00
5,000w\4,000'
1,000
10,4008,0002,400
1,500 ' '13,0001,200 9,200
306 3,700, .
1 ;6'001,200
400
Social scientistsMensWomen
48,000 2,700, 4,504 zoq41,400 2,100, '17990 200'7,200 600 . 690 (1) ,
3,000 . 6,400 "25,6002,590 5,500° 21,9.00
400 900 3,700 ;
1;100'1,000
100
4,200'3,500
700
1Too teW cases-to estim,atex.Note: Detail,thay not add to totals because of rounding! ;
10 Source: -National Science Foundation; Chracteristics of Doctoral Scientists and Engineers in the United 1919' (NSF80-3234al anda ,unpublished data.--

I `
, Appendix table 21.-Doctoral scientist and engineers by field, race, and- rimary work activity: 1 73,1977, and 1979
-
Reseirch Managtment ,and Management of other
Field and race. Total development of R&D a than R&D TeaChing Consulting
1973
I All fields 220,400 41,5,00 32,900 13,300 89,000 4,100. fVbite 200;900' 63,900 30,70.0 14,600 73,000 3;700
Black 2,100 400 4300 200 900 . (1)Asian , 9,100 . ' 4,400 1,000/ _ 100 , 2,800 ;00... Other2 1,300 2,600 900 400 3,300 100,
Physical scientists. 48,506 19,900 8,800 2,200 14,300 400White 44,000 17,900 8,200 ' 2,100 12,Q00 400_Black, 500 100 - 100 (1) ' .200 (1)
L Asian 2,100 1,200 300 (1), 500 (1)Other 1,900 700 200 (1) 800 (1)
Mathematical scientists' 12,100 2,6Q0 500 500 8,100 . 100,
White 11,000 2,300 , 500 400 7,300 100Black - 100 (1) (1) (1) 100 '(1) 'Asian 500 200 (1) ,(I) 300 (1)Other 500 200 (1) (1) 300 , (1)
, -Comptiter specialists 2,700 1,100' 400 200 900 100
White 2,500 1,00Q 300 ZOO 800 (1)Black (1) (1) In) (1) (1) (1)Asian .i. 100 (1) (1) (1). (1) (1) 'Other 100 (1) , (1) (1) 100 (1)
Environmental scientists 10,300 3,700 2,000 ,a 600 3,100 300White 9,700 3,490- , 1,800 600 3,000 300..-Black (1) (1) (1) (1) (1) (1)Asian 300 100 (1) (1) (1) (1)Other o 400 200 100 (1) 100 (1)
Engineers 35,800 '13,200 / 8,300 2,200-, 8,900 1,100White 31,800' 11,300 I 7,800 , 2,100 7,800 1,000Black 100 (1)Atir (1) (1) (1) (1)
i Asian 2,700 1,5'00- 300 - (1) 700 100/ Other'
1,100 400'
200 100 300 (1)..
, Life scientists 58,000 23,900 8000 2,600 18,,100 600White 53,100 21;500 7,700 2,500 16,700 600
. Black 700 200 100 (1) 300 (1)man, 2,310 1,300 300 (1) 500 ° (1)Other 2,000 , 800 200 ., - 100 600 (1)
Psychologists 24,900 3,300 2,400 2,00 9,300 .900White 23,200 3,100 2,200 2,400 8,800 £00
Asian 200 (1) (1)100 ; (1) 100 (1)
(1) 100 (1)Black 300 (1)
Other j 1,100 o 100 100 100 400 (1)
.\ Social scientists I 28,100 3,700 2,200 2,400 7,300 400White . 25,700 3,500, . 2,000 2,300 1 ,700 400
Sales and /professional
"services
Otherand
No report
8,200 10,6007,500 9,500
100 100200 400.400 600
600 2,300500 2,00Q
(1) (1)(1) 100
*(1) 200
100 300100 200
(1) ' (1)(1) 0, (1)(1) (1)
(1) 10011) 100 r
- '(1) (1)(1) (1)
. (1) (1)
(1) 600(1) 600(1) (1) :a:(1) (1) I(1) (4
200 1.,700s 200 1600, (1) (1)
(1) 100(1) 100
.-
1.,500 2,900D 1,400 2,700
(1) (1)100 100100 ' 160
5,300 1,0004,900 900
100 (1)(1) (1)300 100
4 300200,
. i 1,7001,500.
: \ Black 400 (1) 100 100 200 (1) (1) . (1), Asian 900 100 (1) 700 (1) (1) , 100\ Other 1,100 ZOO
100100 , 00 (1) (1) 100
..
4 /1
22,200 90,40 6,100 ' 15,200 18,600 ."20,600 81,601 5,500 14,000 16,400
300 1,0dd (1) 100 200 s500 3,500- 400 300. 900800 4,400 200 - 800 1,100.
3,400 14,700 400 1,100 3,3003,100 .. 13,200 400 900(1) 100 (1) ' 100 (1) .
100 600 (1) (1) 200 . ,.
- . 1977,
All fields 284,300White 253,600Black 2,800Asian 15,300Other 12,600
)
93,50080,300
6008,4004,100
38,30035,200
500'1,4001,300
,
Physical scientists . 57,500 24,800 9,800White ," 51,3b0 21,700 . 9,000,Black / 400 200 '200 -'With ° 3,200 .Z,000 300Othkr 2,400 900 300
41Matherna tical scientists 14,600 3,380 ° 600
White\ - 12,900 "2,800 500Black \ 100 (1) (1)Asian 1 700 200 (1)Other .. 800 200 (1)
computer specialists 540 2,6.00 900White 5,000 2,200 900Black (1) (1) - (1)Asian 690 300 100OtheF 200 100 (1)
700 (1)200 (1) 200
800 '9;100 100 100 600700 8,100 00 100 500
01').
100 ' ( (1) _ (1)(1) .,(iy(1)
400 ''"(1 (1)500 (1. (1) (1)
-1
500 1,200 -200 100 400400 1,00d 100 ° 100 300
(1) (1) (1) ' (1) (1)(1) 100 (1) \ (1) (1) ,,,(1). 100 (1) ,`\ (1) (1)
. ,
. 102 .1
79

I
(
..
.
ti
q)
Appendix table 21:- (con.)
t
Field and race Tatal
Research Managementand Management of other
development . of R&D than R&D Teaching Consult*
Sales andprOfessional
services. .
Otherand
No report
Environmental scientistWhiteBlacliAsianOther . ...,
13,00012,100
(1)5004po
4,9004;400
(1)100
' 200%.
2,000 1,9001,900 1;100 .'
-- (1) (1)(1) (1)
100 (1)
3,5003,300
(1)100100
400''.. 300' (1)
100(1)
,
.
100100
(1)(1),0)
1,000.1,000(1)(1) ,(1)
.*
.Engineers
WhiteBlackAsian ,Other
45,00038,300
1004,8001,700
..,,
17,20013,400
(1)2,900
800
10,300 4,3009,400 3,900(1). (1)
500 200300 100.
8,8007,690(1)
800400
1,6001,404
(1)200
(1)
700600
(1)(1)(1)
2,200' 1,900
(1)300100
...
Life scientistsWhiteBlackSianOther
71,90064,500
800.3,800
' 2,900
29,60025,800
200*2,3001,200
9,300 4,4008,500 4,000
100 100400 100
'300 100
19,00017,400
200500900
1,2001,100
(1) I,
(1)... ',
100
3,1002,600
(1)200200 0
5,5905,000
100s 200
200
Psychologist?WhiteBlackAsianOther
33,70031,100
500300
1,900
4,0(103,700
100(1)
200
2,500 3,5002;300 3,200
100 (1)(1)
100 . '200
10,800.10,000
200100600
1,500;1,400.(1)
(1)100
9;6009,000
(1)100500'
,71,900,1,600
100(1)
200
Social scientistsWhite . .BlackAsianOther
42,70038,500
6001,4002,300
7,100.6,300
100300500
3,000' 4,3002,700 4,000
100 1001Q0 (1)100 100
23,30021,000
300800
1,200
800700
(1)(1)(1)
500500
(I)(1)(1)
3,8003,300
100100300
1979 fAll fields
WhiteBlackAsianOther
4.13,700E76,900
'3,400, 21,000
12,400
99,70086,400
700-1 8,800
3,700
, 43,000 29,294136,800 26,900
500 5004,500 7001,200 1,100 '
91,900.82,109'
1,2001;8003,800
9,4007,600
100900
.400
21,00019,500
200. ,500
800,
19,80017,500
290800
1, 300
Physical scientistsWhiteBlack'AsianOther
60,20053,100
5004,3002,200
23,900E1,100
2001,800
goo,
12,700 3,60010,900 '. 3,400
1QQ (1)1,400 100
200 100
111,40012,600
100900800
SOO
700(1)(1)(1)
1,200''1,100co-!
, 100(1)
' 3,7003,300
(1)100300
Mathematical scientistsWhite
. Black ,AsianOther _
15130013,200
200,'900
1,000
46003,000
(1)300300
, 100 1,300400 1,100,
(1) (1)100 (1) -
(1) 100
.-..
t8,9007.,V0
100, 500400
100(1)(lc100
200,' 200
(1)(1)(1)'
400300
(1)03
100
. .computer specialists
White o
BlackAsian
"
Other'
6,7606,000 '(1)
500300
3,0002,700
(1)200100
1,000 700900 600
(1) (1)(1) a(1)
(1) 100
1,0001,000(1)
100. 100
300200
(k).100
(1)
200200
(1)(1)(1)
e
400'400
(1)(1)(1)
Environmental scientistsWhiteBlackAsian " N, .Other
14.,60013,600t 100
500500
5,6005,100
10.0300200
2;400 1,200 .2,200 .4,200(1) (1)
400 (1)100 (1)
3,0002,800'(1)(1)
100
800700
.' (1)(1)
----400 . '
260200
(1) '(1}
(1)
'1,4001,300(1)(1)(1)
EngineersWhiteBlackAsian..Other
5Q',20041,00Q
2007,5001,500
17,80013,700
(1)3,500
500
.
12,500 4,20010,009 ,4,0(10
100 (1)2,100 100
300 100
9,3008,000
(1)900 .
400
2,600,2,000
(1) ' -600
..(1).
1,100900
(1)100
(1)
'2,7002,400
(1) ,
200100
Life scientistsWhite -lila'ckAsianOther
80,10071,500
''. 9004,9002,800
3350029,700
2002,540,
`1;100
9,500 6,8008(400 6,300
~ lop 100700 200300-, / 200
19,20017,200
4000/00
1,600.1,400
(1)100 .100
4,2003,800.(1) '
300200
5,400, 4,700
(1)300300,
9, 1

../
I <11
..<
Appendix table 21;-(con.)4 4.
Field mid rice Total
Researchand
developmentManagement
of R&D
Managementof other .
than R&D Teaching Con%sulting
Sales andprofessional
services
therand,
No report
PsychologistsWhite'Black-AsianOther
m
38,00035,100
600400
1,900
4,6004 600l
100100200' ' '
1.26001,500(f)We
' 200
5,0004,500
100100300 -
1014009,7Q0
20Q100400
1,5001,300
(1)(1)100
13,00012,200 '' ZOO
100600
1,400'1,500
(1)(1)
100
Social scientistsWhiteBlack AAsianOther
48,60043,400
1,0002,0000.2,200
7,4006,600
100.200500
.3,0002,600
100100200,
6;005,800
200200200
25,60022,800
4001,4001,000
1,100900
(1)100
(1)
1,p00900
(1)(1 .)
(1)
4,2003,800
100100200
Too few case's to estimate.
?Includes American' Indians and No report."Source: National Science Foundation, Characteristics of Doctoral Scientists and Engineers in the United States (biennial
series, 1977-79) and unpublished data.N
/ As 1 0 els
A

-f
e --
Appendix table 22.-Doctoral scientists and engineers by field, race, and primary work activity: 1979
;
Field and race
AU fieldsWhiteBlackAsianOther2
Reseakh'and development Manage-Basic Applied inept
Total research research Development of R&D
313,700 47,900 36,800 15,000 43,000276,900 442.;2(10 31,900 12,300 36,800
3,400 300 400 (1) 500, 21,00 3,400 3,300 2,100 4,500
12 40G 1,900 1,300 500 1,200,
Physical scientists 60,1200 12,100 9,000 2,800 12,7001 While 53,100 10,500 8,200 .2,400 10,900
' Black 500 100 100 (1) ., '100Asian 4,300 1,000 500 % 300 1,400 ,Other 2,200 500 300 100 200
Mathematical scientists 15,300 2,100 1,190 500 500White .-. 143,200 1,700. 1,000 400 400Black 200 U) (1) (1) (1)Asian 900 ,200 100 100 100
Other 1,000 200 (1) (1) (
Computer specialists 6,700 1400 500 2,100 1,000White 6,000 400 400 1,800 "900
.Black (1) (1) _* (1) (1) (1)
Asian 500 (1) (1) 200 11)
Other -'' 300 (1) (1) 100 (1)
Environmentalscientists 14,600 2,700 2,500 400 2,400
' 117.3iite 13,600 2,500 2,300 300 110 2,200
Black 100 (1) 100 (1) (1)
Asian 500 100 . `. 100 100 100
Other 500 100 (1) (1) 1001
. .
. Engineers 50,200- 1,900 8,000 7,800 12,500. White 41,000 ,1,600 6,000 6,100 10,000
Black 200 1 (1). (1) qa(1) 100 1
Asian 7,500 300 1,700 - 1,400 2,100 'Other 1,500 (1) 300 .3064 300
Life scientists 80,100 23,400 9,200 900 9,500White 71,500 20,800 8,100 800 8,400Black 900 200 100 (I) 100Asian % 4,900 _1,700 700 (1) 706Cothir 2,800 700 400 (1) 300
Psychologists 38,000 2,600 2,000 30Q 1,600%white , 35,100 2,300 1,900 A 300 1,500Black' 600 (1) (1) (1) (1) tAsian 400 (1) ' (1) (1) (1) 1Other 1,900 200 (I) (1) 200
Social scientists 48,600 2,700 4,500 200 3,000White' 43,400 2,400 4,090 200 2,600Black ' 1,000 (1) 100 (1) 100Asian 2,000 (1)' 100 (1)- . 100
Other 2,200 200, 300 (1) 200
.t.
132
Manage- $rent Sales and Other
of other- professional andthan R&D 'Teaching Consulting se/ices No report
29,200 91,900 9,000 21,000 19,860261900 82,100. 7,600 19,500 17,560
. 500 1,260 100 200 . 200
7Q0 4,800 900 500 .800
1,100 3,800 400 800 1,300',
3,600 14,400 .8003,400 12,600 700(1) - 100 (I)
/ 100, 900 (1)100 . '800 (1)
3,7000163,300 ,
(1) '
100.300
1,300 1 8,900 400 1 200 400
. )(1)4,200 7.,900 300 200 300(1) 100 / (1) (1)
(1) 500 (1) (1) (1)
100 400 100 (1) , 100 4 .
700 1,100 " 300 '' 200 400600 1,000 200 Q
200 400 ,0) (1) (1) (1) (1)
r ,(I) 100 100 11) (1)
100 100 (1) 6 (1) (1)
1,200, 3;000 ... 800 200 1,4001,200 2,800 700 200 1,300(1) (1) (L) (1) (1)
(1) (1) 4) (1) (1)
(1) 100 100 (1 ) (1)
4,200 9,300 2.600 '1,1t 2,700.
4,000 $,,000 2,000 900 2,400(1) (1) (1) (1) (1)
100 900 600 100 1200100 400 (1) (1), 100
6,800 19,200 16600 4,200 5,4006,300- 17,200 1,4'00 3,800 4;700
100- 400 (t) ,---d' (1) (1)
200 900 1700 300 , 300200 700 100 200. 300
5,000 10,400 1,500 13,000 1,600
4,500 9,700 1,300 12,200 1,500100 200 (1) . -2007. (1)100 100 (1) 100 (1)
300 400 100 600 100
6,400 25,600 - 1,100 1,000 '. 4,2005,80p 22,800 900 900 3,800
260 400 a) . (1) . 100200 1,400 100 (1) 100200 .1,000 (1) (1) 200
,
'Too few cases to estimate.?Includes American Indians and 'No teport.'Note: Detail may mit add to totals because of rounding.Souice; National Science Found.Dtion, Characteristics of Doctoral Scientists and Engineers in the-United States: 1979 (NSF 80-323)..0 .
4 1 0

... " /*pendia table 23.-Experiencedl scientisliag engineers by field, race, and primary work activity: 1978
r,*
4 I.. - Research and development . , Managmelit .. . ,-. Other.
. Basic Applied Management of other -. Production/ and '."Field and race Total Total research kesearch Development of R&D than R&D SeaChing Consulting inspection, Report4ng2 No report
Environmental ,
scientists 23,500 7,600 1,700 4,100 1,900 2,400WhVe 23,200 7,500 1,600 4,000' 1,900 2,300B?a , (3) (3) (3) (3) (3) (3)Asian 200 100 100 -(3) (3) (3)Other 100 (3) 13) (3) (3) (3),
All fields 880,600 243;400. 28,160 52,600 ' 162,700 146,800White 840,000 230,600 25,900 49,300 155,400 103,300Black 9,300' 3,000 300 700 1,000 1,106Asian 20,300 9,200 '1,500 2,500 5,300 1,500Other 4,900 ' 1,500 _goo ' zoo 1,000 po ,,,,
. .Physical scieriiists 100,200 41,00 12,200' 16,100 13,000 16,800
White. 93,900 38;000 11,100 14,700 . 12,200 161300 .Bla'ck 1,700 500 100 300 100 100 .
3,900 2,400 900 900 600 400Other . 700 400 :ACK '100 . 100 (3)
Mnthematical scientists, 22,900 3;200 '1,300 1,000 '' 900 2,600White 21,200 3,000 1,200 1,000 1 900 2,500Black 800 (3) (3) (3) ' (3) .. - 100 'Asiarf 600 200 100 (3) (3) (3)pther , 200 (3) 7 (3) (3) (3), . (3)
1. . . ..
Computerspecialists 44,700 6,900 20Q 1,100, 5,500 3,600*\--White ' .', 43,400 6,800 200 1;100 5,400 3,500 .
Black " . 500 (3) (3),, (3) (3) 100Asian 700 100 (3) (3) 100 (3) `'
Other 100 (3) . (3) (3)i (3) (3)
, .Engineers 560,800 .159,300 2,900 18,400 138,000' , 69,400 1 5,600 13,500_
White 540,600 161,600 2,800 17,100 ' 131,700 67;390 12 ,200 12,600Black ' 4,000 1',000 (3) 200 800 700 1 000 200Asian 13,000 5,700 (3) 1,100 1 4,600 900 , 00 500Other 3,100 900 (3)
.t.100 800 400 00 200
Life scientists 61,800 17,700 , 7,500 8,000ti 2,200 5,600 11,Q 14,400a \ -
White 58,900 16,300 6,800 7,400 .. 2,100 '5,40 '11,700 13,6004 Black 1,200 300 100 100 100\ 11 oo 100 '500
. Asian 1,300 r 800 300 ,4(10 (3) 100 (3) 200' Other 50(f 200 200 (3) (3) 100 (3) .: 290-
170,60 75,000 49,500'166,100 71,000 48,000
1,800 1,500 4002000 1,800 800
500 600 300
9 p 600. 14,300 2,0009,100 . 13,600 1,900
400 200 (3) .1D0' 44 - 100
(3). (3) d).. .
3,000 8,600 . 46o2,900 8;000 400
100 300 (3)(3) 200 (3)
100 1.00 (3)
6,100 1 ,1,9005,900 1,800
100 . (3)100 (3')
(0Y. (3)
3,700 2,8003,700 '2,800(3) (I)(3) (3)'(3) (a) c
. .Psychologists 29,100 2,800 900 1,400 500 2,300' 4,100 ,....,7,400
White 28,500 2,700 800.5 1,400 500 2,300 4,1.00 7,200Black 500 100Asian (3) (3) (3
110 (3) '(3) ', (3) 100 100(3) 1 (3) (3) (3) (3) I
Other - . , 100 (3) (3) (3) (3) (3) (3) me-
117,300 64,000 54,000113,300 61,200 52V000 '
1,000 900 600 .2,200 1,400. 1,000
700 400 ,400,
10,p00, 2,600 3,4009,500 11 2,400 .. 3,100
400 106 100200 . ' , 200 1-00300 (3) (3)
700 3,800 700600 3,300 600100 200 (3)
(V 200 (3)(3) (I) ' .(3). .
3,200 1;800 19,400 1,900 4.3;200 .1,700 18,700 1,800(43) .:. -(3) 300 (3)(3) ' a''' 100 400 (3) ,(31 (3) 100 (3) .
1,50Q .1,800 ' 1,700 2,0001.,500 1,800 1,600 2,000(3) (3) . , (3) (3)(3) (3) 100 (3)(3) - (3) (3) ' 100
*
32,300 '94,700' 30,0,00 36,10031,100 92,000 29,000 34,700
100 590 200 300700 V 1,800 600' 800 'f'300 400 200 300
2,100 4,900 ' 2,400 2;9d02,000 , 4,800 2,300 2,800(3) (3)( 100 100
100 (3) (3) (3)(3) (3) ' (3) (3)
"
Social scientistsWhiteBlackMilanOther
6,500 . 1,000 700 4,300'6,300 1,000 700 4,200
200 (3) - (3) , (3)(3) (3) (3) (3) '-(3) (3) (3) (3)
37,500 4,700 1,500 2,500 700 4,100 6,700 12,100 1,70036,300 4,600 1,500 2,500 700 4;000 6,500 11,500 1,600
600 (3) ,- (3) (3) (3) (3) .100 200 (3)500 (3) * (3) (3) (3) ' 100 (35 400 (3)100 (3) (3) ' (3) .' (3) 1 (3) (3) (3) (3)
2,100 3,400 2,800'2,000 3,200 1 4,700
. . -100 '(3) 1001 (3) (3) (3)
(3) 100 (3)
1Those scientists and engineers in the labcir force at'the.time of the 1970 Census.fa- ,
?Includes statisticai work and computer application. , .
3Too few cases to estimate. i LNotej Detail may not add to totals because of rounding: -. .
Source: National Sefence Foundation, Characteristics of Experienced Scientists and EnRineers:1940tSSF 79-322). -.... .,. ii.r.............................tk...........-.,

'
10
IN,
.Appendix table 24.-Scientists and engine(ers by field,'sex, and type of employer:
' 1974, 19746, and 1978
Total
Field andjai 1974 1976
All fieldsMenWomen
2,248,2002,072,100
176,100
2,377,2002,179,900
197,200
- Physicalscientists 201,400 227,4
Men 185,500 .207,500Women 15;900' ,19,900
Mathematicaldcientists 82,800' 88,300
Men 69,300 72,700Women 13', 5Q0 15,600
Computerspecialists 166,200 172,300
Men 134,900 138,700Women 31,300 33,600
Environmentalscientists 69,100 74,800
Men 64,800 71,10QtWomen '4,300 3,700
Engineers , 1,212;600 1,240,700Men 1,208,300 1,234,000'Women 4,300 6,700
Lifescienfists' 238,6Q0 277,500
Men 193,406 226,000',Women 1. 45,200 '51,400
' °Psychologists 89,606 97;800Men 11,500 76,700
.Women 18,100 21,100
'Business and.industry
1978 1974 1976
2,473,200 1,376,200 1,433,1062,241,700 1,31303,00 s 1,362,600
231,500 ' 62,400 70,500
Z12,400 98,000 108,700197,400 89,300 99,000
15,000 8,700 9,700
88,400 :32,000A0,900 27,00017,500 5,000
%53,60027,9005,700
233,9001,93,40040,600
121,60099,10022,500,
125,900101,6'0024006
72,30064,6007,700
36.,20034;8001,400
40,40038,900
1,500
11,268,400 939,600 959,7001,248,500 . 936,700 955,1.00
19,800 2,900 4,600
291,000 '89,500 102,000227,800 78,000 88,30063.200 11,500 13,700'
40,900 c 17,704 18,70054,700 14,100 14,80031,200" 3,600 13,900
Socialscientists 187,900. 198,300\
"Men 144,500 153,200'-."1
Women 43,400 45,200
46
186,000 41,600 44;400149,500 34,800 37,00036,500 - 6,800 7,100
,
Educationalinstitutions
Fede;a1government - - Other
1978 _1974 1976 4 1978 1974 1976 1978 1974 1976 1978
1,528,1001,445,300
82,700
341,300288,200 312,100',53,100
p0,700
58,600,
380,800304,800
76,000,
189,100175,500
13,600
205,600189,700.15,900
X05,800187,3d0'18,600
341,500294,50047,000
367,800 358,100315,600 304,60052,400 ;4,000
116,300 47,400eik
54,100 .55,500 19,600' 22,800 18,000 36,400 41,700 22,600198,400 44,200 49,4001 51,500 18,800 21,100' 164900 . 33,200 38,000 20,500
7,900 3,200 4,700 4;0Q0, 800 1,800 1,100 3,200 3,900 2000
34,200 31,900 34,600 35,100 7,900 8,700 9,400 11,000 11,300 9,70025,600 28,100 29,800 i8,600 6,100 g 6,600 8,800 8,100 3;,400 7,8008,600 3,800 4,800 6,500 1,800 2,100 600. 2,900 3,000 1,800
140173,000 13,400 13,800 17,910 13.900 14,300. 14,600 17,300 18,200 28,800145,100 10,600 10,900 13,90Q 11,300 11,600 12,300 13,900 14,600 --22,30027,300 2,800 2,900 4,000 2,600 2,800 2,300 '3,400 3,800 6,600
4.
40,400 10,100 1,1,100 12,900 10,600 11;400 10,400 12,1d0 112,200 8,600 4,j4.,l'1
` 36,000 9,100 10,500 11,300. 9,600 10,500 .9,500 11,200 11,200 7,900 'N't,4,400 1,000 600 1,600 1,000 600 900 900 900 700
985,400 4k3,100 43;900 48,700 95,100 97,500 90,600 134,800 139,500 "143,700 '969,100 , 42,900 43,600 47,700 94,700 96,900 89,200' 134,600 138,400 142,50016;300 , , 200 300 900 ' 400 700 1,400 800 1,100 1,200
' 86,400 754,300 86,100 94,400 17,900 '25,600 41,800 55,900 63,7,00 68,E00'49,00077,300 *56,300 65,500 65,500 16,000 23,100 35,500 43,100 49,600
9,100 19,000 20,700 28,900 .1,900 2,500 6,40Q 12,800 14,600 18,200
31,600 39,300 '42,900 55,300 5,100 5,400 t 4,000 27,500 30,700 29,90028,500 33,-700 36,100 36,000 4,500 4,700 3,100 19,200 21,200 22,100
3,000 5,600 6,700 19,400 600 700 900 8,300 . 9,600. 7,900
7 4
60,804 $0,800 84,300 61;200 19,000 20,000 ' 17,000 46,500 49,900 46,700.55,300 63,300 66,300 50,200 14,500 15,300 12,000 3.1,800 24,600 31,9005,600 17,500 17,900 11,100 4,500 '4,700 6,000 14700 15,400 '14,900
lIncludes nonprekit organizations; rollitary; State, local, Al other governments; and "No report:"Notes Detail may not add to'lotals because of roundiig.
. Source: .11ational,Science Foundation; U.S. Scientists and Engineers (biennial seties, 1976-78).
k 'y-'Y-
104
00

Appendix table 25.-Scientists and engineers by-field, sex, and type of employer: 1978,
..
. ;
---..... ..,..
N--.
.,
., Business'andField and sex Total industry-
. , .,Educational_institutions
.
Nonprofitorganizations
--....-Federal,
government
- state- and local Other
\.Other and
Military governments government No reEort
All fields 2,473,20Q,Men 2,241,700'Women \ 231,590 .
1,528,1001,445,300
82,700
380,800304,80076,000
80,40060;500,19,-600
'205,800 .187,30018;600
20,60020,300
200
145,30014,400
23,000
58,30055,500,2,800
.
54,20045,900'8,400
Physic's' scientists 212,400Men 197,400Women 715,000
116,3b0108,400
, 7,900
.55,50051,5004;000
+
7,9907,000
900 .
18,00016,9001,100
.
.700700
(1)
5,2004,600
'600
4,4004,100
, 300
4,4004,100
300 ..
Mathemdtical scientists 88,400. Men. 70,900
Women 17,500
34,20025,6008;600
35;10028;69Q'
6,500 .
3,100, 2,600
.500
9,4008,8a0
600
; 800700
(1)
A
3,3002,3001,000
1,5001,300
200
1,000900100
. -.,Computer specialists 233,900
:sMen . 193,400Women - 40,6'00-
i
173,000145,100
27,800
17,60013,700.4,000
11;100-9,0002,000
:14,6001-2,3002,306
2,9002,700
200
, 6,800°.4,100
2,700'
3,7003,500
300
"4,3003,0001,300
Environmental scientists 72,300Men 64,600Women, 7,700
40,40036,0004,400
12,90011,300.
1,600a
1,1601,000
100
10,4009,500
900
10000
(1)
° 4000.4,400
500
1,800.1,700
100
° 700700
(1)
Engineers 1,268,400'1,i48,500
WIPomen 19,800
985,400.969,100/
i6,800
- 48,70047,700
900
,
17.,90017,800
100
. 90,60089,2001,400
1`l.,60011,600
(1)
52,90052,600, 300
34,700134,306
400
26,60026,200
. 400,,',
\Life scientists. 291,000Men 227,800,Women, 63,200.
86,40077,390'
9,100
94,40065 , 50028000
.
18,5009,7008,900
'.
'41,80035,500
6,400
1,8001,800(1)
.
31,40027,700
3,800
4;200' 3,500
700.
12,3006,900.5,400
.1
.p-----.Psycliologitts 120,900, Men 89,700
Women . 31,200
31,60028,500
3,000
55,300,36,00019,400
10,2007,800
'. 2,400
4,9003,100
900 .
2,200'2,200.(1)
..
:
13,2008,700
5,500
1,7001,,300',400
2,7002,000
700
Social scientists 186,000Men 149,500Women 36,500
60,80055,300
5,600
61,30050,20011,100
10,200'5,6004,600
r 17,00012,0005,000
500500
.(1)\
27,60018,0009,600
6,2005,700
500
2,2002,100
200
1 Tod few cases to estimate.Nbte: o Detail may not add to totals because of rounding.Source: National Science Engineers: 1978 (NSF
109
Foundation, U.S. Scientists and 80-304). 110
1

0'1
Appendix table 26.-I-Doctorai scientists'and engineers by field,' sex, and tyge bf,employer:"1973, 1977, and1979 .
TotalBusiness and 17.4k Educational
industry institutions
Field and sex 1973 0 1977 1979 1
All fieldsMenWomen
\)Z20,400* 284,300 313,700 53203,500 256,800 2843,400 5217;000 27,500 33,300 1
73 ,1977 1979 1973 1977 '1979
400 71,500 82,800 129,400 163,100 174,000000 68,500 78,2,00 117,200 144,400 152,100400 3,000 4,600 12,200 18,800 21,900
Physical scientists 48,500 57,500 60,200 19Men .416,,600° 54,600 57,000 .19Women,' 1,900 2,900 3,100
700 23,000 25,000 22,000 27,100 27,200300- 22,300 24,200 20,700 25,300 25,40030b 600 800 1,300 1,800 1,800
Iiitheinatic41 scientists 12,100 14,600 15,300 900 1,300 .1,400 10,500 12,200 12,600.Nezi 11,400 13,500 14, ZOO 800 1,200 1,400 9,700 11,300 11,700Women 800 1,000 1,100 42) 100 100 700 900 1,000
Computer specialists° Men
Wonntn
Federalgovernment ° ; Other 1
1973 1977 1979 1973 1977
18,20017,200 ;,
21,40020,100
23,90022,300
0400 28,3430,16,900 v23p800
1,000 1,300 1,600 2,500 4,500
4,100 3,900 4,600 2,700' 3,4004,000 3,700 4,400 2,600 -3,200°'
100 ZOO 200. 100 300
500 00 800 300 500500 60 aq 300 400
(2) (2) (2) (Z) s (2)
1979
33,00027,800
5,300
3;3003,000
300
400400100
2,700 5,800 6,700 1,000 3,100 3,700 1,400 2,100 2,500 10'0 300 3'' ZOO 300 300.2,600 5,500 6,400 1,000 -3,000 3,500 1,300 2,000 2,300 100 ZOO ..399 ZOO 300 300
100 ZOO 400 (2) 100 ZOO (2) 100 100 (2)' (2) (2) 2) (2) (2)
Environmental . , -,..
scientists 10,300 13,000 14,600 2,206 3,100 4,200 5,200 6,300 6;200Men 10910.0 12,600 14,000 2,200 3,000 4,100 5,000 1,000 5,900Women 300 400 600 / (2) 100 100 ZOO 300 300
r. Engineers 35,800 45,000 50,200. 17,800 229-900 26,400 169000 15,900 17,000- .
Men 35,600 44;800 49,700 17,700 ,22,800 269A00 13,000 15,800 ;16,900Women 100 300 500 100 100 100 100 100 i ZOO
. Life scientists 58,000 71,900 80,100 4,zoo 10,100 11,500 3g9200 479.500 529200A0° Men 51,900 63,000 68'9900 6,9,00 9,500 10,600 34,700 40,900 44,100
Women 6,100 9,000 11,100 300 600 900 4,600' 6,600 8,100
Psychologists 24,900. 33,700 38,000 -3,100 0 5,500 7,100 15,10% 18,600 '19,900Men . 20910.0 26,100 28,800 2,600 4,400 5,300 12,200 149400 15,200
, Women 4,800 7,600 9,200 500 1,200 1,800 29900 4,200 4,800
Srial scientists 28,100 42,700 48,600 1,600 2,600 3,500 23,000 33,406 36,300Men 259200 36,800 41,400°. 1,500 . 29300 3,000 20,,600 28,700 30,700Women 2,900 6,000 79200 100 ZOO 400 '2;400 4,800 5,500
2.,0001,900
: (2) ,
. Z,4002,400
100
2,7002,600
pc)
.1,000900
(2)
1,2009200
)
' 29700 3,500 3,600 2;300 2970700 3,500 0,500 2,300 2,700) (2) (2) .(Z) (2)
6,100 6,800 7,500 '5,500 7,6005,600 6,200," 6,800 4,700 6,400
500 600 700 700 1,300
1,200 1,200 1,100 5,400 8,4001,000 1,100 900 4,200 6,300
ZOO lop ZOO 1,300 2,100
1,500 2,600 3,300 2;000. 4,1001,300 2,400 zoo 1,800 _3,400
00 200",,e- 400 * Op 700
- ) ''Includes hospitals and clinics; nonprofit organizations; military; State government; other government; and "No reiort." : -?Too few cases to estimate., . 1
Note: Detail may n -...t add to totals because of rounding. ,--
Source:' National Sci nce Foundation, Characteristics of Doctoral Scientists and Engineers in the United States (biennial series, 1977-7 ).V
1
1,509
1,40100
ZOO ,
'100(2) 'I.-
8,47,501,400
.9,9007,4002,500
"i96004;700
- 900
112
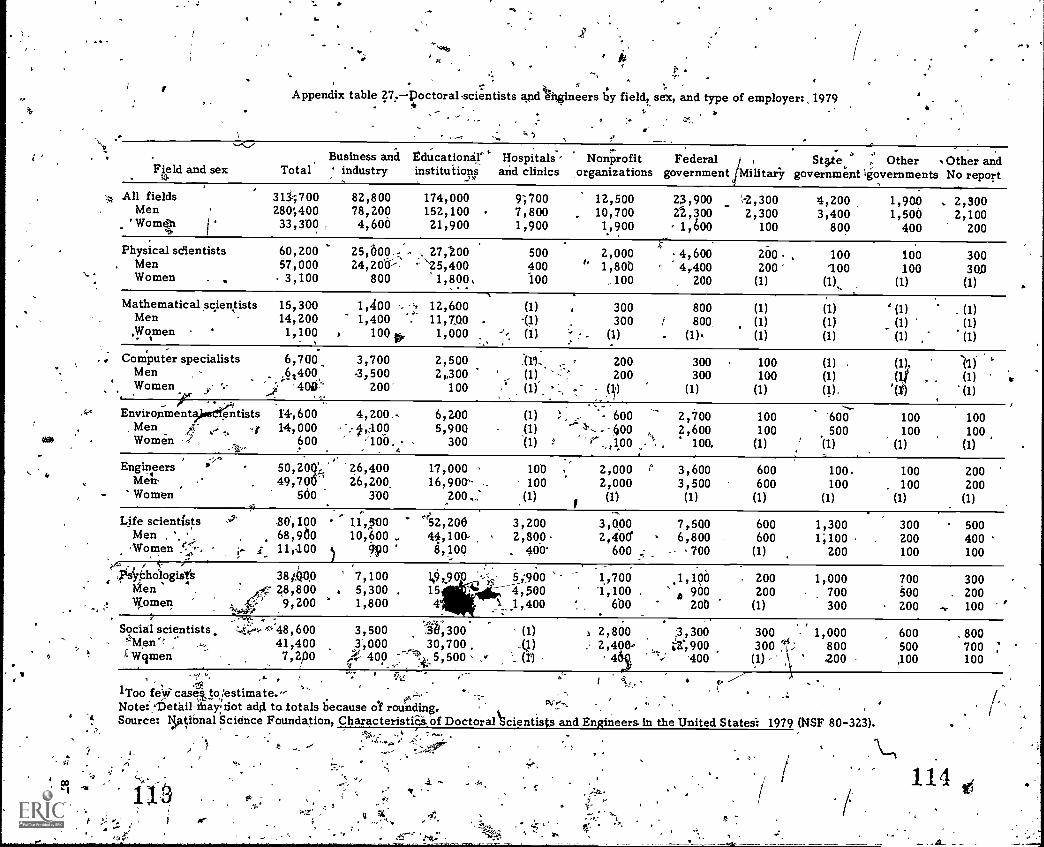
i
.Appendix table 27,-Poctoralscientists aTulth,gineers by field, sex, and type of employer: ,1979
a ) Ar'
0
so)
Field and sexBusiness and Educational."' Hospitals Nonprofit Federal St9..te ,. Other Other and-Total ' industry institutions and clinics organizations government jMilitary government ;governments No report
All fieldsMen
'Wome
313;700280;40033,3D0 ,
82,80078,2004,600
174,000152,10021,900
9;7007,8001,900
12,50010,7001,900
23,90022,300 2,300
1,600 100
4,200 1,9003,400 1,500
800 400
2,3002,100
200
Physical scientists, Men
Women
60,200 25,600..: - . 27,20057,000 24,200 '"25,4003,100 800 1,800,
, . .
500400100
2,0001,80b
_100
4,6004,400
200
280 100200 100(1) (1),
Mathematical scientistsMen,Women
15,300 1,400 12,600 (1)14,200 1,400 11,7Q0 - 11)1,100 100 o, 1,000
300300
(1)
800/ 800,. (1)%
(1)(1)(1)
(1)
(1)(1)
100 300100 30,0
(1) (1)
(1) . (1)(1) (1)(1) , (1)
-. , Computer specialists
MenWomen 3;
6,7006 400
40B'
3,700 2,500.3,500 2,300
200 100
200200
(111
300 100 (1) . (1). 11) '300 100 (1) ( (1) a
(1) (1) (1). '( ) (1)
Environment" fistsMen 'rWomen 4 ,
14,60014,000
600
4,200.----$,,10,0
'100. -4
6,200 (1) - 600 2,7005,900 (1) -'600 2,600
300 (1) ,100 100.
100100
(1)
'600500
' (1)
100100 100
(1) (1)
EngineersMA,Women
50,200',' 26,400, 49,700 26,200.
500 3'00
17,00016,900-
200.;
2,000 r2,000
(1)
3,6003,500
(1)
600600
(1)
100100
(1)
100 200. 100 200
(1) (1)
Life scientistsMen ,
'Women r.
zrs'yhologists 3400,0 7,100Men .4" 28,800 5,300Women 9,200 1,800
SO, 100 '''''52,200 3,20068,980 10,600 44,100- 2,80011,00 ) ,790 8,100 400'
1 e
3,000 7,5002,400 6,800
600 -- 700
600600
(1)
1,3001;100
200
300 500200 400100 100
Social scientists,q/en`fWqmen
;4,48,600 3,500 'lb.0 :300 (1)41,400 1400 30,700, _1)7,200 cfI5 400 5,500 (1)
5'900 1,700 .1,1904 500 "1,100 . * 900
1,400 600 200
o
1Too fenicasekto:estimate.-*Notel,Detail diardot add to totals because of rounding.Source: IsjatiOnal Science Foundation, Characteristics of Doctoral
o."
2,8002,400-
4135
I
;2;900'400
200200
(1)
1,000700300
300 1,000300 ',I; 800
(1) ' ZOO
..
=
dentists and Engineers in the United States:
r'
700 300500 . 200200 100
600500,100
. 800700100
1979 (NSF 80-323).
114,

tt*A 4.
Appendix table 28.-Doctoral scientists and engineers by field, race, and type of employer:1973, 1977, and 1979
1
TotalBusiness and Educqtional Federal
indhstry institutions , government Other 1
1973 1977 1979 1973 1977 1979 1973 1977 1979 1973 1977 1979 1973 1977 1979
All fieldsWhiteBlackAsianOther2
220,400 284,300200,900 253,600
2,100 2,8009,100 15,3008,300 12,600
313,701)276,900. 3,40021,00012,400
53,40048,800
3002,7001,5p0
71,50062,609
4005,8002,600
82,80070,800
4008,13002,800
129,400117,400
1,4005,2005,500
163,100146,200
1,8007,4007,800
174,000154,600
2,2009,9007,300
18,20017,400
200500500
21,40019,400
300800900
23,900 19,40021,800 _17,700
400 2001,000 800
800 800
28,30025,300
3001,3001,400
33,00029,600
5001,400"1,500
Physical scientistsWhiteBlackAsianOther ;
48;500 57,50044,000 51,300, 500 600.2,100 3,2001,900 2,400
60,20053,100
,-- 5004,3002,200
19,70018,100
.. ZOO700500
23,00020,700`
ZGO
1,300700
25,00022100
2002,100
700'
22,00019,500
3001,1001,100
27,10024,100
3001,400
-1,300
27,20D24,000
ZOO
1,8001,100
4,1003,800
100100100
3,9003,600
1.00' ' 200100 ,
4,600' 2,7004,109 2,400
100 (3)300 200100 100
.3,4003,000(3)
300200
3,3002,909(3)
200ZOO
Mathefmatical scientistsWhiteBlackAsianOther
li,100 14,60011;000 12;900
100 '1005100 700500 800
4-
15,30013,290
200900
1,000
900800
F3)(3)(3) ,
1,3601,200(3)
100(3) ..
1,400.1,34
(3)100100
10,5009,400
100500
/ 500
12,20010,800
100600
x700
12,60010,800
100900800
500500
.. (3)(3)(3)
600500
(3)(3)(3)
800 300,700 '300
(3) (3)(3) (3)
100 (3)
500400' (3)
(3)(3)
400400
(3)(3)(3)
Computer specialistsWhite -Black .Asian
'Other
2,700 5,$002,500, 5,000(3) (3)
100 600100 200
.6,7006,000(3)
500300
.1',900
900(3)(3)
13)
3,1002,600
(3)400100
3,7003,200
(3)300200
1,401,300(3)(3)
100
2,1001,800(3)
202100
2,500 `
,. 2,100(3)i400 t
/ 100
10010Q
e(3)(I)(3)
300200
(3)(3)(3)
300 200.300 200
, (3) (3)(3) (3)(3) (3).
300300
(3)(3)(3)
300300
(3)(3) \
. (3)
Environmentalscientists
WhiteBlackAsianOther
10,300 13,0009,700 12,100(3) (3)
300 500400 400
14,60013,600
100500500
2,2002,100
(3)100101).
3,1002,800
(3)200100
4,2003,900
100200
. 200
5,2004,900(3)' 100
200
6,3905,900(3)
ZOO
200
6,2005,800(3)
200200
2,0001,800
, (3)(3)
100
2,4110'2,200
'(3)100100.
2,700 1,0002,600 900(3) (3)
..f .100 (3)(3), (3)
1,2001,200(3)(3)(3) `'
1,5001,300(3)(3) ,
100
*Engineers
WhiteBlack
OtherOtherI
35 800 45,0003 '800, 38,300
2,700 4,800100,
1,100 1,70
50,29941,000,
ZOO,7,5001,500
17,80015,800
(3),1,500
400
22,90019,100
(3)3,000
700
_,140020500
(3)5,200
700
13,,0001,1,500/ 100
1,000500
15,90013,800
1001 300,
800
'17,00014,700- Lpo1,600'
600
2,1,Q02,500(3)
- 1001.00
3 ;5_3,100 ,
(3)200ZOV
3;600 2,3003,200, 2,000
(3) (3)300. 100100 100.
t,700 '2,400 I
(3) A300
'1\100
3,2002;700
(3)300-,.'-
1904
Life scientistsWhite °BlackAsianOther.
58,000 71,90053,100 64,500
700 8b02,309 3,8002,000 2,900
80,10071,500
9004,9002,800
7,2006,700
100300
- 200
10,1008,900
100700400
11,50010,300
(3)800400
. 39,200"35,800",' 500
1,5001,400
47,50042,700
5002,3001,9911
$2,20046,300. 600 e3,4001,900
6;1005,700
100200
. 200
6,8006,200
100,200200
7,500° '5,5006,900 4,900
100 100200 300200 100
7,6006,700
100500400
8,900'8,000
100500300
PsychologistsWhiteBlac.kAsianOther e'
24,900 33,70023,200 31,100
300 500200 300
, ,1,1110 1,900'',:-P
38,00035,100
600490
1,900
3,1002,800
(3)(3)
200
5,5005,100
13)(3)
400
7,100-6,500
'100'1009500.
15,10014,100
. 200100700
18,60017;100
400.200
1,0'00
19,90018,500
400200
' 800
1,2001,200.(3)
(3)(3)
1,260',1,100
(3)(3)
100
1,100 5,4001,0001 5,100(3) (3)(3) ° , 100
100 304. -
8,4007,800
100100500,
9,9009,100
200100500
Social scientistsWhite .
BlackAsk=Other
/8,a 100 .42,700425,7'00 38,5005., 400 600'i1,000 1,400
1,100 2,300
48,60043,400
1,0002,0002,200
1,6001,500
(3)(3)
100
2,6002,300
(3)100100
3,500 .
3,200(3)
100140
.23,00021,000
300800
1,000
33',40030,100
5001,1001,700
36,30632,400 4
7001,7001,500.
1,5001,400'13)(3)(3)
2,600,2,400
(3) '100
100.
3,300 2,0003,000 1,900
100 ((3)(3) 100200. 100
.4,1003,600
100`leo
300
5,600'4,900
100200400
* . t ,.;.;,Includes hospitals and clinics; nonprofit ortanizations; military; State government;.other governraen'ts; and "No
'2Includes American Indians and "No report." . f
,3Too felt cases to estimate, 1.1 5 f' t
Note: 'Detail May not add to totals because of rouliding. 4
Source: NatiorAl Science Foundation, Characteristics of DoctoralScIentistit and Engineers in the United States (biennial series,.1977079).
i -,
'

I
'44Appendix table 29,-Uoctoral scient
- ,/f Field'and race
All fields'WhiteBlackAsian .OtherZ
e.field, race, aid type of employer: 1979,tx pi
.iitiainess and EdticationalTotal' industry institutions
313,700. .,-82,800276,900" - 70,800
3,400' 40021,000 8,800
- 12,400 2,800
Physical scientists 691200-White 53;100-Black 00Asian 4,300Other .s, 2,200
k.
Mathematical scientistsWhiteBlackAsianOthef
t.
15,30013,200
200900
1,000
Federal State 0.ther Other andtiona, evernm*,,i Military government governments No report .
174,000 . 9,.54,600 8,- 2,200 20
9,900 ' 3007,3(10 -400
;p00st zoo
5001
23,900 2,309 4,200%21400 2,200 .3,800
400 (1) . (11,1,000 (200
800 00 100
1,9001,700
100100200
2,3001,900
100,200200
25,00022,1410
2002,100
700
1,4001,300(1)
100° 100
27,200, /14,400
2001,800.1,300
12,60010,800
100900800
4,6001,809 4,100
(1), 100100 300100 100
300300
(1)(1)
.(1)A
800700
(1)(1)
100
(1) (1)(1) (1)(1) . (1)(1) 0 (1)
(1)(1)(1)(1)(1).
Computer specialistWhiteBlackAsi4nOther
6,700, 6,009
(1)500300
3,7003,200(1)
300
2,500 (1)2,200 / (1)(1) (1)
100 (1)100' (1)
201200
4(1) ;(It(1)
300 - 100300 100
(1) (1)(1) (1)
(1)
(1) , (1) (1)(1) (1) (1)(1) (1) (1)
A' (1) (1) (1)(1) . (1) c1)
Environmental sbientists 14,600White' 13,600Black 400Asian---.. ,500Othei . , 500
EngineersWhite.Black
4 Asian'Other
4,2003,900
100200200
50, WON.. 26,40041,000'1. 29,500
200-'-) (1)7,500 6.2001,500 700
6,200-5,800
(1)200200
17;00014;700
10Q1,600
600
. 60(tt , 2,700 100,... 600 4,600 100
(1), (1)..,-, (3)
or 100 (1)9 (1) gi (1) ( 1 )
2,000 3,600 600r /,700' -34
..200 600 ,
(1) . (1) (1)200 , 300 (1)
(1) ' l00c 100
600 100500,, 100
(1) (1)(1) (1)(1) (1)
100100
(1)100
(1)
100(1)(1)(1)(1)
100 200100 200
(1) (1) :-(1) 100(1) (1)
Life scientists,WhiteBlackAsian,Otter
80,10071,500
9004,9002,800
1,50010,300
(1)- 800
400
52.20046,300
6003,4001,900
3,2002,800
(1)300100_
3,000,700
"(1)200100
7,5006;904..100
20020
700 1,*300600 * 1,200
(1) (1)(1)' 100(1) $ (1)
300'200
(1)(1)(1)
500600
(1)(I) `"""100
PsiEhologistsWhite
Asia.%Other
38,00035,100
600. 4001,900
7,1006,500
100100500
19,90018,500
400200800
5,9005,500
100(1)300
1,70Q 1, 01,600 14'00(1)(1)
100 .100
Social scientistsWhiteBlackAsianOther
48,600 3,50043,400 3,200
1,000 " (1).47000 1002,200 '100
36,30032,400
700.1,7001,5,00
(1)(1)(1)(11(1)
2,8, 3,3007 00 " 3,000100 , 100
(1) \11)209 200
200 l',000200 1,0001) (1)
(1) -(1)(1) (1)
300 /-1,000,300 900
(1) (1)(1) (1)(1) _ (1)
700600
(100
600' 800600 600
(1) (1)(1) (1)
100 ( 100
.4'Two few cases to estimate.zlncludes American Indians and No Report."Note: Detail,may not add to totals because of rounding. s
Source: National Science Foundation, Characteristics of Doctoral Scientists and Engineerings in the United States: 1979 (NSF 80-323),
116.
ow.

s'4.
.0
4
( Q e*''.t. ..A, S,.
..I
.., * +Appendix table 30.-Experiehcedl scientists and engineers by field, race, and type of employer: 1978.
.. - .2
, Business and Edugational Hospitals Nonprofit Federal State Other Other andField and race Total industry institutions and clinics organizations government Military government goveinrnient No ,regort.
All fields 880,600 557,200 127,400 ` 8 00 17,900 89,800 2,800 28,200 30,500 18,400White ' 846,600 '240,00 121,000 6 7 900 ,16,900 85,000 2,800 2-7,000 27,900 17,700Black ..., 9,300 -3,100 1,900 00 ! 200 2,200 (2) 100 1,100 300,Asipn 20,300 11/100 3,600 0 600 +2,300 1 100 100 1,200 300°the:1 4)900- 3,000... 800 ' (2) 300 300 (2) 200 . 300 (2)
. .
Physical scientists 100,200 55,400 24,600 . 900 3,300 10,100 . 200 1,300 2,400 1700White 93,900 ,52,600 23,300 . 800 '2,900 Atom 200 1,300 s, ZOO 1,600Black 1,700 o 600 200 : 100 ' 100 ' 400 ' "(2). (2) 300 (2)
Asian 3,900 1,800 1,000 12) . 300 700 , (7,) (2) ' 100 , (2)
Other ' 700 500 100 (2) . 100 ' . (2) . (2) (2.) (2) (2)
-Mathematicalscientists 22,900 6,600 10,600 ,- (2) 700
,,300 ....- 100 600 700 300
White ' 21,200 ' 6,400 9,900 . ' (2) 600 3,000 ' '''' 100 - 500 400 ' 300Blackt . , , 800 (2) 300, (2) (2) , 200 Az) ' (1) 200 (2)Asian 600 200 - 400 . ' (2) .(2) (Z)" .(2)', - (2) (2) (2)Other 200 (2) '100 '; (2) (2) (2) (2) . 100 (z). (z)
Cgmputer specialist% !44,'/00 33,500, 3,500 400 ''' 1,100 3,200 200 800 1,300 700White . 43,400 32,700 ; 3,400 ' - 4b0 , 1,100 2;900 200 800 1,300 700Black . 500 eoo (2) (2) (2) . 200 (2) 2) (2) (2)
Asian 700 £00 (2) (2) (2) . 100 (2) (1) (2) (2) .Other ', . loo 100 (1) (2)
. :' , (2) (2) (2) / . (2).' (2)
Environmental scientists 23,300 12,000 4,300 ". (II) 400 '4;400 NI 100 ` 800 1,000 400White 23,200 11,800 4,200 , (2); '. 400 4,300 . 100 800 1,000 400Black WI (2) (2) (2) (2) ' (2) ' (2) (1) (2) / (2)
x*** Asian_ 200 100 100. (2) .' (2) (2) (2) (2) (2) (2)
Other - 100 100 (2) (2);,( t2) . (2) (2) (2) . (2) (2).. .
EngineersWhiteBlackAsianOther -
560,800 421,400 25,500 80q;*+, 8,10, 'sS1,106 2000 17,9'00' 201700 13,200540,600 408,700 ', 24,000 700 7,800 48,500 1,900 17,000 19,200 ,12,800
4,000 2,100 '+, 300 (2)+
(2) *00 (2) (2) 400 zoo"13,000 8,300 1, ho , .100 200 '1:1300 100 , 900 ,/ 1,000 200
\ , 3,100 2,300 200 '.12). I00 200 (2) (2) 200 . (2)
, s
Life scientists 1 "- 61,800White. ... 58;900Black 1
`.. 1,100Asian 1,300Other 500
14,600 26,800 1;000 1,300 11,764 200 \-4,100 1,400 80014,200 25,2Q2, 900 4,100 I" 11,2002 200 4,000 1,300. 800
(2) 60'2.4. 100 100 ,o 200' (2) 100 (2) (2)
200 , 700 . (2) 100 100 l',.. 12) (2) , (2) (2)
4-lbb 300 t' "` (2) (2) ''''' 100 2) (2) ./ (2)- i (2) .
Psychologists 29,100 5,700 4,600 1,300 Ao lob 1,100 . 800 Soo
White , 28,500* 5,700 14;000 4,500 1,200 700. 100 1,400 700 500-Black 500 (2) 200 100 (2) 100 (2) (2) 100 2)Asian (z)' (z) (z) (z)4' (z) (2) . (z) (2) (2)
Other -(z) 100. (z) (z) . (z) .(z) (z) (z)
Social scientists 2. 1°37,500 8,000 ,/ 17,7004 60e , /1,800 5,200 (2) 1'1700. 1,900 600,
White 36,300 ' .7,800 17,000 ' -Cob '. 1,200 4: 5,100 .(2) `1.', 600 1,700 600Black , , 600 100 ,. 30.0 :-.4,42) . (2) (2) v, (2) (2), 100 4, (2)Asian 500 (2) 400 (2).7 ..,,, (z) , 100 (z) (z) (z) (z)Other jpo (2) -(2) (2) (2) (1) (2) . 1004- (2) (2)
e- '''' .1Those scientists and engineers in the labor2force at the timeof The 1970/Cetsus of PopulatiPC.Woo few cases to estimate. r . I... c
1.-1_ 1 7114 3IncludesAmirican Indians and "ptheli .4iew,, t l'..,
Note: Detail'may not add td totals becaue of o . .,--Source: National Science Foundation, Characteristics of ExperieneecrSvientists and Engineers: 1978 (NSF 79-322).
. ...
71
q .; ;+, c, A
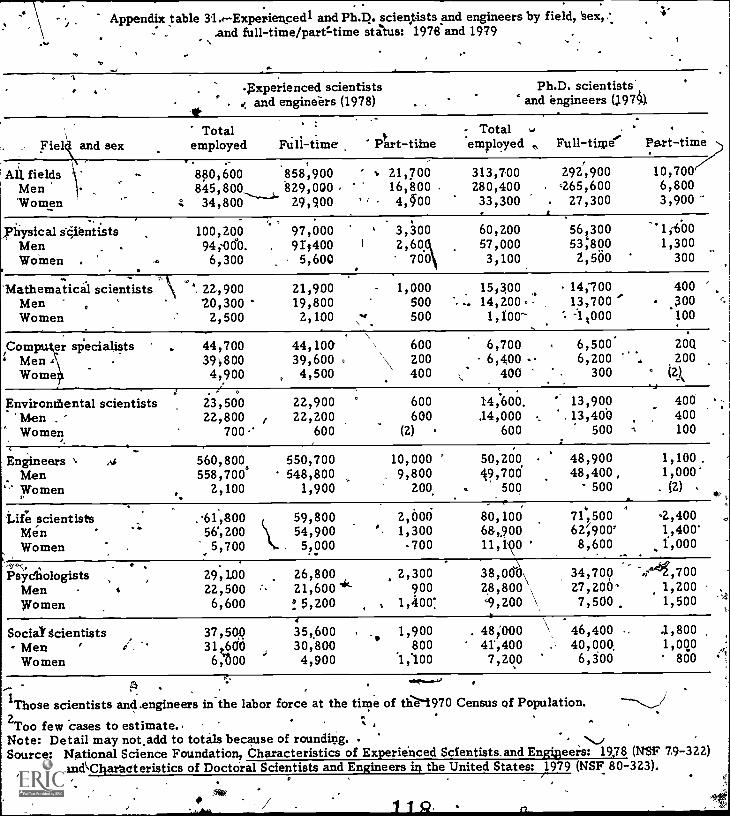
Appendix table 31.e-Experiekcedl and Ph.D. scientists and engineers by field,And full-time/partf-time status: 1978 and 1979
. Experienced scientists. f and engineers (1978)
Ph.D. scientists'and engineers (19741
Field and sex employedTotal :
Ftili-time t. .Part-tilne. Totalemployed , Full-time" Part-time)
All fields \ ...
MenWomen .-
V
::
..880,600 858,900845,800,_ 829,00034,800 29,900
%
"21,70016,8004,4500
313,700280,40033,300 .
/26925,690000
27,300
10,7006,800
physical scientistsMenWomen . ...
.100,200 97,00094,-0060. . 911400
6,300 , 5,600
'1
3,300
760
60,20057,0003,100
.
56,30053;800
2,560
'46'9:001,300
300
'Mathematical scientistsMenWomen
22,900 21,90020,300 ' 19,800
2,500 2,100
-
v1,000
500500
15;30014,200 13,700
1,100-
14;700
:1;000
400.300
100
,Com er specialistsMen AWome
44,700 44,10039,800 39,6004,900 4,500
=
\600\ 200400
6,7006,400
400
6,500"6,200
300
20Q200
°
Environthental scientists'MenWomen
, .23,500 22,90022,800 22,200
700 600
600600
(2)
14,600,.14,000
600..
'" 13,900.13,400
500
400400100
Engineers ,4MenWomen,
560,800 550,700558,7006 548,800
2,100 1,900
10,0009,800
200, v
50,20019,700
500
48,90048,400,
500
1,1001,000'
. (2)
'Life scientistsMenWomen
.61,800 59,80056,200 54,900
', 5,700 . 5,000
.
' 2,0001,300-700
.80,10068,,.90011,100
1
71,50062;900'8,600
2,4001,400'
.. 1 000,
.Psychologists
Men 4
Women
29,1.00 26,80022,500 21,6006,600 f 5,200 ,
2,300900
1,400:
38,00\28,800 ,x9, 200 \
34,70027,200'7,500
.,4,7001,2001,500
SociatacientistsMen 'Women
37,500 35,600311.660 30,8006,'00 4,900
1,900. .8001,100
. 48100041',400
7,200.
46,400 -40,000
6,300
.1,8001,000
800,z..A ....e.---, .
1Those scientists and .engineers in the labor force at the time of the 39701970 Census of Population. ---,.,/2Too few cases to estimate.. . : , .Note: Detail may not,add to totals because of rounding. . ' ..,Source: National Science Foundation, Characteristics of Experienced Sclentists.and Engineers: 19,78 (NSF 7.9 -322)/ an&Charteteristics of Doctoral Scientists and Engineers in the United States: 1979 (NSF 80-323).
. .
1 1 Q.

N
Appendix table 32.1-Experiericedl and Ph.D. scientists and engineers by field, race,and full.-time-/patime status: 1978 and 1979
*
.-
4.0
11.
-
Experienced scientistsand engineers (1978)
' Ph.D. scientistsand engineers (1979) j
Field and racef ..
Totalemployed
s
Pull-time..
Part-timeTotalemployed Full-time
.
Part time
4111 fidldsWhiteBla'ck-Asian .Other2 1
4
.
880,i100846,000
9,300: 20,300
4,900
-858,900825,100
- 9,10019,800*-4!
4,800 , .
21,70020,900
200500100
.313,700/276,25o
3,400' 21,00012,400
292,900258,400
3,20019,60011,600
10,7009,800
2003040 ,400
Physical scientistsWhite- aBlack ,- - .
Asian -Other ..
3100,20093p900 ,
1,7003,900
. 700'
-
:97,00090,800.
1,7003,700 ,
700
3,300. 3,100
(3)200
(31
60,20053,100
5004,3002,200
56;300494900'
5003,9002,J00
.:,
1,600. 1,500
(3) %,.,(3)'
. 100
Mathematical scientists
BlackAsianOther
22,900
800.- 600'
200
21,90020,400
:700600100
1,000, 900 -
100(3)(3) 4'
15,30013,200
200900%900
00
200 .900 '900
'
.
, 40040/0
(3) 4°--(3)(3) .
Computer specialistsWhiteBlackAsianOther .
44,70043,400'
500700100
44,0042,900
500. 700
.100
\ 60040
600(3) '(3)
(3)
, 6,700*6,000(3)
500300
6,6005,700(3)
500300
. -200200
(3) ). (3)
(3)
Environmental scientists'WhiteBlackAsian .Other
23,50023,200
(3), 200.100,
e
22,90022,00
(3)zoo100
. 60Cr600
(3)100
(3)
14,60013,600
100. 500
. 500
13,90012,900
100400
'' 500
400400 .
(3)(3)
. (3).
EngineersWhite ! .
BlackAsian .Other .
560,800540,600
a '4,00013,000
v 3,100 .
550,700_530,700
4,00013,0003,100 . :
10,000410,000
_ (3)(3)(?)
./-
54,20041,000
.2007,5001,500
48,90039,880
1007,4001,500
1,1001,000
(3) .(3) '(3) 1
Life scientistsWhiteBlack .Asian.Other
61,80058,900
1,200..1,300
500
59,80057,100
1,1001,100
500 a ,
2,0001,800(3)
. 100100
80,100 .71,500,, 9004,9002,800
.
71,50063,800
900'4,2002,600 ...
2,4002,200
(3)100100*
PsyChologistsWhiteBlack
t AsianOther
'29,.10028,500
500(3)
100
26,80026,300
500(3)
100
2,3002,300(3)(3)
(3)
/ 38,00035,100
600 ,
400..1,900
34,70032,100
600400
1,700
2,702,500
(3)4g.(3)
100
Social scientistsWhite ..
BlackAsianOther
_37,50936 300
600500100
35,60034,400
600400
' 100
1,9001,800(3)
10013).
. 48',600,43,400
:3 1 , 0002,000
. 2,200
46,400, 41,500,
9001,9002,100 ;
1,8001,600
100(3)
100
1 Those cientists and.engineers in the labor force at the time of the 1970 Census of Populition.2Includes American Indians and "Otherntifor experienced /E's; American Indian and "N,o_re7 .'t" for Ph.Ds.
3Too few cases to estimate.Note: petail may not add to totals because of rounding.Source? National Science Foundation, Characteristics of Experienced Scientists and Engineers: ,19723-(NSF 79 -32'Z)
and Characteristics of Doctoral Scientists and Engineers in the United States: 1979 (NSF; 80-323).

Appendix table 33.-Employed scientists and engineers by field, sex, and age: 1978
24 andField and sex Total under 25-29 35-39 40-44 45-49 50-54 55-59 60-64
70 and65-69 over
All fields 2,473,200 195,100Men 2,241,700 133,1300
. Women 231,500 61,300
421,30,0 387,700361,200 349.,00060,100 38,700'
347,500323,50024,00"
285,300270,60014,700
267,600255,300
12,300
248,400239,700
8,700
181,800 86,200175,000" 83,600
6,800 2,600
34, %0033,1004,70,0
17,50016,900
600
Physiealscientists 212,400 13,500Men 197,400 10,100W,om en° 15,000 3,400
31,100 24,40027,900 22,1003,200 2,300
32,80030,6002,200
29,400, 28,200
1,20
26,70025 3001,400
22,40021,700
300
17,400 :10,00017,100 9,900
300 100
2,8002,-600
200
'1,9001,900
(1)
Mathematical scientists 88,400 6,400Men , ' 70,900 3,900Women 17,500 2,500
11,200 21,500'7,400 18,0003,800 3,500
15,50013,0002,500
11,9009,7002,200
8,3007,1001,200
7,0005,7001,300
1,300, 2,3003,100 2,200
200 100
800700100
200100100
Computer specialists . 233,900`' 28,700Men 193,400 .16,400Women' °. 40,600, .12,300
59,800 48,00046,000 41;50013,800 '6,500
43140039,2004,200
22,20020,8001,400
17,50016,3001,200
8*,500'7,800
700
4,300 1,4004,000 1,300
300 100
200100100
(1)(1)(1)
Eniironinental scientists' ,72;300 '7,800'64.,600 4,400
Women 7,700 3,500
20,300 _ 6,90017;700 , 5,9002,600 1,000
6,100. 6,000
100
7,1007,100(1)
8,000. 7,900
100
6;5006,409
100
5,500 2,8005,200_, 2,700
300 (1)
1,1001,100.(1)
200200
(1)-e .Engineers 1,268,400 : 64,6Q0
Men - 1" , 1,248,500 58,400_Women 19,800 6,200
193,500 181,90185,200 178;7
8,300 3 00
165,100164,200
900
4k1,9064PE,500
400
149,800149,700
100
160,400160,000
400
112,300 52,700112,100 52,600
200 ' 100
22,80022,800
(1)
12,40012,300
100
Lifd scientists 1' 291,000 /. 27,400. Men r 227;800 13,900Women 63?200 13,500
61,900 53,60045,900 42,600
'16,000 111000
'1'39,200"2,9006,300
30,300-25,700 ,
,60026,80023,400 .
3,400
20,50018,0002,500
18,900 8,86015,200 7,7003,700' 1,100
2,7001,900'"
800
00500200
Psycliologists 120,900 22,400Men 89,700 13,300Women 31,200 9,000
, 16,300 24,70012,300 .18,100.4,100 6,6'00
18,000
13,8004,200
9,9008;0001,900
11;8008,90D2,900
8,7_007,5001,200
5,700 2,4005,000 2-,000700
700 400
800..
100
20010010
Social scientists , 186,000 24,300- Men 149,500 13,400,Women 36,5000i. '10,900
...
27,200 26,70018,900 22,100-
' 8,300,- 4,60(4
'27,40023,8003,600
.-21,60018,6003,000
18,70016,7002;000
14,40012,6001,800
14,400 5,80013;300 5,100
1,100 700
3,6003,200
400
1,9001,800
100,
Too \fewcases to estimate. -
as, .
Hoy:- Detail may not add, to totals because of rounding. .'''Source: National Science Foundition,,U.S. Scientists and Engineers: 1978 (NSF 80-304).
1,21

G.
Appendix table 34.-Employed doctoral scientists=and engineers by field, race, and age: 1979
Field and race
All fields. White
BlackAsianOther3
physical scieOistsWhiteBlackAsianOther
Mathematical scientistsWhiteBlackAsianOther
Computer specialistsWhiteBlackAsian -Other
Environmental scientistsWhiteBlackAsianOther
*'EngineersWhiteBlackAsianOther
Life scientistsWhiteBlackAsianOther
PsychokigistsWhite'.Black
ianOther
Social scientistsWhiteBlackAsianOther
0-.
Total 25-29 30-34 35-39 40-44 45-49 r4,564 55c59 60-64 65-6970 andover 1
313,700 7,500 5'.2,700-75;700 - 5f,300 39,900 33,100 26,500 15,400 6,500 2,000.27,6,900 6,700 46,000 67,100 46,200 35,100 29,-700 24,300 14,000 6,200 1,600
3,400 100 700 900 600 ,400 300 300 100 (2) (2)
21,000 500 4,700 5,000 4,900 2,700 1,700 ti 1,000 400- 100 100
'12,400 200 1,300 2,900 2,600 1,600 1,500 1,000 -500 200 300 .
60,200 1,500 9,600 13,700 10,900 7,700 6,500 4,900 3,700 1,400 300
53,100 1,400 8,200 12,000 9,100' 6,900 6,100 4,400 3,500 1,300 200
500 (2) 100 200 100 100 (2) (2) (21 (2) (2)-°
4,300 100 900 1,100 1,4141"0 500 200 300 (2) (2) (2)
1,200 (2) 300 500 ' 500. 200 200 ZOO 200 100 (2) .
15,300 500 2,400 - 4,400 2,800 2,000 1,106. 900 y 800 300 100
13,200 400 1,900' 3,900 2,400 1,600 1,000; 1 800 800 300 100
200 (2) ' (2) 100 (2) ', (2) (2) (2) (2) (2) (2)
' 900 100 1k4 300 100' ZOO ZOO (2) . . (2) (2) (2) (2)
900 (2) A 200 300 ZOO - 100 100 100 (2) (2) (2)
6,700 300 1,900 2,100 4,1,000 500 300 300 100 (2) (2)
, 6,000 200 1,600 2,100 ' 900 500 ' 300 200 100 (2) (2)
(2) (21 (2) '(2) , (2) (2) (2) (Z) (2) (2) (2)
500; 100 .200 log, (2). (2) (2) (2) (2) (2) (2)300 42) (2) 100' 100 (2) (2) 100 (2) (2) (2)
14,600 200 2,30(14 1,500 2,700 2;100 1,200' 1,300 500 400 ' 100\
13,600 200 2,100 '' '4 \3,Z00 2,500 2,200 1,100 1,300 500 300 100. 1
100 (2) 100 (2)(' (2) (2) (2) ' (2) (2) (2) (2)
500 (2) 100' 100 100 (2) (2) (2) (2) (2) (2)
500 (2) (2) 1002 100 100 100 (2) (2) , (2). i (2)..
50,200 1,000 7,300 12,300 10,900 6,800 5,400 4,200 1,600 700 200
41,000 700 5,100. 10,100 8,700 5,700 4,600 '3,900 - 1;300 600 100
200 (2) 100 100 (2) (2) (2) (2) (2) (2) (2)
7,500 Z00, 1,900 1,800 1,900 700 600 200 ZOO (2) 100
1,500 100 100 300 300 400 200 100 100 (2) (2)
80006 1,700 14,700 18,500 12,900 9,800 9,100 6,900 4,300 1,700 500
71,500 1,500 13,400 16,300 11,100 8,600 8,260 6,400 4,000 1,600 400900 (2) 100 2.Q.0 100 100' 100 100 (a) (2) . (2)
4,900 \ 100 900 1,200 ' 1,100 600 500 300 roo 1(2.) (2)
2,800 . 100 400 800 500 400 - 300 ZOO ZOO \(2) (2)
38,000 1,500 7,70 8,400 5,200 4,700 .4,200 3,300 1,700 700 50035,100 1,500 7,300 7,900 4,800 4,300 3,900 3,100 1,500 700 300
600 . (2) ZOO 100 100 , 100 (2) 100 (2) (2) (2)
100. 100 100 (2) 100 (2) (2) (Z) (2) \
1,900 (2) 100 300 300 300 300 200 200 (2) 106
48,600 ........eim 6,700 12,900 7,900 6,100.
5,200 4,500 1 2,700 1,400 40043,400 800 6,300- 11,600 6,600 5,400 44600 4,200 2,400 1,300 400
lApo (2)
"--(1)---' zoo 300 300 100 100 (2) 100 (2) (2)
2,000 , ZOO 400 400 po 300 ZOO (2) (2) (Z)
2,200 (2) . 100 600 1 600.
100 300.
100 ZOO (2) 100
4
lIncludes "No report."
2Too-few-cases to estimate.
3Includes American Indians and "No report."Note: .13,,etail inay not add to. totals because of rounding.Source: `National Science FiTulicIation, unpublished data.
A00444,
-122

.
A,
Appendix table 35.-Doctoral scientists and engineers by field,, sex, and age: .1979
,Field and sexs
Total
All fieldsMenWomen
332,300294,40037,900
Physical scientists 64,300Men 60,600Women
-.,3,700
Mathematical scientists 16,100'Men 14;300Women -1,300
Computer gecialists 6,800Men 6,400Women
.400
Environmental specialists 15,100Men 14,400Women 700
Engineers 51,500Men '51,000.Women 600
Life scientists 86,300Men 73,200Women . 13,100
-Psychologists'- 40,300Melt__ ' 30,1'00
'----W6men 10,200
social scientistsMenWomen
-
52,00043,8,00
.-8,100
1Includes "No report."
Too few cases to estimate.
25-29 30-34 35-.9 40-44 45-49 50-54 55-59 60-64.11; 70 and
65-69 over 1f
1,900 54,700 77,400 55,100 40,700 33,900 27,500 - 17,800 11,000 6,3006,300 45,400 69,200 50,000. 37,100 30,400. 25,000 16,100 9,800 5,000'1,600 9,300 8,200 5,100 3,600 3,500 2,500 1;700 1,-100 1,300\
1,600 9,800 14,000 11,000 1,900 .6,700 5,100 4,500 2,500 1,1001,40 9,000 13,200 10,400 ;7,600 6,400 4,900 4,300 2,400 900.I 200 00 800 600 300 400 200 200 100 100
500 2,500 4,500 2,800 2,000 1,100 1,000 900 500 300i 400. 2,200 4,200 : 2,600 , 1,900' 1,000 900 800 500 300
100 300.c-
300 ', 200 100 , 100 100 100 (2) (2)
; 300 1,900 2,300 1,000 . 500 300 300 . , 100 (2) (2)200 1,700 2,200 1,000 500 300 °300' 100 , (2) (2)
(2) 200 100 (2) (2) (2) () (2) (2) (2)441
200 2,400 3,500 2,800 2,400 1,200 1,300 600 500 200200 2,200 '3,400 2,700 2,300 ! 1,200 1,300 500 400 200
:(2) 200 100' 100. 100 (2) (2) (2) (2) (2) 6
1 ,000 7,500 12,400 11,000 6,800 5,400 4000 1,800 1,000 3001,000 7,300 12,200 10,900 6,800 5,400 4,300 1,700. 1,000 300,
(2), . 200 1010 100 (2) (2) (2) (2) (2)e .
1,900 15,400 19,100 13,200 10,000 9,400 7,200 5,000 3,200 2,0001;400 12,200- 16;200 11,500 8,900 8,100 -. 6,400 4,300 2,800 1;500
500 3,300 2,900 1,700 1,100 1,300 800 700 400 400,
1,600 8,200 8,500 5,400 4,800 4,300 3,500. 2,000 1,100, 9001,000* 5,600 6,600 4,000 3,700 3,500 2,700 1,600 700 00
'600 2,600 1 0 1,300 1,100 c. 800 800 - 400 A00 3004_
800 6,900 13,200 8,000 6,300 5,400 4,700 ' 3,000 2,100 -1,400600 5,100 11,200 6,90t ' 5,500 4,700 4,100 2,700 1 800. 1,100
-200 1,800 2;000 1,100 800 800 600 300 1300 300
* Note: Detail may not. add to totals becaus2 of iounding. . ... S Source: National Science Foundation, Charatteristics of Doctoral Scientists and Engineers 'in the United States: 1979` (NSF 80-323).
1
1,24 I

rt
Appendix table 36.Characteristics of Ph.D. scientists and engineers by Hispanic 'origin: 1979
Field Sex, race, and age
'All fields
Physical scientistsChemistsPhysicists /Astronomers
2,660
500300100
MenWomen
w7274.Black
2,209400
1,500(1)
Asian 100Mathematical scientists 100 Other 1,000
Mathematicians '100Statisticians (1) Total ( 2,600
25-29 100C-Olnputer specialists (1) 30-34 700
35-39 700Environmental scientists 100 4440-44 400
Earth scientists (1)' 45-49 300Oceanographers (11 50-54 20.0
Atmospheric scientists ( 1) 55-59 10060-64 .100
Engineers .300 65-69 (1)70 and over (1)
Life scientists 800 No'report (1)Biological scientists' 500
. Agricultural scientists 100Medical scientists , 200
Psychologists '.400
Social scientists 400Economists 100Sociologists/
Anthropologists , 100Other social scientists ' 200
'1 Too few cases to estimate.
Employment, status andyears professional experience
Type Of employer,primary work activity
Labor force
Total employed 2,500In S/E 2,100ChitsideE . 200Postdoctorates 200
Unemployeac seeking (1)
Outside labor force (1)
100400800400400'100200100
(1W)
100100
Total1 year and less2-4 years5-9 years10-14 years15-19 years20-24 years25-29 years,0-:34 years35-39 years40 or more years.No report
Business/industryEducational institutionsHospital and clinics ,
5061,400
Nonprofit organizations zooFederal governmeid 200Militarq ita)State government (1)Other "government (1)Other and no report' loo`
Research/developmentBasic research 500Applied research 300Development 100,
Management of 'R&D 300Managenieilt 200Teaching 800Consulting (1)Sales 200
and no report 100
Note: Detail may not add to totals because of rounding.Source: National Science Foundation, unpublished data.
1
<or
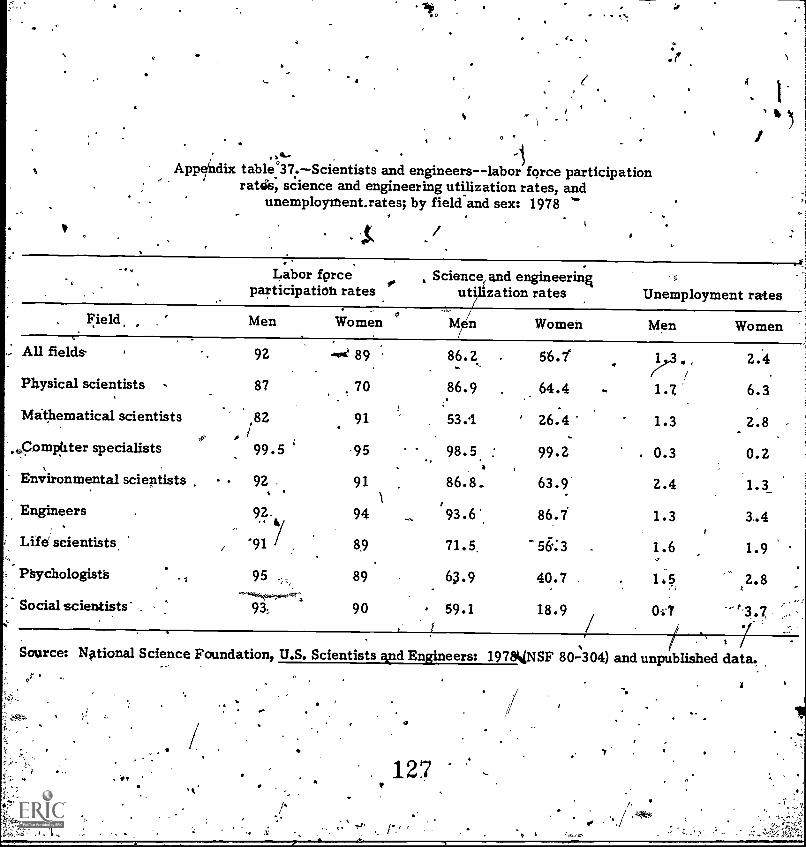
Appidix table°37.-Scientists and engineers--labor force participation. .ratie, science and engineering utilization rates, and
unemploymentrates; by field and sex: 1978
Labor forceparticipatioh rates
Science, and engineeringutilization rates Unemployment rates
Field Men Women Women Men Women,
..- All fields 92 4.04e 89 86.2 . / 2.4
Physical scientists s 87,
70 86.9 , 64.4 1.7 6.3
Mathematical scientists 82 91 . 53.1 26.4 1.3 2.8,f o i
'
.
',,Computer specialists 99.5 -95 98.5 : 99.2 . 0.3 0.2
Environmental scientists 92 , 91 86.8, 63.9 2.4 1.3.1
Engineers 9 94 , 193.6 86.7 1.3 3.4
Life' scientists, '91 / 89 71.5, 56:3 1.6 1.9.,. .
Paychologista .: 95 89 63.9 40.7 . 1.5 2.8
Social scientists' 93: 90 59.1 18.9 047
Source: National Science Foundation, U.S. Scientists and Engineers: 1978V,NSF 80-304) and unpublished data.
.
IC
127
.
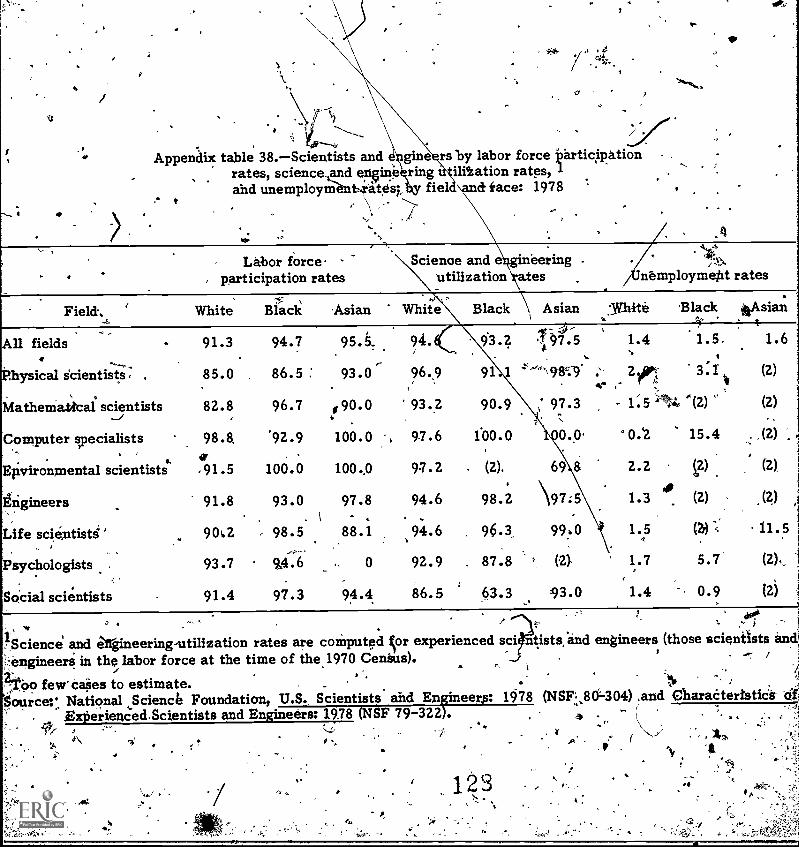
Appendix table 38.-Scientists and ngine rs by labor force 'participationrates, science and engineering ilitation rates, 1and unemployednt4ratesi,by fiel & face: 1978
S.
,
Labor forceparticipation rates
-4; ,Field-. White Black Asian
All fields
Physical dcientists.
MathematIcal scientists
Computer specialists
Environmental scientists
gigineers
Life scientists
Psychologists
SoCial scientists
91.3
85.0
82.8
98.8.a.91.5
91.8
902
93.7
91.4
94.7
86.5
96.7
.92.9
100.0
93.0
98.5
9,4:6
97.3
1
95.5...
93.0
$90.0
100.0
100.0
97.8
88.1
0
94.4
. .4
Scienoe and e eeringutilization aces
15Nnemploymejit rates
White Black Asian T.Iiite Black ttAsian
94*(..
96.9
93.2
, 97.6
97.2
94.
94.6
92.9
86.5
93.2
91 1
90.9
100.0
- (2).
98.2
96.3
87.8
63.3
1V.s
4-'98;9
,* 97.3
1 0.0
69 8
\97.5
99,0
, (2),
93.093.
1.4 1.51
: 2,,, 3:14' ."
- 1:5 'tf%, '(2)
' 0:2 15.4
2.2 (2)
AO1.3 (2)
1.5 N ,
1.7 5.7
1.4 0.9
1.6
(2)
(2)
(2)
(2),
(2)
11.5
(2),,
(2)
Science and e' rates are computed Vr experienced sci tists.and engineers (those scientists and:-,engineerti in the labor force at the time of the 1970 Census),
2too few cases to estimate. --,
Source:' National Scienc6 Foundation, U.S. Scientists and Engineer: 1978 (NSF -,8d =304) ,and CbaraatertstiCEc ciia
Exterienced-Scientists and Engineers: 1978 (NSF 79-322). . 4 -
- f
l
..-.1
I
7.. . ,. ..v -t..

. .
Appendix table 39.-Doctoral scientistsand engineers-labor force participationrates, Sience and engineering utilization rates, and
unemployment rates; by field and sex: 1979
- tabor fOrce,participation rIftes
Science and engineeringutilization rates . Unemployment rates
1
Field . Men Women Men .Women. e
All fieldsi 95.9le
Phy,sical scientists'1 r"
t95.1
Mathematical scientists , 96.2- ,.,......
Computer specialists ' 998.
, t.,Environmental scientists 97'.4;'ngineers
..:
:Life scientists
Psychologists.
;Social scientpts
5\96;2
94;4'
96.4
/
.
#
; ' ,
, 90.4
, 87.7:....
.
91.2
89.6 '
-. '' 89:9 92.0, ..I
98.4 9&.2vc.,' ,
93.6 ,- 96.1
96.2 t 93.4.4
, .; 94.4
92.4 * ,91.8
92.1- 81.7
84.3
8,5.6
90.5;
98.9
- '06.6
92.5
91,2
8%.4
77.2
Men Women
0:7 2.7
170. 3.5
0.3 2.2
(1) (1)
-0.3 .8
t 0.5
.0.8
. 6.9 -
0.7
1.7
3.1"
.1.8,8
3.3', .-. -.-
..,..
,4Tob
, /, .,..,,feiv. cases'fb estimate: . .... ,
-SO.irciil National Science Foundation, Characteristics of Doctoral Scientists and Engineers the United States:0 1979, (NSF40.4.323). 4,4',.
.s
I: , t ^,e,
I, - ,.-
/)
X
a
ti
r

//'
r- "-.........1:,. - .?"
g A
A
I.
. , -,rr.4-
t !4 \ -,Appendix table 40.-Doctoral scientists and engineers - -labor force participation
.,:.rates, science and engineering utilization rates, and
unemployment rates; by field and race: 1979r
Labor force .,
f particirtion rates
Field White
All fields (0.2,Physical scientists 94.3
Mathematical scientists 95.'s 4
Computer speciVsts g.:51 14 99.9
Environmental scientists- 97.1
Engineers 97.9
Life scientists 93.8
Psychologists 95.5
Social scientists 94.5
Sciende and engtagritkutilization rates Unemployment rates
Black Asian White . Black Asian White Black Asian
94.9 98.0 , 90.7 85.6 0.1c 0.9 2.8 1.1
- 93.6 98.8 89.4 87.6 92.2 1.0 . 5.9 *1%7
100'. 0 99.1 12.0 98.7 90.3 0.5 (1) 0.4
(1) 97.2 98.2 (1)-. 98.0 (1) '(I) (1)
11.
100.0 99.8 96.2 100.0 97.3 0.3 (1) 0.2
100.0 98.4 93.3 91.3 94.1, 0.5 (1) 4 0.8,
91.6 9609 .94.0 92.8 96.2 1.0 1.7 1.3
X91.65k
97.9 91.8 81.2 84.0 1.2 1.2 0.7
° 95.1 98.2 8.7 76.6° 84.6 0.9 4.2 1.1
/.'IToo few cases to estimate. . _
. .401*.
Source: National Science Foundation, Characteristics of Doctoral Scientists and Engineers in theUnited States: 1979(NSF 80-323).
4
Go
131,
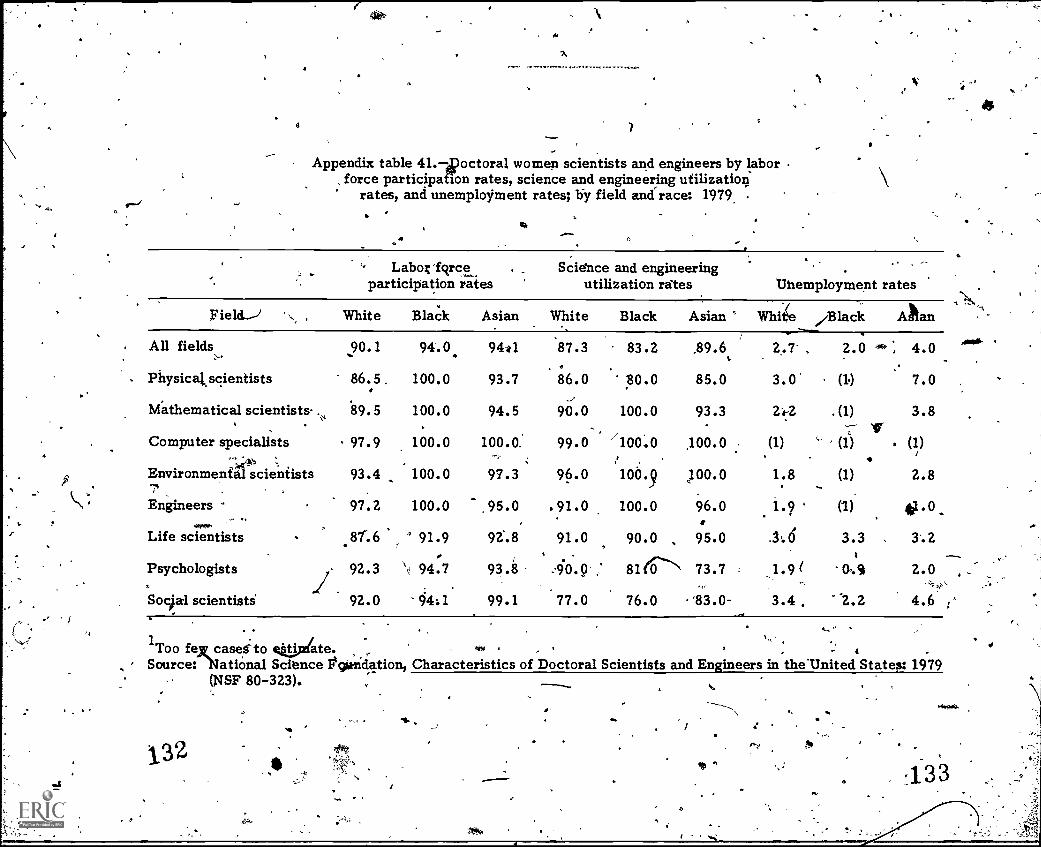
1
Appendix table 41.-koctoral women scientists and engineers by laborforce participation rates, science and engineering utilization
rates, and unemployment rates; by field and race: 1979
a
LabotIctrce Science and engineeringparticipation rates utilization rates 'Unemployment rates
Field,/ White
All fields 90.1
Physicatscientists 86.5.
M'athematical scientists- . 89.5,
.
Computer specialists 97.9700,4 't
Environmenial scientists 93.4
Engineers 97.2..
...ewe.
Life scientists 87-.6
Psychologists 92.3
Segal scientists 92.0
Black Asian
94.0 944.
100.0 93.7
100.0 94.5.
100.0 100.0.
100.0 97.3
100.0 95.0
4 91.9 92.8
N 94.7 93.g
44:1 99.1
White
87.3, .
86.0
90.0
99.0
96.0
.91.0
91.0
-40.Q-
77.0
Black Asian ' While /Black Akan
83.2 2.7' 2.0 4.0 Am..89.6 , ,
80.0 85.0 3.0 (1) 7.0
100.0 93.3 24-2 . (1) 3.8
100.0 ,100.0 .. (1) " (1) (1)
100.9 100.0 1.8 (1) 2.8
100.0 96.0 1.9 ° (1) 61.0.r
90.0 95.0 .3.6 3.3 3.2
816.--- 73.7 1.9 0.9 2.0. ---,,--,-,,
.
76.0 .'83.0- 3.4 . 2.2 4.6 :'
1Too fex cases-to et:Ix/ate. .
Source: National Science Pcpaidation, Characteristics of Doctoral Scientists and Engineers in the'United States: 1979(NSF 80-323).
132

,Appendix table 42.-Experiencedi scieAtists and engineers by field, sex,. race, and thedian annul salary: 1978
. 4 -,1
.
, .
Field Total Men Women White. .
c
Alljlelds 440' $27',200- -.$21,400.' $22,600 $27,300,,
Physical seati.sT ts , 27,900 '.- 28,000 22,000 27,800Chemists ' .----- Is \26,700. 27,300. 21-, 200 ' 27,000 \Physicists/Astronoiners 29,300 29 ;300 . 30,700 29,400Other physical scientists 28,900 29,100 (3) 29,300
.
Mathematical scientists 27,500 27,900 24,100 27,700Mathematicians 27,500s 28,000 22,500 27,700Statidticians 27,500 .27,600 26,700 27,6M
Coinputer specialtists 4 .25,900 26,200 23,600 25,900
Environmentallcientiats 30,4100 30, o 24,700 30,400Earth scientists .30;600 30,80 24,700 30,600Oceanographersl? , ''' 26,800 '026;800 (3) 26,70Q.
GIVAtmospheric scientists 29,700 . 29,700 (3) 29,50y..-Engineers "4 27,400 27,400 '; 24,100 27',500
Black Asian Other
$24,900 \ $25,800 $24,300
23,4(0-0 26,300 (3)23,300 25,300 (3)
(3) 28,300 -(3)(3) ,(3) (3)
. ,26,600 26,800 (3)26,400 (3) (3)
(3) (3) ' (3)
25,600. 25,100 (3)
(3) (3) (3)(3) (3) (3)(3) (3) (3)
. (3) 43) (3)
28,800 25,600 24;700.
. 22,200 22,800 21,70022;600 " 27,000 , (3)
(3 (3) 3(3)(3) - (3) (3),
28,5001 (3) (3)
22,000 (3) / (3)' (3) (3) (3) .
(3) (3). (3)"(3) (3) (3)
, . ..
Life scientists 24,90b 25,200 21,900.* .5 000-BiolOgical scientists 25\200 25,800 21,800 25,3'00
,, Agri tultUral scientists, 23 9500 -23,900 (3) 23,800Medical scientists 28 900 30,2b0 22,800 30,000J, 9 .
.
Psychologists 26,500 - 27;300 23,800 26 5 0
Social scientists 27,600 28 9700 21,000 27,100.
Economists 30,500 1: 30,800 25,600 30,500Sociolbgists/ , .
. ! : 4'Anthropologists 25,900' 24,900 21,500 26,000
Other social scientists 26,400- 27,400 19,800 26,500
ose scientists anctengineeis'in the labor force it the time of the 1970 'Census.A's -w.i.,/
t'ludes Americanini,liaps ameNo.,report." '_. , i -% ,,,.-", f c'... , 34. i
,,;4-1:) rew eases toestimate. . . . I *4-;
,Source: Nation?) 54fence FotRidatioii; Characteristics of ExperiencedScientists and Engineers (NSF 79-322).,-, .
-/.1,44, ..
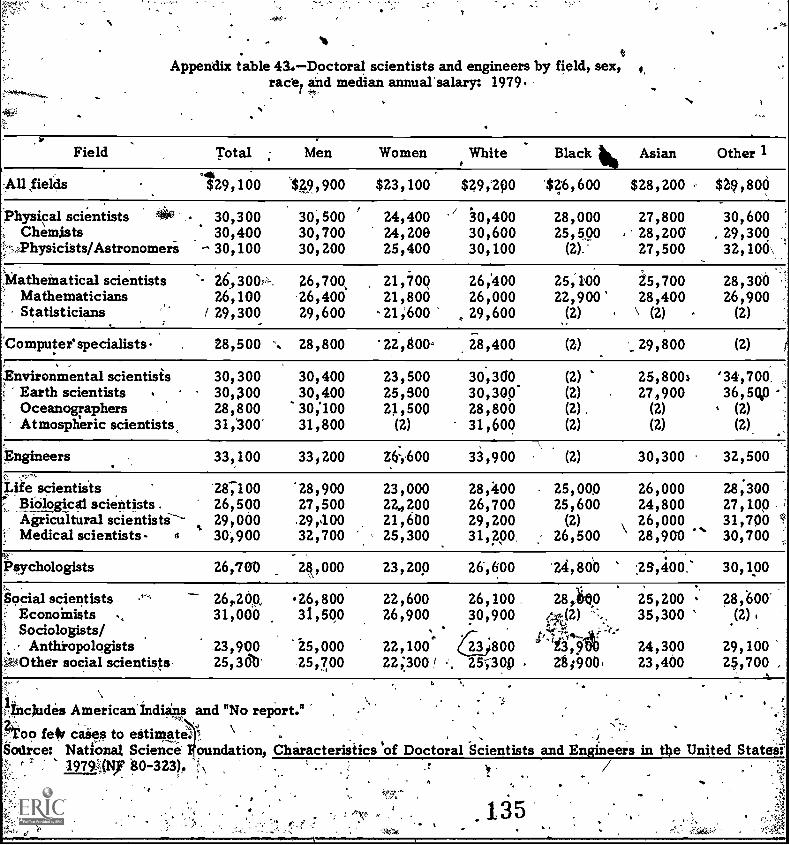
ti
Appendix table 43.-Doctoral scientists and engineers by field, sex,race, and median annuarsalary: 1979.
Field
All fields
Physical scientistsChemists
:?::.Physicists /Astronomers
"Matheinatical scientistsMathematiciansStatisticians
`Computer'specialists. ,
Environmental scientistsEarth scientistsOceanographersAtmospheric scientists,
Engineers
Life scientistsBiological scientists .
Agricultural scientisti---Medical scientists- 4
psychologists
Social scientistsEconomistsSociologists/
AnthkopologistsOther social scientists
Total Men Women
$29,100 '$29,900 $23,100
30,300 30,500 ' 24,40030,400 30,700 24,208.
^ 30,100 30,200 25,400
26.,30V. 26,700,26,100 .26,400 21,80029,300 29,600 -21;600
28,500 '.. 28,800 '22,800-
30,300 30,400 23,50030,300 30,400 25,30028,800 30;100 21,50031,300' 31,800 (2)
33,100 33,200 26600
'28;100 '28,900 23,00026,500 27,500 22420029)000 .29,400 21,60030;900 32,700 25,300
26,4700 21\k,000 23,200
26,,200. 26,800 22,60031,000 31,500 26,900
23,900 '25,000 22,10e25,3d0' 25,7,00 22;300!
\ .
1 .
,,Includes American'indins and "No report.",.?!too fe!? Canes to eitimate \ ' .
White Black ki Asian Other 1
$29,200 '$16,600
/ 30,40030,60030,100
28,00025,500
(2):
26;400 25,10026,000 22,900'29,600 (2)
28,400 (1)
30,30030,30,0*28,80031,600
(2)(2)(2)(2)
\ .
33,900 (2)
28,40026,70029,20031,200
- 25,00,025,600
(2)26,500
26,600 '24,800
26,100. 28,b0030,900 0,z(2)
61;800 i3,9U025;300 28 ;900,
$28,200 , $39,800
27,80028,20027,500
30,60029,30032,100\
25,700 28,30028,400 26,900\ (2) (2)
29,800 (2)
25,800N '34,700,27,900 36,5C1,0
(2) (2)(2) (2).
30,300 32,500
26,000 28;30024,800 27,10026,000 31,700
i 28,900 30,700
;25,400' 30,100
25,200 28;600'35,300 ` (2)
24,300 29,10023,400 20,700
godrce: National ScienCe oundation, Characteristics 'of Doctoral -Scientists and Engineers in t4e "United Stateni1979(N7 80-323).
A
.135
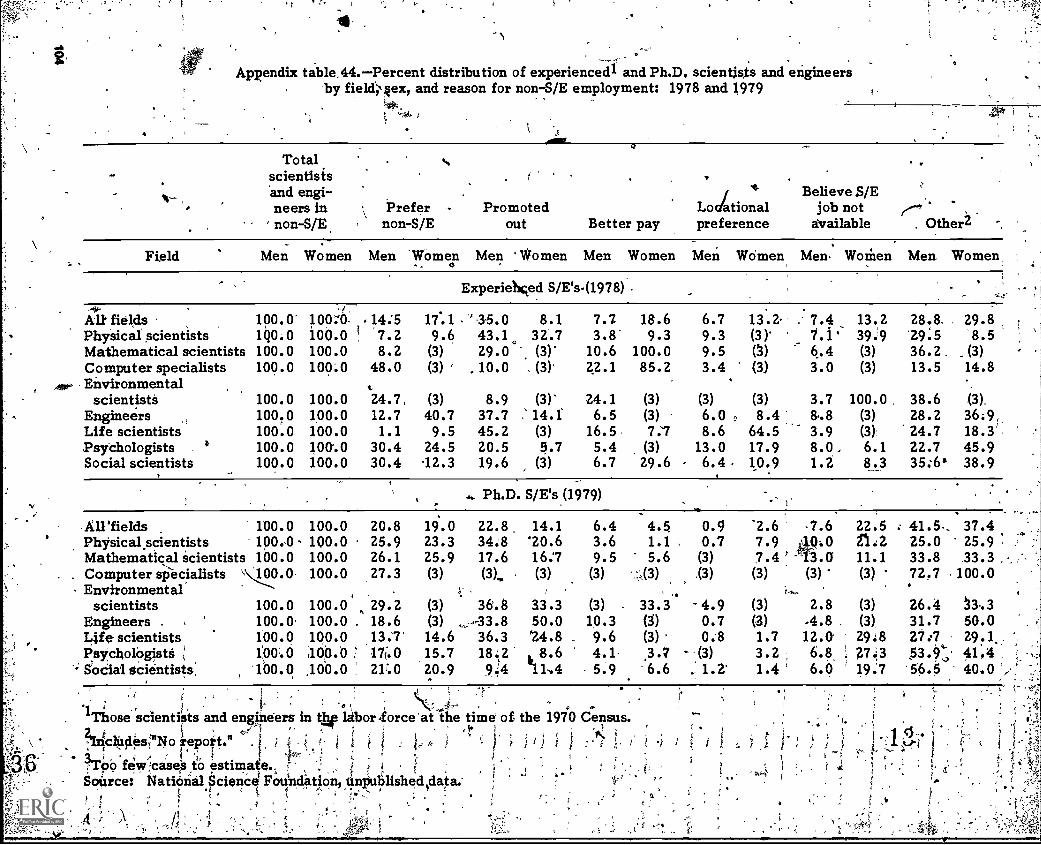
thAppendix table,44.-Percent distribution of experienced]. and Ph.D. scientists and engineers
by fieldi,sex, and reason for non-S/E employment: 1978 and 1979
't
eCI
Total.scientists , .
and engi- .I> Believe S/E
neers in Prefer - Promoted Lociational job not t--, , .
.
' non-S/E non-S/E out Better pay preference available . Other2
Field Men Women Men 'Women Men *Women Men Women Men Women Men. Woiiien Men, Women0
Experiehced S/E's(1978)-4
,11., /All fields 100.0 100:0. 14:5 17..1 '35.0 8.1 7.7 18.6 6.7 13.2 . 7.4 13.2 28.8. 29.8Physicat scientists 1(10.0 100.0 .7.2 9.6 43.1G 32.7 3.8' 9.3 9.3 (3)* 7.1' 39.'9 '29:5 8.5Mathematical scientists 100.0 100.0 8.2 (3) 29.0 ', (3) 10.6 100.0 9.5 (3) 6..4 (3) 36.2. _ (3)Computer specialists 100.0 100:0 48.0 (3) ' 10.0 . (3)' 22.1 85.2 3.4 (3) 3.0 (3) 13.5 14.8Environmental t
scientists 100.0 100.0 24.7, (3) 8.9 (3)' 24.1 (3) (3) (3) 3.7 100.0 38.6 (3)Engineers 100.0 100.0 12.7 40.7 37.7 14.1 6.5 (3) 6.0 .; 8.4 8.8 (3) 28.2 36:9,Life scientists 100.0, 100.0 1.1 9.5 45.2 (3) 16.5 7.1 8.6 64.5 3.9 (3) 24.7 18.3'Psychologists 1 100.0 100-.0 30.4 24.5 20.,5 5.7 5.4 (3) 13.0 17.9 8.0 , 6.1 22.7 45.9Social scientists 100.0 100.0 30.4 12.3 19.6 (3) 6.7 29.6 6.4 10.9 1.2 8.3 35:6' 38.9
Aa Ph.D. S/E's (1979)
AU 'fields 100.0 100.0 20.$ 19.0 22.8 14.1 6.4 4.5 0.9 -2.6 -7.6 22.5Physical scientists 1000 , 100.0. 25.9 23.3 34.8 '20.6 3.6 1.1 , 0.7 7.9 10.0 21:2Mathematical scientists 100.0 100.0 26.1 25.9 17.6 16.7 9.5 5.6 (3) 7.4 ' -13.0 11.1-
. Computer specialists ',.0.0 100.0 27.3 (3) (34 . (3) (3) -,-,),(3) (3) (3) (3) (3)Environmental' .
scientists 100.0 100.0 29.2Engineers . , 100.0 100.0. 18.6Life scientists 100.0 100.0 13.7'Psychologists 100.0 100.'0 ; 17.0SoCial scientists: 100.0 .160.0 mo
(3) 36.8(3) -33.814.6 36.315.7 18.220.9 9.4
33.3 (3) 33.3 4.950.0 10.3 (3) 0.724.8 9.6 (3) 0.81,8.6 4.1 3.7 (3)11-.4 5.9 6.6 . 1.2'
ITliose scientists and engineers in tO labor force'at the time of the 1970 Census.
dudes "No report." .1. i P
,Tpo few:cases to estimate.Source: National.Sciencd Fou#4091,tinluilshed Oata..
(3) 2.8 (3)(3) .4.8 (3)1.7 12.0 29.83.2 6.8 . 27.31.4 6.0 19.7
41.5.. 37.425.0 25.9 :
33.8 .33.372.7 100.0
26.4 33..331.7 50.027:7 29.1 _
53.94-,,, 41,4'56.5 40.0
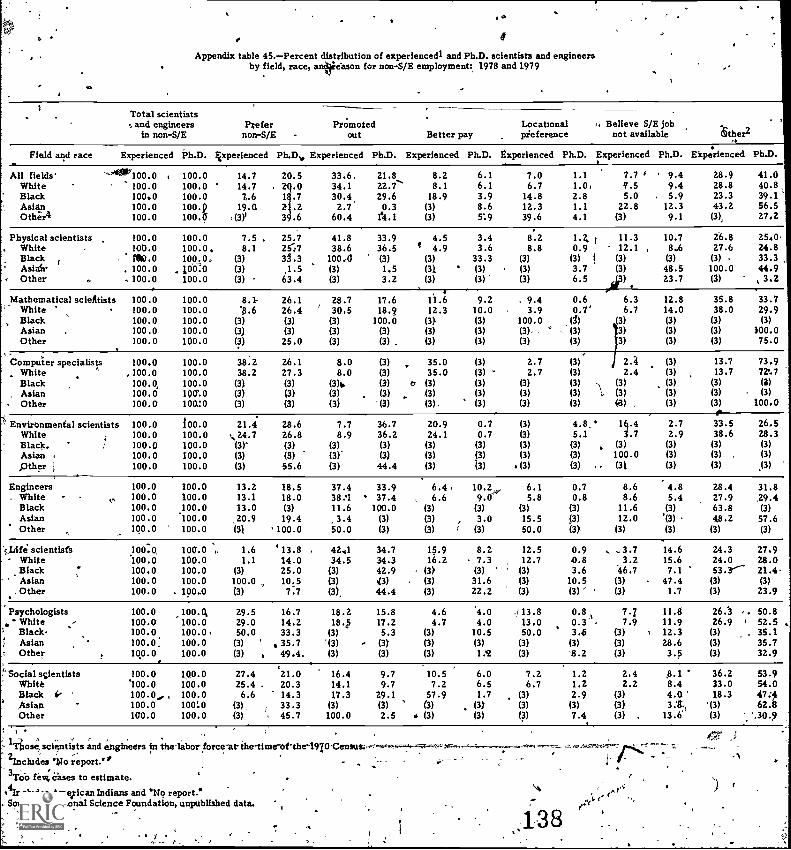
V
Appendix table 45.-Percent distribution of experienced) and Ph.D. scientists and engineersby field, race, antpeason for non-S/E employment: 1978 and 1979
Field and race
Total scientistssand engineers Prefer Promoted Locational Believe S/E job
in non-S/E non-S/E out Better pay pieference not available Ither2
AU fields' ''-=
WhiteBlackAsianOther4
Experienced Ph.D. k xperienced Ph.D.,, Experienced Ph.D. Experienced Ph.D. t xperienced Ph.D. Experienced Ph.D. Ekperienced Ph.D.
X100.0 100.0 14.7 20.5 33.6. 21.8 8.2 6.1 7.0 1.1 7.7 r 9.4 28.9 41.0100.0 100.0 14.7 . 20.0 34.1 22.7 8.1 6.1 6.7 1.0, 7.5 9.4 28.8 40.8,100.0 100.0 7,.6 1 .7 30.4. 29.6 18.9 3.9 14.8 2.8 5.0 5.9 23.3 39.1100.0 100.91 19.0 2 .2 2.7 0.3 (3) 8.6 12.3 1.1 22.8 12.3 43.2 56.5100.0 100.0 , (3)' 3 .6 60.4 1'4.1 (3) 5:9 39.6 4.1 (3) 9.1 (3), 27.2
. .100.0 100.0 7.5 . 25.7 41.8 33.9 4.5 3.4 8.2 1.2,) 11.3 10.7 26.8 25.0.100.0 100.0 . 8.1 25:7 38.6 36.5 't 4.9 3.6 8.8 0.9 12.1 , 8..6 27.6 24.8100.0 10.0.0. (3) 31.3 loo,a (3) (3) 33.3 (3) (3) ! (3) (3) (3) 33.3
. 100.0 . 100:0 (3) ,1.5 (3) 1.5 (31 ' (3) (3) 3.7 (3) 48.5 100.0 44.9
.100.0 100.0 (3) 63.4 (3) 3.2 (3) (3) (3) 6.5 ) 23.7 (3) , 3.2
100.0 100.0 8.1- 26.1 28.7 17.6 11.6 9.2 . 9.4 0.6 6.3 12.8 35.8 33.7100.0 100.0 1.6 26.4 '' 30.5 18.9 12.3 10.0 3.9 0.7' 6.7 14.0 38.0 29.9100.0 100.0 (3) (3) (3) 100.0 (3) (3) 100.0 (1) (3) (3) (3) (3)100.0 100.0 (3) (3) (3) (3) (3) (3) (3)- "(3) 3) (3) (3) N00.0100.0 100.0 (3) 25.0 (3) (3) _ (3) (3) (3) (3) 3) (3) (3) 75.0
100.0 100.0 38.2 26.1 8.0 (3) 35.0 (3) 2.7 (3) 2.4 (3) 13.7 73.9,100.0 100.0 38.2 27.3 8.0 (3) 35.0 (3) 2.7 (3) 2.4 (3) 13.7 72.7
100.0, 100.0 (3) (3) (3)s (3) 0 (3) (3) (3) (3) .-\ (3) (3) (3) (3)100.0 106.0 (3) (3) (3) . (3) 13) (3) (3) (3) \,.. (3) (3) (3) (3)100.0 10a:0 (3) (3) (3) "(3) (3). (3) (3) (3) (a) , (3) (3) 100.0
100.0 100.0 21.4 28.6 7.7 36.7 20.9100.0 100.0 .. 24.7 26.8 8.9 36.2 24.1100.0 100.0 (3)" (3) (3) (3) (3)100.0 100.0 (3) (3) (3) (3) (3)100.0 100.0 (3) 55.6 (3) 44.4 (3)
100.0 100.0 13.2 18.5 37.4 33.9 6.4,100.0 100.0 13.1 18.0 384 37.4 , 6.6100.0 100.0 13.0 (3) 11.6 100.0 (3)100.0 100.0 20.9 19.4 3.4 (3) (3)
100.0 (3) ' 100.0 50.0 (3) (3)
- ..
100.0 100.0 ,. 1.6 ' 13.8 4241 34.7 15.9 8.2.100.0 100.0 1.1 14.0 34.5 34.3 16.2 7.3100.0 100.0 (3) 25.0 (3) 42.9 (3) (3)100.0 100.0 100.0 10:5 (3) NM ' (3) 31.6100.0 . 100.0 (3) 7.7 (3). 44.4 (3) 22.2
100.0 100.q, 29.5 16.7 18.2 15.8 4.6 '4.0 .J13.8 0.8 7.7 11.8 26. . 50.8100.0 100.0 29.0 14.2 18.5 17.2 4.7 4.0 13.0 0.3 - 7.9 11.9 26.9 . 52.5100.0 100.0 50.0 33.3 (3) 5.3 (3) 10.5 50.0 ' 3.6 (3) 12.3 (3) . 35.1100.0, 100.0 (3) ' . 35.7 .(3) - (3) (3) (3) (3) (3) (3) 28.6 (3) 35.7100.0, 100.0 (3) , 49.4. (3) :2(3) (3) 1 (3) 8.2 (3) 3.5 (3) 32.9
100.0 100.0 27.4 21.0 16.4 9.7 10.5 6.0 7.2 1.2'100.0 100.0 25.4 . 20.3 14.1 9.7 7.2 6.5 6.7 1.2100.0., , 100.0 6.6 14.3 17.3 29.1 57.9 1.7 (3) 2.9100.0 100:0 (3), 33.3 (3) (3) ' (3) , (3) (3) (3)100.0 100.0 (3) , 45.7 100.0 2.5 6 (3) (3) (3) 7.4
0.7 (3) 4.8. 1(1.4 2.7 33.5 26.50.7 (3) 5.1 3.7 2.9 38.6 28.3
(3) (3) (3) , (3) (3) (3) (3)(3) (3) (3) 100.0 (3) (3) (3)13) (3) (3) (31 (3) (3) .(3)
10.2 6.1 0.7 8.6 4.8 28.4 31.8,i,..-9.0 5.8 0.8 8.6 5.4 27.9 29.4
(3) (3) (3) 11.6 (3) 63.8 (3)3.0 15.5 (3) 12.0 '(3) 4,8.2 57.6
(3) 50.0 (3} (3) (3) (3) (3)
12.5 0.9 , .. 3.7 14.6 24.3 27.912.7 0.8 3.2 15.6 24.0 28.0
(3) 3.6 46.7 7.1 53.2' 21.4(3) 10.5 (3) 47.4 (3) (3)(3) (3) (3) 1.7 (3) 23.9
2.4 8.1 36.2 53.92.2 8.4 33.0 54.0
(3) 4.0 18.3 47:4(3) 3.I, .(3) 62.13(3) . 13.6 (3) '.30.9
Physical scientists, White
BlackAsiafir
= Other
Mathematical scientistsWhiteBlackAsian ,
Other
Computer specialistsWhiteBlackAsianOther
' Environmental scientistsWhiteBlack.Asian .
ether i
Engineers. White ,
BlackAsianOther 100.0
....1Afe scientisfsWhiteBlackAsian
. Other
Psychologists,, ' White ,
Black.: Asian
Other i
Social scientistsWhiteBlack 40
' Asian 'Other
Those, scientists and engineers in thelaborforce-atthetime"Otthe'1970.Censuw.,"Includes °No report.''3Too ' few, Cases to estimate.
+Includes Ameorican Indians and No report.". Source: National Science Foundation, unpublished data.
° -
.'
\,
si38

-r
Le 4
Appendix table 46.-Recent" science and engineering bachelor's degree recipientsby field, sex, and labor force status: 1978 and 1979 in 1980
'. Field and sex Total 1Laborforoe 2
Total Employedemployed in S/E
,/Employedin non-S/E
All fieldsMenWomen
598,600394,600204,000
45,100294,300150,8'00-
429,100284,800144,300
226,600'171,10055)500
202,500'113,700
88,800
Physical scientistsMenWomen
33,90026,000'7,?00
/8,50013,7004,800
.18,100-13,3004,800
14;00010,4003,500
4;1002,9001,200
Mathematical scientistsMenWomen
24,60.014,40010,200
19, C)010,6008,900
18,90010,200.,8,700
11,700'6,4005,300
.7,2003,8003,400
'a 1
Computer specialists ,Mbn*Women
16,000 15,10011,700 10,8004,300 4,300
14,800 '13,800 90010,600 9,800 8004,200 4,000 100
Environmental scientistsMenWomen
20,000 . !14,90015,000 ;11,3004,900, 3,600
14,100,'10,800
3,300
8,3006,5001;800
5,800. 4,300
1,500
EngineersMenWomen
Life scientistsMenWomen
419,200 a 108,600 107,200110,500 100,500 , 99,100
8,700 8,100 8,000
97,500 92,40097,980 60,400 58,000,54,800 37,100 34,400
99,30091,9007,400
7,8007,200
600
48,60030,40018,200
43,80027', 50(f16,300
PiychologistsKenWomen
. 88,100 ) 65,300,35,200 26,0052,900 39,200
63,200 .
25,20038,000
. ,11,500 61,8004,800 20,4006,700 31,400
Social ScientistsMenWomen
1
144,200 105,70084,000 60,90060,300 e " .44,900
1e0, 50057,60042,900
19,50010,8008,700
'81,00045,80034,200
r
1 I11n4ludes full-time graduate students.zExbludes full-time graduate students.3'TOO few cases to estimate.Note: betel may.not add to tota14 becaustisof rounding.SouNce: National'Science Foundation, unpub hed data.
rr'
Unemployed,seeking
Employedin field
Full-timegraduatestudents'
16,0009,5006,500
187,100144,30042,800
.138,40095,200
1 ,43,100
400400
.`100
8,40063002;100
14,60012,0002,700
600400200
9,4005,'5003,800
4,5003,700
800
300 13,400 900200 800100 3,9001 (3)
800 5,200 4,500'500 4,100 3,600300 1,206 900
1,500 94,300 9,8001,400 87,400 9,200
100 6,800 600
5,100 36,200 51,2002,400 22,900 35,9002,600. . 13,300 15,300
2,104 9,000 19,300- 900, , 3 500 8,800
1,200 5,600 10,500,
5,200 11,300 33,600' 3,300 5,100 21,40,0, 1,900 6,200 12,300
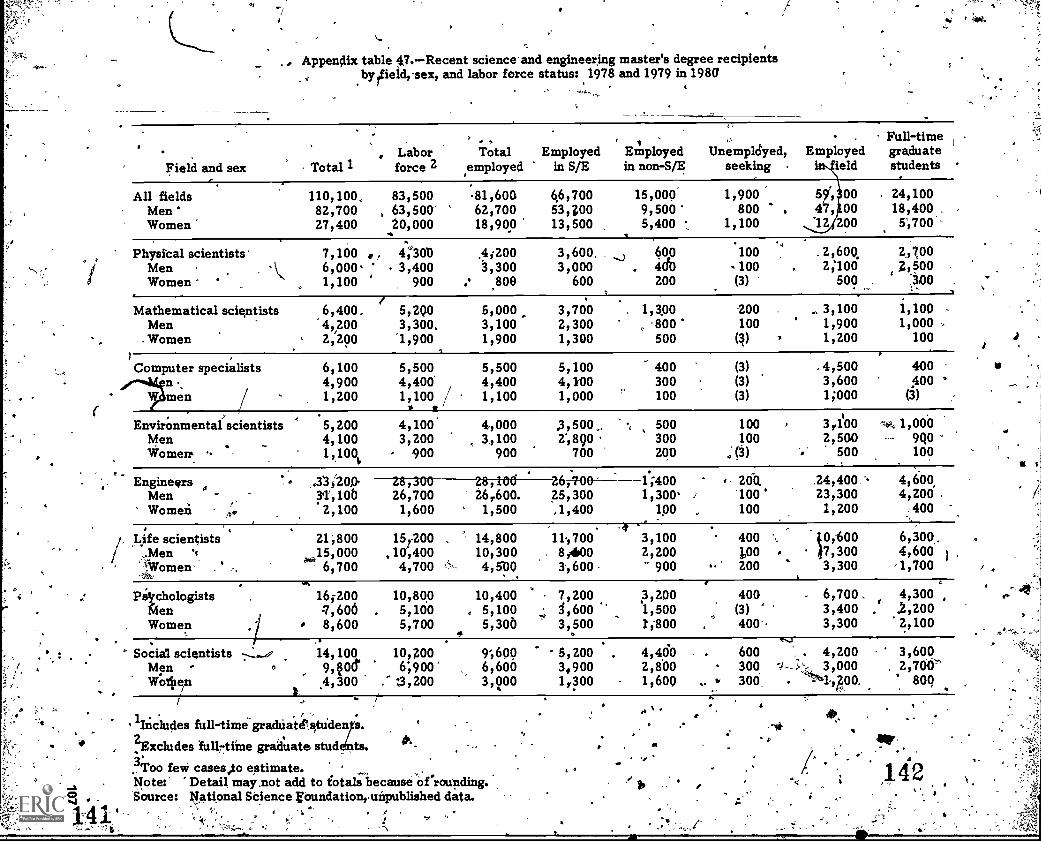
4
, , Appendix table V.-Recent science and engineering master's degree recipientsby
ylield,sex, and labor force status: 1978 and 1979 in 1980
Field and sex Total 14, Labor
force 2
.Total Employed
employed in S/E
IEmployedin non-S/E
UnemplOyed,seeking
. Full-timeEmployed graduate
ield students
All fieldsMenWomen
110,100, 83,500 -81,60082,700 , 63,500 62,70027,400 20,000 18,900
46,70053,20013,500
15,00Q9,5005,400
1,900 9c 00800 , 47, 00
1,100 12 200
24,10018,400 .
Physical scientists'MenWomen
Mathematical scientistsMen
. Women
Computer specialistsnmen
Environmental scientists 5,Men 4,Women. 1,
7,100 , 4;301)6,000 3,4001,100 ' 900
6,400_ f 5,2004,200 3,300.2,200 '1,900
6,1004,9001,200
200100100
4;2003,300. .800
3,600, 6003,000 ado
600 200
5,000 3,700 . 1,3003,100 2,300 , .8001,900 1,300 500
100100
(3)
. 2,60Q, 2,7002;100 2,500
500 . :MO
200 . 3,100100 1,900
(3) 1,200
1,1001,000
100
5,500 5,5004,400 4,4001,100 / 1,100
4,1003,200
- 900
4,0003,100
900
5,1004,1001,000
400300100
(3)(3)(3)
.4,500 4003,600 4001;000
3,500. - 5002,890 300
700 200
100100
.(3)
3,11002,500
500
-44 1,00.09Q0
100
EnginegrsMenWomen
..33;200 28,300p',lob 26,7002,100 1,600
.28,106 26,700 1;40026,600. 25,300 1,300- J
1,500 ,1,400 100 ,
20Q .24,400'100 23,300100 1,200
4,4,200
400
/, *Life scientistsI/ ....Men 's
'Avomen
21;800as
6, 6,700
15,200 ,
10;4004,700
14,80010,3004,500
11, 7008,4001,600
3,1002,200
900
400 10,600 6,300.,1,00 47,300 4,600 )
200 3,300 1,700
PrkychologistsMenWomen
16;200 10,8004,606 . 5,100
A 8,600 5,700
10,400 7,200 .3,200. 5,100 1,600 1,500
5,300 3,500 1000
400(3)400'
- 6,700. 4,3003,400 " 2,2003,300 2,100
Social scientistsMenWoftiein
14,100 10,200940e 6;900.4,300 ," ;3,200
9;690 '5,2006,600 3,9003,900 1,300
4,400 . 6002,800 3001,600 o, 300.
4,200 3,6003,000 , 2,700'1,ZOO. 800
illicit:des full-time gradnaii4tuilels%!Excludes .full7tiine graduate studeints.
?Too fevi casesito estimate. .
. Note:' Detail may ,not add to totals 'Orrounding..
0 Source* National Science roundationrunpublished data..., .,.... .
1.4 3:.
d
ry
'217,.;
^
' 4
"#!Sr:
142.
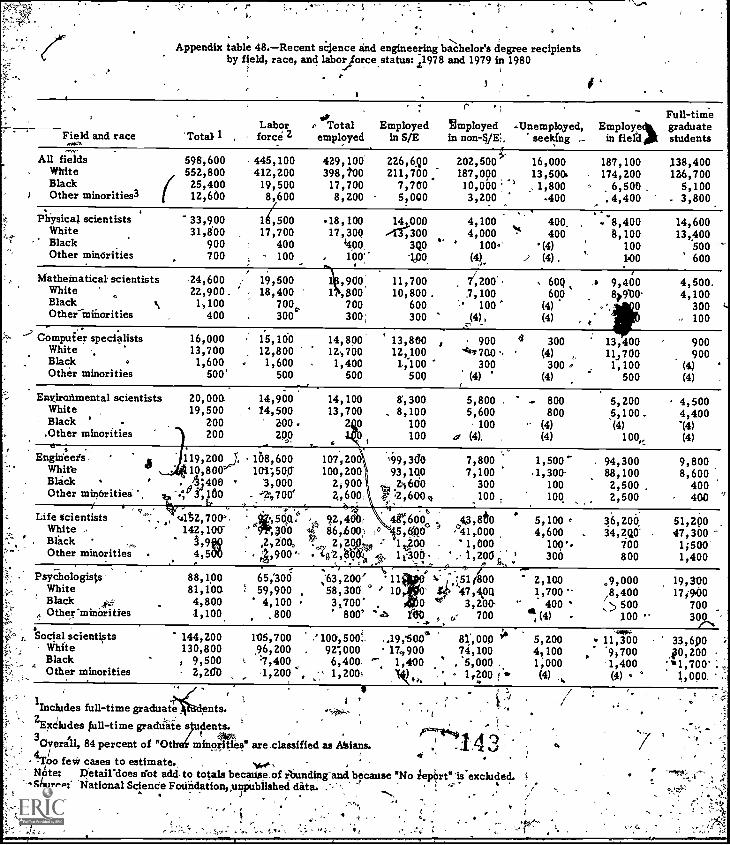
0
Appendix table 48.-Recent sCjence and engineering bachelor's degree recipientsby field, race, and labotyorcestatus: 1978 and 1979 in 1980
r
r i
Full-time11,Labor P Total Employed employed Unemployed, Employek graduate
Field and race 'Total 1 , , force 2 employed in S/E in non-S,/E ;, seeking - in field, students
All fields 598,600 . 445,100 429,100 226,690 202,500k 16,000White 552,800 412,200 398,100 211,700, 187,000 13,5006Black /
12,660 8 8,200 5,00025,400 19,500
,60017,700
Other minorities37,700 10,000 " , 1,800
3,200 -400
Physical scientists 33,900 15,500 .18,100 142,000 4,100 400, ,
White 31,800 17,700 17,30Q /1 Nt1,300 4,000 400Black 900 400 44p0 3Q0 '4 ' 100' (4)Other minorities 700 - 100 - . 100, ' -0 (4). .," (4) .
.
187,100 138,400174,200 126,700
6,500 5,100.4,400 - 3,800
.. . .
. 8,400 14,6008,100 13,400
100 500140 600
9,400 4,500.4990 4,100
, 0 300- 100
13,400 90011,700 9001,100 (4)
500 (4)
Mathematical scientists -24,600 , 19,500 1 ,900 11,700 7;200', . 60Q oWhite 22,900 . 18,400 1 ,800 10,800 . 7,100 600Black
'6. 1,100 700,, 700 600 ,' 100 (4)Other-minorities 400 300 300, 300 (4), (4) , r
...9 Computer specialists 16,000 15,100 14,800 13,800 , 900 d 300White .. 13,700 12,800 12,700 12,100 "41700 -, (4) .
Black o- 1,600 1,600 . 1,400 1,100 300 300 ,,,...Other minorities 500' 500 500 500 (4) (4)
'- ,
Ens ironmental scientists now 14,900White 19,500 14,500Black ' 200 200.Other minorities 1 200 200,..
14,100 8',300 5,800 .13,700 , 8,100 5,600
200 100 100
O100 a (4),
.. 800 5,200800 5,100_
- (4) (4)(4) 100,,
4,5004,400'(4)(4)
sEngineeis 119,200" J. - 158,600 107,200 ',99,3d0 7,800 1,500"
': White 10,800' 101;500' 100,200 93,1(10 7,100 ' 1,300Black ' ji;400 3,000 2;900 .4660 . 300 100Other minorities -",i' r,100 - 1°,700' 2600 2,600, 100 100
f-. 4,,,`P .,
'92,4ult2,700'. zso,a, * 4C6000 . 4,3,8do 5,100 0,,,White . 142,100- * ``Tio,300 los 86,40Q-, ° oi5,00 ° 141,000 4,600, A,9f19 .2,200. ?)!" , 2,20 : 1400 '1,000 100'Black 'Other minorities . 4,500 '4,900'' te2,!3I% 1.. 11300 - , 1,200 ' 300
t-,
Psychologists 88,100 65,300 ,'63,200' ' 11 I. .;51 800 2,100. White 81,100. ! 59,900 , 58,300 10 47,490 1_,700'
Black Aszi 4,800 ' 4,100 32700' *" 3,200- ,- 400
94,300 9,80088,100 8,6002,500 . 4002,500 400
Life xcient1st s 36,200 51,200- 34,2Q0- . 47,300
700 1;500800 1,400
.9,000 19,300,8,400 174.00j 500 700
,, Other 'minorities 1,100 . 800 800° -°b 119... , - 700 (4) - 100 30/mom-Isocia1scientiets 144,200 195,700 ,'100,500!. ..191500* 4,000 ''' 5,200 11,300 33,690
White 130,800 96,200 , 92;000 17,900 74,100 4,100 92700 ,0,200Black ' $ 9,500 I, 7,400 6,400 '" 1,400 , 5,000 . 1;000 1,400 '111,700' :Other minorities 2,260 -1,200 ' 1,200 44)., 1,200 f.e (4) (4) 1,000.A= , ,
01 '1lncludes full-time graduat dents. .
aExdiudes Full -time graduate s dents. ,. 1 _
A i
30lierall, 84 percent of "Ot rot t:1041es" are .classified as Miens. 1.4 3,TO' o few cases to estimate.Note: Detail's:toes not add..to totals becansenk rounding -and because "No lep;nt"'is`excluded. 4
SI rce:* National Sciende Foundation,,unpubliihed data. -'-' - . . 4'.1 ... e . '''...,
..,,..,..,. .
to jt
a

Appendix table 49.- Recent science and engineering master's degree recipientsby lieldlrace, and labor force status: 1978 anc1979 in 1980,
Field and race k "l'eltal 1'L'aborforce 2
Totalemployed.
E p oyedSJE
Employedin non-Sit
All fields-White ,eBlackOther minorities3
110,10098,900
2,9006,800
83,5067.5,900
2,00D4,600
81,60074,400. ,
1,800
66,701:r60,300
1,3004,300
15,00014,000
500300
Physical scientistsWhiteBlack
4 Other minorities
7,1005,900
% .3007,00
,4,3003,700
ZOO
4,2004
ZOO
3,6003,000
280-200
600600
(4)(4)
Mathematical scientists '6,400 5,200 5,000 3,700 1,308White 6,100 4,900 , 4,800 . 3,500 1,300Black (4) "(4) (4) (4)
, Other minorities 300 200 200 100 ) (4)
Comppter specialists 6,100 5500 5,500 5,100 400White 5,40.0 , 400. .4,900 4,500 400Black 100 7 100 100 100 (4)
Other minorities 600 500. 500 500 (4)
Environmental scientists 5,200 4,100 4,000 3,,500 500White somi 3,900 3,900 3,400 500Black " (4) (4) / (4) (4) (4)
Other minorities 100 100 100 l'o 14)
Engineers 33,200 -28,300 28,100 26,700 1,400. White - /,Black
27,800700
24,400400
24,200e 400
22,900400
1,300(4)
Other minorities 4,200 3,000 3,000 100
Life scientists 21,8D0 15,200 14,800 11,700 3,100White ' 20,500 14,300 14,000 11,100 2,900Black 500 400 300 300 100Other minorities 600 400 400 300
Psychologists 16';200. 10,800 10,400 7,200 3,200White 15,500 10,300 10,100 7,000 3,100.Black 500 300 200' 200 (4)
Other minorities 200 100 100 = bIoo 100
Social scientists . 14,100 10,200 9,600 5,200 4,400/ White 12,800 i 9,300 8,800 4,900 3,900
Black 800 600 `600 200 . 300Other minorities 200 lop 100 _100. (4)
1Includes fultali iext ate'students,` 2.Excludes full -time graduate students.
' .3 ,,e-dt .- ' 'T ..
Overll, 98 percent of 'Other minorities are classifiectas Asians.. i
CoO few caltesIct.estimgte. .
Nut,: Detail does not ad in totals because of rounding and because "No report" is excluded 4 4.°' Source: National Science Foundation, unpublished data.
1 : i . III*
ti
Full -timeUnemployed, Employed graduate
seeking in field students
1,9001,600
300(4)
100100
(4)(4)
59,300 24,100/53,900 20,806
1,000 7003,800 2;100
2,600 2,7002,300 2,100 ,
ZOO 100100 500
. ,
. 200200(a'r(4)
3,100 1;1002,900 - 1,000(4) (4)
100 100
(4)(4)(4)(4)
100100
(4)(4)
4,500 ;4004,000 /300(4) (4)
500 200
3,100 41,0002,900 700(4) (4)
100 (4)
o 200o 100
(4)(4)
. 24,400 4,60021,10,0 i 3,300
300 2002,600 , 1,.100
400300
(4)
10,600 6,30010,000 5,900
300 003Q0 200
400300
- 100(4)
6;700,6,500
200100
4,3004,100
100100
600500100
(4)
4,200:4,200
(4)4 (4)
3,6003,2'00
200(4)
I

Appendix table 50.-Recent sclhce and eAgineering degree recipients by field, sex,degree level, labliF force participat'On rates, science andengineering utilization rates, an unemployment rates:,
1978 and 1979 'n 1980
/ Labor force. Science and engineeringparticipation rates -utilization rates Unemployment rates
Field and degree level Men Women ', Men Women Men , Women
Bachelor's f
All fields .
PhysicatscientistsMathematical scientistsComputer specialists ,
Environmental scientitts.EngineersLife scientistsPsychologistsSocial scientists.
..4
mope 1 All fields ..1..0. 98.3 93.7' Physical scientists 91.4 9218
Mathematical scientists 99.0 94.BComputer specialists 99.5 100.0
- Environmental scientists 98.3. 89.6,Engineers 99.2' .99.4Lifecientists 97.4' 93.9
. Psychologists ,99.2 92.5Social scientists 97.2 93:4
c.
98.7 92.196.4 100.0100.00 91.4
99.1 90.3
99.5 93.4
99.2 95.099%8 94.594.9 87.7
,87.9 'k 94.1
Master's
+.,
58.176.260.3
,.,90.657-.591.550.418.417.7
-
83.8 67.4 1.2 5.487.0 . 69.0 X.7 4.871.7 ,69,.9 3.6 1.993.8 89.1 (1)
,(1)
88.4 T 76.6 1.8 4 (1)
94.4 86.0 / .0.Z 8.277.5 76.5 1.1 5.270.8 , 62.2 0.8. 6.655.7 , 41.8 4.5 7.9
36.8 3.2 4.3( 73.2 . 2.6 1.759..3 4.0 1.9'
94.4 1.6 2.9%49.7 4.6 7.990.9 1.4 1.349.0 4.0 7.117.0 3.6 2..919.4 5.4 4.3(.
1"Rio few. cases to estimate.Source: National kience Foun't4 Hon, unpublidhed data.
4 etkb
r145***
Pi

O
I
Appendix table 51.-Recent science and engineering degree recipients by field, race,degree level, labor force participation sates, science andengineering utilization rates, and unemployment rats:
. "1978 and 1979 in 1980
..,
Labor force Science and engineering , (participation rates utilization rates ,- UnemploOdent rates
Field and degree level White
All fields 96.7Physical scientists 96.2Mathematical scientists 98.3Computer specialists 4 99.5Environmental scientists 96:0Engineers 99.2Life scientists 96.2Psychologists 94.7Sociarscientists 95.6
Black Other White Black Other White Black Other
Bachelor's 41,1
'95.9 t 98.1 51.4 , 39.2 58.2 . 3.3 9.3 .4.8100.0 . 10
.0.0 75.2 71.8 98.9 2.E . 1.0 (1)
84.0 100.0 58.5 87.4 86.9 3.2 (1) (1)/'100.0 100.0 94.5. 65.9 100.0 0:4 15.9 (1)100.0 100.0 55.7 40.6 86.4 5.4 (1) 13.6100:0 . 100.0 941.7 85.5 94.7 1.2 .4.2 4.292.4 944.5 50.0 52.3 '46.4 , 5.1 2..7 10.498.1 .100.0 18.1 12.9 12.6 2t8 \e 9.0 (1)94.3 100.0
118.6 19.0 (1) 4.3 .. ,13.3 (1)
-Master's
All fields . 97.2' Physical scientists 96:7-Mathematical scientists 96.Computer specialists 9Ebivironmental scientists 9 .0.Engineers . 9 .5.Life scientists. ' 9 .2Psychologists 91.1Soial scientists ) 97.2
,.92.3 -91.9' 19.4 164.5 A 93t2 """ 2.0 12%8 0.9
100.0 100,0 82.8 64.0 10(40 I . 2.0 11.4 (1)100.0 100.0 70.5 100.0 . 79,9 - 3.1 (1) (1)100.0 100.0 92.1 100.0 100.0.... (1) (1) ,..-,p '(1)100..0 100.0 85.6 :C1) 100.0 1.576.0 '08.9 0.9 100.0,E '\96.61` 0.6
100.0 92.3 77.2 72:2 79.6 2.2100.0 190.0 67.4 48.3 46.3 2.892.4 A 73.4 52.6 40.4 60..4 5.4
1Too few cases to estimate. '
Sourcei. National SaiendeFoundatilm, unpublishedata.
(1) 44 (1)(1) 1.312.8 11r.38.8' ar10.4 (1)

41.
..
.
r.
APpendbi table 52.-Median annual salaries of recent science and engineering degree recipientsby field, sex, race and degree level: 1978 and 1979 fn 1980
_
'Field and degree level Total Mel , WomenOther
White = BlaCk minorities
4Bachelor's
,
All. tieldS
Physical scientistsChemistiPhysiciSts/AstronomersEnvironmental scientistsOther physical scientists
14,853 $17,022
15,07015,65317,31614,18915,476
15,57616,19417,51314,594,16,818
$11,815 $14,88,4
13,96214,32616,70812,35911,899
15,05915,65717,10314,23115,076
$1+840 $16;7
14,18b , 10,6751.4.011 ,12,613'5,376 (1) ..-
11,187 10,378(1) (a)
Matheniatical scientistsMathematicians/-Statisticians
Computer specialists
17,4294
;18018,763
17,795 16,500
' 15,941 15,66518,986 18,063
17,212 19,260 - 17,811Itaffi
15,610. 19,820 13,20918,854 '17,761 17,966
Engineers 20,01 . 203748 21,335 20,782 22,,667,/ P20,592
Life scientistsBiological scientistsAgricultural scientists
12,069 . 02,78811,872 12,39112,377 13,094
11,25511,38710,895
12,07411,87612,,388
12,12612,208
1,745
13,11412,93713,639 .
Psychologists , . 11,243 12,341 10,789 11,257 10,327 14,285
Social scientists 12,162Economists '14,568Sociologists/Anthropologists 11,916Other social scientit's 122;373
13;41615,01013,92212,980.
11,05312,655_10,87e.11,848
12,228 .10,84714,728 . 11,13811,983 11;45512,526 9,945
13,74413,31113,41319,456
4 Master's
All fields - 20,567. 21,767 - 15,595 - 20,357 18,737 , a ,936s
Physical scientistsChemists,Physicists/Astronomers -Environmental scientists
'Other physical scientists
20,24919,15120,50421,80617,094
20,6714419,661
19462522,11817,408
18,31917.406722,28620,09916,687
20,32719,01920,30421,'91117,094
' 21505619,64123,55223,552
(1)
19,03813,564 -20t,909 -19,673
(IL01/04014°
Mathematical scientistsMathematicians/
StatisticiansComputer specialists
21,461 23,012
19,134 20,39024,695 25,597
8,190 21,992
14,328 . 19,04222,117 4,146
29,665 1,434
19,456 211552,313,676 21,123
Engineers-
Life scientistsBiological scientistsAgricultural scientist
24,513 24,593 '23,231 24,572 26484.. ,23,840.
. PsYcholFists
15,07.7 1.5,72814,2.63 14,49116,799 16,895
14,342 15,06514,069 14;202 41
16,391 16,827
16,94717,02416,529
14,8675,,604
16,802
-15;113- ---15,75714,487 15,109 17.,8'99 (1)
Social scientists 16,204Economists 20,422Sociologists/Anthropologists 15428Other social scientists 17,#71
17,12820,71816;61317,616
to--
+,Jvp4ew cases, to estimate. .
SOtirce: National Science Foundation, unpublished data
14,489'17,39013,67914,339
16,32420,62315,47317,751
12,948 16,73117,408 17,408
' 11,104 '-. 11,917' 12,803 (1)
e
-=.-...
-
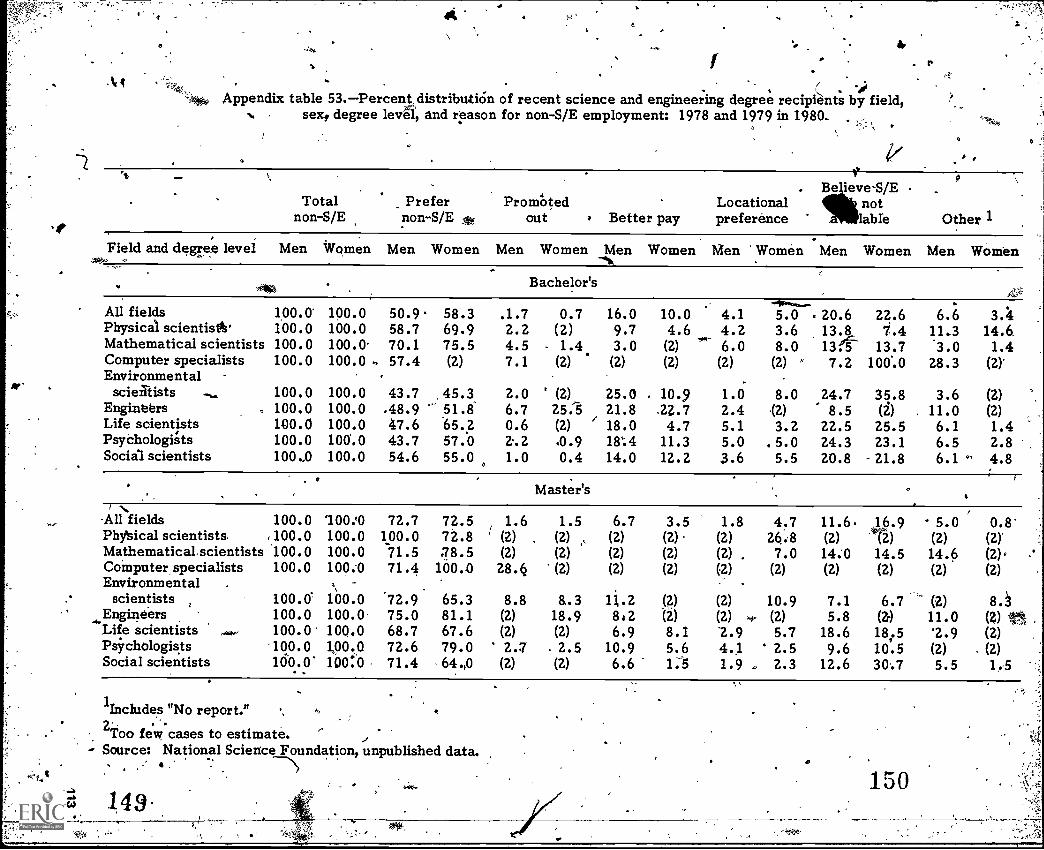
f
S
(, ""`.N.N. Appendix table 53.-Percent distribution of recent science and engineering degree recipients by field,
N. sexy degree level, and reason for non-S/E employment: 1978 and 1979 in 1980.
7/ ,
`1>
Be ieveS/ETotal Prefer PromOted Locational not
non-S/E non-S/E out s Better pay preference lable Other 1
Field and degree level.11w
Men Women Men Women Men Women Men-41,4
Women Men Women Men Women Men Women
Bachelor's-5F-...-.
All fields 1,00.0 100.0 50.9 58.3 .1.7 0.7 16.0 10.0 4.1 5.0 = 20.6 22.6 6.6 3.4Physical scientist' 100.0 100.0 58.7 69.9 2.2 (2) 9.7 4.6 4.2 3.6 13.8 1.4 11.3 14.6.Mathematical scientists 100.0 100.0 70.1 75.5 4.5 1.4 3.0 (2) 6.0 8.0 13f 13.7 '3.0 1.4Computer specialists 100.0 100.0 .. 57.4 (2) 7.1 (2) (2) (2) (2) (2) 7.2 100..0 28.3 (2)*Environmental
scieiTtists , 100.0 100.0 43.7 45.3 2.0 (2) 25.0 . 10.9 1.0 8.0 24.7 35.8 3.6 (2)Engineers , 100.0 100.0 .48.9 51.8 6.7 253 21.8 .22.7 2.4 (2) 8.5 (2) , 11.0 (2)Life scientists 100.0 100.0 47.6 65.2 0.6 (2) / 18.0 4.7 5.1 3.2 22.5 25.5 6.1 1.4Psychologths 100.0 100.0 43.7 57.0 2.2 .0.9 18:4 11.3 5.0 .5.0 24.3 23.1 6.5 2.8Social scientists 100.0 100.0 54.6 55.0
01.0 0.4 14.0 12.2 3.6 5.5 20.8 21.8 6.1 °' 4.8
Master's. ....,
-All fields 100.0 100:0 72.7 72.5 1.6 1.5 6.7 3.5 1.8 4.7 11.6. 16.9 ° 5.0 0.8'Physical scientists. .100.0 100.0 100.0 72.8 I (2) , (2) , (2) (2) (2) 26.8 (2) (2) (2) (2)Mathematical, scientists 100.0 100.0 71.5 78.5 (2) (2) (2) (2) (2) , 7.0 14.0 14.5 14.6 (2) .Computer specialists 100.0 100.0 71.4 100.0 28.6 (2) (2) (2) (2) (2) (2) (2) (2) (2)Environmental , -
scientists 100.0' 100.0 '72.9 65.3 8.8 &.3 11.2 (2) (2) 10.9 7.1 6.7 (2) 8.i....
Engineers 100.0 100.0 75.0 81.1 (2) 18.9 8:2 (2) (2) .c.- (2) 5.8 (2 ) 11.0 ($)Life scientists 100.0 100.0 68.7 67.6 (2) (2) 6.9 8.1 2.9 5.7 18.6 185 '2.9 (2)Psychologists 100.0 00.0 72.6 79.0 2.7 2.5 10.9 5.6 4.1 2.5 9.6 10.5 (2) - (2)Social scientists 160.0' 100:0 71.4 64.0 (2) (2) 6.6 13 1.9 , 2.3 12.6 30.7 5.5 1.5
1Includes "No report. k
2Too few cases to estimate.- Source: National Science Foundation, unpublished data.
. .. M
,
149.
es-

, -Appendix table 54.-Percent distribution of recent science and engineering degree recipients by field,
race, degiee level, and reason for non -$/E employment: 1978 and 1979 in 1980
-Totalnon-S/E
Prefernon-S/E
Promotedout.
Field and race Bachelor Master's Bach. Mast. Bach. Mast.
All fieldsWhiteBlackOther minoritiel
1011.0 100.0100.0 100.0100.0 100.0100.0. 100.0
54.1 72.7 .1,4 1.654.8 72.0 .14 _1.745.4. 0 88.8 1.4 (2)42.7 57.7 (2) (2)
Physical scientistsWhiteBlack
. Other, minorities
100.0100.01100.0100.0
100.0100.0100.0100.0
61.9 89.962.7 88.9 1.654.8 100.0 (2)(2) (2) (2)
(2)(2)(2)(2)
Mathematical scientistsWhiteBlackOther minorities
100.0100.0100.0100.0
100.0100.0100.0100.0
72.7 74.2 3.0 (2)72.6 76.3 3.1 (2)49.4 (2) (2) (2)
100.0 (2) (2) (2)
Computer specialists 100.0White 100.0Black 100.6 100.0Other minorities 100. 100.0
100.0 50.4 80.1 12 19.972.9 80.1 9..0 19.9(2) (2) /-12) (2)'(2) (2) (2) (2)
Environmental scientistsWhiteBlack .Other minorities
100.0 100.0 44.2 70.Q4.,
1:5100.0.=, 100.0 43.0 69.0 1.5100.0 100.0 66.1 100.0 . (2)100.b 100.0 1. (2) (2) (2)
8.89.1(2)(2)
EngineersWhiteBlack
t Other minorities
400.0100.0100.0100.0
100.0100.0100.0100.0
49.151.0_35.9(2)
75.4 8.376.1 5.5(2) 64.160.9 (b)
1.31.4(2)(2)
Life scientistsWhiteBlack
100.0100.0100.0
Other minorities 100.0
iop.o 54.0'100.0 53.9
100'".0 32.3100.0 . 53.0
68.4 0.4 (2)68,5 0.4 (2)
100.0 (2) (2)(2) (2) (2)
PsychologistsWhite,BlackOtilerminorities
100.0 100.0. 51.6 76.0 1.4. 2.6100.0 100.00 52.7 74.7 1.5 - 2.7MO, -100.0 39.6 100 (2) (2)100.0 100.0 55.9 100.0 (2) (2)
Social scientists
slickOther minorities.
100.0 100.0 54.8 68.6 0.7100.0 100.0 55.4 65.,8 0.8100.0 100.0 54.0 83.1 (2)100.0 100.0 26.5_ 100.0 (2)
(2)(2)(2)(2)
llnchides "No-report."
2Too few cases to estimate.. Source: National Science Foundation, unpublished data.
Better pay .LocationalprefereUce
Believe 3/F4-jobnot available Other 1 /
Bach. Mast. Bach. Mast. Bich. Mast. Bach. Mait:
13.413.37.1
26.8
5.65.5
(2)26.9
4.54.44.8
11.1
3.1(2)(2)
21.521.134.919.3
13.513.8.11.215.4
5.25.2 3.76.3 OW(2) (2)
8.2 (2) 4.1 10.0 11.9 (2) 12.3 (2)'9.4 (2) / 3.3 10.7 12.3 (2) 12. (21(2) (2) 45.1 (2) (2) (2) (2)(2) ;. (2) (2) (2) . (2) (2) t2)
1.6 (2) 7.0 2.7 13:6 14.1 90s,a#1.6 (2) 7.1 2,8 ,13.2 11.8 2.3 9.3
(2) (2) (2).. (2) 50.6 '(2) (2) (2)(2) (2). (2) (2) (2) 100.0 (2) (2)
(2) (2) (2) (2) 18.7 (2) 24.9 (2)(2) (2) (2) (2) '9.1 (2) 9.0 (2)(2) .(2) (2)' (2) 39.6 (2) 60.4 (2)(2) (2) (2) , (2) (2) (2) (2) (2)
21.4 6.8 21t8,- 4.3 27:5,. 7.0 2.7 3.322.2 7.0' 2.9 4.5. 27.7 7.2 2.8 3,4(2) (2) ,(2) (2) 33.9 (2) . (2)(2) (2) :(2) (2) (2) (2) (21 (2)
21.9 7.7, 2:2 (2) 7.8 5.4 10.1 10.221.1 6.2 2.4 (2) 8.4 5.6 11.0 10.7(2) (2)/ (2) (2) (2) (2) (2) (2)
100.0 39.1 (2) (2) (2) (2) (2)"4"*(2)0
13.2 7.2 4.4 3.7 23.6 18.6 4.4 '2.113.4 6.1 4.1 3.8 23.5 19.4' 4.7 2.2 .6.4 (2) (2) (2) 61.1 (2) (2) ( (2)
16.9 100.0 25.4 (2) 4.6 (2) (2) (2)
14.2 8.1 5.0 3.2 23.6 1 10.1 4.2 (2)13.6 8.5 4.9 3.4 23.8 10.6 3.6 (2),11.6 (2) 6.2 2) 29.3 (2) 13.3 (2)32.7 (2) 11.4 (2) (2) (2) (2) (2)
13.2 4.7 4.4 2.0 21.2 19.4 5.6 4,013.3 5.3 4.3 2.3 ° 20.1 20.5 5.9' 4.65.6 , (2) 4.8 (2) 35.6 16.1 (2) (2)
29.0 (2) (2) (2) 44.6 (2) (Z) (2)
151 ,.
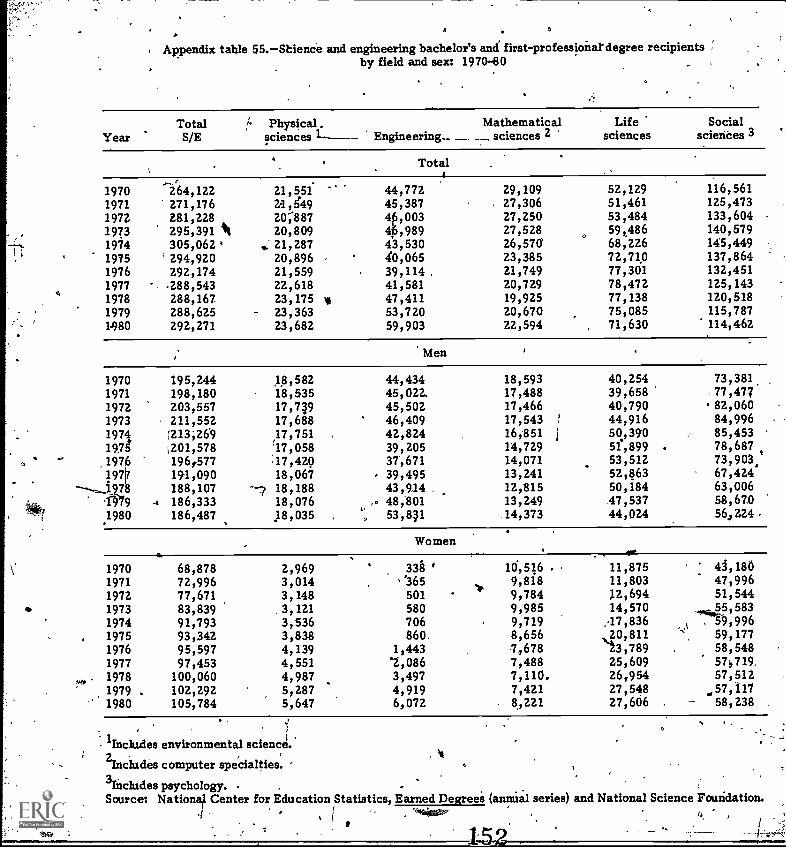
A
Appendix table 55.-Shience and engineering bachelor's and first - professional degree recipientsby field and sex: 1970 -80
YearTotalS/E sciences
Physical.Engineering-
Mathematicalsciences 2
Lifesciences
Socialsciences 3
Total
1970 264,122 21,551 44,772 29,109 52,129 116,561
1971 271,176 2/1,449 45,387 27,306 51,461 125,473
1972 281,228 20;887 4A,003 27,250 53,484 133,604
1973 295,391 A 20,809 4p,989 27,528 59,486 140,579
1974 305,062 , 21,287 43,530 26,570 68,226 145,449
1975 '294,920 20,896 40,065 23,385 72,710 137,864
1976 292,174 21,559 39,114. 21,749 77,301 132,451
1977 288,543 22,618 41,581 20,729 78,472 125,143
1978 288,167 23,175 Iii 47,411 19,925 77,138 120,518
1979 288,625 23,363 53,720 20,670 75,085 115,787
1980 292,271 23,682 59,903 22,594 71,630 114,462
Men
1970 195,244 18,582 44,434 18,593 40,254 73,381
1971 198,180 18,535 45,022, 17,488 39,658 77,477
1972 203,557 17,719 45,502 17,466 40,790 -82,060
1973 211,552 17,688 46,409 17,543 44,916 84,996
1974 !213;269 42,824 16,851 somo 85,453
1975 ;201,578
,17,751
'17,058 39,205 14,729 51,899 . 78,687
196,577 :17,420 37,671 14,071 53,512 73,903k1976
191--,-1/7
191,090188,107 -2
18,06718,188
39,49543,914
13,24112,815
52,86350,184
67,42463,006
019 4 186,333 18,076 48;801 13,249 47,537 58,670
1980 186,487 18,035 53,811 14,373 44,024 56,224.
Women
1970 68,878 2,969 338 ' 16,516 . 11,875 4J,180
1971 72,996 3,014 '.365 9,818 11,803 47,996
1972 77,671 3,148 501 9,784 12,694 51,544
1973 83,839 3,121 580 9,985 14,570 55,583-,-.lir"59
1974 91,793 3,536 706 9,719 ,4 7,836 , , ,9961975 93,342 3,838 860. 8,656 ,20,811 59,177
1976 95,597 4,139 1,443 ,678 -23,789 58,548
1977 97,453 4,551 .2,086 7,488 25,609 57,719.
. 1978 100,060 4,987 3,497 7,110. 26,954 57,512
1979 . 102,292 5,287 4,919 7,421 27,548 .,57,117
1980 105,784 5,647 6,072 8,221 27,606 - 58,238
'Includes environmental science'.. 'It
211chides computer speCialties.
3Inc1udes psychology.Source: Nationq Center for Education Statistics, Earned Degrees (annual series) and National Science Foundation.
4.I
152

4
Oen
s
Appendix table 56.-Science and engineering master's degree recipientsby field and sex: 1970-80
Year TotalPhysical
sciences 1 Engineering, .
Mathematical.1sciences 2
Lifesciences
Socialsciences 3
Total o
,1970 49,13181
'5,948 15,597 7,107 8;590 12,076,1971 50;624 6,386 16,347 , 6,789 8,320 12,7821972 53,567 6,307 16;802 7,186 8,914 14,358
-1973 54,234 6,274 16,758 , 7,146 9,080 14,976'1974 54,175 6,087 15,393 7,116 9,605 15,9741975 53,852 5,830 15,434 6,637 9,618 16,3331976 511,747 5,485 16,170 6,466 9;823 16,8031977 16,731- 5,345 16,889 6,496 10,707 17,2941978 56,237 . 5,576 17,015 6,421 10,711 16,5141979 54,456 5,464 16,193 6,101 10,719. 15,9791980 54,463 5,279 16,888 6,480 10,264 15,552
Men
1970 40,741 5,101 15,425 5,298 6,374. 8,543,1971 41,966 5,533 16,160 5,101 6,130 9,0421972 44,010 5,419 16,521 5,409 6,587 10,0741973 44,474 16,470 5,416 6,843 , 10,3181974
,:.. 43;630 ,200 15,031 5,323 7,,1)5 10,881
1975 . 42,847 ,982 15,038 4,871 7,207 10,74919Z6 42,675 4,660 15,581 4,776 7,20.4 ' 10,4541977 ' 43,577 4;458 16,156 4,730' 7,696 10,5371978- 42,547 4,630 16,144 4,704 7,485 9,5841979 . 40,416 4,472 15,203 4,469 7,259 ' 9;0131980
..40,010 4,280 15,695, 4,670 6,943' 8,422
Women
1970 8,577 847 172 1,809 2,216 3,5.331971 4 8,658 853 187 1,688
t2,190 3,740
1972 888 281 1,777 2,327 4,2841973 9,760 , 847 288 1,730 2,237. 4,6581974 10,545 887 362 1,793 2,410 5,0931975 11,005 848 396 a ,766 2,411 .5,5841976 12,072 825 589 r1,690 2,619 6,3591977 13,154 887 733 ., 1,766 3,011 6,7571978 13,690 946 871. 1,717 ,226 6,9301279 14,040 992 990 1,632 3,464 6,9661980 14,453 999
I' 1,193 1,810- 3,321 7,130
1Includes environmental science.
21ncludes computer specialties.3Includes psychology.Source: National Center for Education Statistics, -Earned Degrees Conferred
Science Foundation.
, 1
(annual series) and thl National.

N.
Appendix table 57.-Science and engineering doctorate recipientsby field and'sex: 1970-80
YearTotalS/E
Physical -
sciences EngineeringMathematical
sciences 2tife
sciencesSocial
sciences 3"
3
Total
1970 17,639 . 4/313 3,681 1,343 , 4,131 4,1711971 18,466 4,391 . 3,654 1,327 '11,534 4,560°1972 18,412 4,103 3,704 1,295 4,478 4,8321,973 18,598 4,016 3,560 1,264 4,524 5,2341974 17,865 3,631 .3,336 1,229 4,220 504491975 17,784 3,628 3,151 1,188 4,252 53565
$
1976 17,288 3,433 2,835 1;100 .r 4,203 5,717 4
1977 16,937 3,344 2,599 1,039 4,199 5,756.1978 16.196 3,137 2,442 1,001 4,179 5°,437
1979 16,163 3,104 2,517 966 4,403 5,373 I.1980 17,195 3,151 2,479 963 4,710 5,892
Men
1970 16,112 4,077 1,245 3,632 3004- -1971 16,666 4,145
.3,6573,631 1,231 3,910 3,745--
1972 16,502 ,830 3,679 1,194 3,831 3,968.1973 16,310 ,742 -3.,496 i '11,147, 3,790 .4 _4,135
1974 15,453 3,378 3,281 1,120 3,488 4,188.1975 15,147 3,326 3,084 1,Q64 3,470 4,203"1976 14;502 3,133, 2,766 983 3,412 4,2081977 13,979 3,024 . 2,.525 911 3,408 4`,.11.42
1978 13,157 2,825 2,385 862 ', 3,307 3,77S,1979 13,053 2,754 2,434 814 3,429 3,622980 13,399' 2,765 2,389 847 . 3,563 3,835
Woien I
"0.1970 1,527 r 236 24 98. - - 499 670
1971, 1,800 246 23 96 624 811
1972 1,910 273 25 . 101 , 647 86419731974
2,2882,412
274253
64.55
117,., 109
734-712
1,0991,263
1975 2,637 302 67 124 782 1,3621976 2,786 ; 300 69 117 791 1,5091977 2,958 320 14 , 128 '791 1,6451978 3,039 312 57 11 139 872 1,6591929 3,310 350 83 .... 152 974 1,751 01980:, 3,796 386 .90 116 1,147 2,057
ihicludes environmental science..
21ncludes compu ter specialties.
3lncludes psychology.Source: National Academypf Sciences and National Science Foundation.

1
Appendix table Graduate degree attainment rates, by sex: 1972-80
Bachelor'sdegrees ,
Year NumberO
Master's /'degrees , Attainment
Year Number / rate
Bachelor'sdegrees
Year /slimier
Dibtoraldegrees-
year NumberAttainment
rates
1970197119721973/97419751976-19771978
1970197119724-
'197319741975197619771978
MenI'
f95,244 1972 44,010 22.5 1965 128,723 1972 ° 16,502 12.8198,180 1973 44;474 22.4 1966 133,989 _1973 16,310 12.2203,557 1974 43,630 21.4 1967 143,847 1974 15,453 -10.7211,552213,269
19751976
'42;84742,675'
'20.3 1968,1969
158,711.181,323
1975- 1976
. 15,14714,502
9.58.0
' 201,578 1977 ,13'9-577,20.021.6 1970 1977 013,,979 7.2
196,57T 1978 42,547 21.6 1971 19§s180 lin 13,157 6.6191,090** 1979 40,416 21.2 1972 03,557 1979 13,053 6.4188,197 1980 40,010 21.3 1973 2 552 ; 1980 13,399 6:3
WMen
68,87872,99677,-671
.197219731974
.9,5579,760,.
10,545
13.913,413.6
19651966,
) ' 1967
36,21339;482 .
44,002
19721973.1974
1,9102,2882,412
5.35.85.5
83,84991,793
'19751976
11,00514.072
3.113.2
19681909
53,46363,196
197,51926
2,6372,786
4.94.4
t93,342 1977 13,154 14.1 1970 68,878 1977 2,958 4.395,597 1978 13,690 14.3 1971 72,996 1178 3,039 4.2597,453" 1979 ,14,040 14.4 1972. 77,671 1979 3,310 4.3.
100,060 1980 - 14,453 14:4- 1973 , 83,839 1980 3,796 4.5, .
Source: National Center for Education Statistics and National Science Foundation, unpublished ata.° 4
.
rb155

.,Appendix table 59.-Siciente*A' engineering earned degrees by
field, rade, and degree level: 1978/79
6.0 9
- Field and 'race Bachelor's
Total
a/7AB fields 322,195Physical sciences 22,659Matheniatical:sciences 11,634Computer specialties' 8,392Engineering 4,, 58,003Life sciences .71,442PSychOrogy 42,561
.1Sbcial sciences 107,6:04
,
Master's Doctorates
tr,
50,2014,713
, 2,5712,528
11,4179,6977,852
11,423
14,4142,617
568188
1,6353,8872,5882,931
4,5,185 13,1844,3732,3t2
2,415520
.2,273 17510,082 ` '1,4038,9Q9 e 3.;6137,078 2,380
1,0,118 2,678
1,988 3948'6 4871 1365 4
246 25296 61476 111748 132
1895 590160'104 29149, 8850 . 183309 161
87 23236 "65
970 203,65 25"36, 625 1
215 22162 . 46191. 64276 39
-
/. White
All fields 2.84,852'Physical sciences 20,958Mathematicalesciences' 10,229Computer specialties 7,40-4Engineering 52,651Life sciences .64,445Psychology 36,648
'Social sciences 92,517
Black
All fieldsPhysical sciencesMathematical sciencesCompufer specialties'EngineeringLife sciences.PsychologySocial sciences .
18,743704.652507
1,7752,837 ,'3,2189,050
Asian
All fieldsPhysical sciencesMathematical SciencesComputer specialtiesEngineeringLife sciencesPsychologySocial sciences
7,080439
'324263
1,8581,788
7811,627
Hispanics
All figldsPhysical sciencesMathematical sciencesComputer specialtiesEngineerihgLife sciences, ."PsychologySociarsciences
10,333495 ,t288207
1,5552,1391,7373,912
P
4SOUrce: National Center for Eacatio Statistics and National Academy ofSciences, Doctorate Record File.
e '1
156

Appendix table 60.Posidoctorates in science and engineering'by field and sex: 1973, 19", and 197.9 .
.Men
Field 1973 1977 '1979,
All fields\
Physical scientists, ;
,4,800"
- 1,10
7,700
2,300
8,000
1,900
Women'
1973 1977 1979
Mathematical scientists
Computer specialists.,-
100
(1):
100
(1)
200
(1)
Environmental scientists 200 300 300
Engineers 200 400 200 '
Life scientistR 2,206 3,900 4,700...,--- i
Psychologists 200 400 400
Social gntists 200 ' '400 300
900 2,000 2,200
100 . 300 300
11) . (1) (1)/,
(1) (1.) (1)
(1) (1) (1)
(1.) (1), (1)
60 1,300 1;500, ...
100 200' 200
(1) , 100 100
/k ..1r
1Too few cases to estimate. . /..,
Note: Detail may not add to totals because of ro}inding:-....._S rce: National Science Foundation, Characteristics of- Doctoral Scientists and
Engineers in the United States (biennial series, 1977-79) and unzublisheddata.
n.
.
5.7
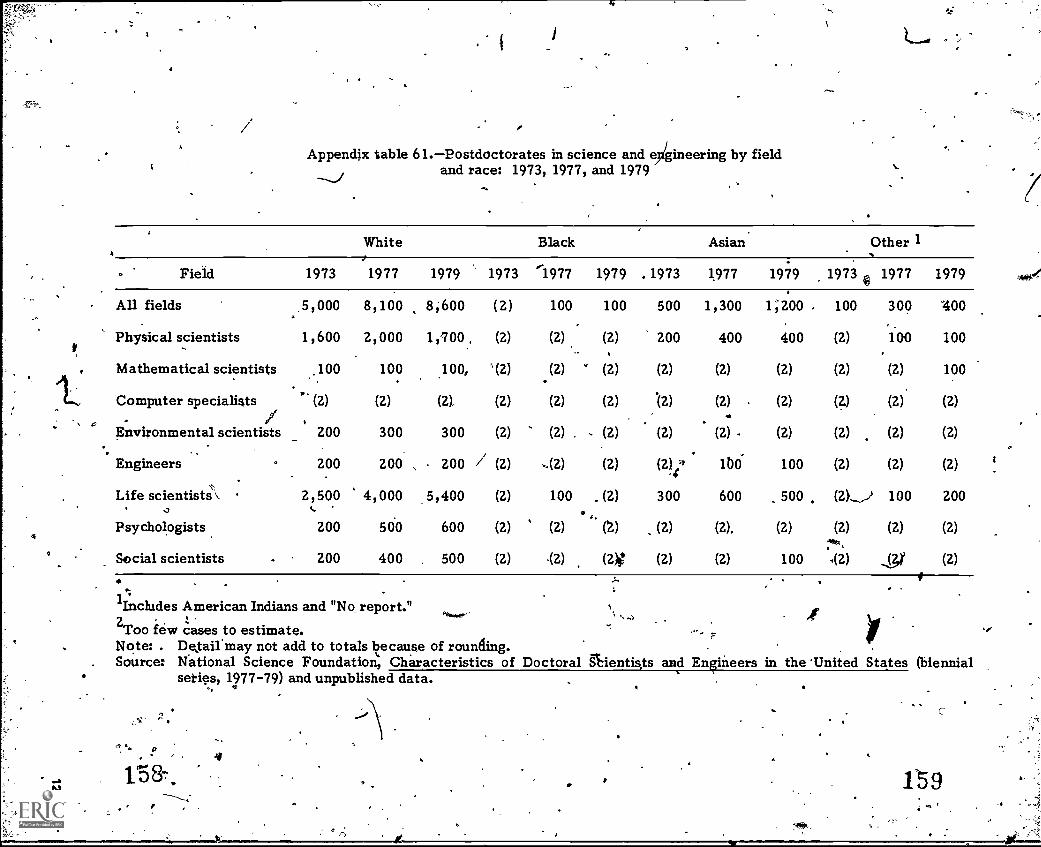
4
Appendix table 61.Postdoctorates in science and eyigineering by fieldand race: 1973, 1977, and 19791.1
White Black Asian Other 1
Field 1973 1977 1979 1973 1977 1979 . 1973 1977 1979 1973 4
All fields ,5,000 8,100 8;600 (2) 100 100 500 1,300 1 ;200. 100
Physical scientists 1, 600 2, 000 1,700 , (2) (2) (2) 200 400 400 (2)
Mathematical scientists 100 100 100, ''(2) (2) ' (2) (2) (2) (2) (2)
Computer specialists (2) (2) (2). (2) (2) (2) (2) (2) (2) (1). i , .
Environmental scientists 200 300 300 (2) (2) . - (2) (2) (2) (2) (2)
. .Engineers ° 200 200 , 200 / (2) ..(2) (2) (2) ' , 160- 100 (2)
Life scientists,\ . 2,500 4,000 5,400 (2) 100 . (2) 300 600 500 (2)9
t.4 .
Psychologists 200 500 600 (2) (2) (2) (2) (2). (2) (2)
Social scientists 200 400 . 500 (2) 42) (2)11 (2) (2) 100 .(2)
'Includes American Indians and "No report."2Too few cases to estimate.zcNote:. Detail may not add to totals because of rounding.Source: National Science Foundation, Characteristics of Doctoral Slientists and Engineers in the 'United States (biennial
series, 1977-79) and unpublished data.
1977 1979
300 400
100 100
(2) 100
(2) (2)
(2) (2)
(2) (2)
100 200
(2) (2)
41 (2)
41
1591

1
66,
Appendix table 62.Graduate Rec d Examination (GRE) scores by sex, race,and undergraWate major: 1978/79
"
Sex and racePhysicalscience
Mathematicalscience
MenVerbal'QuantitativeAnalytical
51464055g
510682568
WomenVerbal 534 498Quantitative '600 1(36Analytical 564 565
.WhiteVerb 541 537Quantitative 639 682 kAnalytical 581 . 602
)31ackb.Verbaj 391
.' .11364 .\-"
Quantitative 462 486Analytical 406 .401
,Asiaii.( .
Verbal 495 476. Quantitative 6613 \ 660
Analytical 546 549
,/.
..
.Biological Behavioral apcialh. Engineering scie ce science science
465661525
. 497603534
. 527675587
L3521
,. . 437
459675533
'485"377518
500 \528526'
521569553
.
35838130, *
494596
-537 ".: .,6
506 452522 501509 473
509 457479 446513" 469
528 484514 496535 506
i,
386 343366 337371 333
503 328 4 4
510 4
Source: Cheryl L. Wild, A Summary of Data Collected From Graduate Record Examination Test-Takers Dui.'1978/79, Data Summary Report #4 (Princeton, N.J.: Educational Testing Service, March 1980), pp. 68-776-78.
s.
itoa
41.

;A
- Appendix table 63.Graduate Record Examitiation (GRE) scores by undergraduatemajor and Hispanic cirgin: 1978/79 .
4se
Undergraduate\major
Mexicah Arcierican Puerto Rican Latin American
Verbal Quantitative `Analytical Verbal Quantitative Analytical Verbal Quantitative Analytical
Physical-science , 56,9 600. 516 418 532 433 509 . 592 524
Mathematical science 420 59,5 467 375 550 412 ,* 468 626 530
Engineering . - 434 595 .At*
487 390 583 439 476 624 520.
Biological science 407 448 421 398 450 `401 473 509 484
Behavioral science 446 427 435 399 387 si. . 382 481 460 473
Social ieience * 409
>,t
413 .404 ' 363. 378 362 465 429 448'. ,
Source: Cheryl L. Wild, A Summary of Data Collected From Graduate ecord Examination Test-Takers During 1978=79, Data SummaryReport 114 (Princeton, N.J.: Educational Testing Service, 6March 980), pp. 76 -78.
.... .
, ..%,,
-1.61
A
S
r.
162 °1
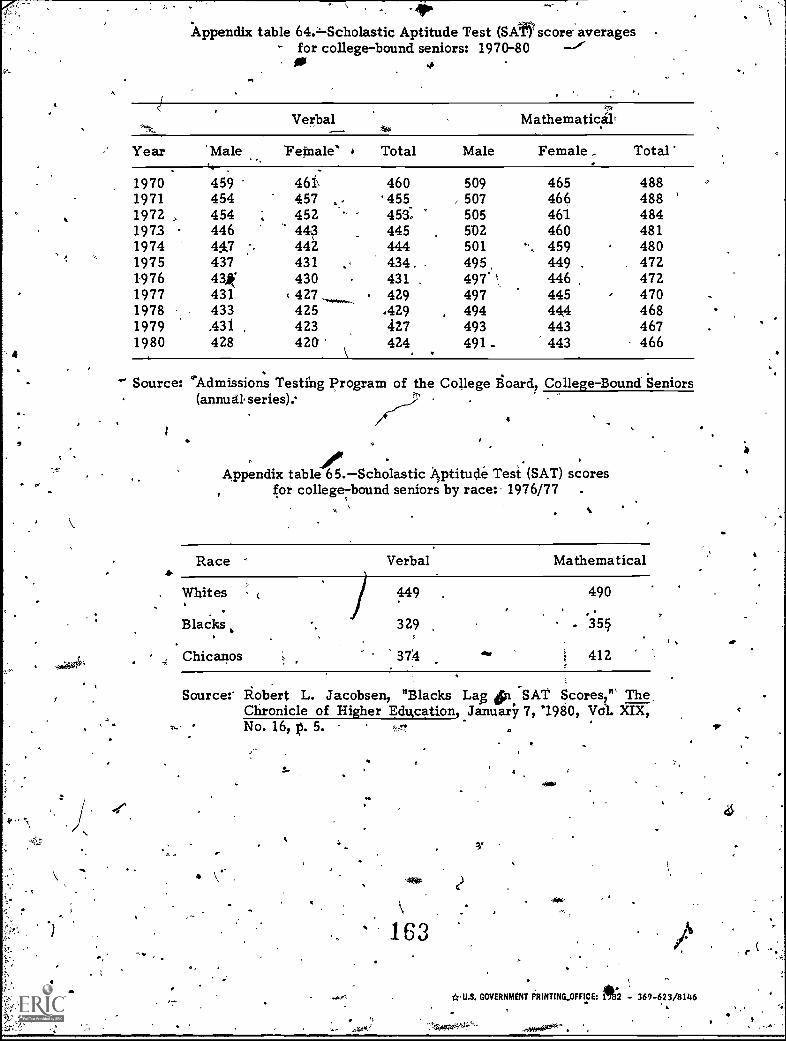
410"
Appendix table 64.-1-Scholastic Aptitude Test (SAWscore averagesfor college-bound seniors: 1970-80
OP
'4
Verbal Mathematic#
Year 'Male .., Feina le' Total Male Female , Total
197019711972 ,197.31974197519761977197819791980
.
45945445444644,743743,E431433,431428
..
461457 .
452 .,
443442431430427425423420
460455453 :,
445444434431429
.429427424
509, 507
505502501495,497*497
, 494493491_
'
465466
460
449.446445444443443
488488488484481480472472470468467466
.
-
'
" Source: °'Admissions Testing Program of the College Board, College-Bound Seniors(annud series):
Appendix table Scholastic Aptitude Test (SAT) scoresfor college -bound seniors by race:. 1976/77 .
Race Verbal Mathematical
Whites 449 490
'35§Blacks 329
Chicanos 374 412
Source: Robert L. Jacobsen, "Blacks Lag 61 -SAT Scoresz' The.Chronicle of Higher Education, January 7, 1980, Vol. XIX,No. 16, p. 5. .-
'4
163
* U.S. GOVERNMENT PRINTINLOFFIGE: PINS2 - 369-623/8146