Embed Size (px)
Citation preview

DOCUMENT RESUME
ED 077 774 SE 016 417
AUTHOR McDermott, Cecil W.TITLE The ' Development of an Individualized Learning System
for students Studying Intermediate Algebra, FinalReport.
INSTITUTION Hendrix Coll., Conway, Ark.SPONS AGENCY National Center for Educational Research and
Development (DHEW/OE), Washington, D.C.BUREAU NO BR-2-F-004PUB DAZE Jul 73CONTRACT OEC-6-72-0725(509)NOTE 41p.
EDRS PRICE MF-$0.65 HC-$3.29DESCRIPTORS *Algebra; Autoinstructional Aids; *College
Mathematics; Curriculum; *Individualized Instruction;Instruction; Instructional Media; LaboratoryProcedures; Mathematics Education; *Prc)gramDescriptions; *Research; tutoring
ABSTRACTAn audio-tutorial learning system for college
students studying intermediate algebra was developed by a member ofthe mathematics staff and was directed by student assistants. Ananalysis of covariance design was used to determine if studentsreceiving help from student assistants did significantly better thanthose not receiving help. Results showed that when initial abilitiesin mathematics (as determined by Blyth Algebra pretest and CollegeEntrance Examination Board scores) were held constant, the groupreceiving no help had a significantly higher Blyth Algebra posttestmean score. Both groups achieved significantly above the nationalaverage. (Author/DT)

FILMED FROM BEST AVAILABLE COPY
Final Report
Project No. 2F004Contract No. OEC-6-72-0725-(509)
Dr. Cecil W. McDermottProfessor of MathematicsHendrix CollegeConway, Arkansas 72032
U S DEPARTMENT OF HEALTHEDUCATION & WELFARENATIONAL INSTITUTE OF
EDUCATION7 .A 00C u v. E r,* rIAS tit- I % REPROD,cr:, Ix ''L Y AS RECF Vf 0 r RON'vkE PERSC . ,R ORGANIZA 1 .ON ORIGINA. INC. T PONTS OF ',.,IFA .),, OPINIONSSTATC 0 DO NOT HFCESS 21; V RE PRE(-NT Or F IC:AL NA-10%Al ,NSTTUTF 0'
EDUCATION POSITION OR POLICY
THE DEVELOPMENT OF AN INDIVIDUALIZED LEARNING SYSTEM FORSTUDENTS STUDYING INTERMEDIATE ALGEBRA
July 6, 1973
O. S. DEPARTMENT OF HEALTH, EDUCATION, AND WELFARE
Office of Education
National Center for Educational Research and Development(Regional Research Program)

ABSTRACT
An audio-tutorial learning system for college students studyingintermediate algebra was developed and directed by student assistants.
A member of the mathematics staff developed the system and assignedfinal grades. Otherwise, the mathematics staff was not involved.
An analysis of covariance design was used to determine ifstudents receiving help from student assistants do significantlybetter than those not receiving help. Initial abilities in mathematicsas determined by Blyth Algebra pretest, discriminatory analysis, andCollege Entrance 2xamination Board scores were held constant. Thegroup receiving no help had a significantly higher Blyth Algebra posttest mean score when the Blyth Algebra pretest and College EntranceExamination Board scores were held constant. Both groups achievedsignificantly above the national average.
It was concluded that college students capable of directingtheir own learning can successfully master intermediate algebraconcepts when the students are placed in a well defined self pacingaudio-tutorial learning system. Students faced with no teacher helpavailable may work more intensely and achieve at a significantly higherlevel than students receiving help on a systematic basis. Instructionalcost for precalculus mathematics instruction may be reduced by as muchas forty percent over a five year period.

Final Report
Project No. 2F004Contract No. OEC-6-72-0725-(509)
THE DEVELOPMENT OF AN INDIVIDUALIZED LEARNING SYSTEM FORSTUDENTS STUDYING INTERMEDIATE ALGEBRA
Dr. Cecil W. McDermottProfessor of Mathematics
Hendrix CollegeConway, Arkansas 72032
July 6, 1973
The research reported herein was performed pursuant to a
contract with the Office of Education, U.S. Departmentof Health, Education, and Welfare. Contractors under-taking such projects under Government sponsorship areencouraged to express freely their professional judgmentin the conduct of the project. Points of view or opinionsstated do not, therefore, necessarily represent officialOffice of Edacation position or policy.
U.S. DEPARTMENT OFHEALTi {, EDUCATION, AND WELFARE
Office of EducationNational Center for Educational Research and Development

PREFACE
This research report is the culmination of a project whichbegan in the summer of 1971. Much credit for the research proposalas originally conceived goes to Dr. Willis Alderson, former assistantto the President, Hendrix College. His encouragement was a source ofstrength as the project went through various forms of revision. Itwould be remiss if special appreciation were not given to Dr. BurvinC. Alread, the contracting officer for Hendrix College and Mr. RodneyTodd, chief accountant and business manager for their advice inconnection with record keeping, interim reports, and expenditures.Finally, no value can be placed on the contribution that Pat Huggler,Debra Roberts, Cathy McLendon, and John Lovett made to this researchproject. Each was dependable, competent, and dedicated. Eachassisted the project director by carrying out instructions affectingthe research in such a way that no crisis was experienced during theeighteen month duration of the project. Their selection as assistantsproved to be extremely wise.

r TABLE OF CONTENTS
LIST OF TABLES
I. INTRODUCTION
Purpose of the StudyLocal Implications of the StudyGeneral Overview of the Learning
System and Cost FactorsThe Learning System Operational
DetailsRelated Literature
vi
II. EXPERIMENTAL METHODS 5
Description of the ComparableLearning Systems
Audio-Tutorial MethodsExperimental Design and Methods
of Procedure
III. RESULTS 10
IV. CONCLUSIONS AND RECOMMENDATIONS 18
ConclusionsRecommendations
BIBLIOGRAMY 20
APPENDIXES 22

LIST OF TABLES
TABLE PAGE
1. LEARN] G EXPERIENCES BY UNITEXPERIMENTAL GROUP a 7
2. LEARNING EXPERIENCES BY UNITCONTROL GROUP 8
3. GENERAL DATA EXPERIMENTAL GROUP a 11
4. GENERAL DATA CONTROL GROUP fl 12
5. ANALYSIS OF COVARIANCE SU1NARYBLYTH ALGEBRA PRETEST AND POST TEST 13
6. ANALYSIS OF COVARIANCE SUMMARY V SCOREAND BLYTH ALGEBRA POST TEST
7. ANALYSIS OF COVARIANCE SUMMARY CEEB MATHAND BLYTH ALGEBRA POST TEST
13
14
8. F TEST FOR RATIO OFPOS2 TEST VARIANCES 14
9. STATISTICAL ANALYSIS OF TIMEDEVOTED TO COURSE 15
10. UNIT TEST AVERAGE SCORES BY GROUP 37
vi

I. INTRODUCTION
Purpose of the Study
The purpose of this study was to develop a program of individ-ualized instruction for students not adequately prepared for elementaryfunctions, the first course in mathematics at Hendrix College. Studentsnot prepared for elementary functions as determined by a discriminatoryanalysis guide were placed in an intermediate algebra learningsequence. The sequence utilized an audio-tutorial learning systembased on an audio-tutorial text, keyed in tapes and filmstrips, andproblem sessions. The student's progress was measured by using astandardized pretest, unit tests, and standardized post test. Thestudent's attitudes were measured by an attitude survey.
Local Implications of the Study
The Hendrix College mathematics department developed a discrimi-natory analysis guide in 1971 for the purpose of placing students iseither calculus, elementary functions, or contemporary mathematics. Acopy of this guide is in Appendix A. The traditional two term sequencein algebra and trigonometry was removed in the spring of 1971 andreplaced by a more rigorous one term course in elementary functions.It was anticipated at the time of this proposal that 130 to 150students would take elementary functions each of the school years1971-72 and 1972-73. Because of the lack of high school preparationit was anticipated that 20 to 30 of'these students would need toparticipate in an intermediate algebra course during each of the schoolyears 1971-72 and 1972-73. It should be noted that 116 students tookelementary functions during the school year 1971-72 and 147 during1972-73 and 78 participated in an experimental intermediate algebracourse during 1971-72 and 1972-73. The situation was predicted andturned out to be one that provided an opportunity to conduct someresearch related to the development of an efficient learning systemthat would solve a problem and make it possible for a mathematics staffto reallocate its time without affecting the precalculus mathematicsinstructional program.
General Overview of the Learning System and Cost Factors
fhe learning system developed and used in the experimentassociated with this project was designed specifically for collegemathematics instruction using the particular combination of instructional

devices: a discriminate analysis placement process, an audio-tutorialtext, keyed in Cassette tapes and filmstrips, a standardized pretest,
unit test, a standardized post test, a student coordinated test-11:gprogram, and problem sessions. The system was developed by thisresearcher with assistance from a mathematics education student, DebraRoberts, and then operated by two mathematics majors, Pat Huggler andJohn Lovett. Although some components of the system were developed tomeet the specific needs of Hendrix College freshmen mathematicsstudents, the organizational structure was developed in such a waythat it can be readily adapted to other colleges. As will be madeclear in this report, the learning system can be.used to reallocatestaff resources, yet efficiently teach elementary precai.culus mathe-matics concepts. The total cost for 76 students taking intermediatealgebra by traditional instruction would have been $3750.00 or $53.00per student. This figure is based on the salaries of the two instruc-tors who would have devoted 12.5% of their time to the courses.
If the system had not been in an experimental mode, that is noexperiment had been conducted, the cost would have been $3040.00 or$40.00 per student. This figure includes $780.00 for student help,$1760.00 for equipment and materials, and $500.00 for superv'sion,student placement, and student evaluation by the mathematics staff. It
is easy to see that the second year the system operates the cost ofequipment is re(hced and therefore total cost is reduced. It is thisresearcher's opinion that the system would only cost $32.00 per studentover a five year period whereas regular instruction would be about$60.00 considering increased salaries. Although these figures arebased on the situation at Hendrix College, do not include indirectcosts which are the same for either method of instruction, and relateto 76 students, the comparisons in cost of teaching methods withsimilar results is dependable and significant.
The Learning System--Operational Details
A freshman at Hendrix College is placed in either calculus,elementary functions, or contemporary mathematics (a general educationnon-skills course). Students placed in contemporary mathematics butdesiring to take elementary functions at some future time areencouraged to enroll in "Math Lab." Math Lab utilizes the learningsystem developed in this project. It is a credit no-grade course andis strictly preparation for elementary functions. It does not meet anymathematics requirement but is counted as an elective toward the 36courses required for graduation.
Students assigned to Math Lab assemble together the evening ofthe first day of classes for the term. A mathematics instructordescribes the learning system in which each student participates.During the course of the experiment outlined in the next section ofthis report, this researcher described the system and randomly assignedstudents to the experimental and control sections. Students'schedules are studied and ten class periods set up each week as help or
2

testing sessions. This is done in such a way that each student canreceive help or tz.ke a test at least three times each week. Daring 01eexperiment students receiving no help were not allowed Lc a'-..end prob-leMsessions.
During the Math Lab opening class session the audio-tutorialtext is discussed in detail and the manner in which the Cassette ta-)cs
and filmst.:-"ps ale to be used is decribed. Equipment such as tapeplayers, earphones, and filmstrip viewers are demonstrated and thenlocated in a room in the main college library. Four work static2ns aremade available for use by !trail Lab students. Record forms ere ';iven toeach student and each is encouraged to record the time actually devotedto the course including problem sessions and test sessions. During thecourse of the experiment the record forms were occasionally checked soas to encourage record keeping. Clocks are provided in the :lath Labtesting room and in the library study room for convenience.
With these instructions the Math Lab becomes operational. Con-sider student A. The first convenient: period (one of the to _I periodsset up in tl'e opening class session) student A comes to the Math Labtesting room and takes the standardized pretest given by studentassistants. A file for student A is established and his pretest s(orerecorded. Student A then starts the course. After studying unit oneand working various types of study exercises, viewing the films pro-vided, and listening to tape lectures related to the material, thestudent comes in at an appropriate time and takes unit tes4- one. He iscareful to record the time devoted to unit one. Unit one test isadministered by a student assistant and the score recorded. If thestudent make 70% or better he is allowed to go on to the next unit.If the student makes less than 70% he must take an alternate form ofthe unit test when he is better prepared. This process is continueduntil all 14 units are completed. After the last unit test has beensuccessfully completed the student takes a standardized post test,tarns in his time sheet, completes an attitude survey intended as amonitor on the operation of the program, and therefore completes thecourse. At the end of the term the student assistants turn in thefiles on all students to the chairman of the mathematics department. Agrade of P is given to all students who complete twelve units with aminimum of 70% on each unit or a post test score of 26. If a studentdoes not complete either of these criteria and does not plan to do workduring the next term, the student can drop the course with appropriatenotification in accord with college regulations. If the student doesnot complete 14 units and plans to complete the course during the nextterm, the student is given a grade of I and one additional term tocomplete the course. During the experiment, all students were givenexactly one term to complete the course.
*The June 9, 1972 Progress report indicated that a student must
have a minimum score of 60% on 12 units or a post test score of 21.This standard was updated after a careful analysis of the data obtainedfrom the trial run during the spring of 1972.
3

Related Llterature
Experiments using linear prograLls, branch progran,s, conpnLerivt.dinztruetions, video cztpes, and oral prograining have been conOuccdthroughout the United States with soiue sie,nificant results. indu,tryand the armed seiviees have developed learning packages that areextremely effective in tne sense that facts are retained an ,:)T,Hed
successfully over 30-90 rerio(1s without reinforcement. Ti,e
Pro]ect, the Pcz,dri:: rxl,eriTent, and the Pi,..%N oral progr,17!inf.-, c'.
ment arc of piof;ra,:'; in individualized instruction in wnlchthis resealcher has utilived educational. technology in forrihg neweducational T1,ese programs relate to teachers,
or secondary school children, or elementary forms 01 learninc-,--but_ n,)cspcil:ically to college mathematic
F:- students. 'nese 7rograns uti!i7eonly one or two methods of presenting concepts. In fact, thischaracteristic of ,.:ost experiments currently being conducted whichrelate to individualized instruction.
The cxoeriment described in this project involves t,:o comolete
learning systerzs, co-.-ponents of which give a new linear ordering but
each component or Learnirg experience was selected in accord withrecent research findings. The edncational technology used was selectedso as to maxiiaize the learning of a given unit.
The audio-tutorial materials developed under Project 70 atFullerton, California were utilized. Copies of the audio-tutorialtext, Intermediate Algebra, by Gus Klentos and Joseph Nel:myer which caneout of Project 70 %..eve purchased from Charles E. Aerrill PublishingCompany. Tradition filmstrips were keyed into three of the 14 uniLsselected for the experiment using a Bell and Howell Cue recorder andSinger synchronized Cassette iilmstrip viewers. Audiotronic pldyers andheadsets were used in four student carrels.
4

t..
II. EXPERIMENTAL METHODS
Description of the Comparable Learning Systems
Two audio-tutorial learning systems were developed and compared.The following is a linear ordering of the components of each of thesystems.
Learning system a consists of 7 components.
1. Each student was placed in Math Lab based on a discriminatoryanalysis guide and student need for preparation for elementaryfunctions. Placement in experimental group a was done usingrandom numbers.
2. A one hour introduction to the learning system was given by amathematics instructor for the entire group. When enrollment
w_s completed, record forms were established for each student.
3. By Ailizing student schedules, ten hours each week were setup as test sessions so that each student had at least threehours available for testing. This ten hour schedule is
referred to as the Math Lab schedule.
4. A Blyth Algebra pretest was completed at the student's con-venience wiain the limits of the Math Lab schedule.
5. The student worked through 14 units of intermediate algebrausing audio-tutorial text, filmstrips, and Cassette tapes. Aunit was completed after a unit test score of 70% was obtained.Two forms of each unit test were available. All unit tests
were administered by student assistants during the scheduledten hour test sessions. The student recorded the time devotedto each unit of study.
6. The Blyth Algebra post test was taken after unit 14 was com-pleted or at the end of the term.
7. An attitude survey was completed by the student and the recordof time devoted to the course was placed in the student's
record file.
Learning system $ consists of the components of learning system
a and an addi:,:onal component. Briefly the components for S are:
5

4-
1. Student placement.
2. One hour introduction and establishment of record forms.
3. Development of Math Lab schedule.
4. Blyth Algebra pretest.
5. Work through 14 unite '- klished procedure.
6. A student may receive.. .2.1.p from the student assistants at
the student's convenience within the limits of the Math Labschedule. This is the additional component.
7. Blyth Algebra post test.
8. Attitude survey and record of time form.
The students assigned to learning system a will be referred toas experimental group a. The students assigned to learning system Rwill be referred to as control group R. Group a received no help.Group R received help. Tables 1 and 2 indicate the learning experi-ences by unit for groups a and R. Appendix B provides a list of thetopics treated in the 14 units.
Audio-Tutorial Methods
In the study of mathematics, most students are accustomed to thetraditional lecture-textbook method where they read a certain sectionin the text, go to class to hear a lecture on the material, then areleft to try to work the exercises. The frustrations of this type ofsituation are many. First, most studer:zs have difficulty reading amathematics textbook; second, once the classroom lecture is over, thechalkboard is erased and the explanatory lecture is lost; and third,many students have great difficulty working the homework assignment afew hours after the lecture.
The audiotutorial materials used in this experiment are anattempt to remedy the defects of the traditional lecture-textbookmethod. In the audio-tutorial approar±, the lecture and other explana-tions are put on audio tape. The chalkboard illustrations are put inthe text. Therefore, each student has a permanent record of thematerial generally presented in the classroom. The student may gothrough the lecture at his own rate, and any part of the lecture may bereviewed as often as desired by simply reversing the recorder and turn-ing back a few pages in the text.
Experimental Design and Methods of Procedure
Two audio-tutorial learning systems were compared. The timescheduled for each system was 68 days including 18 week-end days.
6

c.
TABLE 1
LEARNING EXPERIENCES BY UNITEXPERIMENTAL GROUP a
UnitLearningExperience 1 2 3 4 5 6 7 8 9 10 11 12 13 14
Description ofMath Lab x
Blyth Algebrapretest x
View filmstripwith sound x x X x
Read audio-tutorial text x x x x x x x x x x x x XXListen to tape x x x x x x x x x x x x x x
Attend problemsessions
Take unit test x x x x x x x x x x x x x x
Pick up testresults X x x XXXxXX x x x x x
Blyth Algebrapost test x
Attitude survey
7

TABLE 2
LEARNING EXPERIENCES BY UNITCONTROL GROUP a
LearningExperience
Unit
1 2 3 4 5 6 7 8 9 10 11 12 13 14
Description ofMath Lab x
Blyth AlgebraPretest x
View filmstripwith sound x x X x
Read audio-tutorial text XXXXXXXXXX x x x x
Listen to tape x x x x x x x x x x x x x x
Attend problemsession XXXXXXXXXX x x x x
Take unit test x x x x x x x x x x x x x x
Pick up testresults XXXXXXXXXX x x x x
Blyth Algebrapost test
Attitude survey
8
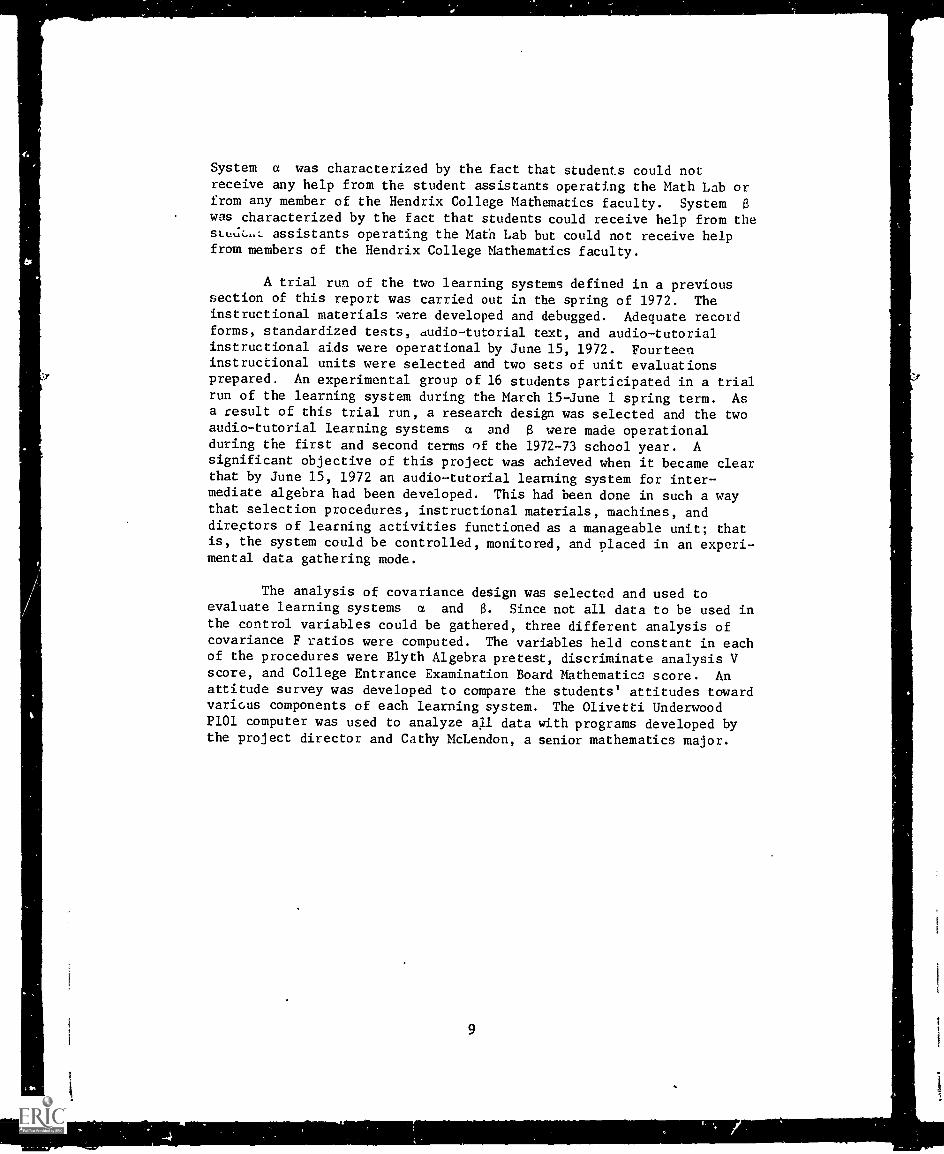
System a was characterized by the fact that students could notreceive any help from the student assistants operating the Math Lab orfrom any member of the Hendrix College Mathematics faculty. System a
was characterized by the fact that students could receive help from theassistants operating the Math Lab but could not receive help
from members of the Hendrix College Mathematics faculty.
A trial run of the two learning systems defined in a previoussection of this report was carried out in the spring of 1972. Theinstructional materials were developed and debugged. Adequate recoidforms, standardized tests, audio-tutorial text, and audio-tutorialinstructional aids were operational by June 15, 1972. Fourteeninstructional units were selected and two sets of unit evaluationsprepared. An experimental group of 16 students participated in a trialrun of the learning system during the March 15-June 1 spring term. Asa result of this trial run, a research design was selected and the twoaudio-tutorial learning systems a and B were made operationalduring the first and second terms of the 1972-73 school year. Asignificant objective of this project was achieved when it became clearthat by June 15, 1972 an audio-tutorial learning system for inter-mediate algebra had been developed. This had been done in such a waythat selection procedures, instructional materials, machines, anddireptors of learning activities functioned as a manageable unit; thatis, the system could be controlled, monitored, and placed in an experi-mental data gathering mode.
The analysis of covariance design was selected and used toevaluate learning systems a and S. Since not all data to be used inthe control variables could be gathered, three different analysis ofcovariance F ratios were computed. The variables held constant in eachof the procedures were Blyth Algebra pretest, discriminate analysis Vscore, and College Entrance Examination Board Mathematic score. Anattitude survey was developed to compare the students' attitudes towardvarious components of each learning system. The Olivetti UnderwoodP101 computer was used to analyze all data with programs developed bythe project director and Cathy McLendon, a senior mathematics major.
9

III. RESULTS
An analysis of covariance design was used to test the differencebetween post test means of experimental group a and control group S.
Since three different variables were held constant, three analysis ofcovariance treatments were carried out. Tables 3 and 4 give the dataused in the three treatments. Tables 5, 6, and 7 show the analysis ofcovariance summary tables. When pretest scores were held constantthere was a significant difference at the .01 level between the posttest means of group a and group 6 with group a having the highermean score. When discriminate analysis V scores were held constantthere was no significant difference at the .01 level between the posttest means of group a and group a. When the College EntranceExamination Board Mathematics scores were held constant there was asignificant difference at the .01 level between the post test means ofgroup a ;Ind group a with group a having the higher mean score.
An F statistic was computed to test the null hypothesisHo: a
a= as against the alternate hypothesis H
1: u
a# as . Table 8
gives the results associated with this statistical test. Ho wasaccepted at the 0.01 level.
Several other statistical studies were carried out although somewere not mentioned in the project proposal. Appendix C charts thenumber of hours devoted to the course by each student in both group a
and H. Table 9 provides a statistical analysis of the time devoted tothe course. There was no significant difference between the mean scoresfor the two groups. It should be noted that 15 of the 31 students ingroup a (levoted over 30 hours to the course while only 9 of the 27students in group a devoted over 30 hours to the course. Appendix Dgives the final grades assigned to each student in both group a and E.A grade of P was pass and a grade of F was fail. Only one student ingroup a failed the course. Four students in group a failed thecourse. It should be noted that the failure rate of approximately tenpercent is slightly less than the thirteen percent failure rateexperif-rced from 1967-71 in college algebra courses at Hendrix College.
The unit test played a role in motivation in the course in thata student could not go on to the next unit of study without making ascore of at least 70% on a unit test. Each test had 20 questions andtwo forms of each unit test were available. A particular unit test fora particular student was selected in a random manner. If a student hadto take a unit test r second t:me, then the alternate test was given.Appendix E indicates there was a Pearson r correlation of 0.611 betweenunit test average scores and post test scores for group a and a
10

TABLE 3
GENERAL DATAEXPERIMENTAL GROUP a
StudentCode
Blyth AlgebraPretest
CEEB
MathV
ScoreBlyth AlgebraPost test
1 20 580 1.03 332 23 590 0.85 253 16 480 0.60 224 16 x x 245 24 600 x 406 12 450 x 357 6 470 x 348 17 x x 299 21 450 0.32 2510 12 450 0.46 3011 18 390 0.27 3212 23 x x 3713 18 540 -0.08 2414 20 370 0.33 3515 30 x x 4116 15 x x 3017 15 310 0.24 3818 25 450 0.10 3919 29 420 0.63 3620 11 380 -0.15 2221 21 530 0.65 3622 33 500 0.92 4523 13 x x 3024 19 500 x 2825 19 470 0.70 3626 33 670 x 4027 14 480 x 2428 21 490 0.34 3329 18 450 0.11 3130 23 510 x 4031 16 430 -0.43 25
11

I
TABLE 4
GENERAL DATACONTROL GROUP
StudentCode
Blyth AlgebraPretest
CEEBMath
V
ScoreBlyth AlgebraPost test
101 28 320 -0.13 23
102 16 410 0.29 20103 11 400 x 27
104 19 x x 33105 15 x x 24
106 11 410 x 20
107 16 310 -0.11 21108 16 430 -0.16 17109 17 x x 27
110 10 420 0.10 14
111 22 x x 28112 20 470 -0.27 23
113 27 510 0.04 27
114 20 630 x 29
115 3 680 x 18
116 15 x x 21
117 14 440 -0.03 27
118 17 420 x 37
119 27 500 -0.13 34
120 18 x x 26
121 17 410 x 22
122 23 390 -0.00 33123 17 430 x 27
124 23 520 0.40 37
125 12 490 x 20
126 16 500 0.23 26127 24 440 x 37
128 21 380 -0.17 20
129 8 300 -0.04 19

f
TABLE 5
ANALYSIS OF COVARIANCE SUMARYBLYTH ALGEBRA PRETEST AND POST TEST
a
No. Cases Mean S.D. No. Cases Mean S.D.
Blyth Algebra Pretest 31 19.39 6.30 29 17.34 5.81
Blyth Algebra Post test 31 32.22 6.32 29 25.41 6.27
Analysis of Covariance
Source of variation df ssy.x msy.x
Among means 1 450.65 450.65
Within groups 57 1502.49 26.36
SDy.x = 5.13 Fy.x = 17.10 F0.01 = 7.11
Adjusted post test means due to analysis of covariance and regressionequation:
Mean post test a group 31.62
Mean post test Q group 26.06
The difference 5.56 is significant by the F and T test at the .01 level.
TABLE 6
ANALYSIS OF COVARIANCE SUMMARYV SCORE AND BLYTH ALGEBRA POST TEST
V Score
Blyth Algebra Post test
a B
No. Cases Mean S.D. No. Cases Mean S.D.
18
18
0.37
31.5
.40 14
6.53 14
.01
24.36
0.19
6.72
Analysis of Covariance
Source of Variation df ssy.x msy.x
Among means 1 127.31 127.31
Within means 29 1159.38 39.98
SDy.x = 6.32 Fy.x = 3.18 F01
= 7.60
Adjusted post test means due to analyiis of covariance and regressionequation:
Mean post test a : 30.39
Mean post test f3 : 25.74
The difference 4.65 is not significant by F or T test r. the .01 level.
13

TABLE 7
ANALYSIS OF COVARIANCE SUMMERYCEEB MATH AND BLYTH ALGEBRA POST TEST
a
No.Cases Mean S.D. No.Cases Mean S.D.
CEEB Math 24 481.67 82.87 23 443.91 88.93Blyth Algebra Post test 24 32.5 6.57 23 25.31 6.78
Analysis of Covariance
Source of Variation df ssy.x msy.x
Among means 1 528.16 528.14":
Within means 44 1946.16 44.23
SDy.x = 6.64 Fy.x = 11.94 F.01
= 7.25
Adjusted post test means due to analysis of covariance and regressionequation:
Mean post test a : 32.26
Mean post test 8 : 25.38
The difference 6.88 is significant by F and T test at the .01 level.
TABLE 8
F TEST FOR RATIO OF POST TEST VARIANCES
F nasal.
n s0
2
(na-1)a
a
2(n8 -1)a82
2
Ho : as = aa
H1 : as a8 F.01
2.47
Since sa = 6.32 , na = 31
and so = 6.27 n8 = 27 ,
then F = 1.01 and Ho was accepted
14

TABLE 9
STATISTICAL ANALYSIS OF TIME DEVOTED TO COURSE
No. ofCases Standard Deviation
Experiment Group a 31
Sample
Control Group a 29
xa - xat = 1.45
(s02 (s02
na no
11.12
10.16
t.01 2.71
There is no significant difference in the means.
Sample Mean
31.44 hours
27.46 hours
15

correlation of 0.632 between unit test average scores and post testscores for group a. This researcher was pleased with the correlationsconsidering the fact that one set of tests was prepared by the authorsof the audio-tutorial text and the other set of tests was prepared bythe project director and both sets of tests were constructed using onlyface validity.
The unit test average scores for each group were computed. Areview of Table 10 indicates that the group mean of the experimentalgroup a exceeded the control group (3 on 11 of the 14 units. Thisresult is compatible with other results obtained in this study.
The attitude survey had as its basic function the monitoring ofthe work of the student assistants. A copy of the attitude survey isincluded in Appendix E. Appendix E also provides detailed results ofthe survey. Thirty completed forms were received from group a and27 from group 0. Although only raw data is given in the appendix theresults were analyzed using a chi-square test. The results indicatedthat the student assistants' work was viewed as favorable but notoutstanding, a performance that can be duplicated with senior mathe-matics majors on a regular basis. It is doubtful that the studentassistants contributed significantly to the performance of the controlgroup 0. This is as it should be. The eight items relating to studentassistants were answered only by group S participants. Forty-eight ofthe 57 students responding felt that the learning system was wellorganized and 46 thought it had many advantages over the lecture discus-sion technique used in other mathematics courses. The difficulty levelof the material seemed appropriate and the attitude toward learningusing the learning system in this experiment was very positive. Theresponse to item 9 by group a was significantly different from theresponse by group 3. Twenty-three of the 30 students responding ingroup a thought some of the mathematics topics should have beenexplained more thoroughly whereas only 9 of the 27 students responding ingroup 0 responded in a similar fashion. The problem sessions providean explanation for the difference in the responses. Item 7 provided acheck on item 9. Although the results are not as significant, 14 of the30 students responding from group a felt they did not receive an ade-quate explanation of each mathematics topic whereas only 7 of the 27students responding in group a responded in a similar manner.
16

TABLE 10
UNIT TEST AVERAGE SCORES BY GROUP
Unit
Experimental Control
Group a Group 13
1 17.46 17.30
2 17.75 17.56
3 17.68 17.03
4 16.87 16.13
5 17.43 17.00
6 16.21 16.68
7 16.93 16.62
8 17.59 17.18
9 17.06 16.38
10 17.31 17.66
11 18.62 17.91
18.45 17.58
13 17.46 17,54
14 16.64 16.63
17

Conclusions
IV. CONCLUSIONS AND RECOMMENDATIONS
Two manageable and efficient audio-tutorial learning systemsbased on the audio-tutorial materials developed under Project 70 atFullerton Junior College, Fullerton, California were developed in sucha way that college students at Hendrix College learned mathematics skills
associated with intermediate algebra at a level significantly above thenational average as measured by the Blyth algebra test norms. The twolearning systems were compared. Students receiving no help from studentassistants but studying mathematics in a linearly ordered learning systemunder the direction of student assistants had mean scores significantlyhigher than the mean score of students receiving help from studentassistants and studying mathematics in a linearly ordered learning system.Both group means were above the national average based on post test norms.The systems were organized by a member of the Hendrix College mathematicsstaff, otherwise no member of the staff was involved. The cost of teach-ing intermediate algebra was reduced from $60.00 to $32.00 per student.In addition to a reduction in cost per student, the mathematics teachingstaff was free to devote more time to upper level courses. The programresulted in two desirable benefits for a small private liberal artscollege; a saving in instructional cost and the development of a broadercurriculum for mathematics majors.
This researcher feels that students capable of directing their ownlearning of low level mathematics skills need reinforcement and guidelinesfor performance. Adequate research results are available from othersources to support this claim. However, a dependency relationship betweenstudents and instructor can cause a student to procrastinate and faulterin his work. The myth that one can master great numbers of skills inalgebra during the last few days of a course was definitely a factor inthis experiment. Interviews with students in group S clearly show thatmost students felt that since help was available one could wait until thelast few days of the term to finish the course. Most of the students didfinish the course but with only superficial involvement. Learning wasnot accumulative and performance on the post test was poor. On the otherhand, the attitude survey indicates there is a need for clarification ofmathematical concepts riot adequately covered in any set of instructionalmaterials. Perhaps such assistance can be provided by student assistantsand without the development of a dependency relationship between instruc-tor and student. Additional research is needed to investigate thismatter.
18

Recommendations
Small libral arts colleges silould give serious consideration tothe development , c. audio-tutorial learning systems to be used in theteaching of low le-el mathematics concepts. Concepts taught in conven-tional college algebra, modern mathematics for elementary teachers, andgeneral education mathematics can be taught efficiently. Each collegeshould develop its own learning system but use commercially producedmaterials whenever possible. Audio-tutorial materials are available andthe state of technology related to Cassette players and filmstripviewers is satisfactory.
Student assistants should be junior or senior mathematics majorsinterested in teaching mathematics either at the high school or collegelevel. The student assistahLb should direct the learning system withonly limited involvement by the mathematics instructional staff. Studentassistants should generally limit the4c role to administering and gradingtests and the maintenance of records for evaluation purposes. However,clarification of concepts not adequately treated in the learning systemshould be permitted.
It is further recommended that studies be made as to the feasibil-ity of incorporating audio-tutorial 35 millimeter slides and drill cardsinto an aueio-tutorial learning system. Slides and drill cards mightprovide a way of giving a personal touch to the instructional materialsby the mathematics staff in a specific college. This researcher ispresently preparing a proposal which if funded would allow for theincorporation of 35 millimeter slides and drill cards into the learningsystem developed in this project. The intent is to add depth to thesystem to meet specific local needs.

BIBLIOGRAPHY
Books
Hays, William L. Statistics for the Social Sciences. New York: Holt,Rinehart and Winston, Irc., 1973.
Henderson, Kenneth. Teaching Secondary School Mathematics. Washington,D.C.: National Education Association, 1969. A Research Report.
Kerlinger, Fred. Foundations of Behavioral Research. New York: Holt,Rinehart and Winston, Inc., 1965.
McDermott, Cecil W. PLAN Programmed Mathematics. Little Rock, Arkansas:Programmed Learning Aids National, 1968.
Newmyer, Joseph and Klentos, Gus. Intermediate Algebra. Columbus, Ohio:Charles Merrill, 1970. Audio-tutorial Approach.
U.S. Department of Health, Education, and Welfare. Analysis of Researchin the Teaching of Mathematics. Washington, D.C.: Office ofEducation, 1965.
Walpole, Ronald. Introduction to Statistics. New York: MacmillanCompany, 1968.
West, Lorna. Cedar Park School. Selma, Alabama: Coffee PrintingCompany, 1970. Report on a Title III project for the Advancement ofCreativity in Education.
Periodicals
McDermott, Cecil W. "Discriminatory Analysis Guide for Freshman Place-ment in Mathematics at Hendrix COlege," Educational ResearchArkansas (Sumrer, 1971), 52-58.
McDermott, Cecil W. "Improving Math Instruction at Hendrix College,"Mathematics Currents, XII (May, 1972), 6-9.
McDermott, Cecil W. "The Hendrix Experiment," Arithmetic Teacher,XVIII (March, 1971), 1962.
20

McDermott, Cecil W. "The Establishment of Parameters for a Learning
System in CompuLer Programming Defined by a Fixed Linear Orderingof Components," Educational Research in Arkansas (Spring, 1973),40-43.
White, Virginia. "A Profile of Individualized Instruction,"Mathematics Teacher, LXV (May, 1972), 448-453.
Whitten, Bill. "Mathematics--A New Course Plan at Hendrix College,"Arkansas Gazette, (March 4, 1973) 4E.
Unpublished Reports
Bulpitt, Mildred. Project 70. Fullerton, California: FullertonCollege, 1971.
McDermott, Cecil W. Calculators in a General Mathematics Laboratory.Wynne, Arkansas: Wynne Public Schools, 1968. An Evaluation ofOperation Grant 67-2853 ESEA Title III.
21

APPENDIX A
Discriminatory Analysis Guide
for Freshman Placement, in Mathematics
at Hendrix College
Dr. Cecil W. McDermott
Hendrix College
Conway, Arkansas
June 3, 1971
This project was conducted through a grant fromthe Arkansas Educational Research StimulationProgram of the U.S. Office of Education andadministered by the Arkansas Commi3sion onCoordination of Higher Educational Finance.
22

DISCRIMINATORY ANALYSIS GUIDEFOR FRESHMEN PLACEMENT IN MATHEMATICS
AT HENDRIX COLLEGE
I. Statement of the Problem and Objectives
Entering freshmen students at Hendrix College in the fall of 1971will be placed in one of our courses: precalculus mathematics, calcu-lus, contemporary mathematics, or Math Lab. The students are placedaccording to their past performances in high school mathematics courses,total grade point average, and college entrance examination scores. Theplacement procedure has emphasized an "intuitive feeling" about the
student's potential mathematical ability rather than fully utilizing thedata available. The purpose of this project is to make it possible toutilize four years of data in running a discriminatory analysis toproperly place freshmen students in freshmen level courses in such a wayas to maximize their chances for success in the course for which theyare best qualified.
II. Method of Research
This researcher has maintained a detailed set of data on allentering freshmen since the fall of 1967. Each student's grades in highschool mathematics courses, overall grade point average, College EntranceBoard (CEEB) verbal and mathematics scores, and two standardized mathe-matics test scores have been available for statistical analysis. Alsoavailable were the grades each student made in his freshman mathematicscourses: calculus, college algebra, and trigonometry.
The statistical technique of discriminatory analysis was used tofind the variables which best predicted a student's chances of successin each of the freshman mathematics courses. Success was defined as apredicted grade of C or better and failure was defined as a predictedgrade of D or F.
The discriminatory analysis was carried out using Olivetti Under-wood P101 and IBM 360-50 64K computers. The results consist of anequation involving five variables. The number generated by the equationis a prediction about a student's chances of success in either calculusor precalculus mathematics.
III. Resume of Findings
(a) Data characteristics
Data was obtained on 1170 freshmen students who have entered
23

Hendrix College since 1967. Of these students, 313 were successful infreshman mathematics (A, B, or C in calculus, or A, B in collegealgebra) and 193 were not successful (D, F in calculus and C, D, F incollege algebra). Complete data on six variables have been obtained.The variables are: (1) freshmen mathematics grades, (2) CEEB verbalscores, (3) CEEB mathematics scores, (4) overall high school gradepoint, average, (5) a rating of mathematical grades and courses, and(6) a high school incentive quotient defined especially for this project.
(b) The Discriminate Equation
The biserial correlation coefficient is satisfactory for deter-mining the relationship between a dichotomized variable and one continu-ous variable. However, it is often desirable to predict a dichotomyfrom several numerical variables. Just as multiple regression yieldsappropriate weight for utilizing more than one variable in predicting anumerical criterion, so also an equation can be used in predicting avariable dichotomy. The latter equation is called a discriminantequation. A coefficient of multiple biserial R can be obtained from a
discriminant equation and is similar to the coefficient of multiplecorrelation.
A discriminant equation, originally developed by R. Z. Fisher, isvery useful in ascertaining appropriate weights for a series of variablesyielding maximum separation of two groups, each of which is assumed to benormally distributed. The equation may be expressed asV = aixi + a2x2 + + amxm where xl, x2, ...xm are continuous variablesand al, a2, ...am are coefficients. The coefficients for the equation are
found by solving a series of simultaneous equations similar to the normalequations used in multiple regression analysis.
The discriminant equation lends itself to the prediction of successin a specific course and upon solution the output of the equation is indeviation form with a range of about -3 to +3. The equation can bechanged from deviation form.
The equation obtained in this study is in raw score form. Anequation for placing students in freshman calculus mathematics wasobtained using data on four freshman classes. The equation isV = 0.0008956x1 + 0.001098x2 + 0.1898x3 + 0.02525x4 + 0.01027x5 - 2.3953.
A student is placed using this equation only if he has successfullycompleted trigonometry.
When applied to all students involved in the study the placementprocedure was 84% accurate.
V scores for students were obtained and cut off points wereestablished so that the best accuracy could be obtained on 496 studentswhose grades in freshman mathematics we had obtained. Cut off V scoreswere selected so that the predictions coincided with the results asmuch as possible. A student with a V score of 1.29 or more will hestrongly recommended for calculus. A student with a score from 0.68 to1.28 will be recommended for calculus. A student with a score from 0.51
-A-
24

to 0.67 will be recommended for calculus with caution.
An equation for placing students in freshman precalculus mathe-matics was obtained to be used in placing students without trigonometry.It yields a set of V scores that would be obtained from the calculusequation. rhe following equation is just as accurate for placementpurposes as the calculus equation: V = 0.0008956x1 + 0.001098x2 +
0.1898x3+ 0.02525x4 + 0.01027x5 - 1.9153. A student with a V score of
0.50 or higher will be recommended for elementary functions. A studentwith a V score of 0.25 to 0.49 will be recommended for elementaryfunctions with caution. A student with a V score of 0.24 or lower willbe recommended for Math Lab or contemporary mathematics.
It should be noted that the placement procedure outlined in thisreport results in a recommendation to the student and the student'sadvisor. A student will be encouraged to follow the recommendation,however one may feel his background is stronger or weaker than thatindicated by the V score. Therefore, a student may a.:tually enroll inMath Lab when it was recommended that the student take elementaryfunctions.
25
APPENDIX B
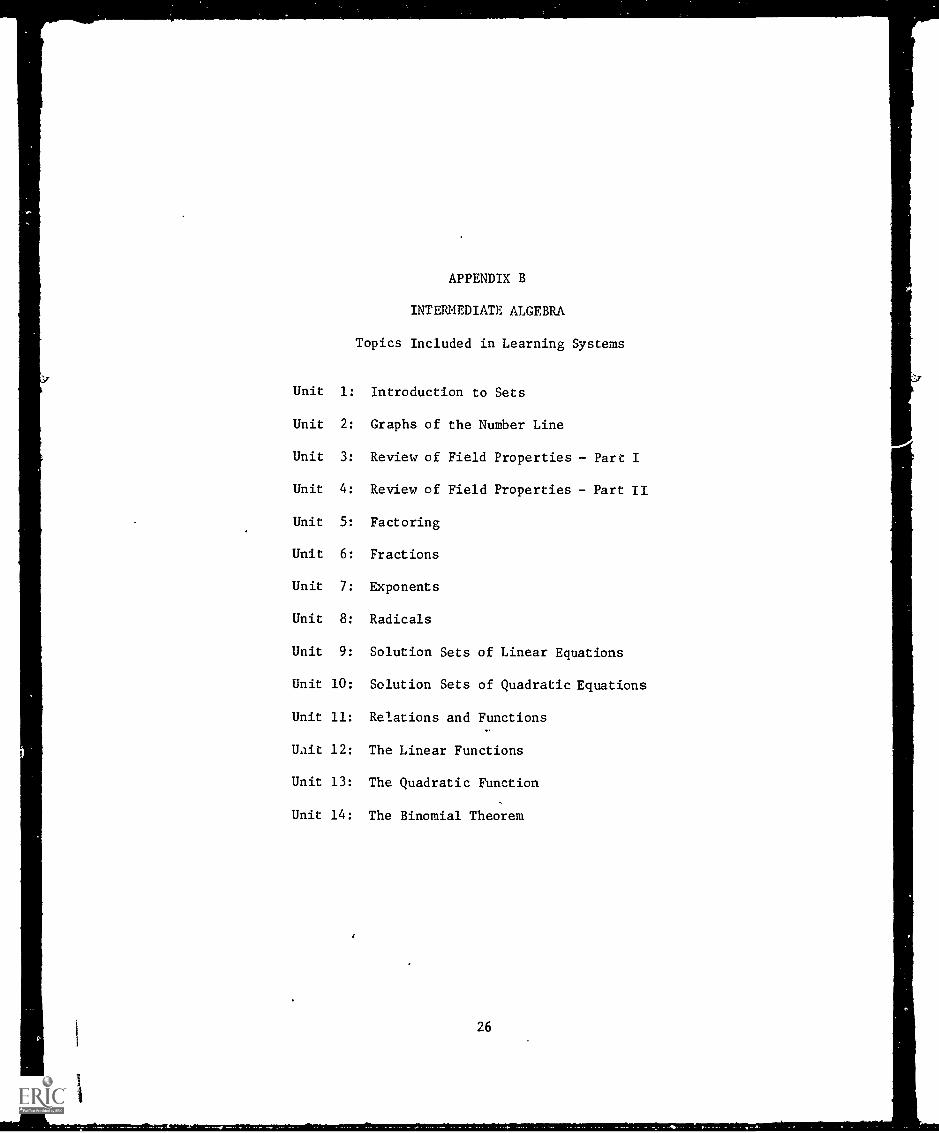
INTERMEDIATE ALGEBRA
Topics Included in Learning Systems
Unit 1: Introduction to Sets
Unit 2: Graphs of the Number Line
Unit 3: Review of Field Properties - Part I
Unit 4: Review of Field Properties - Part II
Unit 5: Factoring
Unit 6: Fractions
Unit 7: Exponents
Unit 8: Radicals
Unit 9: Solution Sets of Linear Equations
Unit 10: Solution Sets of Quadratic Equations
Unit 11: Relations and Functions
Uait 12: The Linear Functions
Unit 13: The Quadratic Function
Unit 14: The Binomial Theorem
26

APPENDIX C
TIME DEVOTED TO COURSE
Experimental Group a
Number of Hours
Student Code Devoted to Course
1 24.75
2 27.75
3 22.75
4 25.75
5 34.50
6 38.25
7 11-43.50
Control Group 8
Number of HoursStudent Code Devoted to Course
101 18.75
102 20.25
103 53.00104 25.75
105 30.25106 31.75107 38.75
8 28.75 108 23.75
9 22.75 109 18.50
10 19.25 110 15.25
11 29.75 111 26.50
12 20.00 112 25.2513 26.75 113 16.50
14 30.00 114 22.75
15 15.50 115 22.50
16 39.50 116 39.00
17 33.00 117 27.50
18 36.75 118 29.00
19 14.00 119 12.75
20 44.25 120 23.25
21 19.25 121 44.75
22 18.25 122 25.75
23 49.75 123 15.25
24 40.25 124 21.00
25 37.75 125 21.25
26 29.75 126 44.0027 32.25 127 41.0028 28.75 128 22.50
29 34.00 129 40.00
30 40.25
31 67.00

APPENDIX D
FINAL GRADE ASSIGNMENT
Experimental Group a
Student Code Grade
Control Group
Student Code Grade
1 P 101 P
2 P 102 P
3 P 103 P
4 P 104 P
5 P 105 P
6 P 106 *F
7 P 107 P
8 P 108 *F
9 *F 109 P
10 P 110 *F
11 P 111 P
12 P 112 P
13 P 113 P
14 P 114 P
15 P 115 *F
16 P 116 P
17 P 117 P
18 P 118 P
19 P 119 P
20 P 120 P
21 P 121 P .
22 P 122 P
23 P 123 P
24 P 124 P
25 P 125 P
26 P 126 P
27 P 127 P
28 P 128 P
29 P 129 P
30 P
31 P
*All five students with grade of F failed to meet either of the tworequired criterias for passing; a score of 26 in the post test or
complete 12 units with 70% score.
28

APPENDIX E
PEISON r CORRELATION COEFFICIENT
Unit Test Av,2rage and Post test
Experimental Group a Control Group 8
StudentCode
1
2
3
4
5
6
7
8
9
1011
12
13
14
15
16
17
18
19
20
21
22
23
24
25
26
27
31
29
30
Pearson r = 0.611 Pearson r = 0.632
*Based on fewer than 12 unit scores but more than 8.
29
28
Unit TestAverage
PostTest
StudentCode
Unit TestAverage
PostTest
17.57 33 101 16.42 23
16.35 25 102 15.64 2014.35 L. 103 16.50 2715.92 24 104 17.85 33
16.64 40 105 16.21 24
18.14 35 106 15.40 *2017.20 34 107 17.00 2117.28 29 108 13.42 *17
*17.09 25 109 16.92 27
18.64 30 110 16.16 *1417.07 32 111 18.00 28
18.00 37 112 17.85 23
16.57 24 113 17.00 2718.21 35 114 18.14 29
17.92 41 115 15.00 *18
17.00 30 116 16.85 21
17.35 38 117 17.07 27
17.64 39 118 17.70 37
18.57 36 119 17.57 34
14.07 22 120 17.07 26
16.07 36 121 15.92 22
18.92 45 122 18.07 33
16.85 30 123 17.07 27
17.15 28 124 17.28 37
15.92 36 125 17.00 20
16.91 40 126 17.57 26
15.85 24 127 17.92 37
17.3515.35
33
31
128129
18.60
13.92
20
19
17.50 40
16.69 25

APPENDIX F
Experimental Group Date
ATTITUDE SURVEY
The items in this attitude survey are statements to which you areasked to indicate your immediate reaction. Check the appropriate squareindicating your feeling. Please read the statements as quickly aspossible and answer without much hesitation. Do not skip any questionsunless it is clearly marked to be omitted by your group.
1. The audio-tutorial text covered some topics which were new to me.
Strongly Agree Undecided Disagree StronglyAgree Disagree
((c..)
.-- ,
1
-,
.. i /
2. Some of the materials in the audio-tutorial text were too difficult.
0 0StronglyAgree
Agree Undecided Disagree
3. I got bored working through the audio-tutorial text.
Strongly
Disagree
Strongly Agree Undecided Disagree StronglyAgree
t(4**-%"
(1"
Disagree
4. Some of the materials in the audio-tutorial text were too easy.
Strongly Agree Undecided Disagree StronglyAgree Disagree
s("Th1 \
5. I thought the learning system was well organized.
StronglyAgree
I, 1
Agree Undecided Disagree
ray
30
StronglyDisagree

6. I can't see much advantage of this system over the traditionallecture-discussion method of instruction.
Strongly Agree Undecided DisagreeAgree0 0 0 0 Strongly
Disagree
7. I received an adequate explanation of each mathematics topic.
Strongly Agree Undecided Disagree StronglyAgree Disagree
n n8. Some of the material in the learning system was repetitious.
Strongly Agree Undecided Disagree StronglyAgree Disagree
, , ,.- -,-
(i ( ) (
i
/ \1
1}
..., : \ , ./,,,,....
9. Some of the mathematics topics should have been explained more
thoroughly.
StronglyAgree
Agree Undecided Disagree Strongly
Disagree0 0 010. Intermediate algebra is very interesting.
StronglyAgree
Agree Undecided Disagree StronglyDisagree
11. I enjoy doing my work alone.
Strongly AgreeAgree
Undecided Disagree0 0 012. I like variety in the ways of learning mathematics.
StronglyDisagree
Strongly Agree Undecided Disagree StrlrglyDisagree0 0 0 0 0Agree
31

13. The student assistants were qualified to manage the learning system.
Strongly Agree Undecided Disagree StronglyAgree Disagree
\ i
14. The student assistants presented the concepts at a level appropriatefor students without previous knowledge of intermediate algebra.
Strongly Agree Undecided DisagreeAgree
StronglyDisagree
(2)15. The student assistants made little effort to prepare for the problem
sessions.
StronglyAgree
Agree Undecided Disagree StronglyDisagree
1
.
,----,.N
1.. / \ i . ) (
16. The student assistants were unable to hold my attention and interestin the problem sessions.
Strongly Agree Undecided DisagreeAgree
17. The problem sessions added value to the course.
StronglyDisagree
(::2)
Strongly Agree Undecided Disagree StronglyAgree Disagree
18. I got bored during the problem sessions.
Strongly Agree Undecided Disagree Stronglyagree Disagree
; -4.°'.s."...,
,-. ) (...,
19. I learned new ways of thinking about problems from discussions inproblem sessions.
StronglyAgree
Agree Undecided Disagree0 0 032
StronglyDisagree
(:12)

20. The problem sessions were not very helpful.
Strongly Agree Undecided Disagree StronglyAgree Disagree
(2) (1) c,21. I wouldn't have understood the basic concepts of intermediate
algebra without the problem sessions.
Strongly Undecided StronglyAgree DisagreeAgree Disagree
0 0 0 ( )
22. There are many advantages of this system as opposeci to the lecturediscussion technique used in other math courses.
StronglyAgree
.s,/
Agree Undecided
33
Disagree
0StronglyDisagree

APPENDIX F (Continued)
ATTITUDE SURVEY RESULTS
Item StronglyAgree
Agree Undecided Disagree StronglyDisagree
1a 9 16 0 4 1
P. 10 11 0 4 2
2a 1 4 4 11 10
2 4 1 17 3
3a 1 7 7 12 3
P 1 5 1 18 2
4a 1 4 10 ..!A 1
P. 0 1 13 7 6
5a 16 9 3 2 0
15 8 2 2 0
6a 1 1 2 17 9
2 0 2 12 11
7a 5 11 8 5 1
P 4 16 3 3 1
8a 1
1
11
5
2
1
16
180
2
9a 3 16 4 7 0
P 0 3 6 14 4
10 a3 13 8 2 4
P 6 8 6 7 0
11 a6 14 5 3 2
P. 3 ].7 3 3 1
34

APPENDIX F (Continued)
ATTITUDE SURVEY RESULTS
Item Strongly Agree Undecided Disagree StronglyAgree Disagree
12a 7 15 6 0 2
R 7 17 1 2 0
16aR
20aa
21aa
22aR
8
9
x
2
9 13 0 0
13 5 0 0
x x x x
15 7 3 0
x x x x x
0 1 13 7 6
x x x x x
0 1 13 7 6
x x x x x
10 7 8 1 1
x x x x x
0 0 9 14 4
x x x x x
2 9 10 5 1
x x x x x
0 3 6 14 4
x x x x x
2 4 13 6 2
7
7
15 6 2 0
17 2 1 0
35