Embed Size (px)
Citation preview
DOCUMENT RESUME
ED 216 '291 CG 015 981
a
AUTHOR ° Hing, Esther; Cypress, Beulah K.TITLE Use of Health' Services by Women 65 Years of Age and
Over; United States. Vital. & Health Statistics. Data .
, , * from the National Health Survey Series.13, No. 59.''INSTITUTION National Center for Health Statistics (DHHS/PHS),
' Hyattsville, MD. A 1
REPORT NO a DHHS-PHS-81-1720.-PIA DATE .. Aug 81VOTE J 81p.; Material made available at the White House:
it"
SO/
Conference on Aging (3rd, Washington, DC, November30-December 3, 1981). For related documents,,see CG415 980-987 Ad ED,215 257-289.
AVAILABLE FROM Superintendent of Documents/ U:S.Governmenf.Printing .
i
Office, Washington,'DC 20402. *,
EDRS PRfCE 1601/PC04 Plqs Postage.
a.
DESCRIPTORS *Female's; Geriatrics; Health-Needs; *Health Services;Hospitals; *Individual Characteristics; *Medical CareEvaluation; *Medical Servicest2Nursing Homes; *OlderAdults; Racial Differences; Sex Differences
IDENTIFIERS *White House Conference on Aging. .
ABSTRACTAs the American population increases, the health
problems ofplder2W-omen'4111 be of greater concern to healthplannersbecaUse'it,.is the,,elderly_womanwho most of tent survives toold age and-has 'greatgr need of services. Data from the National,Health 'Survey w %used to determine charactieristics,conditionsmanagemeit,,alid .outcomes of patients at physicians' offices,hospitalsl'and'nursing hoMes. Results showed that ambulatory care inphysicians' offices was most often Soughtpy.older women', generallyfot chronic non-life-threatening conditions; their use of shortstays at hospitals was only for acute illt,esses. Minorjty women used .staysmedical setvices less often thanwhite women but had longer lengths.' '
of hospital stays. This document contains numerous figures, tables,and appendices fllustrattng the statistical data and survey results.JAG)
:21.)
.'
11
1
I
*************************e**********************************************'le Reproduction's SuOlied by'EQRS are the best that can be made* 4'from the origihal document.*************************************************************i*******.
0 0
II
.
I ..
! :
.
. 111
111 .
. II . ' II . ' 1 .
. . . I . I:111 II . 6 II
.
I
. 5
il
111
I. I
: I
4
p
J44
I
Library of Congress Cataloging in Publication DataHing, Esther.
Use of health services by women 65 years and over.(alitai and health statistics. Series 13, Data from the national
health survey ; no. 59) (DHHS publication ; no..(PHS) 81 -1720)cAuthors: Esther Hing and Beulah K. Cypress.
AI;gust 198,1 .",Bibliography: p.Supt. of Docs. nb.; HE 20.6209: 13/591. Aieckwomen-Medical care- United States-Statistics. 2.
Medical care-United States-Utilization-Statsitics. 3. Healthsurveys- United Statei. United States- Statistics, Medical. I.Cypress, Beidah.K. II. National Center for Health Statistics (U.S.)III. Title. IV. Series.- V/',c Series: DHHS publication ; no. (VHS)81-1720. IDNLM: 1. 'Health services for the aged- Utilization-United States. 2. Women. W2 A N148vm no?593RA407.3.A349 no. 59 362.1'1'09,73s 81-607865(Rifit408.W65) . (362.1'9'0880565 1 AACR2Igo; 0.8406-0228-6
3
_ -
FoO$ale by the Superintendent (TeoCutnenis,11.S. Goverbnient Printing Oifice,,WashIngton. D.C. 20402
VP
NalionalCenter for Health Statistics
DOROTHY P. RICE, Director
ROBERT A. ISRAEL, Dgputy Director
JACOB J. FELDMAN, Ph,D., Associate Direetor ,4-or Analysisand Epidemiology
GAIL F. FISHER, Ph.D., Associate Directorfor theCooperative Health Statistics-System
GARRIE J. LOSEE, Associate Director: for Data Processingand Services . _
ALVAN 0. ZARATE, Ph.D;, Assistant Director for.International Statisijcs
E. EARL BRYANT, Associate Director, for Interview andExamination Statistics
RQIiERT C. HUBER, AssOciate Director for Management
MONROE G. SIRKEN, Ph.D., Associate Direct:3r for Researchand Methogology
PETER L. HURLEY, Associate Director for Vital and HealthCare Statistics
ALICE HAYWOQD, Information Officer
Division of Health 'Care Statistics
- W. EDWARD BACON, Ph,D., Direct&*JOAN VAN NOSTRAND, Deputy Director .
JAMES E. DELOZIER, Chief, Ambulatory Care_StatisticsBranchMARY 'MOIEN, Chief Hospital Care Statistics Branch
. EVELYN S. MATHIS, Chief Long-Term-Care StatisticsBranchMANOOCHEHR K. NOZARY, Chief, Technical ServiceBranch;
-It
C
I
t.
00
0.
COOPERATION OF THE US. BUREAU OF THE CENSUS. Undjr the .legislation establishing the National Health Sur-vey, the Public Health Service Is authorized to use, insofar as ICpossible, the services Or facilities of other Federal, State, orprivate ag-enCies. .
Heal tIn aceoldatith specifications established by..the NationatCenter fdi tatisiics, the Bureau of the Census, under acontractual arraniefient, Articipated in pladning the NationalHospital 151schare. Survey' and collecting its data. .
Library of Congress Catalog Card Number 81-607865
I
N,e
C
4
%
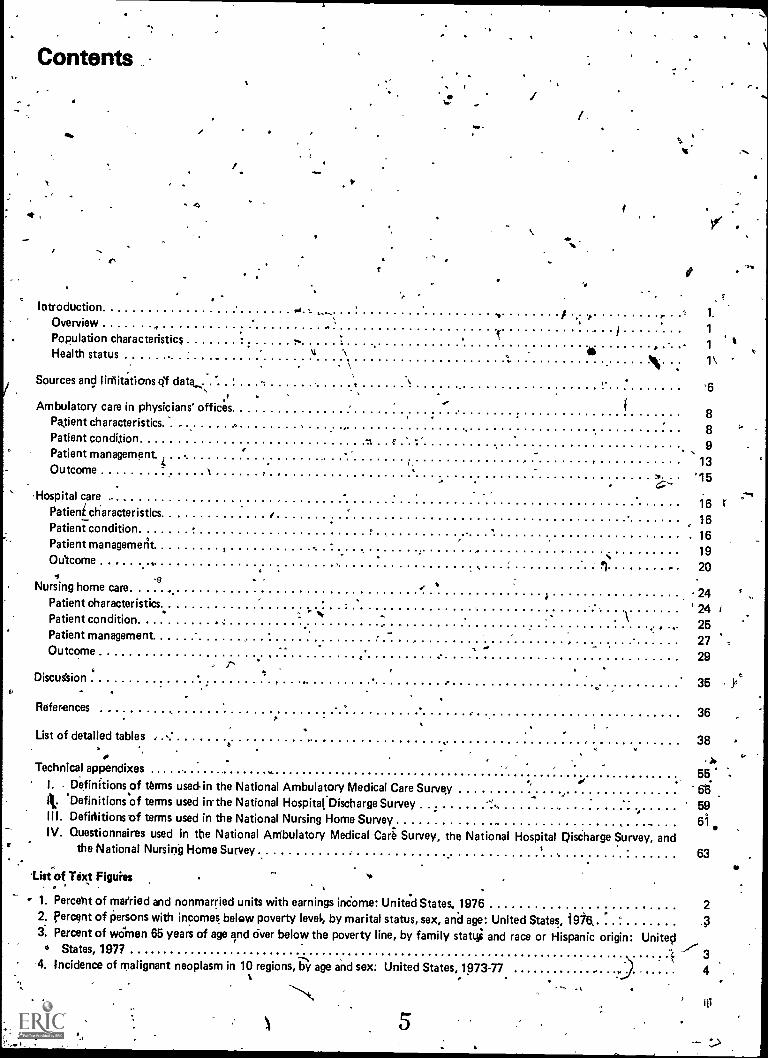
Contents
IntroductionOverviewPopulation characteristics
I
Health status
Sources and liniitations cif data... ' . \ .. .Ambulatory care in physicians' offices i
Pa.tient characteristics. . Q .
Patient condition 'a f 9..Patient managementOutcome 1
.4,
1\
'6
8
8
Hospital care
Patient characteristicsPatient conditionPatient management
Oulcome
Nursing home care.*9
Patient characteristicsPatient condition.Patient managementOutcome
Discussion
References
List of detailed tables.
,
"
..
..
G''' '15
. . '.
13
16
16
16
19
20
2424
2627
29
35
36
38
r
k
' n6
. ,Technical appendixes ,..
I. Definitions of terms used in the National Ambulatory Medical Care Surveyft 'Definitions'of terms used in the National Hospitatbischarge SurveyIII. Definitions of terms used in the National Nursing Home Survey
-.
IV. Questionnaires used in the National Ambulatory Medical Carl Survey, the National Hospital Diseharge Survey, andthe National Nursing Home Survey
'List of Text Figuies
- 1. Percent of married and nonmarried units with earnings income: United States, 1976
' X
555659
61
63
2
*.
2. Percent of persons with incomes below poverty level., by marital status, sex, and age: United States, '106.3; Percent of women 65 years of age and dyer below the poverty line, by family statuj and race or Hispanic origin: United
0 States, 1977"I' -"- 3
4. Incidence of malignant neoplasm in 10 regions, by age and sex: United States, 1973-77 .- ,. . 4.% .
----..,4c
ill
\ 5
. ,
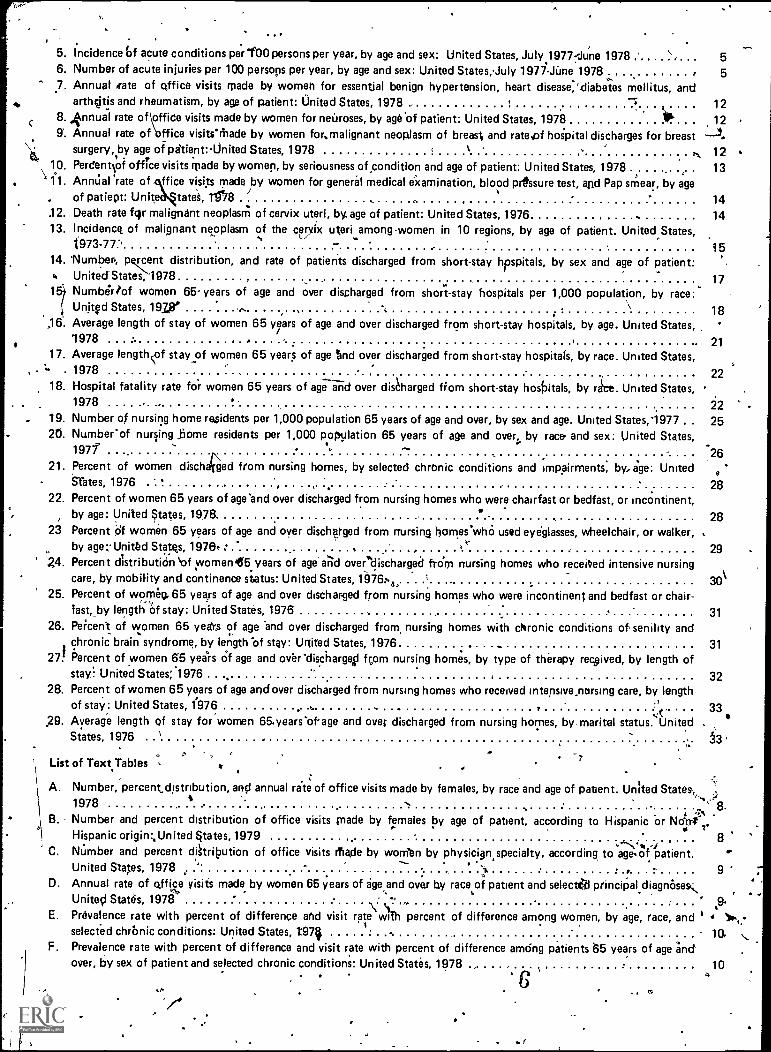
5. Incidence bf acute conditions per100 persons per year, by age and sex: United States, July 1977 -June 1978 '.
56. Number of acute injuries per 100 persons per year, by age and sex: United States,July 1977 -June 1978 , 57. Annual ,rate of office visits made by women for essential benign hypertension, heart disease,diabetes mellitus, and
arthiiitis and rheumatism, by age of patient: United States, 1978 ''s 12
c8. Annual rate of `office visits made by women for neuroses, by age of patient: United States, 1978 129'. Annual rate of office visiteenade by women for, malignant neoplasm of breast, and rate,pf hospital discharges for breast --t
surgery, by age of patient: United States, 1978 %_,
-, 1210. Perdentvi office visits made by women, by seriousness of condition and age of patient: United States, 1978 13
' .11. Amnia! 'rate of office visits made by women for generOl medical examination, blood prtssure test, agd Pap smear, by age. of patiept: Unite tatet, 10 /
8 , ,. . 14..12. Death rate fqr malignant neoplasm of cervix uteri, by. age of patient: United States, 1976 , 1413. Incidence. of malignant neoplasm of the cervix uteri among -women in 10 regions, by age of patient. United States,1/
t973 -77',
1514. 'Number; percent distribution, and rate of patierits discharged from short-stay hpspitals, by sex and age of patient:t UniteciStates, 1978 17-
Number-1°f women 65- years of age and over discharged from short-stay hospitals per 1,000 population, by race:Unitgcl States, 190 .,.. , 18
)6. Average length of stay of women 65 years of age and over discharged from short-stay hospitals, by age. United States,1978 , , 21
17. Average lengthcof stay of women 65 years of age 'and over discharged from short-stay hospitals, by race. United States,1978 22
e an18. Hospital fatality rate for women 65 years of agd over discharged from short-stay hospitals, by ra(ce. United States,1978 . ' 22
19. Number of nursing home residents per 1,000 population 65 years of age and over, by sex and age. United States,1977 . . 2520. Number-of nurling Some residents per 1,000 population 65 years of age and
4 .overz, by race and sex: United States,1977 ' 26
21. Percent of women dischkged from nursing homes, by selected chrbnic conditions and impairments; by, age: Uniteda
.
STates, 1976 2822. Percent of women 65 years of age-and over discharged from nursing homes who were chairfast or bedfast, or incontinent,
by age: United States, 1978 ,
.- 28
23 Percent of women 65 years of age and over discharged from nursing homes'wh6 used eyeglasses, wheelchair, or walker, ,by age...United States, 1976' : . . ,"- 29
24. Percent distribution 'of women45 years of age a'r*id overibischarged trOm nursing homes who received intensive nursingcare, by mobility and continence status: United States, 1976.,,; 30'
25. Percent of womeg. 65 years of age and over discharged from nursing homes who were incontinent and bedfast or chair-, . .fast,by length Of stay: United States, 1976 31
26. Peicent of women 65 years of age and over discharged from nursing homes with chronic conditions of senility and,,
chronic brain syndrome, by length of stay: United States, 1976I.27! Percent of women 65 years Of age and over -dischargail from nursing homes, by type of therapy received, by length of
, ,stay: United States; 1976 , 3228. Percent of women 65 years of age and over discharged from nursing homes who received intensivenarsing care, by length
of stay: United States, 1'976 , , . , 3344United
status. , *.29. Average length of stay for women 65.years-of age and over discharged from nursing homes, by. maritalStates, 1976 ' . 63
' List of Text Tables s
I 1. I
iie
A. Number, percent. distribution, and annual rate of office visits made by females, by race and age of patient. United States-,t. ....4i1978 . .. i,' 8-
\ B. Number and percent distribution of office visits made by females by age of patient, according to Hispanic or Ndryl .
Hispanic origin:United States,1979. 8 '
C. NUmber and percent distribution of office visits Mode by woreen by physicignspecialty, according to age of patient..United States, 1978 '' ' -t. , -
D. Annual rate of office visits made by women 65 years of age and ove r by race of patient and selecte principaldiagnOses,,
E. Prevalence rate with percent of difference and visit rate with percent of difference among women, by age, race, and 14 lo-,.-
F. Prevalence rate with percent of difference and visit rate with percent of difference among patients 65 years of age andselected chrbnic conditions: United States, T974
over, by sex of patient and selected chronic conditions: United States, 1978
United States, 1978.:4.
. .
\ `1,..,' e ,
21
' q.
1 a
9
I
\ ...
31
IV ./*6
.1
10
G. Number and pe- nt of office visits made by women 65 years of age and over, by selected principal diagnoses and mostfrequent second - o third-listed diagnosis: United States, 1978 ' 11
H, Rate of return office isits made by women, by age of patient and selected principaltliagnpses: United States, 1978 . . . . 11..1, Number arfd percent d ribution of office visits made by women 65 years of age and over, by disposition of visit: United
States, 1978 .15
K. Percent distribution of Women 65 years of age and over discharged from short-stay hospitals or nonihstitutionalized, bymarital status: United States, 1978 18
L. Number and percent of office visits made by women 65 years of age and over and number and percent discharged from
F short-stay hospitals, by selected first-listed diagnoses: United States, 1978 18M Number and percent distribution' of women discharged from short-stay hospitals by number of diagnoses for each pa-
,
tient, according to age of patient: United States, 1978 , \ . P
19N. Number and rate of women discharged from short-stay, hospitals, by surgery status and age of patient: United States,,
1978 I . 200. Rate of all-listed operations for women discharged-from short-stay hospitals, by age of patient and selected surgical cate-r'
gories: United States, 1978 ' 20P Average length of stay of women discharged from short-stay hospitals, by age of patient and selected first-listedcilig-
noses: United States, 1978 ' l's 21-t-O Average length of stay of women 65 years of age and over discharged from short-stay hospitals, by surgery status and age
of patieht: United States, 1978 ,4 22..-/-
R Average length of stay of women 65 years of age and over discharged from short-stay hospitals, by marital status: UnitedStates, 1978 - 22
S. Fatality rate of patients discharged from short-stay hospitals, by sex and age of patient: United States,1 978 22T Number and percent distribution of patients 65 years of age and over discharged from short-stay hospitals, by sex Of
patient and discharge status: United States, 1918 23U. Percent distribution of women 65 years of age and over discharged from nursing hoses, by age and marital status:
/United States, 1976 . , 26..W Percent of women 65 years of age aqd over discharged from short-stay hospitals and from nursing homes, by selected
.diagnoses: United States, 1978 and 1976 ' ,,, : A 26Y, Percent distribution of women 65 years bf age and over discharged from nursing homes, by selected functiohal statuses:
United States, 1976 , 27,--Z. Average length of stay of patients 65 years of age and over discharged from nursing homes, by sex, age, and marital....,
status: United States, 1976 . - / 30AA. Average age by discharge status and average length 6f stay cif women 65 years of age and over discharged from nursing
homes, by discharge status'and age of patient: United States, 1976 .1 33BB Numb* percent distribution, and average length of stay of women 65 years of age and over discharged from nursing
, homes, by living arrangement after discharge: United States, t976 34% ..
4
7
C
A
P-,
'
'4?
.vi
0
0.0
''0.05
Symbols
Data not available
Category not applicable
Quantity zero
'Quantity more than zero but less than
z. .
Quantity more than zero but less than500
Figure does not meet standards ofreliability or.precision.
# Figure suppressed to comply with.confidentiality requirements
a
44
.-
`'
8.
1
J
I
Use of Health Services byWomen 65. Years, of Ageand -Over'by Esther Hing ant! Beulah K. Cypress, Ph.D., Division ofHealth Care StatistiCS
Introduction. 4
OvervieW
As the AmeriCan population ages, the healthproblemi of elderly women will play a greater role inthe concerns of health planners because it is theelderly woman who more often survives to old ageand thus is subject to greater risk of disease and needfor services. In 1978, 130 women were aged 65-74,166 aged 75-84, and 220 aged 85 years and over forevery 100 men of the same age.' The 7-yeardifference in life expectancy by sex, which accounted.Kir the greater number of females in 1978, is
,,expected to increase to a 10-year differerice by theyear 2003.2 Thus the ptotblems of old age will be
- largely they problems faced by older women. Thisreport will examine the use of three major health caresettings by the elderly woman: physicians' offices,hospitals, and nursing homes. MU- are from threesaniple surveys conducted \by the National Center forHealth Statistics: the National Ambulatory MedicalCare Survey, the National Hospital Discharge Survey,and the National Nursing Home Survey. The data will'show the health problems presented by elderlywomen in each of these settings and relate .theseproblems to treatment or care received. Selected ,dataon the outcome of care in Felation.to mortality andlength of stay in hospitals aria nursing homes will alsobe examined. :*
'Population characteristics
In 1978 an estimated 14.3 million. women were65 years of age and over in the United States. Ofthese women, 91 percent were white, 8 percent were.iblack; and abop/olfercent were members of otherraces.' A'bout#285,000 or 2 percent of the civilian
*noninstittiTiOrialized female population 65 years, ofage and over were of.Hisfanic origin.' Most of thecivilian noninstitutionalize female population 65years of age and over lived infamilies (57 percent),
.4
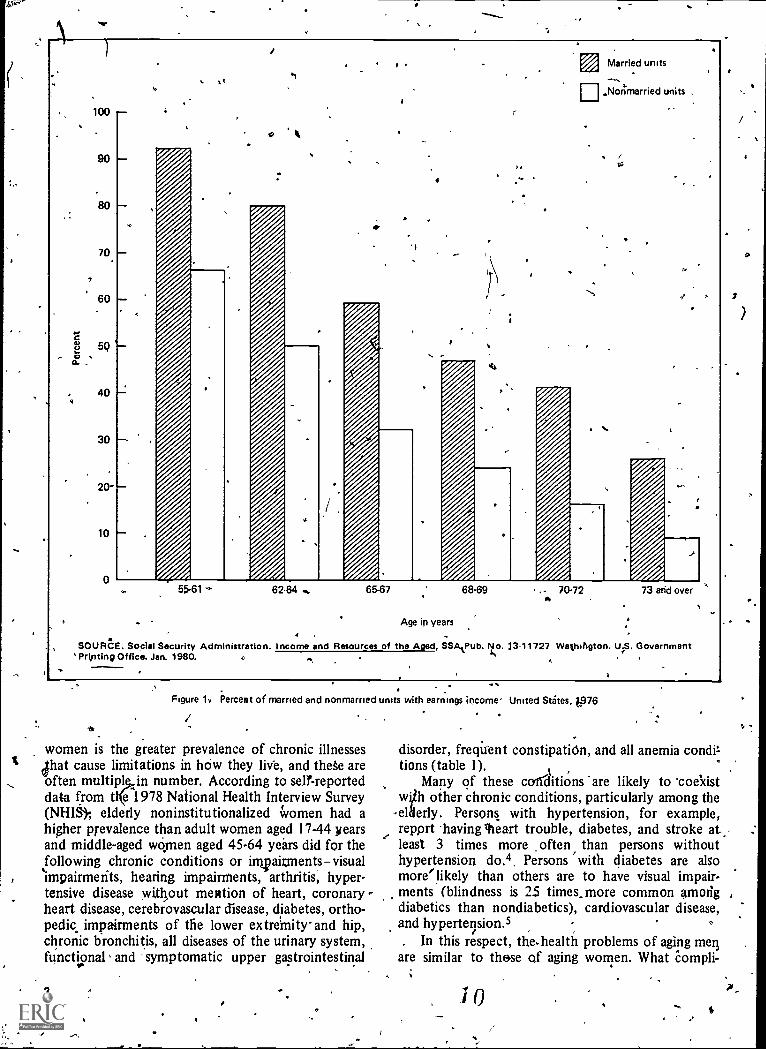
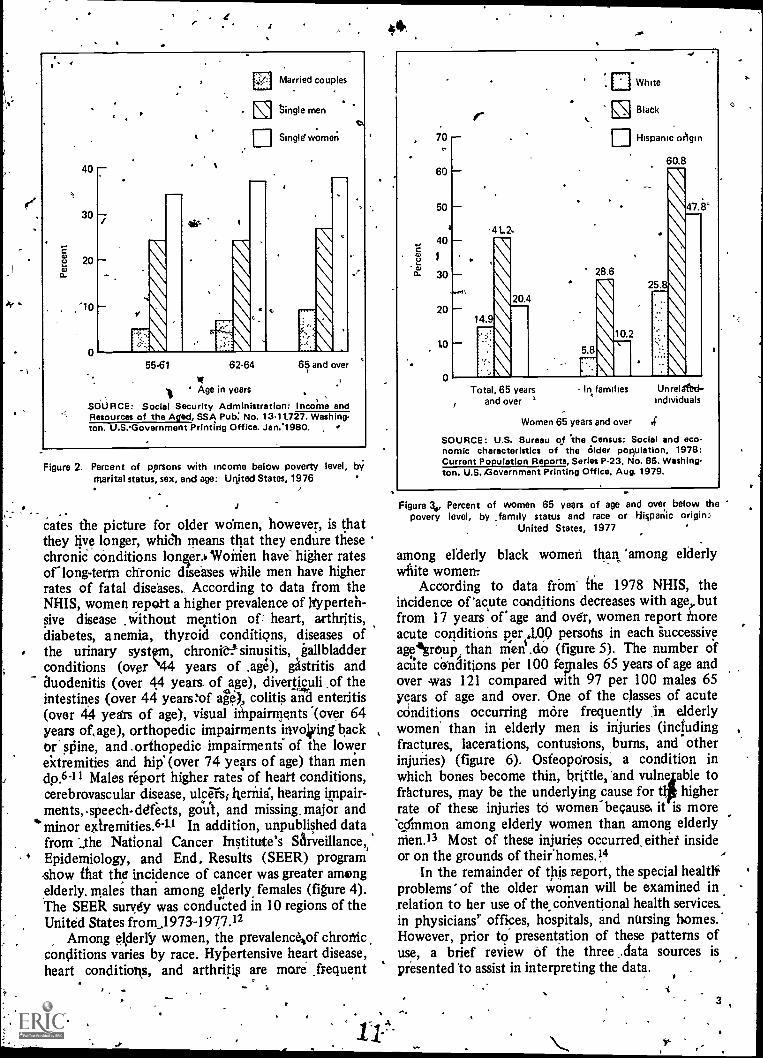
but'only 36 percent were wives.' The.most commonmarital status for these women was widow. In .197.8,52 percent of the women 65 years of age and overand 69 percent of those 75 years of age and over werewidowed.' (The proportion is 'even higher ainong,elderly "Women in institutions.) Nearly half of thewomen aged 75 years and over lived alone.' The, lossof a spouse creates hardship for the older woman notonly in terms of loneliness and isolation, but also interms of reduced financial resources. In 1977, themedian income for an eldeily- widow was $3,502compared with $6,0k9 for an elderly married cou-ple.' Generally, married couples had higher earningsthan nonmarried persons (figure 1), but even amongthe nonmarrieds, the incomes of women were lowerthan the incomes of their male counterparts. Thusmore "poor" women were found than "poor" Men(figure 2). .
' Among all women 65 years of age and overblackand Hispanic wopien were more likely to haveinconfes belbw the poverty level (41 and 20 percent,respectively) than white women were (15 percent)(figure 3) The poverty of black and Hispait womenis accentuated if they do not liye with \families.HOwever, even among women living with families, alarger proportion of black women had incomes belowthe poverty level (29 percent) than white women did(6 perceq). This proportion is greater because blackwomen are more likely than white women are tomaintain a family without a husband (21 percentcompared with 8 percent, respectively). Elderlyblack women were nearly 3itimes as likely as whitewomen were to be the recipients of public assist -.ance.3 Thus because order womenThave fewer socialand financial resources to draw on, they are at adisadvantage when they have a major health problem.Elderly black and Hispanic women are part' ularlyvulnerable. '
A..,
Health status LI"
What are the health problems' facing olderwomen? The major health' characteristic of older
9
p.
7
t-,<e.
o.
100
90
70
60
5Q L
40
30
20-
10
tiV Married units
111,,Norimarried units .
tr.
55 61 6264. 65-67 68.69 .. 70-72 73 and over
Age in years
SOURCE. Social Security Administration. Income and Resources of the Aged, SSAtPub. No. 13-11727 Wathington. U.S. GovernmentPripting Office. Jan. 1980.
9. .Figure 11 Fermat of married and nonmarned units with earnings income. United States, 076
women is the greater prevalence of chronic illnessesthat cause limitations in how they livb, and thee areoften multiplin number. According to selr-reporteddata from tKe 1978 National Health Interview Survey(NHIS* elderly noninstitutionalized Women had ahigher prevalence than adult women aged 17-44 yearsand middle-aged women aged 45-64 years did for thefollowing chronic conditions or imj2aitrnentsvisualimpairments, hearing impairments, arthritis, hyper-tensive disease without mention of heart, coronaryheart disease, cerebrovascular disease, diabetes, ortho-pedic impairments of the lower extremity' and hip,chronic bronchitis, all diseases of the urinary system,functional ^ and symptomatic upper gastrointestinal
disorder, frequent constipatiOn, and all anemia condittions (table 1).
Many of these cediaitions 'are likely to 'coe'xistwVh other chronic conditions, particularly among the
- elderly. Persons with hypertension, for example,report having %eart trouble, diabetes, and stroke atleast 3 times more _often than persons withouthypertension do.4. Persons 'with diabetes are alsomore'likely than others are to have visual impair-
, ments (blindness is 25 times. more common among ,
diabetics than nondiabetics), cardiovascular disease,and hypertension.5. In this respect, the.health problems of aging mert
are similar to those of aging women. What Compli-
0
f`
1
40
30
aa' 20
a.
'10
0
7
Married couples
single men
ElSinglet women
55.61 62.64
vtAge in years
SOURCE: Social Security Administration: Income andResources of the Aged, SSA Pub: No. 13.11.727. Washing-ton. U.S.-Government Printing Office. Jan.'1980.
65 and over
Figure 2. Percent of Rersons with income below poverty level, byMarital status, sex, and age: Unjted States, 1976
sates the picture for older women, however, is thatthey live longer, which means that they endure these 'chronic conditions lonier.b Woirien have higher ratesor long-term chronic diseases while men have higherrates of fatal diseases. According to data from theNHIS, women repoit a higher prevalence of hyperten-sive disease .without mention of heart, arthritis,diabetes, anemia, thyroid conditions, diseases ofthe urinary systpm, chrone sinusitis, gallbladderconditions (over \44 years of .age), gAstritis andauodenitis (over 44 years. of age), diverticuli .of theintestines (over 44 years:of alet colitis and enteritis(over 44 years of age), visual iMpainnents .(over 64years of, age), orthopedic impairments invojiting backor' spine, and .orthopedic impairments" of the lowerextremities and hip' (over 74 years of age) than mendp.6-II Males report higher rates of heart conditions,cerebravascular disease, ulcers; lleriiia, hearing impair-ments,-speech-defects, goul, and missing, major and
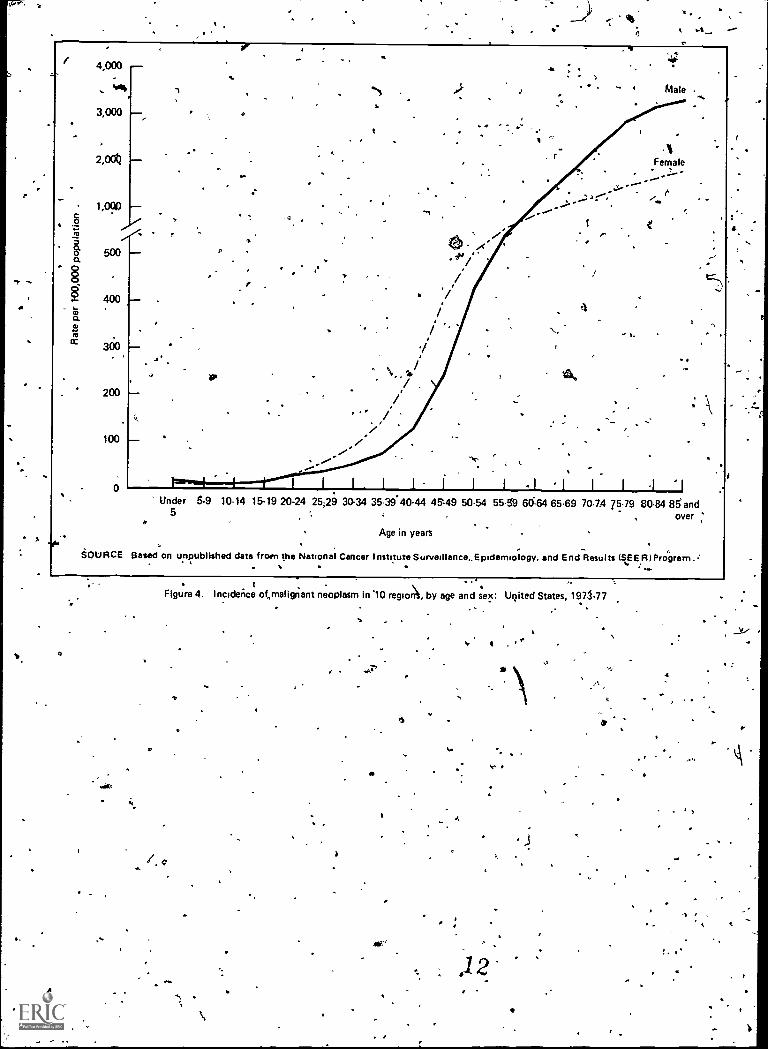
'minor extremities.6-1-1 In addition, unpublished datafrom the National Cancer Institute's Sarveillance,,
.5 Epidemiology, and End, Results (SEER) programshow that the incidence of cancer was greater amongelderly. males than among elderly. females (figure 4).The SEER survey was conducted in 10 regions of theUnited States from_1973-1977.12
Among eJder1 women, the prevalenc4of chronicconditions varies by race. Hypertensive heart disease,heart conditions, and arthritig are more frequent
-
44
70
60
50
a
40
CL 30
20
10
0
.
+ea.
ar N.
14.
20.
White
Black
EllHispanic (Agin
60.8
28.62
47.8'
Total, 65 yearsand over
In amilies Unrelafetkindividuals
Women 65 years and over .4'
SOURCE: U.S. Bureau of 'the Census: Social and eco-nomic characteristics of the Older population, 1978:Current Population Reports, Series P23, No. 85. Washing-ton. U.S. ,Government Printing Office, Aug. 1979.
Figure 3., Percent of women 65 years of age and over below thepovery level, by ,family status and race or Hispanic origin
United States, 1977
among elderly black women than 'among elderlywhite women:
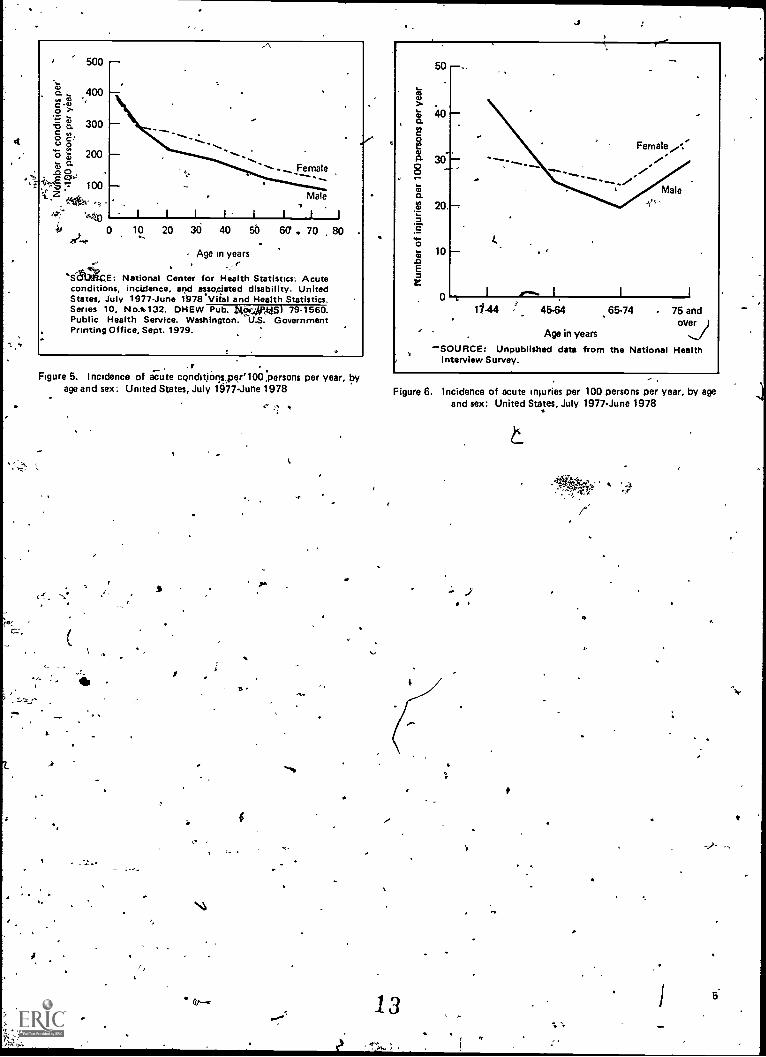
According to data fr.-am- the 1978 NHIS, theincidence of 'acute conditions decreases with age butfrom 17 years of* age and over, women report Moreacute conditions per 1.00 persons in each 'successiveaegroup, than men .do (figure 5). The number ofacute conditions per 100 fegiales 65 years of age andover was 121 compared with 97 per 100 males 65years of age and over. One of the classes of acuteconditions occurring more frequently in elderlywomen than in elderly men is injuries (includingfractures, lacerations, contusions, burns, and otherinjuries) (figure 6). Osteoporosis, a condition in
fwhich bones become thin, brittle, and vulne
higherto
actures, may be the underlying cause for trate of these injuries to women because. it is more'c...cfmmon among elderly women than among elderlynien.I3 Most of these injuries occurred. eithet insideor on the grounds of their'homes.14
In the remainder of this report, the special healtliproblems' of the older woman will be examined inrelation to her use of the conventional health services.in physicians' offices, hospitals, and nursing homes.'However, prior to presentation of these patterns ofuse, a brief review of the three ..data sources ispresented to assist in interpreting the data.
3
A
4,000,
44
.1114.
3,000
2,0
1,0010
500
400
300
200
100
t,
,*
.
I.
..ru
/:/
/
-1 t
1
.
.",
A.
I.
Male
14Female
-
l..1. eUnder 5-9 10-14 15-19 20-24 25;29 30-34 35-3940-44 45,49 50-54 55-59 6064 65.69 70.74 75-79 80-84 85and
5 over ;
Age in years
SOURCE Based on unpublished data from the National Cancer Institute SurvelilanceEpidemiology, and End Results (SEER/ Program.:, .
4
a.
.Figure 4. Inciderice otmalignant neoplasm in 10 regio, by age and sex: United States, 1973-77
a
4 4
4
4
a
-q 4.
a. 4 4 4.
500
a 400.. W ,
Co7:3 300o 2..
ou o
F, 200a-.o o- 100
0
Female
Male
I I I I I I I I
10 20 30 40 50 60 . 70 80
Age in years
E: National Center for Health Statistics: Acuteconditions, incidence, and associated disability. UnitedStates, July 1977-June 1978.Vital and Health Statistics.Series 10, No.* 132. DHEW Pub. Ltio.:,-492,M,51 79.1560.Public Health Service. Washington. GovernmentPrinting Office, Sept. 1979.
Figure 5. Incidence of acute condit,iorlsper'100 persons per year, byage and sex: United States, July 1077-June 1978
1
st
s
50
.40
30
20.
10
Female
Male
11.44 4564 65-74 . 75 andover
Age in years
'SOURCE: Unpublished data from the National HealthInterview Survey.
Figure 6. Incidence of acute injuries per 100 persons per year, by ageand sex: United States, July 1977-June 1978
13
iS
/
15
Sources and limitations of data
The estimates in this report are from the 1978National Amb6latory Medical Care i.irvey (NAMCS),the 1978 National Hospital Thischarge Survey(NHDS), and the 1977 National Nuriing HomeSurvey (NNHS). The NAMCS is a confirm nationalprobability sample of ambulatory me ical encoun-ters. The scope of the survey covers physician-patientencounters in the offices of nonfederally Unplbyedphyskians classified as "office-based, patient:care"physicians by the American Medical' Association orthe American Osteopathic As,sociation. 4isits tophysicians practicing in Alaska and Hawaii; visits tohospital-based physicians; visits to specialists in anes-thesiology,' pathology, and radiology; and visits tophysicians who are principally engaged in teaching,research, or administration are 'excluded as well astelephone contacts and nonoffice visits. The samplefor the 1978 NAMCS included 3,007 physicians, 466of Whom were not-eligible (out of scope) at the timeof the survey. Of the 2,541 physicians- who wereeligible, 1,850 (73 percent) actually participated.Data on office visits were obtained from. a sample of47,291 visits. . .
Data presented on hospital care are from theNHDS, which is a continuing nationwide samplisurvey of short-stay hospitals in the United States.The scope of NHD9>encompasses patients dischargedfrom hospitals, exclusive of military and VeteransAdministration hOspitals, located in the 50 States andthe District of Columbia. Only hospitals having sixbeds or 'Fore for patient use and those in which theaverage length' of stay for all patients is less thandays are included in the survey. The sample for.1978NHDS included approxithately 535 hospitals; 48 ofthese were either out of scope or out of business. Ofthe 487 in-scope hospitals, 413,(85 percent) actu-ally participated. The sample of discharges obtained.from participating hospitals included approximately219,000 medical records.
. Data presented on nursing home care are from the1977 NNHS, which is a nationwide sample survey of,,,,,
6
a ,
nursing homes, residejts, discharges, and staff. Thescope of the 1977 NNHS encompassed all types of
4 nursing homes, including personal care and domi-ciliary care homes in the conterminous United States.The sample for the 1977 NNHS included a nationalsample of 1,698 nursing homes; 166 wereeither out of scope or out,of business. Of the 1,52in-scope nursing homes, 1,451 (95 percent) actuallyparticipated. The sample of discharges from Partici-pating nursing homes included 5,142 discharges.Patient data 4fortipthe 1977 NNHS were obtainedfrom ,two samples of patientsthose currently resid-ing in the nursing homes and all patients dischargedfrom the nursing home during the calendar year1976. Data in this report are basically from thedischarged resident sample, but selected data will bepresented on residen s who w61 residing in the
&ornursing,home.Data presented from the NAMCS, NHDS, and
NNHS (discharged resident sampl,) share severalcommon characteristics:
1. The data were generally abstracted frdm patienthealth records. In the NAMCS, information wasrecorded on the encounter form, which supplieddata on a systematic random sample of visits. Inthe NHDS, data were obtained from the facesheets of a sample of medical records of in-patients discharged from short-stay hospitals.Data from the NNHS on discharges from nursinghomes were collected by interviewing a memberof the nursing staff who referred to the medicalrecords. Thus the data in this report are based onactual use of health resources as recorded onmedical records.
2. The data reflect estimates of patient events ratherthan estimates of patients. In the NAMCS, thepatient-physician encounter (visit) was the unit ofanalysis and the discharge event was ale unit ofanalysis in the NH12S and NNHS. Sampled per-sons who visited a physician more than once dur-
inie 7-day period of data` collection were in-cluded in. the sample as multiple Osits, as weredischatges from hospitals and nursing homesduring the 1-year period of data collection.
3. Data on diagnoses in the NAMCS and NHDS werecoded according to the Eighth Revision of theInternational Classification of Diseases, Adaptedfor Use in the United States (ICDA).1 s Data ondiagnostic categories used:in the NNHS, however,
-were collected according to medical' nomencla-ture, but they were not coded according to theICDA.
Because data in this report are national estimatesbased on a sample, they are subject to sampling.errors. Tablesind chart's of standard errors used in
the preparation of this report for each respectivesurvey (NAMCS, NHDS, and NNHS) can be foundin appendix I of previously published- reports.16-I 8These appendixe,s also contain detailed descriptionsof the survey methods, the sanyple designs, the datacollection, and 'processing procedures, and the estima-tion procedures.
Definitions of the terms used in this report arepresented in appendixes Facsimiles of the PatientRecord form used in the NAMCS, the MedicalAbstract form used by participating hospitals in theNHDS, and the Discharged Residgnt Questionnaireused in the NNHS are ,presented in appendix IV. Thereader is urged to review these appentNtes*forinterpretation of the estimates -presented in thisreport.
.. ; ..,*I
r
0.'
k
e 0. 7
Ambulatory care in physicians' offices7
,10
Patient characteristics
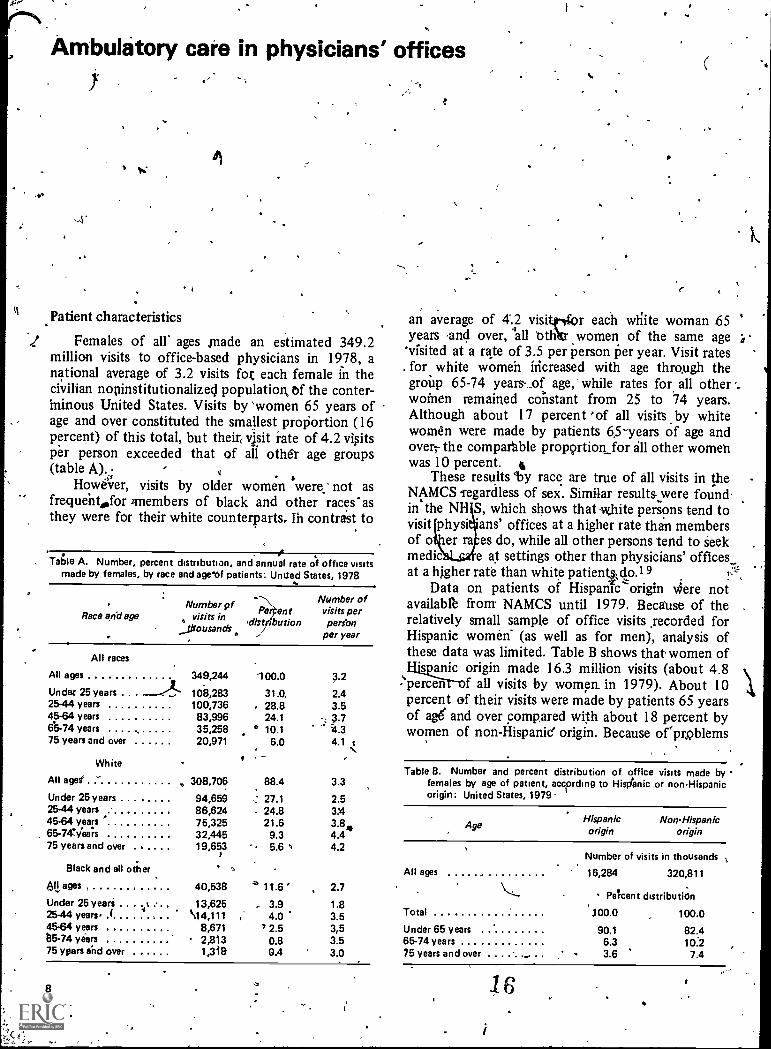
.1 Females of all ages ,made an estimated 349.2million visits to office-based physicians in 1978, anational average of 3.2 visits fot each female in thecivilian nopinstitutionalizecj population of the conter-minous United States. Visits by 'women 65 years ofage and over constituted the smallest proportion (16percent) of this total, but their, visit rate of 4.2 visitsper person exceeded that of all other age groups(table A). -
Hower, visits by older women were: not asfrequeht,for members of black and other races'asthey were for their white counterparts, Ih contrast to
Table A. Number, percent distribution, and annual rate of office visitsmade by females, by race and age of patients: Unued States, 1978
Number pfRace and age visits M
_fflousano's
Pe ent-dist ibution
Number ofvisits perperfon
per year
All races
All ages
Under 25 years . . .
2544 years45-64 years6b-74 years75 years and over
349,244
108,283100;73683,99635,25820,971
100.0
31.0,28.824.1
° 10.16.0
3.2
2.43.53.74.34.1 c
White
All ages° 308,706 88.4 3.3
Under 25 years 94,659 27.1 2.525-44 years 86,624 24.8 3X145-64 years 75,325 21.6 3.8465-747yea;s 32,445 9.3 4.475 years and over 19,653 5.6 4.2
Black and all other
411 ages , 40,538 11.6 ' 2.7
Under 25 years 13,625 - 3.9 1.825-44 years, ( \14,111 , 4.0 3.54564 years 8,671 7 2.5 3,5135-74 years 2,813 0.8 3.575 ypars and over 1,318 0.4 3.0
8
an average of 4..2 visitor each wiiite woman 65years and over, all Oth women of the same age'visited at a rate of 3.5 per person per year. Visit rates
. for white women increased with age through thegroup 65-74 years- _of age,- while rates for all otherwomen remained constant from 25 to 74 years.Although about 17 percent ''of all visits by whitewomen were made by patients 65-years of age andover; the compar'able prop9rtion for all other womenwas 10 percent. t
These results 'by race are true of all visits in theNAMCS -regardless of sex. Similar results.were found.in' the NH S, which shows that -white persons tend tovisit physi ans' offices at a higher rate than membersof o er ra es do, while all other persons tend to seekmedic e at settings other than physicians' officesat a higher rate than white patientgo.1 9
Data on patients of Hispanic`origin sere notavailab1' from NAMCS until 1979. Because of therelatively small sample of office visits ,recorded forHispanic women- (as well as for men), analysis ofthese data was limited. Table B shows that women of
s anic origin made 16.3 million visits (about 4.8percen f all visits by women, in 1979). About 10percent of their visits were made by patients 65 yearsof age and over compared with about 18 percent bywomen of non-Hispanic' origin. Because orptoblems
Table B. Number and percent distribution of office visits made by -females by age of patient, according to Hisdanic or nonHispanicorigin: United States, 1979
AgeHispanic
originNonHispanic
origin
All ages
Total
Under 65 years65-74 years75 years and over
I
16
Number of visits in thousands
16,284 320,811
PeTcent distribution
100.0 100.0
90.1 82.46.3 10:23.6 7.4
in estabfishing an apigeopriate population base, visitrates Wgre not calculated fOr non-HiS4anic or His-panie patients.
Patient condition
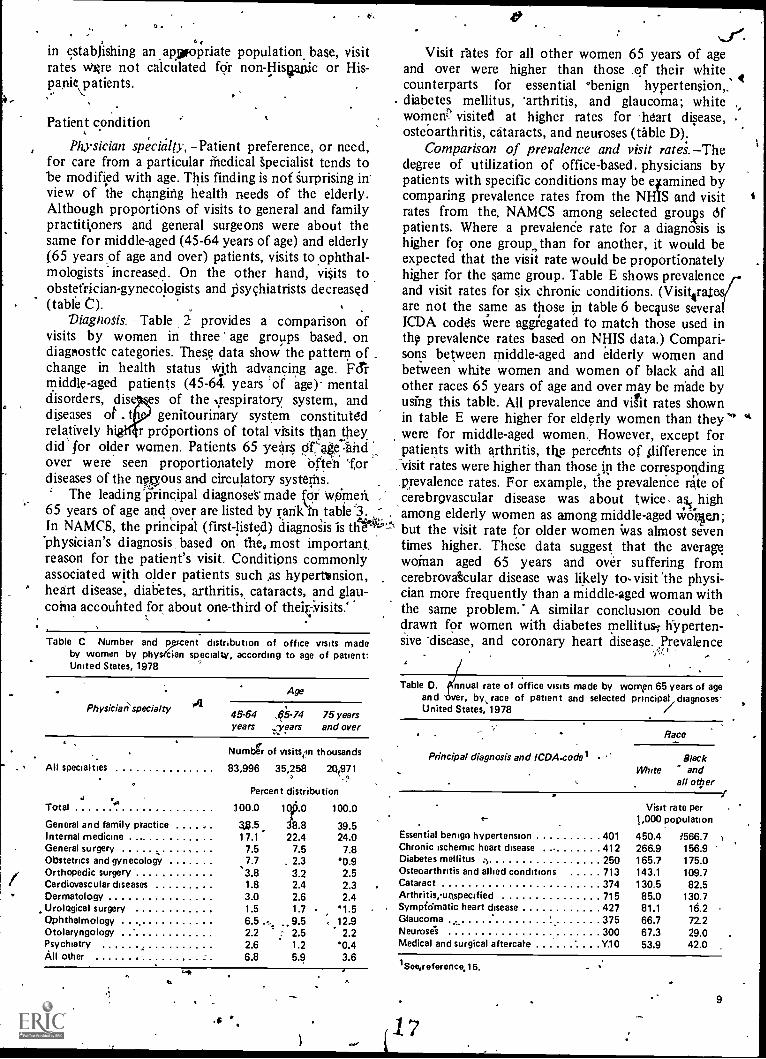
Physician spiyialty, -Patient preference, or need,for care from a particular Medical specialist tends tobe modified with age. This finding is not Surprising inview of the changing health needs of the elderly.Although proportions of visits to general and familypractitioners and general surgeons were about thesame for middle-aged (45-64 years of age) and elderly(65 years of age and over) patients, visits to ophthal-mologists increased. On the other hand, visits toobstetrician-gyneco)ogists and psychiatrists decreased(table C).
Diagnosis. -Table 2 provides a comparison ofvisits by women in three' age groups based, ondiagnostic categories. These data show the pattern ofchange in health status With advancing age. F&middle-aged patients (45-64. years 'of age)- mentaldisorders, dis es of the .respiratory system, anddiseases of t genitourinary system constitutedrelatively if r prOportions of total visits than theydid' for older women. Patients 65 years OrAe:inidover were seen proportionately more Often fordiseases of the nervous and circulatory systerns.
The leading Principal diagnose's*made for women, ,
65 years of age and over are listed by rarik1n table .3.In NAMCS, the principal (first-listed) diagnosis is tilt 4'-.°"physician's diagnosis based on the, most important.reason for the patient's visit. Conditions commonlyassociated with older patients such as hypertension,heart disease, diabetes, arthritis, cataracts, and glau-coina accounted for about one-third of theiOisits'
Table C Number and percent distribution of office vrsits madeby women by physecian specialty, according to age of patient:United States, 1978
Physician' specialty
Age
45-64 ,65-74 75 yearsyears years and over
Numbt of insits,.ri thousands
All specialties 83,996 35,258 20971
Percent distribution',.
Total.1
100.0 1.0 100.0
General and family practice 3j3.5 8.8 39.5Internal medicine 17.1 22.4 24.0General surgery 7.5 7.5 7.8Obstetrics and gynecology 7.7 . 2.3 '0.9/ Orthopedic surgeryCardiovascular diseases
.3.8 3.2 2.51.8 2.4 2.3
Dermatology 3.0 2.6 2.4Urological surgery 1.5 1.7 1.5Ophthalmology 6.5 ... 9.5 12.9Otolaryngology 2.2 ; 2.5 2.2Psychiatry 2.6 1.2 '0.4AU other , 6.8 5.9 3.6
ti
N.Y.Visit rates for all other women 65 years of age
and over were higher than those ,of their whitecounterparts for essential °benign hypertension,_diabetes mellitus, 'arthritis, and glaucoma; whitewomen' visited at higher rates for 'heart disease, .
ostebarthritis, cataracts, and neuroses (table D).Comparison of prevalence and visit rates. -The
degree of utilization of office-based. physicians bypatients with specific conditions may be qamined bycomparing prevalence rates from the NH1S and visitrates from the. NAMCS among selected groups ofpatients. Where a prevalenCe rate for a diagnosis ishigher for one group, than for another, it would beexpected that the visit rate would be proportionatelyhigher for the same group. Table E shows prevalenceand visit rates for six chronic conditions. (Visit4ratare not the same as those in table 6 because severaICDA codes were aggilegated to match those used inth9 prevalence rates based on NHIS data.) Compari-sons between middle-aged and elderly women andbetween white women and women of black and allother races 65 years of age and over may be made byusing this table. All prevalence and visit rates shownin table E were higher for elderly women than theywere for middle-aged women. However, except forpatients with arthritis, the percents of difference in-visit rates were higher than those,in the corresponding.prevalence rates. For example, the prevalence rate ofcerebrovascular disease was about twice, ass highamong elderly women as among middle-aged WO'rlen;but the visit rate for older women Was almost seventimes higher. These data suggest that the averaswoman aged 65 years and over suffering fromcerebrovakular disease was likely to, visit the physi-cian more frequently than a middle-aged woman withthe same problem.' A similar conclusion could bedrawn for women with diabetes mellitus; hyperten-sive *disease, and coronary heart disease. Prevalence
Table D. QCnnual rate of office visits made by women 65 years of ageand 'aver, by race of patient and selected principal, diagnosesUnited States, 1978
Race
Principal diagnosis and ICDA.codelWhite
Blackand
all other
Visit rate per1,000 population
Essential benign hypertension 401 450.4 1566.7Chronic ischemic heart disease 412 266.9 156.9Diabetes mellitus 250 165.7 175.0Osteoarthntis and allied conditions 713 143.1 109.7Cataract 374 130.5 82.5Arthritis,uospecified 715 85.0 130.7Sympfdmatic heart disease 427 81.1 16.2Glaucoma 375 66.7 72.2Neuroses 300 67.3 29.0Medical and surgical aftercate Y10 53.9 42.0
1See,reference,15.
1 '7
9
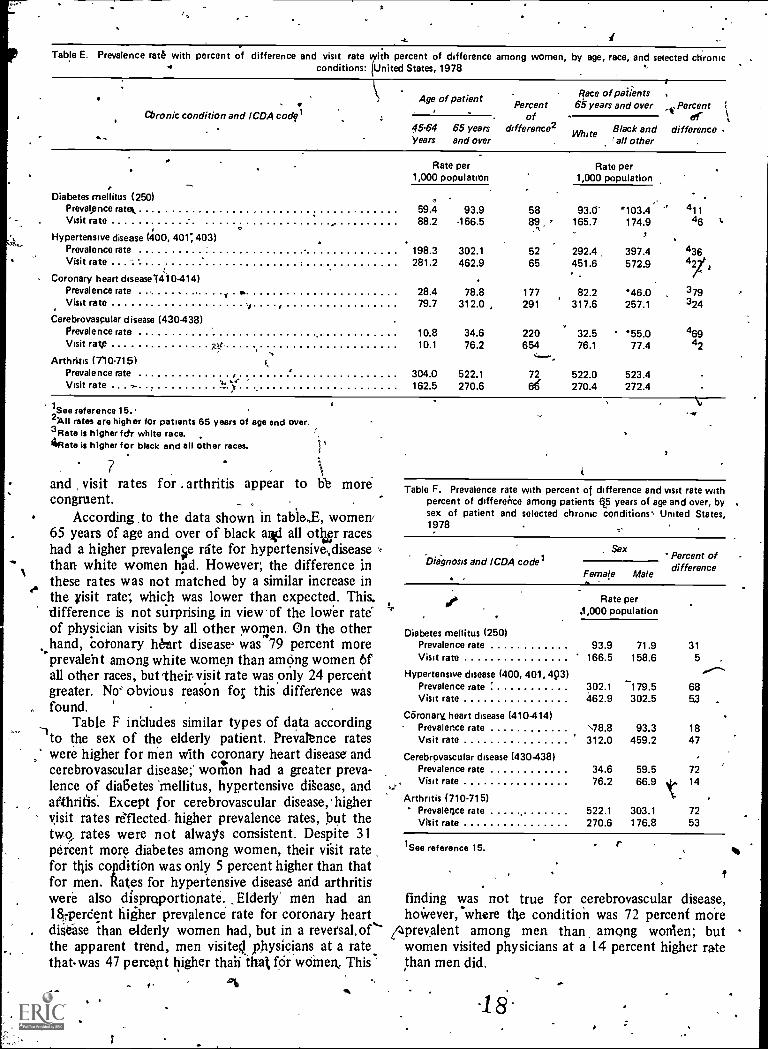
Table E. Prevalence rate with percent of difference and visit rate percent of difference among women, by age, race, and selected chronicconditions: United States, 1978
Cbronic condition and ICDA codfl
Age of patientPercent
of45-64. 65 years difference2Years and over
Race of patients65 years and over Percent 1
ofWhite Black and difference
=all other
Diabetes mellitus (250)
Rate per1,000 population
Rate per1,000 population
Prevalence ram 59.4 93.9 58 93.0- 103.4 411Visit rate 88.2 166.5 165.7 174.9 46
Hypertensive disease (400, 401; 403)Prevalence rate 198.3 302.1 52 292.4 397.4 436Visit rate 281.2 462.9 65 451.6 572.9
Coronary heart disease(4) 0-414)Prevalence rate 28.4 78.8 177 82.2 46.0 379Visit rate 79.7 312.0 291 317.6 257.1 324
Cerebrovascular disease (430-438)Prevalence rate 10.8 34.6 220 32.5 55.0 469Visit rate vttc 10.1 76.2 654 76.1 77.4 42
,......Arthritis (710.715)
Prevalence rate 304.0 522.1 72 522.0 523.4Visit rate .. 162.5 270.6 66 270.4 272.4
1See reference 15.2A11 rates are higher for patients 65 years of age and over.3Rate is higher fctr white race.Rate is higher for black and all other races. jj
7and visit rates for . arthritis appear to hb morecongruent. _
According to the data shown in table,E, women'65 years of age and over of black ai-fl all otter raceshad a higher prevalence rite for hypertensive,diseasethan white women had. However; the difference inthese rates was not matched by a similar increase inthe visit rate; which was lower than expected. This.difference is not surprising in view.of the lower rate'of physician visits by all other women. On the otherhand, coronary heart diseases was 79 percent moreprevalent among white women than aiming women 6fall other races, but 'their visit rate was only 24 percentgreater. No obvious reason foE this difference wasfound.
Table F includes similar types of data according--Ito the sex of the elderly patient. Prevalence rates
were higher for men with coronary heart disease andcerebrovascular disease;' women had a greater preva-lence of diabetes 'mellitus, hypertensive disease, andarthritis: Except for cerebrovascular disease, highervisit rates reflected higher prevalence rates, but thetwo, rates were not always consistent. Despite 31percent more diabetes among women, their visit ratefor this copciition was only 5 percent higher than thatfor men. Rates for hypertensive disease and arthritiswere alSo disproportionate. _Elderly men had an18iperdent higher prevalence* rate for coronary heartdiSease than elderly women had, but in a revefsal.of"the apparent trend, men visited physicians at a ratethatwas 47 percept higher thah that for women_ This
v.10
Table F. Prevalence rate with percent of difference and visit rate withpercent of difference among patients 65 years of age and over, bysex of patient and selected chronic conditions' United States,1978
Dia-gnosis and ICDA codelSex
Female Male
Percent ofdifference
Diabetes mellitus (250)Prevalence rateVisit rate
Hypertensive disease (400, 401, 493)Prevalence rateVisit rate
Coronary heart disease (410-414)Prevalence rateVisit rate
Cerebrovascular disease (430 -438)Prevalence rateVisit rate
Arthritis (710-715)' Prevalertce rate
Visit rate
Rate perA ,000 population
1See reference 15.
93.9 71.9 31
166.5 158.6 5."302.1 179.5 68462.9 302.5 53 .
\78.8 93.3 18312.0 459.2 47
34.6 59.5 7276.2 66.9 14
522.1 303.1 72270.6 176.8 53
finding was not true for cerebrovascular disease,hoWever, where the condition was 72 percent more
(4prevalent among men than among women; butwomen visited physicians at a 14 percent higher ratethan men did.
-18or.
..
''able G. Number of visits made by women 65 years and over for selectell principal diagnoses by percent of most frequent second- or third-listeddiagnosis: United States, 1978
... e
. Second- or third-listed diagnosis and ICDA code'
'444% e
.
Principal diagnosis and ICDA codel
Diabetesmellitus,
250'
'
.
HypertensiveCoronary
heartdisease, disease,
400, 401, 403 410-414
Arthritis,710-715
'Number of visits in thousands
All visits , 2,224 6,182 4,166
Percent
3,614
Diabetes mellitus 250 8.6 9.6 6.0Hypertensive disease 400, 401,403 ' 33.3 13.6Coronary heart disease 410-414 10.6 . 8.6Arthritis 710.715 6.2 . 7.0 10.5
'See reference 15.
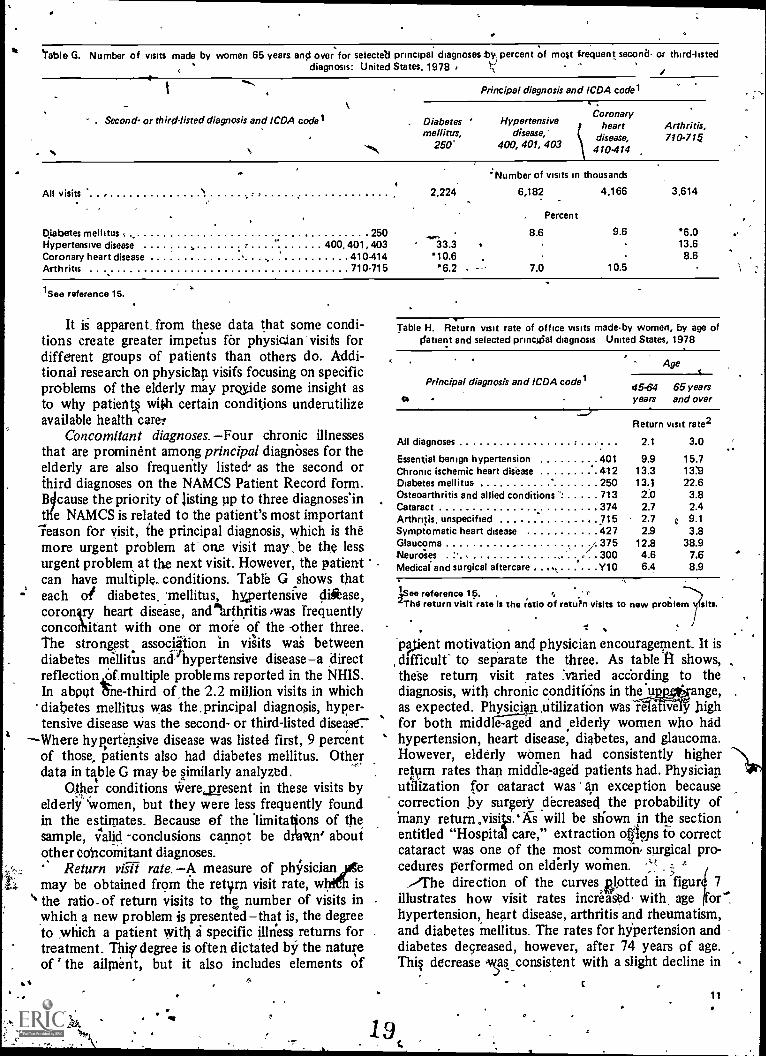
It is apparent. from these data that some condi-tions create greater impetus for physician visits fordifferent groups of patients than others do. Addi-tional research on physician visifs focusing on specificproblems of the elderly may pride some insight asto why patient§ with certain conditjons underutilizeavailable health carer
Concomitant diagnoses. -Four chronic illnessesthat are prominent among principal diagnoses for theelderly are also frequently listed- as the second orthird diagnoses on the NAMCS Patient Record form.Bicause the priority of listing up to three diagnoses'intlie NAMCS is related to the patient's most importantreason for visit, the principal diagnosis, which is theMore urgent problem at' one visit may be the lessurgent problem at the next visit. However, the patientcan have multiple. conditions. Table G shows thateach or diabetes. 'mellitus, hypertensive disease,coronlry heart disease, anclaiarthritis,was frequentlyconcothitant with one or more of the other three.The strongest association in vi;its was betweendiabetes mellitus and hypertensive disease-a directreflectionlOtmultiple problems reported in the NHIS.In abpat he -third of the 2.2 million visits in whichdiabetes mellitus was the.principal diagnosis, hyper-tensive disease was the second- or third-listed disease7
-Where hypertensive disease was listed first, 9 percentof those, patients also had diabetes mellitus. Otherdata in table G may be similarly analyzed.
Oter conditions were present in these visits byelderly 'Women, but they were less frequently foundin the estimates. Because of the 'limitations of thesample, valid -conclusions cannot b e d i;awn? aboutother cohcoinitant diagnoses.
Return vet rate. -A measure of plsicianmay be obtained from the retyrn visit rate, w is
° the ratio. of return visits to the number of visits inwhich a new problem is presented-that is, the degreeto hich a patient with a specific illness returns fortreatment. Thi§f degree is often dictated by the natureof ' the ailment, but it also includes elements of
Table H. Return visit rate of office visits madeby women, by age ofdatient and selected princgial diagnosis United States, 1978
Principal diagnosis and ICDA codel
Age
45-64years
65 yearsand over
Return visit rate2
All diagnoses 2.1 3.0
Essential benign hypertension 401 9.9 15.7Chronic ischemic heart disease 412 13.3 13:9Diabetes mellitus 250 13.1 22.6Osteoarthritis and allied conditions ". 713 2.0 3.8Cataract 374 2.7 2.4Arthritis, unspecified .. 715 2.7 0 9.1Symptomatic heart disease 427 2.9 3.8Glaucoma / 375 12.8 38.9N.eurrises , 300 4.6 7.6Medical and surgical aftercare , .., i , Y10 6.4 8.9
'See reference ip.'The return visit rate is the ratio of return visits to new problem
lpent motivation and physician encouragement. It isdifficult' to separate the three. As table 41 shows,these return visit rates "varied according to thediagnosis, with chronic conditions in theange,as expected. Physician,utilization wasTeliffieljr highfor both middle-aged and elderly women who hadhypertension, heart disease, diabetes, and glaucoma.However, elderly women had consistently higherretvm rates than middle-aged patients had. Physicianutilization for cataract was an exception becausecorrection by surgery decreased the probability ofMany return .visils.gs will be shown in the sectionentitled "Hospital care," extraction ogiefis to correctcataract was one of the most common, surgical pro-cedures performed on elderly women...-)The direction of the curvesetted in figur 7
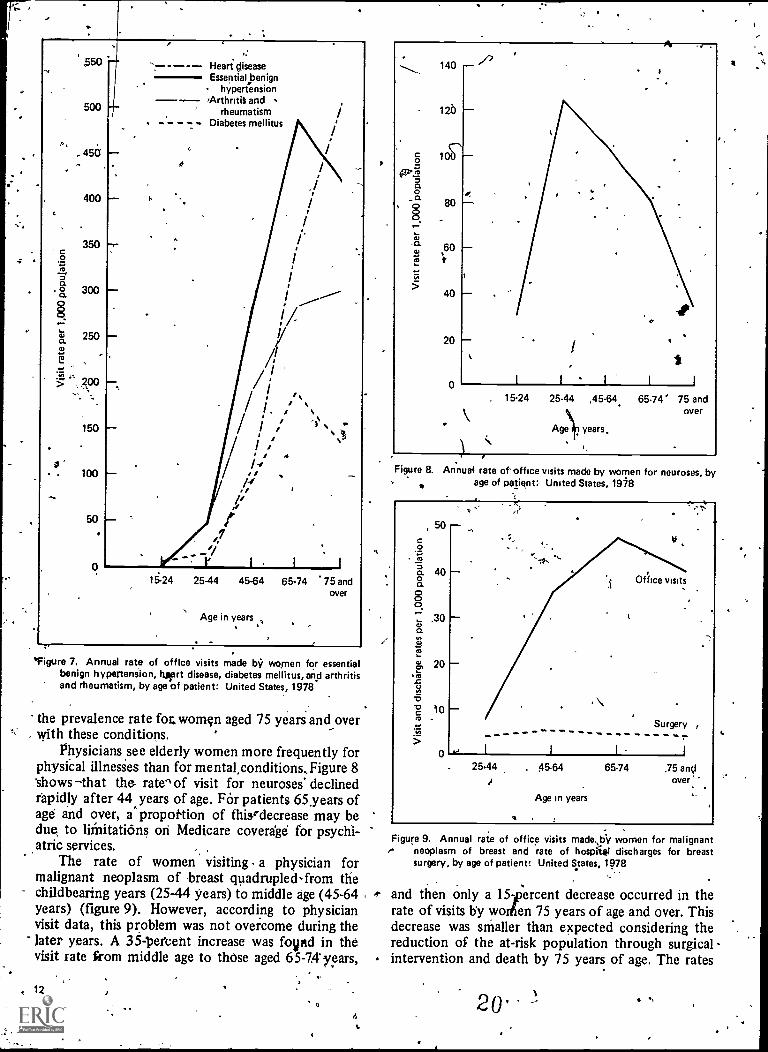
illustrates how visit rates increased, with, age or'.hypertension, heart disease, arthritis and rheumatism,
mand diabetes mellitus. The rates for hypertension anddiabetes decreased, however, after 74 years of age.Thi§ decrease as consistent with a slight decline in
19
11
. ;
550
500
45a
400
350c0
ao 300
07 250
7, 4,,300
150
100
Heart diseaseEssential benign
hypertension'Arthritis and
rheumatismDiabetes mellitus
15-24 25-44 45-64 65.74 75 andover
Age in years
*Figure 7. Annual rate of office visits made by women for essentialbenign hypertension, turrt disease, diabetes mellitus, and arthritisand rheumatism, by age of patient: United States, 1978
the prevalence rate fot women aged 75 years and overwith these conditions.
Physicians see elderly women more frequently forphysical illnesies than for mental,conditions,Figure 8shows that the rate" of visit for neuroses' declinedrapidly after 44 years of age. FOr patients 65years ofage and over, a proportion of thisrdecrease may bedue, to liinitatians on Medicare coverage for psychi-atric services.
The rate of women visiting a physician formalignant neoplasm of breast quadrupled-from thechildbearing years (2544 years) to middle age (45-64years) (figure 9). However, according to physicianvisit data, this problem was not overcome during thelater years. A 35 .-1)etterit increase was fovpid in thevisit rate from middle age to those aged 65-74 years,
12
. rFigure 8. Annual rate of office visits made by women for neuroses, by
age of patient: United States, 1978
50
c
,45a 400a
0,30
o.
ro
c) 2043
-512 10
0
et
Surgery ,---------------------.., I I I i
25.44 . 45-64 65-74 ,75 andover.
Age in years
Figure 9. Annual rate of office visitse neoplasm of breast and rate of
surgery, by age of patient: United
made.,bil women for malignanhospitsg discharges for breas
States, 1978
and then only a 151percent decrease occurred in therate of visits by worien 75 years of age and over. Thisdecrease was smaller than expected considering thereduction of the at-risk population through surgicalintervention and death by 75 years of age. The rates
20'
7
ot hospital discharges for breast,surgery varied littlefrom the youngest to the oldest age group indicatingthe continued Use of surgical procedkes during Oldage (figure 9).
Despite the rising rate of visits for bidastnancies, the rates of bleast examinations decreasedwith age. According to_the data collected during thehealth interviews in 1973 less than half the women65 years of age and over reported having had a breastexamination within the prior year compared withover three-fourths' of the. women 17-24 years' of
-_age.20 Among the elderly women interviewed, abotit18 percent had not had a breast examination for 5years dr more. However, these figures may havechanged by 1978.
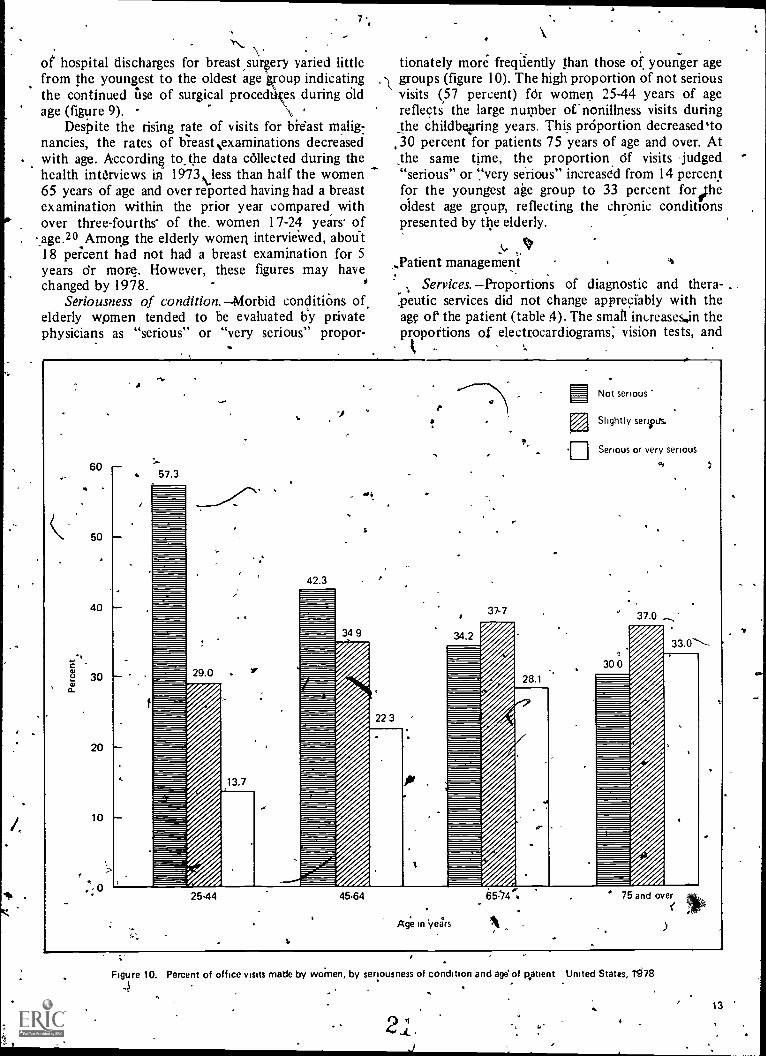
Seriousness of condition. Morbid conditions ofelderly women tended to be evaluated by privatephysicians as "serious" or "very serious" propor-
tionately more frequently than those of younger agegroups (figure 10). The high proportion of not seriousvisits (57 percent) fOr women 25-44 years of agereflects the large number of nonillness visits duringthe childbe,ging years. This prOportion decreased'to30 percent for patients 75 years of age and over. Atthe same time, the proportion Of visits judged"serious" or `,`very serious" increased from 14 percentfor the youngest age group to 33 percent for ftheoldest age group, reflecting the chronic conditionspresented by the elderly.
_Patient management
Services. Proportions of diagnostic and thera-peutic services did not change appreciably with theage of the patient (table 4). The small increases..in thepropottions of electrocardiograms; vision tests, and
60
50
40
C
30o.
20
10
, 0
ti
57.3
29.0
13.7
42.3
34 9
22 3
34.2
t,
rej
Not serious
Slightly serous
Serious or very serious
37-7 37.0
28.1
30 0
25.44 45.64
Age in years
65:74P 75 and over
Figure 10. Percent of office visits made by women, by seriousness of condition and age' of patient United States, 1978
4
2 L.J
13
rd .
blood pressure cheCks given to patients ovr6r 64 yearsof age reflect the onset of gerontological problems..The decreaie in the proportion of Pap tests per-formed during Itisits was consistent with the de-creased rate of that test as a reason for visit which isdisspssed in the section entitled "Preventive care." ,
'Drug prescription, the principal therapy em-ployed during' all visits regardless of age, tended to
%..iricr'base slightly from middle to old age. The NAMCSincluded data on specific medication therapy begin-ning with 198p And this information will be availablein future publications from the National Center for°Health, Statistics. This information will be of specialinterest regarding the elderly in terms of the infhience`of age and sex on ordering psychotropic dn.kgs and ofthe extent of use of preSctiptiOns with-generic tern&
Preventive care. SpeculaSioQ about the elderly. patient's4continuing concern for preventive care has
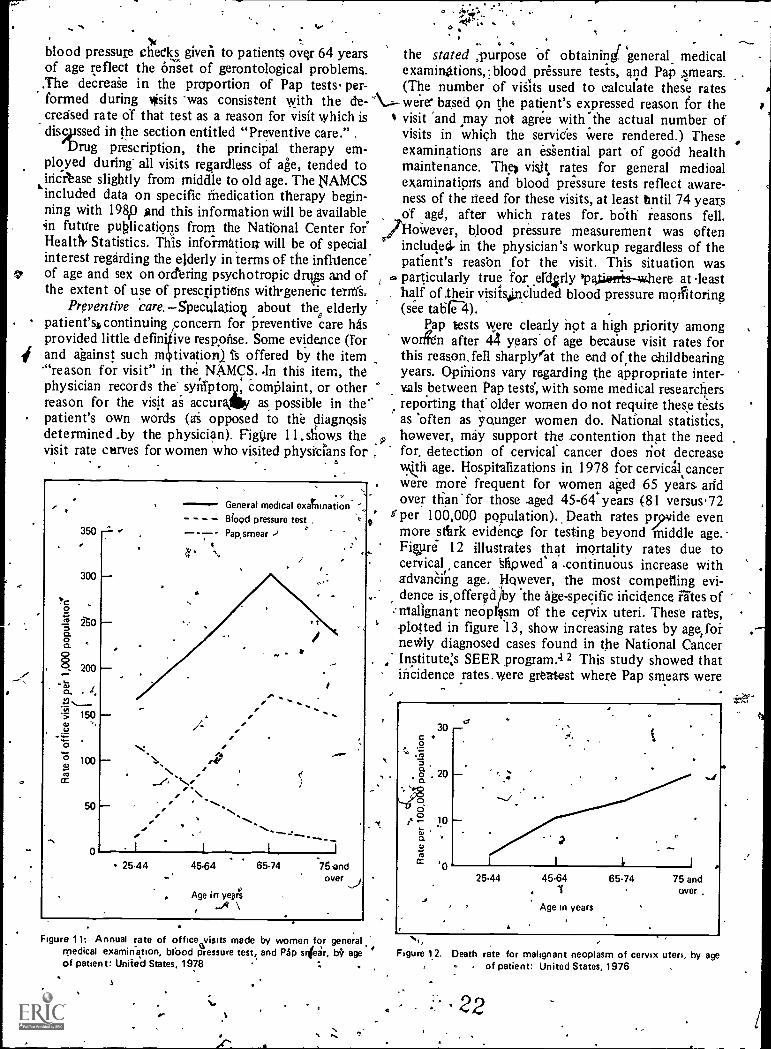
provided little definitive response. Some evidence (Forand against such m tivation,) Ts offered by the item'"reason for visit" in the, NAMCS. .In this item, thephysician records the-syreipton2, complaint, or otherreason for the visit as accurkilly as possible in thepatient's own words (ai opposed to the diagnosisdetermined .by the physician). Figire 11. shows thevisit rate carves for women who visited physicians for
I
350
300
" 150U
0co
100
50
0
...
General medical exaTnination
Blood pressure test ,
- -7- Pap,smear
S
9Age in years
14 \
- 25.44 45.64 65.74 5,andover
the stated ;purpose of obtaining( 'general medicalexaminations,=, blood pressure tests, and Pap smears.(The number of visits used to calculate these rates
N..-- were' based 9n the patient's expressed reason for thevisit and may not agree with-the actual number ofvisits in which the services were rendered.) Theseexaminations are an essential part of godd healthmaintenance. The) visit rates for general medioalexaminations and blood pressure tests reflect aware-ness of the need for these visits, at least until 74 yearsof ,,agd, after which rates for, bOth reasons fell.However, blood pressure measurement was oftenincluded. in the physician's workup regardless of thepatient's reason fo the visit. This situation wasparticularly true for..erd4rly 'patiorrtsmAhere at leasthalf of their visits4rcluded blood pressure morttoring(see table '4).
Pap tests were clearly not a high priority amongworifen after 44 years of age because visit rates forthis reason, fell sharply'fat the end ofrthe childbearingyears. Opinions vary regarding the appropriate inter-
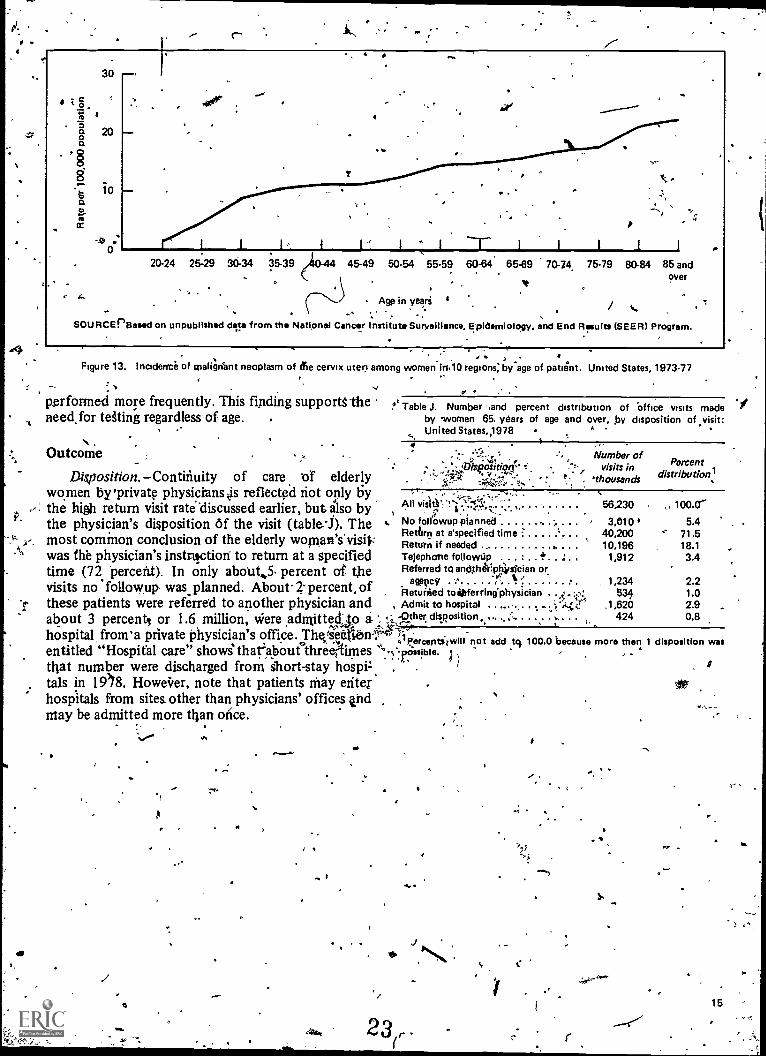
. vials between Pap tests, with some medical researchersreporting that older women do not require these testsas 'often as younger women do. National statistics,however, may support the .contention that the needfor detection of cervical cancer does riot decreaseworth age. Hospitalizations in 1978 for cervical cancerwere more frequent for women aged 65 years andover than for those .aged 45-64 years (81 versus.72
f per 100,000 pqpulation).. Death rates p iyvide evenmore stiirk evidence for testing beyond middle age.Figlire 12 illustrates that mortality rates due tocervical cancer afipwed a .continuous increase withadvanCiiig age., owever, the most compelling evi-dence is,offergd by the age-specific incidence rates ofmalignant neopl sm of the cervix uteri. These rates,plotted in figure '13, show increasing rates by age:forne*ly diagnosed cases found in the National Cancer
. Instituters SEER program:4 2 This study showed thatincidence rates. were greatest where Pap smears were
Figure 11: Annual rate of office visits made by women for generale fmedical examination, brood pressure test, and Pap smear, b$ age
of patient: Unite'd States, 1978
14
ti
t
/0
g 10
a .1iset .0 I I 1
25.44 45.64. 1
Age in years
65.74 75 andover .
a
Figure 12. Death rate for malignant neoplasm of cervix uteri, by ageof patient: United States, 1976
22
1:
l I L,..L'---1..''20-24 25-29 30.34 35-39 45-49 50-54
#
1J
I T L--1. I I I
55-59 60-64 65-69 70-14, 75-79 80-84 85 andover
Age in years '
SOURCEPSesed on unpublished data from the National Cancer institute Surveillance, Epidemiology. and End Results (SEER) Program.
Figure 13. Incidence of malignant neoplasm of fie cervix uteri among women irs10 regions:by age of patient. United States, 197377
performed more frequently. This finding supports-theneed, for testing regardless of age.
c
Table J. Number sand percent distribution of Office visits madeby women 65. years of age and over, ,py disposition of visit:United States4978 -
N , .
.% Outcome 4.' ... .!:. , -. Number of...
-- -5,. ...:- visits in Percent
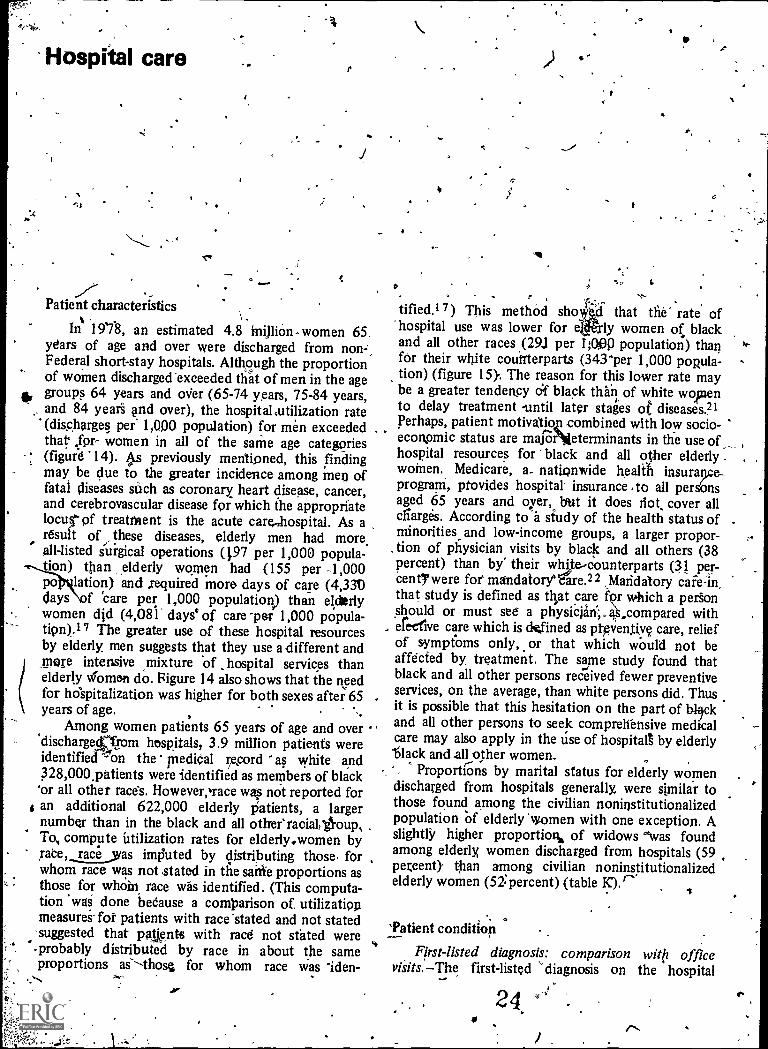
Disposition. Conthiuity of care tif elderly ':inse.clitiVr. 'thousands distribution:.n., ....-, ',./ -
women by'private physicians kis reflected riot only by , -, -;,.., -,:,.., .1,,,,-..;:, , y, ,
the high return visit ratediscussed earlier, but also by Ali visit).-..I.:,:c2,, the physician's disposition Of the visit (table4). The .2 No follOwup planned ',..1 '
56,230
4 05.4Cr
Return at a'specified time :" 40,200 ' 71.5,-- y. most common conclusion of the elderly woman's.visi$:.Ae.
Return if needed . 101:919126 18.1was the physician's instruction to return at a specified Telephone followtip e 1 3.4
time (72 'percent). In only about,5 pereent of the Referred to anoth&IptCysicien or0F 1, .gtocy ' rvisits no 'followup was planned. About. 2-percent. of
hetacuirled toOferring'physician .
1,234 2.2. 534 1.0
'1,- these patients were referred to another physician and , Admit to hospital .... .. ... .,',49;ir ,1,620 2.9
about 3 percent, or 1.6 million, were admittedjo i !,:,..lather. disposition......,', .. , . .. ..... 424 0.8
hospital from'a private physician's office. Thg4entiabir,'4141izricberets,7111
not add tci 100.0 because more than 1 disposition wasentitled "Hospital care" shows" thafabourthreimes '''-'
. T. a )that number were discharged from short-stay hoippt . .
tals in 1908. Howeirer, note that patients may elite': .
hospitals from sites other than physicians' offices andmay be admitted more than once.
. .:/ .. ir,...
e
.
23r,15 --
Hospiial careA
Patient characteristics .
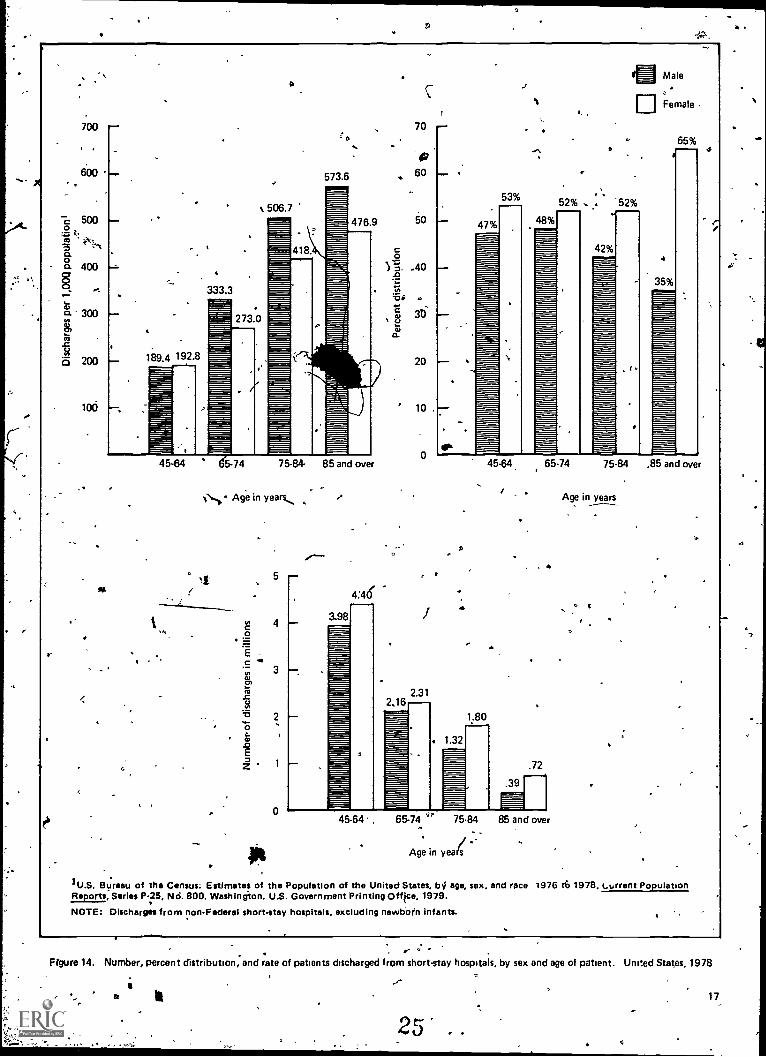
.In 1978, an estimated 4.8 inijlion- women 65.
years of age and over were discharged from non-,Federal short-stay hospitals. Although the proportionof women discharged-exceeded that of men in the age
6, groups 64 years and over (65-74 years, 75-84 years,and 84 year and over), the hospitahutilization rate(discharges per 1,000 population) for men exceededthat' for- women in all of the same age categories
-, (figure -14). As previously mentioned, this findingmay be due to the greater incidence among men offatal diseases such as coronary heart disease, cancer,and cerebrovascular disease for which the appropriatelocus' of treatment is the acute care,.,hospital. As aresult of these diseases, elderly men had more,all-listed surgical operations (197 per 1,000 popula-tion) than elderly women had (155 per -1,000po lation) and .required more days of care (4,330days f Care per 1,000 population) than elderlywomen did (4,081' days' of care-per 1,000 popula-tion).17 The greater use of these hospital resourcesby elderly. men suggests that they use a different andmore intensive mixture of hospital services thanelderly women do. Figure 14 also shows that the needfor holpitalization was higher for both sexes after 65years of age. . . .
,.Among women patients 65 years of age and over
`dischargerfsom hospitals, 3.9 million patients wereidentified '''Ion the inediCal record as white and328,000,patients were identified as members of black'or all other races. However,trace was not reported for
i an additional 622,000 elderly patients, a largernumber than in the black and all other'raciall'gloup,To compute utilization rates for elderlycwomen by
- rate,, race yeas imputed by distributing those, forwhom race was not stated in the same proportions asthose for whOin race was identified. (This computa-tion 'woe done because a comparison of utilizationmeasures- for patients with race "stated and not statedsuggested that patients with race not stated were-probably distributed by race in about the sameproportions as---tho4 for whom race was -Wen-
.:-,..
18
9
0, I.
k,
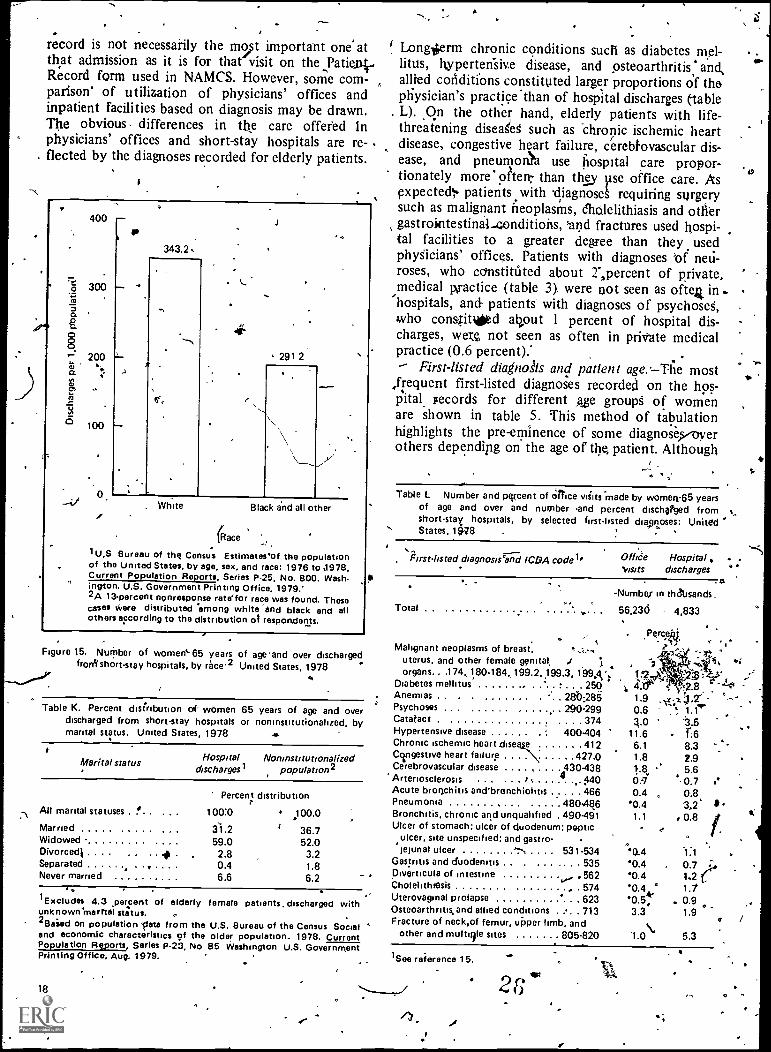
tified.17) This method sho d that the' rate ofhospital use was lower for e ly women of blackand all other races (291 per I;000 population) thanfor their white couitterparts (343'per 1,000 popula-tion) (figure 15): The reason for this lower rate maybe a greater tendency of black than, of white womento delay treatment -until later stages of diseases.21Perhaps, patient motivatioz combined with low socio-economic status are majONeterminants in the use ofhospital resources for black and all other elderly -
woinen. Medicare, a- nationwide health insuraprogram, provides hospital' insurance to all personsaged 65 years and oyer, but it does riot cover allcfiarges. According to-a study of the health status ofminorities and low-income groups, a larger propor-
, tion of physician visits by black and all others (38percent) than by' their white-counterparts (31 per-CentYwere for mandatory'trare.22 ,Maridalory cafe-in,that study is defined as that care for which a pedonshould or must see a physiCian;-4compared withelective care which is dined as preVeaiye care, reliefof symptoms only, or that which would not beaffected by. treatment. The same study found thatblack and all other persons received fewer preventiveservices, on the average, than white persons did. Thusit is possible that this hesitation on the part of blIckand all other persons to seek comprehensive medicalcare may also apply in the use of hospital by elderly'black and all other women.
Proportions by marital status for elderly womendischarged from hospitals generally. were similar tothose found among the civilian noninstitutionalizedpopulation of elderly 'women with one exception. Aslightly higher proportion.. of widows --was foundamong elderly women discharged from hospitals (59petcent)r than among civilian noninstitutionalizedelderly women (52 percent) (table K'). s
'Patient condition
First-listed diagnosis: comparison with officevisits. The first-listed 'diagnosis on the hospital
24.
2
a
o t.
700
600
500 --
a
:0
573.6
70
60
5
--
OP,
CO t
00n
400 AO
'a* .300 c0
c0
3D
.2
200 189.4 192.8 20
100 10 .
Ef
oa
45-64 65-74 75-84- 85 and over
Age in years
0
Ec
is
0c0
E
z
3.98
e
53%
47%
4
48%
aMale
EjFemale
65%4
52% . . '52%
42%4
35%
1.80
1.32
45-64, 65-74 75-84 ,85 and over
9
.72
45-64. 65-74 75.84 85 and over
/ --Age in years
Age in years
1U.S. Bureau of the Census: Estimates of the Population of the United States, by age, sex, and race 1976 t6 1978, c.urrent PopulationReports, Series P-25, Nd. 800. Washington. U.S. Government Printing Office, 1979.
NOTE: Discharges from non-Federal short-stay hospitals, excluding newborn infants.
. r-Frgure 14. Number, percent distribution, and rate of patients discharged from short-stay hospitals, by sex and age of patient. United States, 1978
25 .
17
.e.
a
".
record is not necessarily the most important one atthat admission as it is for that visit on the ,Patienii..Record form used in NAMCS. However, some com-parison' of utilization of physicians' offices andinpatient facilities based on diagnosis may be drawn.The obvious differences in the care offered inphysicians' offices and short-stay hospitals are re-flected by the diagnoses recorded for elderly patients.
400 -
300to
200
Fr>
to
5 100
343.2,
291 2
White Black and all other
(Race
1 U,S Bureau of the Census Estimates'of the populationof the United States, by age, sex, and race: 1976 to 1978,Current Population Reports, Series P-25, No. 800. Wash.ington. U.S. Government Printing Office, 1979.'2A 13percent nonresponse ratelor race was found. Thesecases vere distributed among white -and black and allothers according to the distribution of respondents.
Figure t5, Number of women' 65 years of ageend over dischargedfrodt short-stay hospitals, by rece2 United States, 1978
Table K. Percent distribution of womendischarged from short-stay hospitalsmarital status. United States, 1978
65 years of age and overor noninstitutionalized, by
eHospital NoninstitutionalizedMarital status
discharges1 population
Percent distribution
All marital statuses . !.. 100:0 .100.0
Married ..... . . . . 31.2 36.7Widowed - 59.0 52.0Divorcedi 2.8 3.2Separated ...... . 0.4 1.8Never married 6.6 6.2
'Excludes 4.3 ,percent of elderlyunknown 'marital status.2Baied on population Vete from theand economic characteristics of thePopulation Reports, Series P-23, NoPrinting Office, Aug. 1979.
18
Longterm chronic conditions such as diabetes mel-litus, hypertedsive disease, and osteoarthritis: andallied conditions constituted larger proportions of thephysician's practice than of hospital discharges (-tableL). On the other hand, elderly patients with life-threatening diseaeg such as -chronic ischemic heartdisease, congestive heart failure, cerebkvascular dis-ease, and pneumonN use hospital care propor-tionately more oher- than they Ilse office care. Asexpectedl patients with diagnose requiring surgerysuch as malignant neoplasms, eholelithiasis and othergastrointestinal-conditions, 'and fractures used hospi-tal facilities to a greater degree than they usedphyicians' offices. Patients with diagnoses of neu-roses, who constituted about 2",percent of private,medical practice (table 3). were not seen as ofte4 in .
'hospitals, and patients with diagnoses of psychose,who conslitded al?out 1 percent of hospital dis-charges, were not seen as often in private medicalpractice (0.6 percent)."- First-listed diagnosis and patient age.--Tlie most
,frequent first-listed diagnoses recorded on the hos-pital Fecords for different age groups of womenare shown in table 5: This method of tabulationhighlights the pre-eminence of some diagnose,s/overothers depending on the age of the patient. Although
female patients, discharged with
U.S. 8ureau of the Census Social 'older population. 1978. Current85 Washington U.S. Government
"
r'
Table L Number and percent of Orrice wilts made by women-65 yearsof age and over and number 'and percent discharged from .short-stay hospitals, by selected first-listed diagnoses: UnitedStates, 19.28
diagnosis and ICDA code l'
Total
Malignant neoplasms of breast,uterus, and other female genital,organs.. .174, 180. 184, 199.2, 199.3, 'MA': tr?
Diabetes mellitus 250 4 4.Anemias . . . ....... . . 28'086 1.9
290-299' Psychoses 0.6Catatac t . 374 4.0Hypertensive disease ...... 400.404 11.6Chronic ischemic heart rime e 412 6.1Congestive heart failure . . . ..... 427.0 1.8Cerebrovascular disease . . . . . .A430438Arteriosclerosis 9 440
1
Acute bronchitis and'bronchiolitis 466Pneumonia 4804846Bronchitis, chronic and unqualified . 490491Ulcer of stomach; ulcer of duodenum; peptic
ulcer, site unspecified; and gastro-ieiunal ulcer 531.534
Gastritis and duodenum . . . . . . . 535,Diverticula of intestineCholelithigsis , 574Uterovaginal prolapse 623Osteoarthritis,and allied conditions . 713Fracture of neck.of femur, upper limb, and
other and multilile sites 805-820
Office Hospital . .visits discharges
. et
-Numbef in thattsands
56,236 4,833
. Per*,
t.80.70.4
"0.41.1
0.4"0.4"0.4'0.40.5,3.3
2.8Nl.".*
1:68.32.95.60.7 i*0.8
'1.0 5.3
1.wte reference 15.
20
chronic ischemic heart disease wts the foremostdiagnosis for all hospitalized women 45 years of ageand over, it constituted an increasingly higher propor-tion of all discharges with increasing age of thepatient, ranging from about 3 percent for those 45-64years of age to about 11 percent for those 85 yearsand over.
The spectrum of conditions diagnosed in hospitalsbeconfes narrower as women age. The prominence ofuniquely female problems such as malignant neo-plasms of the breast and, female genital organs}uterovaginal prolapse, uterine fibromyoma, and inter -menstrual bleeding diminished after 64 years of age.Similarly, psychoses, alcoholism, ulcers, and disc andback problems declined in ranks after 64 years of age.For women 65 years of age and over, diagnoses ofcataract, cerebrovascular disease, #nd fractures weremore prominent than they were for younger women.
Table 6 shows the most frequent first-listeddiagnoses for elderly women by racial groups. Racewas not stated for about 13 percent of elderly womendischarged= therefore, caution must be used in inter-_preting differences in diagnoses between the tworacial groups white and black and all other, becausethese differences may be influenced by the distribu-tion of those for whom race was not stated. Neverthe-less, the data show that among elderly women forwhom race was Stated, chronic ischemic heart disease,cerebrovascular disease, cataract, pneumonia, conges-tive heart failure, and diattes mellitus were amongthe 10 most frequent first-listed diagnoses for allracial groups. These 6 diagnoses; however, account6dfor a greater proportion of discharges by black and allother women (32 percent) than they did for whia.women, f 26 percent). Other differences by raceamong elderly female discharges included the higherranking of fractures for white women than for blackand all other women. Fracture of fled( of femur, forexample, was ranked 5th among elderly white womenand 18th among elderly black and all other women.
As previously mentioned, the incidence of fataldiseases is more common among elderly men than
among, elderly women. As table 7 shOws, the dis-charge rates for elderly men exceeded those forelderly women for pneumonia, congestive heart fail-u e, and acute myocardial infarction.
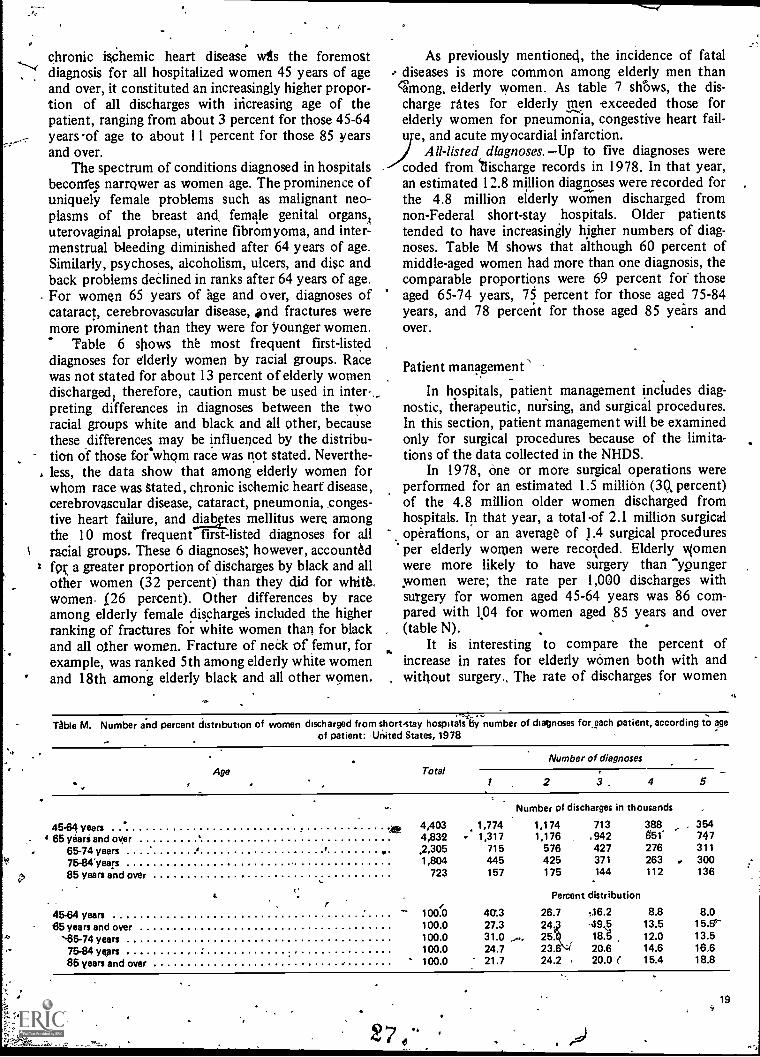
All-listed diagnoses. -Up to five diagnoses werecoded from "discharge records in 1978. In that year,an estimated 12.8 million diagnoses were recorded forthe 4.8 million elderly women discharged fromnon-Federal short-stay .hospitals. Older patientstended to have increasingly higher numbers of diag-noses. Table M shows that although 60 percent ofmiddle-aged women had more than one diagnosis, thecomparable proportions were 69 percent for- thoseaged 65-74 years, 75 percent for those aged 75-84years, and 78 percent for those aged 85 years andover.
Patient management \
In hospitals, patient management includes diag-nostic, therapeutic, nursing, and surgical procedures.In this section, patient management will be examinedonly for surgical procedures because of the limita-tions of the data collected in the NHDS.
In 1978, one or more surgical operations wereperformed for an estimated 1.5 million (30, percent)of the 4.8 million older women discharged fromhospitals. In that year, a total of 2.1 million surgicaloperations, or an average of 1.4 surgical proceduresper elderly women were recorded. Elderly viomenwere more likely to have surgery than "ypungerwomen were; the rate per 1,000 discharges withsurgery for women aged 45-64 years was 86 com-pared with 1,04 for women aged 85 years and over(table N).
It is interesting to compare the percent ofincrease in rates for elderly women both with andwithout surgery., The rate of discharges for women
TAbie M. Number and percent distribution of women discharged from short-stay hospitalsliy number of diagnoses for, each patient, according to ageof patient: United States, 1978
Age TotalNumber of diagnoses
2 3. 4 5
Number of discharges in thousands
45-64 years 4,403 1,774 1,174 713 388 r 354
65 yeariand over 4,832 - 1,317 1,176 .942 651' 747
65-74 years v .2,305 715 576 427 276 311
75-84"years 1,804 445 425 371 263 300
85 years and over 723 157 175 144 112 136
Percent distribution
45-64 years loon 4(7.3 26.7 06.2 8.8 8.065 years and over 100.0 27.3 24.3 +19 5 13.5 15.56
'65-74 years 100.0 31.0 25ki 186 12.0 13.5
75-84 years 100.0 24.7 23.6 20.6 14.6 16.6
85 years and over 100.0 21.7 24.2 20.0 ( 15.4 18.8
19
L
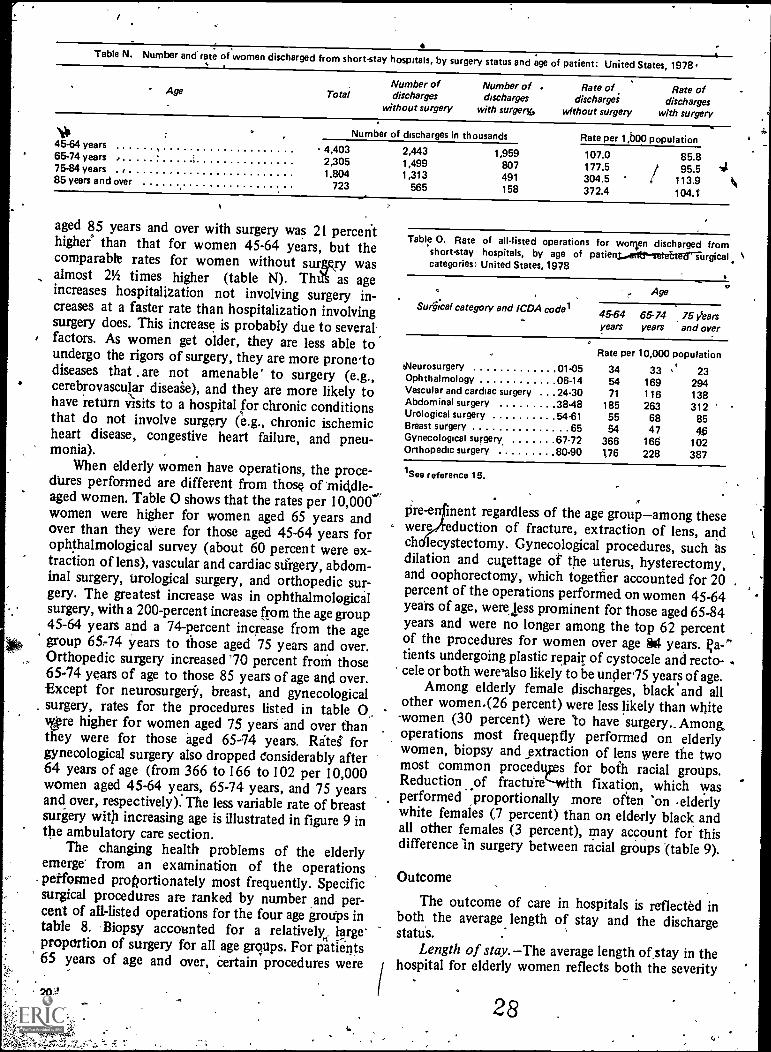
Table N. Number and rate of women discharged from short-stay hospitals, by surgery status and age of patient: United States, 1978.
Age TotalNumber ofdischarges
without surgery
Number of .discharges
with surgery,
Rate ofdischargei
wfthout surgery
Rate ofdischarges
with surgery
stlt .Number of discharges in thousands Rate per 1,boo population
4,403 2,443 1,959 107.0 85.845-64 years65-74 years . 2,305 1,499 807 177.5 95.575-84 years . , 1.804 1,313 491 304.5 113.985 years and over 723 565 158 372.4 104.1'
aged 85 years and over with surgery was 21 percenthigher' than that for women 45-64 years, but thecomparable rates for women without surgcry wasalmost 21/2 times higher (table N). ThiA as ageincreases hospitalization not involving surgery in-creases at a faster rate than hospitalization involvingsurgery does. This increase is probably due to severalfactors. As women get older, they are less able toundergo the rigors of surgery, they are more prone-todiseases that are not amenable' to surgery (e.g.,cerebrovascular diseaie), and they are more likely tohave return visits to a hospital for chronic conditionsthat do not involve surgery (e.g., chronic ischemicheart disease, congestive heart failure, and pneu-monia).
When elderly women have operations, the proce-dures performed are different from those of 'middle-aged women. Table 0 shows that the rates per 10,000'women were higher for women aged 65 years andover than they were for those aged 45-64 years forophthalmological survey (about 60 percent were ex-traction of lens), vascular and cardiac surgery, abdom-inal surgery, urological surgery, and orthopedic sur-gery. The greatest increase was in ophthalmologicalsurgery, with a 200-percent increase from the age group45-64 years and a 74-percent increase from the agegroup 65 -74 years to those aged 75 years and over.Orthopedic surgery increased '70 percent from those65-74 years of age to those 85 years of age and over.Except for neurosurgery" , breast, and gynecologicalsurgery, rates for the procedures listed in table 0..wire higher for women aged 75 yearS and over thanthey were for those aged 65-74 years. Ritei forgynecological surgery also dropped Considerably after64 years of age (from 366 to 166 to 102 per 10,000women aged 45-64 years, 65-74 years, and 75 yearsand over, respectively). The less variable rate of breastsurgery with increasing age is illustrated in figure 9 inthe ambulatory care section.
The changing health problems of the elderlyemerge' from an examination of the 'operationsperformed proportionately most frequently. Specificsurgical procedures are ranked by number and per-cent of all-listed operations for the four age groups intable 8. Biopsy accounted for a relatively, largeproportion of surgery for all age mops. For patients65 years of age and over, Certain procedures were
Table 0. Rate of all-listed operations for women discharged fromshort-stay hospitals, by age of patienyarr&setettersurgicalcategories: United States, 1978
Surgical category and 1CDA code/
Age
45-64 65-74 75 Veersyears years and over
O
Rate per 10,000 populationehleurosurgery 01-05 34 33 23Ophthalmology 06-14 54 169 294Vascular and cardiac surgery .24.30 71 116 138Abdominal surgery 38.48 185 263 312Urological surgery 54.61 55 68 85Breast surgery 65 54 47Gynecological surgery, 67.72 366 166 102Orthopedic surgery 80-90 176 228 387
1See reference 15.
Pre-e inept regardless of the age groupamong thesewere eduction of fracture, extraction of lens, andch lecystectomy. Gynecological procedures, such asdilation and cupttage of the uterus, hysterectomy,and oophorectomy, which together accounted for 20percent of the operations performed on women 45-64yeah of age, were less prominent for those aged 65-84years and were no longer among the top 62 percentof the procedures for women over age 84 years. );a -Q'tients undergoing plastic repair of cystocele and recto-cele or both were'also likely to be under75 years of age.
Among elderly female discharges, black and allother women.(26 percent) were less likely than white
-women (30 percent) were 'to have surgery.. Among.operations most frequepfly performed on elderlywomen, biopsy and extraction of lens were the twomost common procedups for both racial groups.Reduction of fracture` -with fixation, which was
,proportionally,proportionally more often 'on -elderlywhite females (7 percent) than on elderly black andall other females (3 percent), may account for thisdifference in surgery between racial gyoups (table 9).
Outcome
The outcome of care in hospitals is reflected inboth the average length of stay and the dischargestatus.
Length of stay. The average length ofstay in thehospital for elderly women reflects both the severity
28
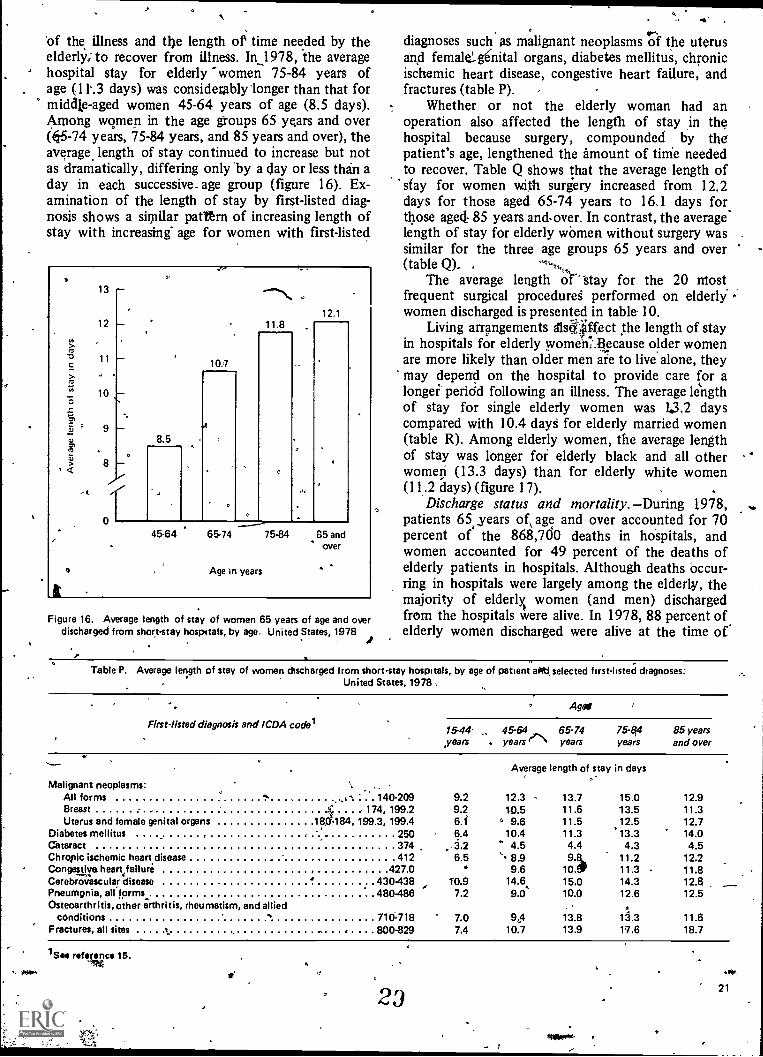
of the illness and the length of time needed by theelderly; to recover from illness. In_1978, the averagehospital stay for elderly -women 75-84 years ofage (11-.3 days) was considerably 'longer than that formiddle-aged women 45-64 years of age (8.5 days).Among women in the age groups 65 years and over(05-74 years, 75-84 years, and 85 years and over), theaverage. length of stay continued to increase but notas dramatically, differing only by a day or less than aday in each successive_ age group (figure 16). Ex-amination of the length of stay by first-listed diag-nosis shows a similar patttrn of increasing length ofstay with increasing' age for women with first-listed
t
13 -
12
11
10
9
8 -
of
10.7
4
8.5
11.812.1
45-64 65-74
o Age In years
75.84 85 andover
Figure 16. Average length of stay of women 65 years of age and overdischarged from short-stay hospitals, by age. United States, 1978
diagnoses such as malignant neoplasms of the uterusand female' genital organs, diabetes mellitus, chronicischemic heart disease, congestive heart failure, andfractures (table P).
Whether or not the elderly woman had anoperation also affected the length of stay in thehospital because surgery, compounded by thepatient's age, lengthened the amount of time neededto recover. Table Q shows that the average length ofstay for women with surgery increased from 12.2days for those aged 65-74 years to 16.1 days forthose aged. 85 years and over. In contrast, the averagelength of stay for elderly women without surgery wassimilar for the three age groups 65 years and over(table Q). ,
The average length of.' 'Stay for the 20 mostfrequent surgical procedures performed on elderlywomen discharged is presented in table 10.
Living arrangements /1s4ffect the length of stayin hospitals for elderly women: ecause older womenare more likely than older men are to live alone, theymay depend on the hospital to provide care for alonger peridd following an illness. The average lengthof stay for single elderly women was 1.3.2 dayscompared with 10.4 days for elderly married women(table R). Among elderly women, the average lengthof stay was longer for elderly black and all otherwomen (13.3 days) than for elderly white women(11.2 days) (figure 17).
Discharge status and mortality. -During 1.978,patients 65, years age and over accounted for 70percent of the 868,700 deaths in hospitals, andwomen accounted for 49 percent of the deaths ofelderly patients in hospitals. Although deaths occur-ring in hospitals were largely among the elderly, themajority of elderly women (and men) dischargedfrom the hospitals were alive. In 1978, 88 percent ofelderly women discharged were alive at the time of.
Table P. Average length of stay of women discharged from short-stay hospitals, by age of patient afitf, selected first - listed diagnoses:United States, 1978
Ago!
Firstlisted diagnosis and ICDA codes15-44'years
45-64years e
65-74years
75-84years
85 yearsand over
Malignant neoplasms:
Average length of stay in days
All forms . 140-209 9.2 12.3 13.7 15.0 12.9Breast 174, 199.2 9.2 10.5 11.6 13.5 11.3Uterus and female genital organs 18184, 199.3, 199.4 6.f ,, 9.6 11.5 12.5 12.7
Diabetes mellitus 250 6.4 10.4 11.3 '13.3 14.0Cataract 374 ..3.2 4.5 4.4 4.3 4.5Chronic ischemic heart disease 412 6.5 8.9 9.8 11.2 12.2Congestive heart failuri 427.0 9.6 10. 11.3 11.8
4CerebroGscular disease .430.438 T0.9 14.6,. 15.0 14.3 12.8Pneumgnia, all forms 480486 7.2 9.0 10.0 12.6 12.5Osteoarthritis, other arthritis, rheumatism, and allied A
conditions 710:718 7.0 9,4 13.8 11.3 11.6Fractures, all sites 800-829 7.4 10.7 13.9 17.6 18.7
1See reeve 15.OW.
23
-
.I.21
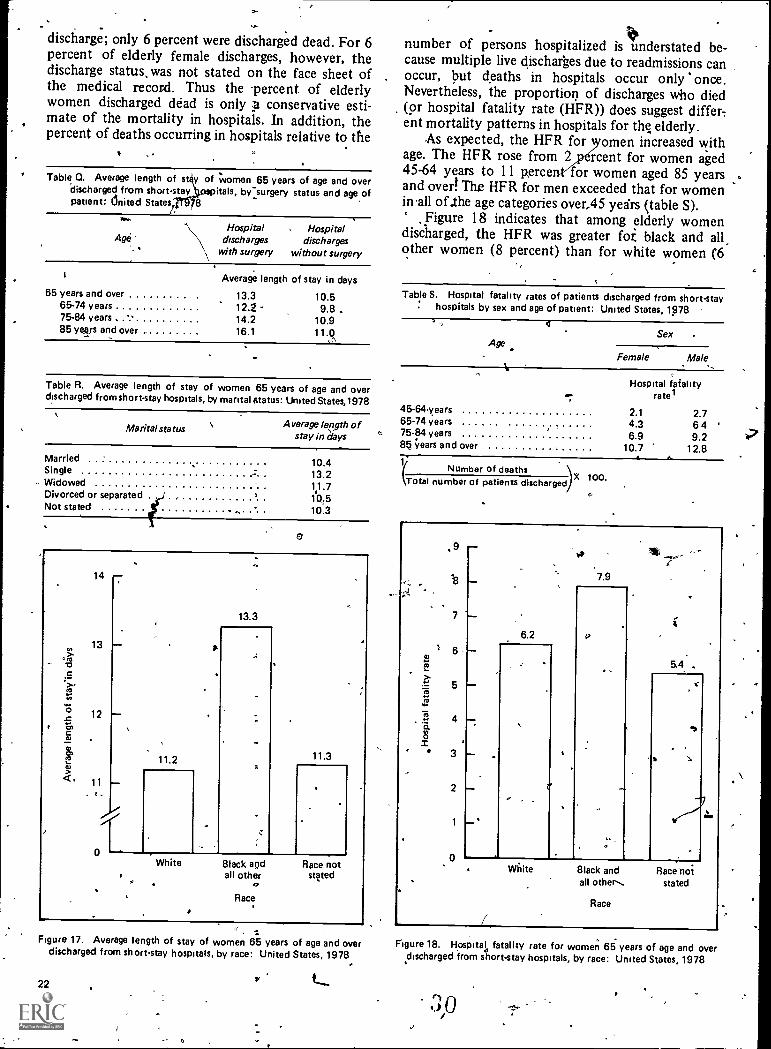
discharge; only 6 percent were discharged dead. For 6percent of elderly female discharges, however, thedischarge status, was not stated on the face sheet ofthe medical record. Thus the percent of elderlywomen discharged dead is only conservative esti-mate of the mortality in hospitals. In addition, thepercent of deaths occurring in hospitals relative to the
Table Q. Average length of sty of women 65 years of age and overdischarged from short-stay itals, by-surgery status and age ofpatient: dnited States/. 8
AgeHospital
dischargeswith surgery
Hospitaldischarges
without surgery
65 years and over65-74 years75-84 years85 years and over
Average length of stay in days
13.3 10.512.2 9.8 .14.2 10.916.1 11.0
Table R. Average length of stay of women 65 years of age and overdischarged from short-stay hospitals, by marital status: United States,1978
Marital status Average length ofstay in days
MarriedSingle
- WidowedDivorced or separatedNot stated
10.413.211.710,510.3
14
13.3
cri13
a-
15 12C
Clq? 11.2 11.3CU
11
oWhite 8lack and Race not
all other stated
Race
Figure 17. Average length of stay of women 65 years of age and overdischarged from short-stay hospitals, by race: United States, 1978
22
number of persons hospitalized is understatednderstated be-cause multiple live discharges due to readmissions canoccur, but deaths in hospitals occur only once.Nevertheless, the proportion of discharges who died(or hospital fatality rate (HFR)) does suggest differ-ent mortality patterns in hospitals for the elderly.
As expected, the HFR for omen increased withage. The HFR rose from 2 rcent for women aged45-64 years to 11 p,erce for women aged 85 yearsand over! The HFR for men exceeded that for womenin'all of .the age categories over,45 yedrs (table S).
Figure 18 indicates that among elderly womendischarged, the HFR was greater fot black and allother women (8 percent) than for white women (6
Table S. Hospital fatality rates of patients discharged frOm short -stay: hospitals by sex and age of patient: United States, 1978
AgeSex
Female Male
Hospital fatalityrate1
45-64years 2.1 2.765-74 years 4.3 6 4 '75-84 years 6.9 9.285 years and over 10.7 12.8
Number of deaths(Total number of patients discharged 100.
a
a.,-
..
.9
4
3
0
7.9
6.2
5.4
-
Mite 8lack and Race hotall other.. stated
Race
Figure 18. Hospital fatality rate for women 65 years of age and overdischarged from short-stay hospitals, by race: United States, 1978
3
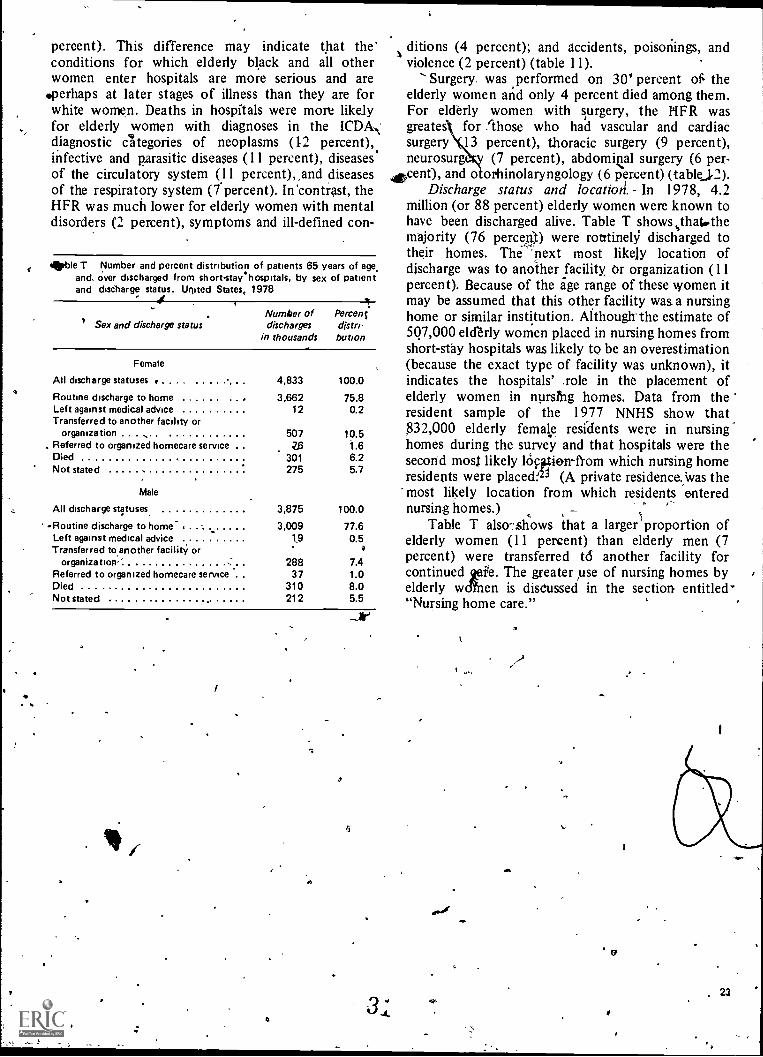
(
percent). This difference may indicate that theconditions for which elderly black and all otherwomen enter hospitals are more serious and are
'perhaps at later stages of illness than they are forwhite women. Deaths in hospitals were more likelyfor elderly women with diagnoses in the ICDA.,'diagnostic categories of neoplasms (12 percent),infective and parasitic diseases (11 percent), diseasesof the circulatory system (11 percent),,and diseasesof the respiratory system (7 percent). In 'contrast, theHFR was much lower for elderly women with mentaldisorders (2 percent), symptoms and ill-defined con-
amble T Number and percent distribution of patients 65 years of age.and over discharged from short -stay hospitals, by sex of patientand discharge status. United States, 1978
Sex and discharge statusNumber ofdischarges
in thousands
Percentdistri-bution
Female
All discharge statuses 4,833 100.0
Routine discharge to home .... .. 3,662 75.8Left against medical advice 12 0.2Transferred to another facility or
organization 507 10.5Referred to organized homecare service 1.6Died 301 6.2Not stated 275 5.7
Male
All discharge statuses. 3,875 100.0
-Routine discharge to home- , 3,009 77.6Left against medical advice 0.5Transferred to another facility or
organizatiosi-,' 288 7.4Referred to organized homecare service . 37 1.0Died 310 8.0Not stated 212 5.5
. ;
ditions (4 percent); and accidents, poisonings, andviolence (2 percent) (table 11).
Surgery wasand
on 30' percent of. theelderly women and only 4 percent died among them.For elderly women with surgery, the HFR wasgreates for `those who had vascular and cardiacsurgery 13 percent), thoracic surgery (9 percent),neurosurg (7 percent), abdomiQal surgery (6 per-,cent), and otorhinolaryngology (6 percent) (tablej2).
Discharge status and locatiori. in 1978, 4.2million (or 88 percent) elderly women were known tohave been discharged alive. Table T showsisthatwthemajority (76 percent) were routinely discharged totheir homes. The 'next most likely location ofdischarge was to another facility Or organization (11percent). Because of the age range of these women itmay be assumed that this other facility was a nursinghome or similar institution. Although the estimate of507,000 elderly women placed in nursing homes fromshort-stay hospitals was likely to be an overestimation(because the exact type of facility was unknown), itindicates the hospitals' .role in the placement ofelderly women in nursfng homes. Data from theresident sample of the 1977 NNHS show that832,000 elderly female residents were in nursinghomes during the survey and that hospitals were thesecond moss likely lOpotien-ftom which nursing homeresidents were placecL2 (A private residence. was themost likely location from which residents enterednursing homes.)
Table T also-:shows that a larger proportion ofelderly women (11 percent) than elderly men (7percent) were transferred td another facility forcontinued vie. The greater use of nursing homes byelderly wen is disCussed in the section entitled'"Nursing home care."
, 23
,--,Nursing home care
-1
Patient characteristics
In 1977, elderly women' were twice as likely aselderly men to reside in nursing homes (figure 19).Although use of nursing homes increased with ad-
. vancing age for both sexes, women used nursinghomes at significantly higher rates than men did_
regardless of the age group. This pattern of use wasespeciallyotrue in the oldest age gioup where l' in 4women 85 years.bf age and over resided in nursinghomes compared with 1 in 7 men of the same age. Alonger life expectancy and a greater tendency amongpersons withdli't spouses to enter nursing homesreflect this greater utilization by elderly wom-en,2 3 ,24 Because about half '(52 percent) of civiliannoninstitutionalized women 65 years of age and overwere widowed (conipared with 14 percent of men of,the-same age), they faced this problem to a greater'extent than men,did. .
The marital status distribution of nursing1Iomeresidents alio reflects this pattern of use. In 1977, 78percent of elderly female nursing home residents werewidowed compared with only 46 percent of elderlY23male residents. -
In 1977, white women were more likely to residein nursing homes than black, and all other womenwere. The rate of nursing home use by elderly whitewomen (62 per 1,000 population) was about 72percent greater than that for elderly women of blackand all other races (36 per 1,000 population) (figure20). This lower use is not only due to the shorter lifespan of black and all other women (71 yearscompared with 77 years for white women),24.. butalso may be due to the greater substitution ofinformal home care for , formal nursing home care.Because elderly black women are: more likely tomaintain an extended family household, informal
.
borne tate is also more likely to'be available to them.Moreover, elderly persons of Asian and tacifiC Islandsethnicity have traditionally been cared for in thehome.25 InIddition, the shortage of beds funded by
irs
Medicaid may .result in the lower use of nursinghomes by 13,04 and all other elderly woMen.26Medicaid is a joint Federal-State program providingmedical benefits to low iftome groups. Becauseelderly black women are more likely to have lowincomes, their use of Medicaid as source of paymentfor nursing home care is greater than that of elderlywhite women. In 1977, a greater proportion of blackthan 'white residents ,relied on Medicaid as theirprimary source of payment for care.23 .
Nursing home utilization was examined in the .
preceding discussion by using cross-sectional data onnursing home residents collected from the 1977NNHS. In addition to the resident sample, the 1977 ,
NNHS also include ps sample of all discharges (aliveand dead) froth' nursing,. homes during the 1976calendaryear. Data on discharges were collected byinterviewing the nurse most familiar with the relevahtmedical records. In the remainder of this section,only data from the dische sample will be examinedbecause it allows examination of completed length ofstay and outcome of came for personidischarged fromnursing homes: Demographically, the chiracteristicsof persons discharged from nursing homes are similarto those of residents currently residing in the nursing.home.. The average age of all elderly. women dis-charged from nursing homes in 1976 whs 82 years1tnd about 78 percent of all elderly diicharked womenwere widowed (fable U). gata on race or ethnicity,however, were not ,collected in the discharge surveyand thus will not be included,n further discussions.
In 1976, 640,900 elderly women were discharged(both alive and dead) from nursing homes. As in the.-
"resident sample, the use of nursing hwes by elderlywomen in 1976 (47 discharges per 1,000 population) .was greater than that by elderly men (36 dischargesper 1,000 population). However, the nursing homeutilization rate-for elderly women as measured by thedischarge survey (47 discharges per 1,000 population)was not as as that measured by . the resident -survey (60 residents per 1,000 population); the.
32
t4.)
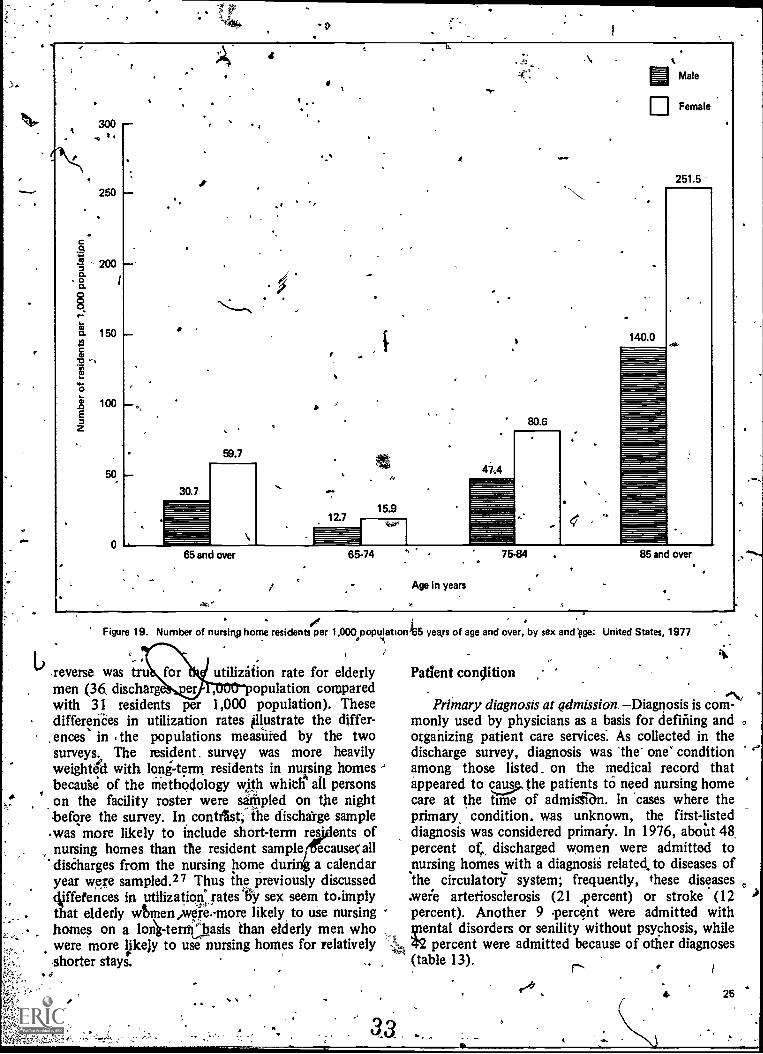
I
ts.
.\MMale
ElFemale
i
Co.
o.oo.
co"
o.
02
E
300
250
200
150
100
50
0
o
30.7
59.7
12.715.9
A
47.'4
80.6
140.0
251.5
gristr`
65 and over 65-74
Age in years
7584 85 and over
Figure 19. Number of nursing home residentsper 1,000 population
reverse was tru utilization rate for elderlymen (36, discharge opulation comparedwith 31 residents per 1,000 population). Thesedifferences in utilization rates illustrate the differ-ences in the populations measured by the twosurveys,.. The resident. survey was more heavilyweighted with long-term residents in nursing homesbecause of the methodology with which all personson the facility roster were sampled on the nightbefore the survey. In contrIst; the discharge sample.was more likely to include short-term res ents ofnursing homes than the resident sample ecausec alldischarges from the nursing home duri a calendaryear were sampled.27 Thus the previously discussedoUffetences in utilization:rates* sex seem to.implythat elderly wtmen,were,-more likely, to use nursinghomes on a lon)ktenfbasis than elderly men whowere more Ipceiy to use nursing homes for relativelyshorter stays.
4-
I
)65 yeArs of age and over, by sex and Vge; United States, 1977
Patient condition
Primary diagnosis at admission. Diagnosis is coni-'monly used by physicians as a basis for defining andorganizing patient care services: As collected in thedischarge survey, diagnosis was the one' conditionamong those listed. on the medical record thatappeared to cas.,..u, the patients to need nursing homecare at the time of admigen. In 'cases where theprimary, condition, was unknown, the first-listeddiagnosis was considered primaiy. In 1976, about 48,percent of, discharged women were admitted tonursing homes with a diagnosii related, to diseases ofthe circulatory system; frequently, these diseases.were arteriosclerosis (21 ,percent) or stroke (12percent). Another 9 percent were admitted with
ental disorders or senility without psychosis, whilepercent were admitted because of other diagnoses
(table 13).
25
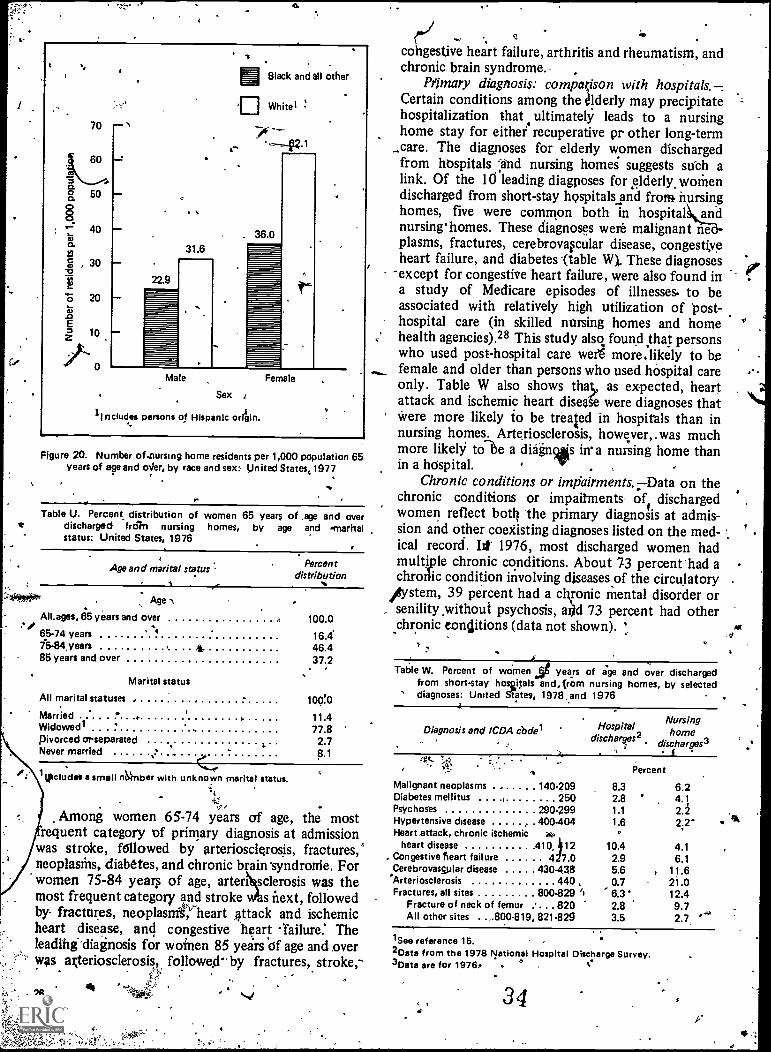
4
70
60
a 50
40o.
g , 30
"E. 20
10
0
31.6
22.9
MBlack and all other
in White'
. 36.0
Male Female
Sex
1 Includes persons of Hispanic orltin.
Figure 20. Number of.nursing home residents per 1,000 population 65years of age and oiler, by race and sex: United States,1977
Table U. Percent, distribution of women 65 years of .age and overrs discharged froln nursing homes, by age and 'marital
status: United States, 1976
Age and marital status Percentdistribution
. Age .%
All.ages, 85 years and over .. 100.0...OP ..
65-74 years ' 4 16.415-84 years 4 46.485 years and over 37.2
. .
Marital status
All marital statuses . 100..0
Married i. 11.4Widowed" .
.. 77.8pivorced or separated 2.7Never married . 8.1
kpciudsi a small ri4nber with unknown marital status.
Among women 65-74 years of age, the mostrequent category of primary diagnosis at admission
was stroke, f6llowed by arteriosclerosis, fractures,neoplasms, diabetes, and chronic brain syndrome. Forwomen 75-84 year of age, artertclerosis was themost frequent category and stroke s next, followedby. fractures, neoplasms, heart ,attack and ischemicheart disease, and congestive heart -failure. Theleading-diagnosis for wainen 85 years Of age and overwas gteriosclerosis, followed" by fractures, stroke,-
ilo
4
co gestive heart failure, arthritis and rheumatism, andcil...,
chronic brain syndrome. .
Nimary diagnosis: compgison with hospitals.-Certain conditions among the r #lderly may precipitatehospitalization that ultimately leads to a nursinghome stay for either recuperative pr other long-term
_care. The diagnoses for elderly women dischargedfrom hospitals :and nursing homes suggests such alink. Of the 10 leading diagnoses for elderly. womendischarged from short-stay hospitals and from nursinghomes, five were common both in hospital andnursinghomes. These diagnoses were malignant neplasms, fractures, cerebrovavular disease, congestiveheart failure, and diabetes -(table W). These diagnoses
-except for congestive heart failure, were also found ina study of Medicare episodes of illnesses. to beassociated with relatively high utilization of posthospital care (in skilled nursing homes and homehealth agencies).28 This study also found that personswho used post-hospital care weri more.likely to brfemale and older than persons who used hospital careonly. Table W also shows that, as expected, heartattack and ischemic heart disease were diagnoses thatWere more likely to be treated in hospitals than innursing homes. Arteriosclerosis, however, . was muchmore likely tole a diagnlis in a nursing home thanin a hospital. . ,
Chronic conditions or impairments. Data on thechronic conditions or impairments of dischargedwomen reflect boat. the primary diagnosis at admis-sion and other coexisting diagnoses listed on the med-ical record. lit 1976, most discharged women hadmultiple chronic conditions. About 73 percent had achroiic condition involving diseases of the circulatory
Aistem, 39 percent had a ckronic mental disorder or, senility without psychosis, ai)d 73 percent had other
chronic conditions (data not shown). :
Table W. Percent of woMen d years of age and over dischargedfrom short-stay hosaitals and. from nursing homes, by selected
' diagnoses: United Slates, 1978 ,.and 1976
Diagnosis and ICDA code" Hospital Nursing
discharges2home
discharges3t4".
4: Percent
Malignant neoplasms 140.209 8.3 6.2Diabetes mellitus I 250 2.8 ' 4.1Psychoses 290.299 1.1 2.2Hypertensive disease , . 400-404 1.6 2;2'Heart attack, chronic ischemic lio.
heart disease 41912 10.4 4.1. Congestive hean failure 4 7.0 2.9 6.1
Cerebrovassplar disease 430.438 5.6 , 11.6Arteriosclerosis 440 , 0.7 21.0Fractures, all sites 800-829 ''i 6.3' 12.4
Fracture of neck of femur ... . . 820 2.8 9.7All other sites . . -800-819, 821.829 3.5 2.7 .4'
'See reference 15.2Data from the 1978 National Hospital Discharge Survey.3Data are for 1976, .
34
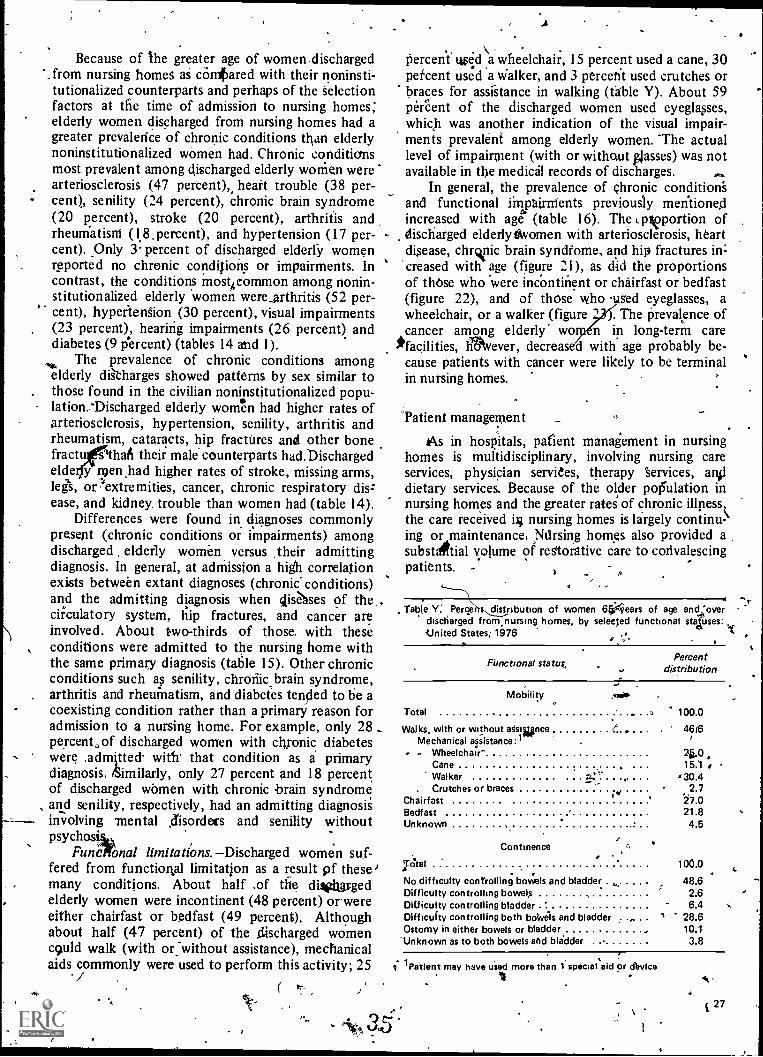
Because of the greater age of women.discharged'. from nursing homes as cOnkared with their noninsti-
tutionalized counterparts and perhaps of the Selectionfactors at the time of admission to nursing homes;elderly women discharged from nursing homes had agreater prevalence of chronic conditions than elderlynoninstitutionalized women had. Chronic conditionsmost prevalent among discharged elderly women werearteriosclerosis (47 percent),, heart trouble (38 per-cent), senility (24 percent), chronic brain syndrome(20 percent), stroke (20 percent), arthritis andrheumatisni ( l8,percent), and hypertension (17 per-cent). Only 3' percent of discharged elderly womenreported no chronic conditions or impairments. Incontrast, the conditions most4common among nonin-stitutionalized elderly women were .srthritis (52 per-
,cent), hypertension (30 percent), visual impairments(23 percent), hearing impairments (26 percent) anddiabetes (9 percent) (tables 14 and 1).
The prevalence of chronic conditions amongNo,
elderly dikharges showed patterns by sex similar to. those found in the civilian noninstitutionalized popu-
lation.Tischarged elderly women had higher rates ofarteriosclerosis, hypertension, senility, arthritis andrheumatism, cataracts, hip fractures and other bonefractu 0thaft their male counterparts had.Dischargedelde y men .had higher rates of stroke, missing arms,lees, or `extremities, cancer, chronic respiratory diszease, and kidney, trouble than women had (table 14).
Differences were found in diagnoses commonlypresent (chronic conditions or impairments) amongdischarged elderly women versus their admittingdiagnosis. In general, at adMission a high correlationexists between extant diagnoses (chronic- conditions)and the admitting diagnosis when Elise' ses of the,circulatory system, hip fractures, and cancer areinvolved. About two-thirds of those. with theseconditions were admitted to the nursing home withthe same primary diagnosis (table 15). Other chronicconditions such as senility, chronic brain syndrome,
. arthritis and rheumatism, and diabetes tended to be acoexisting condition rather than a primary reason foradmission, to a nursing home. For example, only 28percent,of discharged women with chronic diabeteswere ,admitted with' that condition as a primarydiagnosis. /Similarly, only 27 percent and 18 percentof discharged women with chronic brain syndrome
, and senility, respectively, had an admitting diagnosis- involving mental disorders and senility without
psychosiikFunc ono limitations. Discharged women suf-
fered from functioRal limitation as a result pf thesemany conditions. About half of the divtargedelderly women were incontinent (48 percent) orwereeither chairfast or bedfast (49 percent). Althoughabout half (47 percent) of the _discharged womenc9uld walk (with or: without assistance), mechanicalaids commonly were used to perform this activity; 25/
OA.
I
Percent w aused wheelchair, 15 percent used a cane, 30pefcent used a Walker, and 3 percerit used crutches orbraces for assistance in walking (table Y). About 59percent of the discharged women used eyeglasses,which was another indication of the visual impair-ments prevalent among elderly women. The actuallevel of impairment (with or without glasses) was notavailable in the medical records of discharges.
In general, the prevalence of chronic condition'sand functional impairments previously mentionedincreased with age (table 16). The Lpvportion ofdischarged elderlytAvomen with arteriosclerosis, heartdisease, chronic brain syndfome, and hip fractures in:creased with age (figure 21), as did the proportionsof thOse who were incontinent or chairfast or bedfast(figure 22), and of those who used eyeglasses, awheelchair, or a walker (figure 1 . The Prevalence ofcancer among elderly' wo n in long-term care
*facilities, liNever, decreas d with age probably be-cause patients with cancer were likely to be terminalin nursing homes.
Am.
'Patient management
As in hospitals, patient management in nursinghomes is multidisciplinary, involving nursing careservices, physician services, therapy Services, moddietary services. Because of the older po13u1ation innursing homes and the greater rates of chronic illnessthe care received nursing homes is largely continu-ing or maintenance, Nursing homes also provided asubstaikial volume of restorative care to convalescingpatients. -
Table Y. Perce distribution of women 65Aears of age and 'overdischarged from,nursing homes, by selected functional stauses:-United States; 1976 -4% ,
Functional status,Percent
distribution
Mobility
Total
Walks, with or without atsiwnceMechanical assistance:1- Wheelchair
CaneWalker
. Crutches or bracesChairfastBedfast .Unknown
Continence
7thai.
No difficulty controlling boWels and bladder .Difficulty controlling bowelsDifficulty controlling bladder 'Difficulty controlling both boWels and bladderOstomy in either bowels or bladder
"Unknown as to both bowels and blidder
/' .
.
41
.
,
r
1
' 100.0
46i6I
4.0 ,15.1 s30.4
2.727.021.84.5
100.0
48.62.66.4
28.610.13.8
9" 1 Patient may have uied more than 1 special aid or dbvice
, \
A
27
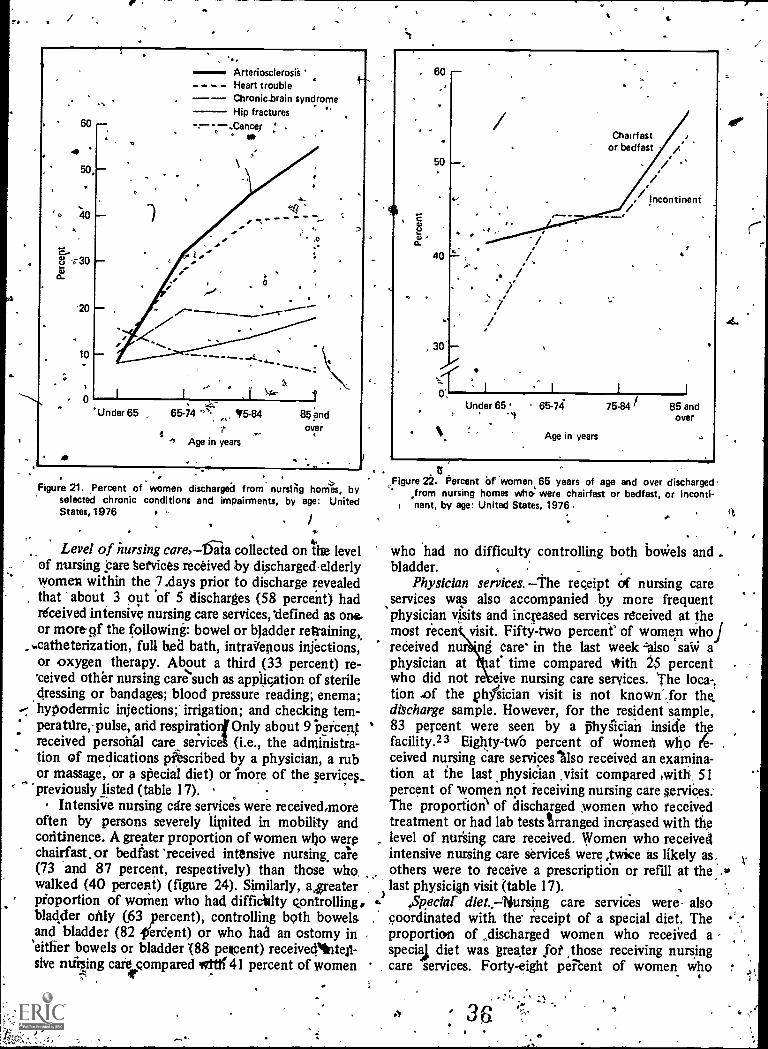
r
,ArteriosclerosisHeart troubleChronic.brain syndrome.= Hip fractures
- --Cancer .
Under 65 . 65-74 "'. 15-84
# Age in years
85 andover
Figure 21. ,Percent of women discharged from nursing homes, byselected chronic conditions and impairments, by age: UnitedStates, 1976
I.
Level of nursing care.-15-ala collected on tire levelof nursing pare §etvices received by dischargedelderlywomen within the 7.days prior to discharge revealedthat about 3 out of 5 discharges (58 percent) hadreceived intensive nursing care services, defined as one.or more-pf the following: bowel or bladder retraining,
,..catheterization, full bed bath, intra 'fenous injections,or oxygen therapy. About a third (33 percent) re-ceived other nursing care such as application of steriledressing or bandages; blood pressure reading; enema;hypodermic injections;' irrigation; and checking tem-
. peratdre,- pulse, and respiratio4 Only about 9 beicentreceived personal care service (i.e., the administra-tion of medications phscribed by a physician, a rubor massage, or a special diet) or more of the services_
'previously listed (table 17).Intensive nursing cdre services were received,more
often by persons severely hunted in mobility andcontinence. A greater proportion of women who werechairfast. or bedfast 'received intensive nursing, cafe(73 and 87 percent, respectively) than those whowalked (40 percent) (figure 24). Similarly, a4reaterpfoportion of women who had difficulty Q.ontrolling,bladder only (63 percent), controlling both bowelsand bladder (82 trerdent) or who hack an ostomy in'either bowels or bladder '(88 pekcent) receivedlriter-sive noising cafe compared we 41 percent of women
4
Figure 22. Percent of women 65 years of age and over discharged,from nursing homes who.' were chairfast or bedfast, or inconti-
anent, by age: United States, 1976
who had no difficulty controlling both boWels and -bladder.
Physician services. -the receipt of nursing careservices was also accompanied by more frequentphysician visits and increased services received at themost recen visit. Fifty-two percent' of women who./received nur ni care' in the last week also saw aphysician at at time compared lfith 25 percent .who did not re ive nursing care services. The loca-,tion .of the physician visit is not known ,for the,discharge sample. However, for the resident sample,83 percent were seen by a flyiician inside thefacility.23 Eighty-N(0 percent of women who fe- .
ceived nursing care services %lso received an examina-tion at the last .physician ,visit compared mitft, 51percent of women not receiving nursing care services:The proportion of discharged women who receivedtreatment or had lab tests arranged increased with thelevel of nursing care received. Women who receivedintensive nursing care service§ were ,twice as likely as.,others were to receive a prescription or refill at the A,
rt
last physician visit (table 17)..Speciar diet.,-Nursing care services were- also
. coordinated with the' receipt of a special diet. Theproportion of discharged women who received aspeciaj diet was realer Jot those receiving nursingcare services. Forty-eight percent of women who
36
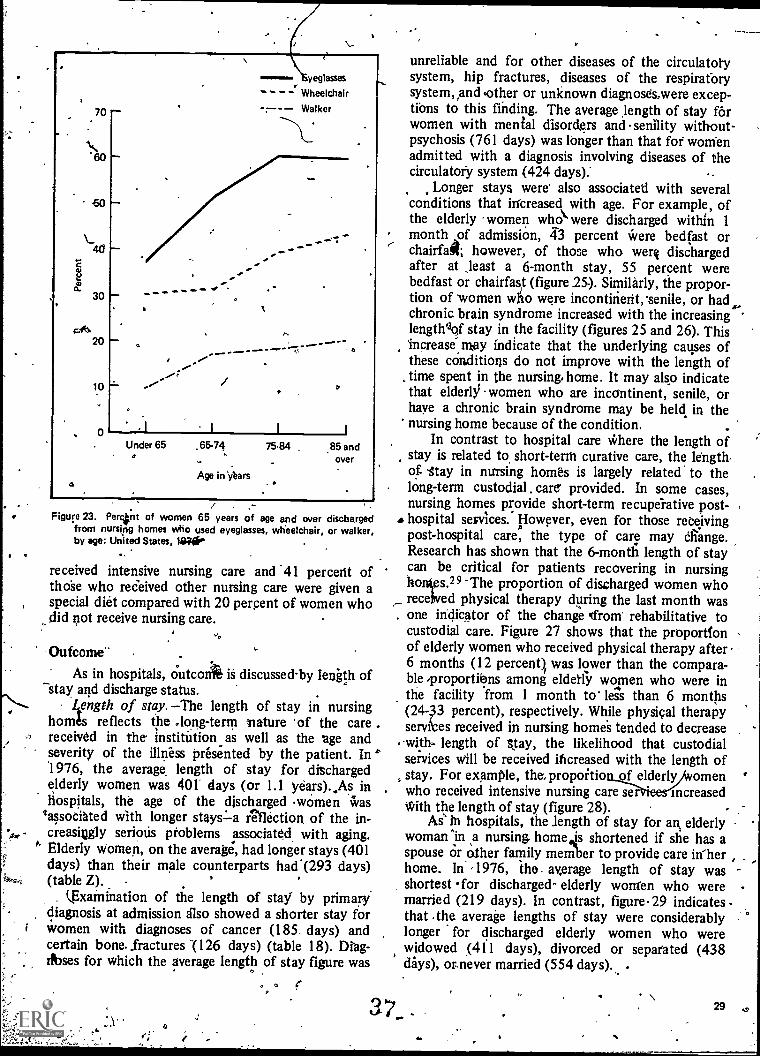
Cl.
O
70
'60
60
ao
30
20
10
0
yeglasses
Wheelchair
Walker
I
Under 650
1
.65.74
Age in 'Oars
1
75.84 .85 andover
Figure 23. Perctnt of women 65 years of age and over dischargedfrom nursing homes who used eyeglasses, wheelchair, or walker,by age: United States, 123O'
received intensive nursing care and '41 percerit ofthOse who received other nursing care were given aspecial diet compared with 20 percent of women whodid not receive nursing care.
-Outcome'.
As in hospitals, outcox is discussed-by length ofstay and discharge status.
-"` Length of stay. The length of stay in nursinghomes reflects the long-term mature of the carereceived in the institution as well as the age andseverity of the illness presented by the patient. In °1976, the average, length of stay for dischargedelderly women was 401' days (or 1.1 years).,As inHospitals, the age of the discharged women was
lassociated with longer staysLa reflection, of the in-creasingly serious problems associated with aging,
" Elderly women, on the average, had longer stays (401days) than their male counterparts had.(293 days)(table Z).
LExainination of the length of stay by primarydiagnosis at admission also showed a shorter stay forwomen with diagnoses of cancer (185, days) andcertain bone. fractures (126 days) (table 18). Drag-rbses for Which the average length of stay figure was
<
unreliable and for other diseases of the circulatorysystem, hip fractures, diseases of the respiratbrysystem, and (other or unknown diagnoses,were excep-tions to this finding. The average length of stay f6rwomen with menial disorders and senility without-psychosis (761 days) was longer than that for womenadmitted with a diagnosis involving diseases of thecirculator:), system (424 days)
Longer stays were' also associated with severalconditions that increased with age. For example, ofthe elderly women who were discharged within 1month of admission, 43 percent Were bedfast orchairfait however, of those who weri dischargedafter at ,least a 6-month stay, 55 percent werebedfast or chairfast (figure 25-). Similarly, the propor-tion of women who were incontinent, senile, or had.,chronic brain syndrome increased with the increasinglengthIof stay in the facility (figures 25 and 26). ThisIncrease,rikay indicate that the underlying causes ofthese conditions do not improve with the length oftime spent in the nursing. home. It may also indicatethat elderly women who are incontinent, senile, orhaye a chronic brain syndrome may be held in thenursing home because of the condition.
In contrast to hospital care Where the length ofstay is related to short-term curative care, the length.of -stay in nursing homes is largely related to thelong-term custodial. care provided. In some cases,nursing homes provide short-term recuperative post-hospital services. However, even for those receivingpost-hospital care, the type of care may eliange.Research has shown that the 6-month length of staycan be critical for patients recovering in nursingho s.29 The proportion of discharged women whoreceived physical therapy during the last month wasone iriciicator of the change gifron rehabilitative tocustodial care. Figure 27 shows that the proportionof elderly women who received physical therapy after6 months (12 percent was lower than the compara-ble proportions among eldetly women who were inthe facility from 1 month to less than 6 months(24-33 percent), respectively. While physical therapyse es received in nursing homes tended to decrease-with, length of Stay, the likelihood that custodialservices will be received increased with the length ofstay. For example, the, propoitio of elderly omenwho received intensive nursing care ser increasedwith the length of stay (figure 28). -
Ae in hospitals, the length of stay for an elderlywoman in a nursing, home is shortened if she has a
,
spouse or other family member to provide care in ,home. In ,1976, the. average length of stay wasshortest for discharged- elderly women who were -married (219 days). In contrast, figure. 29 indicates -
that .the average lengths of stay were considerablylonger for discharged elderly women who werewidowed (411 days), divorced or separated (438days), or never married (554 days).
3 7_ . 29
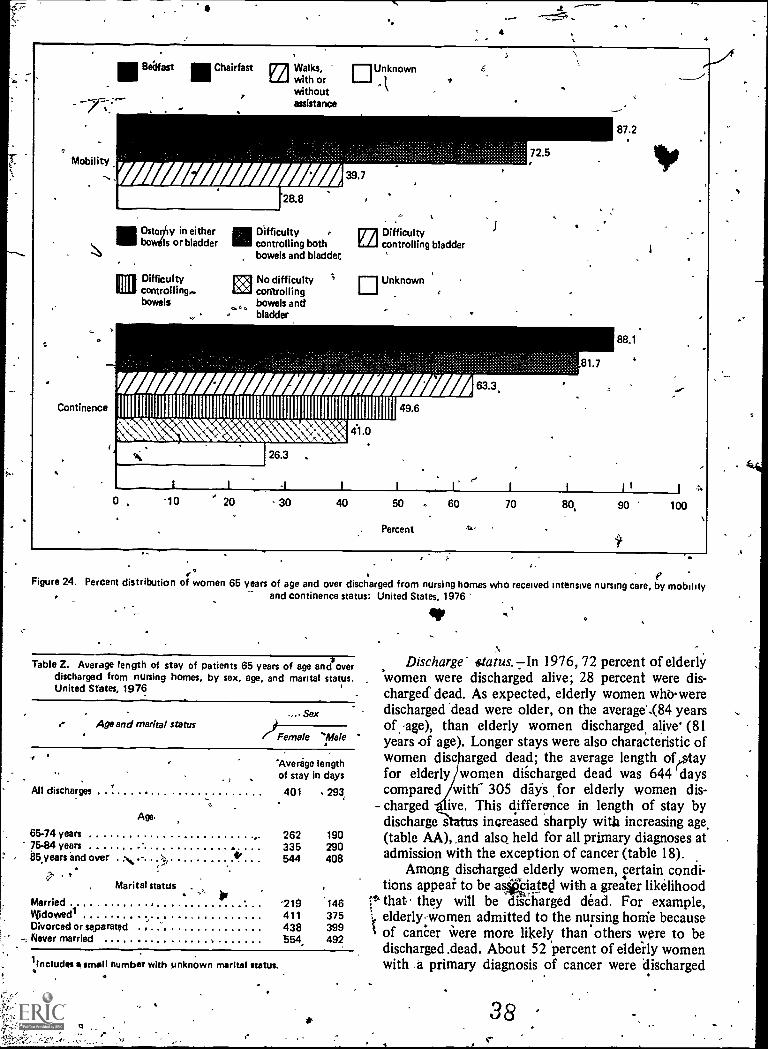
4
III Belfast Chairfast pr'A Walks,LLJ with or
withoutassistance
OUnknown
Continence
11.1 Ostuulty in either1.1 bowils or bladder
Difficultycontrolling..bowels
11111 Difficulty ETA Difficulty111 controlling both L./-1 controlling bladder
bowels and bladder.
renkokgi
No difficultycontrollingbowels andbladder
ElUnknown
/AZ/ Ill Afifimumiummitiommirimmummillim
Natc
0 -10 20
26.3 ,
30
41.0
49.6
I I
40 50
Percent
81.7
63.3,
87.2
88.1
ip
I I j 44
60 70 80, 90 100
°Figure 24. Percent distribution of
0women 65 years of age and over discharged from nursing homes who received intensive nursing care, by mobility
and continence status: United States, 1976
41P
Table Z. Average length of stay of patients 65 years of age and *over Discharge' ,status. In 1976,72 percent of elderlydischarged from nursing homes, by sex, age, and marital status. women were discharged alive; 28 percent were dis-United States, 1976 charged dead. As expected, elderly women who.were
SexAge and marital status )Female Vale
'Average
All discharges
Age,
lengthof stay in days
401 293
65-74 years 262 19075-84 years 335 29085,years end over
Nh. y"?, * 544 408
Marital status
Married '219 146Widowedl 411 375Divorced or separated 438 399Never married $54, 492
1includis smell number with unknown marital status.
discharged 'dead were older, on the average",(84 yearsof age), than elderly women discharged, alive' (81years of age). Longer stays were also characteristic ofwomen disc arged dead; the average length ofesetayfor elderly women discharged dead was 644 dayscompared with- 305 dayS for elderly women dis-
- charged we. This difference in length of stay bydischarge s increased sharply with increasing age,(table AA), ,and also held for all primary diagnoses atadmission with the exception of cancer (table 18).
Among discharged elderly women, certain condi-tions appeal to be a*ciatecl with a greater likelihood
it" that. they will be disCharged dead. For example,elderly women admitted to the nursing honie because
I of cancer Were more likely than others were to bedischarged .dead. About 52 percent of eldeily womenwith a primary diagnosis of cancer were discharged
38
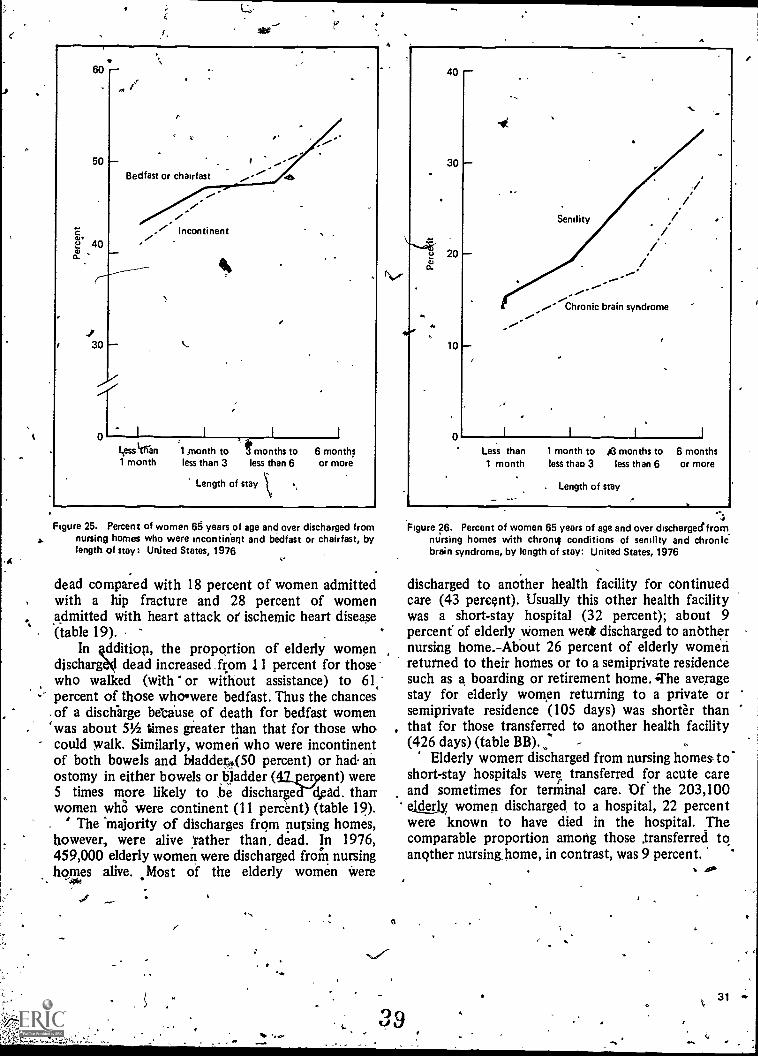
.
Jr
60
50
cu.40
30
Bedfast or chairfast
L.ess Itran1 month
rIncontinent
1 month to t months to 6 monthsless than 3 less than 6 or more
Length of stay
Figure 25. Percent of women 65 years of age and over discharged fromnursing homes who were incontinent and bedfast or chairfast, bylength of stay:. United States, 1976
dead compared with 18 percent of women admittedwith a hip fracture and 28 percent of womenadmitted with heart attack oil ischemic heart disease(table 19).
In 4ddition, the proportion of elderly womendischarga4 dead increased . from 11 percent for thosewho walked (with or without assistance) to 61,percent of those whowere bedfast. Thus the chances
. of a discharge because of death for bedfast womenwas about 51/2 times greater than that for those who-could walk. Similarly, women who were incontinentof both bowels and bladderA(50 percent) or had anostomy in either bowels or bladder (412ergent) were5 times more likely to he discharge dead. thanwomen whO were continent (11 percent) (table 19).
- ' The 'majority of discharges from pursing homes,however, were alive rather than, dead. In 1976,459,000 elderly women were discharged from nursinghomes alive. .Most of the elderly women were
-
z
4
40
30
10
0
Senility
Chronic brain syndrome
I I I
Less than1 month
1 month toless thao 3
le months toless than 6
. Length of stay
6 monthsor more
Figure 26. Percent of women 65 years of age and over discharged.fromnursing homes with chrontf conditions of senility and chronicbrain syndrome, by length of stay: United States, 1976
discharged to another health facility for continuedcare (43 percent). Usually this other health facilitywas a short-stay hospital (32 percent); about 9percent' of elderly women werit discharged to anbthernursing home.-About 26 percent of elderly womenreturned to their homes or to a semiprivate residencesuch as a boarding or retirement home. The averagestay for elderly women returning to a private orsemiprivate residence (105 days) was shorter thanthat for those transferred to another health facility(426 days) (table BB).
Elderly women- discharged from nursing homes -toshort-stay hospitals were, transferred for acute careand sometimes for terminal care. Of the 203,100ekterly women discharged, to a hospital, 22 percentwere known to have died in the hospital. Thecomparable proportion among those transferred toanother nursing home, in contrast, was 9 percent.
410
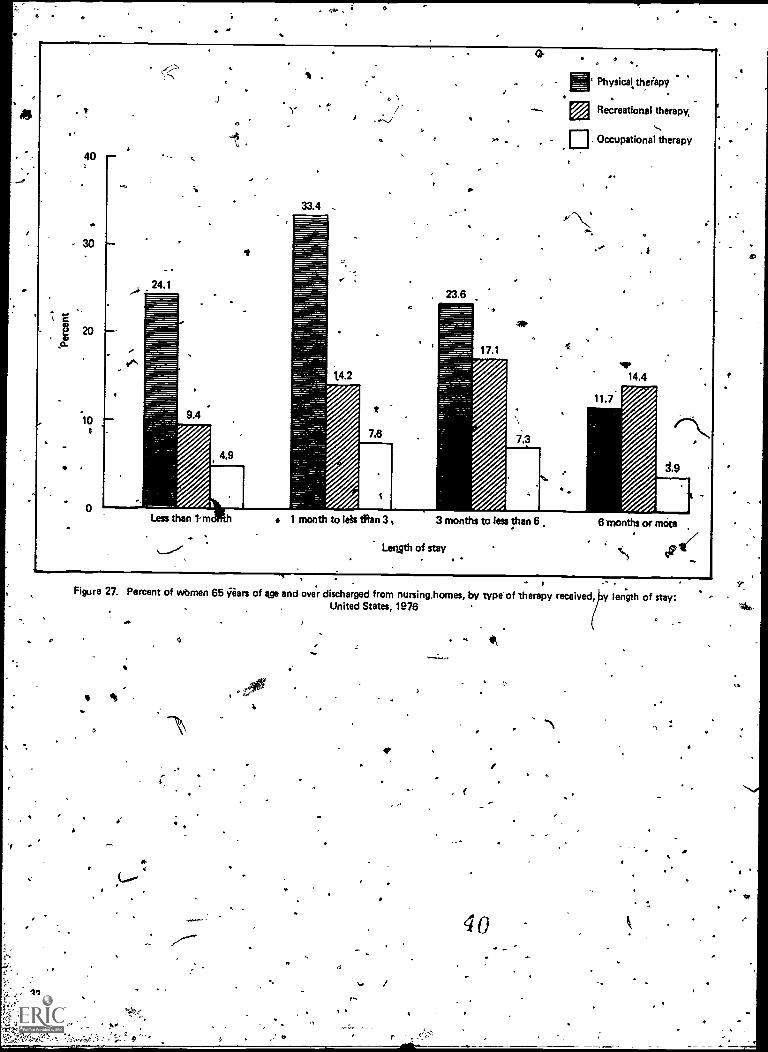
o
40
'10
J
c
33.4
7.
E. Physicaltbeiapy
Recreational therapy
Occupational therapy
1 month to leis Sian 3 , 3 months to less than 6
Length of stay
6 months or mote
- )Figure 27. Percent of wbmen 65 gears of age and over discharged from nursing,homes, by type of therapy received, y length of stay:
United States, 1976
I
32
-\
40
as
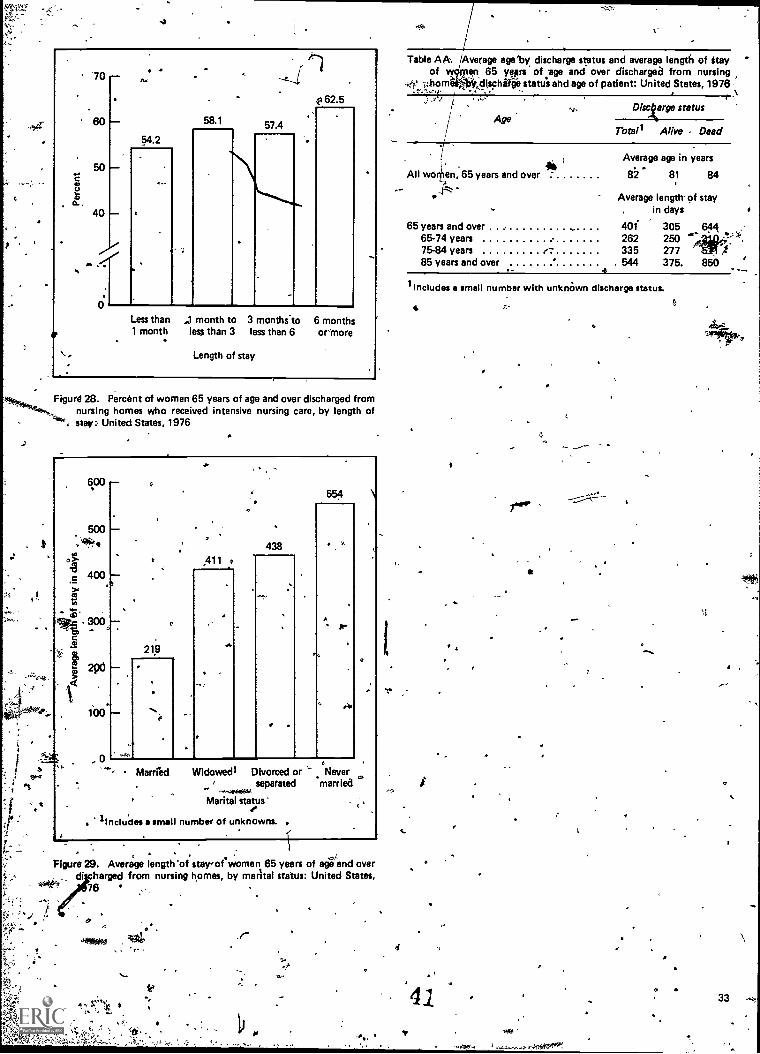
a.
70
60
50
40
,
0
.64.2
58.1 57.4
4162.5
Less than1 month
month to 3 months.to 6 monthsless than 3 less than 6 ormore
Length of stay
Figur@ 28. Percent of women 65 years of age and over discharged fromnursing homes who received intensive nursing care, by length of
. stay: United States, 1976
-
6°°
e
400
0
All438
554 \
5219
let
0
Married Widowed' Divorced or Neverseparated married
Marital status'4.
lIncludes a small number of unknowns.
Figure 29. Average length 'of stay-;of women 65 years of age and overdischarged from nursing homes, by marital status: United States,
76
,r
Table AA. Average age'by, discharge status and average length of Stayof w titan 65 yesrs of ;age and over discharged from nursing
4` horn r idischlifee status and age of patient: United States, 1976I-1
Discarge statusAge
Total' Alive Dead
All women, 65 years and over
Average age in years
82 81 84
Average length- of stayin days
65 years and over .. 401 305 64465-74 years 262 250 14F--:*,75-84 years r 335 277
f85 years and over , 544 375. 850 1,- .6 - .....,
lIncludes a smell number with unknOwn discharge status.
4
'41
4 .
33
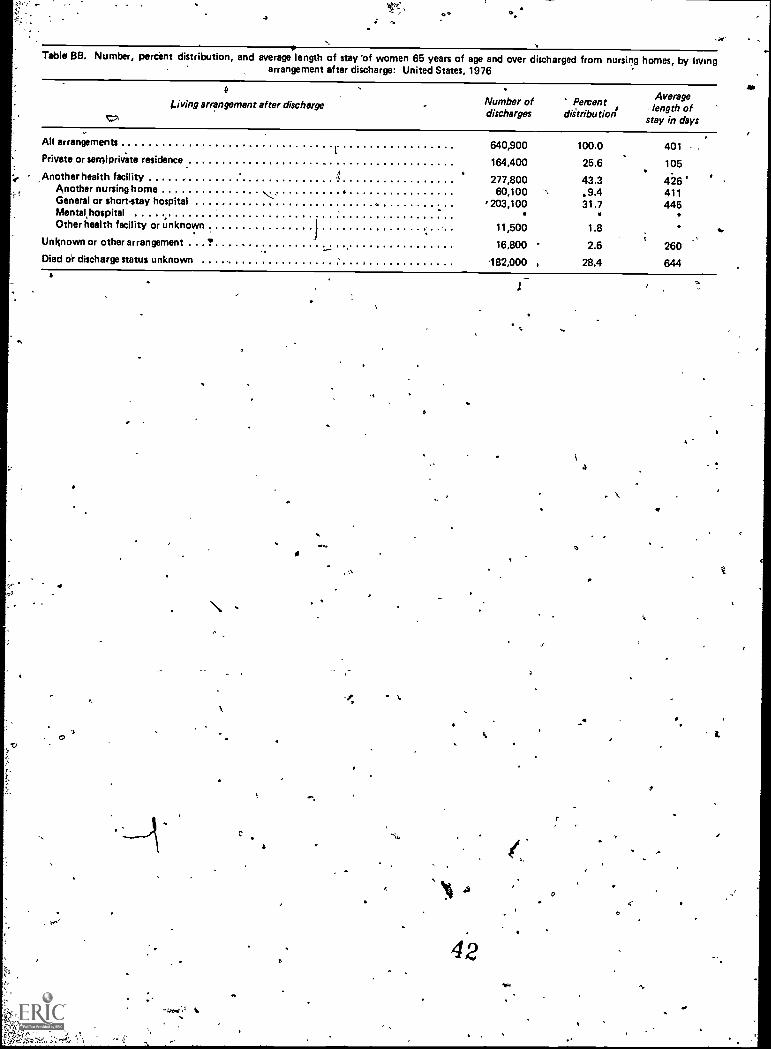
Table 68. Number, percent distribution, and average length of stay 'of women 65 years of age and over discharged from nursing homes, by livingarrangement after discharge: United States, 1976
diving arrangement after dischargeV?,
Number of Percentdischarges diltributioni
Averagelength of
stay in days
-4.
*
All arrangements
Private or sernipriva' te residence
Another health facilityAnother nursing h omeGeneral or short-stay hospitalMental hospitalOther health facility or unknown
Unknown or other arrangement
Died or discharge status unknown
''',.
i
t.
.
640,900
164,400
277,80060,100
, 203,100.11,500
16,800
182,000
100.0
25.6
43.3.9.431.7
1.8
2.6
28.4
401 ,
105
116411445
260
644
0
a
a
.4
a
0
a
1.
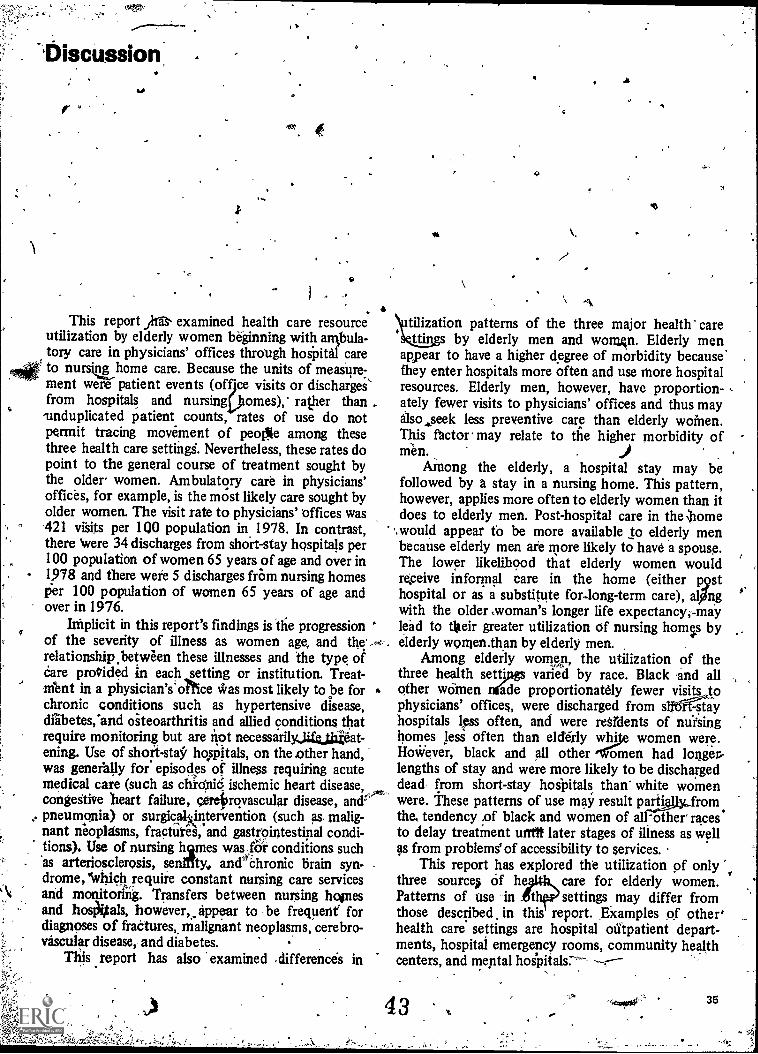
%Discussion
r
9
This report _XS% examined health care resourceutilization by elderly women beginning with ambula-tory care in physicians' offices through hospital careto nurkg home care. Because the units of measorer.ment weiZ- patient events (off ce visits or dischargesfrom hospitals and nursing omes),- rather than-unduplicated patient counts, rates of use do notpermit tracing movement of peollie among thesethree health care settingg. Nevertheless, these rates dopoint to the general course of treatment sought bythe older women. Ambulatory care in physicians'offices, for example, is the most likely care sought byolder women. The visit rate to physicians' offices was'421 visits per 100 population in 1978. In contrast,there were 34 discharges from short-stay hospitals per100 population of women 65 years of age and over in1978 and there were 5 discharges &Om nursing homesper 100 population of women 65 years of age andover in 1976.
Iniplicit in this report's findings is the progression 'of the severity of illness as women age, and the...-relationship ,between these illnesses and the type ofCare provided in each setting or institution. Treat-dent in a physician's'Ortice was most likely to be forchronic conditions such as hypertensive disease,diabetes;and oiteoarthritis and allied conditions thatrequire monitoring but are not necessarily_lifrjadat-ening. Use of short -stay hospitals, on the other hand,was genefally for episodes of illness requiring acutemedical care (such as chidni6 ischemic heart disease,,o,congestive heart failure, cerefrovascular disease, and,-'
, pneumonia) or surgicayntervention (such as, malig-nant neopldsms, fractures, and gastrointestinal condi-tions). Use of nursing hqmes was for conditions such'as arteriosclerosis, senility anechronic brain syn-drome, 'which require constant nursing care servicesand monitoring. Transfers between nursing honesand hosktals, however,_ appear to be frequent' fordiagnoses of &adores,. malignant neoplasms, cerebro-vascular disease, and diabetes.
This report has also examined .differences in
9
tilization patterns of the three major health' careif gs by elderly men and wonAn. Elderly men
appear to have a higher degree of morbidity because'they enter hospitals more often and use More hospitalresources. Elderly men, however, have proportion-ately fewer visits to physicians' offices and thus may
so..seek less preventive care than elderly women.This factor may relate to the higher morbidity ofmen. . )
AMong the elderly, a hospital stay may befollowed by a stay in a nursing home. This pattern,however, applies more often to elderly women than itdoes to elderly men. Post-hospital care in the )home
'.would appear to be more available to elderly menbecause elderly men are more likely to have a spouse.The lower likelihood that elderly women wouldre,ceive informal care in the home (either p9sthospital or as a substitute for-long-term care), alngwith the older woman's longer life expectancyi-maylead to their greater utilization of nursing homp byelderly women .than by elderly men.
Among elderly women, the utilization of thethree health settOss varied by race. Black 'and allother women ilade proportionately fewer visits tophysicians' offices, were discharged from s'#"Itayhospitals less often, and were residents of nuitsinghomes Iess often than elderly white women were.floliiever, black and all other 4omen had longec-lengths of stay and were more likely to be dischargeddead from short-stay hoipitals, than' white womenwere. These patterns of use may result part_Lfrom,the, tendency .of black and women of anither racesto delay treatment weft later stages of illness as wellas from problems' of accessibility to services.
This report has explored the utilization of onlythree sources Of he care for elderly women..89,1
Patterns of use -in t settings may differ fromthose described in this report. EXamples of other'health care settings are hospital otitpatient depart-ments, hospital emergency rooms, community healthcenters, and mental hoipitals: ----r----
43 36
$-
O
/.
'U.S." Bureau of the Census Social agd economic character-istics of the 'tilde; population: 1978. Current PopulationReports, Series P-23, Na. 85. Washington. U.S. ,GovernmentPrinting Office, Aug. 1979,
2Rice, D.: Long life to you. Amer. , De mo,gr., Vol. 1, No. 9,1'979.
3SoCial Security, Administration: Inco and resources of theaged. SSA Pub. No. 13-11727. Washing on. U.S. GovernmentPrinting Office, Jan. 1980.
,e
4Natisinal 'Center for Heal 'Statistics:tCharacteristics of per-sons with hypertedinon: lited States; 1974, by A. Moss andG. Scott. Vital Health Statistics, Series 10-No. 121. DREWPub. No. (PHS) 79-1549.- Public Health Service. Washington,U.S. Government Printing pffice,,Dec. 1978.
National Institutes sit:Health: Diabetei DHEW Pub. No.(NIH) 78-1468. Public'Health Service. iVashVnton. U.S. Gov-ernment Printing Office, 1978.
6National Center for Health Statistics: Prevalence of selectedchronic respiratory conditions: Unites( States; _1970, by C.Wilder. Vital ankHealth Statistics, Series 10.No. 84. DREWPub. No. (HRA) 74.1511. Health Resciurces Administration.Wishington. U.S. Government Printing Office, Sept. 1973.National Center for Health Statistics:Prevalence of chroniccirculatory conditions: United . States,. 1972, by C. Wilder.Vital and Health Statistics; Series 10-No. 94. DHEW Pub. No.(HRA) 75-11521i Health Resources Administration. Washing-ton. U.S: Government Printing Office, Sept.1 974'
f
8National Center for Health ltskistics: -Prevalence of chronicconditions of thprogenitourinary, nervous,oendocrine, metbolic, and blood and blood - forming systems and of othselected chronic conditions: United Stales, 1973, by G. Scott.Vital and Health Statistics, Serfes 10-No:109. DREW Pub. No.(HRA) 771536. Health Resources Administration.- Washing-
. ton. U.S. Government Printing Office, Mar. 1977.
ONational Center for Health Statistics: Prevalence of selectedchronic digestive conditiops: United States, 1975, by T. Druryand L. Howie. Vital and Health Statistics, Series 10-No. 123-.DHEW Pus. No. (PHS) 704588. Public Health Service. Wath-ington. U.S. Government Printing Office, July 1979.
IONatiOnal Center for Health Statistics: Prevalence of chronicskin and musculoskeletal conditions:* United States, 1976, byG. Bonham. Vital
141andHealth Statistics, Series 10-No. 124.
DHEitptib.14&.S) ,79-1552.. Public Health. Service:Wash-ington.V.S. Government Printing Office, Nov. 1978.
11National Center for Health Statistics: Prevalence of selected
L
1
iippairinents: United States, 1977, by B. Feller;,,,ital andHealth Statistics, Series 10-No. 134. DHHS Pub. "No. (PHS)81-1562. Public Health Service. Washington. U.S. GovernmentPrinting Office, Feb. 1981.
12Natiunal Institutes of Health: Cancer Incidence and Mortal-ity in the United. Stptes, 1973-76. DHEW Pub. No. (NIH)78-1837.
13Moore E.C.: Wornen and health: United States, 1980. PublicHealth Rep., iuppl. to September-October 1980. pp..10.81.
14National Center for Health Statistics: Acute conditions, inci-dence and asiociated'disability: United States, July.1972-June1978, by P. Ries. Vital'and Health Statistics, Series 10-No.132; DREW Pub. No. (PHS) 79-1560. Public Health Service.Washington. U.S. Government Printing Office, Sept..1s979.
151Iational Center for Health Statistics: Eighth RevisionInternational Classification of Diseases, Adapted for Use in theUnited, States. PHS Pub. No. 1693. Public Health Service,Washington. U.S. Government Printing Office, 1967.
16National Center -for Health Statistict: Office visitswomen, by B. Cypress. Vital and Health Statistics,. Series13-No. 45. DREW Pub. No. (PHS) 80-1796. Public HealthService. Washington. U.S. Government Printing Office, Mar.1980. r12National Center for Health Statistics: Utilization otort-stay hospitals, -annual summary for the United, States, 1978,by B. liatipt-A Vital and Health Statistics, Series 13-No. 46.
-DHEW Pub. No. (PHS) 80-1797: Public Health Service. Wash-ington. U.S. Government Printing Office, Mar. 1989.
18National Center for Health Statistics: The National NursingHome Survey: 1977 summary for the United States, by J. VanNostrand, A. Zappolo, E. Hing, B. Bloom, B. Hirsch, and DFoley. Vital and Health Statistics, Series 13-No. 43. DPub, No. (PHS)- 79-1794. Public Health Service. Washington.U.S.,overnment Printing Office, July 1979.
19Nationl Center for Health Statistics: Physician visits: Vol:ume and interval since last visit: United States, 1975, by A.Gentile. Vital and Health Statistics, Series 4 0-No. 128. DHEWPub. No.. (PHS) 79-1556. Public Health Service,. Washington.U.S. Government Printing Office, Ap.r. 1979.
20National Center for Health Statistics: Use of selected medi-cal procedures associated with preventive care: United States,1973, by A. J. Moss and M. H. Wilder. Vital and Health Statis-tics, Se'ries 10-No. 110. DHEW Pub. 'No. (HRA) 77-1538.Health :Resources Administration. Washington. U.S. Govern-.men114inting Office, Mar. 1977.
Ob
2IGonella, J. S., Louis, D. Z., and McCord, J. J.: The stagingconcept, an appreiatn the assessment of outcome of ambula-rtory care. Medical Care. 14:13-21, 1976.
22Office of Health Resources Opportunity: Health status ofminorities and" low - income groups, by M. H. Rudov and N.Santangelo. DHEW Pub. No. (HRA)79-627. Health ResourcesAdministrationgtim. U.S. Governmetnt Printing Office,'1979.
23National Center for Health Statistics: Characteristics ofnursing home residents, health status and care received,National Nursing Home Survey, May-December 1977, by E.Hing. Vital and Health Statistict, Series 13-No. 51. DHHS Pub.No. (PHS) 81-171-2. Public Health Service. Washington. U.S.Government Printing Office; Apr., 1981.24 National Center for Health Statistics: Final mortality sta-tistics, 1978. Monthly Viuit Statistics Report. Vol. 29; No. 6,Suppl. (2). DHHS Pub. No. (PHS) 80-1120. Public HealthService. Hyattsville, Md. Sept. 17,,1980.
25Specfal Committee on Aging, United States Senate, 1972. 4
\
4
`Trends in Long-Term Care (Part 2 Nosteces of Minority Groupsto Nursing Homes). Washington. U.S. ovemment PrintingOffice. Aug. 10, 1972. pp. 2458-2475.
26Scanlon, W., Difederisco, E., and Stassen, .. Long-termcare: Current experience and a framework for analysis. TheUrbadInstitute. Washington. 1979. pp. 26-33.
27National Center for Health Statistics: A comparison of nurs-ing home residents and discharges from the 1977 NationalNursing Home Survey: United States, by E. Hing and A.Zappolo. Advance Data from Vital ark,Health Statutzcs, No.29, DHEW Pub. No. (PHS) 78-1250. Public Health Service.Hyattsville, Md. May 17, 1978.
28Young, K. and Fisher, C.: Medicare episodes of illness: Alstudy of hospital, skilled nursing facility, and home healthagency care. Health Care Fin. Rev. Fall 1980. pp. 1-23.
29Katz,.S., Heiple, K. G., Downs, T., Ford, A. B. and Scott, 3C. P.: Long term course of 147 patients with fracture of thehip. Surgery, Gynecology and Obstetrics. Vol. 124, pp.1219-1230, June 1967.
40
ry
37
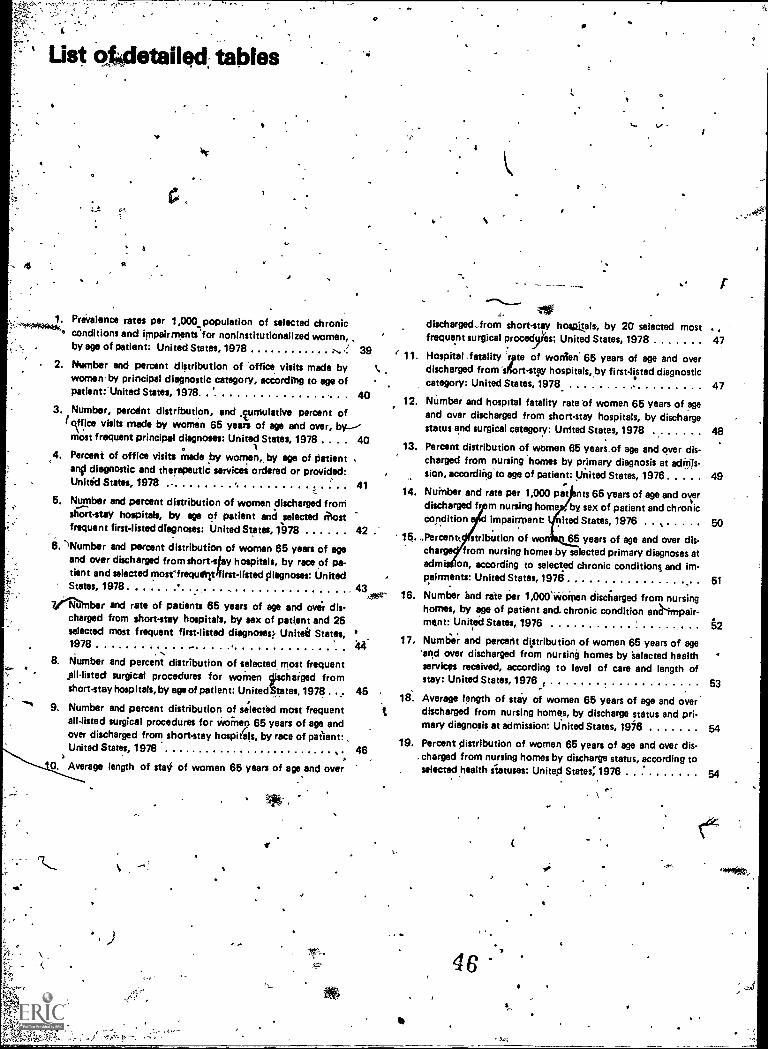
List olgletailed, tables
1. Prevalence rates per 1,000 population of selected chronicconditions and impairments 'for noninstitutionalized women,by age of patient: United States, 1978
2. hiember and percent distribution of 'office visits made bywomenby principal diagnostic category, accordihg to age ofpatlent:'United States, 1978 ..
3. Number, percent distribution, and luniulative percent ofVice visits made by women 65 years of age and over, bymost frequent principal diagnoses: United States, 1978 . . 40
4. Percent of office visits made by women,, by age of patientanti diagnostic and therapeutic services ordered or provided:United States, 1978 -
5. Number and percent distribution of women discharged fronishort-stay hospitals, by age of patient and ,mlected 1lostfrequent first-listed diagnoses: United States, 1978
a
39
40
41
42
6. .'Number and percent distribution of women 65 years of age
and over discharged from short-spy hospitals, by race of pa-tient and selected mosefrequfnt rst-listed$iiagnoses: UnitedStates, 1978
7/111.1nber and rate of patients 65 years of age and over dis-charged from short-stay hospitals, by sex of patient and 25selected most frequent first-listed diagnoses United States,1978
8. Number and percent distribution of selected most frequentAll.listed surgical procedures for women 51,,ischaiged fromshort-stay hospitals, by age of patient: United States, 1978.. 45
9. Number and percent distribution of selectad most frequentall-listed surgical procedures for Woine7 65 years of age andover discharged from short-stay hospitals, by race of patient:United States, 1976 46.
Average length of mini of women 65 years of age and over
discharged,from short-stay hospitals, by 20 selected mostfrequent surgical procedies; United States, 1978
11. Hospital fatality `te of wonien 65 years of age and overdischarged from 'sitort-stey hospitals, by first- listed diagnosticcategory: United States, 1978-
12. Number and hospital fatality rate of women 65 years of age
and over discharged from short-stay hospitals, by dischargestatus and surgical category: United States, 1978
13. Percent distribution of women 65 years of age and over dis-charged from nursing homes by primary diagnosis at adriiis-
. sion, according to age of patient: United States, 1976
43.,
14. Nuinber and rate per 1,000 pat nts 65 years of age and ordischarged f m nursing home , by sex of patient and chroniccondition d impairment: ited States, 1976 . .
16...Percentt stribution of wo 65 years of age and over dis-cha from nursing homes by selected primary diagnoses atadm' an, according to selected chronic conditions and im-pairments: United States, 1976 51
16. Number end rate per 1,000WOrpen discharged from nursinghomes, by age of patient and, chronic condition animpair-mint: United States, 1976 52
17. Number and percent distribution of women 65 years of age'and over discharged from nursing homes by 'selected healthservices received, according to level of care and length ofstay: United States, 1976 53
18. Average length of stay of women 65 years of age and overdischarged from nursing homes, by discharge status and pri-mary diagnosis at admission: United States, 1976 54
19. Percent distribution of women 65 years of age and over dis-charged from nursing homes by discharge status, according toselected health statuses: United States:1976
47
47
48
49
50
54
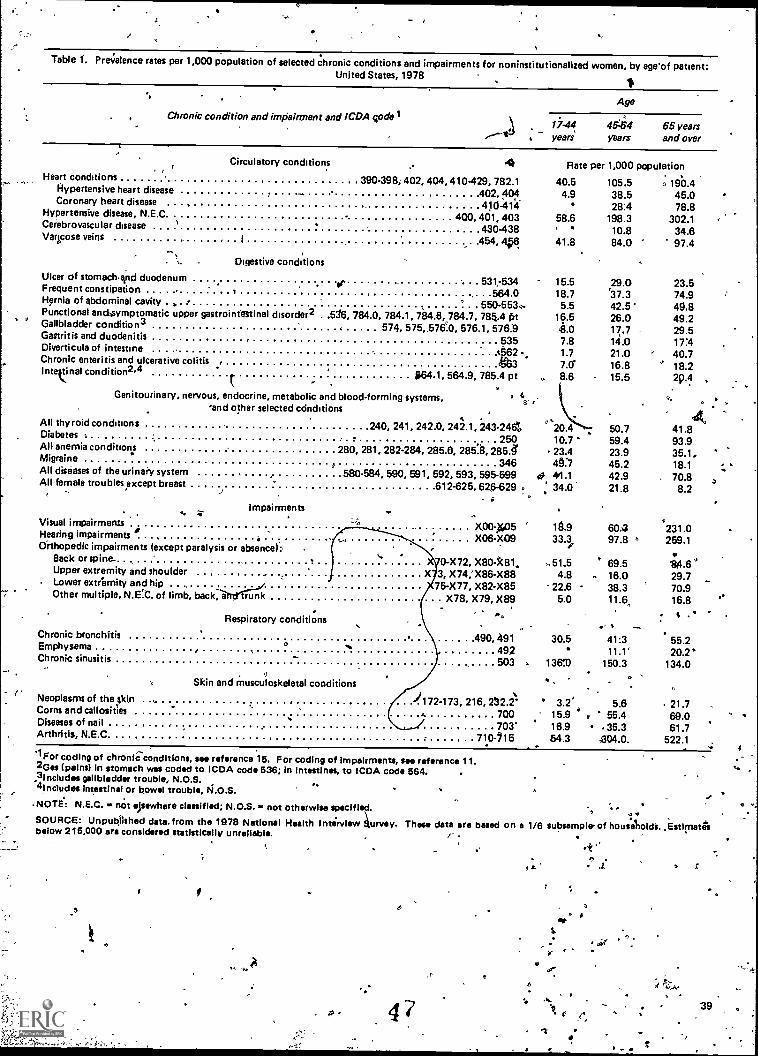
Table 1. Pre;ratence rates per 1,000 population of selected chronic conditions and impairments for noninstitutionalized women, by age'of patient:United States, 1978
Chronic condition and impairment and ICDA codelAge
years45:454 65 yearsyears and over
Circulatory conditions 4 Rate per 1,000 population
Hypertensive heart disease I 402, 404
Heart conditions 390-39% 402, 404, 410429, 782.1
Coronary heart disease ' 410.414
Cerebrovascular disease 430-438
Hypertensive disease, N.E.0 400.401,403
Varicose veins 1 454, 4956
. ... Digestive conditions
Ulcer of stomachrind duodenumet 531,-534
Frequent constipation .1 564.0Hernia of abdominal cavity . ' 550-5530Functional anciaymptomatic upper gastrointestinal disorder2 . .5/6. 784.0, 784.1. 784.8. 784.7, 784.4 trt
" Gallbladder conditio n3 , 574, 575 ,,5760, 576.1, 576:9Gastritis and duodenitis 535
.Diverticula of intestine t 2Chronic enteritis and ulcerative colitis . 3intestinal condition2.4 $64.1, 564.9, 785.4 pt
Genitourinary, nervous, endocrine, metabolic and blood-forming systems,'and other selected cdnditions
ar
All thyroid conditions 240. 241. 242.0, 242.1.243 -246';Diabetes 250All anemia conditions 280, 281, 282.284, 285.6, 2851, 285./Migraine
1, 346All diseases of the urinary system 580-584, 590, 591, 592, 593, 595-599All female troubles except breast 612-625, 626 -629.
. sImpairments
Visual impairmentsHearing impairments ,
Orthopedic impairments (except paralysis or absence):Back or spine.Upper extremity and shoulderLower extremity and hipOther multiple, N.E!C. of limb, back:iiftd<T11C
Respiratory conditions
Chronic bronchitisEmphysemaChronic sinusitis
Skin and musculoskeletal conditions
Neoplasms of the skin ... )172.173, 216, 232.2Corns and callosities 700Diseases of nail ..
703'Arthritis, N.E.0 710-115.
X00.11(05X06-X09
0-X72, X80-k81,,3, X74;X86-X8875-X77, X82-X85
X78, X79, X89.,,
490, 491492503
1 For coding of chronle-conditions. see reference 16. For coding of impairments, set reference 11.2Ges (pains) in stomach was coded to ICDA code 536; in intestines, to ICDA code 564.3Includes gallbladder trouble, N.O.S.'4includes intestinal or bowel trouble, N.O.S.
.NOTE: N.E.C. - not elsewhere classified; not otherwise specified.SOURCE: Unpublished data. from the 1978 National Health Interview urvey. These data are based on a 1/6below 215,000 are considered statistically unreliable. f
40.54.9
58.6'
105.538.528:4
198.310.8
,. 190.445.078.8
302.134.6
41.8 84.0 97.4
15.5 29.0 23.518.7 r37.3 74.95.5 42.5 49.8
16.5 26.0 49.26.0 17.7 29.57.8 14.0 17:41.7 21.0 ' 40.77.0' 16.8 " 18.2
. 8.6 15.5 29.4
'20.44
50.7 41.810.7 59.4 93.923.4 23.9 35.1,4'7 45.2 18.1
0 41.1 42.9 70.8 a' ' 34.0 21.8 8.2
19.9 spa 231.033.3 97.8 ° 259.1
.. 51..5 69.5 ;4.64.8 - 16.0 29.7
22.6 - 38.3 70.95.0 11.6, 16.8
, -
30.5 41:3 55.211.1' 20.V
136'.0 150.3 134.0
3.2' 5.6 21.715.9 ' 55.4 69.016.9 35.3 61.784.3- £04.0. 522.1
0
5
4
A
6
subsample' of houseliolcia. Estimate's
`
guar
r
39
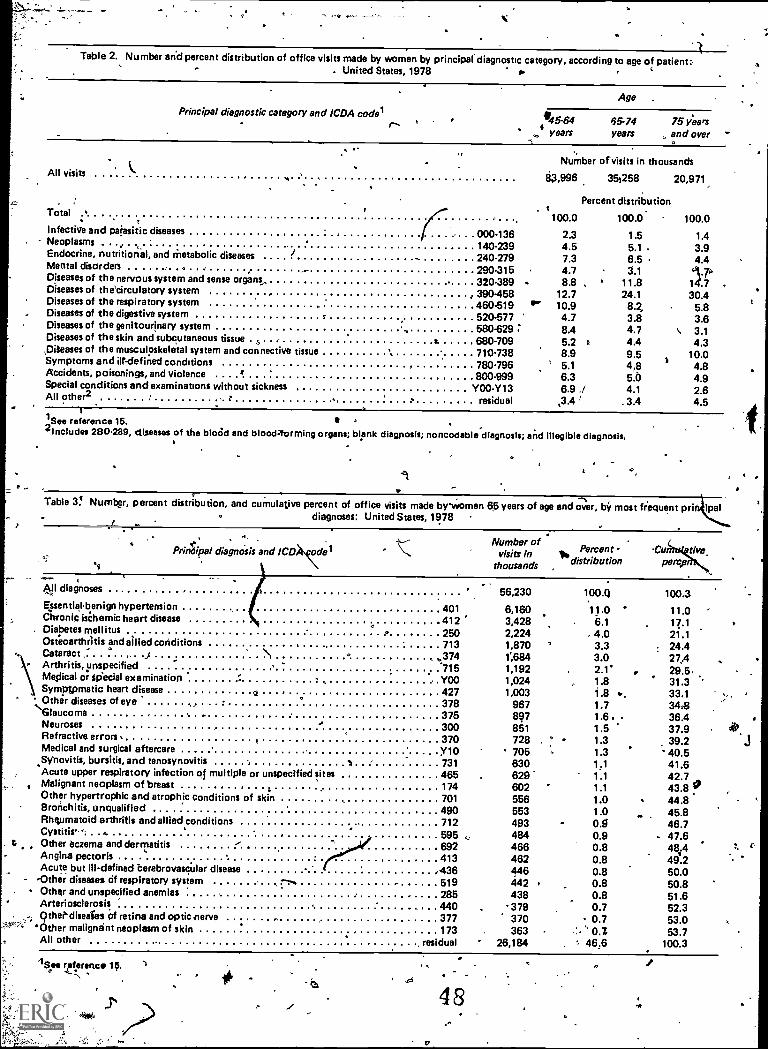
j
Table 2. Number arid percent distribution of office visits made by women by principal diagnostic category, according to age of patient:. United States, 1978
Principal diagnostic category and ICDA coderr- ° ,
Age .
'4554years
65.74years
75 yeasand over
All visits
Total
Number of visits in thousands
63,996 35,258 20,971
Percent distribution
100.0 100.0. 100.0Infective and paiasitic diseases 000.136 2.3 1.5 1.4Neoplasms - , 140-239 4.5 5.1 . 3.9Endocrine, nutritional, and metabolic diseases I
240-279 7.3 6.5 4.4Mental disorders - 290.315 4.7 3.1Diseases of the nervous system and sense organs, 320.389 . 8.8 , 11.8 14.7Diseases of the'circulatory system , , 390.458 12.7 24.1 30.4Diseases of the respiratory system 460.519 "'" 10.9 8.Z 5.8Diseases of the digestive system 520-577 4.7 3.8 3.6Diseases of the genitourinary system
. 580.629 ; 8.4 4.7 3.1Diseases of the skin and subcutaneous tissue
a t. 680-709 5.2 0 4.4 4.3,Diteases of the musculoskeletal system and connective tissue \ 710-738 8.9 9.5 10.0Symptoms and ilf-defined conditions 780-796 ° 5.1 4,8 4.8Accidents, poisonings, and violence a 800.999 6.3 5.0 4.9Special conditions and examinations without sickness Y00 -Y13 6.9 ./ 4.1 2.6All other2 . - : residual ,3.4 . 3.4 4.5
1 See reference 15.2lncludes 280.289, diseases of the bloOd and blood4ormIng organs; blank diagposis; noncodablediagnosls; and Illegible diagnosis.
Table 3! Number, percent distribution, and cumulative percent of office visits made bywomen 65 years of age and over, by most fr'equent prig ipal0 diagnoses: United States, 1978
diagnOsis and ICD)ts.KdelNumber of
Percent Cu dyevisits indistribution percp,thousands ,
All diagnoses 56,230 100.Q 100.3Essentiabenign hypertension 401 6,160 11.0 11.0Chronic ischemic heart disease 412 3,428 6.1 17.1Diabetes mellitus 250 2,224 4.0 21.1Osteoarthritis and allied conditions 713 1,870 3.3 24.4Cataract ," . .) 1 ° ..4374 1;684 3.0 274Arthritis, unspecified *715 1,192 2.1' 29.5,Medical or Special examination ' . Y00 1,024 1.8 31.3Symptomatic heart disease o 427 1,003 1.8 *, 33.1Other diseases of eye .
378 967 1.7 3438Glaucoma .Neuroses . . . 375
300897851
1.6 .1.5
36.437.9
Refractive errors .e 370 728 ° 1.3 39.2
Medical and surgical aftercare yio 705 1.3 40.5bursitis, and tenosynovitis I 731 630 41.6Syllovitis,
Acute upper respiratory infection of multiple or unspecified sites 465 629 1.1 42.7Malignant neoplasm of breast 174 602 1.1 43.8 vOther hypertrophic and atrophic conditions of skin 701 556 1.0 44.8Bronchitis, unqualified 490 553 1.0 45.8Rheumatoid arthritis and allied conditions 712 493 0.5 46.7Cystitis- . 0. 595 484 0.9 47.6
S Other eczema and dermatitis . 692 466 0.8 48.4Angina
. 413 462 0.8 49.2Acute but ill-defined berebrovascular disease .436 446 0.8 50.0
- -Other diseases of respiratory system 519 442 0.8 50.8Other and unspecified anemias 285 438 0.8 51.6Arteriosclerosis 440 379 0.7 52.3
,..; Othediseales of retina and optic nerve . 377 370 - 0.7 53.0'*' 'Other malignant neoplasm of skin 173 363 53.7
All other . residual 26,184 , 46.6 100.3
O
48
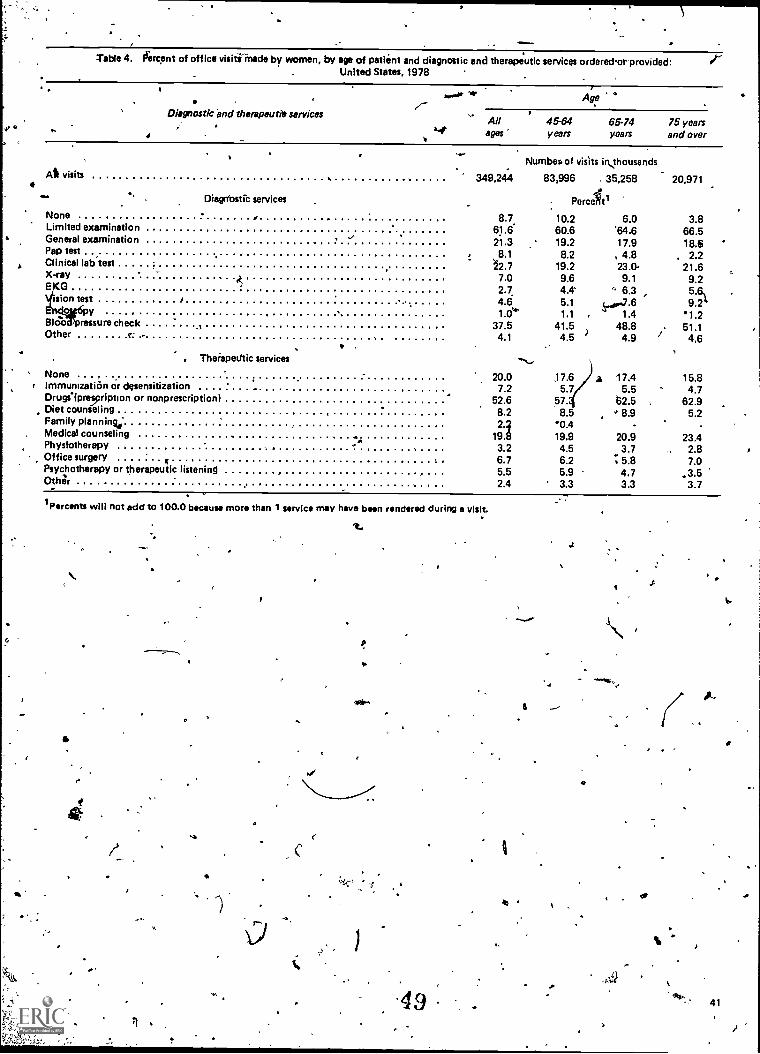
Table 4. fiercent of office visitiinade by women, by age of patient and diagnostic and therapeutic services ordered.or provided:United States, 1978
Diagnostic and therapeutic services
All visits
DiagOostic services
None ,Limited examinationGeneral examinationPap testClinical lab test
E-ray
sion test ..
Y .Blood3pressure check .1Other r: -
None .
i Immunization or desensitizationDrugs4lpreription or nonprescriptionDiet counseling ,Family planning.-Medical counseling ..
hystotherapy. Office surgery f
Psychotherapy or therapeutic listeningOthrlr
, Theiapedtic services
Perceitl
8.7. 10.2 6.0 3.861.6 60.6 '64.6 66.521.3 19.2 17.9 18.6
8.1 8.2 , 4.8 . 2.2/2.7 19.2 23.0- 21.6
GX 7.0 9.6 9.1 9.2
2.7. 4.4. ' 6.3 5.6%4.6 5.1 .7.6 9.21.0'4* 1.1 . 1.4 1.2
37.5 41.5)
48.8 51.14.1 4.5 4.9 4.6
20.0 17.6 z 17.4 15.87.2 5.7 5.5 4.7
52.6 57. 52.5 , 62.98.2 8.5 ' 8.9 5.2
1921A'0 - -
..,, 19.9 20.9 23.4P 3.2 4.5 3.7 2.8
6.7 6.2.. 5.8 7.0
5.5 5.9 4.7 3.52.4 3.3 3.3 3.7
.
Age '°,,-
All.
45-64 65-74 75 yearsa.4. ages years years and over
Numbea of visits ihousands
349,244 83,996 35,258 20,971
tPercents will not add to 100.0 because more than 1 service may have been rendered during a visit.
o
p
49
6
.0
41
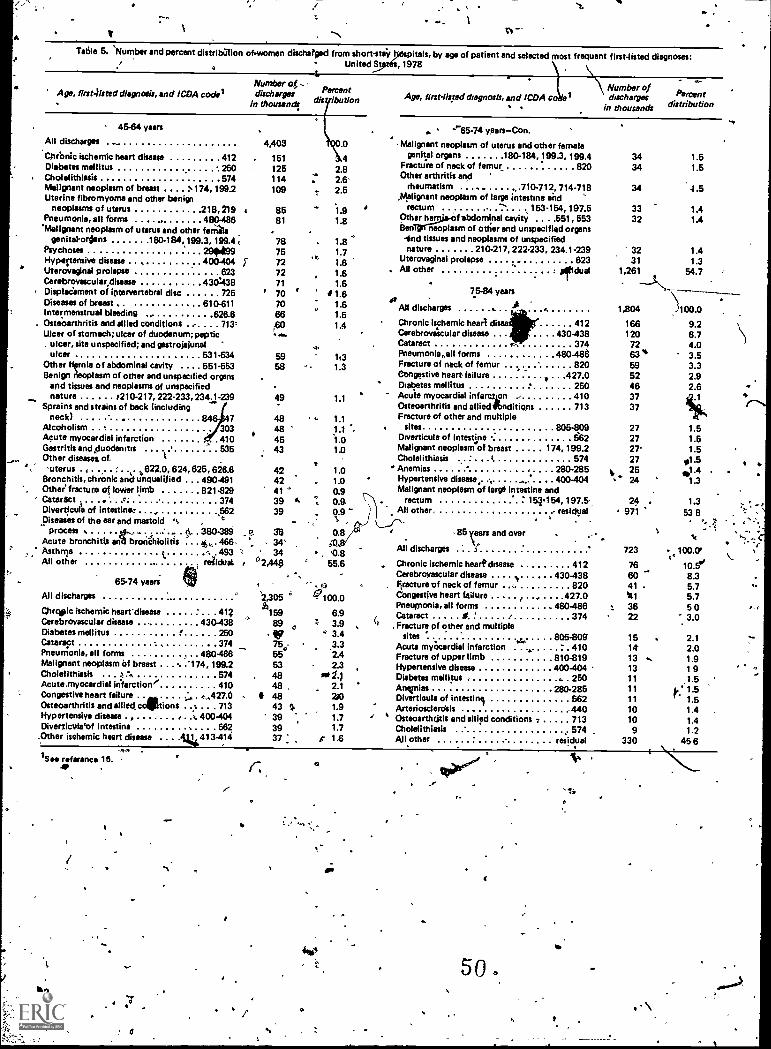
,
V
Wile 5. 'Number and percent distribution ofwomen discharged from short-stay- United St
tnspitals, by age of patient and selected most frequent first-listed diagnoses:, 1978
Age, firsaisted diagnosis, and 1CDA nodalNumber og -
dischargesdisylbutlonin thousand!
All discharges
Chronic ischemic heart disease 412 . 151Diabetes mellitus 250 125Cholefithimis 574 114Malignant neoplasm of breast 174, 199.2 109Uterine fibromyoma and other benign
neoplasms of uterus 216, 219Pneumonia, all farms . 480-486
'Malignant neoplasm of uterus and other feral.genital-ordans 180. 184,199.3,199.44
PsychosesHypertensive disease . , 4Uteroveginal prolapse 623Cerebrovescular,disease 430438
' Displacement of iptervertebral disc 725Diseases of breast 610-611Intermenstrusl bleeding ,, 626.6Ostioarthritis and allied conditions . e. . . 713;Ulcer of stomach; ulcer of duodenum; peptic
ulcer, site unspecified; and gestrojelunalulcer . 531.534
Other htrnia of abdominal cavity .. 551.553Benign neoplasm of other and unspecified organs
and tissues and neoplasms of unspecified
-. nature 4210.217, 222-233, 2341-239Sprains and strains of beck (including
neck) 84603AlcoholismAcute myocardial infarction 410Gastritis and Ouodenutis 535Other disease& of. (
'uterus .4 622.0, 624, 625, 626.8 42Bronchitis, chronic anifunquelified . .. 490.491 42Other fracture or lower limb 821.829 41Cataract . . 4 , 374 39Diverticur e of intestiner , ,562 39
piseashs of the ear and mastoid °, ,process , . 0., - . . .: .. . tl,. . 380-389 e 36
Acute bronchitis anli brolia.iolitis . . . 4,,,. 466- 34'Asthma ,
1.- 493 '-!, ' 34
All other residual , ° 2,440
65-74 years
45-64 years
4,403
8581 1.8
78 1.81.71.81.61.6
42.8: 2.6-2.5
1.9
75727271
' 707066
5958
49
48484543
All discharges
4.
1t31.3
1.1
1.01.00.9
0.9
0.8
.
55.6
2,305 ° 47100.0
Chrqpic ischemic heart' disease 412h159
6.9Cerebrovascular disease ... 430-438 89 z 3.9Diabetes mellitus 250 VII 3.4Cataract 374 750 .3.3Pneu monis, all forms 480-486 55 2.4Malignant neoplasm of breast '174, 199.2 53 - 2.3Cholelithiasis . , 574 48 to 1.)Acute.myocardial irifarction / . 410 48 2.1Congestive heart failure a, :, . ... ,427.0 48 24Osteoarthritis and allied cocstions .% . . . 713 43 SI. 1.9Hypertensive disease . , . t. 400-404 39 1.7Diverticulatf intestine 562 39 1.7
;Other ischemic heart disease . . . .14413-414 37 : $ 1.6
Age, first-listed diagnosis, and 1CDA coNumber ofdischarges
in thousands
Percentdistribution
"-'85-74 years-Con.
Malignant neoplasm of uterus and other femalegenital organs 180-184, 199.3, 199.4
FractUre of neck of femur 820Other arthritis and
rheumatism . 710-712, 714.718Malignant neoplasm of large intestine and
rectum -.4 153-154, 197.5Other he f 'abdominal cavity . . .551, 553Ben neoplasm of other and unspecified organs-end tissues and neoplasms of unspecifiednature 210.217, 222-233, 234.1-239
Uterovaginel prolapse 623All other eirldual
75-84 yearset AAll discharges ..
Chronic ischemic heart disea 412Cerebrovaicular disease . . . 430-438Cataract r- 374Pneumonia,.all forms 480.485Fracture of neck of femur 820. .Congestive heart failure * 427.0' Diabetes mellitus 250Acute myocardial infarc,ten 410Osteoarthritis and allied*nditiqns . 713Fracture of other and multiple
sites 805 -809 27Diverticula of intestine 562 27Malignant neoplasm of breast 174, 199.2 27'Cholelithiasis ' ( 574 27Anemias ,. 280-285 v 25Hypertensive disease, , , 400-404 24Malignant neoplasm of large intestine and
rectum 154454, 197.5- 24 . 1.3All other residual 971 53 8
3434
34
ti
1.51.5
4.5
33 1.432 1.4
32 1.431 1.3
1,261 54.7
1,804 100.0
166 9.2120 8.7
72 4.063% 3.559 3.3
2.92.6
52463737
1.51.51.5
so1'41.3
85 and over
All discharges
.
Chronic ischemic heart cksease 412Cerebrovascular disease . . . . N ...... 430-438Fracture of neck of femur 820Congestive heart failure ... .427.0Pneumonia, all forms 480-486Cataract 0 ' 374Fracture of other and multiple
sites.e... 805-809'
Acute myhcardial infarction 410,.Fracture of upper limb 810-819Hypertensive disease 400-404 -Diabetes mellitus - , . 250Anemias 280-285Divertioula of intestinj 562Arteriosclerdsis ... -440Osteoarthrjtis and allied conditions - 713Cholelithiasis 574All other residual
t
723 r 100 0't \.
1 0.5'8.35.75.7503.0
766041 .
111
e 3622
15 2.114 2.013 .. 1.913 1911 .1.511 k: 1.511 1.510 1.410 1.49 1.2
330 456
1 SAD reference 16.
500to
\
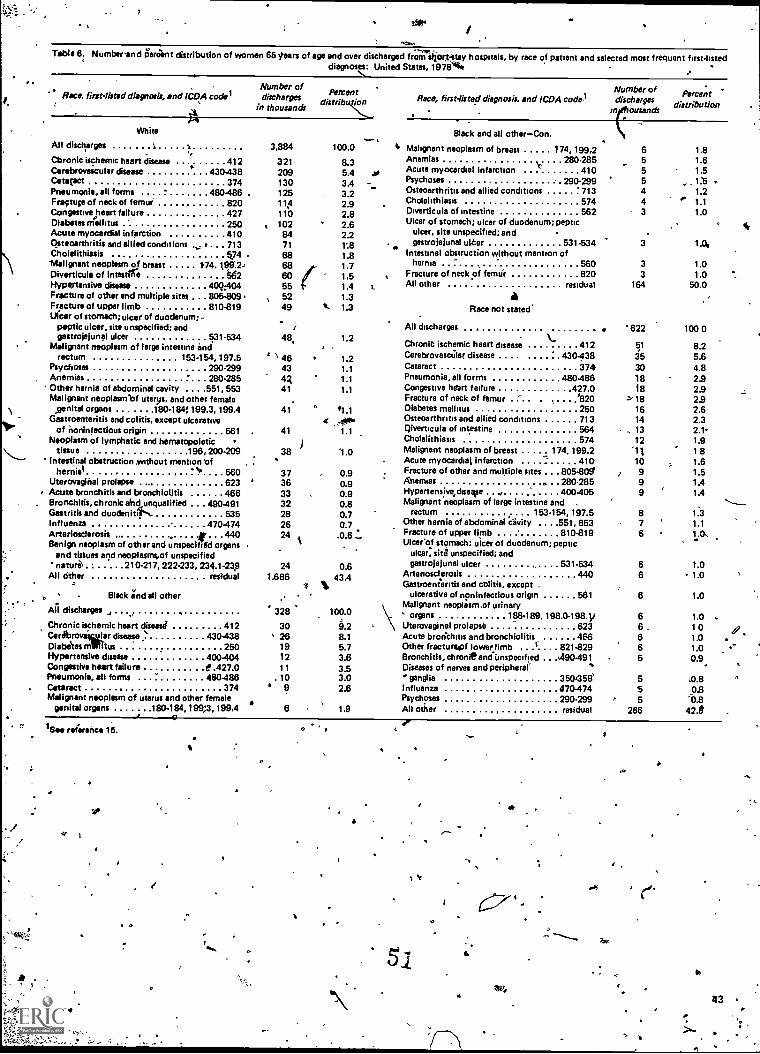
Table 8. Numbeand iierant distribution of women 85 tears of age and over discharged from"iiicorkstay hospitals, by race of patient and selected most frequent first-listeddiagnoses: United States, 1978**,
Number of Number of Percent
in thousandsdischarges distribt ion
tn ousandsdischarges distribution
Race. lint -lined diagnosis, and (WA codel
White
All discharges 1 1 3,884
Chronic ischermc heart disease 412 321C4rebrovescular disease 430438 209Cetatact 374 130Pneumonia, all forms 480486 . 125Fractups of neck of femur 820 11:3Congestive heart failure 427 110Diabetes mellitus 250 . 102Acute myocardial infarction 410 84Osteoarthritis and allied conditions . 713 71Cholelithlasis 5.74 68'Malignant neoplasm of breast 1.74. 159.2-. 68Diverticule of intestge td2 60RYPertensive disease 40Q404Fracture of other and multiple sites . 805.809.Fracture of upper limb 810.819Ulcer of stomach; ulcer of duodenum: -
peptic ulcer, site unspecified; andgastrojelunel ulcer 531-534
Malignant neoplasm of large intestine andrectum 153.154, 197.5 ' \ 46
Psychoses 290.299 43Anemias 280-285 4ROther hernia of abdominal cavity .. . 551, 553 41Malignant neoplasmlaf uterus. and other female
.genital organs 180-1841199.3, 199.4 41Gastroenteritis and colitis, except ulcerative
of noninfectious origin 561Neoplasm of lymphatic and hematopoietic
tissue 196,200-209Intestinal obstruction without mention rof
hernial t 560 37Uteroveginal prolapse 623 ' 36
. Acute bronchitis and bronchiolitis 466Bronchitis, chronic abd unqualified . . . 4.90-491Gastritis and duodenitil-... 535Influenza , . 470-474Arteriosclerosis , # 440Benign neoplasm of other and unspecified organs
and tistues and neoplasms,of unspecifiednatured . 210-217, 222.233, 234.1-239
All Other residual 1.686
. Black and all other .All discharges , , ' 328Chronic ischemic heart disease 412 30C4rebroviswar disease ' 430-438 ' 26Diabites m.litus 250 19Hypertensive disease 400-404 12Congestive heart failure 9 427.0 11Pneumonia, all forms 480-486 . 10Cataract 374Malignant neoplasm of uterus and other female
agenital organs 180-184,199;3,199.4 6
555249
48
41
38
3332282624
24
(
er 1See reference 15.
41`
O
11 0
. e
Race, first-listed diagnosis. and ICDA code1
- Slack and all other-Con.
100.0 4, Malignant neoplasm of breast 174, 199.2 6 1.8
8.3 AnemiasV 280-285 5 1.6
5.4 asAcute myocardial infarction 410 5 1.5
3.4 Psychoses 290-299 5 1:5
3.2 Osteoarthritis and allied conditions 713 4 1.2
2.9 Cholelithiasis 574 4 1.1
2.8 Diverticula of intestine 562 3 1.0
2.6 Ulcer of stomach; ulcer of duodenum; peptic
2.21:8
ulcer, site unspecified: and
. gastrojejunal uker 531-534 3 1.0,
1.8 Intestinal obstruction without mention of1.7 hernia 560 3 1.01.5 Fracture of neck of fernui. . 820 3 1.01.4 s.
All other residual 164 50.01.3 a1.3 Race not stated
All discharges 622 100 01.2
Chronic ischemic heart disease 412 51 8.21.2 Cerebrovascalar disease .. .. .... : . 430.438 35 5.61.1 Cataract 374 30 4.81.1 Pneumonia. all forms 480-486 18 2.91.1 Congestive heart failure 427.0 18 2.9
Fracture of neck of femur .... . . .... '820 %18 2.9#1.1 Diabetes mellitus 250 16 2.6
.4"1.1
Osteoarthritis and allied conditions 713Ciiverticula of intestine 564
14, 13
2.32.1'
Cholelithiasis 574 12 1.91.0 Malignant neoplasm of breast 174, 199.2 "11 18
Acute myocardial infarction 410 10 1.60.9 Fracture of other and multiple sites . .. 805-809 e 9 t50.9 Aums . . 280-285 9 1A0.9 Hypertensive,diseve , 400-405 9 1.4
0.8 Malignant neoplasm of large intestine and .
0.70.7
rectum 153-154, 197.5Other hernia of abdominal cavity . . . .551, 553
87
1.31.1
.0.6 Fracture of upper limb-819
6Ulceeof stomach: ulcer of duodenum; peptic
ulcer, sitd unspecified; and
as gastrojejunal ulcer 531.534 6 1.0
43.4 Arteriosclerosis 440Gastroenteritis and colitis, except .
6 1.0
ulcerative of noninfectious origin 561 6 1.0Malignant neoplasm.of urinary
100.0 organs 188.1 89. 198.0-198.1/ 6 1.09.2 Uterovaginal prolapse 623 6 108.1 Acute bron'cloto and bronchiolitis 466 6 1.05.7 Other fracturapf lower limb l 821.829 6 1.03.6 Bronchitis, chronieand Unspecified . . .490-491 5 0.9.3.5 Diseases of nerves and peripheral3.0 -ganglia 350458' 52.6 influenza 470474 5 9.13
Psychoses 290.299 , 5 '0.81.9 All other residual 286 42.8
Ner
.4
Si
43
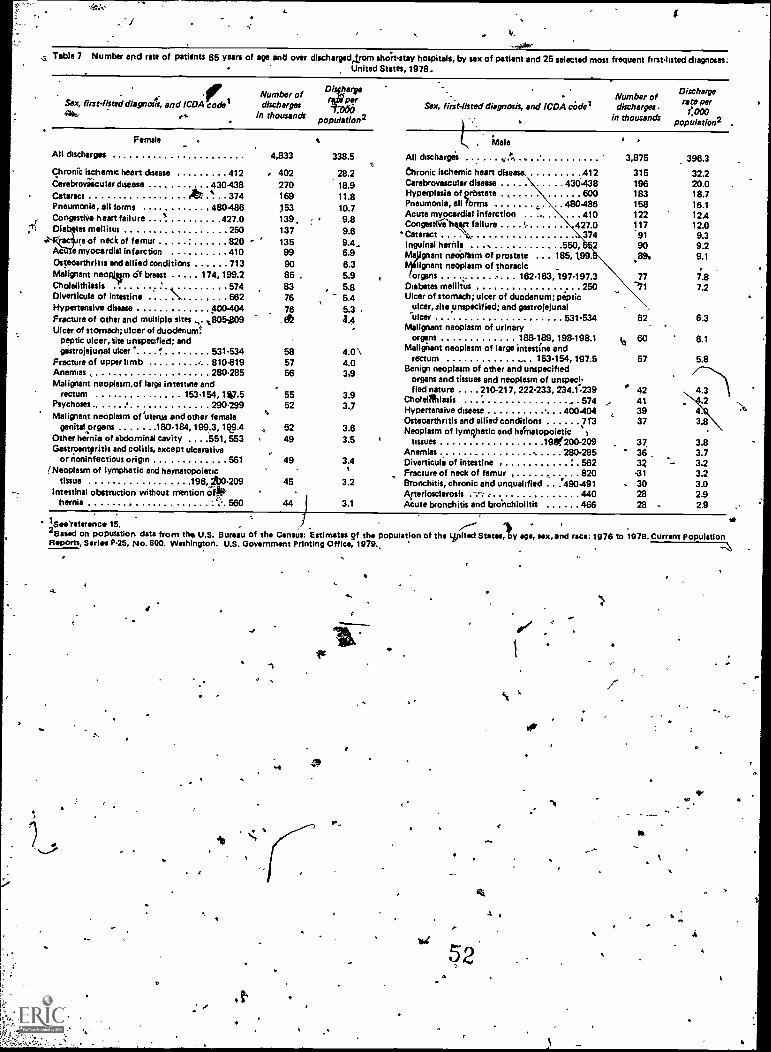
I
:-.44der
. Table 7 Number and rate of patients 65 years of age and over dischargedetrom shoh-stay hospitals, by sex of patient and 25 selected most frequent first-listed diagnoses:United States, 1978.
Sex, first-Ihted diagna4, and ICDA code ,Number ofdischarges
in thousandspopulatIon2
airPflf
Sex, first-listed diagnosis, and ICDA coderNumber ofdischarges .
in thousands
Female .
All discharges
Chronic ischemic heart disease 412Cerebrovascular disease 430-438Cataract rib? ' . 374Pneumonia, all forms 480-486Congestive heart failure $ 427.0Diabetes mellitus . . .250
re of neck of femur 820e myocardial infarction 410
Osteoarthritis and allied conditions 713Malignant neoqieen of breast 174, 199.2Cholelithiesis '' 574Diverticula of intestine \ 562Hypertensive disease . 400-404Fracture of other and multiple sites . %I:1054309
Ulcer of stomach; ulcer of duodenumsPeptic ulcer, Site unspecified; andgistrojejunal ulcer' '' 531.534
Fracture of upper limb / 810.819Anemias , 280.285Malignant neoplasm,of large intestine and
rectum . 153.154, 1*7.5Psychoses 6 290.299Malignant neoplasm of 'uterus and other female
genitalorgans .180484,199.3, 1%9.4Other hernia of abdominal cavity . . . .551, 553Gastroenteritis and colitis, except ulcerative
or noninfectious origin 561!Neoplasm of lymphatic and hematopoietic
tissue 1964b0.209Intestinal obstruction without mention oft
'''' 560
4,833
,,
402270169153139,137135
999085 08376
76. fit
585756
5552
5249
49
45
44
338.5
28.218.911.810.79.89.69.4.6.96.35.95.85.45.3 .4.4
4.0 \4.0359
3.93.7
3.63.5
3.4
3.2
3.1
. Male
All discharges
Chronic ischemic heart disease. 412Carebrovascular disease 430.438Hyperplasia of prbstate , 600Pneumonia, all %mu 480-486Acute myocardial infarction ... 410Congestirteeft failure 427.0Cataract . 374Inguinal hernia 550, z 2Ma gnant rumPlesm of prostate . .. 185,1.99.
Ililignant neoplasm of thoracicorgans 162-163, 197-197.3
Diabetes mellitus 250Ulcer of stomach; ulcer of duodenum; peptic
ulcer, site unspecified; and gastrojelis nalulcer 531.534
Malignant neoplasm of urinaryorgans 188-189, 198-198.1
Malignant neoplasm of large intestine andrectum 153.154, 197.5
Benign neoplasm of other and unspecifiedorgans and tissues and neoplasm of unspeci-fied nature .... 210-217, 222-233, 234.1-239
Choleiffinlasis ' . . 574Hypertensive disease 400404Osteoarthritis and allied conditions 713Neoplasm of lymphatic and heinatopoietic 1
tissues 19200-209Anemias , 280-285Diverticula of intestine ' 562Fracture of neck of femur , , 820Bronchitis, chronic and unqualified . ..'490.491Afteriosclerosis --- 440Acute bronchitis and brenchiolitis 466
1
3,875
315196183158122117'9190.89.
77'71
62
kt 60
57
42413937
37,363Z
-31. 30
2828
Dischargerate per
1:000population2
.
396.3
32.220.018.716.112.412.09.39.29.1
7.87.2
6.3
6.1
5.8
3.83.73.23.23.02.92.9
vs1See'retwonce 15. /---- / i2 Bawl on population data from the, U.S. Bureau of the Census: Estimates of the populatIon of the spited States, by age, VIN, and race: 1978 to 1978. Current PopulationReports, Series P-25, No. 800. Washington. U.S. Government Printing Office, 1979.,
---J
a
O
,
0-
s
IVqr
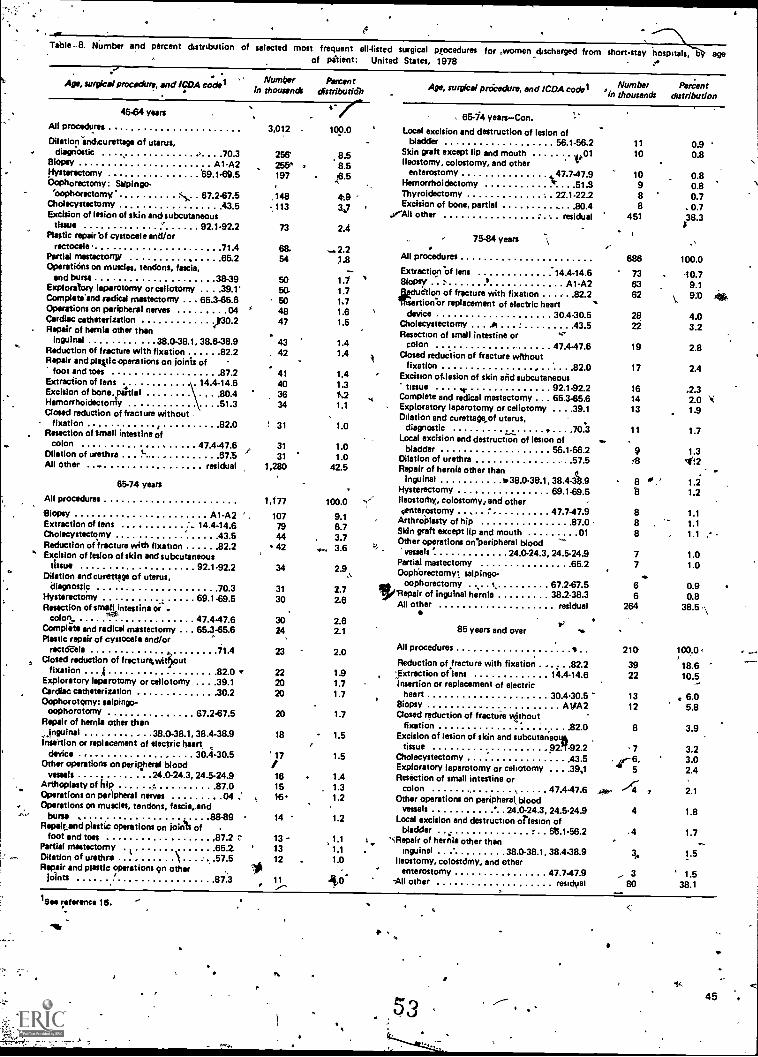
Table -8. tiumber and percent distribution of selected most frequent all-listed surgical procedures for .women _discharged from short-stay hospitals, oy ageof pitient: United States, 1978 ..
Age, *mice' procedure, and ICDA cod*
4584 years
All procedures
Dilationvanckurette9e of uterus,diagnoctic .4 70 3
Biopsy A1-A2Hysterectomy 69.1-69.5Oophorectomy: Selpingo-
koophorectomy S,.... 67.287.5Cholecystectomy 43 5Excision of lesion of skin andsubcutaneous
tissue 92.1492.2Plastic repairof cystocele and/or
rectocele 71 4Partial mestectorqw 65.2Operaticins on muscles, tendons, fascia,
and bursa 38-39Exploratory laparotomy or adiotomy . . .39.1'Cornplete'end codicil mastectomy .. . 65 385.6Operations on peripheral nerves 04Cardiac catheterization k30.2Repair of hernia other than
inguinal 38.0-38.1, 38.6-38.9Reduction of fracture with fixation 82 2Repair end plavic operations on joinis of
foot and toes 87 2Extraction of lens 14.4-14.6Excision of bone, paltiel .80.4HemorrhoidectonlY
,
51 3Closed reduction of fracture without ,
fixation .. 0rResection of small intestine of
colon 47.4.47.6Dilation of urethra ... t. 57"5All Other .. residual
85-74 years
All procedures
Biopsy A1-A2Extraction of lens . . 14.4-14.6Cholecystectomy 43 5Reduction of fracture with fixation 82 2
" Excision of lesion of skin and subcutaneoustissue 92.1-92.2
Dilation and curettage of uterus,diagnostic 70 3
Hysterectomy 69.1-69.5Resection of small intestine or .
4**colon. 47.4-47.6Complete and radical mastectomy . 65.3-65.6Plastic repair of cystocele and/or
rectaele 71 4Posed reduction of frectureAout
fixation . A 82 0Exploratory laparotomy or celiotomy . .39.1Cardiac catheterization .30.2Oophorotomy: salpingo-
oophorotomy 67.2-67.5Repair of hernia other than
Ingulnal 38 0-38.1, 38.4-38.9Insertion or replacement of electric heart
device . 30.4.30.5Other operations on peripheral blood
vessels 24 0-24.3, 24.5-24.9Arthoplesty of hip o 87 0Operations on peripheral nerves 04Operations on muscles, tendons, fascia,and
bursa 88-89RePaitand plastic operations on Joints of .
foot and tots .Partial mastectomy .
Dilation of urethraRepair and plastic operations 9n other
Joints
87 265 257 5
87.3
10es reference 16.
0
Numin
thousaerbnds
Percentdistributidh Age, surgical poicedure, and lCDA codel ' i
Numberthousands
PercentPern
distribution
i
'0'
3,012
256255k197
,148113
73
4342
41
403634
! 31
3131
1,280
1,177
107794442
34
31
30
3024
23
222020
20
18
'17
161516
14
13 -1312
11
4' c100.0
8.58.5
,t6.5
4'13 '
V2.4
-.2.21.8-1.11.71.71.61.5
1.41.4
1.41.31.21.1
1.0
1.01.0
42.5
100.0 -9.18.73.7
w. 3.6
2.9%.
2.72.8
2.82.1
2.0
1.91.71.7
1.7
- 1.5
1.5
1.4, 1.3
1.2
1.2
1.1 1,,1.1
1.0
4.0'
, 65-74 years-Con.
Local excision and destruction of lesion ofbladder 56.1-56.2
Skin graft except lip and mouth 1,01Ileostomy, colostomy, and other
enterostomy ., 47.7.47.9Hemorrhoidectomy Tc 51 SThyroidectomy 2Z1-22.2Excision of bone, partial 80 4
."All other residual
75-84 years
All procedures
Extrection.of lens '14.4-14.6Biopsy ' a A1-A2leduction of fracture with fixation 82 2Thsertion.or replacement of electric heart
device 30.4-30.5Cholecystectomy 43 5Resection of small intestine or '-
colon 47.4-47.6Posed reduction of fracture without
fixation 82 0Excision of-lesion of skin and subcutaneous
tissue "e 92.1-92.2Complete and radical mastectomy .. 65.385.6Exploratory laparotomy or celiotomy . . . .39.1Dilation and curettage of uterus,
diagnostic . .70..3Local excision and destruction of lesion of
bladder 56.1-56.2Dilation of urethra 57 5Repair of hernia other than
inguinal v38.0-38.1, 38.4-3/3.9Hysterectomy 69.1-69.5Ileostorhy, colostomy: and othersenterostomy ' 47.7-47.9
Arthroialasty of hip 87 0Skin graft except lip and mouth 01Other operations on peripheral blood
vessels ' 24.0-24.3, 24.5-24.9Partial mastectomy 65 2Oophbrectomyl salpingo-
oophorectomy r. 67.2-67.5salpingo-
'Repair of inguinal hernia 38.2.38.3All other residual
*V
85 years and over ...
All procedures
Reduction of fracture with fixation 82 2. .,,Extraction of lens 14.4-14.6
insertion or replacement of electricheart 30.4-30.5
Biopsy A1IA2Posed reduction of fracture without
-.4. .fixation 82 0Excision of lesion of skin and subcutan-eo
tissue 92111.92.2,Cholecystectomy 43 5Exploratory laparotomy or celiotomy . . . .39,1Resection of small intestine or
colon 47.4-47.6. ,Other operations on peripheral, blood
vessels 24 0-24.3, 24.5-24.9Local excision and destruction orlesion of
bladder 615.1-56.2"%Repair of her;ia other than
inguinal 38.0-38.1, 38.4-38.9Ileostomy, colostdmy, and other
enterostomy 47.7.47.9-All other residual
I-
A4,
1110
10988
451
686
736362
2822
19
17
161413
11
9713
8
888
77
6264
210
3922
1312
a
7
if-6"5
.
4
.4
3,
, 380_
el .4
0.90.8
0.80.80.7
. 0.738.3
100.0
40.79.19:0 40%
4.03.2
2.8
2.4
42.32.01.9
1.7
1.34:2
1/1.2
1.11.11.1
1.01.0
0.50.8
38.5 \
loo.o
18.610.5
6.05.8
3.9
3.23.02.4
2.1
1.8
1.7
1.5
1.538.1
,
53 45
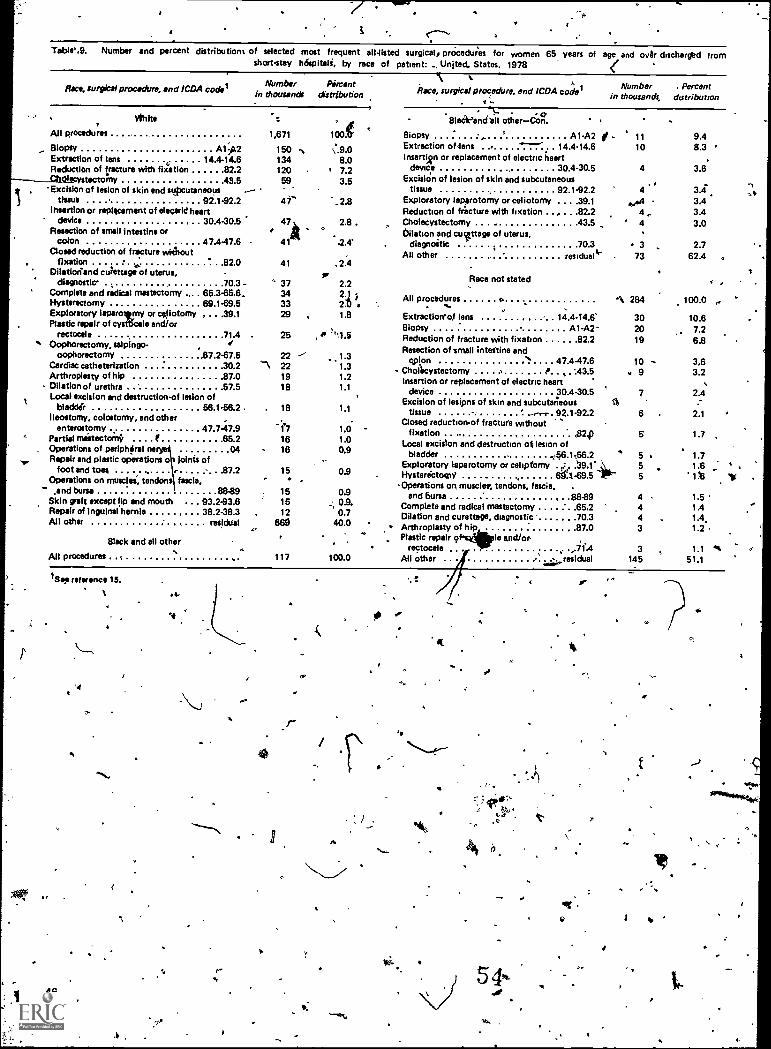
Table.g. Number and percent distribution% of selected most frequent aildisted surgical, prOcedues for women 65 years of age and over discharged fromshort-stay hdepitali, by race of patient: United. States, 1978
Race, surgical procedure, and ICDA coderRace, surgical procedunt, and ICDA code'Number Percent
In thousands distribution
vitaAll procedures 1,671
Bio MY A1;02Extraction of lens 14.4-14.6Reduction of fracture with aation 82 2
dtecystectomy 43 5, Excialon of lesion of skin and stipcuteneous --
tissue 92.1-92.2Ihsertion or replacement of deoarid heart
device 30.4-30.5Resection of small intestine or
colon 47.447.6Closed reduction of fracture without
fixation 82 0Dilatiorcand culettagdrof uterus,
diagnostic 70 3 -Complete and radical mastectomy ... . 65.3-65.6,Hysterectomy 69.1-69.5Exploratory laparotemy or cejlotomy , . . .39.1Plastic repair of cystWale and/or
rectocele 71 4Oophorectorny, salpingo- , .?
oopliorectornY ,67.2-67.5Cardiac catheterization 30 2 `1Arthroplasty of hip 87 0 19Dilation of urethra 57 5 18Local excision and destruction-of lesion of
bladdir 56.1-56.2 18Ileostomy, colostomy, and other .
enterostomy 47.7-47.9 -17Partied mastectomy f 65 2 16Operations of periphdral ne 04 16Repair and plastic operations o Joints of
foot and tool . ' 87 2Operations on musclei, tendons fascia,
and bursa 88-891
15Skin graft except lip and mouth . . . 93 2-93.6 15Repair of Inguinal hernia 38.2-38.3 12All other residual 669
I
Number Percentin thousands, distribution
oBlack -and till other-Con.
1005 Biopsy ',- A1-A2 I - 11 9AExtraction of dens ----'. 14.4-14.6 10 8.3 'Insertign or replacement of electric heart .
device 30.4-30.5 4 3.6Excision of lesion of skin and subcutaneous
tissue 92.1-92.2 4Exploratory lapprotomy or celiotomy . . . .39.1 .4Reduction of frixture with fixation . . , . . .82.2 4,.
2.8 Choiecystectomy . 43 5 ' 4. 0Dilation and curtage of uterus,
.2.4- diagnostic . 70 3 3 2.7All other residual 73 62.4 .
150134 8.0120 7.259 3.5
41- '.2.8
47k
41
41
37343329
3.4
3.43.43.0
25 ,
2222
15
Black and all other
All procedures .
1So.reference 15.
46
'4
.1/4,
.1
1
117
ti
e.
, 1.31.31.21.1
Race not stated
All procedures A, 284. ... ,Extractiorrof lens 14.4-14,6 30 10.6Biopsy A1-A2-- 20 7.2Reduction of fracture with fixation 822 19 6.8Resection of small intestine and
cplon '1'. 47.4-47.6 10 -Chollicystectomy 0 ,, .:43.5 . 9Insertion or replacement of electric heart
device 30.4-30.5 7Excision of lesipns of skin and subcutaneous IZi
1.1 tissue - ' .-.-.- 92.1-92.2 6Closed reduction-of fracture without
p24) 5 1.7fixationLocal excision and destruction ot lesion of
bladder .156.1156.2 5 1.7Exploratory iaparotomy or celipfomy . ..,':' .39.1' 5 1Z
0.9 Hysterictow/ 6g.. -69.5 5 1.Operations on muscles, tendons, fascia, .
and bursa , .88-89 4Complete and radical mastectomy 65 2 4Dilation and curettage, diagnostic 70 3 4Arthroplasty off" hip . 87 0 3Plastic repair 9 le and/or-
rectocele "71.'4All other r
.,....- residual
100.0
1.0 -1.0
3.63.2
2.4
2.1
0.90.9.0.7
40.0
100.0
1.5 '
1.41.4.1.2
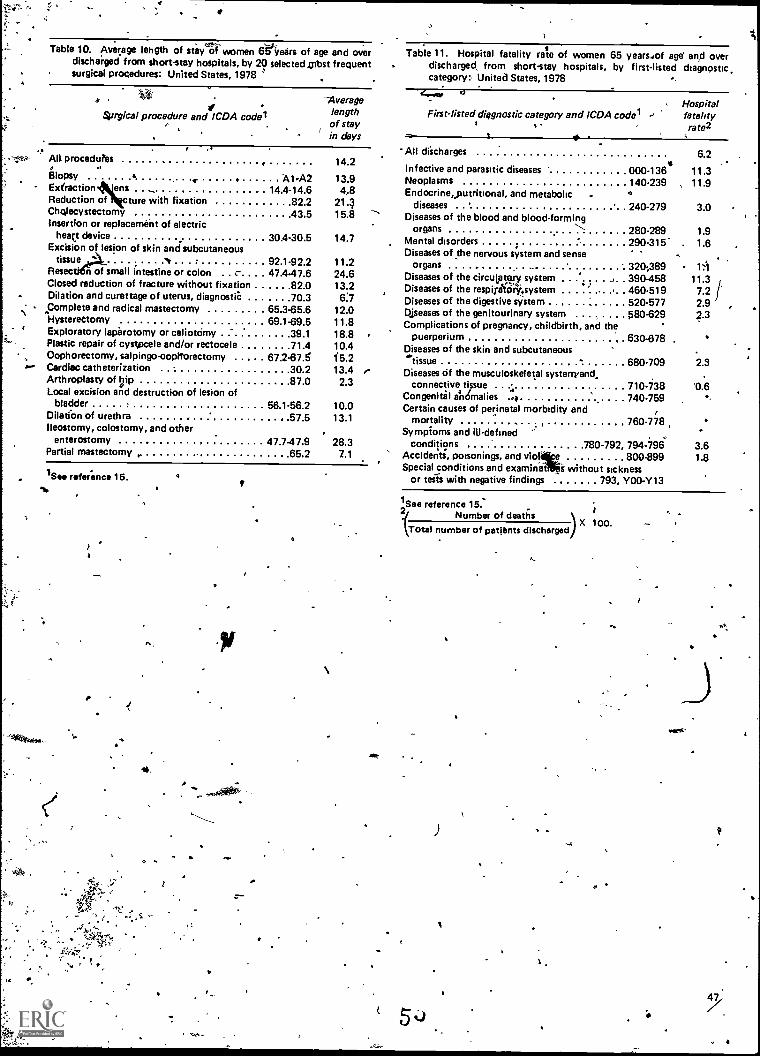
Table 10. Average lehgth of steyV women 65itetirs of age and overdischarged from short-stay hospitals, by 20 selected obst frequentsurgical procedures: United States, 1978
aSurgical procedure and ICDA codel
Averagelengthof stayin days
0
Table 11. Hospital fatality rate of women 65 years...of age' and overdischarged, from short-stay hospitals, by first-listed diagnostic.category: United States, 1978
4.er u
First-listed diagnostic category and ICDA codel.
Hospitalfatalityrate2
Alt procedutes
Biopsy 4Extraction ensReduction of ture with fixationChctlecystectomyInsertion or replacement of electric
hey deviceExcision of lesion of skin and subcutaneous
tissueResec n of small intestine or colon . . c-. .Closed reduction of fracture without fixationDilation and curettage of uterus, diagnostiC
Complete and radical mastectomyHystereCtomyExploratory laparotomy or celiotOmyPlastic repair of cystpcele and/or rectoceleOophorectomy, salpingooopttorectomyCardiac catheterizationArthroplasty of hipLocal excision and destruction of lesion of
bladderDilation of urethralleostomy, colostomy, and other
enterostomyPartial mastectomy ,
A1-A214.4-14.6
82 243.5
30.4-30.5
92.1-92.2. 47.4.47.6
..82.070.3
65.3-65.669.1-69.5
39 171 4
67.2-67.530 287 0
56.1-56.257 5
47.7.47.965 2
14.2
13.94.8
21.315.8
14.7
11.224.613.26:7
12.011.818.810.415.213.42.3
10.013.1
28.37.1
,
..-
,
All discharges
Infective and parasitic diseases 000 -136'Neoplasms 140-239 ,
Endocrine,putritional, and metabolic 4
diseases 240.279Diseases of the blood and blood-forming
organs ,,,280-289
Mental disorders 290.315-.Diseases of the nervous system and sense
organs 320;389Diseases of the circulatory system , 390-458Diseases of the respirittinlritsystem
,,
460.519Diseases of the digestive system 520.577Diseases of the genitourinary system 580-629Complications of pregnancy, childbirth, and the
puerperium 630-678Diseases of the skin and subcutaneous'tissue .. 680.709Diseases Of the musculoskeletal systerryand,
connective ti sue :. 710-738Congenital a'n6malies ... 740-759Certain causes of perinatal morbidity and
mortality 760.748Sympioms and ill-defined
conditions 780-792, 794 -796Accidents, poisonings, and via e 800.899Special conditions and examinat s without sickness
or tens with negative findings 793, Y00 -Y13
6.2
11.311.9
3.0
1.91.6
1:1
11.37.22.923
2.3
'0.6.,
3.61.8
41 See reference 15.
I
1 See reference 15:Number of deaths
Total number of patients discharged)X 100.
ti ag.
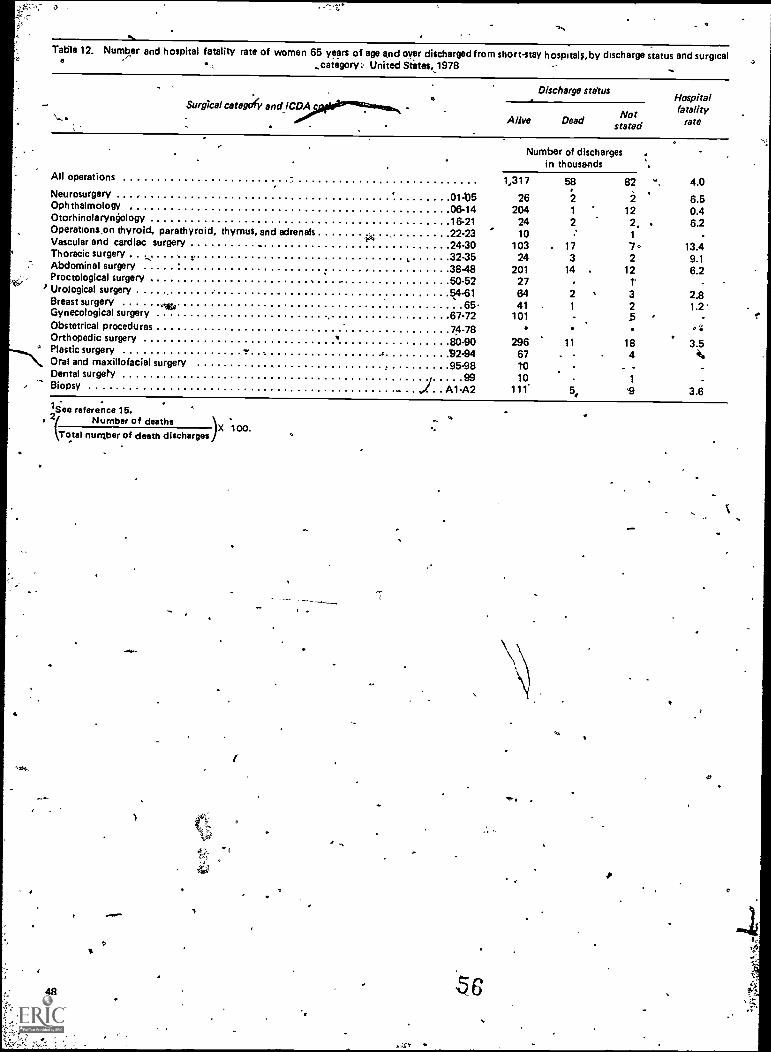
,
Table 12. Number and hospital fatality rate of women 65 years of age and over discharged from short-stay hospital ;, by discharge status and surgicala_category: United States.1978
Surgical category and fIC2A,4
Discharge statusHospitalfatality
rateNotAlive Dead stated
Number of dischargesin thousands
All operations 1,317 58 82 4.0Neurosurgery 01.05 26 2 2 6.5Ophthalmology 06-14 204 1 12 0.4Otorhinolaryntiology 16.21 24 2 2, 6.2Operations.on thyroid, parathyroid, thymus, and adrenalsVascular and cardiac surgery . ?4'...
22-2324-30
10 =
103 . 171
7.-
13.4Thoracic surgery .: i. 32-35 24 3 2 9.1Abdominal surgery 38-48 201 14 12 6.2Proctological surgery . 50-52 27 t -
' Urological surgery 54.61 64 2 3 2.8Breast surgery
oects 65. 41 1 2 1.2Gynecological surgery 67-72 101 5Obstetrical procedures 74.78 °kOrthopedic surgery 80-90 296 11 18 3.5Plastic surgery ....
c 92.94 67 . ... 4Oral and maxillofacial surgery
, 95-98 tO - -Dental surgery 99
.
10 1Biopsy 1.. A1-A2 11 5, 9 3.6
1See reference 15..
2jNumber of deaths .
100.Total number of death discharges
)X
sO
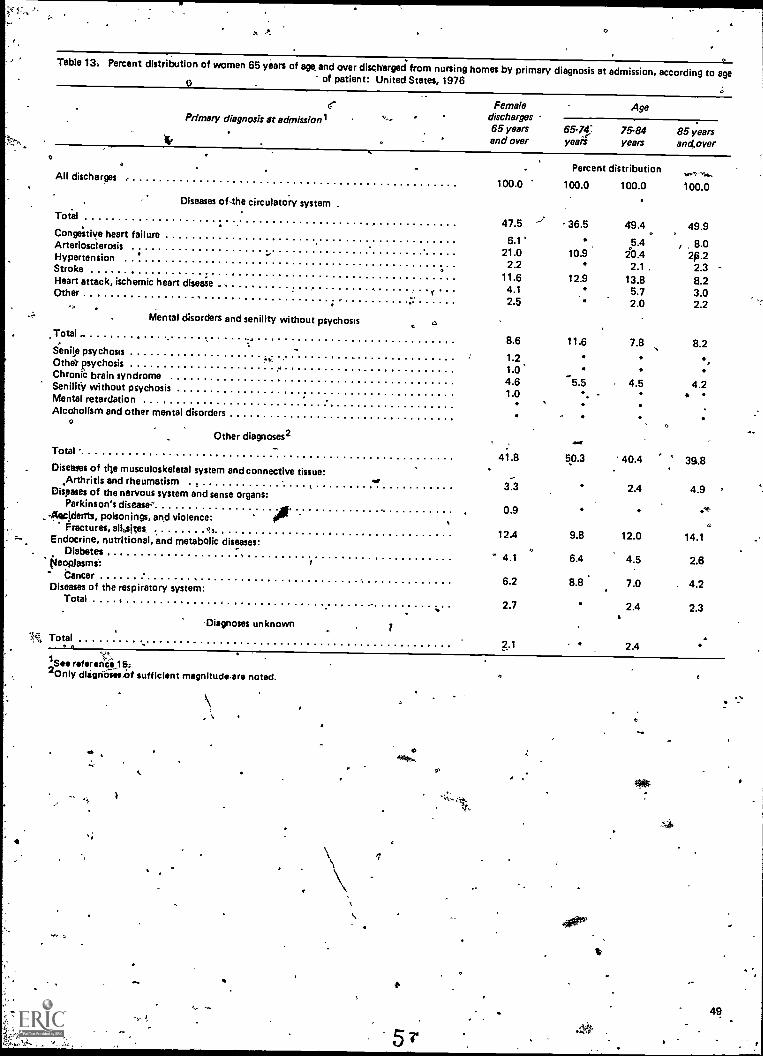
0
Table 13, Percent distribution of women 65 years of age and over discharged from nursing homes by primary diagnosis at admission, according to age0 of patient: United States, 1976
Primary diagnosis zit admissionlFemale Age
discharges65 years 65-74- 75-84 85 years,..,and over years years andover
Percent distribution...--- ....All discharges
100.0 100.0 100.0 100.0
Diseases of-the circulatory systemTotal
47.5 ../. 36.5 49.4 . 49.9Conge'stlye heart failure
6.1 5.4 , 8.0Arteriosclerosis' ... 21.0 10.9 20.4 2,0.2Hypertension
2.2 2.1 , 2.3Stroke11.6 12.9 13.8 8.2Heart attack, ischemic heart diseiie . -.4.1 5.7 3.0Other , 2.5 2.0 2.2
Mental disorders and senility without psychosis aTotal
8.6 11.6 7.8 8.2Sense psychosis
1.2Othel psychosis1.0Chronic brain syndrome4.6 5.5 4.5 4.2Senility without psychosis1.0 *.Mental retardation
Alcoholism and other mental disorders
Other diagnoses2 ."Total
41.8 50.3 40.4 35,8Disetoes of the musculoskeletal system and connective tissue:
Arthritis and rheumatism . ,. I 3.3 2.4 4.9 °Diseases of the nervous system and sense organs:Parkinson's disease,'
.. . 0.9 .41i--4ePidents, poisonings, and violence:
Oractures, allosites ,412.4 9.8 12.0 14.1Endocrine, nutritional, and metabolic diseases:
.Diabetes ' 4.1 6.4 4.5 2.6fsleopJasmi:Cancer
6.2 8.8 7.0 . 4.2Diseases of the respiratory system:Total . . ,
2.7 2.4 2.3
-Diagnoses unknown
N Total2-1 2.4
1See refaranCis15:2 Only dlignosecisf sufficient magnitudeare noted.
O
49
..
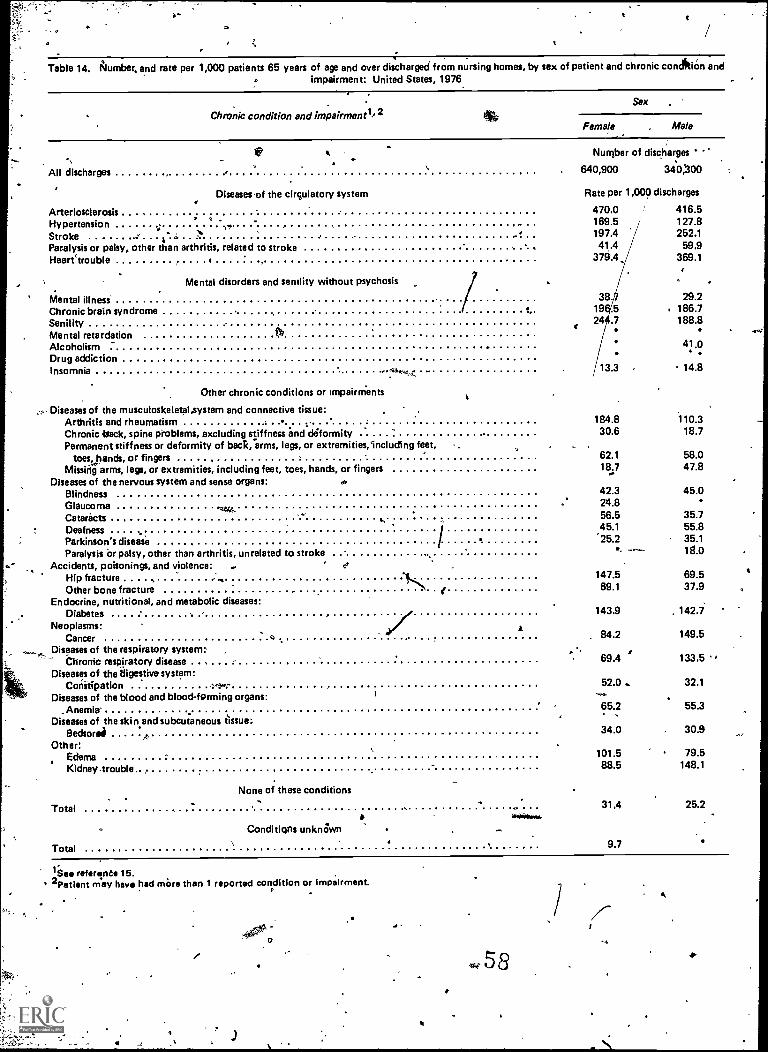
114
o
Table 14. Number, and rate per 1,000 patients 65 years of age and over discharged from nursing homes, by sex of patient and chronic conclitiOn andimpairment: United States, 1976
Chronic condition and impairtnent1,2Sex
Female . Male
All discharges
Arteriosclerosis .HypertensionStroke ....... . -
Paralysis or palsy, other than arthritis, related to strokeHearetrouble
Diseases of the circulatory system
Mental disorders and senility without psychosis
Mental illnessChronic brain syndromeSenilityMental retardationAlcoholismDrug addictionInsomnia "=1--;*;
Other chronic conditions or impairnients
Diseases of the musculoskeletalaystem and connective tissue:Arthritis and rheumatismChronic back, spine problems, excluding stiffness and deformityPermanent stiffness or deformity of back, arms, legs, or extremities,including feet,
toes, hands, or fingersMissing arms, legs, or extremities, including feet, toes, hands, or fingers
Diseases of the nervous system and sense organs:BlindnessGlaucoma oe...CataractsDeafness .Parkinson's diseaseParalysis or palsy, other than arthritis, unrelated to stroke
Accidents, poisonings, and violence:Hip fractureOther bone fracture
Endocrine, nutritional, and metabolic diseases:Diabetes
Neoplasms:Cancer
Diseases of the respiratory system:Chronic respiratory disease
Diseases of the ?figestive system:Constipation
Diseases of the blood and blood-forming organs:_Anemia .
Diseases of the skin tissue:subcutaneous tssue:Bedsorei -4
Other:EdemaKidney-trouble.
None of these conditions
Total
Conditions unknown
Total
lie. referent. 15.2Patient may have had more than 1 reported condition or impairment.
Number of discharges '
640,900 340,00
Rate per 1,000 discharges
470.0 416.5169.5 127.8197.4 252.141.4 59,9
379A, 369.1
38 29.219 .5 186.724 .7 188.8
41.0
13.3 14.8
184.8 110.330.6 18.7
62.1 58.018.7 47.8
42.3 45.024.856.5 35.745.1 55.825.2 35.1- 18.0
147.5 69.569.1 37.9
a
143.9 142.7
84.2 149.5
69.4 133.5
52.0. 32.1
65.2 55.3
34.0 30.9
101.5 79.588.5 148.1
31.4 25.2
9.7
e0
,
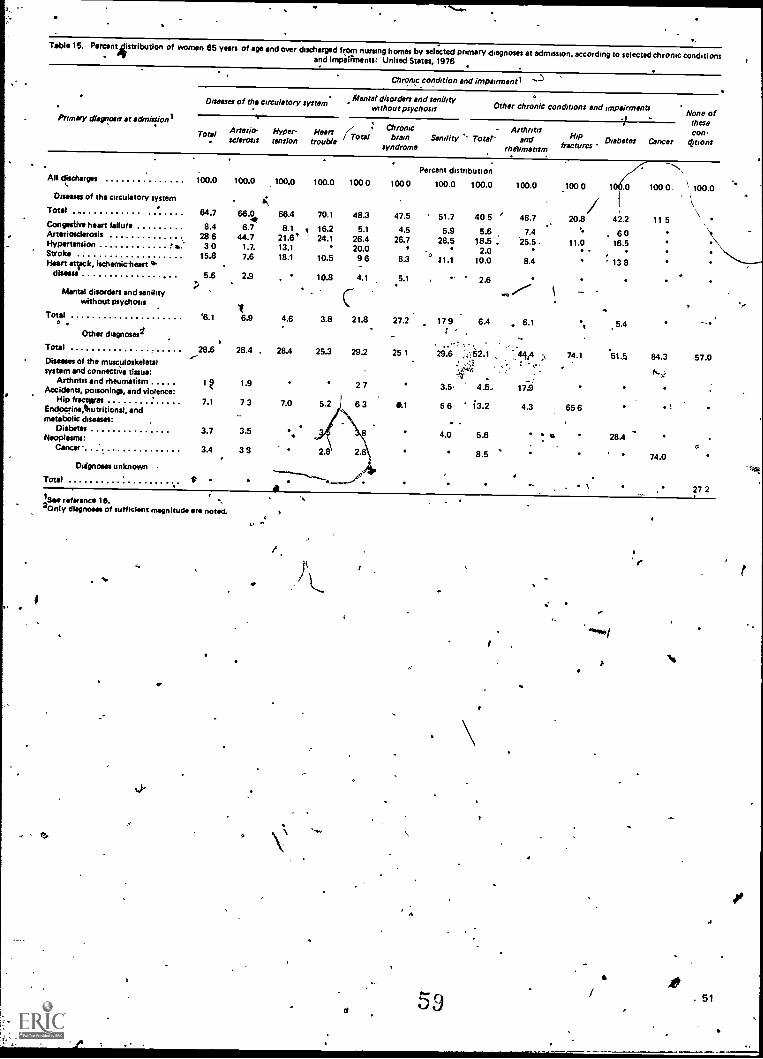
Table 15. Percent jistribution of women 65 years of age and over discharged from nursing homes by selected primary diagnoses at admission, according to selected chronic conditions- orand impairments: United States, 1976
Primary dhrsr oafs at edmillonl
Chronic condition and impairment)
enta disorders and senilityM l'Diseases of the circulatory systemOther chronic conditions and impairmentswithout psychosis None of
Total (TotalArterio- Hyper- Heartse /crass tension trouble
.
All discharges 100.0 100.0 100.0 100.0 100 0lDiseases of the circulatory system . i..
Total .. 64.7 66.0 66.4 70.1 48.3Congestive heart failure 8.4 6.7 8.1 . 16.2 5.1Arteriosclerosis 28 6 44.7 21.6' 24.1 26.4..Hypertension b. 3 0 1.7. 13.1 20.0Stroke 15.8 7.6 18.1 10.5 9 6Heart snack. ischemicheart 'a
disease
Mental disorders and senilitywithout psychosis
5.6 2.9 10.8 4.1,
Total '6.1 6.9 4.6 3.8 21.80
Other chagnoses1
Total 28.6 26.4 . 28.4 25.3 29.2Diseases of the musculoskeletalsystem and connective tissue:
Arthritis and rheumatismAccidents, poisonings, and violence:
Hip fractslresEndocrine,thutritional, andmetabolic diseases:
Diabetes 3.7 3.5Neoplasms:
Cancer- 3.4 33
Diignoms unknown
1 t9 1.9 2 7
7.1 7 3 7.0 5.2 1 6 3
Total
2.8' 2.6
19 ''''''''... .-/ik
tNi ,"as reference 15.
Only diagnoses of sufficient magnitude are noted. .
Chronicbrain
syndrome
-Senility 's niter-
100 0
47.5
4.526.7
8.3
Percent distribution
100.0 100.0
51.7 40 5
5.9 5.628.5 18.5.
'0 2.011.1 10.0
5.1 ' 2.6
27.2 17 9 6.4
25 1 29.6
3.5
wi-,
4.5.
0.1 6 6 13.2
4.0 5.6
8.5
Arthritisand
rheumatism
100.0
' 48.7
7.425.5.
8.4
6.1
17.9
4.3
1 these
Hip Diabetesfractures Cancer
COO.
damns
'
\\*°`-.--.
.100 0
20.8
"11.0
1/,
,
0
42.2
6016,5
13 8
100
11
0.
5
.
',
100.0
\
-.
5.4
74.1 .514 84.3 57.0
65 6 1
28.4
74.0
\27 2
59 . 51
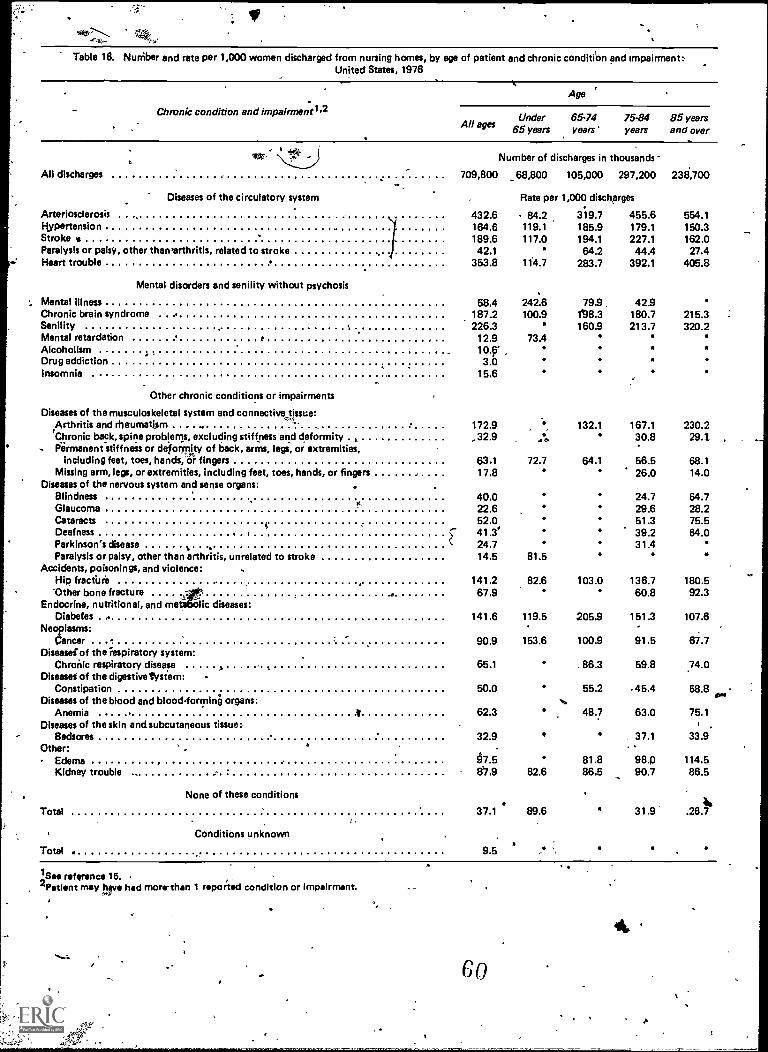
vtt
Table 16. Nuniber and rate per 1,000 women discharged from nursing homes, by age of patient and chronic condition and impairment:United States, 1976
Chronic condition and impairmentl
Age
All agesUnder
65 years65'74years'
75-84years
85 yearsand over
All discharges
Diseases of the circulatory system
709,800
Number of discharges in thousands
_68,800 105,000 297,200
Rate per 1,000 dischprges
238,700
Arteriosclerosis 432.6 84.2 319.7 455.6 554.1Hypertension . 164.6 119.1 185.9 179.1 150.3Strokes 189.6 117.0 194.1 227.1 162.0Paralysis or palsy, other thawarthritis, related to stroke 42.1 64.2 44.4 27.4Heart trouble 353.8 114.7 283.7 392.1 405.8
Mental disorders and senility without psychosis
Mental illness 58.4 242.6 79.9. 42.9Chronic brain syndrome 1872 100.9 1138.3 1807 2152Servility 226.3 160.9 213.7 320.2Mental retardation 12.9 73.4Alcoholism 10.9'Drug addiction 3.0Insomnia 15.6
Other chronic conditions or impairments
Diseases of the musculoskeletal system and connective tissue:Arthritis and rheumatism 172.9 132.1 167.1 230.2'Chronic back, spine problems, excluding stiffness and deformity , 32.9 .11 30.8 294Permanent stiffness or deformity of back, arms, legs, or extremities,
including feet, toes, hands, or fingers 63.1 72.7 64.1 56.5 68.1Missing arm, lege, or extremities, including feet, toes, hands, or fingers -17.8 26.0 14.0
Diseases of the nervous system and sense organs:Blindness 40.0 247 64.7Glaucoma 22.6 29.6 28.2Cataracts 52.0 512 75.5Deafness . 41.3 39.2 64.0Parkinson's disease
N
Paralysis or palsy, other than arthritis, unrelated to stroke24.714.5 81.5
31.4
Accidents, poisonings, and violence:Hip fracture 141.2 82.6 103.0 136.7 180.5Other bone fracture 67.9 60.8 92.3
Endocrine, nutritional, and me lic diseases:Diabetes . 141.6 119.5 205.9 1512 107.6
Neoplasms:Cancer 90.9 153.6 100.9 91.5 67.7
Diseasei of the respiratory system:Chronic respiratory disease 65.1 86.3 59.8 74.0
Diseasei of the digestive tysie m:Constipation 50.0 55.2 45.4 58.8
Diseases of the blood and blood-forming organs: N.ovoo
Anemia 62.3 48.7 63.0 75.1Diseases of the skin and subcutaneous tissue:
Bedsores 32.9 37.1 33.9.Other:
Edema 67.5 81.8 98.p 114.5Kidney trouble 8'7.9 82.6 86.5 90.7 86.5
None of these conditions
Total 37.1 89.6 31.9 .26.741,
Conditions unknown
Total . 9.5
/Soo reference 15. '2 Patient may have had morrthan 1 reported condition or impairment.
52 .
Go
44.
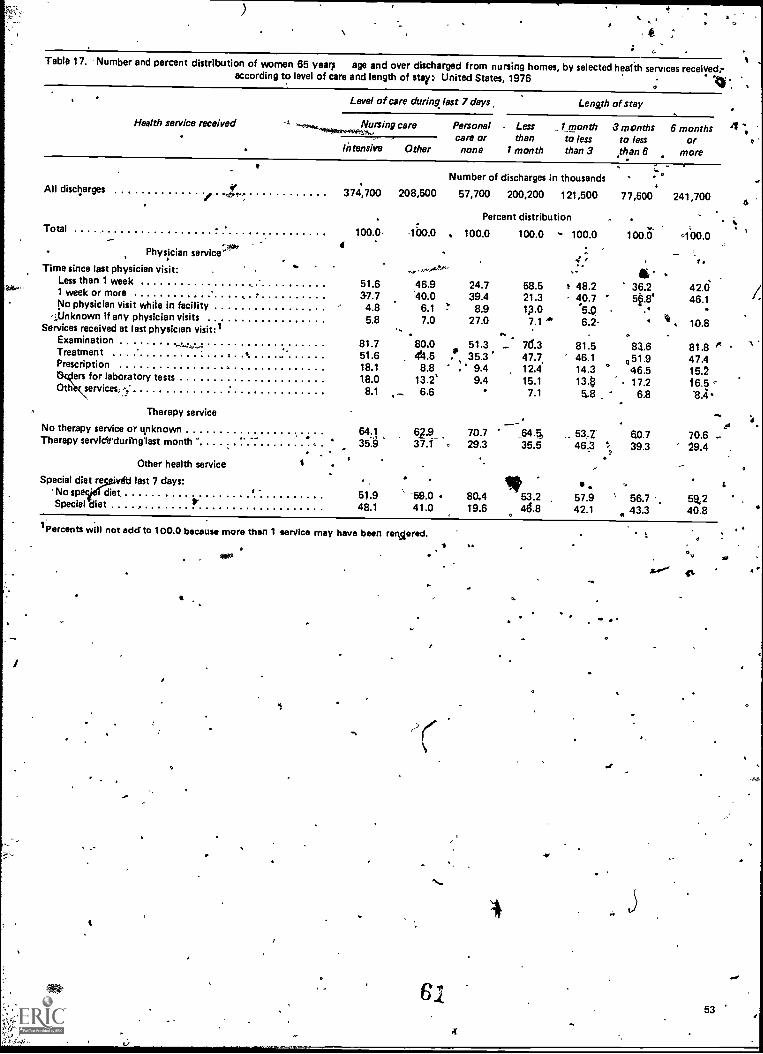
Table 17. 'Number and percent distribution of women 65 years age and over discharged from nursing homes, by selected health services receivedraccording to level of care and length of stay: United States, 1976
o
Level of care during last 7 days Length of stay .
AU discharges
Health service received
Therapy service
Number of discharges in thousands
374,700 208,500 57,700 200,200 121,500
Nursing care Personal . Less _1 monthcare or than to less
Intensive Other none 1 month than 3
Percent distributionTotal . 6
100.0, 1"00.0 . 100.0 100.0 - 100.04' Physician service:`
1:.. ....-rt, v.Time since last physician visit: ...-Less than 1 week 51.6 46.9 24.7 58.5 r 48.21 week or more 37.7 40.0 39.4 21.3 40.7No physician visit while in facility 4.8 6.1 !" 8.9 1,3.0 '54
<:;,Unknown if any physician visits 5.8 7.0 27.0 7.1 6.2-Services received at last physician visit:1 .. .
Examination 81.7 80.0 51.3 - 7(1.3 81.5Treatment . 51.6 41.5 .* 35.3 47.7. 46.1Prescription , 18.1 8.8 , 9.4 12.4 14.3
15\ers for laboratory tests
0th services..118.0 13.2'
8.1 _ 6.69.4 15.1
7.113.85.8
No therapy service or unknown 64.1 62.9_ 70.7 .,644 ,.. 53,2"Therapy servicirdurfngast month 35".9 37.1 . 29.3 35.5 46.3
-.
Other health service ISpecial diet re last 7 days: It .
No sp diet r - 51.9 ' -59.0 80.4 53.2 57.9Special diet P 48.1 41.0 19.6 46.8 42.1
1Percents will not edcf to 100.0 because more than 1 service may have been revered.
r
3
61
'NC
3 months 6 months 4 ..,to less or o
than 6 more
77,500 241,700
100.0 100.0
-r .
36.250.8.
..
83.6051.9
° 46.517.2
6.8
60.7', 39.3
°' 56.7
43.3
t
.42.046.1
It 10.8
81.8 1*47.415.216.5sA
70.6 ..29.4
t5%240.8
1.
53
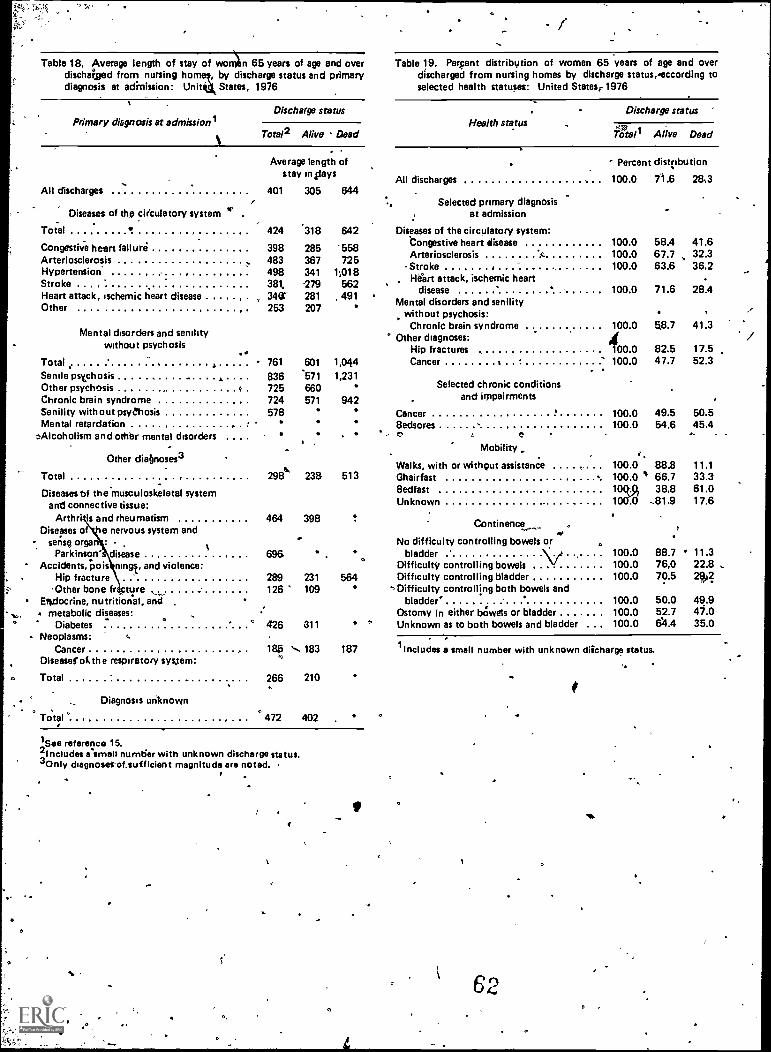
Table 18, Average length of stay of wonlbn 65 years of age and overdischaged from nursing homey, by discharge status and primarydiagnosis at adittission: Unit' States, 1976
Primary diagnosis at admissionlDischarge status
Total2 Alive Dead
All discharges
Diseases of the circulatory system
Total
Congestive heart failureArteriosclerosisHypertensionStrokeHeart attack, ischemic heart diseaseOther
.1"
Total 761
Senile psychosis 836Other psychosis c 725Chronic brain syndrome 724Senility without psychosis 578Mental retardation ,
Alcoholism and other mental disorders
Mental disorders and senilitywithout psychosis
Average length ofstay in4iays
401 305 644
-
Table 19. Perpent distribytion of women 65 years of age and overdischarged from nursing homes by discharge status,'eccording toselected health statuses: United States.. 1976
Health statusDischarge status
57ATotal Alive Dead
Percent dist(ibution
All discharges 100.0 71.6 28,3
Selected primary diagnOsisat admission
424 '318 642 Diseases of the circulatory system:
398 285'Congestive heart disease 100.0 58.4 41.6
483 367Arteriosclerosis A. 100.0 67.7 32.3
498 341Stroke 100.0 63.6 36.2
381 279, 1-14rt attack, ischemic heart
34( 281 491disease 100.0 71.6 28.4r ,
253 207Mental disorders and senility
without psychosis:Chronic brain syndrome 100.0 58.7 41.3
Other diagnoses:Hip fractures 400.0 82.5 17.5
601 1,044 Cancer 3 100.0 47.7 52.3
571 1,231660571 942
Cancer 100.0 49.5 50.5
558725
1;018562
Other diabnoses3
Total
Diseases bf theusculoskeletal systeman connective tissue:
Arth is and rheumatism 464 398Diseases o e nervous system and
- sense orgy :
Parkinson' disease 696' Accidents, pois rungs, and violence:
Hip fracture 289 231'Other bone fr cture 126 109
Endocrine, nutritional, andmetabolic diseases:
Diabetes ° 426 811
Selected chronic conditionsand impairments
Bedsores, t5
Mobility
Walks, with or without assistance ..298 238 513 Ghairfast
BedfastUnknown
Neoplasms:Cancer
Diseaserathe respiratory system:
Total
Diagnosis unknown
185 N.. 1830
266 210
0
Total . 472 402
Continence
No difficulty controlling bowels or
VbladderDifficulty controlling bowelsDifficulty controlling bladder
',Difficulty controlling both bowels andbladder'
Ostomy in either bclwels or bladder4, Unknown as to both bowels and bladder
100.0 54.6 45.4
100.0 88.8100.0 66.710r.r 38.81 I II
100.0100.0100.0
100.0100.0100.0
11.133.361.017.6
88.7 11.376,0 22.870.5 2(40?
50.0 49.952.7 47.0611.4 35.0
t87 lIncludes a small number with unknown diicharge status.
1,.See reference 15.`Includes risme!' number with unknown discharge status.3Only cbagnoserof,sufficient magnitude are noted.
r
62
Appendixes
ContentsI. Definitions of terms used in the National Ambulatory Medical Care Survey 56
Terms relating to the survey56
Terms relating to the Patient Record form-56
II. Definitions of terms tised.;irithe'National Hospital Discharge SurveyHospitals and hospital characteristiOS
5959
Terms relating to hOsiiitalization59
Terms relating to diagnoses59
Terms relating to surgery59
Demographic terms. 60
III.- Definitions of terms tied in the National Nursing Home Survey 61Terms relating to facilities
61Terms relating to discharges 61
IV. Questionnaires used.in the National Ambulatory Medical Care Survey, the National Hospital Discharge Survey, and the .National Nursing Home Survey 63
Patient Record and Patient Log' 63Medical Abstract 64Discharged Resident Questionnaire 65
63
4*
E
55
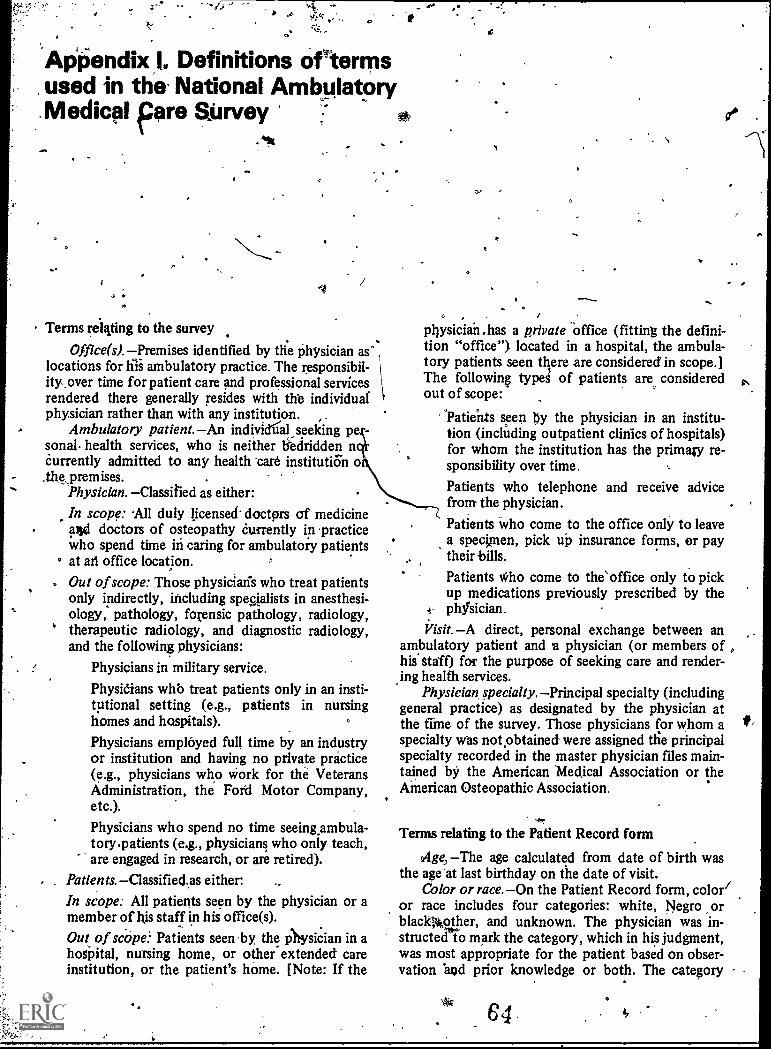
0
Appendix I. Definitions of termsused in the National AmbulatoryMedical fare Survey
0 0
a
Terms relqting to the survey
Office(s). Premises identified by the physician as"'locations for his ambulatory practice. The responsibil-ity.over time for patient care and professional servicesrendered there generally resides with the individualphysician rather than with any institution.
Ambulatory patient. An individUal seeking pesonal. health services, who is neither bidridden nCurrently admitted to any health card institution o.the premises.
Physician. Classified as either:In scope: All duly licensed- doctprs of medicineawl doctors of osteopathy Currently in practicewho spend time in caring for ambulatory patientsat aft office location.
Out of scope: Those physiciais who treat patientsonly indirectly, including specialists in anesthesi-ology, pathology, forensic pathology, radiology,therapeutic radiology, and diagnostic radiology,and the following physicians:
Physicians in military service.
Physicians whb treat patients only in an insti-tutional setting (e.g., patients in nursinghomes and hospitals).
Physicians employed full time by an industryor institution and having no private practice(e.g., physicians who work for the VeteransAdministration, the Ford Motor Company,etc.).
Physicians who spend no time seeing ambula-tory .patients (e.g., physicians who only teach,are engaged in research, or are retired).
Patients. Classifiedas either:In scope: All patients seen by the physician or amember of Ills staff in his office(s).
Out of scope: Patients seen by the physician in ahospital, nursing home, or other extended careinstitution, or the patient's home. [Note: If the
...plwsician .has a private office (fitting the defini-tion "office") located in a hospital, the ambula-tory patients seen there are considered in scope.]The following typed of patients are consideredout of scope:
°Patients seen by the physician in an institu-tion (including outpatient clinics of hospitals)for whom the institution has the primaiy re-sponsibility over time.
Patients who telephone and receive advicefrom the physician.
Patients who come to the office only to leavea specnen, pick up insurance forms, or paytheir bills.
Patients who come to the'office only to pickup medications previously prescribed by thephysician.
Visit. A direct, personal exchange between anambulatory patient and a physician (or members ofhis staff) for the purpose of seeking care and render-ing health services.
Physician specialty. Principal specialty (includinggeneral practice) as designated by the physician atthe time of the survey. Those physicians for whom aspecialty was not obtained were assigned the principalspecialty recorded in the master physician files main-tained by the American 'Medical Association or theAmerican Osteopathic Association.
Terms relating to the Patient Record form
Age, The age calculated from date of birth wasthe age 'at last birthday on the date of visit.
Color or race.On the Patient Record form, color/or race includes four categories: white, Negro orblackMther, and unknown. The physician was in-structed t mark the category, which in his judgment,was most appropriate for the patient based on obser-vation and prior knowledge or both. The category
64 1
f.
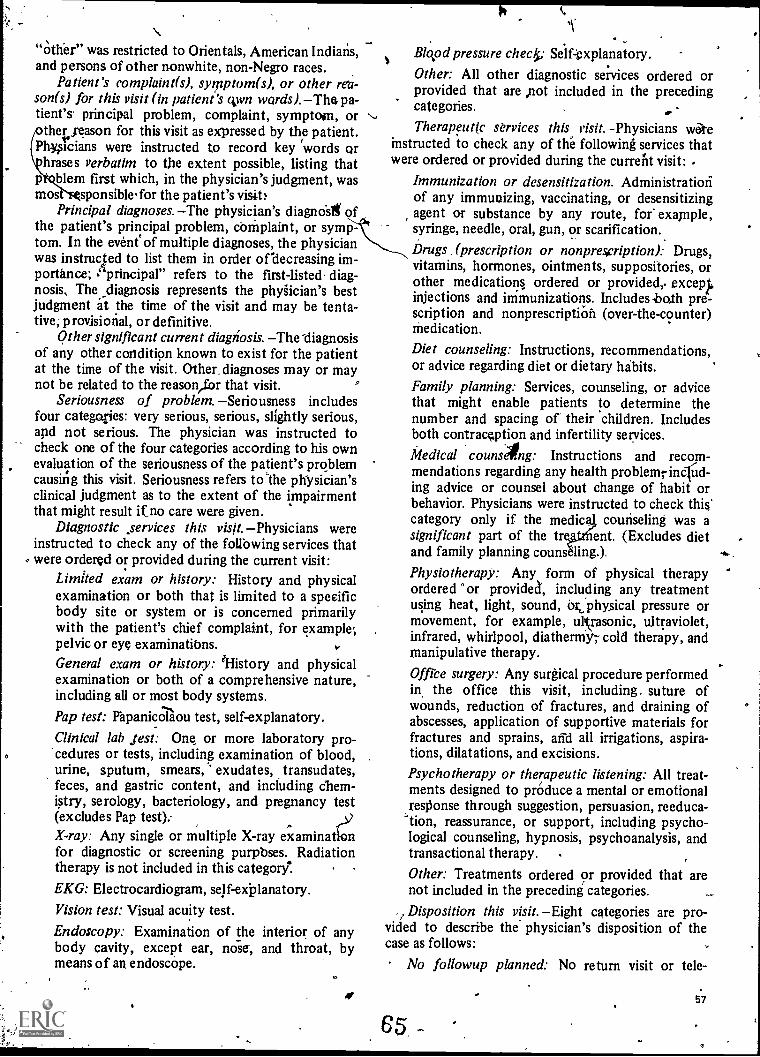
"Other" was restricted to Orientals, American Indians,and persons of other nonwhite, non-Negro races.
Patient's complaint(s), symptom(s), or other rea-sons) for this visit (in patient's qvn words). Thu pa-tient's principal problem, complaint, symptom, or
the, eason for this visit as expressed by the patient.Phoicians were instructed to record key words or
hrases verbatim to the extent possible, listing thatp blem first which, in the physician's judgment, wasmos sponsible for the patient's visits
Principal diagnoses. The physician's diagnoSt ofthe patient's principal problem, complaint, or symp-tom. In the event' of multiple diagnoses, the physicianwas instructed to list them in order of decreasing im-portance; ;principal" refers to the first-listed diag-nosis, The diagnosis represents the phygician's bestjudgment at the time of the visit and may be tenta-tive; provisional, or definitive.
Other significant current diagnosis. The 'diagnosisof any other condition known to exist for the patientat the time of the visit. Other, diagnoses may or maynot be related to the reasonefor that visit.
Seriousness of problem. Seriousness includesfour categories: very serious, serious, slightly serious,apd not serious. The physician was instructed tocheck one of the four categories according to his ownevaluation of the seriousness of the patient's problemcausing this visit. Seriousness refers to -the physician'sclinical judgment as to the extent of the impairmentthat might result it no care were given.
Diagnostic ;services this visit. Physicians wereinstructed to check any of the follbwing services thatwere ordered or provided during the current visit:
Limited exam or history: History and physicalexamination or both that is limited to a specificbody site or system or is concerned primarilywith the patient's chief complaint, for example;pelvic or eye examinations.General exam or history: %story and physicalexamination or both of a comprehensive nature,including all or most body systems.
Pap test: PapanicZou test, self-explanatory.Clinical lab jest: One or more laboratory pro-
. "cedures or tests, including examination of blood,urine, sputum, smears, exudates, transudates,feces, and gastric content, and including chem-istry, serology, bacteriology, and pregnancy test(excludes Pap test):X-ray: Any single or multiple X-ray examinationfor diagnostic or screening purpbses. Radiationtherapy is not included in this category*.
EKG: Electrocardiogram, self - explanatory.
Vision test: Visual acuity test.
Endoscopy: Examination of the interior of anybody cavity, except ear, nose, and throat, bymeans of an endoscope.
Blvd pressure che4. Self-explanatory.Other: All other diagnostic services ordered orprovided that are not included in the precedingcategories. .Therapeutic services this risit.Physicians we
instructed to check any of the following services thatwere ordered or provided during the current visit: .
Immunization or desensitization. Administrationof any immunizing, vaccinating, or desensitizingagent or substance by any route, for example,syringe, needle, oral, gun, or scarification.
Drugs 1 prescription or nonprescription): Drugs,vitamins, hormones, ointments, suppositories, orother medications ordered or provided,. exceptinjections and immunizations. Includes both pre-scription and nonprescription (over-the-counter)Medication.
Diet counseling: Instructions, recommendations,or advice regarding diet or dietary habits.
Family planning: Services, counseling, or advicethat might enable patients to determine thenumber and spacing of their children. Includesboth contraception and infertility services.Medical counslng: Instructions and recom-mendations regarding any health problemrincfut-ing advice or counsel about change of habit orbehavior. Physicians were instructed to check this.category only if the medic counseling was asignificant part of the tr ent. (Excludes dietand family planning couns
Physiotherapy: Any form of physical therapyordered °or provide', including any treatmentusing heat, light, sound, of phy,sical pressure ormovement, for example, ullrasonic, ultraviolet,infrared, whirlpool, diatherniY-; cold therapy, andmanipulative therapy.
Office surgery: Any surgical procedure performedin the office this visit, including. suture ofwounds, reduction of fractures, and draining ofabscesses, application of supportive materials forfractures and sprains, mit all irrigations, aspira-tions, dilatations, and excisions.
Psychotherapy or therapeutic listening: All treat-ments designed to prOduce a mental or emotionalresponse through suggestion, persuasion, reeduca-tion, reassurance, or support, including psycho-logical counseling, hypnosis, psychoanalysis, andtransactional therapy. .
Other: Treatments ordered or provided that arenot included in the preceding categories.
V
?Disposition this visit. Eight categories are pro-vided to describe the physician's disposition of thecase as follows:
No followup planned: No return visit or tele-
6 5
phbne contact was scheduled for the patient'sproblem.
Return at specified time: Patient "was told toschedule an appointment or was instructed to'return at a particular time.Return if needed, P.R.N.: No future appointmentwas made, but the patient was instructed to.makean agpointment%ith the physician if the, patieftconsidered it necessary.
Telephone followup planned: Patient- was in-structed to telephone the physician on a partic-ular day to, report on his progress or to telephoneifthe need, arose.Referred to other physician: Patient was in
I
58
t
structed to consult or seek care from anotherphysician. The patient may or may not return tothis physician at'a later date.
Returned to, referring phygician: Patient wask referred to irtirg`physician and was now instructed
to consult again with the physician who referredhim.
Admit to hospital: Patient was instructed thatfurther care or treatment would be provided in ahospital. No further office visits were expectedprior to that admission.
Other: Any other disposition' of the case notincluded in the previous categories.
66
4
b
Appendix II. Definitions ofterms used in the NationalHospital Discharge Survey
4
Hospitals and hospital characteristics
Hospitals. Short-stay especial and general hospi-tals having six beds or more for inpatient use and anaverage length of stay of less than 30 days. Federalhospitals and hospital units of institutions are notincluded.
, Terms relating to hospitalization
"Patient. A person who is formally admitted tothe inpatient service of a short-stay hospital forobservation, care, diagnosis, or treatment. 1i thisreport the number of patients refers tope number ofdischarges during the yeark including any multipledischarges of the same individual from one short-stayhospital or more. Infants admitted on the day ofbirth, ,directly or by transfer from another medicalfacility, with or without mention of, a disease,disorder, or immaturity are included. All 'newborninfants, defined as those admitted by birth to thehospital, are excluded. The terms "patient' and"inpatient" are used synonymously.,
Discharge. The 'formal release of a patient by ahospital; that is, the terminatioll of a period ofhospitalization by death or by disposition to place ofresidence, nursing home, or another hospital. Theterms "dis-charges" and "patients discharged" areused synonymously. -
Discharge Fate. The ratio of the number ofhospital discharges during a year to the number ofpersons in the total resident population on July 1 ofthat year.
'Days of care. The total number of patient daysaccumulatdd at titne of discharge by patients' dis-charged from short-stay hospitals during a year. Astay of 'less than 1 day (patient admission anddischarge on the same day) is counted as 1 day in thesummation of total days of care. For patientsadmitted and discharged on different days, thenumber of days of care is computed by counting all
TT'
:*
days' from (and ,including) the date of, admission to(but not including) the date of discharge.
Average length of stay. The total number ofpatient days accumulated at time of discharge bypatients, discharged during the year divided by thenumber of patients discharged.
Terms relating to diagnoses
Discharge diagnoses. One or more diseases orinjuries (or special conditions and examinations with-out sickness or tests'with negative findings) tha(dtheattending physician assign§ to they medical recor ofpatients. In the NHDS all discharge (or final) diag-noses listed on the face sheet (summary sheet) of themedical record for patients discharged from theihpatient. service of short-stay hospitals are tran-scribed in the order listed. Each sample discharge isassigned a maximum of five 3- or 4 -digit codes
.according to the Eighth Revision International Classi-fication of Diseases, Adapted for Use- in the UnitedStaths (ICIYA),15 and coding modifications for use inthe NHDS. The number. of principal eLfitit-listeddiagnoses is ctquivalent to the number of discharges.
First-listed diagnosis. The .coded diagnosis eitheridentified as the principal diagnosii or listed first onthe face sheet of the medical record. The number offirst-listed diagnoses is equivalent to the number ofdischarges.
All-listed diagnoses. ;First- listed diagnosis and allother diagnoses in positions 2-5 on the face sheet ofthe medical record.
Ternis relating to surgery
Discharges with slurgery. The estimated numberof surgically treated patients discharged from non-Federal short-stay hospitals during the year.
Operation. One or more surgical operations, pro-cedure's, or special treatments that are assigned by thephysician to the medical record of patients discharged
59 1
from the inpatient service of short-stay ho'spitals. Inthe NHDS, all terms listed on the face sheet (sum-mary sheet) of 'the medical record under the captions"operation," "operative procedures," "operationsand/or special treatments," and the like are tran-scribed in the order listed. A maximum of three3-digit codes' is assigned per sample discharge accord-ing to ICDA and NHDS directives.
All-listed operations. 4.11 coded operations listedin': positions, 1-3 on the face sheet of the medicalrecord exclusive of certain obstetrical procedures,diagnostic endoscopy and radiography, radiotherapy,
\z,
60
and certain other treatments not generally consideredas surgery.
Demographic termsAge. Patient's age recIrs to age at birthday prior
to admission to the Hospital inpatient service.Race. Patients are classified into /two racial
.-groups, "white" and "black and all other." The blackand, all other claisification includes'. all categoriesother thap white. 'Mexican and Puerto Ricincluded in the white category unless speei
identified as all other..
9.
.
I
-
Appendix HI. Definitions ofterms used in the NationalNursing Home Survey
Tegms relating to facilities
Facility.Nursing homes included in the 1977National Nursing Home Survey were those classifiedby, the -1973 Master Facility Inventory (MFI) asnursing care homes, personal care homes with nurs-ing, personal care homes, 'and domiciliary homes.Also included are nursing homes that opened forbusiness between the time the 1973 MFI was con-ducted and December 1'976. A nursing home musthave three beds or more and may be either free-standing or a distinct unit of a larger facility.
TernwcetatingAo;discharges
piichaivc;-=-:iseharge Is a, person who wasformally: .4146*0.7.t.Tri* 'a nursing home during1976. Both' live and dead disCharges are included.,
"Theoretically, the same person ,Can be counted morethan once if he was discharged more than once from anursing home during 1976.
Age. The age of a discharge is. his age at the timeof discharge."`
, Discharge status. The discharge status is whetherthe person was' discharged from the nursing homealive or dead.
Length of stay. The length of:stay is the periodof time between the date of admission and the dateof discharge.
Luting arrangement after discharge for,live dis-charge. The living arrangement after discharge refersto; The residence where the person lives after beingdischarged.
* Another nursing home. Another nursing homeincludes domiciliary .or ,personal tare facilities,intermediate care facilities, and skilled nursingfacilities.
Other health, facility. Other health facility in-cludes chronic disease, rehabilitation, geriatricand other long-term care hospitals, and facilitiesfor the mentally retarded:trivate or semiprivate residence. Private or semi-priVate residence includes houses or apartments,
I-0
rented rooms, boarding houses, and retirementhomes.
"Mar,yal status at time of discharge. Marital.statusis the marital situation of the discharge at the time ofhis release froin the nursing home.
Health Services,
Level of care received. These levels of care aredefined by the nursing services actually receivedby the discharge during the 7 days prior to thedischarge date. Based on the services listed in item,11 and responses to item 10b of the DischargedResident Questionnaire, the following classifica-tions were made. Each succeeding level is exclu-sive of the previous levels:
Intensive nursing .care. Intensive nursing careA includes receiving at least one of the following
services:
Bowel/bladder retrainingCatheterizationFull bed bathIntravenous injectionsOxygen therapy -
Note that tube or intravenous feeding, included inthe comparable definition for residents; is notincluded in this definition.
Other nursing care. Other nursing care includesreceiving at least one of the following services:
Application of sterifeedressings or bandagesBlood presiure readingEnemaHypodermic injections
Irrigation
Temperature, pulse, or respiration check
Personal card or none.Personal..care includesreceiving at least one of the f011bwing services:
Medication prescribed at.last physician-visit
Rub or massage .
Special diet
7/1
1
64
63
None inclUdes those discharges who received noneof the preceding services.
Note that the, medication service in thisdefinition is not identical to that for residents(administration of treatment or medications).
* Furthermore; help with bathing, dressing, oreating (included in the comparable definitionfor residents)
s,is not included in this de-
n finition.Therapy service. Therapy service refers towhether the' discharge received any therapy serv-ices provided by a licensed, registered, or profes-sionally trained therapist. during the calendarmonth prior to the discharge. These services mayhave been provided either inside or outside thefacility.
'Time sinceblast physician visit. This is the lengthof time between the date of discharge and the lasttime the person saw a physician (M.D. or D.0.)while still a resident of the facility for treatment,medication, or examination.
Health Statusq
Activities of daily 'living. The activities of dailyliving were collected for dischirges in the areas ofcontinence and mobility only, based on informa-tion on the niedical record' concerning perform-ance at the.time of discharge.,,.
Continence
No difficulty. controlling bowels or blad-der. The discharge did not have anydifficulty in controlling either his bo,s_or bladder at the time of discliaige.
Difficulty ,controlling bowels. The dis-cha'rge had difficulty controlling his bow:elstat the time of discharge.
Difficulty controlling bladder. The dis-charge had difficulty controlling his 'blad-der at the tiffie of discharge.
Ostomy in either bowels or bladder. Thedischarge had undergone a surgical pro-cedure that resulted in the creation of anartificial opening for the elimination ofwaste.
Aktbilii5,
Walks with or without aSsistance. Thedischarge was able to walk at the 'time.ofdischarge, either with or without assist-ance of special equipment or anotherperson. This category excludes those dis-charges who were chairfest7bedfast, orwhose status was unknown.
t
ChairfaskThe discharge was confined toa chair when discharged: ,
62
Bedfast. The discharge was confined to abed when discharged.
Primary diagnosis at admission. The pri-mary diagnosis at admission was the onecondition reported by the nursing staffrespondent as the major diagnosis notedat the time of admission. The list ofconditions corresponds to the Eighth Re-vision International Classification of Dis-eases, Adapted for Use in the UnitedStates (ICDA),15 The respOndent re-ported the information based on thedisNarge's medical record.
Chronic conditions ..and impairments.=Chronic conditions and Impairments in-
t 'dude those long -term physical and mentalproblems of the discharge selected by thenursing staff respondent from a list of 37conditio,ns and impairments (see item 8 ofthe Discharged, Resident Questionnaire).The respondent based the selection on-acheck of the medical record. More thanone conditibh or impairment could bereported.
Special aids or devices used' This categoryincludes only thOse special aids or devicesused ona regular basis (see list in item 13 "of theDischarged Resident Questionnaire). Definitionsfor selected special aids and devices are presented:
Cuffs. Cuffs are hand or foot devices consist-ing of a fabric cuff that is placed around thewaist or ankle, with a second strap attachingthe cuff to a side-rail or belt. It isused to
%, protect the resident from injuring himself.
Geriatric chair. A geriatric chair is a paddedchair or a combination chair and ,table withsmall wheels and with `a,. high back. It isdesigned to support the resident.
Mechanical feeding device. A mechanical. feeding device is any adaptive equipipent thathelps the'resident to feed himself.
Posey belt or similar device. A posey Celt orsimilar device is. an apparatus that may beused either in a bed or a wheelchair to securechest, waist, or legs.
Walker. A ,walker is a device that the residentuses on his own to support himself whilewalking.
+r,
Other.Other special aids or devicesslings, artificial limbs, orthopedicshower chairs, page turners, and devicthan those listed in the tabtes.
NOTE: A list of references follows the 'text.
"0
eludehOei,.other
----
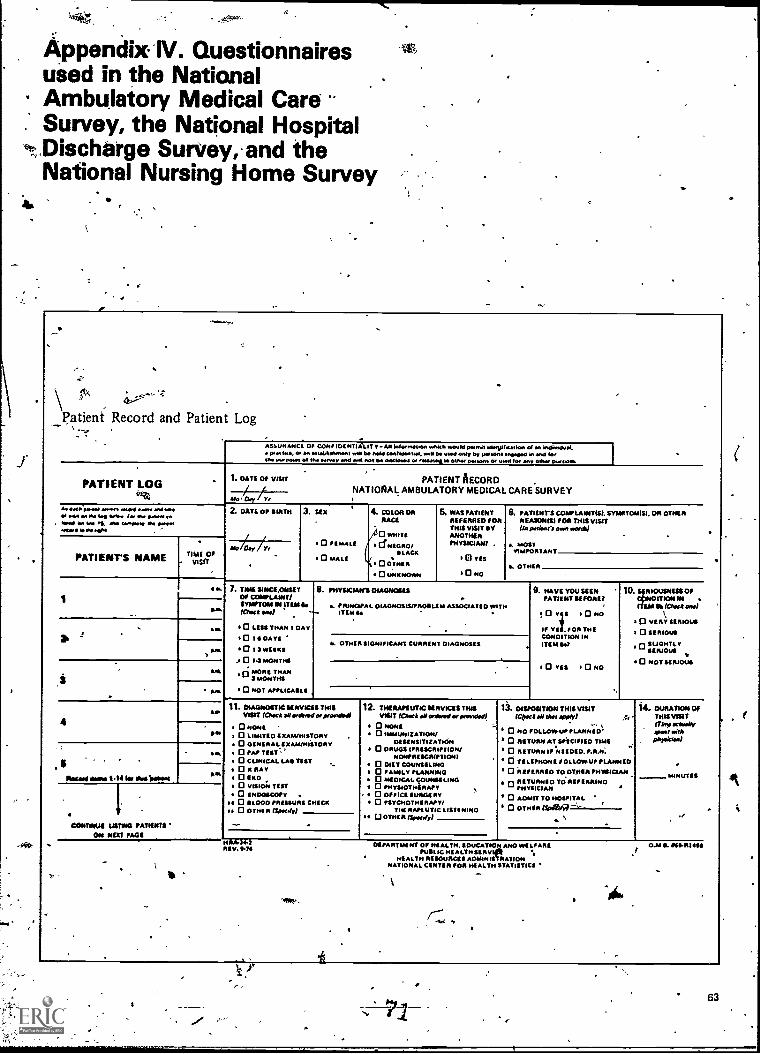
Appendix-IV. Questionnairesused in the NationalAmbulatory Medical CareSurvey, the National Hospital
eP?.,.Discharge Survey, and theNational Nursing Home Survey
4.
e
_f,tx
Patient Record and Patient Log
Alas./HAMM OF CONFMENTIAIIT v -All WO/ n01000 whatIt +.0.10 WWII 16810111LA WO of an indimPuMP.M We, 011.1 muIrm...H 1.M0 coollowo.1, il M woe only ov me/ in and 101
Ow IA+ PIMPS 011M 10nray and tIN not 00 deicloonl Or 10100140 0110./ fnusons Oe 01 +1 101 any Olhdy p.00016
PATIENT LOG1. DATE Of VISIT
OA, Cloy Yr
AI 0.11 anna ofe04 ma. and..ol wow MM 4. Wan /a/ IN 0.0001M
. 1001110 W 11., 00 1.0,010 011 000011440,1110100 .401
IPATIENT'S NAME TIV
04
2. DATE OF MIRTH
Me am T.,
3. sex
PATIENT AECORDNATIONAL AMBULATORY MEDICAL CARE SURVEY
0 FEMALE
0 moat
4. COLOR onRACE
/10 WHITEI CfNEGRO/
SLACK
0 °loon0 UNKNOWN
6. WAS PATIENTREFERREO FORTHIS VISIT KYANOTHERPHYSICIAN/ .
El vas
10 No
6. PATIENTS COMPLAINTISI. SYMPTOENST. ON OTHERREASON/Si FOR THIS VISIT
pationei own *Veda
MOSTVIMPO
S. OTHER
V. a
A011.
L A.
MA
7. TIME SINCILONSETOP COMPLAINT/SYMPTOM IN ITEM&/OM /
LESS THAN 1 DAY
1014 OATSQ 1 3 PAWLS
0 1.3 MONTHS
3/.0.ne TTIAN
0 NOT APPLICASLI
8. mysocinws oinonOseS
. PRINCIPAL OIAGNOSIS/PAMILIA ASSOCIATED WITHITEM S.
R OTHER SIGNIFICANT CURRENT DIAGNOSIS
9. HAVE YOU SEENPATIENT SEFORE?
!Ors 0 soIF VII, /OR THECONDITION INITEM SW
0 YES 0 NO
FIOUSNESS OFORLON IN
EMIIP (Chock awl
I Q VERY SERIOUS
I 0 SERIOUS
0SUGHTLY
0 NOT SERIOUS
4Pm
1Negmfmmii 5.14 Ill MINI1M/Mol
CONTINUE USTIOM PATIENTSON NM PAGE
11. DIAGNOSTIC SERVICES THISVISIT (Owat orolt.od prow411
0 NOME '
0 LIMITED SICALUisiSTORT0 Gs AWIMETOR V0 rAl,0 CLINICAL LAS UST0 X RAY0 IKCI0 VISION TILT
I 0 LNDOSCOPYs 0
0001RISSURS CHICK
w 0 WHIR 13/NOI//
WM.144REV. PM
12. THERAPEUTIC SERVICES TINSVISIT KAMA 41ordwei plooKhal
I 0 NONEI 0 IMMUNIZATION/
DITSINSITIZATION* 0 DRUGS IPRIScntrTiON/
NONPRESCRIPTION{0 DIET COUNSELING
I 0 FAMILY PLANNING0 MEDICAL cOusai Ewa0 PHYSIOTHERAPY0 OFFICE SURGERY0 PSYCHOTHERAPY/
TIARA/4 UTIC LISII MINGs °TOUR (Swesiy1
13. Onronvon THIS VISIT(Cpset Oa apply;
0 NO FOLLOVPUPPLANNIO0 RETURN AT SPECIFIED TIME
0 RETURN I/ *NEEDED. P.R.N.
TILIPHONE FOLLOWUP PLANNEDI 0 TO OTAIR PP/AMMAN
° 7414:17./C: 7"ING
0 ADMIT TO HOSPITAL
0 OTHER
s
DEPARTMENT OF HEALTH. EDUCATION AMOPUBLIC /HEALTH SIRV
HEALTH RESOURCES AMAMI:MATSONNATIONAL CENTER FOR HEALTH STATISTICS
14. DURATION OfTHIS VISIT
*awayAwn nit*"skim)
MINUTES
.1
0.M S. 114111411411111
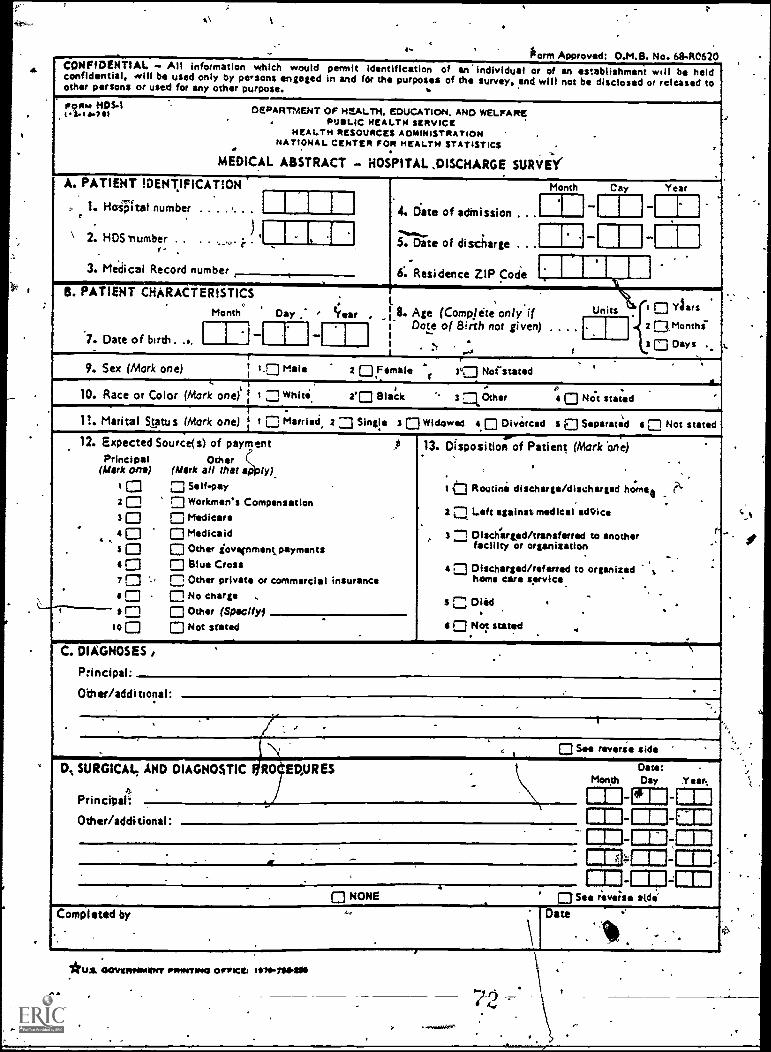
a CONFIDENTIAL -- All information which would permit Identification of an individual or of an establishment will be heldconfidential, will be used only by persons engaged in and fOr the purposes of the survey. and will not be disclosed or released toother persons or used for any other purpose.
,P.tigima.r!" DEPARTMENT OF HEALTH. EDUCATION. AND WELFARE, PUSLIC HEALTH SERVICE
HEALTH RESOURCES ADMINISTRATIONNATIONAL CENTER FOR HEALTH STATISTICS . ,a
MEDICAL ABSTRACT - HOSPITAL ,DISCHARGE SURVEY
A. PATIENT IDENTIFICATION Month Cay Year
1. HoiFtat number . I 1 1 4. Date of adinission . .. I I l'e
) ...........\ 2. HOS 'number .. . . ...r.,. i . ' j 1, 1 5. Date of discharge . I. 1 If3. Medical Record number 6: Residence ZIP Code
B. PATIENT CHARACTERISTICS .I. 0Month Day , C
I Aarsear 8. Age (Complete only if Units
.1'
. 2f Mo n th i-
3 0 Days7. Date of birth. ... I I ..1 [ 1 Dote of Etirth not given) . . . .
.... fI I . \
(9. Sex (Mork one) : 1.0 Male 2 OFSmile r 3°0 Not stated. ' .
10. Race or Color (Mork one) : t 1Whiti 2'0 Black ." 1 Other III Not stated .
.-n. Marital Status (Mork one) 1 I 0 Married 2 0 Single 3 0 Widowed A 0 Divorced Sal Separated a 0 Not stated
12. Expected Source(s) of payment ,11 13. Disposition of Patient (MorkOne)
(Mork ono) (Mark all that :121y) 'Principal Other . .
. 0 0 Self-pay 10 Routine discharge/discharged horn Re20 0 Workmen's Compensation '.
3 0 Medicare L-..2 1 Left against medical acNice0 _
r0 0 Medicaid 3 1 DISchirged/transferred to another. .,facility or organizationS 0 0 Other jovenmentpayments
0 0 Blue Cross 4 0 Discharged/referred to organized ,7 C ., n Other private or commercial insurance home care service
s 0 0 No charge . S '' Died . . 's ri NI Other (Spocltyl
00 Not stated 4 0 Not statedi
.
C. DIAGNOSES
P:incipal
Other/additional:.
, ..
IN See reverse side
D,, SURGICAL AND DIAGNOSTIC RO EPURES Daze:- Month Day Year.
4I I I- La IPrincipal: - rn
Other/additional. -I 1 1- alRI I 1-11111111-111
. _ 111111r-111111111- IN_ar
. ., . Cla NM I. 0 NONE . 0 See revehe e&de
.. .Completed by Date
\ .
64
*u.e, clOwnefeatitivv PRINTING winces IC 26.711114110
...rved.401,
at
t.
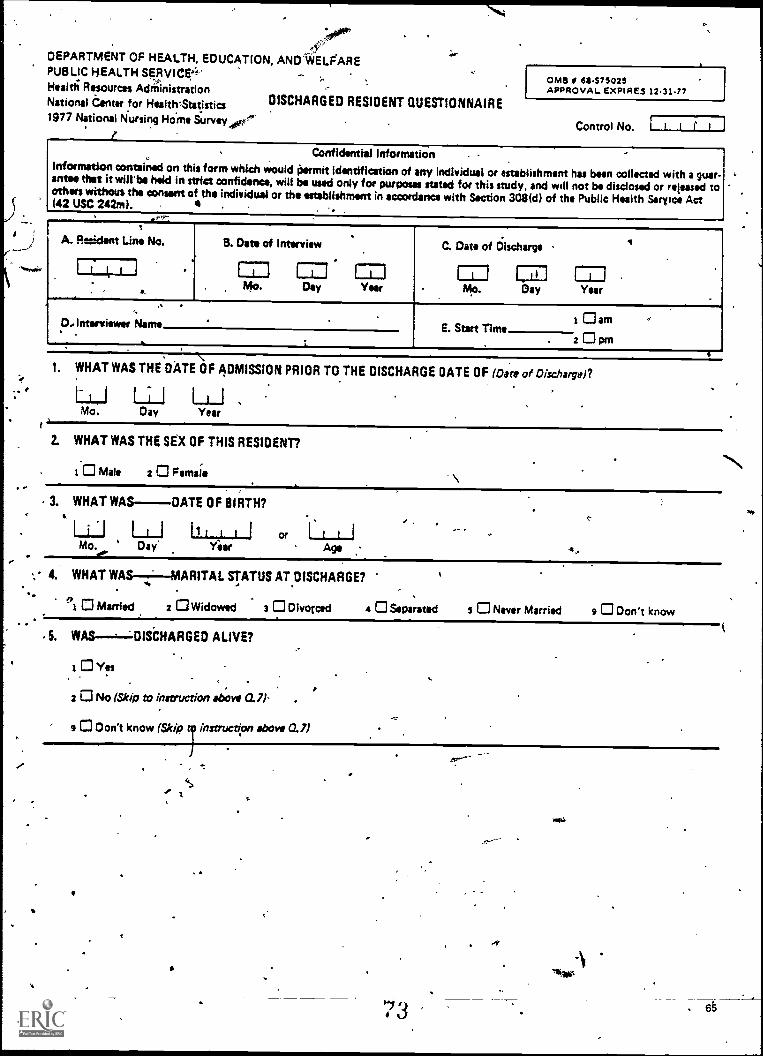
,
-;11#4rP'4"DEPARTMENT OF HEALTH, EDUCATION, AND'WELFAREPUBLIC HEALTH SERVICE.4"Heald; Resources AdriiinistrationNational Center for Health 'Statistics1977 National Nursing Home iurvey
DISCHARGED RESIDENT QUESTIONNAIRE
OMIS # 6975025APPROVAL EXPIRES 12.31-77
Control No. ifConfidential Information
Information contained on this form which would permit identification of any individual or establishment has been collected with a guar.ante* that it will'be held in strict confidence, will be used only for purposes stated for this study, and will not be disclosed or released toothers without the consent of the individual or the establishment in accordance with Section 308(d) of the Public Health Serra Act(42 USC 242m).
.1
A. Rent Line No..i.
B. Date of Interview
71Mo.
.. C. Date of Discharge
mDay
1-71Year
A 1 I .. IMI MUDay Year . Mo.
'0.Interviewer Name
.
. ..
E. Start Timei Gam .
.. 2 C3 pm
1. WHAT WAS THE DATE OF ADMISSION PRIOR TO THE DISCHARGE DATE OF (Date of Discharge)?
LrJ LiJMo. Day Year
2. WHAT WAS THE SEX OF THIS RESIDENT?
0 Male 2 0 Female '\3. WHAT WAS--DATE OF BIRTH?
a.
I LI1 or
Mo .do-
Day AAge
4. WHAT WAS--t--MARITAL STATUS AT DISCHARGE?
*1 0 Married 2 0 Widowed 3 0 Divorced 4 0 Separated s O Never Married 9 0 Don't know
S. WAS --,--LOISCHARGED ALIVE?
0 Yes
2 0 No (Skip to instruction above 0.7)'
s O Don't know (Skip r instruction above 0.7)
'7 3 . 6
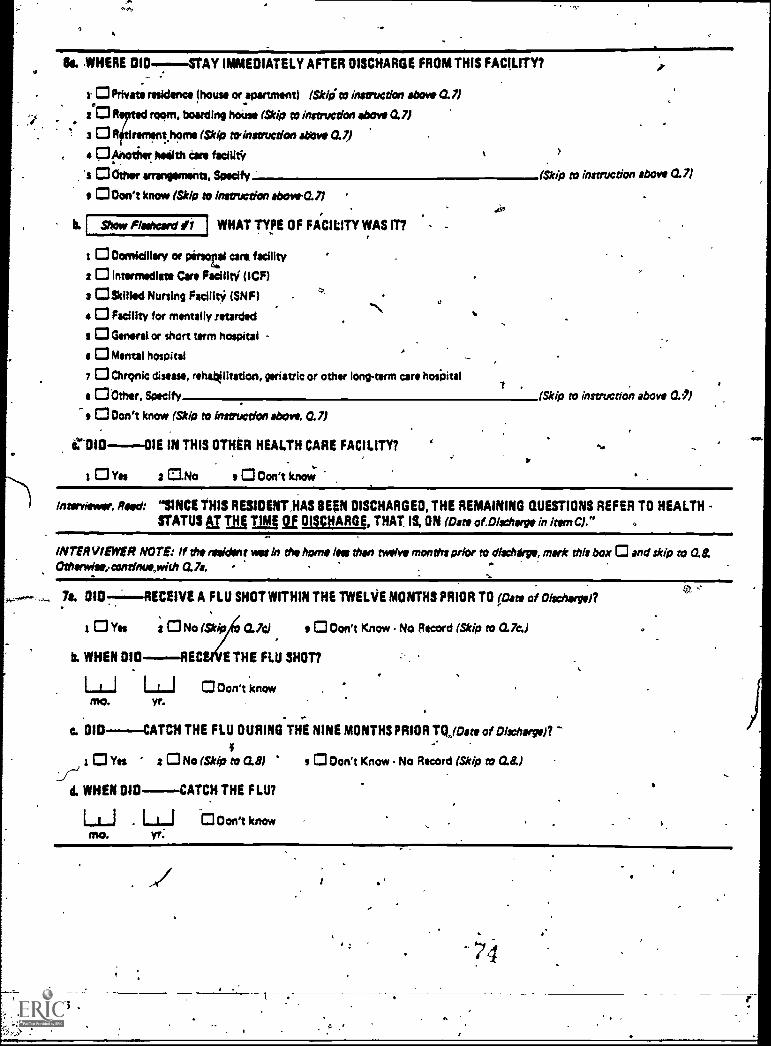
74
Bs, WHERE IMMEDIATELY AFTER DISCHARGE FROM THIS FACILITY?
0 Privet residence (house or apartment) (Skip to instruction above 0.7)
20 R room, boarding house (Skip to instruction above an-
- 3 R it rommthome (Skip to above a
< 4 O Another feeeilth Care focal*
*s O Other arrangements, Specify. (Skip to instruction above 0.7)
Don't know (Skip to instruction ebove.7)
b. Show Flashcard WHAT TYPE OF FACILITY WAS IT?
t CI Domiciliary or pirstai care facility
: 0 Intermediate Care FacilltY (ICF) .
3 CISkilled Nursing Facility (SNF) .0
e CI Facility for mentally retardedN
s CI Generator short term hospital -
$ CI Mental hospital
7 0 Chronic disease, rehatOlitation, geriatric or other long-term care hospital7 ,
En Other. Specify (Skip to instruction above OA
s 0Don't know (Skip to instruction above. 0.7)
C.*010----01E IN THIS OTHER HEALTH CARE FACILITY? ti
t Yes 2 Callo s O Don't know
Interviewer, Reed: "SINCE THIS RESIDENT ,HAS BEEN DISCHARGED, THE REMAINING QUESTIONS REFER TO HEALTHSTATUS Ar TNT TI jA gl DISCHARGE, THAT IS, ON (Oats of.DIscharge in kern 0."
INTERVIEWER NOTE: If the resident wet In the home lea than twelve months prior to discharge, mark this box 0 and skip to O.&Otharwise,continue,with 0.7a.
7e. 010 --- RECEIVE A FLU SHOT WITHIN THE TWELVE MONTHS PRIOR TO pate of Discharge)?
Yes 2 0 No (SNP CL7cI s O Don't Know No Record (Skip to 0.7a)
b. WHEN 010--,--REC E THE FLU SHOT?
1-1-1 Don't knowYr.
0I0-- -CATCH THE FLU DURING THE NINE MONTHS PRIOR TQlOate of Discharyen
Yes z CI No (Skip to OA s O Don't Know No Record (Skip to a&)
d. WHEN DID. --- -CATCH THE FLU?
LLJ . LLJ ti Don't knowmo. yr;
66
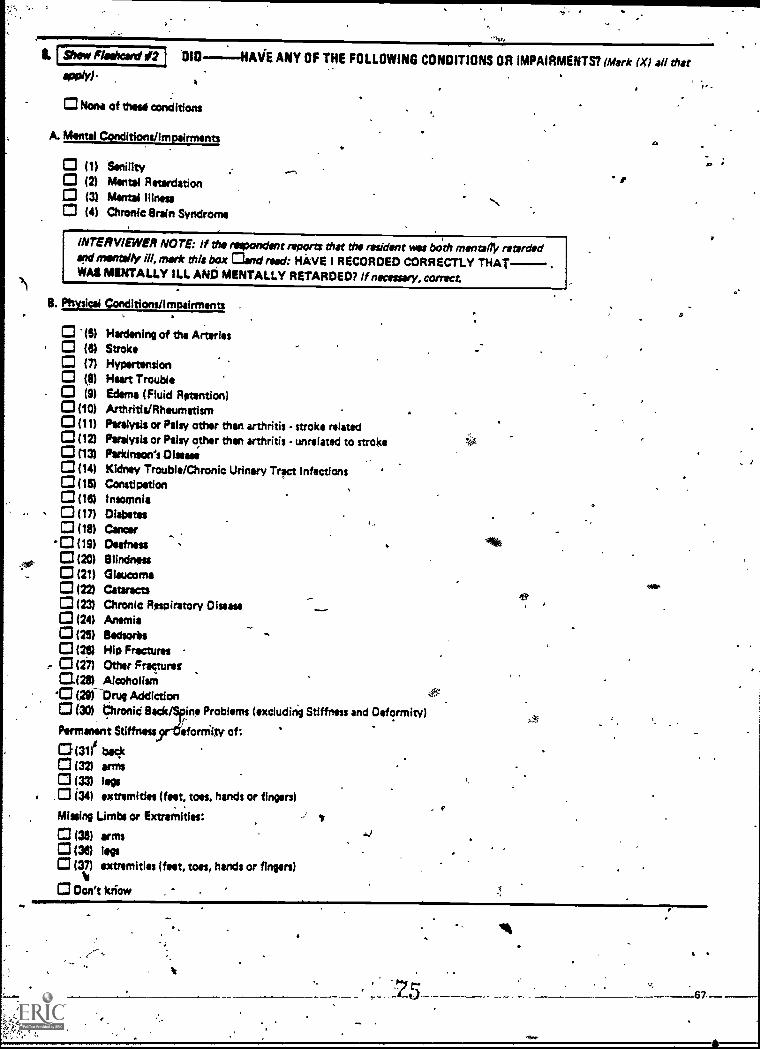
Show Flathcsid sr2 l 010--:-44AVE ANY OF THE FOLLOWING CONDITIONS OR IMPAIRMENTS? (Mork (X) all that
A
Nona of theta conditions
A. Mental Ctinditions/Impairments
(1) Senility(2) Mental Retardation(3) Mint* Illness(4) Chronic Brain Syndrome
INTERVIEWER NOTE: If the respondent reports that the resident vas both mentally retardedand mentally ill, mark this box and road: HAVE I RECORDED CORRECTLY THATWAS MENTALLY ILL AND MENTALLY RETARDED? If necessary, correct
5. Physical Conditions/Impairments
'(5) Hardening of the Arteries(6) Stroke
C3 (7) Hypertension(8) Heart Trouble(9) Edema (Fluid Ratontico)
(410) Arthritis/Rhaurnatism(11) Paralysis or Palsy other than arthritis - stroke related
0(12) Paralysis or Palsy other than arthritis - unrelated to stroke(13) Parkinson's Disease
(14) Kidney Trouble/Chronic Urinary Tract infections0(15) Constipation
(16) Insomnia0 (17) Diabetes
(18) Cancer(19) Deafness120) Blindness
©(21) Glaucoma(22) Cataracts(23) Chronic Respiratory ()issue(24) Anemia
©(25) Wuxi*(2e) Hip Fractures
, (27) Other Fractures0425) Alcoholism
'0 (AiDrug Addiction(30) Ohronid fleck ins Problems (excluding Stiffness and Deformity)
Permanent Stiffness eforniity of:
131 beck(32) arms(33) legs
.0 (34) extremities (feet, toes, hands or fingers)
Mussing Limbs or Extremities:
(3O) arms134) togs(37) extramitles (feat, toes, hands or fingers)
Don't kik*
e
P
111
67
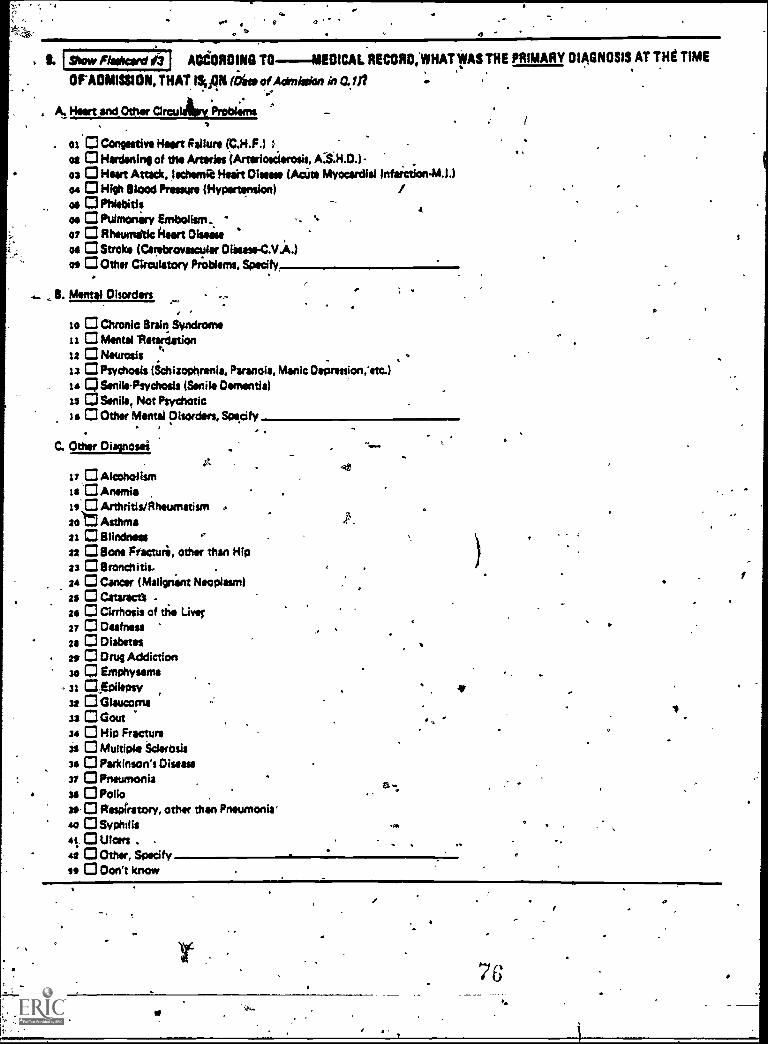
u
I Show flalvard #3 J ACCORDING TO--11EDICAL RECORD,WHATIVAS THE PRIMARY DIAGNOSIS AT THE TIME
OAOMISSION, THAT ISION (bite of Admission in Q1 it
, A. Heart WO Other CircuAnt Problems,
os 0 Congestive Heart Failure (C.H.F.)os 0 Hardening of the Arteries (Artesiosilerosis,ea 0 Heart Attack, ieehemie Nears Disease (AcUte Myocardial Infarction-M.1.104 CI High Blood Pressure (Hypertension)os 0 Phlebitisas CI Pulmonary Embolism,07 0 Rheumatic hurt DIseiseoa 0 Stroke (Carabroyascvlar DiaseseC.V.A.)os 0 Other Circulatory Problems, Specify,
B. Mental Disorders -.-
to 0 Chronic Brain Syndromeit 0 Mental 'Retardation12 0 Neurosis23 0 Psychosis (Schizophrenia, Paranoia, Manic Depression,Ittc.)le CISenils-Psydiosis (Senile Dementia)is a Smile, Not Psychotic14 C3 Other Mental Disorders, Specify
.
C. Other Disposal
17 0 AlcoholismIs 'CI Anemiais 0 Arthritis/Rheumatism .sot Asthma21 0 Blindness22 0 Bone Fracture, other than Hip23 0 Bronchitis.
, 24 O Cancer (Malignint Neoplasm)23 0 Cataracts -tee 0 Cirrhosis of the Liver27 0 Deafnessas 0 °labiumas 0 Orug Addictionso O Emphysema
- 31 CZEPileosy32 CI Glaucoma33 0 Goutse 0 Hip Fracture31 0 Multiple Sderbsis3* 0 Parkinson's Disease37 0 Pneumonia34 O Polio34. 0 Respiratory, other than Pneumonia''o O Syphilis
4t. ulcers42 C3 Other, Specifyse 0 Don't know
1
68w
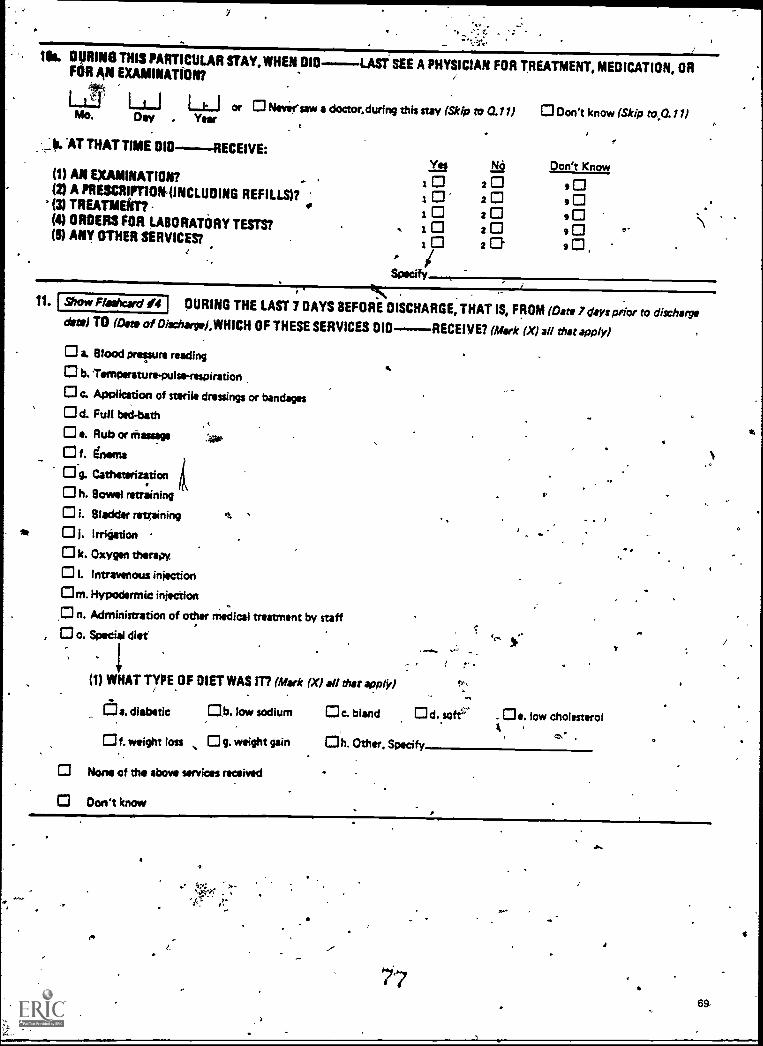
ae .
Ill. DURING THIS PARTICULAR STAY, WHEN DIDFOR AN EXAMINATION?
LAST SEE A PHYSICIAN FOR TREATMENT, MEDICATION, OR
or Neversaw a doctor.during this stay (Skip to al l I
Yee
Don't know (Skip
Don't Know
to.0.1l )Mo. Day . Veer
b. 'AT THAT TIME OID----RECEIVE:
(1) AN EXAMINATION? I 9 0(2) A PRESCRIMON (INCLUOING REFILLS)? i 2 9 0(3) TREATMENT? t 0 20 9 0(4) ORDERS FOR LABORATORY TESTS? 2 9(5) ANY OTHER SERVICES?
A
Specify-
tt. I Show Floshcard 04 DURING THE LAST 7 DAYS BEFORE DISCHARGE, THAT IS, FROM (Date 7 days prior to disr.horsvdate) TO oat of Diacharptl,WHICH OF THESE SERVICES DIG------RECEIVE? (Mark (X) all that apply)
a. Blood pressure reading
b. l'enneratuns.pulse-rewiratibrt
c. Application of sterile dressings or bandages
d. Full bed -bath
e. Rub or rhassage
f. &ems
Og. Catheterization
h. Bowel retraining
i. Bladder retraining
* 01. Irrigation
k. Oxygen thltraN
I. Intravenous injection
Om. Hypodermic injection
n. Administration of other medical treatment by staff
o. Special diet
1(1) WHAT TYPE OF DIET WAS IT? (Mark (X) all that apply)
Cf:]a. diabetic .b. low sodium c. bland . e. low cholesterol
f. weight loss g. weight gain Oh. Other. Specify
None of the above services received
Don't know
I.
r.
.
7j7
A
6
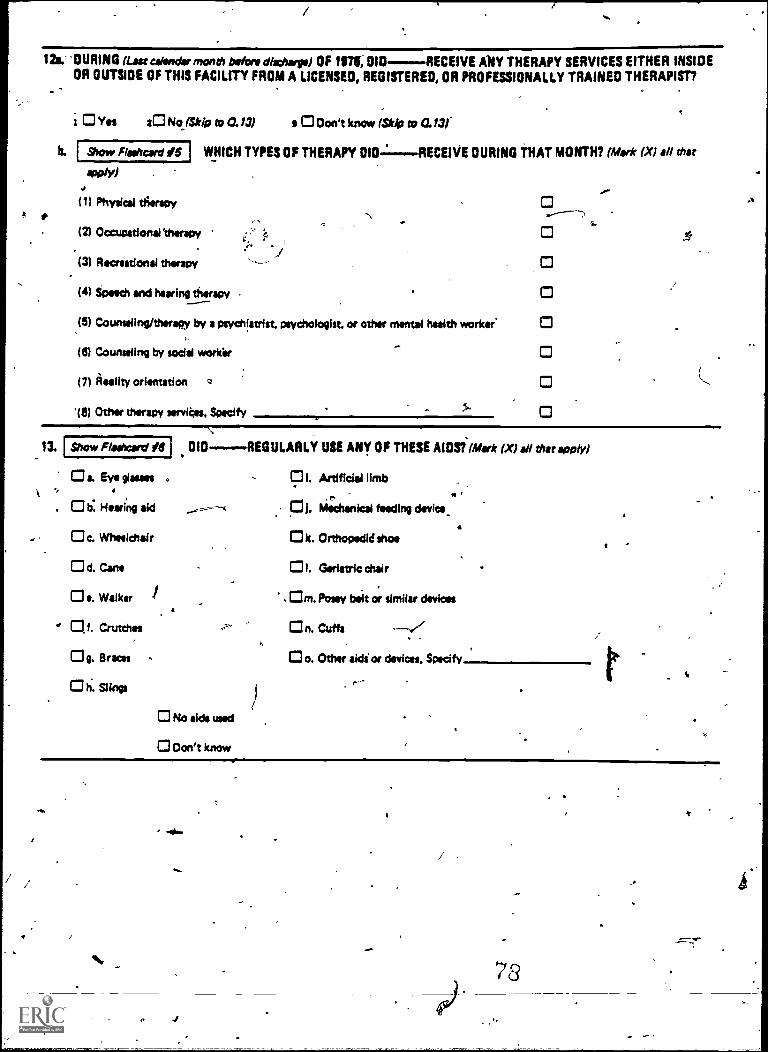
[ Show Fliehard IS I
Show Flasheard IS 1
4.
12s.-DURING (Last callindar mond, before discharge) OF 197t, DID RECEIVE ANY THERAPY SERVICES EITHER INSIDEOR OUTSIDE OF THIS FACILITY FROM A LICENSED, REGISTERED, OR PROFESSIONALLY TRAINED THERAPIST?
b.
i Yes 2C1NojSkip to O. /3) 001111CM* (St42 to a /3/
800/Y)
(11 Physical th'erspy
WHICH TYPES OF THERAPY 010 RECEIVE DURING THAT MONTH? (Mark (XI all that
0(21 Occupational 'therapy
(3) Recreational therapy
(4) Speech and hearing therapy
(51 Coubsalln9/11**11111 by a Psychiatrist. psychologist. or other mental health worker.
(6) Counseling by social workir
(7) Reality orientation a
Other therapy services, Specify
13.
0 a. Eye Own". 0 is: Hearing aid C31. ha;chanical feeding device_
c. Wheelchair k. Orthopedid shoe
0 d. Cane 01. Geriatric chair
0 e. Walker - Om. Posey bait or similar devices
Of. Crutches On. Cuffs
g. Braces - o. Other aidi or devices. Specify
0 h. Slings
010 REGULARLY USE ANY OF THESE AIDSi(Mstir (X) all that apply)
DI. Artificial limb
No aids used
Oon't know
ti
*v.
ma,
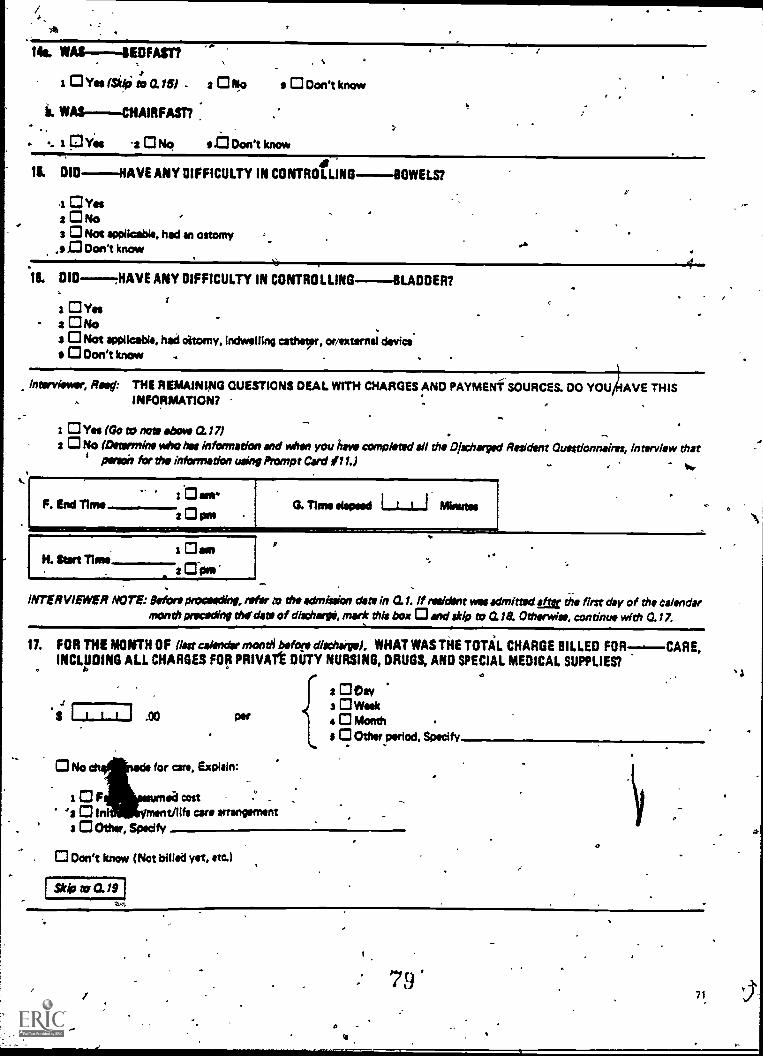
/, -
A.
14s. WAS-BEDFAST?
a Ova Isidoi to arm - 2 Orio
ii. WAS-CHAIRFASI7
.. -.. a 0Yes 2 0 No at Don't know
a 0 Don't know
1$. DID-RAVE ANY DIFFICULTY IN CONTROLLING----- BOWELS?I
1 CI Vass 0 No '3 0 Not applicable, had an ostomy
.1, 0 Don't know
16. DID .HAVE ANY DIFFICULTY IN CONTROLLING-BLADDER?
s 0 Yeea ONo
.
3 0 Not applicable, had ottomy, indwelling catheter, orirsurnal devicea CI Don't know .
t
histryitnew, Rapt THE REMAINING QUESTIONS DEAL WITH CHARGES AND PAYMENT SOURCES. DO YOU AVE THISINFORMATION?
i 0 Yes (Go to note *boy i t 0.17) . ..,
2 0 No (Deurrnino who has information and when you have completed all the Discharged Resident Outstionnsires, interview thatpinch for rho information using Prompt Card #11.) .. . , to.
F. End Time
sl..-
2 0 am2 0 pm
H. Sort Timet Oson
2 Dime
G. Time elapsed I Minutes
0 *e
INTERVIEWER NOTE: Wort proonding, tear to the admission date in 0.1. If nwidint was admitted sae the first day of the calendarmonth brocading &Odom of dischwypi, ~it this box 0 and skip to 0.1a Othorwiss, continuo with 0.17.
11. FOR THE MONTH OF (last calendar month before dischairga). WHAT WAS THE TOTAL CHARGE BILLED FOR--.---CARE,INCLUDING ALL CHARGES FOR PRIVATt DUTY NURSING, DRUGS, AND SPECIAL MEDICAL SUPPLIES?
.,
.1
'S .00
2 0 Ow3 0 Wok4 0 Month .
s 0 Other Period. Specify..
0 No ehanads for care, Explain:
i a F ed cost -
a 0 I ON cars arrangementa 0 °lbw, Specify
O
0 Don't know (Not billed yet, am)
stip to a 19VA.
4.
/
ot
I
: 79'71
a
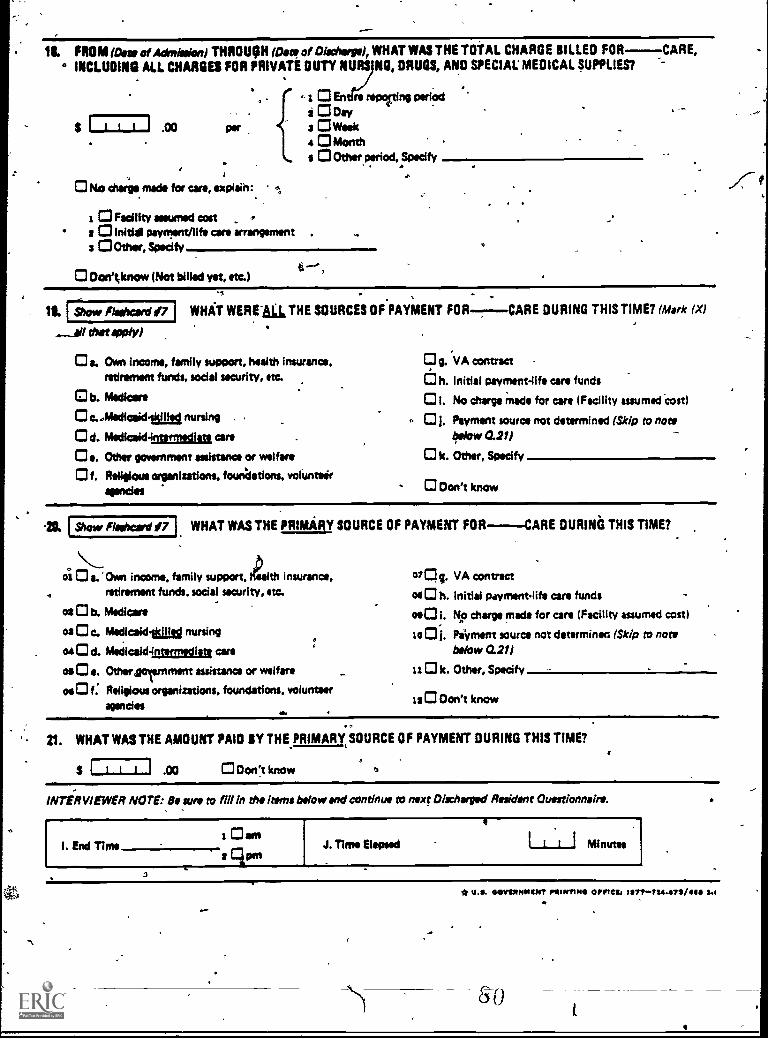
I Show flootcord #7 1
18. FROM Woe of Admission) THROUGH Kee of Dischorgol, WHAT WAS THE TOTAL CHARGE BILLED FOR CARE, .o INCLUDING ALL CHARGES FOR PRIVATE DUTY ?MRS NO, DRUGS, AND SPECIAL MEDICAL SUPPLIES?
I I I
,0 No charge made for care, explaih:
1 CI Facility assumed cost2 0 lnitid payment/life care arrangement .
3 °Other, Specify,
.00
- En re lng cerfodi3 Day
Week0 Month
s 0 Other period, Specify
0 Oon' ;know (Not billed yet, etc.)
. 0
ILAwe *WY)
WHAT WERE La THE SOURCES OF PAYMENT FOR
0 a. Own income, family support, health insurance,retirement funds, social security, etc.
b. Medicare
c...Mediceid.abg nursing
Od. Medicaidnumitaa cars0 e. Other government assistance or welfare
0 f. Religious organizations, foundations, volunteiragencies
CARE DURING THIS TIME? (Mark (X)
0 0. VA contract
O h. Initial Payment-life care funds
01. No charge Made for are (Facility assumed cost)
01. Payment source not determined (Skip to nowbelow 0.211
k. Other, Specify
0 Don't know
Show Floshcord #7 WHAT WAS THE PRIMARY SOURCE OF PAYMENT FOR-CARE DURING THIS TIME?
oi 0 a. Own income, family support, ALM insurance,retirement funds. social security, etc.
os 0 b. Medicare
os 0 c. Medicsidtad nursingat O d. Medicsid4rxermsam are
oe 0 ta. Other gornment assistance or welfare
oe 0 f. Religious organizations. foundations. volunteeragencies
S. VA contract
m 0 h. Initial Fhwmantlifil are funds
090 i. NO charge made for care (Facility assumed cost)
se 01. Payment source not determiners (Skip to notbelow 0.21)
110 k. Other, Specify
120 Don't know
0
21. WHAT WAS THE AMOUNT PAID BY THE PRIMARY SOURCE OF PAYMENT DURING THIS TIME?
.00 0 Oon't know
INTERVIEWER NOTE: Be sun to fill In the Items below and continue to next Dir./forged Resident Questionnaire.
I. End Time
j
4
J. Time Mooed 1--1__d Minutes
72
* U.S. 04/11SONNINT POINTING ernes, 1117TT24.1171/41111 3.1
sao4
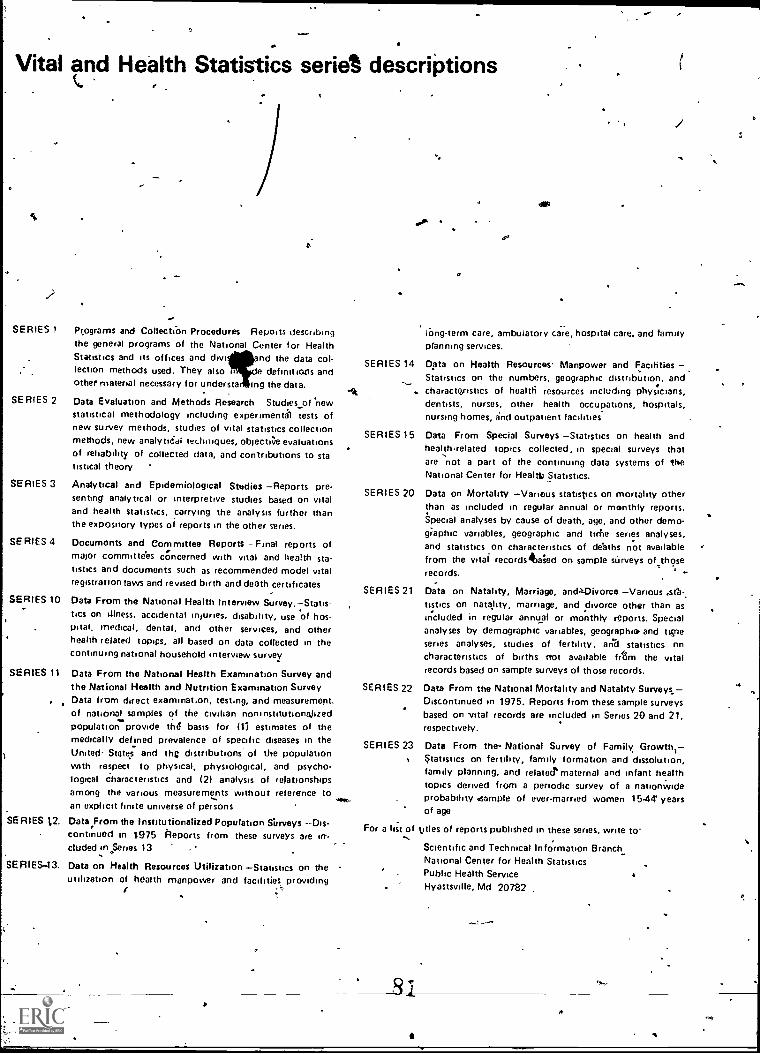
Vital and Health Statistics serie% descriptions
S.
2
SERIES 1 Programs and Collection Procedures Repoits describingthe general programs of the National Center for HealthStatistics and its offices and dive nd the data col-lection methods used. They also II e definitions andother material necessary for understa mg the data.
SERIES 2 Data Evaluation and Methods Research Studies_of 'newstatistical methodology including experimen61 tests ofnew survey methods, studies of vital statistics collectionmethods, new analytiCal tcehiuques, oblectie evaluationsof reliability of collected data, and contributions to statistical theory
SERIES 3 Analytical and Epidemiological Studies -Reports pre-senting analytical or interpretive studies based on vitaland health statistics, carrying the analysis further thanthe expository types of reports in the other series.
SE RIES 4 Documents and Committee Reports -Final reports ofmajor committees concerned with vital and health sta-tistics and documents such as recommended model vitalregistration laws and revised birth and death certificates
SERIES 10 Data From the National Health Interview Survey.-Statis-tics on illness, accidental injuries, disability, use of hos-pital, medical, dental, and other services, and otherhealth related topics, all based on data collected in thecontinuing national household interview survey
SERIES 11 Data From the National Health Examination Survey andthe National Health and Nutrition Examination Survey
. Data from direct examination, testing, and measurement,of national samples of the civilian noninstatutionalizedpopulation provide thd basis for (11 estimates of themedically defined prevalence of specific diseases in theUnited. States and thg distributions of the populationwith respect to physical, physiological, and psycho-logical characteristics and (21 analysis of relationshipsamong the various measurements without reference to
awan explicit finite universe of persons
SERIES 1.2. Data From the Institutionalized Population S'urveys -Dis-continued in 1975 Reports from these surveys are in-cluded rn Series 13 .
SERIES-13. Data on Health Resources Utilization -Statistics on theutilization of health manpower and facilities providing
sodo
limg-term care, ambulatory care, hospital care, and familypranning services.
SERIES 14 Data on Health Resources. Manpower and FacilitiesStatistics on the numbers, geographic distribution, and
. characteristics of health resources including physicians,dentists, nurses, other health occupations, hospitals,nursing homes, and outpatient facilities
SERIES 15 Data From Special Surveys -Statistics on health andhealth-related topics collected, in special surveys thatare not a part of the continuing data systems of theNational Center for Healt Statistics.
SERIES 20 Data on Mortality -Various statistics on mortality otherthan as included in regular annual or monthly reports,Special analyses by cause of death, age, and other demo-gi.aphic variables, geographic and tithe series analyses,and statistics on characteristics of de'aths not availablefrom the vital recordska;ed On sample surveys of thoserecords.
SERIES 21 Data on Natality, Marriage, and=Divorce -Various .seb-tistics on natality, marriage, and divorce other than asincluded in regular annual or monthly reports. Specialanalyses by demographic variables, geographic and urineseries analyses, studies of fertility, and statistics nncharacteristics of births mat available frtm the vitalrecords based on sample surveys of those records.
SERIES 22 Data From the National Mortality and Natality Surveys.-Discontinued in 1975. Reports from these sample surveysbased on vital records are included in Series 20 and 21,respectively,
Data From the- National Survey of Family Growth,-Statistics on fertility, family formation and dissolution,family planning, and relate& maternal and infant healthtopics derived from a periodic survey of a nationwideprobability ',sample of ever-married women 15-44 yearsof age
For a list of titles of reports published in these series, write to
Scientific and Technical Information BranchNational Center for Health StatisticsPublic Health ServiceHyattsville, Md 20782
SERIES 23
S
4el