Embed Size (px)
Citation preview

DOCUMENT RESUME
ED 072 230 VT 018 675
TITLE The Public Employment Program: An Evaluation by theNational Urban Coalition..
INSTITUTION National Urban Coalition, Washington, D.C.PUB DATE Sep 72NOTE 103p.
EDRS PRICE MF-$0.65 HC-$6.58DESCRIPTORS Disadvantaged Groups; Economically Disadvantaged;
Employment Opportunities; *Employment Programs;Employment Services; *Federal Legislation; *JobDevelopment; Manpower Development; *ProgramEvaluation; Public Policy; *Unemployed
IDENTIFIERS *Emergency Employment Act of 1971
ABSTRACTThe National Urban Coalition conducted this
evaluation to determine the manner in which the provisions of theEmergency Employment Act of 1971 have been carried out, the problemsraised by legislative and administrative guidelines, and thedifficulties experienced in implementing projects locally.,Some majorfindings were: (1) The Labor Department ruled that otherwise eligibleapplicants with populations of less than 75,000 were ineligible toreceive funds, alt119pgh Congress had set no population limit, (2)
Characteristics ofa!e enrollees did not seem to matchcharacteristics of the unemployed (e.g., while 52 percent of the poorhad an eighth grade education or less, only.7 percent of theenrollees had an eighth grade education or less), (3) Congress didnot provide &dequate funds to cover the cost of training andsupportive services under Section 5 of the Act, (4) Most of thecities, counties, and states surveyed had not started to implementthe objectives of modernizing outdated Civil Service practices, tobring the sponsor into compliance with U. S. Civil Service CommissionGuidelines specifically developed for the program, and (5) Programagents did not employ many of the specified target groups--youth,older workers, or those having particular difficulty finding jobs inthe high .unemployment market. UM

U.S OEPARTMENT OF HEALTH.EDUCATION & WELFAREOFFICE OF EOUCATION
THIS OUCUMENT HAS BEEN REPROOUCEO EXACTLY AS RECEIVED FROMTHE PERSON OR ORGANIZATION ORIG,INATING IT POINTS Of VIEW OR OPIN.IONS STATED 00 NOT NECESSARILYREPRESENT OFFICIAL OFFICE OF EOUCATION POSITION OR POLICY
thepublic
eploymentprogram:
An EvaluationBy The NationalUrban Coalition
September1972

Officers ofThe National Urban CoalitionChairmanSol M. LinowitzThe National Urban CoalitionWcshington, D.C.
Co-ChairmenAndrew HeiskellChairman of the BoardTime, Inc.New York, New York
Vernon E. Jordan, Jr.Executive DirectorNational Urban League, Inc.Nov York, New York
James M. RocheFormer ChairmanGeneral Motors CorporationDetroit, Michig n
PresidentM. Carl HolmanThe National Urban CoalitionWashington, D.C.
SecretaryClifford L. Alexander, Esq.Arnold and PorterWashington, D.C.
TreasurerAlfred S. MillsChairman and
Chief Executive OfficerThe New York Bank
for SavingsYew York, New York
Steering Committee ofThe National Urban CoalitionI. W. AbelPresidentUnited Steelworkers of
timpricaPittsburgh, Pennsyi:
Clifford L. Alexander, Esq.Arnold and PorterWashington, D.C.
Arnold AronsonSecretaryLeadership Conference on
Civii RightsNew.York, New York
Albert E. Arent, Esq.Arent, Fox, Kintner, Plotkin
and KahnWashington, D.C.
Rev. Msgr. Gcno BaroniDirectorThe Center for Urban Ethnic
AffairsWashington, D.C.
Lucy BensonPresidentLeague of Women Voters of
the United StatesWashington, D.C.
Hon. Joseph J. BernalState SenatorSan Antonio, Texas
His Excellency BishopJoseph I. Bernardin
General SecretaryU.S. Catholic ConferenceWashington, D.C.
Hon. Julian BondGeorgia LegislatureAtlanta, Georgia
Senator George L. BrownExecutive DirectorMetro Denver Urban
CoalitionDenver, Colorado
Dr. James E. CheekPresidentHoward UniversityWashington, D.C.
James A. ChristisonExecutive SecretaryAmerican Baptist Home
Mission SocietiesValley Forge, Pennsylvania
Dr. Kenneth 2, ClarkPresidentMetropolitan Applied
Research CenterNew York, New York
Robert D. ClarkPresidentUniversity of OregonEugene, Oregon
Hon. John DriggsMayor of PhoenixPhoenix, Arizona
Casey EikeUniversity of KansasLawrence, Kansas
Harold A. Ellis, Jr.PresidentGrubb and Ellis Comp-anyOakland, California
Edwin D. EtheringtonPresidentNational Center for
Voluntary ActionWashington, D.C.
Hon. Daniel J. EvansGovernorStati. of WashingtonOlympia, Washington
Hon. Peter FlahertyMayor of PittsburghPittsburgh, Pennsylvania
Arthur A. FletcherExecutive DirectorUnited Negro College Fund,
Inc.New York, New York
I. 0. FunderburgPresidentGateway National BankSt.-2-ouis, Missouri
His Excellency BishopRaymond J. Gallagher
Bishop of Lafayette-in-IndianaLafayette, Indiana
Dr. Hector P. GarciaCorpus Christi, Texas
John W. GardnerChairmanCommon CauseWashington, D.C.
Warren V. GilmorePresidentYouth Organizations UnitedWashington, D.C.
R. Ray GoodeCounty ManagerMetropolitan Dade CountyMiami, Florida
Leonard Goodman, Jr.ChairmanEl Paso Urban CoalitionEl Paso, Texas
Katharine GrahamPresidentThe Washington PostWashington, D.C.
Ernest GreenDirectorjoint Apprcnticeship ProgramNew York, New York
Hon. Roman S. GribbsMayor of DetroitDetroit, Michigan
The Most Rev.George H. Guilfoylc
Bishop, Diocese of CamdenCamden, New Jersey
Ira HallExecutive DirectorStanford Mid-Peninsula
Urban CoalitionStanford, California
LaDonna HarrisMcLean, Virginia
Hon. Richard G. HatcherMayor of GaryGary, Indiana
Dorothy I. Height.ft President
National Council of NegroWomen, Inc.
Washington, D.C.
Ben W. HeinemanPresidentNorthwest Industries, Inc.Chicago, Illinois
Andrew HeiskellChairman of the BoardTime, Inc.New York, New York
Dr. Vivian W. HendersonPresidentClark CollegeAtlanta, Georgia
Gustav HeningburgPresidentThe Greater Newark Urban
CoalitionNewark, New Jersey
Aileen C. HernandezChairOneNational
Advisory CommitteeNational Organization for
Women, Inc.San Francisco, California
Dr. Hilda HidalgoChairwomanUrban Studies DepartmentLivingston CollegeNew Brunswick, New Jersey
Continued on inside back cover

FOREWORD
Since its creation in 1967 The National Urban Coalition has
supported the concept of a public service employment program as
a permanent feature of the national labor market. This position
stems from two basic premises. The-first is that even in a full
employment economy, a large number of disadvantaged Americans
will not be able to find suitable jobs in the private sector.1
The second is that throughout the country there i. a rapidly
growing need for the social, community and public services that
are the responsibility of the public sector.
We were pleased that Congress responded to these and other
economic realities by enacting the Emergency Employment Act of
1971 (EEA).
In the fall of 1971 The National Urban Coalition joined the
National Civil Service League in sponsoring a national conference
of community representatives, public and private, to discuss the
emergency employment program's administrative guidelines and to
prepare communities to assume meaningful roles in implementing
projects at the local level.
The Public Employment Program (PEP) that grew out of the
EEA is a beginning, but we view it as a transitional measure
leading to a much larger permanent program of public service
1. 4% unemployment is generally accepted as the target for afull employment economy. There is reason to believe thata fuli employment economy should be able to achieve anunemploymLnt rate of 3% or less.

employment. For this reason we decided to monitor and evaluate
the program to determine the manner in which the provisions of
the Act have been carried out, the problems raised by legislative
and administrative guidelines, and the difficulties experienced
in implementing projects locally. The Coalition was anxious to
obtain its information quickly so it could make recommendations
while improvements in program performance were still possible.
There are encouraging signs that support for a permanent
public service employment program is growing. The large number
of applicants for PEP positions throughout the country is a con-
vincing argument for many persons who previously doubted the
need for such a program. Private groups, including corporate
representatives, are increasingly accepting the fact that the
growing local demand for public services can be met only through
a federally sponsored public employment effort. The Congress
will soon consider legislation to extend, expand and strengthen
the Public Employment Program. We hope that a strong bill will
be passed.
We trust this report will prove both constructive and timely.
Washington, D. C. Sol M. LinowitzChairman
M. Carl HolmanPresident

ACKNOWLEDGMENT
This study could not have been undertaken without the
assistance and active support of local urban coalitions. Their
investigations, reports and staff work form the nucleus of the
reporI.
The National Urban Coalition would like to thank the
Department of Labor for its cooperation in this enterprise.
Its data, constructive criticism of our initial drafts and
general assistance were invaluable ingredients of the final
product.
To the members of our t":1:ecutive Committee, who reviewed the
document in detail, thanks are in order. As is often
the casc among groups composed of such diverse members, the
Committee did not unanimously endorse all of the report's
findings and recommendations. Three members did not share the
view that the chronically unemployed should have been a major
priority of the Poblic Employment Program, nor the emphasis on
the importance of supportive services and training. Two mem-
bers did not agree with the report's interpretation of the way
in which public service needs were defined and met by some cities.
We have included an appendix, submitted by the American
Federation of State, County and Municipal Employees, which
reflects the concerns and differences cited above.
TABLE OF CONTENTS
I THE EMERGENCY EMPLOYMENT ACT OF 1971: A HISTORY
II SUMMARY OF FINDINGS AND TRENDS
III_ SELECTION OF PROGRAM AGENTS
IV ALLOCATION OF SECTION 5 FUNDS
V OPERATION OF SECTION 6
VI SELECTION OF PARTICIPANTS
VII EMPLOYMENT, TRAINING AND SUPPORTIVE SERVICES
VIII UNMET SERVICE NEEDS
IX CONCLUSIONS AND RECOMMENDATIONS
APPENDICES
14
17,
22
27
3/1
48
64
72
83
-1-
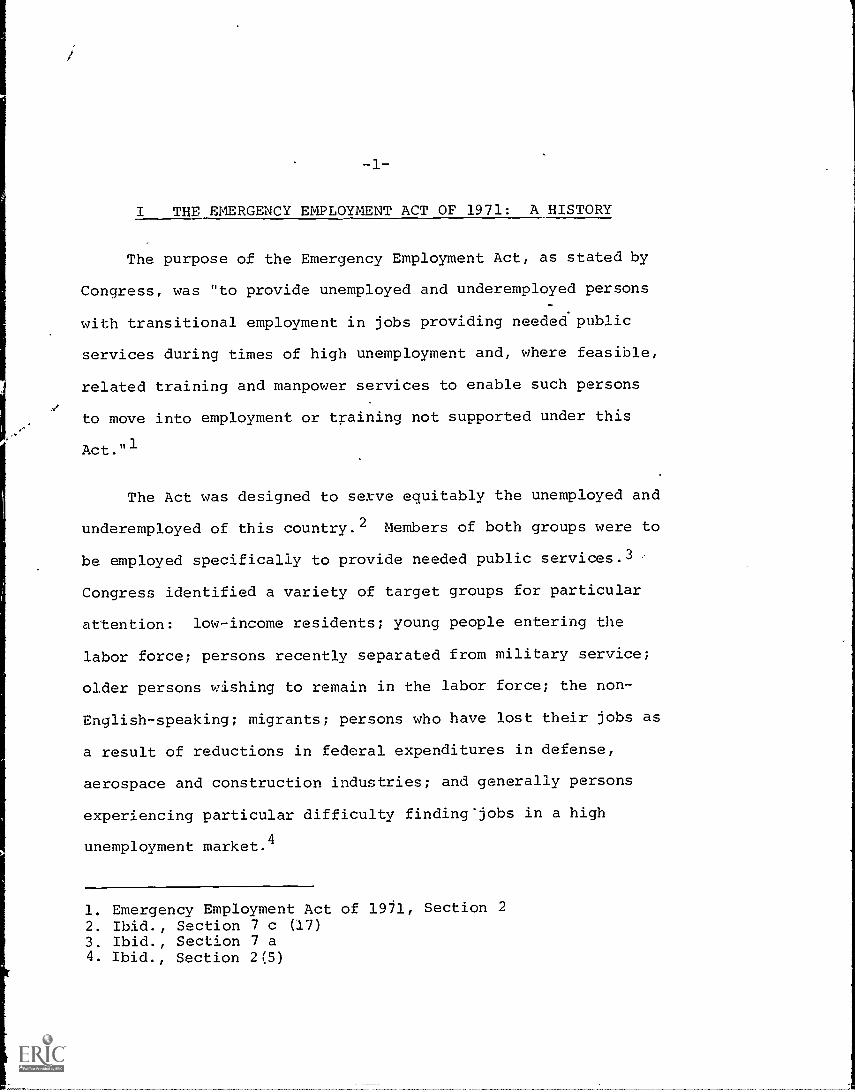
I THE EMERGENCY EMPLOYMENT ACT OF 1971: A HISTORY
The purpose of the Emergency Employment Act, as stated by
Congress, was "to provide unemployed and underemployed persons
with transitional employment in jobs providing needed public
services during times of high unemployment and, where feasible,
related training and manpower services to enable such persons
to move into employment or training not supported under this
Act. ul
The Act was designed to serve equitably the unemployed and
underemployed of this country.2 Members of both groups were to
be employed specifically to provide needed public services.3
Congress identified a variety of target groups for particular
attention: low-income residents; young people entering the
labor force; persons recently separated from military service;
older persons wishing to remain in the labor force; the non-
English-speaking; migrants; persons who have lost their jobs as
a result of reductions in federal expenditures in defense,
aerospace and construction industries; and generally persons
experiencing particular difficulty finding jobs in a high
unemployment market. 4
1.
2.
3.4.
Emergency Employment Act of 1971, Section 2Ibid., Section 7 c (17)Ibid., Section 7 aIbid., Section 2(5)
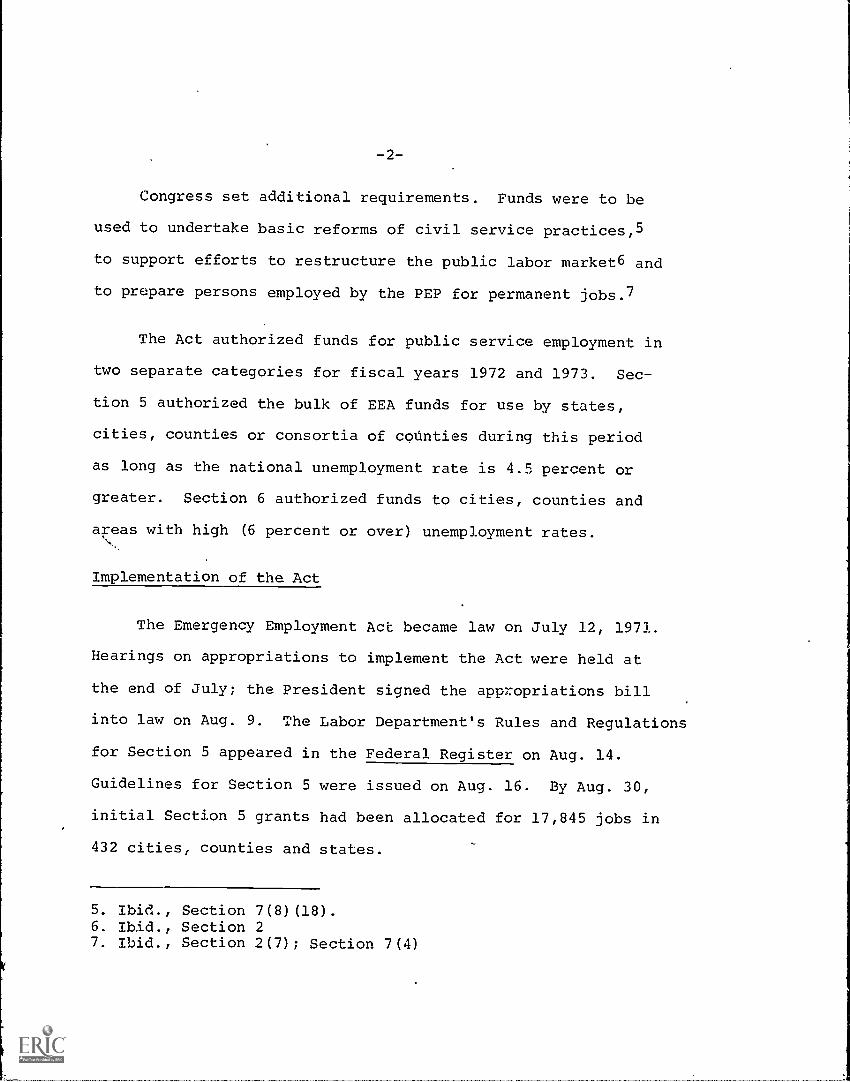
-2-
Congress set additional requirements. Funds were to be
used to undertake basic reforms of civil service practices,5
to support efforts to restructure the public labor market6 and
to prepare persons employed by the PEP for permanent jobs.7
The Act authorized funds for public service employment in
two separate categories for fiscal years 1972 and 1973. Sec-
tion 5 authorized the bulk of EEA funds for use by states,
cities, counties or consortia of counties during this period
as long as the national unemployment rate is 4.5 percent or
greater. Section 6 authorized funds to cities, counties and
areas with high (6 percent or over) unemployment rates.
Implementation of the Act
The Emergency Employment Act became law on July 12, 1971.
Hearings on appropriations to implement the Act were held at
the end of July; the President signed the appropriations bill
into law on Aug. 9. The Labor Department's Rules and Regulations
for Section 5 appeared in the Federal Register on Aug. 14.
Guidelines for Section 5 were issued on Aug. 16. By Aug. 30,
initial Section 5 grants had been allocated for 17,845 jobs in
432 cities, counties and states.
5. Ibid., Section 7(8)(18).6. Ibid., Section 27. Ibid., Section 2(7); Section 7(4)
-3-
Section 6 Guidelines were issued Sept. 20, and participating
cities, counties and areas were selected. Final allocations of
Section 5 and Section 6 funds, including the major demonstration
programs, had been made by Jan. 14, 1972.
Section 5 funds were distributed on the basis of a fixed
formula. Section 6 funds were distributed to cities, counties
and areas with unemployment rates of 6 percent or more follow-
ing a formula that, according to the Labor Department, gave
equal weight to the percentage of unemployment over 6 percent
and the number of people unemployed: This formula for Section
6 wa-,; confusing to many cities for two reasons: it received so
little publicity that it was generally unknown to them, and
they were not certain about which statistics the DepartmT.nt was
using for the percentage of unemployment and the number of
unemployed persons, particularly in "areas" and neighborhoods
within a city.
Six months aft4lc the Act became law, the Labor Department
//allocated $1 bilaon to all the states and to 615 cities and
counties with populations of at least 75,0'015. The Department
selected the recipients of both Section 5 and Section 6 monies.
States, cities and counties have moved rapidly to place
people on the Section 5 payroll. Such haste lends itself to
potential management problems and abuses. The fact that there
-4-
were only a few cases of outright misuse of funds is a remarkable
a.:hicvement for which the Labor Department and local program
agents deserve great credit.
The EEA was passed as an "emergency employment" measure
designed to improve the economy by rapidly reducing unemployment,
even though its outreach was limited to no more than 3 percent
of the unemployed population. The Administration attempted to
offset the limited number of potential employees by pieSsing
states and local communities to plan and hire as rapidly as
possible.
The speed with which the Labor Department successfully
distributed $1 billion to local jursidictions constitutes a
notable accompl_ .hment. The Department's rapid mobilization
was accompanied by other noteworthy end commendable features.
Cities responded quickly in hiring and moving people into
Section 5 job slots. The proportion of minority representatives
hired was exceptionally high, according to both the national
data (Negro - 20 percent; Spanish-speaking - 7 percent;
Other - 4 percent)8 and the sample of Urban Coalition cities
surveyed (Black 40 percent; Spanish-speaking - 11 percent;
Other - 0 percent).8
8. Data combines both Section 5 and 6.9. See Appendix, Table XV.

-5-
Methodology
To prepare this report, The National Urban Coalition relied
on a variety of sources: an analysis of the EEA legislation;
the Rules, Regulations and Guidelines issued by the Labor Depart-
ment; the proposals submitted by 'le cities selected for the
study sample; an analysis of the Agent Information System (AIS)
data accumulated by the Department nationally through Feb. 29,
1972, as well as an analysis of AIS data for the cities and
counties participating in the study; and data collection at the
local level by Urban Coalitions utilizing uniform survey instru-
ments and techniques. The survey was designed to obtain supple-
mental data not provided in the AIS and to obtain subjective
information which could be used in assessing qualitative aspects
of the program.
The number of Section 5 participants in the 26 local Urban
Coalition cities reported in the AIS data of Fel.ruary 1972 was
5,690. 10 There were 286 people listed as Section 6 participants.
It is difficult to determine whether the small number of Section
6 participants was the result of poor reporting procedures, the
delay by most cities in starting Section 6 programs until Sec-
tion 5 had been in operation for two months, or the difficulties
experienced by cities in launching Section 6 programs. No com-
parable national breakdown of Section 5 and 6 participants is
10. The Providence Urban Coalition reported on the entire stateof Rhode Island, and two local Urban Coalitions have countyrather than city jurisdictions.
-6-
available through the national AIS data for the same period.
This data lists 70,000 Section 5 and 6 participants national2v
but makes no distinction between the two Sections. The totel_
of 70,000 enrolices in the national PAS report is considerably
lower than the 120,000 enrollees publicly reported at the time
by the Labor Department.
Individual AIS reports were received from the Labor
Department for all program agebts in participating Urban Coali-
tion communities. This data was reported scpaiately for Section
5 and Section 6. Comparisons and analyses were made of partici-
pants in Section 5 and Section 6 proarams. Because the data
from Section 6 was so limited, comparisons are inconclusive,
but they do suggest certain trends that warrant further
investigation.
Legislative Intent and Ambivalence
One major difficulty in assessing whether the program is
working as Congress intended is that Congress left a good deal
to chance.
While Congress set forth certain intentions and prescribed
general guidelines, much of the Emergency Employment Act is
worded in such a broad manner that it has been subject to a
variety of interpretations. This legislative nebulousness
permitted the Labor Department to introduce its own objectives
into the program, to concentrate on some provisions of the Act
while giving less weight to others, and to supervise the
-7-
administration of PEP programs locally in a permissive manner.
State and local governments were thereby encouraged in part
to make their own-PEP decisions in a way that would present
them with the least difficulties, regardless of the Act's
original intentions. Given their tight budget constra'nts and
natural responsiveness to political factors, it is little
wonder political jurisdictions have frequently taken the path
of least resistance.
Although the Act establishes target croups, most of which
contain heavy concentrations of "disadvantaged- people, some
view the Public Employment Program primarily--if not entirely--
as a counter-oyencal program to offset a severe economic re-
cession. One city repre!-ientati-7e has stated that "the designa-
tion of the legislation as the Emergency Employment Act of 1971
suggests that Congress was not creating an Act for the chronical-
ly unemployed, but rather for those segments of the work force
which normally are employed, but because of the economic down-
turn and changing national priorities found themselves out of
work." While some others would not go this far, they would in-
sist that the EEA was not intended as a measure that would gire
any priority to the chronically unemployed population.
The legislation does indeed mention work opportunities for
"times of high employment," and it does include a "trigger"
device that would shut off Section 5 funds if the national
-8-
unemployment rate should fall below 4.5 percent. In that sense
there is a counter-cyclical feature in the Act. Yet this does
not appear to warrant the observation that the PEP is intended
primarily as a program for those displaced by the economic down-
turn. Nor does it gainsay the extensive concern with the
chronically unemployed expressed in the Act, in the Congressional
hearings preceding passage of the legislation and by the prin-
cipal drafters of the bill. The Coalition's view is in line
with the position of the National Advisory Committee on Manpower.
In an article prepared for the C --cree, Eli Ginzberg, its
chairman, wrote: "At no point did the NMAC view PEP primarily
as a counter-cyclical device; rather, it viewed PEP as an
approach which held promise of removing employment barriers from
the path of seriously disadvantaged groups. 11
Section 2, in discussing target groups, explicitly stresses
the particular difficulties of low-income, low-skilled, welfare-
dependent and chronically unemployed persons in times of high
unemployment. Section 7(c)(2) requires that program agents
"plan fi)r effectively serving on an equitable basis the signifi-
cant segments of the population to be served...." The special
Section 6 program was included to ensure coverage of "areas of
substantial unemployment," where a large number of the chronically
unemployed can be found.
11. Eli Ginzberg, Perspectives on a Public Employment Program,prepared for 33rd meeting of National Manpower AdvisoryCommittee, June 16, 1972, p. 15.
-9-
The Act provides for funding of high unemployment areas .
within cities and counties as well as entire cities or coun-
ties having 6 percent or more unemployment. It is logical
to assume that if Congress had been interested in providing
funds only to those cities affected by the recession and by the
cutback in defense and/or the aerospace industry, it would have
provided the funds only to entire cities or counties. By in-
cluding areas and neighborhoods, Congress was expressing its
_intent to provide specifically for disadvantaged people who
had a continuing problem of unemployment--namely, those in the
disadvantaged areas of the cities, counties and rural areas.
The Act is more specific about training and supportive
services, although some important questions are left unanswered.
While expressing the intention of providing "related training
and manpower services," Congress specified that not less than
85 percent of all EEA funds in Section 5 should be used for
wages and employment benefits, thereby leaving little money
for training and supportive services.
When the House-Senate conference committee considered a
version of Section 6 which had been included only in the
Senate bill, the conferees approved the section but--undoubtedly
due to oversight--did not allocate funds for administration and
training and supportive services. The Department of Labor
allocated administrative funds for projects funded under
Section 6 because it was not rational to assume that those
-10-
projects could operate unless funds for administration were
available. It seems only logical that training and supportive
services also were essential for the successful op:',7ation of
Section 6 projects, particularly in view of the c'laracteristics
of the chronically unemployed living in areas of "high severity"
unemployment.
There was some indication in the Congressional hearings
that Congress, in its anxiety to Channel as much money as possi-
ble directly into the hands of the unemployed, assumed that
whatever training and supportive services might be needed could
be financed from existing manpower and social service programs.
Had truly comprehensive manpower programs been operative and
had supportive service programs not been overburdened already,
a marriage between PEP and other programs might have been
negotiated. Unfortunately, this marriage was to be impossible.
The Act's intentions could not be fulfilled by the resources
Congress allocated.
One further area was left unclear by the Act. The goal
of filling "unmet needs for public services" could mean different
things to different people.12 The Act identified a range of
public service fields, but it ,did not answerthe important
question of by and for whom these needs were to be met. It
neither required nor encouraged an effective community process
for selecting these needs on a priority basis. What was the
12. Ibid., Section 2(5).
-11-
primary consideration to be? The expansion of the traditionally
popular public services such as public works and transportation?
The extension of the social services programs? Services par-
ticularly needed by the target groups and poverty areas? Pub-
lic services for areas recently hard hit by city budgetary
constraints? Administrative jobs for which certain skills
were required?
National Urban Coalition Assumptions
The National Urban Coalition believes that there is sufficient
evidence, in both the legislation and the Congressional hearings,
to indicate that the low-income and chronically unemployed popu-
lation was intended to be a major priority of the Emergency
Employment Act. The designation of target groups, most of which
have high correlations with a large number of the chronically
unemployed, appears to reinforce this assumption, as does the
inclusion of a separate section for high unemployment areas.
Moreover, any measure that is introduced to combat unemployment
problems in times of high unemployment should deal significantly
with the groups that are hardest hit during those times--the
poor and the chronically unemployed. This is not to say that
we regard PEP as a program solely for the chronically unemployed.
We feel, however, that any evaluation of a public service em-
ployment program should seriously take into consideration the
extent to which this group received priority attention.
-12-
Our position on training and supportive services is
directly related to our first assumption that the poor and
chronically unemployed should be a significant priority of
any public service employment program. If these peopleWho
are likely to lack the necessary education, skills and employ-
- ment habits--are to compete in the permanent job market and to
climb career employment ladders, they will need positive re-
inforcement through training and supportive services, just as
poor and deprived children require compensatory education to
obtain equal educational opportunities. As Secretary of Labor
James Hodgson acknowledged before the House Select Subcommittee
on Labor during hearings on March 17, 1971, a public service
employment program "is most useful when combined with some sort
of training component...."13 Any evaluation of the PEP therefore
must examine closely the extent to which such support is being
provided, at least to*those program recipients who have the
greatest need for it. This requirement is all the more impor-
tant because existing manpower training and service programs
are not sufficiently comprehensive, are inadequate and are already
oversubscribed.
Our third major assumption is that the definition of unmet
public service needs must be broad enough to encompass community-
wide considerations. It should not be limited to either the
immediate needs of understaffed local government bureaucracies,
13. Hearings before the Select Subcommittee on Labor, Committeeon Education and Labor, House of Representatives, p. 249.

-13-
the understandable self-interest considerations of local government
employees seeking greater security and advancement, the pressure
of politicians acting on behalf of special constituencies or
the interests of any particular group or faction. Nor should
unmet public service needs be determined casually and without
careful consultation with community groups. In short, the
Coalition believes that the process tnrough which public service
priorities are formulated tends to be a good indicator of their
value and potential utility. Any study of the PEP, therefore,
has to look at the way public service needs were determined and
at whether the determined needs corresponded to the priorities
of community groups.
-14-
II SUMMARY OF FINDINGS AND TREY:7)S
Several significant trends in the administration of the
Public Employment Program emerged clearly from the National
Urban Coalition's study:
1. The Labor Department ruled that otherwise eligible applicants
with populations of less than 75,000 were ineligible to
receive funds directly from the Labor Department as Pro-
gram Agents, although Congress had set no population
limits.
2. The Labor Department's decision to alter Congress' formula
for the allocation of EEA money resulted in a distribution
of Section 5 funds that provided different allocations to
different states and cities with the same numbers of people
unemployed.
3. In cases where entire counties or cities had unemployment
rates above 6 percent, no effort seems to have been made
to define sub-areas with particularly'high rates of
unemployment and extraordinary special needs.
4. The Labor Department distributed Section 6 funds among
cities and counties in a manner that eliminated many
eligible "areas" with over 6 percent unemployment.
5. Characteristics of the enrollees do not seem to match
characteristics ofthe unemployed. While 52 percent of

-15-
poor people had an eighth grade education or less, only
7 percent of the PEP enrollees had an eighth grade edu-
cation or less. Concentrated efforts to place experienced
and educated applicants in jobs in the private sector
could have been made before they were placed in federally
supported jobs.
6. Retired army officers with pensions were included under
the veteran preference status. (Although technically
they qualified, this certainly was not within the legis-
lative intent.)
Tz.-- Congress did not provide adequate funds to cover the cost
of training and supportive services under Section 5.
8. Open Civil Service jobs have not been allocated on a priority
basis to PEP enrollees, nor have cities provided new
budget allocations for their permanent employment.
9. Most of the cities, counties and states surveyed had not
even started to implement the objective of modernizing
outdated Civil Services practices, to bring the sponsor
into compliance with U. S. Civil Service Commission
Guidelines specifically developed for PEP.
10. Although Program Agents were required to identify."unmet
public service needs," most did not. Jobs were often
filled primarily on the basis of the needs of a City

-16-
Administrator or Department rather than the needs of the
people in the community served.
11. Program Agents did not employ many of the specified target
groups--youth, older workers or those having particular
difficulty finding jobs in the high unemployment market.
12. Most of the jurisdictions in the study sample did not
undertake the task of identifying and/or creating employ-
ment within expanding occupations likely to provide the
best opportunity for continued employment and career
building.
13. There is an apparent wage differential between those
employed under Section 5 and Section 6 that warrants
further investigation by the Labor Department.
-17--
III SELECTIC,N OF PROGRAM AGENTS
On July 28, 1971; representatives of the Labor Department
testified on the initial appropriation for the EEA in hearings
before the House Appropriations Subcommittee that handles
funds for the Department. The Department, both in prepared
testimony and in response to Committee questioning, stated
that it intended to depart in several respects from the specific
requirements of the legislation.
It is important to note that the Appropriations Committees
do not deal with the substantive features of legislation; their
responsibility is to determine how much of the money authorized
under a law will be appropriated. Congress expressed its inten-
tions in the Act, which had already passed. The substantive
issues had already been decided. The Labor Department's report
to the Appropriations Committee announcing administrative
changes in the legislative provisions cannot be interpreted
as Congressional sanction or approval of those changes.
Under Section 5 of the legislation, eligible applicants
could be federal, state and general local government or public
agencies and institutions which are subdivisions of state or
general local government, and Indian tribes.1 Section 6 takes
a similar approach; it specifically states that "any unit or
combination of units" of general local government is an eligible
applicant. 2
1. Section 4 (1) (2) (3) .2. Section 6(c) (2)

-18-
In response to z request by Rep. Daniel J. Flood, D-Pa.,
chairman of the Subcommittee, for a definition of "area," the
DepartMent replied: "The Act does riot specify; just an area.
So we have chosen to regard areas as cities and counties with
populations of 75,000 or more.° What the Department proposed
in its testimony--and later established--was:
"The heads of local units of government (cities,
counties, states) will be the principal agents of
the Secretary of Labor....These agents will, on our
behalf, deal with the sub-units within their juris-
diction, thus precluding a complex overburdening
federal involvement at the local level. Units of
government of 75,000 or more will be eligible to
participate individually. Smaller units will be
covered under the 'balance of state' and the
governor or eligible county will act as our agent."4
Sponsorship, thereby, came a matter of who could initiate the
grant process rather than who w_s legally entitled to sponsor a
program. The Labor Department invited governmental units of
75,000 and above to submit applications, as they stated in
their testimony to the Appropriations Committee. The only
applications that were considered were those from governmental
units of the size designated, who received an invitation to bid.
3. EEA Appropriation, Fiscal Year 1972. Hearings before aSubcommittee of the Committee on Appropriations, House ofRepresentatives, 92nd Congress, First Session, p. 6.
4. Section 5 - IIIA, Eligible Applicants.

-19-
The Act, as written, established standards and criteria
for determining target populations, job priorities, the areas
that were to be served and the servicing of "unmet needs,"
In fact, the House and Senate had made a special effort to
assure that their wishes on this bill were clearly spelled out.
Yet the Labor Department expressed to the Appropriations Com-
mittee its intent to act as though the bill were largely a
"revenue sharing" measure whereby specific standards and
criteria for the expenditure of funds would be determined
locally, 'ether than regulated by the Department as prescribed
by the legislation. The Department indicated that "there will
be a minimum of Federal involvement in the program at the local
planning and application stage...."5 The Department also told
the Committee, "We are leaning in the direction of setting
some broad guidelines, but letting the local people, within
the definition of the Act, decide who to put on."6
The Department acknowledged its intent to get money out
as fast as possible, and stated that normal procedures would
be bypassed. Rep. George H. Mahon of Texas, Chairman of the
House Appropriations Committee, noted that this "opens the gate
for all kinds of mismanagement and even possible scandal."7
The appropriation for the EEA was passed and the Department
proceeded to write its Regulations and Guidelines according
to the changes it had suggested to the Appropriations Committee.
5. Hearings, p. 2.
6. Hearings, p. 29.
7. Hearings, p. 16.
-20-
The message was clear. A "Program Agent" was one who is
invited by the Secretary of Labor to apply. The Guidelines
state flatly, "The Secretary of Labor will designate Program
Agents in advance and list them in the Federal Register."8
According to the Labor Departmnt, "What the Department did
was to establish administratively Program Agents, which are
all states and other governmental jurisdictions with 75,000
or more population, and selected reservation Indian tribes.
These Program Agents receive funds directly from the Depart-
ment through a grant agreement in which they in turn agree to
distribute the funds to other eligible applicants. If the
Department had chosen to deal directly with all eligible appli-
cants, it might have had to deal with anywhere from 20,000 to
80,000 units of government, depending upon what is incln-led
in 'units of government'. "9
Contrary to the wording and spirit of the legislation,
cities, towns and counties of less than 75,000 population were
designated "balance of state," and their states were desig-
nated as Program Agents; even though the states were not
"eligible applicants" for Section 6 under the legislation.
Therefore, cities and counties which should have been able
to qualify as eligible applicants for Section 6 were dependent
on the states for allocation of funds. As the Program Agents,
these states were able to'retain a portion of the limited
amount of administrative funds available.
8. Guidelines, III.9. Labor Department Memorandum to The National Urban Coalition.

-21-
With the exception of about 700 selected jursidictions,
all Section 5 EEA funds were routed through governors'
offices for their own use or for distribution by them to
local areas. In addition to administrative costs, the state
received some of the funds allocated to local jurisdictions
which had-state public employees, based on the ratio of
state public employees to all public employees in these
local jurisdictions.
-/2-
IV ALLOCATION OF SECTION 5 FUNDS
The Act requires that 80 percent of the $750 million
allocated among the states for Section 5 shall be:
...allocated by the Secretary in such amanner that of such amounts (1) not lessthan 80 per centum shall be apportionedamong the states in an equitable manner,taking into consideration the proportionwhich the total number of unemployed per-sons in each such state bears to suchtotal number of such persons, respectively,in the United States....
In addition, sub-section (b) states that:
The amount apportioned to each state underclause (1) of sub-section (a) shall be ap-portioned among areas within each suchstate in an equitable manner, taking intoconsideration the proportion which thetotal number of unemployed persons ineach such area bears to such total num-ber of persons, respectively, in thatstate. 2
At the House hearings on appropriations to implement the
bill, the Labor Department stated that the allocation formula
was to be developed by the Secretary: "Two factors are in our
formula. One is the amount of unemployment and the second is
the severity of unemployment."3
According to the testimony, the formula used by the
Department was to be based on the "total number of unemployed
in the States compared with the total number in the Nation.
1. Section 9a.2. Ibid.3. Hearings, p. 7
-23-
Then, with equal weight, the number of unemployed over
4-1/2 percent as compared with the number of unemployed in
the Nation over 4-1/2 percent."4
The same double formula for allocation among the states
was to be used within a state.
The Labor Department claims that it did not alter, the
Congressional formula for the allocation of EEA funds. It
supports this view by citing the fact that it did "take into
consideration the proportion which the total number of unem-
ployed in each state bears to the total number of unemployed
persons in the United States," since this consideration con-
stitutes one-half of the allocation formula, The Department
also points to the General Accounting Office's sanction of the
formula and the defeat in the House, during debate on the ap-
propriations bill, of an amendment that would have provided
that the allocation formula be based solely on the proportion
of total unemployed persons in the country.
There remains a real question, however, whether the
injection of a severity factor in the allocation of Section 5
funds was in line with the spirit of Congressional intent.
The language of the Emergency Employment Act itself, stressing
an "equitable manner" of distribution, as well as the Con-
gressional hearings and the deliberations of the House Education
4. Ibid.
-24-
and Labor Committee, point to a Congressional intent that was
far more concerned with equitable allocations based on total
unemployment than with considerations of severity. This argu-
ment appears particularly persuasive, since Congress authorized
Section 6 specifically to deal with areas with high rates of
unemployment. The Senate, which had included a severity fac-
tor in its bill, accepted Section 6 as a fulfillment of its
concern about the severity of unemployment.
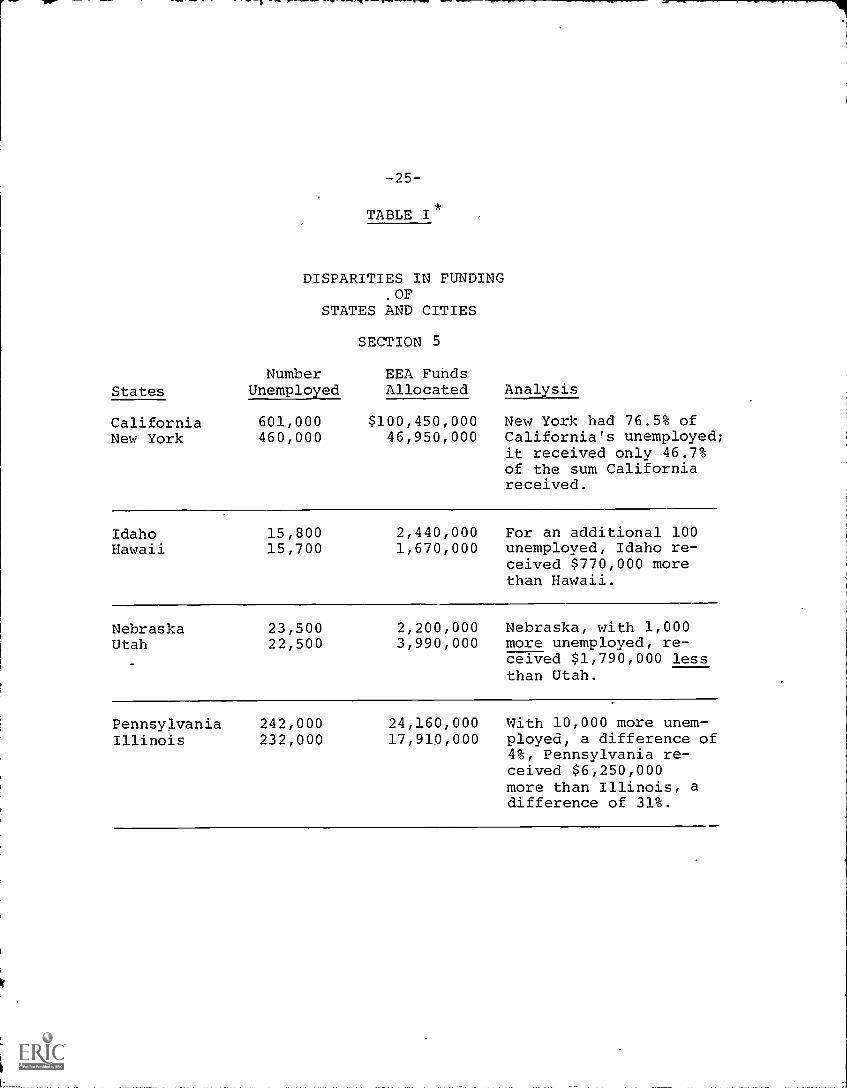
The double formula introduced by the Department has
created a marked disparity in the funding of various states
and cities. Table I illustrates some of these differences.
-25--
*TABLE I
States
DISPARITIES IN FUNDING.OF
STATES AND CITIES
SECTION 5
Number EEA FundsUnemployed Allocated
California 601,000 $100,450,000New York 460,000 46,950,000
Idaho 15,800 2,440,000Hawaii 15,700 1,670,000
Nebraska 23,500 2,200,000Utah 22,500 3,990,000
Pennsylvania 242,000 24,160,000Illinois 232,000 17,910,000
Analysis
New York had 76.5% ofCalifornia's unemployed;it received only 46.7%of the sum Californiareceived.
For an additional 100unemployed, Idaho re-ceived $770,000 morethan Hawaii.
Nebraska, with 1,000more unemployed, re-ceived $1,790,000 lessthan Utah.
With 10,000 more unem-ployed, a difference of4%, Pennsylvania re-ceived $6,250,000more than Illinois, adifference of 31%.
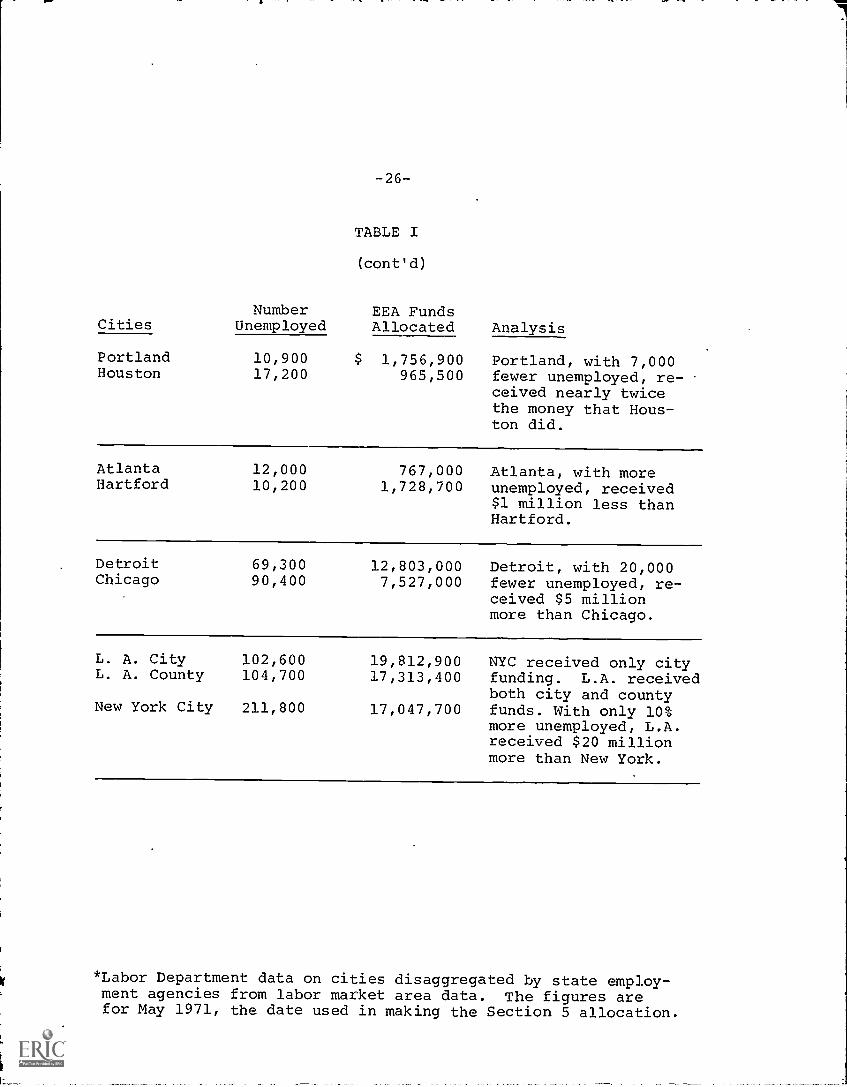
-26-
TABLE I
(cont'd)
CitiesNumber
UnemployedEEA FundsAllocated Analysis
PortlandHouston
10,90017,200
$ 1,756,900965,500
Portland, with 7,000fewer unemployed, re-ceived nearly twicethe money that Hous-ton did.
Atlanta 12,000 767,000 Atlanta, with moreHartford 10,200 1,728,700 unemployed, received
$1 million less thanHartford.
Detroit 69,300 12,803,000 Detroit, with 20,000Chicago 90,400 7,527,000 fewer unemployed, re-
ceived $5 millionmore than Chicago.
L. A. City 102,600 19,812,900 NYC received only cityL. A. County 104,700 17,313,400 funding. L.A. received
both city and countyNew York City 211,800 17,047,700 funds. With only 10%
more unemployed, L.A.received $20 millionmore than New York.
*Labor Department data on cities disaggregated by state employ-ment agencies from labor market area data. The figures arefor May 1971, the date used in making the Section 5 allocation.
-27-
V OPERATION OF SECTION 6
Congress included Section 6 in the Act to provide funds
specifically for counties, cities and areas with excessively
high unemployment rates (over 6.0 percent).
The importance of the term "area" is critical in assessing
the Section 6 program. The Labor Department's Guidelines
stipulate that applications "will include a specific defini-
tion of the areas to be assisted and the basis upon which
these recommended areas were selected." In any city where
the over-all unemployment rate exceeded 6 percent, the FrJgram
Agent still was obliged to select and specify those neighbor-
hoods or other special "areas" in which unemployment was par-
ticularly high, or at least identifiably higher than other
areas under the sponsor's jurisdiction.
The Department's Regulations require that where a city
or county experiences an unemployment rate over 6 percent and
where the rate in sub-areas within that city or county is
appreciably higher, the sub-areas will be recipie'nts of
greater amounts of Section 6 funds. No section of a city
or county receiving funds under Section 6 which has less than
6 percent unemployment is to provide employment for partici-
pants. Nor should funds be spent to hire participants in any
sub-area which has less than 6 percent unemployment.2
1. Guidelines Section 6 IV-D.2. Guidelines Section 6 III B Eligible Areas.
-28-
Malcolm Lovell, Assistant Sedretary of Labor for Manpower,
is quoted as having said in August 1971 that "preference will
be given to programs where area residents serve their own
neighborhoods." This would have been a most laudable approach
to utilization of the Section 6 funds. However, there is no
evidence, either in the Section 6 proposals or in the informa-
tion from the Urban Coalitions, that a preference was given
by the Department or that Program Agents tried to develop such
a program.
The proposals and the local survey instruments indicate
that in most of the cities involved in this study, no effort
was made, nor was any system established, to introduce an area
emphasis for Section 6 programs, where the entire city or county
had an unemployment rate above 6 percent. Nor is there any
indication that attempts were made to recruit area residents
for jobs that would serve unmet public service needs in their
own neighborhoods.
The proposals and surveys show that, where designated areas
received Section 6 funds, participants were selected or were be-
ing selected from the designated areas of highest unemployment.
In those cases where the entire city was designated to receive
Section 6 funds, only one city indicated that target areas were
defined on the basis of severity of unemployment or that par-
ticipants were being selected from these areas as" required in
the Guidelines.
-29-
With respect to the verification of residence in designated
areas, only three Program Agents indicated that a random sample
of participants was visited. Two required that the participant
be certified by a social agency in the area. About one-third
required proof of address by automobile license or other
identification. The remainder required no verification.
The Labor Department's Rules and Regulations and Guidelines
did not define how Section 6 funds were to be distributed among
the qualifying areas, cities and counties--except to reiterate
the legislation, which permitted designation of any city, county
or identifiable area having an unemployment rate over 6 percent.
Members of the Department staff indicated that the cities and
areas were funded on the basis of a formula incorporating the
percentage of unemployed persons over 6 percent and the number
of unemployed, where that allocation would require $25,000 or
more. Model Cities, Office of Economic Opportunity and Economic
Development Administration staff members indicate that they
identified many areas that were not funded at all, but which had
over 6 percent unemployment and a number of unemployed persons
large enough to warrant an allocation of more than $25,000.
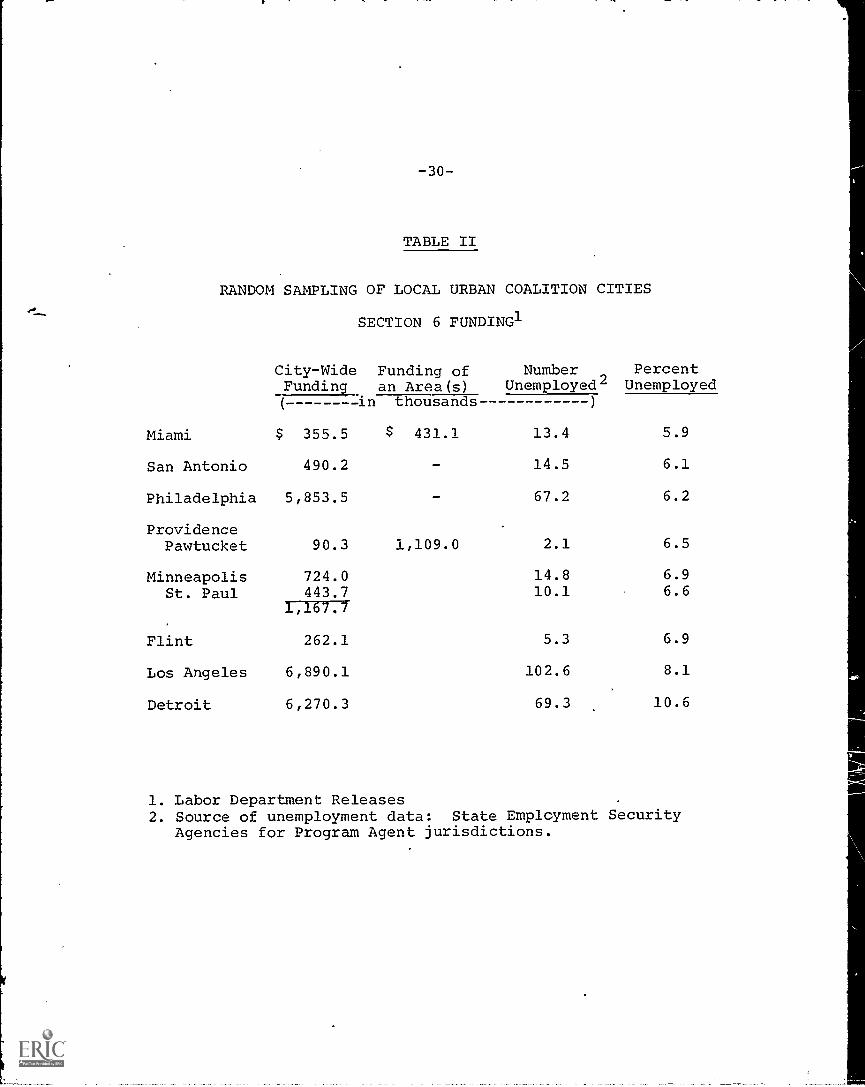
-30--
TABLE II
RANDOM SAMPLING OF LOCAL URBAN COALITION CITIES
SECTION 6 FUNDING'
City-WideFunding
Funding ofan Area(s)
NumberUnemployed2
PercentUnemployed
(in thousands )
Miami $ 355.5 $ 431.1 13.4 5.9
San Antonio 490.2 14.5 6.1
Philadelphia 5,853.5 67.2 6.2
ProvidencePawtucket 90.3 1,109.0 2.1 6.5
Minneapolis 724.0 14.8 6.9
St. Paul 443.7 10.1 6.61,167.7
Flint 262.1 5.3 6.9
Los Angeles 6,890.1 102.6 8.1
Detroit 6,270.3 69.3 10.6
1. Labor Department Releases2. Source of unemployment data: State Employment Security
Agencies for Program Agent jurisdictions.

-31-
Table II is organized in order of the percent unemployed.
Only cities that were funded city-wide were included, because
there was no nossibility of determining the unemployment rate
and number unemployed for individual areas within a city.
Area data was not included in most Section 6 proposals, and
the local Urban Coalition staff conducting the survey could
not obtain it in most cases from either the Program Agents or
the Employment Service.
When the House and Senate versions of the emergency employment
bill were combined, the language left unclear whether all Section
6 funds were to be assigned to wages and fringe benefits or
whether the allocation of funds under Section 6 operated under
the same formula as Section 5, assigning 85 percent of the
funds to wages and fringe benefits.
According to the "Labor Department, "Section 10 of the Act
states that money for training and manpower services is not to
exceed 15 percent of the funds appropriated under Section 5.
Hence, the Department determined that it could use only Section
5 monies for training and supportive services. However, recog-
nizing that Section 6 participants might need training and sup-
portive services, the Department issued a memorandum to the
field which gave Program Agents permission to use-Section 5
monies for these purposes for Section 6 participants. "3
3. Labor Department memorandum to The National Urban Coalition,July, 1972
-32-
Unless Section 6 Program Agents were urged or required to
use funds for training and supportive services, they could not
have been expected to do so, in view of the reluctance of
administrators to transfer funds from one category to another.
Moreover, the residence restrictions to high-unemployment,
poverty areas in Section 6 made it easier for Program Agents
to use Section 5 funds for Section 5 participants. A permissive
memorandum to the field was not sufficient to provide needed
training and supportive services to Section 6 participants.
Had the Department wanted to encourage such a policy, it could
have either allocated a specific amount of money from Section 5
funds for services to Section 6 participants or made an adminis-
trative decision to permit a portion of Section 6 funds to be
used for these purposes.
Because Program Agents could not operate programs' without
some allowance for administrative costs, the Labor Department
allowed use of Section 6 funds to cover administrative costs
of Section 6 programs. It is difficult to understand why a
similar practice could not have been followed for training
and supportive services, particularly because persons employed
under Section 6 were likely, in most cases, to be the most
difficult to place unless training and/or supportive services
were provided.
-33-
Without readily available training funds, the cities
inevitably selected participants who already were trained to
perform the jobs selected. Through the Guidelines, the Labor
Department in effect made a decision that no funds would be
available for training or supportive services for Section 6
participants and that, only 3.2 percent of these funds would
be available to cover the cost,of program administration. 4
4. Guidelines Section 6 IV D. Application by Program Agents.
-34-
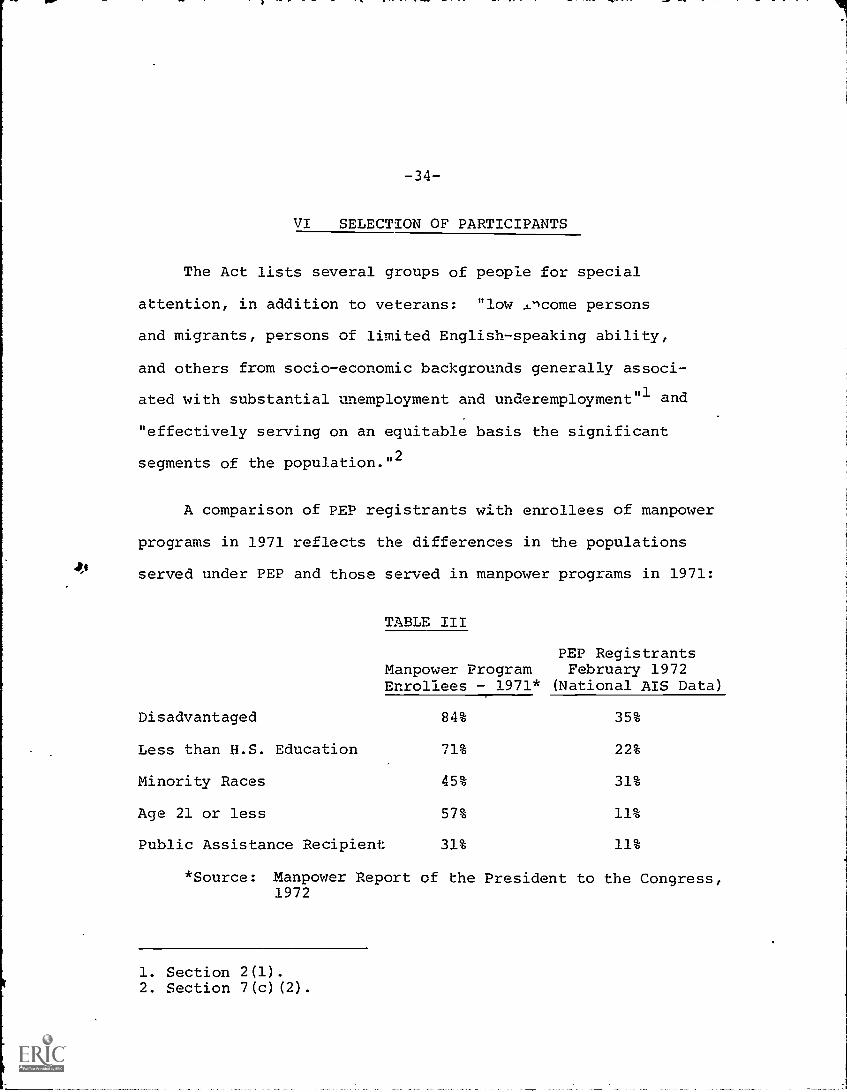
VI SELECTION OF PARTICIPANTS
The Act lists several groups of people for special
attention, in addition to veterans: "low income persons
and migrants, persons of limited English-speaking ability,
and others from socio-economic backgrounds generally associ-
ated with substantial unemployment and underemployment"' and
"effectively serving on an equitable basis the significant
segments of the population."2
A comparison of PEP registrants with enrollees of manpower
programs in 1971 reflects the differences in the populations
served under PEP and those served in manpower programs in 1971:
TABLE III
Manpower ProgramEnrollees - 1971*
PEP RegistrantsFebruary 1972
(National AIS Data)
Disadvantaged 84% 35%
Less than H.S. Education 71% 22%
Minority Races 45% 31%
Age 21 or less 57% 11%
Public Assistance Recipient: 31% 11%
*Source: Manpower Report of the President to the Congress,1972
1. Section 2(1).2. Section 7(c)(2).

-35-
Although the EEA is written as though it were a manpower
measure, the bill was designed as an employment program. The
"emergency" nature of the proposal was not an emergency for
the target groups listed in the Act, who had been suil:ering
from an unemployment rate in excess of 6 percent throughout
the previous period of low unemployment nationally. The em-
phasis, even in the title of the Act, was on "emergency
Employment." Although Congress wrote into the proposal all
the requirements of a manpower program--designation of a dis-
advantaged group for training, provision of training, provision
of steps for upward mobility, guarantee of a permanent job on
completion .of involvement in the program--these were written
loosely enough to give the Labor Department the opportunity
to broaden the interpretation of what Congress intended, to
emphasize the goal of speed and to leave broad decision-making
powers in the hands of the states and local communities.
The emphasis on distributing jobs equitably among unemployed
segments of the population warrants a careful examination of
the characteristics of those who were hired and their relation-
ship to characteristics of the unemployed. Because only 8
percent of the EEA participants were underemployed, the charac-
teristics of the total sample should match the characteristics
- of the unemployed.
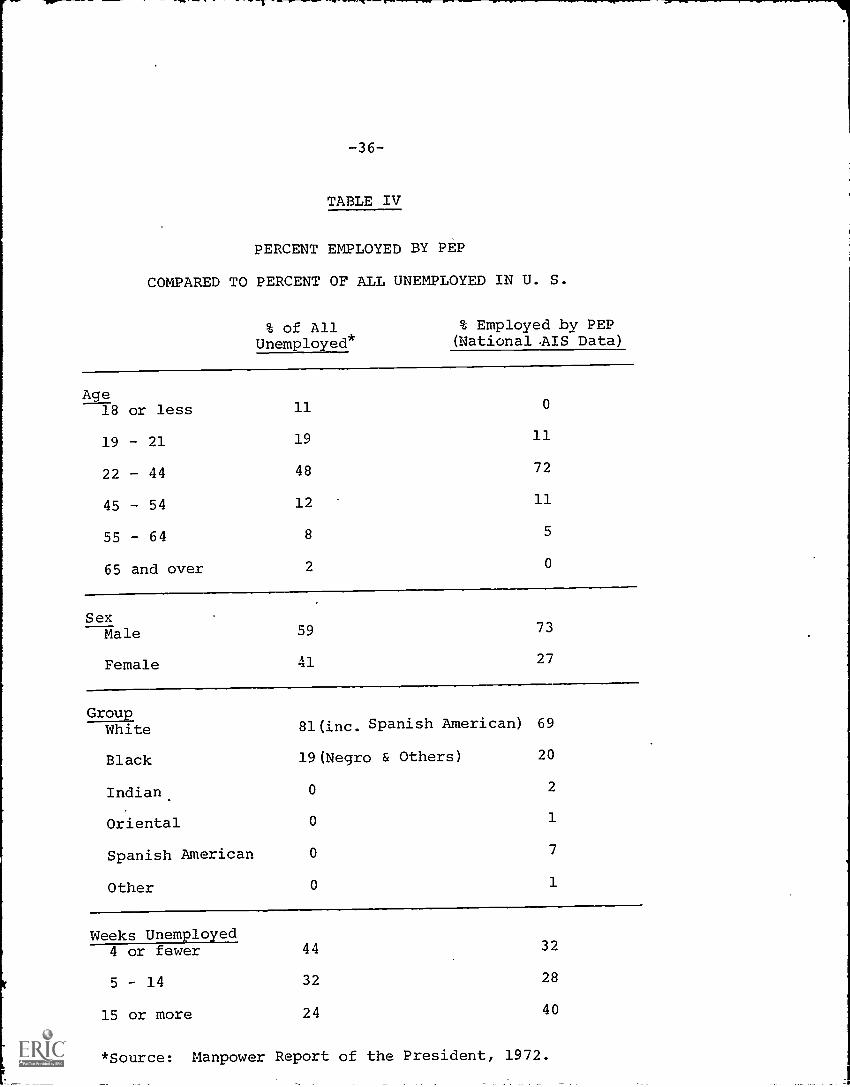
-36-
TABLE IV
PERCENT EMPLOYED BY PEP
COMPARED TO PERCENT OF ALL UNEMPLOYED IN U. S.
% of All % Employed by PEPUnemployed* (National AIS Data)
Age18 or less 11 0
19 - 21 19 11
22 - 44 48 72
45 - 54 12 11
55 - 64 8 5
65 and over 2 0
SexMale 59 73
Female 41 27
GroupWhite 81(inc. Spanish American) 69
Black 19(Negro & Others) 20
Indian 0 2
Oriental 0 1
Spanish American 0 7
Other 0 1
Weeks Unemployed4 or fewer 44 32
5 - 14 32 28
15 or more 24 40
*Source: Manpower Report of the President, 1972.
-37-
Accordingto AIS data, the national average of PEP
participants who are disadvantaged is 35 percent. However,
the study sample indicated a higher frequency of employment
for disadvantaged in urban areas--39 percent. No comparable
data is available for the percentage of unemployed persons
who are poor.
81 percent of all persons unemployed in the United States
are white, including the Spanish-speaking. The national AIS
data showed 76 percent of all those hired in PEP were white
and Spanish-speaking; 24 percent Negro and others. In urban
areas comprising the study sample, 40 percent were Negro and
11 percent Spanish-speaking. The cities, particularly, are
to be commended for their successful efforts to involve
minorities in the program.
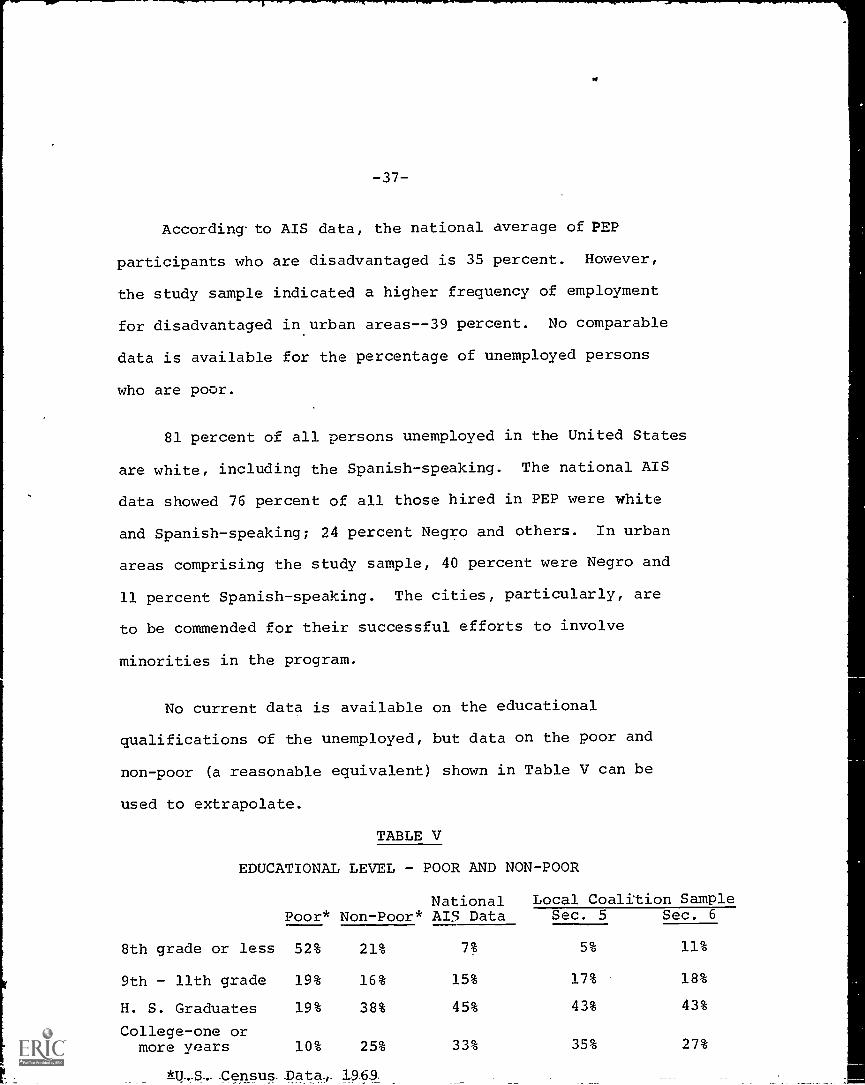
No current data is available on the educational
qualifications of the unemployed, but data on the poor and
non-poor (a reasonable equivalent) shown in Table V can be
used to extrapolate.
TABLE V
EDUCATIONAL LEVEL - POOR AND NON-POOR
NationalPoor* Non-Poor* A1$ Data
Local Coalition SampleSec. 5 Sec. 6
8th grade or less 52% 21% 7% 5% 11%
9th - 11th grade 19% 16% 15% 17% 18%
H. S. Graduates 19% 38% 45% 43% 43%
College-one ormore years 10% 25% 33% 35% 27%
tp..s,..census..Data.,. 1969-

-VS
-38-
Table V clearly shows PEP with a marked under-representation
of the undereducated, and an equally marked emphasis on those who
are high school graduates or above.
Many groups suffering high unemployment have been seriously
neglected under the PubliC Employment Program (Table XV, Appendix).
Virtually no 16-to-18-year-olds are included, and only 11 percent
of the enrollees are found in the 19-to-21-year-old category,
despite the fact that 30 percent of all unemployed persons are
21 and under. No enrollees were in the 65 and over category, and
only 5 percent were 55 to 64, while 10 percent of the unemployed
are over 55. 41 percent of the unemployed are women, but only
27 percent of those hired under PEP were women.
An example from-San Antonio is representative of many:
As part of the funding process, San Antoniosubmitted a grant agreement to the Department ofLabor. Using a DOL study of San Antonio's "SlumArea" (smaller part of the designated impact areafor Section 6 funds), the city cited the follow-ing statistics: 58 percent of the sub-area residentshad only finished 8th grade and 70.8 percent hadnot completed high school. Whereas, the city hiredpeople under Section 6 with the following educationallevels:
9 percent with 8 years or less of education(4 of the 45)
7 percent with 9 to 11 years (3 of the 45)53 percent with high school diploma (24 of
the 45) and31 percent with 13 to 15 years (14 of the 45)
Clearly, this illustrates an educational biason the part of the city. For a public serviceprogram that is specifically designed to aidthose who cannot obtain jobs within the privatesector because of the language barrier, their
1
39
minority or migrant status, or their lackof skills and educational achievement, theEmergency Employment Act in San Antoniohas been heavily concentrated with thoseof above average (for San Antonio) educa-tional levels. Over all, college graduatescomprise 13.4 percent; those with 13-15years comprise 32.9 percent; and highschool graduates comprise 45.7 percent.Those with only some high school (9 to 11years) total 4.3 percent, and those with8 years or less are only 3.7 percent ofthe total EEA participants. The peoplewith 8th grade or less education werehired as laborers (10), labor foreman (1),welder (1) and equipment operator (1).These jobs are low paying.
No compiled data is available for aerospace and defense-
related unemployed, but reports from Urban Coalitions indicate
these fields were given low priority in the cities sampled.
Another prob:lem revealed by some local Urban Coalition
samplings is that of military personnel who have served at
local Army bases and retired with government pensions. These
people also have been included under the "veteran" category- -
not a direct breach of the Act, perhaps, but not in line with
the legislative intent. No. current data exists about the num-
ber of retired military personnel hired under PEP. An investi-
gation of this situation, particularly in areas close to large
military bases, is very much in order.
The survey instruments were designed to yield information
about any special efforts made by PEP sponsors to recruit selec-
tively and hire the "significant segments" of the population
referred to in both the legislation and Guidelines. Precise
-40--
descriptions of recruitment, referral and hiring mechanisms
were sought from the local Urban Coalitions in an effort to
determine exactly what procedures were followed for assuring
the involvement of "significant segments" of the unemployed
in the local population.
The local Coalitions indicated that the Program Agents
generally hired the conventionally desirable participants and
accommodated whatever others were necessary to satisfy the
Labor Department's minimum Guidelines. Only two cities re-
sponded affirmatively to the question: "Was a special effort
made to hire residents of poverty areas for EEA jobs?" The
others gave a "no" answer, indicated the information was not
available or stated that "no special effort" had been made.
The inordinately high unemploymept rate across the
country meant that, in virtually all cases, recruitment as
such was no major problem for a Program Agent or its sub-
agents. One respondent to the Coalition's survey noted that
the "program had 10 applications for every job funded"--not
an atypical situation.
It appears that the principal mechanism for channeling
applicants to the appropriate Program Agent was either the
local Employment Service or the Program Agent's own Personnel
Department. Some Program Agents advertised positions. Others
made commitments in their proposals to use minority media and
community organizations, but neglected to do so.
-41-
The use of community manpower programs as resources for
recruitment and selection appears to have been minimal. While
"briefings" of new PEP employees took place, no substantial
"orientation" or training served as part of the entry system
in the sample cities. Since the program provided little money
for formal training--the method utilized being basically on-
the-job training through the ongoing supervisory process--the
provision of manpower services was bypassed in most cases.
To a question aimed specifically at determining the ratio
of participants selected from easily identified poverty
neighborhoods--such as-Community Action Agency target areas
or model neighborhood areas--only four respondents provided
meaningful answers. During the field interviews, only three
of the cities in the sample specifically described who had been
hired from CAA target areas of model neighborhoods, or other
identifiable poverty areas. In only four cases was the sponsor
able to describe the number or percentage of unemployed persons
in those areas--indicating that no analysis of the nature and
extent of unemployment in the poverty areas had been carried
out in preparation for the Public Employment Program.
"Preference" seems to have played a minor role in either
the recruitment or the selection process. With few funds
available to launch a specialized recruitment effort, preference
for the disadvantaged, the unskilled, the young, the elderly,
-42-
or women new to the labor market remained a neglected process.
Veterans were the only group for whom a major effort toward
placement was mounted.
The Rhode Island Coalition, in responding to the survey,
made the following observation regarding preference.
The [Program] statistics read: 71 percentwhite and 27 percent black. While on thesurface this appears to be non-discriminatory,artificial barriers to employment (exams andexperience) were very much in evidence.Most minorities were screened into low- ornon-career ladder type jobs. For example,there were 20 job openings for firemen.Recruitment was done through ES, newspaperads, and such. The Employment Service heldthe initial interviews; the Program Agentdid additional interviewing; and, an examwas given. Hiring was done by the ProgramAgent conditional upon a favorably physicalexamination. The Concentrated EmploymentProgram referred 10, the majority of whichwere black; the Opportunities Industrializa-tion Center referred 16 blacks; and, theModel Cities Program referred about a half-dozen blacks. All 20 who were hired forthe firemen's positions were white.
Data on individuals actually employed by the Program Agents
utilizing EEA funds point to a pattern of employing relatively
skilled, albeit unemployed, middle class persons (the majority
male)--both black and white. In general, applicants learned
of PEP positions through routine channels and applied for jobs.
Those who appeared most capable of performing the required
tasks were hired.

-43--
The work performed by the 70,000 employed under PEP was
compared to the work of those who were likely--because of age,
education or "disadvantaged" status--to have handicaps in the
labor market and were also among the groups designated to re-
ceive preference by the Act. (See Table VII.)
The four job areas employing the largest number in the
total group--Public Works/Transportation, Education, Other,
and Law Enforcement -- represent 73 percent of all jobs, while
the remaining five classifications--Health, Parks and Recrea-
tion, Social Services, Environmental Quality, and Fire Protec-
tion--represent 27 percent. (See Table XIII.)
The variation from the national distribution of jobs
suggests that those individuals with employment handicaps
have been concentrated in the jobs demanding the least skills
and offering the least opportunity for upward mobility.
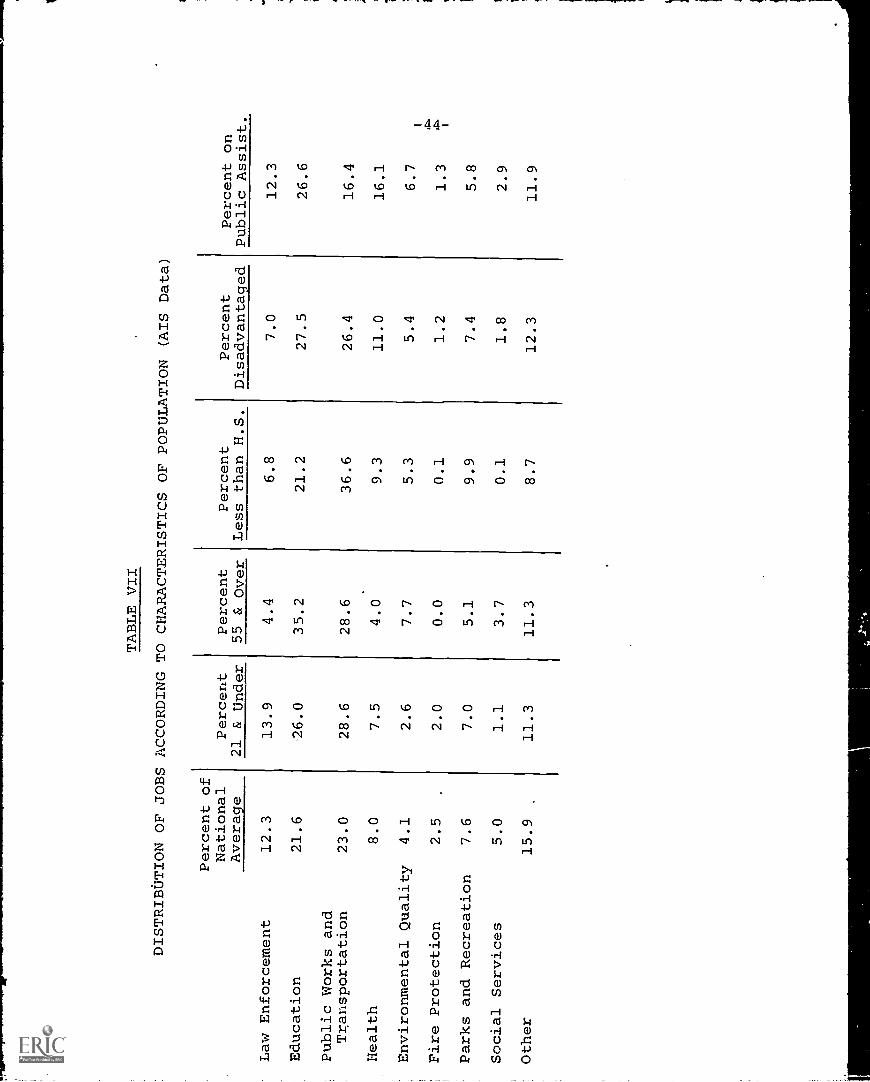
TABLE VII
DISTRIBUTION OF JOBS ACCORDING TO
CHARACTERISTICS OF POPULATION (AIS Data)
Percent of
National
Average
Percent
21 & Under
Percent
55 & Over
Percent
Less than H.S.
Percent
Disadvantaged
Percent on
Public Assist.
Law Enforcement
12.3
13.9
4.4
6.8
7.0
12.3
Education
21.6
26.0
35.2
21.2
27.5
26.6
Public Works and
Transportation
23.0
28.6
28.6
36.6
26.4
16.4
Health
8.0
7.5
4.0
9.3
11.0
16.1
Environmental Quality
4.1
2.6
7.7
5.3
5.4
6.7
4=2.
Fire Protection
2.5
2.0
0.0
0.1
1.2
4=2.
1.3
Parks and Recreation
7.6
7.0
5.1
9.9
7.4
5.8
Social Services
5.0
1.1
3.7
0.1
1.8
2.9
Other
15.9
11.3
11.3
8.7
12.3
11.9
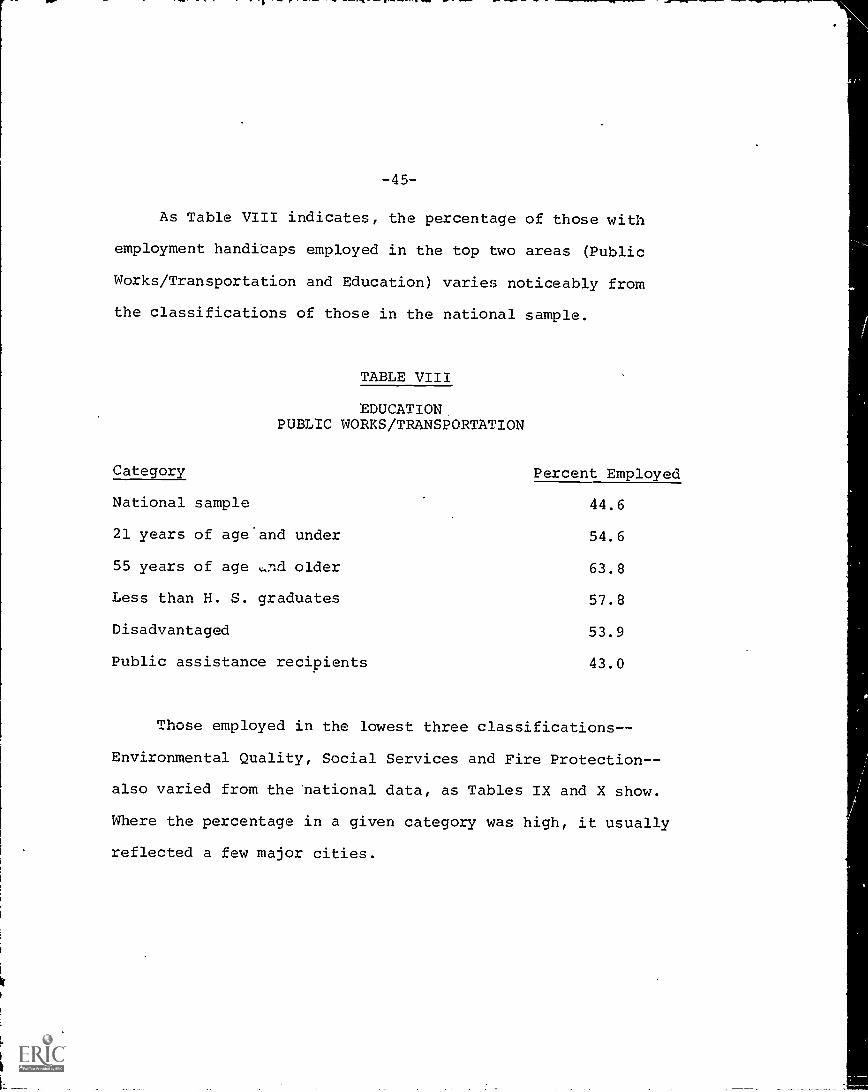
-45-
As Table VIII indicates, the percentage of those with
employment handicaps employed in the top two areas (Public
Works/Transportation and Education) varies noticeably from
the classifications of those in the national sample.
TABLE VIII
EDUCATION.PUBLIC WORKS/TRANSPORTATION
Category Percent Employed
National sample 44.6
21 years of age'and under 54.6
55 years of age ,nd older 63.8
Less than H. S. graduates 57.8
Disadvantaged 53.9
Public assistance recipients 43.0
Those employed in the lowest three classifications --
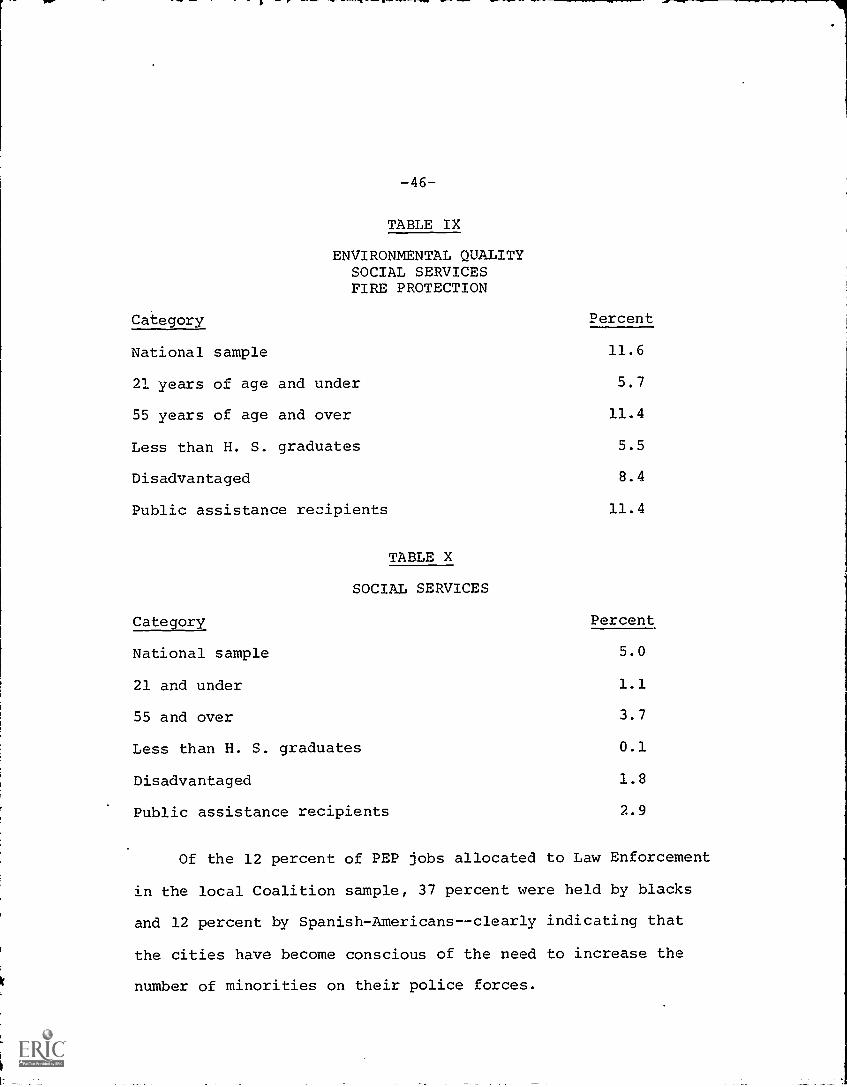
Environmental Quality, Social Services and Fire Protection--
also varied from the national data, as Tables IX and X show.
Where the percentage in a given category was high, it usually
reflected a few major cities.
-46-
TABLE IX
Percent
ENVIRONMENTAL QUALITYSOCIAL SERVICESFIRE PROTECTION
Category
National sample 11.6
21 years of age and under 5.7
55 years of age and over 11.4
Less than H. S. graduates 5.5
Disadvantaged 8.4
Public assistance recipients 11.4
TABLE X
SOCIAL SERVICES
Category Percent
National sample 5.0
21 and under 1.1
55 and over 3.7
Less than H. S. graduates 0.1
Disadvantaged 1.8
Public assistance recipients 2.9
Of the 12 percent of PEP jobs allocated to Law Enforcement
in the local Coalition sample, 37 percent were held by blacks
and 12 percent by Spanish-Americans--clearly indicating that
the cities have become conscious of the need to increase the
number of minorities on their police forces.
-47-
The same was not true of Fire Protection. Only 2.5 percent
of all jobs in the national data were in Fire Protection. Of
these jobs in the local Urban Coalition sample, only 10 percent
were held by blacks and 4 percent by Spanish-Americans, although
41 percent and 19 percent of the local Urban.Coalition PEP em-
ployees were black and Spanish-American, respectively. The
black and Spanish-American involvement was concentrated in a
few cities. Traditionally, there has been a serious shortage
of minority employees in fire departments across the country.
PEP could have been used more creatively to eliminate these
traditional barriers to employment of minorities.
Similarly, a small number--3 percent--of the jobs provided
under PEP were in Environmental Protection. Of those employed
in these jobs, however, 41 percent were black and 18.5 percent
Spanish-American. It appears that traditional barriers to
minority employment have not developed in those relatively new
job classifications.
Additional information is needed to determine precisely
what these jobs consisted of, whether the people with handicaps
received any training or other manpower services, and to what
extent they were given opportunity for permanent employment.
VII EMPLOYMENT,
Training, Administration
-48-
TRAINING AND SUPPORTIVE SERVICES
and Supportive Services
The Act states that "Not less than 85 percent of the funds
appropriated...shall be expended for wages and employment
benefits...."1 With this statement of intention Congress
placed in serious jeopardy the fulfillment of its intention
to provide related training and manpower services.2 With
only limited funds remaining, the Public Employment Program
at the local level was forced into one of two patterns.
Cities either were required to identify and fill jobs for which
no significant vocational training was necessary, or they had
to fill jobs demanding skills and education with persons al-
ready possessing those skills and education. The Act does not
provide sufficient manpower services to assure that individuals
who did not already possess the skills could be adequately
prepared for careers under the EEA.
The legislation requires that the program application
include "a plan for effectively serving on an equitable basis
the significant segments of the population to be served."3
This is a major feature of the legislation, for it in effect
requires the sponsoring agency to detail its strategy for
serving racial minorities, veterans, youth, older (over 45)
1. Section 3(b).2. Section 2.3. Section 1(c)' (2).

-49-
workers, women, the non-English-speaking and other categories
of workers who have disproportionately high unemployment rates.
It is precisely these sub-groups of the labor force who most
need training and related services in order to compete on an
equitable basis within the labor market. The non-English-
speaking require in-depth literacy training; young people fre-
quently are without marketable skills and ir need of extensive
vocational training; women with young children need d- -care
services.
Any plan for "serving on an equitable basis the significant
segment of the population to be served"4 therefore would
logically reauire a detailed training and supportive services
strategy. Yet Congress authorized so little funding for these
important components that its own requirements to give preference
to the target population cannot be met realistically unless jobs
for which few appreciable skills are necessary are designated
for EEA funding. With the best of intentions a Program Agent
would have found it difficult to involve an equitable cross-
section of the unemployed.
If a Program Agent selected the most likely option of
creating or filling technical and semi-technical jobs, thus
avoiding the neee to define and construct an underfunded
training or supportive service system, the sponsor then would
be obligated to hire from the portion of the labor force which
4. Section 1(c)(2).
-50-
already enjoys the greatest mobility and competitive advantaae
within the labor market. These persons are high school and
college graduates, predominantly male, between the ages of
22 and 45. 5 The tragic irony in this situation is that the
chronically unemployed were neglected once again by a program
designed to reach them. For the second quarter of 1971 the
unemployment rate for "urban poverty neighborhoods" stood at
10.1 percent while that for "other urban neighborhoods" was
only 5.8 percent. Unemployment of black youth in urban poverty
areas during the second quarter of 1971 registered a staggering
36.2 percent. In addition, unemployment rates for females held
consistently higher than those for males.6
The Labdr Department's Guidelines allocated only 10 percent
of EEA funds for administration and supportive services (the
remaining 5 percent was retained by the Department for its own
cost of administration, data collection and analysis and evalua-
tion). Of the 10 percent available to local or state Program
Agents, 3.2 percent was allocated for administration and 6.8
percent for training and supportive services. The proposals
submitted by the cities included in the study showed that 87.8
percent of the funds were allocated to wages and fringe benefits,
3.8 percent to training and supportive services and 8.1 percent
5. Data from the 1971 Fourth Quarter Report of the Bureau of
Labor Statistics, U.S. Department of Labor.6. See Appendix, Table XV AIS Data.
-51-
to administration.? The cities needed the administrative funds
to operate the programs, and those funds were provided; conse-
quently training and supportive services were underfunded.
Program Agents had to rely primarily on supervisor-on-the-job
training for whatever training and supportive services were
to be provided.
An analysis of the Section 6 proposals included in the
study showed that 92 percent of project funds was to be spent
on wages, 8 percent on administration and--in accord with the
Labor Department Regulations and Guidelines--virtually no
funds for training or supportive services. Ironically, the
Labor Department interpreted the legislation as not requiring
any training and supportive services for Section 6 programs8--
those intended to serve high unemployment areas with residents
most likely to need those training and supportive services.
The Labor Department's Guidelines stipulated that:
Because of the limitation of funds availablefor training and supportive services, Pro-gram Agents must make every effort to securethese services from existing agencies andFederally funded manpower training systemsand facilities. Among existing Federallyassisted manpower resources that should beexplored for linkage are the ConcentratedEmployment Programs, MDTA Program (par-ticularly area skill centers) and the Pub-lic Service Careers Program, Job Corps andWork Incentive program.9
7. This data was taken from an analysis of the proposals forUrban Coalition cities. The data is such that it might re-flect funds allocated by the local community. The UrbanCoalition recommends that DOL investigate this further.
8. See discussion of Section 6 in Chapter V._
-52-
A large city or heavily populated county that had these
resources might have accomplished this objective, provided
that political and bureaucratic barriers could have been kept
to a minimum and that job slots in those progr\ pms existed
without additional funding. Such possibilities were limited
and problematical. Even with a full spectrum of available man-
power programs, all the other diverse supportive components,
such as health services and coverage, day care, transportation-
although theoretically available to Program Agents--would have
been in short supply. The Department never issued a directive
to the Concentrated Employment Programs, Skill Centers, Employ-
ment Service Offices or any of the other manpower projects it
financed to reserve for PEP enrollees some portion of their
services which already had been funded. Without a directive,
there was no chance that existing manpower programs, already
overburdened and under pressure, would respond on a priority
basis to referrals by city and county personnel offices.
Apparently plenty of qualified or semi-qualified job seekers
were ready to move into PEP positions, providing an "easy" solu-
tion to a complex problem. A local government thus did not have
to make overtures to manpower programs for training resources
if it was prepared to take the expedient of recruiting those
most readily capable of filling the jobs rather than those most
in need of employment.

-53-
Local Urban Coalitions reported that in the majority of
cases the only training available was on-the-job training by
supervisors. Transportation and child care generally were not
available. Two-thirds of the respondents reported no pro-
vision for counseling. Most of the other third reported some
counseling by supervisors, who probably had no training in
counseling. About one-third received the same health examina-
tions and health coverage available to other civil servants
on hiring; the rest received no health services or coverage.
Most participants, once on the job, received the same fringe
benefits available to employees of the regular civil service
system.
Permanent Jobs
The Labor Department's Guidelines state that each Program
Agent and the employing agencies responsible to it must plan
to place at least half of the EEA participants in continuing
positions with the Program Agent or the employing agencies
financed through EEA. In all cases. the Program Agent must
set forth, in writing, any deviation from this requirement.
The cities in the Coalition sample are divided evenly on
the question of whether budget projections reflect permanent
jobs being held for persons= currently in EEA-supported jobs.
The responses to the field interviews indicate not only that
steps in this direction have not yet been taken, but that, in
-54-
some cases, the only service to be offered at completion of PEP
'will be the counseling of participants for private industry.
In only one case was a written commitment from sub-agents
submitted--the single instance where "first preference" for
PEP participants for placement in open civil service jobs
was stated unequivocally. The field surveys, moreover, did not
indicate that any special effort has been made to move people
out of PEP-supported jobs into regular civil service jobs as
those jobs become available.
It is too early to, expect that many PEP enrollees would
have moved into permanent positions, but it is not too early
for Program Agents to have obtained commitments that future
openings in similar classifications would be reserved for
PEP employees.
Career Advancement
The legislation farther requires that the jobs be designed
so as to develop opportunities for career advancement, pro-
vide opportunities for continued training and provide "transi-
tional" public service employment which would enable partici-
pants to move into public and/or private employment. The
legislation refers to career advancement of participants and
to the provision of skills that are expected to be in demand.
In view of the limited training and other manpower services
available, Program Agents can do little to translate the concept
of new careers and career advancement into practice.
-55.-
"Career advancement" usually can be achieved only by investing
training funds and time in the employee. The requirement for the
retention in permanent employment of a minimum of 50 percent of
PEP employees cannot be treated lightly because considerable
planning, time and funds are usually needed to meet it. The
Labor Department's administration of the program does not ade-
quately reflect these considerations. Nor do the Guidelines
indicate how this requirement is to be enforced.
The creation of new careers was another stated objective
of the legislation.1° It can be argued that with slow and care-
ful planning, and with skillful negotiation, Civil Service Com-
missions and municipal personnel offices could have developed
PEP projects to serve a "new careers" objective. But the tre-
mendous speed with which the Labor Department required cities
to prepare their applications for funding, and all the ensuing
pressure for quick "results," blocked incentives for formulating
carefully phased career development models.
Perhaps the "new careers" were new to some individual employing
agencies, but on the whole this was scarcely a new classifica-
tion. Job restructuring was a rare development. The law stated
that job restructuring was to be accomplished "to the maximum
extent feasible." However, agencies that made no efforts at
job restructuring can not be said to have complied with Con-
gressional intent. Career ladders, another requirement, were
10. Section 7 (b) (1)(2).

-56-
being built in a few cases; in some cases the career ladder
consisted of moving from Assistant Director of an agency to
Director of an agency--scarcely what Congress intended by
"career ladder."
Unions1
The Act provides labor organizations with the opportunity
to comment on the PEP proposals both to the applicant and to
the Secretary. 11 Only two proposals from the sample Coalition
cities included comments from appropriate labor unions--one
favorable and one unfavorable. The Labor Department admitted
that it did not have time to consider most of the comments
that were made in the proposals.
Some unions were upset with that section of the Guidelines
and Regulations which defined an underemployed person as one who
is "working for an employer other than the Program Agent" be-
cause that eliminated any opportunity for upgrading civil servants
and members of the union who already were employed by the Program
Agent. The unions felt this decision by the Labor Department
adversely affected their membership.
In almost all cases where a union was operative, the
employees of PEP, once hired, did receive the opportunity to
obtain union status and union benefits.
11. Section 12(c).

-57-
Civil Service Guidelines
The legislation requires assurances that theprogram will, to the maximum extent feasible,contribute to the elimination of artificialbarriers to employment and occupationaladvancement, including civil service require-ments which restrict employment opportunitiesfor the disadvantaged
and
...assurances that agencies and institutionswill undertake analysis of job descriptionsand a reevaluation of skill requirements atall levels of employment, including civilservice.12
Local Urban Coalitions participating in the sampling report
that some Program Agents are following normal civil service
hiring procedures and others have been beset by time constraints
and program deadlines. Even more significant is the indication
that many of the Program Agents have not yet come to grips with
the civil service issue. Comments such as "Our job descriptions
are not that strict or binding--we have very flexible job descrip-
tions and have not had a need to revise them" and "no evidence
to date as to the implementing of merit or civil service program"
indicate that some Program Agents need to focus on the equita-
bility and appropriateness of their hiring and employment
practices required by EEA Guidelines.
One Coalition respondent in the field survey noted that
"although responses were in the positive concerning changes in,
and reevaluations of, the civil service system...the system
12. Section 7(c).
-58-
'screened out' automatically specified minorities and 'disad-
vantaged.'" The respondent stated that "there were still
artificial barriers (exams, published employment lists and the
like)."
Civil Service Commission Guidelines developed specifically
for PEP require that Program Agents Utilizing EEA funds address
such problems as reevaluation of skill requirements, revision
of job descriptions, modification of merit system practices
and elimination of artificial barriers to employment.
The "lack of EEA participants with less than a high school
diploma" indicated to one local Coalition survey team that the
city "did not reevaluate job structures and Civil service re-
quirements in a manner aimed at compliance with the Act."
Another report stated:
The changes agreed to during Employment TaskForce meetings with the City and the CivilService Commission supposedly affected 28slots. From the final count, however, only1 (out of 4) Intake Worker (classified asAdministrative Assistant II) has only ahigh school diploma. Two have 14 years ofeducation and the fourth has 13. No Com-munity Service Aides have less than a highschool diploma. (Ten of these slots weretransferred to other positions because thejob required a car and license, a requirementthe City felt would discriminate against thepoor.) Even if the Employment Task Forcerecommendations were accepted by the CivilService Commission and the City PersonnelOffice, the results indicate this changewas made on paper but not implemented.
-59--
One major consequence is the need for "full" and official,
rather than "provisional," civil service status for PEP em-
ployees. Coalitions participating in the field survey reported
that their local communities were divided on this point. In
a few placed, PEP employees have been "blanketed in"--afforded
civil service status as a group. In many other communities,
however, PEP employees have been relegated to second class
status as "provisional" employees with only a remote chance
that their status will change. Some enrollees have been placed
in "exempted" positions. Nearly all the respondents in the
field survey indicated that those EEA personnel who were
"exempted" would not be given first preference for any civil
service position if and when one opened.
Wages
Data from the local Coalitions shows that wages were
commensurate with the prevailing wages for the Program Agent,
and usually with the prevailing wages for the whole community.
In most cases, fringe benefits were the same as those provided
to regular civil servants. The major disparity was to be found
in retirement benefits, frequently because of state law.
PEP participants in general earned more than they had made
before they were admitted to the program. (See Table XI.) Of
those employed before PEP was established, according to national
data, 16 percent were receiving less than the minimum wage and
therefore had to be raised to the minimum wage. The pre-PEP
hourly wages reported indicated--assuming that anyone earning
less than $2.00 an hour is in poverty--that 32 percent were
in poverty (31 percent of Section 5 participants and 44 percent
of Section 6). when the same $2.00-an-hour breakpoint was used,
13 percent were still in poverty with PEP hourly wages (8 percent
of Section 5 and 29 percent of Section 6 participants).
Despite the need to raise a substantial number of participants
above the poverty level, the major expansion in wages seemed to
come from the category ranging from $2.00 to $3.99 an hour--or
between $4,160 and $8,300 a year. Yet there is a noticeable
difference between the wages of Section 5 and Section 6 partici-
pants. The major increase for Section 5 participants was in
the $3.00-to-$3.99-an-hour category, and the primary increase
for Section 6 participants stemmed from the $2.00-to-$2.99-an-
hour group. This suggests that the jobs made available to those
funded under Section 6 tended to be of lower caliber than the
jobs of those funded under Section 5. The percentage of people
paid $4.00 and above is higher among Section 5 participants
than among Section 6 participants. This could be the result
of a higher percentage of college-trained people in the Section
5 program than among the Section 6 participants.
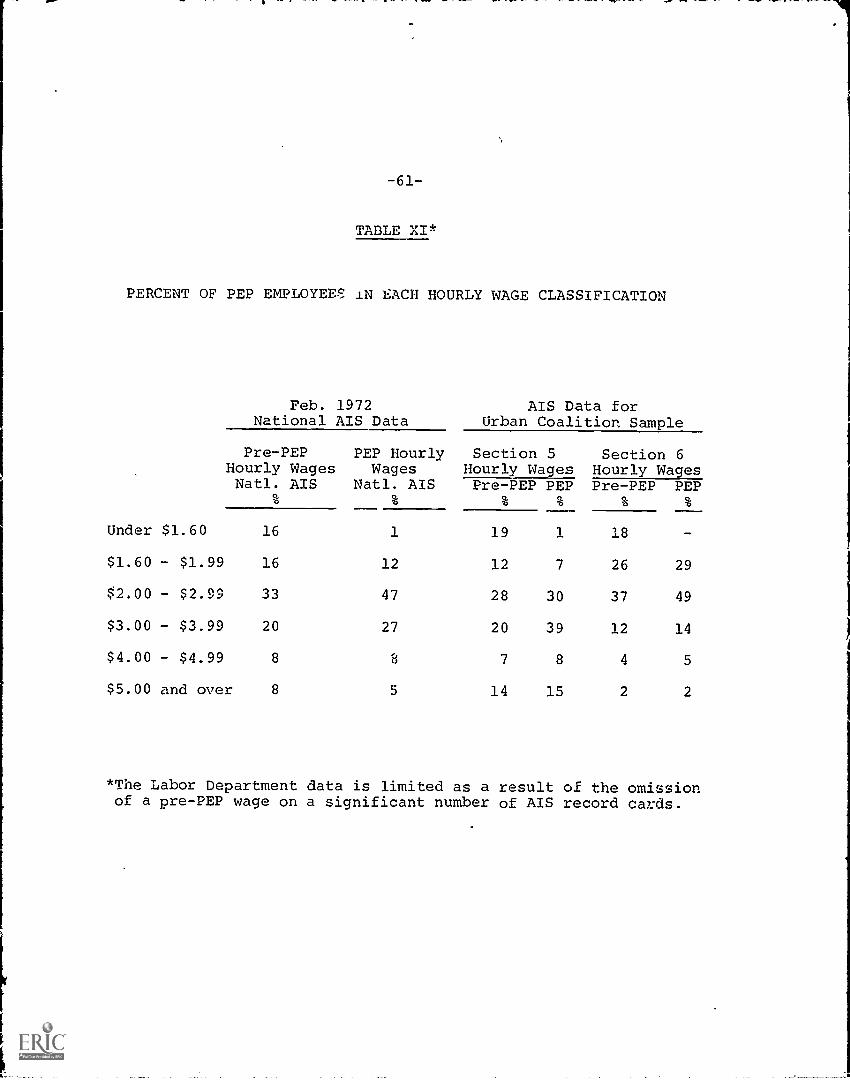
-61-
TABLE XI*
PERCENT OF PEP EMPLOYEES IN EACH HOURLY WAGE CLASSIFICATION
Feb. 1972 AIS Data forNational AIS Data Urban Coalition Sample
Pre-PEPHourly WagesNatl. AIS
PEP HourlyWages
Natl. AIS
Section 5Hourly Wages
Section 6Hourly Wages
Pre-PEP PEP Pre-PEP PEP
Under $1.60 16 1 19 1 18
$1.60 - $1.99 16 12 12 7 26 29
$2.00 - $2.99 33 47 28 30 37 49
$3.00 - $3.99 20 27 20 39 12 14
$4.00 - $4.99 8 8 7 8 4 5
$5.00 and over 8 5 14 15 2 2
*The Labor Department data is limited as a result of the omissionof a pre-PEP wage on a significant number of AIS record cards.
The wages projected in the proposals in the local Coalition
sample average $3.00 an hour or $6,240,a year. The lowest
average wage proposed was $2.19 an hour; the lowest single
wage proposed was $1.61 an hour or $3,324 a year. The average
wage paid to participants in the Coalition survey sample based
on AIS data for Section 5 jobs was $3.44 an hour or $7,155 a
year. The average for Section 6 jobs amounts to $2.57 an hour
or $5,346 a year. The average national wage (which includes
both Section 5 and Section 6) is $2.99 an hour or $6,219 a year.13
The difference between wages in the local Coalition sample
and wages throughout the country is inconsequential ($32.00
a year). However, the difference ($1,809) between the Section
5 average wage ($7,155) and the Section 6 average wage ($5,346)
for the same Coalition sample cities is greater than can be
accounted for by factors of education, age or other personal
characteristics of PEP employees.14 The Section 6 sample is
unfortunately too small to yield final conclusionS.
The Labor Departmenc should start to maintain data separately
for Section 5 and Section 6 jobs and to examine the comparative
qualifications of both Section 5 and Section 6 participants,
cross-referencing their salaries and job classifications.15 If
the data confirms the preliminary findings of The National Urban
13. See Appendix, Table XV14. See Appendix, Table XV.15. At the time that the study was done, the Labor Department did
not keep separate data. The Department now reports Sections5 and 6 separately as recommended in the text above.

-63-
Coalition's study, those prejudgments frequently'encountered
among employers about the capacity of those living in poverty
neighborhoods may have been perpetuated under the program.
The National Urban Coalition does not believe that this
data obtained through the Coalition sample is adequate to
inthcate more than a trend, but it does feel that additional
in-depth study is essential to uncover what could be a serious
flaw in the program.

-64--
VIII UNMET SERVICE NEEDS
One of the purposes of the Act, stated in the legislation,
was to assist state and local communities in providing needed
public services: "to fill unmet needs for public services in
such fields as environmental quality, health care, housing and
neighborhood improvements, recreation, education, public safety,
maintenance and streets, parks and other public facilities,
rural development, transportation, beautification, conserva-
tion, crime prevention and control, prison rehabilitation and
other fields of human betterment and public improvement."'
It appears that many sponsors performed hasty analyses of
the latest budget requests from operating departments, deter-
mined which staff slots were left unfilled because of fiscal
shortages, and defined the functions of those unfill3d slots
as "unmet public service needs." The fiscal needs and con,-
straints of the departments were, according to the Coalition
sample, the single most important consideration in determining
the unmet needs fo: public services. Even elected public of-
ficials, presumably responsive to the requests of the local
community, apparently played little part in creating these new
job opportunities. The community rarely had lead time or
sufficient knowledge to bring pressure for particular services.
Surveys of communities and neighborhoods with high unemployment,
1. Section 2(5).
-65-
theoretically areas toward which the EEA program was to be
directed, were used rarely or not at all. Apparently no for-
mal procedures were established or significant effort made to
adjust bureaucratic requirements to specific unmet needs in the
community. In many cases, special surveys of operating agencies
and departments were conducted, but the surveys tended only to
restate the dilemma of unfunded positions. "Unmet public
service needs" were determined finally, for the most part, by
agency and department heads.
The survey instruments attempted to cross-check the process
of how unmet needs were defined locally by asking the Program
Agents to "list up to six specific criteria utilized in estab-
lishing priority of unmet service needs." The majority answer-
ing this question indicated that needs were determined primarily
by city departments. A few of the returns specified that there
had been some sort of community involvement. Some of the survey
instruments carried no response whatsoever.'
Program Agents were asked to rank,.in order of importance,
the nine categories of public service need established by the
Labor Department. (See Table XII.)

TABLE XII
RANK ORDER OF STATED PRIORITY OF UNMET PUBLIC NEEDS
AND PERCENT DISTRIBUTION
OF THOSE EMPLOYED IN PUBLIC SERVICE AREAS
Rank Order as Stated
by Program Agents in
the Coalition Sample
Rank Order Based
on Distribution on
National AIS Data
% Employed in Each
Classification Based
on National AIS Data
*
Public Works/Transportation
1(3.6)
123.
Law Enforcement
2(4.6)
412.
I
Health & Hospitals
3(5.0)
58.
(31
Cl I
Education
4(5.2)
222.
Social Services
5(5.4)
75.
Parks and Recreation
6(5.7)
67.5
Environmental Quality
7(6.0)
84.
Fire Protection
8(6.1)
92.5
Other
9(6.7)
316.
*Statistical Average to the rank order listed by Program Agents in the local Coalition
sample.
-67-
An examination of the rank order of stated priorities in
each of the Labor Department's nine categories (See Table XII)
derived from the sample of Program Agents shows a considerable
difference in pattern from the rank order based on an analysis
of actual placements reflected in the AIS data. The averages
for the classifications are much more closely "bunched" in the
Program Agents than they are in the actual job distribution.
The jobs in the "Other" category2 were largely administrative
jobs, according to the Department's data, whereas the identifi-
cation of "others" by the Program Agents in the response to the
survey included "rehires," libraries, museums and similar
substantive areas, rather than just, administrative positions.
An analysis of examples of the types of PEP jobs indicates that
a high proportion of jobs contained in the other categories
were clerical and administrative. (See Appendix, Tables XVI
and XVII.)
The lowest five categories (Social Services, Parks and
Recreation, Environmental Quality, Fire Protection, Other)
represent a marked break from the top four (Public Works, Law
Enforcement, Health and Hospitals, Education).
2. Labor Department definition: Category includes all governmentalfunctions not included in categories 1 through 8. Typically,this category will include administrative organization suchas the Comptroller's Office, Personnel Office and similaradministrative units.
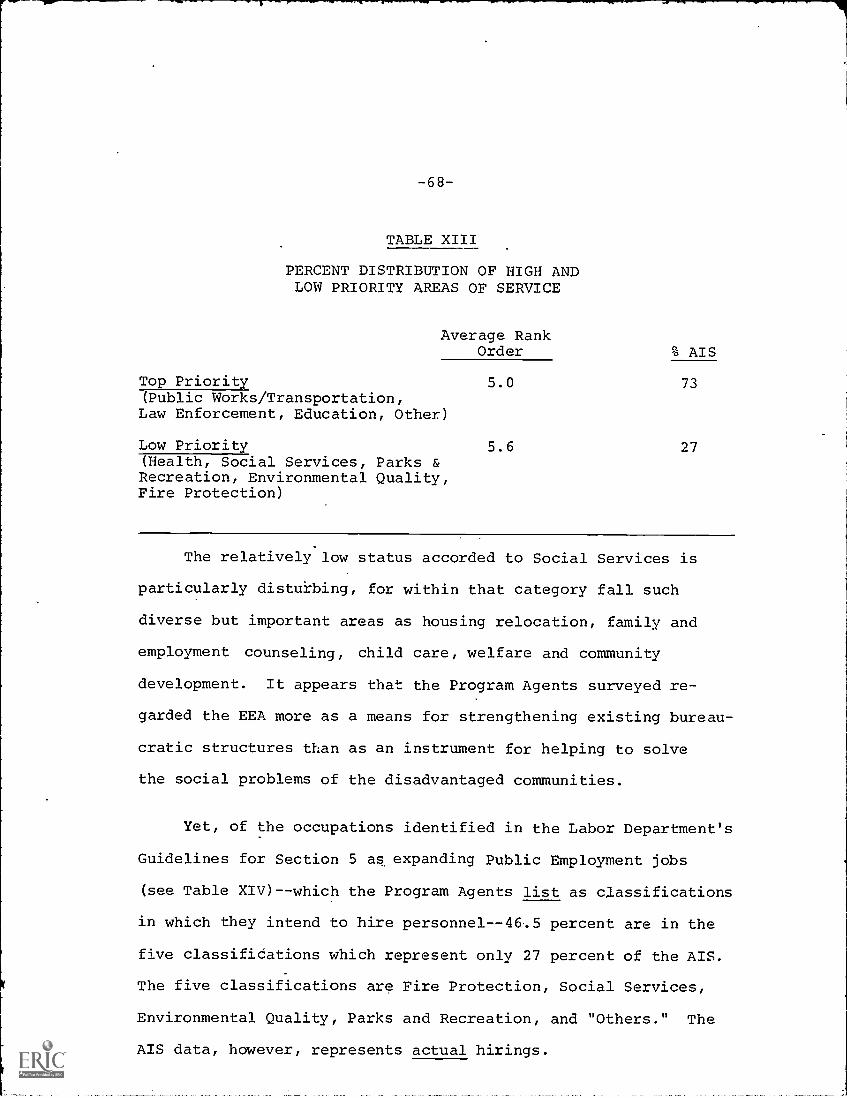
-68-
TABLE XIII
PERCENT DISTRIBUTION OF HIGH ANDLOW PRIORITY AREAS OF SERVICE
Average RankOrder % AIS
Top Priority 5.0 73(Public Works/Transportation,Law Enforcement, Education, Other)
Low Priority 5.6 27(Health, Social Services, Parks &Recreation, Environmental Quality,Fire Protection)
The relatively low status accorded to Social Services is
particularly disturbing, for within that category fall such
diverse but important areas as housing relocation, family and
employment counseling, child care, welfare and community
development. It appears that the Program Agents surveyed re-
garded the EEA more as a means for strengthening existing bureau-
cratic structures than as an instrument for helping to solve
the social problems of the disadvantaged communities.
Yet, of the occupations identified in the Labor Department's
Guidelines for Section 5 as expanding Public Employment jobs
(see Table XIV)--which the Program Agents list as classifications
in which they intend to hire personnel--46.5 percent are in the
five classifidations which represent only 27 percent of the AIS.
The five classifications are Fire Protection, Social Services,
Environmental Quality, Parks and Recreation, and "Others." The
AIS data, however, represents actual hirings.

-69-
Those previously employed by the Program Agent occupied
21 perceht of the,Section 5 jobs in the study sample, 13 percent
of the sample's Section 6 jobs and only 11 percent of all PEP
jobs nationally. Most of the rehires were concentrated in a
few major cities which had had to fire staff. The major cities
dismissed a higher proportion of civil service staff than did
other jurisdictions.. Most of the other cities had "a freeze"
on new positions. Where cities did not rehire, it was not be-
cause of any special commitment but because they had no staff
to rehire. The budget squeeze in most cities had not forced
them to fire staff but rather had prevented them from budgeting
for support staff that the departments and personnel offices
believed were needed. These are many of the positions created
under PEP.
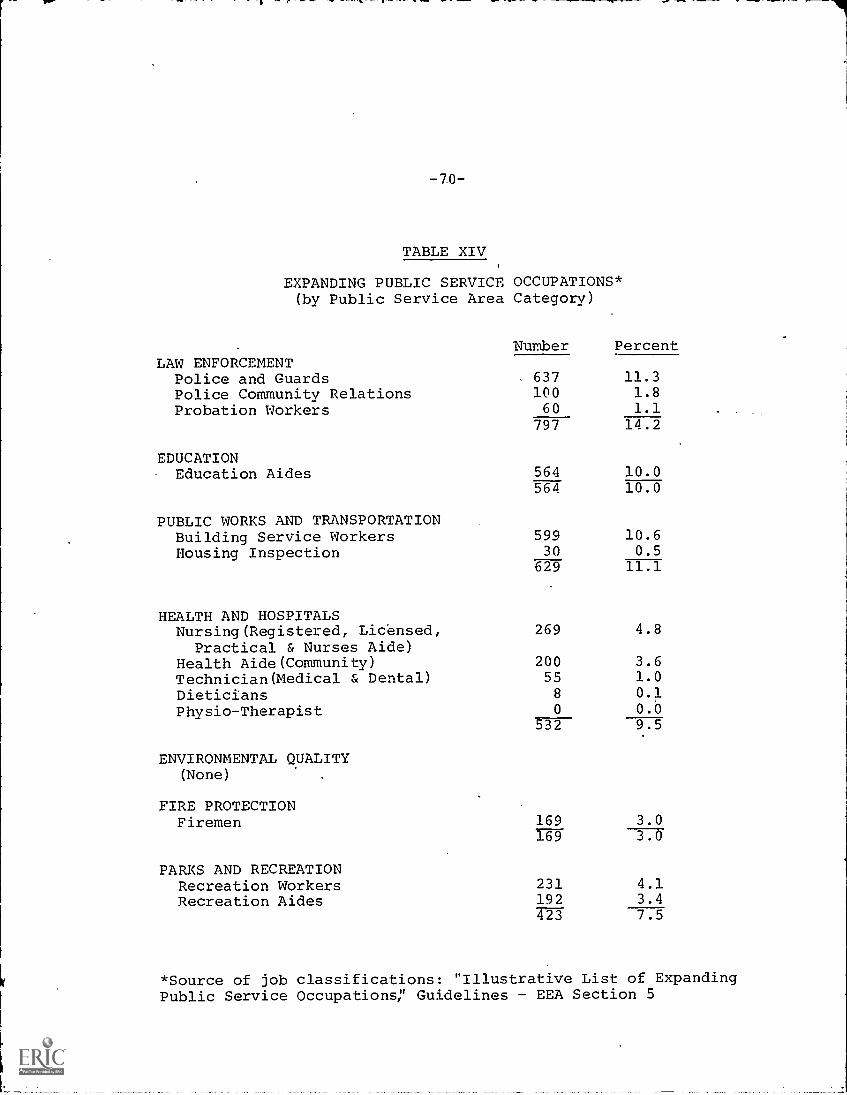
-7.0-
TABLE XIV
EXPANDING PUBLIC SERVICE(by Public Service Area
LAW ENFORCEMENT
OCCUPATIONS*Category)
Number Percent
Police and Guards . 637 11.3Police Community Relations 100 1.8
Probation Workers 60 1.1797 14.2
EDUCATIONEducation Aides 564 10.0
564 10.0
PUBLIC WORKS AND TRANSPORTATIONBuilding Service Workers 599 10.6Housing Inspection 30 0.5
629 11.1
HEALTH AND HOSPITALSNursing(Registered, Licensed, 269 4.8
Practical & Nurses Aide)Health Aide(Community) 200 3.6Technician(Medical & Dental) 55 1.0
Dieticians 8 0.1
Physio-Therapist 0 0.0532 9.5
ENVIRONMENTAL QUALITY(None)
FIRE PROTECTIONFiremen 169 3.0
169 -STU
PARKS AND RECREATIONRecreation Workers 231 4.1Recreation Aides 192 3.4
423 7.5
*Source of job classifications: "Illustrative List of ExpandingPublic Service Occupation41 Guidelines - EEA Section 5
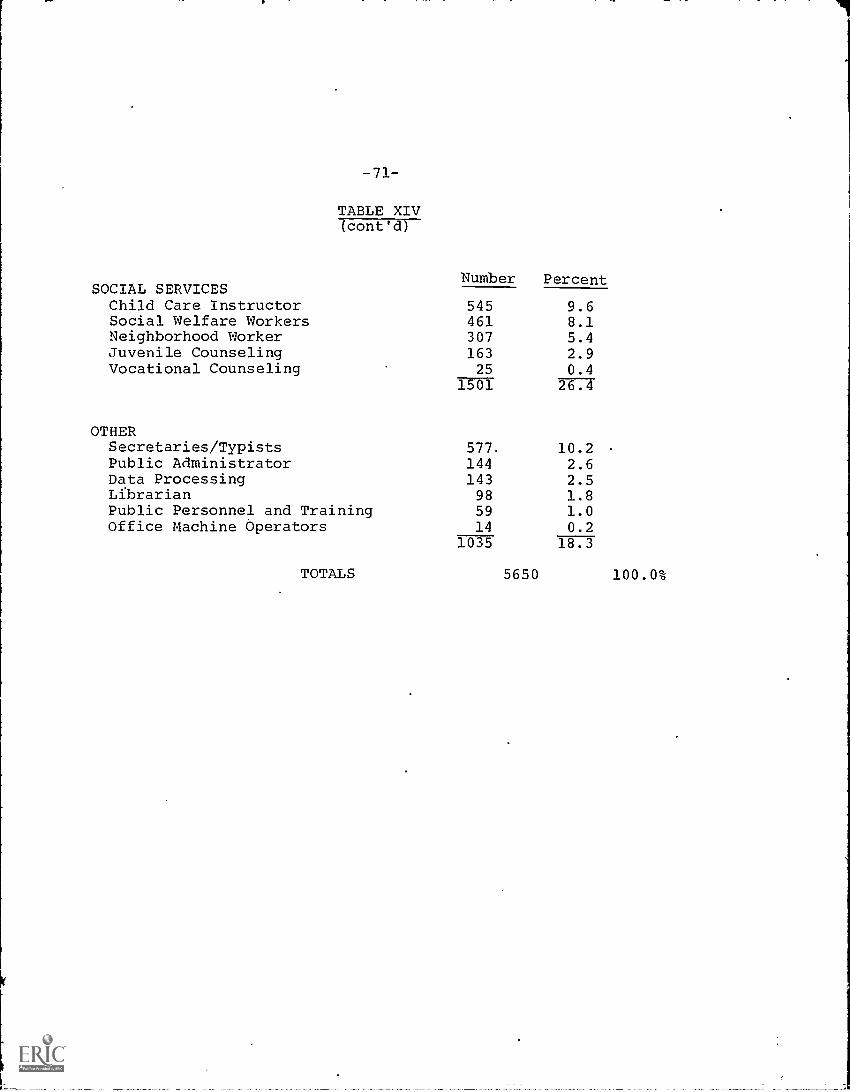
-71-
TABLE XIV
Number Percent
(cont'd)
SOCIAL SERVICESChild Care Instructor 545 9.6Social Welfare Workers 461 8.1Neighborhood Worker 307 5.4Juvenile Counseling 163 2.9Vocational Counseling 25 0.4
1 01 26.4
OTHERSecretaries/Typists 577. 10.2Public Administrator 144 2.6Data Processing 143 2.5Librarian 98 1.8Public Personnel and Training 59 1.0Office Machine Operators 14 0.2
1035 18.3
TOTALS 5650 100.0%
-72--
IX CONCLUSIONS AND RECOMMENDATIONS
Although the EEA created and funded jobs with great speed,
on the whole it must be termed too little and too late. Long-
range planning would have made the difference--and it must be
applied to any future public service employment programs if
they are to succeed.
The "emergency" the EEA was intended to meet did not begin
with the passage of the Act in July 1971. The many seriously
disadvantaged in our society had been plagued throughout the
1950s and 1960s by the problem of access to jobs, high unemploy-
ment rates, inappropriate experience and barriers to employment
in the public and private sectors. The recession that raised
the unemployment rate in 1970 and 1971, leading to the "emergen-
cy" of 1971, was predictable in 1969 and before.
T' 1, there was little excuse foi*the unclear goals, inadequate
funds and unrealistic time frames that hampered the implementation
of the EEA from its inception. Sensible planning in the operation
of a public service employment program as part of a total economic
policy designed to reduce inflationary pressures and stimulate
employment of the structurally unemployed, rather than to remove
the frictionally unemployed from the labor market, should be the
goal of all future expansions in EEA or other public service
employment programs.
-73--
The importance of expanding the program cannot be overemphasized.
But it is essential that any expansion be preceded by the kind
of careful planning that did not precede implementation of the
EEA program. If it is to achieVe its purpose, an expanded public
service employment program must meet two criteria: it must
employ, train and upgrade those who cannot be employed elsewhere,
and it must fill public service needs that are not now being
filled.
General Conclusions
At best, the PEP will provide employment for only 3 percent
of the unemployed. Persons placed in jobs have been, to a large
extent, those who had the most potential for placement in the
private sector or in regular civil service positions. Charac-
teristically, they were adult males, with a high school education
or more, who had been unemployed for only a short period ot time.
They apparently had significant skills; little or no money was
spent in training them to perform their jobs. Placed in PEP
positions, they were not available for private sector jobs.
Frictional unemployment based on normal tarnover is a
natural--in fact healthy--aspect of our economy. Our data
shows that 60 percent of those hired under the PEP were unem-
ployed for fewer than 15 weeks. The Labor Department's AIS
syStem lists EEA participants under three categories: those
unemployed between 5 and 14 weeks; and those unemployed four
-74--
weeks or fewer.1 Twenty-six percent of Section 5 participants
and 28 percent of Section 6 participants for the Coalition
sample cities had been unemployed four weeks or fewer. Because
so many eligible participants had been unemployed much longer,
it must be argued that priority should have been given to those
unemployed more than four weeks.
It would appear, therefore, that many of those placed on
federally supported payrolls, except in depressed areas, probably
could have been absorbed into the normal labor market had a
more aggressive placement effort been made. Taking such well
prepared individuals out of the labor market tends to have an
inflationary influence Jn the economy. 2 PEP was not used pri-
marily to nake chronically unemployed, difficult-to-place per-
sons able to compete better in the labor market. Instead it
skimmed off those among the unemployed who were easiest to
place, thereby increasing the demand for skilled workers in
jobs that have not been filled in all but the most depressed
areas, even during periods of high unemployment.3
Had there been an effective labor exchange capable of
placing those unemployed who are experienced, educated and
able to enter new job classifications, many of those hired
under. EEA could have been moved into private sector jobs.
1. See Table X.2. Urban Institute Charles Holt et al - Manpower Phase III.3. See the number of jobs listed and unfilled in ES offices
throughout the country.
-75-
In turn, a much greater number of uneducated and unskilled
unemployed persons could have been upgraded and trained in public
employment jobs, thereby increasing their productivity. Training
could have contributed to the upward mobility of these workers
and removed them from the fierce competition for the few low-
skilled jobs remaining in the labor market. The limited funds
available for manpower programs should be utilized to obtain
maximum rather than minimum benefits.
The operation of the PEP has tended to stress the unmet needs
of city administrations and neglected the unmet service needs of
poor people. In only a few cities were there reported efforts
to provide jobs other than those that those cities, as a re-
sult of their fiscal problems, had either frozen, left vacant
or been unable to budget. According to PEP Guidelines, new job
opportunities were to be created to supply improved services in
poverty areas. The unmet needs addressed by the program were
often more the unmet needs of city governments than unmet needs
of the target populations. Congress did not design the EEA to
serve the purposes of general revenue sharing under the guise
of an employment program.
Although the legislation requires the elimination of civil
service barriers to employment, the PEP has made little progress
in eliminating these impediments. More intensive recruitment of

-76-
less skilled workers, combined with substantive job training to
increase performance levels, could have reduced the number of
vacancies requiring skilled workers.
.Inadequate funds for training and supportive services
virtually assured that under PEP only a small percentage of
unskilled, semi-skilled and otherwise disadvantaged could effec-
tively be brought into the work force, wither ts::,aporarilv or
permanently.
The legislation also called for equitable allocation of
funds among and within the states on the basis of the ratio
of the number unemployed in a state to the number Aemployed
nationally. The Labor Department set up a new allocation system
providing equal weight to the number of unemployed and to the
severity of unemployment, causing serious imbalance among the
recipients of the program.
Case Study:,A Program Which 2eemingly Complied with the Guidelines
The Pittsfield, Mass., Urban Coalition cited a program
carried out--despite the time pressures- -in at:cord with the
intent of the legislation that could serve as a model for other
jurisdictions:
The program's long7range objective was to guarantee that
people with the greatest need were to be given the highest
preference for the few available PEP jobs-sufficient only to
employ 4 percent of the county's unemployed people.
-77-
Outreach and recruitment were carried out by community
agencies and the Employment Service. The agencies were en-
couraged to search their on constituencies. The respondent
further reported:
No one could report for an interview withoutfirst reporting to one of these agencies tobe certified eligible for PEP employment, inorder to reduce the amount of favoritism thatwould prevail if people reported directly toeach public agency.
Eligibility included only primary wage earners and secondary
wage earners in cases where the family income was below the
poverty level. Those selected, other than veterans, had to
have been unemployed for more than six months.
Job placement stressed the creation of a job that would lead
to permanent employment. Whether a job met an "unmet public need"
was only a secondary consideration. The survey continued:
People with the greatest need had the firstopportunity for jobs that hopefully would leadto permanent employment for the participantseither within the city structure or in privateindustry as the economy turns around.
Civil Service provisions became a drag on theprogram and a significant delaying factor.We overcame it by ignoring it to a large ex-tent. We learned to use job titles alreadyon the Civil Service list and-then used ourown job description when recruiting.
The decision as to which neighborhoods shouldne cover,!d Section 6 was determined bytaking an approximate one-third sample ofthe people receiving unemployment compensa-tion and then recording which census tractthey lived in. By then taking the 1970population data of people between the ages

-78-
of 18 - 65, we reapportioned the unemployedthrough all census tracts. We then chosethose census tracts with unemployment ratesabove 6 percent as being eligible for Sec-tion 6. Exceptions to the rule were madeonly'for low income housing projects lo-cated outside the high unemployment areas.
Because of the crash nature of the program,lack of staff and having to continue tryingto play catch-up football, no serious efforthas been made in the counseling, educationand training portion of- the program. Thispart is just now getting underway. The pri-mary area of concern, however, will be jobcounseling to get the individual into per-manent employment instead of just a transi-tional job. The education and trainingwill be supplemented to that purpose.
Recommendations
The National Urban Coalition believes that some of the PEP's
major problems can be resolved if these recommendations are
followed:
1. In order to have maximum impact on the economy and
unemployment, PEP funds must be substantially increased, so
that the program can serve at least 10 percent of the
unemployed.
2. Recruitment of new PEP enrollees should emphasize young people,
women, not -high school graduates,, older workers and other
groups-not adequately served to date. Every Program Agent
should be required to submit an acceptable plan for recruit-
ing from those groups before it is refunded. Persons above
the poverty level with independent incomes should not be
eligible for PEP placement.

-79-
3. Special consideration for employment should be given to any
person who has been unemployed for more than 15 weeks (or 6
weeks if not eligible for unemployment compensation) or has
a family income below the level established as'the poverty
level.
4. Section 5 funds should be distributed exclusively on the
basis of 'the total number of persons unemployed.
5. Allocations for Section 6 funds should be published 90 days
before funding with information about the number and percentage
of unemp2.cved persons in the city, county or area as well as
the proposed funding level. Other areas that have equally
high local unemployment rates but have not been selected,
or feel that their allocation is not equitable, should then
have 60 days to qualify their cities, counties or areas for
a share of the Section 6 funds.
6. Only people from areas of high unemployment within the city
should be employed under Section 6. People from areas where
unemployment is not above 6 percent who are currently em-
ployed under Section 6 should be transferred,to Section 5
as rapidly as Section 5 slots become available.
7. Program Agents must not be permitted to use PEP funds to
transfer employees from local government payrolls to Federal
support peyments. Not more than a small percentage of PEP
I
-80-
funds--possibly 10 percent--should be allocated to government
housekeeping/administrative jobs to assure that the program
stresses public service needs.
8. To avoid channeling difficult-to-place individuals into low-
paying jobs that provide few opportunities to gain skills,
Program Agents that assign more than 20 percent of the PEP
jobs to Public Works and Transportation should be required
to specify how these positions contribute to the "unmet
public service needs," particularly the needs of high unem-
ployment areas, and how the positions are benefitting the
unemployed.
9. A larger pro?ortion of Section 5 funds and at least an equal
proportion of Section 6 funds should be available for train-
ing and supportive services, as long as existing manpower
and social service programs cannot meet this need.
10. Private non-profit agencies providing needed public services
should be allowed to become employing agents under contract
to public Program Agents. They, as well as industry, should
be used more effectively as alternate resources for permanent
placements for those not being placed in public agencies.
11. Highly qualified PEP participants should be placed in regular
non-subsidized jobs as soon as those jobs become available.
They should be replaced insofar as possible by enrollees

-81-
with employment handicaps. At least one-third of all PEP
participants should be placed in permanent jobs each year.
12. In categories where marked discriminatory practices have
existed--Fire Protection, for example--minorities, where
available, should be given preference.
13. Program Agents should be required to make specific changes
in civil service procedures to eliminate barriers to public
employment by those most in need, as a condition for refund-
ing of their PEP proposals. The upgrading of underemployed
Program Agent staff should also Le undertaken to provide
opportunities for career advancement to civil service
employees who are underemployed..
14. The Labor Department should conduct a study of the AIS data
on wages paid for Section 5 and Section 6 participants,
comparing:
Job ClassificationsEducationAgeRaceOther Variables
A major effort should be made to eliminate salary differentials.
15. The Department should form an advisory committee on the PEP.
The committee could also serve as an advisory group on the
development of 'all public service employment programs. The
advisory committee should include public members as well as
beneficiaries of the program.

-82-
16. Future legislation or administrative guidelines should
utilize manpower councils, composed of members of the
groups and areas to be served as well as other community
representatives, to assist the Program Agents in the
planning, monitoring and evaluation of the Public
Employment Program.
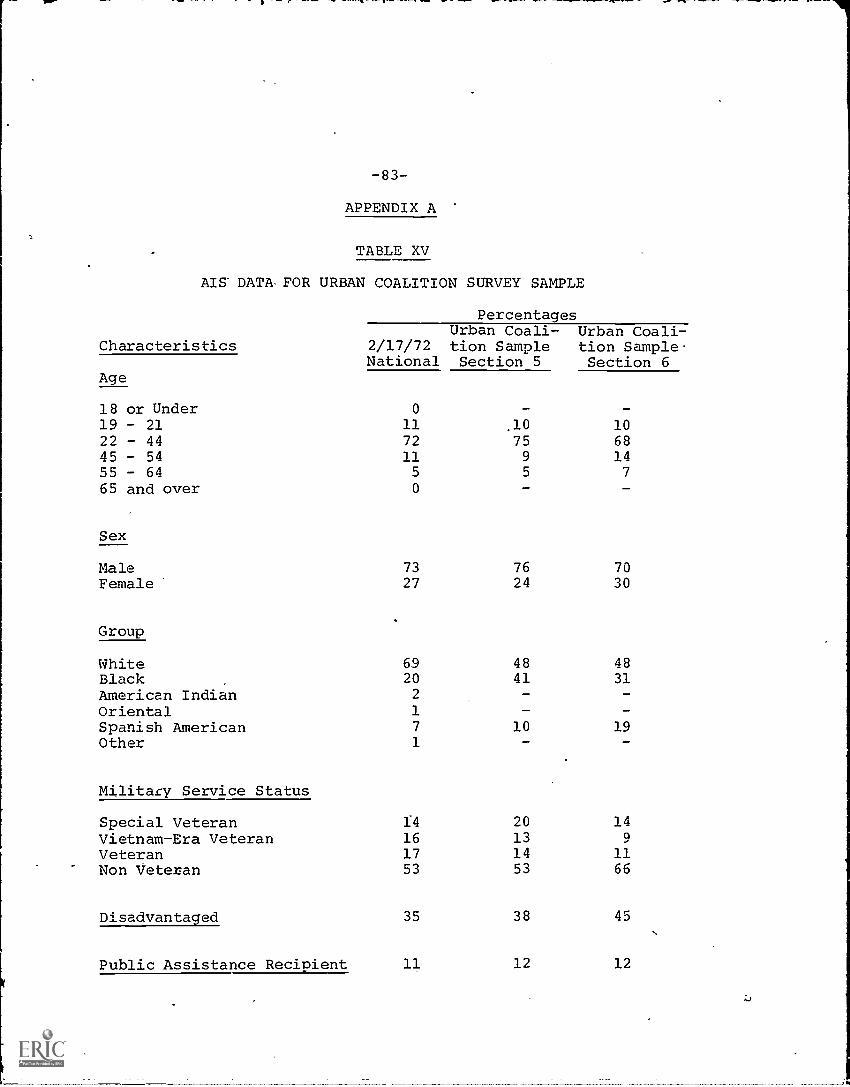
-83-
APPENDIX A
TABLE XV
AIg DATA-FOR URBAN COALITION SURVEY SAMPLE
Characteristics
PercentagesUrban Coali-
2/17/72 tion SampleNational Section 5
Urban Coali-tion Sample-Section 6
Age
0
1172115
0
.10
759
5
1068147
18 or Under19 2122 4445 5455 6465 and over
Sex
Male 73 76 70Female 27 24 30
Group
White 69 48 48Black 20 41 31American Indian 2
Oriental 1
Spanish American 7 10 19Other 1
Military Service Status
Special Veteran 14 20 14
Vietnam-Era Veteran 16 13Veteran 17 14 11Non Veteran 53 53 66
Disadvantaged 35 38 45
Public Assistance Recipient 11 12 12
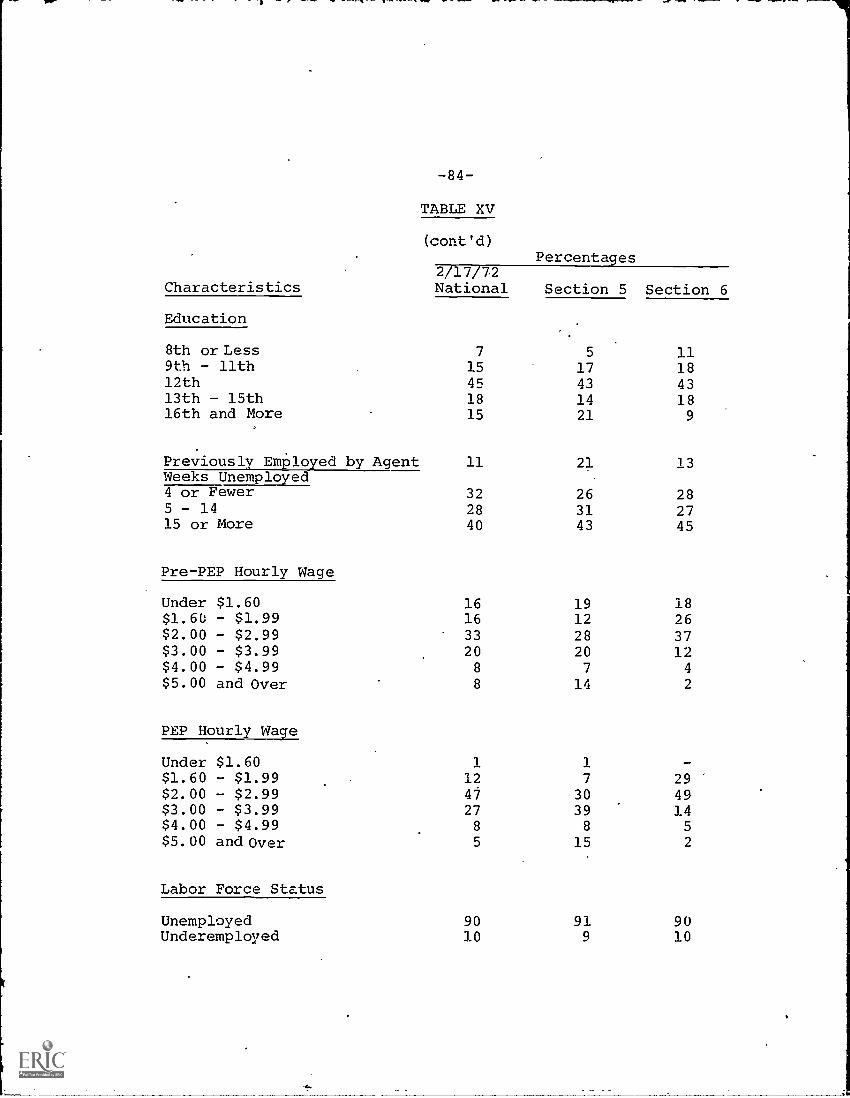
Characteristics
Education
-84-
TABLE XV
(cont'd)Percentages
2/17/72National Section 5 Section 6
8th or Less 7 5 119th - 11th 15 17 1812th 45 43 4313th - 15th 18 14 1816th and More 15 21 9
Previously Employed by Agent 11 21 13Weeks Unemployed4 or Fewer 32 26 285 14 28 31 2715 or More 40 43 45
Pre-PEP Hourly Wage
Under $1.60 16 19 18$1.60 - $1.99 16 12 26$2.00 - $2.99 33 28 37$3.00 $3.99 20 20 12$4.00 $4.99 8 7 4
$5.00 and Over 8 14 2
PEP Hourly Wage
Under $1.60 1 1
$1.60 $1.99 12 7 29$2.00 - $2.99 47 30 49$3.00 $3.99 27 39 14$4.00 - $4.99 8 8 5
$5.00 and Over 5 15 2
Labor Force Status
Unemployed 90 91 90Underemployed 10 9 10

-85-
TABLE XVI
PEP JOB CLASSIFICATIONS FOR SAMPLE CITY A
SECTION 5 - POSITIONS
Health & Hospitals
12 Ambulance Attendant2 Medical Technologist
Auditor
1 Management Analyst I1 Clerk Typist II
Zoning Administration
4 Zoning Inspector I1 Appraiser Negotiator I
Safety & Claims
2 Safety Analyst1 Clerk Typist II
General Services
1 Maintenance Repairman4 Custodial Worker
U.R.D.A.
1 Clerk Typist II1 Administrative Assistant I1 Clerk I1 Accountant I
Public Library
1 Gardener Florist I2 Library Assistant I2 Library Assistant II
Career Service Authority
4 Personnel Technician III2 Clerk Typist II1 Clerk II
City Attorney
1 Attorney II
Parks & Recreation
6 Tree Trimmer I1 Draftsman II6 Recreation Leader1 Safety Analyst2 Clerk Typist II
Public Works
6 Utility Worker I2 Project Inspector4 Draftsman II2 Painter I1 Maintenance 'Repairman I4 Auto Serviceman I1 Accountant I
Safety
7 Deputy Sheriff I1 Maintenance Mechanic1 Clerk Steno II
Community Relations
2 Administrative Intern I

-86-
TABLE XVI (cont'd)
SECTION 6 - POSITIONS
Health & Hospitals
4 Clerk I18 Clerk II1 Clerk Typist I6 Clerk Typist II1 Hospital Admissions Clerk9 Hospital Attendant I2 Pharmacy Helper2 'Jtility Worker I2 Program Aide'2 Custodial Work I1 Delivery Clerk I6 Counter Clerk
U.R.D.A.
1 Administrative Assistant I3 Administrative I .ern III1 Clerk Typist I2 Clerk Steno6 Job Counselor Trainee I1 Maintenance Repairman1 Watchman
Safety
Sheriff:7 Clerk Typist I
Police:4 Clerk Typist II5 Car 'Washers
Fire:1 Garage Attendant I3 Clerk Typist II
Safety and Claims
1 Evaluation Analyst I
Housing Administration
2 Public Service CareerClerical Trainee
1 Account Clerk
City Attorney
1 Clerk Steno I
Career Service
2 Personnel Technician I1 Clerk Typist II
Zoning Administration
1 Clerk Typist II
General Services
1 Utility Worker I4 Painter I
Parks and Recreation
J. Clerk Typist I7 Clerk Typist II2 Custodial Worker I
15 Utility Worker I1 Maintenance Mechanic6 Recreation Leader
Community Relations
2 Administrative Intern I
Public Library
8 Clerk Typist I2 Clerk I1 Custodial Helper I
Welfare
3 Eligibility Technician2 Community Services Aide
Assessment
4 Clerk Typist II

-87-
TABLE XVII
PEP JOB CLASSIFICATIONS FOR SAMPLE CITY B
SECTIONS 5 AND 6
Secretary - Model CitiesPhysical CoordinatorBookkeeperAssitant Physical CoordinatorAssistant Education CoordinatorPlacement Officer - PersonnelMuseum Curator Trainee City EngineerMechanic 1 Waste WaterRadio Operator StreetSkilled Labor - Street:Solid Waste TechnicianPreventive MaintenanceJanitorMechanicGeneral Laborer -- StreetHeavy Equipment OperatorRadio TechnicianGeneral Laborer - ParkFinancial Advisor - RehabitInspector - RehabitJanitor - Parking-GarageAccounting - Clerk, City ControllerGeneral Laborer - ParkTruck Driver SanitationGeneral Laborer - Street DepartmentLaboratory Technician - Waste WaterCustodian - Water WorksDraftsman Water WorksSignal Technician - TrafficInspector - EngineeringApprentice Radio OperatorStenographer II City AttorneySecretary - PersonnelEngineer AideCustodian
Truck Driver Highway DepartmentMaintenance II - ParkSecurity Guarei - City BuildingHousekeeper - LaundererSecretary I Area Plan - ProsecutorFamily Planning Counselor - Health DepartmentHome Economist - Counsel for RetardedTeacher - Naturalist - Trainee ParksYouth Service Bureau - SecretaryJanitor Helper, County HomeLaundry Helper
Number2
1
1
1
11
1
12
3
3
4
1
1
5
1
1
2
1
1
1
1
4
1
4
2
1
1
11
1
11
1
1
3
3
2
1.
2-,
.,.
11
1
1
1

Truck Driver - Highway
Physical TherapistSecretary - Commission
Tray-line WorkerMaintenance Assistance
Kitchen Helper
TABLE XVII (Cont'd)
-88-
GroundskeeperStock ClerkNurse's AideLaundry HelperPractical NurseMaintenance ManCurator Trainee - MuseumGuard - MuseumSecurity Guard AirportSurveyor - Engineering Dept.Assistant CuratorPlanner - Area PlanResearch Assistant-Area PlanPractical NurseIndustrial SanitarianChemical SanitarianHousing DirectorProgrammer Auditors Dept.Caseworker DPWCase Aide - DPWClerk Typist
achers' AideA.JreationAidesRoving Recreation LeadersBookkeeper.- City ClerkBarrett Law Clerk - CitySecretary EngineerBuilding InspectorRegistered Nurse - ChildrenSafety Engineer TraineeCase Worker - ChildrenRegistered Nurse HospitalClerk Typist - City Clerk OfficePersonnel Trainee - PersonnelPark SupervisorCustodian SchoolsCarpenter SchoolsHeavy Equipment Operator - StreetSecretary - SchoolLaborer Street
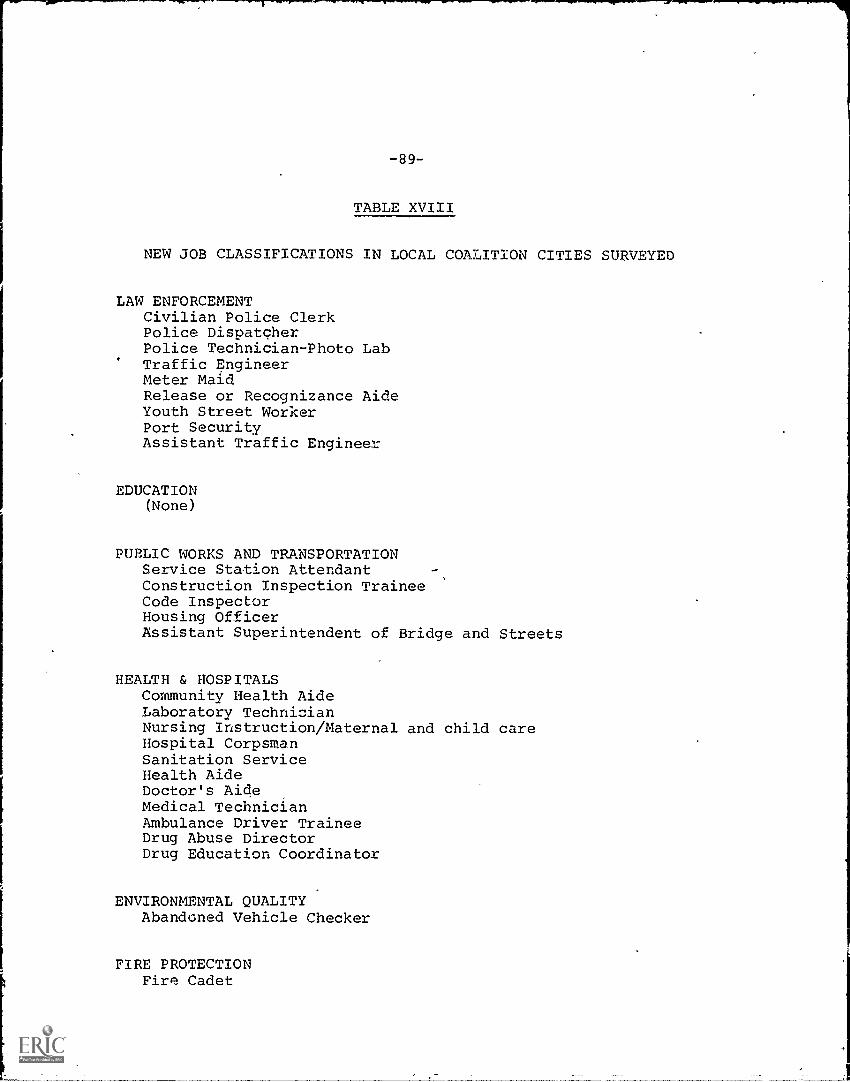
-89-
TABLE XVIII
NEW JOB CLASSIFICATIONS IN LOCAL COALITION CITIES SURVEYED
LAW ENFORCEMENTCivilian Police ClerkPolice Dispatcher.Police Technician-Photo Lab
.
Traffic EngineerMeter MaidRelease or Recognizance AideYouth Street WorkerPort SecurityAssistant Traffic Engineer
EDUCATION(None)
PUBLIC WORKS AND TRANSPORTATIONService Station AttendantConstruction Inspection TraineeCode InspectorHousing OfficerAssistant Superintendent of Bridge and Streets
HEALTH & HOSPITALSCommunity Health AideLaboratory TechnicianNursing Instruction/Maternal and child careHospital CorpsmanSanitation ServiceHealth AideDoctor's AideMedical TechnicianAmbulance Driver TraineeDrug Abuse DirectorDrug Education Coordinator
ENVIRONMENTAL QUALITYAbandoned Vehicle Checker
FIRE PROTECTIONFire Cadet

-90-
TABLE XVIII
(cont'd)
PARKS AND RECREATIONPark Security OfficerRecreation Counselor TraineeSenior Recreation CounselorRecreation Service RepresentativeRecreation Supervisor
SOCIAL SERVICESCommunity Program HelperInterpreter of SpanishActivity CoordinatorSocial Worker AideVeteran CounselorVocational Skill SpecialistSocial Service InvestigatorManpower CounselorVet. and Drug CounselorYouth Coordinator
OTHERAdministration:
Training CoordinatorAccountantAccounting TechnicianAdministrative Analyst CRAAdministrative Analyst PDPlanning AideSenior PlannerDeputy Purchasing AgentDeputy Personnel DirectorPhoto-JournalistData Processing Documentation AssistantUrban Operation Research AnalystProject Coordinator Municipal Development ProgramProgram AideAdministrative AidePersonnel AidePublic Utilities Inspector TraineeOffset PressmanAdministration Aide - MayorMuseum Director
Libraries:Book Mender General Service
Museums:...'inteArts Instructor
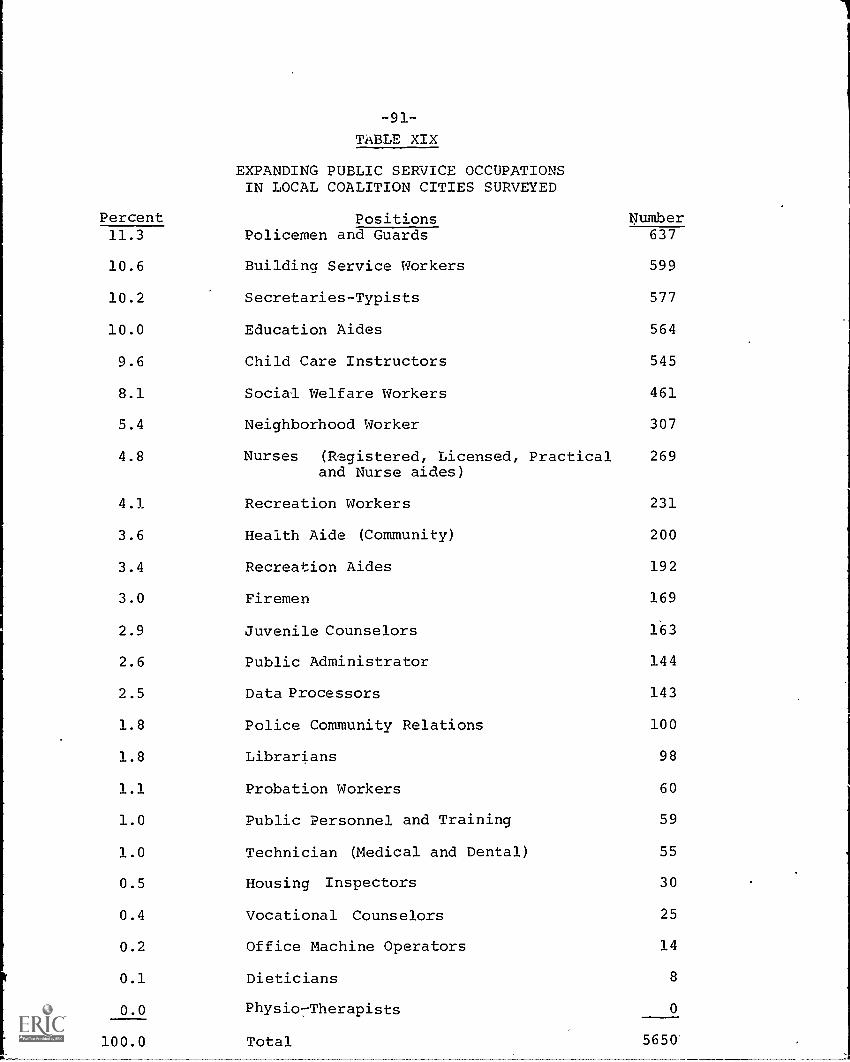
-91-
TABLE XIX
EXPANDING PUBLIC SERVICE OCCUPATIONSIN LOCAL COALITION CITIES SURVEYED
Percent Positions Number11.3 Policemen and Guards 637
10.6 Building Service Workers 599
10.2 Secretaries-Typists 577
10.0 Education Aides 564
9.6 Child Care Instructors 545
8.1 Social Welfare Workers 461
5.4 Neighborhood Worker 307
4.8 Nurses (Registered, Licensed, Practicaland Nurse aides)
269
4.1 Recreation Workers 231
3.6 Health Aide (Community) 200
3.4 Recreation Aides 192
3.0 Firemen 169
2.9 Juvenile Counselors 1e3
2.6 Public Administrator 144
2.5 Data Processors 143
1.8 Police Community Relations 100
1.8 Librarians 98
1.1 Probation Workers 60
1.0 Public Personnel and Training 59
1.0 Technician (Medical and Dental) 55
0.5 Housing Inspectors 30
0.4 Vocational Counselors 25
0.2 Office Machine Operators 14
0.1 Dieticians 8
0.0 Physio7Therapists 0
100.0 Total 5650

-92-
APPENDIX B
COMMENTS ON THE URBAN COALITION REPORT ON EEABY
AMERICAN FEDERATION OF STATE, COUNTY AND MUNICIPAL EMPLOYEES, AFL-CIO
AFSCME does not concur with the emphasis placed in Chapter I
on the training of low-income and chronically unemployed persons
as an overriding priority of the Emergency Employment Act. Cer-
tainly such persons should be provided with every feasible oppor-
tunity fot employment under an EEA program; we are aware that,
in a number of instances, efforts to reach out into high unemploy-
ment areas in a city were something less than wholehearted.
EEA was not intended, however, as a training or a manpower
development program. It was designed to meet two objectives: to
provide jobs, and to meet unfilled public service needs. The Act
specifically limits the amount which can be expended on training
and job support programs.
We may well share the Urban Coalition's criticisms of
Federal manpower programs as a whole. A critique of EEA is not
the appropriate vehicle, however, in our view, for pointing out
a shortcoming which was never a part of the program's design-
particularly when that program has been so badly abused in so
many other areas by a high-handed Administration.
AFSCME does not concur with the presumption in Chapter I
that only those public service needs which meet the priorities
held by community groups (unspecified) can be regarded as

-93-
fulfilling the public service function of PEP. While we are
strong for community participation in the planning of a public
employment program, we suggest that the realities of public
administration are such that the very areas which are cut back
first when refuse collection is decreased to once a week, or
when a neighborhood health center is closed, are precisely the
areas of the city about which the Urban Coalition (and AFSCME)
is most concerned. In other words, a decision to restore--via
a Public Employment Program--municipal services curtailed by a
city caught in a budget squeeze is most likely to benefit the
low income and chronically unemployed residents of that city.
Their participation in such a decision would obviously be help-
ful--but lack of such participation is not a sufficient basis
to judge the decision wrong or misguided.
Nor does AFSCME agree with Recommendation No. 3 in Chapter
IX calling for special consideration for those unemployed for
over 15 weeks. We submit that family needs may well be as com-
pelling for the breadwinner out of work 4 weeks--or 8 weeks--as
for the person unemployed 15 weeks. To establish an arbitrary
number is to misread the purpose of a Public Employment Program.
The number on which we should concentrate is the number of
dollars going into PEP--as the report correctly does in
Recommendation No. 1.

-94-
AFSCME dissents from the use of an arbitrary figure in
Recommendation No. 8, as well--which would limit funds for Public
Works and Transportation jobs to 20% of PEP employment. By what
criterion does the report conclude that Public Works or Trans-
portation jobs are less meaningful or less needed as public
services--or that there are fewer opportunities to gain skills?
Again, we suggest that the report needs to look at those
areas of the city where cutbacks in street repair or in bus
transportation hit first and hit hardest--be assured that it is
not in the upper-crust, politically potent neighborhoods.
Finally, we cannot concur with the augmented training funds
called for in Recommendation No. 9. As we have noted earlier,
training and support services are a separated and distinct issue
from the funding df Section 5 and Section 6 programs under PEP.

-95-
APPENDIX C
Sample Study
Included in the study are the areas served by the following
local Urban Coalitions.
Urban Coalition of Greater Los Angeles
Stanford Mid-Peninsula Urban Coalition
Pasadena Urban Coalition
Metro Denver Urban Coalition
Urban Coalition of Metropolitan Wilmington
Greater Miami Coalition, Inc.
The Urban Coalition of St. Joseph County, Indiana
The Baltimore Urban Coalition
New Detroit, Inc.
Urban Coalition of Greater. Flint
Pontiac Urban Coalition
Urban Coalition of Minneapolis
St. Paul Urban Coalition
New York Urban Coalition
Niagara Coalition, Inc.
Westchester Coalition, Inc.
titizens' Coalition, Inc. (Winston-Salem)
Philadelphia Urban Coalition
The Urban Coalition of Rhode Island, Inc.
El Paso Urban Coalition
San Antonio Urban Coalition
The Racine Environment Committee

Dr. John L. S. Holloman, Jr.ChairmanHealth Manpower Advisory
BoardNew York, New York
Dr. Howard W. JohnsonChairman of the BoardMassachusetts Institute of
TechnologyCambridge, Massachusetts
Samuel C. JohnsonChairman and PresidentS.C. Johnson and Son, Inc.Racine, Wisconsin
Vernon E. Jordan, Jr.Executive DirectorNational Urban League, Inc.New York, New York
Joseph D. KeenanInternational SecretaryInternational Brotherhood of
Electrical WorkersWashington, D.C.
Hon. Moon LandrieuMayor of New OrleansNew Orleans, Louisiana
Robert D. Li lleyPresidentAmcrican Telephone and
Telegraph CompanyNew York, New York
Hon. John V. LindsayMayor of New YorkNew York, New York
Sol M. LinowitzChairmanThe National Urban CoalitionWashington, D.C.
Tony LovatoDenver, Colorado
Louis MartinVice President and EditorSengstacke NewspapersChicago, Illinois
Gordon McAndrewSuperintendent of SchoolsGary, Indiana
Donald P. McCollum, Esq.Oakland, California
Donald H. Mc GannonPresident and Chairman of
the BoardWestinghouse Broadcasting
Company, Inc.New York, New York
Dean R. McKaySenior Vice PresidentIBM CorporationArmonk, New York
Dr. Martin MeyersonPresidentUniversity of PennsylvaniaPhiladelphia, Pennsylvania
Barbara MikulskiCouncilwomanBaltimore, Maryland
J. Irwin MillerChairnianCummins Engine CompanyColumbus, Indiana
Alfred S. MillsChairman and
Chief Executive OfficerThe New York Bank for
SavingsNew York, New York
Gordon M. MoodieFormer ChairmanWestchester Urban CoalitionChappaqua, New York-
C. McKim Norton, Esq.CounselRegional Plan AssociationNew York, New York
Antonia PantojaExecutive DirectorPuerto Rican Research and
Resources CenterWashington, D.C.
Lorenzo PatinoSacramento, California
Jacob S. PotofskyGeneral PresidentAmalgamated Clothing
Workers of AmericaNew York, New York
Joseph RhodesPittsburgh, Pennsylvania
James M. RocheFormer ChairmanGeneral Motors CorporationDetroit, Michigan
David RockefellerChairmanChase Manhattan BankNew York, New York
Hillary RodhamNew Haven, Connecticut
H. I. RomnesChairman of the Executive
CommitteeAmerican Telephone and
Telegraph CompanyNew York, New York
Bayard RustinExecutive DirectorA. Phillip Randolph InstituteNew York, New York
Gumecindo SalesDetroit, Michigan
Henry SantiestevanExecutive DirectorSouthwest Council of LaRazaWashington, D.C.
Hon. Francis W. SargentGovernorThe Commonwealth of
MassachusettsBoston, Massachusetts
Dr. Mark R. SheddSpecial Assis.ant to the
Board of EducationPhiladelphia, Penns} Ivania
Rabbi Henry SiegmanExecutive Vice PresidentSynagogue Council of
AmericaNew York, New York
Lelan F. Sillin, Jr.Chairman and PresidentNortheast UtilitiesHartford, Connecticut
John G. SimonPresidentTaconic Foundation, Inc.New York, New York
Marta SotomayorDenver, Colorado
Howard SteinChairmanDreyfus Fund CorporationNew York, New York
Carl B. StokesWNBC-TVNew York, New York
Martin StonePresidentMonogram Industries, Inc.Los Angeles, California
Frank E. SullivanChairmanUrban Coalition of St. Joseph
CountySouth Bend, Indiana
James H. J. TatePhiladelphia, Pennsylvania
Irene TovarDirectorChicano School Finance
ProjectUrban Coalitibn of Greater
Los AngelesLos Angeles, California
Dr. Francisco TrillaChairmanPuerto Rican Association for
National AffairsBrooklyn, New York
Cynthia WedelPresidentCouncil of ChurchesWashington, D.C.
John WheelerPresidentSouthern Regional CouncilDurham, North Carolina
Roy WilkinsExecutive DirectorNational Association for the
Advancement of ColoredPeople
New York, New York
Leonard WoodcockPresidentUnited Auto WorkersDetroit, Michigan
Jerry WurfPresidentThe American Federation of
State, County andMunicipal Employees,AFL/CIO
Washington, D.C.
Rev. Vidrew J. Young, Jr.ChairmanCommunity Relations
CommissionAtlanta, Georgia