Embed Size (px)
Citation preview

DOCUMENT RESUME
ED 075 671 VT 020 051
TITLE Report on the Vocational Education Effort in Iowa,
1972.
INSTITUTION Iowa State Career Education Advisory Council, Des
Moines.
SPONS AGENCY Office of Education (DREW) , Washington, D.C.
PUB CATE Oct 72
NOTE 202p.
'EDPS PRICE MF-$0.65 HC-$9.87
DESCRIPTORS Budgeting; *Career Education; *Cost Effectiveness;
Elementary Grades; Post Secondary Education; *Program
Evaluation; Program Planning; Secondary Grades;
*State Surveys; *Vocational Education
IDENTIFIERS Iowa
ABSTRACTThis report was designed to measure the effort
expended during 1971 toward implementing programs to meet th3 needs
of citizens of Iowa and to supply the State Board of Public
Instruction with data, information, and advice to improve career
education efforts in the state. Data were obtained primarily from
statistics available by the State Department of Public Instruction
and the State Auditor's Office, from site visit observations
conducted over a 2-year period, and from questionnaire responses by
local and area school administrators, instructors, and students.
Based on the findings, a number of conclusions were reached, some of
which are: (1) Secondary school students seem to have a greater
interest in pursuing post-secondary vocational and technical programs
in area schools than previously, (2) Future program planning in the
vocational and technical area would be enhanced by annual labor
market needs surveys, (3) Area community colleges do not have the
proper financial commitment to provide strong vocational and
technical programs, (4) An imbalance of training effort exists in the
seven occupational clusters, (5) Most of the area schools provide
academic instruction related to the world of work, and (6) Population
trends and the state general aid formula may cause vocational
programs to have to be extended to disproportionate lengths.
(Author/SN)

FIL7.ED FRO:: BEST COT":
Iowaa place to grow
S r) PA F: .. r
OFFICE UP
1972 REPORT
ON THE
VOCATIONAL EDUCATION EFFORT
IN IOWA
Prepared by
STATE OF IOWACAREER EDUCATIONADVISORY COUNCIL
OCTOBER 1972

Iowa
a place to grow
RODERICK BICKERTChairman
Career Education Advisory CouncilExecutive Hills 1209 '.7.ast Court Des Moines, Iowa 50319 515/ 251 3650
October 3, 1972
Mrs. Virgil E. Shepard, PresidentIowa Board of Public Instruction
Dr. Sidney P. Marland, CommissionerUnited States Office of Education
Mr. Lawrence Davenport, ChairmanNational Advisory Council on Vocational Education
Madam and Gentlemen:
HARLAN1,(-;!1',LExccuLvc Lien
The attached report is intended to fulfill the legal requirementsgiven to this Council to conduct an annual evaluation of the voca-tional education effort within the State of Iowa. The Councilexpanded its responsibility, by including in this assessment, ef-forts directed toward the career education concept at the elementaryand junior high school grades, in addition to the review of effortsat the secondary and post-secondary level.
This report was a st:aff effort directly supervised by the Council.Each phase of the report was reviewed by the Council Members and,in numerous locations, knowledge gained b'' Council field visitsare reported.
Sincerely,
77.Roderick Bickert, Chairman
Harlan E., Giese, Executive Director
HEG/md
CC: Robert BentonCalvin Dellefield
CAREER EDUCA TION IS Career Orientation, Cart.. Exploration, and Job Preparation

1971-1972 MEMBERSHIP
IOWA CAREER EDUCATION ADVISORY COUNCILExecutive Hills - 1209 East Court
Des Moines, Iowa 50319
(515) 281-3656
CHAIRMAN:
VICE CHAIRMAN:
Robert Benton
Roderick Rickert
James E. Bowman
William Dickinson
Robert Kiser
Robert Koons
Executive Director:
Robert Skinner
Gordon Bennett
Harlan E. Giese
Evaluation Specialist: Donald Davis
Kenneth Lewis
Marvin Lind
John Reeves
Evelyne Villines
Joe White

TABLE OF CONTENTS
CHAPTER PAGE
II
11-CRODUCTION AND DEFINITION OF TERMS
Introduction. 1
Definition of Terms 4
AN OVERVIEW OF THE STATE PLAN AND FUNDING PATTERNS 7
The State Plan 7
Planning for Manpower Needs S
The State Plan 10
Educational Program Implementation 13
Developing State Plan Contents 19
Continuing Labor Market Survey 20
Funding Patterns 21
Summary and Conclusions 25
Recommendations 27
III CAREER EDUCATION EFFORT IN ELEMENTARY AND JUNIORHIGH GRADES 28
Elementary Effort 28
IV
Current Effort 29
Exemplary Projects 29
U.S. Office of Education Funded Project 31
Elementary-Secondary Education ActFunded Project 32.
Junior High School Effort 33
Summary and Conclusions 36
Recommendations 37
SECONDARY CAREER EDUCATION EFFORT 38
State Plan Analysis 38

11
CHAPTER PAGE
IV, cot' t. Secondary School State-Wide Effort 40
School Offerings 40Student Needs 43Labor Market Trends 43Existing Programatic Offering 44New and Expar_ded Program Offerings in FY 72Special Needs 47State-Wide Enrollment Trends 49Agricultural Employment Trends 51A Microscopic Example 53Educational Opportunities - Polk County 55Secondary Vocational Offerings of AreaCommunity Colleges and Area Vocational-Technical Schools 58
Efforts of Area Schools 59Efforts of County School System 60Related Academic Instruction 61Program Planning for Secondary Schools 65Program Justification 68
Guidance 70
Follow Up of Career Education Students 70
Developmental Efforts 73
Alternate Method for Student Follow Up 74
Financial Analysis 76
Equipment and Supplies 76Office Education 77Agriculture 79Distributive Education 80Home Economics 82Trade and Industry 84Summary 86Council Observations 87
Funding Secondary Programs 88
State Appropriations 88Tax Problems of Local Schools 89Federal Allocations to the State 92State Disbursement of Federal and StateFunds to Local Secondary School !3ystems 93Secondary School Administrator's Attitudeson Financing of Vocational Programs 97

CHAPTER
IV, can't. =e7."niform Sys
AlternaL-;_vcs lo 77Lu...-tionL1Offering
Recommendal-icns o L Gcvernor':-; :7_ducationalAdvisor-.7
Other AlLerm=i.Li..
CO:e
Fizz:ding
Trar,s;:,orcation
Population Base
1C.1
101
101101
Summary and Conclusions 104
Recommendations 107
V CAREER EDUCATION EFFORT TN AREA SCHOOLS 109
State Pan Projections 109
Projected Enrollments 109Comparative Information 110
Post - secondary State-Wide Effort 121
Enrollment Reporting Systems 121Enrollment Trends 123Programatic Offering 131Prcram Voids 134New Programs in Fiscal Year 1972 139Future Planning 140Related Academic Instruction 146Post-Secondary Administrator's Opinion -Career Education Concept 148
Program Justification 149
Guidance and Counseling 150
Placement and Follow-Up of VocationalEducation Terminators 150
Alternative Methods for Student Follow-Up 154
Financial Analysis 156
Information Source 156Equipment and Supplies 156Home Economics 157

CHAP TER
V, eon' t. Office -.::ducati-,11
DistributivHealth 0,:cup3tionsTrade and inalstrySummary
Appropriatio:Is and _-,Ilocations
'AT..7.z.,Licaal. Aid iTunding Trencis
Gecleral Aid Funding Trends
Prograraa Costs
IntroductionFulicling TrendsPrograr, Cost Variations
Summary and Conclusions
Recommendations
BIBLIOGRAPHY
1571
16=,
171
171
173176
179
182
184-187

LIST OF GRAIDI-1S
GRAPH PAC;;.
1 Projected Training Output Compared to Need 15
2 Professional, Technical, and Service OccupationalGroups hill Grow Fastc_.,,,t
3 Projected Employment Opportunities During FiscalYear 1972 17
4 Vocational Education Funding and Allocation Patterns
5 Iowa Secondary School Attendance Centers OfferingReimbursed Vocational Programs 42
6 Total Manpower Needs for Iowa 43
7 Reimbursed Occupational Programs or Program ClustersAvailable to Secondary Students in Iowa in FiscalYear 1972 45
8 Student Enrollments in Secondary Vocational- TechnicalPrograms 50
9 Vocational Programs in Eight Counties Around PolkCounty 54
10 Secondary Attendance Centers Offering ReimbursedVocational Programs in Polk County 57
11 Analysis 05 Secondary Student Follow-Up 71
12 Terminating Students with Status Unknown or NotAvailable fIr Placement 72
13 State Biennial Allocations for Elementary andSecondary Education in Iowa 91
14 Per Cent of Reimbursement Compared to Amount Requested 94
15 Cost of Vocational Instruction Per Pupil, Per Year,in Fiscal Year 1971 in Council Bluffs CommunitySchool System 96
16 Actual and Projected Enrollment Trends in Iowa's AreaCommunity Colleges and Area Vocational-TechnicalSchools 110-113

GRAPH
17
18
Iowans Age 18 Ease:: on l'rojected Live Eirbs
Student Enrol:-:.Ents in ?os7:-Scondar-v Vocazicnal-Technical Programs
19 Post-Secondary ':c-J-Lic.:1a1-1 cca Enr,olint Trends
20 Number of ru17-1- -2z7;*a,..ryPrograms Of ere -,sy Area Schools During 1;72
21 Programs Cffered by Area Scthools in Seven OccupationalCategoris 135-138
22 AnEA.ysis of Fast-Secondary Student Follow-Up 151
PACE
119
i 32
23 State Biennial Allocations for Undergraduate Post-Secondary Education in Iowa 170
24 State-Wide Post Secondary Vocational-Technical ProgramCosts Compared to Post-Secondary Vocational AidReimbursement 174
25 Per Cent of Reimbursement Compared to Total Program Cost 174
HAP
1 Specific Areas of High Rates of Youth Unezplovnent
2 Areas with Higher Races of Schcoi i:iropouts
3 Secondary Programs Reimburs126 for the First Tine
Fiscal Year 19 72
4 Percentage of Farmers Workiag Off the Far 100 Days
or More Annually
Secondary Schools Located in Counties iincluded in
1972 Survey
52
62

LIST 3F TAf3LES
A
TABLE
1 Program Expansion Plans Projected by Local
Administrators
2 State Biennial Allocations for Flementary and
Secondary Education in Iowa
PAC,E
ip7
3 Number of Students Enrolled by Occupational
Categories, by Area Schools, During the Fall
Term, 19 71 124
4 Program Expansion Plans Projected by Area School
Administrators 142
5 State Biennial Allocations for Undergraduate Post-
Secondary Education in Iowa 168-169

ix
LIST OF MIENS
EXHIBIT PAGE
Youngsters took for Security, \ot Glamour 118
2 Rakes 'National Mania' for College Degrees 128

x
APPEND"
A Inventory of CounLi visits
PAGE......
189
CHAPTER I
INTRODUCTION & DEFINITIONS OF TERMS
INTRODUCTION
This report was designed to meet the requirements of Public Law
90-576 in terms of measuring the extent of effort expended during the past
year (using the State Plan for Career Education as a bench mark) toward
implementing programs to meet the needs of the citizens of Iowa. The re-
port is also designed to satisfy the desires of the State Board of Public
Instruction for data, information, and advice to be considered in develop-
ing policies to foster improvement of the career education effort in Iowa.
A summary of the major points for which Council thought was requested is
contained in the December 14, 1971 letter from Mrs. Virgil Shepard, State
Board President. These points are as follows:
1. What are the recommendations of the Advisory Councilregarding the role and responsibilities of the dif-ferent educational agencies involved in career educa-tion?
2. What are the recommendations of the Advisory Councilregarding financing career education?
3. What are the strengths and weaknesses of career edu-cation offerings in the elementary-secondary schoolsof the State?
It is also the hope of the Council that the State Legislature will
be able to use the contents of this report as an assist in its law making
efforts. A few items in this report reflect on problem areas that emanate
from congressional action. Hopefully, the Council's efforts at bringing
these to light will be of assistance at that Level.
-2-
The report was developed through the use of. statistical in-
formation made available by the Iowa Department of Public Instruction,
The State Auditor's Office, from observations made by field visits of
the Advisory Council
sponses by local
`rig the past two years, from questionnaire re-
school administrators, and instructors, and
from numerous other data sources which are listed in the bibliography.
The Council wishes to recognize and commend the local and area school
educators for the high level of professionalism which they displayed
through the rapid return of the questionnaires. The questionnaires
mailed were sent to a sample of the total population and mailed by
groups, according to the speciality background of the individual, i.e.,
school administrators, office education instructors, vocational agri-
culture instructors, and the like. The percentage of response was con-
sidered to be exceedingly high on the first mailing which allowed the
Council to conserve some of its limited funds by not requiring a second
and third mailing to obtain a sufficient response for tabulation. We
appreciate these attitudes which were demonstrated by the Iowa Educators.
The Council also recognizes the assistance of the various staff
members of the Department of Public Instruction in forwarding needed data
to the. Council and interpreting and clarifying information in which there
appeared to be discrepancies.
The methodology used for completion of this report included
charting the major component parts of. Public Law 90-576 and sub-dividing
these components into elementary and secondary school effort, area school
effort, and adult education effort. Because of the large number of

-3-
components of the Act and limited staff time, it was possible to only com-
plete an assessment of state effort relating to the portions of the Act on
secondary and post secondary programs, and selected exemplary programs and
projects. A cursory review was made of the portions of the Act relating
to diF-, handicapped, guidance and counseling, research and
training, cooperative programs, and consumer and homemaking education.
No attention was given, in this report, to construction, contracting with
private schools, ancillary services, work study, or the secondary and post
secondary school effort in adult education.
Throughout the report, primary data sources are cited. In order
to increase efficiency, a modified scientific footnoting method is used to
identify the sovrcas of the data cited. A typical footnote carries the ap-
pearance of (5-150). In this illustration, the 5 denotes the data source
which is numbered in the bibliography and the number 150 cites the page
number on which the data may be found. A footnote appearing like (25)
identifies a single document (usually of limited length) found in the bib-
liography where no page number is necessary.
Public Law 90-576 specified that each state shall establish a
vocational education advisory council. In the Fall of 1971, the Iowa
Vocational Advisory Council decided to change its name to the Iowa Career
Education Advisory Council. It was the belief of this Council that the
change in name would not create any conflict in terms of discharging its
responsibilities as outlined in Public Law 90-576. Current emphasis by
the U. S. Office of Education on Career Education places importance on the
Iowa Council's efforts to be concerned about the total career development

-4-
of t: e citizens of Iowa, rather than limiting its efforts otily to the job
ski ;e,velopment portion of career education which is normally referred
to as vocational education.
DEFINITION OF TERMS
This report uses certain teLillinology for which a statement
definition may Larify the couilunications between the intent by the Council
and the message received by the reader. Where the source of the definition
is not identified by footnote, the definition has been approved for use in
this report by the Iowa Career Education Advisory Council.
Administrative Decision
A decision defining the details with which board policy will be
implemented,
Board Policy
A judgment, derived from some system of values and some assess-
ment of situational factors, operating as a general plan for funding
decisio:-.s regarding the means of attaining desired objectives. (1-403)
(Some policies are also established by the Iowa Legislature and the Con-
gress in their law-making activities.)
Career Education
K - 6 - Career education in grades K - 6 relate existing es-
sential instruction in the basic skills to the varied ways by which adults
earn a living and teaches respect for the value of all work.
Junior High School - Career education in the junior high school
provides "hands-on" exploratory opportunities in major occupational "clus-
ters" (broad groupings such as marine science, construction, fine arts, and
-5-
health, et. al.) of which each student should explore a minimum of three
clusters which are of his greatest interest to determine the nature of
careers in each cluster.
Senior High School - Career education in the senior high school,
should provide a broad range skill training in clusters of closely related
occupations keyed to student interests, labor market needs, and recent mi-
gration patterns of the institution's graduates. The student should develop
sufficient skill in a specific job cluster to qualify for employment or
entrance into more advanced job preparation or further education for a pro-
fession. It may be desirable to provide a cooperative program for the stu-
dent during his 12th grade to bridge the student's transition from school
to work.
The Area Community Colleges and Area Vocational Schools can serve a
unique function as part of the total career education effort. These schools
should cooperate as a statewide system that provides specialized vocational
and technical programs for those persons who have graduated or left high
school who need highly developed skills in specific job categories to com-
pete effectively in the labor market.
Functional Administrative Cost - The administrative cost in an area
school which is directly attributable to one of the four specific program
functional categories outlined in Section 286A.12 of the Iowa Code. To il-
lustrate, the functional administrative cost attributable to the cost of
all vocational programs of an area school would be the salary of the voca-
tional director, his staff, supplies, travel, and the like. (48)
Program - A number of courses (or units of instruction) properly or-
ganized into learning units for the purpose of attaining specified educational

-b-
objectives; many include out-of-school activities sponsored by the school;
(1-420)
or
A curriculum - which is organized and conducted in accordance with the
provisions of the State Plan for Vocational Education approved the IL S.
Office of Education. (14-16)
Vocational Education - That portion of career education that is di-
rected toward imparting to students the skills and specific related infor-
mation necessary to prepare the individual for entry into employment.
CHAPTER II
AN OVERVIEW OF THE STATE PLAN AND FUNDING PATTERNS
THE STATE PLAN
Part II of the State Plan contains an analysis of data which is
utilized for projecting the vocational education needs of the State for a
period of five years. The rata is presented in tabular and graphic form.
The identified labor :aarkeL need information was compiled from several
primary sources. Somc of tine sources derive their conclusions on labor
market need from statical. projections, while others project needs based
on vacancy studies. A third process utilizes employer surveys to project
future need.
Previous annual evaluations by this Council have recognized that,
while the information used was the best available, the reliability of the
data mix could be questioned. Valid data is necessary for effective plan-
ning. For this reason, this Council has recommended, in the past, the
completion of a coordinated state-wide labor market survey of employers.
At the time of this writing, the planning and design for a study of labor
market need has been completed by the Department of Public Instruction.
That agency has reported that they intend to conduct the labor market need
survey in time to include the results in the Amendments of the 1973 State
Plan. For this reason, the Council will not spend time developing an ex-
tended analysis of Part II of the State Plan for Fiscal Year 1972. Se-
lected elements of Part II have been cited in the advice letter sent by
the Council to the State. BoLtrd with regard to needed 3mendonts for t'
Fiscal Ycar l(173 .id-vice letLer be lounk.1 in the Ap-
pendix.
Planniro., or Markr)owe- Needs - The current of fort by the Depart-
ment of Public instruction in identifying employers traiilin needs is one
of the components of the Career Education Need information System. The
empitoyment need portion of the CENTS Project covers a sampling of all em-
plo7yers, state-wide. This Project also includes a sample of all employers
located within the boundaries of each merged area district in the State.
The study is to be funded with State research funds from Public Law 90-576.
According to Section 103(a)(1) of Public Law 90-576, the Comm!.s-
sioner of Education shall transfer funds to the Secretary of Labor, so
that he may complete national, regional, state, and local studies and pro-
jections of manpower needs for the use of Federal, state, and local of-
ficials. Since the passage of Public Law 90-576, no funds have been re-
ceived by the Iowa State Employment Security Commission to make studies and
projections for career education planning. Further, it has been determined
that the U. S. Office of Education has never transferred any funds from
their office to the Secretary of Labor under Section 103(a)(1).
Presently, the National Advisory Council on Vocational Educa-
tion is hosting meetings between the U. S. Office of Education and the
Bureau of Labor Statistics to identify methods for effectively identifying
labor market needs. These discussions, we understand, include details of
implementing Section 103(a)(1) of Public Law 90-576.

In a report izom the Governor's Conference on Comprehensive Man-
power Planning, George Lundberg, Chairman of the Iowa Employment Security
Commission reported "...that, despite volumes of statistics collected uv
government agencies and others, there were many important areas where we
(sic: Employment Security) had little, if any reliable information." (32-14)
He further reports that current work force data is not available for almost
two-thirds of our Iowa Counties. (32-41)
Iowa State Employment Security Commission reports that the major problem
in collecting adequate labor market information is the lack of qualified
personnel and data processing capacity. (32-42)
The Council has had the opportunity to review the planning and
design foundation for the labor market need portion of the CENIS Project.
The Project will be funded with Part C funds from Public Law 90-576. It
appears to the Council that the system being planned will yield informa-
tion that can be used to facilitate effective state-wide and area-wide.
educational program planning. It also appears that this information will
be of considerable value, since it will be based on employers' stated
needs which will be sampled periodically. This expression by employers
will reflect, more accurately, projected employment opportunities in more
meaningful job classifications in Iowa than the 1972 statistical projec-
tions made by the Iowa State Employment Security Commission in their
publication Occupational Requirements for Vocational Education FY 1972.
Those projections are based on national trends for broad clusters of jobs.
Federal regulations prohibit the use of Part C research funds

on the same topic lor r,ore ap-)ear cIppropriaLe for
the Administration: 3card In',ccucti,m to ;41.ve dLtentiell to
planning for funding and ILLT.;,ec.1,!ntaLon vi i It.ure labor Tarket surv:?.vs
like that proposed unoef ?rojoct.
Snould the U. S, Of Lice of. lEduchLin fund Lhe U. S. Department
of Labor to the full exter,t speciiel! in Lhe law ($5,000,000), and should
the U. S. Department of Labor divert a proportionacc share of these funds
to the Iowa State Emplynient Security Commission, the allocation to Iowa
would, most likely, be inadquate to effectively collect the necessary
planning ,x1formation outlined by Mr. Lundberg in his speech. Funds
should be sought from the Scate Legislature to support periodic labor
maket need surveys.
The State Plan is intended to be a blue print which details the
work or accomplishments to be achieved in a given period of time. In
order to develop such a plan, it is necessary to have reliable data about
the labor market, student needs and interests, and past trends of student
movement within and out of state. To be effective, a blue print or plan
must have demiensional characteristics that tell how much, when, and where.
These dimensions need to possess projection of possibilities for deviation.
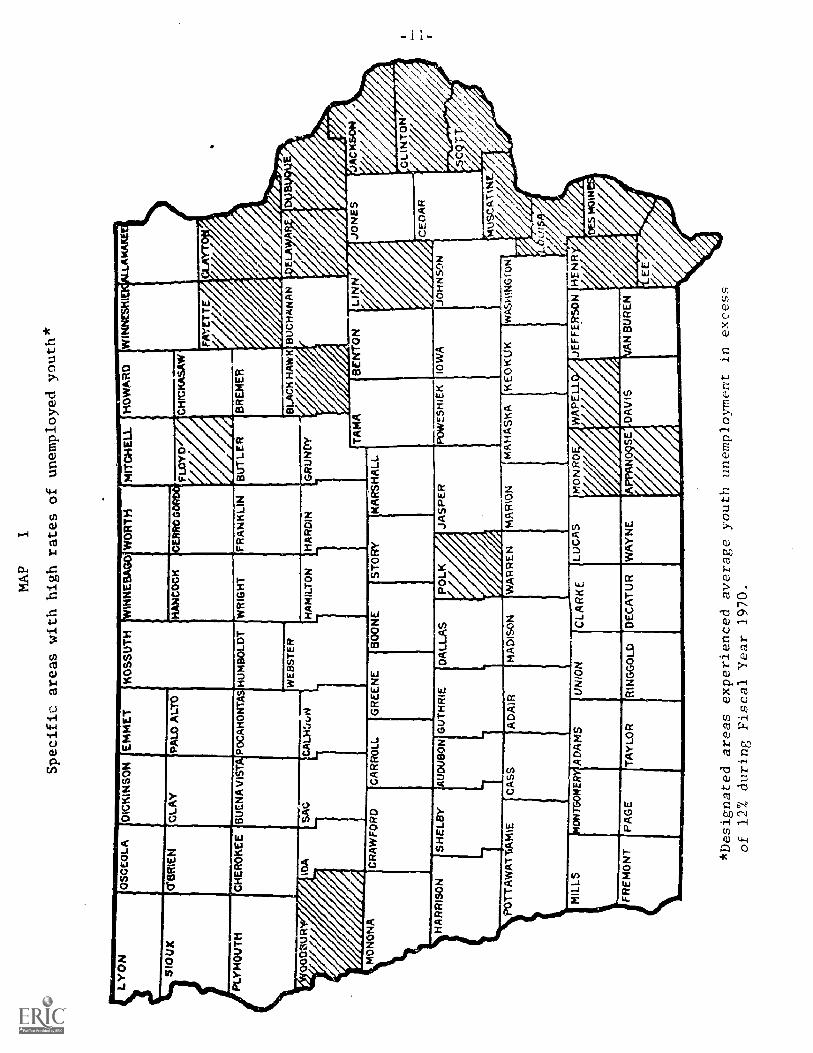
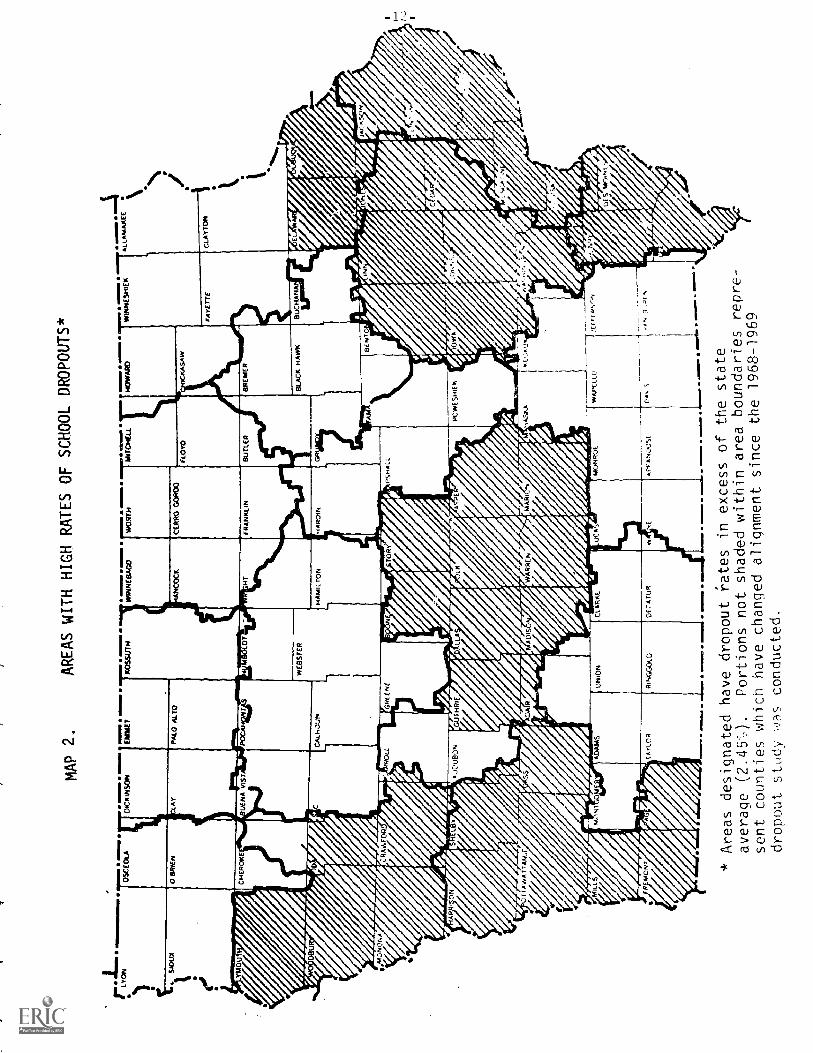
Maps contained in Part II of the State Plan for career education
delineate depressed areas, areas with high youth unemployment, areas of
generally high unemployment and underemployment, and areas experiencing
high rates of school dropouts. (See Maps 1 & 2). Other graphics identify
areas of population density, schools with five or more vocational programs
SIO
UX
OS
CE
OLA
aemEm
MAP
1
Specific areas with high rates of unemployed youth*
DIC
KIN
SO
NE
MM
ET
KO
SS
UT
HIH
NE
BA
GO
PA
LO A
LTO
HA
NC
OC
K
PLY
MO
UT
HC
HE
RO
KE
EB
UE
NA
VIS
TP
OC
AH
ON
TH
UM
BO
LDT
WR
IGH
TF
RA
NK
LIN
MIT
CH
ELL
FLO
YD
/
BU
TLE
R
HOWARD.
FA
YE
TT
E
WE
BS
TE
RB
LAC
K H
AW
KB
UC
HA
NA
N00
0BU
RC
ALM
:ode
.)H
AM
ILT
ON
HA
RD
ING
RU
ND
Y
JON
ES
MO
NO
NA
CR
AW
FO
RD
CA
RR
OLL
GR
EE
NE
ST
OR
YM
AR
SH
ALL
CE
DA
R
HA
RR
ISO
NS
HE
LBY
AU
DU
BO
NG
UT
HR
IED
ALL
AS
JAS
PE
RP
OW
ES
HIE
KIO
WA
JOH
NS
ON
CLI
NT
ON
PO
TT
AW
AT
hAM
IEA
DA
IRM
AD
ISO
NW
AR
RE
NM
AR
ION
MA
HA
SK
AKEOKUK
A9.11NGI-cM
MIL
LSA
DA
MS
UN
ION
CLA
RK
ELU
CA
SMONRO
FR
EM
ON
TT
AY
LOR
RIN
GG
OLD
DE
CA
TU
RW
AY
NE
DA
VIS
AN
BU
RE
N
*Designated areas experienced average youth unemployment in excess
of 12% during Fiscal Year 1970.
f)
OS
CE
701.
7..
0 B
RIE
N
MAP 2.
DIC
KIN
SON
DIM
E;
PA
LO A
LTO
AREAS WITH HIGH RATES OF SCHOOL
DROPOUTS*
Rosstns
WIN
NE
BA
GO
$117
MW
UH
OW
AR
D
om
IwwA
WIN
NE
SH
IEK
ALL
AM
AK
EE
CE
RR
O G
OR
DO
FA
VE
77E
UE
NA
KIS
T
WO
VE
NB
LAC
K H
AW
KB
UC
HA
N
C.A
LI-o
)UP
HA
MIL
TO
NH
AR
OIN
IM
ON
ON
AC
MA
WF
OR
PS
HA
LL
.LL.
NU
MIL
LSW
KR
EL
LCJE
F,f,
Z5r
:
..11
111
VT
AY
LOR
RIN
GG
OLD
DE
C..
TU
R
1114
ON
Iew
oof
=E
mm
aoo
limm
oss.
o
Aiv
AN
CC
SE
`v,f
o.a
. o
* Areas designated have dropout
rates in excess of the state
average (2.45).
Portions not shaded within area
boundaries repre-
sent counties which have changed
alignment since the 1968-1969
dropout study
q3S. conducted.
1

and geographic areas sg..rved by each area school.
When reviewi74. Sc.ate Plan for Fiscal Year 1972, the Council
finds that state-wide quantitative measures for performance are identified
in the annual Plan. Neither the annual Plan nor the long-range Plan identi-
fy the school disri.;ts where the projected programs will be located to
serve the greacesc number of students with the greatest needs most effi-
ciently. The Plan,also,does riot specify whether the new or expanded pro-
grams will be located in the schools experiencing high rates of youth drop-
out or high youth. unemployment. The current and preceding State Plans did
not state the goals to be attained in dimensional or measurable terms.
The U. S. Office of Education has developed new guidelines for
the State to follow in developing the State Plan for Fiscal Year 1973.
These 'sidelines encourage the writing of the State Plan in terms of meas-
urable obler!TI-ves.
The U. S. Office of Education guidelines specify that the goals
need to be stated in terms of level of education (e.g., elementary, sec-
ondary and the like) in addition to target populations such as general,
disadvantaged, handicapped, and the like.
One inhibiting factor to effective state planning is the un-
certainty of federal funding. For this reason, it appears appropriate
that priorities should be placed on program implementation, so that
schools and students with greatest needs are given high priority and
others are given lower priority.
....ati.onEdtalpromlementation - The major program cate-
gories were analyzed in Table I of Part II of the State Plan to identify
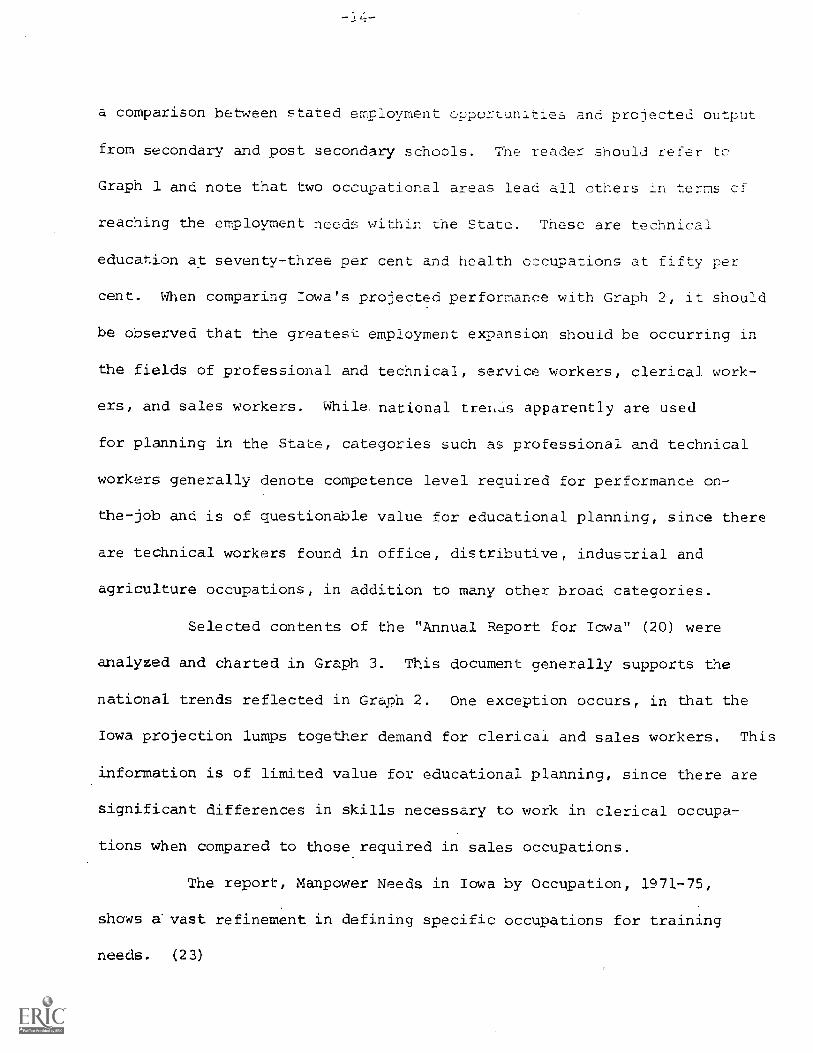
a comparison between stated employment opportunities and projected output
from secondary and post secondary schools. The reader should refer tc
Graph 1 and note that two occupational areas lead all others in terms or
reaching the employment needs within the State. These are technical
education at seventy-three per cent and health occupations at fifty per
cent. When comparing Iowa's projected performance with Graph 2, it should
be observed that the greatest employment expansion should be occurring in
the fields of professional and technical, service workers, clerical work-
ers, and sales workers. While. national treh.is apparently are used
for planning in the State, categories such as professional and technical
workers generally denote competence level required for performance on-
the-job and is of questionable value for educational planning, since there
are technical workers found in office, distributive, industrial and
agriculture occupations, in addition to many other broad categories.
Selected contents of the "Annual Report for Iowa" (20) were
analyzed and charted in Graph 3. This document generally supports the
national trends reflected in Graph 2. One exception occurs, in that the
Iowa projection lumps together demand for clerical and sales workers. This
information is of limited value for educational planning, since there are
significant differences in skills necessary to work in clerical occupa-
tions when compared to those required in sales occupations.
The report, Manpower Needs in Iowa by Occupation, 1971-75,
shows a' vast refinement in defining specific occupations for training
needs. (23)

7
n50
25
13.4
10.
'2
NN
cn 0 0 0 0 0 4.1
cd a)
43-9.
a-e
stst
O
GRAPH 1
Cr) N
N N
0 C
NC
r
-6'4
13"
5.'
Inen r-
-113
4!
NV
)
NC
r)
.
.. 40,4
%O
4.
.41
N'4
)C
iN
VD
N4)
NC
iN
'CN
1---
I's-.
NN
r-N
-N
.N
.N
.N
.N
.N
Projected Training Output Compared to Need, in Percentage
(Including Expansion and Replacement)
Developed From Table 1 page II -
3 1972 State Plan for
Career Education.
N
Gra
ph b
y Io
wa
Car
eer
Edu
catio
n A
dvis
ory
Cou
ncil

-16-
Professional, technical and service occupational groups
will grow fastest
Employment
(millions)Occupational group
-30 -20
Percent change
-10 0 10 20
1968
75.9
10.3
7 7.
12.8
4.6
7.8
10.0
1.7
14.0
3.6
3.5
1980
95.1
15.5
11.1
17.3
6.0
9.5
12.2
2.0
15.4
3.5
2.6
ALL OCCUPATIONS
Professional and technicalWorkers
Service workers, exceptprivate household, e.g. hospital
attendants, policemen, waitresses
Clerical workers
Sales workers
Managers, officials,proprietors
Craftsmen and foremen
Private household workers
Operatives, e.g. assemblers,truck drivers, bus drivers
Non-farm laborers
Farm workers -33
-2
GRAPH 2
From: U. S. Manpower in the 1970's
U. S. Department of Labor, 1970
U. S. G.P.O., Washington, D.C.
30 40

70
60
50
4030
2010
-17-
14,138
GRAPH
3
12,168
9,733-n 6
,151 4,649
/1
Projected
Employment
Opportunities
During
FY
1972
(From:
Occupational
Requirements
for
Vocational
Education
-
FY
1973 -
Iowa
Employment
Security
Commission,
Des
Moines,
p.7.)
Graph
by
Iowa
Career
Education
Advisory
Council

-18-
The results from the CENTS Project r.i1i :lore adequately identify
programming trends that should take place in the State. It should be pc-
sible to summarize these occupations into the fifteen occupational clusters
identified by the U. S. Office of Education. The fifteen occupational
clusters include:
Agri-business andNatural Resources
Marketing andDistribution
Business & Office Marine Science
Health Personal Services
Public Service Construction
Environment Transportation
Communication and Consumer and Home-
Media making Education
Hospitality and Fine Arts and
Recreation Humanities
Manufacturing (8-2)
Each cluster could then be further identified by categories based on com-
petency level. These would include unskilled, semi-skilled, skilled,
technical, and professional. It is recognized that institutions of higher
education have been preparing persons for employment in the professions
for many years. Junior and community colleges and area vocational-technical
schools have been preparing persons for employment in technical occupations
for at least twelve years. With respect to the 1972 State Plants projected
increase in needs for professional and technical persons, the question
should be raised considering the viable labor market; does this trend
identify whether employers will prefer to intensify "in company" promo-
tions of skilled personnel to technical classifications, or will employers
hire graduates from technical programs for technical vacancies in their
organization? Also, do the national trends for professional and techni-
cal workers apply to Iowa?
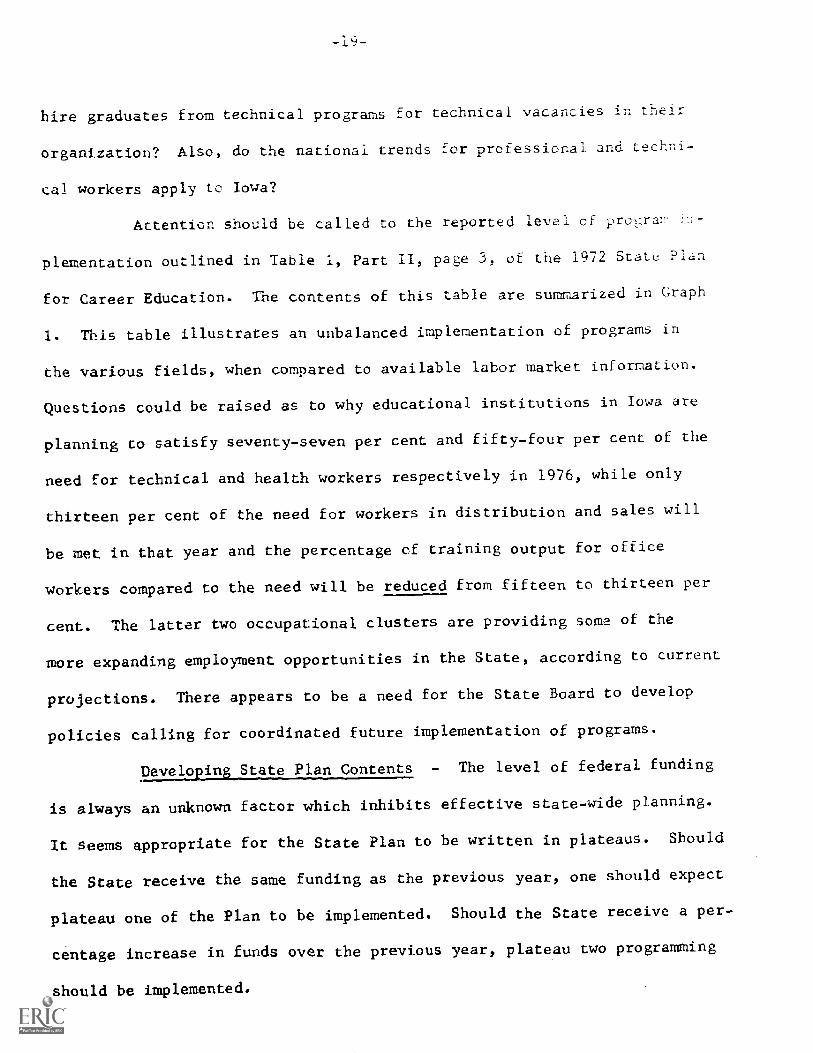
Attention should be called to the reported level of pro `:ran,
plementation outlined in Table 1, Part II, page 3, of the 1972 State P1,.11
for Career Education. The contents of this table are summarized in Graph
I. This table illustrates an unbalanced implementation of programs in
the various fields, when compared to available labor market information.
Questions could be raised as to why educational institutions in Iowa are
planning to satisfy seventy-seven per cent and fifty-four per cent of the
need for technical and health workers respectively in 1976, while only
thirteen per cent of the need for workers in distribution and sales will
be net in that year and the percentage of training output for office
workers compared to the need will be reduced from fifteen to thirteen per
cent. The latter two occupational clusters are providing some of the
more expanding employment opportunities in the State, according to current
projections. There appears to be a need for the State Board to develop
policies calling for coordinated future implementation of programs.
Developing State Plan Contents - The level of federal funding
is always an unknown factor which inhibits effective state-wide planning.
It seems appropriate for the State Plan to be written in plateaus. Should
the State receive the same funding as the previous year, one should expect
plateau one of the Plan to be implemented. Should the State receive a per-
centage increase in funds over the previous year, plateau two programming
should be implemented.

-20-
- There appears to be a need
for an annual collection of labor market information to provide current
basis for effective vo-ational educational planning. The CENIS Project
components, after the system is perfected, should be assigned to these
agencies that are best equipped to complete the tasks. The State Man-
power Planning Council should coordinate this CENTS effort on an annual
basis.
The State Legislature should appropriate sufficient funds in
the 1973 Session to defray the cost of the annual labor market survey.
Possibly, state matching funds for NDTA programs could be diverted to
the labor market survey portion of CENTS. It is possible that future
rapid shifts in the labor market may occur, as has recently happened
in the aero-space and electronics industries, where large numbers of
workers from these industries are experiencing unemployment. For this
reason, it appears appropriate that future program planning should be
aimed at balancing the statewide offering with the fifteen occupational
clusters, identified by the U. S. Office of Education, so that drastic
shifts in training programs offered by schools will not be necessary.

FUNDING PATTERNS
Graph 4 shows the total state and federal funds all:sscated .as
categorical aid to be used to assist in defraying the exceptional cost
of vocational-technical and other categories of career education, such
as disadvantaged and handicapped programs, research, teacher education,
home economics and exemplary projects. The Graph does not include allo-
cations made for financing the cost of state administrative expenses.
The solid lines represent the allocations of state and federal funds,
and total state and federal funds available for local and area school
program support. It should be noted that increases in state funding have
not been made in proportion to the increase in federal funding. The in-
crease in federal funding,during the last three fiscal years, brings
that appropriation to a level almost equal to the amount appropriated
by the State Legislature for fiscal year 1972.
Prior to fiscal year 1968 and through fiscal year 1971, the
State Legislature made a single appropriation for vocational education
aid and left the responsibility for allocation of those state funds to
the discretion of the State Board of Public Instruction. During the 64th
General Assembly, the Legislature passed separate appropriations for
secondary schools and area schools for vocational education support. The
secondary schools were allocated $1,725,000.00 for each year of the bien-
nium, while the area schools were allocated $5,175,000.00 for each year
of the biennium. (4-5) The State Board is still left with the discre-
tion of allocating the federal aid funds, between secondary and post

16
15
14
13 12 11 10
State and Federal Total Vocational
Aid Funds
8,0634216
8,115,937
.0"°
.0' ------..",, 21473,410
....0
......
.0-
ft,a,,,,....0
.0
,...0""
.0* --......_
.0
---. 7,289,359
00.0
0e.
OP0' 7 421 016
4."
.10
7(D) 6,445,000
(C) 6,315,000
5
1.11.Wati
.0°
140T
A.
State & Peapral Allocations Sor Setendary
Schools - Less disadvantao,c1, hdfid14vved,
ro!;odrch, work....1odv. exemplar
A gniiiaver
TotaI
CArea School liudgni
Inc. Adult Progrdrtr.i
-
Le!; guidance, disadvantaged, work-stilv,
handicapped, A exemplary
D.
Total Area School Allocation
,0,.9,517,486
cor
8,258,1)51
(3-43)
(3-43)
(2-64)
(2-64)
State Legislative Appropriations
Total Federal Funds - Not including
carry-overs
2 823 143
52122,25,38
,
(B) 2,781,135
aI o
"3,1/9
(A) 2,636,135
-7
,,
_27*7
2,241,Sin
(4-57)
(6-'17)
4,1)5,742
-
68
69
70
71
PHcal Year
f-.111'1i
,!4
VOCATIONAL EOUCAT1ON PUNDIN' AN))
BUDGET ALLorA-11i,
PROGRAM REIMBVRSEMENT
NICAL AND AREA SCH(11.1,
IN
DAJA
Source:
Iicart-w,t
roposed ter,I
;'if-,(-11
Year 1(4;2
71

secondary schools, for vocation7.1 education.
The funding of area school programs from vocational aid 1-,:nds
has been greater than secondary schools for the five year period Ircrn
fiscal year 1968 through fiscal year 1972. Line C on the Graph repre-
sents the funds available for programs designed for the general popula-
tion, while line D represents the total amount of vocational aid funds
available for area schools, including specially earmarked federal funds
directed for use with special needs population and for the development
of exemplary projects, and for guidance. The difference between Lines
C and D represents the amount of special purpose funds delivered to area
schools. Except for fiscal year 1970, the average amount of vocational
aid funds has been increasing over the five year period.
The funding of elementary-secondary school programs from voca-
tional aid funds has been less than that allocated to area schools during
the five fiscal years. Line A cn Graph 4 represents the amount of funds
available for programs designed for the general population, while line B
represents the total amount of funds available for secondary schools, in-
cluding special purpose federal funds. During t le fiscal years 1968
through 1971, there was a trend toward reducing the amount of funds avail-
able for programs for the general population, while in fiscal year 1972
there was a significant increase (nearly a million dollars), or almost
thirty per cent. The amount of special purpose funds for secondary
schools held at approximately $100,000 for fiscal years 1968 through 1969,
increased to approximately $200,000 in fiscal year 1970 and moved to near-
ly $1,000,000 in fiscal year 1971 and over $1,000,000 in fiscal year 1972.
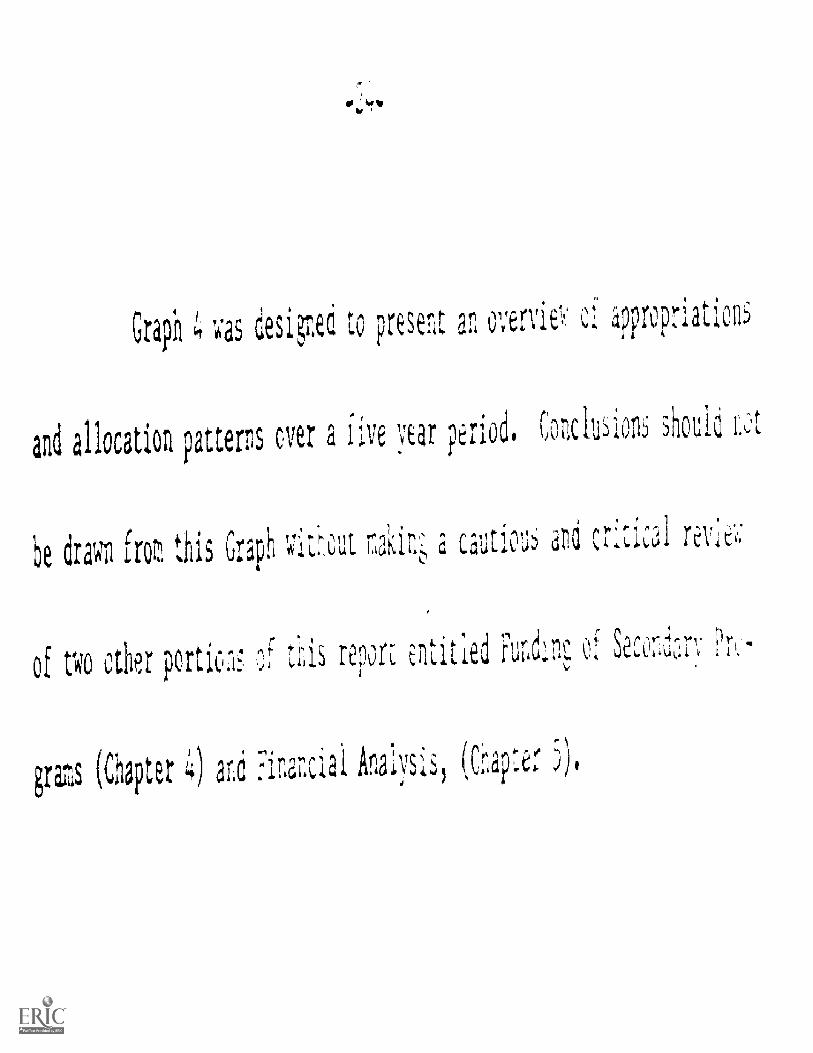
bra 1 To:as desiped to present an overviel:' qro iatio6
and llocation ptterns uer a five yEar period. Conclusions should r.!,
be (Iran froz this Graph 1A'.:icidt r,lk a uciutioli eid
of No other portio:i tcds 1-.)orE Secorid3r;
grats (C'mptt '4) ..'inar,ciai Analysis, (Cii'ir.er 5).
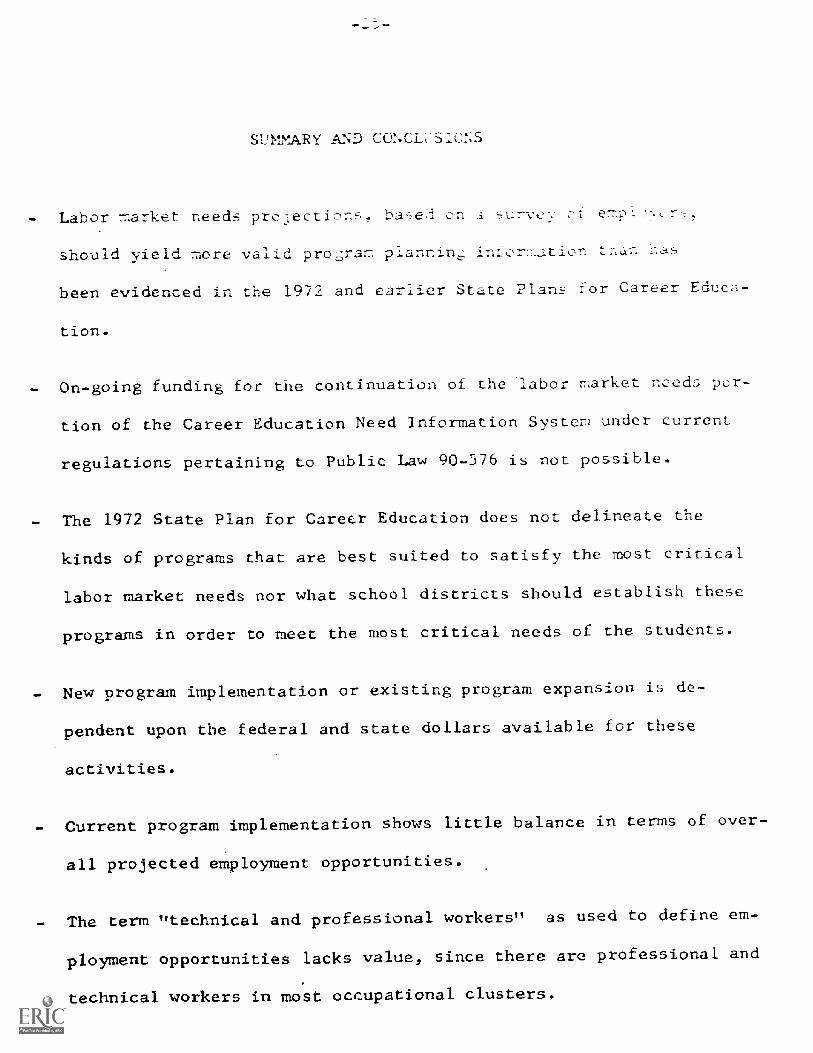
SIRT.!ARY AND CONCECSICNS
- Labor market needs pro;ections, bae,i on 3 5-Iry t::y 0' e7:-4)Hc
should yield more valid proram pl nnin;
been evidenced in the 1972 and earlier State Plans for Career Educa-
tion.
- On-going funding for the continuation of the labor market needs por-
tion of the Career Education Need Information System under current
regulations pertaining to Public Law 90-576 is not possible.
- The 1972 State Plan for Career Education does not delineate the
kinds of programs that are best suited to satisfy the most critical
labor market needs nor what school districts should establish these
programs in order to meet the most critical needs of the students.
- New program implementation or existing program expansion is de-
pendent upon the federal and state dollars available for these
activities.
- Current program implementation shows little balance in terms of over-
all projected employment opportunities.
- The term "technical and professional workers" as used to define em-
ployment opportunities lacks value, since there are professional and
technical workers in most occupational clusters.
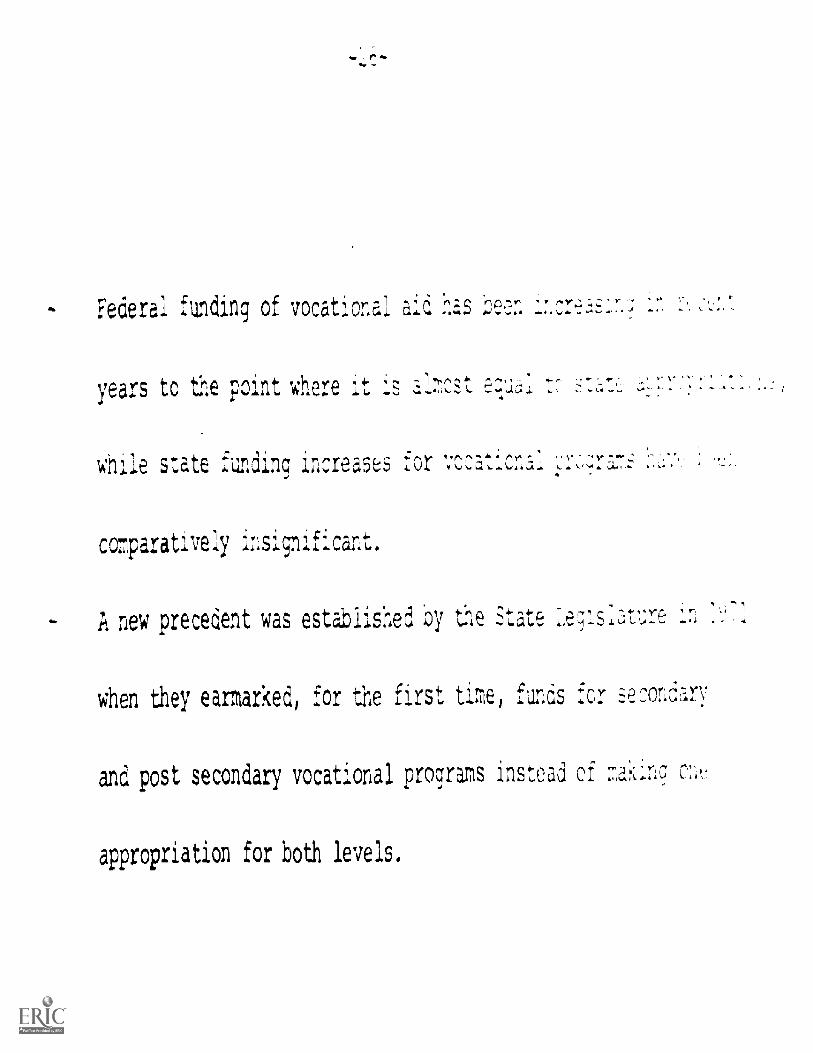
Federal funding of vocaLional aid has :2een 1Lcr43s:::.; In
years to the point where 4SIc
1. ,while state funding Increases a y
comparatively
A new precedent was established 'oy the State L
when they earmarked, for the first time, funds for seconary
and post secondary vocational programs instead of :73kin
appropriation for both levels.
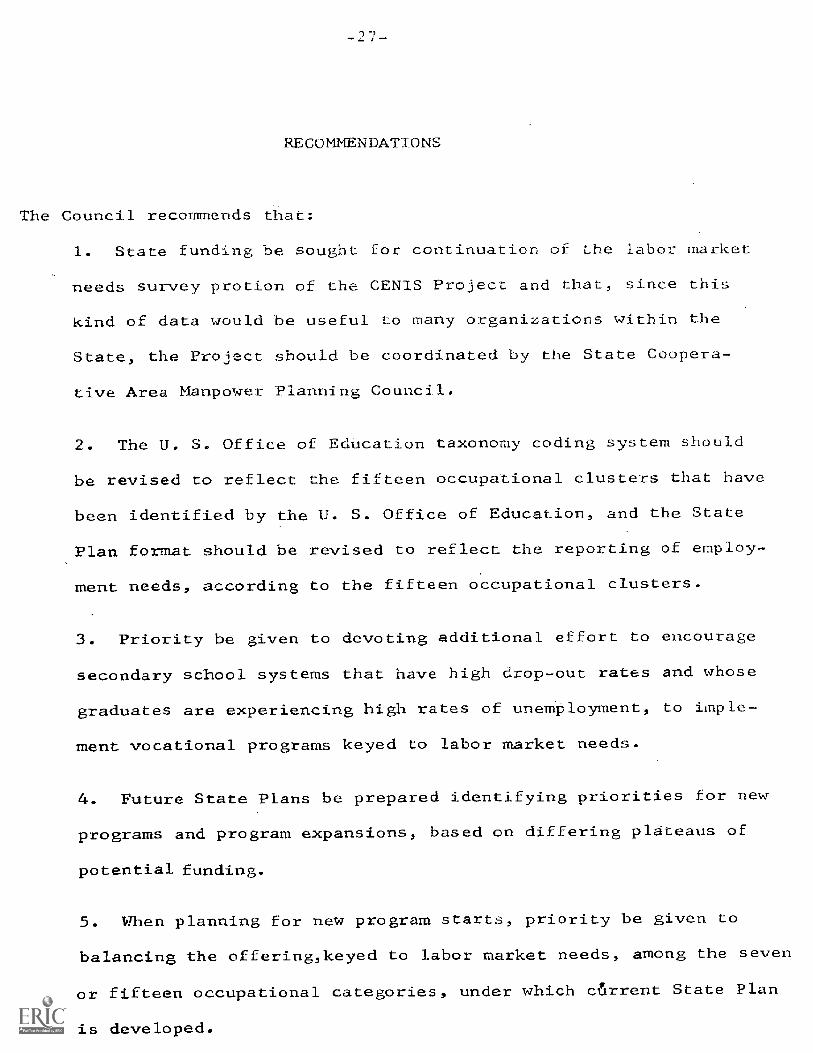
RECOMMENDATIONS
The Council recommends that:
1. State funding be sought for continuation of the labor market
needs survey protion of the CENIS Project and that, since this
kind of data would be useful to many organizations within the
State, the Project should be coordinated by the State Coopera-
tive Area Manpower Planning Council.
2. The U. S. Office of Education taxonomy coding system should
be revised to reflect the fifteen occupational clusters that have
been identified by the U. S. Office of Education, and the State
Plan format should be revised to reflect the reporting of employ-
ment needs, according to the fifteen occupational clusters.
3. Priority be given to devoting additional effort to encourage
secondary school systems that have high drop-out rates and whose
graduates are experiencing high rates of unemployment, to imple-
ment vocational programs keyed to labor market needs.
4. Future State Plans be prepared identifying priorities for new
programs and program expansions, based on differing plateaus of
potential funding.
5. When planning for new program starts, priority be given to
balancing the offering,keyed to labor market needs, among the seven
or fifteen occupational categories, under which current State Plan
is developed.
-28-
CHAPTER III
CAR2ER EDUCATION EFFORT IN ELEMENTARY & JUNIOR HIGH GRADES
ELEMENTARY EFFORT
The Council recognizes that career orientation activities
most likely exist as discrete units in the elementary schools through-
out the State. Inferences made by educators during Council field visits
lead the Council to believe that career orientation is not generally part
of basic skills instruction. For this reason, an accurate assessment (-f
the situation is not possible. Career. orientation at the elementary
level is a necessity for individuals, as evidenced in the study by Thomas
Wolff and Associates, entitled "A Profile of Iowa College and High School
Students". That report states:
"Today's Iowa college student is not at all sure of his
career plans. About half either have an open mind about
changing or say they possibly will change. Only 44% saythey are determined to stick with their present careerchoice through their education period.
This determination obviously grows as the student advan-
ces through class levels. While 40% of the freshmen saythey are determined to stick with their career choice,
48% of the juniors are determined. However, even withthe juniors, 47% say that while they're fairly sure oftheir choice, they may find a career that is better for
them.
Students at area schools are slightly more determined to
stick with their career choices that the private collegeor state university students...
Students who are anticipating further changes in their
careers were asked what fields they intend to go into.About 18% of the total group answered this question." (25-28)
It appears that all students are in need of information about labor
market opportunities and their own talents, in order to make valid de-
cisions about their future work.
Part II of the State Plan projected 2,665 students in grades
kindergarten through eight would be enrolled in new career orientation
programs during giscal year 1972 and that this trend would continue with
a projected enrollment of 4,025 students for fiscal year 1976. This is
an increase of 1,360 students in this program for the five year period.
The Data on Iowa Schools, Part I, for fiscal year 1970-71, shows that
456,366 students are enrolled in grades kindergarten through eight. The
career orientation effort outlined in Part II of the State Plan repre-
sents approximately six tenths of one per cent of the total enrollment
during the next five years.
Current Effort - During fiscal year 1972, three projects
aimed at career orientation were funded from the Iowa allocation for
exemplary projects under Public Law 90-576. In addition, Pottawattamie
County Board of Education is responsible for conducting a career educa-
tion project which is funded by the U. S. Office of Education and Polk
County Board of Education is conducting a career education project under
Title III of the Elementary-Secondary Education Act.
Exemplary Projects - The Iowa State University Project in
pre-career education is a two-phase project. The first phase involved
elementary teachers from nine local school districts teaching in grades
one through eight. The second phase includes secondary school involve-
ment in pre-career reorientation of instruction. Six of the nine
original school systems are involved in this latter effort. The total
plan includes compilation and reproduction of instructional materials
developed by the pilot schools for distribution to any other school in
the State desiring to implement career education. One of the unique
elements of this project places heavy emphasis on the need for the student
to be able to assess his own talents and abilities. Based on his assess-
ment and the knowledge he has gained about jobs in the labor market, the
individual should be able to make a more valid career choice. During
grade eight, the students participating in this project will enroll in
several six to twelve week mini pre-vocational courses. During the ninth
grade, the students will select a one year pre-vocational course. During
grades ten, eleven and twelve, the student will be enrolled in multi-
occupational preparatory vocational courses. If the student is ready in
the twelfth grade, he will be enrolled in specialized occupational train-
ing, utilizing school shops or laboratories, cooperative (on-the-job)
training, or advanced placement in a post-secondary school. (37)
The Monticello Community School District developed a three-phase
project. The initial phase involved the development of a course in career
opportunities for seventh and eighth grade students. The reason for se-
lecting these two grades was to reduce the number of students who were
dropping out of that school in grades seven through nine. The second
phase of the project will attempt to integrate the subject of careers
into all phases of elementary instruction. Phase three will involve ex-
panding opportunities for career experience in grades nine through twelve.

-31-
:All three phases of the project were in some degree of development during
fiscal year 1972. (42)
The Mason City Community School District developed a career
education project which placed major emphasis on re-directing instructor'
thinking and attitudes about instructional content, purpose, for education,
and methodology of instructional techniques. The first thrust in this ef-
fort was aimed at instructing teachers, through field trips and the like,
about various opportunities in the world of work. The teachers must know
about the world of work before they can include viable instructional
units on the topic. The second phase is for the teachers to exchange in-
formation about their varied experiences. Teachers in grades kindergarten
through twelve are included in the project. The teachers then revise their
instructional content to focus on the applied and occupational aspects of
academic instruction. A specific course has been developed for the senior
high school students which focuses on bringing the student to self aware-
ness and causes him to compare his own abilities and talents with those
required in the work environment. (45)
U. S. Office of Education Funded Pro ect - The Pottawattamie
County School System was recipient of a grant to be jointly administered
by that school and Iowa Western Community College to provide career
oriented instruction for several local school systems in the Southwestern
part of Iowa. The project, according to the proposal, will include the
following key elements:

1. Career information2. Testing services3. Vocational counseling and guidance4. Exploratory work experiences5. Intensive job skill training6. Group guidance to develop personal attitudes7. In-service training for teachers and resource persons8. Parent communications
Students from grades kindergarten through twelve were included
in the project. Students involved in the project are utilizing existing
laboratories and shops of the Council Bluffs local school system and Iowa
Western Community College. The shops and labs in the former institution
were not normally used during the summer. (38)
E.S.E.A. Funded Project - The Polk County Board of Education
received a grant from the Iowa Department of Public Instruction under the
provisions of Title III of the Elementary-Secondary Education Act. The
initial effort was directed toward providing low achieving students, in
the elementary grades, with a summer experience in career orientation.
Over the three year period, students in all twelve grades will be included
in the effort. Currently, the Ankeny School System is the only one
participating in the project. If this first effort is successful, the
project will be expanded to other systems in the County. Resource mate -
rials from the Iowa State University Project were to be used in this pro-
ject. Following the summer workshop, the project staff will work to
implement the career education concept throughout the entire Ankeny School
System during the normal school year. (39)
Currently, none of the exemplary career education project pro-
posals identify any effort toward infusing the results of the projects

into the ongoing teacher preparation programs at the three state uni-
versities and the private colleges and universities in the State. Upon
completion of the exemplary projects, the Council recommends that a
directed effort be organized toward infusing career education in all
preparatory teacher education programs in the State.
All but one of the exemplary projects contain provisions for dis-
seminating the results of the projects to other local school systems in
the State. As these projects are implemented in other than the pilot
schools, additional innovative ideas will be generated by individual
teachers. The Council recommends that a state clearinghouse be estab-
lished to catalogue these ideas, techniques, and materials and that each
of the regional educational media centers become involved in stocking and
disseminating this information.
None of the exemplary projects have involved the Iowa Education
Broadcasting Network in their efforts. On August 10, 1972, John A.
Montgomery, Executive Director of the Educational Radio and T. V. Facility
Board, stated that his organization would be interested in cooperating
with sponsors of the exemplary projects. .(46) The Council recommends early
involvement of I.E.B.N. in selected exemplary projects, so that instruc-
tional content on those stations can be focused toward career orienta-
tion.
JUNIOR HIGH SCHOOL EFFORT
All of the exemplary projects reviewed in the elementary school
portion of this chapter provided for the infusion of pre-career education
in the academic subjects taught in the junior and senior high school

curriculum.
As far back as the middle to late 1930's, educational leaders
have identified the need to provide students enrolled in the junior high
school grades (seven through nine) with a broad range of exploratory
experiences to assist them in reaching realistic decisions concerning
his future career and educational choices. Through the provision of a
broad exploratory program, the students should then be able to select
an educational program that would equip them for a career and be prepared
to be a contributing member of society. The instructional programs in
the junior high schools grades in Iowa Schools, apparently, have not been
effectively meeting this goal, as reported in "A Profile of Iowa College
and High School Students". This study reports that:
"Teachers exert a significant influence in inspiring thestudent on a particular course of study, as well as serv-ing as examples for emulation." (25-75)
Those completing the questionnaire for this study were pro-
vided the opportunity to respond to the item, "I like and do well in
studies relating to these fields". The response to this item was not re-
ported and it is, therefore, assumed to be insignificant. It further
appears that broad exploratory opportunities are not provided to students
in the intermediate grades, because of the disproportionately high number
of students that desire to seek employment in the education-social ser-
vices,when compared to total national labor market needs and trends.
The State Plan divides the Secondary Program level into two
areas: grades eight and below, and grades nine through twelve. This type
of organizational division represents 145 school districts or 14.21%
of the total junior high school grade enrollment in the state. Eighty-
five school districts provide a junior high school (grades seven thtoul:,h
nine). During the 1970-71 school year, 149,380 students were enrolled
in grades seven through nine. Of this number, 80,398 students or ap-
proximately 53% were attending a school system that provided an inde-
pendently structured curriculum for those in the junior high school grades.
The remaining 222 school districts have ten different organizational
structures with a total enrollment in grades seven through nine of 47,267
or 32%. It appears to be desirable to reorganize the State Plan format
to reflect the school structure servicing the greatest number of students
in the State.
The Data on Iowa Schools_x Part III (Educational Programs),
shows in Table 14, pages 27 through 37, the number of students enrolled
in practical arts courses in grades nine through twelve for the school
year 1970-71. The table does not indicate the number of pupils enrolled
in these courses on an individual grade basis or whether the courses are
exploratory or specialized. It also does not identify the Subject Areas
and the number of pupils in exploratory programs in grades seven through
eight.
Planning for the broadening of career exploration opportunities
in all junior high school grades is necessary. Without a refined data
collection system, it would be most unlikely that the status of explora-
tory opportunities could be identified. It is also unlikely that plan-
ning for future needs could be improved without a refined data reporting
system.

SUMMARY AND CONCLUSIONS
- Current planning projects that a small portion of lowa':, Lot
tary school population will be involved in career or I. e n i on i)
year 1976.
Five exemplary projects involving more than thirteen elementary-
secondary school districts in the State are reorient ng Leachers and
instructional content to the career education concept.
- None of the exemplary projects outline provisions for infusing, the re-
sults from the projects into ongoing teacher preparation programs.
- There does not appear to be provisions for establishing a state-wide
clearinghouse and dissemination centers for ideas, materials and tech-
niques generated by the exemplary projects.
- Currently, the Iowa Educational Broadcasting Network is not in-
volved in any of the exemplary projects.
- A report by Thomas Wolff and Associates infers that, generally,
junior high school grade students are not being provided a high-
quality, broad-range exploratory type of program.
- Current methods of reporting data on exploratory instructional activ-
ities in the junior high school grades will inhibit future measure-
ment of progress toward improving exploratory instruction in schools.

-37-
RECOMMENDATIONS
Thc. Council recommends that:
1. Early effort be expended toward developing and irople
plan to infuse the findings and results from the exemplary p,c,j,2,1
into ongoing preparatory teacher education programs.
2. A state clearinghouse he established to catalogue and dessemdnJtc
ideas, techniques, and materials resulting from local and state -wide
career education effortsto the regional educational media centers.
3. The Iowa Education Broadcasting Network be involved, at an early
date, in the exemplary projects, so that resource!; of that service
agency can be utilized to enhance career orientation instruction.
4. State Plan format be modified to reflect the elementary-secondary
school structure under which the majority of the students in the
State receive their instruction.
f. The data reporting on the efforts of elementary-secondary schools
in the State be refined, so that the status of exploratory opportuni-
ties for junior high school grade students can be identified.
6. Legislation be passed requiring that career orientation and ex-
ploration 'be implemented in all elementary and junior high school
grades in Iowa.

-38-CHAPTER IV
SECONDARY CAREER EDUCATION EFFORT
State Plan Analysis
Secondary programs are funded under three parts of the State
Plan; Part B - Secondary Programs, Part F - Consumer and Homemaking Ed-
ucation, and Part G - Cooperative Programs. The State Plan projects a
total enrollment of 47,850 secondary students in FY '72. Student enroll-
ment accounted for under Part B funding should reach 17,971. This
estimate includes 2,040 disadvantaged and 914 handicapped students. Five
hundred of the above number of students should also be receiving assist-
ance under the work study, Part H, portion of the Act.
There should be 28,222 students enrolled under Part F, Con-
sumer and Homemaking Education, of the Act. This program generally de-
volops understanding and competencies in home-family management and
relationships, rather than emphasizing preparation for the world of work.
It is anticipated that 1,657 new students would be enrolled
under Part G, Cooperative Programs.
It appears that expansion priorities for secondary career ed-
ucation programs are directed toward:
A. Target]tmulltion of disadvantaged persons;
drop-outs, minority groups, and handicapped.
B. Target Areas of economically depressed and areas with
high unemployment and youth unemployment. The areas
of high drop-out rates and high youth unemployment
correlate closely with areas of greatest population
density.

-
Tables 2 and 3 in Part 111 of R.he State Plan project tbe ex-
pansion and esuablishment of new instructional progr; for se(.:ondary
career education. All of the programs are listed in these table!:-3. He
only those programs relating to Part B of the Act will he discussed
in this part of the report. The programs funded by Part F are discussed
in another corresponding portion of the evaluation. Efforts relating to
Part G of P.L. 90-576 will be reviewed in depth in the FY 1973 Annual
Evaluation.
SECONDARY EXPANDED INSTRUCTIONAL PROGRAMS
(C) (5) (C) (D) (H)
Agriculture
Distributive Ed.
Home Economics 1
Industrial Arts
Office Education.
Trade & Industrial 10
Guidance 5
2
5
SECONDARY NEW INSTRUCTIONAL PROGRAMS
N Agriculture
"Distributive Ed.
Home Economics
Office Education
Trade & Industrial
1 Guidance
(B) (G) (D)
13 10
27(F)
2
2
1 3
3
B = Institutional-type Programs
G = Part G of P.L. 90-576 - Cooperative Programs
C r--- Part C of P.L. 90-576 - Research and Training
D = Part D of P.L. 90-576 - Exemplary Programs &Projects
H = Part H of P.L. 90-576 - Work Study

The expansion of 34 programs are planned for FY '72 under Part
B. This expansion will include two programs in agriculture, two co-op
programs in distributive education, two programs for the disadvantaged
in industrial arts, five coop programs in office education, seventeen
programs in trade and industrial for the disadvantaged and handicapped
and six programs for career counseling and guidance for the disadvantaged
and handicapped. The greatest planned expansion of vocational offerings
at the secondary level is projected to occur in programs for the disad-
vantaged and handicapped and cooperative programs.
A total of nineteen new programs are planned under Part B.
This number included thirteen in agriculture, three trade and industrial
programs for the disadvantaged, and three guidance programs for the handi-
capped.
SECONDARY SCHOOL STATE WIDE EFFORT
School Offerings
This report is limited to reviewing the programs which are
approved by the State Board of Public Instruction for operation under
the guidelines pertaining to P.L. 90-576 and the State Plan for Career
Education and may or may not be reimbursed by the Department of Public
Instruction.
It is recognized that local schools may be operating occupa-
tional preparation programs that meet the standards of the Law and the
State Plan cited above for which recognition by the State Board has not
been sought. Data for these programs are not readily available for con-
sideration and limited Council staff time prohibits the detailed analysis

-41-
of voluminous computer print-outs. Other non recognized "practical art3"
programs, undoubtedly, are operated by local schools which to not provide
salable skills for the students or are not keyed to current labor-market
employment opportunities. These programs are not included in this analy-
sis of effort.
Reimbursed career education programs were offered in 311 of the
452 school districts within the State, during the 1971-72 school year.
Two hundred and twenty-six of these schools offered vocational agricul-
ture programs. Two hundred and fourteen offered home economics programs
and forty-nine offered distributive education programs. Thirty-nine of-
fered office education programs and forty -four offered trade and indus-
trial programs.
Graph 5 shows that, while 469 secondary school attendance
centers offer reimbursable vocational programs, only 278 of these at-
tendance centers provide gainful occupational training. Only 103 school
attendance centers offer more than one reimbursed job-oriented vocational
program for their students.
Section 257.25 of the Iowa Code required that a minimum of five
units of practical arts shall be taught in grades nine through twelve
each year. Practical arts may include such subjects as business educa-
tion, commercial typing, industrial arts, homemaking, distributive educa-
tion, office education, health occupations and agriculture. (9 -1122)
A unit shall consist of one academic year (of) instruction in the sub-
ject. The median number of units offered by the 123 school districts
with an enrollment of 500 or less is 10.5 for these areas. It should
be pointed out that a school could offer 10.5 units by offering four years

G)
H CD
H0
0cr
hi 4
..4> cp
i1
H26
4IZI ri 1
O0
2 1
n oi
coo5
CD
tdI
Min
1
tai
Pz)
O ]
,, i
a.tiiu)
Z i
i0
LI
C0
0 1
w
O<
rt.
0p. O
0 1-
3c.
n
O:4
M,
HZ
>0
>0C
l,Z
< Hr
CI
Otz
io
ItH kC
0 tr
lZ
n0
Z 1-3
o C Og
til0 14
. H
Number of Secondary School Attendance Centers
o1--
0- 0-
.
0 0
"11
111
IIIt
1111
1111
11r
1111
1111
110
1111
1111
1E
1111
1111
1111
Total Attendance Centers
in Iowa
Centers Offering Vocational Programs
Centers Offering One or More Wage-earning Programs
Centers Offering Two or More Wage-earning Programs

-43--
of agriculture, four years of home economics, two years of industrial
arts and one year of typing.
Student Needs
Approximately 193,437 secondary students are enrolled in
grades nine through twelve. Approximately twenty per cent of the
high school graduates will enroll in post secondary vocational and
technical programs. ( 25-32 ) Nearly twenty-eight per cent of Iowa's
high school graduates will complete the requirements for a Bachelor's
Degree. (25 -3 ) Those completing the requirements for the
Bachelor's Degree represent sixty-two per cent of those that started
work toward the degree which means that thirty-eight per cent dropped
out or left school before completion.
Labor Market Trends
The following graph indicates the manpower needs in Iowa
for the period 1970 through 1975.
Iowa Employment SecurityCommission
-20,000
GRAPH 6
Total Manpower Wells for Iowa-10,000 0 10,000 20,000 30,000
& Kindred HZ; ..
Service Workers ..............
Professional, Techn al, & Kindred
Operatibes & Kindred
Crafts en & Kindred
Man gers, Officials & Proprietors
ales Workers
40,000
Laborers, Except' Form & Mine
Farmers & f m Workers
From Projected Manpower Needs for Iowa 70-75
Imo Replacement Needs=1Expansion Needs

Existing Progra.rmnatic Offering
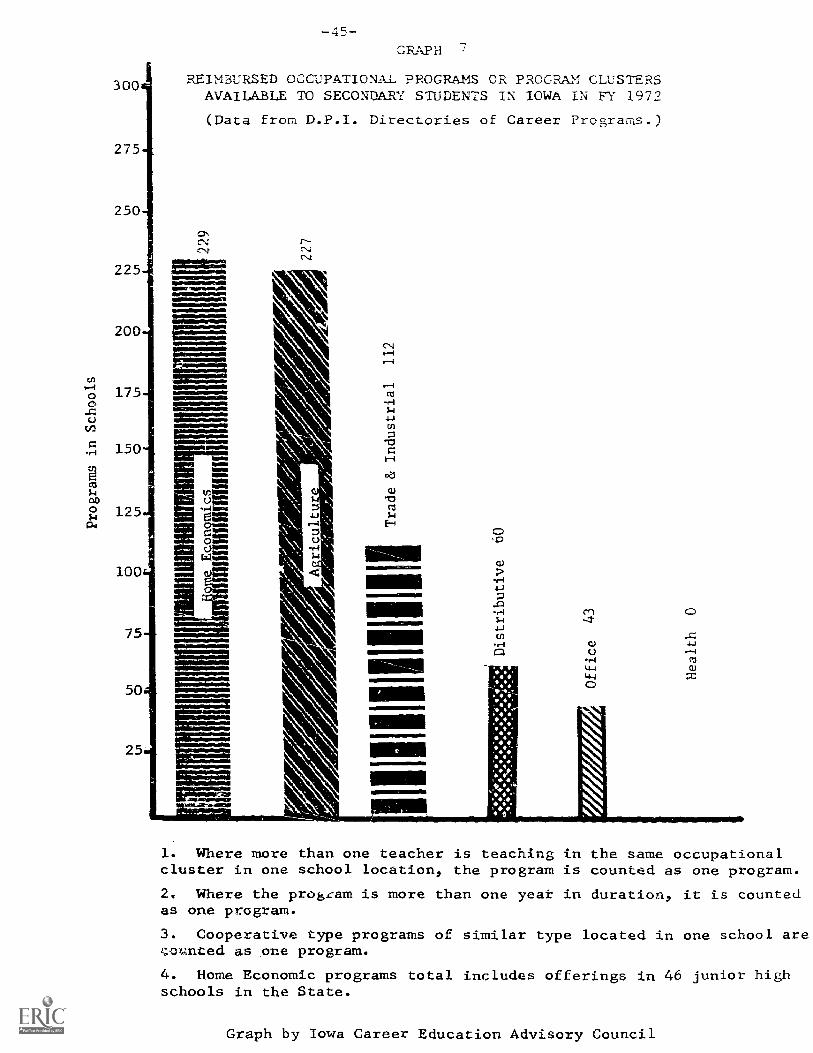
During Fiscal Year 1972, the largest number of program offer-
ings available for secondary students were in the occupational fields
of agriculture and home economics. Council field visits led the
Council to observe that the State Consultants were encouraging home
economics teachers to diversify their offering to provide wage earn-
ing job skills for interested students. Further intensification of
this effort should be encouraged. Agriculture instructors are placing
greater emphasis on providing job skills in off-farm agriculture oc-
cupations. Lesse_ numbers of programs are available for secondary
students in trade, industrial, distributive, and office occupations.
When comparing Graph 7 with Graph 6 , page 43 which outlines projected
employment needs, the reader will observe that, numerically, program
offerings at the secondary level do not parallel the labor market pro-
jections.
New and Ex anded Pro ram Offerin:s in FY 72
During 1972, local secondary schools offered fifty-seven new
programs designed to meet the needs of secondary students with special
needs. Map 3 illustrates the locations of these programs. This map
consolidates the planning data found on two maps in the State Plan
for Career Education. Combined, this map outlines large areas in which
the dropout rates exceed two and forty-five hundredths per cent, while
the encircled county names indicate those counties that were experi-
encing a youth unemployment rate of twelve per cent or more.
It should be recognized that the area designation in the FY '72
State Plan of dropout rates and unemployment are coarse designations
CO
1-1
300
275
250
225
200
-45-CRAPH
REIM3URSED OCCUPATIONAL PROGRAMS OR PROGRAM CLUSTERSAVAILABLE TO SECONDARY STUDENTS IN IOWA IN FY 1972
(Data from D.P.I. Directories of Career Programs.)
° 125 5OM
oMM;alum
100
,C)
MONMICSIOSOMMIOI
4-)r--I
CO
(4-4 OJ4-10
1. Where more than one teacher is teaching in the same occupationalcluster in one school location, the program is counted as one program.
2. Where the program is more than one yeat in duration, it is countedas one program.
3. Cooperative type programs of similar type located in one school are4.13/Anted as one program.
4. Home Economic programs total includes offerings in 46 junior highschools in the State.
Graph by Iowa Career Education Advisory Council

OS
CE
OLA
0'11
1E14
DATA FROM DPI LIST OF SPECIAL NEEDS PROJECTS AND NEW OFFERINGS FOR F1-172
AND 1972 STATE PLAN FOR CAREER EDUCATION
Map by Iowa Career Education Advisory
Council
DIC
KIN
SO
N
CLA
Y
BU
EN
A V
IST
A
EM
ME
T
r-- P A
LO A
LTO
KO
SS
UT
HW
INN
EB
AG
O T
WO
RT
H
11 A
HC
OC
R'
CE
RR
O 0
E0.
00
X
FO
CA
HO
NT
AS
CA
LHO
UN
HU
MB
OLT
WE
BS
TE
R
XX
XX
GR
EE
NE
WR
IGH
T
XX
X
MIT
CH
ELL
NO
WA
RP
FR
AN
KLI
NS
UT
LER
00
tGR
UN
DY
[HA
MIL
TO
Nt H
AR
DIN
)C.
10
MA
RS
HA
LL
SH
ELB
Y
X JP
OT
TA
WA
TT
A M
IE
# Program
XXXX
Expansion
XSpecial
Needs
Programs
0Regular
Programs
UD
UB
ON
UT
HR
IE1
DA
LLA
S
X
JAS
PE
R X
CH
ICK
AS
AW
W IN
NE
S 1
4151
I
.....
ALI
A M
k K
EE
I
' TA
M A
BE
NT
ON
X
CA
SS
AD
AIR
MA
RIO
N
gliP
OW
ES
HIE
K
Tr"
-M
AH
AS
K A
MIL
LSO
NT
GO
ME
M!
XA
DA
MS
TA
YLO
R
UN
ION
CLA
KK
Ej L
UC
AS
IMO
NR
OE
##
RIN
GG
OLD
DE
CA
TU
RW
A Y
NE
KE
OK
UK
WA
PE
LL°
DE
LAW
AR
E
I--
-111
1+1
JON
ES
'X
CU
NT
OH
CE
DA
R
410H
,It O
NX
0
WA
SH
,NO
YO
N
X
1 JE
FF
ER
SO
N
0
YJCXX
XX#
DA
VIS
VA
N B
UR
EN
1=1Caunty names encircled indicate
counties that have youth unemployment
in ccess of 12%
mi.Eucircied multi-county areas
repiont areas of drop-out rates iD
e.P,..,.=7:ss of 2.45%
MAP 3
SECONDARY PROGRAMS REIMBURSED
FOR THE FIRST TIME IN FYI72

-47-
and most likely do not apply to all school districts within the large
multi-county areas or in the individual counties. At the time of this
writing, the 1973 Amendments to the State Plan for Career Education
have been completed. This update reflects high youth unemployment by
individual county and a high dropout rate by school district. This
reduction in tolerance should provide the opportunity for improvement
of the "management by objective" program that has been implemented by
the Department of Public Instruction, since it will be possible to
determine whether school districts that are in the greatest need of
programs for this students are implementing them.
With respect to program implementation during FY '72, the reader
will observe that nine counties experiencing high youth unemployment did
not implement any new special needs programs.
Special Needs
It is possible that many youth have handicaps or learning dis-
abilities in addition of lacking job skills that prevent them from
finding employment in the labor market. The reader should also note
that eight local school systems in counties that reportedly did not
have high dropout rates or high youth unemployment did start special
needs programs. The majority of these counties depend mostly en agri-
culture for their economic base. Considering the remaining program
starts during FY '72 to serve secondary handicapped or disadvantaged
students, one finds that twenty-seven programs were started in the
larger metropolitan counties of the state while seventeen programs were
located in the predominately rural counties. General conclusions
cannot be drawn about theaceasonableness- of special; needs.

-48--
program locations due to the coarse data contained in the State Plan.
Because of refinements found in the FY '73 Amendments to the State Plan,
it will be possible to more accurately measure the future effectiveness
of the program development effort.
Part B (Regular) Vocational Programs
During FY '72, eight new regular offerings were established in
eight different secondary schools in the state. Five of the offerings
were in the field of home economics while one new offering each was es-
tablished in distributive education, office education and cooperative
trade and industrial education.
The expansion of p_.XisLin-6. reimbursed vocational education of-
ferings was far greater than the establishment of new offerings. A
total of twenty additional teachers were employed with the greatest
number added occurring in the field of home economics (16), followed
by the addition of four vocational agriculture teachers.
With respect to the location for new and expanded vocational
offerings, the reader will find by reviewing map 3 , on page 46, that
ten new offerings or expansions were located in counties that were not
experiencing high dropout rates or high youth unemployment while
eighteen new offerings and expansions were located in areas of the state
experiencing high dropout rates and counties experiencing high youth
unemployment.
It is apparent that the greatest emphasis this past year, in
the secondary schools, has been placed on developing programs to
satisfy the job preparation needs of the handicapped and disadvantaged

student. It is further important to note that emphasis on development
of neu and expansion of existing programs continues to be placed on
home economics programs followed by offerings in agriculture.
State-Wide Enrollment Trends
The enrollment in various reimbursed vocational programs of-
fered at the secondary level through FY '71 should be reviewed as a
measure of annual progress. By referring to Graph 8 , page 50, the
reader will ;note that total secondary enrollment growth increased
slightly more than 2,500 students in 1969, when compared to 1968.
E3rowth Ii 1-Y '70 nearly doupied the FY '69 growth. This was due, most
likely, to a change in the system for student accounting. During and
prior to FY '69, if a student enrolled in two consecutive courses in
a field of vocational instruction during one year, the student was
counted as one enrollment. Beginning with the annual report for FY '70,
if one student enrolls in a two-course series in one vocational field
during one year and then terminates upon completion of the first
course and happens to be replaced in the second course by another
student, the enrollment for the two-course series is reported as two
students. For this reason, Graph 8 , on page 50, does not accurately
report the enrollment growth in programs from FY '68 through FY '71.
Generally, agriculture, trade and industrial,, distributive, office and
technical education offerings do not function on a course-semester
basis and, therefore, do not reflect as great a deviation in 1970 as
does home economics. The reader should review the graph, as it will
give him a visual picture of relative enrollments.

35,878
p21
21
2)
24
1S.
2f
23
24
JO gamis Er.
is
17
lb
IS
Pe
41
14
it
a-
9
38,417 43,445k 50,211
-50-
TC"IAL
ENROLLMEN:
Review Narrative Comments for explanation ofenrollment growth
613 6/ toGRAPH 8
STUDENT ENROLLMENTS IN SECONDARY VOCATIONAL-TECHNICAL PROGRAMS
Source - Annual Reports for Career Education - FY 68, 69, 70, 71
Graph by Iowa Career Education Advisory Council
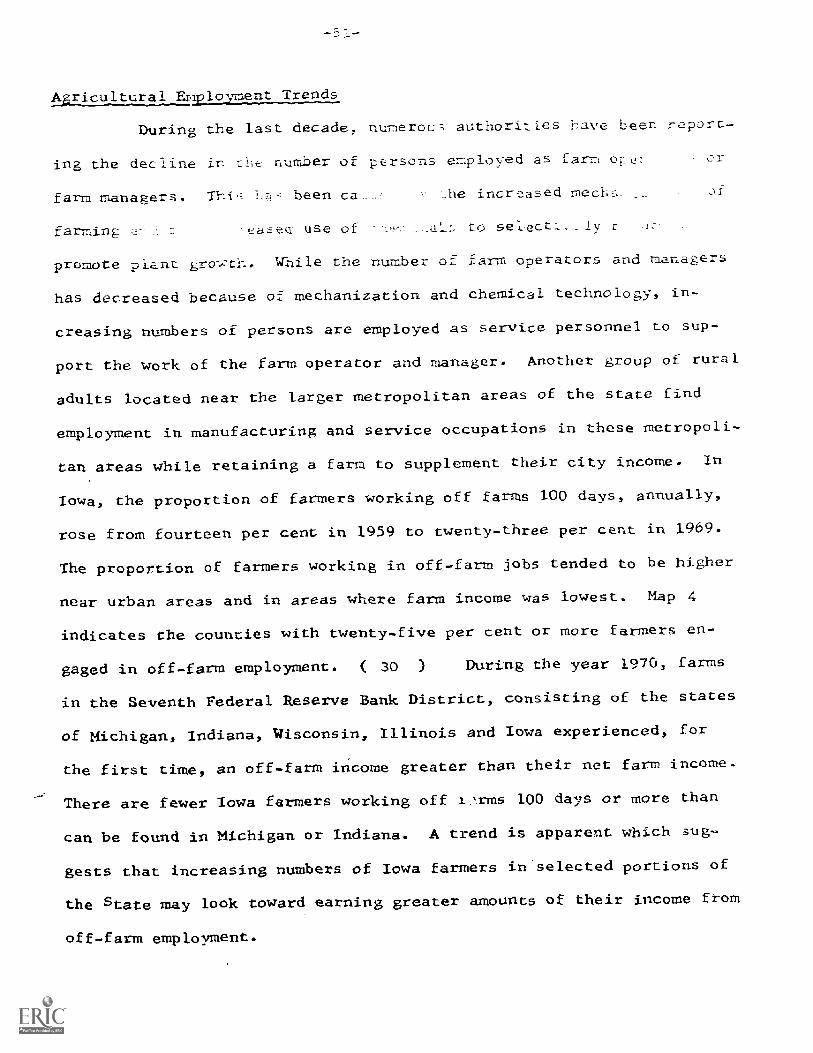
Agricultural_Er.plcti uer-r
Les -rave 1-During the last decade, numeroc-; authorit ,een report-
ing the decline in the number of persons employed as farm cD,, or
farm managers. been ca._ :he incr-used neofiE
farming'4
use of to seLect-___Iy r
promote plant growth . While the number of farm operators and managers
has decreased because of mechanization and chemical technology, in-
creasing numbers of persons are employed as service personnel to sup-
port the work of the farm operator and manager. Another group of rural
adults located near the larger metropolitan areas of the state find
employment in manufacturing and service occupations in these metropoli-
tan areas while retaining a farm to supplement their city income. In
Iowa, the proportion of farmers working off farms 100 days, annually,
rose from fourteen per cent in 1959 to twenty-three per cent in 1969.
The proportion of farmers working in off-farm jobs tended to be higher
near urban areas and in areas where farm income was lowest. Map 4
indicates the counties with twenty-five per cent or more farmers en-
gaged in off-farm employment. ( 30 ) During the year 1970, farms
in the Seventh Federal Reserve Bank District, consisting of the states
of Michigan, Indiana, Wisconsin, Illinois and Iowa experienced, for
the first time, an off-farm income greater than their net farm income.
There are fewer Iowa farmers working off i.'.rms 100 days or more than
can be found in Michigan or Indiana. A trend is apparent which sug-
gests that increasing numbers of Iowa farmers in selected portions of
the State may look toward earning greater amounts of their income from
off-farm employment.

OS
CC
OLA
DIC
I-O
NS
ON
iMM
ET
WIN
NE
BA
GO
WO
RT
HH
OW
AR
DW
INN
E s
HiE
K
19
PA
LO A
LTO
17
AU
AM
A?(
HA
NC
OC
K/C
AIA
SA
W
PO
CA
HO
NT
AS
H ti
M S
ot o
r W
RW
NT--
17A
IN
16
16
18
14
16
16
rALA
IDLI
NA
44
fl T
ON
21
4RO
IN
18 15
20
AY
ET
rEcc
.ovr
t2,,,
Cour)
Li e
s1.11 which
or m
orc
of the litrou.,t,,
Work 10(1
days
or
tuo
rea
nnua
1 1
y o
ft
r,A
NB
Aw
l; st
ictiA
i;At4
I..
)(/1
4 i/Q
I/F
AM
A
CR
Aw
r0 R
E)
CA
RR
OLL
OR
EZ
NE
NA
AR
ISO
NS
Hr
Lay'
AU
corN
afr
Akk
As
AD
AIR
101,
50N
18
'OW
E-S
NIC
K
20
(Nt O
N 20
/
21_
JAC
K I
ON
.
INT
ON
t,r-Nwoov?'"u,
23
2')
(I
-
MA
P/!A
)q.1
15IK
tOK
IJIA
2024
2
AD
AM
S
$) ,
..
AP
_C1i
f1.h
crrt
i,soN
I1 N
FR
EA
foH
TP
AG
ErA
YLO
R
23
t!A kisr)proy__
-----3.5
..im
mer
wr
MAP 4
PERCENTAGE OF FAME RS WORKING OFF THE FARM
100 DAYS OR MORE ANNHnLY
S01117Ce.:
"Busioess Cooditi,3n5"
deraL Reservc flank of Chiciid,
A Microscopic Example
Because of the significant trend toward larger numbers of farmers
working in off-farm employment, it seems appropriate to take a microscop-
ic view of efforts expended by schools to provide their graduates with
skills and technical knowl.dge to be successful in farming or agricul-
ture-related employment and employment in manufacturing and service oc-
cupations generally found in neighboring urban areas. In order to
accomplish this, eight counties around Polk County were selected for
analysis since off-farm employment of 100 days or more per year ranged
between twenty-seven per cent and forty -four per cent of all farmers
in these counties. The reader should refer to Map 4 to identify other
counties experiencing the same phenomenon. Marion, Madison, Marshall,
Warren, Boone, Story, Dallas, and Jasper Counties contain forty-seven
school districts which offer the students a total of seventeen pro-
grams in distributive, office and trade and industrial education. Seven
of the trade and industrial programs are cooperative programs and do
not provide the institutional type of occupational preparation. Nine-
teen school districts provide vocational agriculture programs. Graph 9
illustrates the limited range of vocational opportunities available to
one-half the students enrolled in schools surrounding Polk County. It
appears that, individually, these school districts' enrollments are too
small to provide comprehensive secondary school offerings of vocational
programs.
The reader should observe that twenty-five per cent or more of
the farmers in thirty-seven counties (more than one-third of the state)
find employment of more than 100 days per year off the farm. The
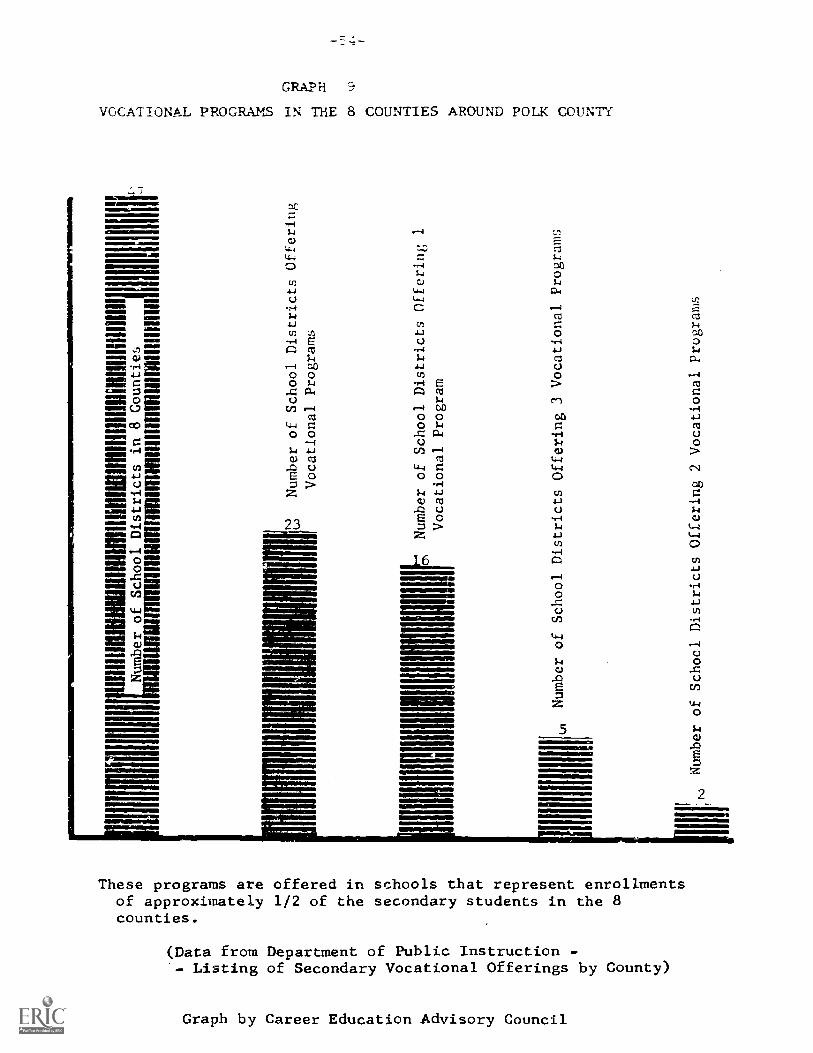
il=
1
t-' r
t.H
. 0rt
1-1)
I4ri
m 5
o
Po(t)
(/)
MM
11
On m
o 0 m
o m o
O S1)
rrI."
H.
O n
O oH 0 C
l,
O r
r1-
n 11
1-n0
m n
m m
HH
.O
0M tn 0 0 O rr `-
4
n 0
CD
O M
CM
Mrt I-
6'0
pi(C
l M 0
Cl)
O Q
t,X
fl
H. 0
0 0
0 m
rt. M 0
1.-A
0 r-h
N.)
t- r
1
O m
?lin)
rr m 0 m
m m
O o
O o Cl)
ri k4 0
0. M
M O M M 0
rr
rt
m o O rr
15"
1111
111111111111111111111mit:leli
1111111111111111111111MIIIIMiliffillIM1111191111111111111111[;
School Districts in 8 Counties
al11
1111
1111
1111
1111
1111
1111
1111
1111
1111
1111
1111
1111
1111
1111
1111
1111
111
1111
1111
1011
1111
1111
1111
1111
1
1111
1111
1111
1111
Number of School Districts Offering
Vocational Programs
Number of School Districts Offering I
Vocational Program
Number of School Districts Offering 3 Vocational Programs
1111
N)
Number of School Districts Offering 2 Vocational Programs
z ro
ro O O 9

majority of the 1h4 school systems in these thirty-seven counties do of-
fer reimbursed vocational programs. In most cases, the offering is
limited to one or two types of programs. School districts in seventeen
of the counties experiencing high rural work migration did implement
new special needs programs. The vast majority of the expansion or new
program starts occurred in home economics.
By referring to Map 3 , found on page 46, the reader will note
that many of the counties which experience significant faLuer out-migra-
tion for work are also counties that experience youth unemployment in
excess of twelve per cent and are counties that have youth dropout rates
in excess of two and forty-five hundredths per cent.
It appears that the youth being raised in counties historical-
ly experiencing high out-migration for work will need expanded voca-
tional opportunities. An expanded offering should better equip them
for employment in urban work centers.
Educational Opportunities - Polk County
Polk County contains nine school districts with fourteen
secondary attendance centers enrolling 13,240 students in grades ten
through twelve. Three school districts, Johnston, North Polk, and
Bondurant-Farrar do not provide the students with a reimbursed voca-
tional program. The Des Moines and West Des Moines school districts
have a total of 10,460 students in grades ten through twelve enrolled
in seven high school buildings. The Des Moines School District has six
high schools one of which m,'Ices available a broad range of vocational
and technical programs to all secondary students in the City of Des
Moines. The other five high school in Des Moines offer distributive
education and consumer-home economics programs. Des Moines East and

-56-
Lincoln also offer a trade and industrial cooperative program. Des
Moines Technical High School offers twenty trade and industrial pro-
grams, one clerical and two wage-earning home economics programs.
The West Des Moines School District offers distributive education and
office education in its high school.
Urbandale, Ankeny, Southeast Polk and Saydel have an enroll-
ment ranging from 500-700 students in grades ten through twelve. All
four of these school districts offer distributive education programs.
Office education is offered in every school district except Ankeny.
Southeast Polk and Ankeny offer the only reimbursed vocational agri-
culture programs in the county. Southeast Polk and Saydel offer a
trade and industrial program which, like their other programs, is
cooperative.
The larger school districts tend to provide a broader range
of opportunities for occupational exploration than the smaller dis-
tricts, although many occupational training areas are not presently
available to the student.
Graph 14 page 57, indicates the number of high school at-
tendance centers in Polk County offering vocational programs. In
terms of student population in grades ten through twelve, only four
per cent of the students in Polk County do not have some type of voca-
tional offering available to them, in comparison to approximately fifty
per cent of the students in the surrounding eight county area. (See
Graph 9, page 54) The number of programs offered by the high schools
in the eight counties around Polk County and the number of
programs offered by the high school in Polk County are about the same

U C.)
CO
4
0 8 3
uj
1
law
910
11
12
13
14
15
16
17
18
19
20
Vocational Programs Offered
GRAPH 10
SECONDARY ATTENDANCE CENTERS OFFERING REIMBURSED VOCATIONAL PROGRAMS IN POLK COUNTY
Data from Department of Public Instruction - Listing of Secondary Programs
Graph by Career Education Advisory Council

-58-
with the exception of the Des Moines Technical High School which is
the Des Moines metropolitan vocational center. It is evident that,
without such a facility, the occupational opportunities for the stu-
dents of Polk County would be greatly limit. U. It is also evident
that other counties could expand their vocational offering by estab-
lishing a central vocational facility. The West Des Moines, Ankeny,
and Urbandale School Districts which have high schools with enroll-
ments from 500 to 1400 students offer only two vocational programs at
each high school. This suggests that there are factors otho- than
student population that determines the number of vocational offerings.
Secondary Vocational Education Offerings of Area Community Collegesand Area Vocational-Technical Schools
Several area schools have begun to assume the responsibility
for providing vocational job preparation programs and career explora-
tion programs for secondary students enrolled within the boundries of
their merged area. The legal basis for this is located in Section
280A of the Iowa Code which states that the area schools shall offer:
"...to the greatest extent possible, educational oppor-tunities and services in each of the following, whenapplicable but not necessarily limited to:
...5. Programs for all students who may best servethemselves by enrolling in vocational and technicaltraining while also enrolled in a local high school,public or private.
...8. Vocational education for persons who have aca-demic, socio-economic, or other handicaps which pre-vent succeeding in regular vocational education pro-grams.
...9. Training, retraining, and all necessary prepa-ration for productive employment of all citizens.
.10. Vocational and technical training for personswho are not enrolled in a high school and who have notcompleted high school. (941202)1'

-59-
Efforts of Area School,:
The Department of Pubii Instruction provided the Council
with information on the efforts expended by area schools in providing
exploration and job preparation programs for secondary students. (56)
Hawkeye Institute of Technology in Waterloo began offering vocational
programs in the field of building trades in the 1970-71 school year.
During that year, the maximum number of secondary students enrolled
was thirty-two. During the current year, FY '72, Hawkeye is enrolling
fifty secondary students in building trades and auto body repair pro-
grams.
Kirkwood Community College in Cedar Rapids utilized their
new facilities during the summer of 1971, to provide an exploratory
experience for local secondary students. These students attended
their own school during the regular school year.
Iowa Central Community College has its administration
center located in Fort Dodge. That school offered engine mechanics
instruction for secondary age student in FY '72. Fifty students were
enrolled during the year under review. The students received their
instruction in Storm Lake. This school also offered an office educa-
tion secretarial and clerical program on its Storm Lake campus that
served forty-four students during FY '72.
The Northwest Iowa Area Vocational-Technical School in
Sheldon has offered programs for secondary school students since 1964.
The secondary enrollment in 1971 averaged eighty-five students en-
rolled in three programs. Currently, the secondary student enrollment
averaged seventy-eight students enrolled in three programs.
-40C-
Southeastern Iowa Community College at Burlington has been
offering a.:areea.- exploration program in auto mechanics on Saturdavs
during FY '72, with approximately 20 students enrolled.
During the 1971-72 school year, the Des Moines Area Com-
munity College conducted a survey of forty local school districts in
an effort to ascertain the number of high school seniors that would
be interested in attending that school all day, one,half day, or dur-
ing the summer during the student's senior year to learn employment
skills. The greatest expression of student interest occurred with
students enrolled in the West Des Moines, Ames, Knoxville,_ Newton,
and South Warren School Districts. Several of the most popular in-
structional programs desired by the students included auto mechanics,
child care, alcohol and drug rehabilitation counseling, diesel
mechanics, computer programming, law enforcement and practical nurs-
ing. (41) Recent word from officials from the Des Moines Area
Community College indicates that action on implementation of programs
for secondary students is being deferred until some obstacles can be
worked out.
Egc.-:.a2afLACcIMeralarProrarns)The Pottawattamie County School Board was recipient of a
direct federal grant which funded an exemplary project under P. L.
90-576. The project was funded first during the 1970-71 school year.
According to a report received from Dr. Earl Winters, Project Director,
little emphasis was placed on providing exploratory instruction for
junior high school age students. Elements of the project made
-61-
provisions for job placement. While the project is designed to func-
tion throughout the school year, it has a unique component which is
the development of an extensive summer school program which provides
instructional opportunities for students from schools which do not
have a comprehensive vocational offering. These instructional of-
ferings are made available in the Council Bluffs High Schools' shops
and laboratories which are normally vacant during the summer. 11,,ing
the summer of 1971, 132 students participated in the summer workshop.
(38)
Related Academic Instruction (Exem lar )
Psychologists suggest that there is a positive relationship
between an individual's success and his interest in the subject. Most
students enroll in the vocational programs because they have a high
level of interest in learning skills and technical knowledge neces-
sary for competence in a particular occupational field. These students
are in need of certain related academic instruction to be successful
in employment. Cooperation between the academic and vocational educa-
tion instructors is needed to orient specific course content to meet
individual needs and interests.
The Council surveyed 195 secondary vocational instructors
teaching in fifty-six schools in the state. The survey sample in-
cluded all schools in fifteen counties in the state. Eighty-five
secondary school corporations function in these fifteen counties,
however, only fifty-six offer reimbursed vocational programs. Ten
counties were selected because schools in those counties were ex-
periencing high drop-out rates and high youth unemployment, while
schools in five counties were reporting low percentage of drop-outs
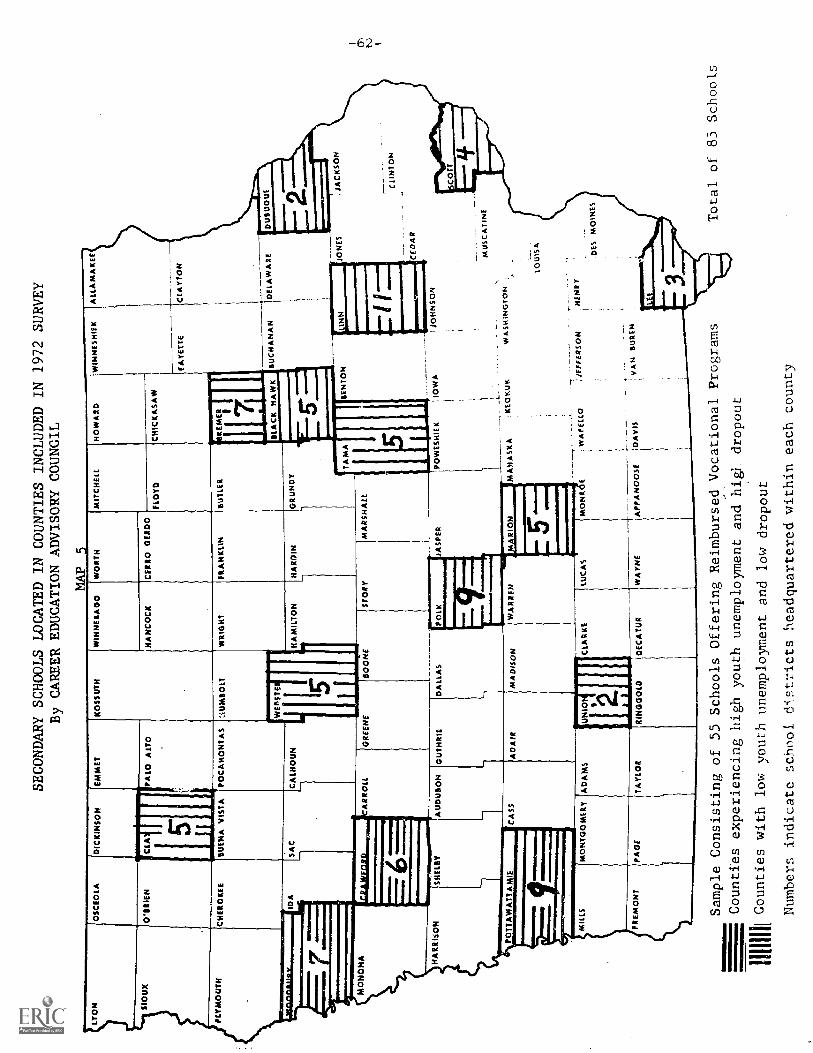
ET
ON S
IOU
X
PLY
MO
UT
H
1111
,,,11
111
1V
OS
CE
OLA
OIR
MN
CH
ER
OK
EE
DIC
KIN
SO
N
if
SECONDARY SCHOOLS LOCATED IN COUNTIES INCLUDED IN 1972 SURVEY
By CAREER EDUCATION ADVISORY COUNCIL
MAP
5E
MM
ET
jALO
ALT
O
KO
SS
UT
HW
INN
E S
AG
OW
OR
TH
HA
NC
OC
KC
ER
RO
GE
RD
O
MIT
CH
ELL
HO
WA
RD
FLO
YD
CH
ICK
AS
AW
WIN
NE
SH
IRK
ALL
A M
A K
U
FA
YE
TT
EC
LAY
TO
N
BU
EN
A V
IST
AP
OC
A H
ON
E A
S
IDA
SA
CIC
ALH
OU
N
aum
eou
VI E
RS
TE
MO
NO
NA
r R
AI W
RIR
D
HA
RR
ISO
N
AR
Rot
t.
SH
ELB
Y
GR
EE
NE
WR
IGH
T
SO
ON
E
FR
AN
KLI
N
HA
MIL
TO
NIH
AR
DIN
SU
TLE
RR
EM
ER
[GR
UN
DY
ST
OR
YM
AR
SH
ALL
BLA
CK
HA
WK
BU
CH
AN
AN
(DE
LAW
AR
E
TA
NA
AU
DU
BO
NG
UT
HR
IED
ALL
AS
PO
LK
PO
TT
AW
AT
T A
MIS
CA
SS
AD
AIR
MIL
LSM
ON
TG
OM
ER
YA
DA
MS
FR
EM
ON
TP
AG
ET
AY
LOR
MA
DIS
ON
UN
ION 11
RIN
GG
OLD
AS
PE
R
IrdI
RW
AR
RE
NM
AR
ION
1PO
WE
SH
IEK
5.
BE
NT
ON
IOW
A
,11
MA
HA
SX
AK
EO
KU
K
CLA
RK
E
[DE
CA
TU
R
LUC
AS
WA
YN
E
MO
NR
OE
WA
FE
LL°
AP
PA
NO
OS
EID
AV
IS
JON
ES
: JA
CK
SO
N
JOH
NS
ON
WA
SH
ING
TO
N
.'JE
FF
ER
SO
NH
EN
RY
VA
N B
UR
EN
MU
SC
AT
INE
LOU
ISA
,
CLI
NT
ON
DE
S M
OIN
ES
Sample Consisting of 55 Schools Offering Reimbursed Vocational Programs
=LT, Counties experiencing high youth unemployment and
higl dropout
MECounties with low youth unemployment and low
dropout
Numbers indicate school 87(.stricts headquartered within each county
Total of 83 Schools

-63-
and youth unemployment. Counties from various sections of the state
were included in the sample to reduce the possibility of regional dif-
ferences.
Eighty- two per cent of the secondary vocational education
instructors responding to the Council survey expressed the view that
academic instructors were willing to modify the focus of instructional
content to meet individual students needs and interests. Nearly forty
per cent indicated they met periodically with the academic instructors
for the purpose of coordinating academic instruction with the job
training they are providing. Fifty per cent of this group indicated
they met at least once a month. Over one-half of the instructors
reported their school tested individual students for competency in
basic skills and then scheduled instructional programs keyed to the
students' needs.
The secondary vocational education instructors were asked to re-
spond to questions related to instruction in the areas of social
science and English. Because of the way the questions on social sci-
ence were constructed, the results are non-conclusive and cannot be
reported with any degree of accuracy.
Communications, either written or oral, are a necessity for
the success of an individual in his occupational choice. If he fails
to communicate his ideas or fails to understand the ideas of others,
he cannot develop the proficiency needed to accomplish his job well.
The majority of the instructors expressed the opinion that the related
English instruction develops skills in conference leading techniques,
parliamentary procedure, writing technical reports, effective public
4-
speaking and, also, developing a technical vocabulary useful for the
consumer. Only about one-third of the instructors were of the opinion
that related English instruction provides units in interpretating
mechanical drawings, sketches, schematic diagrams, pictorial drawings,
or that skills were developed in analyzing common terminology in legal
contracts. The secondary career education instructors were further
questioned concerning instruction in job application and interviewing
techniques. Over seventy per cent reported the English c- culum was
providing instruction in these last areas.
In the past year, the Council has made several visits to
area and local schools. During these visits, the Council members had
a chance to talk with secondary students. The students discussed their
future plans and concerns about the high school they attended. Their
feeling in regards to related instruction differs from those expressed
by the instructors in the questionnaire. A written account of these
meetings may be found in the Appendix. Following are selected student
comments:
- Many teachers are still limiting their career suggestionstoward the field of teaching. The students recognizedthat most teachers have a limited background about theworld of work, because of their heavy emphasis on aca-demic subjects in college.
- Many students see little value in the study of litera-ture as a subject.
- Our academic courses are not related to what we thinkthe real world is all about.
- Students who say they will definitely go to college donot know what they desire to study. They state thatthey need books on jobs!.

Some students are instructed in personal finance andbusiness economics in their social studies classesand consumer-home economics classes.
The persuasive ability of the teacher is sometimesthe determining factor as to whether or not thecourse is kept in the curriculum.
Some teachers grade leniently because the subject isrequired and the teachers know the student doesn'tlike the subject.
- Students finally admit that some of the basic subjectssuch as math, English, and government are essential -but they get 'turned off' by the poor quality of in-struction and lack of differing instructional tech-niques.
- Some social studies instructors encourage a study ofgovernment through attendance at public board meetingsand political party precinct meetings by giving creditfor extra effort.
The Council observed that more cross-curricular planning is needed to
enable the student to receive maximum benefit from related instruction.
Planning sessions should be held at regular, frequent intervals to
insure a maximum cooperative effort.
Program Planning for Secondary Schools
The secondary superintendents or vocational education directors
of the fifty-six districts, with reimbursed career education included
in the Council sample, were sent questionnaires in an effort to determine
administrative attitudes. Forty-five of the secondary administrators
returned the questionnaires for a response of over eighty per cent.
In a short series of true or false questions, the Council attempted
to ascertain the exposure of the administrators to the emerging career

-66-
education concept. It is apparent that there is some confusion among
the respondents with one-third expressing the view that career education
is a new name for vocational education. It should be stressed, for
clarification, that vocational education is only a part of the total
career education concept.
Seventy-five percent of the secondary administrators re-
ported that their Board of Education had been exposed to essential con-
cepts of career education.
When asked to express their reaction that clusters of oc-
cupational programs ought to be available for students in fifteen
major occupational areas in order to meet student employment training,
nearly thirty-eight percent of the administrators responded that
their school was too small and could not provide that breadth of in-
struction. If needed expansion of vocationally oriented instruction is
to take place throughout the State, the administrators of the smaller
school districts must cooperate in implementing alternate methods to
provide this training. All the administrators that responded agreed
that career education and vocational education was of value to the stu-
dents.
The majority of the school administrators responding indicated
that exploratory areas were available in the following areas: office
occupations, ag-business, natural resources, fine arts and humanities,
and consumer-homemaking occupations. A moderate amount of administra-
tors reported offering exploratory areas in marketing and distribution,
construction, health occupations, and manufacturing.
Very few indicated exploratory instruction was being offered

COUNCIL QUESTIONNAIRE rrEl 33
In the chart celow, please indicate: (1) The number uf prec:ramsyou are offering in each of the following areas; (2) The numberof new programs you are planning in each of the areas
in the next three years, and (3) Th number of programs you planto discontinue in the next three
DISTRIBUTIVE ED.1. Present Programs2. New Programs3. Discontinue
OFFICE EDUCATION1. Present Programs2. New Programs3. Discontinue
AGRICULTURE1. Present Programs2. New Programs3. Discontinue
HOME ECONOMICS1. Present Programs2. New Programs3. Discontinue
TRADE AND INDUSTRY1. Present Program2. New Programs3. Discontinue
HEALTH1. Present Program2. New Programs3. Discontinue
SERVICE1. Present Program2. New Programs3. Discontinue
Orien-tationto theWorldof Work
WorkExplo-ration
Entry Semi-Level Skilled Skilled
Tech-nical
Profes-sional
30 31
13
22 17
3
8
Ell
3
it28 ,
r1
26 11 3
28 21 8 4
10
104 1
49 37 21 10
3 29 7 2
IIIIIIIIIIIIIIIIII
2
33
16 v49
III 111
28 2 12
2
8 9 7
12
1
OTHERS (Specify Below) TABLE 1
PROGRAM EXPANSION PLANS PROJECTED BY LOCAL SCHOOL ADMINISTRATORS
0 Number of Schools Responding
45 of 55 Administrators Returning Questionnaire

in the following areas: personal service, public service, transporta-
tion, communications-media, environment and hospitality and recreation.
When questioned about what exploratory programs should be added to the
career education offering, twenty percent of the administrators failed
to identify any additional course offerings, while the majority thought
that programs should be added in the fifteen clustered areas.
Program Justification
The school cidministrators were also questioned about the source
data they used for justifying and establishing new pro,jrams in vocational-
technical education. Most of the administrators ranked student statements
of interest as being the most important in establishing new programs.
Labor market surveys of the local community was ranked second in their
selection and suggestions from the business community ranked third.
An analysis of the area ancillary manpower p5_anning board meeting
minutes reveal that very few local secondary school superintendents or
their representatives serve on the area committees or participate in any
of the planning functions. The fifteen area Committees on Improvement of
Education (these are organizations of local secondary school superintendents
functioning within the boundaries of each merged area) should appoint a
representative from their committee to attend each Ancillary Manpower
Planning Board meeting.
The local superintendent representing each Area Committee on the
Improvement of Education on the AnCillary Manpower Planning Board could
provide valuable input to the Ancillary Manpower Planning Board as to
student drop-out rates, poverty levels and the like. The local superintendent
could also provide valuable feed-back to the Area Committee on the Improve-
of Education concerning labor market trends to effect more viable imple-

-69-
mentation of career education'instructional content and vocational
programs.
The secondary school &dministrators were asked to complete
Table 1 by indicating present programs offered and new programs they
are planning in the various program offerings. They were also asked
to report the achievement level at which the program would function.
The majority of the present programs offered by the school districts
function in the first three levels of achievement which include
orientation, work exploration, and entry level training. Semi-skilled,
skilled and technical courses are usually offered at the eleventh or
twelfth grade level. It is interesting to note that, in the area of
new program planning, the vast majority of the program expansion is
projected to be in the larger urban areas and only very few new programs
were planned by the smaller school districts. No schools planned to
discontinue any of their existing programs.

-70--
Follow-up of Career Education Students
Accurate studcnt follow-up is an important element in the
evaluation of the effectiveness of the career education efforts. It
can be used with other planning information to key program offerings
to labor-market and student needs. It can also be used to measure the
effectiveness of existi- programs and identify needs for new programs.
The 1971 student follow-L .oy the Department of Public Instruction pro-
vided data on secondary students enrolled in 260 school districts with
reimbursable career education programs. Approximately eighty-three
per cent of the secondary students enrolled in career education were
reported as completing the program in whiCh they were enrolled.
Graph 11 is an analysis of the secondary student follow-up conducted
in October, 1971. The chart indicates that, of those who completed
career education programs, forty-one per cent are unemployed, ten per
cent are employed part-time, and five per cent with status unknown.
The main reason cited in the follow-up study for unemployment was
"continuing education". It should be noted, however, that 1,478
secondary students or thirty-seven per cent did not indicate the rea-
son for unemployment. In the summary of placement results for 1971,
a final analysis reveals that of 8,538 total enrollees, fifty-seven
per sent are employed or pursuing further education, while forty-three
per cent were either not followed up, no data reported, or are ex-
periencing unemployment for miscellaneous reasons.
The 1971 student follow-up reporting form suggests that the
local schools are required to follow-up the students who do not com-
plete the career education programs in additio to those that did. The
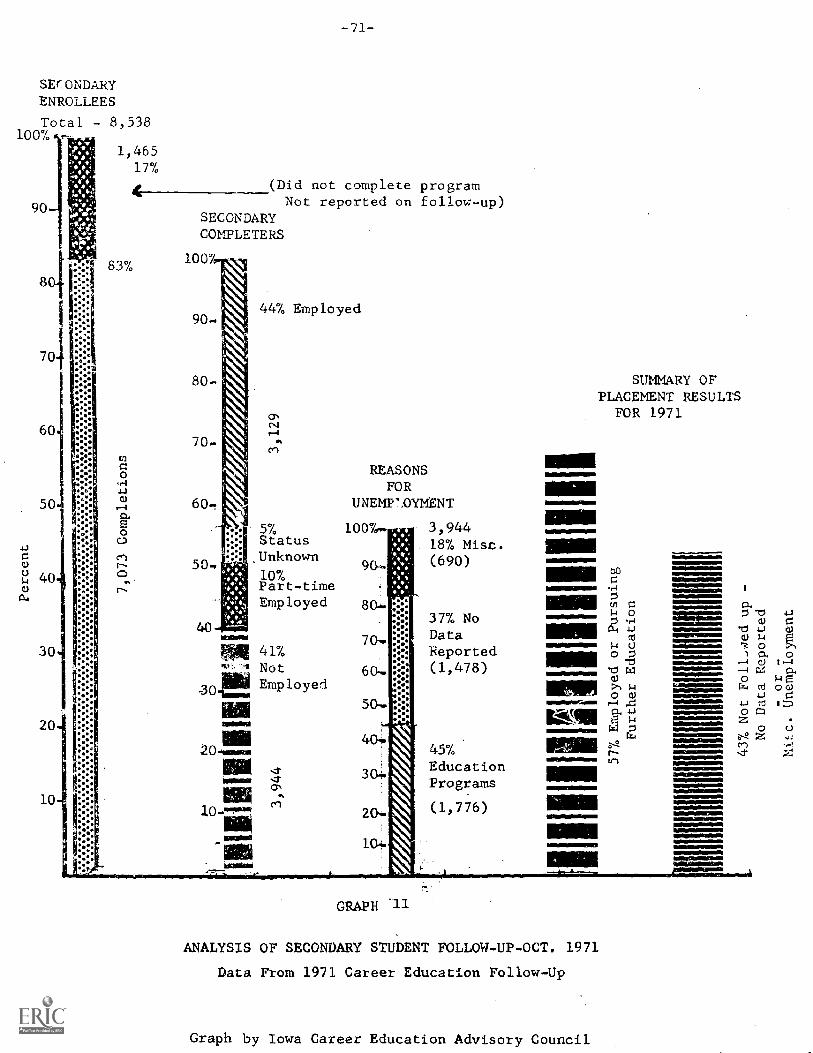
c,
Percent
OC
3-4
-,su
ancA
mm
eraa
nam
......
..46.
....s
mer
raw
-mas
0
.`'.
-wPP
MFf
rn71
17:r
:TIV
ITT
r.'7
111:
7,073 Completions
'1st
sfr.
3,944
o rt0 a.
OD O
VI
0II)
0 X'
rrz,
,!?ri
03rt
.?0
rt0
rt
wC
D
1/40 1
U) O
CO
0 0
00
2 PEI
1'4
:O
'0d0
Ast
r rd
mrr
11a.
ul
0 OP
0ti
0\11
/rr N
.C
O 0
I.-
t-. %
; Icl
Q.)
e- 1
--. W
t. M
D.1
---1
0\ C
O2
1'0
rrz-
,-'2
0 a
-9-
0 H
4%.
CD
0.P
.--
-I P
i2
s.. Z
00 r
r0
r-s-
, mcn
cirs
577. Employed or Pursuing
Further Education
P11111111111110111111111111011111111111111
43% Not Foll.07ed
up -
No Data Reported
- or -
Mic. Unemployment
3,12
9
III
rbr
00 r4 z i_3 Cfi
t-. tri
O
CIJ 0 1-4
2 H
.O
o, 0 o
IT)
(1.
ro O
01-
10
rt CD
.0
a.1m
o O C
D
111
0O
Cr) Os
I0

-72-
follow-up report did not show that this information was used for any
analytical purposes. It may be of value to know the primary reasons
these students did not complete career education programs.
The 1971 follow-up also included the number of students com-
pleting programs in the various program areas. Graph 12 indicates the
percentages,in each career area,of students with status unknown or not
available for placement. The areas of home economics (gainful), T & I,
100
90
80
70
60
50
40
30
20
10
34%
GRAPH 12
TERMINATING STUDENTS WITH STATUS UNKNOWN OR NOT AVAILABLE FOR PLACEMENT
56%
S = SecondaryPS = Post Secondary
20%
Source: Career Education Student Follow -up, Iowa Department of Public Instruction
Graph by Iowa Career Education Advisory Council

and distributive education have a higher percentage status unknown
than the other areas. All of these areas exceed forty per cent. Em-
phasis should be placed on these areas to provide more complete follow-
up information.
The present method of student follow-up presents an accurate
picture of the status of the students, but it fails to provide the
managemr2nt information needed by local education officials for adminis-
trative action. The main purpose in a follow-up is to determine what
happens to the graduates after they leave their vocational programs,
not just in terms of being employed or unemployed, but how well the
training he received prepared him to enter an occupation and achieve
some degree of success.
The Dew-tment of Public Instruction has established a pro-
cedure of writing to Area School Superintendents who are responsible
for vocational programs for which poor placement is evident. The let-
ter suggests that the Area Superintendent should initiate action to
correct the problem, This is a commendable procedure, in that it pro-
vides assistance to the school superintendant who may not be aware of
program deficiencies relating to poor student ?lacement. At present,
this effort has not been implemented for programs offered by secondary
schools, Future efforts should be directed toward pro..oiding this same
assistance to secondary school superintendents.
Developmeii a1 Efforts
The Department is presently developing, as part of the Career
Education Need Information System (CENTS) Project, a three year follow-
up of students which will supplement the annual follow-up requred by
the U. S. Office of Education. This effort will involve the local
-74-
schools surveying 100 percent of those enrolled in career education
programs three years pre,.-icusly. The fellow -up will -,:nlestiion studens,
about their success on the job jr opinion of the quality of program
in which they have been enrollee ,neir employment experiences since
leaving the program, and the like. The employers will not be questioned
in this effort.
A follow-up study of this manitude would require a great deal
more time than the present means of follow-up. Most local administrators
are over-loaded Torth their present administrative duties. It might be
impractical to add the extra burden of a comprehensive student follow-up
system. It may be to a greater advantage if a centralized agency would
accomplish all student follow-up, thus relieving the local 77ministrator
for other duties. The centralized agency could provide usable informa-
tion to the local school districts to help them develop more effective
programs or improve existing programs.
The Department has also developed a system for the follow-up of
all high school graduates or dropouts. The local schools identify the
employment, educational, an military status of each student. This in-
format on is now being filed by the local schools with the Department as
part of the "Secretaries Annual Report". This reporting has been occur-
ring for three years. Some schools have been making curricular changes
as a result of information which they now have. The state-wide extent to
which this follow-up information is being used for management purposes by
the local s -,(7)1 district is not kr.,7n at this time.
Alternate Method r Student F up
The Minnesota has developed a state-wide follow-up system
to determine the status of vocational students after they terminate
their vocational programs. The data is collecte directly fro:7. the .stu-
dent and not from the institution in which he obtained hi training.
Four different types of follow-up reports have teen developed
from the data: 1 A summary of data on all students followed up across
the entire state, 2) A summary of data on students follow up in each cur-
riculum area (e.g., aut._ mechanics) across the entire state, 3) A summary
of data on all students follciwed up within each school, and 4) A summary
of data on all students followed up within each curriculum area within
each school.
The employers are also surveyed to evaluate the graduates by
comparing them with other members of their work group.
The Vocational Follow-Up Project is conducted by a highly
specialized staff which is responsive to the needs of the vocational-
technical schools and the State Department in Minnesota. This approach
tends to provide an efficient vehicle for gathering such follow-up in-
formation that is not evident from the Iowa system which requires each
of the sclics to follow-up its own students. Efficiency is increased
not only in terms of the economics of being able to finance a central
unit more inexpensively than it is possible to finance separate units in
each of the vocational schools, but also in terms of being able to gather
comparable data from each of the. schools in ways in which the accuracy of
the data and returns can be maximized. In a phone conversation with Dr.
David Pucel, Project Director of Minnesota's Vocational Follow-Up Project,
he stated that student follow-up cosrs averaged approximately $5.00 per
student after the initial systems devemopment. This project was financed
by state allocations of research funds from the federal government. (55)

While this cost 771av appear to be h iL
more than seven-tenths of one per cent of the avera±_:e exceptional
for secondary vocational education proL,,rams as ider,L
district.
FINANCIAL ANALYSIS
.lecl by one scncl
In an effort to sample the vocational education financial
needs of the secondary schools, the Council sent questionnaires to 195
secondary instructors in fifteen counties to sample the; opinion.
(See Map 5 , page 62). These counties contain eighty-five school
districts, but only fifty-six districts have reimbursable vocational
programs at the secondary level. The career education programs surveyed
included: vocational agriculture, trades and industries (both coopera-
tive and preparatory), office education, home economics and distributive.
For the year under study, health occupations could not be surveyed be-
cause no reimbursable preparatory programs existed at the secondary
level with the exception that health occupations training is provided as
one occupational area that is offered as part cf some trade and indus-
trial cooperative programs.
Equipment and Sullies
The need f.:r equipment varies with the type of program offer-
ing, for example, distributive programs usually are operated by the
cooperative method which requires less equipment. The length of a pro-
gram tends to determine the amount of equipment needed. Programs of-
fered -' the senior grade level may require less equipment than those

thLt I' action or more scars.
The responses to the questf.cnnaire relatin to e:..,uiprnent
will be discussed by program,rather than collectiveiy,to provide clear
indication of .he typical individual program need included in this sur-
vey sample.
Office Education
Nineteen reimbursed secondary office education instructors
were included in the sample of the Council survey. Fifteen of this number
returned questionnaires for a response of nearly eighty per cent. The
majority of those returning questionnaires utilized both the laboratory
and cooperative method for instructing their students. Nearly one-half
of this group was of the opinion that their equipment was modern and
up- to -datn and that no replacements were needed in the near future. A
slightly larger percentage expressed the view that, while their equip-
ment is presently adequate for instructional purposes, in a short time
it will become obsolete and should be replaced.
Approximately one-half of the office education coordinators
that responded have expended the effort necessary to identify the number
of dollars that will be needed to up-date their equipment in the future.
Because the number of responses is small, the results cannot be con-
sidered to be statistically significant. However, the vast majority
that did respond estimated that their future up- dating needs would cost
the local school district $10,000 or less. Only one respondent re-
=carted that the replacement cost for worn-out or obsolete equipment would
be $100,000. Because of the large expense involved, this program night
have been designed to teach computer programming. Two-thirds of the in-
structor Teported that their administration would be able to expend

sufficient funds to 1:1,-y replacement or additional equipment of state or
federal funds were available to rei..burse at mast fifty per cent of the
cost of the equipment.
Slightly more than one-half of the instrtors had presentee
to their administratiolz in recent years a written "Status of Major Eouip-
ment Report" for planning and btIgeting purposes. Nearly seventy-five
per cent visited verbally with their administration about the equipment
a Jd supply needs while only twenty per cent had developed a five or ten
year replacement or acquisition of new equipment plan to satisfy the
laboratory instructional needs.
The office education instructors were further questioned con-
cerning the extent existing laboratory equipment was used during the day
for instructional purposes. More than two-thirds of the instructors re-
ported that the equipment was used six hours during the normal school
day and more than two-thirds reported that their laboratories were used
fcr adult education programs each year.
In an7 laboratory situation, it is impractical to expect that
all equipment and work stations are used all the time because some in-
structional equipment is used in support of other equipment for teaching
purposes and therefore becomes a part-time training station. Almost
fifty per cent of the instructors reported that between five and 10 pex:
cent of their training stations were vacant during Liie instructional
periods. Slightly more than twenty-five per cent reported that beton
ten and fifteen per cent of their training stations were vacant during
instructional periods. Only one school (six and six tenths per cent)

reported that more than twenty-five per c7!nt of their training statins
were empty each instructional period.
±1.71-Liculture
Twenty-eight vocational agriculture instructor= were included in the sample
of the Council survey. Twenty -two of number retained questionnaires
for a response of ;leaf iv sek_nty-nine per cent. Forty-one per cent of
these instructors utilized the laboratory method of instructing their
students while nearly thirty-seven per cent utilized the laboratory and
cooperative method. Only fourteen per cent of this group was of the
opinion that their er214i:ient was modern and up-to-date and that no re-
placements were needed in the near future. Nearly one-half of this group
expressed the view that while their equipment is presently adequate for
int;tructional purposes, in a short time it will become obsolete and
should be replaced. .twenty -seven per cent indicated that either their
equipment was out-o ate but good repair or that it was out-of-date,
in poor condition and should have been j-placed years ago. Approximately
one-half of the vocational agriculture instructors who responded have ex-
pended the effort necessary to identify the nuniber of dollars that will
be needed to up-date their equipment in the future. Slightly over one-
half of this group estimated that their future up-dating would cost the
local school district $2,000 or less, while the remaining indicated the
up-daLing cost at $10,000 or less. Almost ninety per cent of the in-
structors reported that their administration would be able to expend
sufficient funds to 1,uy replacement or additional equipment if state or
federal funds were available to reimburse fifty per cent of the cost of
the equipment.

sx-cv berce:,t the 7:resented tc
ad.7.inistration a itten "Status cf -;-ol-uprent Pe--rt" for anh:
and budgeting purposes_ Abbroxinately eighty - sever percent had ed
verbally with their administration about the equibment and supzlied neerl,
whiie only twenty-three had developed i five or ten year replacement or
acquis:_ton cf new eouipment Sian to satisfy the laboratory instr-_acticnal
needs.
The aorduiture instructors were further zuestioned concerninc.7
the extent to which existing laboratory equipment was being used durin
the day for instructional purposes. The majority (sixty-four percent)
of the instructors reoorte_ that the equipment was us(.d three he rs a da,:_
This implies that many of the learning actvities are conducted
means that in-school laboratory experiences. Almost ninety percent
ported that their 1:
each year.
In an effort to determine the utilization of equipment, fifteen
percent responded that their training stations were vacant between five
and ten percent of the time during the instructional periods. Approxi-
mately forty ?ercent reported that between ten and fifteen percent of
their stations were vacant, while fourteeil percent report vacant stations
between fifteen and twenty-five percent of the 1,1structional periods.
Fourteen percent report vacancies in their training stations of more
than twenty-five percent of each instructional periDd.
Distributive Education
Thirty-three secondary distributive education instructors were
included in the sample of the Council survey. Twenty-five of this num-
other
':adories were used for adult education trograms

bcr returned questionnaires for a respor_se of seventy-six per cent. One-
half of the instructors utilized the laboratory and cooperative method
fc-f instructing their st.;dents. T7,enty-nine r,er of this wal
of the opinion that their equipment was 77-dern and up-to-date that
n.17. replacements 'ere needed in the near future.
A larger percentage (thi-zty-eight per cent) expressed the view
tha!:,w7.1ile tneir equipment is presently adequate for instructional pur-
poses, in a short time it will become obsolete and should be re/laced.
Approximately five per cent felt their equipment was out-of-date but in
good repair. Only seventeen per cent of the distributive education in-
structors renrYnding expended the effo7:t necessary to identify the number
of dollars that will be needed to up-date their equipment in the future.
Because the number of responses is small, the results cannot be con-
sidered reliable. however, all of those that responded estimated their
future up-dating needs would cost the local school district $10,000 or
less. Over half of the instructors reported that their administration
would be able to expend sufficient funds to buy replacement c additional
equipment if state of federal funds were available to reimburse at least
fifty per cent of the cost of equip:,nt.
Approximately one-half of the instructors had presented to the
administration in recent years a "Status of Major Equipment Report" for
planning and budgeting purposes. One-half had visited verbally with their
administration about equipment and supply needs, while only twenty-one
per cent had developed a five or ten year replacement or acquisition of
new equipment plan to satisfy the laboratory instructional needs.

Me distributive educa:icn inszt,_Ictor were furt'ner estioned
concern ng extent existing laoratory e ip 2nt was used durin .:. t'ne
day f)r instctional bucses. per cent utilized their equipment
three hours cizing the normal day, while nearly rhirteen per cent reported
using their equipment six hou:s during the day. Only a small per cent
(eight) reported that their laboratories were used for adult e&Jcation
programs each year.
In an effort to determine the utilization of work stations
during each period, nearly twenty per cent reported that only five to ten
per cent of their training stations were vacant during the periods. Only
one school (four and one tenths per cent) indicated vacant stations
fifteen to twenty-five per cent of the time, while nearly seventeen per
cent report that more than twenty-five per cent oi their training sta-
tions were empty each instructional period.
Home Economics
Sixty reimbursed secondary home economics instructors were in-
cluded in the sample of the Council survey. Forty-four of this number
returned questionnaires for a response of nearly seventy five per cent.
Forty-three per cent of these instructors use the laboeatory method of
instruction, while a slightly smaller percentage (forty-one per cent)
utilize the laboratory and cooperative method. Thirty-seven per cent of
this group was of the opinion that their equipment was modern, and up-to-
-and that no replacements were needed in the near future. Nearly
,e-half expressed the view that, while their equipment was adequate for
instructional purposes, in a short time it would be obsolete and should
be replaced. Ten per cent felt their equipment was out-of-date, but in
good repair. Approximately forty per cent of the home economics instruc-
tors-that responded have expended the effort necessary to identify the
number of dollars that will be needed to up-date their equipment in the
future. Nearly thirty per cent estimated that their replacement need
would cost the local school district $2,000 or less. Fifteen per cent
estimated the cost at $10,000 or less. Two respondents reported that the
replacement cost for obsolete or worn-out equipment would be $10,00-.7 to
$50,000. Two-thirds of the instructors reported that their adminThtra-
tion would be able to expend sufficient funds to buy replacement or ad-
ditional equipment if state or federal funds were available to reim-
burse at least fifty per cent of the cost of equipment.
Two-thirds of the instructors had presented to the administra-
tion in recent years, a written "Status of Major Equipment Report" for
planning and budgeting purposes. Seventy per cent reported they had
visited verbally with their administration about equipment and supply
needs, approximately one-half had developed a five or ten year replacement
or acquisition plan to satisfy the laboratory instructional needs.
The home economics instructors were questioned concerning the
extent to which existing laboratory equipment was used during the day for
instructional purposes. Nearly sixty per cent of the instructors reported
that their equipment was used six hours during the normal school day, and
fifty-five per cent reported that their laboratories were used for adult
education programs.each year. The majority of the instructors (sixty-one
per cent) reported that less than ten per cent of their work stations

-at-
were empty each instrucrional period which scems co indicate maximum
utilization of equipment and facilities.
Some of the home economics teachers expressed some concern
about the questionnaire mailed by the Council. The following selected
statements illustrate some of their views:
:11.1y program is home economics. Useful. Don't feel this(questionnaire) applies."
"Much of this questionnaire applied to courses that teachemployable skills. We do not have these courses - onlyconsumer and homemaking skills."
"This is too related to a vocational-technical school be-yond high school. It is not geared in any way to includehome economics."
"This does not really apply to my program, as we do notoffer any career education program. Even if we did, itis slanted away from home economics."
Trades and Industries
Fifty-five reimbursed secondary trades and industries coordi-
nators or instructors were included in the sample of the Council survey.
Thirty-six of this number returned questionnaires for a response of near-
ly sixty-six per cent. Trades and industries programs are of two types
which include cooperative or preparatory. The cooperative method of in-
struction in T & I depends usually on one hour a day of related ilstruc-
tion offered by the school through the use of books and manuals and does
not require a large amount of equipment. The analysis of equipment needs
for T & I will be confined to the twenty-five T & I preparatory programs
from which questionnaire response was received. The majority of these
instructors (eighty per cent) reported that they utilized the laboratory
and cooperative method for instructing their students, while twenty per
-85-
cent utilized the laboratory method only. The largest percentage of this
group expressed the view that, while their equipment is presently adequate
for instructional purposes, in a shor: time it will be obsolete and should
be replaced. The next largest group was of the opinion that their equip-
ment was modern and up-to-date for the present programs and no replace-
ments were needed. A smaller percentage felt their equipment was out-of-
date and needed replacement. Sixty per cent of the T & I instructors
responded that they had expended the effort necessary to identify the
number of dollars that will he needed to up-date their equipment in the
future. Thirty-two per cent responded that their future needs would re-
quire from $10,000 to $50,000 for the purchase of new or replacement of
obsolte equipment. Another thirty-two per cent estimated replacement
costs at $10,000 or less. Three respondents reported that equipment re-
placement costs would be $100,000 or more. Nearly sixty-five per cent of
the instructors reported that their administration would be able to ex-
pend sufficient funds to buy replacement or additional equipment if state
or federal funds were available to reimburse at least fifty per cent of
the cost of the equipment.
Approximately si:cty per cent of -Lhe instructors had presented
to the administration in recent years a written "Status of Major Equip-
ment Report" for planning and budgeting purposes. More than seventy-five
per cent had visited verbally with their administration about equipment
and supply needs, while only twenty per cent had developed a five or ten
year replacement or acquisition of new equipment plan to satisfy the
laboratory instructional needs.
- 86-
The T & I instructors were further questioned concerning the
extent to which existing laboratory equipment used during the day for in-
structional purposes. Ninety-two per cent of the instructors reported
that the equipment was used six hours during the normal school day and
sixty per cent reported that their laboratories were used for adult edu-
cation programs each year. Fifty-six per cent of the T & I instructors
responded that between zero and ten per cent of their work stations were
vacant during the instructional period. Twelve per cent reported that
between fifteen and twenty-five per cent were vacant during the period.
Three schools reported more than twenty-five per cent of their training
stations were empty each instructional period.
The T & I instructors have\Indicated a definite future need
for the replacement of equipment.
Summary
This unit of the annual report was probed to assist state ad-
ministrators in viewing financing problems that may appear on the horizon.
The majority of secondary vocational instructors included in
this survey reported that their t.aaching equipment was modern and up-to-
date. The group that reported they had the most up-to-date instructional
laboratories were the office - education instructors, while the programs
with the least up-to-date equipment was in agriculture. Four out of five
instructional areas reported th't fifty per cent or more of the labora-
tories were equipped with obsolete instructional equipment that should be
replaced in the near future.
The majority of instructors who reported the need to replace
obsolete or worn-out equipment stated that less than $10,000 would be
be required for up dating.
A very high percentage of the instructors who reported equipment
needs also reported that their administration would be able to purchase the
necessary new equipment if fifty per cent of the cost would he reimbursed
from state and federa funds.
The instrucc_ors ere questioned about tile action they had taken
to appraise their local adminiStrator of their equipment needs. Instruc-
tors in four of the five servicr: areas reported that more than fifty per
cent had developed a written "Status of Major Equipment" report that had
been filed with their administrators. Over seventy per cent of the in-
structors had spoken to their administrators about their needs which im-
plies that twenty per cent of the population that did not prepare a writ-
ten report did take the time to speak to their administrators about their
needs. More than twenty per cent of the instructors surveyed had de-
velopel a replacement plan which could be used by their administration,
so that needed replacement equipment could be purchased in an orderly
manner over several years.
All service areas reported a high level of usage of their labora-
tory facilities with few vacant training stations. There also appears to
be extensive use of secondary facilities for adult education programs.
Council Observations
During the past two years, the Council has conducted five (5)
of its meetings in various locations throughout the state. During these
visits, the Council members have visited nineteen (19) secondary school
attendance centers. The Council's observations of secondary school

-88-
facilities and equipment do not coincide with the generally favorable
reports of the secondary instructors on the condition of their equip-
ment when compared to area schools equipment. The discrepancy may be due
to the small sample of schools observed by the Council or may be due to
an attitude of resignation by the teachers about their teaching equipment.
In either case, there is apparently the need for state administrators to
review, in depth, the circumstances relating to secondary school vocational
teaching equipment and to take positive step toward improvement of the
situation.
FUNDING OF SECONDARY PROGRAMS
During several recent Council field visits, some local educa-
tors attending the public hearings, raised question about an apparent in-
adequacy of financial assistance available to operate effective secondary
vocational education programs.
State Appropriations
In an effort to identify some basis for the above comments, the
Council reviewed Annual Reports filed with the U.S. Office of Education to
identify the state administrative fund allocations for secondary vocational
education for the biennium of 1967-69 and 1969-71. In additit,n, the Code
of Iowa was consulted to determine the .tategorical aids that had been ap-
propriated for secondary schools for the 1971-73 biennium. It became
apparent that total elementary-secondary school funding needed to be
identified to make a meaningful comparison. The total allocations were
categorized into two (2) categories which were general aid and all cate-
gorical aids. Included in the general aid category were those specific
-
appropriations that had the potential cf- serving all students, while
appropriations to meet the needs of select groups of student or to es-
tablish specific programs were listed under categorical aids. The list-
ing of these appropriations and allocations are found in table 2 on
page 90. Graph 13 , page 91, shows the difference in type of state allo-
cations for secondary schools. The reader will observe that the general
aid appropriations have been significantly greater than those provided for
specific purposes. Reference should be made to table 2 on page 90
which shows that in the 1971-73 biennium the categorical aids for voca-
tional education were approximately one-fifth of the total of all cate-
1
gorical aids.
It should be noted that the legislature appropriated vocational
funds for secondary programs the first time in the 1971-73 biennium. Pre-
viously, the legislature made a single appropriation for vocational-
technical education and left the uivision of the funds between secondary
and post secondary vocational programs to the discretion of the Stat
Board of Public Instruction.
Tax Problems of Local Schools
Severalyears ago, the property owners in the State became more
vocal than ever in their objections to high property taxes. As a result
of these objections, the State Legislature passed a bill in 1971 which
placed a ceiling on school spending and developed a formula to provide a
foundation aid plan based on students enrolled in each school district.
This bill called for the inclusion of all federal aids income in the
calculation of the formula. This, in effect, caused federal funds to be

STATE BIENNIAL ALLOCATIONS
( Exclusive
A. General Instructional Aid
TABLE 2
for ELEMENTARY and SECONDARY EDUCATION in IOWA
of State Administrative Allocations
1967 - 1969
1969 - 1971
1971 - 1973
1.
General Aid
$161,000,000
*$227,000,000
$230,000,000
(62-HF686) (p.696)
(63-HF368)(p.43)
(64-HF121)(p.B8)
2.
School Lunch
$505 000
(64-DF688)(p.56)
3.
Radio and T.V.
(educational)
$500,000
$1,250,000
$2,026,570
(62-SF732)(p.118)
(63-SF686)(p.28)
(64-HF738)(p.62)
4.
Specific School Aid
TOTAL
B. Catagorical Aids
$50,000
(62-HF795)(p.65)
$161,550,000
$228,250,000
$232,531,570
1.
Special Education
$7,000,000
$7,000,000
$7,400,000
(62-HF795)(p.65)
(63-HF368)(p.43)
(64-SF577)(p.61)
2.
Migrant Education
Adult
($40,000)
Not over $70,000
Not over $70,000
Migrants
$70,000
from special cd.
from special ed.
(62-SF869)(p.63)
fund
fund
3.
Driver Training
$3,400,000
$3,400,000
$3,400,000
(62- 3F870) (p.61)
(63-HF659)(p.326)
(64-SF582)(p.5(3)
4.
Vocational Education
a. Administrative Allocation
$1,634,255
1 3Data not avaqable2
See Le)%istative
Approptiation
b. Legislative Appropriation
($12,000,000)
($13,200,000)
$3,650,000
(62-SF876) (p.64)
(63-SF622) (p.42)
(64-11F709)
(p.56)
TOTAL
$12,104,255
$10,400,000
$16,20,000
(62-11F686) (p.696)
62 = session laws from 62nd General Assembly. HP 686 ,
House File
in session laws.]
686. (p.696)
1From annual reports to U.S. Office of Education for FY 1968 & 1969, Form 4063.
This
not
1-(.1 !c(.1
Allocations to special catogories such as handicapped and disadvantaged, eL. al.
2Annual report to U.S. Office of Education for 1969-1970.
3Appropriations rmtde leaving DPI the discretion of allocating funds between secondary
schools.
',4.(
4111
6,i)

-......--'-"ji.
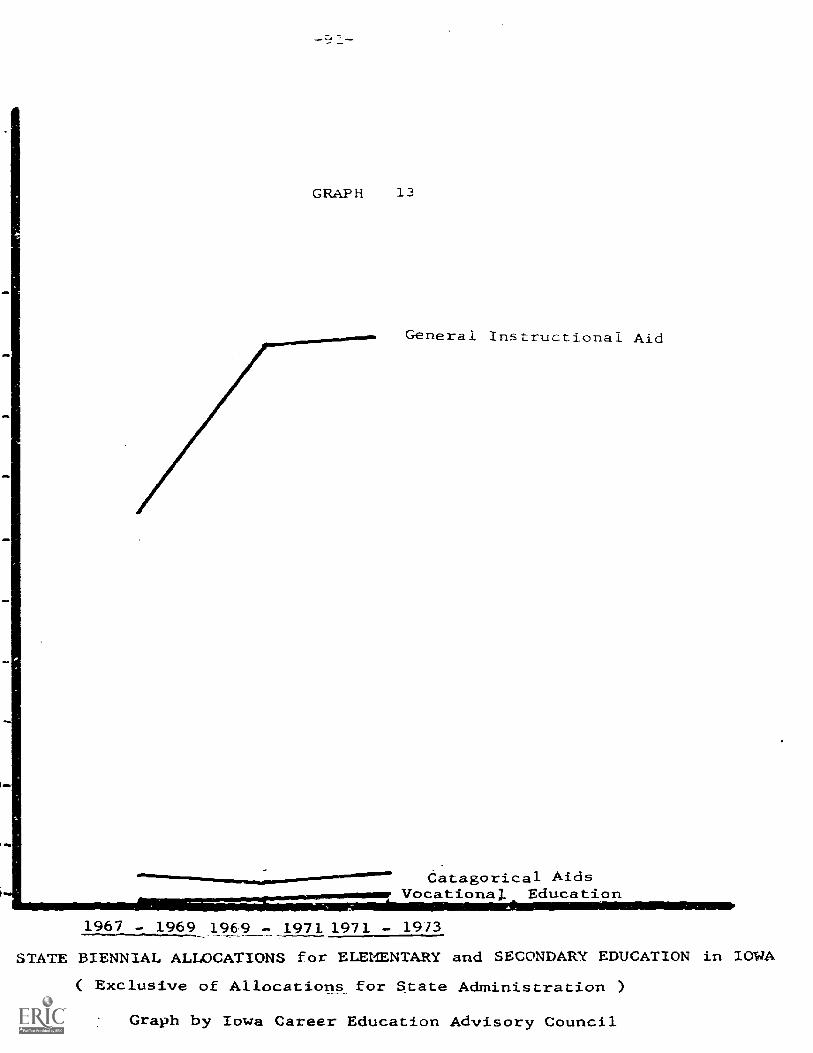
GRAPH 13
General Instructional Aid
Catagorical AidsVocational Education
1967 - 1969).969 - 1971 1971 - 1973
STATE BIENNIAL ALLOCATIONS for ELEMENTARY and SECONDARY EDUCATION in IOWA
( Exclusive of Allocations for State Administration )
Graph by Iowa Career Education Advisory Council

used to supplant local tax funds, raLher than supple:7.ent lcc.11 :3x :cnd:;.
The 1972 session of the Sixty-Fourth General Asse7ably a::ended the
bill which placed a limit on school spending by allowing rho jederal aid
funds to be used to supplement local school spendin.:.
Federal Allocations to the State
Prior to the passage of Publli.c Law 88-210 -cn 19'3,
practice of Congress to pass laws calling for the establishment of certain
kinds of vocational education programs. The Smith-Hughes Act of 1917 pro-
vided for assisting local schools with the exceptional costs incurred
when establishing programs in agriculture, trade and industrial occupa-
tions an's home economics. Later, the George Dean Act provided exceptional
cost assistance to local schools establishing programs in distributive
education. Most recently, the George-Barden Act provided exceptional
cost aids for schools developing programs in practical nursilg and health
occupations education.
When Congress passed the 1963 Vocational Education Act they
recongized the occupational areas listed above and suggested appropria-
tions be made in accord with those acts, however, allowing the transfer
of funds from one occupational area to another by request of the State
Board to the CommisFioner of the U. S. Office of Education. The only
specified funding found in the Act required that states spend ten per
cent of their allocation for gainful home economics occupations programs.
During 1968, Congress passed Public Law 90-576 which amended
the Vocational Education Act of 1963, The enactment of this law left
the allocation of funds for cne six ,,ccunaic.r.ai areas
home economics, distributive, office, heaitl-., and trade and idus:-.rial
education, in Part B of the Act, t- the discretion of each. St;:t
of Public Instruction. Exceptions to this are found in other parts of
the Act which provide specific al locaLions LG each rc'seLrc
and trainin, exa:np.L % programs, ccrisuer cducati
cooperativ2 programs and work study programs.
State Disbursement of Federal & State Funds to Local Secondar; School Systems
During fiscal year 1968 and several years prior, the Iowa
Department of Public Instruction reimbursed local school systems at dif-
ferent percentages for programs in different occupational categories. At
that time and, currently, a uniform accounting system is not functional
and, therefore, total program costs were not identifiable. For this reason,
it is assumed that departmental administrators decided to reimburse pro -
grams in the various occupational groupings at different percentages be-
cause of their asAmptions about the different costs of the programs.
Graph 14, on page 94, shows the reimbursement policies that have been
implemented since 1968. The reader will observe that the former policy of
differential reimbursement has been redirected toward a policy of uniform
reimbursement for secondary school vocational programs. The only excep-
tion to this, which is not shown on the graph, is the reimbursement policy
on cooperative programs. Currently, newly established cooperative pro-
grams are reimbursed at eighty-eight per cent of the cost of the instruc-
tors salary, travel and extended contract for the first year followed
by sixty per cent the second year, forty per cent the third year and

100
60
50
Tech. p.
Dist.
-1
Off. Ed.2
4.4
10
T & I
40
1.4
g.3
a
30
20 1.0
4.
1.
Preparatory programs conducted on 3 hour block of time in junior or senior year.
2.
Preparatory programs generally consisting of 2 hours of laboratory instruction and
12day cooperal ive
experience during the senior year.
3.
Program generally offered 1 hour per day in grades 9-12.
Teacher employed on extended contract to
coordinate summer work experiences of students,
4.
Propram generelly offered 1 hour per day in grades 9 -12 with many schools
otlering the urogram in
grades 7 and8.
5.
Program generally offered during grade 12, including
of each day - cooperative experience
1 FY 168
FY 169
FY 170
Teq
Trade & Industrial Education
Off.
Ofiice Education
Al;.
Agriculture Education
11E
Nome 14;c,utomici Educatin
(Useful)
Dist.
Di!Arihutive
iin
Tech. Ed. , Technical EduLati,,e
FY '71.
Fl ii?
GRAPH 14
"MN
.111
01~
1116
PERCENT OF REIMBURSEMENT COMPARED TO AMOUNT REQUESTED
(Based on Teacher Salary - Travel
-Extended Contract for Secondary Schook)
Source:
Iowa Department of Public Instruction, Percent of Reimbnr!;cHont
to (;lair)
Graph by Iowa Career Education Advisory Council.
-95--
twenty-two percent the fourth year.
Approximately one year prior to this report, the vocational
administrator employed by the Council Bluffs Iowa School System, com-
pleted a study of the total cost (exclusive of academic instruction)
of the vocational programs offered by that school system. A summary of
the results of this study are shown on Graph 15, page 96. The reader
will observe that the range in cost varies from a low of $248.00 per
purpil, per year, to a high of $1,803.00 per pupil, per year. The costs
included administrative overhead proportionate to the number of students
enrolled, custodial services proportionate to the square footage of
laboratory and classroom used, annual depreciation of equipment keyed to
the actual projected service life of the equipment, and direct costs
including utilities based on equipment draw, salaries of teachers, supplies
and text materials used in the program. The average cost of all vocational
programs was $696.00 per pupil. There is no single cost factor that occurs
more than once, however, there is a model tendency toward per pupil program
cost of $605.00 to $704.00. This cost is approximately twice that cost
for all other educational programs per student.
The reader should note that the greatest program expansion and ap-
proval of new programs during FY '72 has occurred in the'home economics
programs. Is there a relationship between the common percentage reimburse-
ment concept and the development of new programs and expansion of existing
low cost programs? Are school administrators being forced to implement
low total cost programs because they receive a

96
sweaBoaa IeuoTauonpaTTV-- udna aad asop lenuuk7 a2eaaAv
smeaBoaa Ieuove-00A TIV aBeaaAV
suoTatedn000 30T110
uoTauonpg anTancrfaasTa
aATauaadoop leTaasnpui pus apeal
SOTUelpaN0any
SuTa3eaa
cmMM,r,
011EMM IM MW
ME1111111.,...,.P.0.:.1.41.:
0
OD . .0
MMWMWM.ceve........."..07*.0
M plimmmimmtf)
BuTpiam .uo-raeuTqmoD
L.D1/40
sTIPIS aPPII PalvTall
aouaTaadxa )1aom paSequeApesTo O0 ,
VD I.e....".ir)
. .
1....,.IPP.14 0 ::::::::::::::::e:iiiw*****""eweee*********wvv4"....****e"::::::*%::":**...V09.991LIAUIPAPALPAAPAA4Weuroel.e.4.3e.tees
'I
sqlV 0TIOPI0
soTmouoog amoH Tnjasn
O O Q o O O oO O o O O O o O O O O (=, O (=, O oC o -1- co NI 0' 00 1-- 0 ce) (N 1-4O \ 00 rs .-4 . r41 r4
r-1SHVTIOG
In
a)E
O coO
r1 31
4.J
O CU
U1J r1
0) OO
E m
Ot4.4
oH-1H 0 0U 0 U
-14-)o M 4
4-1
U0.)
..0 3-1 a.)4-1 a.,
0) 04-4
1-1 a.) 1.4
O .4 a)H .4O H1-1
m4-i 0
o14-1 PO w Rf
.4 0.m =a) 0m G 00 4-4
P E oo oo.$4
OD a)1-1 OO /4
H0
00U
(i)
LC
,-1
PC) U
r.1 0U 0000 0
cn
1 <Oc)% 0v--1
4-1
I MU
M W1-1
Mo WP 0f). P0
COOrl
cv
U H
Ix 3
C.)
CO
1-1
ad 00
-1
ro0
O
4-1
0
Up0O

higher percentage of return on these programs wheri reimbursement is based
on teacher salary, travel and extended contract? Does the current reim-
bursement system encourage school administrators to establish programs,
regardless of their cost, keyed to labor market ds?
Secondary School Administrators? Actitudes on Financing of Vocational Pro6rams
Reference is made earlier in this report to the school districts
that were surveyed in fifteen selected counties in the State. It was re-
ported that the secondary vocational instructors were mailed questionnaires.
The school superintendents or vocational directors of these same school
districts were also surveyed about their opinions on several matters per-
taining to their school operations. A total of fifty-five questionnaires
were mailed to local school administrators from which the Council received
forty-five returns for a percentage of eighty per cent. One matter about
which they were questioned related to financial assistance received for
their secondary vocational programs. About twenty per cent of the school
administrators that offered vocational agriculture and home economics pro-
grams in their school were of the opinion that current reimbursement poli-
cies yeild sufficient funds to their district to defray the exceptional
cost of those programs. More than eighty per cent of their peers included
in the sample did not agree. Only one (1) school administrator was of the
opinion that current reimbursement practices returned sufficient state
and federal tax dollars to defray-the exceptional cost of the distributive
education and office education programs. Fifteen school administrators
disagree. The superintendents in all fifteen schools that offered trade
and industrial programs report that the present amount of dollars of
reimbursement was not sufficient to defray the exceptional cost of the
vocational programs.

Uniform Financial Accounting System
Beginning in February of 1972, personnel in the Department of
Public Instruction began working with an advisory committee of local edu-
cators to develop a uniform financial accounting system for all secondary
schools in the State. One 1,, t: from such a system is that it would
provide financial managcme. _nation on instructional costs for the
school administrator. The system is being developed so that it is adapt-
able for use in the small, middle size, or large schools systems of the
State. The less detailed system will be available for use in the small
school system, while larger amounts of detail will be included in the
systems designed for the middle size to larger school systems in the State.
This Department of Public Instruction project should be com-
pleted shortly and the project calendar calls for pilot testing during
FY '73. Plans call for statewide implementation during the FY '74 or
FY 175 school year. Several larger local school systems in the State
are working with personnel of the University of Iowa to computerize their
cost accounting system. This computerization project is being developed
to be adaptable to the variations found in the cooperating schools. To
illustrate, some schools use flexible modular scheduling while other are
using the Carnegie unit class organization.
ALTERNATIVES TO BROADENING THE EDUCATIONAL OFFERING
One of the goals of educational systems is to provide each
student with a program that includes both basic education courses and
specialized occupational fields of study, thus offering the student a
-9
choice of academic or vocational programs, all directed toward the career
development of the individual.
Recommendations of the Governor's Educational Advisory Comillittee
The Governor's Educational Advisory Couudttee's Final Report,
1971, uL=LisELIJTIJLLLL222na, made certain recommendations that,
if implemental Jden the educational opportunities of students.
Some of theiL 1.,:eommeneations are:
VOCATIONAL EDUCATION
The Committee believes that the improvement of vocationaleducation deserves special emphasis. This obviously meansimproved and expanded programs, but, more than anything,
an improved image is necessary. This will require the at-tention of all Iowans, riot only those involved directly in
the educational process. The quality of guidance programsin general, and especially vocational guidance, must be
substantially improved at all levels of education. Coordi-nation of vocational programs between high schools and areaschools is pr(!sently missing and is sorely needed.
COMMUNITY SCHOOL CONCEPT
The Committee strongly endorses the "community school" concept
for all educational institutions. The education function ofstate and local governments cannot exist in isolation fromother governmental and societal problems. Iowa's educationalinstitutions should be the focal point of community and state
endeavors to solve problems. For example, all local agenciesand organizations, both private and public, should be involvedin the planning for new school buildings and expanded usage of
existing facilities. The achievement of total communityinvolvement in education and total educational involvement in
the community is an important goal toward which to strive. (18)
Recommendation 29 states "the number of local administrative
districts for elementary and secondary education in Iowa should be dras-
tically reduced." (18 They are not stressing a reduction of attendance
centers, but rather a new organizational structure consisting of county-
like units. This type of reorganization could provide the basis for each

-100-
district to consolidate their occupational efforts into one central loca-
tion thus prov_ 'ing broader, more comprehensive educational opportunities
for the youth he surrounding areas.
The Committee also recommended (Recommendation #27) that "Public
school officials should increase their efforts to cooperate with non-public
schools in shared-time and released-time programs." (18) The non-public
schools educate 71,000 or .4pproximately ten per cent of the elementary-
secondary students in Iowa. These students should have equal opportunity
to engage in occupational exploration and job preparation programs since
they will also be entering the labor market. In a consolidated vocational
facility, the county-like unit functioning under a reorganized administra-
tion could provide this type of opportunity more easily than the smaller
school districts. The ideal goal of a comprehensive education for all
students could be realized through the consolidation of numerous local
schools under county-like administrative structures.
Other Alternatives
Several states, similar to Iowa (large areas with sparse popu-
lation and numerous schools with few vocational opportunities for the
students), have implemented systems to deal with this problem. The Coun-
cil received information from five states describing their efforts of pro-
viding more students with a braod range of occupational opportunities.
Generally, each state has made provisions, through legislative action, to
allow school districts to voluntarily combine their efforts to form cen-
tralized vocational facilities which make vocational cluster programs
available for all high school students.
-101-
Governance - The central vocational facilities in Minnesota, Pennsylvania,
and Oklahoma are governed by a board with representatives from each of the
cooperating school districts. Ohio offers two options for governing the
central vocational facility. The managing board may be the county board
when all the cooperative districts are located in the county. The second
option provides for a board consisting of a member from the participating
school districts. Connecticut provides state-owned vocational facilities
and are governed by the State Board of Education.
Funding - Funding for these centers are provided by the participating
districts and state and federal vocational aid. Funds for new construction
are obtained from state aid and district bond Issues. The school district's
financial support of the vocational facility is in proportion to the num-
ber of students they have attending the center. The students are still
counted as being enrolled in the local school district for general state
aid purposes.
Transportation - Local participating districts provide the transporta-
tion and are reimbursed for this service by the state. No specific maximum
distance from the high school to the center is reported, but it is general-
ly not over twenty-five miles or thirty minutes.
Population Base - The centers vary in size according to the age level
of students for which the program is offered. Generally, the student popu-
lation potential at the center is found to be at least 500 (grades ten
through twelve) to provide the maximum of course offerings. Courses are
offered in at least ten different areas but may vary according to pupil
population need, needs of the community and manpower needs.
Basic Skills Instruction - Connecticut provides both academic and
technical programs in their re zonal vocational technical facilities. When
a student enrolls in the school., he becomes a member of that student body.
These schools carry on an active student government, athletic program, and
the usual extra-curricular activities. These state-owned schools have been
in operation for over sixty years.
In Oklahoma and Minnesota, the students attend the facilities on a
half-day basis and attend their home Ligh schools the remainder of the time.
This provides for the maximum use of the equipment and facilities, and ac-
commodates more students. Pennsylvania offers both part-time and full-time
programs for the students. The part-time student receives his academic in-
struction in his home high school. The full-time student receives related
academic courses at the vocational facility. Ohio provides most of the
students with the academic ilistruction at the facility.
Services for Local Schools - The administrative personnel at the centers
do not have the responsibilities for assisting the local school districts in
developing career orientation and exploration programs, but they do work
cooperatively to establish these types of programs.
Non-Public Schools - It should also be noted that centers provide
educational opportunities in career education for non-public high schools on
a tuition basis when adequate space is available.
Instructor Qualifications at Central Vocational Facilities - Instructors'
qualifications vary with each state. In Connecticut, there are three types
of certified teachers in the regional vocational-technical schools:
1. The trade instructor, who must be a high school graduate,eight years of work experience, and six semester hours ofteaching methodology.

-133-
2. Related instructor, two yors preparation beyond tht
high school, including thirty semester hours in te:h-
nical subjects, three years work exile! once and sixsemester hours in methodoloay.
3. General education instructor, same cortiffl,
the teachers in the high school.
Oho' .Lnstructpr qualifications reqzire the shop instructor to have as
a minimum, a high school diploma, fc_:.r years of apprenticeship, plus
three years of recent journeys... exprience. The trade technology
instructcr must be a high schl cladtuate, three years of recent
experience related to the trad.,.f i)r occupaticn in which the instruction
will be given.
The occupational expi7rLence for Oklahoma teachers is the same
as the comprehensive high scnoolz, and the T & T teachers are required
to have at least two years experl.ence in industry. Pennsylvania has
three levels of vocational instructors. Position l requires experience
beyond the fearing period, successful completion of an occupational
competency examination, and eighteen semester hours in an approved
program of vocational teacher education. The next two positions are
permanent positions and are based on continued upgrading by completion
of credit hours in approved courses ani satisfactory teaching experiences.

-104-
SUMMARY AND CONCLUSIONS
- Slightly more than one-fourth high school graduat e s il oc
completing the requirements for a .Jchelor's Degree, while approxiatcl%
twenty per cent will be pursuing some type of vocational or technical
program at the post secondary level. Because less than one-:-ourth 0;
Iowa's high school districts offer two or more reimbursed vocational
education programs, it appears that most Iowa secondary schools are not
meeting comprehensive educational needs of students. School district
size, alone, is not the exclusive reason for lack of breadth of voca-
tional offerings, since many urban and suburban school districts pro-
vice a limited vocational offering or nor offering at all.
- The greatest employment opportunities will be occurring in clerical and
service occupations followed by needs for professional and technical
workers, operatives and craftsmen. Approximately one-half of the school
districts in the State offer vocational agriculture and home economics
programs to their stude-its.
- Existing secondary vocational program offerings do not appear to be keyed
to Employment Service and State Plan projections of employment need.
Program expansions and new program starts do not appear to be keyed to
the projected greatest labor market needs. School systems in some
counties that have high youth unemployment are not implementing new
vocational programs to meet the needs of the students.
- Most secondary school administrators surveyed by the Council consider
students' statements of.interest of greater importance in establishing

vocational prol ,. labor market empioymer:t opportunities.
- Some area schools and county school systems are offering vocational and
exploratory programs for students enrolled in secondary schools that de
not provide this type in instruction. Some of their programs are oflored
during the school year, while others are offered during the summer only.
- There is some question about whether high school instruction prepares
the student to function effectively in an economic society. Vocational
instructors claim that instructional content has been slanted in this
direction, while student statements during the Council field visits
differ with this.
- Some secondary school administrators hold the opinion that career educa-
tion is just a new name for vocational education.
- Many secondary vocational programs will be in need of replacement equip-
ment in the near future. Council observations in a small number of schools
lead one to the opinion that some need replacement equipment now.
- Cost of individual secondary vocational programs vary greatly, while
program reimbursement has been made uniform, based on instructor salaries
and travel. A uniform financial accounting system is being developed
for local secondary schools, so that it may be possible to identify
total vocational program costs. The current uniform reimbursement, ac-
cording to selected secondary school superintendents, does not cover the
exceptional program costs.
- County-like administrative units could serve to pool limited school
resources and increase secondary student numbers, so that several
secondary schools, under one administrative head, could implement the
career education concept and broaden their vocational education offering.
- Some instructors teaching in useful home economics programs are re-
directing the instructional content toward wage earning occupations.

SECONDARY SCHOOL RECOMMENDATIONS
The Council Recommends:
1. The number of vocational programs available for secondary stu-
dents should be expanded greatly. Any expansion effort should be
keyed to labor market needs. Highest priorities should be given to
those school districts with the highest drop-out rates and districts
located in counties experiencing high youth unemployment.
2. Efforts toward cross curricular planning be expanded to provide
that academic 4.nstruction be oriented to the work world.
3. The follow-up effort of vocational technical program graduates
should be expanded to include a survey of student attitude about the
program and employer assessment of student performance. Considera-
tion should be given to relieving local school personnel from the
massive responsibility for conducting the follow-up. Possibly,
some centralized agency could complete the job more efficiently and
at less cost.
4. That an informational program be implemented for those involved
in education and other citizens in Iowa to inform them that career
education is not a new name for vocational education, but is a whole
new concept of education encompassing work orientation, job explora-
tion, and vocational education.
-107-
5. Local school administrators become members of area manpower
planning boards, and that labor market trends be reviewed at
meetings of Area Committees on Improvement of Education, so that
future local school program development may be based on labor
market needs.
6. That laboratory equipment needs be identified, so that future
appropriation requests can be supported with back-up information.
7. That the future vocational program reimbursement be based on
the exceptional cost of the program.
8. That re-assessment be made of selected categories for which
funds have been earmarked by Congress to determine whether there
is a continuing need for the earmarked funds.
9. That legislative action be taken to require the establishment
of 110 or less elementary-secondary school districts in Iowa,
so that the curricular offering can be made more comprehensive
and that impelmentation of the career education concept be made
mandatory in the legislation:

-108-
CHAPTER N,
CAREER EDUCATION EFFORT IN AREA SCHOOLS
State Plan Projections The majority of prorams offered at the post
secondary level are funded under two parts of the State Plan. Pro-
grams conducted under part B qualify for assistance and are referred to
as preparatory programs, while part G programs qualify for assistance
and are cooperative programs.
The State Plan projected that twenty-seven new occupational
programs would be implemented during 1972. These programs would in-
clude five in agriculture, one in distribution, seven in health occupa-
tions, two in technical occupations, five in office occupations, five
in trade and industrial occupations and one each for disadvantaged and
handicapped persons. (28-111-4) These new program developments will
be focused toward new and emerging occupations and these efforts will
be directed toward reducing the problem of youth unemployment and under-
employment. State education agency administrators reported that ',fur-
ther needed expansion was curtailed because of insufficient funds".
(28-111-5) The type of new and emerging occupations referred to in the
Plan were not identified.
Projected Enrollment - The State Plan establishes a goal for area schools
to serve 3.41 per cent of all youth in the state between the ages of six-
teen and twenty-four. (28-11-25) This means that 14,560 post secondary
age youth should be enrolled in post secondary vocational programs dur-
ing fiscal year 1972, compared to 13,584 enrolled during fiscal year 1971.
(7-43)

-109-
This amounts to nearly a seven per cent increase in enrollment over the
previous year. Student enrollment under Part B was projected to reach
14,364, while the enrollment under Part G (cooperative) was projected to
reach 191.
Comparative Information - The State Plan contains enrollment projections
for post secondary students based on the State population of persons
ranging in ages from sixteen through twenty-four. At present, the majority
of youth in the State between the ages of sixteen and eighteen are en-
rolled in secondary schools. According to the 1970 census, there were
308,982 persons between the ages of eighteen and twenty-four residing in
Iowa. (24-Table 19) The State Plan projects that 14,500 students will
be enrolled in area school vocational and technical programs during fiscal
year 1972. This amoun÷-s to 4.7 per cent of the population of the State
between the ages of eighteen and twenty-four. During 1972, the number of
secondary age students enrolled during the regular school year in area
school sponsored vocational and career orientation programs was approxi-
mately 242. (56) This number represents 1.6 per cent of the projected
area school enrollment during the fiscal year.
Graph 16 illustrates historical enrollment trends by area
school from fiscal year 1968 through fiscal year 1972 and, also, shows
predicted enrollments. The historical enrollment trends will be discussed
later. The projections were obtained from a report, entitled AN ENROLLMENT
PROJECTION STUDY, completed by the Midwest Research Institute under con-
tract with the Iowa Higher Education Facilities Commission, in 1971.
(15) The Reader will observe that MRI projected that in most community

20
19
1 178
16
1
-0
13
I-1
12
-0 0
11
010 9 8 7 6 3 2 1
Estimated Population
221,527 Career Ed.
mN -0 k -0 0 x
20 19
18
17161514
1312
11
1 0 9 8 7 6 5 4 3 2 1
68
69
70
71
72
73
74
(Fiscal Year)
Merged Area I
Estimated Population
81,437
..--"'''
..-
....---------
......*
., ..
.4.
College
-------------
------------6'
tio
Career Ed.
75 -7
6
68
69
70
71
72
73
74
75
76
(Fiscal Year)
Merged Area
III
GRAPH 16
2019
18
1716
1514
13
12
1110 9 8 7 6 5 4 3 2 1
2019
18
16
17
1514
13
12
1110 9 8 7 6
Estimated Population
136,629
College
Career Ed.
68
69
70
71
+at
7273
74
(Fiscal Year)
Merged Area
II
Estimated Population
71,145
3Career Ed,
2 1
75
76
68
69
70
71
72
73
74
75
76
(Fiscal Year)
Merged Arc
IV
ACTUAL AND PROjECILD ENIMILMENT TRENDS IN IOWA'S AREA COMMUNITY COLLEGES & AREA VC.-TEG1', ScHu01
(Page
1 of 4
)
Sec page 4 of 4 for
legend
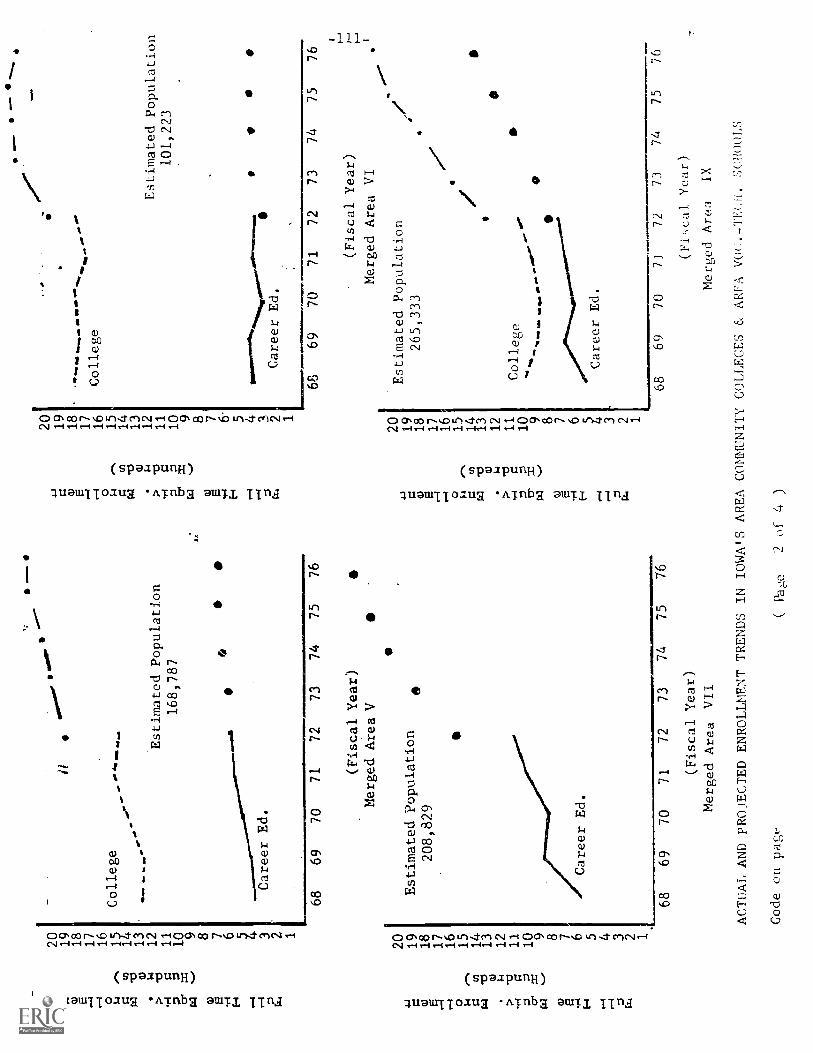
20
19
18
17
16
m13
1ii
-.
0...-......'
w ii
12
g11
=g10
......
9 8 7
College
.0*
,so
"'
Estimated Population
168,787
6 3Career Ed.
2'
1
68
69
70
71
72
73
74
(Fiscal Year)
Merged Area V
20 19
Estimated Population
18
208,829
1716
151413
12 1110 9 8 7 6 5 4 3 2
75
76
20 19
1817
16
1514
13
121110 9 8 7 6' 5 4 3 2 1
Om
mo
College
No
Estimated Population
101,223
Career Ed.
20
19
18 17
16 1514
13 12
1110 9 8 7 6 3 2 1
68
69
70
71
72
73
(Fiscal Year)
Merged Area VI
Estimated Population
265,333
7,
74
College
ti
a.. m
a ea
".
Career Ed.
0
75 0
76
68
69
70
71
72
73
74
7576
68
69
70
71
72
73
74
75
76
(Fiscal Year)
(Fiscal Year)
Merged Area VII
Merged Area
IX
ACTUAL AND PROJECTED ENROLLMENT TRENDS IN IOWA'S AREA COMMUNITY COLLEGES 6, AREA VOc.-TECH.
SCHOOLS
Code on page
l'aze
2 of
4 )

20
Estimates Population
19
1 17 16
..
lr
.'.°41
N14
12
.../..
13
College
'a
Career Ed.
2- c) =
11
=10
= .....-
9 8 7 6I
Z.
/1
331,098
3 2 1
68
69
70
71
72
73
74
75
76
(Fiscal Year)
Merged Area X
20
Estimated Population
19
180.566
18
17 1615
14
13
12
11 10 9 8 7 6 5 4
Career Ed.
2 1
0
0
a
68
69
70
71
72
73
74
75
76
(Fiscal Year)
Merged Area XII
2019
18
17
16 14
15
13
12
11
10 9 a 7 6 5 4 3 2 1
20
19 18
17 161514
13
12
1110 9 8 7 6 3 2 1
Estimated Population
547,797
68
69
70
71
A 72
73
74
75
76
(Fiscal Year)
Merged Area XI
Estimated Population
177,64s)
68
69
70
71
72
73
74
75
76
(Fiscal Ycar)
Merd Area X111
ACTUAL AND PROJECTED ENROLLMENT TRENDS IN IOWA'S AREA COMMUNITYCOLLEGES ei AREA Wc.-TITH. SCH00
(Page
3 of

$4 2
20 1918
17
16
1312
10
11 9 8 7 6 2 Ir 3 2 1
Estimated Population
73,059
''College
OM
.....
Sam
...
aCareer
Ed,*
68
69
70
71
72
73
74
75
76
(Fiscal Year)
Merged Area XIV
20
Estimated Population
19
18
133,055
17
161514
13
12
11 10
College
9 8 7 6 5 4 3*
2 1Career Ed.
68
69
70
71
72
73'
74
(Fiscal Year)
Merged Area XVI
75
76
20
19
Estimated Population
18
150,601
1716
15
13
14
1211
Career Ed.
10 9 8 7 6 5 4 3 2 1
College
----
68
69
70
71
72
73
74
75
76
(Fiscal Year)
Merged Area XV
ACTUAL ENROLLMENTS
from Department of Public Instruction Record:;
--- CAREER EDUCATION
----
COLLEGE PARALLEL,
Information from D.P.I.
PROJECTED ENROLLMENT
Information from M.R.I. Report
and Enrollment Projection Stmly
COLLEGE; PARALLEL
CAREER EDUCATION
Graph by Iowa Career Education Adviwr\
Council.
ACTUAL AND PROJECTED ENROLLMENT TRENDS IN IOWA'S AREA COMMUNITY COLLEGES & AREA VOC.-1ffil.
SCHOOLS
(Page 4 of 4
)

-114-
colleges enrollment differences between arts and science students and
vocational technical students would continue in the eleven community
colleges in the State. Area XI would experience a larger college trans-
fer enrollment than vocational-technical enrollment beginning in lq72. (15)
In all cases, it was projected that total cou.munity college enrollments
would increase, by institution through 1976. Attention should be called
to a comparison between actual enrollment in fiscal year 1972 and the pro-
jected enrollment in that year. In the case of area community colleges
II, III, V, VI, IX, XIV, and XV, the arts and science enrollments did
not reach the expected level. In five of the seven above area community
colleges, there appears to be a downward trend in college transfer enroll-
ments. The remaining four of the eleven area community colleges experi-
enced enrollment increases equal to or slightly greater than those pro-
jected by MRI. Those schools that exceeded the projected increase did
not do so to any significant degree.
The projection of enrollment in vocationeI-technical programs
offered by area schools (both area vocational schools and area community
colleges) on a state-wide basis generally shows a gradual increase in all
institutions except area schools I, VII, X, XI, and XII. It was projected
that these institutions would experience significant increases in their
vocational-technical enrollment. The actual enrollment in three of the
six institutions (I, VII, XI) did not materialize as expected in the 1971-
72 school year. Generally, the enrollment trends for vocational and
technical programs appear to be more accurate than those for the college
transfer programs. There is no evidence that tile.e ',:as a of ort ex-
pended in the MRI report to identify the effect of the establishent
occupationally oriented college transfer pro,141-az:s that would prepare in-
dividuals for employment after two years Of 50n(l,li Presently, data
is not available on the extent to which these prD'izrans exist and the nun -
her of students enrolled in them.
Late in 1969, Thomas Wolff Associates completed a study under
contract with the Iowa Higher Education Facilities Commission, entitled
A PROFILE OF IOWA COLLEGE AND HIGH SCHOOL STUDENTS. (25) The methodology
of the study included sending questionnaires to a broad sampling of high
school students, college students, and obtaining detailed information from
administrators of Iowa Regents Institutions, private colleges, and area
schools. Data was also collected from other sources. (25) While this
study is three years old at the time this report is being prepared, its
results identify some implications that may have intensified with the
time lapse. The study of post secondary enrollrnent plans of secondary
students revealed that about 21 per cent of the tenth, eleventh and
twelfth grade students,included in the study sample, plan to pursue study
in a vocational and technical program at the pOSt secondary level. Eight
per cent plan to learn skills and technical knowledge at an area school,
while 13 per cent plan to study at private vocational technical schools.
(25-2)
In accounting for this comparatively large group who plan to
attend privately-operated business or trade schools, the fact that such

per cent
consideraLio.
tronics and oter
of interest..
Wit",
per cent of the !
studies, while c7-11-;
oenL) Ls
note tl-;:i71 5:
o fc,._r years of liberal
pet eerlt type cf college pro-
gram. The actual extent to -;i_uth2I-,t5 complete a four-year
college degree is much ilier. Tbomas Woi 1. reports that only 28 per cent
of Iowa high school students earn a Bachelor's Degree. (25-3)
Students interests in fields of study lean toward the fields in
which they have had L.he greatest exposure. ?wenty-nine per cent of the
college students major in the natural sciences, while 41 per cent major
in the social sciences. This is verified by statements students have made
during Council fie d visits, Two typical statements on uhis subject are:
Many teachers are still limiting their career suggestionstoward the field of teaching. The students recognizedthat most teachers have a limited background about theworld of work, because of their heavy emphasis on academicsubjects in college. (34)
Many guidance counselors are assigned quantities of menialwork, such as checking attendance, handling disciplineproblems, and the like, instead of providing time and hold-ing the counselor responsible for assisting teachers withthe dissemination of occupational information, while pro-viding instruction in the basic skills. (34)
There appears to be a trend in which future generations of youth
may not be as inclined toward seeking a bachelor degree as has been true
of past generations. A recent article in the Des Moines Tribune stated
that:-
"Sixty-three per cent of the voun4sters think it is wiserto step into a Well-paying job around the corner than o
chasing a pot of gold that r7ay never materialize. Fifty-five per cent believe that industrial pension plans, paidvacations, health insurance and various other benefits of-fered in the 7,-ore common, everyday jobs make looking forsomething adventurously silly".
The full text of the article may be found in Exhibit 1.
Another factor to be considered when making projections for en-
rollment and program expansion is the birth rte of the state. In April
of 1972, the Planning Department of Kirkwood Community College in Cedar
Rapids released the results of an enrollment projection, based on live
births. This projection predicted a decline of enrollments in institu-
tions of higher education in the State, because of a reduction in the
birth rate. The reduction in birth rate was attributed to the Pill. Re-
cently, radio and television stations have been airing public service an-
nouncements encouraging family planning. This may also be a contributing
factor to reduction of the birth rate in Iowa. The Kirkwood projections
may be found in Graph 17.
While a declining birth rate may cause area school administra-
tors some concern, studies (reports by MRI, and Thomas Wolff Associates)
and public attitude indicate that students are exhibiting increasing in-
terest in pursuing their post secondary education in area schools. The
magnitude of this interest, however, does not appear to be as great as
projected by Midwest Research Institute. Students' statements to Council
members and the results of a study by Youth Research Institute, (Exhibit
1) as reported in the Des Moines Tribune, indicate that Iowa may be

777..,..v TEEN VIEW
Jungsters Looz(By Lester Rand
cioh.t
to be scc :-;c1trr. craft bile \valti:--.;z :or athr big 1.at.
zry "-,,- r S
. . .reason dna: if they haven't arta \ ed or firibcd
con-side-ain't, promise by the time they're IS or IT :hey mightas well for more conventional life style-
peet?Ic ritarry early and "MC:: sec.Jr a begoLi-li'2 i -, 1)0.1WouH aQ..to:- models. singers, artists...kr:ter-. i-eld athletes.
tine a young man or woma.i has :c.,:gcd four yearsm,,, hngli,..r !earning they're read:, In :-.-tep trit,, a lecure,
welpp,;;.iig job. Diplomas don't Mean tan mach in the glamor-ous fields, where specific types and styles are generally sought.
Teens pointed out that leaving home is a costly propositionthese days. They noted that one had to have. a substantialbankroll to cope with the high cost of living while looking for ajob in front of a camera, on the stage or in a large advertisingagency.
Meanwhile, boys aren't overly enthusiastic about followingin the footsteps of professional athletes who have struck gold.
1 7
Security, Not Glamour.
.....2 :%.1..
:
:AC
k'.
roar: 7:1
*.
Opportunities in industry, educatun. medicine_ tecnnoitt.etc., are the primary deterrents to reaching for a star. Andthe recession has hit glamour employment particularlc h3rd.
Sixty-three per cent of tne youngsters think it is wiserstep into a well-paying job around the corner than chasea pot of gold that may never materialize. Fifty -live leer centbelieve that industrial pension plans, paid vacatv,lis. healthinsurance and various other benefits offered in the morecommon, everyday jobs make looking for something adventur-ous silly.
STATE TOURNAMENT VISITORS COMMENTTODAY'S QUESTION: IS A GLAMOUR JOB YOUR GOAL, OR IS PRACTICAL SECURITY YOUR AIM?
Ronnie Hokinson, 14, Barn-um "1 am not interested ina glamour job, because I
don't like being in front ofgroups of people. I wouldrather be in competition, insports or some kind of mo-torcycle racing, but I'll prob-ably be a farmer. I'd like tobe a farmer. I was raised ona farm and I like drivingthings like tractors, butdon't like to do chores. I likebeing outdoors. I wouldn'tlike living in a big or littlecity because there is no roomto mess around."
Peg Strum, 18, Roland"Practical security is theonly thing that has enteredmy mind. All I have everthought about. is getting agood .paying job to live on.Glamour jobs might be morefun, but if you find somethingworthwhile and good payingthere's no need for having ajob that satisfies the ego fora little while. To me, a glam-our job is a flakey movie starbatting her eyebrows. It alsodoesn't have a steady in-come. There's ,no worry hi asecure job."
Ines Burriola, 19, DesMoines "For myself, Idon't really feel I need aglamour job. Any job wouldbe fine as long as I could
support myself. And if I hada family, I would like a jobthat would pay enough sothat I could support them. Idon't think that a glamourjob is really the best idea toassure a secure future as faras I as concerned."
A.
Annette Lenz, 19, Manson"I think I would rather
have a regular job, I supposebecause I like simple thingsand a slower moving life. Iw: aid like to have a ranch orfarm with animals becausetoo many people just goaround hurting animals andnot thinking that it matters.but it really does much morethan they can even know. An-imals never hurt you unlessthey have a reason andpeople always do. This wouldhe secure because people willalways need animals eventhough they may not knowit."
65,000
112,000
456,000
20,000
45000
40,000
Pesic of 412.123
Born in 1251
Al. 18 in 1982
War
Babies
Sem
IOWANS Age 18 Based
cm Projected Live Births(Exc-qptinq ,7-atton
Prepared by Kirkwood Corrfronity College
Plennini Department 4-72
28% Dropin Births1961-1971 /
Current 45,407
60r/4 in 1971
Age 111 in 1998
Actual tram /owe Ste* Heidtfi Doormen
4
Propelled Low 21,000
nom 1n 1974
Ago 18 in 1997
Drop of 352 from peek
Projection /MC Planning Not
1948 1958 1968 1978 1988
GRAPH 17
1998 2008 20181
Taken from the Des Moines Register
Dated 5/21/72

";,'""'
entering an era in which selected community collees in the state wi
to place greater emphasis upon vocational and technical education,
need
orde:
to meet the needs of the students the institution ',:as desioef
As reported earlier, in the State Plan overview, State indin;
of vocational and technical programs has remained alnost static sincA? no
passage of the arEa school bill in 1965. This trend IT21: inhibit impiemen-
tation of programs designed to meet the needs of youth and adults in the
state. Currently, some legislators and state administrators are discussing
the possibility of making appropriations with accountability for perform-
ance included as part of the legislation. In order for such legislation
to be written, it will be necessary to have accurate planning data on
labor market needs and student interests. The data yielded by the Career
Education Need information System Project should provide a valuable assist
to area school administrators for planning new programs and adjusting others.
Hopefully, future State Plans will identify, in detail, types of
programs which should be established to meet labor market needs and student
interests, instead of referring to "new and emerging occupations".

-121-
POST SECONDARY STATE-WIDE EFFORT
Enrollment Reporting Systens - Currently, the Department of Public ln-
struction cci.ects enrolinent data from area schools in tw., different
fonts, to satisfy tl-,e needs of the . S. Office of Education and to use
as a basis for reimbursing the area schools from the general aid fund.
Graph 18 illustrates enrollments as reported to the U. S. Office
of Education. This count of students represents the total number of stu-
dents enrolled in vocational and technical programs during each fiscal
year extending from July 1 through June 30. As explained in the second-
ary school portion of this report, if student A completes his training
in a program in September and student B enrolls in the same program in
October, the student enrollment count would be two. This method of re-
porting has the advantage of showing the number of residents in the state
who were served in any given year. It has the disadvantage of duplicate
reporting of training stations filled in the program when the length is
greater than one year. A further discussion of the implications of the
enrollment trends will appear later.
Area schools report their enrollments quarterly to the Area
Schools Division of the Department of Public Instruction. These reports
ref"....ect the unduplicated count of the number of training stations filled
in vocational and technical education programs during the year, based .on
full-time equivalent enrollment. If student A leaves a program during a
given quarter and is replaced by student B, the enrollment count is one.
SO 00
5001
A1000
115b0
3000
a SOO
*co
1 5'00
/ 0 00
S00
TOTAL ENRGLLMENT
5,234 6,662 11,107*
T & I
HealthTech
Off. Ed.
Ag.Dist.Ed.ome Esc .
*See narrative explanation of enrcliment growth
8 49 PO
GRAPH 187/
STUDENT ENROLLMENTS IN POST SECONDARY VOCATIONAL-TECHNICAL PROGRAMS
Source - Annual Reports for Career Education - FY 68, 69, 70, 71
Graph by Iowa Career Education Advisory Council

-123-
Table 3 reports the grand total student enrollment in the fall term of
1971, while Graph 19 identifies enrollment trends during the fall term
for the last four school years. A review of these charts will follow:
Enrollment Trends - Area school enrollments, as illustrated
in Graph 18, are increasing the vocational fields of health occupations,
office education, distributive education and home economics during school
year 1970-71. Enrollment in technical occupations and agriculture have
plateaued while the enrollment in trade and industrial occupations has
declined slightly.
The reader should be aware that the enrollment growth between
fiscal year 1969 and 1970 was not as great as Graph 18 would indicate.
The deviation is due to a change in the student accounting system. Dur-
ing fiscal year 1969, and prior years, the enrollment count was based on
the number of training stations filled throughout the majority of the
year by a single student. From fiscal year 1970 through the present,
the enrollment count is based on the number of persons that have been en-
rolled in the training program during the year, regardless of whether the
student was enrolled during the entire year.
A more reliable measure of state-wide enrollment trends would
be the fall term enrollments in area schools. Graph 19 shows that the
vocational and technical enrollments in area schools have grown from 5,939
in the 1968-69 school year to 9,134 in the 1971-72 school year.
Specific area school enrollments present a divergent picture,
when compared to state-wide statistics. The reader should refer to a
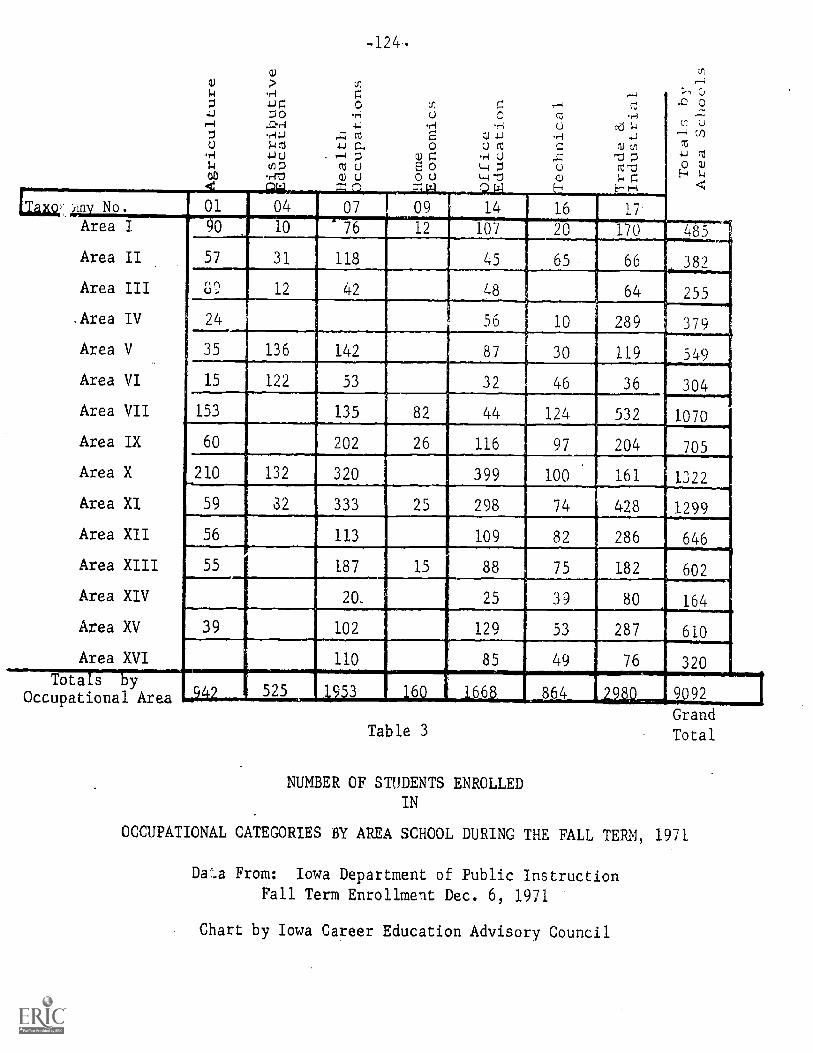
-124-
1-i .r v;G
G.0
4.)0
0 v;0
00
,--;m
,--I .0-1-1 4.-J .ri .rt U0 .,-14-i ,-G cd E
o:1) 4J0 M
f-iG0 WI .44 04
mp (13 U E 0 ,,-i 1/43
40 .40 41U 0U L1-1-0 CJ
Area II
Area III
Area IV
Area V
Area VI
Area VII
Area IX
Area X
Area XI
Area XII
Area XIII
Area XIV
Area XV
Area XVI
Tota s yOccupational Area
64
289
119
36
532
Table 3Grand
Total
NUMBER OF STUDENTS ENROLLEDIN
OCCUPATIONAL CATEGORIES BY AREA SCHOOL DURING THE FALL TERM, 1971
Da'..a From: Iowa Department of Public Instruction
Fall Term Enrollment Dec. 6, 1971
Chart by Iowa Career Education Advisory Council
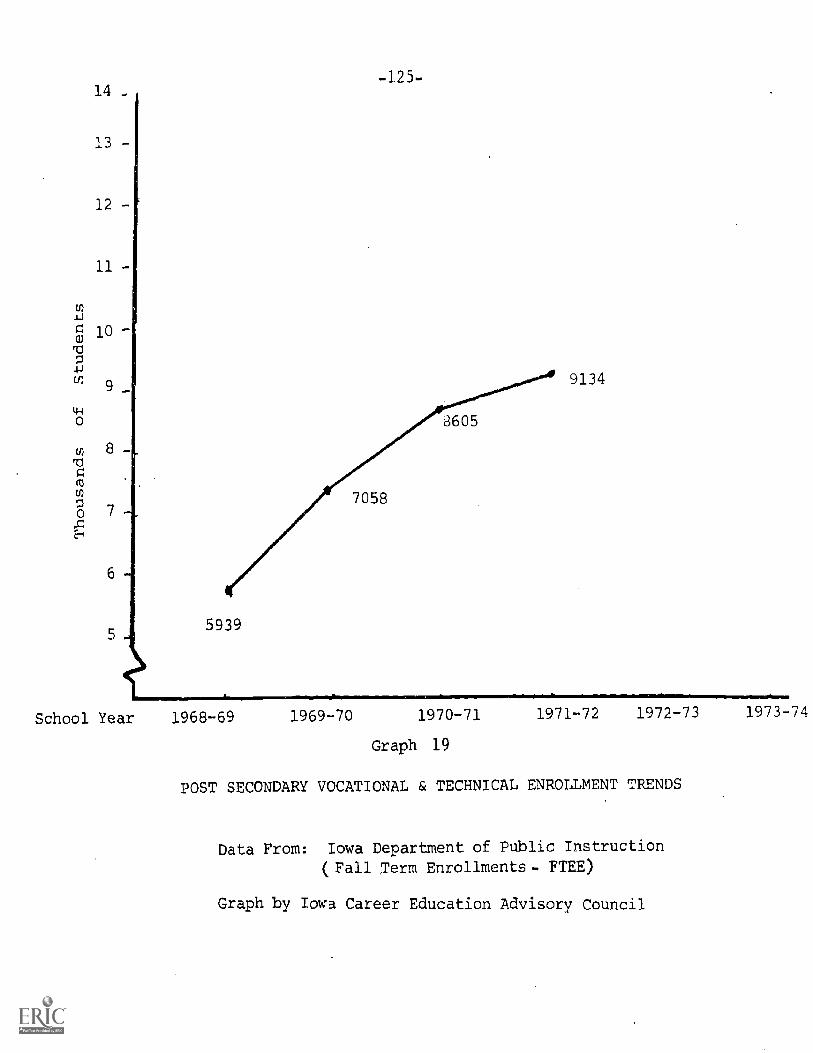
School Year 1968-69 1969-70 1970-71
Graph 19
1971-72 1972-73
POST SECONDARY VOCATIONAL & TECHNICAL ENROLLMENT TRENDS
Data From: Iowa Department of Public Instruction
(Fall Term Enrollments- FTEE)
Graph by Iowa Career Education Advisory Council
1973-74
-L26-
. series of graphs contained in Graph 16, pages 1 through 4. Merged Areas
II, III, V, VI, IX, XI, XIII, XIV, XV, and XVI, all assumed responsibility
for operation of one or more existing long-established junior colleges.
In the case of merged areas IX, XI, XIII, XIV, and XV, the enrollments in
vocational-technical programs are approaching a point where the number is
nearly equal or slightly exceeds the enrollment in the arts and science
college transfer program. The enrollment difference between areas II,
III, V, VI', and XVI have essentially stayed the same in the five fiscal
year period from 1968 through 1972. Area X functions as a community col-
lege, however, the college transfer program was implemented after the
area school was organized and the comparative enrollment growth between
arts and science students and vocational-technical students has been
nearly equal. These selected area community colleges are enrolling more
students in vocational-technical programs than they did as junior col-
leges, however, in five of these schools, significantly larger numbers
of students are enrolled in arts and science programs than in vocational
and technical programs. Area schools I, IV, VII, and XII function as
vocational- technical schools and their entire student body is enrolled in
this type of program.
Representative Edith Green of Oregon, who was one of the de-
signers of the recently passed Public Law 92-318, Amendment to the Higher
Education Act of 1965, recently state that the "...national mania (for
college degrees) may produce the most scholarly unemployment line in the
world". She further reports that, "...a Labor Department study...con-
cludes that less than 20 per cent of the jobs in the next ten years will

-127-
require four years of college education.?? Finally, she states that "Higher
education has been way over-emphasized. The greater needs now appear to be
in vocational and technical training...at community colleges and the like".
The full report of her comments may be found in Exhibit 2. By reviewing
the portion of this report pertaining to Guidance and Counseling, one will
observe that, based on reports of fiscal year 1971, area schools should
improve their efforts at following-up their arts and science students. It
becomes apparent that, without viable student follow-up information on all
students, area school administrators will not have the management informa-
tion necessary to effectively implement Public Law 92-318.
Table 3 identifies the area school enrollments during the fall
term of 1971 by seven program clusters and by area school. It should be
observed that the largest enrollments in area schools occur in the occupa-
tional fields of health occupations, office education, and trade and in-
dustrial education. Smaller enrollments are evident in technical educa-
tion, distributive education, and agriculture education. The smallest
enrollment occurs in home economics-related occupations. When comparing
these enrollments with projected labor demands, as identified in Graph 3,
Chapter II, one may conclude that program expansion should be placed in
the office education and health occupations areas. There is apparently
great need for workers prepared to work in clerical and kindred jobs. By
referring to Graph 1, Chapter II, one finds that,irregardless of the ap-
parently large output of office education workers by area and local schools,
the state is meeting only 15 per cent of the projected need.

0
y
!el
-128-
Rakes 'National Mania'For College Degrees
By Bill Robertson*JD 1972 Newhouse News Service
WASHINGTON, D.C. One ofthe architects of the 'U.S. sys-tem of higher education, Repre-sentative Edith Green (Dem.,Ore.), now thinks the "nationalmania" for college degreesmay produce "the most schol-arly unemployment line in theworld."
In several respects, she sug-gests, the nation's higher edu-cation system is "out of con-trol." What's more, recent con-gressional actions will makematters worse before they im-prove, she believes.
The higher education system,she says, has assumed "degreemill" proportions, and degreesare not producing desired re-sults.
"We have all been reading inrecent months of the numerousPhD's swelling the unemploy-ment ranks," Mrs. Green saidrecently.
Vocational Training"I suggest that it is well past
time we re-examine the nationalmania for bachelors and mas-ters and doctoral degrees.
"It is my guess that millionsof young people in college noware not there because they gen-uinely want to be, but becausethey and their parents have, in
good faith, accepted the dictumthat there is more prestige andgreater economic benefits forcollege graduates than non-col-lege graduates."
Mrs. Green cites a LaborDepartment study which con -cludes that less than 20 percent of the jobs in the next 10years will require four yearsof college education. The re-mainder can be filled by highschool graduates and post-graduates with vocational ortechnical training."It is my belief," she adds,
"that if we, as a nation, persistin downgrading vocational andtechnical training and, at thesame time, continue this slav-ish bondage to academic de-grees, we may end up with themost scholarly unemploymentlines in the world, filled by un-happy men and women who,had they but known the truth,would have originally chosenvocations in which they wouldnow find themselves happilyemployed."
OverextendedThe alleged "degree mill" na-
ture of colleges and universitiesapparently is something thathas developed in the last dec-ade, when the number of col-lege graduates in the labor
force increased a:)eut iuper cent.
Ironically. the increasebe attributed, in part, to the ettorts of Mrs. Grecnchairman of the House SpecialSubcommittee on Education,has been one of higher educa-tion's most successful advo-cates in Congress for ve-irs
Yet, in coming weeks, Mrs.Green intends to go beforet h e House AppropriationsCommittee and try to dis-courage federal spending fora variety of major, new high-er education programs."I think it is clear now," she
explains, "that we have over-extended ourselves badly . . iiiterms of finances, the promiseswe make, and the results weget."
"The harsh truth i- theresimply are not jobs for theyoung people we are runningthrough the degree mill," sheasserts.
"Higher education has beenw a y overemphasized. Thegreater needs now appear tobe in vocational and technicaltraining . . . at communitycolleges and the like."To change educatieli's em-
phasis, Airs. Greed adds, '
require some careful fiscal bal-;ancing. Higher education can-,
I 3
IWO
Exhibit 2
not be totally dropped from thefederal assistance scheme.
"It is not in the best interestsof the country to turn the I fi-
; nancial) faucet off entirely,'i she says. "But I am very much.I opposed to expanding schoolsfurther at the moment."
It was estimated that the private secretarial schools in the
state enroll approximately 2,500 students annually. (44) Both private
and public training programs at the post secondary level have in train-
ing approximately 4,200 persons each year. Total secondary school effort
is not readily identifiable when also considering non-reimbursed programs.
Considering the potential output of both public and private schools at the
post secondary Level, it appears that those sources are training approxi-
mately one-half of the number of workers needed annually, as predicted in
Graph 3, Chapter II.
Large numbers of health occupations job classifications may be
found in the broad categories of service workers and professional techni-
cal and kindred workers. Graph 1, Chapter 11, however, shows that training
output, compared to state-wide need for workers in this classification, is
projected to be 50 per cent for the year under review. This output ranks
second for all occupational groups offered in the state. It should be
noted that all reimbursed vocational health occupations training in Iowa,
for occupations requiring less than a B.A. be gree, is conducted in area
schools at the post secondary level.
Large efforts are being expended by area schools in preparing
persons for employment in trade and industrial occupations. Job classifi-
cations for workers in this occupational grouping may be found in the De-
partment of Labor Classifications of Service Workers and Craftsmen and
Kindred Workers. When comparing the projected output with state-wide
needs, (Graph 1), it is observed that approximately 30 per cent of the

-130-
need is projected to be reached.
The preparation of agricultural workers by area schools has been
growing in recent years. Many of these occupational programs prepare per-
sons for employment in off-farm agricultural occupations. According to
the 1972 State Plan for Career Education, the projected training output
amounted to only 24 per cent of the need, even though Graph 2, Chapter II,
shows there will be a reduction of need for farm workers. Many agriculture-
related employment opportunities are being included in all other job
clusters identified by the U. S. Department of Labor.
Training effort in technical education, as reflected by the number
of students enrolled, ranks fifth of all occupational groupings in the state.
According to State Plan projections, the output of potential workers, com-
pared to employment needs, is the greatest of seven occupational groupings
at 73 per cent. In recent years, numerous national professional journals
have predicted that there will be increasing need for technical workers.
Iowa, according to State Plan projections, may not be experiencing the same
need that is reported to be evident at the national level for technicians.
The enrollment of persons in distributive occupations ranks
number six of seven occupational groupings. This effort, by area schools,
appears to be in balance percentage-wise with total occupational output
from the area schools in seven occupational categories, when compared with
projected labor market needs found on Graph 2.
The first quarter enrollments reported by the Area School Branch
of the Department of Public Instruction are 529 greater than the previous
year. As pointed out earlier, the Area School Branch enrollments are
-131-
counted differently than the enrollments projected in the State Plan for
Career Education, and as reported to the U. S. Office of Education in the
Annual Report. Through the process of interpolation, by comparing the
area schools enrollments and the U. S. Office of Education reported en-
rollments for fiscal year 1971 with the area school enrollment for fiscal
year 1971 and fiscal year 1972, it appears that the interpolated U. S.
-Office of Education enrollment for fiscal year 1972 should fall slightly
short of the enrollment projected in the State Plan. At the time this
report is being prepared, it was projected that the data for the annual
report to the U. S. Office of Education would not be tabulated for another
two months. For this reason, comparable figures were not available.
Programatic Offerinz - During the 1971-72 school year, eleven
area schools operated as area community colleges and four as area voca-
tional-technical schools on twenty-five campuses across the state. The
number of reimbursed and non-reimbursed, State Board approved,%ocational-
technical programs offered by individual area schools ranged from a low
of ten programs to a high of thirty-six programs.
Graph 20 shows that five area schools offered thirteen or fewer
approved full-time preparatory vocational-technical programs, while four
area schools offered twenty-eight or more vocational programs. Six area
schools offered between nineteen and twenty-three vocational-technical
programs. Those schools offering the fewest number of vocational-technical
programs have smaller populations to serve. Those schools with the largest
offering are generally schools with the largest populations. The Area VII

40 25 20 15 10
23
21 A
VE
RA
GE
10
1919
13
32
21
34
28
II
III
IV
VVI
VII
IX
XXI
XII
MERGED AREAS
21
XIII
21
XI
XVI
Number of Fulltime Preparatory Vocational & Technical Programs Offered by Area Schools During
1972
Source - Fall term Enrollment for Area Schools 1971-72 School Year, Department
of Public Instruction
(FUNDED & UNFUNDED)
Grapl,
Iowa Career Education Advisor
Council
Graph 20

-133-
school provides the citizens, within its area,one of the largest numbers
of vocational-technical offerings and yet has a smaller population base
than two other merged area schools that have a smaller program off:eriu,]..
Some area community college administrators are becoming in-
creasingly concerned about the need for their institution to provide
greater vocational and technical opportunities for the population they
are responsible for serving. Those community college administrators
in schools that assumed responsibility for the operation of one or more
former junior college needed several years to reorient their operation.
There were numerous other reasons for lack of effort directed toward im-
plementing new vocational-technical programs in some community colleges.
During this same period of time, area schools that did not assume re-
sponsibility for operating former junior colleges implemented large numbers
of vocational and technical programs.
It is recognized that student interests and abilities vary con-
siderably and, therefore, it seems appropriate that each area school should
provide as broad an offering of programs as possible to serve the needs
of students in their merged area. It is apparent that each area school
could not, offer one of each of the programs located elsewhere in the state
and that opportunities must remain open for any student in the state to
attend any area school. Some students will find it impractical to attend
an area school located in another area of the state and, therefore, it
seems appropriate to review the breadth of offering of vocational-technical
programs in each area school. Primary priority should be given for the use

-134-
of funds forthcoming from Public Law 92-318 for the establishment of
vocational-technical programs in area schools with limited offerings.
Second priority should be given to expansion of vocational-technical of-
ferings in schools having numerous programs and third priority should be
given to further expansion of arts and science programs.
The following analysis will be devoted to full-time preparatory
programs contained in the seven occupational groupings identified in
Table 3. It is recognized that area schools have operated special needs
programs, however, because of limited Council staff time, these programs
will be reviewed in a future Annual Report by the Council. The adult
education effort of area and local schools will also be reviewed in a
future Report by the Council.
Program Voids - A review of Graph 21 illustrates the number
of occupational programs, according to seven categories listed in the
State Plan for Career Education, offered by each area school and for the
whole state.
Three area schools offer programs in four of the seven occupa-
tional groups. The actual number of programs offered ranges from nineteen
in one school to thirteen in another school and eleven in the third. All
three of these schools offer no programs in distribution or home economics.
One school, also, offers no health occupations programs. Two of the three
schools offer no programs in the field of agriculture.
It appears that the three area schoo)s with comparatively limited
breadth in their offering (seven occupational clusters) should seriously

2019
18
117
t
z )4
16
-c)
.r4
claz
1
Qs
4.1 m
13
-0 -0
12
ai o
44f-
-1
11
H10 9 8 7 6 3 2 1
/01
04
07
09
14
16
17
(Taxonomy Code)
_Merged Area I
LA E s_ L cn o s-
aL 4- o s_ o 12 = 2:
20
19
18 17
1615 14
13 12
1110 9 8 7 6 5 4 3 2 1
20
20
19
19,
18
18
17
7
16
11
6
1514
13 12 11 10
010
99
8v
8
1514
13
1211
7 6 5 4 3 2
7 6 3
04
07
09
14
16
'17
(Taxonomy Code)
Merged Area II
2 1
01
007
14
16
17
01
04
07
09
14
16
17
(Taxonomy Code)
(Tax)nomy Code)
Merged Area III
Merced Area IV
Data from:
Fall Term Enrollments, 1971,
Graph 21
Graph by
Career ETI-dti:,n Advi5cr
Department of Public instruction
Council.
PPOGRArq OFFERED BY AREA SCHOOLS IN SEVEN OCCUPATIONAL CATEC,CP)E3
(Page 1 of 4
)

Number
of
Fftigrams
1-04
h
(Jkj)00I-
0.
W.P
LA
ONWp
C)
Oi
Cr
nr-
00n
Ia)t-
1-/--1
ca)
lO
tTiiX
CL;.20 (D=
ha0
n
DE
CM
ca,0-4
>
cc-1
.
cr,
ca.(4
.
Number
of
Programs
1-4-
+
1-Go
%0C
D
1-+
CA
.-4
Coq,
O
Number
of
Programs
N
s-NWPio
OvI
03.0
01-'N004D
O
Agriculture
Distributive
Education
Health
Occupations
Home
Economics
Office
Occupations
Technical
Education
Trade
and
Industrial
Number
of
Programs
i-+o+
i-+
NU
.).p
.ln
--J
000C;)NVI
0%C0
2019
18
1716
1 13 12
11
10 9 8 7 6 3 2 1
20 19
18
17 16
15 14
13
121110 9 a 7 6 5 4 3 2 1
Cl, 0 0 a) 0
01
04
07
09
14
16
(Taxonomy Code
Merged Area X
17
01
04
07
09
14
16
17
(Taxonomy Code)
Merged Area XII
20,
19
18
17 1615
1314
12
1110 9 8 7 6 5 4 3 2 1
20 19
18
1716
1514
13
12 1110 9 8 7 6 3 2 1
01
04
07
09
14
16
17
(Taxonomy Code)
Merged Area XI
01
04
07
09
14
16
17
(Taxonomy Code)
Merged Area XIII
Graph by Iowa Career Edueatiol Advisory
Council
PROGRAMS OTTEREf
BY AREA SCHOOLS IN SEVEN OCCUPATIONAL CATEGORIES
( Page
3 of 4 )
I--1
O02.
;
Number
of
Programs
W
P-U
ICN
JCID
001-
.1\>
WP
-koC
n-40
D1/
4°0
0
Number
of
Programs
I-I
N-14.4
4-4.
n
C`-
4
Co
%CIO
i-
Ns)
LA)
Pst
il
CrN
CO
%DO
=C
o-, m0
-5W
COX
m0O
o<
.<
rD
(--)0
<fD
O
Number
of
Area
Schools
that
have
Programs
)--,N)W_pia03.4,01W.p-03\00
CD
Agriculture
Distributive
Education
Health
Occupations
Home
Economics
Office
Occupations
Technical
Education
Trade
and
Industrial
Number
of
Programs
1-.Nw.p-t
ok.001.--Lr.)W.P,AJION-400,1D0
-13q-
study employment opportunities and student interests in the fields for
which voids exist in their institutions. identification of 1_IFicient
needs for programs of this type should precipitate priority i;:lplener-,E Lion
of such programs.
Placement records from post secondary home economics-related
programs are reviewed earlier in this report. The reader may wish to
refer to Graph 11, Chapter IV, to review the placement record of these
programs. Consideration should be given to approving home economics-re-
lated wage-earning programs that have built in safeguards which will
assure the student reasonable opportunities for employment after comple-
tion of these programs.
The "State Total Graph" of Graph 21, Chapter V, shows that the
majority of area schools offer programs in five of the seven occupational
clusters.
New Programs in Fiscal Year 1972 - Mention was made earlier
that the State Plan did not identify, specifically, new programs that
would be offered in fiscal year 1972, however, the implementation of the
labor market needs portion of the CENIS Project, plus the federal develop-
ment of State Plan guidelines that call for the use of measurable ob-
jectives, should rectify this problem in the future. The State Plan did
project the implementation of twenty-seven new programs which included:
5 agriculture occupations
7 health occupations
5 office occupations
1 program for the disadvantaged

1 distribution occupations
2 technical occupations
5 trade and industrial occupations
1 program for the handicapped
According to a publication by ',Ilia 1JWil Department of Public
Instruction, forty-two new programs were operaced for the first time in
the 1971-72 school year. (56) These programs included:
13 programs in agriculture (including nineveteran farm programs offered on a part-tirs. basis).
2 programs in distribution
1 program in technical occupations
12 programs in T & I occupations
3 programs in health occupations
5 programs in offics occupations
3 programs in home economics occupations
1 program in pre-career for high school students
1 program for the disadvantaged and handicapped
A discussion of area school efforts directed to serve the needs of secondary
school students may be found in the secondary school portion of this report.
Future Planning - The Council sent the area school superintendents
a questionnaire in an effort to gain their opinion on a number of items re-
lating to career and vocational education. Fourteen of the fifteen area
school superintendents returned a completed questionnaire for a response of
93 per cent. Item 33 in the questionnaire attempted to identify future

plans oy area ',
responses recevca
small numLer 50 per cenTL.
r,J.aclor V1L
tr.e
lists
intendents t.o rever.il -2uture .:,Dr SLItUS
ConsiderinLs .11-t7t reD,,,r7,2d
were pannir4- cr,e progn.m Iened Lo
entry level of
respec'L pro,;ras c,osined Lc, pr(J-
spective student o the world of work, it .,Jas ,,_Iperted in Lne surv,,,y that
there currently are fou-!:-te.an programs EuacA:ioning in scare of the fourteer
responding area 5C!,-iC01:; Lc) ?roviie crint_dtion and/or work exploration in
occupational clusters. The majority of area school administrators re-
sponding indicated that exploratory areas were available in the following
areas: office occupations, agriculture-business, natural resources, and
health occupations. A moderate amount -of administrators reported offering
exploratory areas in marketing and distribution, conmunication media, health
occupations, and manufacturing. Very few indicated exploratory courses
are being offered in the following areas: personal service, construction,
and transportation. In addition, the Council is awarethat six area
schools presently provide learning centers that focus on removing academic
deficiencies of persons. The basic skills instruction offered in these
centers help remove individual deficiencies, so that persons will be able
to pass the General Education Development Test and qualify for a high school
equivalency certificate. Other types of human services are often available.

QuestionnairePage -7-
-142-
COUNCIL QUESTIONNAIRE ITEM #33
33. In the chart below, please indicate: (1) The number of programs
you are offering in each of the following areas; (2) The number
of new programs you are planning in each of the following areas
in the next three years, and (3) The number of programs you plan
to discontinue in the next three years.
DISTRIBUTIVE ED.1. Present Programs2. New Programs3. Discontinue
OFFICE EDUCATION1. Present Programs2. New Programs3. Discontinue
AGRICULTURE1. Present Programs2. New Programs3. Discontinue
HOME ECONOMICS1. Present Program s2. New Programs3. Discontinue
TRADE AND INDUSTRY1. Present Programs2. New Programs3. Discontinue
HEALTH1. Present Programs2. New Programs3. Discontinue
SERVICE1. Present Programs2. New Programs3. Discontinue
Orien-tationto theWorldof Work
workExplo-ration
Ent. 7 Semi- Tech- Profes-
Level Skilled Skilled nical sional
7 1 3
6 1
4 1 1 1 10
--3,
1Q
2 2
3
6
El
10
1 2 2 2 2
_
4-
4-0 1118
1 2 3 6 2
2
D12
li I
1
1 1
OTHERS (Specify Below) Table 4
PROGRAM EXPANSION PLANS PROJECTED BY AREA SCHOOL ADMINISTRATORS
0 Number of Schools Responding
Chart by Iowa Career Education Advisory Council
-143-
This latter group of schools are beginning to .rove the focus of their
learning centers to include career orientation and exploration. The
majority of the fourteen instructional offerings are funded under the
special needs portion of Public Law 90-576. While the operation of the
centers is designed to first meet the needs of the disadvantaged and
handicapped, many of the area schools are also making the facilities and
services of these centers available to those without disabilities who need
occupational orientation and exploration. Three area schools do not pro-
vide a career orientation and exploration, or basic academic skills in-
struction center.
One area school reported that they planned to begin work explora-
tion programs in office education, while a second area school reported
that they would begin an exploration program that would include the occu-
pation groups of distribution, office, agriculture and health. One of the
two schools was already offering work exploration in trade and industrial
occupations. Council field observations reveal that many secondary
students do not have sufficient information about the world of work and,
therefore, some fine it difficult to make wise job choices. It would be
advantageous for all area schools to make available, to prospective students,
a work orientation and exploration program or center to assist those stu-
dents who are doUbtful about future careers in making informed choices.
When the career education concept is universally implemented in the ele-
mentary and secondary schools in the state, the need for the area school
orientation and exploration centers may no longer exist.

-144-
Approximately 50 per cent of the area schools reported that, in
the next three years, it should be expected that thirty-six new vocational
education programs should be started. Included in this number should be
nine programs to provide persons with skills to be employed in skilled
occupations, twenty-two programs in technical occupations, and five pro-
grams in professional occupations. Assuming that the responses of approx-
imately fifty per cent of the schools are a reasonably accurate predictor
of efforts of all area schools, it appears that heavy emphasis on future
program development will i)e on the technical fields. The greatest ex-
pansion of technical level programs should occur in the occupatJ_onal cater
gories of distribution and trade and industrial occupations. Lesser numbers
of programs will be started in the occupational categories of office and
clerical, agriculture, health and service occupations. Reference should
be made to Graph 1, Chapter II. This Graph compares projected training
output with stated labor market needs found in the State Plan for Career
Education. The reader will observe that the greatest output, compared to
need, occurs in technical education. Recognition is given to the possi-
bility that State Plan labor market need data may not be valid. If the
completion of the labor market needs portion of the CENIS Project reveals
that the 1971 State Plan projections were reasonably accurate for techni-
cal workers, there may be a need to council with area school administra-
tors about their expansion plans and suggest other alternatives.
Another factor that may be influencing area school administra-
tors toward planning heavier emphasis on technical programs is current
population trends in the State and the current State General Aid Formula.

Generally, technical programs are two years duration, while vocationai
programs trend toward shorter duration, between three and eighteen month.
In June of 1972, Mr. Richard Sydness the State Auditor's
en-
Office met with this Council and explained: By 1986. Iowa will have
slightly more than a twenty-six per cent decline in the twelfth grade
rollment. This may have the effect of reductl.g the public and private
post secondary school enrollment. (34)
JUNE 1970 SCHOOL CENSUS (34)
eider One Year 36,840 26.3%One Year 37,324 25.4%Two Year 41,429 17.2%Three Year 43,085 13.9%Four Year 46,191 7.7%
Five Year 50,054
* Percentage of population decline of five year old's
The declining population may force area school administrators to extend
all educational programs to two year's duration, in order to keep the
classroom and laboratories full. Another possibility is for the Arts and
Science Program to be extended to three years in the area schools. Some
private two year colleges are already doing this.
He further commented that:
Current'reimbursement practices may inhibit theimplementation of more effective teaching tech-niques. The audio-tutorial aided instruction inone case has proved to be more efficient thantraditional teaching methods. The area school,in effect, is being penalized because they cancollect general aid for each student for only8 weeks whereas, previously, they were able tocollect the general aid for twelve weeks. (34)

It appears that a trend may be appearing on the horizon in whin 11 new pro-
grams will be established and existing programs adjusted because of 12,kipu-
lation factors, rather than labor market and student needs. Prorams nay
be .structured for disproprotionate lengths, compared to the time necessary
to impart the technical knowledge and skills, as well as developing the
individual's other abilities to function effectively in society.
There is a need to find 11_6 ,:r,:.ate.,d by
population, area school instructional stations, the general aid
formula, and instructional efficiency and relate these to labor market
needs and student interest.
Related Academic Instruction - In an effort to expand the base
of information needed to evaluate the area schools' effort in meeting the
educational needs of the population which they serve, the Council sent
questionnaires to the fifteen area schools' vocational-technical instructors
representing each of seven instrnrtional [Lelds ofteted. The Council re-
ceived 68 per cent or 206 of the 298 questionnaires mailed to the instructors.
This was accomplished through two mailings to the representative population.
This was considered to be an acceptable response, compared to return re-
sults in other survey efforts.
Psychologists suggest that there is a positive relationship
between an individual's success and his interest in the subject. Most
students enroll in the vocational programs because they have a high level
of interest in learning skills and technical knowledge necessary for
competence in a particular field. These students are in need of certain
related academic instruction to successfully achieve their goal.
Cooperation between the academic and vocational education instructors =t;
needed to orient specific course cm-,-ent to 771-:.. 1:.,dividual needs and ir-
terest. Approximately 55 per cent of the aral vocatic,nal-techniJ
education instructors surve-y _Tcis -:;ed the 't2,
4CadeM:-,_ ir.:structor:, re _ Lucas of instructional
content to meet individual needs and interests. Nearly all of these in-
structors indicated they met periodically with the academic instructors for
the purpose of coordinating academic instruction with the job training
they are providing. Fifty per cent of this group indicated they met at
least once a month. Nearly one-half of the instructors reported their
school tested individual students for cometency in basic skills and then
scheduled instructional programs keyed to the students' needs.
The post secondary vocational education instructors were asked to
respond to questions related to instruction in the areas of social science
and English. Because of the way the ,uestions on social science were con-
structed, the results are non-conclusive and cannot be reported with any
degree of accuracy.
Communications, either written or oral, are a necessity for the
success of an individual in his occupational choice. If the individual
fails to communicate his ideas or fails to understand the ideas of others,
he cannot develop the proficiency needed to accomplish his job well. The
majority of the instructors expressed the opinion that the related English
instruction develops skills in conference-leading techniques, parliamentary
procedure, writing technical reports, effective public speaking, and also
developing a technical vocabulary useful for the consumer. Only about

_
one-third of the instructors were of the opinion that relate En4iis
instruction provides units of instruction in interp etinL; mechanical
dreq... sketches, schemat_c diagrams, pictorial jrawinas, or 1:1,-,1t,
were developed in analyzing terminology core onlv found in legal contract,-;.
The post secondary career education instructors were further -,.aestioned
concerning instruction in job application and interviewing techniques.
Nearly all of those responding reported the English curriculum was pro-
viding instruction in these areas. There appears to be a need to continue
the encouragement for pragmatizing the related academic instruction offered
to vocational and technical students in area schools, in order to fully
implement the career education concept in the area schools.
Post Secondary Administrators' Opinion - Career Education Concept -
In a short series of true or false questions, the Council attempted to as-
certain the exposure of the administrators to the emerging career education
concept. Thirty-five per cent of the area school administrators either did
not reply or expressed the view that career education is a new name for
vocational education. It should be stressed that Council opinion suggests
that vocational education is only the j-lb preparation part of the total
career education concept. All of the area school administrators responding
reported that their Board of Education had been exposed to essential con-
cepts of career education. When asked to express their reaction that
clusters of occupational programs ought to be available for students in
fifteen major occupational areas in order to meet student needs, most felt
it wasn't applicable at the post secondary level, but rather the develop-
ment should occur in the local elementary and secondary schools.

fro r Justification - The area school administrators were
also questioned about the source data they used for justifyin4 and es.
tablishing new programs in vocational technical education. !lost of the
administrators ranked Labor Market Surveys of the local community as
sing the most important in establishing new programs. Students State.
vent of Interest was ranked second in their selections, and suggestions
from the busine3s community ranked third.

-15C-
GUIDANCE AND COUNSELING
Placement and Follow-Up of Vocational Education Ter=inators
The 1971 Career Education Student Follow-Up provided data on post second-
ary students enrolled in the fifteen area schools offering approved voca-
tional and technical education programs. The post secondary students,
enrolled in vocational education programs, had a completion rate of sevent-v-
three per cent. Graph 22 presents an analysis of the post secondary
student follow-up, as of October, 1971. The Graph shows that, of those
completing vocational education programs, seventy-five per centare em-
ployed full-time, while nineteen per cent are unemployed, five per cent
are employed part-time and the status of one per cent of the graduates
was unknown. In the summary of placement results for 1971, the last two
bars in Graph 2 reveal that of the 6,644 total enrollees, fifty-six per
cent are employed or pursuing further education, while forty-four per cent
were either not followed up, no data reported, are experiencing unemploy-
ment, or Dze not working for miscellaneous reasons. It should be noted
that directions accompanying the State follow-up reporting form specify
UA11 area school students terminating enrollment in an approved prepara-
tory career education offering during the 1970-71 school year". (should
be included in the population to be surveyed). (29) Apparently, there
is a reluctance on the part of area schools to follow-up those students
who terminated vocational or technical programs without completing the
program or there is a reluctance to report the employment status of the
non-completers.

POSTSECONDARYENROLLEES
100
-151-
1792 Did not complete program-27% -Not reported on follow-up
POSTSECONDARYCOMPLETERS
73% 100
75% EmployedFull-time
596 Part -
% StatusUnknown
19% NotEmployed
rnCN1
47%
562Misc.
SUMMARY OF PLACEMENT RESULTS
gipmmlOMgoMEMIMM111mmimmloOn
111=....IVIIMEWMMMgigmlimmMMmimmIMMMimimMIIMMMImMIIMMIMOM
111111111MMEIimimol=1111111
MMEM.11111.
1.1IMOINEIMMMSMIIIM=MMEMMIIIMWM==11111MMMMIMINIMMUM
41% EducatioiVogpms42% No Data=7:Reported511
111.11.MMMM1111.0MIImommmlm
FOR 1971
GRAPH 22
ANALYSIS OF POST SECONDARY STUDENT FOLLOW-UP, OCI. 1971
Data From 1971 Career Education Follow-up
Chart by Iowa Career Education Advisory Council
a)
0a.
6:4 4J
00
04 0 0
0o
o
O cn

-152-
Graph 12, Chapter IV, presents an analysis of the percentagL of
former students for whom their status is unknown or are not available for
placement. Considering those who were enrolled in post secondary programs,
the occupational clusters with the greatest percentage of former students
in this category were gainful home economics and health occupational educa-
tion. A third category that ranks high is trade and industrial occupa-
tions. The lowest percentage of former students with status unknown or
not available for placement occurred in agriculture, distribution, and
office occupations. Overall, the area schools have a lower percentage of
students with status unknown or not available for placement than secondary
schools
In addition to the 1971 State Career Education Student Follow-Up,
many of the area schools conduct a more in -depth study to determine the
effectiveness of their total program offerings. The Council requested
and received copies of the various studies compiled by the area schools
in the past year for the 1970-71 school year. A review of these studies
showed that, generally, the data reported for vocational-technical gradu-
ates is parallel to the data requested in the State Annual Follow-Up of
vocational-technical students.
Elsewhere in the study, the Council reports enrollment trends
of area schools and community colleges from 1968 to the present. The
reader will observe, by reviewing these charts, that the four area voca-
tional-technical schools all experienced increases in enrollment in
vocational-technical programs. There were no arts and science students
-153-
enrolled in these institutions. With respect to the eleven comprehensive
community colleges functioning within the State, three of these institu-
tions experienced significant enrollment increases in vocational-technical
programs. One of these three institutions did not assume responsibility
for a previously established junior college. The remaining eight area
community colleges that assumed administrative responsibility for the
operation of one or more previously existing junior colleges re=tort no
significant change of enrollment trends when comparing arts and science
with vocational education.
The major goals of a comprehensive. community college include a
commitment to meeting the needs of students. For this reason, the Coun-
cil reviewed the latest follow-up reports from these institutions to
determine whether an effort is being expended toward following up the arts
and science students and to determine whether these programs are meeting
the needs of students. This review yielded the following information:
- Three institutions did not follow up the 1971 arts andscience graduates.
- Five institutions, some time near the end of their twoyears of schooling, questioned their arts and sciencestudents about their future plans.
- One school conducts a follow up of their arts and sci-ence students some time after they graduate.
- One school questioned arts and science graduates con-cerning qualitative measures of instruction in thecommunity college.
- One school did not submit a follow-up report.
It is recognized that some arts and science programs are de-
signed so that a student may qualify for employment upon graduation or

-154-
may complete the last two years of education to earn a B. A. Degree.
Other students are enrolled in liberal studies which generally impart
few employment skills and are designed mostly for transfer purposes.
It appears that follow-up studies, based on intent, may have
questionable credibility in terms of providing usaable management infor-
mation for school administrators to use for planning future institutional
direction. Data illustrating actual arts and science graduate pursuits
after graduation may provide a better basis for counseling future fresh-
men entering the arts and science programs, and might assist school ad-
ministrators in keying educational program direction to real student
needs, rather than assumed student needs or intentioned plans. Infor-
mation about actual arts and science graduate pursuits could also assist
in measuring the effectiveness of "terminal type" arts and science pro-
grams. There appears to be a need to improve the follow-up efforts of
all post secondary area school students, both qualitatively and quanti-
tatively.
Alternative Methods for Student Follow -Up - The State of
Minnesota has implemented a centralized state-wide student follow-up
system to determine the status of those who have terminated from voca-
tional-technical programs. The data is collected directly from the stu-
dent and the student's employer.
Four different types of follow-up reports have been developed
from the data:
1) A summary of data on all students followed up across theentire state.
-155-
2) A summary of data on student& followed up in eachcurriculum area (e.g., auto mechanics) across thethe entire state.
3) A summary of data on all students follow up withineach school.
4) A summary of data on students followed up withineach curriculum area within each school.
The employers are also surveyed to evaluate the graduates by comparing
them with other members of their work force.
The Vocational Follow-Up Project is conducted by a highly
specialized staff which is responsive to the needs of the vocational-
technical schools and the State_ Department in Minnesota. This approach
tends to provide an efficient vehicle for gathering such follow-up in-
formation. The Iowa system seems to be more cumbersome by requiring each of
the schools to follow up its own students. Efficiency is increased
not only in terms of the economics of being able to finance a central
unit more inexpensively than it is possible when taking time from
guidance and instruction personnel in each area school, but also in
terms of being able to gather comparable data from each of the schools.
(55) In a phone conversation with Dr. David Pucel, Project Director of
Minnesota's Vocational Follow-Up Project, he stated that student follow-
up costs averaged approximately $5.00 per student after the initial
systems development. (47) This Project was financed by state alloca-
tions of research funds from the federal government.

-156-
FINANCIAL ANALYSES
Information Source
In an effort to sample the vocational education financial needs
of the area schools, the Council sent questionnaires to 298 area school
instructors, in the fifteen merged area schools. The questionnaires
were sent to all the area schools, so as to compensate for regional dif-
ferences that may exist in the state and provide a clearer picture of
the total needs of the area schools. In order to identify future finan-
cial needs, the instructors were questioned about their opinions on teach-
ing equipment and supply needs. The career education programs surveyed
were: office education, trade and industrial, health occupations; dis-
tributive education and home economics. Through a mechanical error, the
vocational agriculture instructors at the post secondary level were not
sent questionnaires; however, instructors from other fields providing
"support" instruction for agriculture programs were surveyed.
Equipment and Supplies
The need for equipment varies with the type of program offered,
for example, distributive programs usually place heavier practical ex-
perience emphasis through use of the cooperative method of teaching which
requires less equipment. The length of the program also tends to have an
effect on the amount of equipment needed.
The responses to the questionnaire relating to equipment will
be discussed by program, rather than collectively, to provide a clear in-
dication of the typical individual program need included in this survey
sample.

-157--
Home Economics - Six of the thirteen post secondary home eco-
nomics instructors responded to the questionaire. The number of responses
is so small that the results cannot be considered to be significant.
Office Education - Forty-eight reimbursed post secondary office
education instructors were included in the sample of the Council survey.
Thirty-five of this number returned questionnaires for a response of near-
ly seventy-five per cent. The majority of those returning questionnaires,
seventy-five per cent, utilized both the laboratory and cooperative method
for instructing their students. Forty per cent of this group was of the
opinion that their equipment was modern and up-to-date and that no re-
placements were needed in the near future. A larger percentage of the
total group responding, fifty-seven per cent, expressed the view that,
while their equipment is presently adequate for instructional purposes,
in a short time it will become obsolete and should be replaced.
Approximately fifty-five per cent of the office education
coordinators who responded have expended the effort necessary to identify
the number of dollars that will be needed to up-date their equipment in
the future. The vast majority that did respond estimated that their
future up-dating needs would cost the local school district $10,000 or
less. Fourteen per cent of the respondents reported that the replacement
cost for worn out or obsolete equipment would be $10,000 to $50,000. The
instructors reported that their administration would be able to expend
sufficient funds to buy replacement or additional equipment if state or
federal funds were available to reimburse at least fifty per cent of the
cost of the equipment.

-158-
Nearly sixty per cent of the responding instructors had presented
to their administration, in recent years, a written "Status of Major Equip-
ment Report" for planning and budgeting purposes. Nearly 85 per cent had
visited verbally with their administration about the equipment and supply
needs, while only twenty-eight per cent had developed a five or ten year
replacement or acquisition of new equipment plan to satisfy the laboratory
instructional needs.
The office education instructors were further questioned concern-
ing the extent to which existing laboratory equipment was used during the
day for instructional purposes. More than two-thirds of the instructors
reported that the equipment was used six hours during the normal school
day, and more than two-thirds reported that their laboratories were used
for adult education programs each year.
In any laboratory situation, it is impractical to expect that
all equipment and work stations were used all of the time, because some
instructional equipment is used in support of other equipment for teach-
ing purposes and, therefore, become a part-time training station. Almost
fifty per cent of the instructors reported that between five and ten per
cent of their training stations were vacant during the instructional
periods. Slightly more than twenty-five per cent reported that between
ten and fifteen per of their training stations were vacant during
instructional periods. Only five instructors (twelve per cent) reported
that more than twenty-five per cent of their training stations were vacant
each instructional period.

-159-
Distributive Education - Nineteen post secondary distribu-
tive education instructors were included in the sample of the Council
survey. Fifteen of this number returned questionnaires for a response
of seventy-nine per cent. Nearly seventy-five per cent of the respond-
ing instructors utilized the laboratory and cooperative method for in-
structing their students. Forty per cent of this group was of the
opinion that their equipment was modern and up-to-date and that no re-
placements were needed in the near future. A smaller percentage (thirty-
three per cent) expressed the view that, while their equipment is pre-
sently adequate for instructional purposes, in a short time it will be-
come obsolete and should be replaced. Forty per cent of the distributive
education instructors who responded have expended the effort necessary
to identify the number of dollars that will be needed to up-date their
equipment in the future. Because the number of responses is small, the
results cannot be considered reliable. However, all of those that re-
sponded estimated their future up-dating needs would cost the area school
$10,000 or less. Nearly half of the instructors reported that their ad-
ministration would be able to expend sufficient funds to buy replacements
or additional equipment if state or federal funds were available to re-
imburse at least fifty per cent of the cost of equipment.
Approximately forty per cent of the instructors had presented
to the administration, in recent years, a "Status of Major Equipment
Report" for planning and budgeting purposes. Approximately ninety per
cent had visited verbally with their administration about equipment and

-160-
supply needs, while only thirteen per cent had developed a five or ten
year replacement or acquisition of new equipment plan to satisfy the
laboratory instructional needs.
The distributive education instructors were further questioned
concerning the extent to which existing laboratory equipment was user'
during the day for instructional purposes. Fifty-five per cent utilized
their equipment three hours during the normal day, while nearly thi teen
per cent reported using their equipment six hours during the day. only
a small per cent (thirteen per cent) reported that their laboratories
were used for adult education programs each year.
In an effort to determine the utilization of work stations
during each period, nearly thirty-five per cent reported that only five
to ten per cent of their training stations were vacant during the periods.
Only two instructors (6.6 per cent) reported vacant stations fifteen to
twenty-five per cent of the time, while thirteen per cent reported that
more than twenty-five per cent of their training stations were empty
each instructional period.
Health Occupations - Fifty-nine reimbursed post secondary
health occupation instructors were included in the sample of the Council
survey. Forty-five of this number returned questionnaires for a re-
sponse of seventy-six per cent. Eleven per cent of this instructors used
the laboratory method of instruction, while seventy-six per cent utilized
the laboratory and cooperative method. Thirty-two per cent of this group
were of the opinion that their equipment was iliodern and up-to-date and
that no replacements were needed in the near future. Nearly ore-half

expressed the view that, while their equipment was adequate for instruc-
tional purposes, in ashort time it would be obsolete and should be re-
placed. Ten per cent felt their equipment was out-of-date, but in good
repair. Approximately forty-six per cent of the health occupation in-
structors who responded have expended the effort necessary to identify
the number of dollars that w. 11 be needed to up-date their equipment
in the future. Nearly fifteen per cent estimated that their replacement
need would cost the area school district $2,000 or less. Thirty-one per
cent estimated the cost at between $2,000 and $10,000. Five respondents
reported that the replacement costfbr obsolete or worn out equipment
would be $10,000 to $50,000. Nearly one-half of the instructors re-
ported that their administration would be able to expend sufficient
funds to buy replacement or additional equipment if state or federal
funds were available to reimburse at least fifty per cent of the cost
of equipment.
Two-thirds of the instructors had presented to the administra-
tion, in recent years, a written "Status of Major Equipment Report" for
planning and budgeting purposes. While seventy-six per cent reported
they had visited verbally with their administration about equipment and
supply needs, only twenty-six per cent had developed a five or ten year
replacement or acquisition plan to satisfy the laboratory instructional
equipment needs.
The health occupations instructors were questioned concerning
the extent to which existing laboratory equipment was used during the

day for instructional purposes. Nearly fifty per cent of the instructors
reported that their equipment was used six hours during the normal school
day, and forty-eight per cent reported that their laboratories were used
for adult education programs each year. Thirty-five per cent of the in-
structors reported that less than ten per cent of their work stations
were empty each instructional period. Approximately seven per cent re-
ported that between ten to fifteen per cent of their training stations
were vacant during instructional periods. Thirty-two per cent of the in-
structors repc,:ted that less than fifteen per cent of their training
stations were empty each ,instructional period.
Trade and Industries - One hundred and fifty-nine reimbursed
post secondary trades and industries coordinators or instructors were
included in the sample of the Council survey. One hundred and five of
this number returned questionnaires for a response of sixty-five per cent.
Trades and industries programs include both cooperative or preparatory
types of instruction. The cooperative method of instruction in trades
and industries at the pet secondary level includes the use of laboratory
and classroom instruction, followed by sequences of on-the-job training
offered throughout the program or, in some cases,during the summer re-'
cess only. The preparatory type of program is used almost exclusively
at the post secondary level of instruction. The majority of these in-
structors (sixty-seven per cent of 105 respondents) utilized the labora-
tory method for instructing their students, while twenty-five per cent
utilized the laboratory and cooperative method. The largest percentage

of this group expressed the view that, while their equipment
is presently adequate for instructional purposes, in a short time it will
be obsolete and should be replaced. The next largest group was of the
opinion that their equipment was modern and up-to-date for the present
programs and no replacements were needed. A smaller percentage felt
their equipment was out-of-date and needed replaced. Sixty-three per
cent of the trade and industrial instructors responded that they had ex-
pended the effort necessary to identify the number of dollars that will
be needed to up-date their equipment in the future. Twenty-four per
cent reported that their future needs would require from $10,000 to
$50,000 for the purchase of new or replacement equipment. Another
thirty-two per cent estimated replacement costs at $10,000 or less. Sixty-
six per cent of the instructors reported that their administration would
be able to expend sufficient funds to buy replacement or additional equip-
ment if state or federal funds were available to reimburse at least fifty
per cent of the cost of the equipment.
Approximately sixty per cent of the instructors had presented
to the administration, in recent years, a written "Status of Major Equip-
ment Report" for planning and budgeting purposes. More than eighty-five
per cent had communicated verbally with their administration about equip-
ment and supply needs, while only twenty per cent had developed a five
or ten year replacement or acquisition of new equipment plan to satisfy
the laboratory instructional needs.

-164-
The trade and industry instructors were further questioned con-
cerning the extent to which existing laboratory equipment was used durin
the day for instructional pusposes. Sixty-two per cent of the instructors
reported that the equipment was used six hours of the normal school day
and sixty-five per cent reported that their laboratories were used for
adult education programs each year. Forty per cent of the trades and in-
dustries instructors responded that between five per cent and ten per cent
of their work stations were vacant daring the daily instructional period.
Twenty-three per cent reported that between fifteen and twenty-five per
cent were vacant during the period. Six programs reported more than
twenty-five per cent of their training stations were empty each daily in-
structional period.
The trade and industry instructors have indicated a definite
future need for the replacement of equipment and expansion of now program
offerings.
Summary
This unit of the annual report was probed to assist state and
area school administrators in viewing financing problems that may appear
on the horizon.
The amjority of area school vocational instructors included
in this survey reported that their teaching equipment was modern and up-
to-date. The group that reported they had the most up-to-date instruc-
tional laboratories were the office education instructors, while the

programs with the least up-to-date equipment was in' health occupations.
The majority of instructors who reported the need to replace
obsolete or worn out equipment stated that less than $10,000 would be re-
quired for up-dating. A very high percentage of the instructors who re-
ported equipment needs also reported that their administration would be
able to purchase the necessary new equipment if fifty per cent of the cost
would be reimbursed from state and federal funds.
The instructors were questioned about the action they had taken
to appraise their local administrator of the equipment needs. Instructors
in three of the four service areas reported that more than fifty per cent
had developed a written "Status of Major Equipment Report" that had been
filed with their administrators. Over eighty per cent of the instructors
had spoken to their administrator about their needs which implies that
thirty per cent of the population that didn't prepare a written report
did take the time to speak to their administrators about their needs.
More than twenty per cent of the instructors surveyed had developed a re-
placement plan which could be used by their administration, so that needed
replacement equipment could be purchased in an orderly manner over several
years.
All service areas reported A high level of usage of their
laboratory facilities with few vacant training stations. There also ap-
pears to be extensive use of post secondary facilities for adult education
programs.

During the June, 1972 Council meeting Mr. Richard Sydness of the
State Aduitor's Office discussed financial factors relating to area school
operations. According to audited figures, the value of the fixed assets
of the fifteen area schools amounts to $55,131,526.00. (34) The fixed
assets of area schools include '7he value of buildings, equipment, and
furniture. The estimated value of equipment and furniture in all
fifteen area schools is $15,000,000.00. (48) It has been Suggested that
legislation be drafted to provide for area schools to set aside funds
equal to the annual depreciation of the equipment to allow for reserves
to purchase new equipment when existing equipment becomes obsolete or in-
operative. (34)
Appropriations and Allocations
vocational Aid Funding Trends - The reader should refer to
Graph 4, Chapter II, for a comparison of area school vocational alloca-
tions to total state and federal allocations for vocational and technical
education. This Graph also compares the post secondary allocations to
secondary school allocations. It is of interest to note that the total
post secondary allocations have increased approximately thirty-three and
three tenths per cent from fiscal year 1968 through fiscal year 1972.
The per cent increase is due, apparently, to increased federal allocations,
since state allocations for vocational-technical education have not in-
creased as greatly in the five year period. While the approximate one-
third increase in allocations for area schools, for vocational programs,

over a five year period may appear to be sizable, the increase amounts to
approximately six and seven tenths per cent annually which is nearly eqt:iva-
lent to the nation-wide inflation rate over the same period.
Graph 22 illustrates the various appropriations made for all vo-
cational education by the State Legislature for six years. One particularly
interesting point should be highlighted. Biannually, area school general
aid has been increased from $12,000,000 in 1967-69 to $25.')70,000 in 1971-
73, for an increase of approximately 108 per cent. During the same period,
total state vocational appropriations have increased from $12,000,000 to
$13,800,000 for a mere increase of fifteen per cent during the three bien-
niums. There appears to be a need to review legislative interest in plac-
ing greater emphasis on the expansion of vocational and technical programs
in area schools.
Also to be considered is the fact that area schools have con-
tinued to increase their vocational-technical program offering during the
past five years. Should the State Legislature continue to fund vocational
and technical programs in accord with its recent pat performance, will
there be sufficient programs ,wailable to meet the needs of the numbers
of student who are now expressing increasing interest in preparing for
work in a vocational-technical program, rather than pursuing a B.A. Degree?
General Aid Funding Trends - Table 5 summarizes the financial
appropriations by the State Legislature for general aid appropr'ations for
the six years from fiscal year 1968 through fiscal year 1973. With respect
to these appropriations for undergraduate post secondary education during

TABLE 5
STATE BIENNIAL ALLOCATIONS for UNDERGRADUATE POST
SECONDARY EDUCATION in IOWA
(Exclusive of Allocations for State Administration)
A. General Instructional Aid
(Undergraduate)
1.
Area Schools
2.
Board of Regents
TOTAL
B. Student Aids (Undergraduate)
tuition grants; scholarships,
student loans, (including
private schools, area schools,
& universities)
TOTAL
C. Construction
1.
Area Schools
2.
Board of Regents
TOTAL
1967-69 Biennium
1969-71 Biennium
1971-73 Biennium
$12,000,000
(62-SF873
$119,240,000
(62-SF838
(p.66)
(p.38)
(p.67)
(p.69)
(p.67)
(p.42)
$ 19,400,000
(63- F1F825(p.251)
$135,860,000
(63 -SF655
(p.51)
(p.56)
(p.56)
(p.54)
(p.55)
$25,970,000
(64-11F741
$154,675;000
(64-UF724
(p.53)
(p.73)
(p.7I)
(p.73)
(p.85)
(p.76)
(p.76)
(p.77)
(p.75)
$131,240,000
$325,000
(62-HF765
$2,000,000
(62-SF837
$155,260,000
$525,000
(63 -5F636
$4,500,000
(63-5E688
$180,645,000
$525,000
(64-5E528
$8,000,000
(64-11E724
$2,325,000
$9,500,000
(62-SF879
$34,000,000
(62-HF747
$5,025,000
NONE
$7,100,000
(63-5E689
$150,000
(63-SF696
$8,525,000
$434, 167
(64-5179
$146,750
(64-5)'588
$3,151,000
(64-5E586
$1,000,000
(64-5E587
$969,000
(64-5E584
$43,500,000
$7,250,000
$5,700,917
62 -SF i3 (p,66;
162 = ses. ion laws from 62nd General Assembly.
5E873 = Senate rile 871. (p.66)
pave
in session

TABLE
D. Catagorical Vocational Aids
5(Continued)
1.
Administrative
Allocation1
$6,714,414
Data Not Available2
for Calculation
2.
Legislative Allocation
(.$12,000,000)3
($13,200,001)3
$1D,350,000
(62-SF876 (p.64)
(63-SF622 (p.42)
(64-HF709
(p.56)
$350,000
$400,000
$360,000
(Manpower Development Training Act)
(62-Sv867 (p.61)
(63-SF622 (p.42)
(64-1(F692
(p.55)
$7,064,414
$200,000
(64-HF744
(p.60)
TOTAL
$10,910,000
1From annual reports to U.S. Office of Education for FY 1968 & 1969, Form 4043.
This amo,Int does liot reflect
allocations to special catogories such as handicapped and disadvantaged, et. al.
2Annual report to the U.S. Office of Education for 1969-70
3Appropriations made leaving DPI the discretion of allocating funds between secondary and post secondary
area schools.
See Administrative Allocation
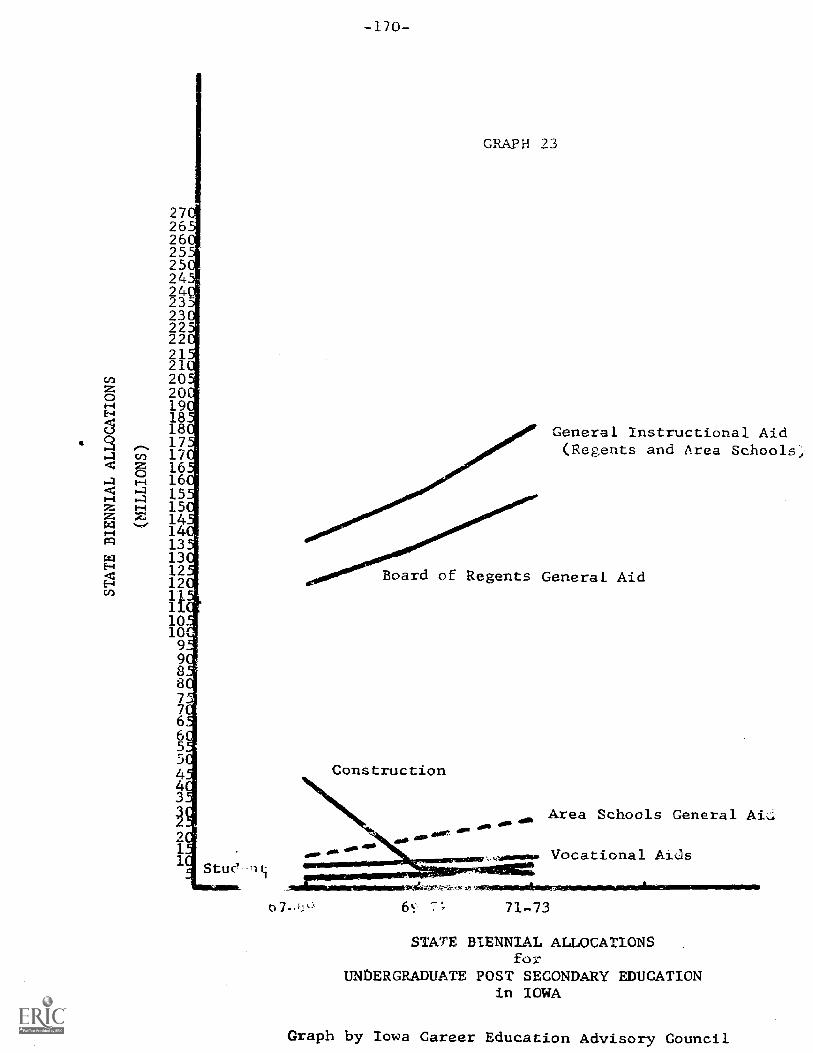
272626252524242323222221212020191818171716
t-t 1615
1415
1413131212111110109988776655443
21
Stud n
-170-
GRAPH 23
General Instructional Aid(Regents and Area Schools,
Board of Regents General Aid
Construction
Area Schools General
Vocational Aids
6L 71-73
STATE BIENNIAL ALLOCATIONSfor
UNDERGRADUATE POST SECONDARY EDUCATIONin IOWA
Graph by Iowa Career Education Advisory Council

the 1967-69 biennium, the regents institutions received $119,240,000,
compared to $12,000,000 for area schools or approximately one per cent
of the total going to area sch ols. During the 1971-73 biennium, the
regents institutions received $154,675,000, while the area schools re-
ceived $25,970,000 for approximately eighty-five per cent of the general
aid going to tic regents institutions.
Appropriations for construction have been greater to the Board
of Regents institutions than to area schools, however, not to the extent
as has the general aid appropriations.
Programatic Costs
Introduction - Section 286A.12 of the Iowa Code provides for
the establishment of a uniform accounting system for area schools. The
law states that:
"The superintendent of public instruction shall establish auniform accounting system for area schools subject to theapproval of the auditor of state. The accounting systemshall provide for crediting all funds received in the formof federal aid, st^._: aid, tuition, and miscellaneous feesto four separate acc_Yants as follows:
1. Arts and science education2. Vocational-technical education3. General adult education4. Co-operative programs or services
All expenditures shall be charged to the appropriate ac-counts. No funds shall be tr-Jsferred from one account toanother without the approval of the superintendent of publicinstruction, and notification of all such transfers shall begiven to the state comptroller. The accounting system ofeach area school shall be audited annually by the auditor ofstate." (63GA.ch 190, 4[2]) (9-22)

It should be noted that each area board of educati-n was given
latitude to spend its 3/4 mill local tax levy for an:: purpose.
The State Auditor's Office, working cooperatively with the De-
partment of public Instruction and the business managers of some area
schools, in an advisory capacity, developed procedures for accounting
for program costs in accord with the Iowa Code. They established that
direct program costs include such items as instructional salaries, equip-
ment and supply costs, directly attributable to the program, and func-
tional administrative costs and building costs p.Jrated to the prograT,
based on the square footage of space used in the program. Indirect pro-
gram costs are also included in the calculation of total program cost.
These indirect costs include the cost of general administration, student
services, learning resource centers and organized research. The cost of
attributable salaries, building, furniture and the like are included in
the total of indirect costs. The prorating of these indirect costs is
made according to the total contact hours of instruction currently of-
fered in each of the four educational functions listed in the law.
During recent years, the State Board of Public Instruction as
been approving additional programs, based on recommendations of its staff,
as funded or unfunded programs, The area schcol administrators submit
budgets for each vocational-technical program to the Department of Public
Instruction covering their estimated financial needs for each fiscal year.
These needs are expressed i terms of total program cost and the.portion
of expected reimbursement tre:zi state and federal vocational aid !_11:.cfs.
First priority is t;iven to allocating vocational aid funds co a prcporticn
basis to existing operational vocational technical programs. If all 01
the vocational aid funds are committed to existing programs, then t:l /e area
schools are allowed to operate new programs, however, these new prk.::.rams
are r.ot allocated any state or federal vocational aid funds. The area
schools must locate other sources of funds in their bud',:r.,_t to support an.;
new programs. One of the other sources includes the local 3/4 mill tax
levy. The area board may use these funds to totally support new voca-
Oonal programs. Another source of funds are past year "left-overs" from
existing operating vocational and technical programs. If the estimated
budget for a program 1,-cis greater than the actual cost of the program, the
excess amount may be directed to funding the new vocational program(s).
A third source of funds that area schools might use for funding new voca-
tional programs are funds carried over from the previous fiscal years.
Currently, the Iowa Code is silent as to how area schools shall use carry-
over funds. Therefore, funds left over from arts and science programs
might be used to establish new vocational-technical programs or vice versa.
Funding Levels - Graph 24 shows, from State Auditor's Reports,
the amount of state and federal vocational aid funds used to reimburse
vocational-technical programs on a state-wide basis, compared to audited
total cost of programs for three fiscal years, from 1969 through 1971.
Possibly, Grai.% 25 presents more meaningful information by showing the

100
90
80
70
60
caLI
50
acu
40
30
20
10
1969
1970
Fiscal
Year
State-wide
Post
Secondary
Voc. -
Tech.
Program
Total
Costs
Compared
to
Post
Secondary
Vocational
Aid
Reimbursement
(Data
from
State
Auditor,
Area
Schools
Consolidated
Reports,
and
State
Auditors
Office)
Graph
by
Career
Education
Advisory
Council
1971
GRAPH
25
40.5%
1969
1970
1971
Fiscal
Year
Per
Cant
of
Reimbursement
Compared
to
Total
Program
Cost
Post
Secondary
Voc.
-
Tech.
Programs
Craoh
by
Career
Education
Advisarv_Conncil

-175-
percentage of state and federal vocational aid usu, to supper:
cost of programs in area schools. Dui ,..scr,]. year l769. area 5k=b01.';
received. 59.6 per cent of the audited total cost of pror.-;7,3 needed
support all of their vocational-techic,ii pr,=7.-.F; iron state arid zdera
vocati,Dnal aid. In fiscal year amount was reduced to t:drty-
five per cent, while in fiscal year 1971, this amount increased 4.
per cent. It is important tz note that fiscal year 1970 was the
year in which area schools were required by Se *ion 286A.12 to charge
all income and expenditures to the ap::opriate accounts for the four
educational functions described in Section 286A.12 of the Iowa Code. Al-
though the State Auditor's Office had attempted to identify a proper
allocation of ti.ocome and expenditures from available data for previous
years, this portion of the Code p -ohibited the transfer of funds from
one educational function to an unless approved by the Superintendent
of Public Instruction, after fiscal year 1969.
An analysis of the 1971 Auditor of State's consoli-iated
(Schedule 3) reveals that, on a state-wide basis, the area schools ex-
pended the following amounts from their three-quarter mill local tax levy
and miscellaneous receipts, including carry-overs from previous years on:
Arts and Sciences
Vocational-Technical
Adult Education
$2,500,301-98
2,945,117.98
392,300.39 (35)
It should be further pointed out that all of the area schools
showed a total of $5,705,4-51.25 undistributed .ta_ance at the en.. :isca-
year 1971. The balances for individual area schools raned fro:7. $i5L,'77-.00
to $1,019,030.84. The majority of the balances rar:ed :520,2,,G06.60
$380,000.00. (35) It appears that the reserves of the vast
the area schoois are becoming Aangerously low. It 3I5C appears dev
meet of new vocational-technical programs in area schools ac-
complished through the appropriation of additional state funds oarmarkee
for vocational-technical education, additional funds made avail.-ible under
authority of Public La-- 92-318, and/or .Je disconti ance of some ef-
fective programs and the diversion of funds from these programs to ribs.
programs.
Program Cost Variation- - During fiscal year 1'371, the
cost per full-time equivalent e _,-Ient for area school stnts ranged
between $952.00 and $1,876.00 for the school year with the cost for all but
two of the schools ranging between $1,288.00 and $1,616.00. For compara-
tive purposes, the cost of instruction for the freshman year at the Uni-
versity of Iowa is estimated at $1,500.00, while the cost of instruction
at Iowa's private colleges for each year of the four years ra-:,ges between
$2,400.00 and $3,400.00. Further comparison reveals that. t;-. full-time
equivalent enrollmt.nt annual average cost for area school students en-
rolled in arts and science programs is approximately $1,047.00, while the
average cost for vocational-technical students is $1,472.00. Considering

that, ;4er,,er
programs co177:pa:
freshman studell
area scoois.
fro:11 $1.3t Lo
rare dn clerical-
ar-.1s
u
ranges between $1.22 to 4. ,Lr sturient,
cost variation is due
4e7-, area Ls
-tne pro4ram, nu7.rer students
enrolled, the amount or e(- quent available and the like. Currently, no
system is available to 7-:o. -imre the effectiveness of the ,.r..2,:am, as re-
ported by former students ar,d employers. Until more detailed fol:ow-uo data
is available, there is no basis to determine whether the expending of $4.82
per student, per instruction hour, yields a student better prepared for
comp( itive employment. When comparable data is available, it will also
be necessary to determine whether lower cost, For instructional houl, will
provide sufficient instructic:- so that the indi%_uual will be able to com-
pete effectively in entry level employment and have sufficient motivation
to continue his education on a commuter basis in private or public colleges
and univerf,ities or ccmmunity colleges if he sees the need for furthering
his education. The reader should refer to the Guidance, Follow-Up and
Placement portion of this report for further information on current efforts

to Lliow up stl!de:ts.
There is riee to Aen::.; cJaiita:ive
and relate these factors to insLI,L,,i..",1, per sour cest, so :
r;.
Pt )ciert cvt Puali" r"'74c;i1Tr
,;.1. 1 L ,;.12

-179-
CHAPTER 5
SUMMARY AND CONCLUSIONS
- The 1972 State Plan for Career Education, in places, is vague. T is
quality diminishes its value as a true planning document. Forth-
coming labor market information may be of value in clarifyiug 1_171ur,L,.
State Plans.
- Secondary school students are expressing greater interest in pursuing
post secondary vocational-technical programs in area schools. This
may be projected arts and science enrollments in area schools
generally did not maLerialize.
- Future vocational and technical program planning should be enhanced
by annual labor market needs surveys. Results of these surveys will
provide for more definitive data to be contained in the State Plan
for Career Education.
- Student attitudes and opinion, according to one congressional leader,
reflact greater youth interest in vocational-technical programs and a
need for more of this type of education with less emphasis on arts and
science programs.
- Area Community Colleges that assumed responsibility for one or more
junior colleges were not able to aggressively implement vocational and
technical programs during the early years of the area school movement
in Iowa. Now that these institutions are able to implement vocational-
technical programs, state and federal vocational education funds have
been committed elsewhere.

tienal clusters idenLi:Hed
when compared to e771.-.7-7.ent
area
and/or ex-loraLi
career (:cice,;.
- Population trend and the _slate L.encra
`.
area school administrators to extend vocational and t..eL:Lf_&_
lengths to disproportionate )engths, in order to kee;
financially solvent.
- Council survey results reveal that selected academic instruction in
the majority of area schools is related to the world oi work, itowcver,
lesser numbers of couuaunication skills instructors devote an): tine Lo
skill building in interpreting technical illustrations and developilva an
understanding of colamon legal terminology.
- The 1971 vocational-technical student follow-up efforts and the re-
sultant reports do not reflect the reasons for almost lorty-live per
cent of the post secondary vocational-technical enrollees experiencin
some form of unemployment or not reporting their status.
- Current efforts at folloWing-up of both vocational-technical and arts
and science students enrolled in area schools lack sufficient detail
to yield useful management information.
- The post secondary vocational and technical instructors, sampled by a
Council survey, report that generally their instructional equipment is in
serviceable condition, however; in the not-to-distant future, an exten-
sive replacement program may need to be implemented.

- State appro,Driations aria allocazlions :c5:
technical programs are less than :L'eheral aid
grad ate study at the regents instiLutiorls
aid appropriations for area scc,eis. erleral
schools have been far 4reater than those for
education.
Area schools, state wide, are speiading slightly more c. Lher
3/4 mill tax levy on vocational technical programs than
science programs.
- Costs of like types of programs among area schools vary groativ.
Pt: S.7- ST-7C7::::A1-7:- ;11, s.
The Council reco=ends tha::
FuLure Stare Plans re,-
Jgreater Ce:ail. _uon: 1_Vi7
will be 1,-nulolted.
5Lcondary
2. Primary emphasis should be given for the .1s.
funds to broadening the vocational-technica: proram
area schools with limited offerings. Secondary emphasis should :c
given to expansion of program offering in schools already p:;(2 in;:
a broad offering.
3. Opportunities for residents of the StJdte to attend any area
school in the State be continued.
4. Area schools that have voids in their program offerings in the
fields of distribution, home economics, health occupations, and
agriculture should implement programs in these occupational fields,
keyed to labor market needs, to provide programs for students who
have talents and interests in these fields of employment trainilv-
5. Area Schools should provide structured occupational exploration
opportunities for those students who are doubtful about career op-
portunities.
6. Area schools excercise caution in implementing technical level
and home economics programs to be reasonably sure employment oppor-
tunities will exist for program graduates.

"L-
be adiul.,_,Hj
basic le4a1
9. Follo-up effcrt be vasti'; improvcd or both ocaticnli
technical studenbH and rLs and science student-, and that con-
sideration be given to the establishment of a centralized aencv
to assume responsibility for this work.
10. Legislative action be taken to provide for area school to
accumulate funds based on the depreciation rates of capital c.uip-
ment.
11. An assessment of area school vocationa-te-.:hnical prorams be
keyed to achieve the most efficient cost-quality ratio.

i.
A. SOCKS
Good, Carter V. (Ed.) Dictionary of Educat ion. New York: !cGraw :1_,Book Company Inc., 1959.
B. PUBLICATIONS OF GCVERNMENT, LEARNED SOCIETIES & OTHER C.RANIZATIONS
Acts and Joint Resolutions, First Re:_:ular Session, Sixty-Second 7,eneraiAssembly, State of Iowa, 1967.
3. Acts and Joint Resolutions, First Re:1;ular Session, Sixty-Tird GeneralAsembly, State of Iowa, 1969.
4. Acts and Joint Resolutions, First Regular Session, Sixty-Fourth GeneralAssembly, State of Iowa, 1971.
5. Annual Descriptive Report, 0E-4041, 1967-68,Program Developments and Ac-complishments, Iowa Department of Public Instruction, Des Moines.
5. Annual Descriptive Report, 0E-4041, 1968-69, Program Developments andAccomplishments, Iowa Department of Public Instruction, Des Moines.
7. Annual Report for Career Education, Fiscal Year 1971, Iowa Department ofPublic Instruction, Des Moines.
8. Career Education, U. S. Government Printing Office, Washington, 1971.
9. Code of Iowa, Volume I, State of Iowa, Des Moines, 1970.
10. Data on Iowa's Area Schools, Iowa Department of Public Instruction, DesMoines, 1971.
11. Data on Iowa Schools, Part 1, School Year 1970-1971, Iowa Department ofPublic Instruction, Des Moines.
12. Data on Iowa Schools, Part 2, School Year 1970-1971, Iowa Department ofPublic Instruction, Des Moines.
13. Data on Iowa Schools, Part 3, School Year 1970-1971, Iowa Department ofPublic Instruction, Des Moines.
14. Definition of Terms in Vocational Technical and Practical Arts Education,American Vocational Association, Washington, 1968.
15. Enrollment Projection Study, by Midwest Research Institute under contractwith Higher Education Facilities Commission, ties Moines, 1971.

l. Federal Annual Reprts 7L-L, to T. 5. ..ffice Eciucatic,n, 14 fl-,
ins,truct;-7n, Jes _oanes.
Fail Ter17, Enr01177,ent, 1971, Iowa Departmen: cfMoines, 1971.
16. Improving Education For Iowans, C;oyer:.or's Ed.JcationAcis ry Cc.ittee.Des Moines, 1971.
1. U. S. !1,..annower in t'ne 1'. S. -.1,,,,r:Lmen:
Office, Washington.
.20. Manpower Needs in Iowa by Occupation, Iowa Employment Security C,is:-;ion,Des Moines, 1972.
21. New Programs in Iowa's Area Schools, 1971-72, Iowa Department of PublicInstruction, Des Moines.
22. Occupational Requirements for Vocational Education, Fiscal Year 1973,__-Iowa Employment Security Codmiission, Des Moines.
23. Projected Manpower Needs for Iowa, 1970-75, Iowa ETployment Security Com-mission, Des Moines, 1970.
24. Several Population Characteristics, Iowa, (1970 Census of Population)U. S. Department of Commerce, Government Printing Office, Washington, 1971.
25. A Profile of Iowa College and High School Students, by Thomas WolffAssociates under contract with Iowa Higher Education Facilities Commission,Des Moines, 1969.
26. Public Law 88-210, Vocational Education Act of 1963, Government PrintingOffice, Washington, 1963.
27. Public Law 90-576, Amendments to the Vocational Education Ac L of 1963,Government Printing Office, Washington, 168.
28. State Plan for Career Education, Parts I, II, and III, Iowa Department of---- -Public Instruction, Des Moines, 1971-72.
29. Student Follow-Up, 1971 Career Education, Iowa Department of Public Instruc-tion, Des Moines, 1971.
C. PERIODICALS
30. Business Conditions, Federal Reserve Bank of Chicago, October, 1971.
31. Business Conditions, Federal Reserve Bank of Chicago, November, 1971.
ESSAYS ANT-) ARTICLES IN COLLECTI,,INS
32. Resorces _ et al.Pres's,
YNPI2ELISiiED MATERIALS
31. Auditcr's Re.-7=c)r: (for all area se els as o June 30, 1971),State Office, DeL;
S71a-Le
3A. Career Education Advisor Council Minutes, Meetin,:s of Neve:711DerMay 18, 1972 and June 22, 1972, Des Moines.
35. Consolidated Report, Area Coot Collec,es, for Fiscal Years 1918, 1969,1970 and 1971, Auditor of State Office, Des Moines.
36. Cost Analysis - Career Education Programs, 1970-71, Council Bluffs PublicSchools, 1971.
37. Proposal for Exemplary Pro_rams in Pre-Career Education, Iowa StateUniversity, Ames, 1971.
38. Pottawattamie Count Exemplary Project, Pottawattamie County Board ofEducation, Council Bluffs, Iowa, 1969.
39. Pre-Career Education Project, Polk County Board of Education, Des Moines,1971.
40. Student Follow-Up Reports from Fourteen of the Fifteen Area Schools forSc:nool Year 1970-1971.
41. Survey of Student Interest in Career Education for 1972-73 Hitih SchoolSeniors, Des Moines Area Community College, Ankeny, 1972.
42. Total Pre-Career Education, Monticello Community School District,Monticello, Iowa, 1971.
43. Annual Report to U. S. Office of Education, Iowa Department of PublicInstruction, E,as Moines, 1970.
F. PERSONAL INTERVIEWS
44. Fenton, Keith, President, American Institute of Business, Des Moines,(Phone Cor-fersation), July 13, 1972.
45. Mattison, Merwyn, Guidance Director, Mason ciLy Community School District,Mason City, (Phone Conversation) September 13, 1972.

;
: ;es. C,:lvcrsaticn)
?1,:cel, Dr. Da- _d, Associate
orlveraLmon-e , _
S-jrines, Richard J., Director, State Audit. Diviicn,04.--f4ce, (Pei-onal S ;,teTbo t,
CCEI:.ESPONDE1';CE DA2A
49. Bialcbrzeski, Wai:_er A., C.;:ief, -_-_,ureau of oc:tic,i7ial-Teci-.nical
State of Connecticut, Hartford, March 29, 1972. (Infor77ation onCentral Vocational Facility)
30. Davis, Harry F., Assistant Director of Vocational Education, State ofOhio, Columbus, April 3, 1972. (Information on Central VocationalFacility)
51. Gordon, Fred L., Vocational Program Supervisor, Trade and IndustrialUnit, State of Minnesota, St. Paul, March 31, 1972. (Information onCentral Vocational Facility)
52. Iowa Department of Public Instruction, Des Moines. (Vocational EducationBudgets for Fiscal Years 1968, 1969, 1970, 1971 and 1972)
53. Iowa Department of Public Instruction, Des Moines. (Career EducationPrograms in Secondary Schools 1971-72) (Dittoed)
54. Jacoby, Robert, Director of Program Services, Commonwealth of Pennsyl-vania, Harrisburg, March 2, 1972. (Information on Certral VocationalFacility)
55. Pucel, Dr. David J., Associate Professor, University of Minnesota,Minneapolis, May 12, 1972. (Information on Student Follow-Up System)
56. Schuermann, William 0., Director of Ca-1_ !f Education, State of Iowa,Des Moines, May 24, 1972. (Information on Area School Secondary StudentEnrollments, and New and Expanded Programs)
57. Stevenson, Dr. William, Assistant State Director of Vocational Education,State of Oklahoma, Stillwater, March 29, 1972. (Information on CentralVocational Facility)

APPENDIX

INVT:NTRY
November 17, lc,o7o
May 25, 19i1
June 25, 1971
v,,
Hedrint:.
ounci1 Elu: - Scool
CouncilLewis Central Counit.vIowa Western Co,n:Ilur,ity Colle:ge
Conducted Public Heari ;e'
Decorah - Schools visited.
Decorah CommunitySouth Winneshiek - Calmarfloward-Winneshiek Community - CrescoNortheast Iowa Area Voc. Tech. SchoolConducted Public Hearing
Estherville - Schools visited.
Emalletsburg CommunityEstherville Ccthililuni.ty
Iowa Lakes Community CollegeBlue Earth Minnesota CentralVocational FacilityConducted Public Hearing
July 1971 through June 1972
No.:ember 18, 1971 Ottumwa - Schools visited.
Ottumwa CommunityDavis County Community - BloomfieldEddyville CommunityIowa Tech Community CollegeConducted Public Hearing
May 18, 1972 Sioux City -. Schools visited.
Sioux City CommunityLaMars CommunityWestern Iowa TechConducted Public Hearing