Embed Size (px)
Citation preview

DOCUMENT RESUME
ED 271 066 HE 019 447
AUTHOR Cameron, Kim S.TITLE The Effectiveness of Ineffectiveness: A New Approach
to Assessing Patterns of OrganizationalEffectiveness.
INSTITUTION National Center for Higher Education ManagementSystems, Boulder, Colo.
SPONS AGENCY National Inst. of Education (ED), Washington, DC.PUB DATE Sep 82CONTRACT 400-80-0109NOTE 92p.PUB TYPE Reports - Descriptive (141)
EDRS PRICE MF01/PC04 Plus Postage.DESCRIPTORS *Change Strategies; Evaluation Criteria; *Evaluation
Methods; Higher Education; Models; *Needs Assessment;*Organizational Effectiveness; *Problem Solving
IDENTIFIERS *Fault Tree Analysis
ABSTRACTA way to assess and ih?rove organizational
effectiveness is discussed, with a focus on factors that inhibitsuccessful organizational performance. The basic assumption is thatit is easier, more accurate, and more beneficial for individuals andorganizations to identify criteria ot ineffectiveness (faults andweaknesses) than to identify criteria of effectiveness(competencies). An organization is defined as being effe.Live to theextent that it is free from characteristics of ineffectiveness. Thetechnique for assessing and improving organizational effectiveness iscalled "fault tree analysis." Seven steps used in fault tree analysiswhen assessing organizational effectiveness include: answer sevencritical questions to limit the scope of the assessment, determinethe to fault and contributing faults, analyze specifics to identifya change strategy, determine weights for the faults throughsubjective judgments of importance and frequency, compute primary andsecondary strategic paths through logic gates, and identifyprioritized change strategies for improving organizationaleffectiveness. Advantages and disadvantages of fault tree analysisare considered, and an example of a private liberal arts college isused to identify indicators of ineffectiveness. Finally, seven modelsof organizational effectiveness are compared. (SW)
************************************************************************ Reproductions supplied by EDRS are the best that can be made *
* from the original document. *
**********************************************************************

THE EFFECTIVENESS OF INEFFECTIVENESS:
A NEW APPROACH TO ASSESSING PATTERNS OF.)O ORGANIZATIONAL EFFECTIVENESS
r-4
CNi
Kim S. CameronNational Center for Higher Education Management Systems
P.O. Drawer PBoulder, CO 80302
U S DEPARTMENT OF EDUCATIONOffice of Ed nal Research and Improvemen!
EDUCAT1 ALOEERIC)
INFORMATION(
a document has been reproduced asreceived from the person or oreantzi. on
originating itMinor.changea have been made to improve
reproduction Quality
Points of view or opt mons stated in this clocu
ment do not necessarily represent Official
OE RI position or policy
September 1982
Preparation of this research was sponsored by the National Instituteof Education, contract number 400-80-0109.
2

A
ABSTRACT
This essay introduces a new approach to assessing and improving
organizational effectiveness. It focuses on the factors thatinhibit successful organizational performance rather than on factors
that contribute to or indicate successful organizational performance.Its basic assumption Is that it is easier, more accurate, and morebeneficial for individuals, and organizations, to identify criteriaof ineffectiveness (faults and weaknesses) than to identify criteria
of effectiveness (competencies). Under this approach an organizationis defined as being effective to the extent that it is free fromcharacteristics of ineffectiveness. A technique for assessing andimproving organizational effectiveness, called Fault Tree Analysis,
is explained and illustrated. Advantages and disadvantages of thistechnique are discussed relative to research in higher education.
3

THE EFFECTIVENESS OF INEFFECTIVENESS
Organizational effectiveness is an enigma. On the one hand, it is
probably the most central construct in organizational behavior. On the
other hand, its definition and meaning are ambiguous, and there has never
been agreement on how to measure it. Effectivene .is is both apex and abyss
in organization behavior research. It is an apex in the sense that all
conceptualizations and theories of organizations are aimed, ultimateki, at
identifying effective performance. It is the fundamental dependent
variable in organizational investigations, and Judgments of effectiveness
and ineffectiveness are an inherent part of the activities of
theoreticians, researchers, and practitioners in organizations. It is an
abyss in the sense that no valid theories of organizational effectiveness
exist in organizational behavior, and no list of criteria has ever been
formulated that is either necessary or sufficient for evaluating the
construct. Moreover, the Judgments of effectiveness made by individuals
frequently are based on an unidentifiable set of preferences and
assumptions.
In this essay, reasons why organizational effectiveness is enigmatic
are discussed first, and it is argued that there are functions as well as
dysfunctions In keeping the construct of effectiveness confusing. In the
second part of the essay, a new approach to defining and investigating
organizational effectiveness is discussed which addresses some of the
problems inherent in the construct. and an illustration of the usefulness
of this approach in assessing organizational effectiveness is presented.
The essay concludes by comparing several major approaches to effectiveness
1

-11.111111/M.^.R.R,."--
with this new approach, and suggestions are made of research settings in
which each approach is most appropriate.
Reasons For the Enigma
Organizational effectiveness remains an enigma for two primary
reasons--one is conceptual the other is empirical. In this section, the
conceptual reasons are discussed first followed by the empirical reasons.
Multiple Conceptualizations of Organizations
The construct of organizational effectiveness is closely associated
with conceptualizations of organizations. That is, distinctions between
effective and ineffective designs, performance, processes, and so forth,
are an inherent part of any view of what an organization is. Variety in
conceptualizations of organizations. therefore. leads to variety in models
and approaches to organizational effectiveness.
Organizations have been conceptualized in numerous ways in the
literature of organizational behavior. For example, organizations have
been called networks of objects (Tichy & Fombrun, 1979), rational entities
in pursuit of goals (Perrow, 1970), coalitions of powerful constituencies
(Pfeffer & Salancik, 1978), individual need-meeting cooperatives
(Cummings) 1977), meaning-producing systems (Pondy & Mitroff, 1979),
Information - processing units (Galbraith, 1977), open systems (Thompson,
1967), collegiums (Millett, 1962). garbage cans (March & Olsen, 1976).
language games (Wittgenstein, 1968). psychic prisons (Morgan, 1980).
machines (Taylor, 1911), social contracts (Keeley, 1980), and so on. Each
of these conceptualizations highlights, even uncovers, organizational
phenomena that were missed or ignored by the others. Research conducted
under these different conceptualizations focuses on different phenomena,
2

proposes different relationships among variables, and Judges effectiveness
differently.
In the organizational sciences. however, there simply are no
universally accepted conceptualizations of organizations. One reason is
that unlike the physical sciences. for example, the worth of
conceptualizations of organizations is Judged on the basis of their
completeness, not on the basis of thei- accuracy. That is,
conceptualizations are accepted if they highlight relevant organizational
phenomena previously ignored in other models. The emphasis is on
elaborating. not replacing, previous models. In the physical sciences.
conceptualizations are accepted if they accurately map the objective
world. No conceptualization so far has mapped all the relevant phenomena
in an organization, nor have any intended to, and therefore each is
inherently incomplete,1
This is not to argue, of course, that there should be only one
conceptualization of organizations and therefore only one model of
organizational effectiveness. In fact, there are important reasons for
perpetuating multiple conceptualizations and multiple models of
effectiveness. Variety in conceptualizations of organizations serves a
useful purpose. Davis (1971) pointed out that what is interesting about
organizations can only be uncovered by contradicting commonly held
propositions. Rothenburg (1979) discussed Janusian thinking (i.e.,
holding contradictory thoughts simultaneously in the mind) as the most
productive means for scholarly progress. Welck (1977) illustrated a
contradictory approach to effectiveness by pointing out contradictory
examples of commonly held criteria of smooth functioning organizations.
Though organizations are efficient and controlled, for example, they also
3

are clumsy and wandering. Morgan (1980) pointed out that increased
insight can be achieved by using a variety of metaphors to describe
organizations. not just one.
Viewing organizations systematically as cyberneticsystems. loosely coupled systems. ecological systems.theaters. cultures. political systems. language games.texts. accomplishments. enactments. psychic prisons.instruments of domination, schismatic systems.catastrophes. etc., it is rossible to add rich andcreative dimensions to organization theory [p. 615].
Daft and Wiginton (1979) suggested that not only is a single
conceptualization impossible because of the limitations of language, or of
the symbr's used to make sense of organizations. but multiple symbols,
models, and metaphors have utility in organizational behavior in capturing
the complexity inherent In organizational rJenomena.
Some writers on organizational effectivenes-, have continued to
advocate the replacement of other models of effectiveness with their own
models (Bluedorn, 1980; Connolly, Conlon, & Deutsch, 1980; Kilmann
Herden, 1976; Price. 1972; Stasser & Denniston. 1979). These arguments
have not proven fruitful, however, because the different models are based
on different conceptualizations of what an organization Is. The
differences among the models relate to disparate emphases. not to
superiority of one over the other (Cameron and Whetten. 1983). An
effective organization-as-social-contract (Keeley, 1980). for example, is
not the same as. and may even be contradictory to. an effective
organization-as-rational-goal-pursuer (Scott, 1977). The first
conceptualization emphasizes an absence of organizational goals and
purposes where participant needs are supreme. The second emphasizes the
presence of organizational goals and purposes where participant needs are
subordinate to organizational accomplishment. Multiple constituency
4
7

models of effectiveness (Connolly et. al., 1980; Miles, 1980; Pfeffer &
Salancik, 1978) are consistent with the first case, while the goal model
(Biuedorn, 1980; Campbell, 1977; Price, 1972; Scott, 1977) follows from
the second.
Construct Space
Variety in definitions and approaches to organizational effectiveness
results not only from association with different conceptualizations of
organizations. but also from its nature as a construct. Constructs in the
social sciences are abstractions that give meaning to ideas or mental
images. but they have no objective reality. They exist in the minds of
Individuals, and they are only inferred from observable phenomena. Other
examples of constructs are leadership, intelligence, satisfaction, and
motivation.2 It is inherent in the definition of a construct that the
total meaning of the phenomenon can never be completely circumscribed.
That is, the necessary and sufficient evidence for identifying the
presence of a construct cannot be explicated because the meaning of
constructs is, ultimately, a product of mental imagery. When identifying
constructs in the objective world, individuals may arbitrarily select
indicators of the construct, or they may substitute the construct with a
conceot (i.e., with a more narrow phenomenon that has an objective
referent outside the mind of the individual). However, these indicators
and concepts may not be the same across individuals, and there is no
comprehensive list that must be used by everyone.
Compare the construct of organizational effectiveness with the
construct of insanity, for example. In both cases, individuals may
observe similar phenomena but make disparate judgments about whether the
phenomena indicate the presence of the construct. When asked to identify
5

indicators of these constructs, widely differing lists may be produced.
even by experts. And, as evidenced by the case of John Hinkley Jr.'s
insanity verdict in 1982, when Judgments are made about the presence or
absence of these constructs, contradictory opinions about the accuracy of
those Judgments are probable.
The construct of organizational effectiveness is enigmatic, then,
because Judgments of effectiveness are made regularly by people, but there
are no consensual criteria available upon which to make those Judgments.
Limited agreement has been reached on some criteria by some individuals.
but the agreement is by no means universal. Therefore. advocates of the
goal model (Bluedorn, 1980; Price, 1972). the system resource model
(Seashore & Yuchtman 1967). the internal processes or maintenance model
(Bennis, 1966; Nadler & Tushman, 1980), the strategic constituencies model
(Connolly, et. al., 1980; Kelley, 1978; Pfeffer & Salancik, 1978). the
legitimacy model (Miles & Cameron, 1982; Zammuto. 1982). and the competing
values model (Quinn and Rohr5augh, 1982) all are correct in some
circumstances. But none of these models captures the total construct
space or the total meaning of effectiveness, Whereas each is valuable in
its own right because it includes distinctions absent in the others. none
has enough explanatory power to supercede other approaches.
This Implies that the "construct space" of organizational
effectiveness cannot be totally mapped. And when advocates of various
approaches to effectiveness adopt one exclusionary stance--that is. when
their model is presented as the necessary and suffIcient one--motivatIon
to map more of the construct space is Inhibited. Effectiveness, then,
should be treated as representing an unmapped terrain where different
6
9

approaches and model? add to the completeness of the map, and debates
about the accuracy of one viewpoint versus another are put aside.
Preference-Based Criteria
This construct characteristic of organizational effectiveness leads
to the second major reason for its being enigmatic: the importance of
measuring effectiveness in organizations but the inability to identify
criteria precisely. It is to be expected that when the construct space of
effectiveness is unclear, its measurement also will be unclear. But
empirically, the reason that consensual criteria for assessing
effectiveness have not been produced is that organizational effectiveness
is inherently subjective --that is, it is based on the personal values and
preferences of individuals. There are several difficulties with
attempting to assess individual preferences and values in research on
effectiveness. One problem is that individuals have difficulty
explicating their preferences. Nisbet and Wilson (1977) and Slovic and
Lichtenstein (1971) each reviewed a large number of empirical studies and
drew the conclusion that individuals are not good at specifying their
preferences. Individuals' behavior or judgments, and the criteria upon
which those behaviors and judgments are based. are not tightly coupled
(see, also, Argyris and Schon, 1978, for a discussion of the distinction
between theories-in-action and theories-in-use).
Another problem with assessing preferences is that preferences are
not stable. They may change to justify previous behavior, in response to
organizational Ilfe cycle development. or as different constituencies
achieve power. For example, a great deal of research in social psychology
has demonstrated that preference changes frequently follow from behavior
changes (see Brehm & Cohen, 1962, and Sherwood, Barron. & Fitch, 1969, for

reviews). Cameron and Whetten (1981). Miles and Cameron (1982), and Quinn
and Cameron (1982) found evidence that changes in preferences related to
effectiveness occurred as organizations progressed through their life
cycles. MacDonald (1975), Miles and Cameron (1982), and Zammuto (1982)
pointed out examples of change; in preferences as a result of different
constituencies in organizations obtaining more (or less) power. Changing
preferences can complicate the assessment of organizational effectiveness.
therefore. because depending on xhaa the assessment is made, the relevant
criteria of effectiveness may differ markedly. The relationships among
criteria at two different points in time often are not clear. so that
effectiveness in the past may not be a good predictor of effectiveness in
the present or the future.
A third problem with preferences that inhibits consensual criteria in
assessing effectiveness Is that individuals. and organizations. may hold
contradictory preferences simultaneously. That is. tney may pursue two
mutually exclusive. desirable end states (e.g., to increase adaptability
and therefore slack resources in the organization and. at the same time.
to improve efficiency and therefore to decrease slack resources).
Cameron's (1;81) research on colleges and universities. and Miles and
Cameron's (1982) investigation of the U.S. tobacco industry illustrate how
organizations pursue criteria of effectiveness that conflict with one
another. In these organ'_dtions, and in others. contradictory preferences
for effectiveness in organizations led to "incrementalism" (i.e., trading
off one set of preferences against another; Lindblom, 1959). "satisficii.g"
(i.e., fulfilling all preferences to only a limited extent; Simon. 1947).
or "sequencing" (i.e., alternating emphasis among preferences; Cyert
March, 1963). Identifying accurate criteria of effectiveness under these
8
1

conditions is difficult. however. because it is no clear which
preference', are being advanced.
In addition. several studies have found that different constituencies
hold preferences that are negatively related to one another (Dubin. 1976;
Friedlander & Pickle. 1968; Rohrbaugh. 1981; Whetten. 1978). This
incompatibility of constituency preferences makes it difficult to identify
which individuals should specify criteria of effectiveness. Since all
possible constituencies can never be tapped. and since the preferences
both within and between constituencies frequently conflict. it often
becomes an arbitrary choice of the researcher to select preferences that
are easily accessible or that have been used in other :_vestigations.
On the other hand. multiple and contradictory preferences may serve a
useful purpose because they allow organizations to be Judged
effective--and consequently to acquire needed resources from various
constituencies--even though widely different types and levels of
performance are displayed. Variety in preferences contributes to
discretion and freedom of action for organizations because they are bound
to "satisfy some of the people some of the time" no matter what they do.
In addition. they are provided with the freedom to manage the image or
impressions of effectiveness. regardless of levels of objective
performances (Pfeffer, 1981). It is this variety in performance, in the
popuiation ecology view, that enhances the probability of organizat. -nal
survival (Hannan & Freeman. 1977).
Empirically, organizational effectiveness is enigmatic. therefore.
because it is based on individuals' subjective preferences. Because these
preferences are unstable. contradictory, and multiple, it Is difficult to
precisely measure effectiveness in organizations. But this unstability,

contradiction. and multiplicity may actually enhance the effectiveness and
survival of the organizations themselves.
This enigma in organizational effectiveness has led to severe. but
justifiable. criticism of the research conducted on the subject. In the
past two decades, at least eight books have been produced on tt subject
of organizational effectiveness (Cameron & Whetten. 1983; Ghorpade, 1970;
Goodman & Pennings. 1977; Mott. 1972; Price, 1968; Spray, 1976; Steers.
1977; Zammuto, 1982). Without excepti -,n. each begins by pointing out the
conceptual disarray and methodological ambiguity surrounding this
construct. In addition, several hundred articles & 1 book chapters have
been written in that period (see Cameron, 1982, for a comprehensive
bibliography). mnd almost all acknowledge that little agreement exists
regarding what organizational effectiveness means or how to properly
assess it. The writing has been fragmented. noncumulative, and frequently
downright confusing. Some writers have become so discouraged by the
literature on effectiveness that they have advocated abandoning the
construct altogether in scholarly activity (Hannan & Freeman. 1977b).
Goodman. (1979a) for example, asserted that "there should be a moratorium
on al: studies of organizational effectiveness. books on organizational
effectiveness, and cheaters on organizational effectiveness (p. 4)."
This abandonment of organizational effectiveness. of course. is both
impossible (i.e., it is a construct that is firmly embedded In both
scholarly and lay language) and unwise (i.e., it serves as an important
variable in research and as an important construct in interpreting
organizational phenomena). However. some suggestions for improving
rese&rch on organizational effectiveness are needed given the confused
;.,,to of the literature. In the next section of this essay, a new

approach to assessing effectiveness Is introduced and an alternative
working definition of the construct is proposed. This suggest; is not
to be construed as a replacement for other avroaches and definitions.
rather it is an alternative that helps address some of the problems faced
by past researchers. and it provides practical guidelines for those faced
with evaluating and Improving effectiveness. It also holds certain
advantages over many of the approaches to assessing effectiveness
currently being used.
Quanizelonal Effectiveness As A Fault Tree
This alternative approach to organizational effectiveness focuses on
the factors that Inhibit successful organizational performance rather than
on the factors that contribute to or indicate successful organizational
performance. It is based on the notion that it is both easier and more
accurate for individuals. and organizations. to Identify criteria of
ineffectiveness--that is. faults or weaknesses--than it Is to identify
criteria of effectiveness--that is. competencies or desirable outcomes.
This alternative approach merges the "critical questions" in assessing
effectiveness ad.anced by Cameron and Whetten (1983) with "fault tree
analysis" (Haasl, 1965)--a procedure developed to analyze systems in the
field of safety engineering.
The explanation of this alternative approach to organizational
effectiveness first considers the advantages of focusing on
Ineffectiveness as opposed to effectiveness in assessments of
organizations. Second. the history and development of fault tree analysis
is briefly expiained. and an explanation is provided for how to construct
and analyze fault trees In assessing organizational ineffectiveness.
Third. the advantages and disadvantages of this approach are discussed in
11
14

comparison to otver common approaches to effectiveness. Finally. an
example of the actual use of fault tree analysis in analyzing an
organization is provided for illustrative purposes.
AdvanJ'ages or ineffectiveness
The difficulty of identifying appropriate criteria stands as the
single most important problem it organizational effectiveness research
(Brewer. 1982; Cameron, 1978; Campbell, Brownas. Peterson. and Dunette.
1974; Nord. 1982). Most of the criticism of the literature has focused on
the reliability, validity, and generalizability of the criteria used in
assessments. One reason for this difficulty in Identifying criteria is.
as discussed above, the nature of the construct itself. Another important
reason pointed out earlier is the difficulty individuals encounter in
trying to identify indicators of success. Val de Ven and Ferry (1980)
found. in attempting to generate criteria of effectiveness among
constituencies in the Wisconsin Job Service and in some Texas child-care
organizations. for example, that individuals had great difficulty
producing effectiveness criteria "because users had not operationalized
their value judgments in their own minds . . . [and] as might be
expected. users found it impossible to formulate criteria they would use
to measure intangible goals [p. 46]." Van de Ven and Ferry ccncluded that
"users could not break out of their reactive role and proact by generating
new effectiveness measures. even when asked to do so but not provided with
a process for doing so [p. 47]."
Shulz, Greenley, and Peterson (1982) discovered. in their study of
hospital effectiveness, that respondents found it much easier to identify
weaknesses (or indicators of ineffectiveness) than strengths of their
12
15

organization (or indicators of effectiveness). Generating criteria
Indicating success was a major obstacle for respondents.
It also has been discovered that organizational change and
Improvement is motivated more by knowledge of problems than by knowledge
of successes. Negative feedback is more conducive to advancement than is
positive feedback. For example. Hirschman and Lindblom (1962) studied
decision making in public administration, international economic
development agencies. and research and engineering programs and concluded
that the stress produced by negative pc-formance feedback was the
necessary precondition for organizational learning. Cangeiosi and Dill
(1965). in an investigation of simulated business firm performance
concluded: "Failure. we agree. leads to change. The consequences of
success, we argue. are less clear [p. 196]." Miles and Randolph (1980)
found similar associations between organizational learning. organizational
effectiveness, and negative feedback about performance. Individuals took
more responsibility for organizational outcomes when negative information
was received instead of positive information. coordination of tasks became
more advanced in organizations receiving negative information than among
those receiving positive information, and faster and greater quantities of
organizational learning were present in organizations receiving negative
performance feedback compared to those receiving positive performance
feedback. %Nisi, Randolph, and Blencoe (1982) concluded after a study of
the effects of feedback on individual and group performance:
It is noteworthy that...objective performance actuallyimproved significantly following negative individuallevel feedback from peers. and negative group levelfeedback from a superior [p. 178].
13

These empirical results are consistent with common experience which
indicates that individuals have an easier time identifying faults than
positive traits in others. as well as In themselves. they are motivated to
Improve their own behavior more readily when weaknesses rather than
strengths are pointed out. and negative feedback is given much more
attention than is positive feedback when received from significant others.
Stephens (1976) concluded that individuals are also prone to reach
agreement more easily on characteristics of failure than on
characteristics of success.
Analysis in terms of success. however, is much moreproblematic *flan analysis in terms of failure. Not
only is it difficult to achieve consensus as to thosedesign characteristics and functions. the channels andInteractions. which lead to system success, butexperience has shown that in complex systems. it ismuch easier to describe and achieve consensus as towhat constitutes failure. When a system isfunctioning smoothly, it is not at all easy to specifyprecisely what combinations of events contribute tothis state. But when breakdowns occur, they areimmediately apparent, although their causes and their"downstream" effects may be more obscure [p. 3].
All this is to say that the construct space of Ineffectiveness
appears to be more narrow and more easily mapped than is the construct
space of effectiveness. Preferences are more easily identified.
Moreover, there is evidence to suggest that organizational improvement Is
more likely when knowledge of faults is present than when knowledge of
successes is present.3 It seems reasonable to suggest. then. that an
approach to assessing organizational ineffectiveness instead of
effectiveness may prove beneficial in increasing understanding of
organizational performance and in helping to improve organizational
functioning. Under this approach organizational effectiveness takes on
14
1 7

the following definition: An_organization_iiefective to the extent that
.jis free of characteristics of Ineffectiveness.4
A particular technique for analyzing organizational ineffectiveness
has been developed In the field of safety engineering, but it has not been
applied widely In the organizational sciences. This technique, called
fault tree analysis, is explained in some detail in the paragraphs below.
)An Explanation of Fault Tree Analysis
Fault tree analysis provides a well-developed procedure for
systematically identifying indicators of ineffectiveness. The criteria of
ineffectiveness are the faults. weaknesses. or major problems exsiting in
an organization. The analysis focuses on these faults. therefore. instead
of on indicators of organizational success. Fault tree analysis is
generally thoughT of as a procedure for increasing the likelihood of
success in any system by analyzing the most likely causes of failure
(Stephens, 1972). It is a technique of reliability analysis used to
diagnose potential or real problems in systems. Unlike conventional forms
of reliability analysis in systems engineering, fault tree analysis relies
on deductive processes rather than inductive processes. That is.
conventional reliability analysis techniques are concerned with assuring
that all discrete parts of a system will reliably accomplish their
assigned functions (e.g., do ai: elements in a light bulb work properly?).
Fault tree analysis is concerned with relating a single fault or failure
to the various parts of a system that may be casually connected (e.g.,
what factors are related to the light not turning on?).
Fault tree analysis was developed by H. A. Watson at Bell
Laboratories in 1961 (Fussell, Powers. Bennetts. 1974). Its original
purpose was to eva:uate the safety of the Minuteman Launch Control System
15
18

In order to prevent the accidental launching of a missile. The
applicability of fault tree analysis to the aerospace industry was
recognized by Individuals at North American Aviation (Hiltz, 1963) and at
Boeing Company, so that in 1965 a symposium was held to Introduce the
technique to a wider audience and to acquaint others with refinements and
modifications (Mearns. 1965; Haasl, 1965; Michels. 1965; Nagel, 1965;
Feutz b Waldeck, 1965). Fault tree analysis bezame an accepted technique
of reliability analysis in seety engineering over the next ten years. but
Its application stayed mostly in the area of non-human systems. Most of
the literature produced on the technique was discussions of quantification
advancements and computer program refinements. Until the mid- 1970,s.
there were almost no applications of fault tree analysis to systems
involving human behavior, mainly because of the unreliability of
predicting failures In that behavior.
However, beginning with the first application of fault tree analysis
outside the field of safety engineering by Witkin and Stephens (1968) in
the Alameda County vocational education program In California, a number of
doctoral dissertations in the field of educational administration have
been written using fault tree analysis. These were written largely under
the tutelage of Kent Stephens. a former member of the Boeing aerospace
group (see references for a listing of the dissertations). No research
other than those dissertations has been published related to behavioral
systems to date. however. Furthermore, none of those applications were
concerned explicitly with evaluating organizational ineffectiveness.
Instead. most focused on more narrow phenomena such as teacher turnover,
student self-confidence. management behavior, and so on. The use of fault
16
19

tree analysis In effectiveness research, therefore. is largely virgin
territory.
In order to understand this technique and its applicability to the
assessment of ineffectiveness, the components of fault tree analysis and
the procedures used to construct fault trees are explained below.5 (For a
more detailed discussion on this technique see references to fault tree
analysis at the end of this essay.)
tical Questions In Assessing Ineffectiveness
Prior to constructing a fault tree--that Is. prior to identifying
faults or problems In an organization--analysts must consider seven
critical questions that both define and circumscribe the scope of the
analysis. No study of effectiveness or ineffectiveness can include all
possible criteria from aIl possible points of view, so some way must be
found to specify precisely what the study does and does not include.
Seven critical questions discussed In Cameron and Whetten (1983) serve as
guidelines for circumscribing assessments. and they have particular
relevance when constructing fault trees. The critical questions are as
fol lows.
Question 1: From whose perspective is Ineffectiveness beinn_juagedi
Ineffectiveness must be defined and assessed from someone's
viewpoint. and it is important fa& the viewpoint be made explicit. The
criteria used by different constituencies to define ineffectiveness may
differ markedly, and there are no agreed upon decision rule's available tc
Identify one constituency's criteria as being more important than another
constituency's criteria. Organizations never satisfy all their
constituencies, and what appears to be high effectiveness from one point
17
20

of view may be interpreted as being mediocre or low effectiveness from
another point of view. The specific point of view being accepted.
therefore. must be made explicit.
guallion 21 On what domaln_of_activity Is the analyses focused?
Domains arise '-om the activities or primary tasks that are
emphasized in the organization. from the competencies of the organization.
and from the demands placed upon the organization by external forces
(Cameror.. 1981; Meyer, 1975). A variety of domains can be identified for
almost all organizations. but no organization is maximally effective in
all its domains. Moreover, the relevant criteria to be considered often
differ markedly in one domain versus another. It is important, therefore.
that the particular domain(s) to be assessed be clearly specified.
Question 3: What level_ol analysis is being used?
Judgments of ineffectiveness can be made at the individual level of
analysis. at the subunit level, at the organization level, at the
population or industry ievel, or at the societal level. Although
ineffectiveness on each of these different levels of analysis may be
interrelated. often it is not. and ineffectiveness on one level may be
independent of ineffectiveness on another level. Without attention being
paid to which level of analysis is most appropriate. meaningful Judgments
of ineffectiveness cannot be made.
18
21
Question 4: What Is the purpose for assessing ineffectiveness?
The purpose(s) for Judging ineffectiveness almost always affects the
Judgment Itself. For example. Brewer (1982) pointed out that changing the
purposes of the evaluation creates different consequences both for the
evaluator and for the unit being evaluared. Different data will be made
available. different sources will be appropriate. different amounts of
cooperation or resistance will be encountered. and different types of
assessment strategies will be required all as a result of differences in
purpose (also see Argyris. 1970). Sometimes the analyst can determine his
or her own purposes. but frequently the purposes for Judging
ineffectiveness will be prescribed a priori by the client. the
participants in the evaluation, or the external environment. Whatever the
case, a clear conception of purpose is critical.
.49.1.12.0iFIS1111112.114.1211
Selecting an appropriate time frame is important because long-term
ineffectiveness may be incompatible with short-term ineffectiveness. Some
organizations. for example. may tolerate short-term ineffectiveness in
order to obtain long-term effectiveness. or vice versa, so that not being
clear about what time frame is being employed could severly handicap an
assessment. Judgments of ineffectiveness are always made with some time
frame in mind. so it is important that the time frame be made explicit.
19
22

Question 6: What type of data are being used for Judgments of
iniffectiveness?
This invci!ves a chcice between using information collected by
individuals outside the organization with that collected by individuals
inside the organization itself. in addition. it involves a choice between
objective data (e.g., organizailonai records) or subjective. perceptual
data (e.g., interviews or questionnaire responses). Data collected inside
the organization has the advantage of being more fine-grained. detailed.
and potentially more accurate than data collected outside the
organization. but it also may be more biased and partial, especially
regarding areas of weakness. Data collected from individuals outside the
organization has the advantage of assessing the public image and effects
of organizational action. but it also may miss important phenomena without
an insider's view.
Objective data have the advantage of being quantifiable, potentially
less biased than individual perceptions. and representative Jf the
official organizational position. but often they are unavaiiable. The
advantage of the subjective or perceptual data is that a broader set of
criteria of ineffectiveness can be assessed from a wider variety of
perspectives. In addition. operative criteria or theories-in-use (Argyris
& Schon. 1978) can more easily be tapped. The disadvantages. however. are
that bias. dishonesty, or lack of information on the part of the
respondents may hinder the reliability and vai'dity of the data. The
selection of data by which to Judge ineffectiveness is important because
perceptions may generate one set of criteria of ineffec+Iveness while
objective data may indicate a totally different set (see Hail & Clark.
1970, for an example).

Question 7: What Is the referent against which Ineffectiveness is Judged?
There are a variety of referents or standards against which to Judge
organizational performance. For example, one alternative is to compare
the performance of two different organizations against the same set of
indicators (comparative judgment). A second alternative is to select a
standard or an ideal performance level and then compare the organization's
performance against the standard (normative judgment). A third
alternative is to compare organizational performance on the indicators
against the stated goals of the organization (goal-centered judgment). A
fourth alternative is to compare an organization's performance on the
indicators against its own past performance on the same indicators
(improvement Judgment). A fifth alternative is to evaluate an
organization on the basis of the static characteristics it possesses.
independent of its performance on certain indicators (trait judgment).
Effective organizations are judged to possess these characteristics.
Because Judgments of ineffectiveness can differ markedly depending on
which referent is used. it is important to be clear about the referent
that serves as the basis for those judgments.
As a result of answering these seven questions at the outset of en
assessment. the analyst can determine how dotalled the fault tree analysis
should ye, for whom the fault tree analysis will be most useful. and the
types of procedures to be used in gathering information for the
construction of a fault tree. Once those answers are specified. formal
fault tree analysis can proceed.
Identlfioljon otPrIterlanf_IneffectlygnAls
The first seep in constructing a fault tree involves the
identification of "top faults" (also called undesired events or critical
21
24

failures). A top fault Is a summary statement of the most crucial problem
In the organization. The top fault may be a compilation of several
related. but more minor problems. or it may stand alone. It Is
essentially the answer to the question: "What is it that keeps this
organization from being what it could be?" or "What Is the major indicator
of organizational ineffectiveness?" The top fault should be a problem
that Alactix inhibits the organization from being more effective (i.e.,
it keeps the the organization from acquiring needed resources. from
satisfying constituencies. from attaining goals. or In other ways
inhibited from being judged as effective). In any given organization.
there may be several top faults, but the number of top faults considered
should be limited in an analysis since a separate fault tree must be drawn
for each top fault.
A top fault should be identified through the use of a consensus
building technique such as nominal group or delphi--where a variety of
individuals identify what they consider to be the top fault(s). and -;hen a
consensus is reached. Or a critical incident methodology (Tarrant. 1963)
may be used where individuals are asked to agree on a critical failure
evert or problem in the organization's past that led to ineffectiveness.
The top fault may identify a problem that _could exist to make the
organization ineffective. but doesn't exist at present. This is the
general approach In safety engineering (e.g., the radar system could
fail). It may identify a past problem that is no longer directly present
(e.g., there was a black-out power failure in New York in 1975). Or it
may Identify a current problem that inhibits the organization from being
effective (e.g., profitability is declining). It is this last alternative
that is preferred in assessing organizational ineffectiveness. Once the
22
25

top event has been determined, it is placed at the top of the fault tree.
and analysis proceeds deductively.
After identifying the single most important top fault. the next step
in the analysis is to identify "primary faults." or factors that
contribute to the occurrence or presence of the top fault. These should
be factors that are directly related to the top fault in time, in space,
or in other ways. This step is a critical one because it Is the primary
faults that compose the branches of the fault tree. Therefore. selecting
the appropriate data sources (see critical questions 1 and 6 above) is an
important consideration. Fault tree analysis is designed not to analyze
all possible contributing factors to the top fault. Just those that are
major and directly related.
Or way to generate valid and reliable primary faults is to ask a
group of experts--those who know well the domain being assessed--to
identify the factors contributing to the top fault. Another is to analyze
critical incidents as a way to discover primary faults. Other sources may
ha organizational records or theoretical relationships among factors shown
by past research to be significant in contributing to the problem.
Factors outside the organization. as well as those inside, should be
considered. Because the primary faults must be directly related to the
top fault. it is important that individuals who identify them be familiar
with the processes present in the organization. A broad representation of
viewpoints is generally desirable. although it is not a prerequisite
(Stephens, 1976).
Van de Ven tnd Ferry (1980) pointed out that it is frequently easier
for individuals to identify the factors that cause or predict
effectiveness than to identify the factors that Indicate effectiveness
23
26
themselves. They suggested that people generally carry around with them a
model of mu their organization is or isn't effective. In terme of fault
tree analysis. this suggests that primary faults may be readily
recoverable from the minds of experts without having to go through a
rigorous system analysis. The application of fault tree analysis in a
limited number of educational settings confirms this notion (see
references). Whereas identifying the primary faults for a complete fault
tree is generally time consuming, it is by no means an unreasonable task
(see, for example, Barker, 1976. and Driessen. 1971).
The primary faults That directly contribute to the top fault are
listed directly below it in the tree. and they constitute the second level
of the fault tree. Each of the second level primary faults is then
analyzed separateiy, so that the factors that contribute to their presence
or occurrence in the organization are identified. That is. the analysis
takes this form: the *allure of A is due to 131. B2. B3. . . . BN; the
failure of B1 is due to C1. C2, C3. . . . CN; the failure of Cl is due to
D1, D2, D3, . . . DN; and so forth.
Faults on lower levels of the tree are more specific and precise than
are faults on higher levels of the tree. The accuracy of fault tree
analysis is generally enhanced if all primary faults on one level are
identified before going on to the next level. The number of primary
faults that are analyzed as contributing causes. and the level of detail
pursued. are determined by the answers to the seven critical questions
discussed above (e.g., the purpole of the assessment. the domain of
anaiysis being considered. and so on). h" the amount of information
available regarding the primary faults. and by the amount of Information
needed to overcome or solve the top fault. Analysis can stop when
24

specific change targets have been identified. Elementary fault trees may
have only three or four levels of primary faults. complex trees may have
as many as 16.6 Each pr'mary event need not be developed to the sue
level of specificity as others. however, so that a fault tree may have
some branches with few levels and other branches with many.
Estationshios Among Criteria ofineffectiveness
The key to fault tree analysis. and what makes it unique among other
re, billty analysis techniques. is the connections made among faults on
lower levels of the tree with faults on higher levels. These connections
occur through "logic gates" derived from Boolean algebraic expressions.
The Boolean logic gates most frequently used are the AND and OR
expressions. The AND logic gate is used when two or more faults coexist
in order to produce a more general fault. It is symbolized by the
1)following figure: . This gate is used only if all the faults are
present simultaneously in order to produce a more general fault. Its use
is illustrated in Figure 1. In this Illustration. fault A is present only
if faults B and C coexist.
FIGURE 1 ABOUT 'IRE
The OR gate is much more common in behavioral systems. and it refers
to the condition where any one fault on a lower level could produce the
more general fault above it In the fault tree. The graphic symbol for the
OR gate is . Figure 2 illustrates its use. In this illustration.
fault A is produced by either fault B
25
28

FIGURE 1 ILLUSTRATION OF THE AND LOGIC GATE
A
B
29

FIGURE 2 ABOUT HERE
i. fault C. An inclusive OR gate indicates a situation where B or C or
both could produce A (i.e., faults are nonmutually exclusive). An
exclusive OR gate Indicates a situation where B or C but tut both could
produce A (i.e., faults are mutually exclusive).
In addition to logic gates. the other types of symbols used in fault
tree analysis identify the nature of the actual faults themselves. These
symbols are derived from system safety engineering and are used to show
the kind of primary faults that compose the fault tree analysis. There
are five common types of symbol.
A rectangle ( ) is the most common symhol, and it signifies
a fault that results from a combination of less general faults through a
logic gate. A circle ( ) signifies a fault that is at the lowest
(most specific) level of analysis on the fault tree. It is a "bottom"
fault. A rhombus (<2> ) signifies a fault that cannot be developed
further because of lack of information. a remote possibility of
occurrence. or some other constraint. It also is a "bottom" event. but
not because it is sufficiently developed. A house ( ) signifies a
fault that is not normally a fault. It is a factor that is present in the
organization. but it does not usually indicate Ineffectiveness. When
combined with other faults in the tree. however, it contributes to the
occurrence of a more general fault. A triangle (///\%) is used to
indicate that a particular fault is developed further at another place in
the fault tree diagram. For example, a fault may contribute to more than
one general fault and so is listed more than once in the tree.
26
30

FIGURE 2 ILLUSTRATION OF THE OR LOGIC GATE
A
B
31
C

Figure 3 illustrates the use of each of these symbols In a fault
tree. The tree in the figure has three ')ranches and three levels. and it
Is Interpreted as follows: Fault A is produced by either
FIGURE 3 ABOUT HERE
faults B, C. D. or any combination of the three. Fault B is produced by
faults E and F. Fault C is produced by faults G or H or both. Fault D is
developed further at another place in the tree (not shown). Faults E and
G are developed as specifically as is needed in the three. Fault F is not
analyzed further because of some constraint In the analysis. Fault H is
not normally an indicator of ineffectiveness. but it does contribute to
the presence of fault C.
After constructing a fault tree. an additional procedure is desirable
to help assure that the tree is accurate and as complete as possible.
Experts should be asked to answer the following questions about each of
the faults:
(1) Is this an indicator of ineffectiveness in the
organization? Is it a problem that stands in the way
of successful performance?
(2) Are all Its major contributing factors (primary
faults) listed below it?
(3) Do the connecting logic gates accurately characterize
the relationship of the primary faults to the more
general fault above them?
The advantage of conducting a fault tree analysis in assessing
ineffectiveness is that relationships among problems within the

FIGURE 3 AN ELEMENTARY FAULT 1REE DIAGRAM
A
C
33

organization are identified. and insights not normally apparent often
emerge. Because a variety of alternative "causes" are generated. the risk
of inaccurately Judging a single cause and effect relationship Is
minimized. Moreover, because faults (or evidence of Ineffectiveness) ere
being considered and not successes (or evidence of effectiveness). more
specificity can generally be achieved. Stephens (1976) suggested
additional advantages of this process as well.
Recent work with FTA [fault tree analysis] of complexsystems. however, has shown that failure analysisgives perspectives on a system which go beyond thesimple logical inversion of success analysis tofailure analysis and back again. In fact. the FTAmethodology itself appears to have a heuristic value,both for those participating In the analysis and themanagers and other decision makers to whom the resultsand recommendations are communicated. It generatesquestions about the system which dc not occur underthe usual conditions of success analysis.Additionally, the methodology. by facilitatingconsensus formation processes of groups. promotes teambuilding activities which. In turn. lead to greaterproductivity.
Quantliyinciawit_Tree Analysis
Once a fault tree has been constructed. the analysis turns to a
determination of a strategic path. A strategic path Is a route from a
bottom fault to the top fault that identifies the faults that are the most
important to overcome In order to improve organizational effectiveness. A
strategic path is determined by computing weights for the various faults.
The goal Is to identify which faults are the most critical In causing
organizational ineffectiveness. Because organizational effectiveness Is
increased as important indicators of ineffectiveness are resolved or
eliminated. computing a strategic path through the fault tree allows the
analyst to identify the most important problems or faults In the system
28
34 .

that inhibit successful performance. Change efforts can thereby be
focused In the most critical areas of the organization.
The weights assigned to faults represent probabilities. In systems
safety engineering, these probabilities are a product of one of two major
approaches: (1) calculation, or (2) simulation. That is. when working
with hardware systems (e.g., a nuclear reactor). there are definite
probabilities associated with the occurance of a fault or a failure. The
life span of a component part. for example, can be calculated based on
past experience with the part. or its life span can be determined by
computer simulation (see. for example, Henley and Lynn. 1976). Wit) both
of these procedures. however, it is assumed that an objective probability
actually exists for each fault. and the analysts' Job is to estimate that
probability accurately as possible. In behavioral systems (e.g.,
organizations). however. objective probabilities are not associated with
specific faults, and they cannot be determined by calculating past event
probabilities or by simulation. Therefore different methods are required
in order to assign weights.
The best procedure for determining a strategic path in behavioral
systems was Introduced by Stephens (1972). It involves the use of
consen..al expert ratings to estimate (1) the relative contribution or
importance of the fault. and (2) the ireauency (i.e., urgency) of fault
occurrence. The rating of the importance of faults is done via some
consensus building approach such as nominal group or delphi techniques
according to their relative contributions to a more general fault. A
percentage contribution is assigned to the faults on each level of the
tree. That is. the weightings of all the contributing faults on one level
of one bran:h of the tree should sum to 1.00. If fault A is caused by
29

faults B and C. or example. the rating of the importance of faults B and
C must sum to 1.0 (i.e., fault B = .6. fault C = .4). Asking individuals
to assign quantified values to their ratings is consistent with the advice
of Kotler (1970).
Executives and experts who are asked to put theirJudgments in the form of numbers tend to give harderthought to the problem, especially if the numbers area matter of record.
Quantification helps pinpoint the extent andimportance of differences among executives withrespect to the decision problem. Numbers permit theanalyst to perform a sensitivity analysis to determinehow much a decision depends on particular differencesIn Judgment (p. 80).
Judgments regarding the frequency of occurrence of the fault are made
only for bottom faults. This is because the frequency of occurrence for
more general faults (or the urgency with which they must be addressed' is
a result of the frequency of the faults on lower levels.7 Estimates of
frequency are produced by having experts assign probabilities to
particular faults based on a scale of how often they occur. For example.
two possible scales are illustrated in Figure 4. Each fault is rated
independently--unlike
FIGURE 4 ABOUT HERE
the ratings of relative contribution which are rated in relation to one
another- so weights need not sum to 1.0 for each set of contributing
faults. Toe scale used for the ratings depends largely on researcher
preference. AS long as it makes sense relative to the faults being
analyzed.
30
36

FIGURE 4 ILLUSTRATION OF TWO FREQUENCY SCALES
VERY VERY
RARE FREQUENT
II
.1 1.0
POINTS
.2 .4 .8
LOW MEDIUM
FREQUENCY
3 7
HIGH

Figure 5 contains an illustration of a fault tree with numerical
estimates assigned to each fault. The importance ratings are circled. the
frequency ratings are in parentheses. and the overall fault weight is in a
box in the figure. The weighting assigned to the bottom
FIGURE 5 ABOUT HERE
faults is a product of the expert estimates of importance and frequency.
It signifier the relative contribution of that particular fault to the
occurrence of the fault on the next highest level of the tree. In figure
5, fault B is the most important contributor to fault A when compared to
faults C and O. Fault E is a more Imports:It contributor to fault B than
is fault F. Fault G contributes more to the occurrence of fault C than
does fault H. And fault K contributes more to fault F than do faults I.
J, or L.
Having weights assigned to each primary fault in the tree now permits
the computation of the "strategic path." In safety engineering. the
strategic path represents the weakest links in the system. or the areas in
which failure is most probable. In organizations. it identifies the
interactions among the most Important problems in the organization that
inhibit organizational effectiveness. Computing the strategic path helps
to identify guidelines for implementing future organizational change that
eliminate or overcome faults.
Strategic paths are identified by using Boolean algebraic formulas
(the algebra of events) to compute weights for each Joaic _gate in the
tree. beginning at the lowest levels In the tree. The weights of the
individual events are used as the basis for the computations. The
31
38

FIGURE 5 ILLUSTRATION OF A WEIGHTED FAULT TREE
A
0(.0=
C
ri0(4)=19 0(2)=
0( 911: Ok.2):: m 0(.4)=.12 (.2):: cc
a
39

algebraic formulas applicable to each of the three different types of
logic gates are given in Table 1.
TABLE 1 ABOUT HERE
To illustrate the computation of a strategic path for the elementary
fault tree In figure 5, the following computations should be made.
assuming that faults G and H and faults I. J, K, and L are nonmutually
exclusive--that Is. that logic gates 3 and 4 are inclusive OR gates.
Beginning at the bottom of the tree.the following computation is done for
logic gate 4:
SPW = [(.08) + (.04) + (.12) + (.06) - (.08) (.04) - (.08) (.12)- (.08) (.06) - (.04) (.12) - (.04) (.06) - (.12) (.06)+ (.08) (.04) (.12) (.06) + (.08) (.04) (.06) + (.04) (.12)(.06) - (.08) (.04) (.12) (.06)] [.3] = [.267] [.3] = .0801
For logic gate 2:
SPW = [(.56) (.3)] [.2] = [.168] [.2] = .0336
For logic gate 3:
SPW = [(.2) + (.1) - (.2) (.1)] [.08] = [.28] [.08] = .0224
Figure 6 illustrates the primary strategic path and a secondary path
(the next most important path) for this elementary fault tree.
FIGURE 6 ABOUT HERE
The advantage of quantifying the strategic paths rather than simply
estimating them a priori is that more precise and more accurate analyses
result (Kotler. 1970; Wood. Stephens. and Barker, 1979) and a clear
strategy for change is specified. In complex fault trees. an awareness of
32
4 0

Table 1 Algebraic Formulas for Computing Strategic Path Values for Three Types of Logic Gates
Formula Type ofNumber Gate Formula
1 Exclusive OR SPW* = P**(Fault1
. . .) + P(Fault2
) + P(Faul+ ) (importance weight'N
of the more general fault)
2 Inclusive OR SPW = P(Fault1
U Fault2
U . . . FaultN
) (importance weight of the
more general fault)
SPW (for a gate with 3 faults) = (P(Faulti) + P(Fault2) + P(Fault3) -
P(Fault1
n Fault2
) - P(Fault1
n Fi-Jult3
) - P(Fault2
n Fault3
) +
P(Fault1
n Fault2
n Fault3)) (importance weight of the more general
fault) where P(Fauii- n Fault2
n Fault3
) P(Fault1
) P(Fault2
)
1
P(Fault3
)
3 AND SPW = P(Fault1
n Fault2
n . . . FaultN
) (importance weight of the more
general fault)
SPW = (P(Fault1
) P(Fault2
) . . P(FaultN)) (importance weight
of the more general fault)
* SPW = Strategic Path Weight
** P = Probability of fault in non-behavioral systems; weiq, , calculates for the fault in behavioral systems.
42

FIGURE 6 ILLUSTRATION OF A STRATEGIC PATH
A
" VX0X0X0X0X0
egXX XXXXX XXXXXXX X XXXXX XXX XXXXX X XXXXXXX),(<000000000000000000000000000000000 0
B
.56
.0336
000000
F
.0801
C
.0224
43
D
xxxx primary strategic path0000 secondary strategic pat

where to begin organizational change Is not always obvious because of the
sheer number of contributing faults In the tree. Whereas. In figure 6 it
is relatively easy to map out a strategy of changes without going through
the strategic path calculations. this Is not generally possible In real
organizational assessments. The formulas derived from Boolean algebra,
therefore. are designed to make precise the couplings among the faults In
the tree and to identify which faults should be overcome first. Therefore
If the fault tree has been properly constructed. and the bottom faults are
sufficiently precise so as to be alterable. the strategic path maps a way
to improve organizational effectiveness by eliminating ineffectiveness.8
An Example of an Elementary Fault Tree Analysts
Most fault Nees constructed in behavioral systems are composed of
several hundred faults that have taken hundreds of person-hours to
construct (see Wood, Stephrsns. and Barker, 1979, for a summary of the size
and time involved In producing several different fault tree analyses).
Fault trees constructed for hardware systems. however. frequently are much
more time consuming. For example, Powers (1974) reported a fault tree
constructed for a nuclear power plant requiring over 25 person-years to
complete. The example presented below Is an abbreviated one with
relatively few faults. and it Is presented only for the purpose of
illustrating the potential usefulness of fault tree analysis In assessing
organizational ineffectiveness. The data were derived from an actual
investigation of organizations. but many of the faults identified are
aggregated among organizations. so this tree does not necessarily identify
any one particular organization In that study. The example assumes.
therefore. that the faults listed are a product cf the consensual
Judgments of experts In the organization. It Is intended to provide a
33
44

simplified prototype of an alternative approach to research on
organizational effectiveness.
The example analyzes a private. liberal arts college in terms of its
indicators of ineffectiveness. It assumes that the following answers have
been derived for the seven critical questions:
QUESTION
1. From whose perspective isineffectiveness beingjudged?
2. On what domain of activityis the analysis focused?
3. What level of analysisIs being used?
4. What is the purpose forassessing ineffectiveness?
5. What time frame is beingemployed?
6. What type of data arebeing used in assessingineffectiveness?
7. What is the referentagainst which ineffectiveness is Judged?
&WEB
Members of the dominant coalitioninside the organization comprise therelevant constituency.
The overall financial condition ofthe organization is of concern.
The organization level of analysisis the focus.
Discovering ways to improve thefinancial health of 'tie organization
and to enhance survival potential is
the goal of the strategicconstituency.
Analyses are based on presentcircumstances but with considerationgiven to contributing factors up to15 years ago.
Perceptions of dominant coaltionmembers provide the relevant datafor the fault tree.
An objective (ability to meetexpenses) referent is appropriate inassessing financial health.
The fault tree identifies "the declining ability of the institution
to meet its fiscal obligations" as the priority Indicator of
ineffectiveness. The assumption is made that if that top fault could be
overcome. the organization would be Judged to be effective. given the
constraints imposed by the seven critical questions. The fault tree
34
45

analysis reproduced in Figure 7 Identifies four major contributing faults
on level 2 of the fault tree. These four faults
FIGURE 7 ABOUT HERE
are. in turn, analyzed in terms of their primary or contributing faults.
and so on through level 4 of the tree. Many of the faults are drawn as
rhombuses not because they could not be analyzed further. but because
additional analyses would make the tree too complex for Illustrative
purposes.
The tree suggests that the four major faults directly contributing to
the top fault are: (A2) inadequate fiscal controls. (B2) nonsupportive
alumni, (C2) declining enrollments. and (D2) over-expansion in a past
growth era. These four faults are connected to the top fault by an
Inclusive OR gate which signifies that the four faults are not mutually
exclusive. Any one of the faults singly or in combination could
contribute to the occurrence of the top fault. For example.
over-expansion (fault D2) may be a major indicator of ineffectiveness, but
it is especially so when rccompanied by declining enrollments (fault C2).
These four faults constitute level 2 of the fault tree. and they divide
the tree into four major branches. The interpretation of the fault tree
can be illustrated by examining the faults in branch A.
Bangh_A. Three primary faults contribute to inadequate fiscal
controls--(AA3) no long range financial planning. (AB3) outdated
accounting procedures. and (AC3) an informal reporting structure. They
are connected to fault (A2) by means of an inclusive OR gate. The first
of these faults (AA3) is not analyzed further in this illustration, so it
35
46

FIGURE 7 A Prototyne Fault Tree Analysis for OrganizJtional Ineffectiveness 1
DECLINING ASILIMEET FISCAL REQUI
BEST COPY AVAILABLE
47
48

WING ABILITY TOSCAL AEOU I RE NEWTS
ill)
Is.s1 aloe1. IAlwl
stesSers C63
C2
S St...l MPSW mile.suss WOIshr to1000
CE 30A3
se 104.sonSOMINS
PolmmeefoofeesIma
.sera. teen
CA0 4 C8A 4 0384 EI3C 4cEA 4
CE8 4 CEC 4- DM 4
4 9
0A84 DAC4
083 DC3
1
Over -ftissasleft IA
swiss etermift Ore
D2.
BEST COPY AVAILABLE
50
A

would be explained in detail to the dominant coalition members in order
for them to rate its accuracy and completeness (I.e., to analyze its
validity).
This simplified example points out that fault trees can become
extremely large and complex relatively quickly, so computation of primary
and secondary strategic paths becomes a necessity. Just analyzing this
example partially through only four levels produced 51 primary faults with
a variety of relationships existing among them (i.e., some primary faults
jointly contribute to more than one general fault. some primary faults
coexist with other faults on the same level of the tree. some primary
faults independently contribute to organizational ineffectiveness, and so
on). These relationships freque..tly are not evident without a deliberate
fault tree analysis. For example, it may not be obvious that the cost of
on-campus housing Ueult DCB4) Is a contributing factor to the
ineffectiveness of the organization unless a fault tree is constructed.
Furthermore. by addressing some of the more specific faults on level 4,
more general faults on the upper levels can be overcome, whereas there may
not have been an obvious way to approach them otherwise. By forming Joint
or coordinated academic programs with the state college in the area (fault
CEB4). for example, the institution in this example may overcome the more
general fault of declining enrollments (fault C2).
Stlategic maths. To determine what is the most productive course of
action to take in overcoming or eliminating these major faults, and
thereby increasing organizational effectiveness, strategic paths were
computed. All bottom faults cannot be addressed at once, and a strategic
path indicates which faults should be addressed first in order to have the
greatest Impact on the top fault. Figure 8 shows the prototype fault tree
37
52

drawn with the hypothetical primary and secondary strategic paths
computed. The weightin6s for each fault used to compute the strategic
paths are also provided.
FIGURE 8 ABOUT HERE
If the incomplete analysis present In the fault tree in figure d is
ignored for the sake of the example, the strategic paths provide valuable
information concerning the most productive ways to overcome organizational
Ineffectiveness. The primary strategic path suggests that by cultivating
state or federal government support (e.g., student loans. subsidized
programs. tax benefits) and by reducing organization expenses (e.g.,
energy costs, maintenance). declining enrollments (CA3) can be reversed
(e.g., more students can be attracted by offering them financial
assistance) which in turn can lead to the elimination of the top fault.
the inability to meet financial obligations. These two faults. in other
words. are the most important primary faults that contribute to
organizational ineffectiveness, and by overcoming them, organizational
effectiveness can be significantly improved.
The secondary strategic path in figure 8 specifies the second most
important set of contributing faults. It indicates that the second
priority for overcoming ineffectiveness is to address high mortgage and
energy expenses. As It turns out. this is the same fault that was
Identified by the primary strategic path. That is because the fault. high
expenses. contributes to two different more general faults. In the fault
tree. it is located at CAB4 and at DA3. The triangle below CAB4 indicates
tha this fault is analyzed in more detail at another place in the fault

FIGURE 8 Primary and Secondary Strategic Paths for tne Prototype Fault Tree
lerilasrm 111011(mown'
DECLINING ASMEET FISCAL AI
il
.1449
0C-00000000000000000
MI,
"AMYssarolissprogiftlen
.3
.175
ft (.114Wmirmme le 1elehleillallii
.12 .
54
1.0 0am . sUe011 1 ..M11011MY 1 et~me .24
0000000000xxxxxxxxxx
Primary Strategic PathSecondary Strategic Path
BEST COPY AVAILABLE

CLONING ROM TT TOFISCAL RE QUI MEATS
1
0000000 XXX XXXX X X XX X XXXX X XX X XXXX X XX XX
Illor MoosII owl Owne
.245
000000( 000000 XXX X XX X X X XxXx
Saw +mune I 6. Isowl "MA er
.204 CI
X XXX X X X ;CX
OM OM.1, fig
.4
.245.045
>x, x x xxX
x
,4* tl,*
56BEST COPY AVAILABLE
5 7

tree (i.e., at DA3). Consequently, in this example, the prescription for
overcoming ineffectiveness and improving organizational performance is
clear from both the primary and secondary strategic paths -- reduce
expenses. This prescription is th9 first priority and the one with the
most potential effect for overcoming organizational ineffectiveness.
However, it is not the only fault that should be considered in
organizational improvement. Other strategies that focus on other bottom
faults also can be considered. but they are not expected to be as powerful
In overcoming the top faults as are those along the strategic paths.
the validity of the prescriptions for improving effectiveness rests.
of course, on the completeness of the tree and the accuracy of the weights
given to the primary faults by the dominant coalition members. The
decision as to which cor.stituency(s) to include in assessmerts of
ineffectiveness is. therefore. an important consideration because the
weightings of the faults that lead to the strategic paths must result from
an understanding of the system being assessed. Expert Judgments of the
domain being considered, therefore. are likely to prove to be the most
valid. Care also should be taken to include a validity check after the
fault tree is constructed so that the appropriate constituency can assure
that the fault tree is complete. Finally, agreement must be reached
within this constituency as to their weightings of the faults in order to
increase the probability that the weightings are accurate.
If proper procedures are used in constructing The fault tree. and if
consensus is reached regarding ratings. there is evidence to suggest that
the Judgments regarding faults will be correct. For example, in a classic
study of the accuracy of prediction by groups. Kaplan, Skogstad, and
Grishick (19'0) found that a group decision produced 67 percent accuracy
39
58
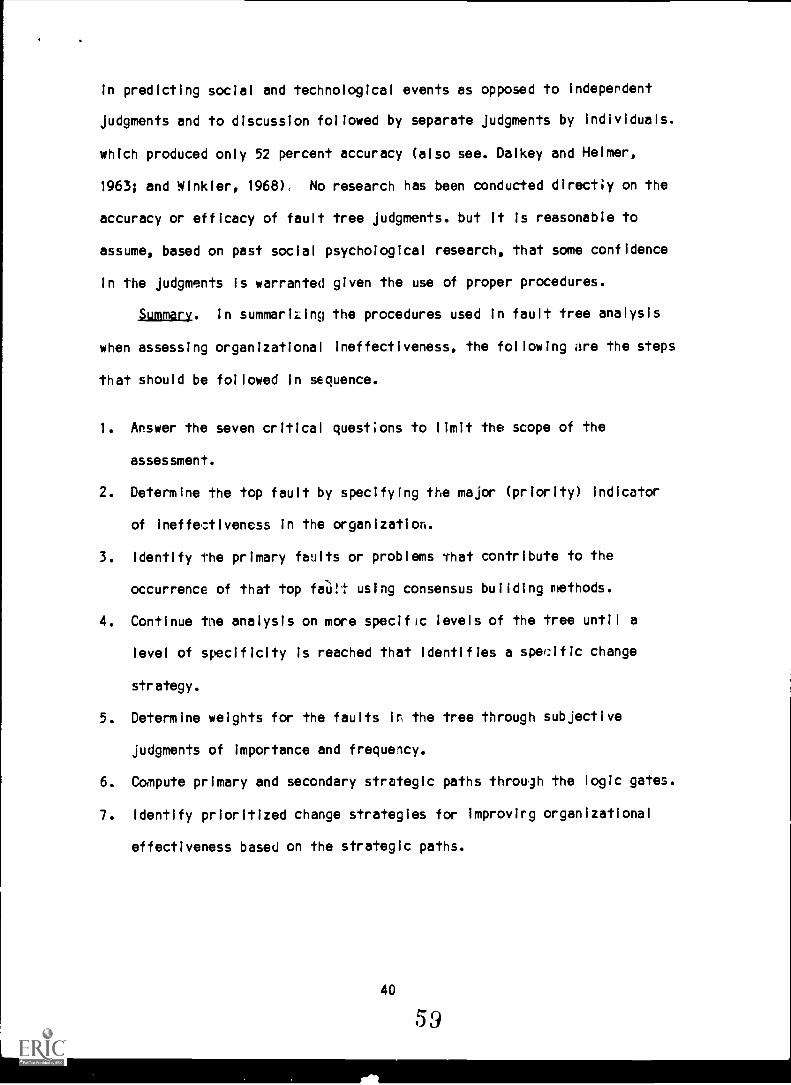
in predicting social and technological events as opposed to independent
judgments and to discussion followed by separate judgments by individuals.
which produced only 52 percent accuracy (also see. Dalkey and Helmer,
1963; and Winkler, 1968), No research has been conducted directly on the
accuracy or efficacy of fault tree judgments. but it is reasonable to
assume, based on past social psychological research, that some confidence
in the judgments Is warranted given the use of proper procedures.
Summary. In summarizing the procedures used in fault tree analysis
when assessing organizational ineffectiveness, the following are the steps
that should be followed in sequence.
1. Answer the seven critical questions to limit the scope of the
assessment.
2. Determine the top fault by specifying the major (priority) indicator
of ineffectiveness in the organization.
3. Identify 1-he primary faults or problems that contribute to the
occurrence of that top faiiit using consensus building methods.
4. Continue tne analysis on more specific levels of the tree until a
level of specificity is reached that identifies a specific change
strategy.
5. Determine weights for the faults In the tree through subjective
judgments of Importance and frequency.
6. Compute primary and secondary strategic paths through the logic gates.
7. Identify prioritized change strategies for improvirg organizational
effectiveness based on the strategic paths.

Advantaces and Disadvantages of Fault Tree Analysis
Defining organizational effectiveness as the absence of Indicators of
Ineffectiveness and then assessing Ineffectiveness through means of fault
tree analysis presents several advantages over many of the past approaches
to effectiveness. but It also may pres,nt some disadvantages. Several of
the more prominent advantages and disadvantages of this approach are
outlined below.
Agontages. One of the most obvious advantages of this approach to
organizational effectiveness Is that It Is easier to generate and to agree
on faults, problems. and weaknesses In organizations than strengths or
successes. Particularly In complex organizations where goals are
difficult to Identify, and where there are various preferences among
constituencies regarding what the organization should be pursuing.
agreement about what the organization should avoid Is much more easily
specified. Faults are nearer the cognitive surface than are strengths.
Just as It Is easier to identify what Is wrong with a machine than to
identify what is right -- because faults are aberrations from the expected
performance pattern. and their occurrence motivates efforts to
re-establish equilibrium - -so Ineffectiveness Is easier to assess than Is
effectiveness. This approach to assessment essentially narrows and makes
more specific the construct space being Investigated.
A second advantage Is that by Including broad participation of
organizational members both In the diagnosis and assessment as wel I as In
the identification of strategies for improved effectiveness. the
dysfunctional consequences of rigorous research are avoided (see Argyrls.
1968). In traditional assessments that rely on questionnaire responses or
structured interviews. misinformation or inadequate information. rejection
41
6

or ignoring of the findings. second-guessing the study design. and other
forms of resistance are common occurrences. In this approach, both
analysts and organizational participants learn collaboratively about the
criteria under investigation. As Argyris (1968) suggested:
In our experience the more subjects are involveddirectly (or through representatives) in planning anddesigning the research, the more we learn about thebest ways to ask questions. the critical questionsfrom the employees' views. the kinds of resistanceeach research method could generate. and the best wayto gain genuine and long-range commitment to thevesearch (p. 194).
Van de Ven and Ferry's (1980) apprvich to organizational assessment
Is similar to fault tree analysis in also placing a high value on
organization member participation. Eoth approaches suggest that the
Mcess of generating the analysis may be more beneficial than the results
of the analysis itself.
A third advantage Is that an understanding of the organization snd
the inter-relationships among subparts Is enhanced by this approach. The
Interrelationships among factors In the organization that contribute to
weakness and ineffectiveness are made clearar by engaging In fault tree
analysis. The approach Is similar to that advocated by Karmiloff-Smith
and Inhelder (1975). Hedberg, Nystrom, and Starbuck, (1976). and others
when they suggested that if a problem is difficult to solve (i.e., if
organizational effectiveness Is difficult to assess) the solution is to
reformulate the problem, not to reformulate the solution alternatives
(i.e., redefine effectiveness and the approach to its assessment). This
approach helps overcome some past obstacles In the assessment of
effectiveness by reformulating the conceptualization of the problem.
A fourth advantage of this approach is that It combines rigorous
analysis with practical application. Most past attempts to assess
organizational effectiveness have focused on Identifying a point on a
scale that characterizes an organization's performance. This fault tree
approach not only serves descriptive purposes (i.e., it describes the
current state of organizational performance). but it also serves a
prescriptive or normative purpose as well (i.e., it generages strategies
for improvement). Therefore. improving effectiveness and assessing
effectiveness are products of the same analysis. Starbuck and Nystrom
(1983) pointed out that. "Organizational effectiveness affords another
Instance of the general proposition that prescription has to come before
understanding. The notion that one should understand organizations before
one tries to improve them is backwards [p. 155]." Combining description
and prescription In the fault tree analysis of ineffectiveness enhances
the understanding of organizations by suggesting strategies for changing
them. At the same time. It does not ignore the need for systematic. a
priori analysis as well.
A fifth advantage Is that this approach can be used for multiple
purposes besides assessing current organizational ineffectiveness. For
example, identifying strategic paths and determining strategies for change
can provide the political Justification needed in organizations for
reallocation of resources. Taking resources from one area in order to
Improve another area that is weak is always a sensitive political Issue in
organizations. especially under conditions where little organizational
slack is present. A fault tree analysis can provide a rational
Justification for implementing such change. Another example Is that this
approach can be used to assess organizational potentlaiMes as well as
41.

current levels of functioning. Brewer (1983). Mohr (1983). and Nord
(1983) implied that evaluations of organizational effectiveness not only
should focus on what organizations 112 produce. but consideration also
should be given to what they could produce. A fault tree analysis can be
constructed in the future tense and analyzed in terms of what are the
major indicators of ineffectiveness that could occur in the organization.
Strategies are then recommended to prevent organizational Ineffectiveness
from occurring. As an illustration of this use. Zarzyckl (1971)
suggested:
. . . .fault tree analysis hc value. in makingan analyst aware of the possible occurrences whichmight lead to production losses. The awareness gainedfrom a fault tree is a major step toward future losscontrol [p. 11].
Disadvantages. Of course, focusing on organizational ineffectiveness
through fault tree analysis may have drawbacks. It Is not an approach
that resolves all of the problems surrounding past research on
organizational effectiveness. Five potential disadvantages are pointed
out in the paragraphs below.
First. Information may not exist regarding all the organization's
major faults. Contributing faults on lower levels of a fault tree may be
difficult to uncover, and underlying causes of problems may not be
apparent or may be inaccurately assumed. Identifying some faults may even
be the result of political processes. so that different fault trees may be
produced depending on which group is asked. For example, constituencies
may identify only those faults that place blame on other groups or on
uncontrollable factors so as to relieve themselves of responsibility for
weaknesses In the organization or of a need for change. Disowning
44
63

responsibility for failure by projecting it externally Is a common
occurrence In the attribution process. Because judging ineffectiveness Is
based as much on values and preferences as is judging effectiveness,
differences existing in individual and constituency perspectives must be
considered in all assessments.
Second. constructing accurate fault trees may take a large number of
hours and the involvement of many people. It is certainly not as easy as
sending out a questionnaire to managers in a sample of organizations and
tabulating the results. Moreover, fault tree analysis. as currently
developed. is limited to one unit of analysis. and comparisons among
organizations require separate fault trees for each organization. The
purpose of fault tree analysis focuses more on improving a single unit
than on making comparisons among multiple units. Comparison among units
is difficult unless similar faults are Identified in the trees. The
amount of time and effort required to analyze and compare the
Ineffectiveness of multiple units of analysis may be prohibitive.
Third. there is no guarantee that solving a problem on a lower level
of the fault tree will automatically solve the problem to which it
contributes on mi upper level of the tree. Whereas fault tree analysis
can Identify the faults that are most tightly coupled in the tree. and
that contribute most to ineffectiveness, it does not guarantee that a
domino effect will result from solving one bottom fault. Moreover, no
empirical work has been published to date demonstrating that the faults
Identified along the strategic path are. in fact, the most powerful In
overcoming the top fault. Anecdotal evidence has appeared In several
articles. But it is not certain that intuitive Judgments or a random
selection of solutions would not be Just as efficacious as rigorous fault
45
64

tree analysis for overcoming or eliminating the top fault. This Is an
area where further research Is needed.
Fourth. this approach does not pay attention to organizational
strengths; InstJad. it pays attention to organizational weakness. Some
policy analysts suggest that organizations are better off focusing
resources and organizational energies on what the organization does well.
That focus advocates capitalizing on what is successful already.
Resources should not be plowed into problem areas. according to that view.
On the other hand. this approach takes the opposite stance by defiring
effectiveness as the absence of ineffectiveness. It advocates
concentrating on organizational weaknesses in order to overcome them.
which implies a reallocation of resources into problematic areas. Thb
relative efficacy of overcoming weaknesses versus magnifying strengths Is
another unknown but fruitful area for future research.
Fifth, some kinds of organizations function well because they are
46
65
understood very well. These organizations have loose coupling.
non-existent or fuzzy goals. fluid structures. etc. The advantage of this
kind of design is that organizational discretion is maximized and multiple
demands can be addressed at once. Two problems may occur In these
organizations. however. because of fault tree analysis. First,
relationships among faults that are identified by fault tree analysis may
be too loosely coupled and dynamic for a reliable analysis. Second. fault
tree analysis. because of its relatively fine-grained analysis. may
destroy some of the mystique of these organizations. Enarson (1981)
illustrated the problem of this phenomenon with this statement: "The
enchantment with the university is at a low ebb when the number of
graduates Is at an all-time high. We are known too well." Just as the

popularity of politicians usually wanes when they become well known by the
public--i.e., when the mystique wears off--so some organizations may
resist fault tree analysis because it exposes them in too much detail.
Despite these potential disadvantages. however. the analysis of
organizational ineffectiveness through a fault tree presents a potentially
useful alternative to the assessment of organizational performance. In
the section below, this approach to effectiveness is compared to other
wellknown approaches and suggestions are made regarding the usefulness of
each.
A Comparison of Models of Effectiveness
This alternative approach to organizational effectiveness does not
aspire to replace other major approaches used in the past. Instead it
should be viewed as a useful addition to the repertoire of models.
Assessing organizational ineffectiveness provides some advantages that are
not present in other approaches. and it helps address some of the major
problems with past organizational effectiveness literature. What is
crucial for the analyst to be aware of in selecting an approach to
effectiveness. however. is when one model is more appropriate than
another; or in the present case, under what conditions is assessing
ineffectiveness by means of fault free analysis the most appropriate
alternative? Table 2 summarizes seven major models of organizational
effectiveness that have received attention in the literature (see Cameron
Whetten. 1983, for other models of effectiveness that are based on a
variety of academic disciplines). The table also suggests when each model
is appropriate for use in assessments. A basic point of that table. and
of this essay, is that multiple models of effectiveness not only are
47
6
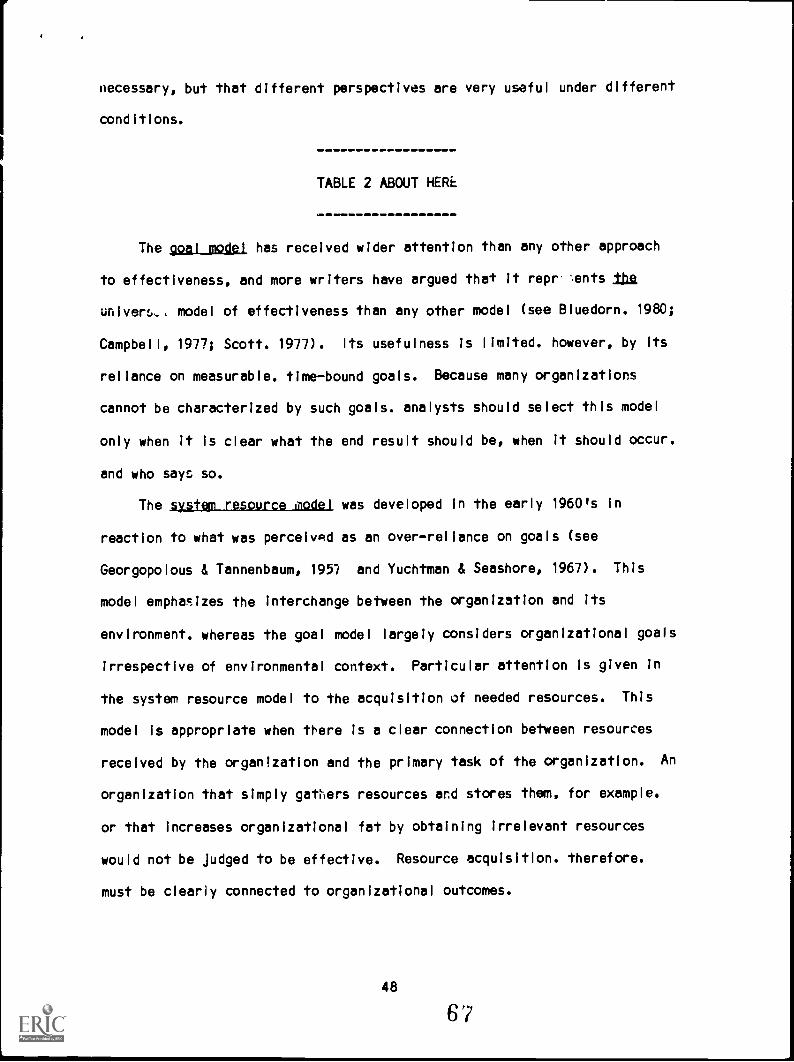
necessary, but that different perspectives are very useful under different
conditions.
TABLE 2 ABOUT HERE
The goal model has received wider attention than any other approach
to effectiveness, and more writers have argued that it reprr-ents
univert.,, model of effectiveness than any other model (see Bluedorn. 1980;
Campbell, 1977; Scott. 1977). Its usefulness Is limited. however, by its
reliance on measurable. time-bound goals. Because many organizations
cannot be characterized by such goals. analysts should select this model
only when it Is clear what the end result should be, when it should occur.
and who says so.
The system resource model was developed In the early 1960's In
reaction to what was perceived as an over-reliance on goals (see
Georgopolous & Tannenbaum, 1957 and Yuchtman & Seashore, 1967). This
model emphasizes the interchange between the organization and its
environment. whereas the goal model largely considers organizational goals
irrespective of environmental context. Particular attention is given in
the system resource model to the acquisition of needed resources. This
model Is appropriate when there Is a clear connection between resources
received by the organization and the primary task of the organization. An
organization that simply gathers resources ard stores them, for example.
or that increases organizational fat by obtaining irrelevant resources
would not be Judged to be effective. Resource acquisition. therefore.
must be clearly connected to organizational outcomes.
48
67

Table 2 A Comparison Among Major Models of Organizational Effectiveness
Model Definition When Useful
Goal Model
System-ResourceModel
Internal Process
Model
Strategic-
Constituencies McJel
Competing Values Model
Legitimacy Model
Ineffectiveness Model
An organization is effec-tive to the extentthat . . .
it accomnlishes its statedgoals.
it acquires neededresources.
it has an absence ofinternal strain, withsmooth internal function-ing.
all strategic constitu-encies are at leastminimally satisfied.
the emphasis of the organ-ization in four major areasmatches constituentpreferences.
it survives as a result ofengaging in legitimateactivities.
there is an absence ofcharacteristics ofineffectiveness.
The model is the model ofchoice .4hen . . .
qoals are clear, time-bound, andmeasurahle.
clear connection exists betweeninputs ald outputs.
a clear connection exists betweenorganizational processes and Theprimary task.
constituencies have powerfulinfluence on the organ;zation (asin times of litt'e organizationalslack), and it must respond todemands.
the organization is unclear aboutits own emphases, or changes incriteria over time are of interest.
the survival or dec ine and demiseamong org-nizations -nust be assessed.
criteria of effectiveness areunclear, or strategies for organ-izational improvemen are needed.
68BEST COPY AVAILAbil

The Internal process model emerged largely from the human resource
development (HRD) and organization deveiopment (OD) perspectives. The
focus is on the interaction of Individuals within the organization in
terms of its participativeness. humanitarianism. absence of strain. and so
forth. This model is based on a normative set of principles describing
how an organization should function to provide maximum potential for human
growth and deveiopment (see Likert. 1967. and Argyris. 1962 for examples.)
It is most appropriate when the organizational processes urder
conside. Ion are closely associated with the primary production task of
the organization (Rice. 1965). An extremely smooth, but subversive
communication system in an organization. for example, would I'dicate good
process but an absence of organizational effectiveness.
The strategic constituencies model arose in the 1970's as a result of
more sophisticated analyses of the external environments of organizations.
Several different versions of this model have been introduced (Connelly.
Conlon, & Deutsch, 1980; Keeley, 1978; Miles. 1980; Pennings and Goo,4man,
1977; Zammuto, 1932). Ih+ each places the satisfaction of the demands of
various constituencies of the organization as the primary concern. This
model is most appropriate when constituencies have powerful influence on
what the organization dcec or when an organization's actions are largely
reactive to strategic constituency demands. The mission or the domain of
some organizations is mandated by external special interest groups; by
contrast, other organizations are more proactive and autonomous in their
activities. Similarly, some organizations exist in an environment where
certain constituencies clearly are more powerful than others. whereas
other organizations have no clear powerful constituency. In the former,

the strategic-constituencies model wouid be a useful approach. In the
latter, tne model wouid not be as appropriate.
The competing values model Is based on the notion that individuals
who Judge organizational effectiveness do so by making trade-offs on two
general value dimensions. These dimensions are assumed to represent core
values that are at she center of human judgment. One is a trade-off
between flexibility (freedom, fluidity) and control (constraint,
determinism). The other is a trade-off between emphasizing people
concerns over organizational concerns. or vice versa. Making those
trade-offs In judging effectiveness results in four major emphases on
criteria of effectiveness. Organizations have been found to differ
substantially on which criteria they emphasize (see Quinn 8. Rohrbaugh.
1981, 1982, for a more complete explanation). Because of its emphasis on
trade-offs In criteria and the shifts that occur In organizations'
profiles, this model is most appropriate when determining what changes
occur in relevant criteria of effectiveness over time. and when there is a
need to help the organization itself understand its major areas of
emphasis.
The recently introduced legitimacy model is frequently associated
with the population ecology pars Active in the organizational survival is
the ultimate aim. Organizations strive for legitimacy with the external
public in order to enhance their longevity and to avoid being selected out
of the environment (i.e., demise). Since doing the right thing Is ffIr
more important than doing things right in this perspective. the model is
most appropriate on macro levels of analysis when determining which
organizations survive and which decline or die.

The motel of Lneffectiveness introduced in this essay is most
appropriate when criteria of effectiveness either cannot be identified or
cannot be agreed upon. and when there is a need to systematically develop
strategies for organizational improvement. None of the other models in
table 2 serve these two functions.
Conclusion
There have been few areas of agreement in the literature of
organizational effectiveness thus far. Some authors have attributed this
condition to the fact that effectiveness is a political concept (Kanter &
Brinkerhoff, 1981). that organizations have many effectivenesses (Cameron.
1980; 1- -ebiniak. 1978). that effectiveness has been inadequately measured
(Steers. 1977). and even that effectiveness is largely a nonsensical term
(Goodman. Atkin. & Schoorman. 1979). Despite these obstacles. however,
this essay has indicated some points in which concensus is possible
regarding the construct of effectiveness: The following statements of
conclusion represent some of those major points.
1. Organizational effectiveness is a construct with unspecified
boundaries. it is impossible. therefore. to produce one model of
effectiveness that encompasses all relevant criteria.
2. Different conceptualizations of organizations produce differen+ models
of organizational effectiveness. Because organizational
conceptualizations are interested in completeness more than in
accuracy. multiple conceptualizations are both possible and desirable.
3. Criteria for Judging organizational effectiveness are founded in the
preferences and values of individuals. Individual differences
preclude concensus regarding one universal set of criteria.
51
71

4. Criteria of effectiveness are time constrained. so that depending on
when effectiveness is assessed. or depending on whether a long-term
view or a short-term view is taken. criteria differ in their
relevance.
5. It is easier for individuals to identify and agree on criteria of
Ineffectiveness than criteria of effectiveness. Problems and faults
in organizations serve to circumscribe the construct space of
ineffectiveness more narrowly than successes and desirable outcomes
circumscribe effectiveness.
6. Different models of organizational effectiveness are useful in
different circumstances. None of the major models of effectiveness
supercedes all others. so that each model possesses some legitimacy in
organizational assessments.
7. Pesearchers can make fruitful additions to the literature of
organizational effectiveness by selecting a model of effectiveness
that is congruent with the specific circumstances being considered.
Limiting the scope of any investigation by means of the seven critical
questions also is a necessity.
8. Identifying strategies for improving organizational effectiveness is
more precisely done by analyzing organizational ineffectiveness as
opposed to organizational effectiveness.
52
7r)ti
FOOTNOTES
1 Any model of organization claimed to be complete would have to account
for all phenomena that influence and are influenced by organizational
behavior. Because those phenomena are time dependent (e.g., some
factors or their effects may go unrecognized until they ar6 uncovered
by the proposal of an alternative model; Kuhn. 1962). no single model
could account for all relevant variables. A model claiming
completeness would also have to claim accuracy. and unlike the physical
sciences where most relationships are governed by immutable natural
forces (e.g., gravity). such forces--and therefore constant. consistent
relationships--are very rare in organizational behavior. No model,
therefore. could be Judged to be both complete and accurate all the
time.
2 For many constructs in organizational Llhavior, however, researchers
have narrowed the construct sdace by agreeing on a common set of
indicators that serve to bound the construct space. Consensus
circumscribes constructs. For effectiveness. no such consensus of
criteria exists, and therefore little narrowing has occurred.
3 There may be several reasons why faults in organizations are easier to
identify and to reach consensus on than strengths. For example, the
effects of faults are generally more obvious than are the effects of
strengths in an organization. When things go wrong, it Is more obvious
than when things are smooth-running. Individuals are more
uncomfortable in the presence of orgarlzational faults and mistakes
than they are comfortable when things are right. That Is. faults
53
73

produce dissatisfaction and effort on the part of individuals to
re-establish equilibrium (effectiveness). An absence of faults. on the
other hand. does not necessarily produce high satisfaction. The
presence of criteria of effectiveness produce satisfaction. tut these
criteria are qualitatively different from criteria of ineffectiveness.
(See footnote 4.) Theories of cognitive dissonance suggest that
ind viduals are motivated to .-form cognitive work only when they
experience dissonance or discrepancy. Hence. faults. which produce
discrepancies, are more readily evident in the environment than are
strengths.
4 The assessment of Ineffectiveness is not Just the flip-side of
assessments of effectiveness. Qualitative differences exist. In
assessing ineffectiveness, for example. the assumption is made that the
organization is effective to begin with, and the task of the analyst is
to identify the factors that diminish effectiveness. In assessing
effectiveness in the traditional way, the organization is assumed to be
ineffective. and then evidence for effectiveness (i.e., criteria of
good performance) are sought. This is similar to the difference
between health and illness. One can look for evidence of good health
(effectiveness) or for evidence of illness (ineffectiveness). The
criteria that indicate each condition are not Just the converse of one
another. They are qualitatively different. A model of ineffectiveness
and its causes is not likely to be Just an absence of criteria of
effectiveness. therefore. A different set of factors will be present
in each model, not just the abser,e of the other models factors. This
definition of organizational effr .eness is qualitatively different.
therefore. from the approaches to effectiveness taken up to now.
54
74

5 it is important to keep in mind that fault tree analysis is a fool for
analyzing organizational effectiveness. It is not a model of
organizations in and of itself.
6 A computer program has been designed to handle up to 16 levels of fault
tree inputs In behaviorally oriented systems. (Developed by Kent
Stephens at Brigham Young University.)
7 It may be the case that not all frequently occurring small faults
contribute to 4-he occurrence of a larger fault. But if the fault tree
is constructed properly, where the faults on the lower levels of the
tree are identified as havi7,g a causal relationship to the faults
immediately above them, the logic of this computational formula holds.
8 The power of fault tree analysis may be enhanced if it is used as an
iterative process. That is. when strategies have been employed to
eliminate criteria of ineffectiveness. the relative weightings of
various faults !;-, the tree may change. A new analysis may uncover a
new strategic path that was not identified in the earlier fault tree.
Continuous self-analysis in an organization. then. could enhance the
self-design and self-renewal process.
55
75

REFERENCES
Argyris. C. Interyotion theory and method. Reading. Mass.:Addison-Wesley, 1970.
Argyris. C. Some unintended consequences of rigorous research.PsycholcsUsA0 Bulletin. 1968, 2Q, 185-197.
Argyris. C. interpersonal comf-1 I.
Homewood. III.: Irwin. 1962.
eness.
Argyris. C., and Schon. D. pnganaailoneW1DArntyof _actionpersoective. Reading. Mass.: Addison-Wesley, 1978.
Baker, B. 0. Fault tree analysis: its implications for use in education.Unpublished masters thesis. Department of Instructional Media, UtahState University, 1976.
Bennis. W. G. The concept of organizational health. In W. G. Bennis(Ed.). Changing organizations. New York: McGraw-Hill. 1966.
Bluedorn. A. C. Cutting the gordian knot: A critique of theeffectiveness tradition in organization research. Sociology and
SzcJaj Research, 1980, §A, 477-496.
Brehm, J. W., and Cohen. A. R. Eisplorations in cogni.iive dissonance. New
York: Wiley, 1962.
Brewer, G. D. Assessing outcomes and effects. In K. S. Cameron and D. A.Whetten (Eds.). Droanizationd effectiveness: ,A comparison of
multiple models. New York: Academic Press. 1983.
Cameron. K. S. Measuring organizational effectiveness in institutions ofhigher education. Administrative Science Quarterly, 1978, 21,604-632.
Cameron, K. S. Critical questions In assessing organizationaleffectiveness. Organizational Dynamics. 1980, 4, 66-80.
Cameron, K. S. Domains of organizational effectiveness in colleges anduniversities. Academy of Management Journal. 1981, 24, 25-47.
Cameron. K. S. A comprehensive bibliography of organizationaleffectiveness. Boulder, Colo.: National Center for Higher EducationManagement Systems. 1982.
Cameron, K. S., and Whetten. D. A. Perceptions of organizationeffectiveness across organizational life cycles. AdministrativeS.Cleace_Q.uar_t1.1.14, 1981, 26, 525-544.
Cameron. K. S., and Whetten. D. A. arganizational afiactiveness: AQmparison of multiple models. New York: Academic Press. 1983.
Campbell, J. P. On the nature of organizational effectiveness. In P. S.
Goodman and J. M. Pennings (Eds.). liewaers.pecilvelon_orvalletionalAifectiwtness. San Francisco: Jossey-Bass. 1977. pp. 13-55.
Campbell, J. P., Brownas. E. A., Peterson. N. G., and Dunnette. M. D. Themeasurement of organizational effectiveness: A review of relevantresearch and opinion. Final report. Navy Personnel Research andDevelopment Center, Minneapolis: Personnel Decisions. 1974.
Cangelosl, V. E., and Dill. W. R. Organizational learning: Observationstoward a theory. Administrative Science Quarterly, 1965, 11,175-203.
57
7

Connolly, T., Colon, E. M., and Deutch, S. J. Organizationaleffectiveness: A multiple constituency approach. Academy ofManagement Review, 1980, 5, 211-218.
Cummings. L. L. Emergence of the instrumental organization. In P. S.
Goodman and J. M. Pennings (Eds.). New perspectLyes on organizationaleffectiveness. San Francisco: Jossey-Bass. 197'. pp. 56-62.
Cyert, R. M., and March, J. G. ti_aehavloral theory_ the firm. EnglewoodClihfs. N. J.: Prentice-Hall. 1963.
Daft, R., and Wiginton. J. C. Language and organizations. Academy of
Management Review, 1979, A, 179-192.
Dalkey, N., and Helmer, O. An experimental application of the Delphimethod to the use of experts. Management Science. 1963. 458-467.
Davis, M. S. That's interesting: Towards a phenomenology of sociologyand a sociology of phenomenology. Philosophy of Social Science,1971, 1 309-344.
DeNisi, A. S., Randolph, W. A., and Blencoe. A. G. Level and score offeedback as determinants of feedback effectiveness. Academy ofMangimen±211§Dedirw. 1982, 175-179.
Driessan. G. J. causgtragignalysjsi Measurina how accidents h en acid
the probabilities of their causes. Paper presented at the 78thAnnual Meeting of the American Psychological Association. September1970.
Dubin. R. Organizational effectiveness: Same dilemmas of perspective.kganization Againistrative Sciences. 1976. Z. 7-14.

Feutz, R. J., and Waldeck, T. A. Thg application of fattlitra_eanalysisIpAynamic systems. Paper presented at the Systems Safety Symposium.Seattle, Washington. June 1965.
Flanagan. J. C. The critical incident technique. Psychological Bulletin.1954, 11, 327-358.
Friedlander, F., and Pickle, H. Components of effectiveness in smallorganizations. Administrative Science Quarterly, 1968, 11, 289-304.
Fussell, J. B., Powers. G. J., and Bennetts. R. Fault tree: A state ofthe art discussion, IEEE Transactions on Reliability. R-23, April1974, 51-55.
Galbraith, J. Organiz tlonal _design; An intormation_processing view.Reading. Mass.: Addison-Wesley, 1977.
Georgopolous. B. S., and Tannenbaum, A. S. The study of organizationaleffectiveness. American Sociological Review, 1957. Za, 534-540.
Ghorpade, J. Aug55;aa_noaani_ozatIon eflectivenes. Santa Monica.
Calif.: Goodyear, 1970.
Goodman. P. S. organizational Pfligilveness as t decIldlommiakimam2=1.Paper presented at the 39ti1 Annual meetings of the Academy ofManagement, Atlanta. Georgia, 1979.
Goodman, P. S., and Pennings. J. M. New perspectives on_organizationaleffectiveness. San Francisco: Jossey-Bass. 1977.
5979

Haasl, D. F. Agianced concepts In fault tree analysis. Paper presentedat the Systems Safety Symposium. Seattle. Washington. June 1965.
Hannan, M. T., and Freeman, J. The population ecology of organizations.AMIrican Journal of Sociology. 1977. fiZ, 929-964.
Hedberg. B. L. T., Nystrom, P. C., and Starbuck, W. H. Camping onseesaws: Prescriptions for a self designing organization.
Administrative Science Quarterly, 1976. a. 41-65.
Henley, E. J., and Lynn, J. W. L'alaerl_o_Iec
allessment. Leyden, Netherlands: Noordhoff, 1976.-
Hiltz, P. A. Tne fundamentals of fault Ire_e_anallsis. Downey, Calif.:North American Aviation. Inc., November 1965.
Hirschman. A. 0., and Lindblom, C. E. Economic development. research anddevelopment. policy making: Some converging views. DohavioralScience, 1962, a, 211-222.
Hrebiniak. L. G. Complex organizations. St. Paul, Minn.: WestPublishing. 1978.
Kanter, R. M., and Brinkerhoff, D. Organizational performance: Recentdevelopments in measurement. Annual Review of _Sociology. 1981, 2.321-349.
Kaplan, A., Skogstad, A. L., and Grishick, M. A. The prediction of social
and technological events. Public Opinion Quarterly, Spring 1950.
60 hs0

Karmiloff-Smiths A. and Inhelder, B. If you want to get ahead. get atheory. CognitioR. 1974-75, 1. 195-212.
Keeley, M. Organizational analysis: A comparison of organismic andsocial contract models. Administrative SclencyLLWarterly, 1980, 21,337-362.
Keeley, M. A social Justice approach to organizational evaluation.Administrative SthifireSkarierly., 1978, 22. 272-292.
Kilman. R. H., and Herden, R. P. Toward a systematic methodology forevaluating the impact of interventions on organizationaleffectiveness. Academy of ManAgemnetReviem. 1976. 1. 87-98.
Kotler. P. A guide to gathering expert estimates. Business_fitrizons.1970, 11, 79-87.
Kuhn. T. S. The structure of scientific revolution. Chicago: Universityof Chicago Press. 1962.
Likert, R. TileIUMNIILMUELLLItiQa. New York: McGraw-Hill. 1967.
Lindblom, C. E. The science of muddling through. Public Admin(strationReqlt, 1959, 22, 79-88.
MacDonald. J, The game of busIneal. Garden City, NY: Anchor Press. 1975.
March, J. G.. and Olsen, J. P. Ambiaufty and choice in ors_ nizatIona.Oslo. Norway: Universitetsforiaget, 1976.
61 81

Means. A. B. &Of' tree analysis: The study of unlikely events Incomplex systems. Paper presented at the Systems Safety Symposium,Seattle, Washington. June 1965.
Meyer, M. W. lrganizational domains. American Sociological Review. 1975,
42, 599-615.
Michaels. J. M. Qgmputer evaluation of the safety fault tree MQ,41121.
Paper presented at the Systems Safety Symposium, Seattle. Washington.June 1965.
Mi R. H. MacrogrganJzationaLlehavior. Santa Monica, Calif.:Goodyear. 1980.
Miles, R. H., and Cameron. K. S. CgtiirlNILLkAnaOLorate strategies.Englewood Cliffs. N. J.: Prentice -Hall, 1982.
Miles, R. H., and Randolph, A. Influence of organizational learningstyles on early development. In J. R. Kimberly a d R. H. Miles(Eds.). Theo. San Francisco: Jossey-Bas:-).
1980.
MI'lett. J. The academic community. New York: McGraw-Hill. 1962.
Mohr. L. R. The implications of effectiveness theory for managerialpractice in the public sector. In K. S. (.:waeron and D. A. Whetten
(Eds.). Organizational effectiveness: A comparison of multiple
glQ1e15. N9w York: Academic Press. 1983.
Molnar. J. J., and Rogers. D. C. Organizational effectiveness: Onempirical comparison of the goal and system resource approach.Acclologicai_ luarterix, 1976. 12, 401-413.
62
8 I)

Morgan, G. Paradigms. metaphor:. and puzzle solving in organizationaltheory. Alimlnistrative _Science Ouarterly, 1980, 2/, 605-622.
Mott. P. E. Ihl characteristics of_e_f_JectiyeLor_canizatLons. New York:
Harper and Row, 1972.
Nadler, D. A., and Tushman, M. L. A congruence model for organizationalassessment. In E. E. Lawler, D. A. Nadler, and P. Cammann (Eds.).
Orgenl at IMOorganizational b_etawioransLtbaSikailtult...wprisinailia. New York:Wiley, 1980, pp. 261-278.
Nagel, P. M. AMOigLLITILLMOItodIPPQMPIIII_LOult tree probabilities.Paper presented at the Systems Safety Symposium. Seattle, Washington.June 1965.
Nisbet, R. E., and Wilson. T. Telling more than we can know: Verbalreports on mental processes. Psychological Review, 1977,231-259.
Nord. W. R. A po,itical-economic orspective on organizationaleffectiveness. In K. S. Cameron and D. A. Whetten (Eds.).
kgapizationAlAilecliyeness: A comparison of multiple models. New
York: Academic Press. 1983.
Pennings, J. M., and Goodman. P. S. Toward a workable framework. In P.
S. Goodman and J. M. Pennings (Eds.). New perspectives on
zganizational effectiveness. San Francisco: Jossey-Bass. 1977
Perrow, C. cc anizational analysis: A sociological view. Belmont.
Calif.: Wadsworth, 1970.

Pfeffer, J. Management as symbolic action: The creation and maintenanceof organizational paradigms. In L. L. Cummings and B. M. Stew(Eds.). Research in organizational behavior, Vol. 3. Green ich,
Conn.: JAI Press. 1981.
Pfeffer, J., and Salancik. G. R. The _external control of organizations.New York: Harper and Row, 1978.
Pondy, L. R., and Mitroff, I. Beyond open systems models of organization.In B. Staw (Ed.). Research in_oraantzationad behavior. Greenwood.Conn.: JAI Press. 1979, pp. 13-40.
Powers, G. J. Fault tree synthesis for chemical process. AICHE Journal,1974, 22, 376-387.
Price, J. L. The study of organizational effectiveness. IgaoJogicalOuarterly, 1972, 11, 3-15.
Price, J. L. Qcadzational effectIveneHomewood. Irwin. 1968.
*s 'I I 1
Quinn, R. E., and Cameron. K. S. Life cycles and shifting criteria ofeffectiveness: Some preliminary evidence. Management Science. 1982,
Quinn, R. E., and Rohrbaugh, J. A competing values approach toorganizational effectiveness. Public ProdActivity Review, 1981, 1,122-140.
Quinn, R. E., and Rohrbaugh, J. A spatial model of effectivenesscriteria: Towards a competing values approach to organizationaleffectiveness. Management Science, forthcoming.
64

Rice, A. K. Learning for leadership: interpersonal anclifttergromDmiationa. London: Tavistock, 1965.
Rohrbaugh, J. Oprationalizing the competing values approach. PublicProductivity Review, 1981, 1, 141-!59.
Rothenburg. A. The emerging goddess. Chicago: University of ChicagoPress. 1979.
Scott, W. R. Effectiveness of organizational effectiveness studies. In
P. S. Goodman and J. M. Pennings (Eds.), hekaripectives ORPconlzational effectiveness. San Francisco: Jossey-Bass. 1977.
Seashore, S. E., and Yuchtman. E. Factorial analysis of organizationalperformance. AcintaiktrAttiesragncg Ouarterlv, 1967. 12, 377-395.
Sherwood. J. J., Barron, J. W.. and Fitch, H. G. Cognitice dissonance:Theory and research. in R. V. Wagner and J. J. Sherwood (Eds.). Thestudy of attitucip change. Belmont. Calif.: Brooks/Cole, 1969.
Shultz, R., Greenley, J., and Peterson. R. Why do some health servicesprovide higher quality care and/or private care at lower costs thanothers? Working paper, Department of Preventive Medicine, Universityof Wisconsin-Madison. 1982.
Simon. H. A. AgainatrAtLygtetayicr. New York: Free Press. 1947.
Slovic. P., and Lichtenstein. S. Comparison of Bayesian and regressionapprc-ches to the study of information processing in judgment.QuanIzationid Behavior and Human Performance. 1971, L., 649-744.

Starbuck. W.that is(Eds.).
models.
H., and Nystrom. P. C. Pursuing organizational effectivenessambiguomly specified. In K. S. Cameron and U. A. WhettenDtganizational ellectiveness:___A comparison of multipleNew York: Aca,Idmic Press. 1983.
Stasser, S., and Den,iton. L. O. A comparative analysis of goal andsystems models designed to evaluate health organizationeffectiveness. Proceeding.s_c. 1979,342-347.
Steers. R. M. Organizational effectiveness: k_b_ehav_i_oral_v_i_ew. SantaMonica, Calif.: Goodyear. 1977.
Stephens. K. G. LIMO tree approach to needs asSISIMODI=AnOgryiew.Paper presented at the Needs Assessment Conference, Oakland.California. April 1976.
Stephens, K, G. A fault approach to analysts at...systems asslemonstrate0 in vocalional_education. Unpublished doctoral
dissertation. University of Washington. 1972.
Thompson, J. D. OrganizatLon In action. McGraw-Hill. 1967.
Tichy, N., and Fombrun, C. Network analysis in social settings. HumanElatIon§. 1979, 12, 923 -965.
Van de Ven, A. H., and Ferry, D. Measuring and assessinoLoraanizations.New York: Wiley, 1980.
Weick, K. E. Re-punctuating the problem. In P. S. Goodman and J. M.Pennings (Eds.). New aerspecli/es_om _organizational effectiveness.San Francircc: Josscy -Bass. 1977.

Whetten. D. A. Coping with incompatible expectations: An integrated viewof role conflict. kministratiNeScience Quarterly, 1978, a.254-271.
Winkler, R. L. The concensus of subjective probability distributions.Management Science. 1968, .11. 61-75.
Witkin, B. R., and Stephens. K. G. fault tree analysis. A research tkmi
elusalLoDALagmajag. Technical Report No. 1. Hayward. Calif.:Alameda County PACE Center, 1968.
Wittgenstein. L. Phillsophical inveLtigations. GEM Anscombe. trans.Oxtord: Blackwell, 1968.
Wood. R. K., Stephens, K. G., and Barker, B. 0. Fault tree analysis: An
emerging methodology for instructional science. instructismal
Science. 1979, 1, 1-22.
Yuchtman. E., and Seashore. S. E. A system resource approach toorganizational effectiveness. American Sociological Review. 1967.
12, 891-903.
Zammuto, R. F. Assessing oraanIzatioaJ effectlyenos; Systems change.ktiaPeiSTI,Alid Strategy. Albany, NY: SUNY Albany Press. 1982.
Zarzycki, J. H. Fault tree anplysis as a managerial tool for _productionloss control. USAMC-ITC Report No. 2-71-14, U. S. Army Logistics
Management Center. Texarkana, Texas: Red Fiver Army Depot. 1971.

SELECTED REFERENCES FOR FAULT TREE ANALYSISIN BEHAVIORAL SYSTEMS
Barlow, R. E. and Chatterjee. P. Introduction to fault tree analysis.OM. December 1973.
Barnes. M. A. Undergraduate professional physical education: A fault treeanalvsis_cl theurporetn _al:Brigham Young _University. Unpublished
doctoral dissertation, Brigham Young University, 1979.
Campbell. D. R. F.Ault_tr.1..5....gissamialsitign-gtrsalgtusafslesAfstudtes In Abo state of New MtKigg. Unpublished doctoral
dissertation. Brigham Young University, 1980.
Clawson. J. M. LIAWitialeA29roach to analysis of nursima_proorams_lQAlliprnia community colleges. Unpublished doctoral dissertation.Brigham Young University, 1979.
Coiling. L. L. D. A fault tMAJor objectives of community recreation 12. Unpublished doctoraldissertation, Brigham Young University, 1975.
.1, - le
Copeland. K. W. Limit tree analysis of the graduate division of thePapartme_nt _o_f__Ebyslcal Education. College ,of Physical Educati_on at
Brigham Young llniversity. Unpublished doctoral dissertation. BrighamYoung University, 1976.
Crosettl, P. A, and E,ice. R. A. Commerical applications of fault treeanalysis. Proceedings_of the Reliability and Ma!ntenans_, Conference.1970, /, 230-244.

Cummings, C. C. Jr. kfault tree analysJs of computer support services:ltteh_5101_psord of Education. Division of Data Processino.Unpublished doctoral dissertation. Brigham Young University, 1977.
Deridder. C. G. A_fault tree analysis of personnel goal s1 United StatesForest Service, Pacific Northest radon. Unpublished doctoraldissertation. Brigham Young University, 1978.
Eagle, K. H. famli_freePaper presented at the 1969 Annual Symposium on Reliability. Chicago.January 1969.
Fowler, D. W. Vocational edkoation administrati_ve_unit:__A fault treeanalysisof the California State Departvent. Unpublished doctoraldissertation. Brigham Young University, 1979.
Fussell. J. B. Fault tree analysis--Concepts and techniques. In E. J.
Henley and J. W. Lynn (Eds.). _Generic techniques in systemscall:Witty asW$.5mgpl. Leyden. Netherlands: Noordhoff, 1976.
Fussell, J. B. Fault tree analysis with emphasis on limitations. Working
paper, Aerojet Nuclear Company, Idaho Falls. Idaho. 1976.
Gurr, P. A. T. ihternAtional community education Afault tree anahs1vi_thSJAOMLIAtbEttiAlaJL S. MottfoundatIQnlakact. Unpublisheddoctoral dissertation. Brigham Young University, 1978.
Hollington. K. C. Eitultftree .D1 : II. .1:11.1 O. "II-I Star k+AlkPLia community colleges. Unpublished doctoral dissertation.Brigham Young University, 1979.

Horne. M. W. Aditi-LthlrieapiroaalLislteachkr turnover: in hon-releaselime seminariesLirLthe Pacific Northwest division of the LDS church
edy.clitional_Aystein. Unpublished doctoral dissertation. Brigham Young
University, 1979.
Jones. A. R. A fault tree evaluation of administrative Processes andAccompanyJI4L4Wislelines tgr_IMPlementing _a federal grant: Amanaggmeni modeJ. Unpublished doctoral dissertation. University ofUtah. 1978.
Knudsen. R. G. A fault tree approach to_an_internationai educationprogram: California State University and Colleges. Unpublished
doctoral dissertation. Brigham Young University, 1977.
Long. R. W. A fault tre.c aporoogh to the analysis of perceived internal=r unJcation problems inapJMaildthajnkith;SaMplaSalabanny_Cp I egedistrict. Unpublished doctoral dissertation. Brigham YoungUniversity, 1976.
Mehr. 4 S. snorts:
Young University. Unpublished doctoral dissertation. Brigham
University, 1978.
Nelson. V. A. A_tault.ireeLanelysis of selected policies. _procedures. and
charactaristLu gd IIIALStoilesm_oLlastarn Utah. Unpublished doctoral
dissertation. Brigham Young University, 1976.
Nielson. D. S. Use of cause/consequance charts in practical systemsanalysis. In Reliability and fault tree analysis. Siam Publishing,1975.
Phillips. W. B. A fault tree analysis of elementary studentselfmgonfidence. Unpublished doctoral dissertation. Brigham Young
University, 1979.
70
90

Puckett. G. C. Liault tree analyst: of to implementation of the Nebowool Dlistri.0_gareer_education RWL. Unpublished doctoraldissertation. Brigham Young University. 1977.
Rich, N. E. A fault tree analysis of student academic needs: Golden West
Q21143.21. Unpublished doctoral dissertation. Brighar YoungUniversity, 1979.
Shields, D. M. &fault tree approach to analyzing school library mediaseivlos. Unpublished doctoral dissertation. Brigham YoungUniversity, 1977.
Siafter, H. S. .8.D_APailcatign_Di_iault tree Anall_Ws_jil thedexplopmentof a prescription for reporting student performance. Unpublisheddoctoral dissertation. University of Wyoming. 1971.
Spitzer, D. Try fault tree analysis. a step-by-step way to improveorganization development. Training. 1980, 1/, pp. 58-62, 68, 69.
Swain. A. D. Shortcuts in human reliability analysis. In E. J. Henleyand J. W. Lynn (Eds.). CtinerIctechataitekanyavessment. Lyden, Netherlands: Noordhoff, 1976.
Vesely, W. E. A time-dependent methodology for fault tree analysis.RILthisminaraerin.g and_Deslon. 1970, 11. 337-360.
WII:on. J. A. A fault tree approach to analysis of counselor training forhishcps in the Lburcb of ktaluES4hrLitS.Unpublished doctoral dissertation. Brigham Young University, 1976.
Witkin, B. R. Fault tree analysis as a planning and management tool: A
case study. Educational Planning. 1977. 1. 71-85.
71
91

Wood, R. K. Teacher use of library _media _centsurs In the future. ARational needs assessment by ie of delphl y ifh local fault treeanalysts 0 this assessmenjfor Instructional development.Unpublished doctoral dissertation. Brigham Young University. 1977.