Embed Size (px)
Citation preview
DOCUMENT RESUME
ED 197 947 SE 033 908
AUTHOR Sacks, ArthuT. e., Ed.: And OthersTITLE Current Issues VI: The Yearbook of Environmental
Education and Environmental Studies. Selected Papersfror.the4:Annual Conference of the NationalAssociation for Environmental Education (9th).
INSTITUTION ERIC Clearinghouse for Science, Mathematics, andEnvironmental Education, Columbus, Ohio.; NationalAssociation for Environmental Education, Troy,Ohio.
SPONS AGENCY National Inst. of Education (DREW), Washington,D.C.
PUB DATE Nov 80CONTRACT 400-78-0004NOTE 406p.: Contains occasional light and broken type.AVAILABLE FROM Information Reference Center (ERIC /IRC) , The Ohio
State Univ., 1200 Chambers Rd., 3rd Floor, Columbus,OH 43212 ($7.50).
EDRS PRICE MF01/PC17 Plus Postage.DESCRIPTORS Attitude Measures: Citizen Participation:
*Conservation Education: Curriculum Development:Elementary Secondary Education; *EnvironmentalEducation: Instructional Development: NonformalEducation: Postsecondary Education; ScienceEducation
IDENTIFIERS *Environmental Education Research
:ABSTRACTTwo maior sections, one dealing with the
practitioner's perspective and the other addressing research andevaluation, comprise these proceedings of the 1980 Conference of theNational Association for Environmental Education (NAEE). Section Icontains 10 essays which describe programs, approaches, and issues ofinterest to the environmental education community. The 22 paperswhich make up Section II Present analyses of significantenvironmental education research problems: many are based uponoriginal studies. Also included is NAB! President A. ClaySchoenfeld's inaugural address entitled "Earth Day :70, '80, '90."(wB).
********************f*************************************************** Reproductions supplied by EDRS are the best that can be made ** from the original document. *
***********************************************************************
CURRENT ISSUES VI:The Yearbook of Environmental Education
and Environmental Studies
Selected Papers from the Ninth AnnualConference of the National Association
for Environmental EducationU.S DEPARTMENT OF HEALTH.
EDUCATION & WELFARENATIONAL INSTITUTE OF
ELUCAT ION
THIS DOCUMENT HAS BEEN REPRO-DUCED EXACTLY AS RECEIVED FROMTHE PERSON OR ORGANIZATION ORIGIN-ATING IT POINTS OF VIEW OR OPINIONSSTATED DO NOT NECESSARILY REPRE-SENT OFFICIAL NATIONAL INSTITUTE OFEDUCATION POSITION OR POLICY
Edited by
Arthur B. SacksLei Lane Burrus-Bammel
Craig B. DavisLouis A. Iozzi
with a Foreword byLynton K. Caldwell
The National Association for Environmental EducaticnP.O. Box 400
Troy, Ohio 45373
ERICPublished by
Clearinghouse for Science, Mathematicsand Environantal EducationThe Ohio State UniversityCollege of Education and
School of Natural Resources1200 Chambers Road, 3rd Floor
;:olumbus, Ohio 43212
November 1980
2
ENVIRONMENTAL EDUCATION INFORMATION REPORTS
Environmental Education Information Reports are issued toanalyze and summarize, information related to the teaching andlearning of environmental education. It is hoped that thesereviews will provide information for personnel involved indevelopment, ideas for teachers, and indications of trends inenvironmental education.
Your conmeni-s and .suggestions for this series are invited.
John F. DisingerAssociate DirectorEnvironmental Education
****************
Publication sponsored by the Educational ResourcesInformation Center of the National Institute of Education andThe Ohio State University.
This publication was prepared with funding from the NationalInstitute of Education, U.S. Department of Education undercontract no. 400-78-0004. The opinions expressed in thisreport do not necessarily reflect the positions or policies ofNIE or U.S. Department of Education.
PREFACE
The Ninth Annual Conference of the National Association forEnvironmental Education (NAEE) was held 23 May through 29 May1980 on the campus of the University of New Mexico inAlbuquerque, New Mexico. One hundred ninety-nine individualsfrom forty states and two foreign countries participated. Ingeneral, the Conference was highly successful. The sessionsdeveloped around invited papers went particularly well, asdid the "Poster Session" which served as a vehicle f-)rdescribing individual programs and approaches toenvironmental education.
The essays contained in this volume represent the best of thesubmitted Conference papers. As in the past, this volume ofCurrent Issues has striven to provide both environmentaleducation applications - -the practitioner's perspective--andthe results of scholarly analysis and integration--theresearcher's perspective. Our goal has been twofold: (1) topresent to our diverse readership a high quality yearbookwhich presents the researcher, the scientist, and the studentof environmental education and environmental studies with thecurrent year's exploration of issues and problems facingeducators and environmental education; and (2) to provideboth the practitioner and the scholar with e selection of theyear's production of environmentally-related research andscholarship.
To insure that the goals of the Current Issues series arereflected clearly in the design of the volume, at its fallmeeting (27 September 1980) NAEE's Board of Directorsauthorized the present format. The first section,"Environmental Education Applications--the Practitioner'zPerspective," replaces the "Notes and Commentaries" sectionfound in last year's Current Issues volume. The secondsection, "Research and Evaluation--Refereed Papers," is arenaming of last year's section entitled "Refereed Papers,"We have also chosen to reverse the order of the sections.
This year, Current Issues also has seen the expansion of theeditorial staff to include broader representation andexpertise to accommodate the range of papers submitted toCurrent Issues. Two editors, Dr. Arthur Sacks and Dr. CraigDavis, were responsible for papers broadly termed"environmental studies," while Dr. Lei Lane Burrus- Bamme,l andDr. Louis Iozzi were responsible for papers broadly termed"environmental education." All of the editors reviewed thepapers for the. "Environmental Education Applications--thePractitioner's Perspective" section, and, based upon thisreview, selections were made. Before papers were selectedfor the second section, "Research and E'r,1:1:ationRefereedPapers," they were carefully reviewed by the respective,
iii
4
editors and submitted for peer review by at least twoadditional experts in the field (see "Reviewers," page vii).
'In all, 40 papers were submitted. A total of 32 were accepted(80 percent), 10 for section one and 22 for section two.
The editors are especially pleased that Current Issues VI hascontinued the approach adopted last year of soliciting aninvited "Foreword" from a distinguished member of theenvironmental community. This year's "Foreword" was writtenby Dr. Lynton Keith Caldwell, Arthur F. Bentley Professor ofPolitical Science and Professor of Public and EnvironmentalAffairs at Indiana University. Professor Caldwell, bestknown for his role in establishing the National EnvironmentalPolicy Act (NEPA), has published widely in the environmentalpolicy and citizen action areas. He is also represented as acontributor to section two of the present volume.
We have also included Professor Clay Schoenfeld's inauguraladdress as he assumed the NAEE presidency at the Ninth AnnualConference. We hope the inclusion of the president's annualaddress too will become a standard practice for the CurrentIssues series.
Once again we wish to acknowledge the effort put forth by theERIC Clearinghouse for Science, Mathematics and EnvironmentalEducation, and, particularly, Dr. John. Disinger, ERIC'sAssociate Director. ERIC's consistent support of the CurrentIssues series has been an essential element in its progress,while Dr. Disinger's rigorous professionalism and his kindwords and helpful advice have helped make a complex task gosmoothly.
Finally, we would like to offer our deep appreciation for thesubstantial support provided to NAEE and to Current Issues bythe'Institute for Environmental Studies of the University ofWisconsin-Madison, the Division of Forestry of West VirginiaUniversity, the Environmental Studies Program of Iowa StateUniversity, and the Institute for Science, Technology andSocial Science Education of Rutgers-The State University ofNew Jersey. By volunteering staff time and facilities, andby absorbing many of the incidental expenses required forediting a volume of this scope, these institutions have beenable to extend their educational roles beyond the borders oftheir states. Without such assistance, Current Issues VIwould not be a reality.
October, 1980
Arthur B. SacksLei Lane Burrus-BammelCraig B. DavisLouis A. Iozzi
Editors, Current Issues VI
iv
5
CURRENT ISSUES VI:The Yearbook of Environmental Education
and Environmental Studies
EDITORS Dr. Arthur B. SacksAdministrator of Academic Programs'Institute for Environmental Studies70 Science HallUniversity of Wisconsin-MadisonMadison, Wisconsin 53706
Dr. Lei Lane Burrus-BammelAssociate Professor of Environ-
mental Education and AssociateForest Scientist
College of Agriculture and ForestryWest Virginia UniversityMorgantown, West Virginia 26506
Dr. Craig B. DavisAssociate Professor of Botany and
Coordinator of EnvironmentalStudies
141 Bessey HallIowa Stat.:e UniversityAmes, Iowa 50011
Dr. Louis A. IozziAssistant Professor of Science andEnvironmental Education
Cook CollegeRutgers-The State University ofNew Jersey
New Brunswick, New Jersey 08903
SPECIAL ASSISTANCE
Ms. Nancy BrzezinskiSecretaryEducation DepartmentCook CollegeRutgers-The State Universityof New Jersey
Ms. Eileen HannemanProgram AssistantInstitute for Environmental StudiesUniversity of Wisconsin-Madison
Ms. Ruth HansenTypistInstitute for Environmental StudiesUniversity of Wisconsin-Madison
Ms. Loretta HooverSecretaryDivision of ForestryWest Virginia University
Ms. Sandra WadeSecretaryEnvironmental StudiesIowa State University
vi
REVIEWERS
The editors would like to thank those listed below whograciously volunteered their services as reviewers for thisvolume of Current Issues. -Re,,rieweLs were selected fromwithin NAEE ranks and from with-6dt in an attempt to bring abroad scope of scholarly and professional expertise to bearupon the papers submitted.
Gene BammelDivision of ForestryWest Virginia UniversityMorgantown, WV 26506
Franklin E. BotelerDivision of ForestryWest V ginia UniversityMorgantown, WV 26506
Jeff E. CarrollEnvironmental EducationPrograms
Forest ServiceUSDAWashington, D.C. 20013
Janey M. Y. CheuThe Institute for Science,
Technology Social ScienceEducation
Rutgers -The State Universityof New Jersey
New Brunswick, NJ 08903
Charles CicchettiInstitute for EnvironmentalStudies/Economics
University of Wisconsin-Madison
Madison, WI 53706
Judy DuShaneLucas County Office ofEducation
Toledo, OH 43610
vii
8
Arthur W. EdwardsScience and Environmental
EducationCook CollegeRutgers-The State Universityof New Jersey
New Brunswick, NJ 08903
Harriet EhrhardScience EducationDade County Public SchoolsMiami, FL 33132
David 0. FunderburkFerLbank Science CenterAtlanta, GA 30307
Kimberly GalloDivision of ForestryWest Virginia UniversityMorgantown, WV 25506
Thomas B. GroomsCenter for Environmental
Education, Inc.Washington, DC 20006
Mark E. HansonEnergy Systems and PolicyResearch Programs
Energy Research CenterUniversity of Wisconsin-Madison
Madison WI 53706
Helen HolmesEconomic, Environmental andConservation Education
Arkansas Department ofEducation
Little Rock, AR 72201
Jon HutchinsonDivision of Urban and
Environmental PlanningSchool of ArchitectureUniversity of VirginiaCharlottesville, VA 22904
Walter E. JeskeEdu6ation and PublicationsBranch
Soil Conservation ServiceWashington, DC 20013
Marty KanarekPreventive Medicine/Institute
for Environmental StudiesUniversity of Wisconsin-Madison
Madison, WI 537Q6
Richard L. PerrineEnvironmental Science andEngineering
University of CaliforniaLos Angeles, CA 90024
Adelia M. PetersCollege of Education,Educational Foundationsand Inquiry
Bowling Green StateUniversity
Bowling Green, OH 43402
Michael D. PiburnScience and HumanitiesGraduate School of EducationRutgers-The Stag: Universityof New Jersey
New Brunswick, NJ 08903
Judith M. SchultzEnvironmental Control Tech-nology Program
Raymond Walters CollegeUniversity of CincinnatiCincinnati, OH 43236
James C. SchumanPhysical SciencesWest Virginia UniversityMorgantown, WV 26506
Karl E. SchwaabVirginia Polytechnic
Institute and StateUniversity
Blacksburg, VA 24061
Alan M. SchwartzEnvironmental StudiesSt. Lawrence UniversityCanton, NY 13617
William B. StappEnvironmental EducationUniversity of MichiganAnn Arbor, MI 48104
R. Thomas TannerEnvironmental StudiesIowa State UniversityAmes, IA 50011
Arnold van der ValkBotanyIowa State UniversityAmes, IA 50011
Daniel WillardSchool of Public and
Environmental AffairsIndiana UniversityBloomington, IN 47401
CONTENTS
ForewordAn Environmental Agenda for the 1980s: Priority Amidst
Diversity. Lynton K. Caldwell xiii
President's Address to the 1980 ConferenceEarth Day '70, '80, '90. A. Clay Schoenfeld xvii
Section I: Environmental Education ApplicationsThe Practitioner's Perspective
Built Environment Education: Position Statement,Ad Hoc Group for Built Environment Education 5
Forest Service-USDA: A Diversified Program forEnvironmental Understanding. Jefferson E. Carroll . . 9
Environmental Education for Decision-Makers in RuralVermont. Verne B. Howe 14
Conclusions and Recommendations on Adult EnvironmentalEducation Programs. David I. Johnson,Randall Champeau, and Chris Newhouse 20
Environmental Education and Humanistic Education in the1980s: Treading the Content-Process Tightrope.Jean MacGregor 27
A Report on Project EASE: Environmental Approaches toSpecial Education. Michael J. O'Brien,Vicki D. Stayton, Shelley Davis-Wilson, andTerry L. Wilson 32
California Wild and Scenic Rivers: A Vehicle forPresenting the Roles of Environmental Professionalsto Undergraduates. Richard'L. Perrine andWilliam Dritschilo 36
Literature and Film: Cultural Documents of theEnvironment. Arthur B. Sacks 41
An Analysis and Evaluation of a Field Trip Series.Thea Teich and Robert D. Townsend 45
The Ohio State-Youth Conservation Corps Experience.Robert D. Townsend and Robert E. Roth 52
ix I. 0
Section II: Research and Evaluation Refereed Papers
Energy and Transportation
Energy and Environment in the 1980s.John H. Baldwin 61
Energy Policy Issues and the Environmental Agendafor the 1980s. Toufiq A. Siddiqi 91
The Energy-Environment Conundrum: A View from theCongress. Kevin C. Gottlieb 105
Designing Transit to Minimize Urban Costs and EnergyUse. J. Edward Anderson 115
Analysis of Morgantown's Personal Rapid TransitSystem. Gene Bammel and Lei Lane Burrus-Bammel.
. . 126
Environmental Education and Citizen Action
Introduction: Environmental Education for CitizenAction. Thomas Tanner 141
A Paradigm for Citizen Responsibility: EnvironmentalAction. Harold R. Hungerford and R. Ben Peyton . . 146
An Assessment of Teachers' Abilities to Identify,Teach, and Implement Environmental Action Skills.R. Ben Peyton and Harold R. Hungerford 155
Developing an Internal Locus of Control as aPrerequisite to Environmental Action Taking.R. Ben Peyton and Barbara Ann Miller 173
Environmental Activism, Phase III: The Burdens ofResponsibility. Lynton K. Caldwell, 193
A Framework for Environmental Education CurriculumPlanning and Development. Harold R. Hungerford,"R. Ben Peyton, and Richard J. Wilke 202
An Assessment of Teachers' Understanding and Use of"Goals for Curriculum Development in EnvironmentalEducation." Randall Champeau, Michael Gross, andRichard Wilke _218
Land Use
An Experiment in Land-Use Control: The Adirondack ParkAgency. M. Kealy Salomon and Alan M. Schwartz. . . 229
Environmental Health
Opportunities for Improving the Environment forHealth. Vicki Kalmar Weisfeld 247
Attitudes, Values, Judgments, and Awareness
MeasuringAttitudes toward Environmental Issues:The Semantic Differential Technique. The Case ofHunting. Lei Lane Burrs-Bammel 265
Making Value Judgments: A Question of CognitiveDeve opment? Anton E. Lawson 281
Expected Consequences, Enjoyability, and OtherEvaluation Scales. Lei Lane Burrus-Bamme1,William E. Kidd, and Gene Bammel 295
A Longitudinal Study of Factors Influencing ValuePreference in Environmental Problems.Samuel J. Alaimo and Rodney L. Doran 311
An Analysis of the Environmental Awareness of YCCCampers-Summer 1979. Elaine L. Davis,Rodney L. Doran, and S. David Farr 327
Assessing Environmental Education Teachers and Curricula
Evaluation of "Preparing for Tomorrow's World" -Science /Technology /Society for Grades 7-12:Methodology and Results. Louis A. Iozzi 341
A Learning and Communications Profile of TeachersEntering an Environmental Education Experience.David I. Johnson and Douglas C. Covert 362
Guidelines for Authors _185
12
FOREWORDAN ENVIRONMENTAL AGENDA FOR THE 1980s:
PRIORITY AMIDST DIVERSITY
One of the enduring values of The Yearbook of EnvironmentalEducation and Environmental Studies is, and will be, itsrecord of the diversity, direction, and underlying princi-ples cf the environmental movement. In a larger sense, itrecords the conceptual and intellectual transformation thatmust occur g:merally if the quality of life on earth is to bemaintained or enhanced. Degrading conditions of life arerisked in a broad range of prevailing attitudes, assumptions,and behaviors. A major transformation in people andinstitutions will be required if the c_vilized world is toavoid self-destruction.
The Yearbook--Current Issues reports an important part of theevidence of how this transformation is proceeding. Thesubstance of Current Issues, however diverse, represents acommon effort to move people toward an awareness, under-standing, and appreciation of the world, consistent with whatwe now know regarding ecological realities. Otherperiodicals report other aspects of environmental concern,but those dealing with environmental education are concernedwith the one aspect of social transformation that isabsolutely fundamental. This aspect is the internalizationof environmental values and respect for the laws governingthe living world. Without this internalization of values,all other aspects of environmental protection are holdingactions and ultimately lost causes. Unless those tendenciesworking to the destruction of our society can be transformedinto self-renewing behaviors, our efforts towardenvironmental protection will fail. Unless an ecologicalconscience is internalized in a critical mass of mankind, noamount of informing, lawmaking, regulating, or preserving canbe counted upon to safeguard the quality of the environment.
The Yearbook--Current Issues provides a continuing record ofdiverse approaches to this goal. Jf transformation throughinternalization. In many instances the goal is implicit inthe substance of the findings or experience reported. Forexample, it is the consequence sought through "A NationalStrategy for Environmental Education" reported in CurrentIssues V. Figure Three of this article (page 103) might betaken as a model for a process by which environmental valuescould be internalized throughout society. But it is whathappens to people in this process that determines whetherinternalization in the sense of deep comprehension andcommitment really occurs or whether the result of educationis no more than enlarging the number of individuals exposedto environmental information.
13
It seems evident from studies of the attitudes of 1-2eople
toward risk that knowledge is not enough to internalize valuecommitments and patterns of behavior. An ecological way lflife is comparable to religious belief. No one has statedthe difference between knowledge and belief more eloquentlythan John Henry Cardinal Newman when he wrote:
First comes knowledge, then a view, then reason-ing, and then belief. This is why Science hasso little of a religious tendency; deductionshave no power of persuasion. The heart iscommonly reached, not through reason, butthrough the imagination, by means of directimpressions, by the testimony of facts andevents, .by history, by description.... Manya man will live and die upon a dogma: no manwill be a martyr for a conclusion.1
It is belief that must be the ultimate goal of environmentaleducation. Knowledge marks the beginning of attitudinal andbehavioral change, but the human response to information isnot necessarily automatic nor progressive. Negative reactionsto new knowledge are common. Those who doubt this shouldconsider the relationship between scientific knowledge andthe smoking of cigarettes, or the pertinacity of people whorebuild in floodplains.
Among the diversity of perspectives on environmentaleducation published last year in Current Issues V are twothat have something especially important to say regarding theway in which environmental values may be internalized. Theirmessage reinforces the point that I wish to make in theForeword to this year's Current Issues.
The first perspective, at least in method, isretrospective--Thomas Tanner's "Formative Influences in theLives of Citizen Conservationists." Tanner's exploratorystudy asked: What makes a conservationist? What influenceslead to internalized environmental values in individuals sothat their behavior and response in relation to issuesaffecting the environment and the living world evidence adeep internal dedication to an ecological way of life?Tanner's study was not conclusive (he described it aspreliminary), but it suggested that personal experience
1"Knowledge and Faith," Readings in English Prose of theNineteenth Century, Part II. Edited by R. M. Alden.Boston: Houghton Mifflin, 1917, p. 413.
x iv
14
greatly outweighs scientific knowledge in inducing anecological perspective. Tanner seems to corroborate Newman.His article Points toward a route that research should takeif we are to discover what ways are most effective inachieving the ultimate goal of environmental education. Thisshould not suggest that there is a one-best-way tointernalize environmental values--only individualsinternalize environmental values, each person forhimself--but further pursuit of Tanner's inquiry could giveus a kind of cost-benefit calculus regarding the respectiveelements of environmental education. We might learn wherethe probabilities for internalization are greatest.
The second article, "Life Styles, Behavior, and FutureEnvironments" by Gene Bammel and Lei Lane Bammel, takes apositive and creative view of the future. Its thesisexemplifies Newman's assertion that "The heart is commonlyreached, not through reason, but through the imagination."If this is indeed true, the conclusion reached by the Bammelsrepresents a high priority for environmental education andresearch. They say (Current Issues V, p. 40):
While it is provocative to have scenarios forthe future that paint disturbing pictures, itis imperative to have images of a golden age,for people may be moved to work to bring thatabout. Every human being stands in need ofhaving an image of the future that he or shewishes to bring about; it is the task of theenvironmental educator to invent and proposeimages that are ecological, self-realizational,and promote the cultivation of the nobler, lessmaterialistic, less consumptive aspects ofhuman personality.
I may be less optimistic about probable futures than GeneHammel and Lei Lane Bammel, but I believe that a vision ofour best possibilities is a defense against the probabilityof the worst. Images of the future have been powerfulmotives in all of the great religions, and they have firedthe drive of revolutionary movements. Without a vision ofthe future our present laws and policies are disjunctive andincremental--unlikely to transform our society in ways thatwill enhance its quality and increase its prospects forsurvival. Yet it must also be understood that pursuit of "agolden age" may exact a price, perhaps, in RobertHeilbroner's words, "a fearful price." The "golden ages" ofhistory commanded heavy and perhaps unavoidable costs inhuman domination and deprivation. And so, concomitant with avision of our best pssibilities, we need an exploration ofstrategies for getting there, and for being sure that thereis where we really want to go.
xv
1.5
The 1980 Conference of the National Association forEnvironmental Education initiated an agenda for the decade ofthe 1980s. No one would surely wish to diminish itsdiversity. But, unlike our national motto E Pluribus Unum,the strength of the collective effort will be greatest ifunified by an all-encompassing principle. I believe that theinternalization of an ecological way of life inspired by arealizable vision of ,our best possibilities could be thisunifying force. I am myself a hopeful pessimist, yet I donot regard an effort to formulate such a unifying principleand strategy as utopian. The costs of achievement should behonestly faced and choices made between one cost as againstanother. But I am convinced that without the driving powerof a vision realizable through practical strategies, ourachievements in environmental education will fall short ofour hopes and mankind's needs.
June 1980
xvi
Lynton K. CaldwellIndiana University
PRESIDENT'S ADDRESS TO THE 1980 CONFERENCE:EARTH DAY '70, '80, '90
A. Clay Schoenfeld'
Earth Day '80 has just come and gone. Where are we and whattime is it--in relationship to Earth Day '70 and Earth Day'90--with respect to environmental education?
In the fall of 1969, a half-dozen people sat around a kitchentable in Madison, Wisconsin, outlining something conceived asa national environmental teach-in. One was U.S. SenatorGaylord Nelson, who had earlier discovered the politicalpotency of environmentalism as Wisconsin's Governor. Theother five of us were professors and students eager tocapitalize on current campus activism to try to help projectan ecological conscience into American mores.
As a writer (Cotton, 1970) in Audubon was to report, EarthDay, 22 April 1970, became "the largest, cleanest, mostpeaceful demonstration in American history." An estimated 20million people of all ages and shades participated (NSEA,1970). Nearly half of the four-year colleges in the countrysponsored demonstrations, double the number that experiencedanti-Vietnam protests (Astin, 1971). Two distinguishedsociologists concluded E-Day elevated "environmental quality"overnight into the general public ken as a "social problem"(Dunlap and Gale, 1972). Eric Sevareid pronounced theinvocation on the CBS evening news that night: "We are nowdealing with final facts....This is the big test."
1970-1980 TRIUMPHS
How well has environmental education met "the big test" inthe 10 years just past? From one perspective, I would say,"Very well." To document that assessment, let me cite someobjective and subjective data.
Iirst, what has happened to the young Earth-Day activists?Are they now upwardly mobile in some traditional career,co-opted by "the System?" Or have they dropped out inuniversity ghettos or rural communes? The answer is,"Neither of the above." A national survey (Schoenfeld, 1979)has shown that almost without exception yesterday's campusenvironmental leaders today remain committed to environmentalaction, albeit typically now in institutionalized modes. If
'President, National Association for EnvironmentalEducation.
anything speaks to a viability of environliental education, itis this evidence that, for many young people, Earth Day wasnot a momentary fling but an introduction to life careers inenvironmental action.
Second, what has been the impact of the environmental era oncolleges and universities? A national survey (Schoenfeld andDisinger, 1978) has indicated that, barring Englishcomposition and math, few university subjects are beingoffered today in so many diverse ways and places, by such amixture of schools, departments, and professors, as thatcomplex of cognitive content and affective process known,precisely or not, as environmental studies. It is strikingthe depth to which environmental studies concepts havepenetrated a not .particularly pliable academicstructure--wholly new instructional curricula and organi-zational arrangements at the undergraduate level, wholly newmaster's degree programs, wholly new cross-discipline Ph.D.research arrangements, wholly new extension configurations.While in some cases the changes may prove to be more semanticthan surgical, the university-environmental movement marriagewould seem in general to be beyond divorce.
With respect to the impact of the environmental movement onthe public schools, given the American tradition of localautonomy, it has ranged from the impressive to the picayune.
Third, what do public opinion polls or expert assessmentsshow? In 1970, only 6 percent of the respondents in anational Gallup poll volunteered "pollution, environment" as"one of the most important problems facing, the country"(Funkhouser, 1973). By 1977 a similar national poll(Mitchell, 1978) indicated that "support for environmentalprotection is strong and unwavering, and sympathy with theenvironmental movement is at a high level." After contact-ing opinion leaders around the country in 1978, Edward K.Delong of the United Press agreed in a series of newspaperdispatches that "the environmental establishment may tu:n outto be the single most powerful force shaping the lives ofAmericans for years to come." A 1979 study (Cutler, 1980)concluded that "most Americans believe more soil and waterconservation is needed, and they are committed to aconservation ethic." David Brower (1980), dean ofenvironmental activists, says, "My crystal ball tells me theenvironmental movement will pick up steam." Gladwin Hill(1980), den of environmental reporters, believes "theenvironmental movement is...a bell that can't be unrung."
Are these opinions really in evidence on the ground? TheNational Earth Day '80 Executive Director (McCabe, 1980)believes the environmental movement "has produced m: jorimprovements in the quality of life for all Americans andcreated a valuable legacy." As high points, he lists cleaner
16
water. and air, action on environmental contaminants, growingrecycling and energy conservation, healthier and saferworkplaces, more public participation in resource policydecision-making, and other advances.
Fifth, has reportage of this progress penetrated the media? Astudy of environmental coverage in two representative dailies(O'Meara, 1978) revealed that while total column inches hadslipped somewhat from a 1970-71 peak, in 1977 it was farabove a 1962 base-point. If it did nothing else, theNational Environmental Policy Act (NEPA, 1969) and its "102"statements gave the press manifold news pegs on which to hangcoverage of environmental issues. A recent national survey(Schoenfeld, 1980) indicates that increasingly the dailypress is staffed with a cadre of environmental reporters that"adapts professional responsibility and craftsmanship to theconstruction of a threatened environment as a socialreality." Meanwhile there has been an irruption inspecialized environmental periodicals (Schoenfeld, Meier, andGriffin, 1979).
Sixth, has environmental education achieved any profes-sionalism? We have acquired some essential trappings: aninternational journal, a national association, a centralcomputerized data bank, an array of evaluated K-12 curricularmaterials and methods, various sects and sections withcompeting and complementary philosophies, in some states acertain credentialing, in federal registers official positiondescriptions, an approach to a code of ethics, a nationalalliance.
1970-1980 TRAGEDIES
Yes, from one perspective we in environmental education havepassed "the big test." But from another perspective, we haveflunked.
For one thing, we tend to be WASPs. We have certainly notpenetrated the urban inner core, for example. Little wonderthat Faramelli (1972) and others have called environmentalism"a cop-out, a flight from social realities, and a digressionfrom dealing with the real issues of racism and socialinjustice."
Second, we tend to practice U.S. colonialism. The Secretaryof the Organization of American States, Alejandro Orfilia(1980) recently reminded a World Conservation StrategyConference that the use of natural resources must be relatedto the long-term development objectives of the so-calledemerging nations, and that "we must pursue conservation so asto improve the lives of people" around the globe and not justin this country.
xix
19
Neuhaus (1974) and others have labeled environmentalism aselitism run wild if not downright "fascist" in nature. Wehave sponsored laws that are as undemocratic as they areunecological. The Endangered Species Act of 1973 comestomind, calling as it did for "a strict mandate of conserva-tion of endangered species over all other criteria"(Stromberg, 1979). That Act was hardly in keeping withCommoner's (1971) dicta that "everything is connected toeverything else," and that "there's no such thing as a freelunch." The Act led directly to the Tellico Dam backlash(Schoenfeld, 1980), which in turn led to 1978 Congressionalamendments that restored some sanity to the EndangeredSpecies Act. Interior Secret&.y Andrus (1980) recently 'crewon that fiasco to offer some advice to us."Environmentalists," he said, "must learn to forego thedubious battles for lost causes, and concentrate instead onthe big opportunities to win new ground and defend gainsalready won" if we expect to retain public support as publicconcerns mount about energy, inflation, social injustice, andnational defense.
I personally am dismayed, for example, by the extent to whichthe environmental movement has been used by the anti-nuclearpower lobby, by the advocates of "no growth," by theopponents of a reasonably technological agriculture, bywilderness preservationists who ignore the concomitant needfor a broad multiple-use land base, and by those who try tomake "capitalism" the whipping-boy for all our ills. ,Indeed,"environmentalism" is in real danger of becoming a dirty wordin circles whose support we desperately need. Rex Resler(1980), Executive Vice President of the American ForestryAssociation, even believes we ought to go back to the"conservation" label and "strengthen the understanding thatthe term encompasses a fundamental regard for the environmentas well as a concern for economic and social considerations."
Fourth, past progress on the ground may prove illusory. Thelatest annual report of the President's Council onEnvironmental Quality (1980) carries a long laundry list ofcontinued environmental deterioration: groundwater'contamination from improper disposal of toxic wastes, thepervasive pollution of surface waters near large cities,closure or reduced production from millions of acres ofcoastal waters, acid rain, overloaded sewage treatmentplants, loss of prime farmlands to urban sprawl, severeerosion that reduces farm productivity and silts streams, theproblem of finding disposal sites for hazardous waste,overcutting of privately held forest land, the loss ofmillions of acres of tropical forests annually--the list goeson.
Fifth, with all its emerging professionalism, theenvironmental education community has not produced a crediblebody_ of research literature in terms of either theory ormethodology. Attitude research dominates, and it has an
xx
2
inherent weakness: its presupposition that communication issomething that a person or an agency or an institution doesto get other people to do what the communicator wants them todo. Attitude research has a simple appeal for agencies witha fixed model of how others should behave and who look atcommunication as a "quick fix"for eliciting that behavior.According to the theory, communications change attitudeswhich in turn program people's behavior. Grunig (1979) callsthis attitude model the "domino model" of communication oreducation. If we can just communicate with people, accordingto the model, the communication domino will topple theattitude domino and that will topple the behavior domino. Infact, social psychology research suggests the attitude theoryhas little explanatory power. One message seldom leads to one
. attitude and one behavior. The dominos don't always fall inthe same direction. People have free will. They controltheir communication, their attitudes, and their behavior. Wecannot control all three with a quick education fix.
Tichenor, et al. (1973), Sharma, Kivin, and Fliegel (1975),Bowman (1977), and Stamm and Grunig (1977) have all foundenvironmental behavior to be "situational"; that is, apro-environmental stance is easier to take when it doesn't"bite" the individual decision-maker directly, regardless ofenvironmental education input. While communication researchgenerally shows a relationship between communication exposureand level of knowledge, research also suggests that level ofknowledge about a resource management issue may be inversely.related to an ecological attitude on that .issue when economicself-interest or some other stance intervene. If attitudesare not necessarily related to knowledge, long-termcommunication research also indicates that (a) salientattitudes are usually not subject to manipulation throughshort-term communication programs, and that (b) attitudes areunreliable predictors of actual behavior (Bowes, et al.,1978).
I suggest we in environmental education research kick thedomino model habit and explore more fruitful theories,employing more rigorous methodology. Grunig's (1981) studiesmay provide some promising azimuths. An incipient NationalEnvironmental Education Research Assessment may contributeboth inspiration and focus
While indeed environAental education has made some progressin the past ten years,.it probably has not kept pace with theforces of environmental degradation. At no echelon ofgovernment has there been an adequate commitment of publicfunds to environmental education. Nor is environmentaleducation sufficiently on the agenda of the educationalresearch agencies or the foundations. The performance of theU.S. Office of Education under the Environmental Education
xxi
Act of 1970 particularly can be called inept. The USOE wasslow to implemeat'the Act, never pressed for full funding,and tended to sprinkle peanut grants over the landscape toad hoc groups with neither staying power nor profe'ssionalcompetence, meanwhile totally ignoring the largest and mosteffective public education instrumentalities in the country,such as the Cooperative Extension Service. The 1978Renewable Resources Extension Act could redress the ills ofthe deceased Environmental Education Act, but one cannot besanguine about Congress funding the RREA in an era of
- budget-cutting.
Seventh, as an Army reserve officer of 33 years' standing, itwould be uncharacteristic if I did not conclude this look atEarth Day '80 with words about the impact on environmentaleducation of imminent demands for a strengthened posture ofnational defense. Nothing is so destructive of so manynatural resources and so much environmental quality as iswar, and nothing is so destructive of a conservationconscience as is war or even rumors of war. TR's first waveof conservation foundered on World War I, FDR's second waveon World War II. Will a third wave founder on a World WarIII?
Yet nothing is so destructive of human resources and freedomsas is the alien ideology against which America is arrayed.Today, in the name of environmentalism in my state, publicsentiment continues to block the U.S. Navy from building acommunication system capable of transmitting secure messagesto Trident submarines stationed submerged at strategic spotsworldwide. Where does environmental protection end and theprotection of American lives begin? Such, in the words ofthe song, is indeed "a puzzlement." As a combat veteran, noone abhors the thought of armed conflict more than do I. Yetif "the balloon goes up," as we say at Fort Sill, I know Iwill doff my environmental suit and put on a uniform. I prayI don't have to make the choice.
1980-1990 AZIMUTHS
So where will we be on Earth Day '90? I am neither anoptimist nor a pessimist. I am a possibilist. It ispossible we will all be six feet under. It is equallypossible we will have achieved an entente with globalhumankind. It is possible that we will have as well achievedan entente among ecology, esthetics, engineering,environment, energy, and economics to the end that we willhave learned how to maintain and even enhance environmentalquality without degrading human justice, and how to enhancehuman welfare without degrading resource quantities. It's atall order, but I simply can't believe that the last, besthope of earth has reached the end of the line.
22
As an old pupil of his, it would be uncharacteristic if I didnot summarize this talk with a reference to a formerSecretary of the Albuquerque Chamber of Commerce.
He said: "The practice of conse,:vation must spring from aconviction of what is ethically and aesthetically right, aswell as what is economically expedient." He did not say,"regardless of what is economically expedient." He wasespousing a concept of integrated environmental managementthat must become the touchstone of environmental education inthe decade at hand.
He went on to explain: "A thing is right only when it tendsto preserve the integrity, stability, and beauty of thecommunity, and the community includes the soil, water, fauna,and flora, as well as people." You will note he did notleave people out of the equation. He was defining integratedenvironmental management education.
Be was Aldo Leopold (1947).
I propose we of NAEE dedicate ourselves to a decade ofintegrated environmental management education, participatedin by all segments of society--a sober consideration of thechallenges posed by the 1980s, marked not by the occasionalstridency of the 1970s but by a reasoning together of waysthat will help enhance environmental quality and energyconservation without jeopardizing human needs, and that willhelp meet human needs without jeopardizing the quality of ourenvironment and our energy requirements. If I could capsulethe theme of such an approach, it would be with the words:"There are no 'anti's' in integrated environmental managementeducation." IEME looks ahead to new goals calling for a broadgrassroots consensus, that balances environmental concerns andenergy conservation with human needs. The "we/they" sj.ldromeis shopworn at best.
I propose also that NAEE examine carefully the implicationsof Evison's (1978) belief that it will be the covertecological message imparted by the actual conduct oforganizations such as ours that will override our overtenvironmental education voices. For example, how long ingood conscience can we continue to afford the luxury of anational conference, given the conspicuous consumption ofenergy such a meeting inevitably entails? Should we not,rather, take the lead in considering a series of regionalconferences as an alternative, meanwhile improvingcommunication by mail? Mid-year board meetings may beexpendable as well.
Together let us face breast forward, never doubting thatclouds can break, that we are baffled to fight better.
REFERENCES
Andrus, Cecil D. 1980. "The New Decade." EPA JournalReprint 6(1): 27 (January).
Astin,, A. W. 1971 "New Evidence on Campus Unrest."Educational Record 52 (Winter): 41-47.
Bowes, John E.; Keigh R. Stamm; Kenneth M. Jackson; andJeff Moore. 1978. Communication of TechnicalInformation to Lay Audiences. Seattle: Universityof WaShington Communication Research Center.
Bowman, James S. 1977. "Public Opinion and the Environ-ment." Environment and Behavior. 9(3) (September).
Brower, David. 1980. Quoted in A. Clay Schoenfeld,"Earth Day Then and Now," Not Man Apart 10(4):12-13.
Commoner, Barry. 1970. Quoted in The Environment Monthly,July, p. 5.
Cotton, Steve. 1970. "Earth Day--What Happened."Audubon 72 (July): 112-115.
Cutler, M. Rupert. 1980. Quoted in Washington Post,11 January, p. 2.
Dunlap, Riley E. and Richard P. Gale. 1972. "Politicsand Ecology: A Political Profile of Student Eco-Activists." Youth and Society 3 (July): 379-397.
Evison, Boyd. 1968. Quoted in Clay Schoenfeld and JohnHendee, Wildlife Management in Wilderness. PacificGrove, CA: Boxwood Press.
Faramelli, Norman. 1972. "Economic Growth, SocialJustice, and Ecology." Address'at Northern IllinoisUniversity, DeKalb, Illinois. 5 May 1972.
Funkhouser, G. Ray. 1973. "The Issues of the Sixties, AnExploratory Study in the Dynamics of Public Opinion."Public Opinion Quarterly 37 (Spring): 62-75.
Grunig, James E. 1979. "Research on Science Communica-tion." Research Bulletin. College Park: Universityof Maryland Center for Research in Public Communica-tion.
xx iv
24
Grunig, James E. 1981. "Communication Behaviors andAttitudes of Environmental Publics." JournalismMonographs, in press.
Hill, Gladwin. 1980. Quoted in A. Clay Schoenfeld,"Earth Day Then and Now." Not Man Apart 19(4):12-13.
Leopold, Aldo. 1947. "The Ecological Conscience."Bulletin of the Garden Club of America 12(12):46-53.
McCabe, Mike. 1980. "Earth Day '80 Summary." Washington,DC: Earth Day '80 Headquarters, mimeo, p. 2.
Mitchell, R. C. 1978. "The Public Speaks." Resourcesfor. the Future 60 (Sep-Nov): 1-6.
National Staff of Environmental Action. 1970. EarthDay--The Beginning. New York: Arno Press.
Neuhaus, Rev. Richard. 1974. "In Defense of People: AThesis Revisited," in James Noel Smith (Ed.),Environmental Quality and Social Justice in UrbanAmerica. Washington, DC: The ConservationFoundation, pp. 59-72.
O'Meara, Daniel J. 1978. "Coverage of EnvironmentalIssues in Two Newspapers, 1962-1977. UnpublishedMaster's thesis, The Ohio State University Library,Columbus.
Orfilia, Alejandro. 1980. Quoted in Richard Pardo,"Washington Outlook." American Forests. 86(4): 9.
President's Council on Environmental Quality. 1980. TenthAnnual Report. Washington, DC: GPO.
Resler, Rexford A. 1980. Personal correspondence inauthor's files, 4 March.
Schoenfeld, A. Clay. 1980. "Newspapers and the EnvironmentToday." Journalism Quarterly, 57(3):456-462 (Autumn).
Schoenfeld, A. Clay. 1979. "Student Eco-ActivistsRevisited: Long-Term Correlates of Earth Day," inCraig Davis and Arthur Sacks (Eds.), Current Issuesin Environmental Education and Environmental StudiesYearbook-V. Columbus, Ohio: ERIC/SMEAC.
Schoenfeld, A. Clay. 1980. "The Public Relations ofNatural Resource Management Today: Lessons from theSnail Darter." Journal of Soil and Water Conserva-tion, 36(5): 215-220 (September-October).
Schoenfeld, A. Clay; Robert F. Meier; and Robert J.Griffin. 1979. "Constructing a Social Problem:The Press and the Environment." Social Problems27(1): 39-61.
Schoenfeld,' Clay and John Disinger. 1978. EnvironmentalEducation in Action-II: Case Studies of Environ-mental Studies Programs in Colleges and UniversitiesToday. Columbus, OH: ERIC/SMEAC.
Sharma, Navin C.; Joseph E. Kivlin; and Frederick C.Fliegel. 1975. "Environmental Pollution: Is ThereEnough Public Concern to Lead to Action?"Environment and Behavior 7(4) (December).
Stamm, Keith R. and James E. Grunig. 1977. "CommunicationSituations and Cognitive Strategies in ResolvingEnvironmental Issues." Journalism Quarterly (Winter).
Stromberg, Ann. 1979. "Endangered Species Act Amendments."The Journal of Natural Resources 19(4): 933-941(October).
Tichenor, P. J.; G. A. Donoghue; C. N. Olien; and J. K.Bowers. 1973. "Environment and Public Opinion," inClay Schoenfeld (Ed.), Interpreting EnvironmentalIssues. Madison, WI: Dembar.
xxvi
SECTION I:ENVIRONMENTAL EDUCATION APPLICATIONS
THE PRACTITIONER'S PERSPECTIVE
SECTION I: ENVIRONMENTAL EDUCATION APPLICATIONS -THE PRACTITIONER'S PERSPECTIVE
This section contains ten essays which describe and report ona wide range of environmental programs, experiments, andissues of interest to the environmental education community.Authors have attempted to distill and report on theirexperience with environmental education projects and methods,with the goal of sharing new approaches, describing importantenvironmental education programs, and developing furtherlines of inquiry. It is hoped that this material will helpstimulate new directions for Current Issues readers andprovide practical models which may be used in a variety ofeducational settings. Some of the essays represent efforts tocomment on areas and issues pertinent to environmentaleducation which have gone largely unnoticed, or, if noticed,undervalued. By bringing such matters before the eye of otherpractitioners, we hope to continue the educational dialogueinitiated when these papers were presented.
BUILT ENVIRONMENT EDUCATION: POSITION STATEMENT
Ad Hoc Group for Built Environment Education'
In May, 1980 the Institute for Environmental Education,School of Architecture and Planning, University of NewMexico, helped to co-sponsor the National Association forEnvironmental Education Conference in Albuquerque, NewMexico. It was the first time that an NAEE conference had anintense focus on built environment education as a componentof its total environmental program. Speakers in this grouprepresented themselves as well as several national groupsalso interested in the built environment, including:
1. The American Institute of Ar?hitects (AIA);
2. Environmental Design Research Association (EDRA);
3. National Art Education Association (NAEA), and others.
The following comments summarize the panel's concern forbuilt environment education, and they constitute a positionstatement for the NAEE mission of educating all people aboutthe long-term consequences of our actions on and in theenvironment.
POSITION I:
A central focus for environmental education is the way inwhich individuals relate to environmental systems. In'orderto achieve an all-encompassing awareness of thoserelationships it is helpful to consider' the environment notas two separable systems components, the natural and thebuilt, but as a continuum ranging from a predominatelynatural to a predominantly built environment. Any givenenvironmental system lies along this continuum and, thus, isa mixture of the built with the natural environment. Thus, anindividual as builder is included within the boundaries ofany environmental problem to be solved.
'Anne Taylor, Wolfgang F. E. Preiser, Aase Eriksen, AlanSandler, Ed Crittenden, Doreen Nelson, Don Wall, Joann Pratt,Kevin Rohane, Earl Mark, Mike Ivansic, William Siembieda.
5
POSITION II:
Built environment education and awareness includes theknowledge of what people as builders do to their surround-ings, the quality of this life they build in personal andcommercial settings, the impact .that those settings have ontheir behavior, the aesthetic choices they make about"things" with which they surround themselves, and theconsideration of themselves as a part of, and not apart fromthe total environment.
POSITION III:
Built environment education is a relatively new field ofinquiry which coordinates many disciplines--architecture,art, education, engineering, construction, mathematics,science. Environmental education helps :'eople to beconsciously aware of space and the consequences of theiractions and decisions in those spaces.
POSITION IV:
It is hoped that built environment education will sensitizepersons of all age groups in artist-like fashion toappreciate, understand, care for, and improve the quality oftheir built surroundings. This in turn will foster reverenceand understanding about the built and natural environment andto the delicate relationship between them.
POSITION V:
NAEE should support the following experiences in BuiltEnvironment Education:
a. Intelligently plan for the quality of the environment,with expectations for a high, instead of the presentlow, quality metaphor.
b. Educate architects and other designers to facilitatebetter communication with their clients in order toreduce the mystique of architecture, thus becomingpartners in and being at one with the implementationprocess.
c. Train teachers to manipulate classroom space both inand outside of schools and to research the effectssuch manipulation have on learning and behavior.
6
30
d. Plan community programs on built environment educationfor citizens and adults and community leaders tounderstand the aspect of their decision making in thisplanning process, especially comprehensive long-rangeplanning.
e. Promote aesthetic development of children and theirability to make critical aesthetic judgments abouttheir surroundings.
f. Help architects act as educators in schools, museumsand other community settings, to produce a new genera-tion of concerned citizens as consumers and potentialdesigners of their environments.
g. It is essential that blacks, Mexican Americans, nativeAmericans, Asians, and other minorities participate inthe design and decision-making process of theircommunities to insure the inclusion of vernacular artand architectural images which express the richness ofall cultures. Minorities need to be educated andparticipate in the environmental design educationprocess along with architects, planners, and educators.
h. Lastly, and perhaps most importantly, built environmenteducation should not become a new subject overlaid onan already overcrowded curriculum, but should be anintegrated force and manifestation of many disciplinescombined.
CONTRIBUTING PARTIES AND PANEL MEMBERS:
Anne Taylor, Ph.D., Co-Director, Institute for Environ-mental Education
Wolfgang F. E. Preiser, Ph.D., Co-Director, Institute forEnvironmental Education
Aase Eriksen, Ph.D., Coordinator, National Architects-in-the-Schools Program
Alan Sandler, Director, Environmental Education, AmericanInstitute of Architects
Ed Crittenden, FAIA, Education and ProfessionalDevelopment Commission, American Institute of Architects
Doreen Nelson, Director, City Building Educational Program
George Bendick, City Building Educational Program
Don Wall, Professor, New Jersey School of Architecture
7
31.
Joanne H. Pratt, Allied Professionals EducationalConsulting Services
Kevin Rohane, Graduate Student
Earl Mark, Graduate Student
Mike Ivansic, Graduate Student
William Siembieda, Associate Professor, School ofArchitecture & Planning, University of New Mexico
8
32
FOREST SERVICE-USDA: A DIVERSIFIED PROGRAMFOR ENVIRONMENTAL UNDERSTANDING
Jefferson E. Carroll'
The involvement of the Forest Service in public education canbe traced to the formation of an independent Department ofAgriculture in 1889. One of the duties of the new Departmentwas to diffuse among the people of the country, general, butcomprehensive and useful, information on agriculture andrural development. Since that time, many laws have expandedthe original authority to include a variety of activitiesdealing with educational institutions, researchorganizations, state and local governments, and the generalpublic.
With this background, public education has been aresponsibility of the Forest Service of the U.S. Departmentof Agriculture throughout its history. Education in itsbroadest definition is a vital element in resource manage-ment and protection. Natural resources can be more quicklydestroyed by an uninformed person than by insects, disease,or even fire. The American people want to be, and legallyhave the right to be, involved in making long-range forestmanagement decisions on public lands. Without anunderstanding of environmental factors, the public cannot beintelligently involved in making these decisions.
The Forest Service has always engaged in research programs toprovide professional and technical knowledge for betterutilization and protection of forest land resources. In thepast, these programs were often directed toward landmanagers, commercial interests and the field of technicaleducation. Within recent years, however, an increasingemphasis has been placed on programs offering nontraditional'forms of education. These programs develop a general publicthat has:
--an awareness of the biophysical environment,- -an understanding of the interrelationships that
exist within the environment, and- -an ability to apply this awareness and understanding
to solving environmental problems and planninglong-range resource management.
To meet these goals, several different educational programswith different target audiences exist.
'Coordinator, Environmental Education Programs, ForestService-USDA, Box 2417, Washington, DC 20013.
1) Cooperative Forest Fire Prevention Program
Popularly known as the Smokey Bear Program, this is perhapsthe oldest and best known of the specific educationalprograms. Smokey got his start in 1942 when forest firecontrol was critical due to shortages of manpower andequipment. The forest fire prevention program became one ofthe first public service campaigns sponsored' by theAdvertising Council, Inc. The bear with blue denim trousersand campaign hat is known throughout the world today forreminding us, "Only you can prevent forest fires."
To mobilize public support for the prevention of forest firesthrough education and develop understanding of the effects offire on the environment, this successful program:
- -provides high-quality, low-cost fire preventionmaterials suitable for nationwide use for a varietyof audiences;
- -serves as national clearinghouse for materials,ideas and contacts to promote public awareness ofthe forest fire threat;
- -uses donated public service time and space oftelevision, radio, newspapers, magazines, andoutdoor advertisers to carry the message.
2) Interpretive Services
In 1960, Congress passed the Multiple-Use, Sustained-YieldAct. This established, among other activities, themanagement of outdoor recreation resources as an importanttask of the Forest Service. Within the field of recreationmanagement, the Interpretive Services Program provideson-the-ground orientation and interpretation activities inthe National Forest System and at the other Forest Servicefacilities. The primary objectives are to orient visitors sothat they can enjoy various recreational pursuits in a safeway and at the same time minimize their impact on the forestenvironment.
More than 100 million people used the Interpretive Servicesin the 154 National Forests last year. The.se forests,encompassing about one-tenth of our Nation's land area, have24 large visitor centers, 308 information stations, 304interpretative trails, 80 demonstration areas, 150amphitheaters, and more than 1,000 interpretative signs.
10
3) Environmental Education Program
In the predominantly urban society of the United States, themajority of people are several generations removed from aclose association with the natural environment. There is aneed to re-establish, among all people, an understanding ofthe natural environment and its relationship with the urbancommunity.
To aid in this understanding, the Forest Service created theEnvironmental Education Program in 1970. Its purpose is toassist the public in icl:mtifying and supporting wise resourcemanagement through understanding. Specifically, the Programseeks to develop the people's skills and knowledge to:
- -understand the interrelationship within theenvironment;
- -recognize and identify environmental problems andsolutions;
--predict the social, economic and ecologicalconsequences to our solutions;
--understand how to become actively involved inland-use planning and resource management decisionmaking;
- -develop action plans to assist in implementingenvironmental programs.
To further this program, the Forest Service sponsors a widevariety of training workshops for educators, resourcemanagers, and representati 'Jes of special interest organi-zations. There are also many lesson plans available throughthe "Investigating Your Environment" series and a number ofpublications and aids suitable for classroom use.
4) Youth Conservation Corps
people are often the first to grasp and use new ideas.They represent a major force today in the environmentalmovement and will be the decision-makers of tomorrow. Totrain these young people, Congress passed the Youth Conser-vation Corps Act in 1970. Its goals are to:
- -provide gainful employment during summer months toyouth 15-18 in a healthful outdooriatmosphere;
--offer an opportunity for learning, understandingand appreciating our natural environment andheritage;
- - insure the development of the natural resources bythe youth who will be ultimately responsible formaintaining and managing these resources for thefuture.
Under the leadership of professional resources managers, boysand girls work and learn together to carry home a betterunderstanding of resource management. The work they do ishard. There are streams to clear, trails to build,recreation areas to construct, wildlife habitats to improve,erosion problems to control, and hundreds of other projects.Last year, approximately 40,000 young people accomplishedprojects valued at $47 million by federal and state landmanagement agencies. The same enrollees received about 3.2million hours of environmental awareness training that helpedto prepare them for their roles as citizens responsible forthe quality of the environment.
5) Woodsy Owl Program
The success of Smokey Bear in forest fire prevention led theForest Service to create a new symbol in the fight forenvironmental quality. In September 1971, Woodsy Owl and hisenvironmental improvement campaign were launched as acooperative venture between the Forest Service, the PublicService Council, and many other volunteer serviceorganizations and agencies.
Woodsy's program materials and his message--"Give a hoot!Don't Pollute!" are designed primarily for children up to 14years old. The basic objective is to promote wise use of theenvironment and to broaden public awareness so that even kidscan participate.
Woodsy became an instant success. He appears on numeroustelevision shows and his message is carried by radio,newspapers, and major magazines. The little owl with thegreen trousers and feathered cap is recognized-in the UnitedStates by 80 percent of the children 10 years of age oryounger. In addition to supplying teacher's kits tothousands of classrooms, Woodsy is now included in majorschool textbooks and each week receives from 800 to 1000requests for campaign materials from children in the UnitedStates and abroad.
Public Information
The Forest Service's Office of Information in Washington,D.C., is divided into four working groups to support theeducational programs. The Publication Group produces a widevariety of information and education publications rangingfrom reports of technical research to popular posters forclassroom use.
The Current Information Group deals with radio, television,and the printed news media. Their responsibilities includetimely release of news information and the preparation offact sheets and speeches on critical issues.
12
The Audio-Visual Group develops a variety of films, displays,exhibits, tapes and slide programs. It also maintains theForest Service photographic library.
The Public Involvement Group is responsible for allactivities that inform and involve the public as groups orindividuals in the management decision-making process.
The functions of these groups are duplicated in the nineForest Service regional offices and within most states, Also,the Forest and Range Experiment Stations and the ForestProducts Laboratory have information offices to disseminateresearch results and produce technical materials foreducational purposes.
In many respects, every job the Forest Service performscontains an element of education. In the course of its work,it deals with homeowners and forest users; works closely .withindustrial managers, universities and politicians; andassists students, teachers, businessmen, and conservationgroup. No matter who is involved, education is used as atool of wise management to, provide the greatest good to thegreatest number in the long run. For further information onany of these programs, contact these addresses:
Cooperative Forest Fire Prevention Forest Service-USDAP.O. Box 2417Washington, DC 20013
Interpretive ServicesForest Service-USDAP.O. Box 2417Washington, DC 20013
Environmental Education ProgramsForest Service-USDAP.O. Box 2417, Room 3233Washington, DC 20013
United States Youth Conservation CorpsP.O. Box 2975Washington, DC 20013
Woodsy OwlForest Service-USDABox 2417Washington, DC 20013
13
37
ENVIRONMENTAL EDUCATION FOR DECISION-MAKERSIN RURAL VERMONT
Verne B. Howel
Typically, environmental education relates to a school systemor nature center. If environmental problems are to beadequately addressed, however, there needs to be a broaderinterpretation of environmental education. Decisions arebeing made every day that have an environmental impact.Often these decisions are made without the ba:dc informationnecessary to assess the impacts. There are many groups ofdecision - makers that should be reached by environmentaleducation methods. This paper deals with one such group,locale planning commissions and boards of selectmen inVermont, and the problem of land-use controls. It is anexample of higher education involved with local people. Theproject, carried out in Vermont but applicable to any ruralstate, was funded in part by a grant under Title I of theHigher Education Act of 1968.
Vermont Land-Use Control Law
The Vermont laws relating to land-use control are thesections of Chapter 117, Title 24, Vermont Statutes Annotatedconcerned with town plans and the implementation of thoseplans, sections 4303, 4387, 4391 and 4410. Vermont has astatewide land-use control law, Act 250, Chapter 151, Title10, Vermont Statutes Annotated. Recently Chaptpr 118, Title24, Vermont Statutes Annotated was enacted enabling theformation of conservation commissions.
Needs Assessment
Chapter 117, Title*24, V.S.A. requires that Vermont townsprepare development plans based on surveys of existingconditions and future trends. It also directs that presentand future growth be considered.
'Director, Environmental Studies Program, Southern VermontCollege, Bennington, VT 05201.
14 .
The development plans of six towns were evaluated by theauthor. In only one case had the plan been based on acomplete survey of existing conditions. In addition, most ofthe plans contained conflicting statements. For example, inone section of a town plan the statement was made thatagricultural lands should be reserved for agriculture, but,in the same plan, the location for new industrial growth wasshown, on the land-use map, to occupy prime agriculturalland. The surveys of existing conditions were limited inmost cases to roads, schools and existing industry.
The response of the towns to Chapter 118, Title 24, V.S.A.was minimal. Only 7 of the 256 towns of Vermont had formedconservation commissions and of these 7 only 3 were active.
The planning commission and the board of selectmen of a townare by statute parties in the Act 250 permit process. Otherstatutory parties are the state agencies and regionalplanning commissions. The planning commission's role is toconfirm or to deny that the proposed development conforms tothe town's development plan. Properly, the commission meetsand discusses the development. One member, who thenrepresents, the planning commission, attends the hearing. Inone case the environmental commissioners realized as thehearing progressed that each planning commission memberpresent was saying something different. The hearing wasrecessed to determine why this discrepancy was happening.Questioning revealed that the planning commission had not metto discuss the proposal and that each person was respondingas an individual without reference to the town developmentplan. Such testimony is not admissible under the Act. Inthe permit process the selectmen are also parties and areexpected to deal with the criteria concerning the impact ofthe proposed development on the cost of town services.
Examination of printed materials available from stateagencies indicated a need for simpler presentations and moreinformation directed specifically to the local governmentbodies. Published books (Sinden, Worrell, 1978) (McHarg,1969) on the planning process are designed for professionalsin the field and assume a degree of sophistication in theprocess not to be found in small town government. Excellentmaterials for conservation commissions have been prepared bystate conservation commission associations in Massachusetts(Dawson, Nickerson, 1978) and Maine (Connors, Dow andBennett, 1975), where conservation commissions have been inexistence for some time.
Interviews by the author with officials in state government,heads of agencies and departments, indicated that localofficials needed more help than they were getting. Inaddition, a study by the New England Environmental Networkbased at the Lincoln Filene Center at Tufts University in
15
39
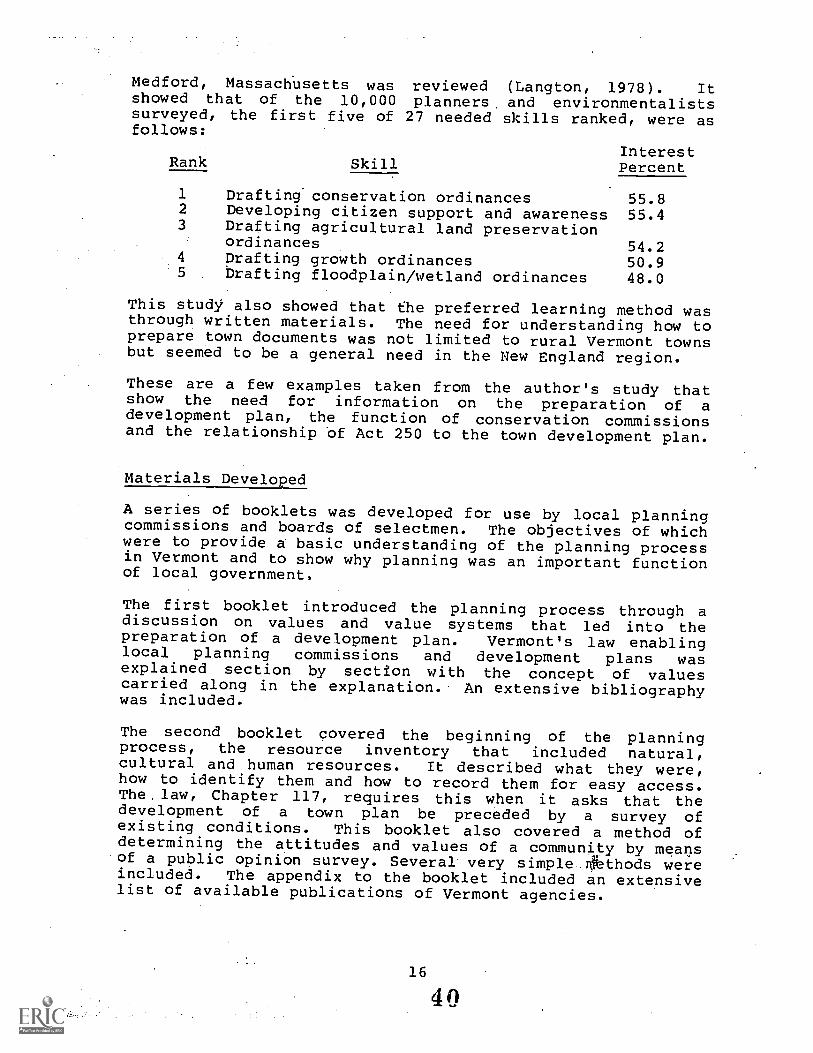
Medford, Massachusetts was reviewed (Langton, 1978). Itshowed that of the 10,000 planners, and environmentalistssurveyed, the first five of 27 needed skills ranked, were asfollows:
Rank SkillInterestPercent
1 Drafting conservation ordinances 55.82 Developing citizen support and awareness 55.43 Drafting agricultural land preservation
ordinances 54.24 Drafting growth ordinances 50.95 Drafting floodplain/wetland ordinances 48.0
This study also showed that the preferred learning method wasthrough written materials. The need for understanding how toprepare town documents was not limited to rural Vermont townsbut seemed to be a general need in the New England region.
These are a few examples taken from the author's study thatshow the need for information on the preparation of adevelopment plan, the function of conservation commissionsand the relationship of Act 250 to the town development plan.
Materials Developed
A series of booklets was developed for use by local planningcommissions and boards of selectmen. The objectives of whichwere to provide a basic understanding of the planning processin Vermont and to show why planning was an important functionof local government.
The first booklet introduced the planning process through adiscussion on values and value systems that led into thepreparation of a development plan. Vermont's law enablinglocal planning commissions and development plans wasexplained section by section with the concept of valuescarried along in the explanation. An extensive bibliographywas included.
The second booklet covered the beginning of the planningprocess, the resource inventory that included natural,cultural and human resources. It described what they were,how to identify them and how to record them for easy access.The,law, Chapter 117, requires this when it asks that thedevelopment of a town plan be preceded by a survey ofexisting conditions. This booklet also covered a method ofdetermining the attitudes and values of a community by meansof a public opinion survey. Several very simple Ribthods wereincluded. The appendix to the booklet included an extensivelist of available publications of Vermont agencies.
The third booklet was actually a continuation of the first.It showed the relationship of the Act 250 permit process tothe development plan of the town. Each application for apermit to develop is evaluated in accordance with the tencriteria of the Act. The booklet described each criterionand showed where in the plan each criterion should beaddressed.
The fourth booklet provided an introduction to the concept ofconservation commissions including the history of thesecommissions in the United States, the functions of suchcommissions and a discussion on the ways in whichconservation lands may be acquired.
Outreach to the Towns
How to reach the local officials of Vermont towns was thefinal stage of the project. Interviews with local Vermontplanners and the Lincoln Filene Center study indicated thatmany and long workshops were not appropriate. As a result,one evening workshops were held throughout the state duringthe spring of 1980. The materials that had been preparedwere introduced by the author briefly. Colored slides wereused to enhance the presentation. A reaction panel ofplanning commission members and select-men whohad previouslyreviewed the materials then presented its evaluation of theseries of booklets. A general discussion followed.
The reactions of those participating in the workshops havebeen interesting. Booklet I, dealing with values and thedevelopment plan has been well received by local planners,even though it is somewhat philosophical. The second bookletwas welcomed by planners, ,selectmen, and concerned citizens.The materials in the appendix were appreciated as well. Thethird booklet also was accepted, by all who reviewed it as aneeded addition to the literature pertaining to Act 250.
The fourth booklet was controversial. The directors ofseveral regional planning commissions were not in sympathywith the concept of conservation commissions. Although suchcommissions have succeeded in all the other New Englandstates, the directors did not consider such commissions to beimportant in land-use decision-making in Vermont. Becausethe towns have not been able to set aside conservation landto any extent, most local officials tended to disagree withthe regional commission directors.
Conclusions
The workshops were, for t_le most part, well attended.Concerned citizens appeared as well as local government
17
41
officials. The workshops, therefore, provided a public forumfor discussion of the land-use decision-making processes.
Thus far, 300 copies of the series have been distributedeither during the workshops or in response to requests madeby planning commissions or boards of selectmen. Requests forthe booklets have also come from planners in other NewEngland states. Several institutions of higher educationhave indicated that the series will be used in appropriateclasses.
The members of town planning and conservation commissions aswell as boards of selectmen turn over comparatively rapidly.The learning process therefore can be ongoing with thematerials updated whenever necessary. This type ofeducational program is new to Vermont towns. An institutionof higher education has provided the opportunity for adifferent learning experience. This role of higher educationinitiates a working relationship between the people of thetowns of the region and the educational institution, anexample of environmental education moving outside theclassroom to reach the nontraditional student.
REFERENCES
Connors, James; Sterling Dow, III; and Dean B. Bennett.1975. A Handbook, How to Make a Natural Pr-sourcesInventory for Your Community. Portland, ME:University of Maine at Portland-Gorham and the MaineAssociation of Conservation Commissions.
Dawson, Alexandra and Norton H. Nickerson. 1978. Environ-mental Handbook for Massachusetts ConservationCommissions, fourth edition. Medford, MA:Massachusetts Association of Conservation Commissions,Lincoln Filene Center, Tufts University.
Langton, Stuart. 1978. Learning Interests and NeedsAmong_Environmental Leaders in New England. Medford,MA: NewlEngland Environmental Network, Lincoln FileneCenter, Tufts University.
McHarg, Ian. 1969. Design with Nature. Garden City, NY:The Natural History Press for the American Museum ofNatural History.
Moss, Elaine, editor. 1977. Land Use Controls in theUnited States. New York, NY: The Dial Press/JamesWade.
Sinden, John A. and Albert Worrell. 1979 UnpricedValues, Decisions Without Market Prices. "lew York,NY: John Wiley and Sons, A Wiley IntersciencePublication.
State of Vermont, Agency of Development and CommunityAffairs. 1975. A Planning and Land Use Manual forVermont Municipalities. Montpelier, VT: Agency ofDevelopment and Community Affairs.
Stewart, Irene, Aja. 1978. Handbook for Vermont Select-men. Montpelier, VT: Vermont League of Cities andTowns.
19
43
CONCLUSIONS AND RECOMMENDATIONS ON ADULTENVIRONMENTAL EDUCATION PROGRAMS
David I. Johnson', Randall Champeaul,Chris Neiwhousel
Introduction
An extensive literature exists on adult environmentaleducation programs. A review of this literature wascompleted in an attempt to identify trends and reasons forsuccess or failure of the programs (Johnson, et al., 1980).A list and summary of the conclusions and recommendationsthat were compiled are presented here.
Conclusions
Review of the adult education literature produced sevenconclusions. These are presented here with a briefexplanation.
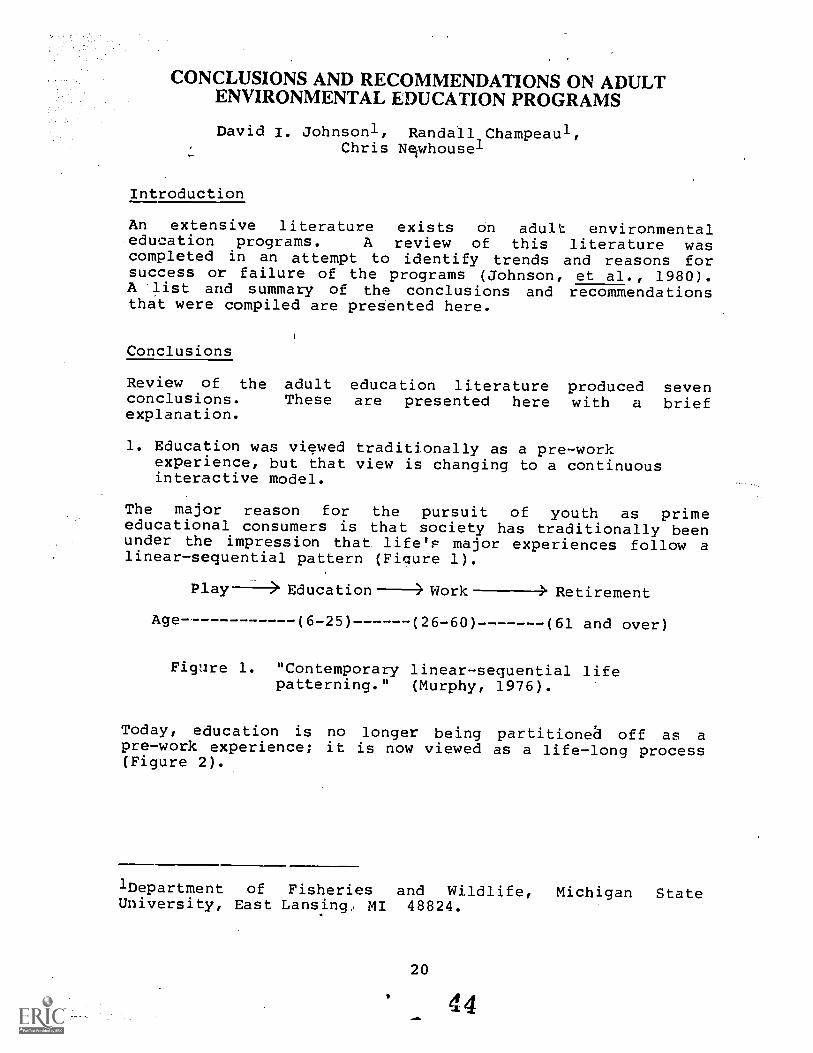
1. Education was viewed traditionally as a pre-workexperience, but that view is changing to a continuousinteractive model.
The major reason for the pursuit of youth as primeeducational consumers is that society has traditionally beenunder the impression that life's major experiences follow alinear-sequential pattern (Figure 1).
Age
Play----> Education Work ----> Retirement
(6 -25) (26 -60) (61 and over)
Figure 1. "Contemporary linear-sequential lifepatterning." (Murphy, 1976).
Today, education is no longer being partitioned off as apre-work experience; it is now viewed as a life-long process(Figure 2).
'Department of Fisheries and Wildlife, Michigan StateUniversity, East Lansing, MI 48824.
20
44
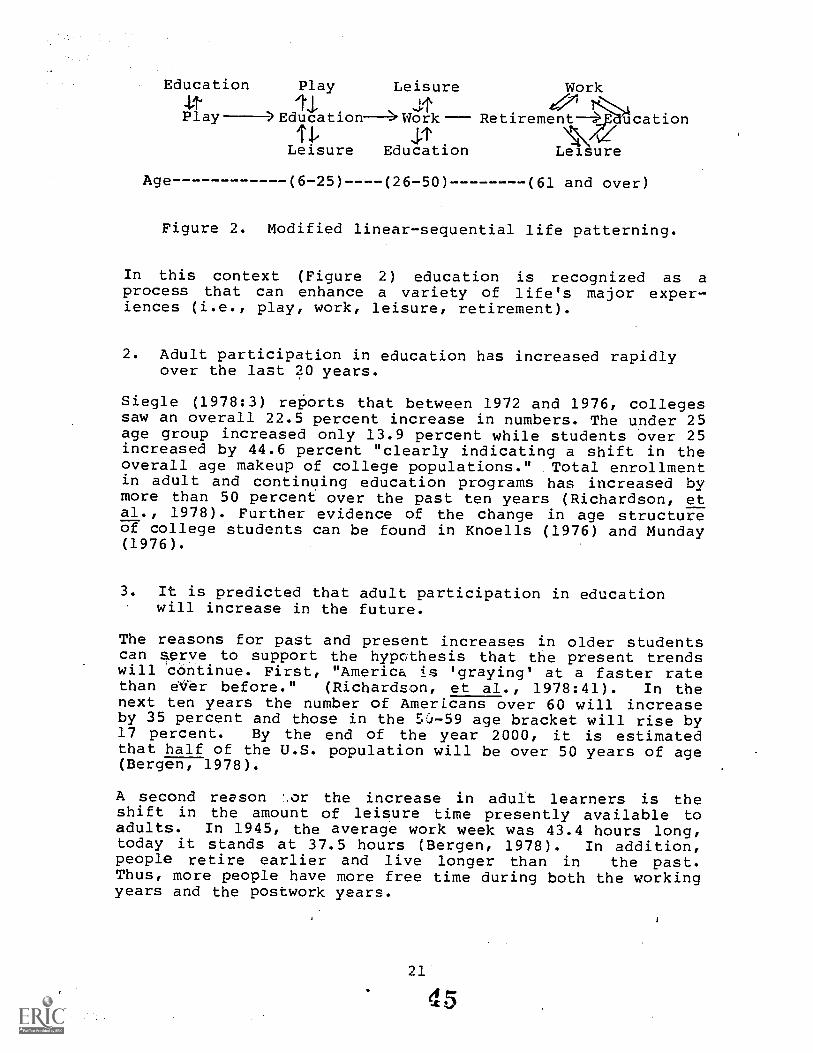
Education Play Leisure Work41- ti, -it 1>kPlay >Education ---Work--- Retirement ---7F ucation
11, J-t \44ZLeisure Education Leisure
Age (6-25) (26 50) (61 and over)
Figure 2. Modified linear-sequential life patterning.
In this context (Figure 2) education is recognized as aprocess that can enhance a variety of life's major exper-iences (i.e., play, work, leisure, retirement).
2. Adult participation in education has increased rapidlyover the last 20 years.
Siegle (1978:3) reports that between 1972 and 1976, collegessaw an overall 22.5 percent increase in numbers. The under 25age group increased only 13.9 percent while students over 25increased by 44.6 percent "clearly indicating a shift in theoverall age makeup of college populations." Total enrollmentin adult and continuing education programs has increased bymore than 50 percent over the past ten years (Richardson, etal., 1978). Further evidence of the change in age structureof college students can be found in Knoells (1976) and Munday(1976).
3. It is predicted that adult participation in educationwill increase in the future.
The reasons for past and present increases in older studentscan serve to support the hypothesis that the present trendswill continue. First, "America is 'graying' at a faster ratethan ever before." (Richardson, et al., 1978:41). In thenext ten years the number of Americans over 60 will increaseby 35 percent and those in the 5.-J-59 age bracket will rise by17 percent. By the end of the year 2000, it is estimatedthat half of the U.S. population will be over 50 years of age(Bergen, 1978).
A second reason '.or the increase in adult learners is theshift in the amount of leisure time presently available toadults. In 1945, the average work week was 43.4 hours long,today it stands at 37.5 hours (Bergen, 1978). In addition,people retire earlier and live longer than in the past.Thus, more people have more free time during both the workingyears and the postwork years.
21
Acs
Finally, the increase in adult learners is fostered by thegrowing need for personal and/or professional developmentimposed by an increasingly complex society.
4. Most adult education participants have a higher-than-average income and education level.
Fleurant's (1975) research indicates that the average incomeof participating adults was between $10,000 and $15,000 with"prime potential" in the $15,000 and up range. This premiseis supported by Siegle (1978) who reports that professionalsand persons in managerial positions are most likely to enrollin continuing education.
Educational background parallels the trend found in incomevs. enrollment. As the level of educational attainment risesso does the potential for participating in adult education(Siegle, 1978; Fleurant, 1975).
5. Adults require a different educational approach thando traditional students.
The concept of adult-centered educational systems becameknown as andragogy. It can best be understood in itscontrast with pedagogy--the traditional schooling system, orthe total control of the content and learning strategy by theteacher. To use a pedagogic system for teaching adults is aparadox, a contradiction in terminology, yet it is attemptedon a regular basis (Knowles,' 1978).
Malcom Knowles, one of the primary proponents of andragogy,recommended a return to the androgogic teaching styles ofConfucius, Jesus, and Aristotle. The teacher should help thelearner, should act as an educational resource and shouldattempt to develop a 'Earning process, rather than follow thetraditional dictates of total control of the content and thelearner (Knowles, 1978). Knowles further recommends thateducators capitalize upon characteristics of adults; theirability for self-direction, their richness of experience,their readiness to learn, and their ability to apply theirlearning should be utilized to the fullest. Adults prefershort-term specific, application-based learning. It providesimmediate reinforcement, benefiting both the learner andfuture educational programs (Simkins, 1977). Either Simkins(1977), or Srinivasan (1977) provides a wealth of material onnonformal adult education for anyone considering an adultprogram.
6. Although adult environmental education programs havefollowed established adult education program recommen-dations, many were unsuccessful in attracting andmaintaining an audience.
22
6
The above statement is not meant to imply that the programswere not properly developed. For example, Presnell (1973)and Force et al. (1970) describe programs which the authorsfeel were of very high quality.
Nor have all 'programs been unsuccessful in attracting andmaintaining an audience. In 1970, for example, theUniversity of Wisconsin--Milwaukee implemented a TV coursewhich had over 4,000 students enrolled and over 100,000viewers. Their evaluation showed the program to besuccessful.
7. Vocational, technical, 'and general education certifi-cate programs could offer opportunity for additionalenvironmental education.
Technical training and general education (G.E.D.) has notbeen traditionally viewed by environmental educators as partof their domain. This literature survey indicated noinfusion of environmental education within G.E.D. programs.However, the Moraine Park Board of Vocational, Technical, andAdult Education (1975) has developed a guide for integratingenvironmental education concepts into K-adultvocational-technical programs using the U.S. Office ofEducation cluster concept as a framework. The guide includesobjectives, learning strategies, classroom materials andreferences for a variety of disciplines and suggests thatproblem solving has a potential role in the vocationalcurriculum. It demonstrates the potential for infusion ofenvironmental education into other areas of adult education.
Recommendations
Clubs, organizations and institutions have participants whohave already shown commitment. If we can identify which oftheir interests relate to environmental education and thenprovide appropriate education opportunities to facilitatethese interests, we have the best potential for programsuccess.
Lnce we have identified potential audiences, providing accessto the education opportunities is a must. Regularly scheduledcourses can be offered in a platooning system (8-4, 4-11 plusSaturday). This schedule will improve access for youngerworking students as well as older students. Allowing courseregistration without the entrance formalities of thetraditional student has improved adult access to MichiganState University courses during the 1979-80 school year.
23
47
The teaching strategy for adults also needs modification.Adults participating in education have immediate expecta-tions to be fulfilled. Therefore, our instructionalobjectives require greater specificity and immediateapplication to the work world or to their current interests.Most adult learning occurs in shorter time frames and ,isself-directed. Therefore, one-shot, evening, half-day orday-long experiences have the greatest potential. For theself-directed learner, library reference study guides,learning flow charts, and self study courses should beprovided. To provide for social needs of the self-directedlearner, learning webs and sharing groups are recommended byIllich (1970).
As Anderson (1978) has recommended, we must continue toinfuse environmental education into the formal K-16educational system where we have an opportunity to affectevery student. But given the expansion of the adulteducational market, we must utilize our knowledge, experienceand commitment to, broaden the- environmental educationemphasis.
A summary of recommendations based on the precedingdiscussions is presented below.
1. Program developers must identify group interests toprovide programs which will meet group needs and meetenvironmental education goals.
2. Colleges and universities must provide easy access tocurrent instructional programs.
3. Non-traditional students require scheduling whichminimizes interference with primary commitments.
4. Adult students need application-based programs.
5. Social and academic needs of self-directed learnersmust be provided for.
6. Emphasis on complete infusion of environmentaleducation into K-16 curricula must be continued.
7. Every opportunity must be used to meet the needs ofnon-traditional students.
24
48
REFERENCES
Anderson, Harold M. 1978. Reflections on an EnergyEducation Venture: Colorado's Adult Energy EducationProgram. Journal of Energy Education 1(1): 24.
Bergen, Timothy J., Jr. 1978. The Future of HigherEducation: A New Renaissance. Paper presented atthe first meeting of the Education Section of theWorld Future Society. Houston, Texas, October 20-22.ED 162 577.
Botinelli, Charles A. and Alan Curtis. 1977. EnergyEducatiori for Adults. Phi Beta Kappan 59(4): 68.
Fleurant, Judy B. 1978. The Adult Education Market: ACompilation of Existing Surveys. New England OpenLearning Project, New England Center for ContinuingEducation. ED 148 259.
Force, Jo Ellen; Thomas A. Seliga; and Ralph W. Swain.1977. A Community Environmental Education Program onAir Quality. Journal of Environmental Education8(3): 32-39.
Illich, Ivan D. 1970. The Schooling Society, firstedition. New York: Harper and Row, 116.
Johnson, David I.; Randall Champeau; and Chris Newhouse.Perspectives on the Status and Success of Environ-mental Education for Adults. Presented at the Conferenceof the National Association for Environmental Education,Albuquerque, New Mexico, May 24, 1980.
Knoell, Dorothy M. 1976. Challenging the Model and theMyth. Community and Junior College Journal 47(3):22-25.
Knowles, M. 1978. The Adult Learner: A NeglectedSpecies. Houston: Gulf Publishing Company, 27-59,71-80.
Moraine Park Board of Vocational, Technical and AdultEducation. 1974. Guide for Integrating EnvironmentalEducation Concepts into Elementary, Secondary, andPost-Secondary Vocational, Technical, and AdultEducation, 493.
Munday, Leo A. 1976. College Access for NontraditionalStudents. Journal of Higher Education 47(6): 681-699.
25
4.9
Murphy, James F. 1974. Concepts of Leisure. EnglewoodCliffs, NJ: Prentice Hall, Inc., 267.
Presnell, Richard B. 1973. Environmental Education, AProblem Approach. Final Report. Green Bay: WisconsinUniversity, 100. ED 104 641.
Richardson, Penelope L., and others. 1978. LifelongLesLaiag.,4211JILLL22112y. Washington, DC: Officeof the Assistant Secretary for Education (DREW), 81.ED 160 859.
Siegle, Beatrice. 1978. The "Older" Student Challengeto Academe. Paper presented at the Annual Conferenceof the California Association of InstitutionalResearch, San Francisco, California, February 23.ED 149 835.
Simkins, T. 1977. Nonformal Education and Development.Manchester Monographs, 1-19.
Srinivasan, L. 1977. Perspectives on Nonformal AdultLearning. New York: World Education, 1-77.
Wisconsin, University of, at Milwaukee. 1970. 1970 ProjectUnderstanding: A Community Education Project of HumanSurvival, 57. ED 045 952.
26
5
ENVIRONMENTAL EDUCATION AND HUMANISTIC EDUCATION INTHE 1980s: TREADING THE CONTENT-PROCESS TIGHTROPE
Jean MacGregor'
Whether we are environmental educators (teachers Concernedwith the environmental values and quality) or humanisticeducators (teachers concerned with the dignity and integrityof people), we probably agree on the basic premise that thechild, and society as a whole, can be fundamentally changedfor the better through education . . . but that there aredifferent ways of going about doing that. Some of the wayshave to do with content: what learners are exposed to. Someof the ways have to do with process: how learners come .toknow what they do.
The tightrope analogy contained in the title of this essaycomes from my sense that embarking into environmentaleducation and humanistic education necessarily involvesrisk-taking, and requires a remarkable degree of delicacy andbalance. And, the farther one goes in pursuit of either, themore balance is required.
Although many of us agree that environnental material andunderstandings can best be interwoven =tang curricula,it still involves substantially new z:onLent for mostteachers. Further we often propose that this content betaught synoptically: that environmental issues facing theneighbOrhood, the community, the region, and world beaddressed from a variety of disciplines at once.
Further still, the content--in terms of environmentalissues--are subject to change, often rapid change. Who wouldhave predicted ten years ago, for example, that synfueldevelopment, fluorochlorocarbon regulation, deadly hazardouswaste sites, or acid rainfall would be makirig front pagestories today? The issues of the 1980s may well bethese...or, they may be others. Perhaps new social issueswill demand attention: those of equitable distribution ofglobal resources...or the extent of the public's right toparticipate in rule-making and planning.
'Environmental ptpiies Faculty, Warren Wilson College,Swannanoa, NC 28778.
27
51
And even further still, many of us concern ourselves with theprocesses of learning. I sense that this attention toprocess comes from a variety of quarters. First,environmental education, by its very nature, requiresparticipation, and active involvement of learners in thenatural and human-made environments at hand. Second, weenvironmental educators who arrived at the K-12 schools inthe 1960s and '70s with this assumption observed what washappening (or, rather, what was not happening) in manyteachers' classrooms, and perhaps fell into the role of thechild who observed that the emperor was in fact naked. Manyof us wondered if environmental education would not onlysolve environmental ills, but educational ones as van.Third, we began to piece together environmental education inthe 1960s and 1970s, decades which one day may be regarded asthe era of process education and humanistic education.
When the process of environmental education and humanisticeducation is discussed, it is essential to define what kindsof processes we mean, and what ends we have in mind. To namea few:
I. THE CONTENT PROCESS
To begin, there is simply the process of learningicmtent.This is the age old emphasis of Dewey...I am not interestedin what the learner knows, but how he comes to know it.EnviTMental education naturally embraces this view ofprocess. Environmental educators, and outdoor educatorsbefore them, have long pointed out that one of +-he bestvehicles for teaching anything is the real world--theenvironment at hand. Environmental education therefore issimply good educative process, or good education.
II. THE "SELF ACTUALIZATION' OR PERSONAL GROWTH PROCESS
A second kind of process, which humanistic educators espouse,has to do with self-development, with personal growth, withwhat A. H. Maslow termed "self actualization" (Maslow, 1968).The end is not merely the content learned' but the positivepersonal growth which has occurred. The emphasis is not juston behavioral objectives, but upon the freedom, value, worth,dignity and integrity of persons '(Clute, 1978). As DonMichael (Michael, 1968) summarizes it,
"...with regard to the education of the feelings,the self, the emotions: we must educate forempathy, compassion, trust, nonexploitiveness,non-manipulativeness, for self-growth, and self-teem, for tolerance of ambiguity, foracknowledgment of error, for patience, forsuffering."
28
III.' THE ENVIRONMENTAL ETHIC PROCESS
Still another set of processes has a different end in mind:that of environmental sensitivity with accompanying personalor civic commitment on the part of the learner. It is notenough that the student simply knows about the biophysicaland social processes which make the natural and human-madeenvironments tick. No. He or she must be exposed tolearning experiences which engender attitudes of concernabout environmental problems, and further still, a motivationto act on them (Stapp, 1969).
IV. THE INNOVATION--IMPLEMENTATION PROCESS
Lastly, because many of us teach teachers, we need to concernourselves with the processes of introducing all these newemphases and ensuring that they meet with some effectivenessand success.
But--where do the processes fit?
I for one believe deeply in the value of an education that isexperiential, and humanistic, and environmental, not only intraditional learning environments, but in the workplace aswell. However, I would like to raise some questions that Ifeel we need to address if we work in public (K-12)education.
1. Do the humanistic and environmental ethicprocesses have a place in public education?
2. If so, how will they take their place?
I raise these questions because these processes are so veryvalue laden. Try as we can to intellectually side-step thisissue with the tenets of value-clarification, certainorientations carot help but surface. To name just a few....
Reductionist views Holistic views
We attempt to depart from "hardening of the categories" andto view the environment and environmental issues by pullingtogether and synthesizing understandings from a variety ofdisciplines.
Heirarchical systems Egalitarian systems
We attempt to depart from Judao-Christian views of God-Man-Beasts-Earth, and to view ourselves (we and all living
29
53
things) sharing a planet and in life processes on which weall depend.
Nationalistic orientations Global orientations
We see that we can no longer just cope with environmental andsocial problems on a national scale, for so many affect theentire world. Further, problem-solving does not merelyrequire the technical expertise of the industrialized world,but rather political and intercultural sensitivity andunderstanding of extraordinary proportions.
-Consumption assumptions Simpler living efforts
We raise questions about the Madison Avenue formulae whichsay that "happiness/security = things" and "wants = needs,"because economies built around nondurable and often faddishconsumer goods have accelerated environmental degradation.We wonder (often vaguely) about simpler times, about"post-industrial" service-based economies.
Public awareness Public participation
We see that it is not enough for a citizenry to be merelyinformed of the workings of government; rather, it isfundamental that citizens who choose to be involved in policyformulation.
Laissez-faire values direction Values clarification
We feel that teachers should no longer avoid value ladenissues, but' attend to them with students with valueclarifying exercises and explorations.
Competitive learning Cooperative learnina
We in humanistic education raise questions regarding theassumptions (myths, to many of us) regarding the value ofcompetition, and ,suggest some ways of learning whichencourage cooperative behaviors among students' rather thancompetitive ones.
Are these the processes that environmental education andhumanistic education are really about? All this is prettyreformist stuff.
Admittedly, content and processes in public schools and inthe educational world in general are already value-laden, Isuspect with the processes noted above on the left., Yet, here
we are with an agenda that espouses some rather differingways of looking at the world and at ourselves as well'. Thisis an agenda which could well come under increasing fire inthe coming years of economic retrenchment and nationalisticfervor.
Each of us, I believe, needs to work out for ourselves, theethics and the ends of the content and the processes wechoose to use, and furthermore, to be able to articulate itto all comers. Are we EDUCATORS using the environmentbecause it provides "relevant content" and "good process"?Or, are we venturing further out there cn the_tightrope, ashumanistic and/or environmental REFORMISTS, using educationalarenas to achieve our goals? Or, somewhere in between?
REFERENCES
Clute, Morrel J. 1978. "Humanistic Education: 'Goals andObjectives." Humanistic Education: Objectives andAssessment. Washington: Association for Supervisionand Curriculum Development.
Maslow, Abraham H. 1968. Toward A Psychology of Being.New York: Van Nostrand Reinhold.
Michael, Donald N. 1968. The Unprepared Society: Plannincfor a Precarious Future. New York: Basic Books, 108-9.
Stapp, William B., et al. 1969. "The Concept of Environmental Education." The Journal of EnvironmentalEducation I(1).
A REPORT ON PROJECT EASE:ENVIRONMENTAL APPROACHES TO SPECIAL. EDUCATION
Michael J. O'Brien', Vicki D. Staytonl,Shelley Davis - Wilson' and Terry L. Wilson2
Introduction
At Murray State University in west Kentucky, a project isunderway that was developed to utilize environmental teachingtechniques with a special population of students, those withphysical and mental disabilities. Project EASE, "Environ-menta1 Approaches to Special Education," resulted from thecollaboration of environmental educators and specialeducators responding to the needs of many "regular" classroomteachers who now have handicapped students "mainstreamed"into their classrooms for all or part of the school day.This placement of handicapped students into regular classesis due in part to legislative mandate, P.L. 94-142, theEducation for All Handicapped Children Act of 1975, whichrequires that handicapped children receive a free,appropriate public education in the least restrictiveenvironment possible. For most mildly handicapped studentsthe least restrictive environment is the regular classroom.Because of the relative newness of the "mainstreaming"process, most regular teachers have not had training inworking with students who have handicapping conditions.Therefore, inservice projects like Project EASE have beenfunded by the Office of Special Education, U.S. Department ofEducation to assist regular educators in acquiring newskills. In Project EASE, environmental education is beingused to orient teachers to "hands-on" learning processes andto provide them with new and exciting alternatives forteaching n11 of their students.
Project Desim
The primary goal of. Project EASE is to promote systemicchange in Local Education Agencies (LEA's) in delivering
1 Project EASE, Department of Special Education, MurrayState' University, Murray, KY 42071.
2 Center for Environmentai Education, Murray StateUniversity, Murray, HY 42071.
32
5s
services to handicapped children. This is accomplished byorganizing leadership, support, and instructional teams ineach participating school system. The teams are then trainedthrough a two-week summer institute and a series of follow-upworkshops. The instructional team, made up of the principal,three regular classroom teachers, and a special educationteacher, all from the same school, develop goals andobjectives for target children with special needs. To aid inthe identification of these children and to serve asconsultants in the development of additional instructionalstrategies, Project EASE field consultants visit eachparticipating school at least once every two weeks. Teammeetings involving administration and support personnel fromthe leadership and support teams, as well as instructionalteam members, are held during the site visits to discussprogress and problems occurring as a result of the teams'activities. Throughout the training sessions and schoolvisits, personal development, as well as team growth, isemphasized.
During the second year of participation in EASE, schoolpersonnel develop and implement an inservice plan to assistother professionals in their system in serving handicappedstudents. The objective is to create a "ripple effect,"i.e., a continually expanding base of specially trainededucators.
Environmental Education and Project EASE
In Project EASE, environmental education is a teaching/learning process that has two main ingredients--people andthe environment. Environmental teaching is centered aroundpeople interacting with one another and with the world aroundthem. It is an interdisciplinary process that recognizes thewholistic nature of both the world and peopl-a. Therefore,environmental education involves learners in multi-sensory,hands-on, life-centered experiences that enable the learnerto be involved in cognitive, affective, and psychomotordevelopment.
One way to approach the wholistic nature of people is to:ecognize that each person has the potential to think, learn,and express himself in a variety of ways. These 'mentalprocesses' vary in strength from person to person dependingon genetic and environmental influences. Among theseprocesses are analysis, abstraction from an image, timescanning, matching, transforming, manipulating elements, andusing analogies, metaphors, and intuition. Throughenvironmental education people can increase their use ofthese processes in solving problems.
In a classroom that is suffering from the "book and dittosheet" syndrome, the environment is so limited that for manystudents only a few of their processes can be utilized; thus,the students are limited in what they can learn, as well asin what they can express. In a diverse, expanded learningenvironment that includes not only the classroom's xesources,but those of the entire building, the school yard, and thecommunity, students are offered the opportunity for moremulti-sensory, multi-process learning experiences. Throughenvironmental approaches, classrooms can become reflectionsof the greater world, where "chunks of life" can be used inteaching and learning.
For the mainstreamed "special education" child a diversifiedlearning environment can be especially helpful. Most of thestudents being mainstreamed into regular classrooms aremildly handicapped, often diagnosed as Learning Disabled,Behaviorally Disordered, Educationally Handicapped, orEmotionally Disturbed. These labels do not indicate what thestudent's real instructional problems and needs are.However, the labels do indicate that these students have notbeen successful, particu7 rly in classrooms that are typifiedby abstract, highly rational, and non-diversified teachingmodes. Many special educators have long recognized thatpeople have different learning styles (or modalities) andthat honoring persons' preferred modalities (e.g.,kinesthetics) increases learning and may even improve upontheir less successful learning styles. Through environmentalteaching, students are provided with opportunities to usedifferent modalities, to get involved with the material to belearned, to process data in different ways, to really thinkabout what they are experiencing and to later express whatthey did.
Using environmental education with children who have problemslearning in traditional classrooms is an accepted idea,although not a widespread one. Many classroom teachers havehad little or no opportunity to experience wholisticenvironmental education activities themselves, and it is verydifficult to teach them in a manner never experienced.Therefore, Project EASE workshops are designed to provideparticipants with experiential, hands-on activities. In thisway, Project staff serve as models to help participants findout what to teach and also how to teach in a way which bettermeets the needs of all students.
As Project EASE enters the third year of operation, there. ults that the teachers are experiencing in theirclassrooms are very encouraging. Many of them are findingthat environmental education activities not only help their"special education" students learn better, but also benefittheir "regular education" students. They report that withexperiential, hands-on environmentai approaches they are able
34
58
to access many different learning modes in each student. Therichness of using real life and real life experiences intheir teaching is expanding the learning process for studentswho had previously failed under the "book and ditto sheet"syndrome. Project EASE teachers are discovering thatenvironmental education materials, such as Project LearningTree (PLT), Outdoor. Biology Instructional Strategies (OBIS),and Acclimatization offer a wealth of choices in matchingstudents' needs with appropriate instructional experiences.They are also realizing that many students are more motivatedas they discover more of themselves (their mental processes)in their learning. Low self-concepts, often a problem withmildly handicapped students, are enhanced as these studentsexperience success in learning.
Expanding the students' learning environment may create somemanagement problems, both in terms of children's behavior andin instructional/materials management. Teachers begin to askquestions such as: "How do I know when a child is ready todo an individual exploration?" "How do I control 25 childrenwho are exploring the school yard?" "How much diversity andfreedom can Johnny handle?" "How do I organize threedifferent learning centers?" "How do I evaluate suchmulti-faceted learning experiences?" In order to meet thisneed, Project EASE staff also assist teachers in discoveringways to manage an "environmentalized" classroom curriculum aswell as to utilize behavior management techniques.
Many teachers also benefit in a very personal way fromProject EASE. As they involve themselves in the workshopsand site visits, they become more aware of themselves aspersons, their potential in the classroom and theirrelationship to the world around them. In the finalanalysis, this kind of personal growth is the key to theProject's success.
35
59
CALIFORNIA WILD AND SCENIC RIVERS: A VEHICLE FORPRESENTING THE ROLES OF ENVIRONMENTAL
PROFESSIONALS TO UNDERGRADUATESRichard L. Perrinel and William Dritschilol
A recurring question within undergraduate education is theproper role for the professional (see Sagen, 1973, andreferences therein). In what ways can professionals, asmembers of a faculty, best contribute to the basiceducational needs of undergraduates? What do undergraduatesneed to learn about the role and future of professions insociety to best select their own future educational pathways?
It seems clear that in our present resource-dependent,environmentally conscious society, the influence ofenvironmental professionals is pervasive. If environmentalgoals are to be properly selected and achieved, there is adistinct social need for the public to understand better thestrengths and limitations of professional expertise. Therealso is a need to understand the background and experiencethe environmental professional requires and that he or shebrings to a role. To provide such understanding, collegestudents must be exposed to the professional role itself,particularly to how professionals apply basic concepts topractical problems. Such exposure should be differentiatedclearly from a serious effort to develop actual professionalcompetence. To be most useful, the exposure shouldillustrate how, from any of the group of relevant basicdisciplines, theoretical ideas can be applied.
The UCLA Freshman/Sophomore Professional School SeminarProgram
Students at UCLA have the option through the Freshman/Sophomore Professional School Seminar Program of learning howfaculty across a spectrum of the professions (medicine,public health, engineering, environmental scientists, etc.)put the basic knowledge of academic disciplines to the test.During each academic period, a number of seminars areoffered, giving students an opportunity to learn the natureof professional work and the role of professionals insociety. Students either desire a future as environmentalprofessionals or have a desire to learn about environmentalproblems even though their career goals are in unrelatedareas.
'Environmental Science and Engineering, 3677 GeologyBuilding, University of California, Los Angeles, CA 90024.
Environmental Science and Engineering (ESE) faculty, seemideally suited to the Seminar program. They address criticalissues; they illustrate the interdisciplinary character ofmany professional activities; they test current concepts andmethodologies in the light of actual experience. We haveused case studies performed by teams of graduate students andfaculty, either currently underway or just completed, asvehicles for revealing the professional's role. Arepresentative case study, "California's North Coast Wild andScenic Rivers: Analysis of Inter-Agency Planning andTechnical Issues," has proven to be a successful Seminarvehicle.
Protection of California's North Coast Wild and Scenic Rivers
The north coastal area of California is both valuable andvulnerable because of its abundance of natural resources,especially rivers and timber. ESE (1980) presents detailedresearch results and a bibliography of books, technicalpapers, newspaper articles, and government documents, many ofwhich were used for the seminar.
Within some 13 percent of the land area of the state lies 40percent of its natural surface water supply. Two-thirds ofthe north coast runoff flows through basins designated aswild and scenic: the Smith, the Klamath-Trinity, and theEel-Van Duzen river basins. The need for management topreserve certain resource qualities is not an issue; it isaccepted by almost all with an interest in the rivers.Differences emerge in determining what constitutespreservation of the rivers and in defining what is needed toaccomplish such a task. The reason for this situation isthat the preservation of a river is a complex matterinvolving many elements: the water itself, its quality andquantity, the fish and other organisms living in the water,the wildlife living near it, the forests and grasslands thatsurround it, and the minerals deposited in and around thestreambed. How these components are managed can affect theeconomy, lifestyle and quality of life not only of the localresidents, but also of a larger, statewide population thathas an interest in these resources.
Aside from the technical issues concerning water quality,forestry, fisheries, wildlife habitat and their inter-relationships, basic perceptions of resource value differgreatly. For some, wilderness itself is a resource whosepreservation requires that only natural processes occur. Forothers, conservation means efficient use of the resources.This dichotomy in conservation goals traces back to thecontroversy over the Hetch Hetchy Reservoir, which led to theformation of the Sierra Club early in this century.Decisionmakers must balance the two views in such a way thatfuture generations will also benefit from the resource.
37
61
Long-range water resource planning is particularly vulnerableto the dichotomy of economic grOwth versus maintenance ofrivers in their natural state. California economic growthhas been intimately linked to water development: to dams,reservoirs, canals, and hydropower. In the north coastalregion, the timber and wood products industry has dominatedthe economy. But watersheds have recently been recognized ashaving economic value aside from their exploitable resources.Services to society such as cycling of nutrients, binding ofsoil to prevent erosion, and breakdown of organic pollutantsare provided free by ecosystems, while cost is incurred whenthese natural processes are interrupted.
There is a mixture of outlooks and opinions among people inthe region. Hearings held on management plan proposals havebeen heavily attended by interest groups and local residents,all concerned about the future of the area. One set of viewsposits that existing regulations--timber harvest plans, waterquality planning, and fish and game regulations--adequatelyprotect from environmental deterioration and that anyfurther, future management should be under local control.Other interest groups argue that more stringent regulation isessential.
The nature of water is such as to transcend bureaucraticboundaries. .Management of the resource is spread among avariety of agencies, many with competing goals and interests.Portions of watersheds are under jurisdiction of federal,state, and local government. Conflicts arise in determiningwho should be responsible for river preservation. Because ofthe involvement of so many groups, each oriented to aspecific function, effective water management becomes verydifficult. Local planning agencies have been designated asprobable management plan implementors, though they are likelynot to be in full agreement with the specifics of the plans.The effectiveness of such an approach seems uncertain andlikely to open the door to further controversy.
Seminar Presentation
This, then, is the subject matter for our Seminarpresentation: a "live," current, environmental problem ofmajor statewide concern, complete with current managementplans, public hearings, and many fascinating related problems(such as the future of the Hoopa Indians). Our initialapproach with the Seminar is conventional. We show slides,interpret maps and assign a wealth of literature for reading.Reading is technical, socio-political, and legal, developedfrom our own research and from testimony at public hearings.The groundwork has been laid by the research our faculty andgraduate student assistants have done earlier, and also by
38
C2
the lengthy documents prepared by numerous state and federalagencies. Thus, students learn to mine the wealth ofknowledge available to them from the full range of sourcesextending to include current news and personal contacts thatmight prove useful in the solution of some future problem.Students are led through almost the entire process fromassessment of the resource and formulation of the goal, tothe legislation framed to meet the goal, to the plans toimplement the legislation.
Students also need to express what they have learned before acritical audience and to sharpen their wits under (possibly)hostile cross-examination. Consequently, we require thatthey regularly participate in oral discussion of the issuesraised, with the typical result that they soon learn to parrycritical thrusts through use of scholarship. Well writtenreports are also essential. We have found it particularlyuseful to let students role play, writing their requiredreport from the viewpoint of one (or a group) of the actorsin the drama; for example, the manager of a local sawmill,providing most of the employment for 50 miles in anydirection. They have found this to be a challengingassignment, quite different from the usual term paper. Weeven have asked seminar students to remake legislative andregulatory decisions while playing the roles of arepresentative cast of interest groups. To do so impressesthem very quickly that there is no easy, environmentallysound and economically attractive solution for many of ourmajor problems.
Conclusions
We conclude that by their nature, environmental problemsconstitute a useful set of examples of how professionalsfunction in our present-day society. The UCLA Freshman/Sophomore Seminars addressing such problems seem to be amongthose most closely and ideally approaching the teachingtargets originally set for the Program. There are severalprobable reasons. First, the problems selected fordiscussion are "live," with current activity and interest.Second, almost every disciplinary interest is activelyrepresented: seminars address history, resources, values,and the natural environment of a region; they addresscomprehensive planning for futures, the methods forimplementation, and likely actual consequences. Third, wehave carefully programmed our presentations so that a wealthof source material is at hand, ready for use, and fresh inthe minds of participating faculty. In combination, thesecircumstances provide an effective framework from which topresent philosophy, goals, methodology, and technicalbackground for the education of environmental professionals.We believe such experience can be equally beneficial to thosewith professional aspirations and to "just plainenvironmentalists."
39
e3
Acknowledgement
The research upon which the Seminar was based was supportedby Grant No. 784-0332 from the Ford Foundation.
REFERENCES
ESE. 1980. California's North Coast Wild and ScenicRivers: Analysis of Inter-Agency Planning andTechnical Issues. Environmental Science and Engineering Report 80-35. University of California, LosAngeles.
Sagen, H. B. 1973. "The Professions: A Neglected Modelfor Undergraduate Education." Liberal Education59: 507-519.
40
64
LITERATURE AND FILM:CULTURAL DOCUMENTS OF THE ENVIRONMENT
Arthur B. Sackgl
First some truisms. Literature and film are products ofindividual and/or collective imagination and geniusconverging at a particular time and place. Necessarily,literature, film,' all aesthetic objects are artifacts of aparticular culture and reflect the temper of the age and theforces that shape thought and action within a given society.Art is wedded to the world, it cannot be otherwise, and eventhe dreamiest of works, the most surreal of productions is apart of the soil of the planet, the substance of the earth.Books and films are historical documents, and they capturemoods and values, attitudes and beliefs, which freezesociety. As such, they are the tools of the historian, thewindows through which the critic may peer to witness the landscape of the past, the weather of human action. When shownto an audience as shadows dancing on a screen, when producedon a stage or recited before a crowd of silent participants,images that move and utterances that reverberate in the bonesof the middle ear recreate the drives, thoughts, passions,anxieties, prejudices, motives, inclinations, madnesses ofthe past filtered through the consciousness of the presentand the individual caught in the present. And hence, likeall other phenomena, they are perceived from the vantagepoint of the perceiver, and tell the viewer, the listener,the reader, through his or her reactions and reflections atleast as much about the present as about the past, at leastas much about the perceiver as the object perceived and theobject's maker.
If we have learned anything from ecology, indeed, if we havelearned anything in the past 50 years, it has been thelessons of the connections among phenomena, man-made andotherwise natural. The shinbohe is connected to thekneebone, the kneebone to the thighbone. Literature and filmhelp us understand these connections and ourselves--and in sodoing they are useful, relevant to an understanding of theways humankind affects the environment.
More directly, literature and film often deal explicitly withthe effects of human action on the environment, theinterconnections between the environment and human1ty...Chekhov's The Cherry Orchard, Ibsen's The Public Enemy,William Carlos Williams' Paterson, Shakespeare's King Lear,Hamlet, and The Tempest, Cervantes' Don Quixote, Faulkner's
lInsticute for Environmental Studies, University ofWisconsin-Madison, 70 Science Hall, Madison, WI 53706.
41
C5
Go Down Moses and all the novels of Yawktapanawpha County,Wordsworth's Lyrical Ballads and Prelude, Gary Synder's BackCountry and Turtle Island, Wendell Berry's Openings andFarmthg, Chaucer's Canterbury Tales. Fiction, poetry, drama.Sixteenth century, 20th or 14th. And so too for non-fiction,Thoreau's Walden, Leopold's A Sand County Almanac, etc. Andas well for film: Jaws, King Kong, The African Queen, TheTreasure of Sierra Madre, Dr. Strangelove, Derzu Uzala.Environmental themes caught in different media: attempts tounderstand the place of humankind in nature,, to understandthe nature of Nature, and, in the 20th century, attempts toweld the fragments of social and religious order overturnedby Darwin and Marx, Malthus and Freud into an integratedwhole where harmony is once again realizable.
So literature and film help us to understand our environmentand the effects humans have upon it (1) because it is thenature of art to do so and art cannot escape from itself; and(2) because some works explicitly examine these relationsovertly, i.e., it is the subject of the works. The study ofliterature, film, by extension, all of the visual and plasticarts, can help the student of the environment to understandhis or her subject, the scholar to interpret the role cultureplays in human behavior as it affects the environment, andthe environmental activist to better comprehend socialforces. By so doing, such study can help effect social andpolitical change for the benefit of the global ecosystem.
In The Comedy of Survival (1974), Joseph W. Meeker notessuccinctly:
"The origins; of the environmental crisis lie deepin human cultural traditions at levels of humanmentality which have remained virtually unchangedfor several thousand years. The premises uponwhich our culture has been built are powerful anddurable, and their weight upon us must be appre-ciated before we can hope to alter theirstructure." (p. 6)
"Industry, technology, the exploitation of theearth and the aggrandizement of mankind aregoverned by ideas, faith, and mythology. Thecultural images describing what we might be havehelped us to become what we are: however thehuman mind images the world, that is how theworld tends to become...That is what a culturaltradition is for, and our institutions exist inorder to pass such models along. Educationacquaints each new generation with the modelsof life and thought available from previousgenerations." (p. 7)
42
66
For thousands of years literature has been one of the primaryvehicles for transmitting the models of our heritage, andperpetuating these. Film and more recently television havejoined to become the major transmitters of culture to massaudiences, have, because of their sensory power, become theprincipal vehicles for educating our young to the images ofthe world's body and what is right and good.
And what is at the heart of literature and film but anunderstanding of man's place in the universe. Literature andfilm are profoundly interested in the relationships of humansto humans, nations to nations, culture to culture, humans andnations and cultures to the world. Meeker has identified anew field of inquiry, literary ecology, ecology as applied toletters which can be extended to the world of film. Meekerdefines literary ecology as "the study of biological themesand relationships which appear in literary works" (p. 9)."It is simultaneously," Meeker goes on, "an attempt todiscover what roles have been played by literature in theecology of the human species" (p. 9). This form of inquiryhelps us understand the philosophical and culturalunderpinnings of human action and belief, help us trace thehistory and cultural ideologies that have contributed toenvironmental degradation and crisis. As a field, literaryecology "makes it possible for us to study the function ofliterary art as it influences the survival of the humanspecies" (p. 10).
Throughout Meeker's work, he is concerned with the role ofliterature solely. However, film and other artifacts ofculture--painting, sculpture, architecture--can and should beanalyzed in like manner. Literature, film, painting and,architecture reveal factors and assumptions such as thefollowing which have been at the heart of environmentalexploitation:
(a) Man is at the center of the universe and nature existsfor man, to be used by man, to be dominated by man.This assumption is as old as Genesis: Adam is given"dominion over the fish of the sea, and over all theearth, and over every creeping thing that creepthupon the earth." Whether dominion translates intostewardship or rape is not essential, in either caseit is man who decides values, purpose, worth of thenatural world, and'determines use.
(b) The universe is directed and there are standards ofcorrect human behavior which involve truth, honor,justice, and these forms exist above the naturalrealm, are in fact detached from the environment,are pure abstractions devoid of natural phenomena.
(c) Individual development and growth, the romanticinvolvement with individual personality, separatesman from man, man from the natural world.
The study of literature, film, etc. should be incorporatedinto environmental education and environmental studiescurricula in an effort to bring to light assumptions such asthese. Doing so aould provide valuable insight into theculture which affects the environment, at the same timemaking students more sensitive to language and image, tohistory, human thought, and human psychology.
This can be done more easily than is imagined. Literatureand film study can be built into an environmental studiesdegree or an environmental major by fashioning a course or atleast designing part of a course around the subject.Invitations to guest lecturers would reduce the need forpermanent personnel, but permanent personnel should be soughtif dollars allow. The works of literature and film arereadily available for use, and our society has a ready supplyof qualified individuals able to introduce students to thehuma.Nities and explore the unquantifiable aspects ofenvironmental degradation and crisis. It is an aspect ofenvironmental studies and environmental education which hasbeen overlooked for too long and deserves more than the lipservice currently paid to it.
REFERENCE
Meeker, Joseph W. 1974. The Comedy of Survival. Nev York:Charles Scribner's Sons.
44
es
AN ANALYSIS AND EVALUATION OF A FIELD TRIP SERIES
Thea Teich' and Robert D. Townsend2
Background
Field trips have long been recognized as valuable educa-tional methods. The best field trips are "somethinq morethan passively accepted journeys from place to place; (theyare) active exploratory experiences" (Dale, 1969).
When most people think of field trips, they think ofelementary school and buses lined up at museums', botanicalgardens, or scienk.a and technology centers. But the noncompulsory field trip has become 'a popular means forindividuals to see and learn under the direction of aknowledgeable guide. Offerings range from the day-long canoetrip through a National Forest offered by the CarnegieInstitute to the several-week visit -) the Galapagos Islandsadvertised by commercial tour companies in Audubon or NaturalHistory.
These programs are taking advantage of a recently recognizedphenomena in this country: interest in "lifelong learning."This interest is not particularly new; non-formal courses andclasses have been offered by civic centers, "Y's" and otherorganizations for many years. But, because of major societalchanqes-increasingly older population, divorce rates, changesin family life p-Aterns, mid-career job switches--"our viewsof education particularly as to whether it should all bepacked into the early years, are shifting" (Peterson, 1978).Thus, the educational community is recognizing the potentialof this emerging audience and is also realizing that itsdemands are different from those of the traditionaleducational audience--children. "Lifelong learning is aconceptual framework for conceiving, planning, coordinatingand implementing activities to facilitate learning by allAmericans throughout their lifetimes (Peterson, et al.,1978). But this framework involves some qualifications. Itdoes not mean further compulsory education, nor does it limitlearning to in-school programs. Indeed, lifelong learning isa basis for integrating formal and non-formal educationalinstitutions as well as other organizations, public andprivate, concerned with the development of people.
'U.S. EPA, NTOTC, Cincinnati, OH 45268.
2ERIC/SMEAC, Ohio State University, 1200 Chambers Road,Columbus, OH 43212.
45
Thus, an interest in learning has become more widespread thanit may have been in the past. Environmental educators cantake advantage of this interest by expanding their offeringsto non-traditional audiences, such as senior citizens andone-parent families, or by experimenting with differenteducational methods or programs. One of these is the fieldtrip which enables participants to relate what they havelearned in their formal schooling, to what they have learnedin the outside world and vice versa (Dale, 1969).
In 1976, the Carnegie Museum of Natural History and theWestern Pennsylvania Conservancy, both of Pittsburgh,Pennsylvania, embarked on a cooperative project to increasepublic knowledge of the natural world, ecological concepts,and human impact on natural systems. At the same time, thetwo organizations decided it was also necessary to increasethe availability of information about their functions.Through the Leonard S. Mudge Environmental Education Programof the Carnegie Museum of Natural History, the "Out of DoorsDays" series of workshops and field trips was developed toprovide an annual program of activities for adult and familygroups concerned with hands-on nature study and environmentaleducation.
Description of Field Trips
The programs were originally designed as a combinationThursday night workshop and Saturday field trip package. Thishas been modified and in 1979 programs were offered invarious formats. These are listed below:
- -Life in French Creek: a canoe trip along a tributaryof the Allegheny River, stopping at islands and sandbars to search for aquatic life.
- -Bird Tracks: an excursion to Carnegie Museum ofNatural History's Powdermill Nature Reserve, thelargest inland bird banding cent-r in the countryto examine the ecology of the area.
- -Tales Fossils Tell: a fossil collecting trip tosites close to Pittsburgh plus a special tour of adeep coal mine to examine the geological formationof the area.
- -Life on the PeniF-scia: an overnight trip to PresqueIsle State Park, in Erie, Pennsylvania, and nearbyWatsburg and Titus Bogs to examine the unique floraand fauna of each area and to view successionalchanges.
46
7fi
--A Day at Bear Run: a program centering on theWestern Pennsylvania Conservancy's property at BearRun and Fallingwater, and why these are protectedas reserves.
--The End of the Glaciers: a trip to several sitesnear the end moraine of the Wisconsin glacier inPennsylvania to examine how the glaciers shaped thetopography of the region.
--Farms of Pittsburgh: a cooperative program with theAllegheny County Cooperative Extension Service tolook at farms and agricultural problems nearPittsburgh.
Out of Doors Days Survey Instrument
At the conclusion of each field trip, participants, includingchildren, were asked to complete a 14-item questionnaire.These included: original source of information, participationin previous trips, reasons for participation, strong and weakpoints of the program, value of the Thursday nightintroductory workshop, effect of gasoline shortages andprices on interest in series, membership in sponsoringorganizations, participation in other museum programs, numberof annual visits to the museum, age, occupation, and distancetraveled to the museum. Questionnaires were distributedduring the return trip and collected upon arrival at themuseum. Data was tabulated and analyzed utilizing theStatistical Package for Social Sciences (SPSS) Subprograms:Frequencies, Pearson Corr, and Crosstabs.
Description of Participants
Our analysis indicates that 64.4 percent of field tripparticipants were members of Carnegie Institute and 17percent were members of the Western Pennsylvania Conservancy?21.7 percent were members of both organizations. However,59.9 percent had not participated in any other educationalprogram of the Institute. Almost all (99.2 percent) of theparticipants indicated they enjoyed the field trips although15.3 percent noted that the programs were different from whatthey had expected.
Participants' ages ranged from 5 to 75, although some fieldtrips had minimum age requirements. Participants under 20years formed 16.4 percent of the population, while 54.3percent were more than 40 years of age. Senior citizens(people over 60 years) constituted 22.9 percent of the group.
Participants' occupations ran the gamut of student throughretiree. Students and individuals employed in educationaccounted for 39.1 percent of the participants. Blue collarworkers accounted for 1.8 percent of the population.Participants' occupations are summarized in Table 1.
TABLE 1: PARTICIPANTS' OCCUPATIONS
Occupation Percent (%)
Student 22.2
Homemaker 11.6
Clerical 4.9
Blue Collar 1.8
Business 8.9
Science/Technology 11.6
Education 16.9
Retired 14.7
Other 7.6
N = 253
Our findings indicate that nearly one-half of the programparticipants first heard about Out of Doors Days througheither the program brochure or Carnegie Magazine, bothpublished by Carnegie Institute. An unexpectedly largepercentage (28.1 percent) first obtained information throughword of mouth. Participant sources of information aresummarized in Table 2.
Because of the current energy situation, two questions wereasked concerning the impact of gasoline shortages onparticipation in the field trip series. Difficulties inobtaining gasoline had affected the summer traveling plans of38.4 percent' of the participants and 33.8 percent indicatedthat their interest qim Out of Doors Days had been affected bythese shortages. Despite this concern, one-third of theparticipants +-raveled ten or more miles to the field tripstarting point. Another third traveled five to ten miles.
48
72
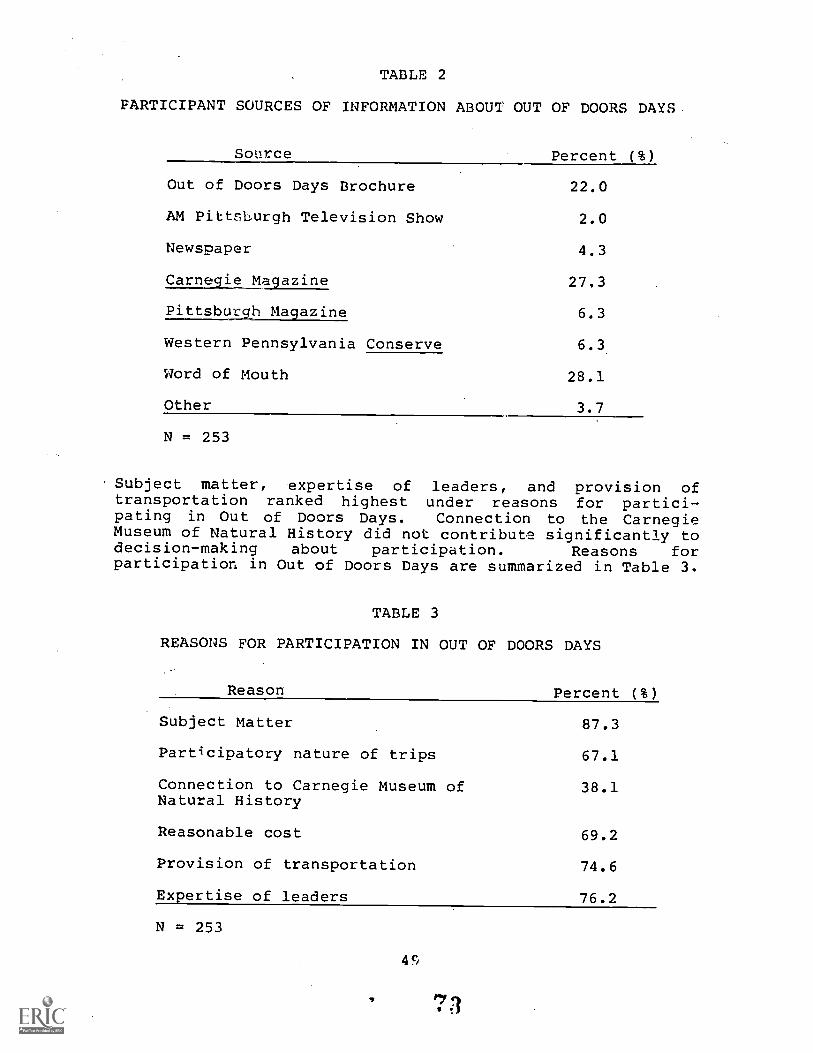
TABLE 2
PARTICIPANT SOURCES OF INFORMATION ABOUT OUT OF DOORS DAYS.
Source Percent (%)
Out of Doors Days Brochure 22.0
AM Pittsburgh Television Show 2.0
Newspaper 4.3
Carnegie Magazine 27.3
Pittsburgh Magazine 6.3
Western Pennsylvania Conserve 6.3
Word of Mouth 28.1
Other 3.7
N = 253
Subject matter, expertise of leaders, and provision oftransportation ranked highest under reasons for partici-pating in Out of Doors Days. Connection to the CarnegieMuseum of Natural History did not contribute significantly todecision-making about participation. Reasons forparticipation in Out of Doors Days are summarized in Table 3.
TABLE 3
REASONS FOR PARTICIPATION IN OUT OF DOORS DAYS
Reason Percent (%)
Subject Matter
Participatory nature of trips
Connection to Carnegie Museum ofNatural History
Reasonable cost
Provision of transportation
Expertise of leaders
N = 253
73
87.3
67.1
38.1
69.2
74.6
76.2
Conclusions
From our analysis, we conclude:
--membership magazines and direct mail are moreeffective than the broadcast media and generalprint media in publicizing the field trip series.More than half of the participants were informedby the first two.
--once people participate, they tend to participateagain and subject matter and leadership expertiseare the major reasons given for participation.These "content" reasons are then followed by thelogistical ones: provision of transportationand reasonable cost.
--the value of the evening introductory workshoptended to vary as to the background and abilityof the presentor. The interest and enjoymentlevels indicated by the participants remainedfairly consistent over all the field trips.Their opinions of the Thursday night workshopvaried greatly.
--the majority of the audience for the field tripswere over 40 years old and lived within ten milesof Carnegie Institute.
Implications
The study has several implications for similar programs oreducators contemplating such program development.
--an audience can be found in urban, maturepopulations.
Programs and activities geared primarily for youthfulaudiences may find increased participation if modified forthis older audience.
--people who are members of the educational institutionsponsoring a program tend to be more likely to participate inthe program. Members participated in more educationalofferings of the Carnegie Institute than did non-members.Similar institutions might utilize membership as majorsources of program participation, or use specific programs asincentives for increasing membership. Significantly,non-members tended to learn first about the field trip seriesthrough word of mouth.
50
74
REFERENCES
Dale, Edgar. 1969. Audiovisual Methods in Teaching, thirdedition. Hindsdale, IL: Dryden Press, Inc.
Peterson, Ric".,ard E. "A Conceptual Framework." MuseumNews 56(5): 18-20, May/June 1978.
Peterson, R. E.; K. P. Cross; S. A. Powell; T. W. Hartle;M. A. Kutner. 1978. Toward Lifelong Learning inAmerica: A Sourcebook for Planners. Berkeley, CA:Educational Testing Service,
51
75
THE OHIO STATE-YOUTH CONSERVATION CORPS EXPERIENCE
Robert D. Townsendland
Robert E. Roth2
During the summer of 1979, The Ohio State University's Schoolof Natural Resources joined with The Ohio Department ofNatural Resources to conduct an eight-week, residential YouthConservation Corps (YCC) Program at the 1300-acre BarnebeyCenter for Environmental Studies, located near Lancaster,Ohio. This event marked the first time R residential campwas established on a university-owned _acidity for thepurpose of making improvements to that facility.
The program consisted of two, four-week sessions. Personnelrepresenting three School of Natural Resources divisions wereselected as staff. University faculty members from all thedivisions visited the facility during the summer and providedthe technical expertise.
Forty-eight teenagers (ages 15-18), randomly selected fromthroughout the state and representing 28 of Ohio's counties,participated in the two sessions of this work, earn, andlearn program. A majority of the campers (72.7 percent) werefrom cities of more than 100,000 people. Minoritiesaccounted for 13.6 percent of the total and 52.7 percent ofthe campers were male. The mean age of the campers was 16.1years.
The majority of the work sites were located on the BarnebeyCenter facility. Projects involved campers in a variety ofconservation-related activities, some of which helped improveand maintain the Center for Environmental Studies. Workprojects were selected from a ranked list of tasks, involvinginput from all the division chairmen within the School ofNatural Resources.
The teenagers participating in the program were energetic,enthusiastic, and extremely competent in performing thelabor-intensive duties assigned them during the four-day workweek. Timber stand improvement, wildlife habitatimprovement, and trail reconstruction and maintenance were
lERIC/SMEAC, 1200 Chambers Road, Columbus, OH 43212.
2Division of Environmental Education, 246 Lord Hall, TheOhio State University, Columbus, OH 43210.
52
76
interrelated, ongoing projects throughout the summer. Otherimprovements to the Barnebey Center facility included: fenceconstruction around the sewage treatment plant, painting,spring development, service road improvement, bridgeconstruction, erosion prevention measures, prairiemaintenance, and litter clean-up. The estimated value ofthese services totaled $46,400. Public service work projectswere conducted for the Ohio Division of Natural Areas andPreserves and the City of Lancaster Parks and RecreationDepartment. Activities included trail maintenance, fenceconstruction, and work on a demonstration model solar home;the campers not only made a contribution to the constructionof the solar facility but they learned about the practicaluse of geo-solar energy.
Locating a YCC program at the Barnebey Center provided aunique educational experience for many campers. The Centeris located two miles from the nearest paved road, and it ispossible to go for hours without hearing the sound of anautomobile. Environmental education experience wascontinuously occurring and spontaneous. Deer, wild turkey,ruffed grouse, and a variety of other wildlife inhabit thearea. "Teachable moments" 'seemed to occur almost all thetime. Formal environmental education was provided on thesite of each job, in evening programs, and on weekend fieldtrips. Campers visited operating strip mines, Indian mounds,state parks, and museums. Care was taken to include the stateand local history and culture of the area into theenvironmental education curriculum, drawing upon localresidents as resource people. Activities conducted onsiteincluded stream and pond studies, a forest-plot study,orienteering, small mammal trapping (all were released), andgeology studies. (Interested individuals may obtain copiesof the "environmental awareness scorecard" and environmentaleducatipn curriculum outline by writing to the authors.)
At the conclusion of each session, campers were asked tocomplete an End-of-Camp Questionnaire to provide backgroundinformation on selected demographic variables and to assesscamper attitudes toward the work program, the environmentaleducation program, the program staff, and the facility.Participation in this activity was voluntary but all camperscompleted the evaluation form.
Analysis of the data provided by this questionnaire yield thefollowing findings:
--With respect to their overall feeling about the YCCsummer experience, an overwhelming majority of theparticipants (92.7 percent) awarded the program thehighest possible rating.
53
77

--Over half of the campers indicated that they desiredto seek natural resource-related careers. Fortypercent indicated they will attend Ohio State.
--Members of minority groups felt less positive abouttheir YCC experience, and indicated that theylearned less about the environment than non-minoritygroup members.
--Older campers exhibited a more positive feeling aboutthe YCC experience.
--Campers from large population centers tended to feelmore positive about the usefulness of what theylearned in their home environment than did campersfrom rural areas.
The future of the Barn bey Center YCC Program looks bright.Robert W. Dick, Program Specialist to the Regional Directorof Region VI Youth Conservation Corps Programs, in an onsiteevaluation stated, "The Barnebey Center Program was the bestcamp I have visited in the Region--a truly outstanding camp."Dan Atzenhoef.fer, YCC Program Manager-Ohio, states, "TheBarnebey operation was a great one. I look forward to itscontinuance and expansion in 1980." The Barnebey YCC Programprovided the unique opportunity for the University, TheSchool of Natural Resources, and the Ohio Department ofNatural Resources to cooperate in the development of aresidential educational experience that can serve as a modelfor others around the nation. The effort continues. In spiteof inflation, budget cutbacks, and program curtailment at thestate and federal level, the Barnebey Center YCC Program hasbeen funded for the summer of 1980.
54
78
SECTION II:RESEARCH AND EVALUATION -
REFEREED PAPERS
SECTION II: RESEARCH AND EVALUATION - REFEREED PAPERS
The twenty-two papers which comprise this section areorganized within six categories. Categories contain as manyas seven essays, as few as one. All of the essays attempt toreflect on problems and issues deemed significant toenvironmental researchers and educators. These essays drawupon existing scholarship and many are based upon thefindings of new and original research. The scope anddiversity of the material contained within this section isindicative of the broad range of interests contained underthe environmental education/ environmental studies umbrella.At the same time, although the depth of analysis varies,these essays underscore the high level of professionalattention to inherently interdisciplinary problems which mustbe faced if they are to be solved, and which must be solvedif the human enterprise is to survive.
57/ 58.
80
ENERGY AND TRANSPORTATION
John H. Baldwin, ENERGY AND THE ENVIRONMENT IN THE 1980s.
Toufiq A. Siddiqi, ENERGY POLICY ISSUES AND THE ENVIRONMENTALAGENDA FOR THE 1980s.
Kevin C. Gottlieb, THE ENERGY-ENVIRONMENT CONUNDRUM: A VIEWFROM THE CONGRESS.
J. Edward Anderson, DESIGNING TRANSIT TO MINIMIZE URBAN COSTSAND ENERGY AND ENERGY USE.
Gene Bammel and Lei Lane Burrus-Bammel, ANALYSIS OFMORGANTOWN'S PERSONAL RAPID TRANSIT SYSTEM.
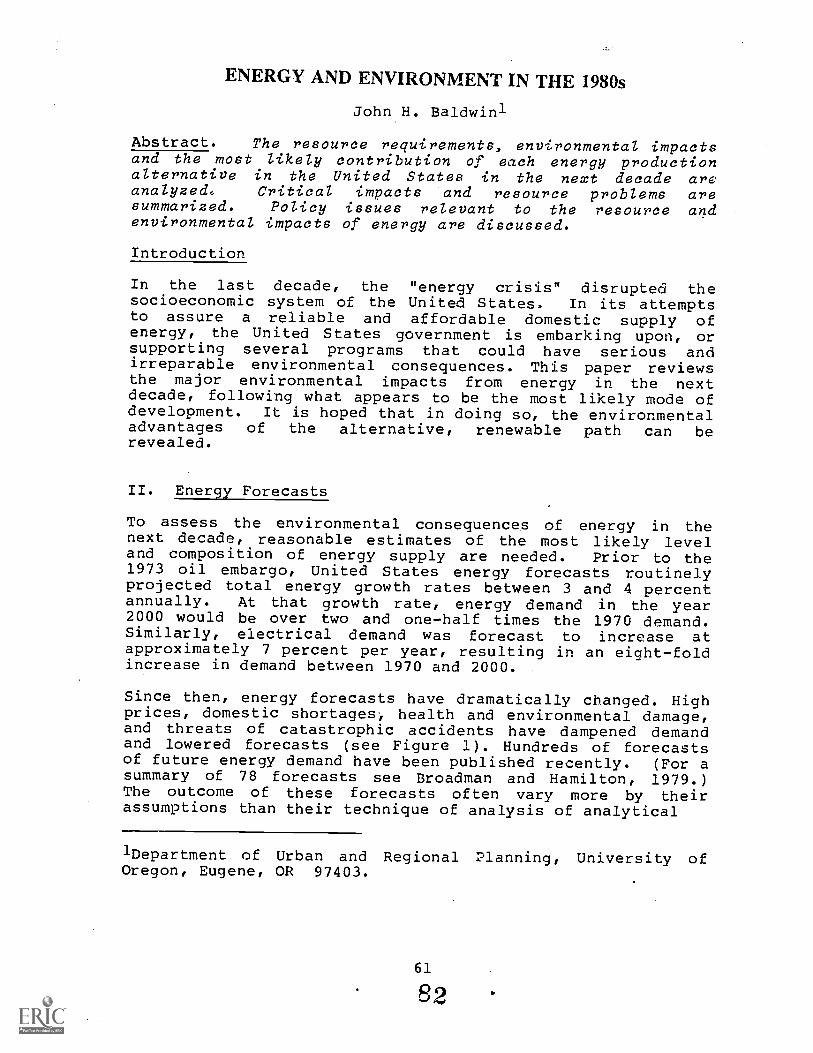
ENERGY AND ENVIRONMENT IN THE 1980s
John H. Baldwinl
Abstract. The resource requirements, environmental impactsand the most likely contribution of each energy productionalternative in the United States in the next decade areanalyzed. Critical impacts and resource problems aresummarized. Policy issues relevant to the resource andenvironmental impacts of energy are discussed.
Introduction
In the last decade, the "energy crisis" disrupted thesocioeconomic system of the United States. In its attemptsto assure a reliable and affordable domestic supply ofenergy, the United States government is embarking upon, orsupporting several programs that could have serious andirreparable environmental consequences. This paper reviewsthe major environmental impacts from energy in the nextdecade, following what appears to be the most likely mode ofdevelopment. It is hoped that in doing so, the environmentaladvantages of the alternative, renewable path can berevealed.
II. Energy Forecasts
To assess the environmental consequences of energy in thenext decade, reasonable estimates of the most likely leveland composition of energy supply are needed. Prior to the1973 oil embargo, United States energy forecasts routinelyprojected total energy growth rates between 3 and 4 percentannually. At that growth rate, energy demand in the year2000 would be over two and one-half times the 1970 demand.Similarly, electrical demand was forecast to increase atapproximately 7 percent per year, resulting in an eight-foldincrease in demand between 1970 and 2000.
Since then, energy forecasts have dramatically changed. Highprices, domestic shortages, health and environmental damage,and threats of catastrophic accidents have dampened demandand lowered forecasts (see Figure 1). Hundreds of forecastsof future energy demand have been published recently. (For asummary of 78 forecasts see Broadman and Hamilton, 1979.)The outcome of these forecasts often vary more by theirassumptions than their technique of analysis of analytical
1Department of Urban and Regional Planning, University ofOregon, Eugene, OR 97403.
61
82
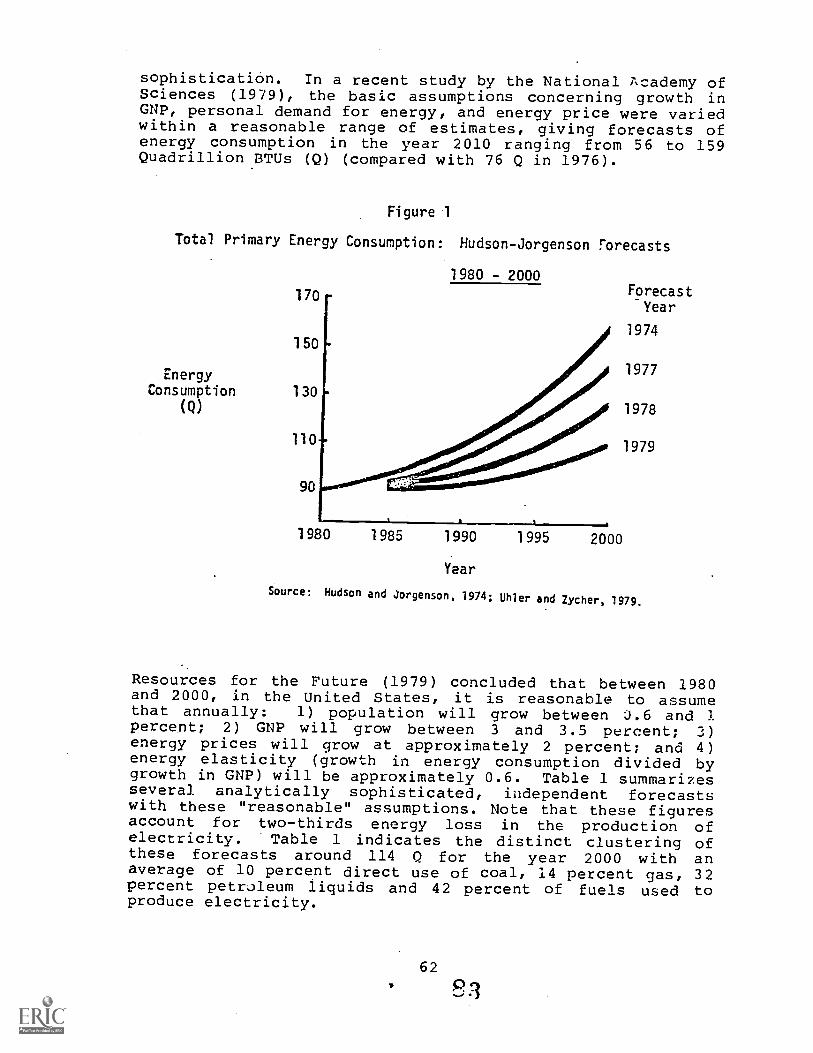
sophistication. In a recent study by the National Academy ofSciences (1979), the basic assumptions concerning growth inGNP, personal demand for energy, and energy price were variedwithin a reasonable range of estimates, giving forecasts ofenergy consumption in the year 2010 ranging from 56 to 159Quadrillion BTUs (Q) (compared with 76 Q in 1976).
Figure 1
Total Primary Energy Consumption: Hudson-Jorgenson Forecasts
170
150
EnergyConsumption 130
(Q)
110
90
1980
1980 - 2000
1985 1990
Year
1995 2000
ForecastYear
1974
1977
1978
1979
Source: Hudson and Jorgenson, 1974; Uhler and Zycher, 1979.
Resources for the Future (1979) concluded that between 1980and 2000, in the United States, it is reasonable to assumethat annually: 1) population will grow between 0.6 and 1percent; 2) GNP will grow between 3 and 3.5 percent; 3)energy prices will grow at approximately 2 percent; and 4)energy elasticity (growth in energy consumption divided bygrowth in GNP) will be approximately 0.6. Table 1 summarizesseveral analytically sophisticated, independent forecastswith these "reasonable" assumptions. Note that these figuresaccount for two-thirds energy loss in the production ofelectricity. Table 1 indicates the distinct clustering ofthese forecasts around 114 Q for the year 2000 with anaverage of 10 percent direct use of coal, 14 percent gas, 32percent petroleum liquids and 42 percent of fuels used toproduce electricity.
62
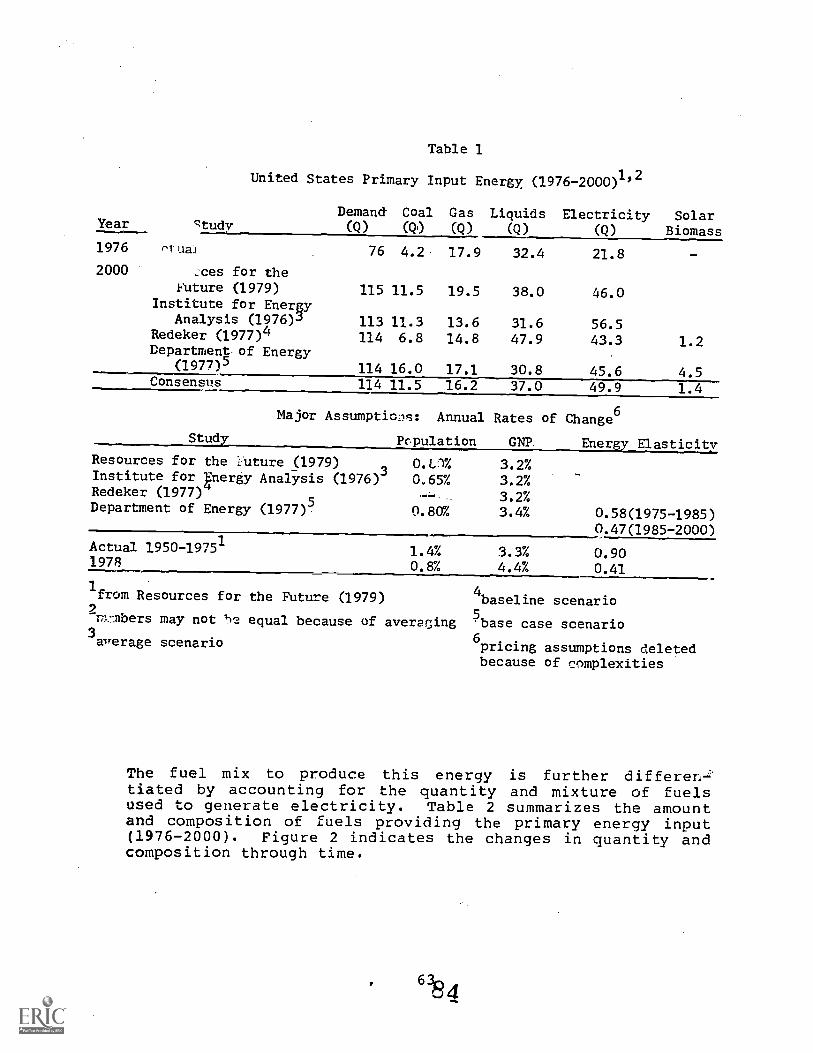
Year
Table 1
United States Primary Input Energy (1976-2000)1'2
Demand Coal Gas Liquids Electricity Solarstudy (Q) (Q) (Q) (Q) (Q) Biomass
1976 r'1 ual 76 4,2 17.9 32.4 21.82000 .ces for the
future (1979) 115 11.5 19.5 38.0 46.0Institute for Energy
Analysis (1976)3 113 11.3 13.6 31.6 56.5Redeker (1977)4 114 6.8 14.8 47.9 43.3 1.2Department of Energy
(1977)5 114 16.0 17.1 30.8 45.6 4.5Consensus 114 11.5 16.2 37.0 49.9 1.4
Major Assumptions: Annual Rates of Change6
Stud Population GNP. Ener: ElasticityResources for the 1-nture (1979)Institute for plergy Analysis (1976)3
Redeker (1977)Department of Energy (1977)5
0.0%0.65%
0.80%
3.2%3.2%3.2%3.4%
Actual 1950-19751
1978
1from Resources for the Future (1979)
1.4%0.8%
0.58(1975-1985)0.47(1985-2000)
3.3% 0.904.4% 0.41
n:l.mbers may not '12 equal because of averaging3average scenario
4baseline scenario
5.base case scenario6pricing assumptions deletedbecause of complexities
The fuel mix to produce this energy is further differen-:'tiated by accounting for the quantity and mixture of fuelsused to generate electricity. Table 2 summarizes the amountand composition of fuels providing the primary energy input(1976-2000). Figure 2 indicates the changes in quantity andcomposition through time.
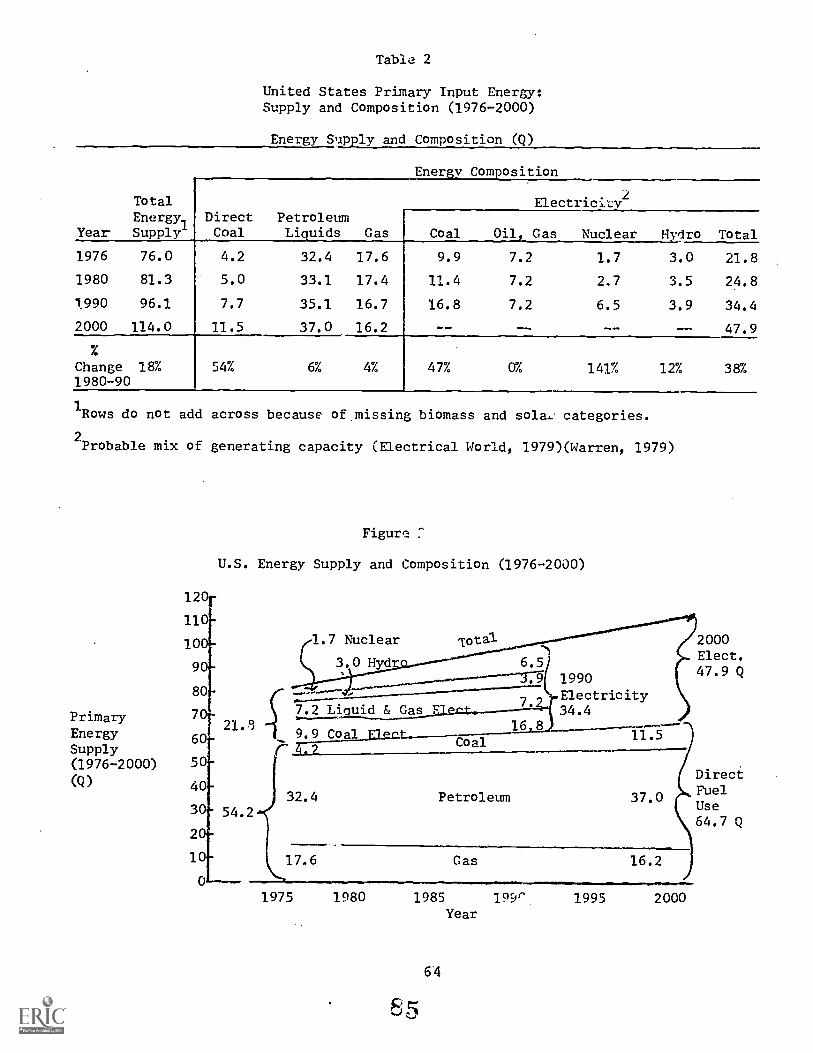
Table 2
United States Primary Input Energy:Supply and Composition (1976-2000)
Energy Supply and Composition (Q)
Ener v Com osition
Year
TotalEnergySupply
1976 76.0
1980 81.3
1990 96.1
2000 114.0
Change 18%1980-90
DirectCoal
PetroleumLiquids Gas
2Electricity
Coal Oil, Gas Nuclear Hydro Total
4.2 32.4 17.6 9.9 7.2 1.7 3.0 21.8
5.0 33.1 17.4 11.4 7.2 2,7 3.5 24.8
7.7 35.1 16.7 16.8 7.2 6.5 3.9 34.4
11.5 37.0 16.2 47.9
54% 6% 4% 47% 0% 141% 12% 38%
1Rows do not add across because of missing biomass and solace categories.
2Probable mix of generating capacity (Electrical World, 1979)(Warren, 1979)
PrimaryEnergySupply(1976-2000)(Q)
1201
11
10
9
80
7
60
50
40
30
2
10
Figure
U.S. Energy Supply and Composition (1976-2000)
1.7 Nuclear Total
19903.0 Hyd
Electricity7.2 Li uad&Cas 5 7.
3.er=_-___ 34.421.9 16 8
9.9 CoalCoal
Petroleum
17.6 Gas
1975 1980 1985 199rYear
856.4
1995 2000
2000Elect.47.9 Q
DirectFuelUse64.7 Q
The changing composition of energy supply is important inassessing the environmental effects from energy in the nextdecade. The predicted sustained supply of petroleum throughthe year 2000 reflects optimism about new discoveries,secondary production techniques, and coal liqueficationprograms. Natural gas supplies will be declining throughoutthe decade by approximately one-half of. 1 percent per year.Conversely, coal use, for power and heat, or for conversionto electricity, will increase 83 percent and 70 percent,respectively, above the 1976 levels of consumption. Two 1978federal laws, the Power Plant and Industrial Use Act and theEnergy Tax Act, were passed to prevent the use of oil andnatural gas in industrial boilers and electrical generation,and to stimulate the use of coal for such purposes (CEQ,1(.379). The increase of nuclear-produced electricity from 1.7Q in 1976 to approximately 6.5 Q in 1990 represents thecompletion and operation of approximately 80 percent of thenuclear capacity currently under construction or on liner
Some may question the continued growth in the supply ofelectricity. Much of the capacity that will provide thatgrowth in the next decade is currently in the final planningstages or under construction. However, the high costs ofelectricity will continue to dampen demand. The resultantavailability of electricity could provide the electricitynecessary to overcome the high front end energy requirementsof a developing solar industry (see Whipple, 1980).
III. Environmental Impacts in the 1980s
A. Petroleum and Natural Gas
To maintain domestic production of petroleum and natural gas,offshore and remote exploratory drilling and the use ofsecondary production techniques must be increased, along withthe development of an oil shale industry (Hayes, 1979).
Future offshore exploratory drilling in areas such as theGeorges Bank, Baltimore Canyon, Blake Plateau and the FloridaEmbayment has become a primary focus of environ mentalconcern. The conflict over drilling in the Georges Banks(which yield 15 percent of the world's fish protein) isindicative of many in the next decades. Although drilling inthe BIltimore Canyon and the North Eastern Gulf of Alaska hasbeen disappointing to date, the Department of Energyestimates that between 1977 and 1990, outer continental shelf(OCS) petroleum production will increase from 0.8 to 1.8million barrels per day, with gas production declining slowly(CEQ, 1979).
65
66
Catastrophic oil spills such as the one in the Bay ofCampeche in 1979 appear to be the major environmentalconcern. However, the consequences of chronic, low-levelcontamination are poorly studied and may have the mostserious consequences to marine and estuery ecosystems.Onshore support facilities (storage tanks, pipelines,refineries, etc.) must be properly planned to preventunnecessary coastal damage.
In August 1977, the U.S. Department of the Interior (USDI)released a revised schedule for OCS oil and gas lease sales.Sales were limited -to five frontier leases per year with noadditional sales in that geologic region for the followingthree years. This new policy was implemented to provideadequate time for environmental planning (required by the1978 NEPA amendments) to prevent boom and bust cycles (CEQ,1978).
Additional onshore natural gas production may come from tightsandstones, Dovonian shales, and geopressurized zones alongthe Gulf Coast. The tight sandstones, found in westernbasins, represent only a modest resource base, are fairlydispersed and under very low pressure, making developmentdifficult. The geopressurized zones _off the Gulf Coastrepresent an unknown resource. Formidable pumping and brinedisposal problems may inhibit development (Hayes, 1979) (CEQ,1979).
B. Oil Shale
The Green River Formation that underlies Colorado, Utah andWyoming contains an estimated 2 trillion barrels of petroleumequivalent in oil shale deposits. For each barrel of oilproduced, 1 ton of shale is mined and heated to 500°C, thendiscarded as slag. The maximum production envisioned isapproximately 1 million barrels per day (compared withcurrent U.S. consumption of 20 million barrels per day) bythe year 2000 (Hutchinson, 1979). This goal will be verydifficult to achieve, however, because of severeenvironmental and socioeconomic impacts from the industry andthe presence of a large work force in an arid, remote area (a1-million-barrel ocr day industry in 2000 would require adirect and indirect labor force of 200,000)(Chappell, 1979).
High air pollution levels already 4xist periodically in thePiceance Basin of Colorado, Lhe area in which initialdevelopment- will occur. Additional pollution (particulates,nonmethane hydrocarbons ar4 sulfur dioxide) from even amodest industry would cause frequent violations of airquality standards. In .addition, significant emissions ofmercury, cadmium, selinium, and arsenic would occur if notproperly controlled (Chappell, 1979).
Water quality problems include waste water produced byretorting (1.2 to 3.6 gallons per ton), increased salinity inthe White and Colorado Rivers, and leaching of trace elementsfrom the shale and slag into surface and aquifer waters.Between 0.85 and 2.5 barrels of water are required to produceone barrel of oil. This water requirement: is often referredto as a limiting factor in the basin. However, a recentColorado Department of Natural Resources (1979) studyconcluded that sufficient water is available to the basin tosupport a onemillion-barrel-per-day industry. Conflicts ofwater quality, water rights, forests and wildlife, may,however, restrict the availability of water to the industry.
The solid waste from an oil shale industry would likely bedisposed of on the surface rather than returned to mines. Inprocessing, a ton of shale yields three-fourths of a ton ofslag, which is 20 percent greater in volume than the originalshale. The favored method of disposal is to pile the slag in1000-acre piles 200 feet high, provide a soil cover andrevegetate. One such pile would be produced each year from amillion-barrel-per-day industry. Because of the toxic natureof the slag, the long-term environmental hazards anddisruption of land could be significant (Chappell, 1979).
In summary, the environmental effects of a surface oil shaleindustry are sufficiently damaging to warrant adeitionalresearch into cleaner in-situ processes and alternativemethods of slag disposal. If an industry develops, greatcare must be taken to control water, air and solid wastepollution.
C. Coal
According to the previous analysis, coal production willlikely increase by approximately 74 percent in the nextdecade. It is anticipated that little, if any, coal will beconsumed in the 1980s for large-scale coal gasification orliquefaction programs. However, in the 1990s, with heavysubsidies, coal liquefaction facilities could beginproduction.
1. Coal Mining
Leasing Federal Lands. On June 4, 1979, the UnitedStates Department of the Interior announced its new coalleasing program, li_ting the moratorium in the leasing offederal lands for coal mining that had been in existencesince 1971. The new leasing program, scheduled to be fullyoperational in 1985, establishes procedures for screening andprioritizing suitable lands, chooses and evaluates theperformances of contractors, and establishes procedures forthe issuance, monitoring, and enforcement of leases (CEO,1979). If the production of coal is to nearly double in this
67
88
decade, substantial growth in the industry and its supportindustries will be necessary. Approximately 250 new largemines must be opened (41 per year average), and greater than150,000 new miners must be recruited and trained (Miller,1979).
Underground Mining. Undergrouni mining presents threemajor problems: acid mine drainage, subsidence, and mostimportantly, worker health and safety. Since 1900, more than100,000 miners have been killed and aver 1 million have beeninjured or prematurely disabled (CEO, 1979). Although thefrequency of accidents is decreasing per unit output, thecoal mining industry has more than twice the disability daysper million employee hours worked than such high-injuryindustries as metal milling, construction, wood products andprimary metals. Although coal mining in general ishazardous, surface mines are safer and the majority of futuremining will be surface mines in the West and Midwest. Thesafety records of individual mines varies widely, indicatingthat health and safety can be substantially improved. In1972-73, the underground mining rate of injury averaged 50.2per million man-hours with a range of 5.3 to 115. The lowfigure of 5.3 compares very favorably with retail trade(11.3), real estate (11.4) ana higher education (7.4) (TheFord Foundation, 1974).
In an attempt to reduce mine hazards, the federal governmentpassed the 1969 Coal Mine Health and Safety Act. Thislegislation provided benefits for Black Lung victims. Thereare currently over 100,000 cases of pneuir coniosis in theUnited States, with approximately three to four thousanddeaths a year attributed to it. The Act also set standardsfor coal dust levels in the mines. The Federal Mine Safetyand Health Amendments Act (1977) brought all 20,000 minesafety programs under the jurisdiction of the Department ofLabor's Mine Safety and Health Administration. The Acttightend standards, increased the number of annualinspections, required miner training, and established minerescue procedures.
To date, two million areas in the United States have beenaffected by subsidence. The Department of Energy estimatesanother 2.5 million acres will suffer damage in the next twodecades. Procedures to monitor, prevent, and control damagefrom subsidence are now being developed by the Department ofEnergy.
Surface Mining. The scarring of Appalachia, where morethan half of the surface mining has occurred, is a testamentto corporate neglect and ineffective regulatory efforts.Over 13 million acres of land have been disrupted by surfacemining, with approximately 50 percent reclaimed. By the year2000, an additional 15 million acres of land will be stripmined. Much of this will occur on federal lands in the arid
68
89
West. This amounts to a land area equivalent to the combinedareas of Connecticut, Delaware, New Hampshire, Rhode Island,New Jersey, W2rmont, and Washington, D.C. (Miller, _9,79).
Low sulfur Western coals represent 40 percent of the nation'scoal supply (77 percent of the economically strippable coal)and are in great demand. Some areas in the West are so drythey could not be reclaimed (National Academy of Sciences,1974). Others could be reclaimed, but only after anintensive, coordinated, long-term effort. Reclamation, wherefeasible, would add only a few cents per ton to the price ofcoal. The key issue is water. Even without coal or shalemining, water resource inventories in many areas of the Westare dropping. Large mining concerns could seriously disruptthe current balance of water resource allocation. Surfacedrainage and leaching from mines into aquifers couldcontaminate water systems.
Water Quality. The U.S. Department of Energy estimatesthat 6,900 miles of Appalachian streams are polluted by acidmine drainage (13,000 miles in the United States). Over 80percent of the acids (8,000 pounds per day) come fromabandoned underground mines. These acids cause an estimated$2 million damage annually to streams and river basins.Abatement costs are very high ($6.6 billion) and cleanup ofthe old mines difficult. Additional problems can beprevented, but the probability of cleanup of existing ones isrelatively low.
Mine Wastes. Approximately one-fourth of the coalextracted is rejected as waste. There currently exist about3 billion tons of waste in an estimated 3,000 to 5,000sizable waste piles. About half of the ,caste pilescontribute to water quality problems with 7. percent of themine acid pollution and significant siltation problemsresulting from the waste.
Legislation. The 1977 Surface Mining Control andReclamation Act established a national program to protect thepublic and the environment from the adverse effects of coalmining. The Act: 1) prohibits mining where reclamation isnot feasible, 2) insures that reclamation occurs concurrentlywith mining, 3) balances coal production with agriculturaland other environmental considerations, 4) assists states inestablishing regulation and enforcement programs, 5)establishes procedures to reclaim previously damaged land,and 6) provides procedures for public participation indeveloping regulations, standards, and programs under theAct. This Act will continue to face many challenges inCongress and the Courts. If the coal industry is to developin the West, the purpose and intent of the new federal landleasing program and the 1977 Land Reclamation Act must bestrictly enforced (CEQ, 1979).
69
cjn

2. Coal Combustion
Coal is the most polluting fossil fuel. Combustion of coalproduces emissions of trace metals such as cadmium, mercury,nickel, beryllium, arsenic, and selenium which arepotentially toxic to living fol.',1s. The combustion of coalalso emits radioactive substances, nitrous oxides, sulfur)xides, particulates, and carbon dioxides. The sulfur
.emissions form biologically active sulfate compounds thatattack lung and other sensitive tissues. They also combinewith atmospheric moisture to form acid rain. The particulateemissions, especially the submicron particles that escapecurrent precipitator emission control devices, pass throughthe natural filters of the respiratory system and lodge deepin the lungs where they cause a number of respiratoryailments (CEQ, 1979). These submicron particles often travelgreat distances in the atmosphere before settling out, andoften carry toxic trace metals, sulfates, or gases to thelungs. Considerable work is needed on the effects andcontrol of submicron particulates.
The buildup of carbon dioxide in the atmosphere fromcontinued fossil fuel combustion represents a significantlong-term hazard to climatic modification (discussed later).The fly ash from combustion must also be- carefully handledbecause of traces of many toxic elements (Miller, 1979).
Today, approximately 74 percent of the largest 623 coalcombustion plants comply with sulfur oxide emissionsstandards, and only 62 percent comply with particulateemissions standards. The environmental acceptability of coalcombristion could be improved by greater regulatory complianceand the utilization of state-of-the-art pollution controltechnologies.
3. Synfuels
On July 15, 1979, President Carter proposed an $88 billionprogram to develop a synthetic fuels industry. The goal ofthe program is to produce 2 million barrels of oil per day,by 1990. The program is to be funded from the recentlyapproved Windfall Profits Tax and managed by aCongressionally chartered Energy Security Corporation whichcould provide loans, make purchase agreements, or guaranteeprices or loans (CEQ, 1979).
The potential environmental risks from the synfuels programare great (Nadis, 1979). The major impacts from coalgasification and liquefaction are: 1) carcinogenic organiccompounds in products, by-products, and emissions, 2) toxic
70
trace elements in emissions, products and by-products, 3)solid-waste disposal of toxic, mutagenic, or carcinogeniccompounds, 4) water pollution from mines and processing, and5) significant land and water requiz4ments.
When the Institute, West Virginia synfuels facility (inoperation between 1952 and 1959) closed, the 359 plantworkers displayed an incidence of skin cancer 16 times thatfrom normal occupational exposures. More than 200 industrialchemicals were identified in by-products, several wereextremely carcinogenic aromatic hydrocarbons. The mostnotorious of these, 3,4-benzo-(a)pyrene, was the first humancarcinogen discovered (in 1775) (Commoner, l'.79).
Many of these p.,:oblems can be minimized by using state-of-t e-art technologies, recycling water, and using wastetI.?at.ment ponds. All are expensive, creating the temptationto cut corners. The problems of land and water use are alsosignificant. Most of the mining would occur in Montana,North Dakota, and Wyoming where the arid lands are verydifficult, if not impossible, to reclaim. To implement the;President's syn.-eels program would require the stripping, andpossibly the permanent ecological destruction of 2000 squaremiles of land, an area the size of the state of Delaware.Two billion tons of rock and residue would-have to be movedannually, a volume twice that excavated for the Panama Canal(Nadis, 1979).
The synfuels process requires a large volume of water. A1.25-million-barrel-per-day industry would require 188,000acre feet of water per year for mining and processing. Aswith the oil shale industry, problems of availability, waterquality, water rights, etc., may severely restrict the growthof this industry.
Finally, synthetic oil and gas derived from coal add between1.2 and 2.8 times as much CO to the atmosphere/ unit ofthermal energy generated than do conventional fossil fuels.A large synfuels industry could aggrevate the potentialproblems of climate modification.
The crash synfuels program may pose several_pgrious nationalrisks (Science, July 13, 1979 and September 7, 1979). Amongthem are inefficient use ..of capital, inefficient use of landand water, environmental hazards, economic hazards, andmid-program backlash from environmental and socioeconomicdisruptions. It must be questioned whether this is the mostacceptable method of providing approximately 5 -13 percent ofU.S. petroleum consumption. A slower stepped approach wouldallow for the modification or elimination of the program atany stage of development in a manner that would not seriouslydisrupt the U.S. economy shmild insurw intable problemsarise.
D. Nuclear Fission
The status of nuclear power is ono of the most important,complex, and controversial issues facing the United States inthe next decades. In 1973, the Atomic Energy Commissionpredicted that by the year 2000, 1500 nuclear plants woulc besupplying over one-half of U.S. electrical demand totalingone-quarter of total U.S. energy demand. As of 1979, 70plants are on line, producing approximately 13 percent pf ourelectricity (4 percent of all U.S. energy demands). Anadditional 96 units, representing 101,000 MWe are undercons.truction or authorized. However, since 1978, utilitieshave canceled plans for 35 plants and are delayingconstruction on others (CEQ, 1979). Between 1975 and 1979,only seven new nuclear power plants were ordered (Miller,1979). This trend is consistent with this paper's predictionof 6.5 Q for nuclear electricity by the year 1990. Thisestimate could bring on line approximately 40 new plantsthrough 1990, or about orl-half the plants under constructionor authorized. Between 1977 and 1990, uranium mining wouldresult in the production of 300 million tons of radioactivetailings (approximately 130 million tons of radioactivetailings exist today), 24 million cubic feet of low-levelradioactive wastes, and approximately 50,000 tons of spentfuel (Warren, 1979).
The nuclear industry is experiencing difficulty for severalreasons: 1) uncertainty over uranium fuel supply and cost,2) concern over power plant meltdown or sabotage, 3) concernover security of nuclear fuel and waste shipments, 4.) wastestorage problems, 5) nuclear proliferation, 6) spiralingcosts, 7) power plant decommissioning, and 8) the controversyover the health effects of radiation.
High exposures to ionizing radiation can cause acute sicknessor death. A scientific controversy is currently raging overthe effects of chronic, low-level radiation exposures of ahuman population. Studies of the effects of exposure tolow-level radiation are costly and difficult. The latencyperiod between exposure and somatic or genetic effect can bedecades, or span generations, making cause and effect studiesdifficult. Genetic defects and cancer can occur spontaneouslyor have other environmental causes, such as chemicalexposures. Further, the incidence of cancer and geneticdefects is low, requiring a large population sample forstatistical confidence.
72
93
Several controversial reports have recently been publishedindicating that human beings may be more sensitive to lowlevels of radiation than previously predicted. If this istrue, the risks of exposure to even low levels of radiationmay be understated by as much as an order of magnitude (CEQ,1978). A University of Pittsburgh study (Mancuso, et al.,1977) of the incidence of malignancies in workers at theHanford Nuclear Facility found a pronounced increase incancer among workers ages 25-45 at the facility. Otherstudies have found that even at very low levels of radiationexposure, there is a significant risk of increased incidenceof cancer (Najarian and Colton, 1978)(Bross and Natarajan,1972). These studies have been the focus of scientific andpublic debates. The debates center around the statisticaltreatments of the data, epidemiological methodologies,sampled populations, and issues of cause and effect. Furthermedical research on carefully designed, long-termepidemiological studfcs will be necessary to resolve theconflict. Until then, however, unnecessary exposures toman-made sources oi radiation should be limited.
Natural background radiation ranges from 38-150 millirems peryear in the United States. Human activities expose theaverage citizen to an additional radiation dose of about 80to 125 millirems per year, the majority of which (an averageof 72 millirems per person per year) comes from medicalsources. The general population allowable exposure toman-made radiation sources (excluding x-rays) is 70millirems per year. The current allowable occupationalexposure, to 800,000 workers in the United States is 5,000millirems per year. There is considerable pressure in thescientific community to lower these standards. In contrast,a properly functioning nuclear plant and support facilitieswill provide an average 0.06 millirems per year (Miller,1979). Relative to medical exposures this is very little.These figures can be misleading, however, because they areaverage figures and biologically active isotopes may beinvolved. People living near nuclear facilities or nearuranium mines may individually receive significant doses.For instance, residences near uranium mill tailings near SaltLake City receive 400 millirems per year (EPA, 1977).
Greater effort should be directed toward problems incontainment, protection, and disposal of hazardous materialsin the nuclear fuel cycle. Currently, the health andenvironmental impacts from radioactivity are greatest in themining and milling phase of the nuclear fuel cycle.Environmental controls are more extensively used toward theback end of the cycle because .of greater levels ofradioactivity. The deep and open-pit mining of uraniumresults in significant land use, health problems, and airwater impacts. Care must be taken in the mining process to
73
94
ventilate the mines to ride them of high levels -ofcarcinogenic radon, radon daughters, and radioactive dust inthe air.
At present, there are 130 million metric tons of uranium minetailings in the United States, located at 21 active and 21abandoned sites. Unmonitored tailing piles result inunnecessary exposures to the public. Gustafson' (1979)predicted that mining and milling activities through the year2000 will result in approximately ten deaths per year in theUnited States from radiation exposures. Approximately 30,000acres of land will soon be placed off limits to reduce publicexposures.
There are currently no commercial nuclear fuels reprocessingplants in operation in the United States.' Governmentreprocessing facilities, used primarily for weaponsdevelopment, are operating at capacity and cannot acceptmaterials from the nuclear power industry (Miller, 1979). In1977, President Carter slowed attempts to develop commercialreprocessing plants in the United States in an effort toreduce the probability of worldwide proliferation of nuclearweapons. The nuclear industry, therefore, cannot reprocessits fuels and must store spent fuel rods on site for eventualwaste disposal.
In the absence of fuels reprocessing facilities, increasingamounts of spent fuel are being stored on site. Therecurrently exist about 5,000 metric tons of spent fuel. Over50,000 metric tons will require storage by the year 2000.Without a permanent waste repository, many reactors willexceed existing storage capacities in the late 1980s. On-sitecapacity will have to be expanded, and, where permitted bythe NRC, fuel compaction procedures will have to beimplemented. These procedures cannot, and should not beexpanded indefinitely. The buildup of on-site nuclear wastesis hazardous and by 1990 may force the closing of severalnuclear facilities if not remedied.
Industry assurances that the problem of long-term nuclearwaste storage can be solved are disputed by many scientists(Alfvin, 1974; Angiano, 1977; Ehrlich, 1974). This hasstimulated public concern and action to the point of banningconstruction of new nuclear power plants in four states untilacceptable waste disposal programs are demonstrated. In themeantime, the large amounts of nuclear waste from weaponsproduction are awaiting permanent storage. The waste iscurrently stored in temporary underground tanks in governmentfacilities at Idaho Falls, Savanna River, South Carolina andHanford, Washington. The on-site storage areas and thesecentral facilities must be closely guarded and monitored toprevent sabotage and accidental release of highly toxicmaterials (Miller, 1979).
74
The most recently proposed disposal site is near Carlsbad,New Mexico, where the waste would be placed in a dry saltdome about a half mile below the desert surface. Recentgeologic reports, however, question the stability of thesalts when exposed to the high temperature nuclear wastes(Angino, 1977); de Marsily, et al., 1977). Public oppositionto the New Mexico Waste Isolation Pilot Plant (WIPP) isgrowing in New Mexico and other states. By 1978, elevenstates had declared that they would not accept a wastedisposal repository. Fifteen more states are consideringsuch a ban (Fisher, 1978).
In February, 1980, President Carter announced a plan toevaluate 11 sites in 6' states for the permanent disposalsite. Geological and environmental reports are to be issued,on each site, leading to a decision on one site in 1985 withcompletion of the facility between the years 1995 and 2000.
Reactor failure and terrorism could cause a serious incident.The potential for such a catastrophic event, along with theroutine venting of low-level radioactive gases, mandates thatthese plants be sited far from population centers.
E. Renewable Sources of Energy
Renewable energy sources collectively provide approximately 6percent of current U.S. energy needs. The forecast of "mostlikely" energy supply predicts only a nominal contribution ofthese sources in the next two decades. However, a DomesticPolicy Review released by President Carter in 1979 concludedthat 20 percent of U.S. energy needs could be met byrenewables in the year 2000 (CEQ, 1979).
On June 20, 1979, President Carter delivered to Congress anoutline of a national solar strategy to accelerate thecommercialization of renewable energy technologies. A recentstudy of the barriers to commercialization of solar energyindicates that the major barriers are financial andinstitutional, not technical (Armstrong and Armstrong, 1979).Thus, federal, state, and local government policy should bedirected toward removing financial and institutionalbarriers.
The impacts of renewable energy vary with the technology. Thedevelopment of hydroelectric sites has significant impacts onaquatic ecosystems and considerable irreversible landdisruption. The prime hydroelectric sites have already been
75
96
New hydroelectric facilities conflict with the growing demandfor river and canyon recreation. These problems can becircumvented by redeveloping existing, abandoned, orunderused hydroelectric sites. In the United States,approximately 50,000 dams coulc be developed to provide theequivalent electricity of 85 nuclear or coal power plants,with minimal additional negative environmental impacts(Broad, 1978).
If air circulation is not properly engineered, passive solarand energy-efficient buildings may present problems of indoorair pollution (Bossing, 1978). Solar thermal and windsystems have negative indirect impacts from manufacturing andconstruction and present aesthetic problems during operation.Large-scale solar thermal power systems may have significantland use, water use and working fluid hazard problems.
Geothermal systems could present subsidence problems ifwithdrawn fluids are not replaced. Mineralized, salty watermay require treatment. Air pollutants could include hydrogensulfide gas, boron particles, mercury, and- radioactiveradon-222 and radium-226. These problems can be controlledby emission control devices or underground heat exchangesystems (Kruger, 1976; Axtman, 1975).
In agricultural areas or areas of high natural productivity,biomass fuels can be an economical source of energy. However,the combustion of biomass can pose air pollution problems.Biomass combustion emissions are lower in sulfur oxide,particulate and nitrogen oxides than emissions from coal oroil combustion (Holzman, 1978). However, ths) dispersed natureof biomass combustion prevents the use of technologicallyadvanced emissions control devices sim1lar to those used incentralized coal or oil - fired power plants. The net resultcould be greater air pollution from nonpoint sources.
IV. Comparative Impacts
A. Health
Table 3 provides a summary of the comparative health impactsof selected energy alternatives. Nuclear electricity hasless of an impact, in fatalities, than coal or gas electricalgenerating technologies. However, it is significant that thehigher estimate of nuclear overlaps with the other options.
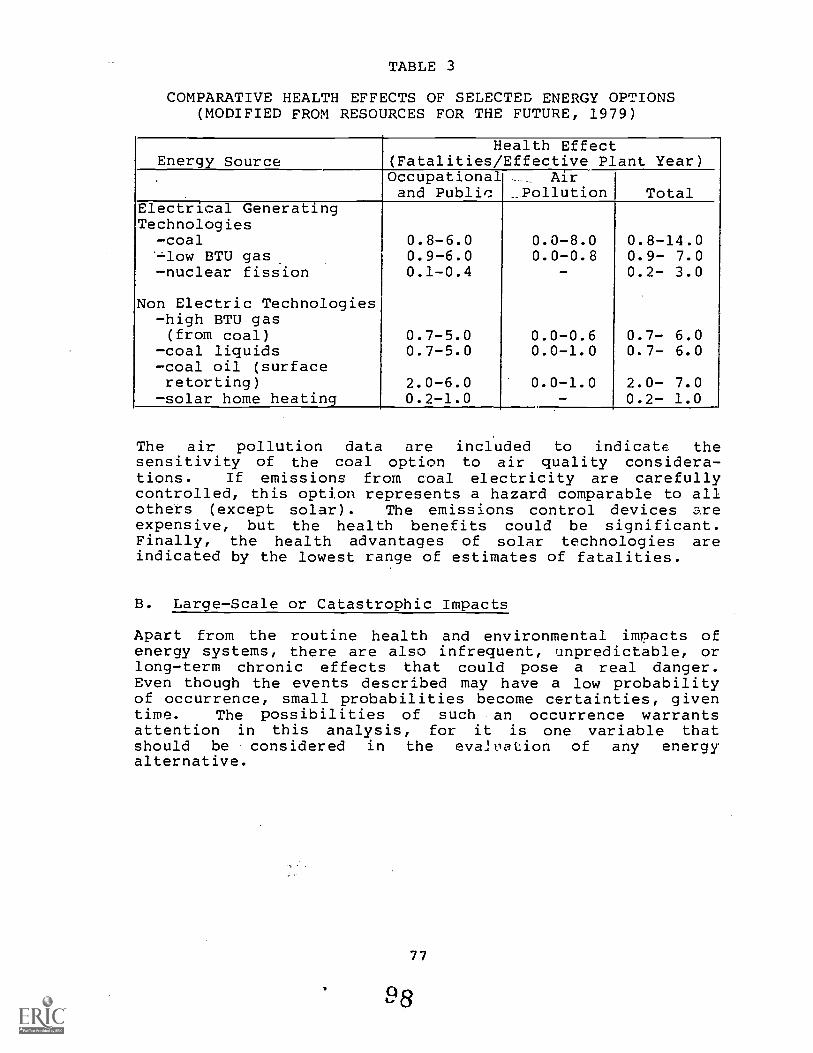
TABLE 3
COMPARATIVE HEALTH EFFECTS OF SELECTED ENERGY OPTIONS(MODIFIED FROM RESOURCES FOR THE FUTURE, 1979)
Energy SourceHealth Effect
(Fatalities/Effective Plant Year), Occupational Air
and Public _Pollution TotalElectrical GeneratingTechnologies
-coal 0.8-6.0 0.0-8.0 0.8-14.0'low BTU gas 0.9-6.0 0.0-0.8 0.9- 7.0-nuclear fission 0.1-0.4 - 0.2- 3.0
Non Electric Technologies-high BTU gas(from coal) 0.7-5.0 0.0-0.6 0.7- 6.0
-coal liquids 0.7-5.0 0.0-1.0 0.7- 6.0-coal oil (surfaceretorting) 2.0-6.0 0.0-1.0 2.0- 7.0
-solar home heating 0.2-1.0 - 0.2- 1.0
The air pollution data are included to indicate thesensitivity of the coal option to air quality considera-tions. If emissions from coal electricity are carefullycontrolled, this option represents a hazard comparable to allothers (except solar). The emissions control devices areexpensive, but the health benefits could be significant.Finally, the health advantages of solar technologies areindicated by the lowest range of estimates of fatalities.
B. Large-Scale or Catastrophic Impacts
Apart from the routine health and environmental impacts ofenergy systems, there are also infrequent, unpredictable, orlong-term chronic effects that could pose a real danger.Even though the events described may have a low probabilityof occurrence, small probabilities become certainties, giventime. The possibilities of such an occurrence warrantsattention in this analysis, for it is one variable thatshould be considered in the evaluation of any energyalternative.
77
1. Acid Rain
Large increases in the acidity of rainfall have been found inseveral areas of the Eastern United States and WesternEurope. It is generally believed that this acidity has itsorigins in the atmospheric conversion of sulfur dioxide andnitrogen oxide pollutants to sulfuric (70 percent) and nitric(30 percent) acids, respectively. Under normal conditions,the pH of rain and snow should be approximately 5.6. Inlarge areas of the Eastern United States, the annual averagepH ranges from 4 to 4.5. Recent studies indicate that acidprecipitation is a problem throughout the entire East Coast,that the impacts 'e.re spreading to the South and West, thatthe acidity of the precipitation is increasing, and thatwidespread damage to the built and natural environments isoccurring (Likens, et al., 1979).
Aquatic ecosystems are particularly sensitive to the effectsof increased acidity, especially in areas underlain by hardsiliceous bedrock such as gneiss, granite, and quartz. Theserocks, resistant to weathering, yield waters with very lowion concentrations. These "soft" waters have a low bufferingcapacity and are unable to neutralize acids from rainfall orsnowfall. Thus, both the amount of acid in precipitation andthe geological characteristics of an area are importantdeterminants in an ecosystem's sensitivity to acidprecipitation. Therefore, areas such as the Adirondacks, theAppalachians and the Sierra Nevada Mountains are particularlysusceptible to damage. Known effects of acid precipitationinclude leaching nutrients from soil, slowing of bacterialdecomposition, injury to leaf surfaces, killing cf fish andzooplankton, and reducing the viability of whole plant andanimal communities (Resources for the Future, 1979; Ballou,et al., 1979).
The spread of the acid precipitation problems to the Westcould have ominous consequences. Science (January .11, 1980)recently reported a rapid rise of nitric acid rain near theRocky Mountain continen:_al divide during the past threeyears. The Rocky Mountains contain some of the most valuableand sensitive wilderness, forest and park areas in the lower48 states. Greater care is needed to protect them frompollution-induced acid rains.
The EPA requires all new coal-based power plants to remove 70percent' to 90 percent of the gaseous sulfur from emissionsthrough the use of "scrubbers" or flue gas desulfurizationunits. Even so, EPA predicts an increase in utility sulfuremissions from 18.6 million metric tons in 1975 to between
78
20.5 (with conservation and best available controls) and 23.8million by 1995. Greater care should be taken to encouragefuel conservation, install best available controls fornitrous and sulfur oxides, and properly site coal facilities(Likens, 1980).
2. Climate Modification: Carbon Dioxide
Atmospheric carbon dioxide will transmit visible light whilehindering longer wavelength infrared radiation. Thus, visiblelight enters the atmosphere from the sun and is degraded toheat which is held in the atmosphere by water vapor andcarbon dioxide. This "greenhouse effect" is responsible formaintaining an atmospheric temperature approximately 10°Cabove what it would be without atmospheric water vapor andcarbon dioxide (Miller, 1979).
The dynamics and interactions of the carbon dioxide cycle ofthe earth are complex and subject to considerable debate.Plants take up CO2 during photosynthesis and release itwhen respiring or decomposing. Global deforestation may beupsetting the balance of uptake and release by favoring thelatter. The combustion of fossil fuels represents anaccelerated form of respiration of materials stored millionsof years ago. By weight, the combustion of one ton of coalyields three tons of CO2. The relatively small averageconcentration of CO2 in the atmosphere (about 0.03 percent)can be increased significantly by burning the earth's fossilfuels and destroying the earth's forests. Estimates of therelative contribution of deforestation and fossil fuelcombustion vary considerably. Scientists estimate that since1890, atmospheric CO2 concentrations have increased from290 parts per million volume (ppmv) to 330 ppmv, an increaseof approximately 14 percent in 90 years (Woodwell, 1978).However, as seen in Figure 3, the accumulation of CO2 inthe atmosphere in recent years is accelerating-,- due toaccelerated rates of deforestation and combustion of fossilfuels, The addition of 40 ppmv has probably resulted in anaverage global temperature increase of less than 0.4°C todate. As shown, increasing our fossil fuel combustion 3-4percent/year through the year 2000 will increase CO2concentrations to between 365 and 400 ppmv causing atemperature increase of 0.5 to 0.6 in the next two decades(National Academy of Sciences, 1977).
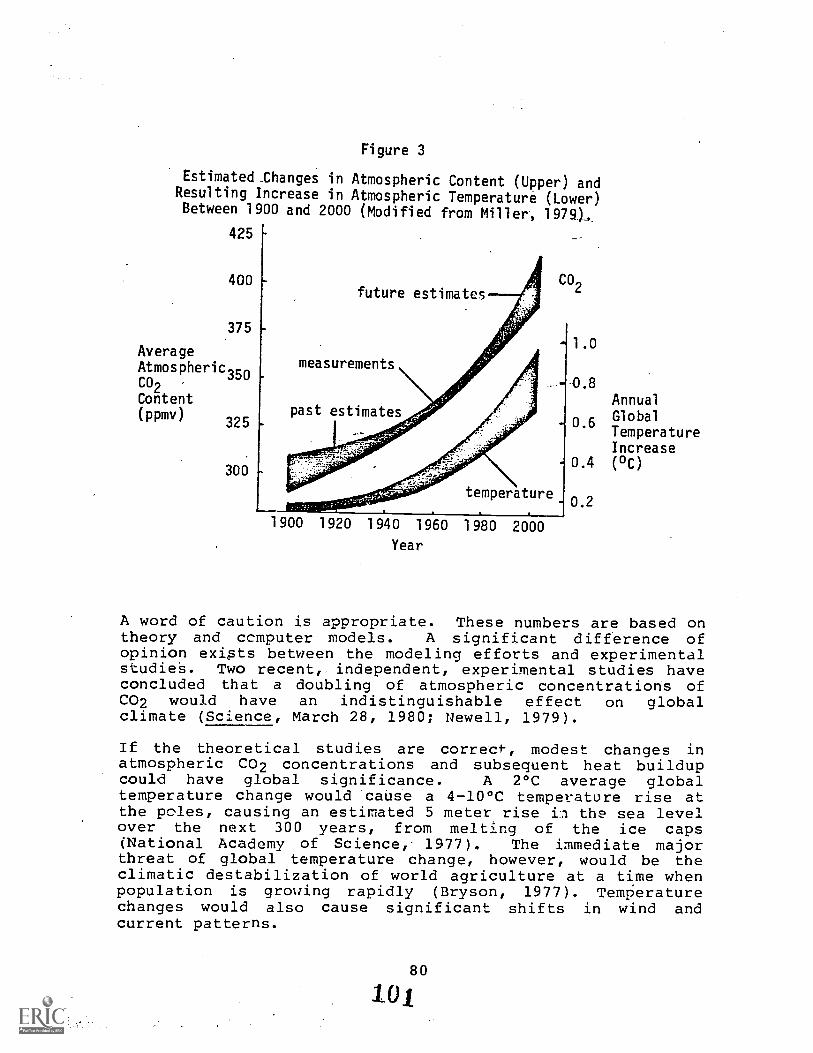
Figure 3
Estimated. hanges in Atmospheric Content (Upper) andResulting Increase in Atmospheric Temperature (Lower)Between 1900 and 2000 (Modified from Miller, 1979),
425
400
375
AverageAtmospheric350CO2
Content(ppmv)
325
300
future estimates
measurements
past estimates
CO2
temperature
1900 1920 1940 1960 1980 2000
Year
1.0
0.8
0.6
0.4
0.2
AnnualGlobalTemperatureIncrease( °C)
A word of caution is appropriate. These numbers are based ontheory and ccmputer models. A significant difference ofopinion exists between the modeling efforts and experimentalstudieS. Two recent, independent, experimental studies haveconcluded that a doubling of atmospheric concentrations ofCO2 would have an indistinguishable effect on globalclimate (Science, March 28, 1980; Newell, 1979).
If the theoretical studies are correct., modest changes inatmospheric CO2 concentrations and subsequent heat buildupcould have global significance. A 2°C average globaltemperature change would cause a 4-10°C temperature rise atthe poles, causing an estimated 5 meter rise in the sea levelover the next 300 years, from melting of the ice caps(National Academy of Science 1977). The immediate majorthreat of global temperature change, however, would be theclimatic destabilization of world agriculture at a time whenpopulation is growing rapidly (Bryson, 1977). Temperaturechanges would also cause significant shifts in wind andcurrent patterns.
80
101
The conversion of coal and shale to petroleum liquids poses asignificant threat to atmospheric CO2 buildup. The CO2_released by the combustion of synfuels is 1.4 times greaterthan that released by coal, and 1.7 to 2.3 times greater thanthat released by oil and natural gas (Science, July 27,1979). Fossil fuels may be able to be used for another 30 to50 years without disastrous effects on climate. That periodshould be used to shift to other energy sources, such assolar, wind, or a properly managed nuclear industry, that donot produce CO2 (Miller, 1979; National Academy ofSciences, 1977).
3. Nuclear Reactor Safety
The Rasmussen Report, published in 1975, evaluated theprobability and consequences of a nuclear accident in theUnited States. With 100 plants in operation,\the probabilityof"a worst case accident was calculated as 1 in 1 billion perplant per year. This accident would cause between 825 and13,200 immediate deaths, 12,375 to 198,000 illnesses, 7,500to 180,000 later cancer deaths, and 4,750 to 171,000 delayedgenetic effects (Nuclear Regulatory Commission, 1975). Theproperty damage would range from $2.8 to $28 billion.Insurance companies are unwilling to insure a nuclear plantfor an accident for over $500 million. To encourage initialgrowth in the nuclear industry the Price-Anderson Act waspassed in 1957 setting a liability ceiling for a nuclearaccident at' $560 million, with the government liable for $420million of that sum.
In January 1979, the Nuclear Regulatory Commission repudiatedthe Rasmussen Report indicating that: 1) it underestimatesthe consequences of a nuclear acciaent, 2) it does not coverall risks in the nuclear cycle, 3) it covers only 100 ratherthan the 1000 plants projected, and 4) it uses questionableassumptions and procedures (Miller, 1979). In March, 1979,an improbable series of mechanical and human failures causeda partial core meltdown at Three Mile Island Nuclear Plantnear Harrisburg, Pennsylvania. No lives were directly lost,but it will be years before any cancer or genetic effects aredetermined. Thousands of people were temporarily evacuated.The accident caused hundreds of millions of dollars in damageand will,require years to clean up. Today, no authoritativeevaluation of nuclear power plant safety or safety of thenuclear fuel cycle exists. Nor are there any conclusivescientific studies of the long-term effects of continuedexposure to low-level radiation released from the nuclearcycle and power plants.
4. Terrorism
Between 1969 and 1975, hundreds of threats, 15 breaches ofsecurity, 15 acts of vandalism or sabotage, and 11 bombexplosions were perpetrated in, or near, nuclear facilitiesin the. United States (Flood, 1976). Absolute protection of anuclear facility from a trained team of saboteurs cannot beguaranteed (American Nuclear Society, 1976). Such a teamcould easily precipitate a major nuclear incident.
The hijacking of nuclear fuel shipments represents a moreserious problem. Protection of hundreds of thousands ofnuclear material shipments is more difficult than protectionof a few centralized nuclear power plants. Enriched uraniumor plutonium shipments" may be hijacked and used to make anuclear device. Or, the dispersion of a 10-pound mass oftoxic plutonium over a 30 square mile area could contaminateit for over 250,000 years (De Nike, 1974). Thus, the effectof one individual in sabotage can easily equal that of anuclear power plant meltdown.
5. Problems in the West
On October 10, 1979, in Albuquerque, President Carter metwith ten Western governors to assure them that the rights andenvironmental quality of the Western states would not beviolated or circumvented by "fast track" energy developments.The ten governors have banded together to form a politicalblock to oppose the proposed Energy Mobilization Board. ThePresident promised the governors that the Energy MobilizationBoard would not be given the power to overrule statedisapproval of even "he largest energy projects. Inaddition, there is widespread concern among citizens andpoliticians that the Administration is not fighting hardenough in Congress for that protection.
The eight Rocky Mountain states of Arizona, Colorado, Idaho,Montana, Nevada, New Mexico, Utah, and Wyoming contain themajor undeveloped energy resources in the United States. TheRocky Mountain region contains: 1) approximately 42 percentof our nation's coal reserve (60 percent of low-sulfurcoals), 2) the richest oil shale, geothermal and uranium (95percent) deposits in the United States, 3) areas of potentialnew sources of petroleum and natural gas, 4) the area ofgreatest solar insolation, and 5) salt deposits for potentialnuclear waste disposal (United States Senate, 1976). Theseeight states alone could meet U.S. energy needs for the next100 years. But, substantial damage to forests, parks,ranches, farms and Indian reservations (with 50 percent ofthe region's uranium and 20 percent of the coal) would beincurred (see Figure 4). Over 50 percent of the land in theregion is owned and managed by the federal government. Thearea contains many of the nation's most beautiful parks,
national forests and wilderness areas. The states want theeconomic development, but not the impacts. Rapid developmentcould circumvent proper evaluation of conflicts of waterquality and water resources, land use, air quality, and thesocioeconomic impacts of boom towns (United States Senate,1976). Thus, the state governments have been attempting toslow the development process to allow for evaluation andcitizen participation in the decision-making process. Thisis directly contrary to the purpose and intent of the EnergyMobilization Board.
The greatest conflict will be for water resources and waterquality control in the region. Agricultural interestscurrently use 90 percent of the water in the region, butrather inefficiently. Additional water could be madeavailable by using trickling irrigation techniques or bydrawing more water out of the water tables. The withdrawalof additional water from water tables is hazardous, for inmany areas, ?:..ter tables have already dropped considerably,making the region more arid and forcing farmers to pay veryhigh pumping costs for irrigation (Carr, 1976; United StatesSenate, 1976).
The tradeoffs involved in reallocating water will bedifficult. A 1000 MW coal plant requires as much water forcooling as a city of 12,000 people. A single synfuel or' oilshale plant will require the equivalent water of a city ofbetween 7,000 and 11,000 people (Harte and El-Gassier, 1978).
The rise in acid rains in the Rockies gives us warning of thepotential for extensive damage to aquatic ecosystems :Ln thearea. This ,'ould become particularly acute if acid minedrainage problems arise. Other air quality problems includemining dust, particulate pollution from new coal-firedfacilities, radiation from improperly managed uranium miningfacilities, and an increase in CO2 production from thecombustion of fossil fuels.
The shipment of fuels out of the Western region by slurry,rail or highway as well as the growth and development ofurban centers in previously undeveloped areas could causesignificant secondary impacts (United States Senate, 1976).
In the next decade, development and conservation interestsare going to clash in the West. All levels of governmentmust be prepared to meet the challenge. Governments mustwork with citizens and establish clear development guidelinesand priorities. Land-use plans should be developed andcarefully integrated with the various levels andjurisdictions of government. To do so requires motivation,time, and public participation. The proposed EnergyMobilization Board would be contrary to all.
83
104
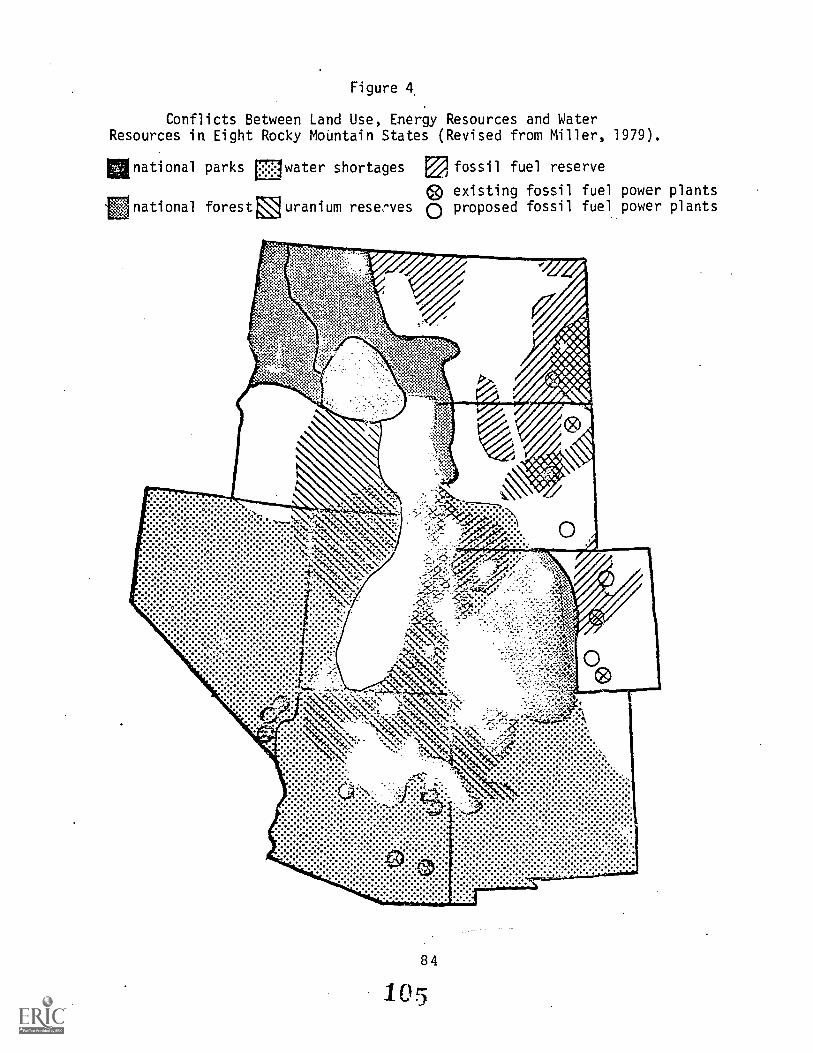
Figure 4,
Conflicts Between Land Use, Energy Resources and WaterResources in Eight Rocky Mountain States (Revised from Miller, 1979).
national parks Owater shortages El fossil fuel reserve
0 existing fossil fuel power plantsnational forest uranium reserves 0 proposed fossil fuel power plants
84
105
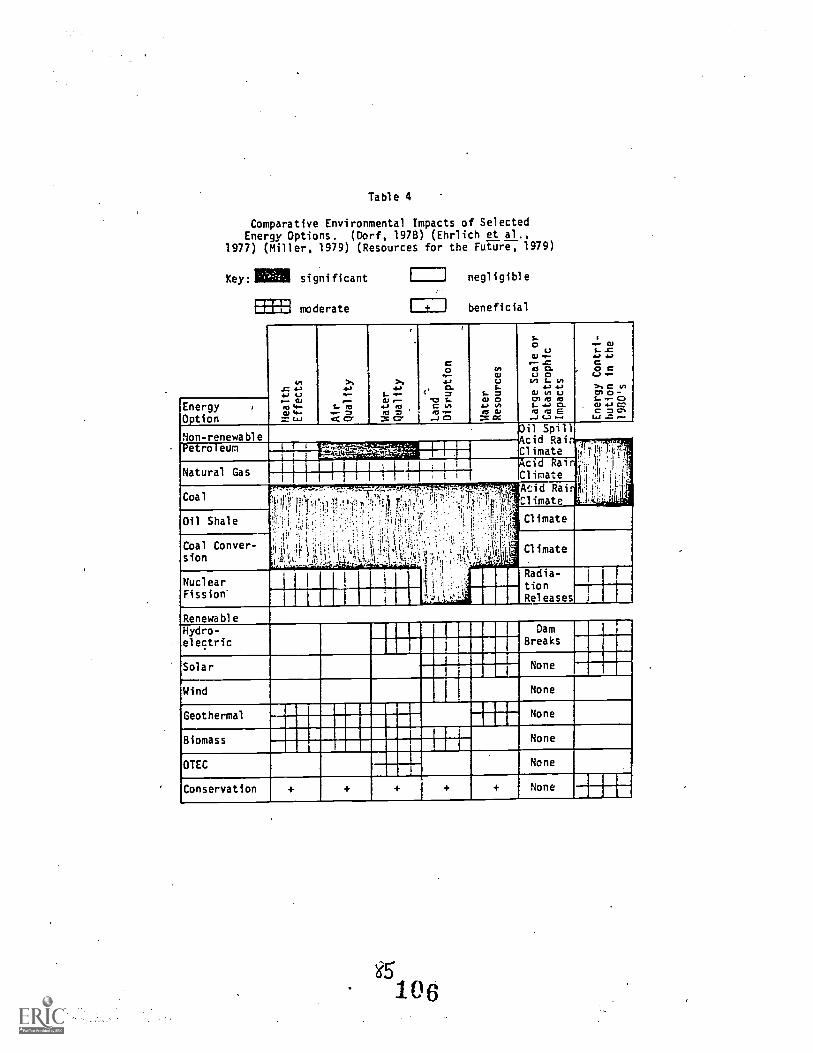
Table 4
Comparative Environmental Impacts of SelectedEnergy Options. (Dorf, 197B) (Ehrlich et al . ,
1977) (Mil I er, 1979) (Resources for the Future, 1979)
Key:
1111111a
significant
moderate
negligible
beneficial
Ii1..7 4.).I) 4.)I,. CUm4-CU 4-
s t...1
) 1.4).....
L.737i &
>,4)L.0.1 ..1., itsM =ar
07.)
, O.- 7MI L.c ,,,M.,-..J 0
CA
LJcu
L.L. 70./ 0..., tilMS M
:Y. Ce
0LJ
0.1 ..-
CS O.L.1 0
C/7 S- In4.) 4-,0 1/1 U
CM MS 0:11.. 4..)RS MI E
...J C.3
0 CC.)
b 7 tll01 0-
c 7 c,Li L ,Energy ,
Option
Hon-renewableAil Spill
.
if
i.,, I;
etro e um 11111111E.-,..:_-,------3:,-_, =IMMO cd Rai.1 imat eWal
Natural Gas, i ci .. ai
1 imate1
. I
11. 1,'' ' -'.,. . .'C loa
.
n ,.I' 7 , r !
i .
.." ---'-'-' )...
Ir.Acid RaiCl imate
. ,.?Cl imateOil Shale
Coal Conver-sion
i .. .. 1.
4 i't , %.11/4
.,.,-..!..-.,....
.
.- ,
Cl imate
NuclearFission'
I1 i .. ill
. .
Radia- 111111111
I tionasesIIlIRenewableHydro-electric
Dam
Breaks
Solar None
Wind None
Geothermal None
Biomass I None
OTEC None1
Conservation + + + + + None
C. Environmental Impacts
Table 4 summarizes the health and environmental impacts ofvarious energy systems. Although the various impacts are notcommensurable, the patterns of impact are apparent. The coaland oil shale syStems have the greatest environmentaleffects. Although they represent an enormous resource, greatcare must be taken to reduce the land-use and air pollutionimpacts. The rush to develop nuclear fission was, in part,due to reported environmental advantages, which are seen inthe table. However, great care is needed to assure reactorsafety and protection and control of materials in the nuclearfuel cycle. Although several of the renewables have moderateimpacts: in certain categories, the environmental advantagesof the renewables are apparent.
REFERENCES
Alfven, H. January 1974. "Fission Energy and OtherSouirCes of Energy." .Bulletin of Atomic Scientists,pp. 4-8.
American Nuclear Society. 1976. Nuclear Power and theEnvironment. American Nuclear Society, Hinsdale,Illinois.
Angiano, E. E. 1977. "High Level and Long-Lived Radio-active Waste Disposal." Science 198: 885-890.
Armstrong, M. and J. Armstrong, 1979. Community Impedimentsto Implementation of Solar Energy. Stanford, CA:Stanford Research Institute.
Auxtmann, R. 1975. "Environmental Impact of a GeothermalPower Plant." Science 187: 795-803.
Ballou, S. W., et al. 1979. "Identifying the Potentialfor SO2 Induced Vegetation Damage in the Evaluationof Energy Policy Scenarios." Changing Energy UseFuture. Los Angeles, CA.
Bossong, K. 1978. "Hazards of Solar Energy." People andEnergy 4:9: 5-6.
Broad, W. July, 1978. "Small Hydro: Sleeping Giant."Science News, pp. 43-45.
Broadman, J. R. and R E. Hamilton. 1979. "A Comparisonof Energy Projections to 1985." Paris: Inter- .
national Energy Agency.
Bross, I. D. and N. Natarajan. 1972. "Leukemia from LowLevel Radiation: Identification of SusceptibleChildren." New England Journal of Medicine 287:107-110.
Bryson, R. A. and T. J. Murray. 1977. Climates ofHunger: Mankind and the Worlds Changing Weather.Madison, WI: University of Wisconsin Press.
Carr, D. E. 1976. Energy and the Earth Machine. Norton,NY.
Chappell, W. R. 1979. "Environmental Impacts of OilShale." Proceedings of the International Conferenceon Energy Use Management, Los Angeles, CA, pp.A28-A36.
Colorado Department of Natural Resources. 1979. Upper-Colorado River Basin 13(a) Assessment: The Avail- ,ability of Water for Oil Shale and Coal GasificationDevelopment in the Upper Colorado River Basin.Prepared for the U.S. Water Resources Council.
Commoner, B. October 29, 1979. "Once and Future Fuel."New Yorker, pp. 114-117.
Council on Environmental Quality. 1973. EnvironmentalQuality. Washington, DC: U.S. Government PrintingOffice.
Council on Environmental Quality. 1978. EnvironmentalQuality. Washington, DC: U.S. Government PrintingOffice.
Council on Environmental Quality. 1979. EnvironmentalQuality. Washington, DC: U.S. Government PrintingOffice.
de Marsily, G., et al. 1977. "Nuclear Waste Disposal:Can the Geology t Guarantee Isolation?" Science197: 519-527.
De Nike, L. D. February, 1974. "Radioactive Malevolence."Bulletin of Atomic Scientists, pp. 16-20.
Department of Energy. 1977. "Market Oriented ProgramPlanning Study (MOPPS)." Final Report. Washington,DC, 1:6.
Dorf, R. C. 1978. Energy, Resources and Policy.Reading, MA: Addison-Wesley Publishing Company.
87
108
Ehrlich, P., et al. 1977. Ecosciance, Population,Resources and the Environment. San Francisco:W. H. Freeman.
Electrical World. September 16, 1979. "30th AnnualElectric Industry Forecast," pp. 69-84.
Environmental Protection Agency. 1977. RadiologicalQuality of the Environment in the United States.Washington, DC: U.S. Government Printing Office.
Fis..;.:r, A. December, 1978. "What Are We Going to do AboutNuclear Waste?" Popular Science, pp. 90-97.
Flood, M. October, 1976. "Nuclear Sabotage." Bulletin ofAtomic Scientists, pp. 29-36.
The Ford Foundation. 1974. A Time to Choose. Cambridge,MA: Ballinger Publishing C- 1pany.
The Ford Foundation. 1979. Energy, The Next Twenty Years.Cambridge, MA: Ballinger Publishing Company.
Gustafson, P. F. 1979. "Environmental Impacts of NuclearPower in the United States to the Year 2000."Changing Energy Use Futures, pp. 544-548.
Harte, J. and M. El-Gassier. 1978. "Energy and Water."Science, 199: 623-634.
Hayes, E. 1979. "Energy Resources Available to theUnited States, 1985-2000." Science 20384377):233-239.
Holzman, D. May, 1978. "Wood Fuel Makes Strong Comeback."People and Energy, pp. 5-6.
Hudson, E. A. and D. W. Jorgenson. 1974. "U.S. EnergyPolicy and Economic Growth, 1975-2000." Bell Journalof Economics and Management Science, pp. 461-514.
Hutchinson, J. 1979. Report: Oil Shale in Colorado.Golden, CO: Colorado Energy Research Institute.
Institute for Energy Analysis. 1976. U.S. Energy andEconomic Growth 1975-2010. Oak Ridge, TN: OakRidge Associated Universities.
Krugt-, P. 1976. "Geothermal Energy." In J. Hollanderand M. Simmons, eds., Annual Review of Energy.Palo Alto, CA: Annual Reviews.
Likens, G. E., et al. October, 1979. "Acid Rain."Scientific American, 241: 43-51.
Lovins, Amory. 1979. Soft Energy Paths: Toward aDurable Peace. Cambridge, MA: Ballinger PublishingCompany.
Mancuso, T. F.; A. Stewart; and G. Kneale. 1977."Radiation Exposures of Hanford Workers Dying fromCancer and Other Causes." Health Physics 33:369-385.
Miller, G. T., Jr. 1979. Living in the Environment,second edition. Belmont, CA: Wadsworth PublishingCompany.
Nadis, S. J. 1979. "The Solution is the Problem."Environment, 21: 8.
Najarian, T. and T. Colton. May 13, 1978. "Mortalityfrom Leukemia and Cancer in Shipyard Nuclear Workers."The Lancet, p. 1018.
Notional Academy of Sciences. 1974. RehabilitationPotential of Western Coal Lands. A Report to theEnergy Policy Project. Cambridge, MA. BallingerPublishing Company.
National Academy of Sciences. 1977. Energy and Climate:Outer Limits to Growth. Washington, DC: NationalAcademy of Sciences.
National Academy of Sciences. 1979. "Outlook for EnergyDemand and Conservation." Committee on Nuclear andAlternative Energy Systems (CONAES). Report of thePanel on Demand and Conservation.
Newell, R. E. and T. G. Dapplick. 1979. Journal ofApplied Meteorology 18: 822.
Nuclear Regulatory Commission. 1975. Reactor SafetyStudy: An Assessment of Accident Risks in U.S.Commercial Nuclear Power Plants. Springfield, VA:National Technical Information Service.
Resources for the Future. 1979. Energy in America'sFuture: The Choices Before Us. Baltimorr, MD:National Energy Strategies Project, Johns Hopkins
. University Press.
89
110
Ridker, R. G.; W. D. Watson, Jr.; and A. Shapanker. 1977."Economic Energy and Environmental Consequences ofAlternative Energy Regimes, An Application of theRFF/SEAS Modeling System." In Charles J. Hitch, ed.,Modeling Energy and Economic Interactions: FiveApproaches. Washington, DC: Resources for theFuture.
Science. July 13, 1979. "Synfuels in Haste, Repent atLeisure." 206: 167-168.
Science. July 27, 1979. "A Warning on Synfuels, CO2 andWeather." 205: 376-377.
Science. September 7, 1979. "Synfuels Crash ProgramViewed as Risky." 205: 978-979.
Science. January 11, 1980. "Acid Precipitation in theWestern United States." 207: 176-177.
Science. March 28, 1980. "The Climatological Significanceof a Doubling of Earth's Atmospheric CO2 Concentra-tion." 27: 1462-1463.
Stobaugh, R. and D. Yergen, eds. 1979. Energy Future.Harvard Business School Energy Project. New York:Random House.
Uhler, R. G. and B. Zycher. 1979. "Energy Forecasting:Coping with Uncertainty." International Conferencein Energy Use Management, Los Angeles, CA.
U.S. Senate. 1976. Land Use and Energy: A Study ofInterrelationships. Washington, DC: Committee onInterior and Insular Affairs.
Warren, D.; G. Speth; and J. Yarn. June, 1979. "Forecast2000: Brighter." Environment 21(5): 25-32.
Whipple, D. 1980. "The Energy Impacts of Solar Heatinc,."Science 208: 262-266.
Woodwell, G. M. 1978. "The Carbon Dioxide Question."Scientific American 238(1): 34-43.
90
ENERGY POLICY ISSUES AND THE ENVIRONMENTAL AGENDAFOR THE 1980s
Toufiq A. Siddiqil
Abstract. Reducing the dependence on imported oil as anenergy source is an important goal for many countries. The wayin which'ihis goal is achieved has substantial implicationsfor environmental quality during the 1980s and beyond. Thispaper looks at the role of oil in the energy economy ofseveral nations in Asia and the Pacific, as well as theU.S.A., and their plans for increased usy of other energysources. The transnational implications of such policies arediscussed.
Introduction
While attempting to formulate an environmental agenda for the1980s, we need to take into consideration some of the otherfactors that will significantly affect national andinternational policies during the decade. One such factorwill almost certainly be the desire of most countries toreduce dependence on imported oil by switching to other energysources. This could have significant implications forenvionmental quality in the 1980s and beyond. A look at therecent past may provide a clue to the direction of the impactassociated with a change in energy sources.
Major Enemy Sources Over the Last Half-Century
In spite of the well-known increase in the rate of techno-logical change that has characterized the twentieth century,it takes many decades for the relative importance of differentenergy sources in national economies to shift substantially.Table 1 shows the changes that have occurred in three of themore industrialized countries around the Pacific--Canada,Japan, and the U.S.A., over the period 1925-1976.
The trends that emerge from Table 1 as the most conspicuousare:
(i) The substantial decline in the relativeimportance of solid fuels (mainly coal),
(ii) A corresponding increase in the role ofliquid fuels (oil) and natural gas, and
(iii) The emergence of nuclear power as an importantsource for electricity generations.
1 East-West Environment and Policy Institute, East-WestCenter, Honolulu, HI 96848.
91
112
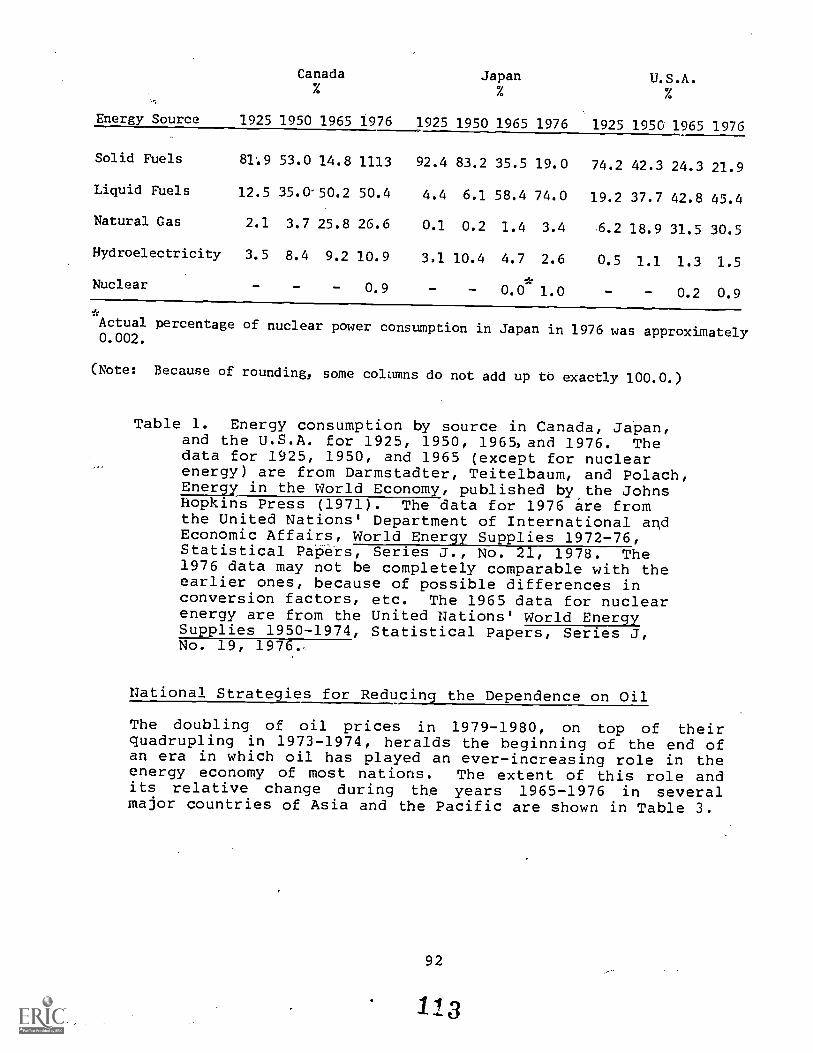
Canada Japan U.S.A.
Energy Source 1925 1950 1965 1976 1925 1950 1965 1976 1925 1950 1965 1976
Solid Fuels 81.9 53.0 14.8 1113 92.4 83.2 35.5 19.0 74.2 42.3 24.3 21.9
Liquid Fuels 12.5 35.0'50.2 50.4 4.4 6.1 58.4 74.0 19.2 37.7 42.8 45.4
Natural Gas 2.1 3.7 25.8 26.6 0.1 0.2 1.4 3.4 6.2 18.9 31.5 30.5
Hydroelectricity 3.5 8.4 9.2 10.9 3,1 10.4 4.7 2.6 0.5 1.1 1.3 1.5
Nuclear - 0.9 - 0.0- 1.0 - 0.2 0.9
"Actual percentage of nuclear power consumption in Japan in 1976 was approximately0.002.
(Note: Because of rounding, some columns do not add up tb exactly 100.0.)
Table 1. Energy consumption by source in Canada, Japan,and the U.S.A. for 1925, 1950, 1965, and 1976. Thedata for 1925, 1950, and 1965 (except for nuclearenergy) are from Darmstadter, Teitelbaum, and Polach,Energy in the World Economy, published by the JohnsHopkins Press (1971). The data for 1976 are fromthe United Nations' Department of International andEconomic Affairs, World Energy Supplies 1972-76,Statistical Pdpers, Series J., No. 21, 1978. The1976 data may not be completely comparable with theearlier ones, because of possible differences inconversion factors, etc. The 1965 data for nuclearenergy are from the United Nations' World EnergySupplies 1950-1974, Statistical Papers, Series J,No. 19, 1976,
National Strategies for Reducing the Dependence on Oil
The doubling of oil prices in 1979-1980, on top of theirquadrupling in 1973-1974, heralds the beginning of the end ofan era in which oil has played an ever-increasing role in theenergy economy of most nations. The extent of this role andits relative change during the years 1965-1976 in severalmajor countries of Asia and the Pacific are shown in Table 3.
92
113
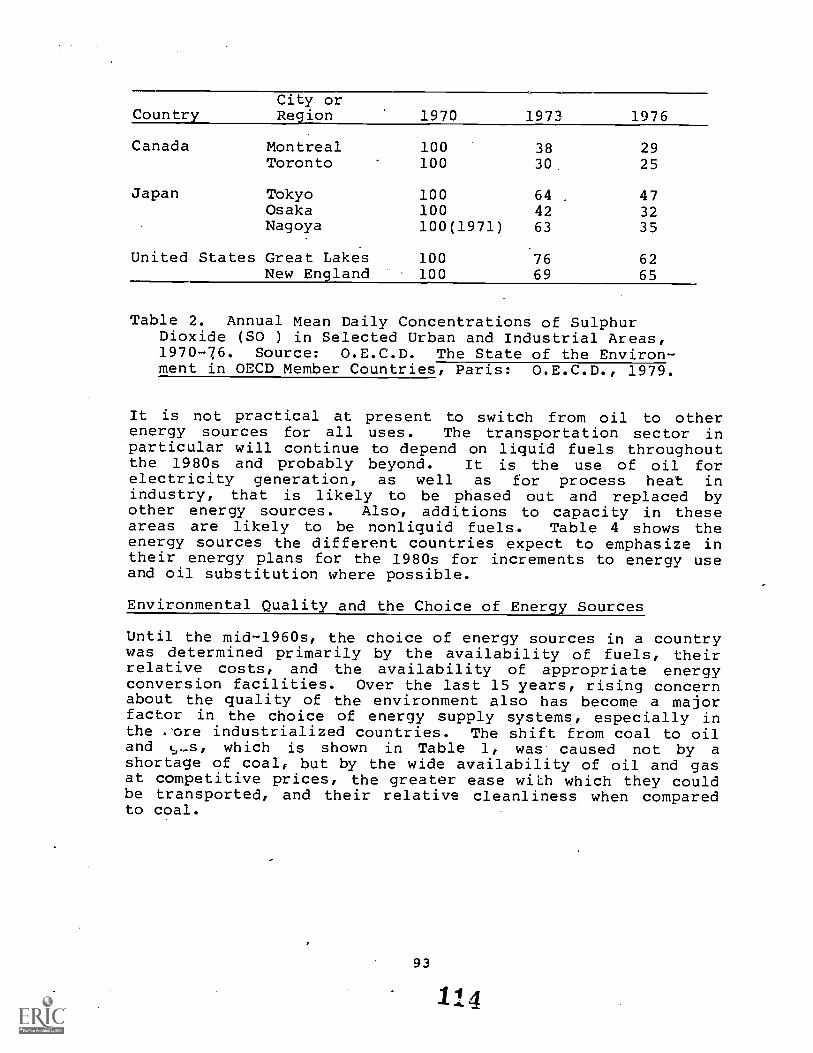
City orCountry Region 1970 1973 1976
Canada Montreal 100 38 29Toronto 100 30 25
Japan Tokyo 100 64 . 47Osaka 100 42 32Nagoya 100(1971) 63 35
United States Great Lakes 100 76 62New England 100 69 65
Table 2. Annual Mean Daily Concentrations of SulphurDioxide (SO ) in Selected Urban and Industrial Areas,1970-76. Source: O.E.C.D. The State of the Environ-ment in OECD Member Countries, Paris: O.E.C.D., 1979.
It is not practical at present to switch from oil to otherenergy sources for all uses. The transportation sector inparticular will continue to depend on liquid fuels throughoutthe 1980s and probably beyond. It is the use of oil forelectricity generation, as well as for process heat inindustry, that is likely to be phased out and replaced byother energy sources. Also, additions to capacity in theseareas are likely to be nonliquid fuels. Table 4 shows theenergy sources the different countries expect to emphasize intheir energy plans for the 1980s for increments to energy useand oil substitution where possible.
Environmental Quality and the Choice of Energy Sources
Until the mid-1960s, the choice of energy sources in a countrywas determined primarily by the availability of fuels, theirrelative costs, and the availability of appropriate energyconversion facilities. Over the last 15 years, rising concernabout the quality of the environment also has become a majorfactor in the choice of energy supply systems, especially inthe .'ore industrialized countries. The shift from coal to oiland which is shown in Table 1, was caused not by ashortage of coal, but by the wide availability of oil and gasat competitive prices, the greater ease with which they couldbe transported, and their relative cleanliness when comparedto coal.
93
114
The use of coal in many areas of Japan and the U.S.A. was alsomade considerably more difficult by the passage of major airquality legislation in the U.S.A. in 1963, 1970, and 1977, andin Japan in 1962 and 1968 (O.E.C.D., 1979).
The shift in energy sources, accompanied by the installationof pollution control equipment, led to an improvement in airquality in several urban and industrial areas during the1970s. As examples, the mean zleily concentrations of sulfurdioxide in some urban areas of Canada, Japan, and the U.S.A.,which are shown in Table 2, showed the relative decline(compared to 1970 values) in SO2 levels during the period1970-1976.
Taking the total energy use in the different countries intoconsideration, it is evident from Table 4 that there will besubstantial increases in the use of coal during the 19Ms, anda smaller increase in the role of nuclear power and naturalgas. With regard to nuclear power, the longer-term impact ofthe Three-Mile Island (T-M-I) accident on the energy plans ofthe nations is difficult to forecast. In the U.S.A. and inJapan the accident has made the siting of nuclear power plantsmuch more difficult; in the U.S.A. T-M-I has accelerated thetrend toward postponement or cancellation of several plannedunits. A likely outcome is that the rate of growth of nuclearpower will be slower than predicted during the mid-1970s, butthat its share of electricity production will keep on growingin most countries during the 1980s.
Implications for the Environmental Agenda for the 1980s
A paper in this current volume by John Baldwin addresses theenvironmental implications of major energy productionalternatives in the United States. Most of the impactsassociated with each energy source are the same in othercountries, and it would not be very useful to repeat themhere. Consequently, this paper will limit its attention toimplications that are transnational in scope, and to the twosources likely to make the largest additions to energyconsumption during this decade, i.e., coal and nuclear power.
Coal
Two major transnational issues concerned with the use of coal(and other fossil fuels) are (i) acid rain, and (ii) climaticeffects of the buildup of carbon dioxide in' the atmosphere.Acid rain has been a controversial issue in northern Europe
94
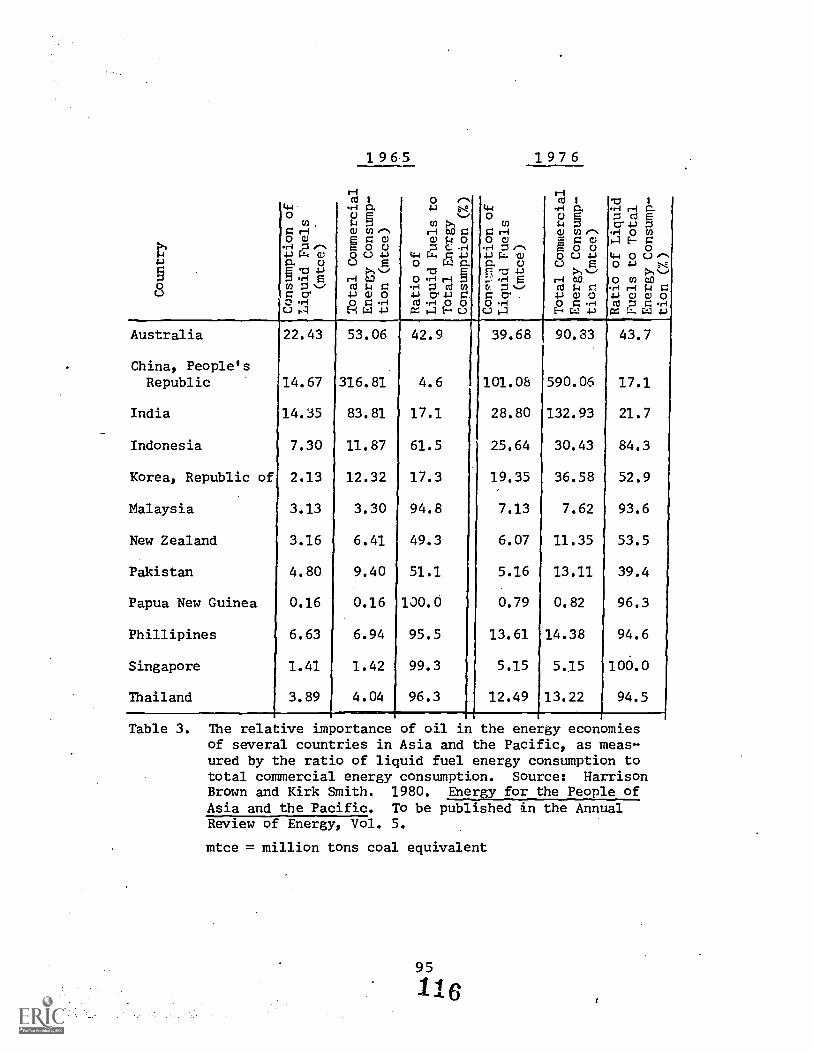
19 6.5
1976
LI-I
cd I. a 4-$
i'l.
14-1
.r4
a2 r-1
ri P.o
(I),
2 0 .,,..,
0 0 g- 2 9
H3 rrC
)
0 CO
eN r4 0 Cl)E
-04-tl
"gZ11 T
a 0
la'gw 1
C.)
E
EbjD1
44 0 41 a.
1' 2
a. 0
1 g E)
c.)
:4
Lo 4-$S
o
0 721
t%
-
cnO,
r-i
tactIPP
02
r-i
0
HO
ctIv)
Prl
v -%./
r-i
t3cdPr,
0 (/)
te-1
r-i
c-t
g
C.)
5, .F-1
s....0
I4
45)
2 .2
Ft L.I
4-3
4C-T
il
.5 4C-)
g
.04
1.-4
1- C.)
g .F,'.c.)
1.-4
46)
2 .1;A)E
-4
CL
I
4-/
4,-)
2 2 9
= iA C:I
4-3
Australia
22.43
53.06
42.9
39.68
90.33
43.7
China,
People's
Republic
'
14.67
316.81
4.6
101.08
590.06
17.1
India
14.35
83.81
17.1
28.80
132.93
21.7
Indonesia
7.30
11.87
61.5
25.64
30.43
84.3
Korea,
Republic
of
2.13
12.32
17.3
19.35
36.58
52.9
Malaysia
3.13
3.30
94.8
7.13
7.62
93.6
New
Zealand
3.16
6.41
49.3
6.07
11.35
53.5
Pakistan
4.80
9.40
51.1
5.16
13.11
39.4
Papua
New
Guinea
0.16
0.16
100.0
0.79
0.82
96.3
Phillipines
6.63
6.94
95.5
13.61
14.38
94.6
Singapore
1.41
1.42
99.3
5.15
5.15
100.0
Thailand
3.89
4.04
96.3
12.49
13.22
94.5
1
Table
3.
The
relative
importance
of
oil
in
the
energy
economies
of
several
countries
in
Asia
and
the
Pacific,
as
meas-
ured
by
the
ratio
of
liquid
fuel
energy
consumption
to
total
commercial
energy
consumption.
Source:
Harrison
Brown
and
Kirk
Smith.
1980.
Energy
for
the
People
of
Asia
and
the
Pacific.
To
be
published
in the
Annual
Review
of
Energy,
Vol.
5.
mtce
= million
tons
coal
equivalent
95116
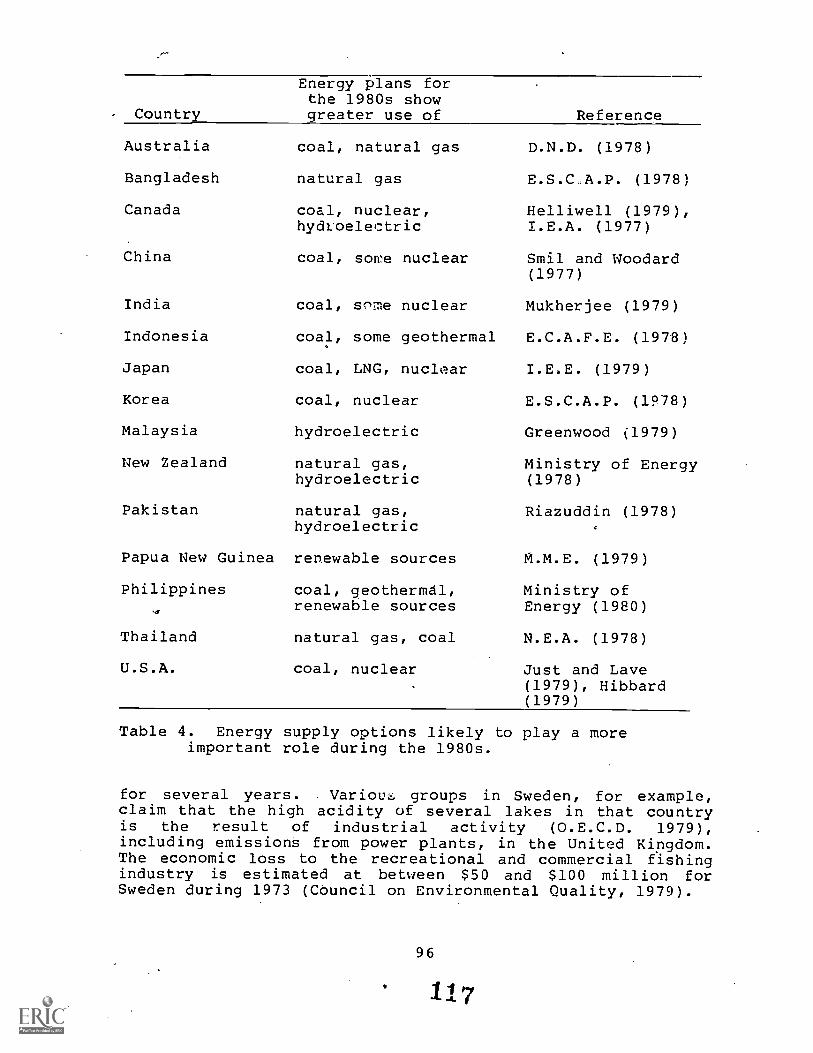
Country_
Australia
Bangladesh
Canada
China
Energy plans forthe 1980s showgreater use of Reference
India
Indonesia
Japan
Korea
Malaysia
New Zealand
Pakistan
Papua New Guinea
Philippines
Thailand
U.S.A.
coal, natural gas
natural gas
coal, nuclear,hydroelectric
coal, some nuclear
coal, sc nuclear
coal, some geothermal
coal, LNG, nuclear
coal, nuclear
hydroelectric
natural gas,hydroelectric
natural gas,hydroelectric
renewable sources
coal, geothermal,renewable sources
natural gas, coal
coal, nuclear
D.N.D. (1978)
E.S.CA.P. (1978)
Helliwell (1979),I.E.A. (1977)
Smil and Woodard(1977)
Mukherjee (1979)
E.C.A.F.E. (1978)
I.E.E. (1979)
E.S.C.A.P. (1978)
Greenwood (1979)
Ministry of Energy(1978)
Riazuddin (1978)
M.M.E. (1979)
Ministry ofEnergy (1980)
N.E.A. (1978)
Just and Lave(1979), Hibbard(1979)
Table 4. Energy supply options likely to play a moreimportant role during the 1980s.
for several years. . Variout, groups in Sweden, for example,claim that the high acidity of several lakes in that countryis the result of industrial activity (O.E.C.D. 1979),including emissions from power plants, in the United Kingdom.The economic loss to the recreational and commercial fishingindustry is estimated at between $50 and $100 million forSweden during 1973 (Council on Environmental Quality, 1979).
96
117
Japan, Canada, and the U.S.A. are also increasingly concernedabout acid rain. In the U.S.A., a study to assess thepotential environmental impacts of increased coal useidentified acid rain L8 an important subject requiring closerscrutiny (U.S. H.E.W,, 1977). The acidity of rainfall in theeastern U.S.A. seems to have increased by a factor of about 50during the last 25 years. The pH values measured in somerainfall are as low as 3.0, an acidity equivalent, to lemonjuice!
Our knowledge about the explicit causes and the total effectsof acid rain is very inadequate. It is quite likely that theyields of agricultural crops and of forests are decrpPc3ed.Works of art, and other steel and stone structures, may bepermanently damaged. There may be increases in theconcentrations cf some trace metals in the drinking watersupplies to levels that are harmful.
The implications of the buildup of carbon dioxide inthe atmosphere also are receiving increasing worldwideattention. Some of the conclusions reached by participants ata Workshop held at the International Institute for AppliedSystems Analysis at Vienna (Williams, 1978) are:
The evidence is strong that substantial additionalatmospheric CO2 will cause significant climatechanges, although quantitative values are difficultto assign with confidence.
We have not yet identified the whole range ofadjustments the world would or could make to asubstantial climate change. It is not prematureto examine possible global and. regional responsesto the eventuality of such changes and theconsequences the responses to the changes cancause on the well-being of the global society.
It is premature to implement at this time policymeasures which require the reduction in use ofcoal and other fossil fuels.
Policies to emphasize the-use of coal because ofits great abundance in preference to nonfossil(non -CO2 producing) energy supply systems areequally unjustified....We urge the maintenanceof great flexibility in energy supply policiesat this time.
Environmental impact assessments of escalatingenergy use must be performed with greater depththan in the past and on a scale commensuratewith the potential importance of the problem.
97
118
It would be highly desirable to devise energysupply systems that allow ready environmentalamelioration.
The increase in the use of coal in the countries listed inTable 4 alone could exceed 1 billion tons/year by the end ofthe 1980s. Substantial increases in coal consumption are alsolikely in Europe, including the U.S.S.R. It has beensuggested (Mustacchi, et ai., 1978) that if and when CO2accumulation in the atmosphere is recognized as a seriousproblem, it will be feasible to absorb CO2 emissions frompower plants in seawater, at an additional cost per electrickwh not higher than 20 percent. .Other scientists feel thatthe removal of CO2 is not an economically viable option.
If seawater is the most likely sink for CO2 emissions, andCO2 removal becomes a necessity for climatic reasons, itwould obviously be advantageous to locate fossil fuel plantsclose to the seashore in order to minimize additional costs.In many countries, including the United States, major coaldeposits are located at considerable distance from the sea,and power plants are frequently located close to mineheads toreduce the costs of shipping coal. Any decision to removeCO2 emissions could thus have substantial implications forthe siting of coal-fired power plants. A large amount ofinfrastructure, such as the building of roads and railroadtracks, usually accompanies the building of .a power plant.Also, industry usually develops in the area to make use of theelectricity available. Any decision to shift an electricpower plant thus would involve large expenditures in additionto strong social and political opposition. For manydeveloping countries with scarce capital, and great need foradditional electricity generation, it is unlikely that plantsbuilt far away from seacoasts will be equipped to removeCO2, even if it becomes desirable on a global level tocontrol, such emissions. Thus increased research on CO2effects and possible removal options is necessary so that anyadditional ccnsiderations required can be factored into sitingdecisions.
On a global level, a small change in temperature andprecipitation could be beneficial to some countries andharmful to others. A temperature increase of 1°C and aprecipitation decrease of 10 percent, for example, couldreduce wheat yields in major producing 'areas such asKazakhstan in the U.S.S.R. and South Dakota in the U.S.A: upto 20 percent (Bach, 1978). A similar change would lead to anestimated decrease in corn yield in the U.S. 'of about 13percent (Benci, et al., 1975), but a possible increase inglobal rice production of about 2 percent (Stansel and Huke,1975). With different crops playing differing roles in thefood supplies of major countries, it is unlikely that such
98
119
countries will view small changes in temperature orprecipitation as necessarily harmful. A universal "Non -CO2Proliferation Treaty" may be as difficult to achieve as itsnuclear counterpart. With the experience of the Law of theSea negotiations in mind, it may be appropriate to initiatediscussions during the 1980s on a possible "Law of the Air."
Nuclear Power
The pros and cons of nuclear power have been discussed atgreat length during the 1970s, but there is every indicationthat they will continue to be a subject of great importanceaffecting the environmental agenda for the 1980s: Most of thedebate has focused on the probability and consequences ofreactor accidents (see, for example, American, PhysicalSociety, 1975), the safe disposal of radioactive wastes(National. Academy of Sciences, 1979), and strategies forcontrolling nuclear proliferation (Greenwood, 1977). It wouldserve no useful purpose to go over all the arguments here; itis sufficient to note that there are large uncertainties ineach of the areas just mentioned.
Given the fact that our world is composed of sovereignnations, which can and do change their policies towards othernations, a major concern of all governments is to minimize theinternal dislocations that such changes could cause. The1970s saw an embargo on the shipment of oil from ,Arabcountries to the U.S.A., Canadian decisions to phase out theexport of oil to the U.S.A., the U.S.A. decision to banimports of oil from Iran and curtail shipments of nuclearfuels to India (although shipments to India are, presentlycontinuing on an ad hoc basis). These events have greatlyincreased awareness in all countries of the crucial role ofenergy in their economies, and have stimulated a desire toachieve either energy self-sufficiency or to ensure externalsupplies for a time span adequate to make any shifts which maybe required.
Many of the countries in the region, including Australia,Canada, India, and the United States have a resource baseadequate to provide energy self-sufficiency by the 1990s.China, Indonesia, and Malaysia are essentially self-sufficientat present, and this is unlikely to change in this century.On the basis of known reserves, energy independence does notappear to be a viable option for Bangladesh, Korea, Japan,Pakistan, and many of the island nations of the Pacific.
For the nations faced with the necessity of importing theirenergy requirements, the choice of the form in which energy isimported depends on several factors. Some of the moreimportant considerations are:
The nature of the demand: If the energy needed isprimarily for vehicular transportation, oil isclearly the form in which energy will be imported.
The relative cost of the fuels:- If fuels are neededto provide a source of heat for electric power plants,the fuel that is cheapest at the plant site on acents-per-kilowatt-hour basis is likely, to beimported.
Environmental considerations: In areas with problemsrelated to air quality, for example in Japan, lesspolluting fuels such as liquefied natural gas arebeing imported for use, even though it may be cheaperto use coal.
Reliability of supplies: In North America, it isconsidered almost axiomatic that many mid-Easternand north African countries of OPEC cannot beconsidered reliable suppliers of oil for the longerterm. It may be something of a surprise to learnthat, in many parts of Asia, both Canada and theU.S.A. are considered less reliable suppliers thanthe same OPEC countries. Developing countries wishingto reduce dependence on oil by emphasizing coal oruranium find that they would, in all likelihood,, haveto import these in either case from Australia, Canada,China, South Africa, the U.S.A., or the U.S.S.R. Thelinks to the country's foreign policy thus become avery major concern in such a decision.
Ease of storage: Administrations in the U.S.A. have'been trying for several years to store enough oil tokeep operations at near normal levels for about sixmonths, in case imports were suddenly cut off. Theyhave had very limited success in achieving this goal.For developing countries, with less available capitaland technology, the possibilities for storing hugeamounts of oil hardly exist. Storage of coal inquantities sufficient to last for a year or more wouldbe. even more difficult. In view of the much smallerquantities involved, the fuel to keep nuclear reactorsrunning for the same time can be stored with relativeease.
100
121
The weighting assigned to each of the above factors indifferent, countries will vary. If a country feels that itsenergy suppliers are reliable, it is likely to choose energyimports in a form that is least costly or easiest for itsexisting infrastructure to cope with. If it feels veryvulnerable to cutoffs, it may base its decision on the ease ofstorage and attempt to build up fuel reserves. These concernsmust have contributed to the decisions of Japan and Korea toboost their nuclear generating capacity significantly duringthe 1980s.
The nuclear debate in the United States has focused on whatrole nuclear power is likely to play in the country's energyfuture. There seems to be a feeling amongst the generalpublic that the nation must first decide whether or not tocontinue building nuclear power plants, and if it chooses toforego the option, it does not have to worry too much aboutthe long-term disposal of radioactive wastes. This, of course,is hardly the case. Large amounts of such wastes alreadyexist in the U.S.A. from the military program as well as the70 or so commercial power plants in operation. Additionalquantities will continue to be produced by these, as well asfrom similar programs around the world. Solutions to theproblem of disposal of radioactive wastes will have to befound, not only for the U.S.A., but for Japan, Korea, India,China, Canada, and the European countries. If any countrydisposes of long-lived wastes in an unsatisfactory fashion, sothat they escape into the atmosphere or oceans, it wouldbecome a problem for all countries.
Research into the safe disposal of radioactive wastes shouldbe an important component of the environmental agenda for the1980s, and should, be pursued with a much greater sense ofurgency, whatever one's views on the desirability of nuclearfission reactors. Even if we decide to phase out nuclearpower during the next decade, the existing reactors would haveto be decommissioned, and the wastes presently being stored"temporarily" disposed of in a fashion that will isolate themfor millenia from the common global environment.
REFERENCES
American Physical Society. 1975. Report of the StudyGroup on Light-Water Reactor Safety. Supplement toReviews of Modern Physics, Vol. 47.
Bach, Wilfrid. 1978. "The Potential Consequences ofIncreasing CO Levels in the Atmosphere," in CarbonDioxide, Climate, and Society, edited by JillWilliams. Oxford: Pergamon Press, pp. 141-167.
101
122
Benci, J. R., et al. 1975. "Effects of HypotheticalClimate Changes in Production and Yield of Corn'"Impacts of Climatic Change on the Biosphere, CIAPMonograph 5, pt. 2, Climatic Effects, pp. 4-3 to 4-36.
Brown, Harrison, and Kirk R. Smith. 1980. "Energy for thePeople of Asia and the Pacific." Annual Review ofEnergy, Vol. 5 (to be published).
Council on Environmental Quality. 1979. EnvironmentalQuality. The Tenth Annual Report of the Council onEnvironmental Quality. Washington, D.C.: U.S.Government Printing Office, 816 pp.
Darmstadter, Joel; Perry D. Teitelbaum; and Jaroslav G.Polack. 1971. Energy in the World Economy.Baltimore: The Johns Hopkins Press.
Department of National Development, Australia. 1978.End-Use Analysis of Primary Fuels Demand Australia1973-74 to 1986-87. Canberra: Australian GovernmentPublishing Service, 53 pp.
Economic and Social Commission for Asia and the Pacific.1978. Energy Sources in the Region. Bangkok:E.S.C.A.P.
Economic Commission for Asia and the Far East. 1978.Indonesia Energy Outlook. Contributed by Indonesiafor the Working Group Meeting on Energy Planning andProgramming, Bangkok, 15-21 August 1978.
Greenwood, Gavin. 1979. "Multi-Options for Malaysia."Petroleum News' Vol. 10 (September 1979), p. 16.
Greenwood, Ted. 1977. Nuclear Proliferation: Motiva-tions, Capabilities, and Strategies for Control.New York: McGraw Hill, 210 pp.
Helliwell, John F. 1979. "Canadian Energy Policy"Annual Review of Energy, Vol. 4. Palo Alto,California: Annual Reviews, Inc., pp.175-229.
Hibbard, W. R., Jr. 1979. "Policies and Constraints forMajor Expansion of U.S. Coal Production andUtilization," in Annual Review of Energy, Vol. 4,pp. 147-174, op. cit.
Institute of Energy Economics, Tokyo. 1979. Long-TermEnergy Demand and Supply Forecast for Japan (1985,1990). Tokyo: Institute of Energy Ecomomics, 24 pp.
102
123
International Energy Agency. 1977. IEA Reviews ofNational Energy Programmes. Paris: O.E.C.D., 244 pp.
Just, James and Lester Lave. 1979. "Review of Scenariosof Future U.S. Energy Use," Annual Review ofEnergy, Vol. 4, pp. 501-536, op. cit.
Ministry of Energy, New Zealand. 1978. Goals and Guide-lines: An Energy Strategy for New Zealand.Wellington: Parliament Buildings, 102 pp. + tables.
Ministry of Energy, Philippines. 1980. Ten-Year EnergyProgram 1980-1989. Metro Manila: Ministry of Energy,108 pp.
Ministry of Minerals and Energy, Papua New Guinea. 1979.Energy Policy and Planning for Papua New Guinea:White Paper. Konebodu: Ministry of Minerals andEnergy, 41 pp.
Mukherjee, Shishir K. 1979. Energy Policy for India:Basic Issues and Future Prospects. Ahmedabad:Indian Institute of Management, 35 pp. + tables.
Mustacchi, C.; P. Armenante; and V. Cena. 1978. "CarbonDioxide Disposal in the Ocean." Carbon Dioxide,Climate, and Society, pp. 283-289, op. cit.
National Academy of Sciences. 1979. Risks Associatedwith Nuclear Power: A Critical Review of theLiterature, Summary and Synthesis Chapter.Washington, D.C.: National Academy of Sciences.
National Energy Administration. 1978. Thailand EnergyPolicy. Bangkok: National Energy Administration.
Organization for Economic Co-operatioll and Development.1979. The State of the Environment in OECD MemberCountries. Paris: O.E.C.D., 177 pp.
Riazuddin. 1978. Energy Needs of Pakistan. Paperpresented at the East-West Resource SystemsInstitute, Honolulu, Hawaii.
Smil, Vaclav and Kim Woodard. 1977. "Perspectives onEnergy in the People's Republic of China." AnnualReview o2 Energy, Vol. 2, pp. 307-42, op. cit.
Stansel, J. and R. E. Huke. 1975. "Rice." Impacts ofClimatic Change on the Biosphere, pp. 4-90 to 4-132,op. cit.
103
124
United Nations. 1976, 1978. World Energy Supplies 1950-1974. Statistical Papers, Series J, No. 19 andWorld Energy Supplies 1972-76. Statistical PapersSeries J, No. 21. New York: United Nations,Department of International and Economic Affairs.
U.S. Department of Health, Education, and Welfare. 1977.Report of the Committee on Health and EnvironmentalEffects of Increased Coal Utilization. Washington,D.C.: U.S. Government Printing Office.
Williams, Jill (ed.). 1978. Carbon Dioxide, Climate andSociety. Proceedings of a ILASA Workshop. Oxford:Pergamon Press, 332 pp.
104
125
THE ENERGY-ENVIRONMENT CONUNDRUM:A VIEW FROM THE CONGRESS
Kevin C. Gottlieb'
Abstract. ..,he Carter Administration's legislation to reduceoil imports through coal conversion is facing obstacles in theCongress. The environmental obstacles, in the form of acidrain and carbon dioxide concentration, can be handledtechnically but may not be surmountable politically. Failureof this legislation could lead to future environmentaldamage.
In July of 1979, President Carter introduced an ImportReduction Program to save an additional 4.5 million barrels ofoil a day (mbd) by the end of the 1980s (July 16, :979). Theimportance of the President's effort is clear. In 19o0 alone,the United States will spend $90 billion for foreign oil.That amount is equal to the net assets of General Motors,Ford, IBM, and General Electric combined. Projecting thisrate of expenditure for the next 12 years will mean that inlittle more than a decade the United States will have paid outcasn equivalent to the trading value of all the stocks listedon the New York Stock Exchange (Sawhill, April 14, 1980).
The horrible potential of spending over a trillion dollars inthe next decade for foreign oil lends a sense of added urgencyto the President's import reduction program. That programwould:
--create an Energy Security Corporation to directthe development of 2.5 mbd of oil substitutesfrom coal liquids and gases, oil shale, biomass,and unconventional gas by 1990.
-- establish a three-member Energy MobilizationBoard empowered to expedite permitting andconstruction of critical energy facilities.
--provide new incentives for development of heavyoil resources,- unconventional gas, and oil shale.
--require utilities to cut current oil consumptionby 50 percent, saving 750,000 mbd.
'Legislative Director, Office of Senator Gaylord Nelson,U.S. Senate; Associate Professor, Dept. of Social Science,Michigan State University; 5209 Waterview Drive, Rockville, MD20853.
105
126
- -establish a major new residential and commercialconservation program designed to save 500,000bd by 1990.
- -provide $2.4 billion annually in energy assistanceto low-income families in the United States.
- -provide a total of $16.5 billion over the comingdecade for improvements in the nation's masstransportation system and in automobile fuelefficiency.
If this program were.to work, oil imports could be cut in halfby 1990, that is to 4-5 mbd. To achieve this objective, thePresident proposed spending $142.2 billion over the nextdecade. Of this total, the largest amount, $88 billion, wouldbe obligated to the Energy Security Corporation for thedevelopment of .synthetic fuels. Oil and gas produced fromcoal is likely to dominate that synthetic fuel effort.
The legislation to make the Pres7ident's proposals law beganits laborious journey through the Congress in the summer of1979. Not until May of 1980 did a conference committeebetween the House and Senate finally agree on the componentsof the controversial Energy Mobilization Board (EMB)legislation. The conference, discussing the equallycontentious legislation forming the Energy SecurityCorporation (ESC), which will award the development money tosynthetic fuels producers, may remain in session throughoutthe summer of 1980.
It is easily understood why these two components of thePresident's program have attracted so much attention. The ESCwill have not only the power to provide badly needed capitalfor energy development, but it will have the prerogative ofsetting up its own federal plants if the private sector doesnot move with enough speed. The EMB legislation has alsobecome provocative because it is viewed as a mechanism forwaiving or bypassing existing jurisdiction for governmentalregulations (for example, if the Environmental ProtectionAgency or the Department of Interior fails to decide in atimely fashion on an Environmental Impact Statement: SenateBill 1030, U.S. Senate).
That these two provisions passed the Senate and the House withcomfortable margins is a commentary on the times. Gas lines,consumer revolts over energy prices, and political instabilityin the OPEC nations have led to a renewed call for energyindependence by the public and their political leaders. Whiletotal independence.(i.e., reliance solely on domestic energysources) can only be a distant dream now, a drastic reductionin foreign. imports is possible. President Carter's importreduction program is basically a sound one but its mostsignificant component, the one most likely to contribute to
106
127
import reduction in a sizable and rapid way, has receivedlittle attention.
The greatest potential for relatively immediate relief fromreliance on foreign oil is the conversion of oil and:. gas -firedutility boilers to burning coal. Contained in the PowerplantFuel Conversion Act of 1980, this provision would order 107existing plants to convert to coal. These plants, alreadyapproved for conversion environmentally by the EPA, couldreduce imports by 1 million barrels of oil a day by 1990. Thetechnology is known, the need for saving oil is ever-presentbut, nevertheless, this legislation is in trouble. Why? Theanswer to this question most eloquently yields insight intoAmerica's energy-environment predicament, or what may betermed the energy-e.ivironment conundrum.
America will have to burn even larger amounts of coal over thenext 30 years. As a recent study indicates, this trend willbe true also for most other industrialized nations in theworld (Wilson, 1980). The World Coal Study (WOCOL) of coaluse trends suggests the following:
--that coal can provide up to two-thirds of thenew energy required between 1980-2000.
- -that coal is easily available and minable inincreasing amounts.
- -that steam coal production, used in boilers,will have to increase by 1000 percent over thenext 20 years.
- -that enormous amounts of capital will have tobe forthcoming from the coal producers them-selves if this development is to occur in atimely fashion (this money will have to begenerated predominantly by the U.S., Canada,Australia, and South Africa br'cause thesenations control the largest coal deposits).
- -that OPEC's price increases in 1979 erasedthe cost advantage (on a Btu basis) whichoil previously held over coal.
Notwithstanding the findings of this study, the history andthe future of coal burning in America is full of obstacleswhich have forced our continued reliance on foreign oil. Thecurrent coal program of the Carter administration is designedto alter this trend, increase demand for domestic coal, andreduce oil and gas use for electric generation. The programconsists of five parts:
107
128
--a $10 billion, ten-year program to reduceutility oil and gas consumption by theequivalent of one million barrels of oildaily, replacing them with coal and otherfuels;
--an acceleration of coal leasing on federal land;
--a program to increase coal exports to the 80million ton per year level by the end of thedecade;
--$20 billion for the first phase of a programdesigned to create a synthetic fuels industry,which could be producing the equivalent of asmuch as two million barrels of liquid andgaseous fuels per day by 1990;
--rapidly growing investment in coal research anddevelopment, which will top $1 billion in 1981.
The Powerplant Fuel Conversion Act of 1980 is the crucialmechanism of the Carter coal program. In phase I it providesfor grants of $3.6 billion for partially defraying theutilities' costs of conversion. In as little as one yearafter the passage of this bill, some of the conversions wouldbe complete and we would see a reduction in oil consumption.By 1985, all 107 conversions should be completed, reflectingan increased coal demand of 40 million tons per year, anincrease of approximately 7 percent over current annual coalproduction. In phase II under this act, 600,000 barrels ofoil a day could be saved through a $6 billion incentive toutilities with coal-capable facilities and others which wouldhave to undertake new construction (Sawhill, May 5, 1980).
Unfortunately, this legislation has encountered at least fourobstacles in the current Congress. In his commentsintroducing the hearings on this bill, Representative JohnDingell, Chairman of the Subcommittee on Energy and Power ofthe House Committee on Interstate and Foreign Commerce,summarized these obstacles as follows:
--questions about the accuracy of the plantsspecified for conversion
--propriety of using federal funds to financeconversions which the electric power industryshould initiate on its own
--potential for state revision of utility regu-lation laws serving as an incentive to theprivate sector, and, therefore, substitutinglocal capital for federal support
108
12n
--and the consistency of coal conversion withenvironmental standards (Dingell, April 16,1980).
Space requirements in this paper necessitate limitingdiscussion to the fourth obstacle, the consistency of energydevelopmerie-",,- and use with environmental standards. But, onemore generic comment about coal conversion legislation isappropriate here.
In 1978, this writer presented a paper on the Powerplant andIndustrial Fuel Use Act of 1978, the first coal conversionbill (Gottlieb, 1978), which had just passed the U.S. Senate.It was the thesis of that paper, that the 1978 bill would failin its mission to convert plants to coal because there weretoo many exemptions allowed for in the legislation. At theDingell hearings on the Conversion Act of 1980, CongressmanNick J. Rahall, Chairman of the Congressional Coal Caucus,testified that in the two years since the original bill waspassed only-one plant in the entire United States actuallyconverted to coal as a result of the 1978 Act (Rahall, April16, 1980). The 1980 Act is designed to correct the flaws inthe earlier bill and to supplement the move to coal on agrander scale, if the obstacles indicated above can beovercome.
Environmental obstacles to energy development and use are notnew. Protecting the environment against rapacious energydevelopment or capricious energy use is of the utmostimportance. There would be little sense to a society whichhad easy access to energy and a strong energy-based economy ifthe environmental compromises which made the energy availablehad rendered the living environment unsafe or undesirable.Unfortunately, America's recent efforts at developing anational energy policy, instead of protecting the environmentby fostering carefully planned energy development, hasendangered the environment unintentionally. The contentiousdebates surrounding Congressional energy policy developmentreflect regional and economic differences, energy consumer andproducer differences, and. differences between the White Houseand the Congress. All of these differing points of vieweventually coexist along an energy-environment continuum whichranges from the extreme view of "more energy at any ,cost," tothe equally extreme view favoring an "undisturbed environmentat any cost." Any group or faction, even a small one in theCongress, for example, can retard legislative development byengaging in the procedural tactics of delay. As aconsequence, urgently needed legislation which ought torequire only months for passage, can consume more than a year,or in some cases, more than one entire session of Congress.
When energy legislation is involved in this process of delay,the result is that lengthy energy development programs are
109
130
postponed. While the development is postponed, the demand forenergy continues to grow and the existing supplies of energycontinue to reach their point of exhaustion. If energydevelopment is orderly and well-timed, it can be scheduled tomeet demand in a way which enables other crucialconsiderations such as the environment to be fully considered.
However, the public cry for energy will be met by compro-mising other variables, and environmental quality is one ofthe first to be compromised.
The two major environmental issues involved in increased coaldevelopment are increased concentrations of carbon dioxide(CO2) contributing to a "greenhouse" effect, and increasedsulfur content leading to "acid rain." Much,has been said andwritten about each of these problems but there is little whichis conclusive. Both are bonafide problems which require moreresearch and demand the best available technology to controltheir harmful effects. But there is a danger in excessiveoptimism or, for that matter, pessimism over the environmentaldanger from these problems.
The official position of the Department of Energy (DOE) on theCO2 question is that increased coal use will mean increasedcarbon dioxide, but that the extent of the effects are notknown now. Additional study is being funded by DOE todetermine the effects. In a letter to Representative AlUllman, Assistant Secretary of Energy George Fumich commentedon the uncertainty of the conclusions which can be drawn fromthe data (Fumich, July 31, 1979). Fumich's point iscorroborated by a study done by an Ad Hoc Study Group of theNational Research Council (NRC). This study contends that therole of the deeper waters of the oceans as a sink for excessCO2 might well mitigate the problem of perceptibletemperature changes. The NRC panel called for additionalstudy, and concluded that more reliable estimates would haveto await more sophisticated computers which would enablescientists to predict locations and intensities of regionalclimate k.;!-Ianges more accurately (NRC, 1979).
Problems with the reliability of CO2 estimates encouragedistrust of all but the most general policy recommendationsbased on CO2 data. In July of 1979, the Senate GovernmentalAffairs Committee conducted a symposium on carbon dioxideaccumulation in the atmosphere. Drawing on the world's topscientists in this field, the Committee's findings suggestthat the effects of CO2 buildup on "agricultural zones,growing seasons, and marine productivity are still in therealm of speculation" (U.S. Senate, 1979). 'While theparticipants could draw general conclusions and identifytrends, they could not achieve precision on any dimension ofthe problem. Consequently, they too concluded that additionalresearch, testing, and computer modeling would be needed.
110
131
This symposium focused on the potential CO2 buildup from amassive increase in synthetic oil and gas fuels from coal.Since the CO2 emissions from synthetics are twice that ofnatural-gas, 1.7 times more than oil and 1.5 times more thancoal itself, the symposium members recommended havingavailable non-fossil fuel energy alternatives which couldsupplant synthetics if evidence of CO2 buildup were tobecome more conclusive. However, they made no recommendationon the substitution of coal-fired utility generators foroil-fired 'generation (U.S. Senate, 1979). Considering thatCO2 emission levels from coal and oil are similar, the 1980Powerplant Fuel Conversion Act should not be attacked forincreasing CO2 emissions per se since the electricitygenerated from coal would be merely substituting for existingelectric generation from oil.
Acid rain is another of the environmental obstacles which mustbe dealt with in the move to coal called for in the 1980Conversion Act. Burning of untreated high sulfur coal inpower plants will increase the acid content of the air and,therefore, eventually the lakesibelow that air. Such aciditycould poison fish, contaminate drinking water, damage forestand farm crops, and increase corrosion. Evidence emanatingfrom Sweden, Norway, NeW England, and the Midwest confirms thepotential of these dangers.
Clearly, by conserving energy generally we can, by carefulplanning, reduce the use of fossil fuels specifically. Suchconservation by definition reduces the CO2 buildup and theacid rain threat at one time. Still, one gains little comfortfrom the preceding relationship when one realizes that as theavailability of oil declines and its price increases, Americawill turn to coal for reasons of national security as well aseconomics. Being successful with conservation is one methodfor reducing the use of imported oil. But it cannot succeedby itself. Since adequate alternative energy sources will notbe in operation on a scale large enough for some time to come,the likelihood is that the primary "oil-backout" method willbe through coal conversion. Therefore, the sulfur question,must still be answered.
While there is much to be learned about the causes and effectsof acid rain, the oxides of sulfur and nitrogen which arereleased when fossil fuels are burned can be controlled bycurrent technology both before and after the burning process.Congressman Rahall at the House hearing on the 1980 FuelConversion Act, called for expansion of the Act's $10 millionfunding for coal preparation facilities. This kind ofpreparation can remove 90 percent of the sulfur in raw coaland can take the place of more expensive pollution controlequipment. Depending on the ambient air quality of theparticular region on which the conversion to coal will occur,stock emission controls can also be used as a substitute orsupplement.
111
The Act also provides $400 million to utilities for equipmentto reduce acid rain by reducing sulfur dioxide and nitrogenoxide emissions. Grants for scrubbers and coal cleaning areprovided. While this amount is not adequate to cover theentire problem, it is a credible beginning which can be
_increased in subsequent legislation.
Any form of control technology inevitably involves cost andenvironmental controls are particularly expensive. In newpower plants, scrubbers will represent 11 to 12 percent of thecapital cost of a system. In a 500-megawatt Plc,nt, $67million will be spent on cleansing the emissions of sulfuroxides. The costs for retrofitting an old plant are 25percent higher. But in rational terms, these costs areminimal when compared with the potentially permanent costs oflost natural resources. For years Americans have purchasedenergy cheaply. Seldom was the consumer's expense for energyequal to the replacement cost of that energy. But, in thecurrent politically charged election atmosphere with afaltering economy, asking businesses to convert to coal, paysubstantially for pollution control equipment, and pass onlypart of thai cost along to consumers already angered by risingenergy costs, is more than most politicians are willing to do.Unfortunately, in the final analysis, even technical questionsabout acid rain policies evolve into political questions whicheclipse the environmental considerations.
The technicians and policymakers at EPA genuinely believe thatutilities should be required to clean their coal before theyburn it, as a way of reducing acid rain (Wall Street Journal,March 28, 1980). But these officials of the CarterAdministration must battle other Carter people in the WhiteHouse, the DOE, and the Office of Management and Budget (OMB),people with a different set of priorities. The DOE officialswant to keep conversion costs low to encourage more companiesto convert. The OMB people want to keep costs low so that DOEwill award fewer grants and subsidies (i.e., less federalspending) to encourage conversions. And the officials in theWhite House want lower costs and fewer regulations so they canbalance the budget, appeal to the business sector, reduce oilimports, use more domestic energy sources, and--get reelected(Jaroslovsky, March 28, 1980).
According to EPA, existing state air quality laws are notadequate to handle a major national coal conversion program.But EPA realizes that the Congress will not tighten thefederal law in the present economic and political climate.Therefore, EPA will try instead to make tight pollutioncontrols a condition which must be met before a utility canget aid under the 1980 Powerplant Fuel Conversion Act. DOEopposes that policy option because it will jeopardize passageof the legislation and discourage utilities from full
112
1=3
participation in the program. Clearly, these are nottechnical problems; they are political problems. If thesepolitical problems persist, other critics of coal conversionand/or government subsidies may try to kill the bill for thissession of Congress. Some environmentalists may cheer thatresult but they would be misguided if they did so.
If the 1980 Powerplant Fuel Conversion Act fails to pass, ourdependence on foreign oil will continue and neither the CO2nor the acid rain levels will be reduced significantly. Butthe failure to move to coal conversion in an orderly way willsurely hasten the day when the unrestrained use of coal willbecome a reality. With all the potential for environmentalproblems posed by coal burning without adequate controls,environmentalists might be better off supporting this bill nowand lobbying for whatever controls they can secure. Politicsis the art of the possible. The 1980s will be a difficultdecade for environmentalists. If they want to maximize theirgains in the legislative arena, they will have to set theirsights on that which is "possible" right now.
The Powerplant Fuel Conversion Act of 1980 passed the Senateby a vote of 86-7 on June 24, 1980. But the bill no longercontains the $6 billion worth of coal conversion incentivesproposed by the Carter Administration. The Senate cut theseincentives from the bill discouraging increased coal usage.An additional obstacle to coal use in the bill was the delaypermitted for conversions of natural gas utilities to coal.Natural gas states lobbied for and received a concessionpermitting natural gas utilities to remain in operation untiltheir useful life had been exhausted. This provision, as withso many others in Congress during the last two years,diminishes the likelihood of domestic coal playing thedominant role in weaning America from excessive reliance onforeign oil.
On a related matter, the Senate defeated the CongressionalConference Committee's report on the Energy Mobilization Boardlegislation. The creation of the Board, to accelerate energydevelopment had been , opposed by a coalition ofenvironmentalists and pro-business forces. Theenvironmentalists feared the Board's potential for overridingexisting environmental regulations while the businesssupporters opposed the imposition of a new government agencyinto what they prefer would be a matter entirely for theprivate sector. The defeat of this conference report maydefeat this legislation for the foreseeable future.
113
1 `-` 4
REFERENCES
"Carbon Dioxide and Climate: A Scientific Assessment."Published by the Climate Research Board of theNational Research Council, Fall 1979, Washington, D.C.
"CO2 Symposium: Findings and Recommendations." Publishedby the Committee on Governmental Affairs, U.S. Senate,Washington, September 1979, p. VII.
Dingell, John D., Representative. 1980. Comments beforethe Subcommittee on Energy and Power. Washington,D.C.: U.S. House of Representatives, April 16, 1980.
"EPA is Mulling Ways to Combat Acid Rain." 1980. WallStreet Journal, March 28, 1980, p. 18.
Fact Sheet on the President's Import Reduction Program.Published by the White House, July 16, 1979.
Fumich, George. 1979. Department of Energy letter datedJuly 31, 1979.
Gottlieb, Kevin C. 1978. "The National Energy Policy: AnExamination of Coal Conversion Legislation." CurrentIssues in the Environment 1978, National Associationfor Environmental Education, Fall 1978.
Jaroslovky, Rich. 1980. "Carter Plan to Aid Utilities'Switch to Coal Sparks Bitter Feuding Among Advisers."Wall Street Journal, March 28, 1980, p. 18.
Rahall, Nick J., Representative. 1980. Testimony beforethe Subcommittee on Energy and Power. Washington,D.C.: U.S. House of Representative', April 16, 1980.
3awhill, John C. 1980. "The Bright Promise of Coal inthe '80s." Washington, D.C.: U.S. Department ofEnergy. Address, American Mining Congress, May 5, 1980.
Sawhill, John C. 1980: "The Dynamo of Energy Independence."Johnstown, PA: U.S. Department of Energy Address,April 14, 1980.
Senate Bill 1030. U.S. Senate. Government Printing Office.
Wilson, Carroll L. (ed.). 1980. Coal: Bridge to theFuture. New York: Ballinger Publishing Co.
114
DESIGNING TRANSIT TO MINIMIZE URBAN COSTSAND ENERGY USE
J. Edward Anderson'
Abstract. Analysis of characteristics of transit systemsleads to the conclusion that guideway-transit costs and energyuse per person carried are minimized if the system uses small,automatically controlled and electrically powered vehiclesoperating on-demand and nonstop between off-line stations in anetwork of narrow guideways. Since the system takes verylittle land, is quiet and nonpolluting, it can catalyzeremarkable improvements in the urban environment.
Scheduled and Demand-Responsive Systems
Conventional city buses, streetcars, and rapid rail systemsoperate on fixed schedules. To give the potential patronconfidence in the service provided, these schedules must bepublished, maintained, and not often changed. Vehicles mustmove whether or not people are in them. As demand declinesafter the peak periods are over, the average vehicle occupancyalso declines, usually markedly. To keep operating costsreasonable, the schedule time between vehicles, or headway,must increase. But with less frequent service, fewer peopleride than would have ridden. if the rush period headway hadbeen maintained. Because of high operating costs, theWashington, D.C. Metro Authority decided to stop subwayservice after 6 p.m. and on weekends. While the energy useper seat-mile of large vehicle, scheduled systems is generallyvery good, the system energy use in energy per person carriedper mile averaged over a 24-hour period is disappointing.*Space and time variations in travel demand fundamentally workagainst the efficiency of these scheduled systems.
The automobile, on the other hand, provides purely demand-responsive service. When it is not in use, it does not cruiseempty but remains stationary and wastes no energy./ But when itis moving, it uses more energy than is theoreti5lly necessaryfor two reasons. First is its large weight per personcarried. New small cars- may weigh as little as 500 to 600pounds per seat, but the rush period occupancy is only about1.2 persons and the daily average is about 1.6 persons. Ifthe car could be made smaller and lighter, less dead weightper person would be carried. However, the vehicle would not
1 Department of Mechanical Engineering, University ofMinnesota, 111 Church Street, S.E., Minneapolis, MN55455.
115
not be as useful for all of the kinds of trips people want totake and would provide less protection during collisions.Second, during an urban trip, the automobile typically makesmany stops. Each time it stops, its kinetic energy isconverted to heat in the brake linings. To accelerate theautomobile back to cruising speed, the kinetic energy must berestored.
The taxi is a demand-responsive system, but often cruiseswithout paying passengers just to attract fares. For thisreason the taxi inherently uses more energy per person wishingto travel for serious purposes than the private automobile.Of course, because the private automobile lends itself to joyriding, it leads to much waste of fuel. The group taxi servicecalled "dial-a-ride" is also not very efficient because of thecircuity of the trip required to pick up and drop offindividuals having different origins and destinations.Commuter vans are quite efficient because of the commonorigins and destinations of a group of persons living in onecommunity and working at the same location; however, thefeature of common origins and destinations makes this serviceconcept unsuited to general transit requirements.
An Ideal System
An ideal transit system from the viewpoint of energyminimization would be demand-responsive like the private auto,of minimum weight-per-seat (or per place if standees arepermitted), able to provide the maximum ratio of occupiedseats per place (called the load factor) over a 24-hourperiod, able to travel nonstop at a modest speed from originto destination, and still able to provide general transitservice.
To understand what kind of system this might be, it isnecessary to understand that the weight-per-place of transitvehicles is quite independent of vehicle size. Figure 1 showsdata from the Lea Transit Compendium (Lea, 1975), whichreports on almost all transit vehicles in the world. Vehiclesof size from those with only three seats to rail cars carryingupwards of 200 passengers,many of whom must stand, can bebuilt in the range of 300 to 400 pounds per place. Fromsimilar data, one also finds that the cost of transit vehiclesper place also varies very little with capacity (Anderson,1978; Cooke, 1980).
This means that transit vehicles can be purchased for roughlythe same amount per pound regardless of size. The cost of therequired vehicle fleet is therefore proportional to fleetcapacity. But the required fleet capacity is proportional toaverage trip time, and for a gi',2n cruising speed the triptime is decreased if the number of intermediate stops isdecreased. Thus, the nonstop trip of the ideal systemminimizes not only energy use, it minimizes the fleet cost.
116
37
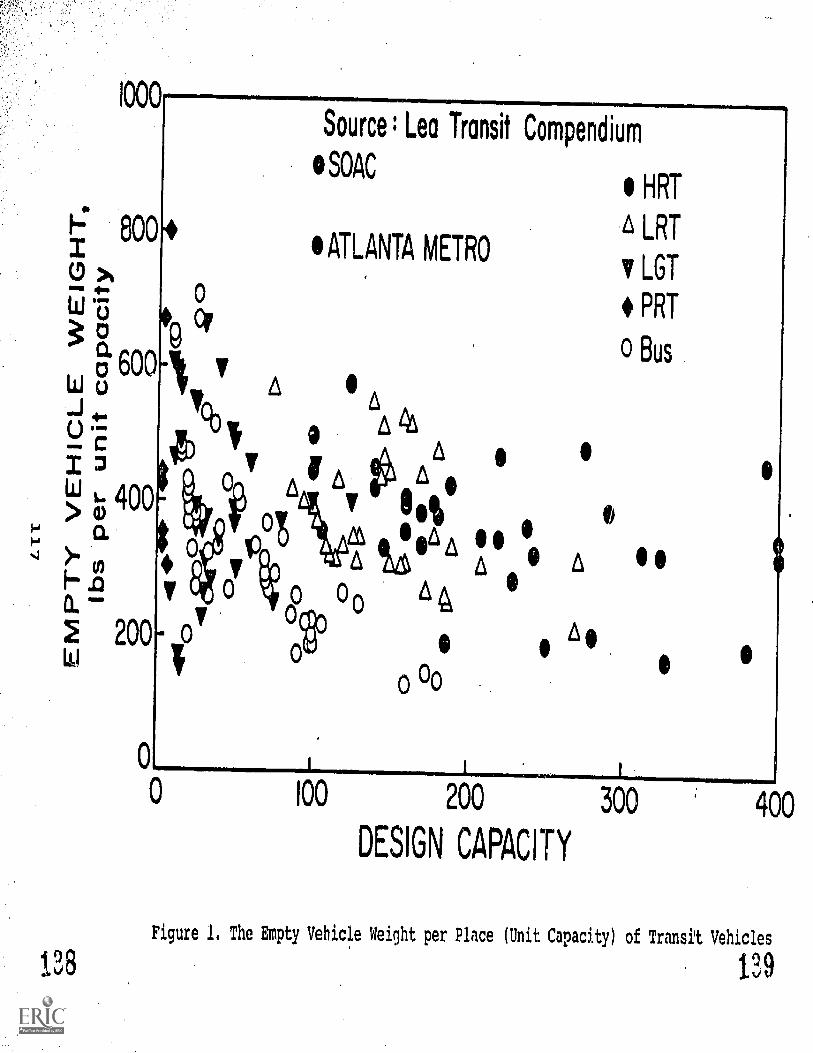
1000Source: Lea Transit Compendium
SOACo HRT
A LRT
v LGT
PRT
o Bus
: 800'ATLANTA METRO
o z,o
W '50 Cv
° g
W u 7a600 1 V
..I T A4.o . Cb
IA 41
Avp A 0 0
0° AA!
ot A V 8% 00
P AW I- 400
%; °.. I 0 p- o 'A A IOAA etpn at A 0 in, 0 01-..nO.
V 0 'Io 00 A ItA .- oy
Oct2 200 o o
A ow i ou
0 oo
100 200 300
DESIGN CAPACITY
0 I
I
400
Figure I. The Empty Vehicle Weight per Place (Unit Capacity) of Transit Vehicles
138 1?,9
Automation
If the vehicles have paid drivers, most of the operating costis in driver wages. In this case it is advantageous toincrease vehicle size to amortize driver wages over as manypassengers as possible. But, for general transit service,large vehicles must run on fixed schedules because that is theonly practical way groups of people arriving at differenttimes and headed to different destinations can beaccommodated.
If the vehicle does not have a paid driver, the driver may beone of the passengers or the vehicles may operate underautomatic control. In the former case, the vehicle is eithera commuter van or a private automobile. The commuter van isvery efficient for the trip it takes from a community to onework place and back, but as mentioned above, it is not suitedto general transit service. If the vehicles are automaticallycontrolled, there is no economic advantage to large sizebecause the initial cost per place is near17 independent ofcapacity, even including the automatic controls. This is truebecause control and failure-management functions can beperformed by microprocessors.
An examination of the data on various operating automatedtransit systems also shows that operating and maintenancecosts per place-mile are only weakly correlated with capacity(Cooke, 1980). Energy use and operating costs of the wholesystem are therefore proportional to the number of place-milesper day. It has been shown from simple analysis (Anderson,1980) that, in moving a given number of persons per day, apurely demand-responsive system requires only one-half toone-third as many place-miles per day as a scheduled system,and that the energy use of well-designed systems fordemand-responsive versus scheduled service is in about thesame ratio.
Automated vehicles can run at very slow speeds in mixedtraffic, but to move at speeds significant enough to use thesystem for general transit service, and to keep the feature ofnonstop trips, the system must run on an exclusive guideway.Thus, the concept of an "automated guideway transit" or AGTsystem emerges. In spite of automation difficulties with BARTand Morgantown, over a dozen AGT systems are now in successfuloperation in the United States, Japan, and Germany. Anexclusive-guideway system clearly cannot be ubiquitous as isthe automobile, but this feature can be turned into anadvantage. By being able to go everywhere, the automobile hasmade possible very low density urban areas in which theaverage trip lengths are very long and fewer trips can betaken by walking than would be the case with higher density.
118
14n
The only economical way an AGT system can provide purelydemand-responsive service 24-hours a day, and hence theminimum number of- place -miles per day per person carried, isto make the vehicles small enough so that each vehicle can beused economically for a party of one, two or three peopletraveling together. A vehicle with one seat for three personsis large enough and is a good configuration for safe operation(Anderson, 1978). If the vehicle is larger, the requirementto maximize the load factor means that it must'Wait for morethan one party. But, it has been shown (Anderson, 1978) thatthe wait time for the second party in general is excessive,even in the rush period, and vehicles will often have to leavethe stations with only one party aboard.
Capacity
Demand-responsive service cannot be provided if the stationsare on line, and certainly the capacity will not be adequatein such a system if each vehicle has room for only threepersons. Therefore, the stations must be placed on bypasstracks off the main lines. With off-line stations, thevehicles can be caused to wait at stations for service 24hours per day without interfering with through traffic.Empty-vehicle movement is required to account for varyingdemand from station to station, but the movement is strictlyin proportion to demand. Studies of 'station capacity (Irving,1979) and potential station demands (Anderson, 1978) show thatthe typical station would have three berths or boardinglocations, and rarely would a station be required to have morethan six to ten berths. Crowds would rarely accumulate becausethe vehicles leave the stations once every few seconds. Thisdoes not mean, however, that the passengers would need todeboard and board quickly. By moving the vehicles through thestations in platoons of size equal to the number of berths,the unloading and loading time is kept adequate and well abovethe average time for each vehicle to pass through a station(Irving, 1979).
With off-line stations,the line capacity is not restricted bythe delay of vehicles in stations. Maximization of linecapacity requires careful study of tine kinematics ancl dynamicsof emergencies in which a vehicle fails in such a way that itslows down quickly. With an exclusive, grade-separatedguideway, very sudden stops would occur rarely. If thevehicles are propelled and braked through wheels, the maximumsafe flow is about twt. seconds per vehicle if the passengersare seated (Anderson, 1978; Irving, 1979). If adult standeesare permitted, the maximum flow is decreased by 30 percent.
119
141
Two seconds per vehicle is equivalent to 1800 '7ehicles perhour, a capacity of about one freeway lane at the optimumspeed of about 35 mph. Since this capacity is too limiting inmany cases, it is necessary to examine alternative means ofpropulsion and braking. Much analysis and testing has shownthat the linear electric motor is the best choice for thisapplication. It permits positive traction regardless of wateror ice on the guideway, can be controlled readily and veryrapidly (in tens of milliseconds), provides adequate forcelevels, is very quiet, and has no moving parts to maintain. Atthe present time, there are about a dozen linear electricmotor AGT systems under development or in operation in theUnited States, Canada, Germany, and Japan. With the linearelectric motor, kinematic analysis shows that it is practicalto consider operation eventually at a capacity of about fourvehicles per second maximum, thus providing a flow equivalentof not one but eight freeway lanes, a capacity rarely needed.The conclusion is that a small-vehicle AGT system of properdesign-will not be capacity limited.
Dependability and Safety
To make such a system (or any AGT system) adequate in terms ofservice dependability, critical on-board systems such ascontrollers, motors, and brakes must be redundant and failuremonitored. If trey are, analysis and testing show that thesystem will be much more reliable than existing systems evenif the smallest vehicles are used (Anderson, 1978; Irving,1979; Hobbs, 1977). With the fault-tolerant features ofredundancy and failure monitoring, collisions betweenvehicles will be rare, but because one can never be sure theywill not occur, the vehicle must be designed to withstandcollisions. If the vehicle is designed with a three-passengerseat and a padded dashboard in front of the passengers, theuse of constant-force, constant-displacement hydraulic shockabsorbers provide adequate protection at speeds up to 25 to 30mph. At higher speeds, seat belts or airbags are recommended.
One more factor needs to be taken into account to provideadequate capacity and safety--the switch. The vehicles mustbe able to switch quickly and separately from the main line toan off-line station, and from one line to another. To do thiswith adequate reliability, the moving parts of the switch mustbe in the vehicle and not in the track, This has requiredclever design of both the track and the in-vehicle switch, andduring the 1970s several ways have been found to solve thisproblem.
120
1.12
The Guideway
The guideway itself requires attention right from thebeginning of the design because it is usually the mostexpensive component in the system. The guideway may beelevated, at grade or underground. Underground systems aregenerally the most expensive, and at-grade systems have thegreatest safety problems and land requirements. Therefore,elevated guideways are usually, but not always, preferable.
Two major considerations come from analysis of minimum-costelevated guideways (Anderson, 1978): 1) There is an optimumshape for minimum weight per unit length--a _narrow deep beam.The vehicle therefore must be designed together with theoptimum guideway rather than the guideway designed after thevehicle configuration has been chosen. The difference hasbeen shown to be as much as a factor of five in cost per unitlength. Moreover, the narrow guideway has much smaller visualimpact and is much less of a problem in ice and snow; 2) Withthe optimum guideway shape, the weight per unit length of theguideway is minimum if the vehicle weight per unit length isminimum, and the vehicle weight per unit length is minimizedif its width and height are minimized. A vehicle designed forthree adult passengers seated side by side provides as small across-section as is practical. If the vehicles were to bedesigned so that the passengers could enter standing up, theywould weigh significantly more per unit length and would besubject to much higher lateral wind loads. Thus, therequirement of cost minimization of the guideway leads to therequirement that every adult be able to sit.
Characteristics of an Optimum System
The criterion of minimum vehicle movement to minimize energyuse and the requirements of cost minimization lead to anautomated guideway transit system using three-seated passengervehicles moving in direct response to demand between off-linestations along a system of narrow guideways. The vehiclesshould be propelled by linear electric motors. They shouldhave redundancy in critical subsystems monitored by amicroprocessor, and the moving switch elements should be onboard :he vehicles. The memory of the destination stationshould be stored aboard each vehicle, which moves its switchto guide itself along the proper path through a network ofguideways in response to commands from wayside diverge-pointcontrollers, and should contain intelligence needed to respondproperly to emergency situations. Station computers commandthe flow of empty vehicles in response to present demands, orwith experience, with anticipated demands, and a centralcomputer provides only the functions of optimum monitoring ofempty vehicles and flow adjustment to minimize possible
121
1.13
bottlenecks (Anderson, 1978; Trying, 1979). Such a system isdesigned to be fault tolerant--no failure can affect but asmall portion of tha system. Vehicles should carry a batterywith enough energy to reach the nearest station in the case ofa power failure. Such a system is usually referred to as atrue personal rapid transit (PRT) system.
Use of the System
To use a PRT system, the patron (a single individual or agroup of two or three people traveling together) selects thedestination station from a map and orders the trip by pushingbuttons. Lights on a display panel confirm the destinationand show the fare, which can be paid in cash or by creditcard. After the fare is inserted, a magnetically encodedticket is dispensed. The patron takes the ticket to a standin front of the first empty vehicle in line and inserts itinto a slot. The ticket is read into the vehicle memory andits door unlatches. The patrons, traveling together by choiceto a common destination, then get in, close the door and areoff nonstop to their destination, If they need to get offsooner, they press an emergency button which stops the vehicleat the nearest station. To encourage higher vehicleoccupancy and hence minimum vehicle weight per person carried,it is recommended that a fare be charged per vehicle ratherthan per person.
Energy Use
The title of this paper promises discussion of how the transitsystem, the basic characteristics of which are derived above,can minimize urban costs and energy use. Assume that thevehicles weigh 500 pounds per place, a modest amount ofstreamlining is used to reduce air drag, a reasonable amountof attention is paid to reduction of- road resistance, theaverage load is one person per vehicle counting emptyvehicles, and the motor efficiency is 50 percent (reasonablefor a linear induction motor). The energy use 'of such a systemon, a daily basis, assuming an electrical generating plantefficiency of one-third, is equivalent to an automobile system(1.6,persons per auto) averaging about 85 miles per gallon ofgasoline if the cruising speed is 25 mph, or 64 mpg if thecruising speed is 30 mph. If the vehicles weigh 400 poundsper place, the latter figure increases to 80 mpg. In theabove calculation, it is assumed that two-thirds of energyinput to the electrical generating plant is lost to the atmos-phere as waste heat. If most of this waste heat is used in adistrict heating system to heat buildings, the transit systemefficiency in auto-equivalent miles per gallon would besubstantially higher than indicated. In this direct sense, anoptimally designed AGT system can conserve a substantial
122
1 14
amount of energy. 'By comparison, if the same kindof calculation is made for a trolley-car system (a scheduledlarge vehicle system now often called light rail transit) witha motor efficiency of 70 percent, the 24-hour systemefficiency calculated on the same basis.is in the range of 20to 25 miles per gallon.
Impacts on the Central City
The greatest advantage of this optimum AGT system in terms ofits ability to attract patrons and to save energy is obtainedif the system is deployed in a gradually expanding network oflines serving not a corridor but an area of the central city.If the lines are placed half a mile apart, the maximumdistance to a station will be about a quarter mile, consideredto be maximum walking distance in most transit analyses. Anarrow-guideway optimum AGT system, requires land only forsupport posts and stations and most of the stations can belocated in buildings with an elevator in each of them toaccommodate the handicapped. By contrast, the present autosystem consumes about two-thirds of the land in the centralbusiness districts of most American cities. While streetswould still be needed for emergency vehicles and some trucks(the automated system could accommodate most of the freighttraffic in the central city), streets could be narrowed andpartly converted into linear parks and gardens. Coupled withthe very low noise level of linear-electric-motor propulsionand the lack of auto-exhaust pollution, the inner-cityenvironment would become far more attractive than at presentas a place to both live and work. A much more livable higherdensity environment than ever would be possible with the autosystem could be created, and by deliberately not placing thestations too close together, many more trips could be taken bywalking than is common today.
If, instead of areawide networks covering the inner region ofthe city, the system were deployed as a family of line-haulsystems to the suburbs (as indicated above the capacity isadequate to do that), it would encourage continuation of longtrips from home to work and foster present urban sprawl. Itis clear that suburban folk would lobby hard for the line-haulapproach, but it would be better in terms of energy savings tobegin area networks in major activity centers in severallocations and to develop policies to encourage people to livenear their place of employment. In any case, a line-haulsystem will not be attractive as a means of traveling to theAowntown unless one can get around conveniently once there.To begin these small area networks, the jurisdiction fordevelopment cannot be region wide, bJt must encompass only thearea involved, and that area must stand the cost of thesystem. If a metropolitan-wide commission is assigned the
123
11 5*
task of building the system, past experience, such as obtainedin Denver in the period 1972-1975, shows that jurisdictionalfights between representatives of inner-city and suburbs willprobably make effective action impossible.
Status
In the early 1970s many development programs were underway todevelop systems having many of the features of the systemdescribed above. It is well that most of these programsstopped because they contained features that made themnoncompetitive. Others should have continued but did not.Catherine Burke (Burke, 1979) has studied the politicalreasons for difficulty in maintaining development on such aradically new transit concept. The one program that hascontinued for over a decade the development of the truepersonal rapid transit concept as described here is Cabintaxi(Hobbs, 1979). This program has been sponsored by the GermanMinistry of Research and Technology with the work being doneby the joint venture Mannesmann DEMAG Fordertechnik andMesserschmitt-Bolkow-Blohm GmbH. This program has had systemsunder full-scale testing since the summer of 1973 in Hagen,West Germany. The Cabintaxi system has been the subject ofextensive application studies for German cities and is beingconsidered for several American cities. The first Cabintaxisystem is to be built in a suburb of Hamburg connecting ahigh-density region to two U-Bahn stations.
Summary
There is no longer any question that true personal rapidtransit systems can be built with very adequate capacity,safety, service dependability, and for a reasonable cost. Italso seems clear that such a system would provide anunparalleled level of transport service for the denserportions of cities, and, if planned carefully, would seem tobe able to do more than alternative transport systems to lowerurban costs and energy use. The remaining question only thepublic can answer: Should it be built?
REFERENCES
Andersori, Z. E. 1978. Transit Systems Theory. LexingtonBooks, D.C. Heath and Company.
Anderson, J. E. 1980. To be published.
Burke, Catherine G. 1979. Innovation in Public Policy.Lexington Books, D. C. Heath and Company.
Cooke, F.A.F. 1980. "Summary of Capital and Operationsand Maihtenance Cost Experience of Automated GuidewayTransit Systems: Costs and Trends for the Period1976-1979." Report No. UMTA- MA -06- 0069 -80 -1,March 1980.
Hobbs, Vivian J.; Wolfgang Heckelmann; Neil G. Patt; andHarry J. Hill. 1977. "Development/DeploymentInvestigation of Cabintaxi/Cabinlift Systems."Report No. UMTA-MA-06-0067-77-02, December 1977.NTIS No. PB 277184.
Irving, Jack H. 1978. Fundamentals of Personal RapidTransit. Lexington Books, D. C. Heath and Company.
Lea Transit Compendium. 1975. Washington, D.C.: N. D.Lea Transportation Research Corporation.
125
i 7
ANALYSIS OF MORGANTOWN'S PERSONAL RAPID TRANSIT SYSTEM
Gene Bammel and Lei Lane Burrus-Bammell
Abstract. Morgantown was selected in 1971 as the site for ademonstration project in urban rapid transit systems. Althoughthe system cost $120 million more than the original $20million estimate, and operating expenses have quadrupled, thesystem has proved to be a safe, quiet, reliable, efficient,nonpolluting means of urban transit. While rider responseindicates improving acceptance of the system, economicrealities make its continued funding unsure.
Background Information
In 1948, the population of Morgantown, West Virginia comprised18,000 residents and 7;500 students. In 1980, there were36,000 residents and over 20,000 students. In spite of thedoubling in population, public transportation in the city wasvirtually unchanged from 1948 through 1971. Morgantownoccupies a series of steep hills separated by shallow valleys.A roadway wider than two lanes requires an unusual amount ofearth moving. It is a difficult city in which to build modern,four-lane roadways.
Climatically, Morgantown is located at the northernmostreaches of the balmy, moist, southern wind patterns, at thesouthernmost reach of the cold Canadian air masses, and justfar enough inland to receive the tail-end of storms off theAtlantic. The city averages 42 inches of rainfall annually, 3feet of snow, minimum winter temperatures of -15°F., andmaximum summer temperatures of 95°F.
Because of the climatic and geographic features, Morgantownwas deemed an ideal site to test a computer-controlled urbanrapid transit system. It is the home of West VirginiaUniversity, the downtown campus of which is 2.5 miles from thenewer Evansdale campus, and an additional 1.7 miles from theMedical Center.
In July 1969, West Virginia University was awarded a grant bythe U.S. Department of Transportation to study the feasibilityof constructing a rapid transit system in Morgantown. InApril 1971, contracts to build the "Personal Rapid TransitSystem" (PRT) were awarded by the Department ofTransportation, with the Boeing Aerospace Company of Seattleas the principal contractor. The first phase of the system,
'Division of Forestry, West Virginia University,Morgantown, WV 26506.
126
which linkd downtown, the downtown campus, and one stop onthe Evansdale campus, was completed in October 1975. Aftertwo years of operation the system was shut down for one fullyear while a second phase was completed, linking the MedicalCenter campus with the other units. During Phase II, certainproblems which had been discovered with the initial systemwere re-engineered.
The system completed its testing phase as of May 1980, and wasturned over to the University which now has completeresponsibility for its upkeep and performance.
Description of the PRT System
The system consists of five passenger stations, twomaintenance facilities, three boiler stations (which pumpheated ethylene glycol to keep the track from freezing in thewinter), a control center, 8.7 miles of single-lane guideway,and 73 vehicles.
The vehicles are 15'8" long, 6'8" wide, and 8'9" high. Thesmall size of the vehicle was dictated by the fact thatpassenger demand at nonpeak hours is low. The system cantransport 1,100 people in 20 minutes. Each car can carry 20people, and there is a 15-second interval between cars.Maximum speed of the vehicles is 30 mph. The 8,650 poundfiberglass vehicles operate on a 70 hp. direct current motorusing 575 volts; they have four-wheel steering, an-air-bagsuspension system and pneumatic tires.
Two features of the Morgantown PRT system deserve specialattention. First, each car travels nonstop from pickup pointto destination. Since there are no in-between stops, thelongest trip--4.2 miles from downtown to the MedicalCenter--takes 11.5 minutes (Alumni News, 1979). The secondinnovative feature is that the system operates, or canoperate, on demand. As a passenger enters a station, a buttonon the turnstile informs the computer of the desireddestination. When 15 others have chosen the same destination,or within three minut 3, a car will be programmed for thedesired stop.
Three major questions relate to the development and use of asimilar PRT system elsewhere: finances, environmental impact,reliability.
(a) Finances
Reader's Digest (Armbrister, 1977) published an article onMorgantown's PRT entitled, "Anatomy of a Boondoggle." Theauthor pointed out that the initial cost estimate of the PRT
127
11.9
was $18 million. Since the actual cost exceeded $140 million,the overrun exceeded the estimate by a factor of 7.5. Equallydisconcerting is the estimated annual operating expense. Thebudget estimate for 1980-1981 is $2,730,000 (Board of Re-gents, 1980). It is expected that one-third of this amountwill come from student fees, one-third from state government,and one-third from the federal government (which, perhaps assymbolic compensation for unexpected expenses, has namedMorgantown the first "National Transportation Center").
In the years from 1972 to 1980, the cost of operating r:
comparable bus system has more than quadrupled. Operating afleet of inter-campus buses cost $200,000 in 1972, and costover $750,000 in 1978-1979. Robert Bates, in charge ofnon-PRT campus transit, estimated the cost of running a veryefficient bus system in 1980-1981 at less than $1 million.
(b) Environmental Impact
Initial plans for the PRT included a stop at the Universitycoliseum to take advantage of the large parking area as well'as to facilitate access to that facility. This would havenecessitated running the guideway (railway plus electricsystem) through the University arboretum, a major biologicaldemonstration area bordering the Monongahela River. This stopwas eliminated at the insistence of those who felt thebird-life and other scientific and scenic values of the areawould be compromised. The guideways have been constructed sothat they either parallel the highway, are above a railway, orare on University or county property. For the construction ofthe guideway, one single-family residence and one scrap metalyard were removed. The actual construction period did playhavoc temporarily with traffic patterns in several places.Since the.vehicles are powered by electric motors, they arequiet, produce no immediate pollution, and actually providethe riders with some pleasant views of the river and thesurrounding hillsides (Environmental Impact Statement, 1969).
(c) Reliability
From the data provided by the operations manager of the PRT(Barker, 1980), it is clear that reliability has improvedsteadily. In 1976, the PRT was operating 92.7 percent of thetime of its planned schedule, in spite of a very severe winterwith unusually heavy snow storms and several days of sub-zerotemperatures (Sherwin, 1980). In the fall of 1979, with PhaseII operating and the system improved, the PRT provided service96.2 percent of the time. Unfortunately, the downtime usuallyoccurs at peak periods, and is due to one form or another ofsystem overload.
128
150
On March 20, 1980, a vehicle pulling into a station stoppedabruptly. It had broken a steering axle, and the oh -boardcomputer, which monitors a number of potential malfunctions,caused a shutdown, of the entire system (Appezzato, 1980).Twenty-five of the 71 vehicles then operating were found tohave cracks in their 'steering axles. By March 25th, reweldinghad taken place and the system was back in full operation.This interruption of service was the longest in the history ofthe PRT.
The spring of 1980 proved to be a time of very highreliability with a minimum of problems. Minor difficultieswith propulsion systems or with steering mechanisms causeoccasional downtimes of 10 to 15 minutes. During 1979-1980,the largest single problem has involved' the entranceturnstiles: passengers occasionally try to insert a quarterrather than the fare card. This appears to be a human errorfor which turnstile systems, whatever their design, havelittle tolerance. The only accident involving bodily harm inthe five-year history of the PRT system occurred when a younglady twisted her ankle on one of the access ramps in 1978.
Rider Response
The first investigation of rider reaction to the PRT wasconducted by the Office of Economic Research in 1976. Findingsfrom that initial effort indicated that people used the PRTmore than they had the buses, people who lived within aquarter mile of a station decreased their use of automobilesby 16 percent, and that safety "ranked highest in the featurespeople liked about the system" (Sherwin, 1980:1).
(a) Subject Selection and Administration 'of Questionnaire
Students enrolled in both sections of Forestry 140, Resourcesof West Virginia, were administered a short, 25-itemquestionnaire (Appendix A) on March 19, 1980. The purpose ofthe questionnaire was to determine (1) the current studentattitude towards the PRT, (2) whether or not any genderdifferences existed in that attitude, (3) if the amount ofstudent driving in town had been reduced, and (4) studentassessment of expense to the state and federal government.
Students enrolled in Forestry 140 were selected for tworeasons. First, Forestry 140 is classified as partiallysatisfying one of three University "core" requirements andconsequently draws a representative group from the variousschools such as Arts and Sciences, and Engineering. Secondly,Forestry 140 is not taught on the main campus, but rather onthe Evansdale Campus. The provided means of transportationbetween campuses is the PRT.
129
151
Questionnaires (N = 320) were distributed the last 10 minutesof Wednesday's class (March 19, 1980) by the investigators.The students had the option of returning the completed formsin the provided addressed envelopes either through the campusmail system or by bringing it to Friday's class. The Springof 1980 had been selected since the PRT had been closed in1979 for completion of Phase II. Therefore, all sophomores,juniors or seniors, except for transfer students, had beenexposed to both the buses and the completed PRT as providedforms of University transportation. Transfer students hadbeen exposed to the bus system for a week in March when thePRT was shut down due to cracked guide axles. Freshmen do nottake Forestry 140.
(b) Data Analysis
The response rate was 40 percent (N = 128). Overall reactionto the PRT might be classified as neutral in that very fewextreme responses (strongly agree or strongly disagree) werescored, the average item response was 3.9 (response range,1-7). The three strongest responses were 2.3 for Item 4 (thePRT is safe), 2.9 for Item 6a (people usually get the desiredcar in less than 10 minutes of waiting) and 3.0 for Item 13(the PRT has not detracted from Morgantown's visualappearance) (Table 1). No comparable negative (5.0-5.8)scores existed. The strongest response over 4.0 was 4.7 forItem 9 (students would like to return to the buses) whichactually indicated support for the PRT.
Significant differences (.01) between male and femaleresponses were identified for Items 6a, 7, and 15 (Appendix A,Table 1). Males, more often than females, perceived that thewait was less than 10 minutes. Females agreed more stronglythan males that women were "worried about using the PRT afterdark" (Item 7, able 1). The same trend existed for Item 15which referred to females being "worried about using the busafter dark" (Table 1). There was no significant (.05)difference in response pattern between Items 7 and 15 whengenders were separated or combined (Table 2). The indicatedfear is not associated with the PRT but with travel after darkon school transportation. This might also explain why somefemales perceive the wait (Item 6) to be longer than menperceive it to be (Table 1).
130
9
AVERAGE RESPONSES TO TRANSPORTATION QUESTIONNAIRE
Question # X2df N Nb N1X N25Z Total TC
1. 2.878 6 83 42 3.446 3.857 3.584
2. 12.882 6 82 41 3.634 4.341 3.870
3. 6.830 6 el 41 3.086 3.439 3.205
4. 5.768 5 82 40 2.159 2.475 2.262
5. 4.167 6 79 40 3.494 3.750 3.580
6a. 20.885***6 74 45 2.459 3.869 2.924
6b. 7.767 6 72 39 3.861 4.103 3.946
7. 17.108** 6 71 42 4.549 3.833 4.283
8. 3.953 6 81 40 4.556 4.600 4.570
9. 5.170 6 80 36 4.563 4.889 4.664
10. 6.732 6 82 39 4.073 3.641 3.934
11. 2.338 6 77 41 3.545 3.195 3.424
12. 3.327 6 79 40 3.975 3.500 3.815
13. 1.934 6 81 40 2.963 3.075 3.000
14. 4.180 6 77 40 3.818 4.275 3.974
15. 21.445** 6 68 41 4.647 3.732 4.303
16. 3.726 6 74 40 4.284 4.125 4.228
17. 10.670 6 81 40 4.111 3.650 3.959
18. 10.713 6 76 39 3.211 3.308 3.243
19. 5.565 6 79 35 3.241 3.538 3.339
23. 4.296 2 78 40 1.603 1.500 1.568
24. 1.858 6 45 11 35.30% 33. 05% 34.86%
** = significant at .01 level
*. * = significant at .005 level
131
153
a = males
b = females
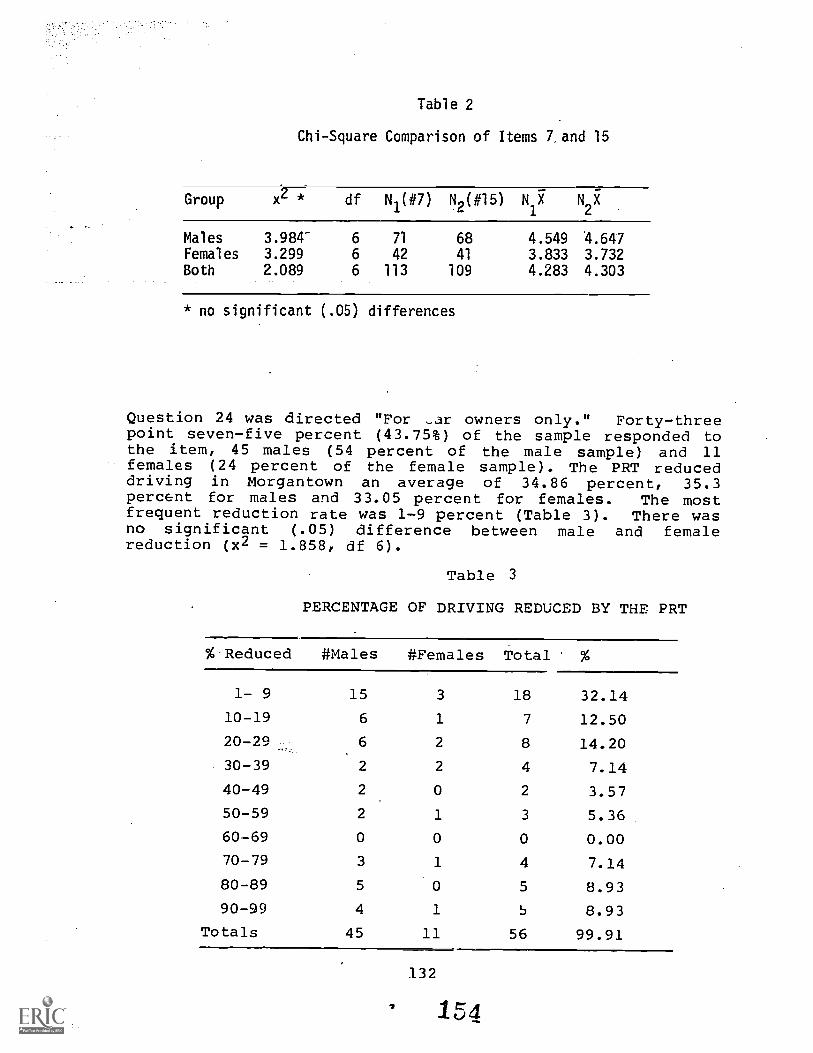
Table 2
Chi-Square Comparison of Items 7 and 15
Group x2 * df N1(#7)
Males 3.984- 6 71
Females 3.299 6 42Both 2.089 6 113
N2(#15) Ni7 N2X
6841
109
4.549 4.6473.833 3.7324.283 4.303
* no significant (.05) differences
Question 24 was directed "For -ar owners only." Forty-threepoint seven-five percent (43.75%) of the sample responded tothe item, 45 males (54 percent of the male sample) and 11females (24 percent of the female sample). The PRT reduceddriving in Morgantown an average of 34.86 percent, 35.3percent for males and 33.05 percent for females. The mostfrequent reduction rate was 1-9 percent (Table 3). There wasno significant (.05) difference between male and femalereduction (x2 = 1.858, df 6).
Table 3
PERCENTAGE OF DRIVING REDUCED BY THE PRT
% Reduced #Males #Females Total %
1- 9 15 3 18 32.14
10-19 6 1 7 12.50
20-29 6 2 8 14.20
30-39 2 2 4 7.14
40-49 2 0 2 3.57
50-59 2 1 3 5.36
60-69 0 0 0 0.00
70-79 3 1 4 7.14
80-89 5 0 5 8.93
90-99 4 1 b 8.93
Totals 45 11 56 99.91
132
Generally, the students did not express knowledge of expensefort the PRT system. One indicator was the high percent of noresponse, 26 percent did not answer or wrote "no idea" forstate expenditure and 24 percent did the same for federalgovernment expenditure. Only 3.9 (N = 5) of the samplecorrectly responded with $40 million for the state while 4.6percent (N = 6) responded with $100 million for thegovernment. The trend was to underestimate the cost, only 5.5percent (N = 7) went over the $40 million mark for the statewhile 13.3 percent (N = 17) exceeded the $100 million for thegovernment.
Forty-one percent (41%, N = 76) of the sample responded to theopen-ended Item 25, "Other comments." The most frequentexpression (N = 13) was for more stations. Others commentedon such matters as inconvenience during breakdown (N = 8), thedesire for extended hours of operation (N = 8), and the needfor improvement during bad weather (N = 4).
Conclusions
Regardless of titles, transit systems can seldom be as rapidas one's own vehicle, nor can they be as personal as a privatecar. There are times when the PRT is the fastest and mostconvenient means of transportation between two or more pointsin Morgantown. Like most cities, Morgantown not only has aproblem with traffic congestion, but also with space to parkall the vehicles driven into the campus or downtown areas.Riding the PRT eliminates this problem for the riders andincreases the number of parking places for those who drive.Some parking space is provided near the Medical Centerentrance and at the coliseum, a short walk from theengineering building station.
With respect to alleviating some Morgantown's severetraffic problems and people-mobility difficulties, the PRT isa great success. As a demonstration center for the kinds ofproblems a transit authority may encounter, it is aninstructive laboratory. As an indicator of how expensive aPRT is likely to be, it is perhaps somewhat misleading. Sincethis was the first of its kind, a number of research anddevelopment costs should not be encountered in futureattempts. But conversely, most other cities are likely tomeet much higher expenses in property condemnations or in thesecuring of rights-of-way. The University or the county ownedmost of the property on which or over which the PRT wasconstructed. Perhaps most important to any city looking formore efficient systems of transit, the costs of constructionhave escalated significantly since the years of the buildingof the PRT in Morgantown.
133
1
Over the last 50 years people have been conditioned to usetheir cars and go wherever they wish, or go nowhere inparticular. Having to walk to a station, wait for a car, andtravel to a predetermined destination may be viewed as a signof a falling standard of living. Perhaps only when theinconveniences are minimal and the economic advantages immensewill a majority of riders enthusiastically endorse a PRT.Meanwhile, the Morgantown Personal Rapid Transit (actually aGroup Rapid Transit) serves as a practical example that arapid transit system can be developed, be made efficient, andprovide safe and dependable transportation to 15,000 or morepeople per day. An annual fight in the state legislature andin the Congress in order to obtain funding .for the PRTindicates that such an expensive solution to urban transitproblems should be analyzed exhaustively before acceptance.Rider response in Morgantown indicates increasing approval ofthe PRT; its high initial cost and expense of operating thesystem might make potential imitators study other alternativesto this particular model of a Personal Rapid Transit system.
REFERENCES
Appezzato, John. 1980. "Car Trouble Causes IndefiniteShutdown." Daily Athenaeum. West Virginia University,March 21.
Armbrister, Trevor. 1977. "Anatomy of a Boondoggle."Reader's Digest, August, 133-137.
Barker, Ted. 1980. (Operations Manager for the PRT.)Tape-recorded conversation, April 18.
Elias, Samy. 1977. "The Morgantown Personal RapidTransit System, M-PRT General Specifications,"January 1.
Environmental Impact Statement for The Morgantown PeopleMover Project: Morgantown, National TransportationCenter, 1969.
Insight. 1979. "PRT: Will Efficiency Continue as WinterApproaches?" December 3:6.
Sherwin, Bill. 1980. "Area Riders Answer Second PRTSurvey." Daily Athenaeum. West Virginia University,March 12, 1-2.
Sherwin, Bill. 1980. "Winter Takes Its Toll on PRT;Malfunctions Not Surprising." Daily Athenaeum. WestVirginia University, February 5, 1-2.
West Virginia University Alumni News. 1979. "StudentsReturn for Fall Semester," September.
West Virginia Board of Regents. 1979. "1980 BudgetRequests," December.
West Virginia University. 1970. "Morgantown PersonalRapid Transit Project Requirements and Constraints,"December.
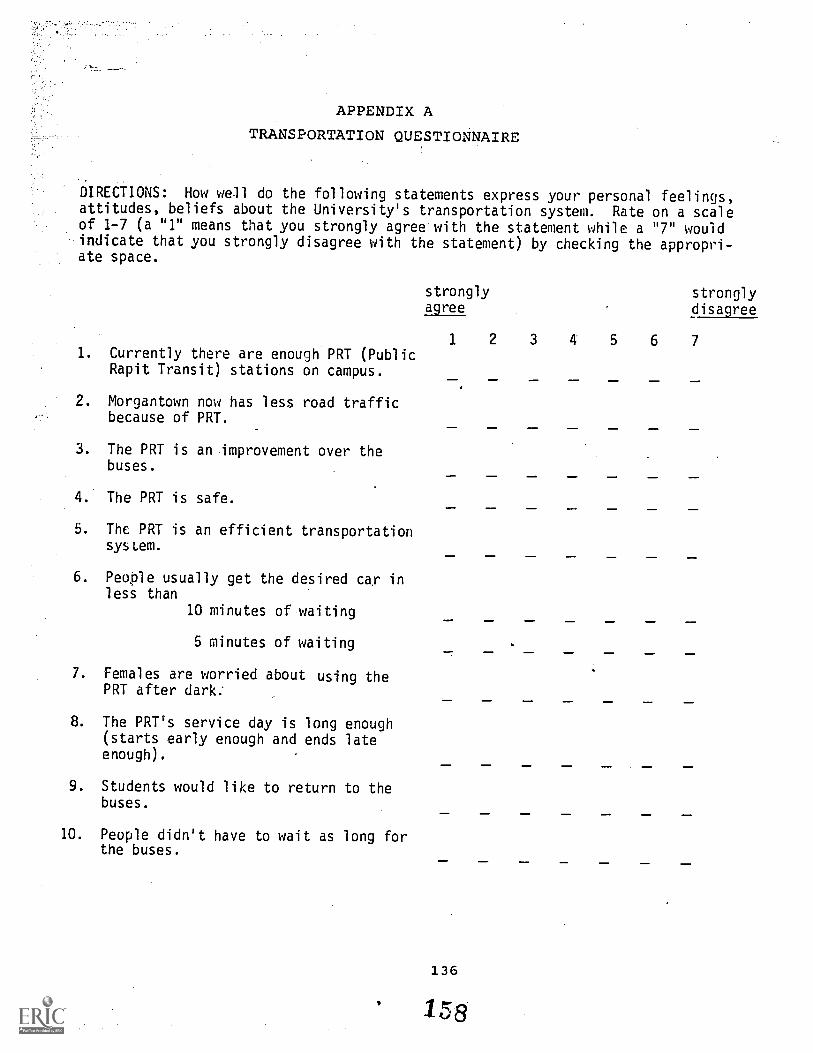
APPENDIX A
TRANSPORTATION QUESTIONNAIRE
DIRECTIONS: How well do the following statements express your personal feelings,attitudes, beliefs about the University's transportation system. Rate on a scaleof 1-7 (a "1" means that you strongly agree'with the statement while a "7" wouldindicate that you strongly disagree with the statement) by checking the appropri-ate space.
1. Currently there are enough PRT (PublicRapit Transit) stations on campus.
2. Morgantown now has less road trafficbecause of PRT.
3. The PRT is an improvement over thebuses.
. The PRT is safe.
5. The PRT is an efficient transportationsys Lem.
6. People usually get the desired car inless than
10 minutes of waiting
5 minutes of waiting
7. Females are worried about using thePRT after dark:
8. The PRT's service day is long enough(starts early enough and ends lateenough).
9. Students would like to return to thebuses.
10. People didn't have to wait as long forthe buses.
strongly stronglyagree disagree
1 2 3 4 5 6 7
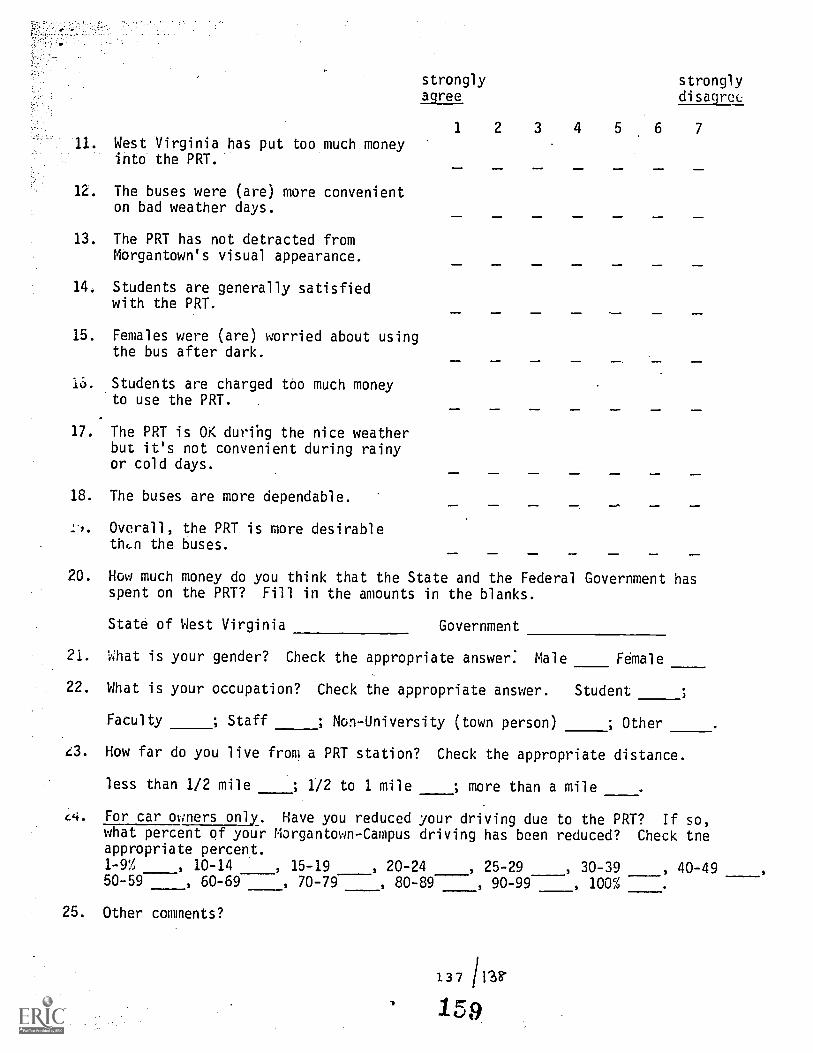
11. West Virginia has put too much moneyinto the PRT.
12. The buses were (are) more convenienton bad weather days.
13. The PRT has not detracted fromMorgantown's visual appearance.
14. Students are generally satisfiedwith the PRT.
15. Females were (are) worried about usingthe bus after dark.
Jo. Students are charged too much moneyto use the PRT.
17. The PRT is OK during the nice weatherbut it's not convenient during rainyor cold days.
18. The buses are more dependable.
1./. Overall, the PRT is more desirableth6n the. buses.
strongly stronglyagree disagree
1 2 3 4 5 6 7
- - -
_ - - - -
20. How much money do you think that the State and the Federal Government hasspent on the PRT? Fill in the amounts in the blanks.
State of West Virginia Government
21. What is your gender? Check the appropriate answer: Male Female
22. What is your occupation? Check the appropriate answer. Student
Faculty ; Staff ; Non-University (town person) ; Other
e3. How far do you live from a PRT station? Check the appropriate distance.
less than 1/2 mile ; 1/2 to 1 mile ; more than a mile
64. For car owners only.. Have you reduced your driving due to the PRT? If so,what percent of your Morgantown-Campus driving has been reduced? Check tneappropriate percent.1-9% , 10-14 15-19 , 20-24 , 25-29 , 30-39 , 40-4950-59 60-69 , 70-79 , 80-89 , 90-99 , 100%
25. Other conunents?
t. ENVIRONMENTAL EDUCATION AND CITIZEN ACTION
Thomas Tanner, INTRODUCTION: ENVIRONMENTAL EDUCATION FORCITIZEN ACTION.
Harold R. Hungerford and R. Ben Peyton, A PARADIGM FORCITIZEN RESPONSIBILITY: CITIZEN ACTION.
R. Ben Peyton and Harold R. Hungerford, AN ASSESSMENT OFTEACHERS' ABILITIES TO IDENTIFY, TEACH, AND IMPLEMENTENVIRONMENTAL ACTION SKILLS.
Lynton K. Caldwell, ENVIRONMENTAL ACTIVISM, PHASE III: THEBURDENS OF RESPONSIBILITY.
Harold R. Hungerford, R. Ben Peyton, and Richard J. Wilke, AFRAMEWORK FOR ENVIRONMENTAL EDUCATION CURRICULUM PLANNINGAND DEVELOPMENT.
Randall Champeau, Michael Gross, and Richard Wilke, ANASSESSMENT OF TEACHERS' UNDERSTANDING AND USE OF "GOALSFOR CURRICULUM DEVELOPMENT IN ENVIRONMENTAL EDUCATION."
INTRODUCTION: ENVIRONMENTAL EDUCATION FOR CITIZEN ACTION
Thomas Tanner'
Abstract. An introduction to this section of the yearbook,including a rationale for, and history of, environmentaleducation for citizen action.
I am pleased to introduce this section of papers dealing withenvironmental education for citizen action, for two reasons.First, because this topic is so important, and represents someof the most exciting, cutting-edge work in our field. Second,because it has been my professional preoccupation for adecade. Hence, the reader will forgive some unavoidable useof the first person singular.
My comments on the papers to follow are necessarily precededby a rationale for, and history of, the work in this area.
Rationale
As we entered the decade of the 1970s, I was very concernedthat the role of citizen action was being seriously slightedin the K-12 curriculuM. Conservation education andtraditional school texts had taught, if I may be permittedwhat is only a slight hyperbole, that we were safe in thehands of Big Brother; government resource agencies had largelysolved our environmental problems and were now steadfastlyprotecting our resources for generations to come. Having beena member of several citizen conservation organizations sinceas early as 1957, I knew this doctrine to be sorelyinadequate. It ignored the fact that the agencies werecreated because of, and then kept somewhat on track by, thesometimes angry clamor of concerned citizens.Nongovernmental, voluntarily-supported groups such as TheNature Conservancy, The Wilderness Society, and the. NationalAudubon Society had long influenced ,public policy byresponsible and informed action. They educated, theytestified, they lobbied, and sometimes,,in the courts of lastresort, they litigated. At times they were in league with, butsometimes they opposed, those agencies which their earlierconcern had helped create. In recent years they forced acloser scrutiny of such gifts of dubious value as the SST,they spearheaded creation of the wilderness preservationsystem, and are now trying desperately to educate both thepublic and its elected representatives about the feasibilityand impacts of various energy sources.
'Environmental Studies Program and Department of SecondaryEdudation, 141 Bessey Hall, Iowa State University, Ames,IA 50011.
141
161
The obstacles which they face ate not inconsiderable. Theymust rely upon voluntary contributions, while theiradversaries are able to draw upon public or corporate fundsthat are extracted from all of us, as4taxpayers and consumers,whether we agree with their position or not. Two essays whichare personal favorites treat this inequity as a threat to thedemocratic system of decision making. John Quarles, PresidentNixon's Deputy Administrator of the EPA, describes theconsiderable power of the corporate lobby, which defeats itscitizen adversaries "not by superior logic, but by superiorresources" (1974). James Moorman, an attorney now serving inPresident Carter's administration, documents the many methodsby which federal agencies subvert, distort, and break the law.When citizens protest, they 'are met with a phalanx of stallingtactics designed "to exhaust plaintiffs, not remedies" (1974).
However formidable the obstacles, these citizen groups wereand are a necessary force in American political life,relatively free of those pressures which sometimes confuse orcompromise the goals of the government agencies. Theyrepresent participatory democracy, which requires far moreeffort than do mere periodic visits to the voting booth. Theyexemplify Jefferson's populist ideals, and understand hisdictum that "The price of freedom is eternal vigilance."
But few teachers know about them, and few teach about them, asresearch reported here shall indicate.
History
In the first issue of the Journal of Environmental Education,Stapp and his students wrote that environmental education must"inform citizens as to hoW they can play an effective role"(Stapp, et al., 1969). But in the decade since, only ahandful of instructional materials has been developed toillustrate the necessity and methods of citizen action. Onemulti-media package featured a battle over pollution controlat a General Motors plant in Tarrytown, New York (Hatch, etal., 1971). Under my direction, case studies were writtenabout the controversies over the Miami jetport and a proposeddam in Oregon (Avery and Koerner, 1972). In 1974, the Officeof Environmental Education funded two independently conceivedproposals to develop true case studies of citizen action.Lynton Caldwell and his colleagues prepared no fewer than 68cases (Caldwell, Hayes and MacWhirter, 1976). In a masterfulintroduction, Caldwell argues the need for citizen-actioneducation. The content is suggested by his title, "The PeopleVersus the Duly Constituted Authorities," and such subtitlesas "Why the Adversary Process?", "Toward Better Modes ofPublic Decision Making," and "Functional Citizenship."Caldwell's introduction alone is worth the price of the book.
142
162
The second project produced only six case studies, but unlikeCaldwell's, these were designed as complete teaching units,with instructional strategies and availability information forfree and inexpensive audiovisual materials. These weredeveloped by myself, partly because of my dissatisfaction withmany of the early environmental education instructionalmaterials. Not only did they not deal with citizen action,but they rarely gave the teacher sufficient backgroundinformation or adequate instructions. The case studies(Tanner, 1976) were an attempt to avoid these traits.
In mid-decade, another approach to citizen-action educationwas :evolving at Southern Illinois University, where HaroldHungerford, his associates, and students developed a hierarchyof goals and concepts for environmental education whichculminated, at the highest level, in the goal of informedcitizen action. Prerequisite levels included ecologicalconcepts, awareness of issues and conflicting values, andaction skills. Instructional materials for grades 6-10 werewritten, field-tested, and revised over a period of some years(Hungerford, et al., 1978).
A final development consisted of national and internationalenvironmental education conferences which legitimizedcitizen-action education by placing it at or near the top oftheir findings and recommendations. These included Snowmass(Schafer and Disinger, 1975), Belgrade (Unesco, 1976, 1977),the North American Regional Seminar (Aldrich, Blackburn andAbel, 1977), and Tbilisi (Unesco, 1978).
The Current Papers
In 1979-80, I was privileged to organize a symposium onEnvironmental Education for Citizen Action, for the 1980 NAEEConference. The invited scholars agreed to participate, andthe symposium was remarkably well attended, surpassing my mostoptimistic hopes. This introduction, and the four paperswhich follow, formed the symposium program.
First, Hungerford presents a paradigm for environmental actionwhich summarizes the modes of action and the levels oforganization which employ them. Next, Ben Peyton describesthe research he did as a doctoral student of Hungerford. Hisresults underline the desperate need for teacher educationregarding citizen action. The third paper reports Peyton'smore recent research, with Barbara Miller, on the concept oflocus of control--the perception which people have of theirown power as citizens. Finally, Caldwell examines the nextnecessary stage of citizen action, in which environmentalbattles will move from the courtroom to the mediation table,for reasons both of expedition and equity.
The 1980 conference attracted two other closely-relatedreports by Hungerford's associates, students, and former
143
163
students. I am pleased to introduce those papers as well.Hungerford, et al. present the hierarchy of goals and conceptsdescribed earlier, and Champeau, et al. assess teachercomprehension of this curriculum framework.
I hope that this section of the yearbook will influence theteaching and research of many of its readers.
REFERENCES
Aldrich, James L.; Anne M. Blackburn; and George A. Abel(eds.). 1977. A Report on the North AmericanRegional Seminar on Environmental Education. Columbus,OH: ERIC/SMEAC.
Avery, Virginia and Judith Koerner. 1972. Case Studies ofTwo Conservation Battles. Arlington, VA: ERICDocument Reproduction Service. ED 099 190.
Caldwell, Lynton K.; Lynton R. Hayes; and Isabel M.MacWhirter. 1976. Citizens and the Environment.Bloomington: Indiana University Press.
Hatch, Richard C., et al. 1971. Survival Kit. Evanston,IL: Harper and Row.
Hungerford, Harold R., et al. 1978. Inve'stigation andAction Skills for Environmental Problem Solving.Champaign, IL: Stipes Publishing Company.
Moorman, James W. 1974. "Bureaucracy vs. the Law."Sierra Club Bulletin, 59(9): 7-10, 39, October.
Quarles, John. 1974. "Fighting the Corporate Lobby."Environmental Action, 6(15): 3-6, December 7.
Schafer, Rudolph J. H. and John F. Disinger (eds.). 1975.Environmental Education--Perspectives and Prospec-tives. (Report on the Snowmass Conference sponsoredby Alliance for Environmental Education and WesternRegional Environmental Education Council.) Columbus,OH: ERIC/SMEAC.
Stapp, William B., et al. 1969. "The Concept of Environ-mental Education." Journal of EnvironmentalEducation, 1(1): 30-31, Fall.
Tanner, Thomas. 1976. Of Democracy, Truth, and Courage.New York: National Audubon Society.
Unesco. 1976. "The Belgrade Charter." Connect, 1(1):1-2, January.
144
1 e 4
Unesco. 1978. "Tbilisi Conference Recommendations."Connect, 3(1), January.
Unesco. 1977. Trends in Environmental Education. Paris:Unesco.
145
165
A PARADIGM FOR CITIZEN RESPONSIBILITY:ENVIRONMENTAL ACTION
Harold R. Hungerfordand
R. Ben Peyton
Abstract. The UNESCO-UNEP Tbilisi Declaration calls forindividua: participation in environmental issue remediation.Further, UNESCO-UNEP research reports a paucity of programsinvolving receivers in issue remediation. A much neededparadigm of citizenship action is presented which has beenand can be applied in environmental education programs.Available instructional materials are described.
Historically, environmental education has been characterizedby instructional and curricular diversity. This situation, inand of itself, is not a negative one. The problem lies in thereason for this phenomenon--a basic lack of agreement as towhat constitutes a substantive structure of environmentaleducation. A myriad of environmental education models existas well as a propensity to call a wide variety of educationalactivities "environmen*al education." Tanner (1974) puts itquite well when he states, "...teachers and other educatorsscurry off in all directions under the environmentaleducation banner..."
Even with a plethora of instructional practices character-izing environmental education, one recent trend emerges fromthe literature. This trend is the responsibility forenvironmental education to produce human beings with what iscalled an "environmental ethic." The assumption is probablymade here that this ethic should result in a citizenry whichis capable of taking ecologically-sound environmental actionfocusing on the remediation of environmental issues.
The literature abounds with definitions cr environmentaleducation and strategies for building toward environmentalawareness and an appropriate "environmental ethic." However,only a few of these references deal directly withenvironmental action and/or processes inherent in actionstrategies. One notable example is the following:
'Department of C.I.M., Southern Illinois University,Carbondale, IL 62901.
2Department of Fisheries and Wildlife, Michigan StateUniversity, East Lansing, MI, 48823.
146
ie6
Above all, environmental education is orientedtoward the development of values that aretranslated, ultimately, into action...eachstudent must acquire an environmental ethic,a concern for a moral commitmeilt to hisresponsibility to the environment. (Hawkinsand Vinton, 1973)
Another example rests with the model of substantive structurefor environmental education developed by Harvey (1976) whichidentifies environmental action as a major goal of what isreferred to as man-environment relationship education (MERE).
Perhaps the most important example of a document which dealsdirectly with the topic of environmental action as a goal ofenvironmental education is the Tbilisi Declaration. TheTbilisi Declaration was formulated in 1977 during aUNESCO-UNEP intergovernmental conference in the USSR. TheDeclaration offers five categories of objectives forenvironmental education and one of these is described underthe heading of "Participation." The participation objectivereads: "...to provide social groups and individuals with anopportunity to be actively involved at all levels in workingtoward resolution of environmental problems."
In addition, there are other generic models which incorporateenvironmental action as an integral part of an overallstrategy for environmental education. Some of these reflecta direct reference to implementing environmental action as apart of an overall environmental education program withoutpresenting an action paradigm per se (Stapp and Cox, 1975).Still others tend to 'imply a need for environmental actiontraining (Allman, et al., 1976; Lovet, 1974). In such cases,action components do not reflect all of the dimensions ofenvironmental action known to society. Also, these actiontraining components are dealt with episodically, withoutsyntactical organization.
The writers, in a 1976 publication which attempted tooperationalize "environmental literacy," proposed thatliteracy is, in part, reflected by human beings who haveknowledge of and the ability to communicate the need forenvircnmental action strategies, who have the ability to usethose skills inherent in environmental action strategies, andwho are willing to use action strategies to remediateenvironmental issues.
Even though references exist in the literature relating tothe need to develop citizenship responsibility skills, theliterature remains heavily weighted toward awareness. Theinference may be made that most writers perceive thatawareness can, in fact, lead to effective citizenshipresponsibilities. However, there also exist in theliterature both intuitive and empirical evidence that this isnot the case. Hawkins and Vinton (1973) are emphatic when
147
1 67
they state, "Awareness, appreciation, and understanding ofthe environment are only the first steps and -do notnecessarily lead to effective action." Winston (1974) alsoputs this situation into critical focus when she writes:
There is no indication that awareness will resultin students' environmental concern...expressedconcern for improved environmental quality doesnot offer conclusive evidence that students havehad an attitude change significantly committingthem to behaviors that will lead to improvedenvironmental conditions.
Still other empirical evidence for this position stems fromresearch conducted by Peyton (1977) and Ramsey (1979).
Given the veracity of this situation, it would be possible tohypothesize that many human beings who are developing soundenvironmental ethics are frustrated in their ability to takeeffective action simply because they are unaware of theaction possibilities that exist, i.e., they have had nopreparation specifically geared toward environmental action.
The need for providing training specifically directed atenvironmental action strategies is succinctly reflected byStapp (1971) when he notes, "...few programs emphasize therole of the citizen in working, both individually andcollectively, toward the solution of problems..." Additionalevidence supporting the need for such training grew out of a1975 UNESCO-UNEP questionnaire entitled, "Assessment ofResources for Environmental Education: Needs and Prioritiesfor Member States." This questionnaire was mailed to 136UNESCO Member States. It was completed and returned by 111of them. A synthesis of findings yielded numerous trends andproblems in environmental education worldwide. Among theproblems described in this synthesis was:
Educational programmes based on real problemsand a functional logic aimed at their solution,have not yet been developed, in a generalmanner, in any of the countries studied.(ENVED 6; 1977)
The potential consequence of providing action training ineducation is discussed by VandeVisse and Stapp (1975) whowrite, "Citizens are more likely to become involved inenvironmental Issues if they are aware of how they can havesome effect upon decision- making."
Due to the need inferred by both the literature and thewriters' personal experience in environmental education, aparadigm is proposed which would permit curriculum developersand others to specifically plan for training in environmental
148
168
action as an integral and substantial component in thisfield. Such a 'paradigm results from an analysis ofenvironmental action strategies themselves, the levels atwhich these strategies are utilized by individuals andorganizations, and the logical constraints placed on action,i.e., those questions which should be answered by citizensbefore an action is taken.
Therefore, a three-part paradigm follows which identifies anddefines specific categories of action. It then identifiesand illustrates the levels at which these actions can betaken. And, finally the constraints that must be placed onaction are posed as questions which should be answered beforean action is taken.
Part I: Categories and Definitions of Environmental Action
Subsequent to an analysis of citizen participation, thewriters pose six (6) categories of environmental action.These are: (1) persuasion; (2) consumerism; (3) politicalaction; (4) legal action; (5) ecomanagenent; and (6)interactions of these. Operationally, the writers defineeach of these as follows:
(1) Persuasion: An effort to verbally motivate humanbeings to take positive environmental action as afunction of modified values, e.g., argumentation,debate, speech making, letter writing.
(2) Consumerism: An economic threat by an individual or agroup aimed at some form of behavioral modification inbusiness or industry (e.g., boycotting) or someconservative mode of behavior with respect to goodsand/or services (e.g., discriminating and conservativeuse of goods and services).
(3) Political Action: An effort aimed at persuading anelectorate, a legislator (or legislature), orexecutive governmental agency to conform to thevalues held by the person or persons taking thataction, e.g., lobbying, voting, supporting candidates.
(4) Legal Acton: Any legal/judiciary action taken by anindividual and/or organization which is aimed at someaspect of environmental law enforcement--or, a legalrestraint preceding some environmental behaviorperceived as undesirable, e.g., lawsuits, injunctions.
(5) Ecomanagement: Any physical action taken by anindividual or a group aimed directly at maintainingor improving the existing ecosystems, e.g., refores-tation, landscaping, installing bird boxes.
149
169
(6) Interaction: Any combination of two or more of theabove action modes, e.g., letter writing forconsumerism or political action, combiningboycotting and lobbying for solutions to inter-national issues.
Part II: Levels of Decision-Making for Environmental Action
Fundamentally, environmental action results from theactivities of either an individual or a group of individualsworking cooperatively. Although there are glaring excep-tions-to the rule, in principle one finds that the individualacting alone is of restricted effectiveness in promotingmajor activities. This limitation is largely a function ofthe power base from which the individual operates. This isnot to be interpreted that the writers consider individualactions to be wasted. Indeed not! However, it would be wiseto acknowledge and appreciate the increased effectiveness ofcooperative action.
Further, one should consider the ability to maximize theeffectiveness of the action as a correlate to the scope ofthe organization. Certainly, national organizations exist ona power base much more powerful than the neighborhoodcoalition. Figure 1 is an effort to diagram this principle.
The argument may be raised that there are unnumerable timeswhen individual action is more appropriate than group action.Further, it may be argued that groups are merely aggregatesof individuals working together and that the power of thegroup depends primarily on the actions of individuals withinthe groups. However, the organization per se permits thoseindividuals to maximize the influence of their values. Theinfluence, for example, of the 150,000 members of DucksUnlimited is potentially far greater than the effectivenessof those individuals acting separately, without organization.It appears eminently important for educators and citizensalike to conceptualize the realities of group vs individualaction as they relate to environmental problem solving.
Part III: Action Analysis Criteria
Given that the individual--or the group--understands theoptions available for action and the levels at which theaction can be initiated, it follows that a particular actiondecision needs to be analyzed and evaluated before it istaken.
150
10
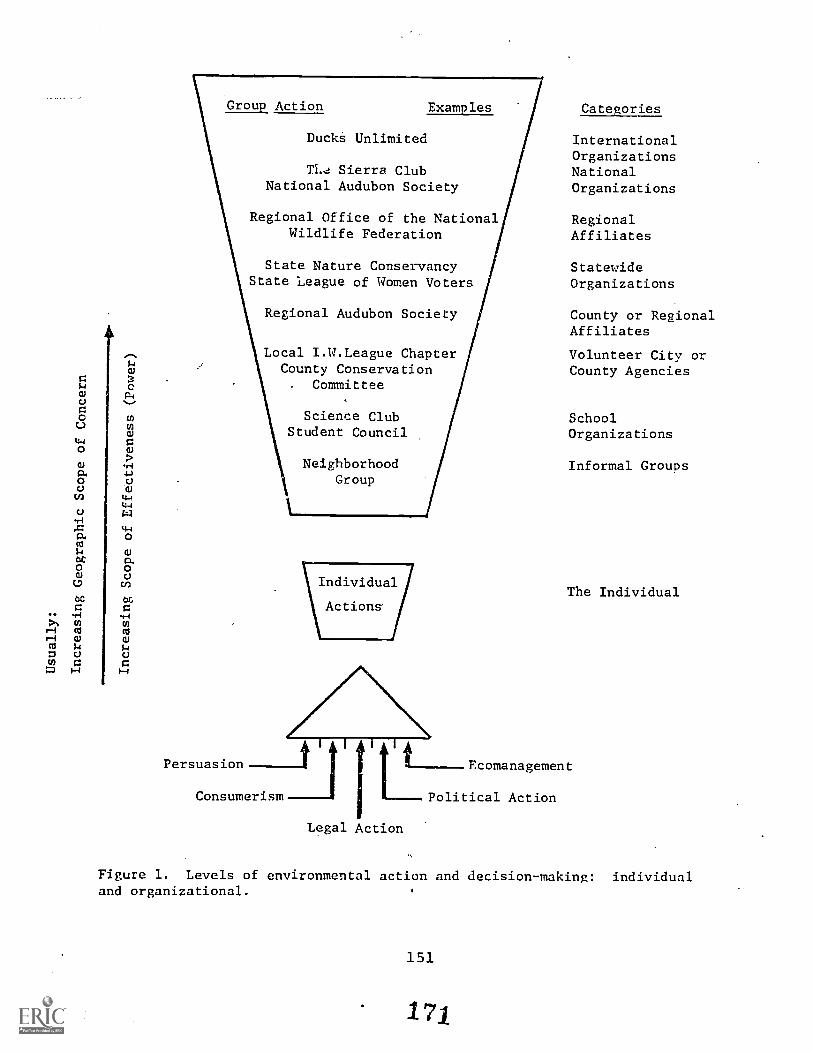
sr
0
000.0rn
rl
I4OC0000
..4-1
U)1-11-1
Nucr) g
)-4
0
a
00
4J
4+J4-1
4-40
0cr
0r-1
1:1/
Group Action Examples
DuckS Unlimited
Sierra ClubNational Audubon Society
Regional Office of the NationalWildlife Federation
State Nature ConservancyState League of Women Voters
Regional Audubon Society
Local I.W.League ChapterCounty Conservation
Committee
Science ClubStudent Council
NeighborhoodGroup
Individual
Actions
Categories
InternationalOrganizationsNationalOrganizations
RegionalAffiliates
StatewideOrganizations
County or RegionalAffiliates
Volunteer City orCounty Agencies
SchoolOrganizations
Informal Groups
The Individual
Persuasion-It t7---__Fcomanagement
Consumerism Political Action
Legal Action
Figure 1. Levels of environmental action and decision-making: individualand organizational.
151
17.E
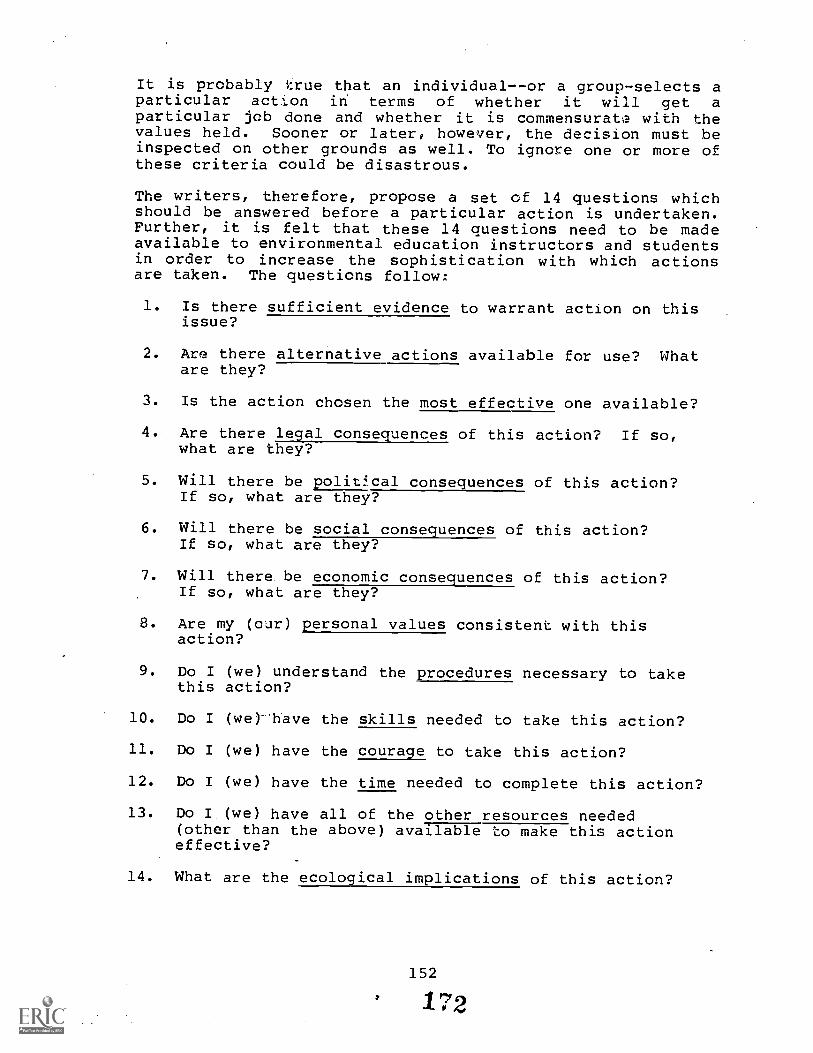
It is probably ' :rue that an individual--or a group-selects aparticular action in terms of whether it will get aparticular job done and whether it is commensurate with thevalues held. Sooner or later, however, the decision must beinspected on other grounds as well. To ignore one or more ofthese criteria could be disastrous.
The writers, therefore, propose a set of 14 questions whichshould be answered before a particular action is undertaken.Further, it is felt that these 14 questions need to be madeavailable to environmental education instructors and studentsin order to increase the sophistication with which actionsare taken. The questions follow:
1. Is there sufficient evidence to warrant action on thisissue?
2. Are there alternative actions available for use? Whatare they?
3. Is the action chosen the most effective one available?
4. Are there legal consequences of this action? If so,what are they?
5. Will there be polit:;cal consequences of this action?If so, what are they?
6. Will there be social consequences of this action?If so, what are they?
7. Will there be economic consequences of this action?If so, what are they?
8. Are my (oar) personal values consistent with thisaction?
9. Do I (we) understand the procedures necessary to takethis action?
10. Do I (we)- have the skills needed to take this action?
11. Do I (we) have the courage to take this action?
12. Do I (we) have the time needed to complete this action?
13. Do I (we) have all of the other resources needed(other than the above) available to make this actioneffective?
14. What are the ecological implications of this action?
Evaluating the Paradigm
As with any theoretically-based model, this paradigm'ssubstantive structure exists on a framework of logic whichis, at least in part, based on empirical observations. Thisparticular paradigm is a vehicle for curricular decisionmaking--a model that must be tested and retested before beingaccepted, rejected, or revised. This phenomenon is notuncommon in education. It is reflected by the widely acceptedand generic environmental education model published by Stappand Cox (1975). In science education it is exemplified bythe substantive structure of Science: A Process Approach(Gagne, 1970) and others.
Initial evaluation of such a paradigm could be reflected bynumerous activities. Among these is a philosophicalexamination and evaluation by peers. It is basically thesame kind of examination originally made when the paradigmwas being constructed--an inspection and comparison againstwhat is, i.e., information currently available concerningcitizenship action and its role in environmental educationand problem solving. A second mode of evaluation would bethe very pragmatic assessment of whether the paradigm couldbe utilized in environmental education curriculumdevelopment. Further, said paradigm must be evaluated in thecontext of whether students can acquire the knowledge andskills necessary to implement action strategies oncecurricula have been developed and implemented.
A summative evaluation of the paradigm would occur when anassessment is made concerning the willingness of students(who have been given training in the paradigm's elements) toactually engage in ecologically sound environmental action ata citizenship level of performance. This behavior is, inessence, a criterion level of performance and an ultimategoal of environmental education.
REFERENCES
Allman, S. A., et al. 1976. Environmental Education:Guidelines and Activities for Teachers. Columbus,OH: Charles E. Merrill Publishing Co.
Gagne, Robert M. 1970. Science: A Process Approach.The Commission on Science Education of the AmericanAssociation for the Advancement of Science, Misc.Pub. 67-12.
Harvey, Gary D. 1976. Environmental Education: ADelineation of Substantive Structure. An unpublisheddoctoral dissertation, Southern Illinois Universityat Carbondale.
153
173
Hawkins, D. E. and D. A. Vinton. 1973. The EnvironmentalClassroom. Englewood Cliffs, NJ: Prentice-Hall, Inc.
Hungerford, H. R. and R. B. Peyton. 1976. TeachingEnvironmental Education. Portland, ME: J. WestonWalch, Publishers.
Lovet, John. 1974. "A Practical Model for EnvironmentalEducation." Journal of Environmental Education,5: 33-36.
Needs. and Priorities in Environmental Education: AnInternational Survey (UNESCO-ENVED 6). 1977. Paris,France: UNESCO-UNEP, 11.
Peyton, R. Ben. 1977. An Assessment of Teachers'Abilities to identify, Teach, and ImplementEnvironmental Action fls. An unpublished doctoraldissertation, Southern Illinois University atCarbondale, 121-123.
Ramsey, John M. 1979. A Comparison of the Effects ofEnvironmental Action Instruction and EnvironmentalCase Study Instruction on the Overt EnvironmentalBehavior of Eighth Grade Students. An unpublishedMaster's thesis, Southern Illinois University atCarbondale, 102-104.
Stapp, William B. 1971. "Environmental Encounters," inOutlines of Environmental Education (Clay Shoenfeld,ed.). Madison, WI: Dembar Educational ResearchServices, Inc.
Stapp, William B. and Dorothy A. Cox. 1975. EnvironmentalEducation Activities Manual (Vol I). FarmingtonHills, MI: (Published by the authors).
Tanner, R. Thomas. 1974. Ecology, Environment andEducation. Lincoln, NE: Professional EducatorsPublications, Inc.
The Tbilisi Declaration. 1978. Connect, 1-8.
VandeVisse, Ellen and William B. Stapp. 1975. "Developinga K-12 Environmental Education Program," in What MakesEducation Environmental? (Noel McInnis and DonAlbrecht, eds.). Washington, DC: EnvironmentalEducators, Inc.
Winston, Barbara .7. 1974. The Relationship of Awareness toConcern for Environmental Quality Among Selected HighSchool Students, 35. Dissertation Abstracts Inter-national, 3412-3413.
154
17d
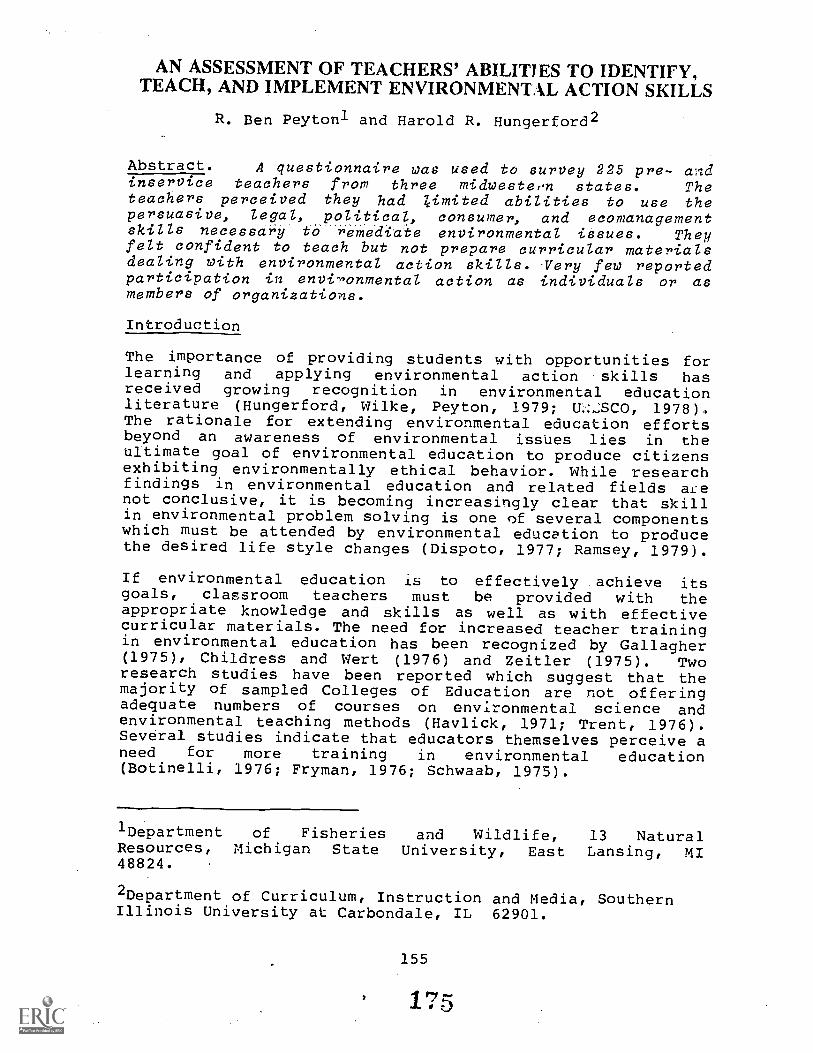
AN ASSESSMENT OF TEACHERS' ABILITIES TO IDENTIFY,TEACH, AND IMPLEMENT ENVIRONMENTAL ACTION SKILLS
R. Ben Peyton" and Harold R. Hungerford2
Abstract. A questionnaire was used to survey 225 pre- andinservice teachers from three midwesteon states. Theteachers perceived they had limited abilities to use thepersuasive, legal, political, consumer, and ecornanagementskills necessary to remediate environmental issues. Theyfelt confident to teach but not prepare curricular materialsdealing with environmental action skills. Very few reportedparticipation in environmental action as individuals or asmembers of organizations.
Introduction
The importance of providing students with opportunities forlearning and applying environmental action skills hasreceived growing recognition in environmental educationliterature (Hungerford, Wilke, Peyton, 1979; U.:-SCO, 1978).The rationale for extending environmental education effortsbeyond an awareness of environmental issues lies in theultimate goal of environmental education to produce citizensexhibiting environmentally ethical behavior. While researchfindings in environmental education and related fields axenot conclusive, it is becoming increasingly clear that skillin environmental problem solving is one of several componentswhich must be attended by environmental education to producethe desired life style changes (Dispoto, 1977; Ramsey, 1979).
If environmental education is to effectively achieve itsgoals, classroom teachers must be provided with theappropriate knowledge and skills as well as with effectivecurricular materials. The need for increased teacher trainingin environmental education has been recognized by Gallagher(1975), Childress and Wert (1976) and Zeitler (1975). Tworesearch studies have been reported which suggest that themajority of sampled Colleges of Education are not offeringadequate numbers of courses on environmental science andenvironmental teaching methods (Havlick, 1971; Trent, 1976).Several studies indicate that educators themselves perceive aneed for more training in environmental education(Botinelli, 1976; Fryman, 1976; Schwaab, 1975).
'Department of Fisheries and Wildlife, 13 NaturalResources, Michigan State University, East Lansing, MI48824.
2Department of Curriculum, Instruction and Media, SouthernIllinois University at Carbondale, IL 62901.
155
175
Efforts to remedy the deficiencies in teacher preparationmust include all dimensions of environmental educationgoals including ecological foundations, awareness ofenvironmental issues, investigative and evaluation skills,and environmental actions skills. The IntergovernmentalConference on EnvironmentalEducation held in Tbilisi, USSR,has identified the need for teachers to be involved inenvironmental decision making.
...in order to assure an adequate training ofeducators, it would seem important to encouragetheir participation, along with other socio-professional groups, in concrete actions aimedat the preservation and improvement of theenvironment. Educators are, in effect, calledupon to play a decisive role in the preventionand solution of environmental problems, notonly through their educational activities, butalso through their participation, as citizensand professionals, in the elaboration andcarrying out of environmental policies. (UNESCO,1977:16)
The purpose of this research study was to make an assessmentof the competency level of teachers in environmental actionskills. More specifically, the intent was to sample teacherpopulations to determine (1) their knowledge and theirsources of knowledge relating to the identification andapplication of environmental action skills, (2) theirperceptions of their own abilities to implement and/ordevelop environmental action curricular materials in theclassroom, and (3) the extent to which they have been orintend to be personally involved in environmental problemsolving.
METHODS
Instrument Design
The design of the survey instrument was based on a model forenvironmental action developed by Hungerford and Peyton(176, 1977). The term "environmental action" refers to theevaluation, selection and implementation of effective,raLional plans of action to remediate some environmentalproblem. Ting action may involve -ommunication skills,participation if, the political and legal processes, and/ormany other types of skills. The model identifies and definessix major categories of action into which these skills may beclassified (persuasion, political, consumer, legal,ecomanagement and interactions of these five) and lists 13criteria to be considered when selecting an action for agiven environmental issue. The action categories areoperationally defined- in the Appendix.
156
176
The research instrument was submitted to a jury (N = 6) andrevised according to their comments. Jury members includedrecognized professionals in science education (1),environmental education (4) and statistics (1). Face validityof the instrument in its final form (Appendix) was acceptedsubsequent to the approval by the jurors.
The first section of the survey instrument collecteddemographic data. The other three assessed participants'knowledge of environmental action modes, their roles asenvironmental activitists, and their abilities to identifycriteria for selecting environmental actions. These latterthree are briefly described below.
Knowledge of Environmental Action Modes: This section (PartA, Task 2 in Appendix) presented and operationally definedeach of the five categories of environmental actions andasked the stibject to list up to five specific examples foreach category (e.g., lobbying through letter writing as anexample of political action). This provided a measure of theextent of the subject's familiarity with examples of thecategories of environmental action. The subjects were nextasked to assume they had professional curriculum developmentskills and to record their own perception of their ability toproduce instructional units in each of the five categories ofaction. Similarly, subjects were asked to 'record theirperceived ability to teach available instructional units ineach of the five action categories.
Participant's Role as an Environmental Activist: Partici-pants were asked to indicate those categories of action(e.g., consumerism, political) in which they felt competentto take environmental action and for the source of theirabilities to take such action (Part B, Appendix).
They were also awed to record individual and/or groupenvironmental actions (e.g., letter-writing campaigns,boycotting tuna products) in which they had participated.
This section also inquired about participants' plans to takefuture action. Respondents who indicated no plans to takefuture actions were asked how important a role the lack ofenvironmental action skills played in their refusal to takeaction. Those who indicated that they did intend to takeenvironmental action in the future were asked to identify theissue and type of action.
Ability of Participant to Identify Criteria: The final taskof the instrument requested subjects to list as many discrete
157
77
action analysis criteria as possible which would be appliedto the selection of the most appropriate environmentalaction.
Thirteen such criteria had been proposed by Hungerford andPeyton (1976, 1977). These were grouped into five categories(Table 1) and used as a basis for evaluating responses byparticipants. For example, any response which indicated thatsocial, economic, ecological or other consequences should beconsidered was placed in Category IV (What are theconsequences of this action?).
Administration of the Instrument
The instrument was administered by either the researcher orby two other professional educators trained in the procedure.Participants were informed of the purpose of the survey andencouraged to answer items candidly. Comments emphasizing theimportance of environmental education were followed by afinal appeal to their educational professionalism forcomplete cooperation. Participants were encouraged to ask forclarification of any items and were assured of sufficienttime to complete the form. A monitor was available at alltimes to answer questions concerning the forms. Mostparticipants were completed in 40 minutes and the forms werenot collected until all respondents had finished.
Monitors were informed to observe participants during thisphase, and to note individuals who were obviously notinterested in cooperating in the project. Forms completed insuch a short time that the subject could not possibly havethought out the items (less than 15 minutes) were to bemarked or otherwise kept separated from the others whencollected. Since no assurances can be given concerning theirenvironmental action competencies, these instruments (N = 14)were withdrawn from the data to ensure that uncooperativeindividuals did not overly bias the survey results.
Sample Population
The survey instrument was administered to samples of teachersenrolled in graduate or undergraduate methods courses inscience education. A total of 225 participants were assessedbetween January and March, 1976 (Northern Kentucky StateCollege N = 80; University of Missouri at St. Louis, N = 79;Southern Illinois University at Carbondale, N = 66).
Participants were selected on the basis of availability. Noattempts were made to randomize the selection. All membersof the selected classes volunteered to participate.
158
178
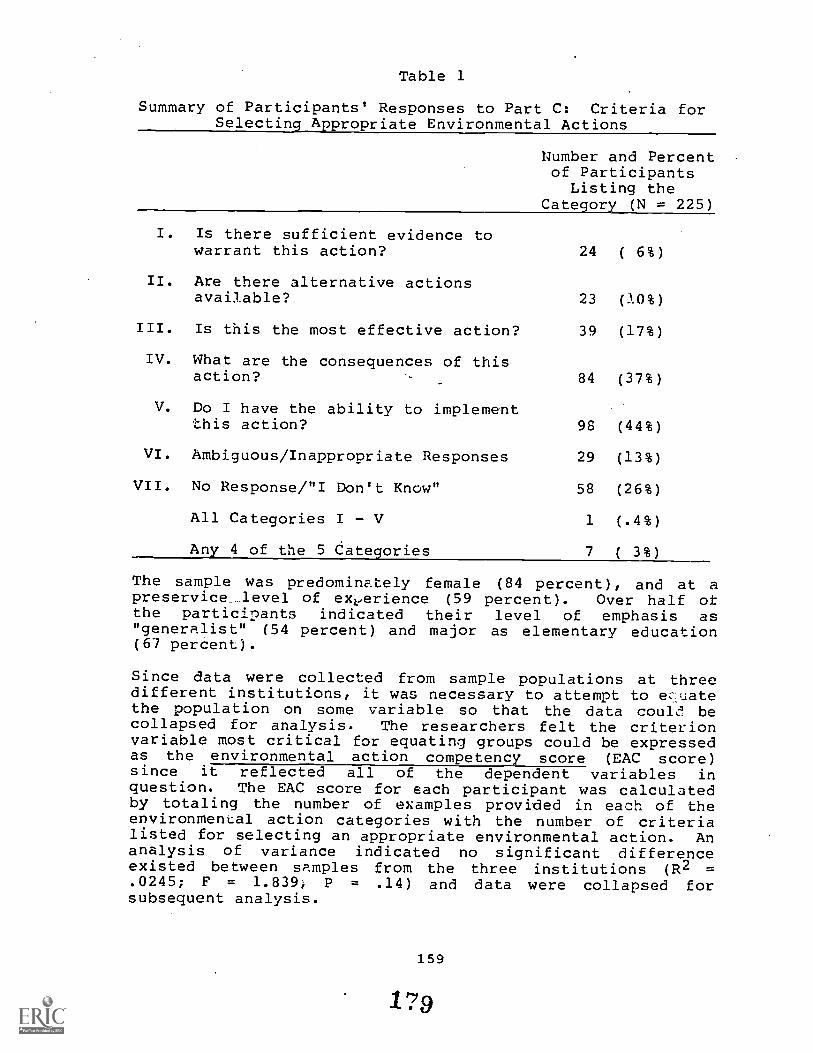
Table 1
Summary of Participants' Responses to Part C: Criteria forSelecting Appropriate Environmental Actions
Number and Percentof Participants
Listing theCategory (N = 225)
I. Is there sufficient evidence towarrant this action? 24 ( 6%)
II. Are there alternative actionsavailable? 23 (A0%)
III. Is this the most effective action? 39 (17%)
IV. What are the consequences of thisaction? 84 (37%)
V. Do I have the ability to implementthis action? 98 (44%)
VI. Ambiguous/Inappropriate Responses 29 (13%)
VII. No Response / "I Don't Know" 58 (26%)
All Categories I V 1 (.4%)
Any 4 of the 5 Categories 7 ( 3%)
The sample was predominately female (84 percent), and at apreservice level of exeerience (59 percent). Over half ofthe participants indicated their level of emphasis as"generalist" (54 percent) and major as elementary education(67 percent).
Since data were collected from sample populations at threedifferent institutions, it was necessary to attempt to ecsuatethe population on some variable so that the data coule becollapsed for analysis. The researchers felt the criterionvariable most critical for equating groups could be expressedas the environmental action competency score (EAC score)since it reflected all of the dependent variables inquestion. The EAC score for each participant was calculatedby totaling the number of examples provided in each of theenvironmental action categories with the number of criterialisted for selecting an appropriate environmental action. Ananalysis of variance indicated no significant differenceexisted between samples from the three institutions (R2 =.0245; F = 1.839; P = .14) and data were collapsed forsubsequent analysis.
159
179
Instrumen'_ Scoring Reliability
Due to the phenomenological nature of Task 2 (subjectsprovided examples of operationally defined actioncategories), and Part C (subjects identified criteria forselecting appropriate environmental actions) it wasconsidered necessary to establish inter- scorer reliabilityfor the scoring procedure. Three professional educators weretrained to -oore responses in each of the two sections of theinstrume' . coring procedure for Task 2 involved evaluatingthe reE ose to determine whether it represented anacceptab_ .mple of an action category. In Part C, scorersanalyzed rL.,ponses and classified them in the five categoriesof environmental action criteria (Table 1). A random sampleof 20 completed instruments was selected for the reliabilitytest. The scoring results of the trained scorers were thencompared statistically for inter-scorer reliability.
The scorers' results were discussed and instructions forscoring revised. Another group of instruments was selectedand scored, followed by further comparison, discussion, andrevision of instructions. This sLstem was repeated untilinter-scorer reliability was deemed acceptable using arandomly selected group of instruments, The final revision ofscoring instructions yielded the following Pearson productmoment correlations across three scorers:
Persuasion: r1,2 = .66, r1,3 = .79, r2,3 = .66;
Consumerism: r2,2 = .78, r1,3 = .81, r2,3 = .70;
Political Action: r1,2 = .70, r1,3 = 1.00, r2,3 = .70;
Le.yd Action: 7"1,2 = .901 r1,2 = 1.00, r2,3 = .90;
Eccmanagement3 r1,2 = .90, r1,3 = 1.0°, r2,3 = -90.
In Task 2, scoring results in each of the five actioncategories were subjected to Pearson Product MomentCorrelation analysis. In each case, correlations were abovethe value of .549 required for statistical significance atthe .01 level (df = 19).
In Part C (environmental action criteria) multiple regressionanalysis was used to establish interscorer reliability.Results of the other three scorers were used as predictors ofthe researcher's scores for each of the seven categories.R2 values in all categories ranged from .47 to perfectcorrelation (P < .01).
160
Limitations of the Study
Limitations are imposed on this study by the samplepopulation, the instrument design, and scoring procedures.The sample used represents primarily elementary educators(pre- and inservice) from three midwestern universities. Theaction model used in the design of the instrument may nothave fit the frame of reference of the participants andtherefore responses may not accurately represent theircompetencies. The opportunity also existed for subjects topurposefully misrepresent their own competencies. Further,the extensive time and energy required for completioncertainly could have decreased participants' motivation tothink carefully before responding to the items. Finally,while scoring methods were validated statistically, somevariation in results must also be attributed to scoringprocedure.
The researchers attempted to minimize the impact of theselimitations as described in the methods. However, inferencesand recommendations must be considered within the constraintsimposed by sample characteristics, instrumentation, andscoring procedures.
RESULTS AND DISCUSSION
1. To what extent can teachers provide examples ofpersuasive, consumer, ,olitical, 'egal andecomanagement modes of action?
2. To what extent are teachers able to identify themajor criteria for selecting appropriate environ-mental actions?
The data indicate participants are limited in the extent towhich they are able to provide examples of various modes ofenvironmental action and identify criteria for selectingactions. Fewer than 20 percent of the participants providedexamples of all five action modes. The category for which thelargest number of rarticipants (64 percent) provided exampleswas "persuasion". The remaining four categories indescending order of frequency of appropriate responses were"political" (57 percent), "ecomanagement" (51 percent),"consumerism" (48 percent), and "legal" (42 percent).
Findings for Research Question 2 (Table 1) indicate a similarlack of ability -,x) identify criteria applied in the selectionof environmental actions. These findings suggest to theresearchers that participants tend not to have transferredtheir foralal training and experiences to a functional frameof :reference for environmental action. This is :he case eventhough forrl general education (e.g., civics courses,
161
communications courses) and nonformal life experiences haveexposed them to most of the necessary action components.These results are also consistent with findings in ResearchQuestions 3, 5, and 6, in suggesting that participants wouldhave difficulty teaching action skills or taking part inenvironmental action themselves.
3. How do teachers perceive their own ability to prepareand teach environmental education units or modules ineach of the five identified action modes?
Fewer than 7 percent of the participants reported feelingcompetent to prepare units in all five environmental actioncategories. When viewed separately, "ecomanagement" was themost frequently indicated area of competence (34 percent ofthe participants), followed by "persuasion" (31 percent),"consumerism" (31 percent), "political" (20 percent), and"legal" (12 percent).
A larger proportion of participants felt competent to teachalready constructed units in each category ("ecomanagement"and "persuasion," 77 percent of the participants;"consumerism", 76 percent; "legal," 65 percent; and"political," 64 percent). The more positive response toteaching prepared units leads the researchers to infer thatparticipants were reflecting a confidence in their ability tolearn to implement new environmental action curricularmaterials in the classroom. However, even thoughparticipants were asked to assume they had curriculumdevelopment skills, it is difficult to assess whether the lowpercentages dealing with preparing units or modules is afunction of insecurity in curriculum development or lack ofunderstanding of the substantive structure of environmentalaction. One can only speculate from other data in thisresearch (environmental action competency scores) that thelack of cognitive content associated with environmentalaction would contribute significantly to feelings ofinsecurity with respect to curriculum development in thisarea.
4. What sources of information have contributed signifi-cantly to teachers' knowledge of environmental actionskills?
The most frequently mentioned sources of information aboutenvironmental action were college (26 percent) and highschool (11 percent) courses. However, multiple regressionanalysis revealed that the number of courses taken does notpredict the environmental action competency score (R2.0088; F = 2.4661; p = .1177). This further indicates thatsuch courses may have enhanced awareness of issues andconfidence in that awareness, but have done little to preparestudents in the environmental action dimension.
162
1S2
Participants' environmental action competency scores werepositively related to the number of actions reported taken(R2 = .16; F = 45.27; p = .000). When asked to indicatethe sources of information concerning environmental actionskills, 15 percent of the participants responded thatenvironmental action experiences had contributed to theirknowledge. This does not, however, eliminate the E.dditionalpossibility that attainment of environmental action skillsvia other means may lead to more involvement in environmentalaction taking.
Membership in environmental organizations and/or the readingof periodicals of environmental organizations were mentionedby only 8 percent of the participants as having contributedto their knowledge of environmental action. Mostparticipants (80 percent) reported not belonging to anyenvironmental organization. Membership in only oneorganization was reported by 14 percent, and 5 percentreported belonging to two such organizations. Fewparticipants mentioned activist groups such as the SierraClub or National Audubon Society. These results would seemto indicate that active environmental organizations play a.very limited role in educating teachers about environmentalaction.
5. What is the extent of involvement of teachers asenvironmental activists?
The participants report a limited involvement in environ-mental actions. A history of three individual actions eachwas reported by only 4 percent of the participants. Threegroup actions were reported taken by only 3 percent. However,17 percent reported taking some form of group action. Overhalf of the participants (56.4 percent) indicated they hadnot taken any form of positive environmental action.
Even the few actions reported were of less demanding formssuch as "helping to clean up a river bank," "recyclingtrash," "buying returnable bottles," or "talking to friendsabout an issue." There was little involvement reported inpolitical or legal categories (campaigning, organizinglobbyist activities, initiating litigation). These findingsare consistent with the lack of involvement in activeenvironmental organizations reported in Research Question 5.
Participants' own perceptions of they;- ability to takeeffective environmental action are consistent with thepopulation's reported history of action taking. Only 3percent felt competent to take action in all five categories.Participants felt most competent with "persuasion" (35percent felt competent in this category), "consumerism" (36percent), and "ecomanagement" (36 percent) categories ofaction. Few participants felt competent to take "political"
163
1S3
(17 percent) or "legal" (8 percent) actions. Thirty-eightpercent did not feel they could effectively take action inany of the areas.
Of the 137 participants (61 percent) who felt they wouldprobably take environmental action in the future, only 23percent identified a specific issue on which they intended totake action, and 16 percent have identified the actionitself. Issues varied, but most were general issues such as"air and water pollution," "energy conservation," or"conserving our natural resources." Similarly, the actionslisted in these cases Were ambiguous: "probably some letterwriting," "boycott products," or "some form of persuasive orpolitical action." Few responses to this task were specificsuch as "halt the Meramec Dam from being built by educatingthe bill's sponsor about the problems the dam would cause,"and "stop the effect on the ozone layer caused by aerosolsprays by boycotting those products and writing letters tothe manufacturing companies."
6. To what extent do teachers attribute a lack ofknowledge concerning action skills to their ownreluctance to take environmental action?
Participants who expressed no intention to take future actionwere asked mhether they perceived a lack of environmentalaction skills and whether they felt they would take action ifappropriate skills were acquired. Eighty-seven (87)participants fell into this category. Most (83) indicated alack of environmental action skills and 77 stated that theywould take action if they had the appropriate skills. Theseresults support the researchers' position that environmentalaction skill components must be provided if environmentalliteracy is accepted as a goal of environmental education.
SUMMARY
The results indicate that the population of pre- andinservice teachers surveyed is poorly prepared in theenvironmental action skills identified and measured by theinstrument. Most of the population has had limitedexperience in environmental action taking, perceive theyposses,s little competency in the necessary skills, and haveincomplete plans or none at all for future involvement asenvironmental activists. Categories of action in whichparticipants consistently were most comfortable and competentrepresent the least sop-isticated forms of environmentalaction and involve skills within the capabilities of educatedmembers of society (e.g., speaking, letter writing, pickingup litter, planting trees).
164
184
A statistical relationship between the number of actionstaken and environmental action competency scores, plus therole of past action experiences attributed to knowledge ofaction skills by 15 percent of the participants, indicatesthat environmental action involvement could be a source ofcompetency. Although 53 percent of the participants have hadat least one course in which environmental issues were asignificant topic, statistical analysis indicates that thesecourses do not account for a significant proportion of thevariance in environmental action competency scores. Thisfinding supports the contention that environmental educationhas stressed awareness of issues, but neglected theenvironmental action components of environmental literacy.
Only 8 percent of the participants indicated environmentalorganizations had contributed to their knowledge ofenvironmental action skills. The National Audubon Society isrepresentative of the environmental organizations whichallocate time, money and materials for the purpose ofimproving environmental education in the schools. Thisresearch indicates such efforts have had little impact on theenvironmental action skill development of the pre- andinservice teachers sampled.
Participants with no future plans for action tend to perceivethat a lack of appropriate skills contributes to theirreluctance to become involved. This supports theresearchers' position that environmental action skillcompetencies must be developed if environmental education isto achieve the ultimate goal of environmental literacy (e.g.,remediation of environmental problems).
The findings of this study indicate that without some form offuture intervention (teacher training, availability ofappropriate curricular materials, or nonformal educationalexperience such as involvement in environmental organiza-tional and/or actions) there is little reason to expect theassessed sa711).1? (or Fimilar samples) to effectively prepareenvironmentally literate students in their classrooms.
RECOMMENDATIONS
In summary, it is recommended that...
1. ...similar research be conducted to assess the environ-mental action competencies of secondary schoolteachers.
2. ...research which extends beyond the minimal compten-cies investigated by the present study be conducted toestablish the specific environmental acticn skillcompetencies and deficiencies of teachers.
165
opl, ,,,,4.1 to3. tudiez...longitudillo etc is5 40C )e 0 C/ Illert-ttleidentify and qe.oei, 51Dec- rs Ole 0.A 411 cicILI,
ct° 11 ,0 P ,.cognitive snq of coN.,e fa. ens %G'' to
% clenvironmental;ky ' 'tl°
P-1 h be I" modit,4. ...teacher tt,f1 0 ,. gram vir vol 01 and tioh ,lclo en pnecessk,v elciktplodewhere the kwe OrOdUc i.s14
vo - 03-experiences NO'14./%0 peYon rivir*0 4.01 -s ,01.1 skielevel to an 4140' in e400- -10-
oseat, 0,0u1,4 ef'5. ...environMe4A pLypil cI0,dent l'el 0 for 0 Otc ,11any level sh()W/orINVIde st-tion
v/3',1,s. lAer/'tehol acas episodic 1.14,-' t1106-0N A e ,
'Os itl ev IN 011911a6. ...envirormehoi,A0N4hiygt1,, maoe ,its e ed dot,,I, io. ,..k,on action sk111 ',04hant
use in puPlie 00votNN ns ih aye efft7. 4 ti eo a.i,...enviroilmerloi.,0t\% hlya ionm e ti 5'env 1A-ta 'Nvito involve elav
1k5FEEE"CEs
L A gymmat et4- 5Bottinelli, C. 4/eill 1;1 ief - ti .06o1' Std -I'l Jol
Secondary EnvVoN Edoc;(4Z in /40k\4130, -' dayof cation, 38
A .1' toChildress, R.76.
ners CIINefc71976.
EnvironmePai. aped op plan,, 4
Environmental vat `k%" 7(4)* 2\,11 0.
N __:,oing taiDispoto, R. C. 14/i° k °N\ ell,a1 Vach cnd e'l no 1111IA i, e cVariables. Jp40 -t Resea Tea -------.
14: 273 _z30.
Fryman, J. 1976. 14
Pollutio0 Col,mental EducaqoUnpublish ed tl 5at CarborglaW
of redet,4 od
q a 0-
i
iro
inao-hnqsoot tIA Ttylqp., ,vere
1s, k 011 ty
/0. 1.ment4) cat,
cadets ,..,Gallagher, J. a. 190c.k.P4Ivir°1,1 gep.z, 0 Pt-on t.e9 tt'llFDevelopment Ado Fina-- 1.1 (5t, pfleq4%c ;,,,3
supported jo&I.10ceir, bivi514;ted 'T.eCO pNy '-ofEnvironmenta (150 11, "-rid eta-ot 'Zif;erlosEducatioill v14%03'0 ericl) DC/ 5it0,404 rsiqpvet'la,of State Colgo tlq'unive 'Ilfie
/N
11
gnd ), ,fvirph
Havlick, S. W. 19)3. 10' GI.mpse .'At10,-30, pf Enogr 4\h 1 .14-ie5 lh ,e 4amental Eclucak1001,aottuni` ld (, AIP 4-)111-sh fl,ofEducation Cocpoenfedisq,) ;e.Environmenta gOC`1 Ma tl 0 1)%111110p tl on. _e51 Th.Educational 100 WV1" k,
166
Hungerford, H. R. and R. B. Peyton. 1976. TeachingEnvironmental Education. Portland, ME: J. WestonWelch, Publisher.
Hungerford, H. R. and R. B. Peyton. 1977. EnvironmentalAction: A Paradigm. A Report on the North AmericanRegional Seminar on Environmental Education.Columbus, OH: SMEAC Information Reference Center,The Ohio State University, August.
Hungerford, H. R.; R. Wilke; and R. B. Peyton. 1979.A Framework for Environmental Education CurriculumPlanning and Development. Journal of EnvironmentalEducation (accepted for publication July, 1979).
kamSeY, John M. 1979. A Comparison of the Effects ofEnvironmental Action Instruction and EnvironmentalCase, Study Instruction on the Overt EnvironmentalBehavior of Eighth Grade Students. UnpublishedMaster's thesis, Southern Illinois University atCarbondale.
SchWaeb, K. E. 1975. A Survey of the Effectiveness ofEnvironmental Education Teaching Methods as Rated byPublic School Teachers and Professors of Education inIllinois. Doctoral dissertation, Southern IllinoisUniversity at Carbondale. Dissertation AbstractsInternational, 36(12): 7752-A. (University Micro-films No. 76-13,286.)
Trent, J. H. 1976. Changes and Trends in EnvironmentalEducation (1970-75). Journal of EnvironmentalEducation, 7(3): 51-60.
()Tilted Nations Educational, Scientific, and CulturalOrganization. 1977. Needs and Priorities inEnvironmental Education: An International Survey..Paris: UNESCO, Intergovernmental Conference onEnvironmental. Education Organized by UNESCO withUNEP, Tbilisi, USSR, 14-26, October.
°Tilted Nations Educational, Scientific, and CulturalOrganization. 1978. The Tbilisi Declaration.Connect. Paris: UNESCO, III(1): 1-7, January.
Zeitler, W. R. 1974. The Environmental-Ecological Web.Journal of Environmental Education, 6(2): 53-56.
167
187
APPENDIX: ENVIRONMENTAL ACTION INVENTORY
(The items and instructions included in the instrument arepresented here in abbreviated form. The format has beenmodified slightly and area for responses omitted to conservespace.)
ENVIRONMENTAL ACTION INVENTORY
PART A
To the respondent: Remember, there are NO hidden agendas inthis inventory. This inventory simply assesses the status ofenvironmental action as it relates to both pre and inserviceteacher. Your honest participation should lead to improvedinstruc ional practices in environmental education.
1. Your identification Number:
2. Your Sex: Male Female
3. Your Year in SchoLl:
4. Years of teaching experience, if any (please do notinclude student teaching).
5. Level of Concentration: (Early Childhood, ElementaryEducation; Senior High School; Other).
6. Area of Emphasis: (Generalist; Science Education;Environmental Education; Social Studies; Other,please explain).
7. The number of courses you have taken in...(Ecology;Resource Management; Conservation; EnvironmentalEducation; The number of OTHER courses you have takenin which environmental issues was a significant topic).
8. ...the income level that BETT reflects the grossincome for your family while you were in high school...
9. The size of the community in which you grew up, i.e.,spent most of your youth...
10. Please write the names of any environmental or conser-vation organizations with which you affiliate (include
0. those from which you receive journals or periodicals).
TASK 1: Please list below, what you perceive to be the three(3) most important environmental issues facing man today.
168
1,38
TASK 2: There are many strategies or modes of environmentalaction to which a citizen may turn in dealing with anenvironmental issue. These actions can be classified intocategories of actions. Within these catcyories, action canbe taken on an individual or a group basis.
Generally, we perceive there to be five (5) separatecategories of environmental action. These are li-,ted below.For each category, list up to five (5) examples (modes) ofenvironmental action available within that category. If y.71can identify no examples in a category, please so state.
1. PERSUASION: Used when someone or a group tries toconvince others that a certain environmental actionis correct.
Examples of persuasion action
2. CONSUMERISM: Consumerism is an economic pressureexerted by an individual (317 a group aimed at someform of behavior modification in business or industry.
Examples of consumerism action
3. POLITICAL ACTION: Political action is an effort aimedat persuading an electorate, a legislator (orlegislature), or executive governmental agency toconform to the values held by the person or personstaking that action.
Examples of political action
4. LEGAL ACTION: Any legal/judiciary action taken by anindividual and/or organization which is aimed at someaspect of environmental law enforcement--or, a legalrestraint preceding some environmental behaviorperceived as undesirable.
Examples of legal action
5. ECOMANAGEMENT: Any physical action taken by anindividual or a group aimed directly at maintainingor improving the existing environment.
Examples of ecomanagement
TASK 3: In this task it is assumed that, as an educator, youhave the general skills necessary to produce (prepare)instructional units or modules.
169
1s9
Do you personally feel you have the knowledge necessary todevelop a unit or module for environmental action purposesfor use with students on:
A. Persuasion skills?
B. Consumerism skills?
C. Political action skills?
D. Legal action?
E. Ecomanagement?
TASK 4: Would you personally feel comfortable teaching analready prepared unit or module which focused on theenvironmental action skills associated with:
A. Persuasion?
B. Consumerism?
C. Political. action skills?
D. Legal action?
E. Ecomanagement?
PART B
YOU AS A CITIZEN
TASK 5: Some human beings (citizens) feel totally frustratedin terms of solving environmental issues either as anindividual or on a group basis.
If these frustrations exist from your own personal frame ofreference, please list one, two, or three environmentalissues which yo.4 feel to be of importance but, at the sametime, 'you feel totally frustrated with in regards toresolving eiti'er as an individual or on a group basis.
TASK 6: Please check those categories in which you feel youcould competently take environmental action, either as anindividual or as a member of a group, should the occasionarise within the next week or so. (A. Persuasion; B.Consumerism; C. Legal Action; D. Political Action; E.Ecomanagement; F. I do not feel competent in any of thesecategories.)
If you feel competent in any of the above categories, pleaserespond to the following: Where do you feel you gained theability to use action skills? Check one or more of the
170
190
following: (A. A high school course; B. A college course; C.Membership in an environmental organization; D. Participatingin an environmental action; E. Other, please explain.)
TASK 7: Have you ever taken an environmental action as anindividual or as a member of a group?
If you answered "yes," please list those specific actionsbelow and check whether they were taken as an individual oras a group member.
TASK 8:
A. Do you think that you will take an environmental actionat some point in the future?
If you answered "no," please go to B below.If your answer was "yes," please go to D.
B. Do you feel that a lack of environmental action skillsis a major reason why you don't think you will betaking some action in the future?
C. Do you think you would be willing to take action inenvironmental issues-if you gained the skills for sodoing?
If vou wish to comment on C, please do so here.
D. If you DO intend to take some action, have you identi-fied the issue on which the action will be taken?
E. If "yes," specifically what is that issue?
F. If you responded above, do you know what kind ofaction you will take?
G. If "yes," please identify specifically what kind ofaction you anticipate taking.
PART C
THE TASK:
To review, the five (5) action categories are generallyidentified as persuasion, consumerism, political action,legal action, and ecomanagement.
Whenever a citizen or a group of citizens decides that anenvironmental action should be taken in any one or more ofthe above categories, there are undoubtedly some
171
1 91
considerations (e.g., consequences, constraints, rules, orquestions) to be made when selecting the appropriate actionfor use. These considerations may deal with the feasibility,possible outcomes, or appropriateness of the proposed action.
How many considerations (constraints, rules, questions,consequences) that would apply to the selection of mostenvironmental action strategies can you think of? If you canthink of some of these considerations, please list thembelow. Number each discrete item. Thank you.
172
192
DEVELOPING AN INTERNAL LOCUS OF CONTROL AS APREREQUISITE TO ENVIRONMENTAL ACTION TAKING
R. Ben Peyton' and Barbara Ann Miller'
Abstract. Principles of the locus :if control theory (L ofC) and supportive research findings are reviewed. A
citizen's L of C may have important implications forenvironmental education in promoting the ultimate goal ofresponsible environmental action. A paradigm of environmental behavior is proposed.
Introduction
It is generally accepted by educators that the major goal ofenvironmental education should be to produce "anenvironmentally literate citizenry that is both competent totake action on critical environmental issues and willing totake that action" (Hungerford and Peyton, 1976, p. 11). Manywriters have stressed the importance of extendingenvironmental education beyond the awareness level to thecitizen participation level (Balzar, 1971; Childress andWert, 1976; Ginzbarg, 1971; Harvey, 1977; Hawkins and Vinton,1973; Hungerford, et al., 1979; UNESCO, 1978).
Educational efforts to produce environmentally literatecitizens have been largely based on the postulate that a
linear relationship exists among cognitive (knowledge),affective (attitude), and conative (behavioral) domains.Accordingly, environmental education programs often presentawareness and knowledge of ecology and/ot environmentalissues, and assume that this awareness and knowledge willlead to the desired attitude development and, ultimately, tothe necessary ,environmentally ethical behaviors.
Findings of current research into the relationships thatexist among the cognitive, affective, and conative domainsindicate that these relationships are far more complex thanpreviously assumed (Borden and Schettino, 1979;Burrus-Bammel, 1978; Heberlein, 1973; Ramsey and Rickson,1977). Increased awareness and/or knowledge do notnecessarily lead to positive attitude formation or toenvironmentally ethical behavior. Nor is there evidence toindicate the extent to which experiences such as values
'Department of Fisheries and Wildlife, 13 NaturalResources, Michigan State University, East Lansing, MI48824.
173
193
clarification, increased environmental sensitivity, oracclimatization, generate increased participation inenvironmental action taking. Indeed, little empiricalresearch ecists in environmental education which identifiesthe variables responsible for a specific environmentalaction, nor the relationships among these variables.
Certainly, a number of variables may interact in promotingenvironmental action taken by an individual, including theindividual's knowledge (beliefs) about the issue, attitudestoward the components of the issue, and environmental actionskills. An additional variable which has not been consideredby environmental educators in this context is an individual'sperception of whether or not he/she has the ability to bringabout change through his/her own behavior. Thisvariable--lolus of control--suggests that an individual withthe necessary environmental knowledge, values, and skills,may not engage in environmental action taking if he/sheperceives an individual inability to bring about change insuch a situation. Evidence indicates that this perceptionmay reflect more than a lack of confidence in the actionitself. Some individuals do not attempt to bring aboutdesired change because they attribute change to chance orpowerful others (e.g., God, parents, government, "they,"etc.) rather than to their own behaviors.
The theoretical construct of locus of control (I. of C) hasbeen frequently researched in the behavioral sciences.However, research exploring the role of L of C inenvironmental education is almost nonexistent (Smith, 1979).The purpose of this paper will be to:
1. review the principles of the L of C theoreticalconstruct;
2. describe the potential implications of the theoryof L of C for environmental education; and,
3. propose a paradigm to guide further research intothe variables impinging on environmental actiontaking.
Locus of Control Construct
Julian B. Rotter was one of the first to propose and definethe theoretical construct known as locus of control (1966).His theory developed as a ::-exult of analysis of patients inpsychotherapy.
174
...clinical analysis of patients suggested thatwhile some patients appear to gain from newexperiences or to change their behavior as aresult of new experiences, others seem todiscount new experiences by attributing themto chance or to others and not to their ownbehavior or characteristics (Rotter, 1966:2).
Rotter proposes that an individual's actions can be predictedon the basis of one's values, expectations, and the nature ofthe situation. Rotter's basic formula for predicting anindividual's behavior in a specific situation is presentedas:
the potential for behavior (X)to occur in relation to rein-forcement (A)
is a funs tion of
the expectancy of the occur-rence of reinforcement (A).following behavior (X)
and
the value placed on rein-forcement (A)
This approach to predicting behavioral outcomes places equalemphasis on expectancy, reinforcement value, and thepsychological situation. It is the expectancy of rein-forcement which reflects an individual's L of C. RW.Iter, etal., define expectancy as the "probability held by theindividual that a particular reinforcement will occur as afunction of a specific behavior on his part in a specificsituation...(1972:12)." Reinforcement value reflects theperceived importance of the expected outcome if the behavioris successful. Thus, a specific behavior will more likelyoccur if the individual places a sufficiently high value onthe expected outcome of the behavior and also anticipatesthat the behavior will be effective in producing the desiredresults (reinforcement).
Rotter has identified two attitude positions which anindividual may have with respect to expectancy forreinforcement (L of C).
175
When a reinforcement is perceived by the subjectas following some action of his own but notbeing entirely contingent upon his action, then,in our culture, it is typically perceived as theresult of luck, chance, fate, as under thecontrol of powerful others, or as unpredictablebecause of the great complexity of the forcessurrounding him...[We] have labeled this abelief in external control. If the personperceives that the event is contingent upon hisown behavior or his own relatively permanentcharacteristics, we have termed this a belief ininternal control (Rotter, 1966:1). (Emphasisadded.)
Rotter's formula may be used to predict whether an individualwill take a specific environmental action. If the desiredaction is writing a letter-to a Senator with regard to anAlaskan land bill, the probability of the individual writingthe letter may depend on: (a) his/her expectancy that theletter writing will indeed contribute to the preservation ofAlaskan lands, and (b) the value which the individual placeson preserving Alaskan lands. Given that the individualvalues Alaskan land preservation, an individual who perceivesan internal L of C is more likely to write a letter expectingto gain the desired reinforcement. Alternatively, anexternal individual attributes change in the Alaskan landsituation to chance or powerful others and fails to takeaction.
Rotter (1966) describes the L of C construct as a distri-bution of individuals on a continuum according to the degreeto which they accept personal responsibility for what happensto them. Other writers have emphasized the importance ofviewing L of C not as a trait or personality type, but as anindividual's more common tendencies to expect events to becontingent or noncontingent upon his/ her actions (Lefcourt,1976; Pharesi 1976).
Locus of control has been shown to operate as both ageneralized expectancy covering many diverse situations, andas a specific expectancy directed toward a class ofsituations. When an individual is confronted with a novel orambiguous situation, the individual's behavior is more likelyto reflect a generalized expectancy for control. If afamiliar situation is encountered, behavior will predictablyfollow the individual's specific expectancy for control inthat situation ( Lefcourt, 1976; Phares, 1976).
Many paper and pencil instruments have been developed tomeasure an individual's L of C. Both generalized andspecific expectancies have been assessed in a variety of agegroups, populations, and topic areas (Crandall, r21.7. 1965;Dean, 1969; James, 1957; Mischel, et al., 1974; Nowicki and
176
196
Strickland, 1973; Reid and Ware, 1974; Tomera, 1979). The Lof C instrument which has received the most recognition wasdeveloped by Rotter (1966). His Internal- External ControlScale includes 29 forced-choice items which measuregeneralized expectancy across a range of situations. Severalresearchers have developed instruments intended todistinguish between different types of external control(Crandall, et al., 1965; Kleiber, et al., 1973; Levenson,1972). In the r view, important differences exist betweenthe individual who believes outcomes are in the control ofother people, and the individual who believes outcomes are aresult of fate or chance. Levenson (1972) devised a L of Cinstrument which further distinguishes among externals asattributing control to either "powerful others" or "chance."Her Internal, Powerful Others, Chance Scale has been usedwith some success in supporting these factors as independentorientations.
Factors Influencing Locus of Control
There has been considerable research to identify the factorswhich influence the development of an individual's L of C.Locus of control appears to be influenced by familialorigins, ethnicity, social class, and mental age.
Research pertaining to familial origins of L of C seem toindicate that family environment, consistency of parentalreinforcement, and ordinal position in the family affect L ofC. In general, a warm, supportive, nurturing environmentencourages internality (Davis and Phares, 1969; Katkovsky,et al., 1967; Shore, 1967). Earlier born children tend to beslightly more internal than later born children in largefamilies (Chance, 1965; Crandall, et al., 1955; Eisenman and-Platt, 1968; MacDonald, 1971).
Studies on the social antecedents of L of C indicateexpectancy of reinforcement is related to ethnicity acid
social class. Lefcourt (1976) reviewed the literature andreported a trend for blacks to be more external than whites,and showed lower socioeconomic status to be associated withexternality. Gurin, et al. (1969) questioned the benefitsattributed to internality. They proposed that internalitymay have negative implications espec'.ally among minoritygroups and the economically deprived. They further suggestedthat individuals in such groups are bntter .adjusted when ableto attribute, failures to chance or powerful others. Aninternal individual who experiences repeated failure couldeventually suffer from self-derogation and self-blame.
Although an individual's L of C has been shown to berelatively consistent when measured over short durations,several researchers have been able to demonstrate shifts in L
of C over longer periods. Bailer (1961) and Penk (1969)suggest a positive relationship between age and internality.However, Bailer's study indicates mental age rather thanchronological age is the salient aspect with regard toincreases in internality.
Abundant literature exists pertaining to L of C. Althoughnot exhaustive, this review of the literature hasoutlinedfactors found to influence the development of anindividual's L of C. In summary, L of C is the degree towhich an individual perceives reinforcement to be contingent(internal) or noncontingent (external) upon his/her actions.Locus of control seems to operate as both a broad,generalized expectancy and as a situation specificexpectancy. Further, an individual's perceived L of Cappears to be stable over short durations, and may beinfluenced by familial origins, ethnicity, social class, andmental age.
Implications for Environmental Education
Several generalizations which may be inferred from researchon L of C may have important implications for EE. Thesegeneralizations and their potential implications arepresented in this section along with a brief review of thesupporting research.
A word of caution is appropriate concerning the nature of thesupporting research. Many of the reported findings are basedon correlational studies. Certainly these are legitimatemethods of research; however, care must be taken not to infercausation between variables which show a significantcorrelation. For example, a significant relationship hasbeen reported between having an internal L of C andresistance to subtle manipulation. It follows that internalsmay tend to be more discriminating in accepting informationfor use in problem solving--a desirable trait in' anenvironmentally literate citizen. However, it does notnecessarily follow that making externals more internal wouldalso make them more resistant to manipulation. This infers acausal relationship between the two variables which has notyet been substantiated by research.
In addition, the literature cited is limited by the problemsof research design and population constraints which arecommonly inherent in behavioral research. However, even withthe recognized limitations of available research findings, itis proposed that sufficient evidence exists to warrantconsideration and further investigation of these potentialimplications by environmental educators.
1. Internals more frequently participate in productiveaction taking than externals.
Several researchers have reported evidence that internals aremore often the initiators of social action and change, orparticipate more actively than externals in attempting tocontrol their environment (Brown and Strickland, 1972; Rosenand Salling, 1971; Ryckman, Martens, Rodda, and Sherman,1972). Gore and Rotter (1963) measured black collegestudents' willingness to participate in various kinds ofsocial actions at the height of a social protest movement.Internal blacks stated a greater willingness to becomepersonally involved in a more active form of civil rightsbehavior. Strickland (1965) measured the degree of actualparticipation by blacks in the civil rights movement andreported a positive correlation between internality andparticipation.
Some discrepancies with regard to activism and L of C havebeen reported. Lao (1970) found that externals who blameddiscrimination on the social system tended to participate andbecome more personally involved in civil rights activitiesthan internals. Gurin, et al. (1969) presented a thoroughreview of L of C in blacks and proposed that a more complexrelationship exists between L of C; and behavior. Theyreported that when internal-external control refers toblacks' conceptions of their condition as blacks, it is theexternal rather than the internal orientation that isassociated with more effective behaviors. Internal blackswho tended to see the cause of blacks' problems in personalinadequacies of blacks, rather than in the social system,supported the view that individual self-betterment is thebest approach to dea'ing with the problems. Thus, theseinternals did take action, but the actions were individualrather than group actions. Both studies by Lao and Gurin, etal., reported a preference for collective action rather thanridividual action by externals who tended to blame thesystem.
The relationship between internality and individual actiontaking has strong implications for environmental education.Achieving the goals of environmental education depends ondeveloi-ing individuals willing to initiate positive, rationalenvironmental action taking. In view of the generalizationsreported here, this would seem to make internality desirable.
2. Internals differ from externals in their ability torecall relevant material, and in how actively theyseek additional information.
In a study by Wolk and DuCette (1974), internals were foundto demonstrate performance superior to externals on assigned
179
109
tasks which involved recall of relevant information. Seeman(1963) presented prison inmates- with three categories ofinformation varying in relevancy to the parole process. Sixweeks later he found that internals recalled significantlymore of the relevant information than externals.
The relationships among L of C, knowledge, and informationseeking behavior were investigated by Seeman and Evans(1962). Results of their study involving 43 internal-external pairs of white male tuberculosis patients indicatedthat internals were more knowledgeable about their illness,were more inquisitive with the hospital personnel about thedisease and - their own condition, and expressed lesssatisfaction with the amount of information they were_receiving. Other researchers have supported these findings(Davis and Phares, 1967; Williams and Stack, 1972).
Having greater recall of relevant material and more activelyseeking additional information are certainly importantabilities for 'Tfective environmental problem solving. Ifbecoming more internal leads to increases in recall andinquisitiveness (causal relationship), then developing aninternal L of C among citizens may be an important goal ofenvironmental education.
3. Internal individuals are superior to externals in theirutilization of information.
Phares (1969) compared the utilization of information indecision making by internals and externals. Subjects wereprovided with information about four men and were asked to--match each of the men with a suitable occupation and mate.After the task was completed, internals provided over 50percent more reasons to justify their matches than externals.When only correct reasons were counted, internals providedthree times as many correct responses as externals.
Rational, objective problem solving might be enhanced by anincreased ability to accurately apply information. I therelationship between this characteristic and internality is acausal one (i.e., becoming more internal wovld cause agreater utilization of information), citizens' perception ofL of C should be an important consideration of environmentaleducators.
4. Internal individuals are more resistant to subtlemanipulation and are less influenced by high-prestigeindividuals than externals.
Studies concerning an individual's tendencies to conformindicate that internals are more trusting of their own
180
2 6g
judgment, and are less apt to conform to the influence of°tilers (Biondo and MacDonald, 1971; Crowne and iverant,1963; Doctor, 1971; Getter, 1966; Gore, 1962; Hjelle andClouser, 1970; Lefcourt, 1967; Odell, 1959; Strickland,1970).
Further studies have revealed that internals are not simplyresistant to influence, but are more discriminating in whatinfluences they will accept. Ritchie and Phares (1969)reported that both internals and externals shifted theirviews as a result of a persuasive message. However,externals were found to shift their opinions more when themessage was attributed to a high-prestige, rather than alow-prestige source. Prestige of the source was not asinfluential in shifting the attitudes of internals as thecontent of the message. Other studies with similar findingshave been reported by Ryckman, Rodda, and Sherman (1972).
These findings also seem to have important implications forproducing rational, objective environmental problem solvers.It is essentiai that the value positions and credibility ofinformational sources be carefully assessed when investi-gating the dimensions of an environmental issue. It seemsreasonable to expect internals to be more capable and/orwilling to reject information which comes from biased orprestigious, but uninformed sources.
5. Internal individuals exhibit a superior capacity todelay gratification in order to attain greater, long-term gains.
Using normal and mentally retarded youth, Bailer (1961) founda significant positive correlation between internality andcapacity to delay gratification. Strickland (1972) testedboth black and white sixth graders and found that internalsexhibited more delay behaviors than externals, but only amongthe white subjects. A later study (Strickland, 1973)reported internality was significantly and positivelycorrelated with delayed, larger rewards in white, middleclass youth. Mischel, et al. (1974) reported that internalitywas positively correlated with an individual's ability topersist in a task to obtain greater rewards. These studiesseem to substantiate the greater capacity of internals todelay gratification in order to attain more significant,long-term gains.
Solving environmental (and other social) problems oftenrequires behaviors that sacrifice short-term rewards for theattainment of greater, long-term gains. If environmentaleducation is to produce citizens capable and willing to adoptbehaviors to improve and/or maintain environmental quality,increased internality may be an important part of theprocess.
181
201

6. Internals respond differently to those tasks which theyperceive to be skill-related, than to tasks theyperceive to be chance- determined.
Phares (1957) and James and Rotter (1958) demonstrated instudies which ignored L of C, that if a task was perceived tobe solvable through skill, individuals would seriously useexperience and feedback as a basis for making. decisions.
However, individuals will ignore feedback and tend to gambleon outcomes if the task is perceived to be chance-determined.Other researchers who measured L of C have reported thatinternals devote more attention to decision making concerningskill-related matters, and less attention in chance-relatedsituations than do externals (Julian and Katz, 1968;Lefcourt, et al., 1968; Rotter and Mulry, 1965). Davis andPhares (1967) presented each of three groups with a diffi-rent reason for success or failure in an upcoming task(skill, chance, or no such instructions). Internals showed adecrease in participation in the chance-instructed group,whereas externals participated more. Internals participatedsignificantly more than externals in the skill and noinstruction situations.
In view of the above findings, it appears important forenvironmental education to present citizens with theperception that the outcomes of environmental actions areskill-related and not due entirely to chance events.
7. An individual's perceived L of C is susceptible tochange.
Gorman (1968) and McArthur (1970) measured changes in L of Cfollowing contemporary political events relevant to controlexpectancies. In each study the experimental group had avested interest in the outcome of the event. The failure ofthe desired outcome to materialize did not reinforce aninternal L of C. In both studies, the experimental groupshowed a greater shift toward the external end of thecontinuum; however, no indication exists as to the permanenceof this shift.
deCharms. (1972) established a teacher training programspecifically aimed at encouraging personal causation(internality) in the students involved. Evidence showed thatthe teachers' training did indeed increase the students'sense of personal causation. Further, deCharms was able todemonstrate that these shifts have persistence when measuredover a period of up to two years, and that additionalexposure to trained teachers has a cumulative effect inincreasing the students' internality. Other researchersreported similar shifts toward internality following trainingand substantiated the cumulative effects of training reported
182
202
by deCharms (Martin and Shepel, 1974; Nowicki and Barnes,1973).
Rowe has investigated the impact science education methodsmay have on students' L of C. She suggested that:
...science appropriately taught may contributeto improving the sense of fate control and thatthis improvement, in turn, will increase theamount of voluntary learning and investigatingthat people will engage in (Rowe, 1973:300).
Ruwe reported evidence that teaching techniques such asdivergent questioning, sufficient wait time, and inquirymodels shift students' perception of fate control (L of C)toward internality.
Given that an internal L of C in citizens is accepted as adesired perspective in an environmentally literateindividual, it is significant that L of C is responsive totraining and experience. The nature and extent of suchtraining to be offered by EE are by no means defined clearlyas yet. 'However, the implication seems evident thatenvironmental educators should begin to examine environmentaleducation curricula and teaching methods to determine how aninternal L of C may be best developed in citizens.
A Paradigm of Environmental Behavior
The research reviewed here indicates that internals may beexpected to be more autonomous and better informed problemsolvers than externals, and to participate more frequently inenvironmental action taking. Given that Rotter's formula forpredicting an individual's potential for behavior is viable,and that environmentally responsible behavior is the ultimategoal of environmental education, it follows that the L of Ctheory has important implications for environmentaleducation.
The proposed model (Figure'l) attempts to graphically relatethe L of C construct to the many other variables andprocesses which impinge on environmental action taking bycitizens (e.g., writing a letter about the Alaskan landsissue). The left side of the model includes those impingingvariables (knowledge and experiences), beliefs (B1 andB2), and attitudes (A1) with which environmentaleducation has traditionally dealt with. More recently,environmental education literature has encouraged including aknowledge of, and experiences with, environmental problemsolving as reflected by the impinging variables on the upperright side of the model. The review of the L of C theoreticalconstruct presented in this paper supports the inclusion ofsuch recent trends in environmental education, and further
183
203
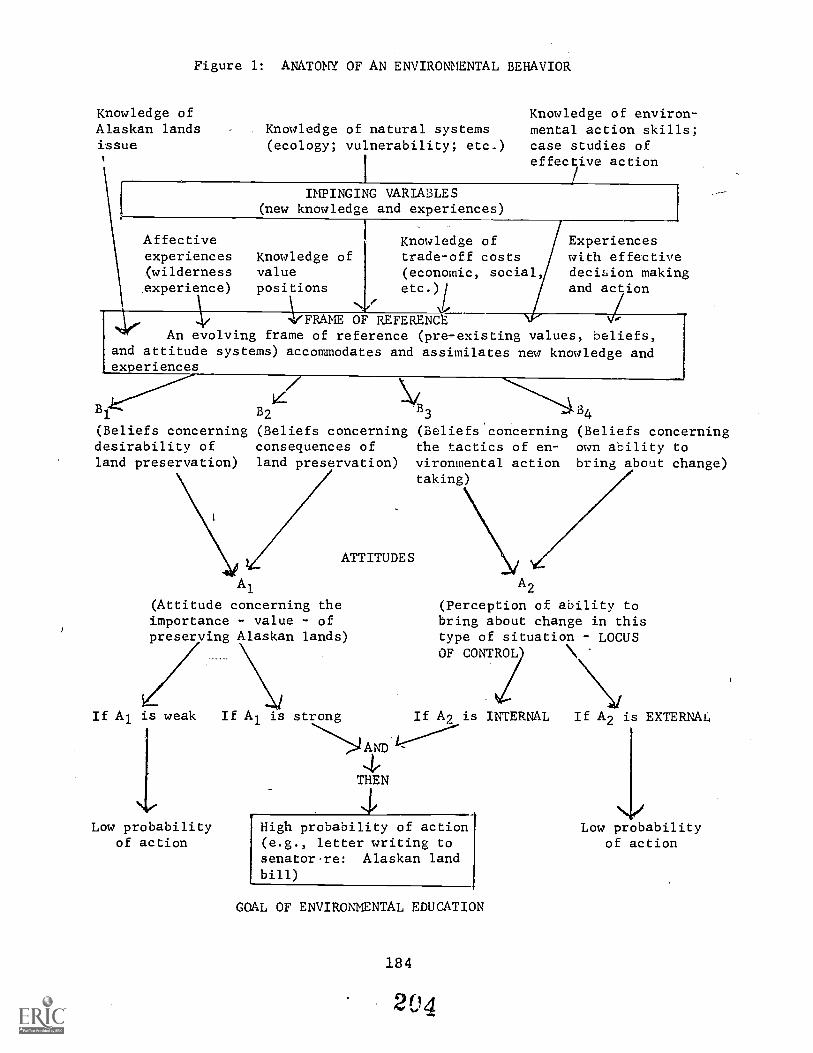
Figure 1: ANATOMY OF AN ENVIRONMENTAL BEHAVIOR
Knowledge ofAlaskan lands Knowledge of natural systemsissue (ecology; vulnerability; etc.)
Knowledge of environ-mental action skills;case studies ofeffective action
IMPINGING VARIABLES(new knowledge and experiences)
Affective Knowledge of Experiencesexperiences Knowledge o trade-off costs with effective(wilderness value (economic, social, decision making.experience) positions etc.) and action
Ne'N(FRAME OF REFERENdg
An evolving frame of reference (pre-existing values, beliefs,and attitude systems) accommodates and assimilates new knowledge andexperiences
B1 B2 -B
3 B4
(Beliefs concerning (Beliefs concerning (Beliefs concerning (Beliefs concerningdesirability of consequences of the tactics of en- own ability toland preservation) land preservation) vironmental action bring about change)
taking)
ATTITUDES
Al
(Attitude concerning theimportance - value - ofpreserving Alaskan lands)
If Al is weak
Low probabilityof action
If Al is strong
A2
(Perception of ability tobring about change in thistype of situation LOCUSOF CONTROL
If A2 is INTERNAL
AND
IeTHEN
High probability of action(e.g., letter writing tosenatorre: Alaskan landbill)
GOAL OF ENVIRONNENTAL EDUCATION
184
204
If A2 is EXTERNAL
Low probabilityof action
suggests that citizens be given diverse, positive experienceswith effective decision making and action. In addition, L ofC implies that other beliefs (B3 and B4) and attitudes(A2) are important considerations in bringing about a
specific environmental action.
The processes inv,Aved as precursors to an environmentalaction are implied by the frame of reference component. Thepe;radigm assumes that a citizen has a frame of referencewhich reflects all past learning experiences, values,be3. efs, and attitudes, and which serves to process any newknoe,ledge and/o: experience. Some of this new input ismodified to "fit" into the existing frame of reference(assimilation). In other cases, the frame of referenceitself is adjusted to accept new perspectives(accommodation). The result is a constantly evolving frameof reference comprised of new beliefs and attitude systems.The attitude systems prevailing at any given time willdetermine the types of behaviors, if any, that are engagedin.
The model (Figure 1) attempts to recognize many componentswhich are necessary to achieve the desired environmentalbehavior by the citizen. An internal L of C is not proposedas the panacea to correct our past failures in environmentaleducation, but rather as an additional component which maycontribute to future successes. The relationships proposed(Figure 1) have been useful in suggesting a number ofrecommendations for environmental education curriculumdevelopment, teaching methods and research. For example, theneeds for research suggested by the paradigm include the needto
1. develop valid and reliable instruments whichmeasure situation specific (i.e., L of C inenvironmental problem solving) rather thangeneralized expectancy of reinforcement.
2. determine the types of experiences and knowledgeneeded to develop general and situation specificirternal expectancies.
3. identify variables (knowledge, experiences) whichimpinge on environmental action taking and theextent to which each variable contributes toaction.,
4. determine the extent of causal relationshipswhich may exist between internal L of C andvarious problemsolving attributes.
185
2
The paradigm and literature reviewed further suggest thatenvironmental educators should...
5. prOvide citizens with experiences intended todevelop or reinforce an internal L of C inenvironmental problem solving by: (1) usingcase study involvement which models effectiveaction taking; (2) avoiding action takingexperiences which reinforce externality incitizens because of unreasonable expectationsor through lack of positive feedback; (3)using methods such as positive feedback,inquiry teaching, and student participationin decision making which enhance student self-image and confidence in problem solvingabilities.
6. provide citizens with evidence that achievingresults with environmental actions is skill-related rather than chance-determined.
7. consider the L of C of citizens when dealingwith environmental action components so thatthe most productive teaching methods may beselected.
8. develop students' internal expectancies ofcontrol in specific classroom situations whichwill transfer to similar life style situationsrelated to environmental quality.
REFERENCES
Bailer, I. 1961. "Conceptualization of Success andFailure in Mentally Retarded and Normal Children."Journal of Personality, 29: 303-320.
Balzer, L. 1971. "Environmental Education in the K-12Span." American Biology Teacher, 15: 220-224.
Biondo, J. and A. P. MacDonald. 1971. "Internal- External.Locus of Control and Response to Influence Attempts."Journal of Personality, 39: 407-419.
Borden, R. J. and A. P. Schettino. 1979. "Determinantsof Environmentally Responsible Behavior." Journalof Environmental Education, 10(4): 35-39, Summer.
Brown, J. C. and B. R. Strickland. 1972. "Belief inInternal-External Control of Reinforcement and Parti-cipation in College Acti7itics." Journal ofConsulting and Clinical Psychology, 38: 148.
186
2 0p
Burrus-Bammel, L. L. 1978. "Information's Effect onAttitude: A Longitudinal Study." Journal ofEnvironmental Education, 9(4): 41-50, Summer.
Chance, J. E. 1965. "Internal Control of Reinforcementsand the School-Learning Process." Paper presentedat meting of Society for Research in Child Develop-ment, Minneapolis, March.
Childress, R. B. and J. Wert. 1976. "Challenges forEnvironmental Education Planners." Journal ofEnvironmental Education, 7(4): 2-6.
Crandall, V. C.; W. Katkovsky; and V. J. Crandall. 1965."Children's Beliefs in Their Own Control of Rein-forcements in Intellectual-Academic AchievementSituations." Child Development, 36: 91-109.
Crowne, D. P. and S. Liverant. 1963. "Conformity UnderVarying Conditions of Personal Commitment." Journalof Abnormal and Social Psychology, 66: 547-555.
Davis, W. L. and E. J. Phares. 1967. "Internal-ExternalControl as A Determinant of Information-Seeking in aSocial Influence Situation." Journal of Personality,35: 547-561.
Davis, W. L. and E. J. Phares. 1969. "ParentalAntecedents of Internal-External Control ofReinforcement." Psychological Reports, 24: 427-436.
Dean, D. G. 1969. Dynamic Social Psychology: TowardAppreciation and Replication. New York: RandomHouse.
deCharms, R. 1972. "Personal Causation Training in theSchools." Journal of Applies Social Psychology,2: 95-113.
Doctor, R. M. 1971. "Locus of Control of Reinforcementand Responsiveness to Social Influence." Journalof Personality, 39: 542-551.
Eisenman, R. and J. J. Platt. 1968. "Birth Order and SexDifferences in Academic Achievement and Internal-External Control." Journal of General Psychology,78: 270-285.
Getter, H. 1966. "A Personality Determinant of VerbalConditioning." Journal of Personality, 34: 397-405.
Ginzbarg, H. 1971. "Environmental Education for PoliticalAction." Journal of Environmental Education, 3:26-27.
187
207
Gore, P. M. 1962. "Individual Differences in thePrediction of Subject Compliance to ExperimenterBias." Unpublished Doctoral dissertation, Ohio StateUniversity, Columbus.
Gore, P. M. and J. B. Rotter. 1963. "A PersonalityCorrelate of Social Action." Journal of Personality,31: 58-64.
Gorman, B. S. 1968. "An Observation of Altered Locus ofControl Following Political Disappointment."Psychological Reports, 23: 1094.
Gurin, P.; G. Gurin; R. C. Lao; and M. Beattie. 1969."Internal-External Control in the MotivationalDynamics of Negro Youth." Journal of Social Issues,25: 29-53.
Harvey, G. 1977. "A Conceptualization of EnvironmentalEducation." A Report of the North American RegionalSeminar on Environmental Education. Columbus, OH:SMEAC Information Center.
Hawkins, D. E. and D. A. Vinton. 1973. The EnvironmentalClassroom. Englewood Cliffs, NJ: Prentice Hall.
Hebedein, T. A. 1973. "Social Psychological Assumptionsof User Attitude Sur'7eys: The Case of the WildernessScale." Journal of Leisure Research, 5: 18=33.
Hjelle, L. A. and R. Clouser. 1970. "Susceptibility toAttitude Change as a Function of Internal-ExternalControl." Psychological Record, 20: 305-310.
Hungerford, H. R. and R. B. Peyton. 1976. TeachingEnvironmental Education. Portland, ME: J. WestonWalsh.
Hungerford, H. R.; R. Wilke; and R. B. Peyton. 1979."A Framework for Environmental Education CurriculumPlanning and Development." Journal of EnvironmentalEducation (accepted for publication, July).
James, W. H. 1957. "Internal Versus External Control ofReinforcement as a Basic Variable in Learning Theory."Unpublished Doctoral dissertation, Ohio StateUniversity, Columbus.
James, W. H. and J. B. Rotter. 1958. "Partial and 100Percent Reinforcement Under Chance and SkillConditions." Journal of Experimental Psychology,55: 397-403.
188
' 208
Julian, J. W. and S. B. Katz. 1968. "Internal VersusExternal Control and the Value of Reinforcement."Journal of Personality and Social Psychology,8: 89-94.
Katkovsky, W.; V. C. Crandall; and S. Good. 1967."Parental Antecedents of Children's Beliefs inInternal-External Control of Reinforcements inIntellectual Achievement Situations." ChildDevelopment, 38: 765-776.
Kleiber, D.; D. J. Veldman; and S. L. Menaker. 1973."The Multi-dimensionality of Locus of Control."Paper presented at Eastern Psychological AssociationConvention, Washington, DC.
Lao, R. C. 1970. "Internal-External Control andCompetent and Innovative Behavior Among Negro CollegeStudents." Journal of Personality and SocialPsychology, 14: 263-270.
Lefcourt, H. M. 1967. "The Effects of Cue ExplicationUpon Persons Maintaining External Control Expectan-cies." Journal of Personality and Social Psychology5: 372-378.
Lefcourt, H. M. 1976. Locus of Control: Current Trendsin Theory and Research. Hillsdale, NJ: LawrenceErlbaum Assoc.
Lefcourt, H. M.; L. Lewis; and I. W. Silverman. 1968."Internal Versus External Control of Reinforcementand Attention in Decision Making Tasks." Journalof Personality, 36: 663-682.
Levenson, H. 1972. "Locus of Control and Other CognitiveCorrelates of Involvement in Anti-PollutionActivities." Unpublished Doctoral dissertation,Claremont Graduate School, Claremont, CA.
MacDona..d, A. P. 1971. "Birth Order and Personality."Journal of Consulting and Clinical Psychology, 36:171-176.
Martin, R. D. and L. F. Shepel. 1974. "Locus of Controland Discrimination Ability with Lay Counselors."Journal of Consulting and Clinical Psychology, 42:741.
McArthur, L. A. 1970. "Luck is Alive and Well in NewHaven." Journal of Personality and Social Psychology,16: 316-318.
209189
Mischel, W.; R. Zeiss; and A. Zeiss. 1974. "Internal-External Control and Persistence: Validation andImplications of the Stanford Preschool Internal-External Scale." Journal of Personality and SocialPsychology, 29: 265-278.
Nowicki, S. and J. Barnes. 1973. "Effects of a StructuredCamp Experience on Locus of Control Orientation."Journal of Genetic Psychology, 122: 247-252.
Nowicki, S. and B. R. Strickland. 1973. "A Locus ofControl Scale for Children." Journal of Consultingand Clinical Psychology, 40: 148-154.
Odell, M. 1959. "Personality Correlates of Independenceand Conformity." Unpublished Master's thesis, OhioState University, Columbus.
Penk, W. E. 1969. "Age Changes and Correlates ofInternal-External Locus of Control Scale."Psychological Reports, 25: 856.
Phares, E. J. 1957. "Expectancy Changes in Skill andChance Situations." Journal of Abnormal and SocialPsychology, 54: 339-342.
Phares, E. J. 1968. "Differential Utilization ofInformation as a Function of Internal-ExternalControl." Journal of Personality, 36: 649-662.
Phares, E. J. 1976. Locus of Control in Personality.Morristown, NJ: General Learning Press.
Ramsey, C. E. and R. E. Rickson. 1977. "EnvironmentalKnowledge and Attitudes." Journal of EnvironmentalEducation, 8(1): 10-18.
Reid, D. and E. E. Ware. 1974. "Multidimensionality ofInternal Versus External Control: Addition of aThird Dimension and Non-Distinction of Self VersusOthers." Canadian Journal of Behavioral Science,
131-142.
Ritchie, D. E. and E. J. Phares. 1969. "Attitude Changeas a Function of Internal-External Control andCommunicator Status." Journal of Personality,37: 429-443.
Rosen, B. and R. Salling. 1971. "Political Participationas a Function of Internal-External Locus of Control."Psychological Reports, 29: 880-882.
190
210
Rotter, J. B. 1966. "Generalized Expectancies forInternal Versus External Control of Reinforcement."Psychological Monographs, 80 (1, Whole No. 609).
Rotter, J. B.; J. E. Chance; and E. J. Phares. 1972.Applications of a Social Learning Theory ofPersonality. New York: Holt, Rinehart and Winston.
Rotter, J. B. and R. C. Mulry. 1965. "Internal VersusExternal Control of Reinforcement and Decision Time."Journal of Personality and Social Psychology, 2:598-604.
Rowe, M. B. 1973. Teaching Science as Continuous Inquiry.New York: McGraw Hill.
Ryckman,, R. M.; J. L. Martens; W. C. Rodda; and M. F.
Sherman.. 1972. "Locus of Control and AttitudesToward Women's Liberation in a College Population."Journal of Social Psychology, 87: 157-158.
Ryckman, R. M.; W. C. Rodda; and M. F. Sherman. 1972."Locus of Control and Expertise Relevance asDeterminants of Changes in Opinion About StudentActivism." Journal of Social Psychology, 88: 107-114.
Seeman, M. 1963. "Alienation and Social Learning in aReformatory." American Journal of Sociology, 69:270-284.
Seeman, M. and J. W. Evans. 1962. "Alienation andLearning in a Hospital Setting." AmericanSociological Review, 27: 772-783.
Shore, R. E. 1967. "Parental Determinants of Boys'Internal-External Control." Unpublished Doctoraldissertation, Syracuse University, Syracuse, NY.
Smith, J. M. 1979. "A Study of the Variables Associatedwith Environmental Action and Locus of Control AmongFour Dissimilar Populations." Unpublished Master'sthesis, Southern Illinois University, Carbondale.
Strickland, B. R. 1965. "The Prediction of Social Actionfrom a Dimension of Internal-External Control."Journal of Social Psychology, 66: 353-358.
Strickland, B. R. 1970. "Individual Differences in VerbalConditioning, Extinction, and Awareness." Journal ofPersonality, 38: 364-378.
Strickland, B. R. 1972. "Delay of Gratification as aFunction of Race of the Experimenter." Journal ofPersonality' and Social Psychology, 22: 108-112.
Strickland, B. R. 1973. "Delay of Gratification andInternal Locus of Control in Children." Journal ofConsulting and Clinical Psycholoa, 40: 338.
Tomera, A. N. 1979. "Environmental Locus of Control.Instrument." Unpublished institutional research,Department of Curriculum, Instruction and Media,Southern Illinois University, Carbondale.
United Nations Educational, Scientific, and CulturalOrganization. 1978. "The Tbilisi Declaration."Connect. Paris: UNESCO, 3(1): 1-7, January.
Williams, J. G. and J. J. Stack. 1972. " InternalExternal Control as a Situational Variable inDetermining Information Seeking by Negro Students."Journal of Consulting and Clinical Psychology,39: 187-193.
Wolk, S. and J. DuCette. 1974. "Intentional Performanceand Incidental Learning as a Function of Personalityand Task Directions." Journal of Personality andSocial Psychology, 29: 90-101.
212192
ENVIRONMENTAL ACTIVISM, PHASETHE BURDENS OF RESPONSIBILITY
Lynton K. Caldwell'
Abstract. Environmental education must respond to a newphase in citizen involvement in public environmental affairs.Successes of activism have entailed responsibility forunforeseen consequences that environmentalists have notalways accepted. Education for environmental action must nowaddress these consequences, consistent with a holistic,evolutionary view of mankl:nd's environmental predicament.
Addressing a conference of the American Public PowerAssociation, Governor of Washington Dixie Lee Ray "...berated federal politicians and a 'new class' ... that isuneducated in free enterprise and the sciences," which s'Pa
said "...threaten America's orientation to capitalism, growthand technology" (Seattle Times, 1979). And writing toAudubon Magazine, a. correspondent declared that: "TheAmerican public has finally become disgusted with Stop-Everything Environmentalists--SEEs for short" (Audubon,1980). He alleged that:
Since the early 1970s, the SEEs have seized everylegal opportunity to stop resource development.They seldom bother to learn the facts or analyzethe need for a project. They just want to stopit as quickly as they can and move on to theirnext personal vendetta. In the process, theyhave grossly misused hardwon environmentallegislation.
- The essence of these and similar charges is that"environmentalists" are irresponsibly obstructing solutionsto America's energy and natural resource needs. The argumentis made that the environmental protection movement has gonetoo far; that court action and regulation are stoppingeconomic progress for ideological and self-serving reasonsunrelated to environmental quality. Attacks on environmentalaction groups have been launched from both right and left ofthe political spectrum, and some foundations have backed awayfrom support of environmental groups and causes.
'Arthur F. Bentley Professor of Political Science andProfessor of Public and Environmental Affairs, IndianaUniversity, 1800 North Fee Lane, Bloomington, IN 47405.
193
2;1. 3
Attacks upon. environmental activists are not new. Shortlyafter the environmental movement began to show legislativestrength, a reactive literature of innuendo and implicationemerged questioning the honesty of environmentalists'motivation (Newhaus, 1971; Grayson and Shepard, 1973).Anti-environmentalist broadsides described environmentalistsas upper-middle class elitists interested only in protectingtheir economic and aesthetic principles from contamination bythe poor, the black, the blue-collar working classes, andbusiness enterprises that disfigure the environment butprovide the jobs, energy, or material goods that people need(Briggs, 1976; Tucker, 1977). These opinions wereoccasionally voiced by politicians representing hard-lineanti-environmentalist constituents and by some superci]i...,usscientists who regarded ecology as a conscience and theprotection of nature as an exercise in naive emotionalism.Even editors of the prestigious journals Science and Naturelent support to ill-founded attacks upon environmental actionand protection measures which, had they occurred in their ownfields of expertise, they might well have found unacceptable(Maddox, 1972; Fairfax, 1978; Schindler, 1976; Simon, 1980).
To understand and explain this reaction is certainly a partof environmental education, and yet this task has not yetbeen accomplished. It cannot be accomplished here; but Ibelieve that we can identify some of the causes ofanti-environmentalist reaction, can see where environmentalactivists may have been remiss, and determine what remedialaction may be indicated. First, however, some basicclarifications are required.
There are few self-styled anti-environmentalists. Some of,the most acerbic critics of environmental action claim to betrue conservationists, reasonable as contrasted to a lunaticfringe, subversives, and SEEs. There are some scientists andmore economists who deny the existence of any generalenvironmental problem, arguing that the world has always beenchanging and that man and nature will adapt to whatever thehuman ingenuity brings forth. From this viewpoint, theprotection of endangered species is sentimental foolishnessas the species will become extinct anyway, and protectionwastes funds that might help needy people or advance realscientific research.
It appears from opinion analysis that a large part of theAmerican public is not persuaded by these arguments(Mitchell, 1978). Popular support for environmentalprotection measures remains high and is periodicallyreinforced by new environmental disasters of which LoveCanal, Three Mile Island, and the Great Mexican oil spill areexamples. Nevertheless, the apparently most unqualifiedsupport accorded earlier environmental legislation no longerexists. In some sectors of society, "environmentalist" has
become a bad word and environmental protection a polarizingissue. Opposition to environmental protection measures ismore articulate and better organized than in earlier years,and environmental action tends more and more to impinge uponlife styles and economic growth.
Environmental activists. are now being asked to pay the priceof success, a price that some had not anticipated and othershave not been sure that they were obliged to pay. Thisobligation is not created by intemperate or attntion-seekingcritics of environmentalism, although they have given itvisibilLty. It arises out of the honest doubt of relativelyunbiased citizens who are being asked to choose betweenconflicting claims of environmental protectionists and ofeconomic interests, notably of developers, industrialists,and public works enthusiasts. Unfortunately, theseconflicting claims are not easily reconciled. They expressdiffering values and differing assumptions regardingpreferable futures. Very often their premises are notdemonstrably true or false, '.eaving the relatively neutralcitizen no objective basis for choice. Nonetheless, thereoften is a valid public environmental interest at stake, andwith few but inevitable exceptions, environmental defendersare not just another self-interested pressure group.
The environmental protection movement has thus entered PhaseIII in which activists must go beyond their own firstpremises and values and consider the basis of opposingarguments, and seek out ways by which the conflictingpositions may be altered to obtain an environmentallydesirable conclusion. This could lead beyond regulation andmanagement to technoeconomic systems change. The case forPhase III environmentalism was made in 1975 by Carl Pope whenhe argued that "a new synthesis needs to be defined in placeof unacceptable choices between growth or no growth, jobs orno jobs, sprawl or open space" (Pope, 1975). A more recentand complex analysis of environmental activism in transitionhas been undertaken by Denton E. Morrison (1980), who notesthat "The leading edge of thought in environmentalism is thatthe current mode of environmental regulation, howevernecessary for the short and mid-term, must in time besupplanted by broad social transformation in the direction ofsoft technology."
Phase I of environmental protection seldom considered theenvironment comprehensively. It was exemplified by theconservation movement prior to 1960 and was focused primarilyupon specific aspects of the environment, as in theprotection of endangered species of animals and plants,.conservation of water, soil or forests, and reclamation ofwet or arid lands for agriculture. Campaigns againstcommerce in egret plumes, protection of the North Pacific fuseals, and establishment of the U.S. Forest Service arefamiliar examples of Phase I environmental action.
195
2'
The transition to Phase II, the environmental movement from1960 to 1980, was gradual. But it illustrates howenvironmental education was effective in changing manypeople's perceptions of the world and ultimately in changingtheir values. A symbolic date for the transition may be 1941when the National Audubon Society's Bird Lore became TheAudubon Magazine. The conceptual groundwork for a broaderecological view of the environment was being laid in theuniversities by such scholars as Aldo Leopold at theUniversity of Wisconsin, Lawrence Palmer at Cornell, PaulSears at Yale, and Victor E. Shelford at the University ofIllinois. Of course, there were many others and theirnumbers grew. Conservationists such as Fairfield Osborn (OurPlundered Planet, 1948) and William Vogt (The Road toSurvival, 1948), in books that are regrettably nearly asrelevant today as when written, sought to arouse publicawareness of a rapidly deteriorating global environment.There were thus "environmentalists" before the term wasinvented, or before nationwide and international movementsoccurred. By 1963 when Rachel Carson's Silent Springappeared, there was sufficient overt evidence of environ-mental disaster that the personal experience of people inlarge numbers made credible warnings that had previously madelittle impression.
There were many dissatisfactions and nascent fears (arousedparticularly by biomedical findings) that coalesced into theenvironmental movement of the 1960s. Environmental action,Phase II, was initially a spontaneous, grassroots,decentralized citizen initiative. It did not have unifiedideology beyond the general conviction that the humanenvironment was threatened, that the threat was global, andthat public action was necessary to stop or reverse it.Legislators and public officials felt citizen pressure foraction, but the precise nature of that action was seldomspecified. The public seemed to want something done aboutthe environment, but it was not quite sure just what shouldbe done or what the costs of action might be. Mo:e focused,issue-oriented, environmental groups found reinforcement inthis amorphous groundswell of public sentiment. And it nowseems clear that many people failed to understand that aquality environment, like any other desirable thing, hascosts. Most significantly, few people seemed to realize thatthe causes of environmental deterioration were often to befound in their own life styles and ambitions.
Phase III emerged as this realization became evident, whenenvironmental laws and regulations began to bump against thenormal life habits and expectations of ordinary people. Itis the initial success of the environmental movement inobtaining statutory and regulatory protection for theenvironment that has led to a politics of confrontation.
196
216
In the present phase of environmental activism, the challengeis not so much to obtain protective legislation andregulation as it is to make these measures work to achievetheir objectives without creating unwanted side effects andgenerating destructive political opposition.
The environmental activists must now do what they haveadmonished others to do--to take a systems approach toenvironmental problems--to think holistically about theproblem including its social, economic, and politicalaspects. Some environmental activists have already begun todo this, but it imposes a burden of learning, ofcommunicating, and of evaluating alternatives that manyenvironmentally concerned individuals will find difficult tobear. Nevertheless, broadened approaches to environmentalprotection are being taken.
One of these is environmental mediation. Pioneered by GeraldW. Cormick, the adaptation of labor mediation techniques togenerally more complex environmental disputes has providedone process and structure through which all facets of anenvironmental dispute may be examined, with a view to findinga generally satisfactory solution instead of a victory forone adversary or the other with collateral issues leftunresolved (Baldwin, 1978; Patton, 1977; McCarthy, 1976;Fanning, 1979). Environmental mediation is a Phase IIIprocess because it causes the environmental protectionist (aswell as the environmental changer) to consider the totalconsequences of the proposed environmentaffecting action andto participate in seeking the best available solution to anenvironmental problem having significant social, economic,and political implications.
The most clearly defined example of a Phase III effort hasbeen the National Coal Policy Project, put together in 1976by Gerald L. Decker, corporate energy manager of Dow ChemicalCompany, and Laurence I. Moss, a former president of theSierra Club (Carter, 1977, 1978; Alexander, 1978). In aneutral setting provided by Georgetown University, a team ofenvironmental and industrial mining experts undertook acomprehensive study of the coal industry to separate theareas upon which agreement existed, or could be reached,without great difficulty from those areas in which theconcerns of environmental quality and energy production fromcoal seemed fundamentally at odds. The results of the studywere generally encouraging. Substantial areas of agreement,or possible agreement, were discovered and a clearer pictureemerged of the problems upon which the basis for agreementwas not apparent (National Coal Policy Project, 1978). Theseproblems could become objects of further study. Meanwhile,the areas of dispute and possible litigation may have beensignificantly reduced.
197
217
Efforts at joint environmental-industrial problem solvinghave been made with some success in other areas, notably inthe siting of industrial facilities, highway routing, andforest management (McCloskey, 1977). If as many as a quarterof environmental disputes could be resolved throughcooperative study, the saving in time, money, and effortwould be enormous and the prospects for less adversarialhandling of other issues would be improved.
Phase III environmental education ought to provide criticalstudy of these cooperative and other efforts and to assiststudents in perceiving the full dimensions of an environ-mental controversy, without diminishing commitment to theessential requirements of environmental protection. Theability of future citizens to play informed and constructiveroles in environmental policy problem solving could mean moreenvironmental protection rather than less.
Researchers, writers, and teachers in -environmental studiesneed also to continue, and to increase, contacts with andassistance to educators in agriculture, engineering,forestry, mining, and business management. For example,UNESCO has for several years been promoting theenvironmental education and training of engineers through aninternational multidisciplinary working group (Caldwell,1977).
Environmental education programs across this country havebegun to take Phase III circumstances into account. But twodifficulties are encountered. The first is the formidableproblem of identifying and properly interrelating thecritical issues in any environmental controversy. Merely torequire students of environmental science or policy to takecourses in economics or law may fall short of equipping themto deal comprehensively with environmental issues. There isstill much work to be done in coherent curriculum. If we areserious about achieving a holistic approach to environmentalproblems, we will have to find ways to develop more effectiveinteraction among academic specialists and to enlargeopportunities for cross-disciplinary learning.. Summerworkshops would be one way to do this. Some efforts in thisgeneral direction have been made, but more are needed.
The second difficulty in implementing a Phase III approach isencountered in those cases where conflicts areirreconcilable. There are major policy areas involving,among others, questions of land use, transportation, energy,and species preservation where no amount of joint problemsolving, mediation, or compromise can resolve differences.Perhaps, the best that can be done here is to clarify theopposing positions and to analyze the consequences towardwhich each position leads. Where confirmed evidence pointsunmistakably to outcomes that would maintain or enlarge
198
21&
future options, or where the degradation of the biosphere isthreatened, environmental education may appropriately assumean advocacy role. I cannot regard advocacy as inappropriateto environmental education when the destruction of thebiosphere is clearly at stake.
Those of us professionally engaged in the development ofenvironmental studies share in this burden of Phase III ofenvironmental action. It is our function to help preparepeople to meet its challenge. But we are not wholly freefrom the earlier need to induce a public awareness ofenvironmental circumstances and issues (Goldsmith andHochbaum, 1975). It does not appear to me thatmeans--financial and institutional--to support the level ofeffort needed is proportionate to both needs. I hope that theNational Association for Environmental Education may leadefforts to bring environmental awareness and a recognition ofresponsibility for environmental protection into a coherentrelationship. To do so would contribute tp actualizing theprecept stated in Section 101 of the National EnvironmentalPolicy Act "...that each person has a responsibility tocontribute to the preservation and enhancement of theenvironment."
Environmental educators might profitably give more attentionto multiple impact analysis as a systematic way ofapproaching environmental ,issues in the Phase III context.Daneke and Delli Priscolli (1979) have given us a very usefulsurvey of the uses of social planning, and the impliedlessons could be applied with equal justification toenvironmental policy and planning. The environmental policycurriculum could draw more often upon the literature ofpolicy analysis in addition to its present reliance uponresearch in environmental impact analysis.
A concluding note of caution may be prudent. Because betterways may be found to achieve environmental protection thanthrough adversary conflict does not mean that the case ofeach participant in a cooperative effort is equallymeritorious. On occasion the merit may be equal, but rarelyso if those concerned with environmental protection havethought through the environmental issue in its fulldimensions and have sought to practice what they havepreached to others--a holistic perspective on human needs andbehaviors in relation to the continuing viability of theEarth.
199
219
REFERENCES
Alexander, Tom. 1978. "A Promising 'Try at EnvironmentalDetente for Coal." Fortune, February 13, 94-96 ff.
Audubon, 82: 124 (January 1980).
Baldwin, Pamela. 1978. Environmental Mediation: AnEffective Alternative? Report of a Conference Heldin Reston, Virginia, January 11-13, 1978. PaloAlto, CA: RESOLVE, Center for Environmental Conflict.
Briggs, Bruce B. 1978. "Needless Fuss About Land Use."The Alternative, February 13, 94 ff.
Caldwell, Lynton K. 1977. "Engineering and Ecodevelopment:International Initiatives." TECHNOS, 6: 4-15,January-March.
Carter, Luther J. 1977. "Coal: Invoking 'the Rule ofReason' in an Energy-Environment Conflict." Science,198: 276-280, October 21.
Carter, Luther J. 1978. "Sweetness and Light fromIndustry and Environmentalists on Coal." Science,199: 958-959, March 3.
Daneke, Gregory A. and Jerry Delli Priscolli. 1979."Social Assessment and Resource Policy: Lessonsfrom Water Planning." Natural Resources Journal,19: 299-375, April.
Fairfax, Sally K. 1978. "A Disaster in the Environment' Movement." Science, 199: 743-748, February 17.
Fanning, Odom. 19.9. "Earthlog." Audubon, 81: 15-16,January.
Goldsmith, Francis J. and Godfrey M. Hochbaum. 1975."Changing People's Behavior Toward the Environment."Public Health Reports, 231-234, May-June.
Grayson, Melvin and Thomas Shepard, Jr. 1973. TheDisaster Lobby. Chicago: Follett Publishing Company.
McCarthy, Jenc and Alice J. Shorett. 1976. "Mediation toResolve Environmental Controversies: The SnohomishExperiment." Journal of Soil and Water Conservation,31, September-October, 6 pp.
Maddox, John. 1972. The Doomsday Syndrome. New York:McGraw-Hill.
200
220
Mitchell, Robert Cameron. 1978. "The Public SpeaksAgain: A New Environmental Survey." Resources,60: 1-6, September-November.
Morrison, Denton E.; Kenneth E. Hornbeck; and W. KeithWarner. 1972. "The Environmental Movement: SomePreliminary Observations and Predictions," in SocialBehavior,, Natural Resources and Environment. Editedby William Burch, Neil Cheek, and Lee Taylor.New York: Harper & Row, 259-279.
Morrison, Denton E. 1980. "The Soft, Cutting Edge ofEnvironmentalism: Why and How the AppropriateTechnology Notion is Changing the Movement." NaturalResources Journal, 20: 345-358, April.
National Coal Policy Project. 1978. Where We Agree:Report of the National Coal Policy Project, Vols.1 and 2. Edited by Francis X. Murray. Boulder, CO:Westview Press.
Neuhaus, Richard. 1971. In Defense Of People New York:Macmillan.
Patton, Leota K. and Gerald W. Cormick. 1977. "Mediationand the NEPA Process: The Interstate 90 Experience,"in Environmental Impact Analysis: Emerging Issuesin Planning. Edited by Ravinder K. Jain and Bruce L.Hutchings. Urbana: University of Illinois Press,pp. 43-54. Papers presented at the Conference onEnvironmental Impact Analysis, "The DecisionProcess"--co-sponsored by the Department ofArchitecture and the U.S. Army Construction Engineering Research Laboratory, Champaign, Illinois, held atAllerton House, Monticello, Illinois, May 22-25.
Pope, Carl. 1975. "Growth and the Poor." Sierra ClubBulletin, 60: 7-11 ff, April.
Schindler, D. W. 1976. "The Impact Statement Boondoggle."Science, 509, May 7.
Seattle Times (June 18, 1979), p. A14.
Simon, Julian L. 1980. "Resource, Population, Environment:An Oversupply of False Bad News." Science, 1431-1437,June 27.
Tucker, William. 1977. "Environmentalism and the LeisureClass." Harper's, 49-56 ff, December.
201
221
A FRAMEWORK FOR ENVIRONMENTAL EDUCATION CURRICULUMPLANNING AND DEVELOPMENT
Harold R. Hungerford, R. Ben Peyton,and Richard J. Wilke'
Abstract. The purpose of this paper is to describe: (1) theresearch effort which led to the formulation and validationof the Goals for Curriculum Development in EnvironmentalEducation, and (2) how the "Goals" can be used forenvironmental education curriculum planning, development, andevaluation.
Introduction
It is generally agreed by curriculum specialists that,irrespective of the subject, goals are needed to i_rovide asense of direction for curriculum development andinstruction. VandeVisse and Stapp (1975, p. 96) haveexpressed the need for goals in environmental education. Theyhave warned that, "...without a clear statement of goals, anenvironmental education program would become a series ofunrelated experiences, focusing on limited programobjectives." Unfortunately, as Roth (1976, p. 7) has noted,"the presence of environmental education in public schoolcurricula can often be characterized by loose organizationand little sense of direction."
Although general goals for environmental education (e.g., todevelop environmental awareness, knowledge, attitudes,skills, etc.) have been described, the writers have longnoted the need for more definitive subgoals to guidecurriculum development. Recent studies such as Childress'National Profile of Environmental Education Curricula (1978)can be used to document the inconsistency between the goalsexpressed for, and used in, environmental education programsand projects, and those recommended by documents such as theBelgrade Charter(1975) and the Tbilisi Declaration (1977).This inconsistency may be due, part, to the inherentdifficulties confronting a curriculum developer charged withthe task of translating general goals into manageableinstructional objectives. In order to help curriculum
1The authors' names are listed in alphabetical order. Nohierarchy is suggested or implied. Dr. Hungerford is aProfessor in the Department of Curriculum, Instruct-ion, andMedia at Southern Illinois University at Carbondale. Dr.Peyton is an Assistant Professor in the Department ofFisheries and Wildlife at Michigan State University. Dr.Wilke is Director of the Central Wisconsin EnvironmentalStation at the University of Wisconsin at Stevens Point.
202
292
developers and practitioners overcome these difficulties, thewriters decided to develop a framework of more definitivesubgoals to guide environmental education curriculumdevelopment.
The writers began the development process by adaptingHarvey's (1977) superordinate goal for environmental,education. This provided the overriding or general goaltoward which all subgoals were directed. An analysis of theliterature and research conducted at Southern IllinoisUniversity at Carbondale indicated that a framework of goalsfor environmental education must include four levels: LevelI. Ecological Foundations; Level II. Conceptual Awareness;Level III. Investigation and Evaluation; and Level IV.Environmental Action Skills. The writers developed subgoalsfor each of these four levels'and then subjected the originalGoals for Curriculum Development in environmental-educaitionto two validity assessments. The goals were revised on thebasis of recommendations received from a validity panelconsisting of five nationally recognized environmentaleducators. The revised goals follow.
Goals for Curriculum Developmentin Environmental Education)
The Superordinate Goal: ...to aid citizens inbecoming environmentally knowledgeable and,above all, skilled and dedicated citizens whoare willing to work, individually and collec-tively, toward achieving and/or maintaining adynamic equilibrium between quality of lifeand quality of the environment.
1 This document represents the final draft of the goalssubsequent to validation. The final validity assessmentwas conducted by a panel of five professional environ-mental educators. This panel was composed of Drs. RobertS. Cook, John Disinger, Robert George, Harold McKenna,and R. Thomas Tanner.
2Adapted from Gary D. Harvey, A Conceptualization ofEnvironmental Education. In J. L. Aldrich, A. M. Blackburn,and G. A. Abel (Eds.), A Report on the NorthAmerican Regional Seminar on Environmental Education.Columbus, OH: SMEAC Information Reference Center, 1977.,
203
223
Level I. Ecological Foundations Level:
This level seeks to provide the receiver with sufficientecological foundations knowledge to permit him/her toeventually make ecologically sound decisions with respect toenvironmental issues.
The Ecological Foundations Level would minimally include'thefollowing conceptual components:
A. Individuals and populations.
B. Interactions and interdependence.
C. Environmental infliences and limiting factors.
D. Energy flow and materials cycling (biogeo-chemical cycling).
E. The community and ecosystem concepts.
F. Homeostasis.
G. Succession.
H. The human being as an ecosystem component.
I. The ecological implications of human activitiesand communities.
Level II. Conceptual Awareness Level--Issues and Values
This level seeks to guide the development of a conceptualawareness of how individual and collective actions mayinfluence the relationship between quality of life and thequality of the environment...also, how these actions resultin environmental issues which must be resolved throughinvestigation, evaluation, values clarification, decisionmaking and finally, citizenship action.
Goals at this level are formulated to provide opportunitiesfor receivers to conceptualize...
A. ...how human cultural activities (e.g., religious,economic, political, social, etc.) influence theenvironment from an ecological perspective.
B. ...how individual behaviors impact on theenvironment from an ecological perspective.
C. ...a wide variety of environmental issues and theecological and cultural implications of theseissues
204
2`e4
D. ...the viable alternative solutions availablefor remediating discrete environmental issuesand the ecological and cultural implicationsof these alternative solutions.
E. ...the need for environmental issue investigationand evaluation as a prerequisite to sound decisionmaking.
F. ...the roles played by differing human values inenvironmental issues and the need for personalvalues clarification as an integral part ofenvironmental decision making.
G. ...the need for responsible citizenship action(e.g., persuasion, consumerism, legal action,political action, ecomanagement) in the remediationof environmental issues.
Level III. Investigation and Evaluation Level:
This level provides for the development of the knowledge andskills necessary to permit receivers to investigateenvironmental issues and evaluate alternative solutions forremediating these issues. Similarly, values are clarifiedwith respect to these issues and alternative solutions.Goals at this level are presented in two components.
Component A: Goals for Component A are to develop inreceivers...
A. ...the knowledge and skills needed to identify andinvestigate issues (using both primary and secondarysources of information) and to synthesize the datagathered.
B. ...the ability to analyze environmental issues andthe associated value perspectives with respect totheir ecological and cultural implications.
C. ...the ability to identify alternative solutions fordiscrete issues and the value perspectives associatedwith these solutions.
D. ...the ability to autonomously evaluate alternativesolutions and associated value perspectives fordiscrete environmental issues with respect to theircultural and ecological implications.
' E. ...the ability to identify and clarify their ownvalue positions related to discrete environmentalissues and their associated solutions.
205
225
F. ....the ability to evaluate, clarify, and change theirown value positions in light of new information.
Component B: Goals for Component B are to providereceivers with opportunities to...
G. ...participate in environmental issue investigationand evaluation.
H. ...participate in the valuing process in a manner asto permit the receiver to evaluate the extent to whichhis/her values are consistent with the superordinategoal of achieving and/or maintaining a dynamicequilibrium between quality of life and quality ofenvironment.
Level IV. Environmental Action Skills Level--Training and Application
This level seeks to guide the development of those skillsnecessary for receivers to take positive environmental actionfor the purpose of achieving and/or maintaining a dynamicequilibrium between quality of life and the quality of theenvironment. Goals at this level are presented in twocomponents.
Component A: The goal for Component A is to developin receivers...
A. ...those skills which will permit them to effectivelywork toward ends which are consistent with theirvalues and take either individual or group actionwhen appropriate, i.e., persuasion, consumerism,political action, legal action, or ecomanagement.
Component B: The goals for Component B are to p7ovidereceivers with opportunities to...
B. ...make decisions concerning environmental actionstrategies to be used with respect to particularenvironmental issues.
C. ...apply environmental action skills to specificissues, i.e., to take citizen action on one ormore issues.
D. ...evaluate the actions taken with respect to theirinfluence on achieving and/or maintaining a dynamicequilibrium between quality of life and the qualityofthe environment.
206
2 '6
Assumptions Made by the Developers
The following assumptions have been made relative to thegoals:
1. That the goals for curriculum development inenvironmental education are appropriate for use inguiding both formal and nonformal environmentaleducation curriculum development efforts.
2. That a "receiver" can be thought of as any person,of any age, who can be reached through either theformal or nonformal educational sectors.
3. That the superordinate goal is philosophically correctas stated. That this goal represents the most appro-priate direction for environmental education if environ-mental education is going to meet the tremendouschallenges facing mankind both' today and tomorrow.
4. That ecological foundations are critical to any environ-mental education program as prerequisite or corequisitecognitive knowledge. That ecological concepts are anintegral part of environmental education. Despite thispremise, it remains cogent to make certain that receiversdistinguish between environmental education and ecologyper se.
5. That, regardless of the importance of specificinstructional methods such as outdoor education,environmental interpretation, and acclimatization,these are not a part of the substantive structureof environmental education per se.
Therefore, ancillary goals representing theseactivities directly do not appear here althougha number of the goals for curriculum developmentin environmental education might be facilitated by theuse of these and other methodologies.
6. That some level of "environmental sensitivity" isprobably critical to the receiver's being willingand/or able to engage profitably in Levels II, III,and IV of this set of goals. Irrespective of thisassumed prerequisite, the developers have arbitrarilyomitted goals dealing with sensitivity on severalgrounds. These are:
A. Sensitivity would have to be represented asfoundational.
B. Sensitivity per se cannot be operationalized inin a manner as to provide for any measurablecriterion level of affect.
207
227
C. Every individual will enter the EE process witha unique set of affective predispositions,generated by the individual's own backgroundof experiences.
D. Like values clarification, sensitivity will,in part, result from EE activities themselves.In particular, judiciously developed instructionalprograms in ecological foundations and conceptualawareness should measurably assist in thesensitization process.
7. The process of valuing, values clarification and moralreasoning are implicit in the goals, particularly IIIand IV.
8. That environmental action is, in fact, represented bythe five categories of action as stated in the goals(or in combinations of these categories). Theassumption is also made that these action categories(or combination of them) are exhaustive.
9. That the concept of maintaining and/or achieving adynamic equilibrium (homeostasis) must be interpretedfrom both cultural and ecological perspectives. Thatsaid equilibrium may well result in a distinctcompromise between quality of life on one hand andquality of the environment on the other. Thecurriculum developer must be constantly aware ofthis in order to produce curricular materials thatlook rationally at both the cutlural and ecologicalcosts involved in achieving a true equilibrium.
10. That the phrase, "...to provide receivers withopportunities to apply environmental action skillsto specific issues" implies no more than what isstated. That an educator cannot ethically force areceiver to take action but, instead, should providemechanisms whereby action can be taken if desired.
11.. That instructional objectives would be generated undereach subordinate goal during curriculum development.
12. That environmental education is an interdisciplinarypursuit and that numerous disciplines must be reflectedin the generation of any set of goals for curriculumdevelopment. Only in this manner can environmentaleducation help receivers to successfully meet thechallenges facing them as world citizens.
208
Developer's Initial Content Validity Assessment
The developers initially assessed the content validity of the
goals by comparing the goals expressed at each level of their
document against the five (5) categories of environmental
education objectives proposed at the Tbilisi
IntergovernmentalConference on Environmental Education in
1977. The TbiliEi objectives follow:
AWARENESS: to help social groups and individuals
acquire an awareness and sensitivity to the total
environment and its allied problems.
KNOWLEDGE: to help social groups and individuals
gain a variety of experiences in, and acquire a
basic understandingof, the environment and its
associated problems.
ATTITUDES: to help social groups and individuals
acquire a set of values and feelings of concern
for tL environment andmotivation for actively
participating in environmental improvement and
protection.
SKILLS: to help social groups and individuals
acquire the skills for identifying and solving
environmental problems.
PARTICIPATION:to provide social groups and
individualswith an opportunity to be actively
involved at all levels in working toward
resolution of environmental problems.
The validity comparison grid will be found in Figure 1.
Results of the Validity Panel Assessment
The use of a validity panel is an accepted and recommended
means of establishing content validity (Ary, Jacobs and
Razavieh, 1972; KerLinger, 1973). Further, this same
procedure has been recommended by Saylor and Alexander (1974)
for defining and validatingsubgoals such as those included
in the Goals for Curriculum Development in Environmental
Education. A more complete description of the validity panel
assessment follows.
In 1978 and subsequent to the developers' initial content
validity assessment, they submitted thegoals to a validity
panel consisting of seven nationally recognized environ-
mental educators for their evaluation.
209
22n
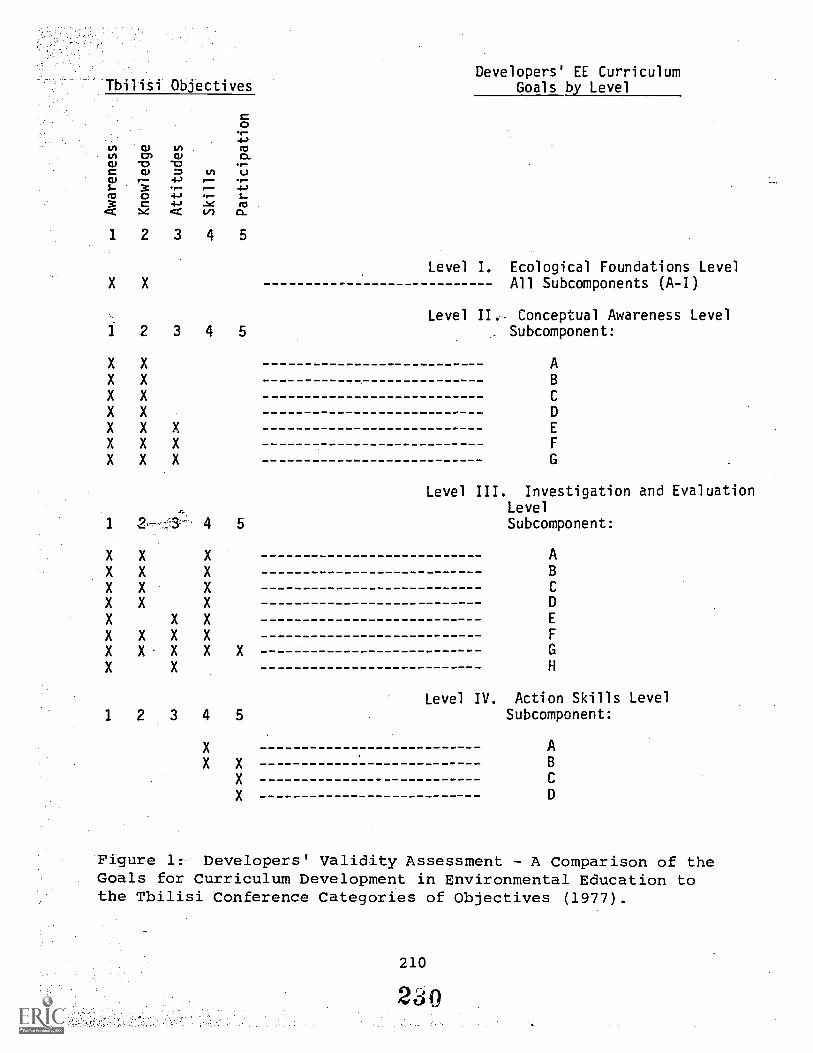
Developers' EE CurriculumTbilisi. Objectives Goals by Level
X X
2
X X
X X
X X
X X
X X
X X
X X
1
X X
X X
X X
X X
X
X
1 2
3 4 5
3 4 5
X
X
X
Level III. Investigation and EvaluationLevel
4 5 Subcomponent:
X AX
xX
X XXXXXXXXXXX
Level IV. Action Skills Level3 4 5 Subcomponent:
X AX X
X
X
Level I. Ecological Foundations LevelAll Subcomponents (A-I)
Level II.- Conceptual Awareness LevelSubcomponent:
AB
C
D
E
F
Figure 1: Developers' Validity Assessment - A Comparison of theGoals for Curriculum Development in Environmental Education tothe Tbilisi Conference Categories of Objectives (1977).
210
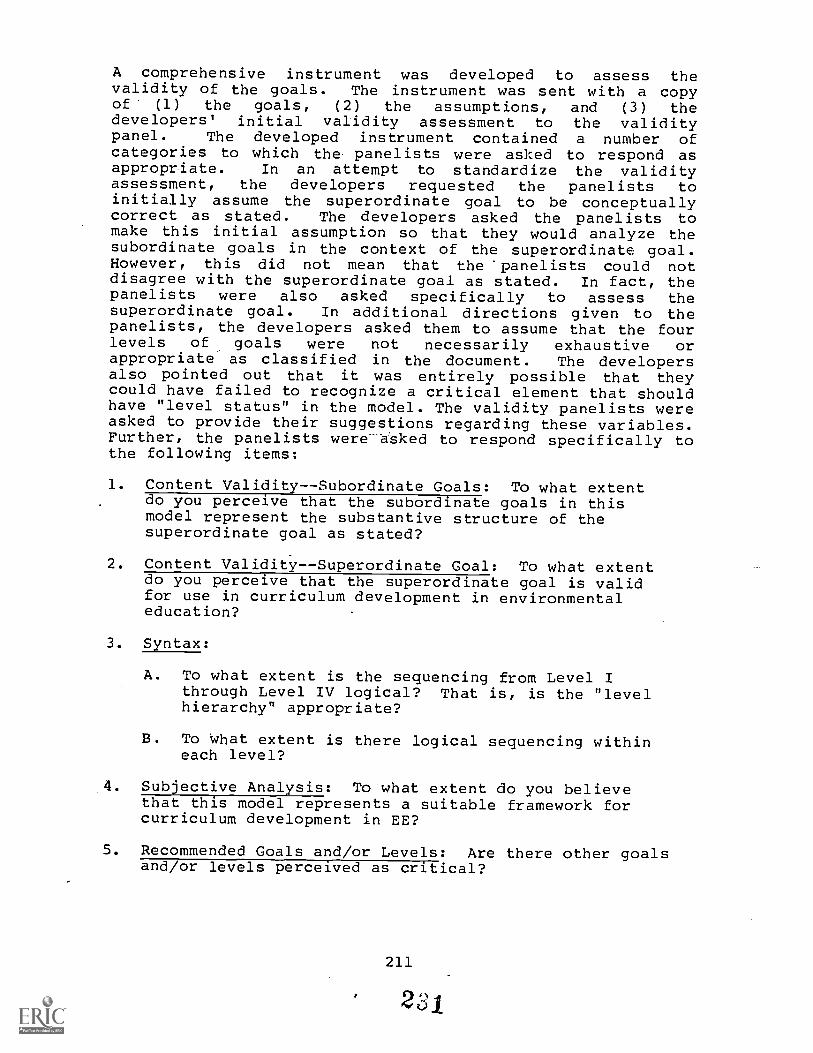
A comprehensive instrument was developed to assess thevalidity of the goals. The instrument was sent with a copyof (1) the goals, (2) the assumptions, and (3) thedevelopers' initial validity assessment to the validitypanel. The developed instrument contained a number ofcategories to which the panelists were asked to respond asappropriate. In an attempt to standardize the validityassessment, the developers requested the panelists toinitially assume the superordinate goal to be conceptuallycorrect as stated. The developers asked the panelists tomake this initial assumption so that they would analyze thesubordinate goals in the context of the superordinate goal.However, this did not mean that the 'panelists could notdisagree with the superordinate goal as stated. In fact, thepanelists were also asked specifically to assess thesuperordinate goal. In additional directions given to thepanelists, the developers asked them to assume that the fourlevels of goals were not necessarily exhaustive orappropriate as classified in the document. The developersalso pointed out that it was entirely possible that theycould have failed to recognize a critical element that shouldhave "level status" in the model. The validity panelists wereasked to provide their suggestions regarding these variables.Further, the panelists were-asked to respond specifically tothe following items:
1. Content Validity--Subordinate Goals: To what extentdo you perceive that the subordinate goals in thismodel represent the substantive structure of thesuperordinate goal as stated?
2. Content Validity--Superordinate Goal: To what extentdo you perceive that the superordinate goal is validfor use in curriculum development in environmentaleducation?
3. Syntax:
A. To what extent is the sequencing from Level Ithrough Level IV logical? That is, is the "levelhierarchy" appropriate?
B. To what extent is there logical sequencing withineach level?
4. Subjective Analysis: To what extent do you believethat this model represents a suitable framework forcurriculum development in EE?
5. Recommended Goals and/or Levels: Are there other goalsand/or levels perceived as critical?
211
Completed validity assessments were received from five of theseven panelists. In general, the comments received from thepanelists were consistent. The consistency of the commentsgreatly facilitated the process of revising both the goalsand the assumptions made by the developers regarding thegoals. The revision process was completed during the springof 1978. The revised goals and the assumptions regarding thegoals are presented herein.
Applying the Goals
The utility of the Goals for Curriculum Development inenvironmental education lies in their application.Basically, the goals exist as a framework within whichspecific performance objectives can be written by thecurriculum developer from which a curriculum forenvironmental education can be developed. As far as thewriters can determine, no environmental education curriculumhas ever been developed in precisely this manner. This mayexplain why the literature abounds with challenges byprofessionals, to the community as a whole, to producesyntactically sound curricula which transcend the "awarenesslevel" of receiver achievement.
Although environmental education curricula abound throughoutthe world, it is evident that most curricular packages areproduced largely on the basis of developer bias andintuition. Many such packages were developed even before anyconsensus was reached relative to the parameters ofenvironmental education per se. It would be the writers'recommendation, therefore, that new curriculum developmentprojects are needed and that these projects be responsiblyptoduced with environmental issue investigation and theremediation of issues as major goals. The utilization of theGoals for Curriculum Development in environmental educationwould certainly facilitate this process.
Figure 2 presents a curriculum model based on the goallevels. This conceptual scheme illustrates how a curriculumscope may be operationalized from the goal levels andintegrated through grades (vertical organization) and acrossappropriate disciplines (horizontal organization).Development of the curriculum scope would require theexpansion of each goal component into specific objectives incognitive and affective domains.
The goals not only provide a basis for developing curriculumobjectives, but to some extent specify teaching strategies aswell. If the curriculum is to achieve Component B of LevelsIII and IV, teaching strategies must be implemented whichprovide receivers with the opportunities to participate inenvironmental issue investigation, evaluation, and decisionmaking.
212
2 .`-) 2
The writers have also found that the Goals for CurriculumDevelopment can be used for analyzing and evaluating EEmaterials currently in existence. One such analysis ispresented here.
1
In 1978, a one-year program for environmental education waspublished entitled Investigation and Action Skills forEnvironmental Problem Solving. The program is composed of aset of six (6) modules written by H. Hungerford, R. A.Litherland, R. Ben Peyton, and A. M. Tomara. The moddles arepublished by Stipes Publishing Company, 10 Chester Street,Champaign, Illinois 61820. This program's intent is toassist receivers in acquiring those skills needed to becomeeffective issue investigators and responsible citizenactivists. Individual module titles are as follows:
Module I:
Module II:
Module III:
Looking into Environmental Problems
Studying Environmental Problems UsingSecondary Sources
Using Surveys, Questionnaires, andOpinionnaires in EnvironmentalInvestigations
Module IV: Interpreting Data in EnvironmentalInvestigations
Module V: Studying an Environmental Problem
Module VI: Environmental Action Strategies
Subsequent to the development of the Goals for CurriculumDevelopment in environmental education, the writers decidedto compare the modules against the goals in order todetermine which goal levels were represented by that program.Such an analysis could assist the program's developers in anevaluation of the modules and provide indications of wherethe modules might need subsequent revision.
A partial report of that analysis appears here in Table 1entitled, "Goal Analysis. of the Investigation and ActionSkills Modules." The performance objectives for each moduleare accounted for in this analysis (by number because spacedoes not permit an iteration of each objective). Althoughsome objectives could be included in more than one goallevel, the writers arbitrarily chose to place each oojectiveinto the one level that appeared to be the most appropriate.The column entitled "Other" contains those objectives thatdeal specifically with skills directly associated with areassuch as math and language arts.
213
n
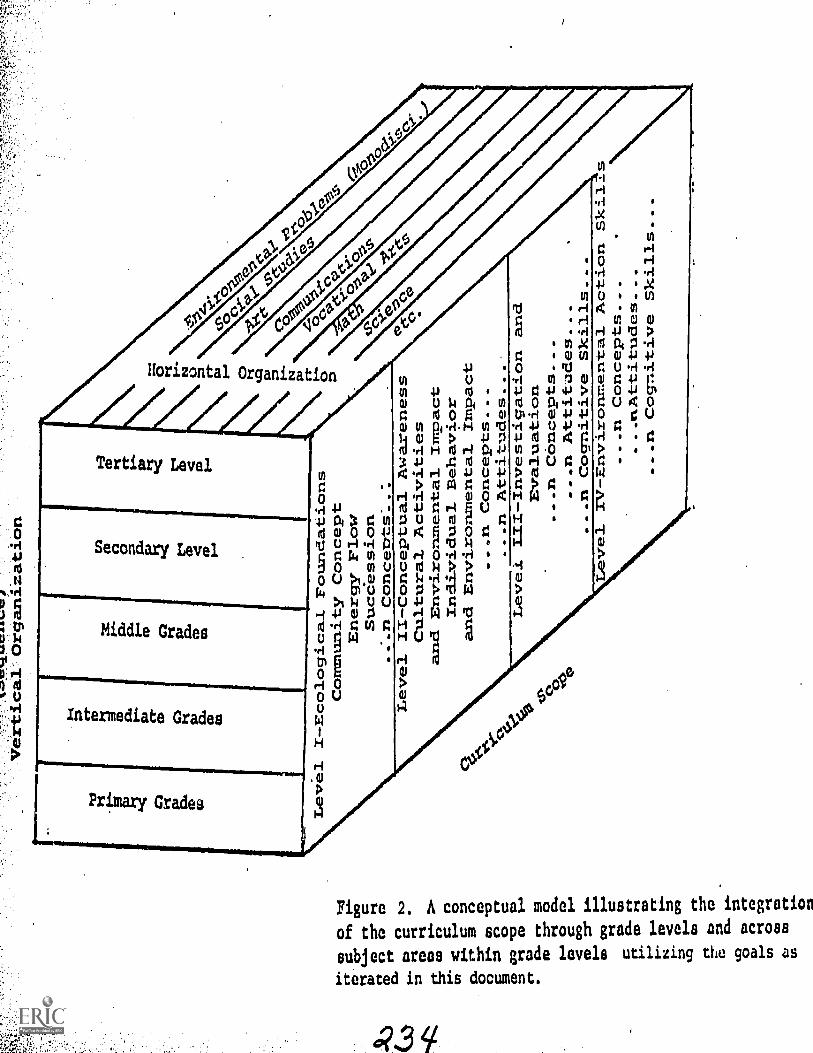
014
0
0
dc`
e
,
0lo.
%
10, # 0.
Horizontal
Organization
Tertiary
Level
011110101.............ftwerdim
ow
Secondary
Level
Middle
Grades
Intermediate
Grades
Primary
Grades
to , I
5 .0
) g ma04)0 0 V
N 1-1
sr.1
pg g in in0 A4 in U
0
P
g
W UO
$.1
U
4.1
0)0
d w g ulU.r1
H 0U
1H
.to
Icy
1/1riritriR al E
n
tri
...4
(nritirin 44 lo ci 44 4.1
a) U 04 LI)
0 0 040 Id 0 4 41 Ul
.r1
a 4.1
4.1
0) VI
Orl.
H M 'Cl
Sri
t) .r1
popmH rl L
n
0 .0or4
01
:,;
of a) .r)
1-1
C.)
0
4.dri
0 U P '1 00> 41 PI
0 0 4.1
g
1H 44
00 H 14
0
14.10H
1
O U g H .Qi
Vg
11
,0)-1
0 g
ri 0 .1-1
*riu m m
g g a)0 0 ru
U 0 4I ri 1,41
H '0
a)
0
toP
4.
I toto
4.1M
1170 0
04 0 r1
a) 4,3
4.1U .ri
r14-1u 4.1
.cU
. g, I
Figure
2.
A conceptual
model
illustrating
the
integration
of
the
curriculum
scope
through
grade
levels
and
across
subject
areas
within
grade
levels
utilizing
the
goals
as
iterated
in
this
document.
In summary, much of the curriculum planning for environmentaleducation has been based upon the use of "hunches," asChildress (1978) has noted. The writers believr" that theresponsibilities of environmental education ace toogreat...the time too short...and practitioners' skills toofew to allow curriculum development to remain a matter ofintuition. Therefore, the writers recommend that the Goalsfor Curriculum Development in Environmental Education beutilized to guide curriculum planning and development in thefield. Further, the writers recommend that existing EEprograms be analyzed to determine the extent to which theymeet the goals.
215
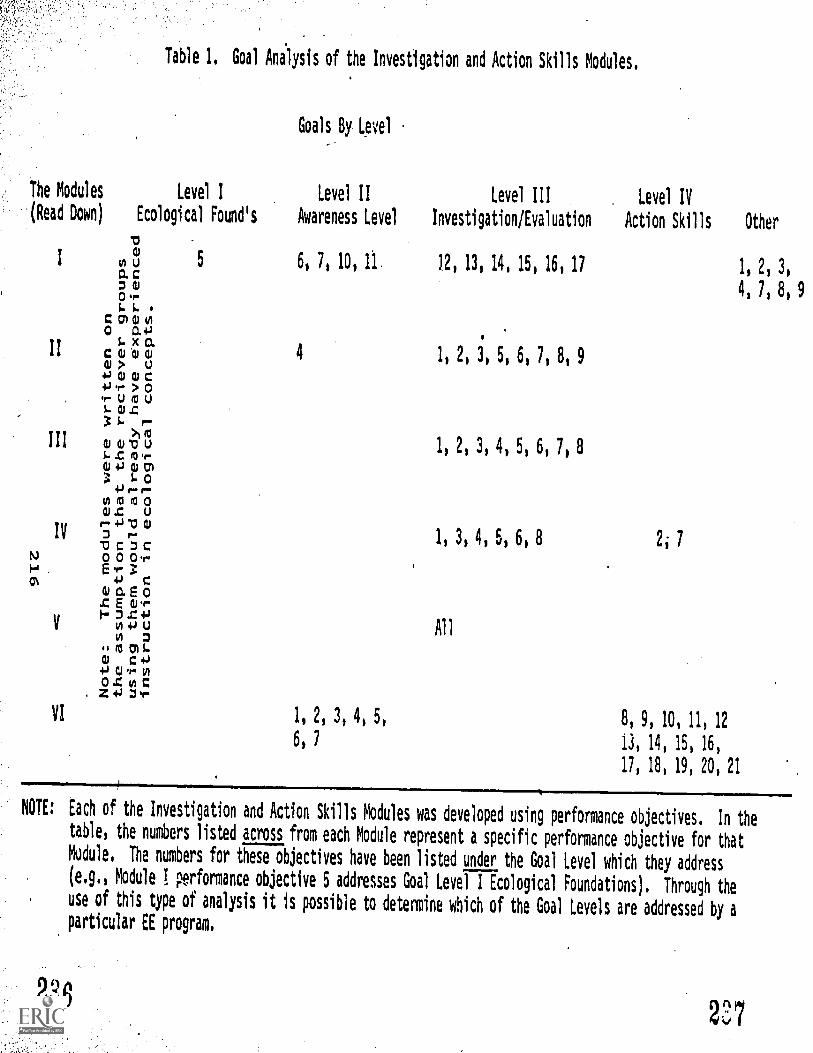
Table I. Goal Anilysis of the Investigation and Action Skills Modules,
Goals By level
The Modules level I Level II level III Level IV
(Read Down) Ecological Found's Awareness Level Investigation/Evaluation Action Skills Other
I 0 tl 5 6,7,10, 11 12, 131 14, 151 161 17 1, 21 3,
;aQ.)4, 7, 81 9
C cr) oiln
o 0.4
II XO.C41014) 4 1,2,3,5,6,7,8,9w > u
> 0U iD U
S-41.33S. r-
I I I 4.1
>)0)17U 1, 2, 3, 4, 5, 6, 7, 8
wo)1.
4) P' r"041(0001-C U
IV+1-04)
3 r 1, 3, 4, 5, 6, 8 2; 7TiC3CIV 000.r.
. E 3c
c.E 0E CU'r"
V VI U4.3
AllVI 3
to (041 C4-14-1411"1/1
C, 2034-VI I, 2, 3, 4, 5,
6, 1
8, 9, 101 111 12
13, 14, 15, 16,
17, 181 19, 20, 21
NOTE: Each of the Investigation and Action Skills Modules was developed using performance objectives. In thetable, the numbers listed across from each Module represent a specific performance objective for thatModule. The numbers for these objectives have been listed under the Goal Level which they address(e.g., Module ! performance objective 5 addresses Goal Level I Ecological Foundations). Through the
use of this type of analysis it is possible to determine which of the Goal Levels are addressed by aparticular EE program.
24'17
REFERENCES
Ary, D.; L. C. Jacobs; and A.'Razqvieh. 1972. Introduc-tion to Research in Education. New York: Holt,Rinehard and Winston, Inc.
Belgrade Charter. 1976. Connect. UNESCO -UIIFP Environ-mental Education Newsletter, 1(1): 1-2. ,
Childress, R. B. 1978. Public School EnvironmentalEducation Curricula: A National Profile. Journalof Environmental Education, 9(3): 2-11.
Harvey, G. D. 1976. Environmental Education: ADelineation of Substantive Structure. Doctoraldissertation, Southern Illinois University.Dissertation Abstracts International, 1977, 38611A-612A (Uniyersity Microfilms No. 77-16, 622).
Kerlinger, F. N. 1973. Foundations of BehavioralResearch (2nd ed.). New York: Holt, Rinehard andWinston, Inc.
Roth, R. E. 1976. A Review of Research Related toEnvironmental Education 1973-1976. Columbus, OH:ERIC/SMEAC Clearinghouse for Science, Mathematics,and Environmental Education.
Saylor, J. C. and W. M. Alexander. 1974. PlanningCurriculum for Schools. New York: Holt, Rinehardand Winston, Inc.
Tbilisi Intergovernmental Conference on EnvironmentalEducation. 1978. Toward An Action Plan: A Reporton the Tbilisi Conference on Environmental Education.A paper developed by the FICE Subcommittee onEnvironmental Education. Washington, DC: U.S.Government Printing Office, Stock No. 017-080-01838-1.
VandeVisse, E. and W. B. Stapp. 1975. Developing a K-12Environmental EducaLion Program, in N. McInnis andD. Albrecht (eds.),, What Makes EducationEnvironmental? Louisville, KY: Data Courier, Inc.
217
23&
AN ASSESSMENT OF TEACHERS' UNDERSTANDING AND USEOF "GOALS FOR CURRICULUM DEVELOPMENT IN
ENVIRONMENTAL EDUCATION"
Randall Champeaul, Michael Gross2,and Richard Wilke2
Abstract. A questionnaire was administered to centralWisconsin teachers to assess their comprehension of the"Goals for Curriculum Development in EnvironmentalEducation." Also assessed was whether teachers felt schoolsshould be responsible for addressing the Goals and whetherthey had the knowledge, skills, and resources to accomplishthe Goals. These results are presented.
Introduction
The "Goals for Curriculum Development in EnvironmentalEducation" (Hungerford, Peyton, and Wilke, 1980) were writtento aid educators in incorporating environmental educationinto formal and informal educational programs. These goalswere developed to further define the general goals formulatedat Belgrade (1975) and Tbilisi (1978) internationalconferences.
The need for this definitive statement of goals issubstantiated by the Childress (1978) study. Childress foundthat educators were addressing the awareness and ecologicalfoundation of environmental education. However, littleattention was given by educators to developing investigationand action skills regarding environmental issues. This wasinconsistent with the recommendations of the Belgrade andTbilisi reports.
Hungerford, et al. (1980, p. 43), stated that theseinconsistencies "may be due to inherent difficultiesconfronting a curriculum developer charged with the task oftranslating what are very general goals into manageableinstructional objectives." Childress further noted thattranslating the general goals into instructional objectivesmany times results in the use of "hunches" as a basis forcurriculum planning.
'Department of Fisheries and Wildlife, Michigan StateUniversity, East Lansing, MI 48823.
2College of Natural Resources, University of Wisconsin,Stevens Point, WI 54481.
218
2`-'9
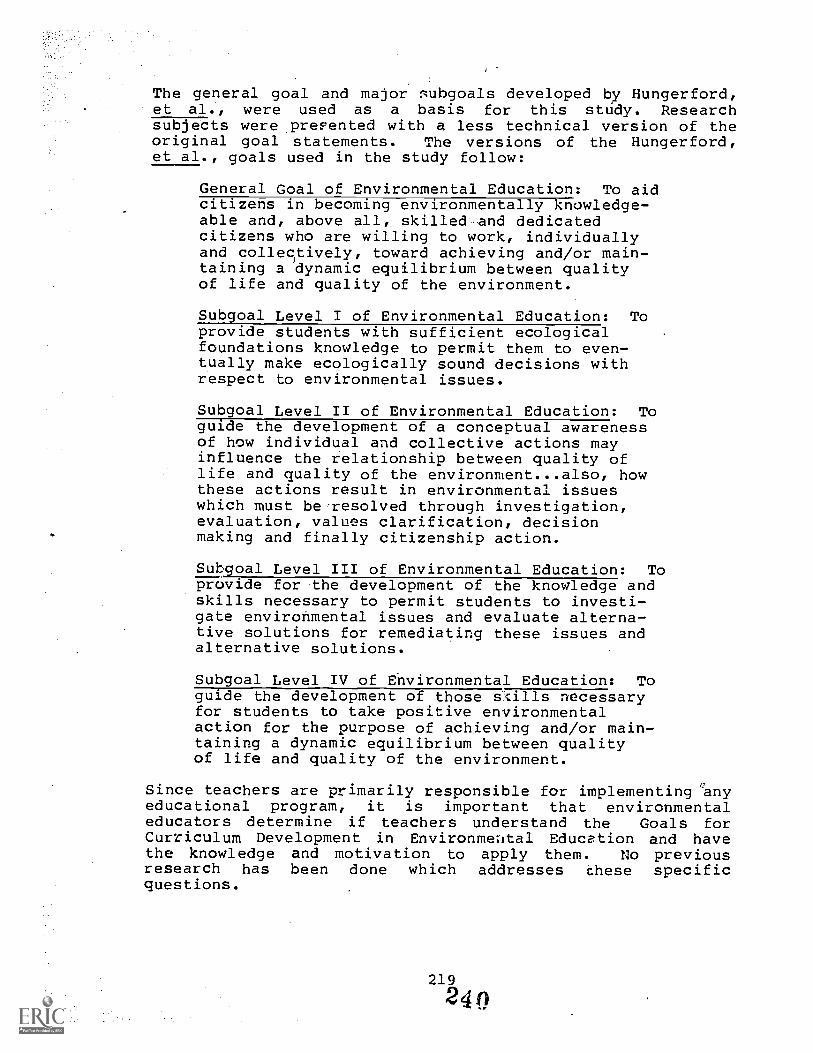
The general goal and major subgoals developed by Hungerford,et al., were used as a basis for this study. Researchsubjects were pre'ented with a less technical version of theoriginal goal statements. The versions of the Hungerford,et al., goals used in the study follow:
General Goal of Environmental Education: To aidcitizens in becoming environmentally knowledge-able and, above all, skilled and dedicatedcitizens who are willing to work, individuallyand collecitively, toward achieving and/or main-taining a dynamic equilibrium between qualityof life and quality of the environment.
Subgoal Level I of Environmental Education: Toprovide students with sufficient ecologicalfoundations knowledge to permit them to even-tually make ecologically sound decisions withrespect to environmental issues.
Subgoal Level II of Environmental Education: Toguide the development of a conceptual awarenessof how individual and collective actions mayinfluence the relationship between quality oflife and quality of the environment...also, howthese actions result in environmental issueswhich must be resolved through investigation,evaluation, values clarification, decisionmaking and finally citizenship action.
Subgoal Level III of Environmental Education: Toprovide for the development of the knowledge andskills necessary to permit students to investi-gate environmental issues and evaluate alterna-tive solutions for remediating these issues andalternative solutions.
Subgoal Level IV of Environmental Education: Toguide the development of those sthls necessaryfor students to take positive environmentalaction for the purpose of achieving and/or main-taining a dynamic equilibrium between qualityof life and quality of the environment.
Since teachers are primarily responsible for implementing anyeducational program, it is important that environmentaleducators determine if teachers understand the Goals forCurriculum Development in Environmental Education and havethe knowledge and motivation to apply them. No previousresearch has been done which addresses these specificquestions.
219
240
This research was undertaken to determine teachers'understanding, knowledge, and motivation regarding the Goalsfor Curriculum Development in Environmental Education.Specifically, the objectives of this study were to:
1. determine if a selected sample of teachers couldcomprehend the superordinate and major subgoals asstated in the "Goals for Curriculum Development inEnvironmental Education,"
2. determine if a selected sample of teachers perceivethe achievement of the Goals should be an importantcomponent of every student's education,
3. determine if a selected sample of teachers perceivethey possess the knowledge and skills necessary toassist students in achieving the Goals,
4. determine if a selected sample of teachers perceivea need exists for teacher workshops designed toprovide educators with the knowledge and skillsneeded to assist students in achieving the Goals,
5. determine if a selected sample of teachers perceivethere is a need for K-12 curriculum materials designedto aid students in achieving the Goals,
6. determine if a selected sample of teachers perceivethey individually need curriculum materials whichcould be used to assist their students in achievingthe Goals,
7. determine if grade level of instruction or area ofinstruction relates to:
a. a comprehension of the Goals by the teache-,
b. teacher's perceived need for achievement of theGoals by all students,
c. teacher knowledge and skills necessary to assisttheir students in achieving the Goals,
d. teacher's attitudes regarding the need forworkshops designed to provide educators with theknowledge and skills needed to assist studentsin achieving the Goals,
e. teacher's attitudes regarding the need for K-12curriculum materials designed to aid studentsin achieving the Goals,
f. teacher's attitudes regarding their individual
220
211
need for curriculum materials which could beused to assist their students in achieving theGoals.
Instrument Development
A Likert-type instrument was developed to collect informa-tion necessary to accomplish the objectives of this study.Six statements were applied to the general goal proposed byHungerford, Peyton, and Wilke and to each of their four majorsubgoals:
1. I fully comprehend this goal as stated.
2. a believe that the achievement of this goal should bean important component of every student's education.
3. I possess the knowledge and skills necessary to assistmy students in achieving this goal.
4. I believe a need exists for teacher workshops designedto provide educators with the knowledge and skillsneeded to assist students in achieving this goal.
5. I believe there is a. need for K-12 curriculum-materialsdesigned to aid students in achieving this goal.
6. I have a need for curriculum materials which I can useto assist my students in achieving this goal.
After each statement, the teacher was instructed to circlethe response on a five-point Likert scale ranging fromstrongly agree to strongly disagree which best reflected howhe/she felt about that statement. Information was alsorequested regarding the teacher's level and area ofinstruction.
Face and content validity for the test instrument wasassessed by a panel of two environmental educators and twostatisticians, each holding a doctoral degree in theirspecialty field. The instrument was revised in accordancewith recommendations made by the panelists. The finalinstrument was determined to have face and content validityby all panelists.
Cronbachs Alpha Reliability Coefficients were calculated foreach of the problem/statements used in the test instrument.'All of the reliability coefficients obtained fell between .70and .90. Based upon the reliability coefficients obtained,the researchers concluded that the instrument was internallyconsistent and reliable.
221
Data Collection
The instrument was administered by mail to 300 K-12 teachers.Using 'a random numbers table, the teachers were randomlyselected from 3,100 teachers in 24 public and private schooldistricts located in Cooperative Educational Services AgencyNumber 7 (CESA 7) serving eight central Wisconsin counties.A follow-up mailing of questionnaires was made tononrespondents. A total of 129 usable questionnaires werereturned (43 percent).
Data Analysis
Frequency distributions were computed for each of the 30items. A Chi-square statistic was calculated comparing gradelevel and area of instruction vs. responses on the assessmentitems. Mean responses were also calculated for grade leveland area of instruction for each of the 30 (items.
Results
Tables 1-6 present frequency distributions for the sixstatements as they relate to the general goal and the fourmajor subgoals of the "Goals for Curriculum Development inEnvironmental Education."
The analysis of statements 1, 2, 4, 5, and in correspond-ing tables shows that the majority of respcs agree orstrongly agree with the statements. In other words, mostteachers comprehend the goals, believe the achievement of thegoals is important to every student's education, believe aneed exists for goal-related teacher workshops, believe thereis a need for goal-related curriculum materials and believethat they personally have a need for goal-related curriculummaterials. Respondents tended to be neutral to or disagreewith the statement "I possess the skills necessary to assistmy students in achieving this goal" (Table 3). This supportsthe perceived need for goal-related workshops (Table 4).
A Chi-square statistic was calculated (0< = .05) comparinggrade level and area of instruction vs. responses on theassessment items (Champeau, 1979). Analysis revealed nostatistically significant relationship for either independentvariable and their responses. No significant relationshipbetween grade level and subject matter area of the teachersand their attitudes toward and their understanding of thegoals was exhibited.
222
213
Mean responses were calculated for gra level and subjectmatter area (Champeau, 1979). Cross tabulation of meanresponses vs. grade level and area of instruction furtherverifies that there is little apparent relationship betweenthe independent and dependent variable. One exception is the13 science teachers who responded to this instrument. Thisgroup tended to agree or strongly agree that "I have theknowledge and skills necessary to assist my students inachieving the goals."
Table 1
Frequency Distribution of Responses to the Statement "Ifully comprehend this goal as stated."
GeneralGoal
Sub-goal 1
Sub-goal 2
Sub-goal 3
Sub-goal 3
Strongly Agree 42.2% 37.5% 27.0% 27.0% 27.2%
Agree 51.6 58.6 57.9 57.9 62.4
Neutral 3.1 0.8 11.9 11.9 7.2
Disagree 2.3 2.3 4.8 2.4 2.4
StronglyDisagree 0.8 0.8 0.8 0.8 0.8
Table 2
Frequency Distribution of Responses to the Statement "Ibelieve that the achievement of this goal should bean important component of every student's education."
GeneralGoal
Sub-goal 1
Sub-goal 2
Sub-goal 3
Sub-goal 4
Strongly Agree 39.1% 39.1% 25.0% 27.2% 25.8%
Agree 53.9 56.3 61.3 54.4 61.3
Neutral 5.5 .3.9 12.1 16.0 10.5
Disagree 1.6 0.8 1.6 2.4 2.4
StronglyDisagree 0.0 0.0 0.0 0.0 0.0
223
2i4
Table 3
. Frequency Distribution of Responses to the Statement "Ipossess the knowledge and skills necessary to assist
my students in achieving this goal."
General Sub- Sub- Sub- Sub-Goal goal 1 goal 2 goal 3 goal 4
Strongly Agree 2.4% 3.1% 1.6% 2.4% 2.4%
Agree 38.1 33.9 34.1 30.1 30.1
Neutral 37.3 35.4 38.2 42.3 43.1
Disagree 21.4 26.8 25.2 23.6 22.8
StronglyDisagree 0.8 0.8
Table 4
0.8 1.6 1.6
Frequency Distribution of Responses to the Statement "Ibelieve a need exists for teacher workshops designed toprovide educators with the knowledge and skills needed
to assist students in achieving this goal."
General Sub- Sub- Sub- Sub-Goal goal 1 goal 2 goal 3 goal 4
Strongly Agree 28.1% 27.0% 22.6% 24.2% 21.8%
4 Agree 56.3 53.2 54.8 49.2 59.7
Neutral 12.5 18.3 20.2 22.6 17.7
Disagree 2.3 1.6 1.6 4.0 0.8
StronglyDisagree 0.8 0.0 0.8 0.0 0.0
224
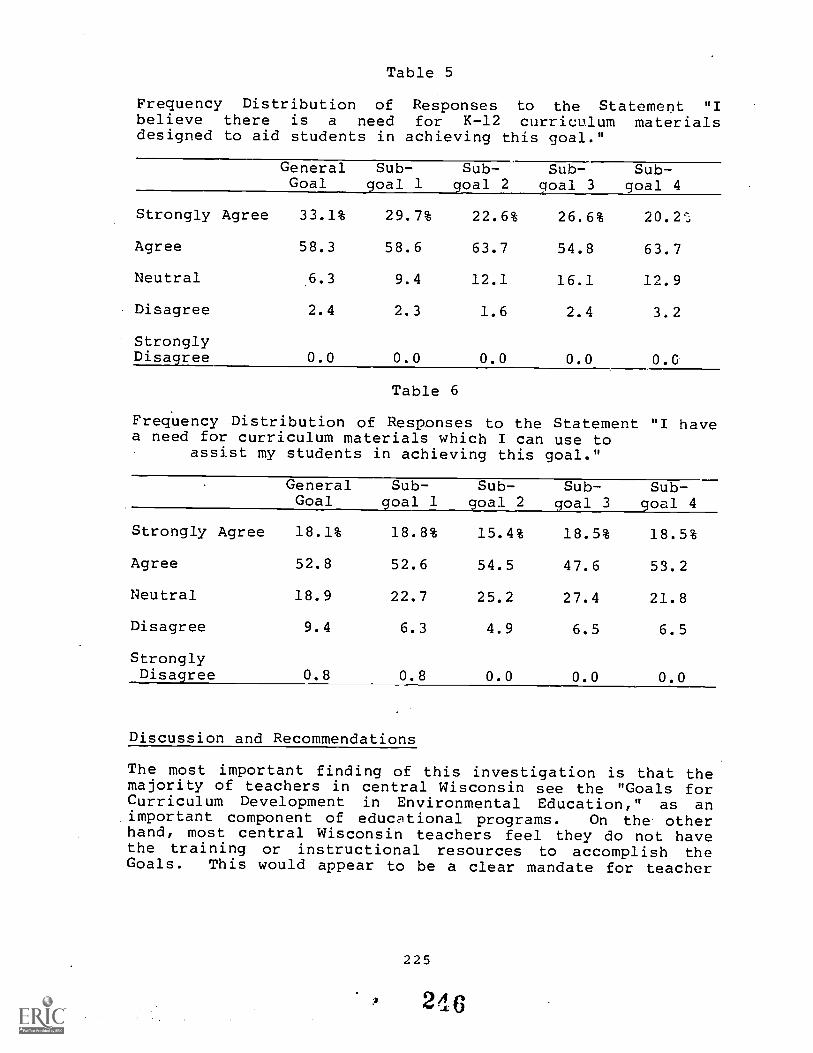
Table 5
Frequency Distribution of Responses to the Statement "Ibelieve there is a need for K-12 curriculum materialsdesigned to aid students in achieving this goal."
General Sub- Sub- Sub- Sub-Goal goal 1 goal 2 goal 3 goal 4
Strongly Agree 33.1% 29.7% 22.6% 26.6% 20.21;
Agree 58.3 58.6 63.7 54.8 63.7
Neutral 6.3 9.4 12.1 16.1 12.9
Disagree 2.4 2.3 1.6 2.4 3.2
StronglyDisagree 0.0 0.0 0.0 0.0 0.0
Table 6
Frequency Distribution of Responses to the Statement "I havea need for curriculum materials which I can use to
assist my students in achieving this goal."
GeneralGoal
Sub-goal 1
Sub-goal 2
Sub-goal 3
Sub-goal 4
Strongly Agree 18.1% 18.8% 15.4% 18.5% 18.5%
Agree 52.8 52.6 54.5 47.6 53.2
Neutral 18.9 22.7 25.2 27.4 21.8
Disagree 9.4 6.3 4.9 6.5 6.5
StronglyDisagree 0.8 0.8 0.0 0.0 0.0
Discussion and Recommendations
The most important finding of this investigation is that themajority of teachers in central Wisconsin see the "Goals forCurriculum Development in Environmental Education," as animportant component of educational programs. On the otherhand, most central Wisconsin teachers feel they do not havethe training or instructional resources to accomplish theGoals. This would appear to be a clear mandate for teacher
225
2 A 6
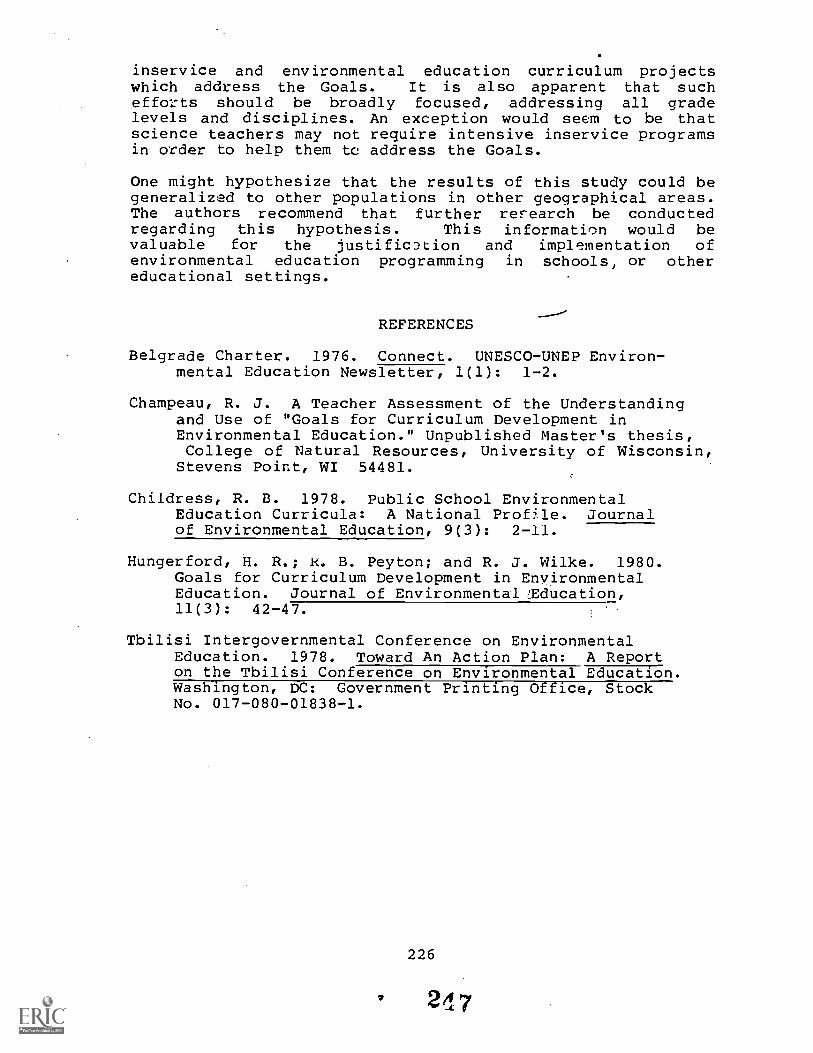
inservice and environmental education curriculum projectswhich address the Goals. It is also apparent that suchefforts should be broadly focused, addressing all gradelevels and disciplines. An exception would seem to be thatscience teachers may not require intensive inservice programsin order to help them tc address the Goals.
One might hypothesize that the results of this study could begeneralized to other populations in other geographical areas.The authors recommend that further research be conductedregarding this hypothesis. This information would bevaluable for the justificDtion and implementation ofenvironmental education programming in schools, or othereducational settings.
REFERENCES
Belgrade Charter. 1976. Connect. UNESCO-UNEP Environ-mental Education Newsletter, 1(1): 1-2.
Champeau, R. J. A Teacher Assessment of the Understandingand Use of "Goals for Curriculum Development inEnvironmental Education." Unpublished Master's thesis,College of Natural Resources, University of Wisconsin,Stevens Point, WI 54481.
Childress, R. B. 1978. Public School EnvironmentalEducation Curricula: A National Profle. Journalof Environmental Education, 9(3): 2-11.
Hungerford, H. R.; R. B. Peyton; and R. J. Wilke. 1980.Goals for Curriculum Development in EnvironmentalEducation. Journal of Environmental !Education,11(3): 42-47.
Tbilisi Intergovernmental Conference on EnvironmentalEducation. 1978. Toward An Action Plan: A Reporton the Tbilisi Conference on Environmental Education.Washington, DC: Government Printing Office, StockNo. 017-080-01838-1.
226
° 2/17
LAND USE
M. Kealy Salomon and Alan M. Schwartz, AN EXPERIMENT INLAND-USE CONTROL: THE ADIRONDACK PARK AGENCY.
c1.77 fcgaii
AN EXPERIMENT IN LAND-USE CONTROL:THE ADIRONDACK PARK AGENCY
M. Kealy Salomonl and Alan M. Schwartzl
Abstract. The Adirondack Park, located in northeastern NewYork State, is the largest park in the lower 48 states; it isbigger than Yellowstone, Yosemite, and the Evergladescombined. Although 40 percent of the land within the Park ispublic and has been pru*ected by the "Forever Wild Clause" ofthe New York State Constitution since the late 1800s, over 60percent of the six million acre park is private land anduntil 1972 had virtually no land-use controls. In 1971 theNew York State Legislature, fearing large -scale developmentsthat might adversely affect the Park, created the AdirondackPark Agency (APA) to create plans for the regulation of bothpublic and private lands. The Private Land-Use andDevelopment Plan was approved by the Legislature in 1973 andgave the APA authority to control the intensity and qualityof development for the approximately three and one-halfmillion acres of private land. Over one-half of this Zandwas "zoned" one unit per 42 acres. Bitter opposition to theAgency was common in the region. Changes in the APA Act andregulations during their first eight years are reviewed.Specific areas include changes in legislation affecting theAct, revisions in permit processes, new nonregulatoryelements in the Agency's work program, and progress in thedevelopment of local land-use programs. The views andactions of the local citizens concerning these issues areconsidered. In addition, issues critical to the futuresuccess of the Agency and this experiment in private Zand-usecontrol are identified.
The Adirondack Park is located in the northeastern section ofNew York State (Figure 1). The Park includes six millionacres of land (most of it unspoiled wilderness) which makesit roughly equal to the size of Vermont. Nevertheless, thepopulation of the area is only 112,000 permanent residentsand'90,000 seasonal residents.
1M. Kealy Salomon, student in The Environmental StudiesProgram, St. Lawrence University, Canton, NY 13617;Alan M. Schwartz, Associate Professor and Director ofEnvironmental Studies, St. Lawrence University, Canton,NY 13617.
229
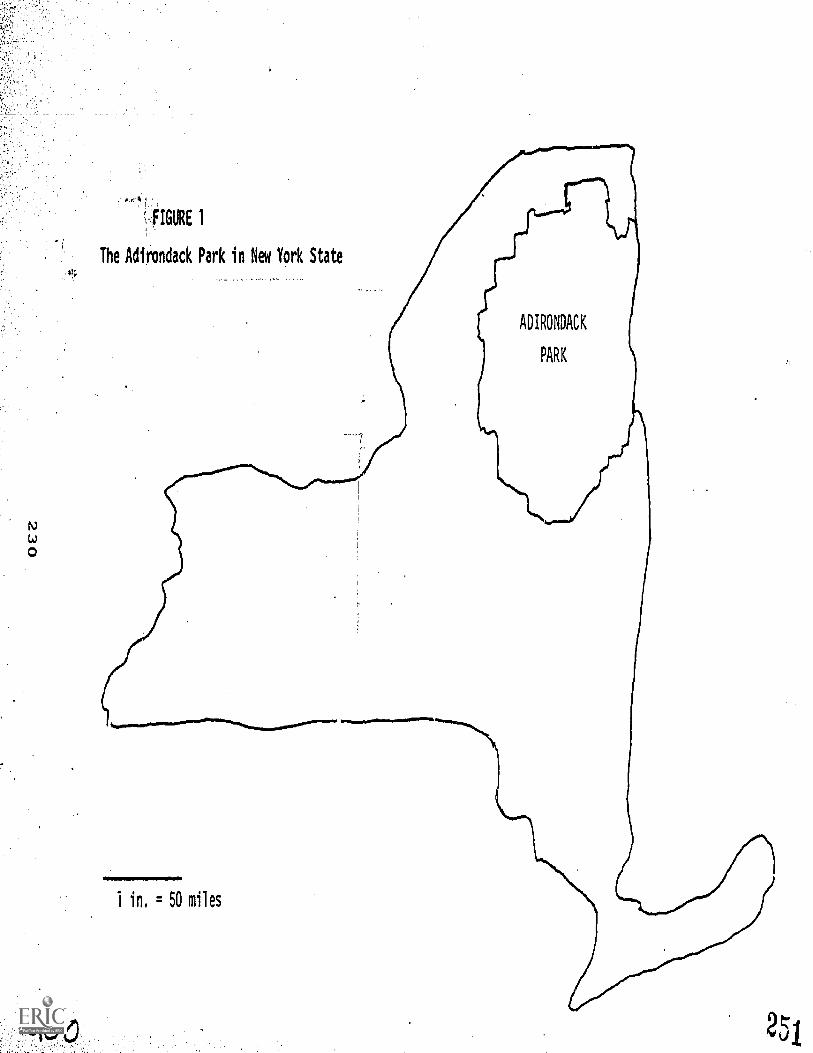
JIGURE 1
The Adirondack Park in New York State
.011011 in. = 50 miles
ADIRONDACK
PARK
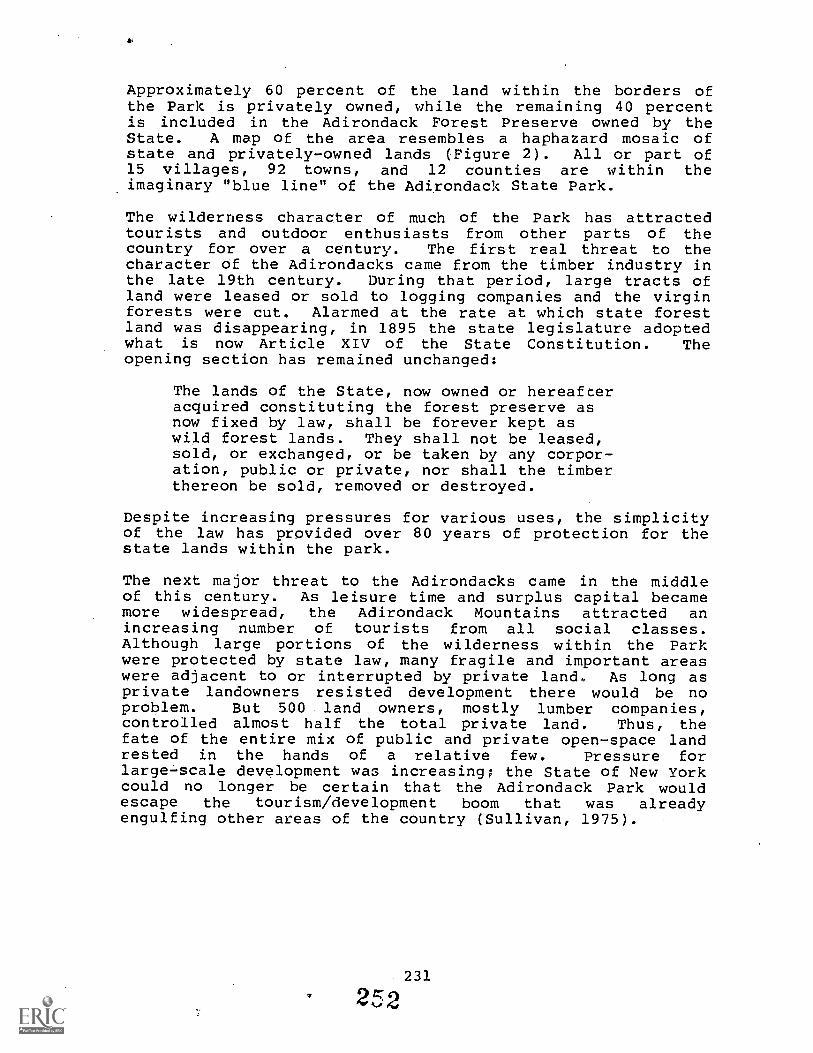
Approximately 60 percent of the land within the borders ofthe Park is privately owned, while the remaining 40 percentis included in the Adirondack Forest Preserve owned by theState. A map of the area resembles a haphazard mosaic ofstate and privately-owned lands (Figure 2). All or part of15 villages, 92 towns, and 12 counties are within theimaginary "blue line" of the Adirondack State Park.
The wilderness character of much of the Park has attractedtourists and outdoor enthusiasts from other parts of thecountry for over a century. The first real threat to thecharacter of the Adirondacks came from the timber industry inthe late 19th century. During that period, large tracts ofland were leased or sold to logging companies and the virginforests were cut. Alarmed at the rate at which state forestland was disappearing, in 1895 the state legislature adoptedwhat is now Article XIV of the State Constitution. Theopening section has remained unchanged:
The lands of the State, now owned or hereafteracquired constituting the forest preserve asnow fixed by law, shall be forever kept aswild forest lands. They shall not be leased,sold, or exchanged, or be taken by any corpor-ation, public or private, nor shall the timberthereon be sold, removed or destroyed.
Despite increasing pressures for various uses, the simplicityof the law has provided over 80 years of protection for thestate lands within the park.
The next major threat to the Adirondacks came in the middleof this century. As leisure time and surplus capital becamemore widespread, the Adirondack Mountains attracted anincreasing number of tourists from all social classes.Although large portions of the wilderness within the Parkwere protected by state law, many fragile and important areaswere adjacent to or interrupted by private land. As long asprivate landowners resisted development there would be noproblem. But 500 land owners, mostly lumber companies,controlled almost half the total private land. Thus, thefate of the entire mix of public and private open-space landrested in the hands of a relative few. Pressure forlarge -scale development was increasing; the State of New Yorkcould no longer be certain that the Adirondack Park wouldescape the tourism/development boom that was alreadyengulfing other areas of the country (Sullivan, 1975).
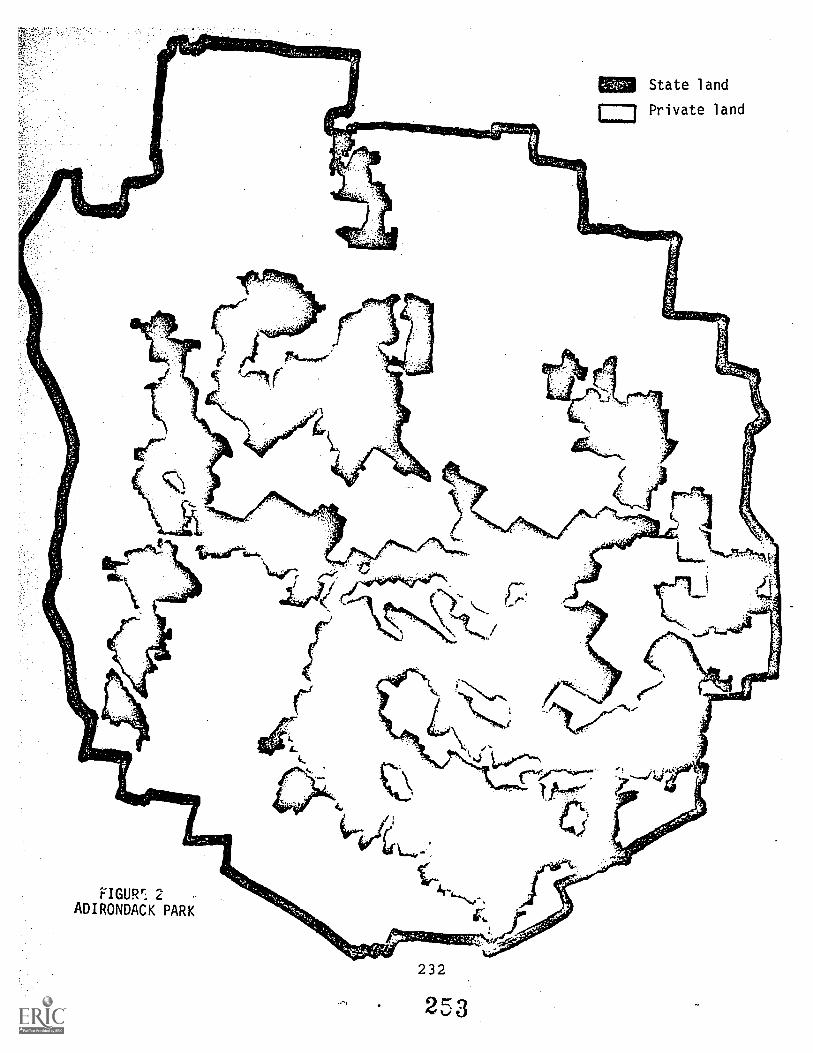
11:11 State land
1 I Private land
FIGUR' 2ADIRONDACK PARK
232
253
In 1968 Governor Nelson Rockefeller created the TemporaryStudy Commission on the Future of the Adirondacks, andcharged it with the responsibility for developing along-range policy for the state lands and for suggestingmeasures-that would ensure that the development of privatelands would be appropriate and consistent with the long-rangegoals (Temporary Study Commission, 1971). The Commissionproduced a report that outlined 181 recommendationspertaining to all aspects of the Park. The first threerecommendations dealt with the creation of an Adirondack ParkAgency which would be responsible for developing andimplementing land-use plans for both the public and privatelands within the Park. The Adirondack Park Agency (APA) Actwas passed by both the Senate and the Assembly in 1971.
The APA is an independent agency within the State of New YorkExecutive Department. It consists of eight private citizens,appointed by the Governor for four-year terms, and threestate officials, namely the Commissioners of the Departmentof Environmental Conservation and the Department of Commerce,and the Secretary of State. Five of the private citizensmust be permanent residents of the Park and three must residepermanently outside the Park. Not more than one may beappointed from any of the 12 Park counties, and not more thanfive may be affiliated with the same political party(Adirondack Park Agency, 1971a).
The APA first produced the State Land Master Plan which wassubmitted to Governor Rockefeller for approval .in 1972.Legislative approval was unnecessary because the plan dealtsolely with management of the state lands. The seven land-useclassifications of state land and the guidelines for theiruse were designed to maintain the Adirondack Park lands in asnatural and unspoiled condition as possible.
The checkerboard separation of state and private lands withinthe Park meant that the stringent controls imposed by the APAfor the state lands were really of little value if thegeneral character of the surrounding private lands weredestroyed by development pressures. After the State LandMaster Plan had been approved, the APA set to work on themuch more difficult task of developing a land-use plan forthe privately-owned lands. The Adirondack Park Land-Use andDevelopment Plan was submitted to the state legislature in1973. There were attempts to defeat the bill, but whenstrong pressure from Governor Rockefeller made passage seemcertain, the representatives for the area asked for a yeardelay to study the plan in depth. Governor Rockefellerbelieved that the delay would result in hurried anduncontrolled development of the type that the plan was meantto halt and he vetoed the delay. A few months later the billwas passed by the Legislature creating the most stringentland-use controls governing private land anywhere in the
233
;
United States. The fervent desire for passage of this billby a politically powerful governor was the decisive elementin the enactment of the Private Land Plan.
The plan called for six classifications of land use: hamlet,industrial, moderate intensity, low intensity, rural use, andresource management. Hamlet areas are. most often thepopulation centers of the Park and they may or may not beincorporated villages. The hamlet areas are those localeswhere the APA plan calls for the majority of future growthand intensive development of tourists facilities so that therest of the Park will remain relatively unspoiled. For thesereasons there are no restrictions on land use, development,or intensity guidelines. Industrial areas are large areasoutside the hamlets. They are sites for existing orpotential industrial development, mainly mining operations.The overall objectives of the plan are to encourage continuedoperation of existing industry and to provide suitablelocations for potential new industries. Industrial useareas, like hamlets, have no overall intensity guidelines,but conflicting land uses are discouraged.
Moderate and low-intensity areas are those where growth anddevelopment cannot be of the same magnitude as hamlet areas.When planning development in these areas, biological,physical, and public considerations play an important role.Land-use in moderate intensity areas allows for 500 units/sq.mile (1.3 acres/unit), and that in low-intensity areas isstill more restrictive, allowing 200 units/sq. mile (3.2acres/unit). Moderate and low-intensity areas are usuallyfound in the vicinity of hamlets and have relatively easyaccess to roads and the shoreline.
Rural-use areas are those areas where natural resource andpublic considerations necessitate more restrictive land-useand development plans. The objective in these areas is toencourage land use that is compatible with naturalrestrictions and consistent with the preservation of openspaces. Primary uses of the land are residential andagriculture, and the maximum density may not exceed 75units/square mile (8.5 acres/unit).
The most restrictive class of private land within theAdirondack Park is the resource management class, where thereis a great need to protect and preserve the open-spacecharacteristics due to pressing natural and publicconsiderations. The purpose of the resource managementclassification is to protect fragile ecosystems and preventlarge-scale development in an area where it might detractfrom the aesthetic qualities of an unspoiled wilderness.Land-use in resource management areas is primarily limited toagriculture and forestry operations with a small amount ofresidential development permitted. Overall intensity
234
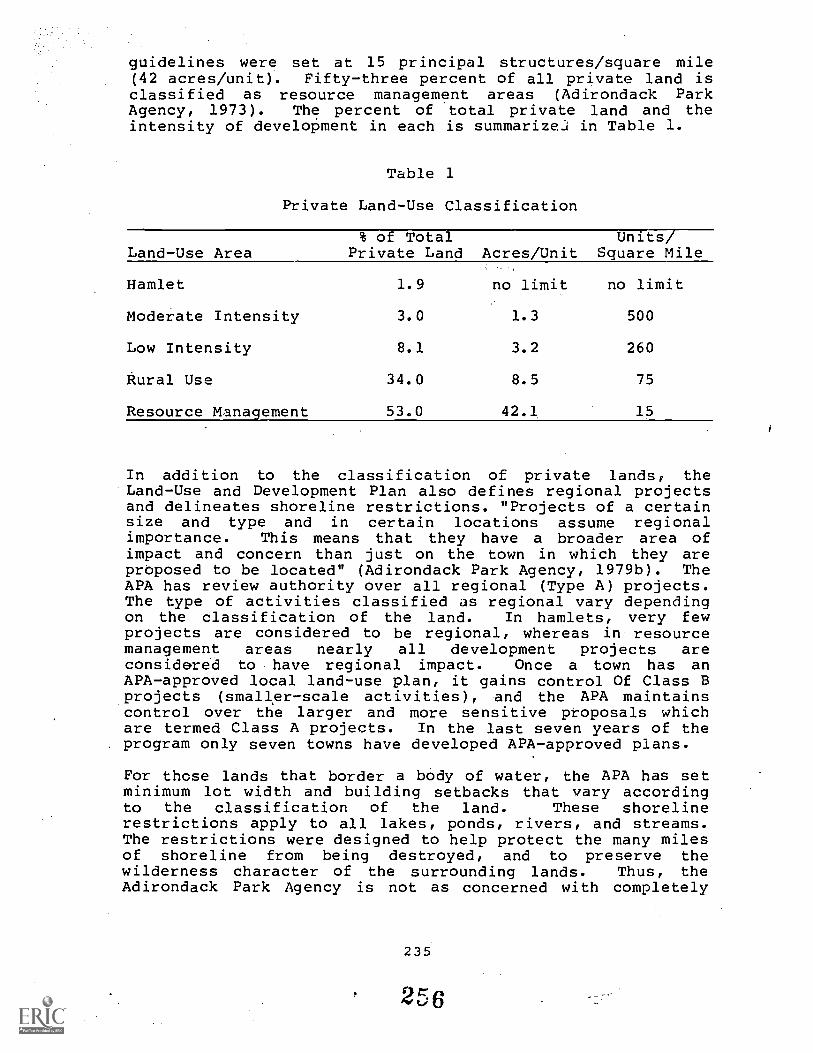
guidelines were set at 15 principal structures/square mile(42 acres/unit). Fifty-three percent of all private land isclassified as resource management areas (Adirondack ParkAgency, 1973). The percent of total private land and theintensity of development in each is summarize.. in Table 1.
Table 1
Private Land-Use Classification
Land-Use Area% of Total
Private Land
Hamlet 1.9
Moderate Intensity 3.0
Low Intensity 8.1
Rural Use 34.0
Resource Management 53.0
Units/Acres/Unit Square Mile
no limit no limit
1.3 500
3.2 260
8.5 75
42.1 15
In addition to the classification of private lands, theLand-Use and Development Plan also defines regional projectsand delineates shoreline restrictions. "Projects of a certainsize and type and in certain locations assume regionalimportance. This means that they have a broader area ofimpact and concern than just on the town in which they areproposed to be located" (Adirondack Park Agency, 1979b). TheAPA has review authority over all regional (Type A) projects.The type of activities classified as regional vary dependingon the classification of the land. In hamlets, very fewprojects are considered to be regional, whereas in resourcemanagement areas nearly all development projects areconsidered to have regional impact. Once a town has anAPA-approved local land-use plan, it gains control Of Class Bprojects (smaller-scale activities), and the APA maintainscontrol over the larger and more sensitive proposals whichare termed Class A projects. In the last seven years of the
. program only seven towns have developed APA-approved plans.
For those lands that border a body of water, the APA has setminimum lot width and building setbacks that vary accordingto the classification of the land. These shorelinerestrictions apply to all lakes, ponds, rivers, and streams.The restrictions were designed to help protect the many milesof shoreline from being destroyed, and to preserve thewilderness character of the surrounding lands. Thus, theAdirondack Park Agency is not as concerned with completely
235
256
halting growth in the Adiron dacks as it is with directingfuture growth into areas with natural conditions capable ofabsorbing the impacts.
Opposition to the APA has been very vocal from the outset.The year-round residents of the Adirondack Park were againstthe idea of state intervention, and many groups were formedin an effort to voice opposition. The vast majority of localand county governments within the Park have gone on record inopposition to the land-use planning authority of the APA. Anactive citizen's grop called the Adirondack Citizen's Rights
League was formed soon after the completion of The PrivateLand-Use and Development Plan to rally local opposition andpush for repeal of the Act. It was never very clear if theopposition's major concern was the intensity of the controlsor the infringement of a state agency into what had beenlocal concerns, but the fervor of the opponents was never indoubt. For example, public hearings on the private landbecame shouting natches and a few isolated incidents ofviolence occurred. On one occasion, an intruder was arrestedattempting to torch the Agency's headquarters, and onanother, employees found a large pile of manure on the
Agency's
doorstep with a sign, "We've taken yours longenough, have some of ours."
The effect of the local citizen opposition was counteractedby strong support for Adirondack preservation from all majorurban areas of the state. Local opposition probably played arelatively small role in the changes in Agency rules andregulations, the Agency's staff and their way of relating tolocal citizens, but these have changed over time. Anybureauracy has difficulty in implementing new, untriedprograms, and the problems surrounding the APA and theadministration of its new, complex, land-use control programresulted in "horror stories" during its formative years.These include: unreasonable delays in issuing permits,preventing a rural family from living above its .newly-builtstore, and alleged arrogance by the young staff membersresponsible for project reviews. Although there was nogroundswell of local support for the Agency, there is now ademonstrable acceptance of and/or acquiescence to both theAct and the Agency. Specific areas in which this can benoted are: the changes in the thrust of legislation proposedby Adirondack legislators to alter the Act or Agency,streamlining and increased efficiency of the permit process,and the additional work programs that include areas outsidethe regulatory interests of the Agency. Perhaps the mostimportant indicator of the success or failure of the Agencyis its ability to entice local governments to work with itand to develop local land-use plans.
Since casting their vote against the creation of the APA in1971, a group of local legislators have been involved in a
236
257
continuing battle either to abolish or substantially weakenthe Agency. When one examines the bills submitted by theselegislators, some revealing trends emerge. In 1974, lessthan one year after the Private Land-Use Bill was signed bythe Governor, eight pieces of legislation concerning theAgency were introduced in the New York State Legislature.The only bill to become law involved a minor change in theprocedure by which changes in the land-use map would be made.All other bills either did not get out of committee or didnot pass both houses of the Legislature. Most of theseproposed bills made such substantial changes that the PrivateLand-Use Plan, in effect, would have been eliminated, and thepowers of the Agency eviscerated. One bill provided for theelimination of all of the development density regulationswhich are the very heart of the Land-Use and DevelopmentPlan.
The attempts to abolish the Agency or to reduce substan-tially its land-use control powers have continued throughevery legislative session. The support of the StateLegislature, however, has been unwavering, and thoughlegislation to abolish the Agency is still introduced yearlyby the same few Adirondack legislators (perhaps as a tokengesture for some members of their constituency), many morelegislative bills introduced by these Adirondack legislatorsare aimed at more subtle diminution of the Agency's powers.In each legislative session local legislators have tried toshift the balance of membership to include more localresidents. In 1974 and 1975, legislation was submitted toadd two more full-time residents and require the chair of theAgency to be a full-time resident. In 1976, a bill torequire that local v::;-)intees be chosen from a list providedto the Governor by ;lected local officials, passed bothhouses of the Legislacure, but was vetoed by the Governor.Another bill that same year required more local residentmembers, all of whom would be elected by local people ratherthan appointed. Bills in 1977 and 1978 also tried to placemore elected local officials on the Agency. By 1979, however,the suggested changes were more modest. Proposed legislationto increase total Agency membership would have resulted in acorresponding increase in the number of members from withinthe Park. A bill to limit the number of terms on the Agencywas also introduced to reduce the influence of the strongenvironmental appointees originally on the commission who nowhave over six years experience and additional clout in Agencydecision making. Thus, over time, local legislators havesupplemented their basic thrust of eliminating nonParkresident Agency appointees, with more modest proposals toincrease local representation on the Agency.
The drive for increased local representation will not endquickly. In 1979, Governor Hugh Carey recommended to theLegislature the appointment of a millionaire oil company
237
2,58
executive to serve as one of the Park resident Agencymembers. Although he had a legal address within the Park,this individual resided for most of the year in Manhattan.The individual's appointment to the Agency was not approvedby the Senate because of alleged financial wrongdoings. Thesuggestion, however, that this individual could represent theviews of Park residents infuriated residents and legislatorsfrom the area. While no legislative changes in Agencymembership have succeeded, proposals to increase localrepresentation no doubt will continue to be made.
Other trends in legislation point out even more dramaticallythe tacit acceptance of the Agency. In 1974, legislation wasintroduced to abolish the intensity guidelines of the PrivateLand-Use Plan; in 1979 a bill proposed by the samelegislators would have allowed two contiguous landowners topool their development densities. Another bill submitted in1979 would have allowed developers who had avoidedenvironmentally sensitive areas a 20 percent increase intheir allowed building density. Thus, new legislationreflects the desire for more subtle changes in the Act orAgency, making state control more palatable for localresidents.
The most recent legislative events that suggest new attemptsat cooperation between supporters of the Agency and Parkresidents concerns the way the Agency makes changes in itsintensity guidelines. This legislation is being sponsored bylocal Adirondack legislators who have consistently opposedthe Agency, and by legislators who are known as "friends ofthe Agency." This is the first time since the creation ofthe Agency that a' bill initiated by local residents has beensubmitted by such a diverse group of legislators with theendorsement of the Agency.
A second area where the Agency has changed significantly isin its permit process. In the early days of the Agency therewere great delays in issuing permits. This infuriated localresidents attempting construction projects. In some cases,the permit review process was so lengthy that residents'plans could no longer be accomplished within the same shortAdirondack construction season. Laws and regulations wereenacted in 1979 to require the Agency to notify an applicantwithin 15 working days as to whether his application wascomplete or whether additional information was required.Within 90 days of the notice of a completed application, theAPA must approve (with or without conditions) or disapprove apermit application. The median time for a permit decisionfor a single-family dwelling was reduced in 1979 to 19 days.The maximum time was 52 days. The mean time for a two-lotsubdivision in 1979 was 17 days, while the major projectsranged from 1 to 170 days with a median time of 38 days(Adirondack Park Agency, 1979a).
238
2E9
A third area that illustrates the changes made uy the Agencyto assure its continued existence is the expansion of itswork program outside the regulatory area. The Agency has nowdeveloped an expanded educational program on basic Parkinformation. Although the Agency has always vowed that "theultimate future of the Park rests in the hands of theresidents and visitors," and that "it is an essential elementof the Agency's program and responsibility to keep the publicadequately informed as to the beauty and tranquility of theregion," only recently has it had the luxury of allottingmore staff time to this. endeavor. Although in the past astaff person has theoretically been charged with "Parkeducation," the major job of "Agency education" has been anall-consuming first priority. The continual controversygenerated by misunderstandings, incorrect rumors, and anoverly complex law, kept Agency personnel from pursuing anygeneral education programs. Recently, however, significantnew efforts have been made in education programs concerningthe natural beauty of the Park, its fragile ecosystems, andits flora and fauna.
The Agency considers all these changes proof of itsflexibility and will note with pride its overwhelming permitapproval record; in 1979 of 381 applications submitted, only6 were de.lied. These figures belie the fact that almost allpermits have conditions attached which -include: buildingsetback, location of septic facilities, areas which may notbe developed, etc. Many permits have more specificconditions. The role of a conditional approval on thequality of development is difficult to assess because thepresent permit system does not require notification once theproject has been completed. In addition, the Agency is unahleto determine how many project ideas were never submitL.edsimply because of the existence of the Agency. According toRobert Flacke, the present Commissioner of the New York StateDepartment of Environmental Conservation, the APA hasdiscouraged "the fast buck developer" from considering theAdirondacks as a suitable target for easy profits (Flacke,1978). The Agency also has no way of knowing how manyproposals that are approved are scrapped because the sponsorfinds the conditions attached to the permit unacceptable.The only sure way the Agency has of knowing that it hasapplied restrictions that are deemed to be excessive by theproject sponsor is when the conditions result in litigation.This is relatively rare, however, because few Adirondackresidents can afford the time and expense, or have theexpertise, to pursue litigation.
Unfortunately, it is not only difficult to determine thenegative impacts of the conditional permits on development,but it is also difficult to determine the effc,A of theconditions on safeguarding environmental quality.
239
2 6' 0
Theoretically, the conditions result in setback fromsLoreline, proper placement of sewage facilities, etc., thatwill improve and protect environmental quality. Even if oneassumes the conditions are rigorous and defined well enoughto prevent environmental degradation, protection ofenvironmental quality will occur only if the conditions areenforced. In reality, however, the Agency until veryrecently has had only one enforcement officer to coversix million acres of Park land. In the words of one Agencyofficial, "We just haven't had the time to follow up on ourpermits. Our enforcement officer ha,: all he can do just toinvestigate the violations that are called in to the office."
The most critical test -f the success of the Agency is itsability to get communities to develop local plans usingAgency guidelines. After the Land-Use and Development Planwas adopted by the New York State Legislature in 1973, theAdirondack Park Agency had control ov^r most planningactivities and land-use decisions in the i ,2k. The originalintention, however, was for the state to form a partnershipwith the local governments. The APA statute provided forState assistance to local planning boards under the auspicesof the Agency. The basic purposes of this provision were toincrease the capability of local governments in the area ofland-use control; to establish a two-tiered organization ofland management and review of regional projects; and toprovide a basis for amendment and refinement of the land-usemap (Adirondack Park Arency, 1978).
The. APA is willing to relinquish jurisdiction of some localplanning decisions, but not until the municipalities haveadopted a land-use plan that is consistent with the goals ofthe APA. In an effort to encourage local communities to workon land-use programs, the APA offers several incentives.When a town is granted APA approval, it benefits fromrefinement and redistribution of overall intensity guidelinesand local review of Class B regional projects. There arealso State funds available from the APA that have beenspecifically designated for use in the planning process bylocal governments. The Agency also offers its staff as aresource for technical information and advice.
The controversy and resentment that accompanied the creationof the Adirondack Park Agency was, for many years, the forcebehind the lack of local planning efforts. Adoption of anAgency-approved program was considered an endorsement of theAPA and most municipalities made a concerted effort to avoidplanning with the Agency. Through the years the need forlocal planning has become, for many towns, a more importantissue than the existence of the Adirondack Park Agency. Thenumber of planning boards has more than doubled since 1971,and many towns have developed master plans and/or subdivisionregulations, sanitary codes, and zoning ordinances (Davis and
240
2e1
Liroff, 1978). The simple presence of regulations enforcedby the state has had a tremendous impact on uncontrolledgrowth. Developers purposely limit the size of projects inhamlet areas so they will avoid classification as a regionalproject and the resultant review by the Adirondack ParkAgency. The APA continues to be a subject at many localhearings, but the discussion usually centers on technicalquestions of Agency approval, monitoring, and the two-tieredpartnership, rather than on the existence of the Agency.According to the Agency legal counsel, Robert Glennon, a newattitude has emerged: "Now that you're here, what can you dofor us?" The conflict is far from resolved, but its effecton the local planning program has been greatly reduced.
Despite Agency encouragement and aid to local planning boardsonly seven towns within the Park have APA-approved clans thathave also been adopted by their respective town boards.Sixty-eight of the remaining 100 municipalities have planningprograms in various stages of completion. Not all of themunicipalities presently working on land-use plans seek APAapproval as the final goal. Some boards believe that theyare writing a plan for their specific community and there isno benefit from APA approval. In some areas of the Park,opposition to the APA is still substantial, and any supportof a conforming land-use plan is politically risky.
Allocation of local planning assistance funds has been basedon community need and interest. Those communities which havereceived assistance to date are those with the largestpermanent Park population, and the greatest number ofregional projects. The correlations are not a reflection ofconscious Agency policy, but the concern of local governmentsabout development activity. The Agency does not expect toget 100 percent of the towns involved in land-use programs.Many of the towns do not have a great deal of developmentactivity, and thus, the time and expense of preparing a planmay not seem beneficial.
The Adirondack Park Agency recognizes the need for continuingState commitment and aid to local planning programs. Thereare seminars for communities that presently have, or willsoon have exclusive jurisdiction over Class B regionalprojects. These sessions give community officials anopportunity to apply regulations to actual Agency permitapplications. There is also a special brochure outlininglocal planning authority;. procedures, and technicalconsiderations. These progra are aimed at making betteruse of natural resource infcvination and the planning effortsthat have been prepared by both the municipalities and theAPA (Adirondack Park Agency, 1979a). They also represent acommitment by the State to a continuing state/localpartnership in administering land-use programs in theAdirondack Park.
241
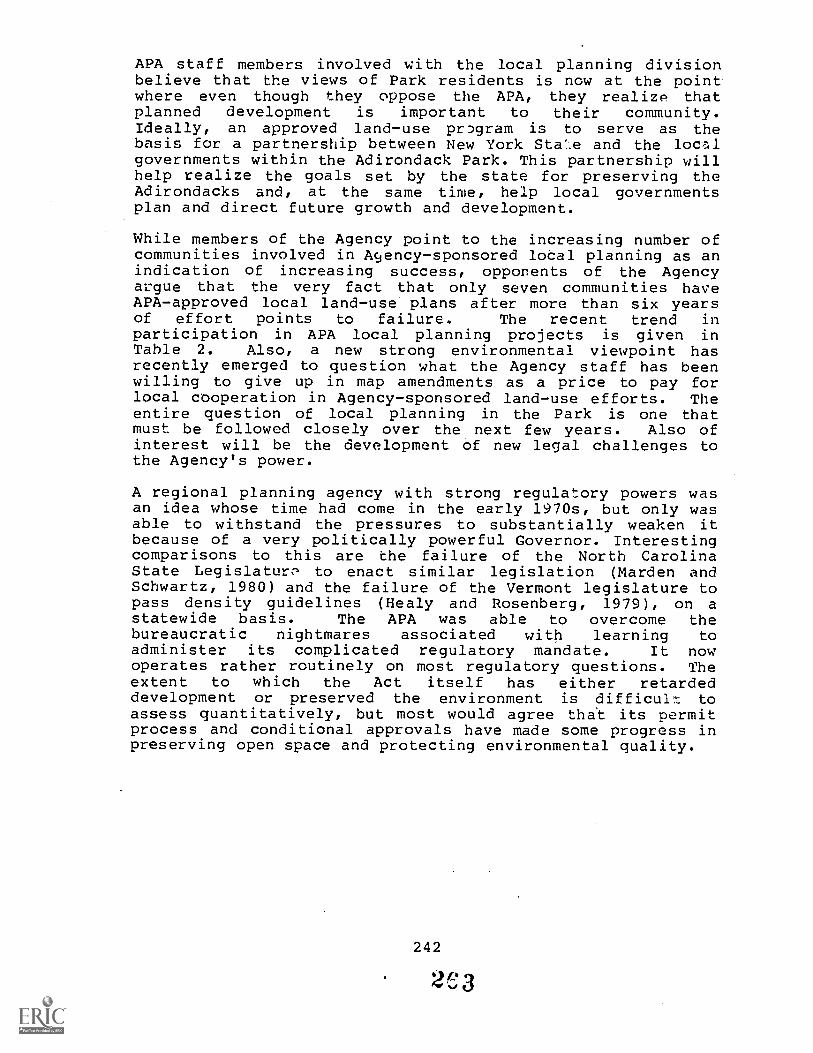
APA staff members involved with the local planning divisionbelieve that the views of Park residents is now at the pointwhere even though they oppose the APA, they realize thatplanned development is important to their community.Ideally, an approved land-use program is to serve as thebasis for a partnership between New York Stae and the localgovernments within the Adirondack Park. This partnership willhelp realize the goals set by the state for preserving theAdirondacks and, at the same time, help local governmentsplan and direct future growth and development.
While members of the Agency point to the increasing number ofcommunities involved in Agency-sponsored local planning as anindication of increasing success, opponents of the Agencyargue that the very fact that only seven communities haveAPA-approved local land-use plans after more than six yearsof effort points to failure. The recent trend inparticipation in APA local planning projects is given inTable 2. Also, a new strong environmental viewpoint hasrecently emerged to question what the Agency staff has beenwilling to give up in map amendments as a price to pay forlocal cooperation in Agency-sponsored land-use efforts. Theentire question of local planning in the Park is one thatmust be followed closely over the next few years. Also ofinterest will be the development of new legal challenges tothe Agency's power.
A regional planning agency with strong regulatory powers wasan idea whose time had come in the early 1970s, but only wasable to withstand the pressures to substantially weaken itbecause of a very politically powerful Governor. Interestingcomparisons to this are the failure of the North CarolinaState Legislature to enact similar legislation (Marden andSchwartz, 1980) and the failure of the Vermont legislature topass density guidelines (Healy and Rosenberg, 1979), on astatewide basis. The APA was able to overcome thebureaucratic nightmares associated with learning toadminister its complicated regulatory mandate. It nowoperates rather routinely on most regulatory questions. Theextent to which the Act itself has either retardeddevelopment or preserved the environment is difficul' toassess quantitatively, but most would agree that its permitprocess and conditional approvals have made some progress inpreserving open space and protecting environmental quality.
242
2;;;13
Table 2
Status of Local Governments Assisted by Departmentof State or APA Planning Program
December31, 1978
March1980
A. No specific program, contactongoing through project reviewactivities, county meetings, etc.(19 towns, 7 villages have plansor controls in effect).
32 24
B. Initial contact made for specificplanning programs.
10 8
C. Contract, work started ("New"programs).
6 16
D. Preliminary work (analysis)completed. Plan being prepared.
18 15
Regulations and map amendmentsbeing considered.
E. Planning elements completed. 26 25
F. Local program approved by APA
1. APA approved, adopted locally (5) (7)2. APA approved, component
adopted locally (2) (2)3. APA approved, program yet to
be adopted locally (2) (2)
G. Local program adopted by localgovernment, program not submittedto or acted upon by APA.
4 5
H. Local program component adoptedby local government, program notyet submitted to or acted uponby APA
2 3
TOTAL 107 107
243
2C4
31,
Interesting areas for future study include the ability of theAgency to increase its planning partnership wi_h localgovernments and the degree the Agency is willing to moderateits strong environmental concerns to succeed in this effort.
REFERENCES
Adirondack Park Agency. 1973. Adirondack Park Land-Useand Development Plan.
Adirondack Park Agency, 1979a. 1979 Annual Report of TheAdirondack Park Agency.
Adirondack Park Agency. 1979b. A Citizen's Guide toAdirondack Park Agency Land-Use Regulations, January.
Adirondack Park Agency. 1979c. Evaluation of AdirondackPark Agency Local Planning Assistance Program, DraftReport.
Davis, Gorden G. and Richard A. Liroff. 1978. Conflictin The North Country. Unpublished manuscript.
Flacke, Robert F. 1978. "A Report on Implementation ofThe Adirondack Park Agency Act." Presented to TheEnvironmental Planning Lobby, October 15.
Healy, Robert G. and John S. Rosenberg. 1979. Land-Useand The States. Baltimore, MD: John HopkinsUniversity Press.
Marden, Parker G. and Alan M. Schwartz, et al. 1980."Comparative Regional. Issues: Land-Use andEnvironmental Planning in The Adirondacks andAppalachians." Proceedings of The Third AnnualAppalachian Studies Conference.
Sullivan, Fred. 1975. "Adirondack Zoning: A NationalExperiment in Lend-Use Control Faces LocalChallenge." Empire State Report, 1: 467-6, December.
Temporary Study Commission on the Adirondacks. 1971. TheFuture of mhe Adirondack Park. Blue Mountain Lake,NY: The Adirondack Museum.
244
265
ENVIRONMENTAL HEALTH
"icki Kalmar Weisfeld, OPPORTUNITIES FOR IMPROVING THEENVIRONMENT FOR HEALTH.
d.q.claq(02e6
OPPORTUNITIES FOR IMPROVING THE ENVIRONMENTFOR HEALTH
Vicki Kalmar Weisfeldl
Abstract. SeleL.ted opportunities are explored for makingthe human environment safer, more disease preventing, andmore health promoting. The concept of risk factor -J andissues in disease prevention strategies for high-risk groupsare discussed. Environmental educators' potential role increating a more healthful environment is emphasized.
The recent groundswell of interest in the United States inhealth promotion and disease prevention has been heightenedby a number of factors: the identification of some riskfactors for such major diseases as cancer, heart disease andstroke, which opens up the possibility of prevention; thepublic realization that medical care cannot cure many ofthese diseases, which emphasizes the critical need forprevention; and the, rising cost of health care, whichunderscores that need. Interests in disease prevention andenvironmental issues share a fundamental origin--publicconcern for improving the quality of life. These twomovements continue to overlap, primarily because so manydisease risk factors are environmental. More than ever,
1Vicki Weisfeld is a Professional Associate at theInstitute of Medicine, National Academy of Sciences,Washington, DC. Much of the factual content of this paper isbased on her work for the Institute's Division of HealthPromotion and Disease Prevention. Opinions expressed arethose of the author.
2Certain specific preventive measures save many times theircosts--immunizations, fluoridation, family planning, and afew others. But, at least in the short run, comprehensivedisease prevention programs are likely to increase thenation's health care budget, by increasing direct costs forservices aimed at prevention, while continuing to meetresponsibilities to care for those who need medical treat-ment. However, successful preventive efforts might wellreduce the indirect costs of illness--the loss of valuablegoods and services that are not produced because the personwho would have produced them was ill, injured, disabled, ordied prematurely. In the very long run, successfulprevention will increase the number of elderly individuals,who do make greater demands on national resources, includinghealth care resources, and for whom planning in the socialservices and health sectors of society should begin now.
247
2C7
environmental educators have a potentially great andchallenging role in health promotion and disease preventionefforts. This paper will try to identify some of these areasof opportunity.
Despite recent advances in scientific understanding, theprecise environmental contributors to certain diseases areyet to be identified, and the means to determine the balanceof preventive strategies that will work best in particularcircumstances still must be developed. Some of theseproblems will be resolved through the results of biomedicalresearch and some by ongoing discussions of appropriateenvironmental health policy. Environmental educators couldplay a pivotal role in such discussions.
Risks to Good Health
The current increased interest in disease prevention comes ata time when, by most standards, the U.S. population ishealthier than it has ever been. An American born in 1900could expect to live to age 47; one born in 1978 could expecta lifespan of over 73 years (U.S. National Center for HealthStatistics, 1979). This increase in life expectancy at birthhas been achieved largely by the conquest of most of theinfectious diseases that used to kill infants and youngchildren.
Today's leading causes of death are heart disease, cancer,stroke, injuries, and v1/21ence. These disorders havemultiple, interacting causes; yet, they are not inevitable.Their prevention is a different and sometimes more complexmatter than preventing the acute infectious diseases.
Each person faces a somewhat different risk of illness orinjury. At birth, everyone has a certain likelihood ofdeveloping particular health problems because of heredity,the socioeconomic background of parents, and the healthstatus, lifestyle, and care of the mother during pregnancy.Through life, the probability of experiencing health problemschanges as circumstances change, becoming greater or lesseras people are exposed to varying environmental influences,adopt certain behavior patterns, and receive specificpreventive health services.
The probability of acquiring disease or suffering an injuryis influenced by "risk factors." For most serious diseasesthere are many risk factors. Certain factors--such ascigarette smoking or severe emotional stress--increase thelikelihood of acquiring several different diseases. Manyrisk factors work together synergistically; an example is
243
268
the greatly increased probability of death from lung cancerfaced by asbestos workers who 'smoke cigarettes (Selikoff,Hammond, and Churg, 1968).
A better public understanding of the concepts of health risksis sorely needed--how risks interact, how to respondprudently to uncertainties, how to assess risks for anindividual.
Environmental educators who incorporate riskreduction concepts in their public education efforts aretaking an important positive step.
Kinds of Risk and Their AmeliorationBiological Risk. In general, disease results from aninteraction between an individual's
unique genetic endowmentand the total environment in which he or she functions.Heredity plays a part in the
susceptibility to certain mentaldisorders, infectious diseases, and common chronic diseases,in addition to those disorders normally considered inherited.The relative contributions of genetic (intrinsic) andenvironmental (extrinsic) factors vary widely from conditionto condition. The effects of past disease also may increasebiological risk to subsequent disorders.
Environmental Risk
Factors in the physical environment that increase the risk ofill health include contamination of air, water, and food;workplace hazards; radiation exposures; excessive noise;dangerous consumer products; unsafe highway design; or urbancongestion. During the past hundred years, human activitieshave changed the physical
environment rapidly, much beyondthe capacity of the human organism to respond withevolutionary adaptation. While much of this change isordinarily considered desirable--and called
"progress"--manynew health hazards have been created thereby. Indeed, thevery rapidity of change, as it affects
basic human activitiesand relationships, itself may be a hazard (Levi, 1979).The socioeconomic environment includes such factors affectinghealth as income level, housing, and employment status. Thepoor face more and different health risks than do people inthe economic middle class, because of: fewer and poorerquality medical services, including preventive services;fewer options for coping with problems of all kinds; a morehazardous physical environment; greater stress; lesseducation; and inadequate income to spend on good nutrition,safe housing, and other basic needs. A critical component ofthe socioeconomic environment that affects health is familystructure. Abrupt changes in
sociodynamics--such as thedeath of a spouse--create
severe emotional str.2ss and hAve
249
2e9
been associated with physical illness and even prematuredeath (Rabkin and Struening, 1976; Buell and Eliot, 1979).
Behavioral Risk. A continuing source of confusion about thecontribution of the environment to the development of illhealth has been the broad definition of environment usedwhich encompasses all factors extrinsic to the individual,including "behavioral" factors. Thus, the commonly quotedestimates that up to 90 percent of human cancers and 80percent of heart disease deaths are due to environmentalfactors include the contributions of diet, cigarette smoking,and alcohol use to disease rates.
Many of:today's most serious health problems are linked with"excessive" behavior--too much smoking, drinking, and eating,driving too fast, or striving to achieve too much. Yet, eventhese behavioral responses have environmental substrates.The view that ::Lich factors are wholly under individualcontrol is too simpliscl. The health consequences ofpersonal behavior choices often are not apparent. Even whenthe implications for health are clear, options are not alwaysavailable, or healthful choices may be difficult tomake--consider the trouble people have quitting smoking, orthe peer pressures on adolescents to indulge in riskybehavior. Personal behavior choices are made in the contextof a social environment that glamourizes excessive behaviorthrough advertising, the mass entertainment media, and other,more subtle means. Society supports industries producingunhealthful products, has enacted or enforced laws againstcertain behavior unevenly, has provided ambiguous messagesabout the kinds of behavior that are acceptable and has notameliorated some of the socioeconomic and other stressfulconditions that foster unhealthy decisions.
Still, the emphasis on personal responsibility for health isin many ways a positive step toward helping people recognizetheir own role in maintaining good health. A societalcommitment to take supportive environmental actions andprovide appropriate preventive personal health services,particularly for those individuals and population groups mostin need, is also essential.
Personal Health Services. Inadequate personal health careservices, or inadequate access to them, can put people atgreater risk of ill health.3 Leading examples ofpreventive personal health services are immunizations(primary prevention) and screening for disease (secondaryprevention).
250
270
Prevention Strategies and the Environment
Environmental approaches to health proLotion and diseaseprevention have a proven record of success and greatpotential for future benefits, partly because they are"passive" and r:o not depend on individual responses.
A Safer Environment
"Accidents"--a misnomer, according to injury controlexperts--are often believed to be isolated random events thatoccur by bad luck or fate. In fact, many injuries can beavoided through changes in environmental conditions or agents(primary preveni-ion), or the injuries sustained can bereduced by environmental modifications (secondaryprevention).
In the United States in 1978, there were an estimated 107,930deaths from unintentional injuries (about half of whichinvolved motor vehicles) and 48,580 deaths from homicide andsuicide (U.S. National Center for Health Statistics, 1979).Injuries are the leading cause of death for Ame' cans betweenages 1 and 42; among those 15 to 24, almost 75 percent of'deaths are from injuries. In addition, over 74 millionnonfatal injuries occur annually (U.S. National Center forHealth Statistics, 1978). Injuries cost the nation over $62billion in 1977, not including costs for police anddepartment protection (National Safety Council, 1978)
Most of the effective measures for preventing injuriesinvolve changes in the manmade environment that auto-matically protect everyone--even people who make mistakes orfail to take adequate precauLions--such as insulated tools,childproof medicine containers, or nonlead base paints (Bakerand Dietz, 1979).
3Primary prevention includes activities that promote healthor are undertaken prior to the development of disease orinjury, such as immunizations or automobile speed limits.Secondary prevention includes the detection of disease inearly (asymptomatic) stages and intervention to arrest itsprogress--for example, screening for incipient hyper-tension or for precancerous changes in cells of thecervical epithelium. Tertiary prevention involvesintervention after the development of a clinically manifestdisease in order to reverse, arrest, or delay its progres-sion--for example, administration of phenothiazines toprevent the recurrence of schizophrenic episodes (TaskForce on Theory, Practice, and Application of Preventionin Personal Health Services, 1976).
251
271
Motor Vehicle Injuries (53,610 deaths in 1978; 1.9 milliondisabling injuries in 1977). One approach to preventingvehicle collisions is to reduce the number of miles traveledby automobile through encouraging use of safer modes oftransportation--air, rail, or bus. Lower speeds reduce boththe number and severity of crashes; the national 55 mpn speedlimit has been credited with saving an estimated 5,000 liveseach year.
Impact-absorbing automobile bodies and padded passengercompartments reduce injuries when a collision occurs. Smallcars are involved in more frequent collisions and--whencrashes occur--the risk of injury and death is greater(Robertson and Baker, 1975). Use of combined lap andshoulder belts reduces the likelihood of serious injury ordeath by about 60 percent. The best protection for infantsand small children is to ride in the back seat, restrained inan infant carrier, child car seat or safety harness, althoughadult seat belts are preferable to no restraint (InsuranceInstitute for Highway Safety, 1976). The failure ofeducational efforts to persuade people to use restraints foreither themselves (less than 20 percent of U.S. adultsconsistently use seat belts) or their children requiresdevelopment of passive protection devices.
Highway design features can reduce the likelihood of crashesor injuries by decreasing demands on drivers and removingroadside hazards. The interstate highway system has a deathrate of 1.4 per 100 million vehicle miles, compared with anoverall average of 3.4 per 100 million miles, by eliminatingcrash-precipitating features. Many preventable deaths andinjuries caused when vehicles leave the roadway andoverturn, or strike trees, embankments, or nonyieldingstructures, such as bridge abutments.
Fir,.larms (31,000 deaths in 1976; estimate of injuries, from18,000 to over 100,000. annually). Reducing the availabilityof firearms, particularly handguns, would reduce the numberand severity of personal injuries (Mahler and Fielding, 1977;Browning, 1976; Newton and Zimring, 1969); either assaults orsuicide attempts are less likely to be fatal if attemptedwithout firearms, and firearm accidents also would decrease.Nonlethal bullets, such as those developed for police use in.:rowd control, are suitable for most private handgun use, butio not put handgun owners and their families at risk of deathor serious injury.
Falls (15,000 deaths and 14 million injuries annually).Environmental measures to prevent injuries from falls canfocus either on preventing the fall itself--by attention tosafer walking surfaces and footgear, better illumination,
252
2 2
handrails, and window guards--or on reducing the potentialfor injury--by reducing the distance people fall (safety netsfor construction workers) or by modifying the surfaces theyfall against (heavily padded carpeting, rounded edges andcorners on furniture).
Violence (27,500 suicides and 21,080 homicides in 1978).Violent acts are more prevalent in the United States thanother developed countries; why this is true is more complexand subtle than the explanations commonly offered.Eliminating alcohol abuse would significantly reduce theamount of violence; eliminating guns would reduce itsseverity. Emphasis on violence as an injury control problemmakes it a matter of concern to health professionals andhealth educators, as well as law enforcement officials.
Suicide. In the United States, self-destruction isaccomplished principally through firearms, drugs, and motorvehicle :exhaust gases. Preventing suicide depends onchanging the environmental factors that cause severe personaldistress, providing social supports for individuals andfamilies, and making the means of accomplishing self-injuryless accessible. It is not true that a person consideringsuicide will find the means to do so, regardless ofpreventive measures. In England, when the carbon monoxidecontent of gas piped to homes was reduced, both accidentaldeaths and suicides dropped markedly. What had been the mostcommon means of committing suicide was almosteliminated--without a compensating increase in suicide byalternate means (Hassall and Trethowan, 1972).
A Disease-Preventing Environment
Some environmental actions to prevent disease have beenextremely successful. They are the most promising approachto preventing occupation-related disorders and perhaps someforms of nonoL:cupational cancer. However, numerouscontentious public policy questions surround these preventionefforts. One deserving special consideration results fromthe increasing ability to identify people at genetic risk ofacquiring disease when exposed to a harmful environmentalagent. These subjects are discussed in this section in thecontext of specific examples.
Fluoridation--A Successful Environmental Strategy_ forPreventing Disease
Evaluations of two decades of U.S. experience with controlledwater supply fluoridation conclude that few public healthmeasures have been as unequivocally effective against
253
273
widespread disease (Walsh, 1977). Fluoridation has proved tobe a safe, inexpensive and highly beneficial preventivemeasure. Nevertheless, half of the U.S. population does notdrink water containing optimal amounts of fluoride. Becausefluoridation depends on community interest and support, andmust compete for limited public funds, effective communityeducation regarding this prevention strategy is required(Nightingale, Cureton, Kalmar, and Trudeau, 1978).
Reducing Workplace Health Hazards
Occupation-related disorders are almost wholly preventable.The populations involved are (or could be) relatively welldefined. The hazards to which they are exposed are (or couldbe) enumerated and measured. The knowledge gained bystudying workers' health experience has potential usefulnessbeyond its immediate application in the workplace. Theoccupational environment is a natural laboratory forassessing the potential effects of hazards on the generalpopulation, which is exposed to many of the same agents,although in much smaller doses.
Occupational exposures to toxic chemicals and physicalhazards (noise, radiation, sunlight, vibration) can producelong-term damage to the brain and other critical organs, orproduce cancers, birth defects, or genetic changestransmissible to future generations. Exposures can alsoincrease the frequency of stillbirths, spontaneous abortions,reduced fertilityand sterility. Occupational stress hasmeasurable deleterious effects on health (Caplan, Cobb,French, et al., 1975; Zaleznik, Ondrack, and Silver, 1970;and U.S. Department of Health, Education, and Welfare, 1973).
Each year 100,000 Americans die from occupational illnesses,and 390,000 new cases are recognized. However, the trueextent of occupational disease is undoubtedly much largerbecause the link between job and disease is oftenunrecognized or unreported.
Occupational hazards can be controlled through modificationsof work environments or modifications directed at workers andtheir behavior, or some combination of these. Modification ofwork environments--the manufacturing plant, processes, andmaterials used--is probably the best long-term approach andfor known hazards is essential. These preventive strategiesrely heavily on the efforts of employers, but also need thesupport of employees, unions, environmental educators andhealth professionals, bolstered by government regulatoryactions.
254
274
As with preventing injuries, passive protection is morelikely to be effective. Personal protective equipment isoften uncomfortable or otherwise inconvenient for workers touse. Differential pay for jobs deemed more hazardous, orallowing overtime work in hazardous jobs, requires employees
choose between long-term risk to health and immediate1,,ancial benefits. Likewise, if hazardous industries areconcentrated in one geographic area or located in otherwiseeconomically depressed communities, workers attracted byrelatively good pay and steady employment have little choiceabout refusing risky jobs.
The Occupational Safety and Health Act of 1970 mandates thatworkers be protected from workplace hazards, butimplementation of the law has been slow and has yet to affectoccupational health in the United States substantially (U.S.General Accounting Office, 1977).
Technologies to monitor exposures and control known orputr,tive hazards continue to be inadequate to the needs ofmodern industries, which use more than 30,000 chemicals andmultiple sources of physical energy--microwaves, nuclearisotopes, lasers, and ultrasound. Unless exposures aremonitored, the extent of any hazard posed by these agents,either alone or in combination, will be nearly impossible toassess. Those -professionals concerned -about health hazardsin the environment must keep the demands for informationabout exposures strong.
Identification of People at High Risk
A rapidly growing ,rea of scientific research, which holdsgreat promise for the prevention of some environment-relateddisorders, examines the way environmental exposures producedifferent effects in different individuals, due to -iariationsin genetic susceptibility. As an example of the potentialapplication of such knowledge to disease prevention, peoplewith a genetically determined deficiency thealpha-l-antitrypsin enzyme are especially susceptible topulmonary emphysema (Bodmer and Cavalli-Sforza, 1976; Vogeland Motulsky, 19.79). These people, for whom heightened healthrisk can be demonstrated, may be responsive to targetedanti-smoking education efforts and should be informed aboutavoiding other respiratory hazards.
There are many practical problems associated with the abilityto identify people at risk. People might rather not knowtheir risk status (Kolata, 1980a), or employers might usethis information to deny work opportunities to particularlysusceptible people, rather than eliminating a hazard. (Inrecent years, some industries using lead have denied at least
255
certai kinds of jobs to nonsterilized women of childbearingage.) Individuals probably have a rather wide range ofresponses to an environmental hazard. Simplistic diseaseprevention policies, such as job prohibitions, therefore notonly raise right-to-work issues, but also may bescientifically unsound.
Other related problems which apply to the field of toxicologyin general are raised by the capacity to detect minutequant: of substances (in parts per trillion in somecases F,ria the necessity of using animals to test possiblehazar ,ubstances. The former capacity can create almostinsurma able control problems if an absolute prohibition ofa substance is required by law. In animal tests,interspecies differences may produce misleading results.Some industries, fearing increased regulation, have fosteredpublic skepticism about animal testing by funding expensive,well-organized advertising campaigns cynically supporting"free choice." These self-serving campaigns undermine thepublic's general ability to evaluate risk and take prudentactions. Targeted disease prevention efforts, based ongenetic differences, may not pri-::3t such strong reactions.
A Health-Promoting Environment
Environmental educators and health professionals concernedabout the environmental context of disease and injury shouldalso consider the environment's potential to promote andprotect health.
The socioeconomic environment is a major factor in healthpromotion and protection, and a social action component is anee:essary part of any comprehensive health promotion program(Institute of Aedicine, 1978). This imperative arises fromthe social history of the United States, which has producednumerous disadvantaged population groups. In the past, thesegroups have been chiefly poor and minority peoples. Today,elderly citizens constitIte an additional, large number ofneglected (and poor) people; the number of illegal aliens hasincreased; and children who receive inadequate care are afrustratingly large portion of those with preventabledevelopmental disabilities. Disadvantaged groups have longfound traditiorLd, curative care services inaccessiblebecause of financial, language, and other barriers. Medicaland dental services that emphasize prevention are even moredifficult for them to obtain.
Today most microbial disease agents, as well as manyphysiochemical agents, are nearly ubiquitous. Yet, allpeople exposed or with a recognized risk factor (includinggenetic susceptibility) may not develop overt disease_(Kolata, 1980b). An explanation for this variability thtt
256
276
has gained credence in recent years is that certain aspectsof the social environment affect the etiology of disease(CaLsel, 1975).
In numerous epidemiologic studies that have employed varyingdesigns and that have used different populations, healthoutcome measures, and stress indicators, there have beenshown to be a wide variety of physical and mental diF-order-.;whose onset seems to be precipitated by envil:onmentF.1stressors (such as moving or unemployment). The degree of acommunity's social disintegration, a family's lack of socialsupports, and the number of stressful events in the life ofan individual have been found to affect illness-related workand school absences (Cassel and Troler, 1961; Downes, 1945),the occurrence of complications of pregnancy (Nuckolls,Cassel, and Caplan, 1972), and life expectancy (Berkman andSyme, 1979). The latter finding, in which people who weremost isolated had a 2.3 (for men) or 2.8 (fcr women) timesgreater chance of dying during the nine-year study periodthan those with more extensive social contacts, wasindependent of self-reported physical health status,socioeconomic status or health practices (ciga:ette smoking,consumption of alcoholic beverages, obesity or others).
Although a long-range goal must be to improve the generalsocial environment and reduce undesirable psychosocialstressors, a more feasible immediate goal is to providesocial supports and improve access to them. Educators andhealth professionals can become more aware of availablesources of social sup,,,ort and ,_,,.e them to benefit theirclients or patients. They also can work for public policiesthat strengthen or encourage the development of naturalsupport systems, particularly the family. Natural supportsystems may be effective in mediating stress and also can bea major influence on the use of health services and ingaining compliance with medical regimens (Hamburg andKillilea, 1979).
Conclusion
This paper has only begun to explore the challenge ofpreventing disease and injury and promoting health throughenvironmental actions. The timing for a comprehensivenational prcgram in this area is probably inauspicious,inasmuch as the costs of environmental control are now morereadily demonstrated and more vociferously opposed than thepotential benefits ,are supported. These benefits can be morefirmly established through biomedical and. toxicologicalresearch on environmental, hazards, epidemiologic research onexposed human population, cost-benefit analyses with regardto existing hazards, technology assessment of potential new
257
277
hazards, and public policy research on alternate means toachieve environmental health goals. The effort to gatherinformation about environmental hazards, forecast theireffects or calculate the preventable portion of the nation'sdisease and injury rates--in fact, any effort to study thefuture--is justified only by the ameliorative actions thatsuch investigations prompt.
As this paper has demonstrated, many activities that wouldimprove the environment for health are relatively modest.Broad changes in society at large are another matter. Yet,the lack of these changes cannot be ignored as a cause of illhealth. Nor need this causal relationship be indirect. Thepresent unstable world political situation can indeed beexpected to affect the incidence of stress-related disorders,but much more importantly, it directly affects theprobability of survival of humans and their environment. Forthat reason, preventing nuclear war, possibly "the mostimportant public health problem in all of history" (Hamburg,1979), is also an environmental health problem of thegreatest significance.
REFERENCES
Baker, S. P. and P. E. Dietz. 1979. Injury Prevention,in Healthy People: The Surgeon General's Report onHealth Promotion and Disease Prevention, BackgroundPapers, pp. 53-80. DHEW Publication No. (PHS)79-55071A. Washington, DC: U.S. GovernmentPrinting Office,
Berkman, L. F. and S. L. Syme. 1979. Social Networks,Host Resistance, and Mortality: A Nine-Year FollowupStudy of Alameda County Residents. American Journalof Epidemiology, 109: 186-204.
Bodmer, W. F. and L. L. Cavalli-Sforza. 1976. Genetics,Evolution, and Man. San Francisco: W. H. Freemanand Co.
Browning, C. H. 1976. Handguns and Homicide: A PublicHealth Problem, Journal of the American MedicalAssociation, 236: 2198-2200.
Buell, J. D. and R. S. Eliot. 1979. The Role of EmotionalStress in the Development of Heart Disease. Journalof the American Medical Association, 242: 365-368.
.r
258
278
Caplan, R. D.; S. Cobb; J.R.P. French, Jr., et al. 1975.Job Demands and Worker Health: Main Effects andOccupational Differences. DREW Publication No.(NIOSH) 75-160. Washington, DC: U.S. GovernmentPrinting Office.
Cassel, J. 1975. The Contribution of the SocialEnvironment to Host Resistance. Wade Hampton FrostLecture at the 103rd Annual Meeting of the AmericanPublic Health Association, Chicago, IL, November 18.
Cassel, J. and H. A. Tyroler. 1961. EpidemiologicalStudies of Culture Change: I. Health Status andRecency of Industrialization. Archives ofEnvironmental Health, 3: 25-33.
Downes, J. 1945. Sickness as an Index of the Need forHealth Supervision of the School Child. AmericanJournal of Public Health, 35: 593-601.
Hamburg, B. A. and M. Killilea. 1979. Relation of SocialSupport, Stress, Illness, and Use of Health Services,in Healthy People: The Surgeon General's Report onHealth Promotion and Disease Prevention, BackgroundPapers, pp. 253-276. DHEW Publication No. (PHS)79-55071A. Washington, DC: U.S. Government PrintingOffice.
Hamburg, D. A. 1979. Disease Prevention: The Challengeof the Future. Sixth Annual Matthew B. Rosenhauslecture. American Journal of Public Health, 69:1026-1033.
Hassell, C. and W. H. Trethowan. 1972. Suicide inBirmingham. British Medical Journal, 1: 717.
Institute of Medicine. 1978. Conference on HealthPromotion and Disease Prevention, Volume I, Themes.Washington, DC: National Academy of Sciences.
Insurance Institute for Highway Safety. 1976. ChildInjury Conditions Pnalyzed. The Highway LossReduction Status Report, 11(8): 1-3, May 19.
Kolata, G. B. 1980a. Testing for Cancer Risk. Science,207: 967-969.
Kolata, G. B. 1980b. Genes and Cancer: The Story ofWilms Tumor. Science, 207? 970-971.
259
1 .279
Levi, L. 1979. Psychosocial Factors in PreventiveMedicine, in Healthy People: The Surgeon General'sReport on Health Promotion and Disease Prevention,Background Papers, pp. 207-252. DHEW PublicationNo. (PHS) 79-55071A. Washington, DC.: U.S.Government Printing Office.
Mahler, A. and J. Fielding. 1977. Firearms and GunContrdl: A Public Health Concern. New EnglandJournal of Medicine, 297: 556-558.
National Safety Council. 1978. Accident Facts, 1978 ed.Chicago: National Safety Council.
Newton, G. D., Jr. and F. E. Zimring. 1969. Firearmsand Violence in American Life. A staff reportsubmitted to the National Commission on the Causesand Prevention of Violence. Washington, DC: U.S.Government Printing Office.
Nightingale, E.; M. Cureton; V. Kalmar; and M. Trudeau.1978. Perspectives on Health Promotion and DiseasePrevention in the United States. An Institute ofMedicine Staff Paper. Washington, DC: NationalAcademy of Sciences.
Nuckolls, C. B.; J. Cassel; and B. H. Caplan. 1972.Psychosocial Assets, Life Crises and the Prognosisof Pregnancy. American Journal of Epidemiology,95: 431-441.
Rabkin, J. G. and E. L. Struening. 1976. Life Events,Stress, and Illness. Science, 194: 1013-1020.
Robertson, L. S. and S. P. Baker. 1975. Motor VehicleSizes in 1,440 Fatal Crashes. Insurance Institutefor Highway Safety, Watergate Six Hundred,Washington, DC 20037.
Selikoff, I. J.; E. C. Hammond; and J. Churg. 1968.Asbestos Exposure, Smoking and Neoplasia. Journalof the American Medical Association, 204: 106-112.
Task Force on Theory, Practice, and Application ofPrevention in Personal Health Services, Report, inPreventive Medicine USA, pp. 257-357. New York:Prodist, 1976.
U.S. Department of Health, Education and Welfare. 1973.Report of a Special Task Force to the Secretary.Work in America. W. E. Upjohn Institute forEmployment Research. Cambridge, MA: MIT Press.
260
28n
U.S. General Accounting Office. 1977. Delays in SettingWorkplace Standards for Cancer-Causing and OtherDangerous Substances. Report No. HRD-77-71, May 10.
U.S. National Center for Health Statistics. 1978, Health:United States 1978. DHEW Publication No. (PHS)'8-1232. Washington, DC: U.S. Government PrintingOffice.
U.S. National Center for Health Statistics. 1979.Annual summary for the United States 1978: Births,deaths, marriages, and divorces (provisional).DHEW Publication No. (PHS) 79-1120. Monthly VitalStatistics Report, 27, August 13.
U.S. National Fire Data Center, Department of Commerce.1978. Fire in the United States. Washington, DC:U.S. Government Printing Office.
Vogel, F. and A. G. Motulsky. 1979. Human Genetics:Problems and Approaches. New York: Springer-Verlag.
Walsh, D. C. 1977. Fluoridation: Slow Diffusion of aProved Preventive Measure. New England Journal ofMedicine, 296: 1118-1120.
Zaleznik, A.; J. Ondrack; and A. Silver. 1970. SocialClass, Occupation, and Mental Illness, in MentalHealth and Work Organizations, A. McLean, ed.Chicago: Rand McNally.
ATTITUDES, VALUES, JUDGMENTS, AND AWARENESS
Lei Lane Burrus-Bammel, MEASURING ATTITUDES TOWARDENVIRONMENTAL ISSUES: THE SEMANTIC DIFFERENTIAL TECHNIQUE.THE CASE OF HUNTING.
Anton. E, Lawson, MAKING VALUE JUDGMENTS: A QUESTION OFCOGNITIVE DEVELOPMENT?
Lei-Lane Burrus-Bammel, William E. Kidd, and Gene Bammel,EXPECTED CONSEQUENCES, ENJOYABILITY, AND OTHER EVALUATIONSCALES.
Samuel J. Alaimo and Rodney L.-Doran, A LONGITUDINAL STUDY OFFACTORS INFLUENCING VALUE PREFERENCE IN ENVIRONMENTALPROBLEMS.
Elaine L. Davis, Rodney L. Doran, and S. David Farr, ANANALYSIS OF THE ENVIRONMENTAL AWARENESS OF YCC CAMPERS-SUMMER 1979.
.26,3 1c2624
2 82
MEASURING ATTITUDES TOWARD ENVIRONMENTAL ISSUES:THE SEMANTIC DIFFERENTIAL TECHNIQUE.
THE CASE OF HUNTING
Lei Lane Burrus-Bammell
Abstract. Data generated from 4,0 hunters, 47 nonhunters,an,' 38 anti-hunters were analyzed by an Euclidean "D"formula, chi-square *est, and a sign test of probability.Results indicated an overall significant difference (.05)between groups in response toward a possible object of a huntand the activity of hunting. Both a "Semantic GeographyModel" and profile patterns illustrated this attitudedifference.
Statement of Objectives
The major objectives of the investigation were twofold:first, to determine whether or not the semantic differential(S.D.) would be a useful technique for wildlife and otherenvironmental attitude studies, and second, to determinewhether or not hunters, nonhunters, and anti-hinters wolldvary in response toward a possible _object of a hunt(white-tailed deer, Odocoileus virginianus) and the activityof hunting.
Introduction
The hunter has been stereotyped as callous, illiterate, bloodthirsty, and sexually inadequate, while the antihunter hasbeen viewed as neosentimental, illogical, naive, andbiologically ignorant (Shaw, 1975:6). Research data indicatethat one's view of hunting is related to gender, thatchildhood and adult hunting behaviors are correlated, andthat there is some debate over whether place of residenceduring childhood relates to adult hunting participation(Sofranko and Nolan, 1972; Hendee and Potter, 1975; Kellert,1976). These studies found that certain factors do or do notcorrelate with one's position on hunting, but they do notinform the reader as to the specific values, beliefs, orattitudes held by various groups.
'Division of Forestry, 325 Percival Hall, West VirginiaUniversity, Morgantown, WV 26506.
265
3
Hunting attitude studies have been rather limited in scope,often restricted to current user groups reflecting upon gameregulations (Eisele, 1973), effects of hunter density(Kennedy, 1974), accessibility (Potter, et al., 1973), orreasons for hunting (More, 1973). Fewer investigations haveconsidered attitudes towards animals to determine how theare perceived and treated (Kellert, 1975). The majority ofresearch has centered on identifying and describing variousgroups such as Texas hunters (Berger, 1974), Nevada hunters(Garrett, 1970), Michigan shooting preserve users (Greene,1970), Maryland forest hunters (Kennedy, 1974), and Mainesportsmen (Lobdell, 1967). Hendee and Potter (1971:387)commented that "even with the best methodology; the potentialcontributions of .purely descriptive hunter studies arelimited and leave more important questions unansy.,..red."
Hunting proponents are concerned with the activity'slonge ity. This concern might be due to reports that listthe pr-Tortion of hunters among all outdoor recreationists asdecreaLing (Hendee and Potter, 1971) and the antihuntingsentiment in the general population as increasing (Applegate,1973, 1975).
Methods
Wildlife and other environmental studies have been primarilylimited to agree/disagree or Likert-type question: (stronglyagree, agree, undecided, disagree, strongly disagree)(Edwards, 1957:149-152). The first type has a narrowresponse range that limits the sensitivity of the technique.There is serious doubt that the distance between the possibleLikert responses (foils) represents equal intervals. Thisproblem is intensified when values are assigned forquantitative purposes (i.e., strongly agree = 1, agree = 2,
strongly disagree = 5). The previously mentioned problems areavoided with the S.D.; it is a quick, efficient means ofgetting quantifiable responses from large sample, itrepresents a standardized technique, it can be easilyreplicated, and it facilitates the responses of subjects whomay not be too articulate in describing their reactions(Mindak, 1961).
There are three stages to constructing the S.D. technique: 1)determine the concept or words to be evaluated; 2) select thepolar adjectives (e.g., good-bad, strong-weak, active-passive); and 3) establish the desired number of undefinedscale positions. Polar adjective pairs can be selected fromOsgood's Factor Analyzed List, which contains 76 pairs(Osgood, et al., 1957:53-61).
266
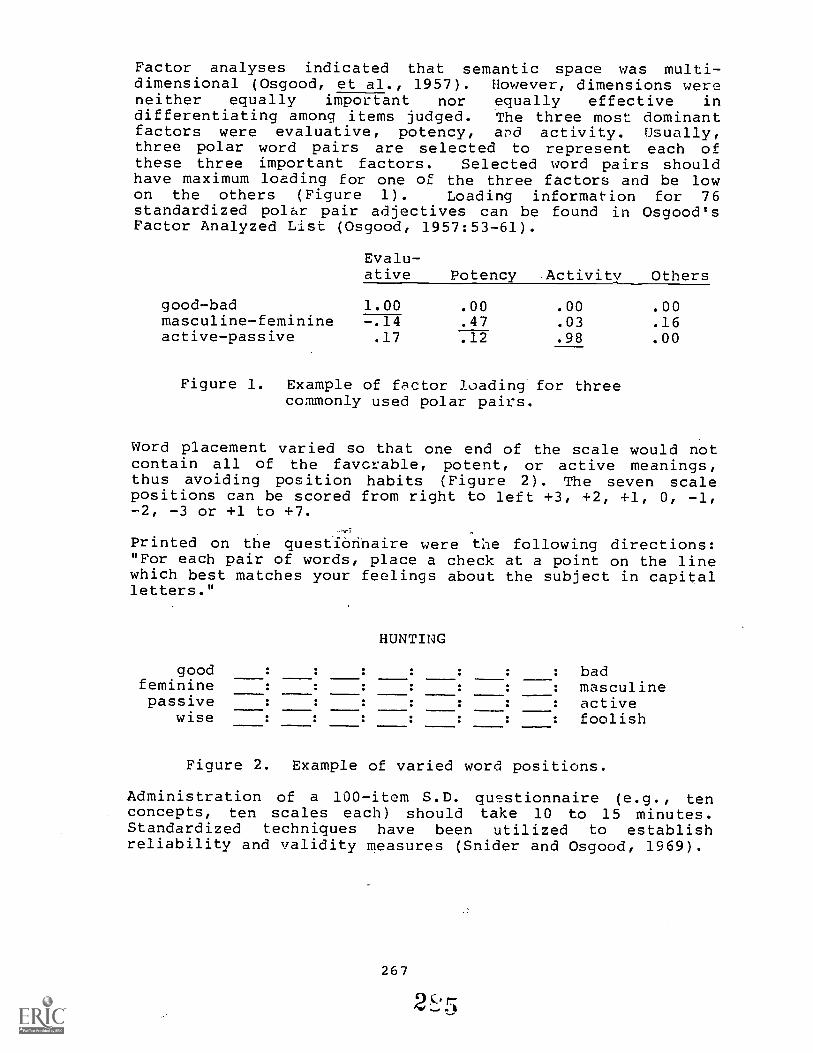
Factor analyses indicated that semantic space was multi-dimensional (Osgood, et al., 1957). However, dimensions wereneither equally important nor equally effective indifferentiating among items judged. The three most dominantfactors were evaluative, potency, and activity. Usually,three polar word pairs are selected to represent each ofthese three important factors. Selected word pairs shouldhave maximum loading for one of the three factors and be lowon the others (Figure 1). Loading information for 76standardized polar pair adjectives can be found in Osgood'sFactor Analyzed List (Osgood, 1957:53-61).
Evalu-ative Potency Activity Others
good-bad 1.00 .00 .00 .00masculine-feminine -.14 .47 .03 .16active-passive .17 .12 .98 .00
Figure 1. Example of factor loading for threecommonly used polar pairs.
Word placement varied so that one end of the scale would notcontain all of the favcrable, potent, or active meanings,thus avoiding position habits (Figure 2). The seven scalepositions can be scored from right to left +3, +2, +1, 0, -1,-2, -3 or +1 to +7.
Printed on the questionnaire were tie following directions:"For each pair of words, place a check at a point on the linewhich best matches your feelings about the subject in capitalletters."
goodfemininepassive
wise
HUNTING
: bad: masculine: active: foolish
Figure 2. Example of varied word positions.
Administration of a 100-item S.D. questionnaire (e.g., tenconcepts, ten scales each) should take 10 to 15 minutes.Standardized techniques have been utilized to establishreliability and validity measures (Snider and Osgood, 1969).
267
C.
Results
Questionnaire responses from 134 West Virginia University-tudents were separated into three classifications: hunters(n = 49), nonhunters (n = 47), and antihunting (n = 38). Themost common method of data manipulation is profile analysis.Profiles are formed by plotting group mean responses for eachpolar word pair (Figures 3 and 4). The probability that allresponse means of one group would consistently fall to oneside of all response means of another group (no crossoverpatterns) is P = .001 (Isaac and Michael, 1971:105). Thiswas the case when hunters were compared to either nonhuntersor antihunters on the concept "hunting" (Figure 3).Chi-square frequency comparisons were made among the groupsin order to determine whether or not the groups varied on thetotal "concept," all word pairs (Table 1), and which polarword pairs, if any, were significant indicators of attitudedifferences (Tables 2 and 3). The chi-square test showedthat each group significantly (.01 or .05) varied from theothers on each of the concepts (white-tail deer and hunting)when all scales (word pah-L) were considered (Table 1).
Plotted average evaluative, potency, and activity values(Table 4) for each group on each concept will yield a modelof semantic space (Figure 5). Once again a chi-square teatof significance can indicate existing between-groupdifferences on the three isolated factors (E, P, A). Groupssignificantly (.01) varied on evaluative and potency factorsof hunting (Table 5). Only hunters vs. nonhunterssignificantly (.05) varied on the factor of activity.
Between-group and between-concept differences can also beestablished by inserting the three factor values (Evaluative,Potency and Activity) in a generalized linear distanceformula. The greatest Euclidean (linear distance) diff-rence between groups occurred when those with antihuntingsentiments were compared with hunters (D = 3.67) (Figure 5).The distance between the hunters and nonhunters (D = 1.64)was less than the distance between the nonhunters and thosewith antihunting sentiments (D = 2.29). The distance betweenthe two concepts, white-tailed deer and hunting, increasedfrom hunters (D = 1.6), to nonhunters (D = 2.37), to thoseopposed to hunting (D = 4.21) (Figure 5).
268
2
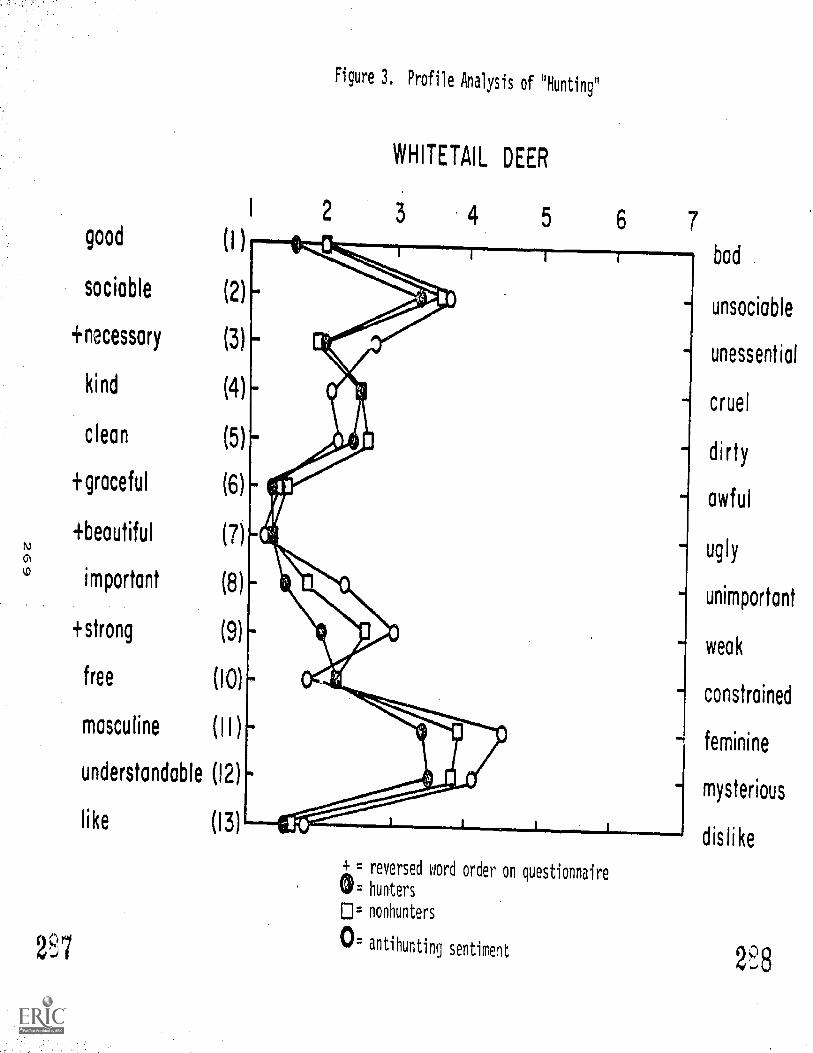
1
good (I )
sociable (2)1
+necessary (3)
kind (4)
clean (5)
+graceful (6)
+beautiful (7)
important (8)
+strong (9)
free (10)
masculine (1 I )
understandable (12)
like (131
Figure 3. Profile Analysis of "Hunting"
WHITETAIL DEER
2 3 4 5 6 7
-..4'14111; II .
.-
14, 1 A
1
,th= reversed word order on questionnaire
tl= hunters
.: nonhunters
0= antihuntinq sentiment
bad
unsociable
unessential
cruel
dirty
awful
ugly
unimportant
weak
constrained
feminine
mysterious
dislike
228
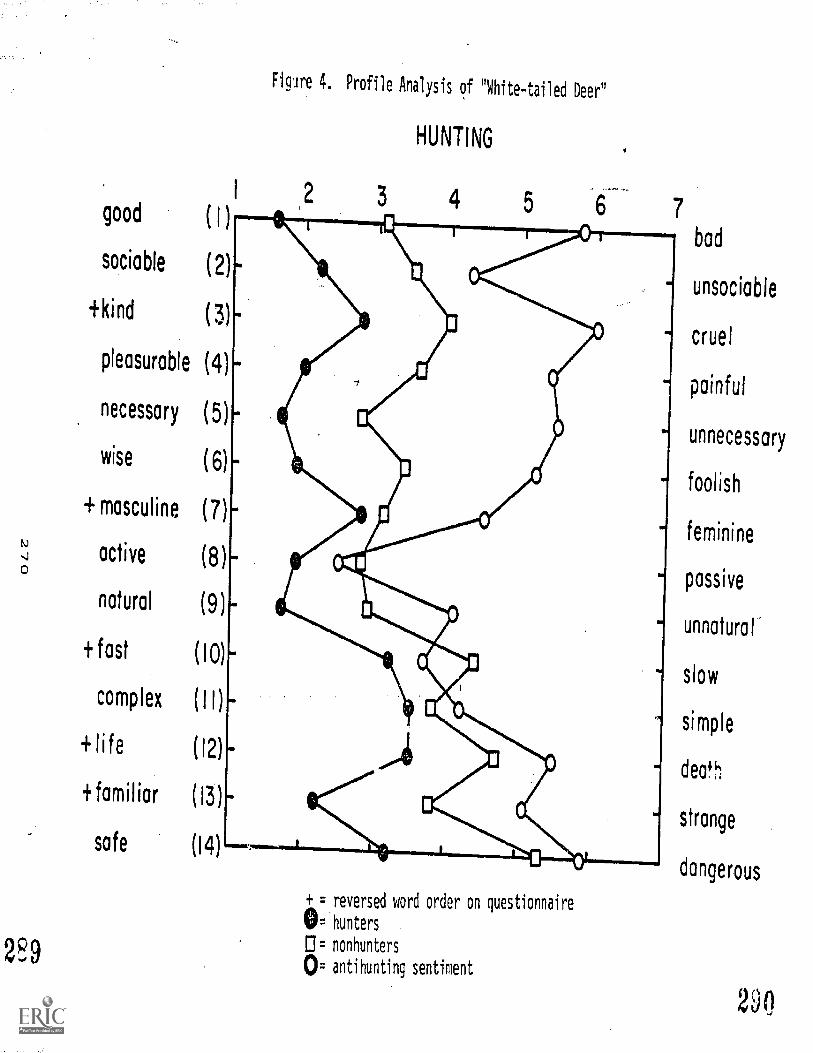
good ( I )
sociable ( 2)
+kind (3)
pleasurable (4)
necessary ( 5)
wise (6)
+ masculine (7)
active (8)
natural (9)
+ fast (10)
complex (II)
+life (12)
+ familiar (13)
safe (14)
2E9
Figure 4. Profile Analysis of "White-tailed seer"
HUNTING
1 2 3 4 5 6
+ =,reversed word order on questionnaire
4/7.: hunters
EI: nonhunters
0: antihunting sentiment
bad
unsociable
cruel
painful
unnecessary
foolish
feminine
passive
unnatural
slow
simple
death
strange
dangerous
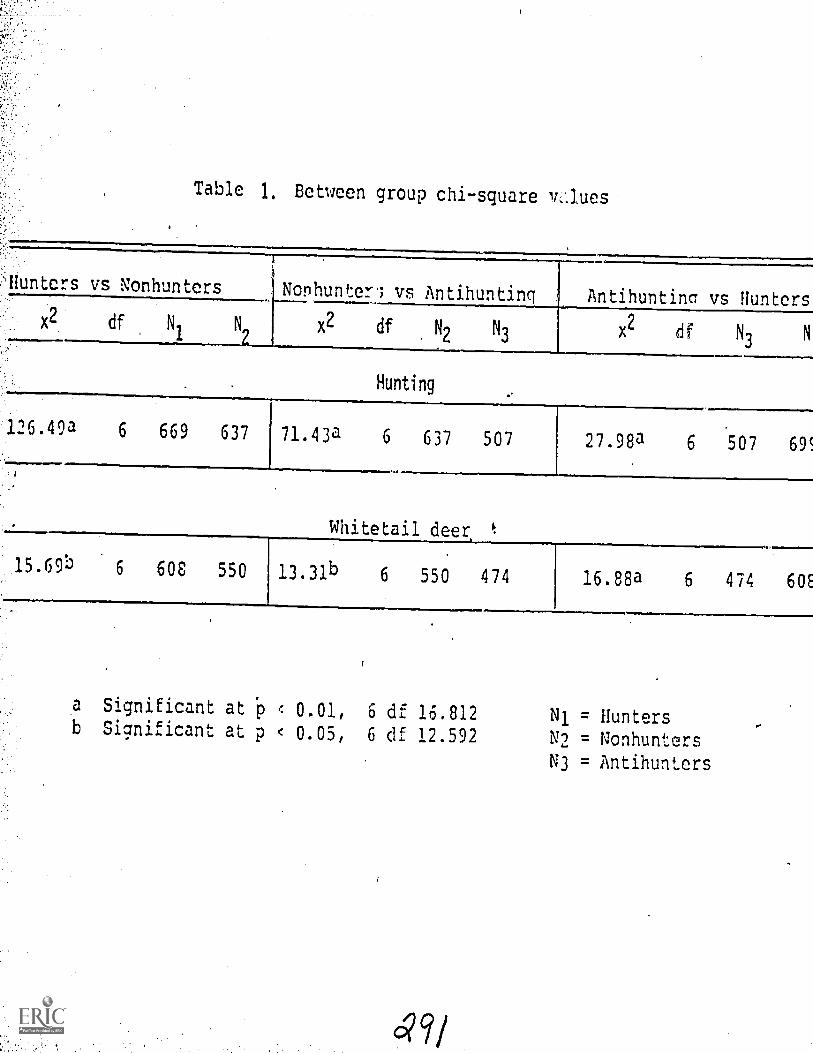
Table 1, Between group chi-square v,.lues
.1,..11.Aunters vs Nonhunters Manhunter; vs Antihunting
x2 df N1 N1 2
x2 df N2 N3
Antihuntina vs Hunters
x2 df N3
Hunting
126.49a 6 669 637 71.43a 6 637
15.69b 6 608 550
Whitetail deer,
13.31b 6 550
507 27.98a 6 507 69,C
474 16.88a 6 474 60E
a Significant at p 0.01, 6 df 16.812b Significant at p < 0.05, 6 df 12.592
Ni = HuntersN2 = Nonhunters
N3 = Antihunters

Tablc 2. Bcteeen group chi-square "whitetailed deer" polar pair analysis
Vlorci
pairHunters vs nonhunters Nonhunters vs antihuntina Antihunting vs hunters
x2 df N1 N2 x2 di N2 N3 x2 df N3 Ni
1 9.01 4 48 44 1.98 4 45 38 9.31 4 38 482 5.07 6 47 43 .93 6 43 38 1.75 6 28 473 9.59 5 46 45 9.06 4 43 25 16.94a 5 25 464 1.00 5 47 42 3.89 5 45 37 2.98 5 37 .475 5.81 5 46 42 3.36 5 42 37 6.61 5 37 46-6 5.59 4 46 41 4.24 4 41 '36 4.17 4 36 467 5.50 4 46 45 5.48 3 45 36 2.52 4 36 468 6.35 5 46 43 5.50 5 43 37 5.38 5 37 249 9.15 6 45 44 4.49 6 45 38 12.83b 5 38 45
10 1.62 6 47 39 12.79b 6 39 37 7.41 6 35 4711 9.49 6 45 44 6.19 6 44 38 18.14a 6 33 4512 13.90b 6 47 4i 12.941) 6 43 36 8.11 6 36 4713 4.67 4 46 44 1C.07 4 44 35 4.56 4 35 46
Significant at p < C.01, 6 df 16.812, 5 df 15.086
b Significant at p < 0.05, 6 df 12.592, 5 dE 13.383
Ni = Hunters
N2 = Nonhunters
N2 = Antihunters

Table 3. Between:group chi-square "hunting" polar pair analysis
...11=.1MPI...0ford Hunters vs Nonhunters Nonhunters vs Antihunting Antihunting vs Hunters?air
20.4 df N df N, N3 x2 df N3 NI
27.40a 5 49 47 43.84a 6 47 37 67.51a 6 37 492 27.04a 6 47 47 14.09b 6 47 38 25.98a 6 33 -473 19.40a 6 47 44 36.38a 6 44 37 50.57a 6 37 474 28.72a 6 47 46 29.33a 6 46 37 44.69a 6 37 475 15.56a 6 48 47 37.17a 6 47 37 62.00a 6 37 486 28.60a 6 48 47 27.51a 6 47 36 58.90a 6 36 487 1.94 4 47 46 4.12 4 46 37 2.41 4 37 478 12.15b 5 45 46 4.16 5 46 36 11.40b 5 36 459 23.79a 6 47 47 14.42b 6 47 36 45.55a 6 36 48
10 17.64a 6 42 45 6.79 6 45 36 7.50 6 36 4211 18.94a 6 45 46 10.96 6 46 35 7.21 6 35 4512 10.72 6 45 46 6.67 6 46 36 24.01a 6 33 4513 30.01a 6 47 47 17.86a 6 47 32 41.72a 6 32 4714 33.43a 6 4G 4G 8.10 5 46 37 41.39a 6 37 4G....1..........a Significant at'p < 0.01, 6 df 16.812, 5 df 15.086
b significant at p f, 0.05, 6 (It 12.592, 5 df 13.388
N1 = Hunters
N2 = Nonhunters
N3 = Antihunters
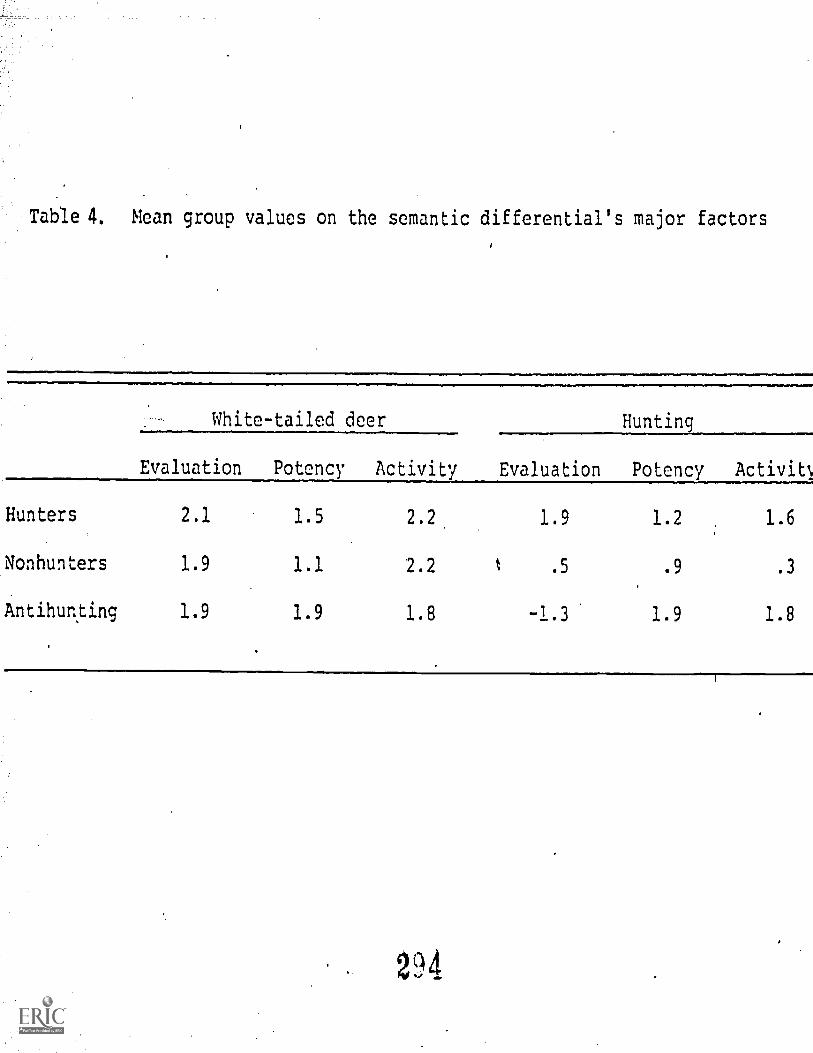
Table 4. Mean group values on the semantic differential's major factors
White-tailed deer Hunting
Evaluation Potency Activity Evaluation Potency Activit%
Hunters 2.1 1.5 2.2. 1.9 1.2 1.6
Nonhunters 1.9 1.1 2.2 t .5 .9 .3
Antihunting 1.9 1.9 1.8 -1.3 1.9 1.8
294
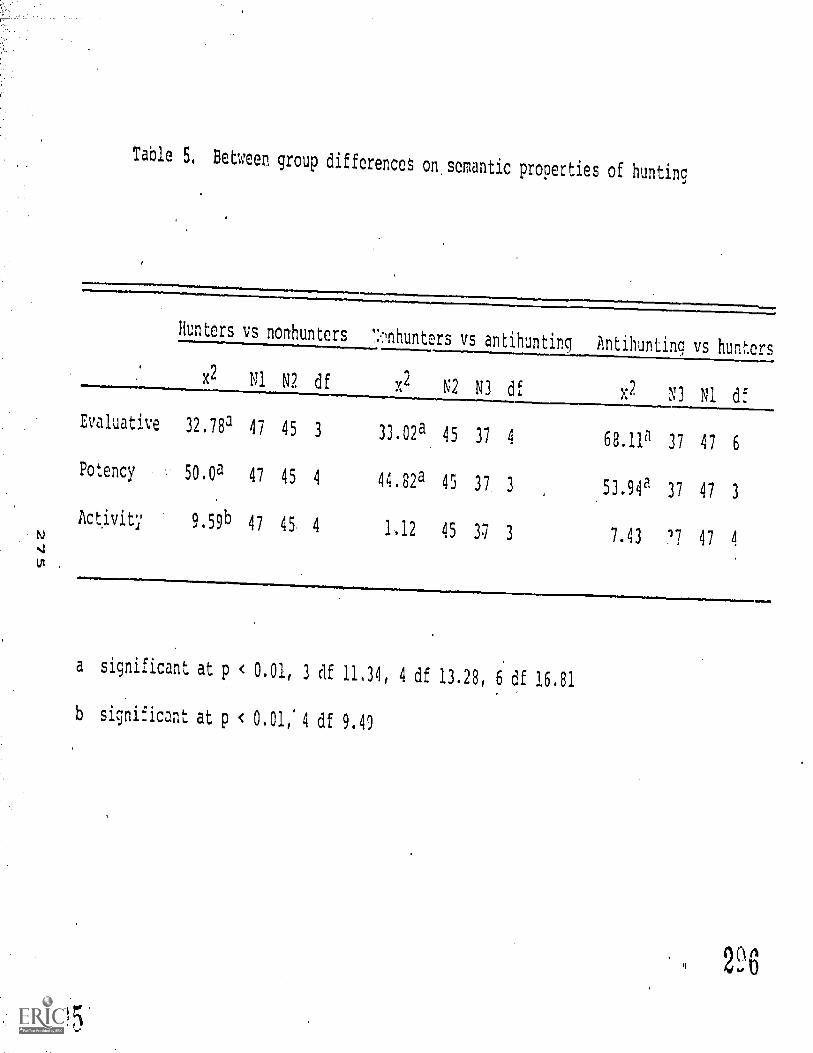
Table 5. Between group differences on, semantic properties of hunting
Hunters vs nonhunters',./.11hunters vs antihunting
AntihunLing vs hunters
x2 N1 N2 df
Evaluative 32.783 47 45 3
Potency 50.0a 47 45 4
Activity 9.59b 47 45, 4
x2 N2 N3 df x2 N3 N1 df
33.02a 45 37
44.82a 45 37
1.12 45 37
4 68.11a 37 47 6
3 53.94a 37 47 3
3 7.43 77 47 4
a significant at p < 0.01, 3 cif 11.34, 4 df 13.28, 6 df 16.81
b significant at p < 0.01: 4 df 9.49
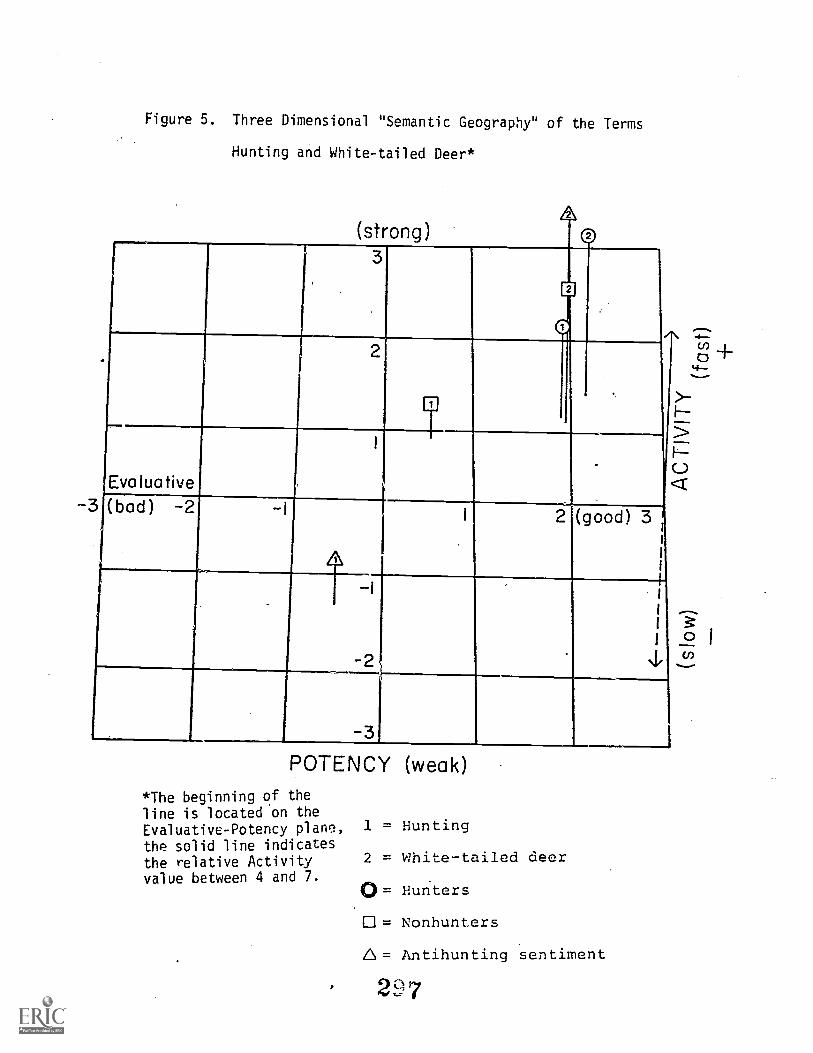
Figure 5. Three Dimensional "Semantic Geography" of the Terms
Hunting and White-tailed Deer*
POTENCY (weak)
*The beginning of theline is located on theEvaluative-Potency plane, 1 = Huntingthe solid line indicatesthe relative Activity 2 = White-tailed deervalue between 4 and 7. 0 = Hunters
O = Nonhunters
6.= Antihunting sentiment
2
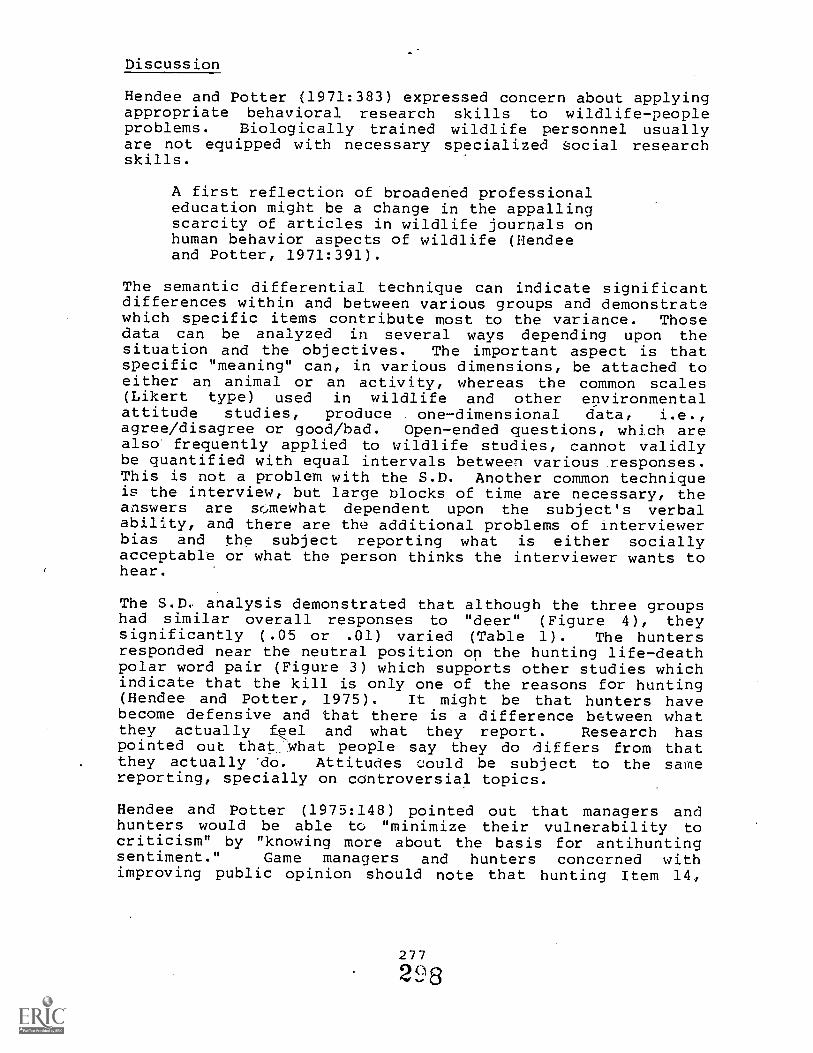
Discussion
Hendee and Potter (1971:383) expressed concern about applyingappropriate behavioral research skills to wildlife-peopleproblems. Biologically trained wildlife personnel usuallyare not equipped with necessary specialized social researchskills.
A first reflection of broadened professionaleducation might be a change in the appallingscarcity of articles in wildlife journals onhuman behavior aspects of wildlife (Hendeeand Potter, 1971:391).
The semantic differential technique can indicate significantdifferences within and between various groups and demonstratewhich specific items contribute most to the variance. Thosedata can be analyzed in several ways depending upon thesituation and the objectives. The important aspect is thatspecific "meaning" can, in various dimensions, be attached toeither an animal or an activity, whereas the common scales(Likert type) used in wildlife and other environmentalattitude studies, produce one-dimensional data, i.e.,agree/disagree or good/bad. Open-ended questions, which arealso frequently applied to wildlife studies, cannot validlybe quantified with equal intervals between various responses.This is not a problem with the S.D. Another common techniqueis the interview, but large blocks of time are necessary, theanswers are somewhat dependent upon the subject's verbalability, and there are the additional problems of interviewerbias and the subject reporting what is either sociallyacceptable or what the person thinks the interviewer wants tohear.
The S.D., analysis demonstrated that although the three groupshad similar overall responses to "deer" (Figure 4), theysignificantly (.05 or .01) varied (Table 1). The huntersresponded near the neutral position on the hunting life-deathpolar word pair (Figure 3) which supports other studies whichindicate that the kill is only one of the reasons for hunting(Hendee and Potter, 1975). It might be that hunters havebecome defensive and that there is a difference between whatthey actually feel and what they report. Research haspointed out that what people say they do differs from thatthey actually 'do. Attitudes could be subject to the samereporting, specially on controversial topics.
Hendee and Potter (1975:148) pointed out that managers andhunters would be able to "minimize their vulnerability tocriticism" by "knowing more about the basis for antihuntingsentiment." Game managers and hunters concerned withimproving public opinion should note that hunting Item 14,
277
298
safe-dangerous, was significant (.01) in two of the threecomparisons (Table 3). Danger might have been viewed interms of.human, animal, and/or property damage. This type ofattitude might be changed through use of the media. Shaw andGilbert (1974) found that television equalled Pers.lnalexperience as the major influence contributing to antihuntingsentiment; movies were fourth and magazines fifth. One couldsurvey various groups to determine points of difference onspecific issues and then plan an appropriate communicationprogram to either educate or propagandize.
Deer polar word pair 12 (understandable/mysterious), was theonly item which significantly (.05) differentiated huntersfrom nonhunters and nonhunters from antihunters (Table 2).Kellert (1976:37) found that hunters revealed greaterknowledge of animals. That could explain why those whoopposed hunting scored the deer more toward the mysteriousand weak end of the scale than did either hunters ornonhunters. Obviously those with an antikill attitude wouldview the prey, subjected to technological advances, inweaponry, as being overpowered, while hunters might have beenimpressed with the strength factor which allows wintersurvival and swift travel.
The S.D. has had widespread application in many fields and itseems, from this investigation, that the technique can supplyneeded attitudinal information as well and establish semanticinterpretation of wildlife activities and environmentalconcerns. S.D. surveys could illustrate and quantifyattitudes, both in order and with the amount of distancebetween rankings.
Gratitude is extended to Harry V. Wiant who volunteered hisstatistical expertise. D. Samuel, B. Whitmore, E. Michael,G. Bammel, K. Gallo, and the Wildlife Society Bulletin staffassisted with editorial revisions.
REFERENCES
Applegate, J. E. 1973. Some Factors Associated withAttitudes Toward Deer Hunting in New Jersey Residents,in J. C. Hendee and C. Schoenfeld (eds.), HumanDimensions in Wildlife Programs. Wildlife ManagementInstitute, 111-117.
Applegate, J. E. 1975. Attitudes Towards Deer Huntingin New Jersey: A Second Look. Wildlife SocietyBulletin 3(1): 3-6-
Berger, M. E. 1974. Texas Hunters: Characteristics,Opinions and Facility Preferences. Ph.D. thesis,Texas A&M University, College Station, 131 pp.
278
2.09
Edwards, A. L. 1957. Techniques of Attitude ScaleConstruction. New York: Appleton - Century - Crofts,Inc.
Eisele, T. 1973. The Anatomy of the Duck Hunter.Journal of Environmental Education 4(1): 22-25.
, Garrett, J. R. 1970. Characteristics of Nevada Hunters.University of Nevada Agricultural Experiment StationBulletin B-22, 66 pp.
Greene, J. C. 1970. Characteristics of Some MichiganShooting Preserve Users. Journal of WildlifeManagement 34(4): 813:817.
Hendee, J. C. 'and D. Potter. 1971. Human Behavior andWildlife Management: Needed Research. Transactionof the 36th North American Wildlife and NaturalResources Conference, 36: 383-396.
Isaac, S. and W. B. Michael. 1971. Handbook in Researchand Evaluation. San Di-,go, CA: Robert R. Knapp,Publisher.
Kellert, S. R. 1975. From Kinship to Mastery: A Studyof American Attitudes Toward Animals. The NationalAssociation for the Advancement of Humane Education,24-27.
Kellert, S. R. 1976. Attitudes and Characteristics ofHunters and Anti-hunters and Related PolicySuggestions. Working paper presented to the Fishand Wildlife Service of the United States Departmentof the Interior, November 4.
Kennedy, J. 1974. Attitudes and Behavior of Deer Huntersin a Maryland Forest. Journal of Wildlife Management38(1): 1-8/ January.
Lobdell, C. H. 1967. Socio-economic Characteristicsof Maine Sportsmen. M.S. thesis, University ofMaine, 95 pp.
Mindak, W. A. 1961. Fitting the Semantic Differentialto the Marketing Problem. Journal of Marketing25: 28-33.
More, T. A. 1973. Attitudes of Massachusetts Hunters.Proceedings of the 38th. North American Wildlife andNatural Resources Conference. Reprinted inHuman Dimensions in Wildlife Programs, John C.Hendee and Clay Schoenfeld (eds.). Wildlife Manage-ment Institute, 72-126.
279
3 011
Osgood, C. E.; G. J. Suci; and P. H. Tennenbaum. 1957.The Measurement of Meaning. Urbana, IL: Universityof Illinois Press, 346 pp.
Potter, D.; J. C. Hendee; and R. N. Clark. 1973. HuntingSatisfaction: Game, Guns, or Nature. Proceedingsof the 38th North American Wildlife and NaturalResources Conference. Reprinted in Human Dimensionsin Wildlife Programs, John C. Hendee and ClaySchoenfeld (eds.). Wildlife Management Institute,62-76.
Sb ;', D. and D. C. Gilbert. 1974. Attitudes of CollegeStudents Toward Hunting. North American 39th Wildlifeand Natural Resource Conference, 1-13.
Shaw, W. 1975. Attitudes Toward Hunting: A :'turfy of SomeSocial and Psychological Determinants. WildlifeDivision Report No. 2740. Michigan Department ofNatural Resources, July.
Sofranko, A. J. and M. F. Nolan. 1972. Early LifeExperiences and Adult Sports Participation. Journalof Leisure Research, Winter, 6-18.
Snider, J. G. and C. E. Osgood. 1969. Semantic Differen-tial Technique. Chicago: Aldine Publishing Company,679 pp.
280
301
MAKING VALUE JUDGMENTS: A QUESTION OF COGNITIVEDEVELOPMENT?
Anton E. Lawson'
Abstract. A significant percentage of students fail to makethe transition to the formal stage of cognitive developmentduring adolescence. This failure may limit one's ability tomake well-reasoned value judgments. Instruction to enhancethis ability may have to take into account the limitations ofconcrete thinkers to be successful.
Introduction
A major aim of environmental education is to develop studentswho, as future participants in a democratic society, willmake informed, well-reasoned decisions when faced withdifficult environmental issues. Hence a major concern ofenvironmental educators is to develop educational programsand teaching techniques for doing so. Needless to say, theenvironmental educator faces an extremely difficult task.The intent of this paper is to identify key variables thatinfluence a 1person s behavior in environmentaldecision-making situations and to discuss in some detail whatis Presently known about one of those variables-cognitivelevel. Implications for educational practice will also bediscussed.
Important Variables
What variables influence environmentally responsiblebehavior? Roth (1979) argues that one of the mostsignificant variables is what the student knows, in otherwords the understanding of relevant concepts divided intocategories such as ecology, economics, politics, adaptation,and psychology. Borden and Schettino (1979) tested thehypothesis that factual knowledge and feelings areindependent variables both influencing environmentallyresponsible action. Their findings indicated that increasedconcern about the environment did not lead to the seeking ofknowledge. Conversely, the acquisition of environmentalfacts did not seemingly result in increased affectivereactions. They concluded that both affective and cognitivevariables are important and suggested th.-.c until more isknown, it would be prudent to attempt to deal with both ineducational program.
1 Department of Physics, Arizona State University, Tempe,AZ 85281.
281
302
To better understand the affective variables in environ-mental decision making, Baker, Doran, and Sarnowski (1978)attempted to profile individual's environmental values. Theyfound environmental values to be largely independent ofgeneral values. A number of environmental educators such asStapp (1973), Bennett (1974-5) and Knapp (1973) have adviseduse of the values clarification approach (Raths, Harmin, andSimon, 1::66) as a means of dealing with environmental valuesin the classroom. Miles (1978) argues that Kohlberg's stagesof moral development also represent a possible approach tothe problem of studying values. In a somewhat differentvein, Cummings (1974) places the act of decision-making atthe center of his approach to environmental education. Andfinally, Lawson and Wollman (1977) found students' ability tomake informed, well-reasoned judgments in social andenvironmental contexts related to their stage of cognitivedevelopment in Piagetian terms.
Thus a number of identifiable variables such as conceptualknowledge, stage of moral development, specific sets ofvalues, and stage of cognitive development, can be identifiedas potential contributors to environmentally responsiblebehavior. Kaufman (1970) has proposed a summary equation formoral decision-making situations that may prove helpful as ameans of considering the contributions of the respectivevariables to the final behavioral outcome.
Kaufman's equation can be stated as follows:
BP = f(iV + U + H)
Where: BP is the behavioral potential or behavioraloutcome, V is the subject's values or atti-tudes specific to the situation,
i is the "idealism" or commitment of thesubject, which expresses the probabilityof his behaving in terms of his values,
U is the utility of the choice, expressedas the algebraic sum of positive consequencesmultiplied by their probabilities ofoccurrence, minus the negative consequencesmultiplied by their probabilities,
and H is habit accountable to previous behavioror modeling in similar situations.
Note chat V, U, and H are all situation-specific. Only i,which can be viewed as a 'unction of moral development inKohlberg's sense (Kohlberg and Turiel, 1971) is considered asgenerally constant from situation to situation. When i is
282
303
low, as at moral stages 1 and 2, iV is diminished, leaving Uand H to dominate the behavioral outcome. On the other hand,with i is high, as in Kohlberg's stages 5 and 6, then iV isincreased and will contribute significantly more to theoutcome. Values (V), of course, are crucial. Presumably thework in values clarification in environmental education cansignificantly enhance the development of environmentallysound values. This, however, has yet to be demonstrated (cf.Lockwood, 1978).
Recent reviews of the effects of values clarification andmoral development on school curricula are found in articlesby Lockwood (1978), Biggs (1976), Graham (A976), Miles (1978)and Phillips and Nicolayev (1978). For purposes of thepresent discussion it is sufficient to say that while bothfields of values clarification and moral development faceconsiderable theoretical difficulty, they both havesufficient intuitive. appeal to warrant further work byeducational researchers.
Utility of choice (U) is a complex factor. Yet at its coreis..,,the examination of alternatives and rational considerationof their consequences. Certainly this weighing processrequires knowledge of alternatives and their consequences,hence conceptual knowledge is essential. Not only isconceptual knowledge essential but the mental habit ofcorparing alternatives may also be essential. Perhaps thisis where the mental operations of the formal reasoner play arole. Unfortunately the II, or habit variable, may also proveof importance in environmental decision making. One may fullwell recognize the potential problems associated with certainpast behaviors yet the convenience and simple habit of thosebehaviors may prevent positive change.
Viewed with Kaufman's summary equation in mind, the job ofthe environmental educator can be restated and clarified. Thejob becomes one of facilitating the development of advancedmoral reasoning, a sound set of environmental values,conceptual understandings, and formal stage reasoning.Although this seems a tall order, Kaufman's equation suggeststhat a failure in any one of these areas may lead toenvironmentally irresponsible behavior. Attention will now beturned to the possible role-played by cognitive developmentin environmental decision making.
Cognitive Development During Adolescence
If it is the case that part of the environmental decision-making process involves the rational examination ofalternatives, their consequences, and the weighing of theseconsequences then it becomes meaningful to ask when suchrational behavior originates. At this point in time no
283
304
satisfactory answer to this question can be given.Nonetheless there are sufficiently compelling theoreticaland empirical reasons to believe it is related to thedevelopment of what Piaget has called formal reasoning ('.g.,Inhelder and Piaget, 1958; Kohlberg and Turiel,,1971; Lawsonand Wollman, 1977; Peel, 1971; Lawson, Karplus and Adi, 1978;Graham, 1976; Biggs, 1976). Thus a closer examination ofPiaget's theory is warranted.
Within Piaget's theory, cognitive development acrossadolescence is seen to involve a gradual transition from thepredominantly "real world" and restricted descriptions of thechild to the more mature hypothetical and tentativeexplanations of the adult. Adolescence is seen as a time inwhich higher-order cognitive operations develop from acomplex interaction of the subject's own attempts tocognitively assimilate his varied physical and socialexperiences. Reasoning patterns such as the isolation andcontrol of variables, combinatorial, proportional,probabilistic, and correlational reasoning develop as a meansof generating and testinq hypotheses about that world.Further, according to inhelder and Piaget (1958),personalities and' a mature system of values develop alongwith the development of formal reasoning. As Inhelder andPiaget state:
First; feelings relative to ideals are added tointer individual feelings. Secondly, personali-ties develop in relation to social roles andscales of values derived from social' interaction(and no longer only by the coordination ofexchanges which they maintain with the physicalenvironment and other individuals)...it isimportant to see how closely these two essentialaffective aspects of adolescence are interwovenwith the transformations of behavior brought onby the development of formal structures (1958:348).
Thus adolescence is not only a time of'cognitive developmentbut of affective development as well. Importantly forPiaget, the emergence of formal operations is the mechanismresponsible for both.
What evidence exists to support the hypothesis that thereasoning patterns of Piaget's hypothetical formal thinkerdevelop during adolescence? Further what evidence exists tosupport the hypothesis that this development is linked to theability to make well-reasoned value judgments? A good dealof evidence has been gathered to support the hypothesis thatformal reasoning develops during adolescence. Inhelder andPiaget's classic 1958 volume The Growth of Logical Thinkingfrom Childhood to Adolescence contains numerous formal tasks
284
305
and protocols which demonstrate the acquisition of moreadvanced reasoning patterns (formal schemata) with age.However, Inhelder and Piaget made no systematic attempt torandomly sample large numbers of subjects at various ages andthey failed to report percentages of subjects respondingcorrectly or formally to their various tasks. Therefore,from their work, it is not possible to determine howprevalent any type of reasoning is for any particular agegroup. However, other researchers such as Longeot (1965),Raven (1973), Burney (1974) and Lawson (1978) have developedbatteries of formal tasks and written problems and have foundincreasingly successful performance with advancing age duringadolescence.
One of the most comprehensive attempts at accessing thedevelopment of reasoning patterns across adolescence wasreported by Lawson, Karplus and Adi (1978). Lawson, Karplusand Adi administered problems requiring proportional,probabilistic, and correlational reasoning to 507 carefullyselected subjects spanning the entire age range ofadolescence--roughly ages 11.5 to 20.0 years. They found thatonly 10 percent of the youngest subjects (6th graders, meanage = 12.9 years) responded correctly to the proportionalreasoning problem but 80.4 percent of the oldest subjects(college students, mean age 19.6 years) solved the problem.The respective percentages for the probabilistic andcorrelational reasoning problems were similar. Thepercentages for all of the age groups (6, 8, 10, 12 andcollege) for all problems are shown in Figure 1.
The data reveal not only that formal reasoning patternsdevelop in more and more subjects with increasing age duringadolescence but they also reveal considerable heterogeneityat any one age. For example, even at the sixth grade levelsome subjects responded with correct choices andwell-reasoned explanations indicating competence with formalreasoning patterns. On the other hand; even in the collegesample some subjects responded incorrectly and offered onlyincomplete, confused and illogical explanations indicatingpoorly developed formal reasoning. The rather abruptinc.-ease in percentage of correct responses given to thereasoning items between eighth and tenth grade suggests apossible transition period. Yet the more linear increase inpercehtages seen for the correlational reasoning itemssuggests more of a gradual and even tempo of development.
Is Cognitive Development Linked to Value Judgment?
Lawson and Wollman (1977) administered three Piagetian tasks(the conservation of weight, bending rods, and balance beam)to a heterogeneous sample of early adolescents (N = 53, meanage = 11.6 years, range = 10.6 to 12.3 years) and found them
285
30 6
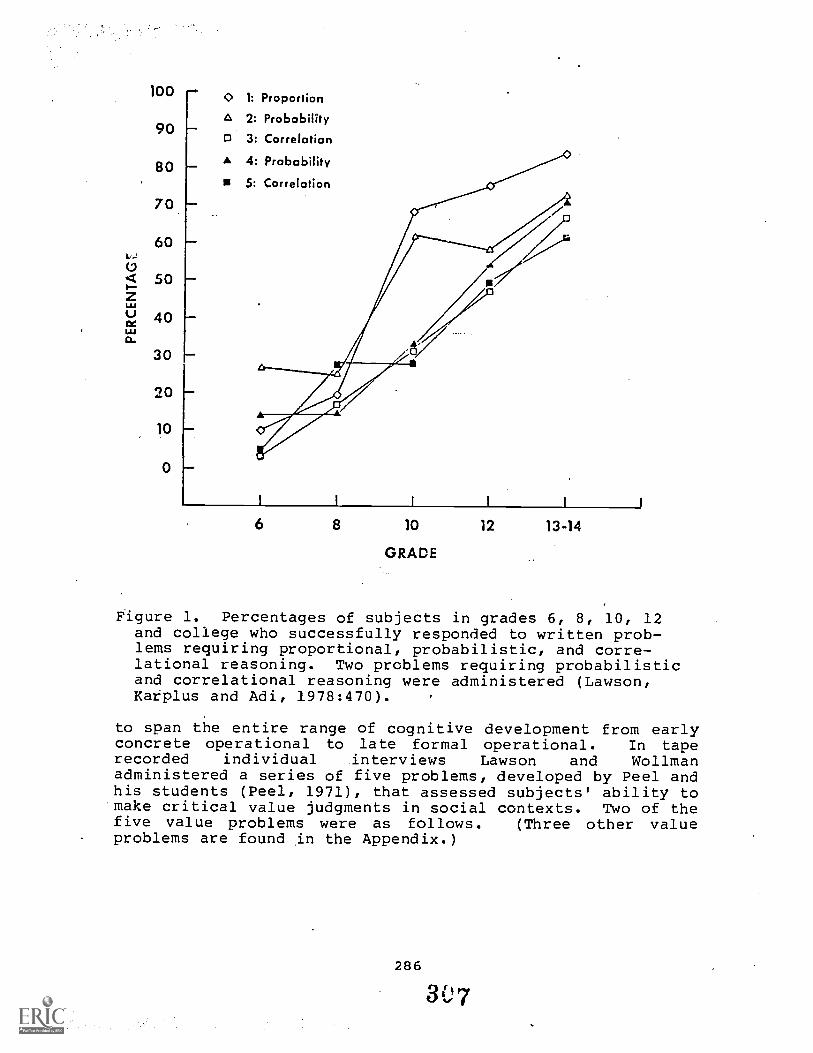
100 wwilo 0
90O
801
70
60L.J
0it 50
Y.1
urx 40LUD.
30
20
10
0
1: Proportion
2: Probability3: Correlation
4: Probability
5: Correlation
1
6 8 10 12 13-14
GRACE
Figure 1. Percentages of subjects in grades 6, 8, 10, 12and college who successfully responded to written prob-lems requiring proportional, probabilistic, and corre-lational reasoning. Two problems requiring probabilisticand correlational reasoning were administered (Lawson,Karplus and Adi, 1978:470).
to span the entire range of cognitive development from earlyconcrete operational to late formal operational. In taperecorded individual interviews Lawson and Wollmanadministered a series of five problems, developed by Peel andhis students (Peel, 1971), that assessed subjects' ability tomake critical value judgments in social contexts. Two of thefive value problems were as follows. (Three other valueproblems are found in the Appendix.)
286
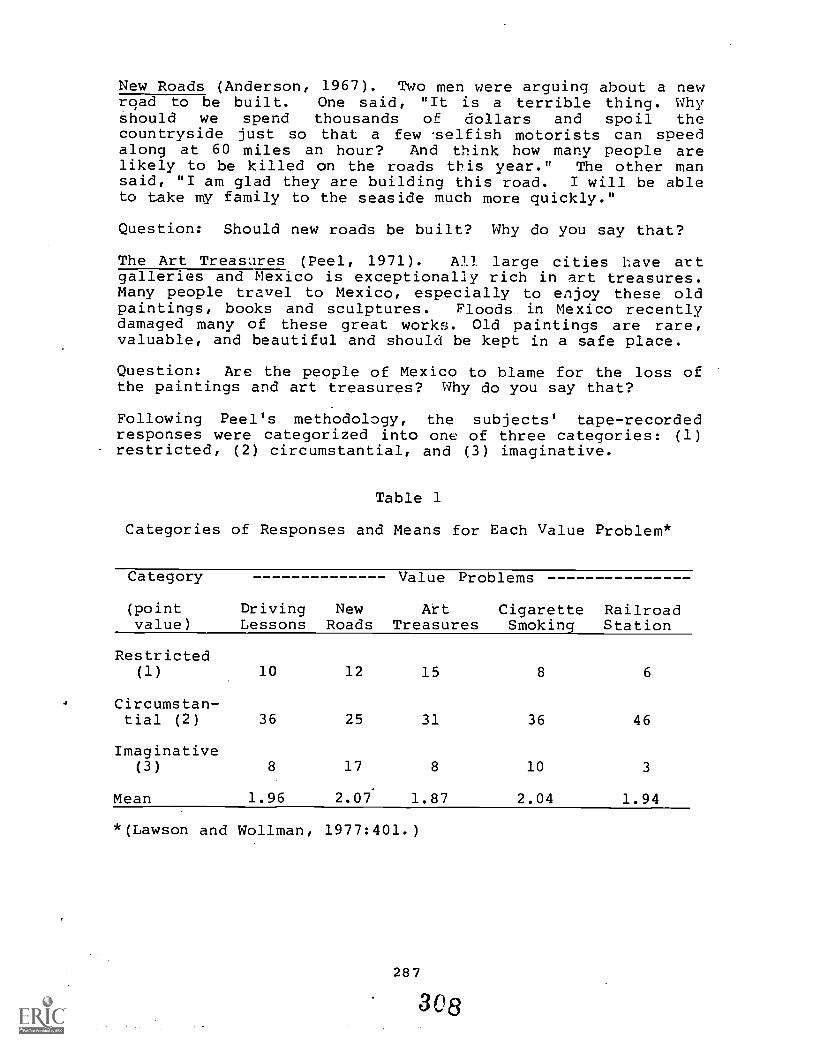
New Roads (Anderson, 1967). Two men were arguing about a newroad to be built. One said, "It is a terrible thing. Whyshould we spend thousands of dollars and spoil thecountryside just so that a few selfish motorists can speedalong at 60 miles an hour? And think how many people arelikely to be killed on the roads ttis year." The other mansaid, "I am glad they are building this road. I will be ableto take my family to the seaside much more quickly."
Question: Should new roads be built? Why do you say that?
The Art Treasures (Peel, 1971). All large cities have artgalleries and Mexico is exceptionally rich in art treasures.Many people travel to Mexico, especially to enjoy these oldpaintings, books and sculptures. Floods. in Mexico recentlydamaged many of these great works. Old paintings are rare,valuable, and beautiful and should be kept in a safe place.
Question: Are the people of Mexico to blame for the loss ofthe paintings and art treasures? Why do you say that?
Following Peel's methodology, the subjects' tape-recordedresponses were categorized into one of three categories: (1)restricted, (2) circumstantial, and (3) imaginative.
Table 1
Categories of Responses and Means for Each Value Problem*
Category Value Problems
(point Driving New Art Cigarette Railroadvalue) Lessons Roads Treasures Smoking Station
Restricted(1) 10 12 15 8 6
Circumstan-tial (2) 36 25 31 36 46
Imaginative(3) 8 17 8 10 3
Mean 1.96 2.07 1.87 2.04 1.94
*(Lawson and Wollman, 1977:401.)
287
308
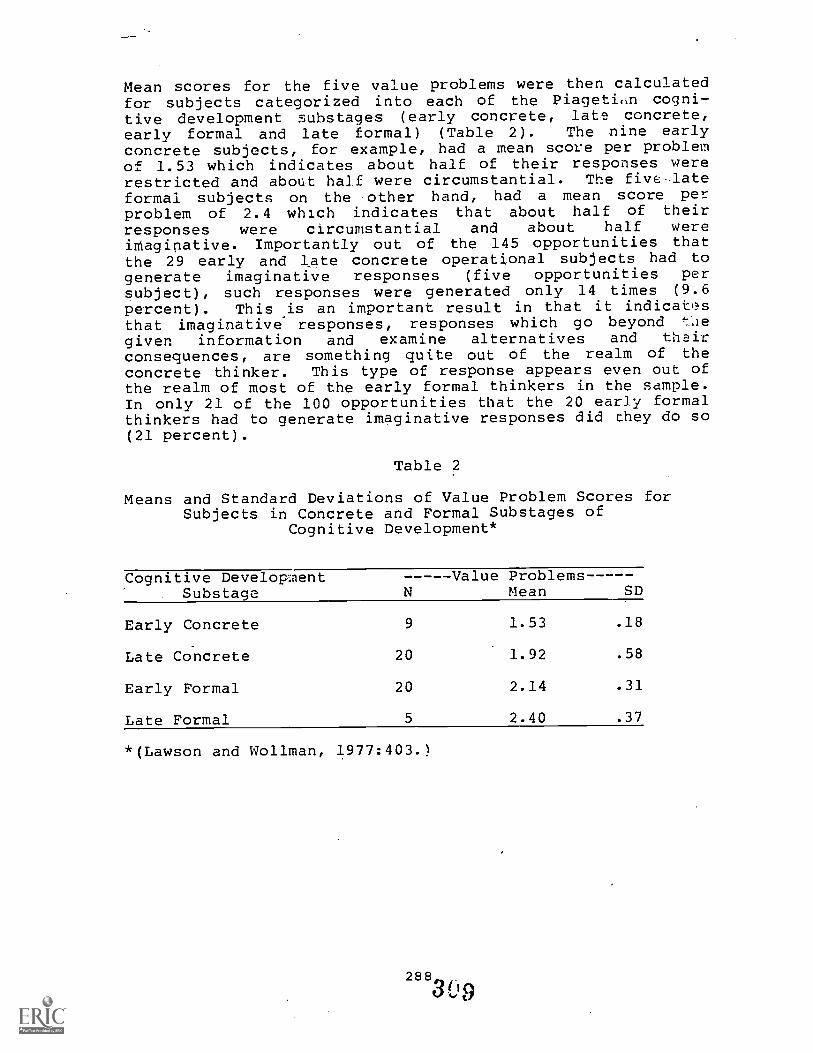
Mean scores for the five value problems were then calculatedfor subjects categorized into each of the Piageti,m cogni-tive development substages (early concrete, late concrete,early forMal and late formal) (Table 2). The nine earlyconcrete subjects, for example, had a mean score per problemof 1.53 which indicates about half of their responses wererestricted and about half were circumstantial. The five-lateformal subjects on the other hand, had a mean score perproblem of 2.4 which indicates that about half of their
responses were circumstantial and about half wereintaginative. Importantly out of the 145 opportunities thatthe 29 early and late concrete operational subjects had togenerate imaginative responses (five opportunities persubject), such responses were generated only 14 times (9.6
percent). This .is an important result in that it indicatesthat imaginative responses, responses which go beyond tlie
giver, information and examine alternatives and theirconsequences, are something quite out of the realm of the
concrete thinker. This type of response appears even out ofthe realm of most of the early formal thinkers in the sample.In only 21 of the 100 opportunities that the 20 early formalthinkers had to generate imaginative responses did they do so(21 percent).
Table 2
Means and Standard Deviations of Value Problem Scores forSubjects in Concrete and Formal Substages of
Cognitive Development*
Cognitive DevelopmentSubstage N
Value ProblemsMean SD
Early Concrete 9 1.53 .18
Late Concrete 20 1.92 .58
Early Formal 20 2.14 .31
Late Formal 5 2.40 .37
*(Lawson and Wollman, 1977:403.)
288.29
Scores on the five value problems were then summed to obtaina single score (5-1rJ) for each subject. An analysis ofvariance was then conducted using substage of cognitivedevelopment as the independent variable and the summed scoreon the value problems as the dependent variable. Theanalysis revealed a statistically significant relationship, F(3,50). = 4.59, p < 0.01. Further, a principal componentsanalysis of the data was conducted. Principal componentsanalysis is a multivariate technique which is oftenconsidered a first-stage solution in factor analysis. Thetechnique mathematically attempts to reduce a set of manymeasures to a smaller number of factors by extr,,;tingweighted sums of the measures which account for a maximumamount of the variance of the total set. Analysis of thepresent data showed the Piagetian tasks and the valueproblems loading on a single component which accounted forover 60 percent of the variance. Again this indicates a gooddeal of common variance between the Piagetian tasks. and thevalue questions.
The Implications of These Findings for EnvironmentalEducation
Raths, Harmin, and Simon (1966:38-39) argue that adults canhelp children develop and clarify their own values by doingthe following seven things:
1. Encourage children to make choices, and to make themfreely.
2. Help them discover and examine available alternativeswhen faced with choices.
3. Help children weigh alternatives thoughtfully,reflecting on consequences of each.
4. Encourage children to consider what it is that theyprize and cherish.
5. Give them opportunities to make public affirmationsof their choices.
6. Encourage them to act, behave, live in accordancewith their choices.
7. Help them to examine repeated behaviors or patternsin their life.
289
310
But as the data reported by Lawson and Wollman (1977)indicate, the discovery and examination of alternatives andthe thoughtful consideration of their consequences issomething that concrete and even early formal operationalstudents seldom if ever do. Does this; mean that they areessentially unable to examine alternatives and theirconsequences? As Piaget has argued, cognitive and affectivedevelopment appear to be closely related. Thus affectivedevelopment may in fact require prior development of.important cognitive operations. Piaget has argued that it isthe development of his ccmbinatorial system of 16-binaryoperations and four fundamental structures of thought calledIdentity, Negation, Reciprocity, and Correlativity (INRCgroup) which is at the heart of both cognitive and affectivedevelopment during adolescence. Nonetheless, little supporthas been generated for this position (cf. Wollman, 1979).
If Piaget's combinatorial system and INRC group are rejectedthen what mental processes might account for the observedlink between the cognitive and affective aspects ofadolescence? It seems reasonable to assume that the mentalprocesses are the very ones involved in taking intoconsideration alternatives and examining consequences. Forexample, in the Piagetian bending rods task, the subject mustfirst identify variables that might affect the bending ofmetal rods, such as rod length, thickness, and metal type,and then conduct controlled experiments to test the effectof each variable. The tests would involve a realization thatone rod may be bending more than another for any one or moreof several reasons. Thus to be certain that any one variablemakes a difference in the bending, one must be certain thatthe other alternatives are held constant. Likewise in aproblem such as Peel's New Roads problem this would involvean awareness of extenuating circumstances such as the numberof persons likely to use the new road, the importance ofgoing to the destinations along the road, the amount ofpollution produced by the cars using the road, and so on. Inother words, the link between cognitive and affectivedevelopment need not be Piaget's combinatorial system andINRC group but it might simply be: (1) a knowledge ofalternative posi4-.ions and their consequences gained throughexperience and, (2) the mental habit of weighing thosealternatives one against the other until the most reasonableone can be chosen in light of their imagined consequences.
This view is entirely consistent with the values clarifi-cation and moral development view that situations that allowstudents to confront problems, share experiences and views,examine alternatives, weigh consequences, and search forresolutions would do much to enhance responsibledecision-making skills. A note of caution, however, seems inorder. Values clarification and moral development teaching
290
311
approaches that have been tried in the past and have includedonly verbal classroom discussions have largely beenunsuccessful (Lockwood, 1978). One of the few teachingapproaches that showed significant development in studentswas one. in which eighth grade students not only discussedmoral issues in class but engaged in role-playing, creatingmoral dilemmas, and in interviewing persons in the school andcommunity at large (Paolitto, 1976). Although Paolitto didnot assess level of intellectual development of her subjects,it is safe to assume that many of them were concreteoperational. The fact that her treatment included much mar`than mere verbal discussions and actually engaged hersubjects in first-hand concrete experiences might have beenthe crucial difference between her success and others'failures. The suggestion is that if your classes containconcrete operational subjects, then your attempts at valuesclarification and moral development might well require muchmore than verbal instructional techniques (e.g., thediscussion of moral dilemmas and environmental-economic-political issues).
Summary
Concrete operational students display an importantlimitation. They find it extremely difficult to sustainreasoning in the absence of objects or recent experience.They often lose track of verbal arguments of even modestlength. They do considerably better with short statementsand when words refer to objects or pictures, or better stillto objects which they have manipulated themselves. As Wollman(1978:15) stated, "At the extreme, objects are more thanhelpful, they are necessary. Hence the term 'concrete'."
Due to this limitation it seems reaonsable to hypothesizethat concrete operational students require first-handexperiences for intellectual and affective development. AsInhelder and Piaget (1958:250) characterized it, "...concretethought remains essentially attached to empirical reality."Thus for concrete thought to be extended it would seem thatone must begin within the empirical reality of the child andonly then present hypothetical extensions of that reality fordiscussion and debate. For the environmental educator tosuccessfully achieve the aim of developing students who willmake informed well-reasoned decisions when faced withdifficult environmental issues, it may be imperative thatinstructional materials be designed that take the limitationsof the concrete thinker seriously.
REFERENCES
Anderson, D. R. 1967. "An Investigation into the Effectsof Instruction on the Development of PropositionalThinking in Children." Dept. Child PsychologyResearch, School of Education, Birmingham University.
Baker, Milton R.; Rodney L. Doran; and Alfred S. Sarnowski.1978. An Analysis of Environmental Values are TheirRelation to General Values. The Journal of Environ-mental Education 10(1): 35-40.
Bennett, Dean. 1974-5. Teacher's Guides: Elementary,Junior and Senior High School (4 vols.). Yarmounth,ME: The Maine Environmental Education Project.
Biggs, J. B. 1976. "Schooling and Moral Development," inPiaget, Psychology and Education. Ved P. Varma andPhillip Williams (eds.). Itasca, IL: F. E. PeacockPublishers.
Bordon, Richard J. and Andrew P. Schettino. 1979. Deter-minants of Environmentally Responsible Behavior.The Journal of Environmental Education 10(4): 35-39.
Brydon, J. 1967. "An Investigation of Certain FactorsEntering into the Judgments of Adolescent Boys andGirls." Dept. Child Psychology Research, School ofEducation, Birmingham University.
Burney, G. M. 1974. "The Construction and Validation ofan Objective Formal Reasoning Instrument."Unpublished doctoral dissertation, University ofNorthern Colorado.
Cummings, Stanley I. 1974. A Methodology for Environmen-tal Education. The Journal of EnvironmentalEducation 6(2): 16-20.
Graham, D. 1976. "Moral Development: The CognitiveDevelopmental Approach," in Piaget, PsychologyarldEducation, Ved P. Varma and Phillip Williams (eds.).Itasca, IL: F. E. Peacock Publishers.
Inhelder, B. and J. Piaget. 1958. The Growth of LogicalThinking from Childhood to Adolescence. New York:Basic Books.
Kaufman, H. 1970. Aggression and Altruism. New York:Holt, Rinehart and Winston.
292
313
Knapp, Clifford. "Teaching Environmental Education with aFocus on Values," in Howard Kirschenbaum andSidney B. Simon (eds.), Readings inValues Clarifi-
, cation. Minneapolis: Winston Press.
Kohlberg, Lawrence and Elliot Turiel. 1971. "MoralDevelopment and Moral Education," in G. S. Lesser(ed.), Psychology and Educational Practice.Glenview: Scott, Foresman.
Lawson, A. E. and W. T. Wollman. 1977. Cognitive Level,Cognitive Style, and Value Judgment. ScienceEducation 61(3): 397-407.
Lawson, A. E. 1978. The Development and Validation of aClassroom Test of Formal Reasoning. Journal ofResearch in Science Teaching 15(1): 11-24.
Lawson, A. E.; R. Karplus; and H. Adi. 1978. TheAcquisition of Propositional Logic and FormalOperational Schemata During the Secondary SchoolYears. Journal of Research in Science Teaching15(6): 465-478.
Lockwood, Alan L. 1978. The Effects of Values Clarifica-tion and Moral Development Curricula on School-AgeSubjects; A Critical Review of Recent Research.Review of Educational Research 48(3): 325-364.
Longeot, F. 1965. Analyse Statistique de Trois TestsGenetiques Collectifs. Bulletin de l'InstitutNational D'Etude Du Travail et D'Orientation Profes-sionelle 20(4): 219-237.
Miles, John C. 1978. The Study of Values in EnvironmentalEducation. The Journal of Environmental Education9(2): 5-17.
Paolitto, D. 1976. "Role-Taking Opportunities for EarlyAdolescents: A Program in Moral Education."Unpublished doctoral dissertation, Boston University.
Peel, E. A. 1971. The Nature of Adolescent Judgment.New York: Wiley-Interscience.
Phillips, D. C. and Jennie Nicolayev. 1978. KohlbergianMoral Development: A Progressing or DegeneratingResearch Program? Education Theory 28(4): 286-301.
Raths, Louis E.; Merrill Harmin; and Sidney V. Simon. 1966.Values and Teaching. Columbus, OH: Charles E.Merrill Publishing Company.
293
314
Raven, R. 1973. The Development of a Test of Piaget'sLogical Operations. Science Education 57(3): 33-40.
Roth, Robert E. 1979. Conceptual Development and Environ-mental Education. The Journal of EnvironmentalEducation 11(1): 6-9.
Stapp, William B. 1973. "Development, Implementation andEvaluation of Environmental Education Programs (K-12)."Unpublished report, Ann Arbor, MI, April.
Wollman, Warren. 1978. Developmental Implications ofScience Teaching: Early Adolescence. Columbus, OH:ERIC/SMEAC.
APPENDIX
Driving Lessons (Brydon, 1967). Most young people want to beable to-drive a car. There are too many cars on the roadsalready in this country and more drivers would only make theposition worse.
Question: Should young people be given lessons on drivingin their last year at school? Why do you saythat?
Cigarette Smoking (Brydon, 1967). At the present day manypeople die from cancer. Cigarette smoking is said to be thecause of lung cancer and yet tobacco is freely soldthroughout the country. Any person over the age of 16 canspend as much money as he likes on buying cigarettes.
Question: Should cigarette smoking be banned by thegovernment? Why do you say that?
The Railroad Station (Peel, 1979). Mt. Pleasant is a largetown with a busy railroad junction which attracts boys andgirls who are interested in watching trains. Scottsville isa small place not far away and many people who live inScottsville do their shopping in Mt. Pleasant because thereare many more shops. The railroad company has recentlydecided to close the Scottsville station and run no moretrains from there to Mt. Pleasant.
Question: Should the Scottsville station be closed? Whydo you say that?
294
315
EXPECTED CONSEQUENCES, ENJOYABILITY, AND OTHEREVALUATION SCALES
Lei Lane BuKrus-Bamme1,1William E. Kidd,' and Gene Bammell
Abstract. The staff and 36 participants of the WestVirginia Forest Industries Camp responded to attitude,knowledg3, expected consequences, enjoyability, andorganization scales on a pre-post program basis. Resultsindicated significant (.05, .01, or .001) correlationsbetween attitude and knowledge change scores, learning andenjoyability, enjoyability and perceived organization,learning and post expectations, plus the staff and campersperception of what happened during the week.
Learning is a complex phenomenon. Typically residential,day, and school environmental programs have cognitive andaffective objectives, be they stated or inferred. Evaluationof past programs has indicated that both attitudes andknowledge levels can be significantly altered _luring anenvironmental program (Kidd, Burrus-Bammel, and Bammel 1978);that nonparticipants did not exhibit such changes during thesame time period (Burrus-Bammel, Bammel, and Kidd, 1979);that measured changer in the experimental camp group did notsignificantly decline over a set period of time(Burrus-Bammel, 1978; Bammel and Hanson, 1978). Otherinvestigations, not necessarily conducted in environmentalprograms demonstrated that novel information is givenprocessing priority; that,, information processing is enhancedwhen more than one modality is involved; that nontraditionaltechniques such as simulation games, puppetry, and fieldtrips can be as or more effective than the standard lecturemethod for presenting knowledge-based material; that fearmessages stimulate more attitude change than either factualor neutral messages.
Environmental evaluation researchers have previouslyinvestigated attitude and/or knowledge changes over time,their relationship to each other, the effectiveness ofvarious teaching techniques but three variables, enjoy-ability, expected consequences, and organization have beenpreviously nelq1,-L.cted.
'Division of Forestry, West Virginia University,Morgantown, WV 26506.
2Forestry and Extension Forestry, West Virginia University.
295
316
WEST VIRGINIA FOREST INDUSTRIES CAMP
The purpose of this study was to determine 1) therelationship of enjoyability to attitudes and knowledge, 2)the relationship of expected consequences to attitudes andknowledges, 3) the relationship of organization to attitudesand knowledges, 4) the relationship of expectations beforethe residential camp program with reports of what actuallyhappened during the program, 5) the camp staff's'ability topredict participants' expectations, 6) the correlationbetween the campers' and staff's reporting of what actuallywas accomplished during the program and 7) the usefulness ofenjoyability, expected consequences, organization and otherprofile data.
Camp Pocahontas
Each year the Cooperative Extension Service supports a numberof what could be called "environmental education" programs,one of which is the West Virginia Forest Industries Camp.This camp is sponsored by West Virginia University,Cooperative Extension Service, West Virginia Forests Inc.,the forest industries of West Virginia, and other publicagencies (the West Virginia Department of Agriculture,Natural Resources, Soil Conservation Service, and the U.S.Forest Service).
The camp's main goal is to impart to the participants afundamental philosophical attitude which approaches theenvironment in which people live as a total system. Themajor component is the natural system upon which is imposedthe social, political, and economic systems. The teachingprogram focuses upon developing a specific understanding ofthe Eastern Hardwood Forest ecosystem. Participants areencouraged to see that the forest can be used to produce thegoods and services required by people without destroying itsplace in the system of nature. Selected campers arepredominantly rural high school students 16 to 20 years ofage, each having been recommended by a forester, teacher, orother youth leader. Final selection is based upon writtenrecommendations and statements of interest by the individualapplicant.
During the week at Camp Pocahontas, the partici-pants were isolated from the usual types of mediasuch as television, radio and newspapers. Thecampers did receive illustrated evening lectures,and took part in on-site role playing where groupsassumed defensible single-use advocacy positionsand sought to harmonize differences with othersingle-use groups. Field trips included tours
296
317
of wood products plants to demonstrate theprogress from log to finished wood product, andon-site practical demonstration with campersinstalling transects and recording data thatprovided a picture of the forest, plants, animals,and historical use. By the close of the sessionthe individuals had received information of thetangible benefits of wood, water, recreation, aswell as the intangible aesthetic influences. Theone-week camp dealt with knowledge of theprocesses that maintain the ecosystem, with theawareness of injurious agents, with multiple use,and with social action processes. As a result,they became aware of the complexities of forestland management, and of the opportunities andresponsibilities associated with forest ownership(Kidd, Burrus - Bammet and Bammel, 1978:13).
Evaluation
Established camp procedure includes administration of awritten objective test at the beginning of the week todet,Irminetattitudes, conceptual knowledge, factual knowledgeand expectations. This same instrument, with an addedenjoyability scale, was given again at the close of camp inorder to establish whether or not any change had occurred,and if change had occurred, the direction and degree of thatchange.
Attitudes have beenf defined as "a relatively enduringorganization of beliefs about an object or situationpredisposing one to respond in some preferential manner"(ROkeach, 1975:134). Attitudes in this study were determinedby the subject's score for favorable or unfavorable responsesto 16 Likert-type statements on a variety of environmentaltopics (Appendix A). Response foils included SA (stronglyagree), A (agree), SWA (somewhat agree), DK (don't know), SWD(somewhat disagree), D (disagree), and SD (stronglydisagree). Numerical values 1-6 (no value assigned to a DKresponse), 6 denoting the multiple use concept, were assignedto each response according to the desired, multiple use,answer. A reliability coefficient oc: .84 was determined in1976 when there were only five response foils instead of the1979 seven. Seventeen true-false and eight multiple choiceitems comprised the 1979 knowledge test (Appendix B). Thereliability coefficient, established in 1976 for the first 15true-false items, was .90. The overall test (attitude andknowledge) validity coefficient of .92 was established in1976 by a panel of three experts.
297
318
Two enjoyability measures were calculated. The firstmeasure, labeled Enjoyability I, resulted from one generalquestion: "How enjoyable (on a scale of 0-100, lowenjoyability to high) was the overall camp experience?" Thesecond measure, Enjoyability II, resulted from averagingresponses to a series of specific questions that related toactual program activities such as tree identification, forestpolicy debate, ecosystem session, etc. (Table 5). Thesequestions had also been rated on a 0-100 scale.
Pre-camp expectations were determined by averaging responses(1-7, low to high) to 23 statements (Appendix C). These samestatements, with the verb tense changed to the past tense(Appendix D), were repeated at the end of the camp todetermine how effective the program was at meeting thevarious expectations. There was also one general questionwhich asked, "How well were your camp expectations met?(0-100, 0 = not met at all, 100 = extremely well met)." Thisfactor was labeled Expectations II. In addition, the camperswere asked "In general, how much do you think you learned(0-100, 0 = nothing, 100 = a great deal) during this campexperience?" (labeled Learned Value) plus "How would you rate(1-5, awful to excellent) the overall organization of this (
week?" Four other specific points were included on the same1-5 scale (1 = awful, 2 = poor, 3 = OK, 4 = good, 5 =excellent):
1. Pre-camp information (camp location, what tobring, etc.
2. Evening programs.3. The daily teaching schedule.4. The day-to-day routine of moving from one
activity to the next.
Averaging responses from the five statements yielded anorganization value.
The camp staff was requested to estimate "What do camperscome expecting?" and "What do you think was accomplished atcamp?" by responding to the pre and post-camp expectationstatements (Appendices C and D).
Results
Attitude and Knowledge. West Virginia Forest Industries Campstaff has been formally conducting evaluation procedures forfive years, less formal methods for 20 years. Participantsin the 1979 program, as in the previous years, improvedsignificantly (.001) between pre and post attitude andknowledge tests (Table 1). Percentages on the knowledge testwere transformed to arcsin values. Previous studies (Kidd,
298
319
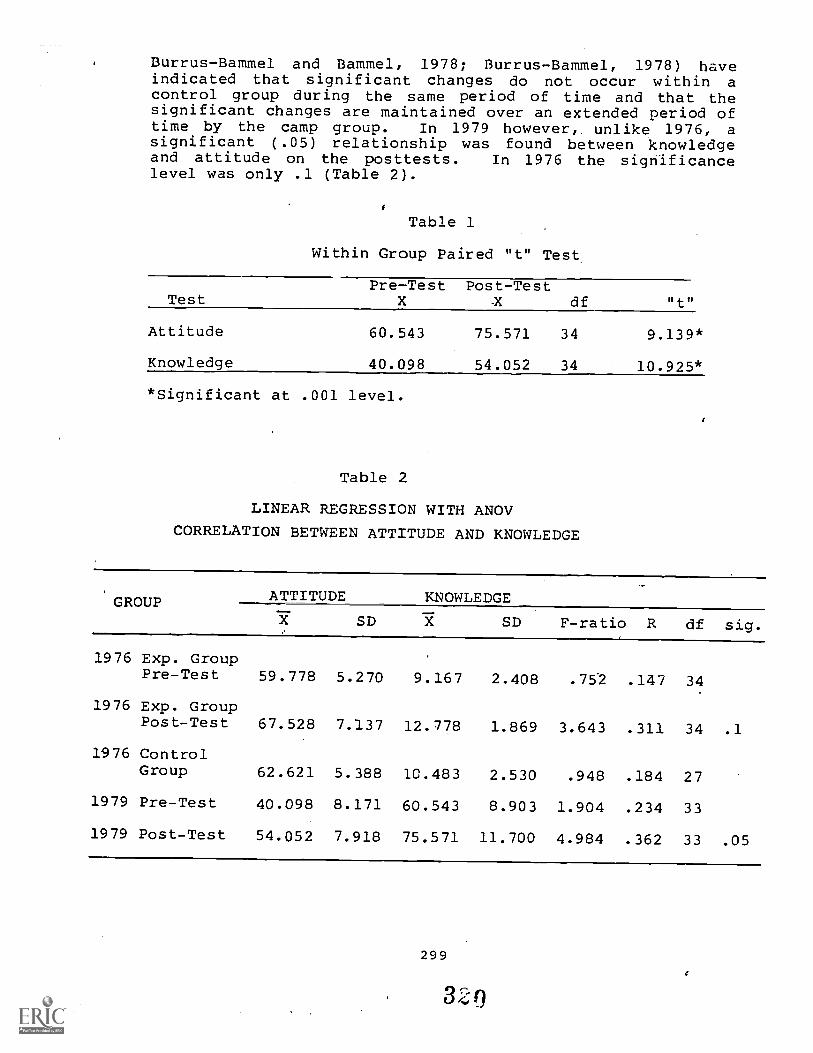
Burrus-Bammel and Bammel, 1978; Burrus-Bammel, 1978) haveindicated that significant changes do not occur within acontrol group during the same period of time and that thesignificant changes are maintained over an extended period oftime by the camp group. In 1979 however, unlike 1976, asignificant (.05) relationship was found between knowledgeand attitude on the posttests. In 1976 the significancelevel was only .1 (Table 2).
Table 1
Within Group Paired "t" Test
TestPre-Test
XPost-Test
-X df "t"
Attitude
Knowledge
60.543
40.098
75.571
54.052
34
34
9.139*
10.925*
*Significant at .001 level.
Table 2
LINEAR REGRESSION WITH ANOV
CORRELATION BETWEEN ATTITUDE AND KNOWLEDGE
GROUP ATTITUDE KNOWLEDGE
X SD X SD F-ratio R df sig.
1976 Exp. GroupPre-Test 59.778 5.270 9.167 2.408 .752 .147 34
1976 Exp. GroupPost-Test 67.528 7.137 12.778 1.869 3.643 .311 34 .1
1976 ControlGroup 62.621 5.388 10.483 2.530 .948 .184 27
1979 Pre-Test 40.098 8.171 60.543 8.903 1.904 .234 33
1979 Post-Test 54.052 7.918 75.571 11.700 4.984 .362 33 .05
299
320
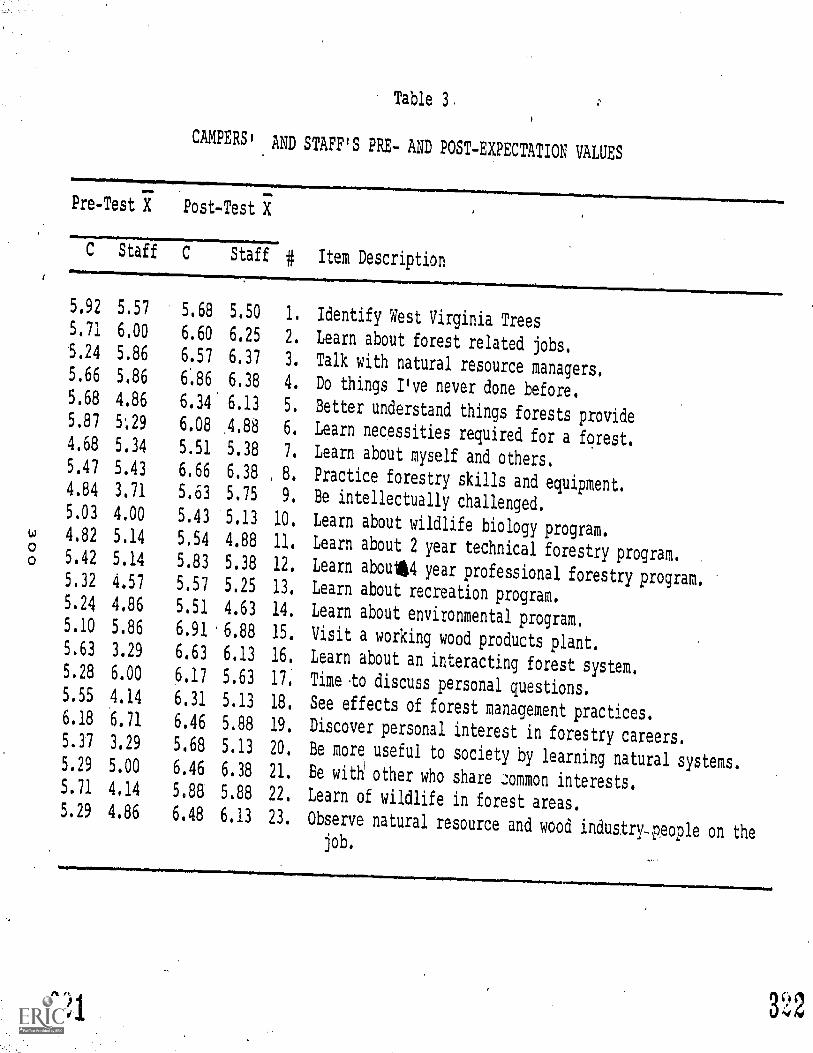
0
Table 3
CAMPERS' AND STAFF'S PRE- AND POST-EXPECTATION VALUES
Pre-Test X Post-Test
# Item DescriptionStaff C Staff
5,92 5.57 5.68 5.50 1. Identify West Virginia Trees5.71 6.00 6.60 6.25 2, Learn about forest related jobs.5.24 5.86 6.57 6.37 3. Talk with natural resource managers,5.66 5.86 6.86 6.38 4. Do things I've never done before.5.68 4.86 6.34 6.13 5. Better understand things forests provide5.87 5..29 6.08 ,4.88 6. Learn necessities required for a forest.4.68 5.34 5.51 5.38 7. Learn about myself and others,5.47 5.43 6.66 6.38 , 8. Practice forestry skills and equipment.4.84 3,71 5.63 5.75 9. Be intellectually challenged.5.03 4.00 5.43 5.13 10. Learn about wildlife biology program.4.82 5.14 5.54 4.88 11. Learn about 2 year technical forestry program.5.42 5.14 5.83 5.38 12. Learn aboulk4 year professional forestry program.5.32 4.57 5.57 5.25 13. Learn about recreation program.5.24 4.86 5.51 4.63 14. Learn about environmental program.5.10 5.86 6.91 .6.88 15. Visit a working wood products plant.5.63 3.29 6.63 6.13 16. Learn about an interacting forest system.5.28 6.00 6.17 5.63 17. Time to discuss personal questions.5.55 4.14 6.31 5.13 18. See effects of forest management practices.6.18 6.71 6.46 5.88 19. Discover personal interest in forestry careers.5.37 3.29 5.68 5.13 20. Be more useful to society by learning natural systems.5.29 5.00 6.46 6.38 21. Be with other who share common interests.5.71 4.14 5.88 5.88 22. Learn of wildlife in forest areas.5.29 4.86 6.48 6.13 23. Observe natural resource and wood industrHeople on the
job.
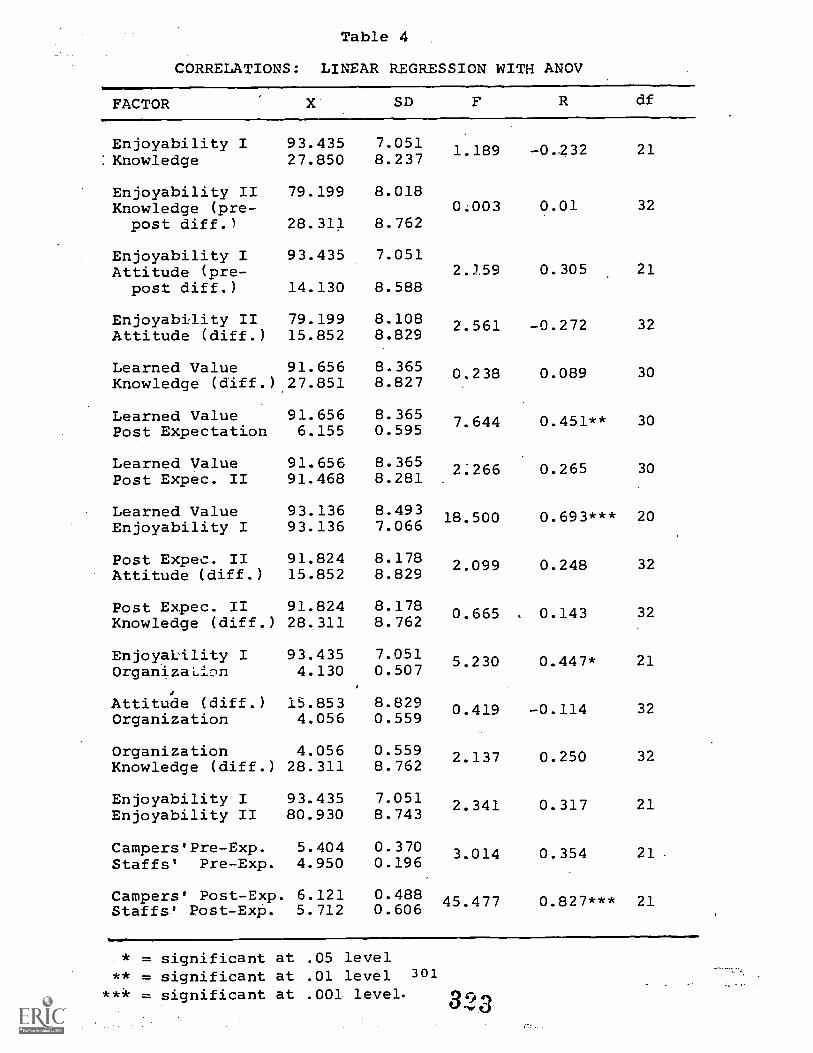
Table 4
CORRELATIONS: LINEAR REGRESSION WITH ANOV
FACTOR X SD
Enjoyability I 93.435 7.051:Knowledge 27.850 8.237
Enjoyability II 79.199 8.018Knowledge (pre-post diff.) 28.311 8.762
Enjoyability I 93.435 7.051Attitude (pre-
post diff.) 14.130 8.588
Enjoyability II 79.199 8.108Attitude (diff.) 15.852 8.829
Learned Value 91.656 8.365Knowledge (cliff.) 27.851 8.827
Learned Value 91.656 8.365Post Expectation 6.155 0.595
Learned ValuePost Expec. II
Learned ValueEnjoyability I
91.65691.468
93.13693.136
8.3658.281
8.4937.066
Post Expec. II 91.824 8.178Attitude (diff.) 15.852 8.829
Post Expec. II 91.824Knowledge (diff.) 28.311
Enjoyability I 93.435Organization 4.130
8.1788.762
7.0510.507
Attitude (diff.) 15.853 8.829Organization 4.056 0.559
Organization 4.056 0.559Knowledge (cliff.) 28.311 8.762
Enjoyability I 93.435 7.051Enjoyability II 80.930 8.743
Campers'Pre-Exp. 5.404 0.370Staffs' Pre-Exp. 4.950 0.196
Campers' Post-Exp. 6.121Staffs' Post-Exp. 5.712
0.4880.606
F R df
1.189 -0.232 21
0.003 0.01 32
2.359 0.305 21
2.561 -0.272 32
0.238 0.089 30
7.644 0.451** 30
2.266 0.265 30
18.500 0.693*** 20
2.099 0.248 32
0.665 . 0.143 32
5.230 0.447* 21
0.419 -0.114 32
2.137 0.250 32
2.341 0.317 21
3.014 0.354 21
45.477 0.827*** 21
* = significant at
** = significant at1010 = significant at
.05 level
.01 level 301
.001 level.
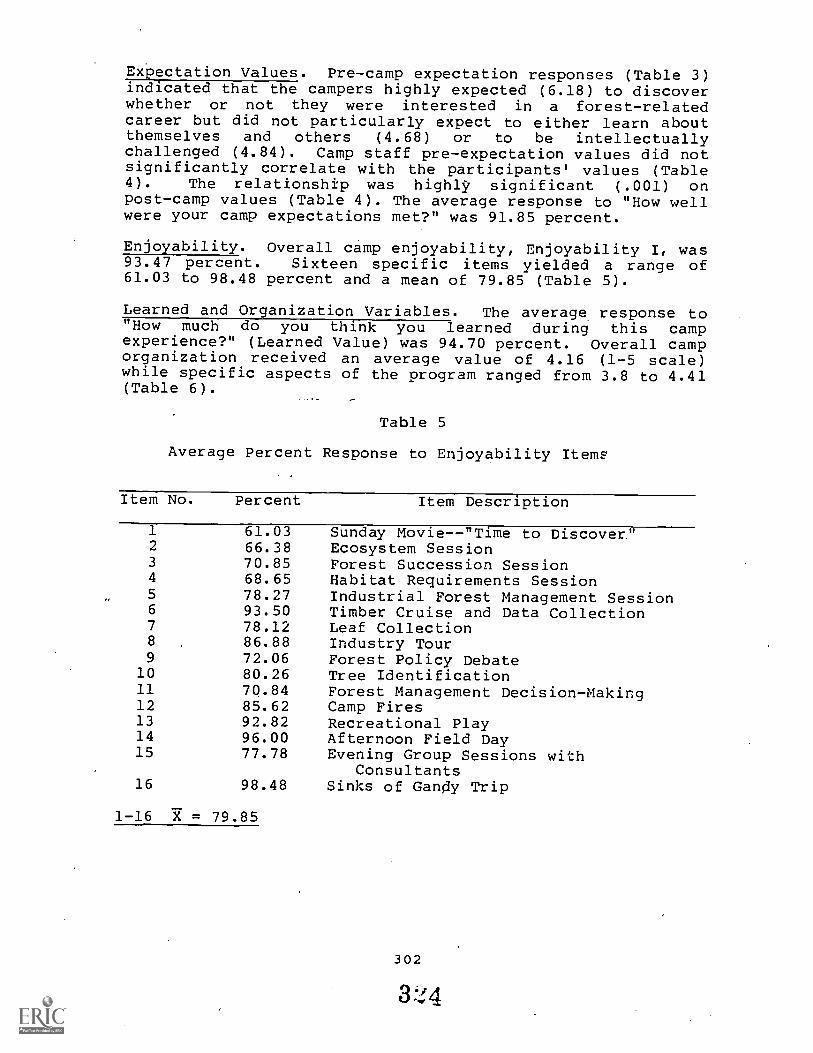
Expectation Values. Pre-camp expectation responses (Table 3)indicated that the campers highly expected (6.18) to discoverwhether or not they were interested in a forest-relatedcareer but did not particularly expect to either learn aboutthemselves and others (4.68) or to be intellectuallychallenged (4.84). Camp staff pre-expectation values did notsignificantly correlate with the participants' values (Table4). The relationship was highlS, significant (.001) onpost-camp values (Table 4). The average response to "How wellwere your camp expectations met?" was 91.85 percent.
Enjoyability. Overall camp enjoyability, Enjoyability I, was93.47 percent. Sixteen specific items yielded a range of61.03 to 98.48 percent and a mean of 79.85 (Table 5).
Learned and Organization Variables. The average response to"How much do you think you learned during this campexperience?" (Learned Value) was 94.70 percent. Overall camporganization received an average value of 4.16 (1-5 scale)while specific aspects of the program ranged from 3.8 to 4.41(Table 6).
Table 5
Average Percent Response to Enjoyability Items
Item No. Percent Item Description
1
2
3
4
5
61.0366.3870.8568.6578.27
Sunday Movie--"Time to Discover"Ecosystem SessionForest Succession SessionHabitat Requirements SessionIndustrial Forest Management Session
6 93.50 Timber Cruise and Data Collection7 78.12 Leaf Collection8 , 86.88 Industry Tour9 72.06 Forest Policy Debate
10 80.26 Tree Identification11 70.84 Forest Management Decision-Making12 85.62 Camp Fires13 92.82 Recreational Play14 96.00 Afternoon Field Day15 77.78 Evening Group Sessions with
Consultants16 98.48 Sinks of Gandy Trip
1-16 X = 79.85
302
3 '14
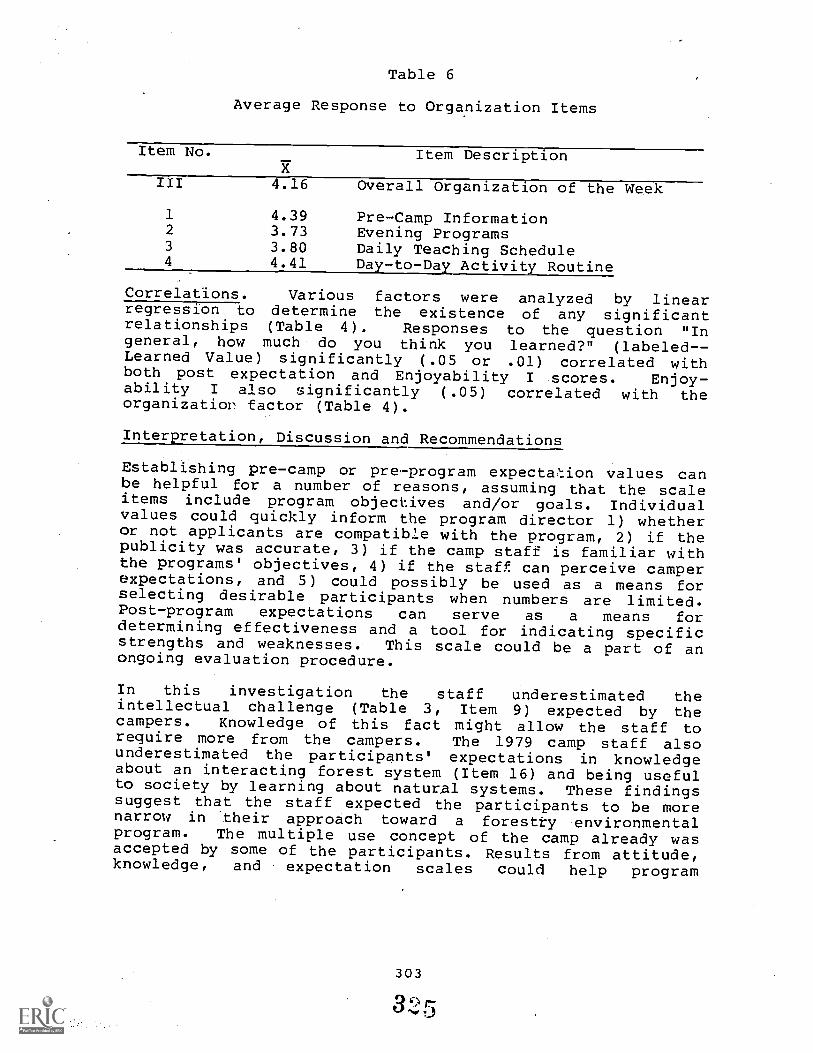
Table 6
Average Response to Organization Items
Item No. Item Description
III 4.16 Overall Organization of the Week
1 4.39 Pre-Camp Information2 3.73 Evening Programs3 3.80 Daily Teaching Schedule4 4.41 Day-to-Day Activity Routine
Correlations. Various factors were analyzed by linearregression to determine the existence of any significantrelationships (Table 4). Responses to the question "Ingeneral, how much do you think you learned?" (labeled- -Learned Value) significantly (.05 or .01) correlated withboth post expectation and Enjoyability I scores. Enjoy-ability I also significantly (.05) correlated with theorganization factor (Table 4).
Interpretation, Discussion and Recommendations
Establishing pre-camp or pre program expectation values canbe helpful for a number of reasons, assuming that the scaleitems include program objectives and/or goals. Individualvalues could quickly inform the program director 1) whetheror not applicants are compatible with the program, 2) if thepublicity was accurate, 3) if the camp staff is familiar withthe programs' objectives, 4) if the staff can perceive camperexpectations, and 5) could possibly be used as a means forselecting desirable participants when numbers are limited.Post-program expectations can serve as a means fordetermining effectiveness and a tool for indicating specificstrengths and weaknesses. This scale could be a part of anongoing evaluation procedure.
In this investigation the staff underestimated theintellectual challenge (Table 3, Item 9) expected by thecampers. Knowledge of this fact might allow the staff torequire more from the campers. The 1979 camp staff alsounderestimated the participants' expectations in knowledgeabout an interacting forest system (Item 16) and being usefulto society by learning about natural systems. These findingssuggest that the staff expected the participants to be morenarrow in 'their approach toward a forestry environmentalprogram. The multiple use concept of the camp already wasaccepted by some of the participants. Results from attitude,knowledge, and expectation scales could help program
directors estimate the correct beginning level instead ofbeing over or under the participants' ,abilities andexpectations. Inappropriate expectations could be correctedbefore the program.
The two enjoyability factors indicated that camp experienceis' more than the sum of specific activities; the overallenjoyability factor (93.47) was much nigher than most of thespecific activities (average = 79.85). Campers most enjoyed(Table 5) the underground cave trip--Sinks of Gandy, theforestry skills field day, timber cruise, and recreationalplay. These most popular activities were physical in nature,required active participation, were novel, plus mentallychallenging. The least popular activity was a movie whichwas shown on the first night. One does need to be carefulwhen interpreting enjoyability or any set of data. Why wasthe movie lower than other activities? Was it the filmitself or was it a matter of when it was shown? That firstevening campers might have been too excited to sit still, theroom acoustics might have prevented understanding, thebenches might have been too uncomfortable for that long of astretch, etc. It was decided, at a fall staff meeting, thatbased upon these results, more active participation would bebuilt into certain teaching units and that the first night'sprogram would be made shorter.
Organization values (Table 6) indicated that the rather longevening programs might be restructured. Organization wassignificantly (.05) ,correlated to enjoyability. This mightmean that young campers need and want structure in order tohave a good time and to learn. Responses to "How much didyou learn from the camp experience?" (average = 93.136) wassignificantly correlated (.001) to Enjoyability I (Table 4).
REFERENCES
Bammel, LeljJane and Gene Bammel. 1977. "The Relationshipbetween Experiential Learning, Perception, and Infor-mation Processing." Current Issues in EnvironmentalEducation -III, Robert Marlett (ed.). NationalAssociation for Environmental Education, ERIC/SMEAC,197-210.
Bammel, Lei Lane and Gene Bammel. 1979. "The Use ofPsychophysical Scales in Environmental EducationResearch." Current Issues V: Yearbook of EnvironmentalEducation and Environmental Studies, Craig B. Davisand Arthur Sacks (eds.). National Association forEnvironmental Education, ERIC/SMEAC, 129-135.
304
3 6
Burrus-Bammel, Lei Lane. 1978. "Information's Effect onAttitude: A Longitudinal Study." The Journal ofEnvironmental Education 9(4): 41-50.
'Burrus-Bammel, Lei Lane; Gene Bammel; and William E. Kidd.1979. "Can Foresters Effect Attitudinal Change."West Virginia Forestry Notes 7: 13-16.
Burrus-Bammel, Lei Lane and Marlene Hanson. 1978."Puppetry and Environmental Education: A RetentionStudy." Current Issues in Environmental Education-IV, Craig B. Davis and Arthur Sacks (eds.). NationalAssociation for Environmental Education, ERIC/SMEAC,169-174.
Kidd, William E.; Lei Lane Burrus-Bammel; and Gene Bammel.1978. "Evaluation of One Environmental EducationProgram." The Journal of Environmental Education10(1): 12-15.
Rokeach, Milton. 1975. Beliefs, Attitudes, and Values.San Francisco: Jossey-Bass Publishers.
305
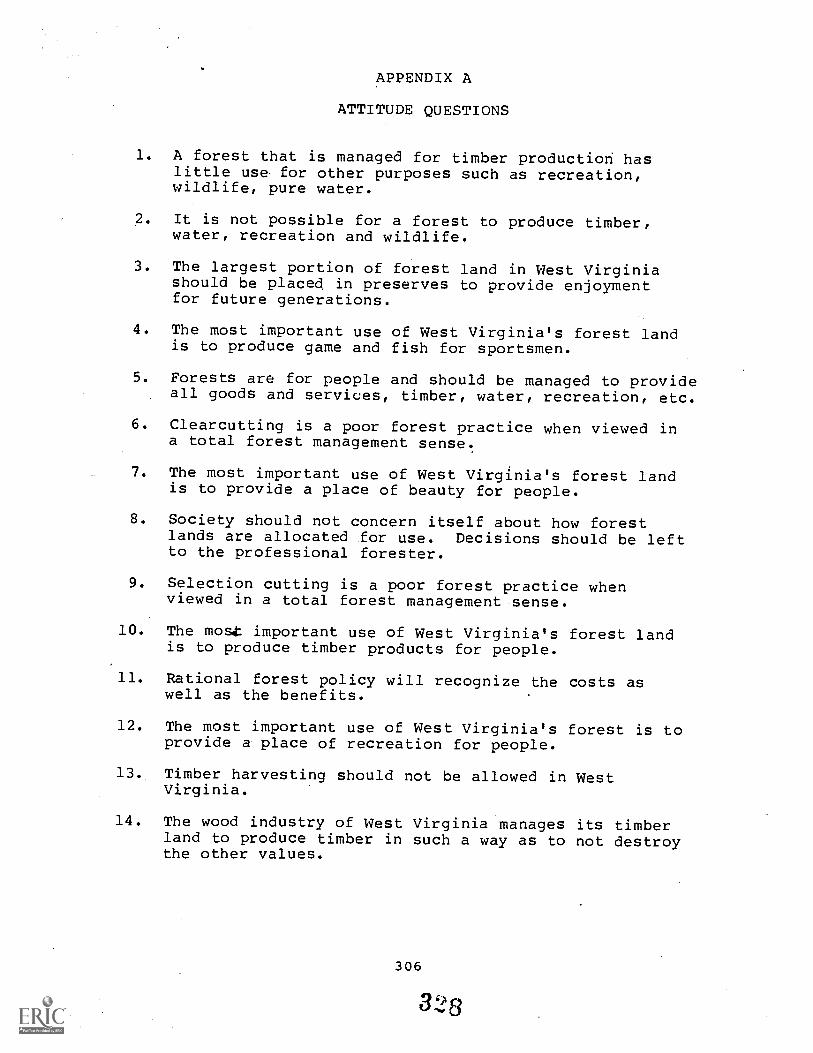
APPENDIX A
ATTITUDE QUESTIONS
1. A forest that is managed for timber productioh haslittle use for other purposes such as recreation,wildlife, pure water.
2. It is not possible for a forest to produce timber,water, recreation and wildlife.
3. The largest portion of forest land in West Virginiashould be placed in preserves to provide enjoymentfor future generations.
4. The most important use of West Virginia's forest landis to produce game and fish for sportsmen.
5. Forests are for people and should be managed to provideall goods and services, timber, water, recreation, etc.
6. Clearcutting is a poor forest practice when viewed ina total forest management sense.
7. The most important use of West Virginia's forest landis to provide a place of beauty for people.
8. Society should not concern itself about how forestlands are allocated for use. Decisions should be leftto the professional forester.
9. Selection cutting is a poor forest practice whenviewed in a total forest management sense.
10. The most important use of West Virginia's forest landis to produce timber products for people.
11. Rational forest policy will recognize the costs aswell as the benefits.
12. The most important use of West Virginia's forest is toprovide a place of recreation for people.
13. Timber harvesting should not be allowed in WestVirginia.
14. The wood industry of West Virginia manages its timberland to produce timber in such a way as to not destroythe other values.
306
328
15. Timber harvesting should be allowed on forested landsthat are managed for that purpose.
16. The most important use of West Virginia's forest landis to provide all goods and services normally avail-able from forest land.,
APPENDIX B
CONCEPTUAL AND FACTUAL KNOWLEDGE QUESTIONS
1. A windstorm blows down trees on several acres of forestland. No changes will occur in. the forest since treeswere the only part destroyed.
2. Water, sunlight and soil are all necessary ingredientsto the growth and development of forest plants but playonly a minor role in producing adequate numbers ofhawks, bobcats and other such animals.
3. Soil is a nonliving part of the forest ecosystem.
4. One effect of cutting trees on the stream ecosystem isto increase the quality of soil material that itcarries.
5. Insects and other micro organisms that occur in theforest ecosystem are a menace to its existence.
6. Natural systemslare separate and apart from social,political and economic systems. That is, there isno relationship of one to the other.
7. West Virginia's forest industry plays a major role inmaking forest management possible in many privately-owned woodlots.
8. Soils, elevation, moisture, temperature and compassdirection have little effect on the kinds of trees,plants and animals that occur on that site.
9. Inventorying the forest includes recording of: treeand other plant species, quality of site relative totree growth, topographic features and man-madestructures, etc.
10. Properly located and constructed logging roads willreduce the quantity of soil material in forest streams.
307
329
11. The most desirable habitat for the white-tailed deerand ruffed grouse is greated by heavy selection harvestcuts or clearcuts.
12- Knowledge about the forest resource and its relation-ship to the other aspects of oir life is necessarybefore good forest policy can be developed.
13. In West Virginia it is usually necessary to replantwith seedlings after timber has been harvested.
14. Forest fires that burn along the surface of the forestfloor do not damage the larger trees.
15. An increment borer is a forest insect pest that occursin West Virginia.
16. The best habitat for ruffed Grouse is: a) meadows andold fields, b) open mature woodland, c) thick growth,d) open pole stands, e) don't know.
17: The major factor in harvesting trees that contributeto increased levels of soil material in forest streamsin: a) marking timber, b) cutting trees, c) don'tknow, d) aforestation, e) road building.
18. Clearings in Eastern Hardwood fore.sts are most likelyto be occupied by tree species that are: a) tolerant,b) climax, c) microcosmic, d) intolerant, e) don't know.
19. Basswood prefers a site that is: a) wet/soggy, b) dry/rocky, c) moist/well-drained, d) damp/moderately dry,e) don't know.
20. The major source of food for all forest animals isthe sun.
21. Quality of forest streams is affected by: a) fellingtrees, b) bucking trees, c) limbing trees, d)skidding trees, e) don't know.
22. Hawks and bobcats are second-level consumers.
23. Chestnut oak prefers a site that is: a) dry/rocky,b) on a north slope, c) down next to a stream, d)don't know.
24. Intermediate harvests are possible only when a) growthexceeds mortality, b.) markets are available, c) thestand is too thick, d) don't know.
25. The major component of a white-tailed deer's diet is:a) grass, b) insects, c) mast, d) browse, e) don't know.
308'
3c3n
APPENDIX C
PRE-CAMP EXPECTATIONS
I EXPECT TO:
1. learn how to identify the trees common to WestVirginia.
2. find out about possible forest-related jobs.3. be able to talk with natural resource managers
(foresters, wildlife biologists, park managers, woodindustry people).
,4. do things that I have never done before.5. better understand and appreciate the various things
(wood products, recreation, etc.) that a forestprovides.
6. learn which skills and knowledges are necessary fora forest-related career.
7. learn more about others and myself.8. get a chance to practice forestry skills and use
forestry equipment.9. be intellectually challenged.
discover the necessary requirements to enter thefollowing five programs:
10. a wildlife biologist program.11. a 2-year technical forestry program.12. a 4-year professional forestry prograL13. a recreation (wildlands administration, inter-
, pretation, etc.) program.14. an Environmental Studies (conservation, etc.)
program.
15. visit a working wood product manufacturing plant.16. learn how a natural forest system (trees, wildlife,
etc.) functions as an interacting system.17. have some time to discuss questions and/or ideas that
I have.18. see the effects that various management practices
have had on a forest.19. discover if I'm interested in a forest-related career.20. be more useful to society by learning about natural
systems.21. be with other people that share a common interest.22. find out about the wildlife that exists in forest
areas.23. see natural resource managers (foresters, wildlife
biologists, ctc.) and wood industry peopliz workingon the job.
309
331
APPENDIX D
POST-CAMP EXPECTATIONS
WHILE AT CAMP I:
1. learned how to identify the trees common to WestVirginia.
2. found out about possible forest-related jobs.3. was able to talk with natural resource managers
(foresters, wildlife biologists, park managers, woodindustry people).
4. did things that I have never done before.5. better understood and appreciated the various things
(wood products, recreation, etc.) that a forestprovides.
6. learned which skills and knowledges were necessaryfor a forest-related career.
7. learned more about others and myself.8. got 4 chance to practice forestry skills and use
forestry equipment.9. was intellectually challenged.
discovered the necessary requirements to entet
10. a wildlife biologist program.11. 'a 2-year technical forestry program.12. a 4-year professional forestry program.13. a recreation (wildlands administration, inter-
pretation, etc.) program.14. an Environmental Studies (conservation, etc.)
program.
15. visited a working wood product manufacturing plant.16. earned how a natural forest system (trees, wildlife,
etc.) functions as an interacting system.17. had some time to discuss questions and/or ideas I had.18. zaw the effects that various management practices
have had on a forest.19. discovered if I was interested in a forest-related
career.20. felt more useful to society by learning about natural
systems.21. was with other people that shared a common interest.22. found out about the wildlife that exists in forest
areas.23. saw natural resource managers (foresters, wildlife
biologists, etc.) and wood industry people workingon the job.
A LONGITUDINAL STUDY OF FACTORS INFLUENCING VALUEPREFERENCE IN ENVIRONMENTAL PROBLEMS
Samuel J. Alaimo" and Rodney L. Doran2
Abstract. One hundred eight junior high students partici-pated in a two-year longitudinal study using an environ-mental inventory. Factors that might potentially influenceenvironmental value preferences as well as other self-perceived factors (concern, locus of control, knowledge, andsources of environmental information) were investigated. Nosignificant difference, between pre and post tests, was foundfor most items.
Introduction
Today's students live in a world dominated by crises, many ofwhich are related to environmental problems. Few students,however, are aware that, in part, these crises are the resultof technological development and human behavior.
Many of the crises faced today involve an environmentalproblem that relates to values. Flitter (1976:6-7) statedthat "We need to realize that our environmental problems arerooted ultimately in bur human attitudes and values."According to Swan (1971:116) "The root cause of theenvironmental crises is not population growth, nor oureconomic and political system, but human attitudes and valueswhich motivate human decisions."
In recent years, more and more environmental educationprograms which relate to values and the environment are beingintroduced into schools. Shaver (1972) believes that theschool's role is to help students develop a clear conceptionof what their commitments are and to relate these commitmentsto the basic values of society. Sta.o (1971), in accord withShaver, advocated that students exploring both the cognitiveand affective domains regarding relationships andresponsibility within human ecosystems.
'Science Teacher, Hoovet Junior High School, KenmoreTonawanda Public Schools, Kenmore, NY 14217.
'Science Educator, Department of Instruction, Faculty ofEducational Studies, State University of New York atBuffalo, Amherst, NY 14260.
311
33
Education might be an important way to he3p solveenvironmental problems by developing attitudes and values inchildren so they may become knowledgeable, concerned, andactive citizens. Environmental education, according to Miles(19/8), should have a value-oriented goal that ischaracterized by an ecological justice. Steffenson (1975)noted that effective environmental education must enablestudents to think, to act, and to seek new valueorientations. He stated that "students need help inverbalizing values so they can at least be examined...andcompared, so other alternatives can be explored" (Steffenson,1975:9).
If environmental education is to have affective objectives,it is essential that there be ways to measure the outcome ofthese objectives. Doran (1977) and Wheatley (1974) concurredthat the instruments available tended to be global measures,e.g., environmental attitude surveys and environmentalopinion scales. Both authors refer to the difficult task ofmeasuring attitudes, beliefs, and values with respect toenvironmental education.
According to Sarnowski (1975), "the measure of values isessential for teaching environmental topics laden with valuequestions and issues." Furthermore, Sarnowski noted that"the information obtained from the measurement of values willenable educators to make curricular and methodologicaldecisions for their environmental education programs"(Sarnowski, 1975:9).
It appears that environmental problems are related to humanvalues. The role of the school in teaching environmentaleducation programs is an important one. To date, mostprograms are concerned with cognitive objectives.Consequently, there is a need for more affective environ-mental education programs. Incorporating such objectivesinto school programs create;,, in turn, a need for valid andeffective ways of assessing affective outcomes of students.
The word "value" has no universal definition. In thisresearch, the definition of "values" formulated by Adler(1956) et al. will be used. Adler contended that values werepreferences held by people whether learned or innate, orboth. Robinson and Shaver (1971) commented that values are"...not directly accessible to observation." Instead,values can be inferred from verbal statements and activebehaviors. In addition, they are useful in predicting stillother observable and measurable verbal and nonverbal behavior(Robinson and Shaver, 1971:408).
312
Review of Literature
To date, few studies (Gardner and Kleinke, 1972; Iozzi, 1978)have attempted to measure environmental value preferences ofjunior and senior high school students. However, some studieshave attempted to measure values of teachers and collegestudents on environmental issues.
Fazio and Dunlop (1976) developed an Environmental ChemistryValue Preference instrument (ECVP). According to theauthors, the ECVP is a %,alid, reliable, and reasonablyefficient way of assessing the value preference of collegescience majors, nonscience majors and chemistry teachers withrespect to the chemical basis of some of our environmentalproblems. Three value preferences were used--humanistic,theoretical, and technological. The authors found that thehighest theoretical value preferences were recorded byscience majors. The nonscience major groups had higherhumanistic value preferences. There was no significantdifference between science majors and nonscience majors intheir technology value scores. No significant difference wasreported between chemistry majors and chemistry teachers.
Lunneborg and Lunneborg (1972) investigated the effects ofenvironmental information on 25 teachers participating in aworkshop as compared to a control group of 22 teachers. Amongthe tests administered to both groups was Allport-Vernon-Lindsey's (1960) Study of Values. This instrumentmeasured the following six values: theoretical, economic,aesthetic, social, political, and religious. Both groups hadnearly identical value profiles on the pre-test. After theworkshop, a dramatic increase in the social score was noted,while economic and theoretical scores were lower,
Arbuthnot (1977) investigated 85 recyclers, 60 people from aconservative church and 60 students in a social psychologyclass. These three groups demonstrated divergent values,i!Iterests, attitudes, experience, and personality traits.'Arbuthnot, using environmental attitude and personalitytraits in order to predict environmental behavior andknowledge, discovered that recyclers were more likely tobelong to ecology groups and obtain information aboutenvirolliental issues from sources requiring high personaleffort as compared to the other groups. The recycler groupwas less bound to past ways of believing and acting, i.e.,they have a greater belief in their own ability to exercisecontrol over events in their own lives.
Sarnowski (1975) measured environmental values of ninththrough twelfth. grade students with the Environmental ValuesInventory (EVI) which he developed and validated. Hehypothesized that general values as measured by Allport,Vernon, Lindsey's (1970) Study of Values instrument were
313
3t:IZkrt.,
similar to environmental values as measured by. the EVI. Theresults supported his hypothesis. This support was based onsimilarity of relationships found between the two instrumentsand the variables: sex, age and geographic residence. Thesesimilarities were used to support the construct validity ofthe EVI. Both of the aforementioned instruments were basedon Spranger's (1928) system for categorizing values:aesthetic, economic, political, religious, social andtheoretical.
Spranger recognized that individuals have a different orderof preference of these value categories depending on theirlife experiences. Similarly, Sikula asserted thatindividuals may possess the same values but differ in thepriorities they assign to them. "Value systems are merelypriority patterns of values or a ranking of values along witha continuum of importance" (Sikula, 1971:282).
According to Spranger, variations in values are due to
differences in the "inner" and "outer" situations of life.The "outer" or external experiences include situations in
which one interacts with family, friends, church, schobl, andjob. "Inner" or internal situations are the result ofexperiences unique and innate to an individual. Thesesituations'can include, in part, an individual's concern,knowledge, perception (locus of control), beliefs, and
attitudes.
The variety of experiences or situations one encounters inlife can be portrayed as the totality of these "inner" and"outer" situations. Since value preferences are dependent onvarious situations of life, one can hypothesize that "inner"and "outer" experiences can have an influence on values.
Data Collection and Analysis
This study investigated selected factors that potentiallyinfluence the environmental values of junior high students.The Environmental Inventory (EI) instrument was developedafter modification of the EVI (Appendix). Among thesemodifications were 1) reduction of reading demands andcomprehension level, 2) use of 35 mm colored slides to depictthe environmental problems and the accompanying occurrence,and 3) reduction in the number of items so as to eliminatefatigue.
The EI measures students' self-perceived 1) concern aboutproblems in the environment, 2) the chances of solvingenvironmental problems and personally helping to solve ourenvironmental problems (locus of control), 3) knowledge aboutenvironmental problems, and 4) source of environmentalinformation. In addition, student:,' environmental valuepreferences were ascertained by asking them to respond to
314
environmental problems and their occurrences (using slides)and to select one of five value-oriented solutions for eachproblem.
The content validity of the EI was supported by the resultsof the following procedures. Two reading specialistsexamined the inventory and concluded' that it could be usedeffectively at the seventh grade. Several groups of theseventh and eighth grade students (different from the study'ssample) viewed the slides and read the environmental problemstatements. They perceived that these problems were"realistic" environmental problems and that the slides andstatements were related. When asked to "group into similarpiles" the action/response statements for all ten items,there was 86 percent agreement with the value categories thatthe statements were written to represent. A similarclassification task' was presented to a group of 16environmental educators with a resulting 95 percent agreementof items to appropriate value category. Based on thesefindings, it was concluded that the EI was "content valid."
Subject Selection
The subjects investigated in this research attend one of thelargest suburban school districts in western New York. Theycome from a predominantly residential community ofapproximately 120,000 people who are primarily Caucasian andrepresent a wide ethnic background.
Data were collected from one centrally located junior highschool during the third week in September, 1977 and duringthe fourth week in October, 1979. Longitudinal data wascollected from 108 students, once while they were in theseventh grade and two years later when they were in the ninthgrade. Experimental mortality claimed 37 of the original 145students, a loss of 25 percent.
The investigator administered the inventory and question-naire to the students to standardize the data collectionprocedure. Data were collected while students were attendinga regularly scheduled 40-minute science class. Answer sheetswere machine scored.
The existence of a significant difference on the EI betweenthe same students in seventh and ninth grade was determinedby using a two-tailed test on the pre-post data. Thisstatistic is used to -indicate whether there is a timedifference between two group means; the treatment in thisresearch involves two years of schooling.
All analyses were computed by using Statistical Package forthe Social Sciences (SPSS) at the State University of NewYork at Buffalo computer center. Statistical data wereconsidered significant at the .05 level.
315
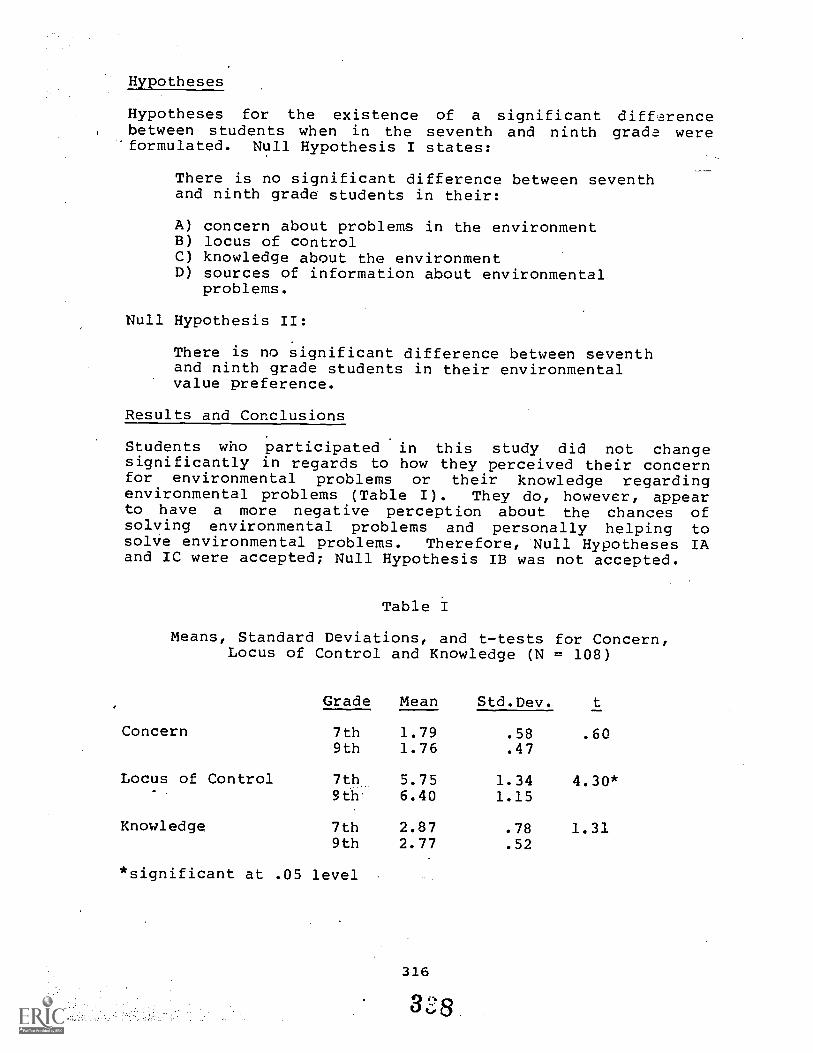
Hypotheses
Hypotheses for the existence of a significant differencebetween students when in the seventh and ninth grade were
'formulated. Null Hypothesis I states:
There is no significant difference between seventhand ninth grade students in their:
A) concern about problems in the environmentB) locus of controlC) knowledge about the environmentD) sources of information about environmental
problems.
Null Hypothesis II:
There is no significant difference between seventhand ninth grade students in their environmentalvalue preference.
Results and Conclusions
Students who participated in this study did not changesignificantly in regards to how they perceived their concernfor environmental problems or their knowledge regardingenvironmental problems (Table I). They do, however, appearto have a more negative perception about the chances ofsolving environmental problems and personally helping tosolve environmental problems. Therefore, Null Hypotheses IAand IC were accepted; Null Hypothesis IB was not accepted.
Table I
Means, Standard Deviations, and t-tests for Concern,Locus of Control and Knowledge (N = 108)
Grade Mean Std.Dev.
Concern 7th 1.79 .58 .609th 1.76 .47
Locus of Control 7th 5.75 1.34 4.30*9th' 6.40 1.15
Knowledge 7th 2.87 .78 1.319th 2.77 .52
*significant at .05 level
316
3 8
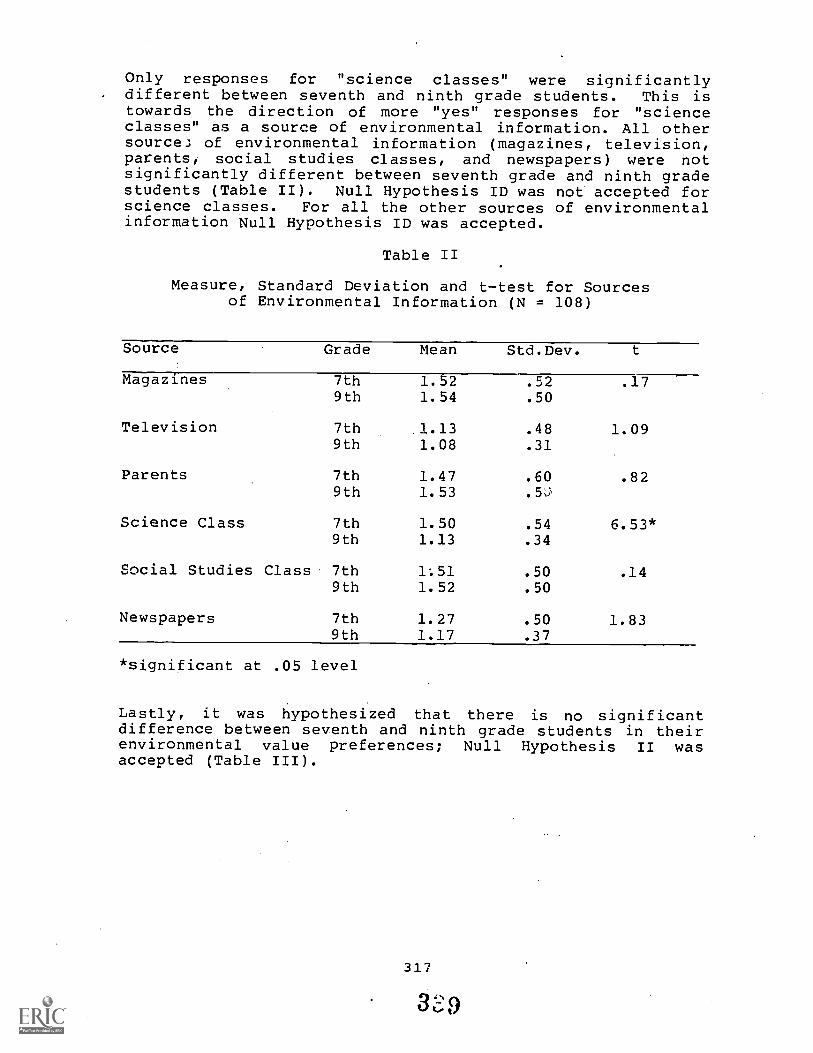
Only responses for "science classes" were significantlydifferent between seventh and ninth grade students. This istowards the direction of more "yes" responses for "scienceclasses" as a source of environmental information. All othersource; of environmental information (magazines, television,parents, social studies classes, and newspapers) were notsignificantly different between seventh grade and ninth gradestudents (Table II). Null Hypothesis ID was not accepted forscience classes. For all the other sources of environmentalinformation Null Hypothesis ID was accepted.
Table II
Measure, Standard Deviation and ttest for Sourcesof Environmental Information (N = 108)
Source Grade Mean Std.Dev.
Magazines 7th 1.52 .52 .179th 1.54 .50
Television 7th 1.13 .48 1.099th 1.08 .31
Parents 7th 1.47 .60 .829th 1.53 .5,
Science Class 7th 1.50 .54 6.53*9th 1.13 .34
Social Studies Class 7th 1:51 .50 .149th 1.52 .50
Newspapers 7th 1.27 .50 1.839th 1.17 .37
*significant at .05 level
Lastly, it was hypothesized that there is no significantdifference between seventh and ninth grade students in theirenvironmental value preferences; Null Hypothesis II wasaccepted (Table III).
317
3 9
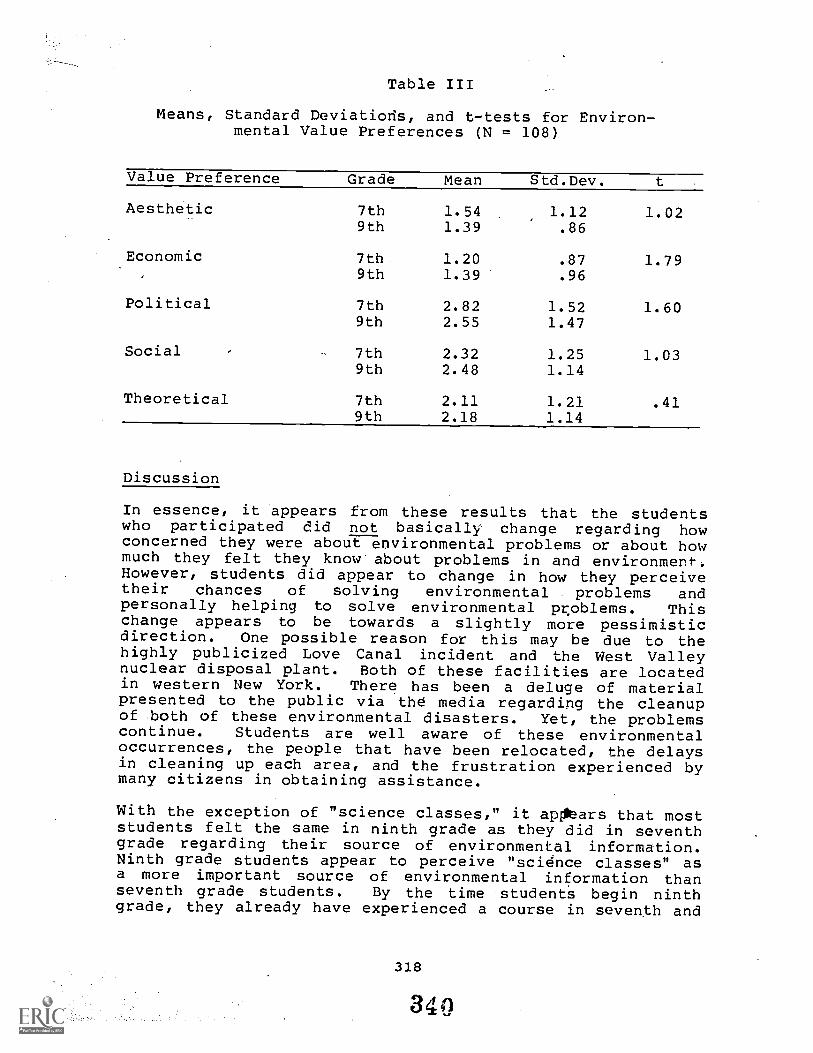
Table III
Means, Standard Deviatiods, and t-tests for Environ-mental Value Preferences (N = 108)
Value Preference Grade Mean Std.Dev. t
Aesthetic 7th 1.54 1.12 1.029th 1.39 .86
Economic 7th 1.20 .87 1.799th 1.39' .96
Political 7th 2.82 1.52 1.609th 2.55 1.47
Social 7th 2.32 1.25 1.039th 2.48 1.14
Theoretical 7th 2.11 1.21 .419th 2.18 1.14
Discussion
In essence, it appears from these results that the studentswho participated did not basically change regarding howconcerned they were about environmental problems or about howmuch they felt they know about problems in and environment.However, students did appear to change in how they perceivetheir chances of solving environmental problems andpersonally helping to solve environmental pr.oblems. Thischange appears to be towards a slightly more pessimisticdirection. One possible reason for this may be due to thehighly publicized Love Canal incident and the West Valleynuclear disposal plant. Both of these facilities are locatedin western New York. There has been a deluge of materialpresented to the public via the media regarding the cleanupof both of these environmental disasters. Yet, the problemscontinue. Students are well aware of these environmentaloccurrences, the people that have been relocated, the delaysin cleaning up each area, and the frustration experienced bymany citizens in obtaining assistance.
With the exception of "science classes," it appears that moststudents felt the same in ninth grade as they did in seventhgrade regarding their source of environmental information.Ninth grade students appear to perceive "science classes" asa more important source of environmental information thanseventh grade students. By the time students begin ninthgrade, they already have experienced a course in seventh and
318
340
eighth grade science. Many topics concerningenvironmental/ecological events are often discussed inscience classes, especially in eighth grade where a five-weekunit is part of the curriculum. The greater number of "yes"responses by ninth' grade students for "science classes"underscores the value of the teacher's role as a source ofenvironmental info5Aation. It appears from thisinvestigation that schools can perform an important role incommunicating environmental information.
The results concerning the lack of a significant change invalue preferences (aesthetic, economic, social, political,and theoretical) between the same students in seventh gradeand later in ninth grade was surprising. According to thiinvestigation, students' environmental value preferences wereestablished during the elementary school years. Collectionof data sometime during the primary years may reveal justwhen this occurs. Furthermore, it would be of interest toascertain whether any changes will have occurred in theenvironmental value preferences of the same students by thetwelfth grade. Many unanswered questions pose interestingpossibilities for further research.
REFERENCES
Adler, F. 1956. The Value Concept in Sociology. AmericanJournal of Sociolou 62: 272-279.
Allport, G. W.; P. E. Vernon; and G. Lindsey. 1970.Manual--Study of Values. New York: Houghton MifflinCompany.
Arbuthnot, J. 1977. The Role of Attitudes and PersonalityVariables in the Prediction of Environmental Behaviorand Knowledge. Journal of Environmental Behavior9(2): 217-231.
Doran, R. 1977. Review of Selected Instruments thatMeasure Environm, tal Education Outcomes, in Robert H.NcCabe (ed.), CutLent Issues in Environmental Education-III. The National Association for EnvironmentalEducation, Columbus, ERIC/SMEAC, November.
Fazio, Frank and Dave Dunlop. 1976. Value Preferencesof College. Students with Reference to EnvironmentalChemistry. Journal of Environmental Chemistry 8(1):26-31, Fall.
Flitter, M. J. 1976. A Value Certification Model forPlanning Adult Environmental Education Programs.Fifth Annual Conference of the National Associationfor Environmental Education, Atlanta, GA, April, 6-8.
319
311
Gardner, Eric F. and David J. Kleinke. 1972. SyracuseEnvironmental Awareness Tests--Level III--FinalReport on Construction and Norming. Syracuse, NY:Syracuse University, 13210.
Iozzi, Louis A. 1978. The Environmental Issue Test (EIT):A New Assessment Technique for Environmental Educa-tion. Paper presented at the National AsSociationfor Environmental Education Conference, Chicago, IL,May.
Lunneborg, Patricia and Clifford Lunneborg. 1972. Effectsof Environmental Information on Teacher Values.Journal of Environmental Education 4(2): 48-50,Winter.
Miles, J. C. 1978. The Study of Values in EnvironmentalEducation. Journal of Environmental Education9(2): 5-17, Winter.
Robinson, J. P. and J. P. Shaver. 1971. Measures ofSocial Psychological Attitudes. Institute for SocialResearch, the University of Michigan, Ann Arbor, MI.
Sarnowski, A. A. 1975. The Development of a Techniquefor the Measurement of Values as Applied to Environ-mental Problems. Unpublished doctoral dissertation,State University of New York at Buffalo.
Shaver, J. P. 1972. Environmentalism and Values. TheJournal of Environmental Education 4(1): 49-53, Fall.
Spranger, E. 1928. Types of Men: The Psychology andEthics of Personality. Translated by Paul J. W.Pigors. New York: Hafner Publishing Company.
Stapp, W. B. 1971. Environmental Approaches toCurriculum DeveloPthent (K-12) in R. Cook and G.O'Hearn (eds.), Processes for a Quality Environment.Green Bay, WI: The University of Wisconsin.
Steffenson, D. 1975. Beyond Survival. Journal ofEnvironmental Education 6(3): 7-11, Spring.
Swan, J. A. and W. B. Stapp (eds.). 1974. EnvironmentalEducation: Strategies Towards a More Livable Future.New York: Halstead Press.
Wheatley, J. H. 1974. Affective Instruments in Environ-mental Education. Columbus, OH: ERIC/SMEAC.
320
312
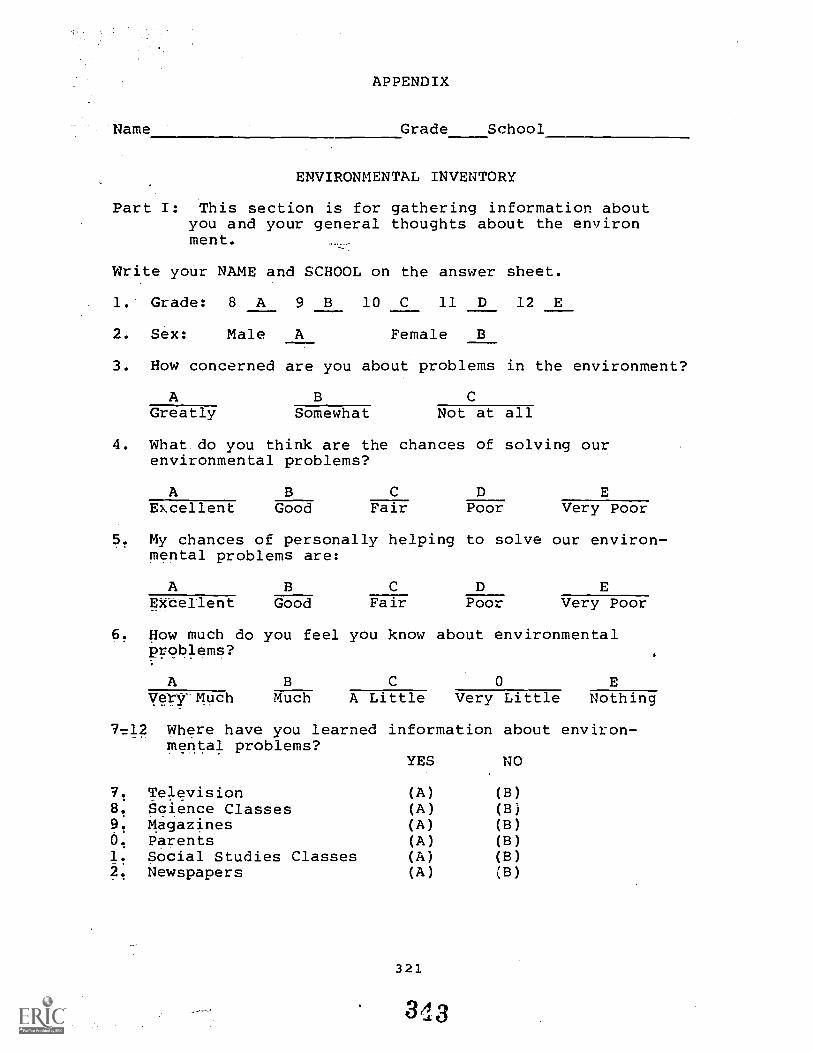
Name
APPENDIX
Grade School
ENVIRONMENTAL INVENTORY
Part I: This section is for gathering information aboutyou and your general thoughts about the environment.
Write your NAME and SCHOOL on the answer sheet.
1. Grade: 8 A 9 B 10 C 11 D 12 E
2. Sex: Male A Female B
3. How concerned are you about problems in the environment?
AGreatly Somewhat Not at all
4. What do you think are the chances of solving ourenvironmental problems?
AExcellent Good Fair Poor Very Poor
5. My chances of personally helping to solve our environ-mental problems are:
AEkbellent Good Fair Poor Very Poor
6. How much do you feel you know about environmentalproblems?
A B C 0
Very Much Much A Little Very Little Nothing
712 Where have you learned information about environ-mental problems?
7. Television8. Science Classes91 Magazines0. Parents11 Social Studies Classes2. Newspapers
YES NO
(A) (B)(A) (B)(A) (B)(A) (B)(A) (B)(A) (B)
321
3,13
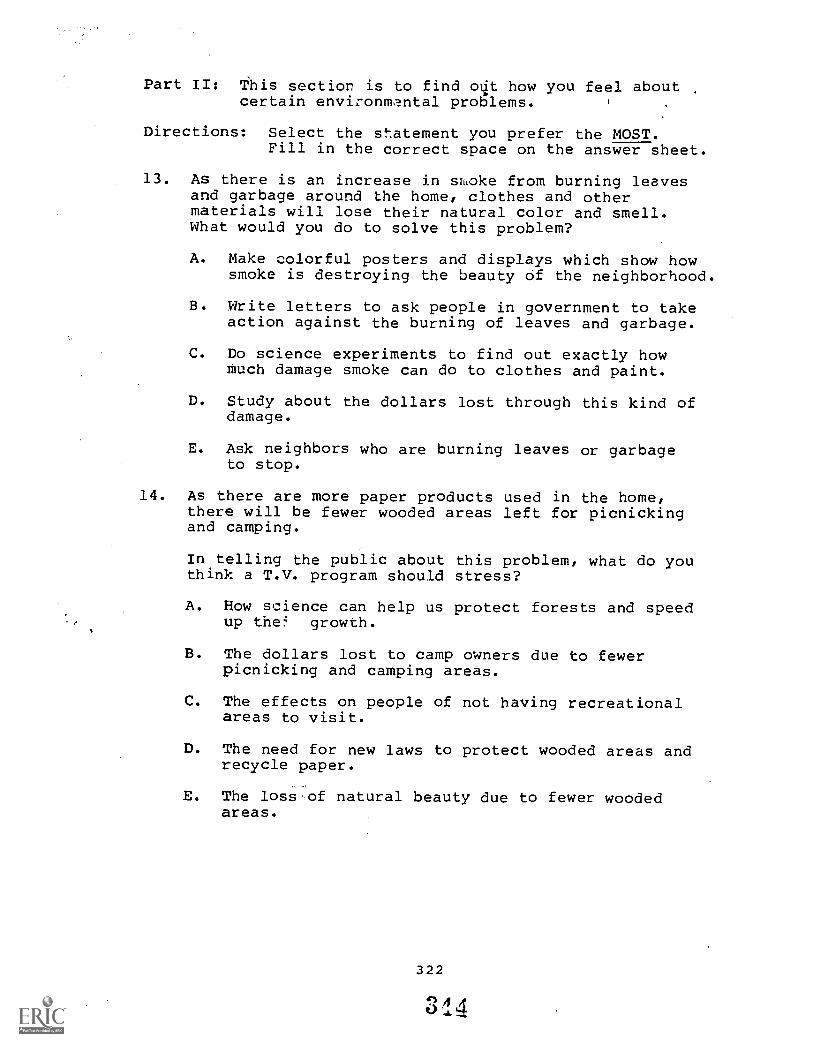
Part II: This section is to find out how you feel aboutcertain environm,?.ntal problems.
Directions: Select the statement you prefer the MOST.Fill in the correct space on the answer sheet.
13. As there is an increase in smoke from burning leavesand garbage around the home, clothes and othermaterials will lose their natural color and smell.What would you do to solve this problem?
A. Make colorful posters and displays which show howsmoke is destroying the beauty of the neighborhood.
B. Write letters to ask people in government to takeaction against the burning of leaves and garbage.
C. Do science experiments to find out exactly howmuch damage smoke can do to clothes and paint.
D. Study about the dollars lost through this kind ofdamage.
E. Ask neighbors who are burning leaves or garbageto stop.
14. As there are more paper products used in the home,there will be fewer wooded areas left for picnickingand camping.
In telling the public about this problem, what do youthink a T.V. program should stress?
A. How science can help us protect forests and speedup the growth.
B. The dollars lost to camp owners due to fewerpicnicking and camping areas.
C. The effects on people of not having recreationalareas to visit.
D. The need for new laws to protect wooded areas andrecycle paper.
E. The loss -of natural beauty due to fewer woodedareas.
322
314
15. As there is more material put into the air fromspraying and sanding by workers, there will be morepeople with breathing problems.
What do you think a good boss faced with this problemshould do?
A. Continue to use the cheapest way of spraying andsanding no matter what.
B. Help get new laws passed to control how the jobis done so as to reduce spraying and sanding.
C. Use only spraying and sanding tools which aresafe to workers and people living nearby.
D. Cut down on spraying even though this would makean area look less attractive.
E. Find new ways to spray or sand by using laboratoryresearch and studies.
16. As there is more careless outdoor camping and hunting,there will be fewer animals living in an area.
What do you think should be done about this problem?
A. Work for the election of politicians who supportthe protection of wildlife.
B. Make posters which ask people to save our wildlife.
C. Do a scientific study to find how careless huntingand camping hurt wild animals.
D. Teach kids in a summer camp about outdoor projectsthat do not disturb wildlife.
E. Collect money for a fund to build and protect anarea for wildlife.
323
31
17. As there is an increase in the amount of smokingin crowded areas, there will be a greater risk oflung cancer to the people in these areas.
As a member of your student council, what do youthink-should be done?
A. Stress how the health and well-being of othersare affected by smoking.
B. Pass out information from scientific researchon the effects of smoking.
C. Inform smokers on how much of their money isspent on cigarette smoking.
D. Tell other students that smoking affects howthey look to others.
E. Enforce more strongly the rules to controlsmoking in school.
18. As more noise is given off by cars, trucks, andplanes, it will become harder to hear.
If several people wanted to talk to your class aboutthis problem who should be asked?
A. A teacher who can show you how noise affectsour enjoyment of music.
B. A lawyer who could tell what laws would be neededto control noise made by cars, trucks, and planes.
C. An engineer who can describe the problems ofbuilding noise-proof buildings.
D. A manufacturer who can explain how much it wouldcost to control the noise given off by cars, trucksor planes.
E. A health official who could discuss how you canprotect yourself from the effects of noise madeby cars, trucks and planes.
324
19. As there are more,ways used by the fishing industryto catch fish, there will be fewer fish living inthe water.
When you see a painting that shows a large number offish being caught, what do you think about that?
A. An example of success using scientific meansof finding schools of fish.
B. The catch shows the fishing industry businesshelping the economy.
C. The pleasure and enjoyment obtained from viewingthis work of art.
D. Here is an industry which must be bettercontrolled by the government.
E. The fish that are being caught will help feedmany hungry people.
20. As there are more chemical sprays to control insects,there will be fewer birds in the same area.
Which group do you think should be contactedconcerning this problem?
A. A farmer's group that is worried over the highcost of raising crops as a result of protectingbirds that eat seeds.
B. A political party that wants to pass new lawsto protect wild birds.
C. A health group that is concerned about the effectson people who may have eaten some game birds thatfed on the sprayed insects.
D. A conservation club that wants to protect birdsfor their beauty and songs.
E. A scientific research group that wants to studynew chemicals that will not harm birds.
325
21. As there are more machines clearing the land forfarming, there will be fewer wild plants remaining.
What type of action should be taken to deal withthis problem?
A. Politicians should use their power while in officeto get laws passed to control the use of farmmachines.
B. Hire someone to show pictures to farmers thatdisplay how machines destroy the trees, shrubs,and flowers.
C. People should be encouraged to investigate waysof farming that use fewer machines.
D. Talks should be given to clubs and social groupsabout protecting wild plants.
E. Someone should be hired who will compare the costin using different types of machines.
22. As there are more buildings with glass fronts andwindows, there will be an increase in the number ofbirds hurt or killed by crashing into the glass.
What should be done about this problem?
A. Suggest that a survey be taken to get people'sfeelings as to the safety of buildings havinglarge glass fronts.
B. Propose a scientific study on the effects oflarge glass areas on population of birds.
C. Suggest the collection of money from owners whohave a lot of glass on their buildings to beused to save birds.
D. Get builders to use stained or colored glasswindows to help birds see the windows and alsomake the buildings look better.
E. Ask Congressmen about passing new laws that wouldnot allow buildings to have large glass areas.
326
318
AN ANALYSIS OF THE ENVIRONMENTAL AWARENESS OF YCCCAMPERS-SUMMER 1979
Elaine L. Davis,' Rodney L. Doran,'and S. David Farr"
Abstract. This paper presents findings of a nationwidesurvey of the environmental awareness of summer 1979 YouthConservation Corps campers. Based on prptest-posttest meanscore differences within eleven content areas, differenceswere found in seven areas, indicating substantial achievementfor a program as brief and diverse as the YCC program.
Background/Introduction
The Youth Conservation Corps (YCC) summer camp program is anationwide endeavor co-sponsored by the U.S. Departments ofAgriculture and Interior and the Forest Service. Its majorpurpose is to provide a combined program of environmentaleducation and work projects for youth, aged 15 to 18, who areenrolled in the corps' summer camps. In pursuing this goal,the program attempts to make environmental activities asrelevant as possible to various field projects in which theseadolescents are involved. Beyond this common goal, however,camp programs vary greatly in terms of geographical locationand work projects, and camp staffs differ widely with respectto experience, training, and educational perspective.
This report discusses the results of an assessment of theenvironmental awareness of YCC campers before and after their1979 camp experience. Through the joint efforts ofindividuals affiliated with the Environmental Studies Centerat the State University of New York at Buffalo, an assessmentsystem for measuring environmental awareness was developed.This involved identifying the environmental awareness goalsof YCC, constructing, pretesting and screening items designedto reflect these goals, the development of an item samplingplan to select items for specific tests, and the preparationof several forms of each test.
'Faculty of Educational Studies, Baldy Hall, StateUniversity of New York, Buffalo, NY 14260. Work completedunder contract #53-3178-8-5 between the Research Foundationof the State University of New York and the U.S. ForestService.
327
319
Eleven domains of goals were developed which served as basesfor the construction of individual test items. These elevendomains consisted of ten cognitive areas and one affectivearea, as follows (number of items in ea,h domain appears inparentheses)2:
A. Nature and Natural Systems (43)B. Relationships in Ecosystems (50)C. Catastrophes (42)D. Carrying Capacity (40)E. Intrusive Role of Humans in Nature (45)F. Wastes (46)G. Human Management Limitations (42)H. Renewable and Nonrenewable Resources (41)I. Ecosystem Protection (42)J. Environmental Policy-Making Process (38)K. Individual Interest and Concern (52)
These domains are discussed below, grouped according toconceptual similarities.
Domain A, Nature and Natural Systems, focused on the fiveelements of ecosystems:, land, water, air, plants, andanimals. Domain B, Systemic Relationships in Ecosystems, wasconcerned with basic processes in ecosystems, such as thelife cycle, biotic succession, and the food chain.
Four of the domains dealt with knowledge and understanding ofspecific concepts critical to the definition of environmentalawareness. Domain C, Catastrophes, dealt with both naturalcatastrophes such as floods and earthquakes, and human-causeddisasters like oil spills, explosions, and nuclear accidents.Special emphasis was given to growing populations andtechnological intervention as increasing the likelihood ofcatastrophes, and to ways of anticipating and controlling theeffects of catastrophes. Domain D, Carrying Capacity,concerned factors which limit the carrying capacity (e.g.,amount of water or nutrients) and processes which threatenit, such as population growth rates. Domain F, Wastes,focused on effluents resulting from human activities likeagriculture, mining, manufacturing, and transportation. Thisdomain also dealt with items concerning desirable practicesregarding wastes, including improved waste handling
2Number of items within each domain varies due to the sizeof the original item pools generated, and to the unequalnumbers of items discarded from each domain during thedevelopment and revision process. An upper limit ofapproximately 50 items per domain was established forreasons of parsimony.
328
350
recycling, and use of biodegradable products. Domain H,Renewable and Nonrenewable Resources, assessedunderstandingand knowledge of which resources are renewable,recycling of nonrenewable resources, conservation, andincreased efficiency of resource use.
Four domains focused on humans and their interactions withnature. Domain E, Intrusive' Role of Humans in Nature,examined the implications of people's attempts to dominatenature. Included in this domain were items concerningresults of insecticide use, chemical effluent disposal,excessive energy consumption, and the construction of cities,highways, and dams. By contrast, Domain I, EcosystemProtection, concerned ways of minimizing human impact on theenvironment by such means as the preservation of endangeredspecies and reduction of resource use. Domain G, HumanManagement Limitations, recognized that, although people doattempt to dominate nature, they are neither omnipotent intheir ability to do so, nor omniscient in their ability toanticipate the consequences of their acts. Items in thisdomain assessed whether campers recognized these limitationsand if they were hesitant to indulge in new nature-dominatingactivities. Domain J, Environmental Policy-Making Process,concerned institutions designed to deal with environmentalproblems. A major facet of this domain was knowledge ofexisting agencies and organizations and their purposes. Alsotested was comprehension of governmental and societalprocesses through which laws are made and agencies formed.
Finally, Area K, the attitude domain, allowed campers toreport their individual habits, activities, and beliefsconcerning environmental issues by responding to statementson a four-point Likert scale (Strongly Agree to Strongly-Disagree). A four-point scale was used, rather than the moretypical odd-integer scale, to prevent neutral or "undecided"response choices. Illustrative items from each of the elevendomains appear in Appendix A.
Method
The general planning by national YCC staff of the 1979assessment imposed several conditions upon the design of thesurvey. First, the assessment was to be nationwide. Second,procedures used needed to provide for sensitivity to rathermodest changes in each of the eleven domains. Third,estimates were desired concerning the relationships among thedomains. Fourth, the data needed to provide for continuedpsychometric evaluation of the domains as well as domaindefinitions. Fifth, the assessment was to be made in a waythat would make clear that individual camps were not beingevaluated. Finally, the design had to provide a means toconfirm that observed pre-post differences, should theyoccur, were attributable to the YCC program's impact ratherthan to extraneous influences.
329
These requirements led to the design of a complex camper/item matrix sampling plan whereby each camper answered aquestionnaire of only 40 to 50 of the 481 available items,drawn from between one to four of the domains. Differentcampers were observed at the beginning than at the end of thecamp experience to emphasize that individual camps were notbeing evaluated, and to preclude the possibility that anyimprovement was due to prior practice on the instrument.
In order to distribute items evenly among camps and campers,51 partially overlapping forms were designed. Eleven of theseforms contained items representing a single domain. Theremaining 40 forms were compiled in such a way as to providefor the co-occurrence of each pair of domains andapproximately equal representation of items within domains.This design achieved an appropriate balance and breadth ofrepresentation of each domain, a balance of cross-domaininformation, and completeness of within-domain, cross-iteminformation. This permitted analyses of the relationshipsamong' domains as well as estimation of psychometricproperties of the domains. The reader interested in a moredetailed and complete discussion of the sampling plan isreferred to an earlier project report (Milbrath, et al.,1979).
The sampling of camps was accomplished by first stratifyingall available YCC camps, based on 1978 camp lists, by agency(Agriculture, Interior, State), and within stratum by campsize. Each of the three resulting lists were then parti-tioned into sampling segments containing nine camps each, andcamps within each segment were randomly ordered. With campssegmented and ordered in this manner, the first two campsfrom each segment were chosen for tesing at the beginning ofthe camp experience and the next two camps were chosen fortesting at the end of the camp experience. The remainingcamps were set aside as spares, to be substituted ifnecessary, since the plan was developed based on 1978 camplists. The sampling procedure resulted in the selection of194 camps with 9855 campers for beginning of camp testing,and 194 camps with 9850 campers for end of camp testing.These numbers represent approximately 44 percent of the totalpopulation of YCC campers, based on 1978 camp lists.
Specific directions for test administration were distributedto camps with the forms. Completed answer sheets were mailedto the Environmental Studies Center, State University of NewYork at Buffalo, during the summer and fall pf 1979, where anextensive screening press took place. AnSWer sheets werechecked manually for any irregularities, such as incorrect ormissing questionnaire form and camp numbers. Answer sheetsthat had been photocopied or done in ink were redone using asoft lead pencil, to guarantee readability by optical scanner
330
3
at a later stage. Data were then transferred from answersheets to magnetic tape via an optical scanner. Theresulting data files were again scanned using a speciallyprepared program which examined each case for missing orunexpected pre-post camp codes, missing or multipleresponses, and consistency among three form identifiers.Editing was then done manually by a staff member, whocompared data records that had irregularities to the originalanswer sheets. Records which could not be clearly identifiedby form or pre-post classification were eliminated, as werecases with more than one-half of the responses missing.
The edited files were then submitted to a scoring programwhich recorded each item, except for the attitude domain, ascorrect or incorrect.
Data Analysis
Unbiased estimates of item means, variances, and covarianceswere computed to take into account the considerable amountsof missing data resulting from the item sampling plan. Thesewere then synthesized into total score estimates for eachdomain. The estimated item parameters were also used toestimate two psychometric properties of the item sets. Thereliability of tests of equal length was estimated for eachdomain, as was the homogeneity of the domain. A detailedaccount of these procedures and the resulting estimates arecontained in the final report of the project (Farr, et al.,1980).
General Findings
After 165 cases were eliminated because they could not beidentified, contained missing data, or were otherwiseunusable, 14,796 campers were represented in the data, 7,635who had been assessed at the start of their camp experienceand 7,161 who had been tested at the end. According to theoverlapping sampling plan, each domain was represented byapproximately 2400 campers observed before the campexperience, and approximately 2200 observed after. Resultsfor each domain are reported in terms of total scores basedon all items included in the survey.
Estimates of before and after camp performance of the 1979campers are shown in Table 1, arranged in order of differ-ence between pre and post camp performance. An approximatet-test was calculated for each difference and indicatedstatistically significant differences for six contentdomains, as well as for the attitude domain.
331
353
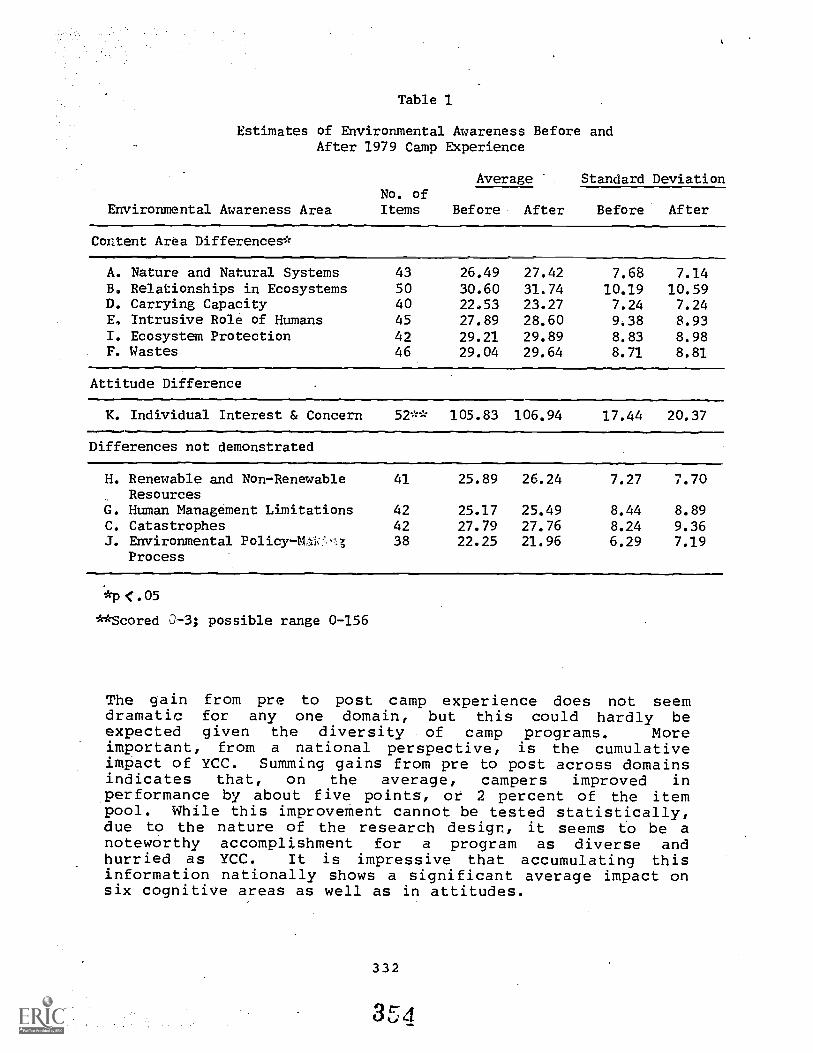
Table 1
Estimates of Environmental Awareness Before andAfter 1979 Camp Experience
Environmental Awareness AreaNo. ofItems
Average Standard Deviation
Before After Before After
Content Area Differences*
A. Nature and Natural Systems 43 26.49 27.42 7.68 7.14B. Relationships in Ecosystems 50 30.60 31.74 10.19 10.59D. Carrying Capacity 40 22.53 23.27 7.24 7.24E. Intrusive Role of Humans 45 27.89 28.60 9.38 8.93I. Ecosystem Protection 42 29.21 29.89 8.83 8.98F. Wastes 46 29.04 29.64 8.71 8.81
Attitude Difference
K. Individual Interest & Concern 52** 105.83 106.94 17.44 20.37NION.I.M..110
Differences not demonstrated
H. Renewable and Non-Renewable 41 25.89 26.24 7.27 7.70Resources
G. Human Management Limitations 42 25.17 25.49 8.44 8.89C. Catastrophes 42 27.79 27.76 8.24 9.36J. Environmental Policy-Mls. ; 38 22.25 21.96 6.29 7.19
Process
4DIC.05
**Scored O-3; possible range 0-156
The gain from pre to post camp experience does not seemdramatic for any one domain, but this could hardly beexpected given the diversity of camp programs. Moreimportant, from a national perspective, is the cumulativeimpact of YCC. Summing gains from pre to post across domainsindicates that, on the average, campers improved inperformance by about five points, or 2 percent of the itempool. While this improvement cannot be tested statistically,due to the nature of the research design, it seems to be anoteworthy accomplishment for a program as diverse andhurried as YCC. It is impressive that accumulating thisinformation nationally shows a significant average impact onsix cognitive areas as well as in attitudes.
332
3 5
The larger gains in certain domains seem to indicate that'those areas which are relevant to particular work projects,and which are more often recognized as camp programobjectives, also show greater effects from pre to post campexperience.
The largest gains were found in the two most general areas,Nature and Natural Systems (Domain A) and Relationships inEcosystems (Domain B). These domains include material thatis easily illustrated in almost any habitat, and which wouldbe included as objectives in the majority of camps. Theremaining four- domains which showed significant gainsrepresent more specific concepts, but those which still canbe illustrated in nearly every habitat. This material,however, would less likely be included as objectives ofspecific camp programs.
Two of the domains which did not show differences before andafter camp, Human Management Limitations (Domain G) and theEnvironmental Policy-Making Process (Domain J), concernpeople and their institutions. The material contained inthese domains do not reflect the type of issues that camperswould find in their everyday camp projects, nor is it likelythat these are major objectives of individual camp programs.Of the remaining domains, Catastrophes (Domain C) deals withevents not likely to be encountered during the campexperience, and Renewable and Nonrenewable Resources (DomainH) concerns minerals, energy, and food resources, which alsomay not be directly related to camp activities.
Analysis Based on Specific Items
The general finding that the YCC program had significantimpacts in some environmental awareness domains but not inothers suggests that YCC camps currently are better suited toinstill gains in some content areas than in others. It maybe that the camp experience is more closely related to somecontent areas than to others, or that camp personnel arebetter able to provide instruction and leadership in somecontent areas than in others.
Interestingly, many of the items which showed the greatestgains from pre to post camp represented conceptual learning.The concept clearly could not have arisen from the dailyobservation of natural events, but had to have been taught byan instructor. The items showing clear gains came from avariety of content domains; their common characteristic wasthe conceptual learning reflected in each. It would seem, onthe basis of this finding that, even though the campexperience provided a setting for learning, the more dramatic
333
3
gains were achieved through teaching. To illustrate, campersshowed a significant increase in the content area, CarryingCapacity (Domain D). Yet carrying capacity is an abstractconcept that cannot be learned by merely pointing to anobject and naming it, nor through typical daily observationsin the camp setting. It seems that the concept had to havebeen taught by an instructor who considered it an importantone to learn.
These findings suggest that the YCC camps provide settings inwhich meaningful learning about the environment can takeplace, in an atmosphere similar to that of a classroom. Ifcampers can gain significantly in areas such as carryingcapacity and relationships in ecosystems, it would seem thatthey could also gain significantly in'conceptual areas suchas renewable and nonrenewable resources, human managementlimitations, catastrophes, and the environmentalpolicy-making process. The fact that the campers surveyeddid not show gains in any of ,these domains suggests thateither the leaders of YCC have not emphasized strongly enoughthe importance of teaching these concepts to campers, or thatcamp staffs themselves are poorly equipped to teach in theseareas. It is likely that both of these possibilities arevalid.
Campers were fairly ignorant of some of the basic factsconcerning energy, and had very poor knowledge of natural andhuman-caused catastrophes. Also, campers knew very littleabout population trends both in the U.S. and worldwide. TheYCC camp experience did little or nothing to increasecampers' knowledge in any of these areas.
Although the national environmental awareness objectives ofYCC, and staff training materials, emphasize that campersshould become more aware of environmental management agenciesand of public policy-making processes, the results of the1979 assessment show that campers start camp with littleknowledge of government and policy processes, and that verylittle happens in camp to increase this knowledge.
Results regarding the attitudes of campers toward environ-mental issues and concerns support the notion that there is agreat love of nature among today's youth. The YCC campexperience seems to build on this, as evidenced by the modestgains in the direction of greater love of nature and a desirefor environmental protection. These young people haverealized a personal responsibility for environmentalprotection, rather than assigning that responsibility to thesocio-political system. While personal concern for theenvironment was high, the proportion of campers who reportedhaving taken environmentally protective action was much
334
smaller. Typically, no more than half of these campersreported having consciously acted to protect the environment.GfAns in this direction, traceable to the camp experience,were perceptible but very modest.
Summary
From the data one can conclude that many YCC camps aresuitable learning settings and that campers did learn a gooddeal about some content areas, as well as showing modestincreases in attitudes, toward the environment. In a programas diverse and limited as the YCC program, this is animpressive accomplishment However, the data also show thatthere are some glaring cJeficiencies in the current approachto the environmental awareness component of the YCC program.Some policy decisions should be taken by national leadershipconcerning emphases that should be given to specificenvironmental awarenes3 content areas it YCC. Followingthis, teaching materials and staff training should beoriented toward providing more adequate coverage,particularly to the deficient content areas selected forgreater emphasis. The data further suggest that ordinaryteaching methodology would probably be successful inproducing substantial learning gains.
REFERENCES
Farr, S. D.; L. W. Milbrath; E. L. Davis; G. DiCerbo; andE. McGregor. 1980. Environmental Awareness in the 1979YCC Camping Program. Environmental Studies Center,SUNY at Buffalo.
Milbrath, L. W.; J. D. Farr; T. J. Shuell; R. Jennings;G. DiCerbo; and E. Nestle. 1979. Measuring Environmental Awareness in YCC Campers. EnvironmentalStudies Center, SUNY at Buffalo.
335
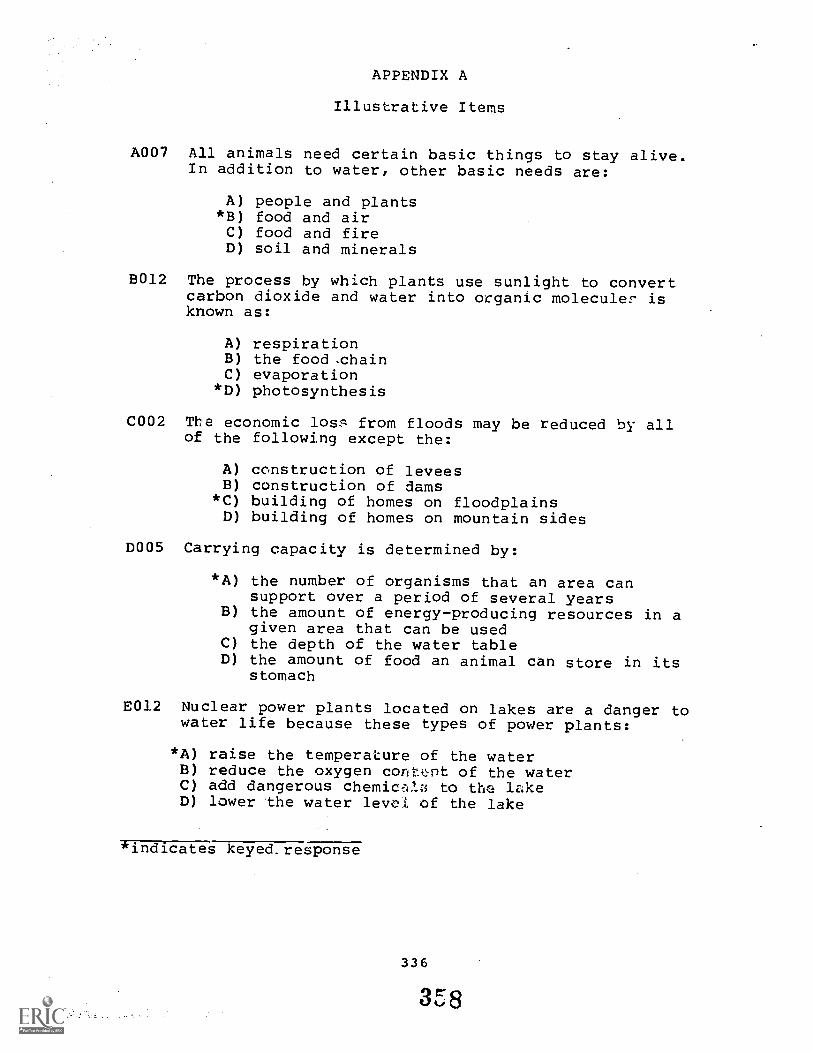
APPENDIX A
Illustrative Items
A007 All animals need certain basic things to stay alive.In addition to water, other basic needs are:
A) people and plants*B) food and airC) food and fireD) soil and minerals
B012 The process by which plants use sunlight to convertcarbon dioxide and water into organic molecule- isknown as:
A) respirationB) the food .chainC) evaporation
*D) photosynthesis
C002 The economic loss from floods may be reduced by allof the following except the:
A) construction of leveesB) construction of dams
*C) building of homes on floodplainsD) building of homes on mountain sides
D005 Carrying capacity is determined by:
*A) the number of organisms that an area cansupport over a period of several years
B) the amount of energyproducing resources in agiven area that can be used
C) the depth of the water tableD) the amount of food an animal can store in its
stomach
E012 Nuclear power plants located on lakes are a danger towater life because these types of power plants:
*A) raise the temperature of the waterB) reduce the oxygen contx,nt of the waterC) add dangerous chemic,:41Ti to the lakeD) lower the water levol of the lake
*indicates keyed response
336
3'8
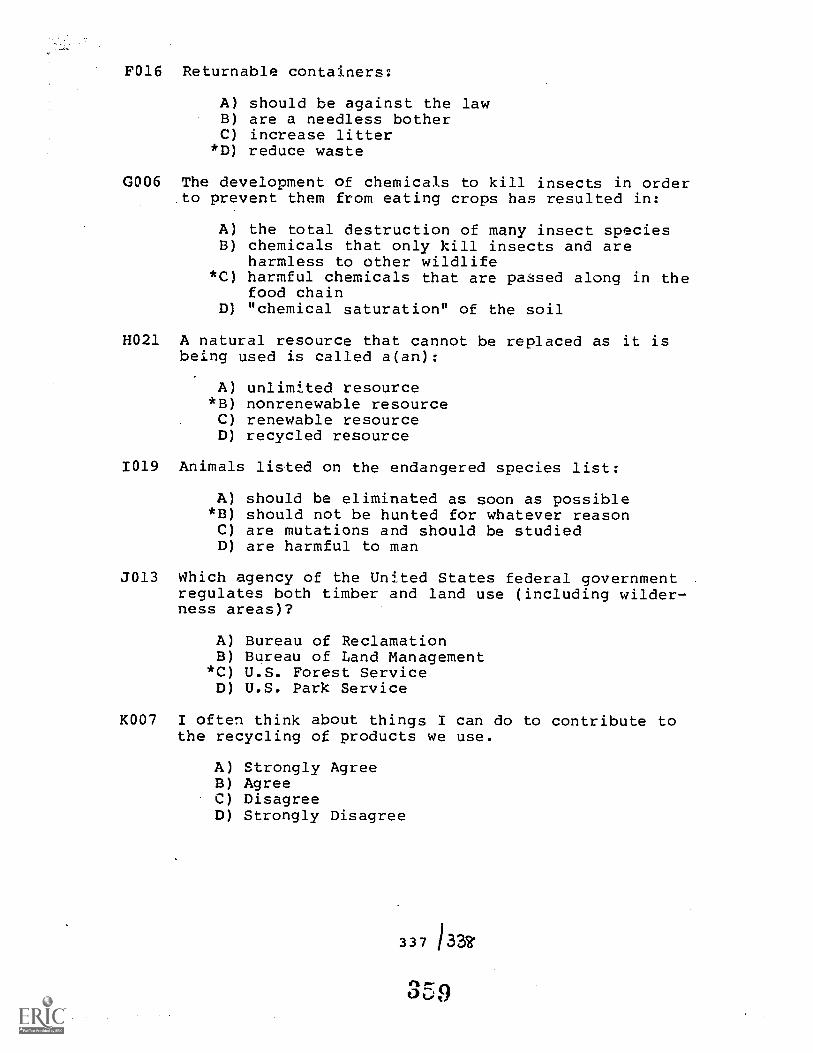
F016 Returnable containers:
A) should be against the lawB) are a needless botherC) increase litter*D) reduce waste
G006 The development of chemicals to kill insects in orderto prevent them from eating crops has resulted in:
A) the total destruction of many insect speciesB) chemicals that only kill insects and are
harmless to other wildlife*C) harmful chemicals that are passed along in the
food chainD) "chemical saturation" of the soil
H021 A natural resource that cannot be replaced as it isbeing used is called a(an):
A) unlimited resource*B) nonrenewable resourceC) renewable resourceD) recycled resource
1019 Animals listed on the endangered species list:
A) should be eliminated as soon as possible*B) should not be hunted for whatever reasonC) are mutations and should be studiedD) are harmful to man
J013 Which agency of the United States federal governmentregulates both timber and land use (including wilderness areas)?
A) Bureau of ReclamationB) Bureau of Land Management*C) U.S. Forest ServiceD) U.S. Park Service
K007 I often think about things I can do to contribute tothe recycling of products we use.
A) Strongly AgreeB) AgreeC) DisagreeD) Strongly Disagree
337 133.
rIP-nOt)0
ASSESSING ENVIRONMENTAL EDUCATION TEACHERS AND CURRICULA
Louis A. Iozzi, EVALUATION OF "PREPARING FOR TOMORROW'SWORLD"-SCIENCE/TECHNOLOGY/SOCIETY FOR GRADES 7-12.
David I. Johnson and Douglas C. Covert, A LEARNING ANDCOMMUNICATIONS PROFILE OF TEACHERS ENTERING AN ENVIRON-MENTAL EDUCATION EXPERIENCE.
339 34.10
3 6 f)
EVALUATION OF "PREPARING FOR TOMORROW'S WORLD"-SCIENCE/TECHNOLOGY/SOCIETY FOR GRADES 7-12:
METHODOLOGY AND RESULTS
Louis A. Iozzil
Abstract. The complexity of issues facing society demand aninterdisciplinary curricula. Combining the theories ofPiaget and Kohlberg with new research, the Socio-ScientificReasoning model E.) 3 formulated, with the goals of fosteringgrowth in critical, thinking, decision-making, problem solvingand moral reasoning. Preparing for Tomorrow's World, afutures-focused environmental education program consisting of14 modules that supplement existing curricula for grades 7through 12, is based on these objectives. This program wasfound to be highly effective in increasing cognitiveachievement and moral/ethical reasoning about issues at theinterfaces of science, technology and society. Methodologyand evaluation results of this intervention study arediscussed.
I. Introduction--Futures-Focused Environmental Education
Literature in the field of environmental education has, forthe most part, emphasized many of the perceived contemporaryenvironmental needs and concerns of today's world. Moreover,since the "surroundings" of individuals across our nation,and indeed the world, vary appreciably, so too do the typesand orientations of environmental educators and environmentaleducation programs. Thus, environmental education is theterm employed to encompass an ever-increasing variety ofnotable efforts, programs and orientations.
Some environmental education programs, for example, emphasizeone or a combination of two or more areas of environmentalinterest or concerns. While some programs focus on thenatural world, others are primarily concerned with outdoorpursuits, and still others deal essentially withconservation, recreation, and, of course, energy.
Depending on the location, some programs concentrate on aparticular environment such as woodlands, coastal zones,mountains, deserts, and, in recent years, the so-called"built" environment. Some restrict their area of inquiry to
'Department of Education, Cook College, Rutgers--The StateUniversity of New Jersey, New Brunswick, NJ 08903; Director,Institute for Science, Technology, Social Science Education,Rutgers--The State University of New Jersey, New Brunswick,NJ 08903.
341
361
the local surroundi while others expand their scope toinclude the global e: conment. While curricula and programsof instruction in environmental education vary widely, allseem to share a common goal: to help today's youth becomemore aware, knowledgeable and concerned about theirsurroundings.
The program described in this paper, Preparing for Tomorrow'sWorld, adds another dimension to environmental education, anemphasis on issues, problems and concerns at the interfacesof science/technology/society. This program, moreover, wasdesigned at the Institute for Science, Technology, and SocialScience Education'at Rutgers--The State University, to bothaddress issues of contemporary concern and to help preparetoday's youth to deal with environmental conflicts and issuesjust now emerging and projected to be of significantimportance in the year 2000 and beyond. Hence, the programcan be described as future-focused environmental education.
That we live in a highly scientific and technological worldcan hardly be disputed. Pew would deny that society has inrecent years come to rely on the achievements of science andtechnology to make life more comfortable, convenient, and formany, more enjoyable. Few would deny that society isbecoming increasingly more dependent upon the ingenuity andachievements of the scientific/technological world. Moreover,few would deny that the application of science and technologyexerts a major impact on our total environment.
While no one can, with any degree of certainty, predict whatfuture demands society will place on science, or for thatmatter, what demands science and technology will place onsociety, some trends seem clear. For example, Shane (1977)in a recent study interviewed and summarized the futuresforecasts of a distinguished international panel ofeducators, world leaders and futurists. This panelidentified the developments which, in their opinion, willhave a significant impact on future events. According tothis panel, the next quarter century and beyond will bringabout:
- -a continued acceleration in the rate of change
--greater complexity of life because of new techno-logical breakthroughs
- -the end of the hydrocarbon age
- -a need to reassess our present concepts of growth
--continued crowding, overpopulation, and persistentfood shortages
342
362
- -continued pressure for human equity in all areas
--increased demand from less developed countries fora new economic order
- -international disagreement and conflict
--changing concepts of work and leisure
- -increased governmental debt and capital deficit
--governance problems and threats to freedom
--a post-extravagant society
Clearly, the decisionmakers being cultivated today will berequired to solve environmental and social problems andresolve conflicts which are encountered only in wild dreams,or, in some cases, only in most frightening nightmares.
Although it is anticipated that our future environmentalproblems will to a great extent be very different from thoseknown today, society is already beginning to see emerging thetypes of questions which will become common in the not verydistant future.
--The question will not be "can we" utilize the powerof nuclear fusion to provide an almost limitlesssupply of energy despite its dangers, but rather,"should we"?
--The question will not be "can, we" modify weather,climate, and other aspects of our environment,but rather, "should we"?
--The question will not be "can we" colonize outerspace or the ocean depths to relieve the pressuresof overpopulation, but rather, "should we"?
--The question will not be "can we" produce a "BraveNew World," but rather "should we"?
Simply, questions which today ask "can we" are beingtransformed rapidly into the more appropriate "should we."
Science and technology can respond effectively to questionsof the "can we" variety, for these are decided by scientistsand engineers based on technical fact. Questions of the"should we" variety require, on the other hand, theconsideration of another dimension--a values Dimension. Suchvalues-based questions must be addressed by an educated andenvironmentally literate society, and not by scientists andengineers alone.
343
3C3
With the continuing complexities of issues facing society,curricula can no longer be confined to the boundaries oftraditional disciplines. Just as environmental education,and indeed the environment itself, is not restricted to rigiddisciplinary lines, so too must futures-focused environmentaleducation be free to vary and to cross traditionaldisciplinary boundaries. As Piaget has argued in ToUnderstand is to Invent (1973), more effective solutions toscience/society problems will emerge from interdisciplinaryresearch.
Hence, educators must develop in youth skills that aregeneralizable, highly flexible, and enduring; educators mustemphasize the development of skills which are t least asbasic as any of those proposed to date. Thes-1 skills areproblem solving, decision-ma%ing and a variety of analyticaland critical thinking skills. Moreover, in developing theseskills a moral/ethical dimension is crucial if today'sstudents will bear the responsibility to effectively andhumanely deal with tomorrow's problems.
II. Preparing for Tomorrow's World- -Description of the Program
The Institute for Science, Technology and Social ScienceEducation at Rutgers--The State University, has attempted to"bridge the gap," both among science, technology and societyand between theory and practice. These efforts have resultedin a package of curriculum materials based on theSocio-Scientific Reasoning Model (Iozzi, 1980; Iozzi andCheu, 1978). The model is based upon and integrates thecognitive developmental theories of Jean Piaget (logicalreasoning), Lawrence Kohlberg (moral reasoning), RobertSelman (social role taking development), as well as newresearch conducted by the author and other research dealingwith adolescent problem solving. In addition to increasingstudents' knowledge about existing and emerging issues ofimportance at the interfaces of science, technology andsociety, the overall goal of the program--Preparing forTomorrow's World--is to provide interesting, yet meaningfuland useful experiences which will result in improveddecision-making and critical thinking skills andmoral/ethical reasoning ability in junior and senior highschool students.
A total of 14 curriculum modules employing a variety of .
formats have been produced. Each curriculum module is ahighly flexible, self-contained unit of instruction whichincludes all materials necessary for classroom use. Thenumber of instructional periods required to teach a moduleranges from a minimum of two weeks of intensive instruction
344
3e4
to, depending on individual school needs, an entire schoolyear. Because the modules are highly flexible, existingprograms of instruction need not be altered. Modules aredesigned to be infused into present courses to provide neededextension or supplementary types of activities.
Each of the 14 modules focuses on a different problem areaand guides students to examine numerous issues, using a
variety of strategies. Specific module topics and gradelevels at which they were field tested are:
Beacon City--An Urban Land Use Simulation(grades 11, 12)
Dilemmas in Bioethics (grades 11, 12)Technology and Society: A Futuristic Perspective
(grades 11, 12)Environmental Dilemmas: Critical Decisions for Society
(grades 10, 11)Of Animals, Nature and Humans: A Social Dilemma
(grades 10, 11)People and Environmental Changes (grades 9, 10)Future New Jersey: Public Issues and the Qualityof Life (grades 9, 10)
Perspectives on Transportation (grades 8, 9)Food: A Necessary Resource (grades 8, 9)Technology and Changing Lifestyles (grades 7, 8)Energy: Decisions for Today and Tomorrow
(grades 7, 8)Space Encounters (grades 7, 8)Coastal Decision: Difficult Choices (grades 7, 8)Future Scenarios in Communications (grades 7, 8)
The modules are essentially:
Free standing and can be used as a separate unitof study, mini-course, or infused into existingprograms where appropriate.
Interdisciplinary, incorporating information andconcepts from the sciences and social sciences.The issues address societal concerns which inter-face science, technology, and society.
Future oriented and aim at promoting responsiblecitizenry with increased abilities in criticalthinking, problem solving, social/moral/ethicalreasoning and decision-making; citizens who aremore cognizant of the implications and conse-quences of their decisions.
Self-contained with all materials necessary forteaching the module included: backgroundinformation, readings, student worksheets,
345
3 t'
audiovisuals, evaluation instruments and otherteaching/library aids.
Flexible and are designed to complement a numberof subject areas.
No particular or specialized staffing is required to use anyof the above modules in the classroom. The program isintended to be implemented by the regular classroom teacherin both public and nonpublic schools. Since unique teachingstrategies are employed, a teacher training workshop ishighly recommended if the students are to obtain the maximumbenefit from the materials.
III. Purpose of the Study
The purpose of this study was to determine whether thecurriculum materials .compriF7 the Preparing for Tomorrow'sWorld program are effective in increasing cognitiveachievement and fostering growth in moral/ ethical reasoningability in a science/technology/society context. Cognitiveachievement as used here refers to the acquisition, storage,transformation, creation, evaluation and utilization ofknowledge (Kagan, 1578). Growth in moral/ethical reasoningability as used hei-e refers to and is based upon thecognitive-developmental school of thought and relies mostheavily upon the theories of Jean Piaget and LawrenceKohlberg. Growth is based upon the stage theory advanced byKohlberg.
Specific Objectives of the Study
1. As a result of participating in the Preparing forTomorrow's World program, students wIII-xhibitstatistically significant (p < .05) growth incognitive achievement within the context of science,technology and society.
2. As a result of participating in the Preparing forTomorrow's World program, students will exhibitstatistically significant (p < .0L) growth inmoral/ethical reasoning ability.
IV. Method
A. Evaluation Design
The evaluation design utilized was a nonequivalent comparisongroup design in which both treatment and comparison groupswere pretested and, after intervention, posttested with
346
36
instruments measuring the. major. dependent variables.Dependent variables included cognitive ac'lievement, moral/ethical reasoning and aptitude/ability. Independentvariables included treatment, effects and sex of participants.
Since earlier studies found that cognitive achievement wassignificantly related to ability to succeed in academic work,the "ability" variable both treatment and comparisongroups was controlled using appropriate statisticalprocedures for Objective 1 (cognitive achievement). Academicability has not been found to be significantly related tomoral/ethical reasoning, and therefore, was not controlledfor Objective 2 (moral/ ethical reasoning).
B. Sample Characteristics
Teachers and students from public and nonpublic schoolsrepresenting 34 communities in New Jersey volunteered toparticipate in this program. The subjects (Ss) can beconsidered as representative of a cross-section of all juniorand senior high school students (grades 7 through 12) in NewJersey and, indeed, the entire nation.
Academically, the students exhibited a wide range ofabilities--from gifted students to those at the lower end ofthe academic spectrum. The differences were controlled inthe statistical analyses.
Socio-economically, the Ss represented a broad spectrum- -from affluent to economically disadvantaged. The majorethnic and racial groups in New Jersey were included. Theseinclude Eastern as well as Western cultures, NativeAmericans, and minorities. There were approximately the samenumber of males as there were females.
C. Sample Size
More than 6,000 New Jersey students used the Preparing forTomorrow's World curriculum series-between September 1978 andApril 1980. The study utilized more than 150 New Jerseyschool teacher volunteers representing 34 towns/cities/communities across the state.
D. Instruments
Cognitive Achievement. A set of instruments was developed tomeasure cognitive achievement for the 14 modules. Test itemswere matched to a particular module, reviewed by subjectmatter specialists and teachers, revised on the basis of theexpert reviews, and assembled into instruments.
All items were multiple choice with, four response options. Asindicated on the following table, most questions were
347
3C7
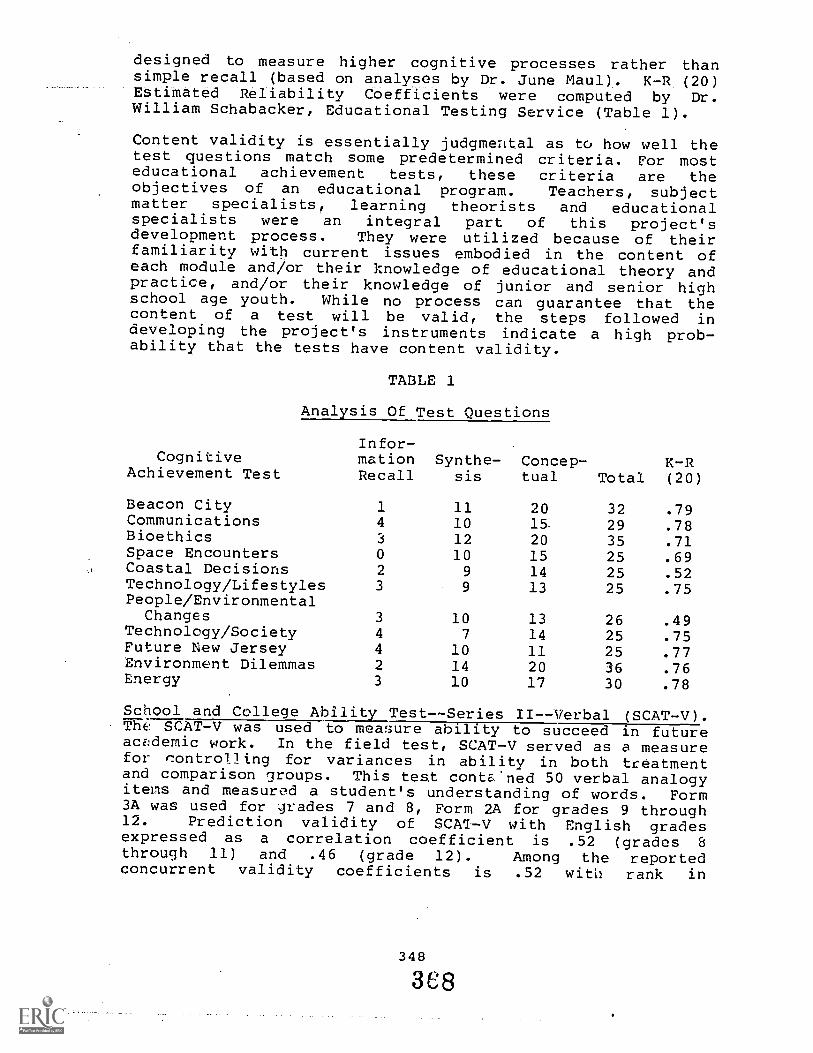
designed to measure higher cognitive processes rather thansimple recall (based on analyses by Dr. June Maul). K-R (20)Estimated Reliability Coefficients were computed by Dr.William Schabacker, Educational Testing Service (Table 1).
Content validity is essentially judgmental as to how well thetest questions match some predetermined criteria. For mosteducational achievement tests, these criteria are theobjectives of an educational program. Teachers, subjectmatter specialists, learning theorists and educationalspecialists were an integral part of this project'sdevelopment process. They were utilized because of theirfamiliarity with current issues embodied in the content ofeach module and/or their knowledge of educational theory andpractice, and/or their knowledge of junior and senior highschool age youth. While no process can guarantee that thecontent of a test will be valid, the steps followed indeveloping the project's instruments indicate a high prob-ability that the tests have content validity.
TABLE 1
Analysis Of Test Questions
Infor-Cognitive mation Synthe- Concep- K-R
Achievement Test Recall sis tual Total (20)
Beacon City 1 11 20 32 .79Communications 4 10 15 29 .78Bioethics 3 12 20 35 .71Space Encounters 0 10 15 25 .69Coastal Decisions 2 9 14 25 .52Technology/Lifestyles 3 9 13 25 .75People/Environmental
Changes 3 10 13 26 .49Technology/Society 4 7 14 25 .75Future New Jersey 4 10 11 25 .77Environment Dilemmas 2 14 20 36 .76Energy 3 10 17 30 .78
School and College Ability Test--Series II--Verbal (SCAT-V).The SCAT-V was used to measure ability to succeed in futureacademic work. In the field test, SCAT-V served as a measurefor controlling for variances in ability in both treatmentand comparison groups. This test contEfned 50 verbal analogyitems and measured a student's understanding of words. Form3A was used for grades 7 and 8, Form 2A for grades 9 through12. Prediction validity of SCAT-V with English gradesexpressed as a correlation coefficient is .52 (grades 8through 11) and .46 (grade 12). Among the reportedconcurrent validity coefficients is .52 with rank in
348
3C8
graduating class. Grade-by-grade measures with intervalconsistency expressed as coefficients range from .88 to .90with grade 7 having the lowest and grade 12 the highest.
SCAT-V correltes .50 with cognitive achievement test scores.
Questionnaires. Teacher questionnaires were also utilized todetermine the effectiveness of modules in meeting projectobjectives. These instruments employed both Likert intensityscales and open-ended variation responses. A studentquestionnaire was also used. This instrument was similar informat to the teacher questionnaires, but included questionsdirected at student concerns.
Moral/Ethical Reasoning. Two standardized and publishedinstruments were utilized. The Environmental Issues Test(EIT) was used with modules dealing with environment relatedcontent while the Defining Issues Test (DIT) was utilized forall other modules (8 modules). Both instruments are similarin format and organized so that a student first reads adilemma story and then indicates the importance of 12 issuestatements regarding the solution to the dilemma on aLikert-type intensity scale. Each of the 12 issue statementsis keyed to a moral/ethical reasoning stage as defined byLawrence Kohlberg. After indicating the importance of suchissue statements, the student then identifies and rank ordersthe four most important statements. Both instruments includedetractor items and consistency procedures to identify anystudents selecting statements randomly. Those tests which donot "pass" the consistency check are discarded.
Reliability coefficient for the EIT using a test/retesttechnique was .84 (N = 40 ninth grade Ss). Time intervalbetween test and retest was seven days. Judgments aboutcontent validity can be made from the EIT's parallelism tothe Defining Issues Test. Concurrent reliability r = .36with the affective subscale of the E6ology Attitude Inventoryand r = .63 with the Defining Tssues Test. Readability isgrade 9 (Fry Scale).
For the DIT, test-retest r is .82 (N = 123 Ss, age 16-56).Time interval between test and retest was reported as "oneweek to five months." Among the relevant concurrent validitycoefficients are .68 with the Kohlberg Moral Maturity Scale,and "in the .30s and .40s" for nintil graders on the DIT andthe Iowa Test of Basic Skills. Readability is grade 9 (FryScale).
Both the EIT and the DIT can be s:ored in several ways- -each method more or less sensitive to different changes.Three scoring methods were employed in the evaluation.
349
3C9
E. Data Collection Procedures
Treatment and comparison groups consisted of volunteersdesiring to participate in the program. Although thePreparing for Tomorrow's World program consists of 14curriculum modules, only 10 of the 14 were used in thisstudy. For each module volunteers were limited to teachersand students in grades for which the modules were developedand who agreed to predetermined, standardized use of theproject materials and evaluation instruments. For allmodules and at all field test locations the following werecollected:
1. Data Type. Pretest/posttest scores for cognitiveachievement, moral/ethical reasoning, general academicability, teachers' opinions, students' opinions.
2. Method of Data Collection. Standardized tests: moral/ethical reasoning, School and College Abilities Test-Verbal (SCAT-V), questionnaires, project developedtests (cognitive achievement), and machine scorableresponse documents.
3. Timelines. Variable--from 2 to 8 weeks depending uponspecific module, particular circumstances, existingcurriculum and needs in field test school district.
4. Personnel Responsible. Regular classroom teachers,Project Director, Associate Director, Field TestCoordinator, Evaluation Consultant.
F. Sampling_Technique
If all students were administered the full battery ofinstruments required to adequately evaluate Preparing forTomorrow's World, each participant would have been subjectedto three full class periods of pretests and three full classperiods of posttests. This procedure was consideredunacceptable and.a matrix sampling technique was employed toboth reduce the amount of testing time and to ensure theinclusion of an adequate sample size.
All students (project and comparison) were administered theSCAT-V. However, the cognitive achievement tests and themoral/ethical reasoning tests were spiraled so that eachstudent was administered only one of the tests. Thistechnique allowed for random assignment of a test form on thepretests. For posttest administration,, each student wasadministered the same test form used in pretestadministration.
350
370
All instruments were administered by the regular classroomteacher. All tests except the moral/ethical reasoning testwere machine scored. Scanning of these documents was underthe supervision of staff personnel. The moral/ ethicalreasoning tests were hand scored by project personnel underthe supervision of the Project Director.
Treatment groups were tested concurrently with comparisongroup-: using the same instruments during the same timeperiod. Since only the treatment group received instructionusing the Preparing for Tomorrow's World program, any changesin pretest to posttest scores is attributable to theintervention (controlling for ability differences). Thecomparison group was administered only the pretests andposttests. They did not utilize any of the modules.
Since the only significant difference between the comparisongroup and the treatment group was exposure to the curriculummodules, any growth in cognitive achievement and inmoral/ethical reasoning demonstrated by the treatment groupis attributable to the effectiveness of the Preparing forTomorrow's World program.
G. Control Group/Treatment Group--Evidence of Equivalency
Control groups consisted of classes of students and theirteachers volunteering to participate in the field test. Somecomparison groups were from the same school as the treatmentgroups while other comparison groups were from entirelydifferent schools and communities. When comparison groupsand treatment groups were from the same school, monitoring byproject staff '2nsured that no student was inadvertentlyincluded in both trertment and control samples. When acomparison group was selected from another school or schooldistrict, the selection process included consideration offactors such as socio-economic information, schoolorganization, learning environment, etc.
To control for any differences in ability between treatmentand control groups, analysis of covariance was employt.d incomparing pre/posttest effectiveness. The SCAT -V scoresserved as the ability measure. All students were tested bytheir regular classroom teachers during the same time periodusing the same instruments.
351
371
H. Data Verification Procedures
Cognitive Achievement and SCAT-V. Responses were made onmachine scannable documents. Machine scoring was conductedat Educational Testing Service, Princeton. Approximately10-15 percent of the answer sheets were personally verifiedby ETS personnel.
Moral/Ethical Reasoning. Responses were made onnonmachinrscorable documents and were hand scored by projectpersonnc ter they were thoroughly thstructed in thenecessa' T--,n,:edures. Scoring was under the direction of theProject actor. Approximately 30 percent of theinstrumen were rechecked by Dr. June Maul and the ProjectDirector--both having had extensive training and experiencein scoring moral/ethical judgment tests at the Center forMoral Education, Harvard University, directed by LawrenceKohlberg.
I. Data Anal-ses Procedures
Analysis of variance, analysis of -ovariance and t-tests werethe primary statistical tools employed. ANOVA and ANOCOVAwere used because the field test desirn required comparing ina single analysis the various cognitive factors which mightbe affecting the program as well as the relationship betweenmore than two measures. T-tests were used in analyzing thedata gathered for moral/ethical growth as a result of theintervention. Interpretations of significance were made atthe .05 confidenc.1 level. SPSS was the computer softwatapackage and all analyses were performed by ETS, Princeton,New Jersey.
V. Results
Cognitive Achievement
Pretest and posttest means and standard dLviations werecomputed (Table 2).
Pretest and posttest scores achieved by the treatment groupand the control group were compared using Analysis ofCovariance. In this analysis SCAT-V (ability) and pretestscores served as covariates (Table 3)
Pretest and posttest scores achieved by the treatment groupand the control group were compared using t-tests (Table 4).Control group Ss exhibited no significant changes in pretestto posttest comparison.
352
37r)
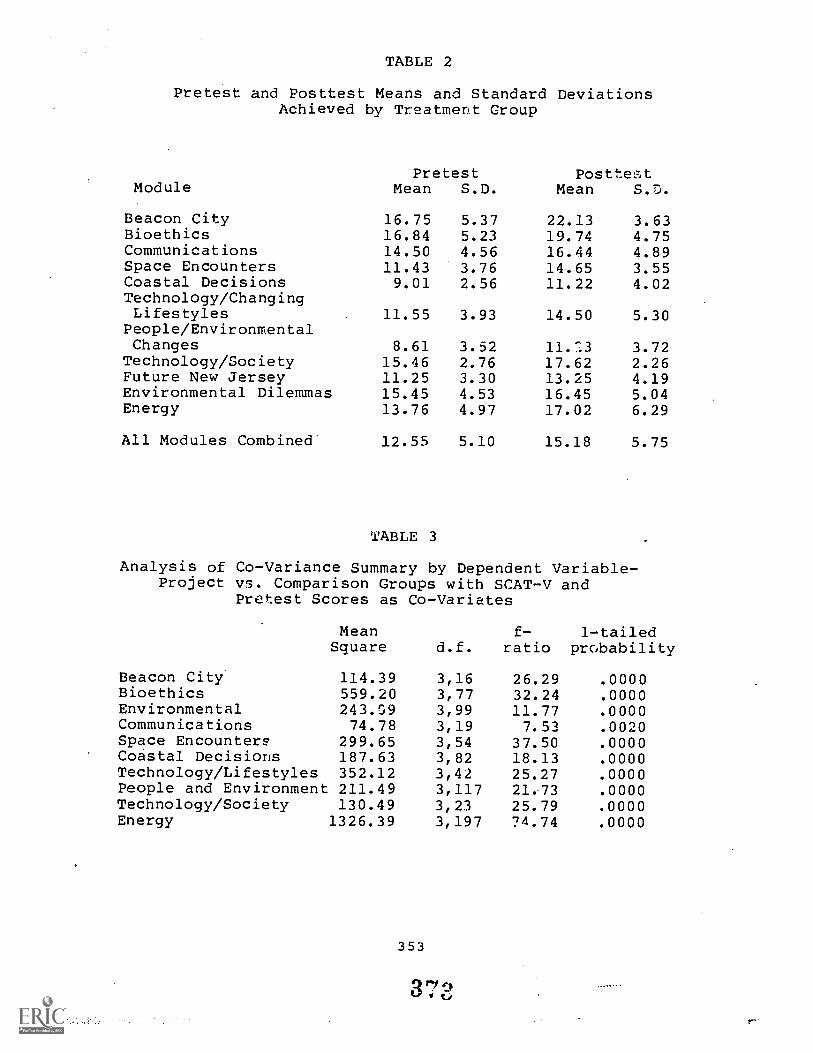
TABLE 2
Pretest and Posttest Means and StandardAchieved by Treatment Group
PretestModule Mean S.D.
Deviations
PosttestMean S..
Beacon City 16.75 5.37 22.13 3.63Bioethics 16.84 5.23 19.74 4.75Communications 14.50 4.56 16.44 4.89Space Encounters 11.43 3.76 14.65 3.55Coastal Decisions 9.01 2.56 11.22 4.02Technology/ChangingLifestyles 11.55 3.93 14.50 5.30People/EnvironmentalChanges 8.61 3.52 11.'13 3.72Technology/Society 15.46 2.76 17.62 2.26Future New Jersey 11.25 3.30 13.25 4.19Environmental Dilemmas 15.45 4.53 16.45 5.04Energy 13.76 4.97 17.02 6.29
All Modules Combined 12.55 5.10 15.18 5.75
TABLE 3
Analysis of Co-Variance Summary by Dependent Variable-Project vs. Comparison Groups with SCAT-V and
Pretest Scores as Co-Variates
MeanSquare d.f.
f-ratio
1-tailedprobability
Beacon City 114.39 3,16 26.29 .0000Bioethics 559.20 3,77 32.24 .0000Environmental 243.09 3,99 11.77 .0000Communications 74.78 3,19 7.53 .0020Space Encounters 299.65 3,54 37.50 .0000Coastal Decisions 187.63 3,82 18.13 .0000Technology/Lifestyles 352.12 3,42 25.27 .0000People and Environment 211.49 3,117 21.73 .0000Technology/Society 130.49 3,23 25.79 .0000Energy 1326.39 3,197 74.74 .0000
353
3,
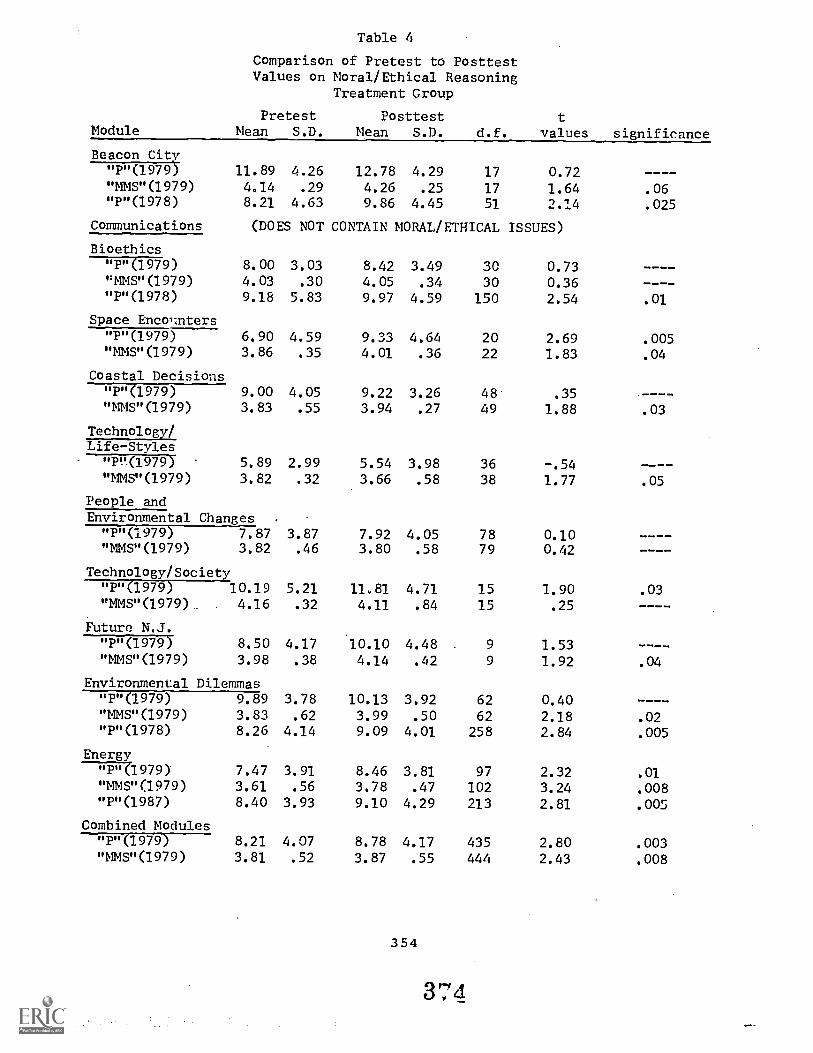
Table 4
Comparison of Pretest to PosttestValues on Moral/Ethical Reasoning
Treatment Group
ModulePretest
Nean S.D.Posttest
Mean S.D. d.f. values significance
Beacon City11.89 4.26 12.78 4.29 17 0.724.14 .29 4.26 .25 17 1.648.21 4.63 9.86 4.45 51 2.14
(DOES NOT CONTAIN MORAL/ETHICAL ISSUES)
-_-_
.06
.025
"P"(1979)"MMS"(1979)
"P"(1978)
Communications
Bioethics"P"(1979) 8.00 3.03 8.42 3.49 30 0.73'NMS" (1979) 4.03 .30 4.05 .34 30 0.36
"P"(1978) 9.18 5.83 9.97 4.59 150 2.54 .01
Space EncolInters
"P"(1979) 6.90 4.59 9.33 4.64 20 2.69 .005"MMS"(1979) 3.86 .35 4.01 .36 22 1.83 .04
Coastal Decisions
"P"(1979) 9.00 4.05 9.22 3.26 48 .35"MMS"(1979) 3.83 .55 3.94 .27 49 1.88 .03
Technology/Life-Styles
"P"(1979) 5.89 2.99 5.54 3.98 36 -.54"MMS"(1979) 3.82 .32 3.66 .58 38 1.77 .05
People andEnvironmental Changes
"P"(1979) 7.87 3.87 7.92 4.05 78 0.10 - _"MMS"(1979) 3.82 .46 3.80 .58 79 0.42
Technology/Society"P"(1979) 10.19 5.21 11,81 4.71 15 1.90 .03"MMS"(1979)._ . 4.16 .32 4.11 .84 15 .25 - - --
Future N.J."P"(1979) 8.50 4.17 10.10 4.48 . 9 1.53"MMS"(1979) 3.98 .38 4.14 .42 9 1.92 .04
Environmental Dilemmas"P"(1979) 9.89 3.78 10.13 3.92 62 0.40"MMS"(1979) 3.83 .62 3.99 .50 62 2.18 .02"P"(1978) 8.26 4.14 9.09 4.01 258 2.84 .005
Energy7771979) 7.47 3.91 8.46 3.81 97 2.32 .01"MMS"(1979) 3.61 .56 3.78 .47 102 3.24 .008"P"(1987) 8.40 3,93 9.10 4.29 213 2.81 .005
Combined Modules"P"(1979) 8.21 4.07 8.78 4.17 435 2.80 .003"MMS"(1979) 3.81 .52 3.87 .55 446 2.43 .008
354
3741
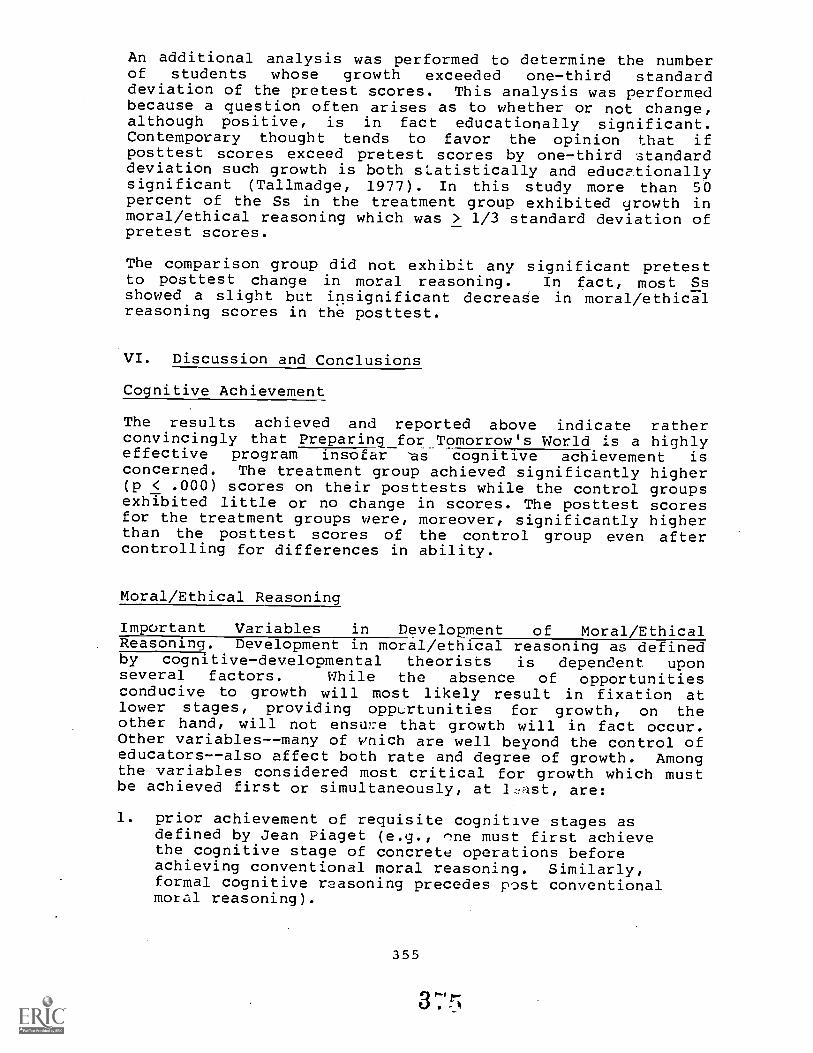
An additional analysis was performed to determine the numberof students whose growth exceeded one-third standarddeviation of the pretest scores. This analysis was performedbecause a question often arises as to whether or not change,although positive, is in fact educationally significant.Contemporary thought tends to favor the opinion that ifposttest scores exceed pretest scores by one-third standarddeviation such growth is both sLatistically and educationallysignificant (Tallmadge, 1977). In this study more than 50percent of the Ss in the treatment group exhibited growth inmoral/ethical reasoning which was > 1/3 standard deviation ofpretest scores.
The comparison group did not exhibit any significant pretestto posttest change in moral reasoning. In fact, most Ssshowed a slight but insignificant decreaSe in moral/ethicalreasoning scores in the posttest.
VI. Discussion and Conclusions
Cognitive Achievement
The results achieved and reported above indicate ratherconvincingly that Preparing for Tomorrow's World is a highlyeffective program insofar as cognitive achievement isconcerned. The treatment group achieved significantly higher(p < .000) scores on their posttests while the control groupsexhibited little or no change in scores. The posttest scoresfor the treatment groups were, moreover, significantly higherthan the posttest scores of the control group even aftercontrolling for differences in ability.
Moral/Ethical Reasoning
Important Variables in Development of Moral/EthicalReasoning. Development in moral/ethical reasoning as definedby cognitive-developmental theorists is dependent uponseveral factors. While the absence of opportunitiesconducive to growth will most likely result in fixation atlower stages, providing opportunities for growth, on theother hand, will not ensul:e that growth will in fact occur.Other variables--many of which are well beyond the control ofeducators--also affect both rate and degree of growth. Amongthe variables considered most critical for growth which mustbe achieved first or simultaneously, at 1,:qst, are:
1. prior achievement of requisite cognitive stages asdefined by Jean Piaget (e.g., 'ne must first achievethe cognitive stage of concrete operations beforeachieving conventional moral reasoning. Similarly,formal cognitive reasoning precedes post conventionalmoral reasoning).
355
,Q1
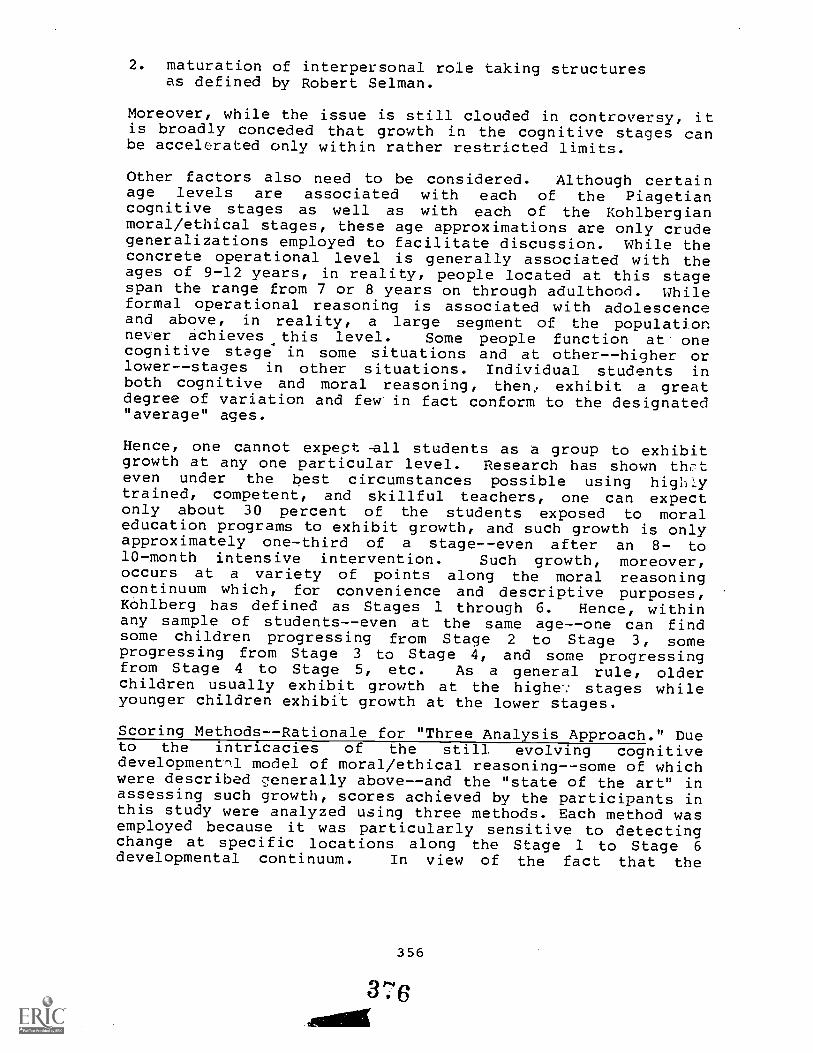
2. maturation of interpersonal role taking structuresas defined by Robert Selman.
Moreover, while the issue is still clouded in controversy, itis broadly conceded that growth in the cognitive stages canbe accelerated only within rather restricted limits.
Other factors also need to be considered. Although certainage levels are associated with each of the Piagetiancognitive stages as well as with each of the Kohlbergianmoral/ethical stages, these age approximations are only crudegeneralizations employed to facilitate discussion. While theconcrete operational level is generally associated with theages of 9-12 years, in reality, people located at this stagespan the range from 7 or 8 years on through adulthood. Whileformal operational reasoning is associated with adolescenceand above, in reality, a large segment of the populationnever achieves .this level. Some people function at onecognitive stage in some situations and at other--higher orlower--stages in other situations. Individual students inboth cognitive and moral reasoning, thene exhibit a greatdegree of variation and few in fact conform to the designated"average" ages.
Hence, one cannot expect -all students as a group to exhibitgrowth at any one particular level. Research has shown thrteven under the best circumstances possible using highlytrained, competent, and skillful teachers, one can expectonly about 30 percent of the students exposed to moraleducation programs to exhibit growth, and such growth is onlyapproximately one-third of a stage--even after an 8- to10-month intensive intervention. Such growth, moreover,occurs at a variety of points along the moral reasoningcontinuum which, for convenience and descriptive purposes,Kohlberg has defined as Stages 1 through 6. Hence, withinany sample of students--even at the same age--one can findsome children progressing from Stage 2 to Stage 3, someprogressing from Stage 3 to Stage 4, and some progressingfrom Stage 4 to Stage 5, etc. As a general rule, olderchildren usually exhibit growth at the highe-: stages whileyounger children exhibit growth at the lower stages.
Scoring Methods--Rationale for "Three Analysis Approach." Dueto the intricacies of the still evolving cognitivedevelopment-11 model of moral/ethical reasoning--some of whichwere described generally above--and the "state of the art" inassessing such growth, scores achieved by the participants inthis study were analyzed using three methods. Each method wasemployed because it was particularly sensitive to detectingchange at specific locations along the Stage 1 to Stage 6developmental continuum. In view of the fact that the
356
376Aiwa
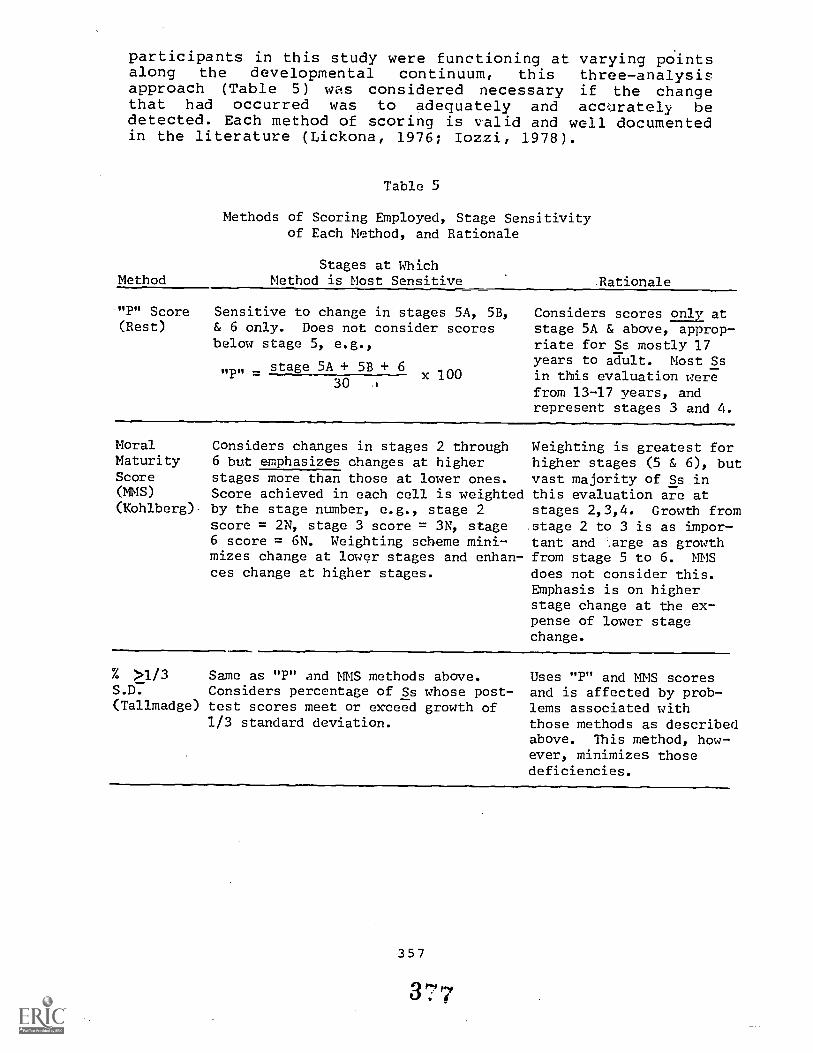
participants in this study were functioning at varying pointsalong the developmental continuum, this three-analysisapproach (Table 5) was considered necessary if the changethat had occurred was to adequately and accurately bedetected. Each method of scoring is valid and well documentedin the literature (Lickona, 1976; Iozzi, 1978).
Table 5
Methods of Scoring Employed, Stage Sensitivityof Each Method, and Rationale
Stages at WhichMethod Method is Most Sensitive Rationale
"P" Score Sensitive to change in stages 5A, 5B,(Rest) & 6 only. Does not consider scores
below stage 5, e.g.,
stage 5A 5B 6up, = X 10030
Considers scores only atstage 5A & above, approp-riate for Ss mostly 17years to adult. Most Ssin this evaluation werefrom 13-17 years, andrepresent stages 3 and 4.
MoralMaturityScore(MMS)(Kohlberg)-
Considers changes in stages 2 through6 but emphasizes changes at higherstages more than those at lower ones.Score achieved in each cell is weightedby the stage number, e.g., stage 2score = 2N, stage 3 score = 3N, stage6 score = 6N. Weighting scheme mini-mizes change at lower stages and enhan-ces change at higher stages.
%
Weighting is greatest forhigher stages (5 & 6), butvast majority of Ss inthis evaluation are atstages 2,3,4. Growth fromstage 2 to 3 is as impor-tant and .arge as growthfrom stage 5 to 6. MMSdoes not consider this.Emphasis is on higherstage change at the ex-pense of lower stagechange.
>1/3 Same as "P" and MMS methods above.S.D. Considers percentage of Ss whose post-(Tallmadge) test scores meet or exceed growth of
1/3 standard deviation.
Uses "P" and MMS scoresand is affected by prob-lems associated withthose methods as describedabove. This method, how-ever, minimizes thosedeficiencies.
357
3""
Results of Previous Intervention Studies. R:st (1976)summarized the results of 14 previous studies which attemptedto evaluate the effects of interventions designed to raisethe moral reasoning levels of children and adults. In eacb ofthe 14 studies cited by Rest, the intervention was taught byan expert and/or scholar in moral/ethical reasoning asdefined by Kohlberg. In contrast, Preparing lor Tomorrow'sWorld was taught by regular classroom teachers, newlyfamiliarized with the approach utilized for a minimal (insome cases only 2 to 3 hours) amount of time.
Rest's summary revealed the following:
--Only 2 of the 14 programs cited which includedjunior and/or senior 'high school students resultedin significant growth after the intervention. Bothof these orograms, moreover, required an inter-vention of one full semester (or one-half year).
--Only 2 of the 14 studies cited included a controlgroup for comparison purposes.
Kohlberg has addressed the issue of time vs. growth inmoral/ethical reasoning as a result of intervention programs(Hersh, et al., 1979). Citing that Blatt's dissertationexperiment was specifically, designed to stimulate moral stageadvance, -Kohlberg commented, "The experiment was designed totest the cognitive-developmental theory of moralchange...Blatt found that more than one-third of the studentsexposed to such discussions would advance during an academicyear in which control students remained essentiallystationary, and the change was always only to the next higherstage" (Hersh, et al., 1979, p. xiii).
In another major study conducted by Blatt and also quoted byKohlberg: "Overall, 18 sessions were held; they wereconducted twice a week for 45 minutes each. At theconclusion of the program, the students were retested.Students...showed an average increase of one-third of astage" (Hersh, et al., 1979, p. 108).
Conclusions--Moral/Ethical Reasoning
In view of the results presented in this paper and in view ofRest's extensive analysis, it is concluded that:
--The fact that statistically significant pretest toposttest growth was achieved by the treatment group("P" score analysis) for six individual modules(1978 and/or 1979) and all modules combined is bothstatistically and educationally significant. Thecomparison group showed no significant pretest toposttest change.
358
--The fact that statistically significant pretest toposttest growth was achieved by the treatment group("MMS" score analysis) for seven modules individually(1978 and/or 1979) and all modules combined is bothstatistically and educationally significant. Thecomparison group showed no significant pretest toposttest change.
--The fact that more than 50 percent of the Ss in thetreatment group exhibited growth in moral/ethicalreasoning which was > 1/3 standard deviation ofpretest score is statistically and educationallysignificant.
--Highly significant growth was achieved using "P" scoreand "MMS" score analysis with an intervention of only2 to 6 weeks maximum. No other reported programsand/or studies have achieved comparable results; fewstudies; despite significantly longer interventiontimes (up to one year), even approached the achieve-ment level obtained using eight of the Preparing forTomorrow's World modules.
The use of some modules with some classes did not result insignificant growth even though these modules utilized similarapproaches and the same curriculum model upon which thehighly successful modules were based.,- Several possiblerQasons can be suggested for this phenomena, These include:too brief an intervention period, loss of large amounts ofdata because of teacher error, excessive student absences,failure to complete module, and limited teacher training.Each of these possibilities will be explored in futurestudies. Nevertheless, the total effects of utilizing theentire program resulted in statistically and educationallysignificant growth in moral reasoning (Tables 2, 3 and 4).
359
REFERENCES
Beck, Clive M. 1972. Ethics. Toronto: McGraw-Hill.
Ferguson, George A. 1966. Statistical Analysis inPsychology and Education. New York: M.:Graw-Hill.
Gibbs, John L.; A. Colby Kohlberg; and Betsy Speicher-Dubin.. 1976. The Domain and Development of MoralJudgment. A Theory and Method of Assessment inJohn R. Meyer (ed.), Reflections on Values Education.Waterloo, Ontario, Canada: Wilfred Laurier UniversityPress.
Gruber, Howard E. and J. J. Voneche. 1977. The EsLentialPiaget. An Interpretive Reference and Guide. NewYork: Basic Books, Inc.
Hersh, : 'chard H.; Diana Paolitto; Joseph Reimer. 1979.Promoting Moral Growth from Piaget to Kohlberg. NewYork: Longman Press.
Iozzi, Louis A. 1976. Moral Judgment, Verbal Ability,Logical Reasoning_ thility and Environmental Issues.Doctoral dissertation, Rutgers--The State Universityof New Jersey.
Iozzi, Louis A. 1980. Education for the '80s and Beyond- -The Socio-Scientific Reasoning Model," in Needs ofElementary and Secondary Education in the '80s.Washington, DC: Government Printing Office, January.
Iozzi, Louis A. 1978. The Environmental Issues Test:A New Assessment Instrument for EnvironmentalEducation, in Craig B. Davis and Arthur Sacks (eds.),Current Issues in Environmental Education. Columbus,OH: ERIC/SMEAC Clearinghouse for Science, Mathematics,and Environmental Education, 200-206.
Iozzi, Louis A. and Janey Cheu. 1978. Preparing forTomorrow's World: An Alternative-Curriculum Modelfor the Secondary Schools. Paper presented at theFirst Annual Conference, Education Section, WorldFuture Society, University of Houston, Clear Lake'City, Texas, October 22.
Kagan, Jerome and Cynthia Lang. 1978. Psychology inEducation, An Introduction. New York: Harcourt,Brace, Jovanovich.
360
001flor,
!
Kohlberg, Lawrence. 1976. Moral Stages and Moralization:The Cognitive-Development Approach, in Thomas Lickona(ed.), Moral Development and Behavior: Theory,Research and Social Issues. New YorY: Holt,Rinehart and Winston.
Lickona, Thomas (ed.). 1976. Moral Development andBehavior. New York: Holt, Rinehardt and Winston.
Maul, June Paradise. 1978. A Study of the MoralAtmosphere in and the Development of Moral Reasoningin a School with Intensive Education. Doctoraldissertation, Rutgers--The State University of NewJersey.
Piaget, Jean. 1970. Piaget's Theory, in P. H. Mussen(ed.), Charmichaels' Manual of Child Psychology.New YorE7-7WrIey.
Piaget, Jean. 1977. To Understand is to Invent. NewYork: Penguin Books.
Rest, James, et al. 1977.. Development in Judging MoralIssues--A Summary of Research Using the DefiningIssues Test. Minnesota Moral Reaearch ProjectsTechnical Report No. 3, University of Minnesota.
Rest, James. 1976. New Approaches in the Assessment ofMoral Judgment, in Thomas Lickona (ed.), MoralDevelopment and Behavior: Theory, Research, andSocial Issues. New York: Holt, Rinehart andWinston.
Selman, Robert. 1976. Social-Cognitive Understanding:A Guide to Educational and Clinical Practice, inThomas Lickona (ed.), Moral Development and Behavior:Theory, Research, and Social Issues. New York:Holt, Rinehart and Winston.
Shane, Harold G. 1977. Curriculum Change Toward the 21stCentury. Washington, DC: National EducationAssociation.
Tallmadge, G. Kasten. 1977. Ideabook. The JointDissemination Review.Panel. Washington, DC: U.S.Department of Health, Education and Welfare, NationalInstitute of Education.
Tomlinson-Keasey, Carol and Clark B. Keasey. 1974. TheMediating Role of Cognitive Development in MoralJudgment. Child Development 45: 291-298.
361
3si
A LEARNING AND COMMUNICATIONS PROFILE OF TEACHERSENTERING AN ENVIRONMENTAL EDUCATION EXPERIENCE
David I. Johnson and Douglas C. Covert'
Abstract. A population of teachers attending an environ-mental teaching workshop indicated their use and perceptionsof mass media for environmental information. Generalinterest magazines were valued more highly than electronicmedia or special interest magazines. This population reliedheavily on knowledge already acquired or resources other thanmass media to resolve conflicting environmental information.
Introduction
The use and perceptions of mass media information sources byinservice teachers offers additional dimensions for rexam-ining preservice and inservice environmental educationtraining programs.
The investigation reported here centered on teachers of firstthrough twelfth grades entering an environmental educationexperience who were expected to conduct some form of-environmental education in their classrooms subsequent to theexperience. Mass Media use was examined to explore thesignificance of various media as they influence thecontinuing development of teachers' environmental attitudes,beliefs and behaviors.
Teachers are an especially important redistribution systembecause they participate in the total communication process(McNelly, 1973) and because "...teachers are importantrepresentatives of the attitudes toward which children aresocialized" (Hess and Torney, 1968). If the environmentalattitudes of teachers can be changed, reinforced, modified,or otherwise manipulated by mass communication, it isappropriate to identify the strength of media impingement.
Outside of the classroom, Sellers and Jones (1973) cite aninstance of mass media being avoided in an environmentalinfluence campaign, efforts to sway attitudes being directedat the interpersonal and quasi-mass communication systems.Stamm (1972) has described environmental campaigns and thecommunication problems which became evident during theefforts. Schoenfeld (1975) points to the successfulcommunication record of the federal bureaus and voluntary
1 Department of Fisheries and Wildlife, 13 NaturalResources, Michigan State University, East Lansing, MI48824.
362
3 p p
associations, especially the Cooperative Extension Service.However, except for the preservice teachers of Peyton (1977),there is little in the literature to show the masscommunication media use patterns of teachers for informationon environmental affairs.
Methodology
The population selected for this study consisted of 123teachers attending four, one-week, residential "Teachers'Environmental School" workshops conducted during the summerof 1978. Each workshop was staffed by faculty members fromMichigan universities. All workshops were held at the RalphA. MacMullan Conference Center, in a vacation resort area ofMichigan's northern lower peninsula. Graduate andundergraduate credits were offered and were interchangeablebetween the four universities participating, Michigan StateUniversity, central Michigan University, Eastern MichiganUniversity and Wayne State University.
The total population of 180 persons attending the foursessions surveyed was stratified on a single dimension,vocation, for primary analytis. Three strata wereestablished: "teachers," "employees of the MichiganDepartment of Natural Resources" and "others." The analysisfocused on the 123 teachers exclusive of the other strata.
Included in the analyzed population were a curriculumcoordinator, an elementary school principal and an assistantsuperintendent in a small district. Although these threemight not have been currently active in the classroom, theyperceived themselves as teachers and were included in the 123member population because of their direct influence onenvironmental education in their schools.
Experimental Design
Each participant was asked to complete a questionnaire as anopening activity of the week-long workshop program. Theeight-page questionnaire, containing 88 numbered items, wasdistributed by the researcher at the conclusion of a briefintroduction and collected by the researcher as it wascompleted by each person.
Data evaluation included descriptive statistics and bothparametric and nonparametric statistical procedures availablein the Statistical Package for the Social Sciences (SPSS)version 7.0 available at the Michigan State UniversityComputer Center.
363
3
Statistical Procedures Used. Frequency distributions,central tendencies and degrees of dispersion offered theprimary descriptive information. The mean was used as thepreferred indicator of central tendency and the measure ofvariability was standard deviation. Error limits at a 95percent confidence interval indicated the degree to which thegroup served as an adequate simple random sample and was auseful reliability indicator for the data summaries.
Three indices were devised to consolidate informationcollected about the respondents' attitudes toward environ-mental affairs, personal actions concerning environmentalmatters, and professional environmental education practices.These indices allowed convenient comparisons within theframework of the study. (For index development rationale,see Covert, 1980, pp. 91-2, 116-9, 151-6.)
The formulas for the three indices were:
Attitude Index = (Attitude Measure + EnvironmentalEducation Content Perception) 100/156
Personal Action Index = [(Public Defense of Views x7) + (Recycling Practices x 2) + (Attempt toInfluence Local Government x 28) + (Attempt toInfluence Legislation x 14) + (Attempt to InfluenceNongovernment Institutions x 14)] 100/77
E.E. Practices Index = [(Minutes per week in E,E./6::,+ (Outdoor Learning Practices) + (Out-of-schoolEnvironmental Activity Frequency) + (E.E. WorkshopAttendance) + (NEEA Membership) + (E.E. ContentPerception/14)] 100/35
The data offered in this report apply to the populationstudied. Inferences to larger populations should beapproached with care.
Assumptions and Limitations. This population was made up ofself-selected representatives of the teaching profession whowere demonstrating through behavior an interest in theirbiophysical surroundings, environmental education or both.Post-data collection interviews and observations supportedthis assumption.
The group was expected to respond favoring perceivedresearcher expectations, particularly considering the natureof the survey and the physical surroundings. Questionnaireconstruction and cross-check items were designed to attenuatesuch bias. Discrepancies between responses and reality werealso expected. Analysis of the complete survey dataindicated minimal bias (Covert, 1980, pp. 31-32).
364
There is always the question of memory accuracy. Responseswere assumed to accurately reflect the perceptions and recallof the respondents at the time. It was assumed, too, thatvariations would tend to be distributed normally throughoutthe population. Statistical treatments were expected toalleviate at least some of the inaccuracies resulting fromfaulty memories. Relationships would be stabilized by thePopulation size and verification items in the questionnaire.
Results and Discussion
Workshop Attendance and Classroom Practices. One-third ofthese teachers indicated they spent 10 minutes or less perweek on environmental education as they perceived it (Table1). One-quarter of this same third attended one or moreworkshops or seminars on environmental education during thePreceding year.
More than one-quarter of the population spent 26-50 minutesper week on environmental education while less than half ofthis same group attended sessions for skill improvement.
There was little apparent relationship between 'orkshopattendance and school time committed to environmentaleducation (Table 1). These teachers seemed to attendworkshops without a particularly high time commitment toenvironmental education in their classrooms, although theexposure may have improved the quality of the instructionaltime. Advpcates of holism in environmental education willProbably be disappointed to see such a modest proportion ofthe school week perceived as a part of environmentaleducation activity.
Simplified interpretation of the data in Table 1 should beapproached carefully. For instance, the 26-50 minutecategory .nay represent a reported 5 to 10 minutes per day orone "class period" per week, implying quite differentapproaches to the study of environmental matters.
Professional Membership. Less than one-quarter of thtteachers surveyed belonged to the Michigan EnvironmentalEducation Association, the professional association createdand maintained to assist teachers in the conduct ofenvironmental education. On the other hand, these sameteachers belonged to an average of two other professionalorganizations (mean 2.065; SD 1.08; 95 percent C.I. 9.3Percent; P1 = 123).
365
3 r-
TABLE 1
WORKSHOP ATTENDANCE--CONTINGENCY TABLE ANALYSIS,MINUTES IN SCHOOL PROGRAM BY WORKSHOP ATTENDANCE
Minutesper week
Number of Workshops Attended
0 1 2 3 4 5
percent of total respondents rowtotal
0 21.3 3.3 2.5 .8 27.91-10 4.1 .8 .8 5.7
11-25 9.0 2.511.5
26-50 14.8 9.0 1.6 .8 26.251-75 5.7 1.6 .8 .8 .8 9.8
76 -100 2.5 1.6 .8 4.9101-125 2.5
2.5126-150- .8 .8 .8 2.5151-250 2.5
2.5251-HI .8 3.3 1.6 .8 6.6
total 63.1 23.0 8.2 4.9 .8 N=122Chi square = 43.21; df = 36; significaice = 0.19Cramer's V = 0.298Kendall's tau c = 0.186; significance = 0.002Gamma = 0.327Pearson's r = 0.248; significance = 0.003; r2 = 0.061
366
3
Continuing Information Source Use
Exposure Quantity Per Day. The population was asked toreport the total time per day spent with each of the fourmass media listed (Table 2). The data are not a measure oftime quality. The radio or television may be "on" withoutmuch attention directed to the contnt. Magazines may beperused for their pictures rather than their verbiage.Newspapers may be selectively read for other than generalnews content.
The first ..tint of interest is the high incidence of use,noted in 'le r.olumn labeled "Users Percent" (Table 2). Thefigures in this column represent the percentages of thoseteachers reporting the use of each medium on a daily basis.
Less than 5 percent of these teachers spent more than threehours per day with the print media but over 35 percent spentmore than three hours per day with radio and televisioncombined (Figure 1). Considerable discretionary time wasrecalled as spent ir the company of electronic media,slightly more than twice as much as with print media.
TABLE 2
CONTINUING INFORMATION SOURCE PROFILE-MINUTES PER DAY WITH MEDIUM
N Mean SD95% C.I. Mean
hoursUsers
or -
Magazines 122 42.484 35.254 6.319 14.9 O. 739 95.9
Newspapers 123 47.846 27.803 4.963 10.4 0.797 94.3
Television 123 93.049 56.943 10.164 10.9 1.55 93.c
Radio 122 112.992 138.358 24.799 21.9 1.88 87.7
Inquiry was made as to the number of times per day eachrespondent watched television news or listened to radio news,(Figure
367
37
A. Print B. Electronic( Magazines plus Newspapers) (Television plus Radio)
percent0 20 40 60 80 100 0 20 40 60 800 i 2.4 0 1.630 6.4 30 2.460 31.7 60 6.590 26.8 90 5.7
tr ,) 120 21.1 01
120a) 13.8c...= 150
180.8
6.c 150i 180
12.221.9
210 i .8 210 6.5240 I 2.4 240 10.6270+ .8 270 .8300 4.9330 .8360 4.1(N= 123)390 (N= 123) .8420 1.6
450+ 5.7
MEAN = 88.25S.D. :: 4.8.5595% C.i.= -± 8.74, 9.9%
MEAN = 187.88S.D. =105.9695% C.1.= ± 19.32. 10.3%
180 min.( 3 hrs.1= 95.7 % 180 min. (3 hrs.) = 64.1%8 hrs. or more = 5.7 %
Figure 1. Combined Electronic Media and Print Medi:i.
Exposure Minutes Per Day
368
3.8
100
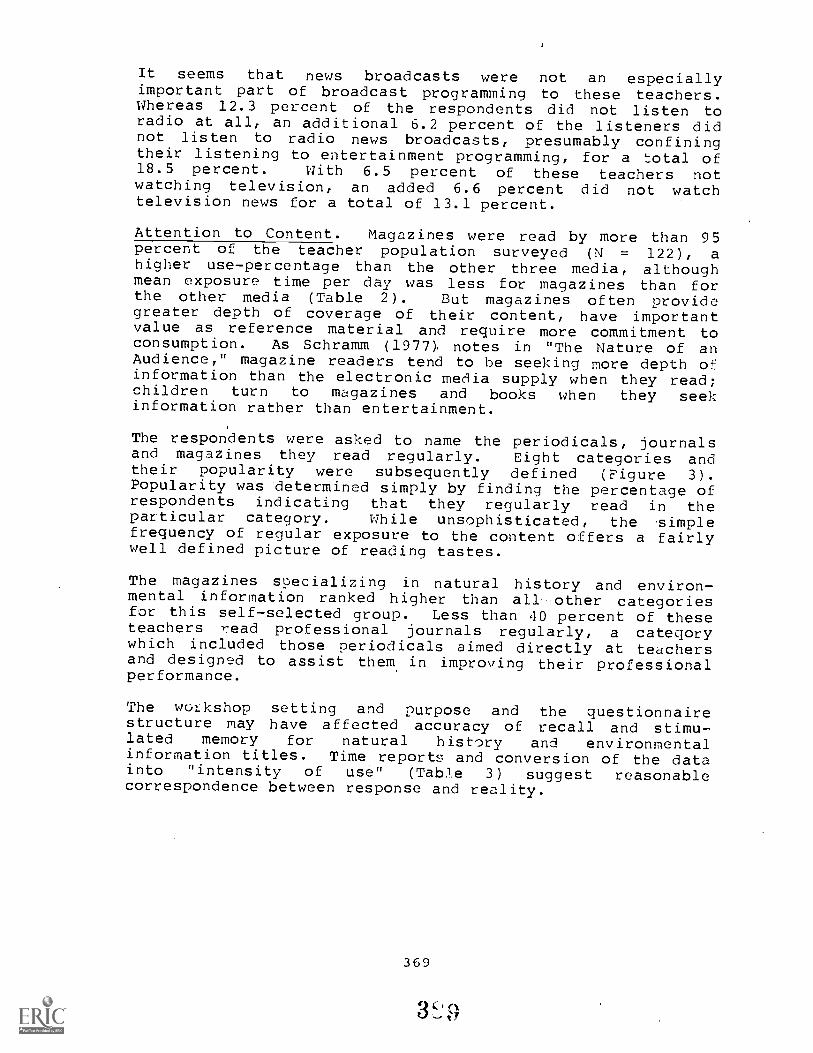
It seems that news broadcasts were not an especiallyimportant part of broadcast programming to these teachers.Whereas 12.3 percent of the respondents did not listen toradio at all, an additional 6.2 percent of the listeners didnot listen to radio news broadcasts, presumably confiningtheir listening to entertainment programming, for a total of18.5 percent. With 6.5 percent of these teachers notwatching television, an added 6.6 percent did not watchtelevision news for a total of 13.1 percent.
Attention to Content. Magazines were read by more than 95percent of the teacher population surveyed (N = 122), ahigher use-percentage than the other three media, althoughmean exposure time per day was less for magazines than forthe other media (Table 2). But magazines often providegreater depth of coverage of their content, have importantvalue as reference material and require more commitment toconsumption. As Schramm (1977), notes in "The Nature of anAudience," magazine readers tend to be seeking more depth ofinformation than the electronic media supply when they read;children turn to magazines and books when they seekinformation rather than entertainment.
The respondents were asked to name the periodicals, journalsand magazines they read regularly. Eight categories andtheir popularity were subsequently defined (Figure 3).Popularity was determined simply by finding the percentage ofrespondents indicating that they regularly read in theparticular category. While unsophisticated, the simplefrequency of regular exposure to the content offers a fairlywell defined picture of reading tastes.
The magazines specializing in natural history and environ-mental information ranked higher than allother categoriesfor this self-selected group. Less than 40 percent of theseteachers read professional journals regularly, a categorywhich included those periodicals aimed directly at teachersand designed to assist them in improving their professionalperformance.
The workshop setting and purpose and the questionnairestructure may have affected accuracy of recall and stimu-lated memory for natural history and environmentalinformation titles. Time report; and conversion of the datainto "intensity of use" (Table 3) suggest reasonablecorrespondence between response and reality.
369
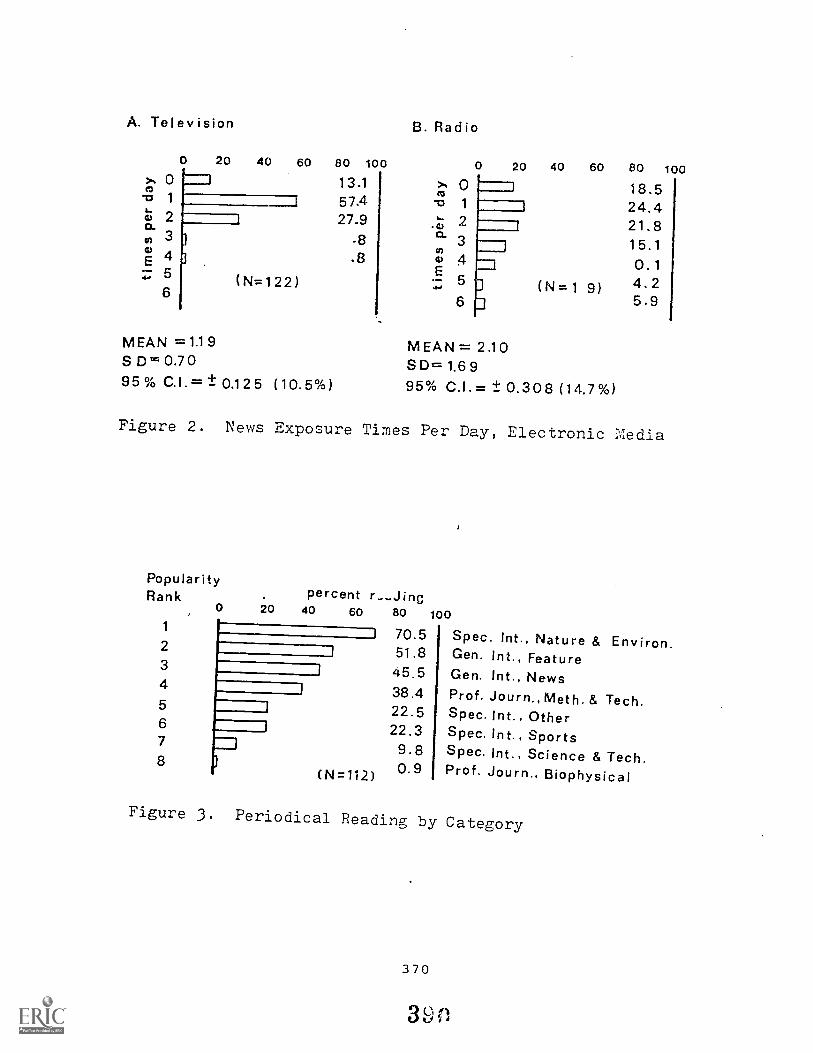
A. Television
0
>-. 00v 1
L.0 2a.a) 3
; 456
20 40 60 80 100
13.157,427.9
-88
B. Radio
>, 0-mcs 1
L.. 20a3
ct)
co 4E4, 5 '3
6
0 20 40
(N=1
60
9)
80
18.524.421.815.10.14.25.9
100
1
1
I
(N=122)
1=3
MEAN =1.19S 1:11c 0.70
95% C.I.= 1.-* 0.125 (10.5%)
MEAN= 2.10S D= 1.6 995% C.I.= ± 0,308 (14.7%)
Figure 2. News Exposure Times Per Day, Electronic Media
PopularityRank
0 20 40percent rJinc
60 80 1001
I 70.5 Spec. Int., Nature & Environ.21 51.8 Gen. Int., Feature3
I 45.5 Gen. Int., News41 38.4 Prof. Journ., Meth. & Tech.5 I 22.5 Spec. Int., Other6 1 22.3 Spec. Int., Sports7 = 9.8 Spec. Int., Science & Tech.8 l
(N=112) 0.9 Prof. Journ., Biophysical
Figure 3. Periodical Reading by Category
370
3cifloi,
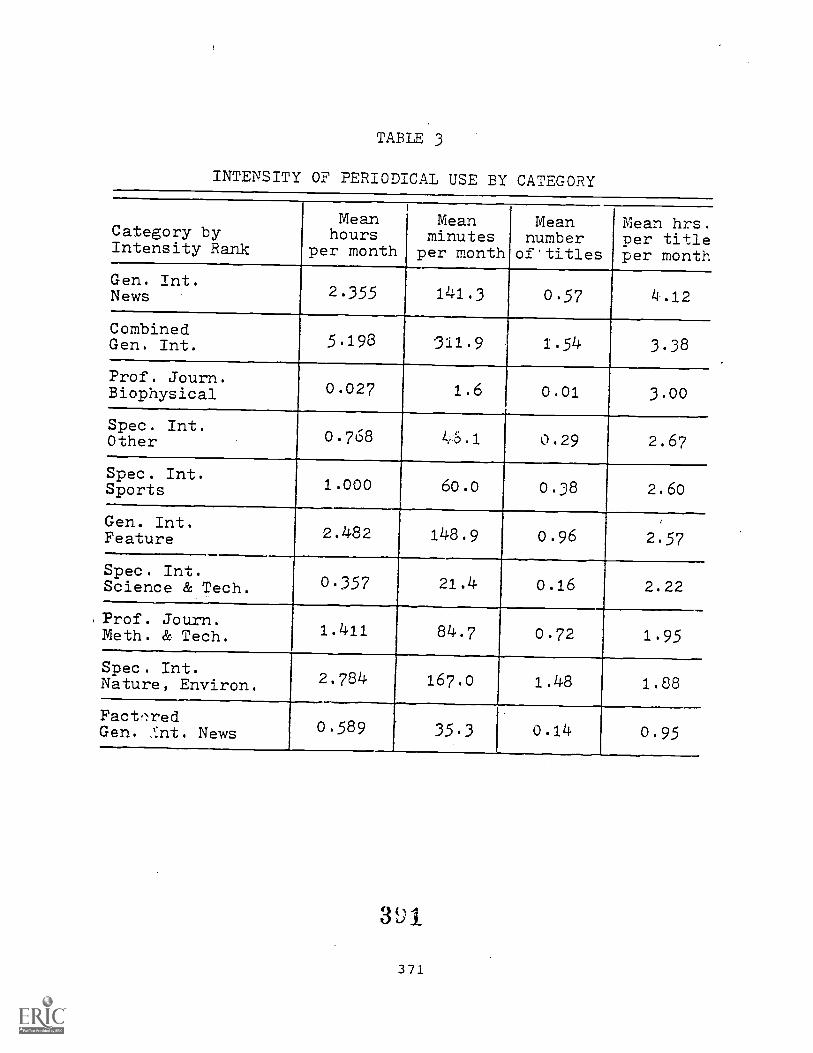
TABLE 3
INTENSITY OF PERIODICAL USE BY CATEGORY
Category byIntensity Rank
Meanhours
per month
Meanminutes
per month
Meannumberof'titles
Mean hrs.per titleper month
Gen. Int.News 2.355 141.3 0.57 4.12
CombinedGen. Int. 5.198 '311.9 1.54 3.38
Prof. Journ.Biophysical 0.027 1.6 0.01 3.00
Spec. Int.Other 0.768 46.1 0.29 2.67
Spec. Int.Sports 1.000 60.0 0.38 2.60
Gen. Int.Feature 2.482 148.9 0.96 2.57
Spec. Int.Science & Tech. 0.357 21.4 0.16 2.22
Prof. Journ.Meth. & Tech. 1.411 84.7 0.72 1.95
Spec. Int.Nature, Environ. 2.784 167.0 1.48 1.88
FactoredGen. .':nt. News 0.589 35.3 0.14 0.95
3',31
371
Cosmopolitan interests were suggested in the high frequencyof exposure to the two categories of general interestmagazines, News and Features. When these two categories werecombined, 69.6 percent regularly read in one or both'categories. Attention to General Interest magazines and toNature and Environment magazines then became essentiallyequal.
Numbers of contacts are only the beginnings of quantityevaluation. The time spent with each periodical categoryexpands this evaluation potential and offers some indicationof the "quality" of the contacts. Combining the number oftitles read per month and the hours spent each month witheach title provided an approximate measure of magazine use
iintensity in each category, or the thoroughness with whichthese magazines were read (Table 3).
The cate.,o-)-ies were ranked (Table 3) according to mean hoursper titl,% per month--the intensity of use per title. Thisalso suggested the attention-to-content ranking andintensity. General Interest News magazines received the mostintensive use. Although probably a function of their weeklyfrequency, this intense use indicates that a large amount ofinformation may be acquired, or enceunteced, with potentialfor considerable reinforcement from this source. Thereduction to last place of Special Interest Nature,Environment magazines indicated that consumption in thiscategory was comparatively superfir.ial.
Information Source Evaluation
Cr=!dibilitY. Although the quantity of exposure to mass mediainformation sources has important relevance to adetermination of communication effects, the audienceperceptions of quality in the exposure must not beoverlooked. Respondents were asked to indicate theircredibility rating of several subdivisions of tEe electronicmass media on a seven-segment scale (Figure 4).
These ratings suggest that electronic media may be dividedinto two major credibility groupings for these teachers.Television documentaries, special television programs andpublic television make up the more credible group, whereasnews programs from any source make up the less crediblegroup. Radio "specials" may have suffered due to perceptionas expanded news programs rather than distinctly specialprog rams.
372
3o2
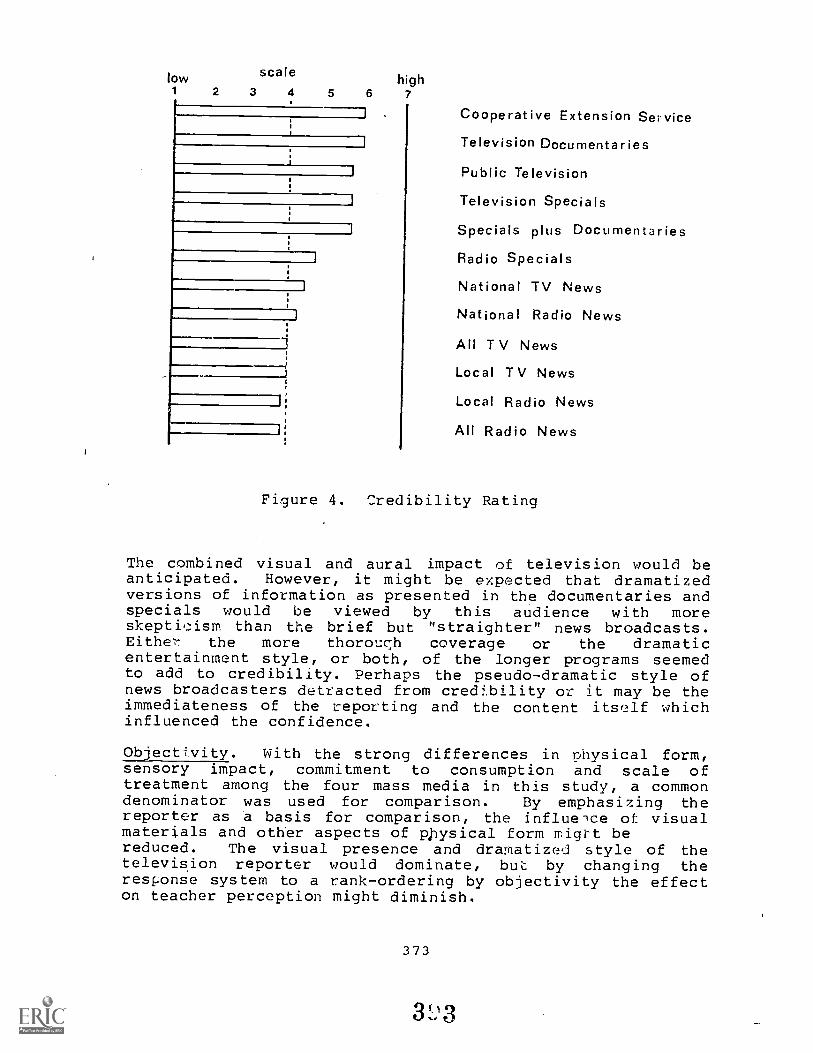
low scale1 2 3 4.1
high5 6 7
Cooperative Extension Service
Television Documentaries
Public Television
Television Specials
Specials plus Documentaries
Radio Specials
National TV News
National Radio News
All T V News
Local TV News
Local Radio News
All Radio News
Figure 4. Credibility Rating
The combined visual and aural impact of television would beanticipated. However, it might be expected that dramatizedversions of information as presented in the documentaries andspecials would be viewed by this audience with moreskepticism than the brief but "straighter" news broadcasts.Either the more thorouch coverage or the dramaticentertainment style, or both, of the longer programs seemedto add to credibility. Perhaps the pseudo-dramatic style ofnews broadcasters detracted from credibility or it may be theimmediateness of the reporting and the content itself whichinfluenced the confidence.
Objectivity. With the strong differences in physical form,sensory impact, commitment to consumption and scale oftreatment among the four mass media in this study, a commondenominator was used for comparison. By emphasizing thereporter as a basis for comparison, the influe'ce of visualmaterials and other aspects of physical form might bereduced. The visual presence and dramatized style of thetelevis,ion reporter would dominate, buy by changing theresconse system to a rank-ordering by objectivity the effecton teacher perception might diminish.
373
3)3
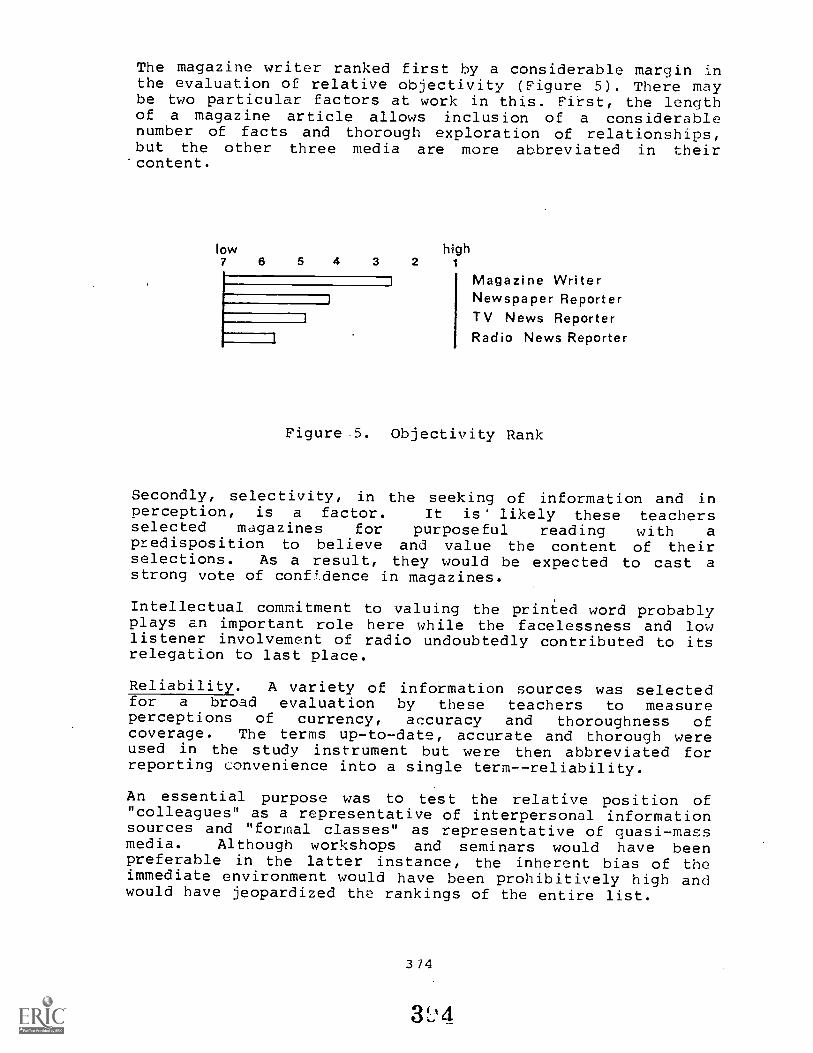
The magazine writer ranked first by a considerable margin inthe evaluation of relative objectivity (Figure 5). There maybe two particular factors at work in this. First, the lengthof a magazine article allows inclusion of a considerablenumber of facts and thorough exploration of relationships,but the other three media are more abbreviated in theircontent.
low7 6 5 4 3 2
1 i
1
1
1
high
Magazine WriterNewspaper ReporterTV News ReporterRadio News Reporter
Figure .5. Objectivity Rank
Secondly, selectivity, in the seeking of information and inperception, is a factor. It is likely these teachersselected magazines for purposeful reading with apredisposition to believe and value the content of theirselections. As a result, they would be expected to cast astrong vote of confdence in magazines.
Intellectual commitment to valuing the printed word probablyplays an important role here while the facelessness and lowlistener involvement of radio undoubtedly contributed to itsrelegation to last place.
Reliability. A variety of information sources was selectedfor a broad evaluation by these teachers to measureperceptions of currency, accuracy and thoroughness ofcoverage. The terms up-to-date, accurate and thorough wereused in the study instrument but were then abbreviated forreporting convenience into a single term--reliability.
An essential purpose was to test the relative position of"colleagues" as a representative of interpersonal informationsources and "formal classes" as representative of quasi-massmedia. Although workshops and seminars would have beenpreferable in the latter instance, the inherent bias of theimmediate environment would have been prohibitively high andwould have jeopardized the rankings of the entire list.
3 74
3`'4
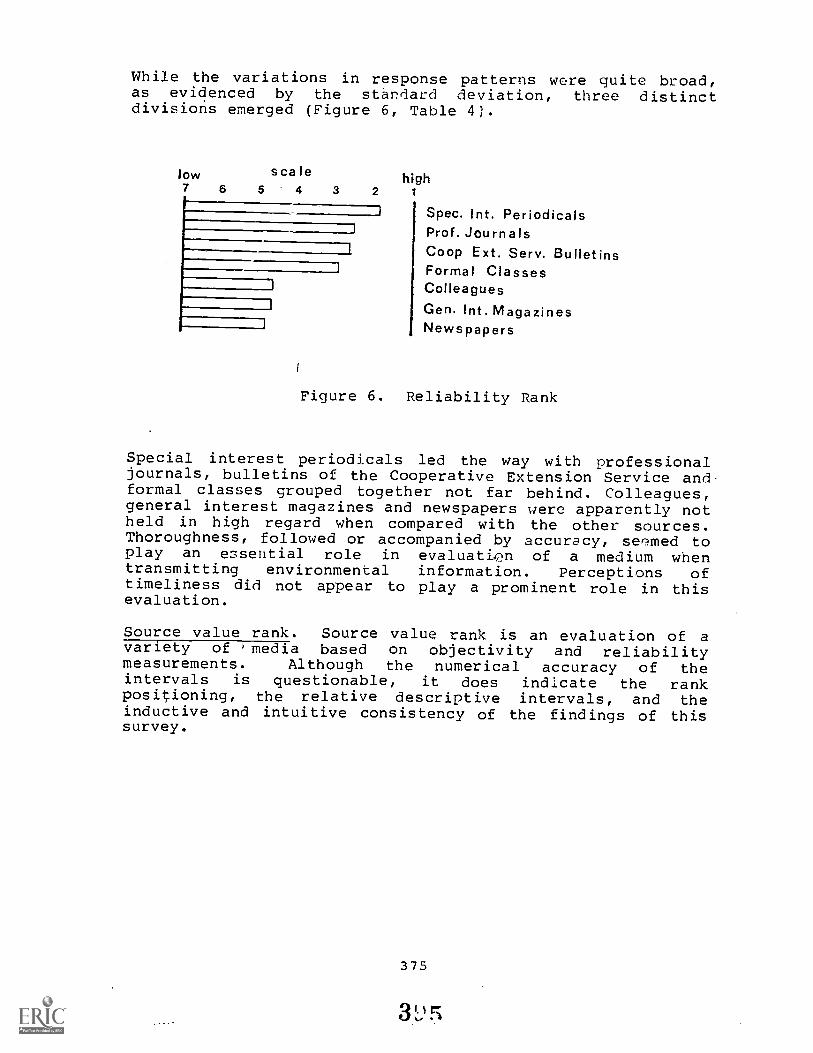
While the variations in response patterns were quite broad,as evidenced by the standard deviation, three distinctdivisions emerged (Figure 6, Table 4).
low scale7 6 5 4
1
1
3
1
J
J
high2 1
Spec. Int. PeriodicalsProf. JournalsCoop Ext. Serv. BulletinsFormal ClassesColleaguesGen. Int. MagazinesNewspapers
Figure 6. Reliability Rank
Special interest periodicals led the way with professionaljournals, bulletins of the Cooperative Extension Service and-formal classes grouped together not far behind. Colleagues,general interest magazines and newspapers were apparently notheld in high regard when compared with the other sources.Thoroughness, followed or accompanied by accuracy, seemed toplay an essential role in evaluatir;)n of a medium whentransmitting environmental information. Perceptions oftimeliness did not appear to play a prominent role in thisevaluation.
Source value rank. Source value rank is an evaluation of avariety of 'media based on objectivity and reliabilitymeasurements. Although the numerical accuracy of theintervals is questionable, it does indicate the rankpositioning, the relative descriptive intervals, and theinductive and intuitive consistency of the findings of thissurvey.
375
3:.'
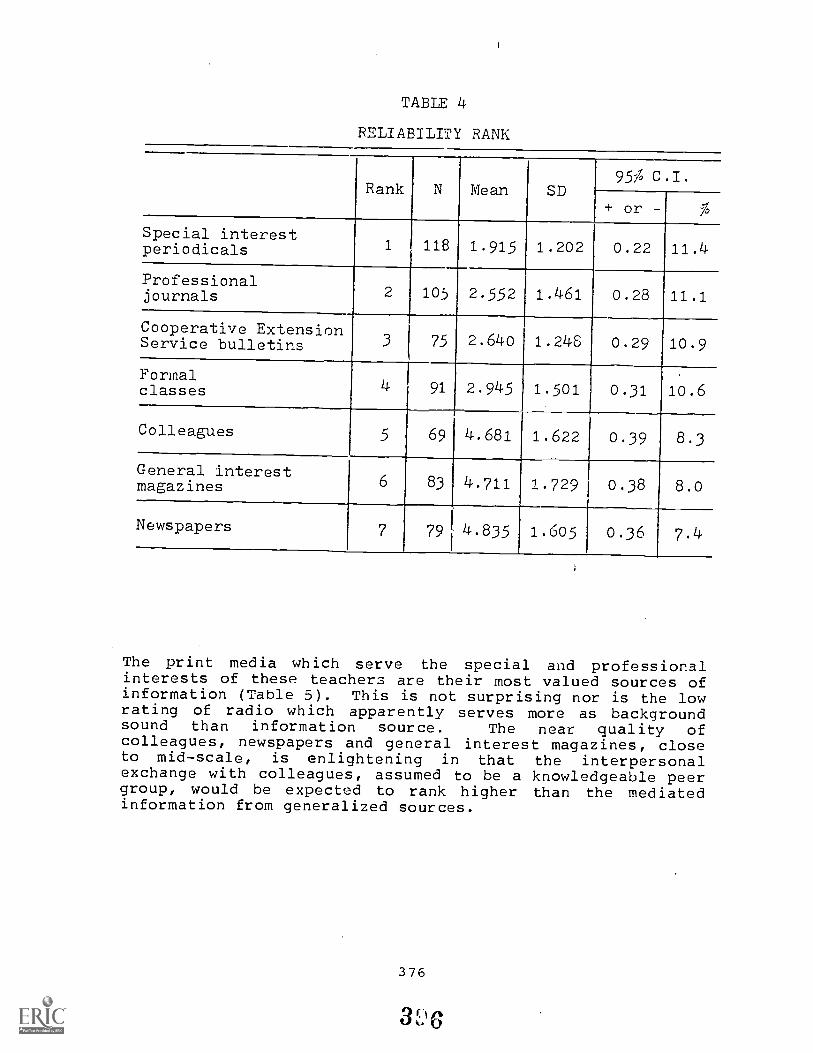
TABLE 4
RELIABILITY RANK
Rank N Mean SD95/, C I.
+ or - %
Special interestperiodicals 1 118 1.915 1.202 0.22 11.4
Professionaljournals 2 105 2.552 1.461 0.28 11.1
Cooperative ExtensionService bulletins 3 75 2.640 1.248 0.29 10.9
Formalclasses 4 91 2.945 1.501 0.31 10.6
Colleagues 5 69 4.681 1.622 0.39 8.3
General interestmagazines 6 83 4.711 1.729 0.38 8.0
Newspapers 7 79 4.835 1.605 0.36 7.4
The print media which serve the special and professionalinterests of these teachers are their most valued sources ofinformation (Table 5). This is not surprising nor is the lowrating of radio which apparently serves more as backgroundsound than information source. The near quality ofcolleagues, newspapers and general interest magazines, closeto mid-scale, is enlightening in that the interpersonalexchange with colleagues, assumed to be a knowledgeable peergroup, would be expected to rank higher than the mediatedinformation from generalized sources.
376
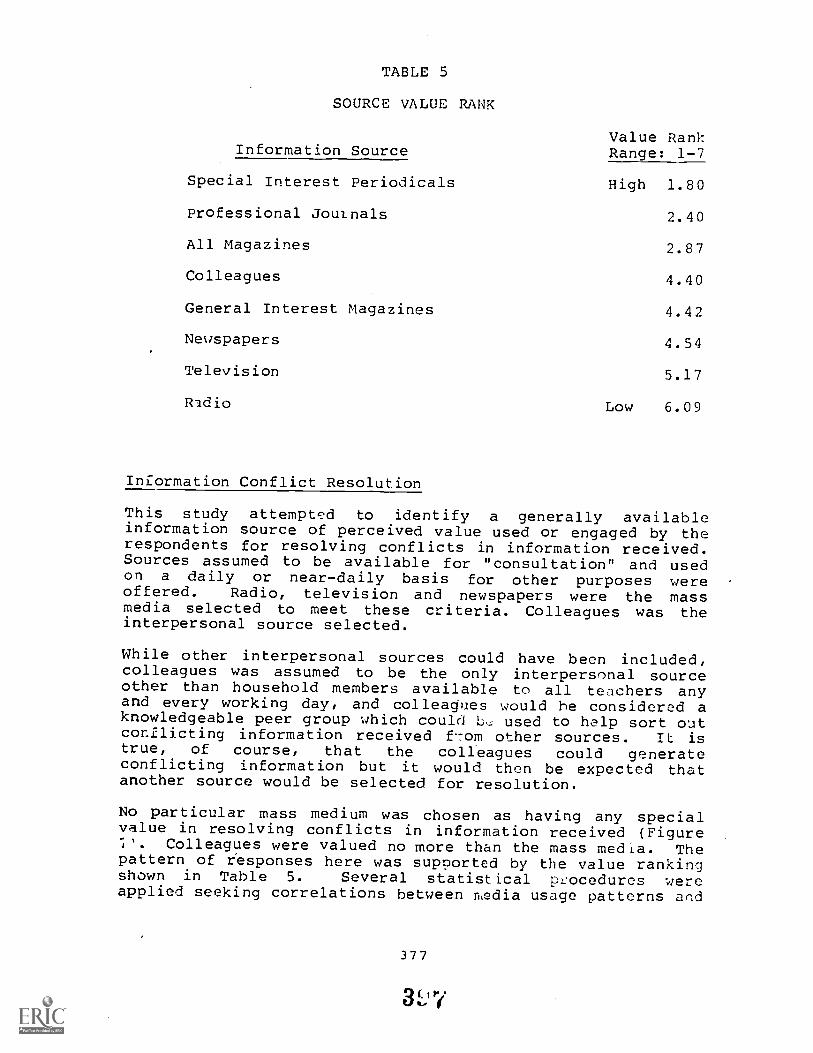
TABLE 5
SOURCE VALUE RANK
Value RankInformation Source Range: 1-7
Special Interest Periodicals High 1.80
Professional JouLnals 2.40
All Magazines 2.87
Colleagues 4.40
General Interest Magazines 4.42
Newspapers 4.54
Television 5.17
Radio Low 6.09
Information Conflict Resolution
This study attempt"d to identify a generally availableinformation source of perceived value used or engaged by therespondents for resolving conflicts in information received.Sources assumed to be available for "consultation" and usedon a daily or near-daily basis for other purposes were -
offered. Radio, television and newspapers were the massmedia selected to meet these criteria. Colleagues was theinterpersonal source selected.
While other interpersonal sources could have been included,colleagues was assumed to be the only interpersonal sourceother than household members available to all teachers anyand every working day, and colleagues would he considered aknowledgeable peer group which could used to help sort oatconflicting information received f7om other sources. It istrue, of course, that the colleagues could generateconflicting information but it would then be expected thatanother source would be selected for resolution.
No particular mass medium was chosen as having any specialvalue in resolving conflicts in information received (Figure
Colleagues were valued no more than the mass media. Thepattern of responses here was supported by the value rankingshown in Table 5. Several statistical procedures wereapplied seeking correlations between media usage patterns and
377
2(IriGP4
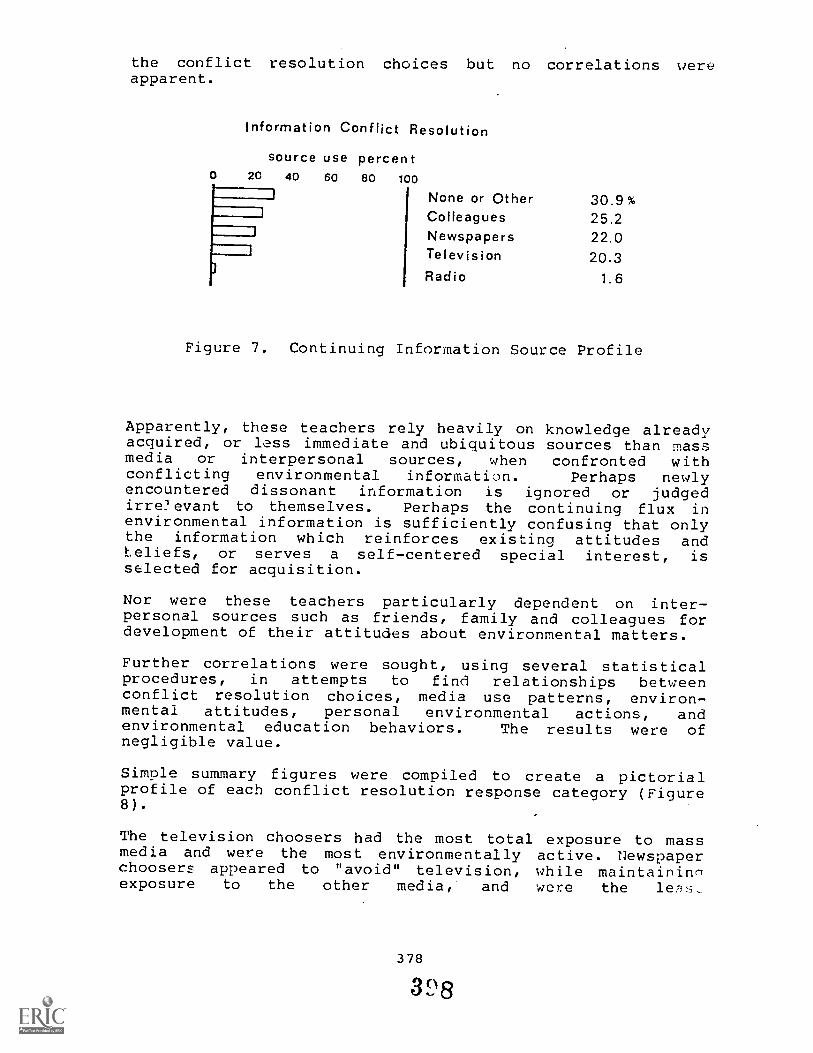
the conflict resolution choices but no correlations .ereapparent.
Information Conflict Resolution
source use percent0 20 40 60 80 100
None or Other 30.9%Colleagues 25.2Newspapers 22.0Television 20.3Radio 1.6
Figure 7. Continuing Information Source Profile
Apparently, these teachers rely heavily on knowledge alreadyacquired, or lass immediate and ubiquitous sources than massmedia or interpersonal sources, when confronted withconflicting environmental information. Perhaps newlyencountered dissonant information is ignored or judgedirre:ievant to themselves. Perhaps the continuing flux inenvironmental information is sufficiently confusing that onlythe information which reinforces existing attitudes andLeliefs, or serves a self-centered special interest, isselected for acquisition.
Nor were these teachers particularly dependent on inter-personal sources such as friends, family and colleagues fordevelopment of their attitudes about environmental matters.
Further correlations were sought, using several statisticalprocedures, in attempts to find relationships betweenconflict resolution choices, media use patterns, environ-mental attitudes, personal environmental actions, andenvironmental education behaviors. The results were ofnegligible value.
Simple summary figures were compiled to create a pictorialprofile of each conflict resolution response category (Figure8).
The television choosers had the most total exposure to massmedia and were the most environmentally active. Newspaperchoosers appeared to "avoid" television, while maintaininnexposure to the other media, and were the
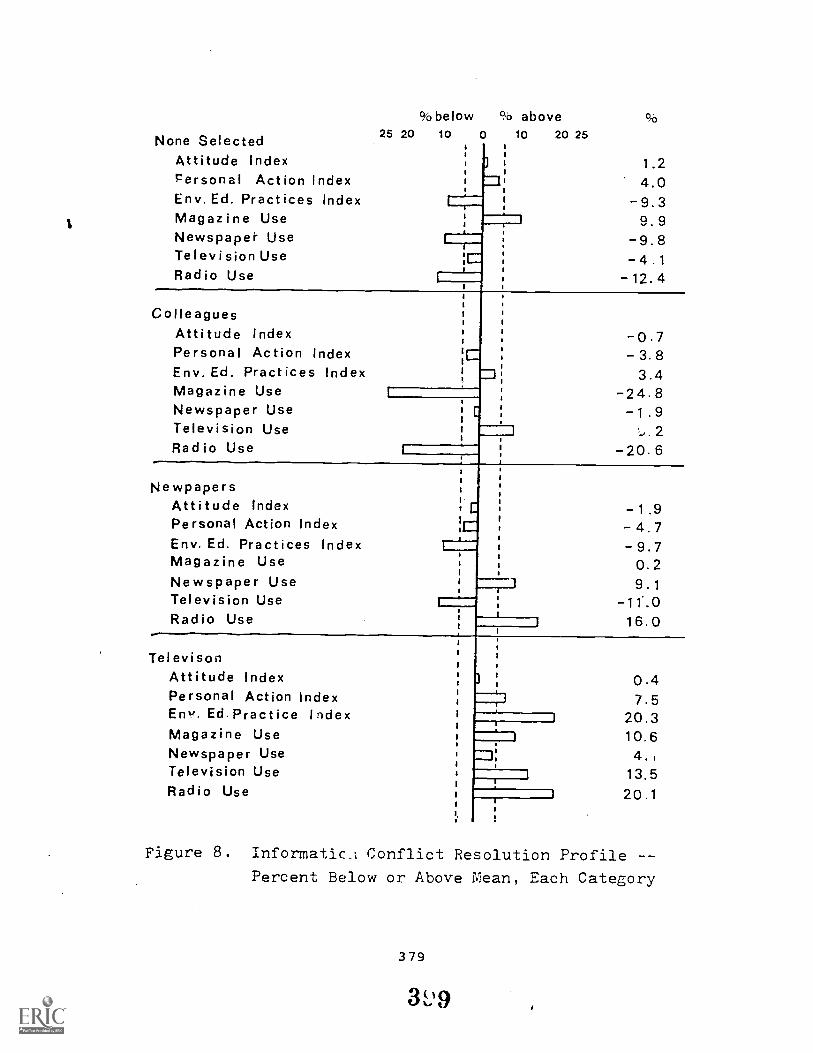
None SelectedAttitude IndexPersonal Action IndexEnv. Ed. Practices IndexMagazine UseNewspaper UseTelevision UseRadio Use
%below25 20 10
ColleaguesAttitude IndexPersonal Action IndexEnv. Ed. Practices IndexMagazine UseNewspaper UseTelevision UseRadio Use
1
NewpapersAttitude IndexPersonal Action IndexEnv. Ed. Practices IndexMagazine UseNewspaper UseTelevision UseRadio Use
TelevisonAttitude IndexPersonal Action IndexEnv. Ed.Practice IndexMagazine UseNewspaper UseTelevision UseRadio Use
qo above0 10 20 25
1
0,0
1.24.09.39.99.8
- 4.1- 12.4
0.7- 3.8
3.4- 24.8
- 1 .92
- 20.6
- 1.9- 4.7
9.70.29.1
16.0
1
1
0.47.5
20.310.64.1
13.520.1
Figure 8. Informatic_i Conflict Resolution Profile
Percent Below or Above Mean, Each Category
379
3(in
environmentally active. Colleagues choosers made more thanaverage use of television while spending notably less timewith the other media and were average in environmentalactivity. Although it is an oversimplification from the dataavailable, no-response choosers appear to consist ofself-contained isolates.
Analysis and interpretation of the data in this portion ofthe survey indicated that those teachers with a high quantityand wide-ranging media consumption pattern were also inclinedtoward active personal and professional roles inenvironmental affairs. High total media consumption ratherthan consumption from specific sources showed the strongestpositive relationship with environmental education practices,although inferential statistics remained weak. Those whosought no resolution of information conflict and those whosought answers only from newspapers and radio were belowaverage in their conduct of environmental education.
Conclusions
Most of the teachers surveyed in this study used all four ofthe mass media offered: radio, televison, newspapers andmagazines. Although these teachers were fairly heavyconsumers of electronic media, news broadcasts were notconsidered an especially important part of broadcastprogramming. Perhaps this was due, in part, to a lowcomparative-credibilil:y rating of electronic media reporters.Television specials and documentary programs on environmentalmatters were, however, highly regarded, Extensive anddramatic coverage appeared to have strong influence onquality perceptions.
Magazines showed a higher use-percent than the other mediaand reading patterns provided especially convenient subjectmatter breakdowns. As might have been expected for thisgroup, magazines directed toward natural history andgeneralized environmental interests were over 50 percent morepopular than any other single category. But, this categoryreceived the lowest intensity of use. It may be concludedthat these magazines are perused rather superficially,perhaps for their visual imagery rather than their verbalcontent, and have little but aesthetic impact on attitudeformation an] reinforcement impact on attitude development.
When intensity of use was determined, professional journals,which were directed toward teachers and intended to assistthem in improving their perforw.nce, ranked next to last,only slightly ahead of the "environmental interest"publications.
380
40n
In evaluating media, magazine writers were perceived as beingthe most objective and special interest periodicals were seenas especially up to date, accurate and thorough in tneircoverage of .environmental affairs. For these teachers,"thoroughness" appeared to be the essential element inevaluation of media transmitting environmental information.
The media information sources achieving the highest valueranking in this survey were magazines and journals. The dataindicated that these teachers were rather dedicated readers,especially of the general interest magazines and thosecatering to special interests. Although no category ofpublication should be considered unimportant, environmentalcommunicators would do well to note the strong influence ofgeneral interest periodicals, especially those emphasizingnews and news-type feature coverage.
This survey suggested that any correlation between mass mediaconsumption patterns and environmentally favorable activitylay in total rather than specific consumption. Of theteachers surveyed, those with high quantity and wide-rangingmedia usage were more active, personally and professionally,than those employing smaller quantities or a narrower range.An inference which might be drawn is that those with a broadand active information base are more widely interested in thetotal world around them.
The data accumulated here leads one to conclude that theseteachers used mass media to gain a general perspective on thecourse of society, to reinforce their personal interests andfor entertainment, but did not use mass media directly tosupport their professional growth or to add to environmentalknowledge.
Recommendations and Implications
Implications for the academic community emerged from thisstudy of mass media use by inservice teachers.
Consl-ructive evaluation and criticism of the mass media asthey provide environmental information need to come fromwell-informed intellectual leaders. It is of little value toconfine critiques to exchanges within a community ofscholars. Rather, sound evaluations must be provided tothose who teach whether or not those teachers acknowledgethat all education is environmental education. And suchevaluations must be extended and made available to thebroader public through a wide-ranging distribution system.
381
4 n N
Teachers and prospective teachers need guidance in developingtheir own critical thinking and in their own evaluations ofmedia presentations. Moreover, students must be trained inthe use of mass media, particularly the electronic media, asinformation sources. This is especially true for thosestudents who will become environmental educators. The massmedia are teaching resources, out of school as well as inschool, but students need guidance in critical evaluation ofthe direct content and the implied messages. The constantmedia exposure requires that the receiver be both selectiveand critical of the messages received.
In the school setting, learning aids applied before, duringand after guided media exposure offer valuable assistance inlearning from and evaluating mediated information. Suchexperience will be of continuing benefit to students.
It is becoming increasingly evident that the collegeeducational experience and the training of teachers is farmore important than many have previously thought when itcomes to the environmental arena. The teachers in this studyshow a strong tendency to fall back on their own priorknowledge, experiences and opinions rather than to seek outother sources when faced with new information.
Purposeful information gathering, in-depth conceptualizationand even learning in general are severely limited afterleaving the college setting. This argues strongly forexpansion of environmental education teacher-training and forenvironmental education specialists. Such specialists wouldneed not only a major or at least a minor in their collegeprogram, but training in the conduct of teacher inservicetraining programs.
The environmental educator is a communication regulator,gatekeeper and agenda-setter. The continuous impingement ofa variety of mass media demands that the practitioner hewell-trained in critical evaluation and use of media and inguiding students to become critical consumers of mediatedmessages.
382
4 "
REFERENCES
Covert, Douglas C. 1980. A Profile of Attitudes, Actionsand Communication Behaviors of Teachers Entering anEnvironmental Education Experience. M.S. thesis,Michigan State University.
Hess, Robert D. and Judith V. Torney. 1968. TheDevelopment of Political Attitudes in Children.Garden City, NY: Doubleday, Anchor Books edition.
McNelly, John T. 1973. Mass Media and InformationRedistribution. Journal of Environmental Education5(Fall): 1, 31-6.
Peyton, Robert Ben. 1977. An Assessment of Teachers'Abilities to Identify, Teach and Implement Environ-mental Action Skills. Ph.D. dissertation, SouthernIllinois University at Carbondale.
Schoenfeld, Clay. 1975. Environmental Mass Communications:Problems and Promises. Journal of EnvironmentalEducation 8(Spring): 3, 20-6.
Schoenfeld, Clay. 1977. The Changing Role of MassCommunication in Environmental Education. Journalof Environmental Education 8(Spring): 3, 60-4.
Schramm, Wilbur. 1977. The Nature of an Audience, in TheProcess and Effects of Mass Communication, pp. 193-5.Edited by Wilbur Schramm and Donald F. Robert.Urbana, IL: University of Illinois Press.
Sellers, Leonard and David W. Jones, Jr. 1973. Environ-ment and the Mass Media. Journal of EnvironmentalEducation 5(Fall): 1, 51-7.
Stamm, Keith R. 1972. Environment and Communication, inCurrent Perspectives in Mass Communication Research,pp. 265-94. Edited by F. Gerald Kline and Phillip J.Tichenor. Beverly Hills, CA: Sage Publications.
Stamm, K. R. and J. E. Ross. 1966. Rationality ofOpinion on a Controversy in Conservation. JournalismQuarterly 43(Winter): 762-5.
Witt, William. Communication Concepts for Science andEnvironmental Communication Concepts. Journal ofEnvironmental Education 5(Fall): 1, 58-62.
383 haq
di)
GUIDELINES FOR AUTHORS
Manuscripts to be considered for publication in CurrentIssues: The Yearbook of Environmental Education andEnvironmental Studies must be accepted for presentation atthe annual conference of the National Association forEnvironmental Education (NAEE). Such acceptance is afunction of the Program Committee for the conference.
The Yearbook is divided into two sections. Section I,"Environmental Education Applications--The Practitioner'sPerspective," is comprised of short papers which offerinformation, observations, and Irogram reviews deemed ofinterest to the community of environmental educators broadlyinterpreted. Section II, "Research and Evaluation--RefereedPapers," is comprised of scholaily articles representing thefindings of original research and thought. Papers in SectionII must be fully documented and must show an awareness ofexisting research. Papers will be accepted for publicationin this Section only after review and recommendation by twoindependent reviewers and the editors.
Manuscript Preparation
1. Manuscripts: Manuscripts for Section I, "EnvironmentalEducation Applications--The Practitioner's Perspective,"must not exceed 1500 words in length. Manuscriptsfor Section II, "Research and Evaluation-RefereedPapers," must not exceed 5000 words in length.All manuscripts must be clearly marked indicating thespecific section to which it is being submitted forconsideration. Five copies of all manuscripts must besubmitted, typed using a standard type-face, doublespaced, with standard margins and approximately 250words per page. Single-spaced typed papers will notbe considered.
2. Abstract: All papers submitted for Section II mustinclude an abstract of approximately 50 words whichpresents the salient points covered in the paper.Abstracts will not be printed for papers appearing inSection I. Abstracts should appear immediately follow-ing the paper's title and name of the author, anddirectly preceding the text (on the same page).
3. References: All references must be presented using theauthor-date-page reference system within the body ofthe text (Sacks and Davis, 1979:31); with each paperfollowed by a Reference Section listing full referencesin alphabetical order according to the last name ofthe author.
385
41'4
4. Figures: All figures, drawings, and graphs must besequentially numbered (Arabic) and must he cited inthe text. Provide camera-ready copy in blac }. ink(preferably India), on heavy white paper o: blue-linedcoordinate paper, and on separate sheets. Place labelsparallel to the axes, using initial capital and lowercase letters. Plan your figures for the smallestpossible printed size consistent with clarity. Careshould be t.ken to make lettering large enough to bereadable after reduction to the 5 x 7 inch printformat of Current Issues.
5. Tables and Photographs: Tables must be sequentiallynumbered (Arabic), titled, and cited in the text.Photographs cannot be printed.
6. Title and Author(s). For the format of the first p,geand the listing of title and author, see examplescontained in this volume.
7. Additional Typing Instructions: Place the name of thesenior author and the page number in the upper rightcorner of each page of the text. This will assist theeditors should pages of the paper become separated.Insert subheads at appropriate places in the text tomark main ideas. Keep subheads short. Proofreadmanuscripts thoroughly before submitted them. Poorlywritten and poorly proofread papers will be returnedto authors.
Deadline for Submission
Manuscripts must be received by the editors not later than 30days prior to the annual conference. Send to: Dr. Lei LaneBurrus-Bammel, Division of Forestry, West VirginiaUniversity, Morgantown, West Virginia 26506.
If you wish confirmation that your manuscript has beenreceived, please enclose a stamped, self-addressed, post card.
386
THE "CURRENT ISSUES SERIES"
"Selected Papers" volumes from conferences (.f the NationalAssociaLion for Environmental Education have been publishedby the ERIC Clearinghouse for Science, Mathematics, andEnvironmental Education annually since 1975. Copies of eachvolume are still available as follows:
IRC 013E - Current Issues in Environmental Education 1975:Selected Papers from the Fourth Annual Conferenceof the CAEE (New Orleans, 1975). Robert Marlette,editor. 129 pages; IRC price $3.60. Alsoavailable in ERIC microfiche collections asED 119 982.
IRC 020E - Current Issues in Environmental Education II:SelecLed Papers from the Fifth Annual Conferenceof the CAFE (Atlanta, 1976). Robert Marlette,editor. 202 pages; IRC price $4.70. Alsoavailable in ERIC microfiche collections asED 135 665.
IRO 029E - Current Issues in Environmental Education III:Selected Papers from the Sixth Annual Conferenceof the NAEE (Est7s Park, 1977). Robert H. McCabe,editor. 279 pages; IRC price $5.50. Alsoavailable in ERIC microfiche collections asED 150 018.
IRC 0385 - Current Issues in Environmental Education IV:Selected Papers from the Seventh Annual Conferenceof the NAEE (Chicago, 1978). Craig B. Davis andArthur B. Sacks, editors. 252 pages; IRC price$5.50. Also available in ERIC microfichecollections as ED 167 407.
IRC 047E - Current Issues V: The Yearbook of EnvironmentalEducation and Environmental Studies. SelectedPapers from the Eighth Annual Conference of theNAEE (Blacksburg, 1979). Arthur B. Sacks andCraig B. Davis, editors. 306 pages; IRC price$6.00. Also available in ERIC microfichecollections as ED 180 822.
Orders may be placed with:
SMEAC Information Reference Center (SMEAC/IRC)The Ohio State University
1200 Chambers Road, 3rd FloorColumbus, OH 43212
(614) 422-6717