Embed Size (px)
Citation preview
DOCUMENT RESUME
ED 1122 801 IM 003 41
AUTHOR Bogatz, Gerry Ann; Ball, Samuel'DIM The Second Tear of Sesame Street: A Continuing
Evaluation, Volume 2.INSTITUTION Children's Television Workshop, 'New York, N.Y.;
Educational Testing Service, Princeton, N,J,..
REPORT NO ETS-PR-71-21PUB DATE Nov 71NOTE 03p.; Por VOlume 1, see IR 003 418
EDRS PRICE MP-$0,83 HC-87,35 Plus PostageDESCRIPTORS Disadvantaged Youth; *Educational Television;
. Poollowup Studies; *Preschool Children; *ProgreaEvaluation; *Tables (Data)
IDENTIpIZRS *Sesame Street1
ABSTRACT .
A second year evaluation of the educationaltelevision series *Sesame Street consisted of a new study todetermine the effect of the revised second year curriculum goals anda folloMup study to determine the effects of a second year of viewingSessime Street and the effect of the program on chij.dren who enteredschool after viewing for one year, This volume of the study containsdata tables and figures. (JY)
t
S
*****************************************************41***************** Documents ac/uired by ERIC include many informal unpublished *
0 materials not available from other sources, ERIC makes every effort ** to obtain the best copy available, Nevertheless, items of marginal "10
* reproducibility are often encountered and this affects the quality *
* of the microfiche and hardcopy reproductions ERIC Rakes available ** via the ERIC Document Reproduction Service (EDRS), EDRS is not ** responsible for the quality of the original document, Reproductions ** supplied by EDRS are the best that can be made from the original. *************************************************************************
I
COCC1
,
THE SECOND YEAR OF SESAME STREET: A CONTINUING EVALUATION
r4Ci Volume 2
Oat
to
by: Gerry Ann Bogatz
Samuel Ball
U S DEPARTMENT OF HEALTH.EDUCATION 4 WELFARENATIONAL INSTITUTE OF
EDUCATION
T.Ns DOCUMENT NAS BEEN REPRO-(WEED EXACTLY AS RECEIVED FROM
THE PER SON ORORDANQATIDN OR KM.
As two IT POINTS 01-VIEW OR- OPINIONS
STATED 00 NOT NECESSA OILY REIMS.SENT °Fp NAHONAk INSTITUTE OfEOUCA MN POSITION OR POLICY
A report to the Children's Television Workshop,
Educational Testing ServicePrinceton, New Jersey
November 1971
ri2
PsAios.ssOm To of Motuii CotyMOWED MATERIAL HAS BEEN 6441.Tf0 or
Tetsysioi
Via 11<lly.P--To EP.0 ANO OROMoZATIOW OPEAATINC..
ti.04A AGREEMENTS WITH 1.4 toTto.4., iN
ST.TtE OF EDUCATION FtlIrmik AfePoOUt hoto ountot Olt (OH- SYSTEM AF4)(01E; PERMISS1CON 01 THE I e,py4, (.,it
OMAR
Copy fight ,C) 1971 by Children's Television Workshop. All rights reserved.
3

Table
1
2
3
TABLES
Volume 2
Pretest and Gain Scores for Black and White Disadvantaged Childrenin Year I Study
Correlations of the Four Measures of Amount of Viewing in Yearand Correlations of Total Scores and Gain Scores with Viewing Scores
Total Test Pretest and Gain Scores of Disadvantaged Children Basedon New Viewing Quartiles (Year I Data Revisited)
4 Multivariate Analysis of Total Gain Scores Using Viewing Record'sOnly to Determine Viewing Quartiles
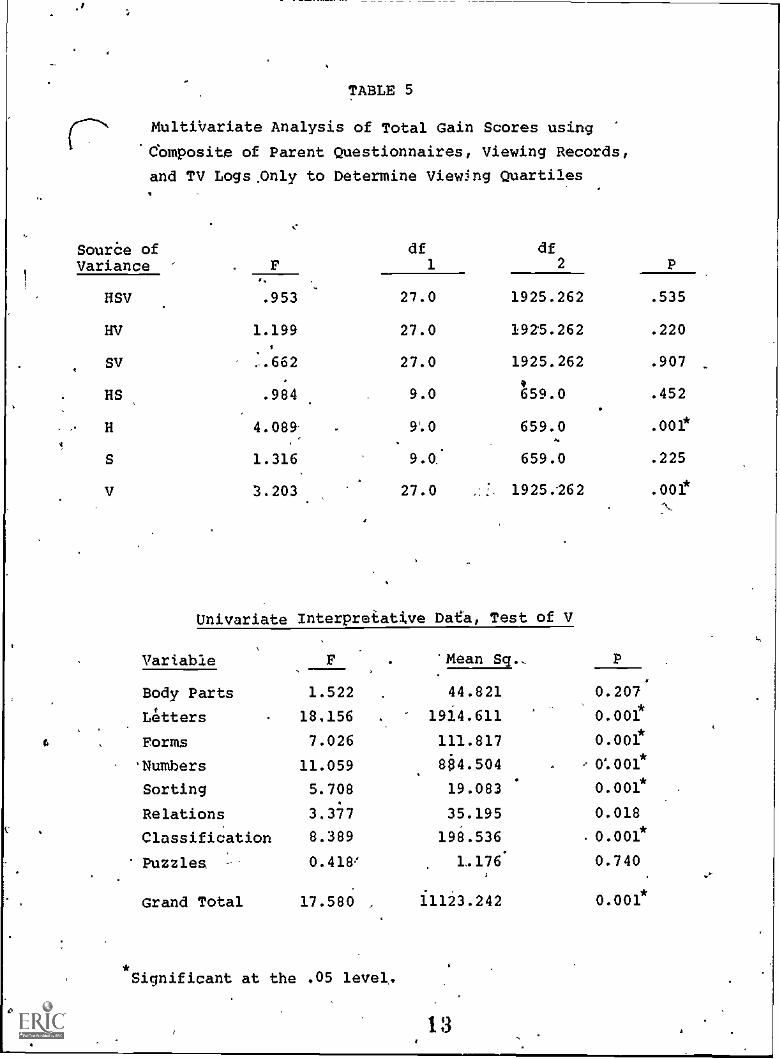
5 Multivariate Analysis of Total Gain Scores Using Composite of ParentQuestionnaires, Viewing Records, and TV Logs Only to Determine View-ing Quartiles
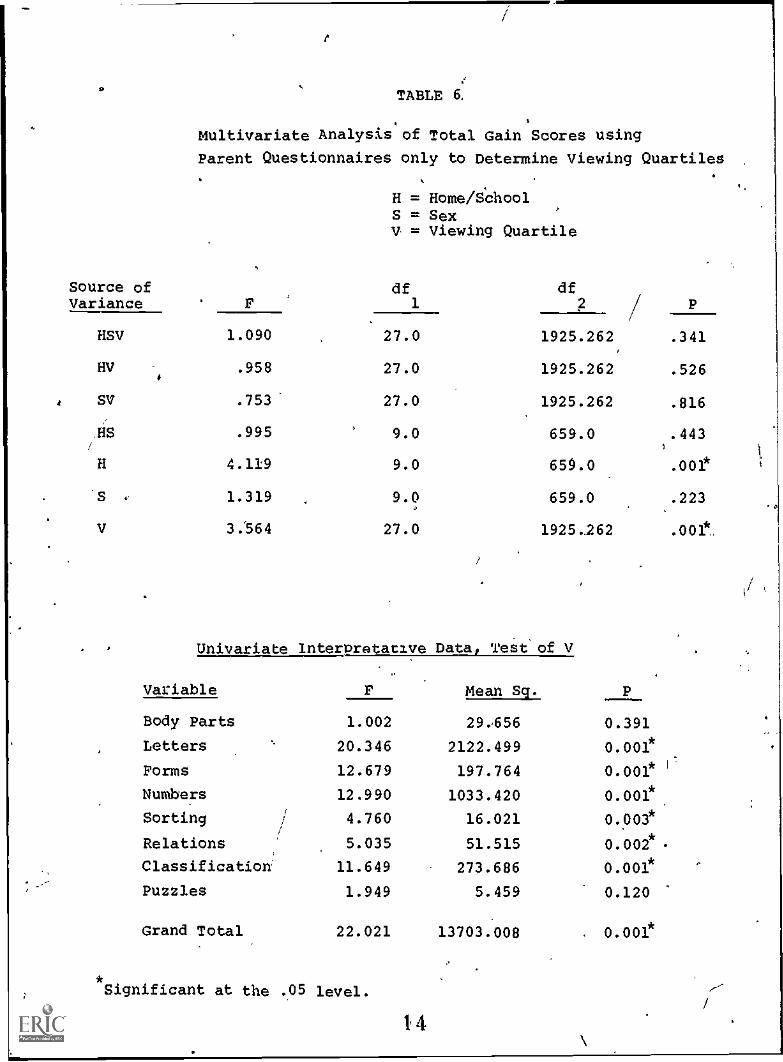
6 Multivariate Analysis of Total Gain Scores Using Parent QuestionnairesOnly *o Determine Viewing Quartiles
7 Multivariate Analysis of Total Gain Scores Using TV Logs Only toDetermine Viewing Quartiles (At-home Children Only)
8 Pretest Scores and Test Reliabilities for All Groups
9 Posttest Scores and Test Reliabilities for All Groups
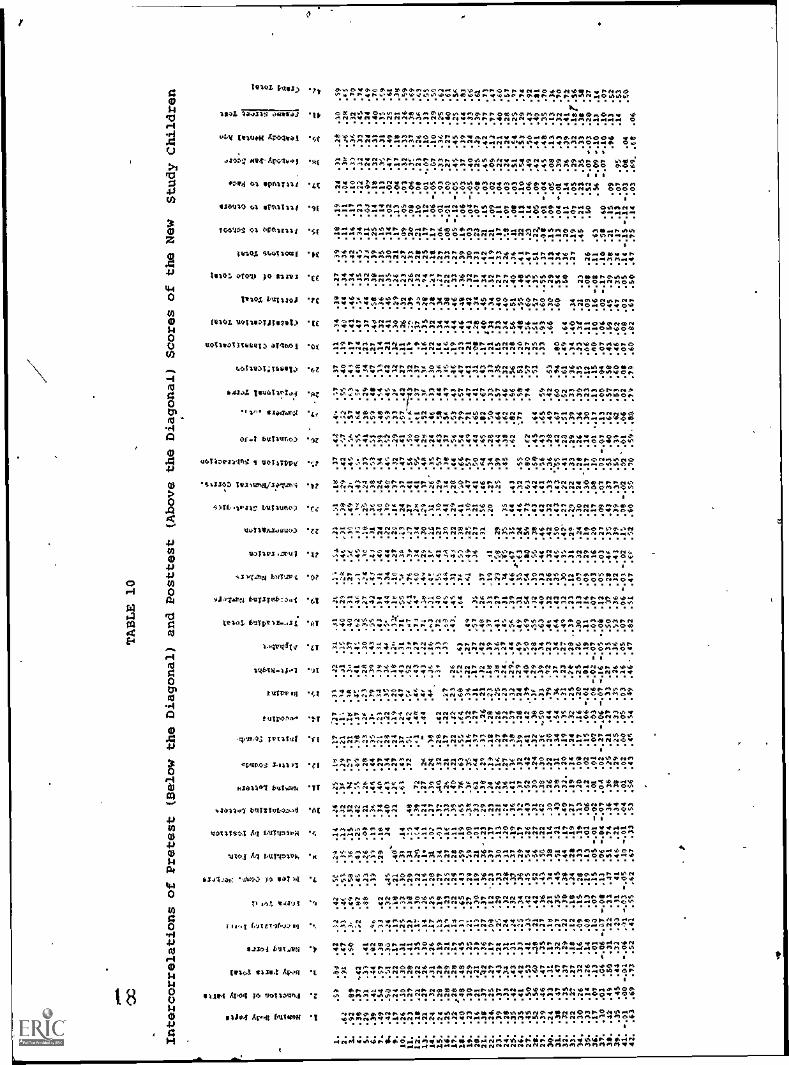
10 Intercorrelations of Pretest and Posttest Scores of the New Group
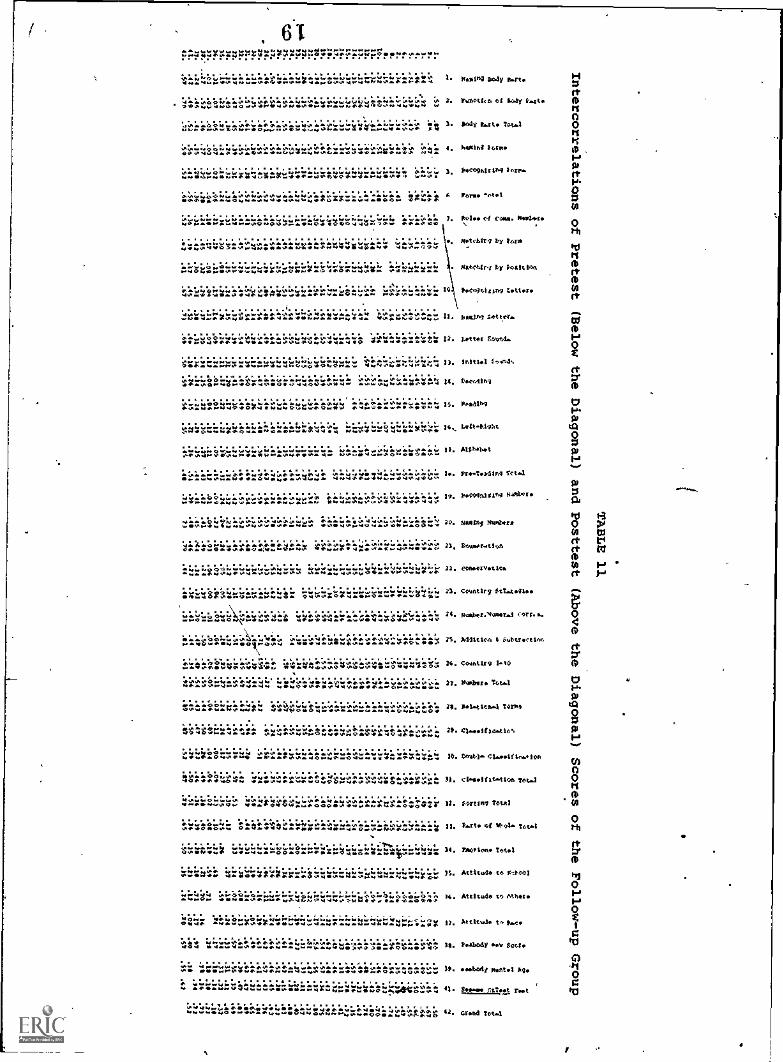
11 Intercorrelations of Pretest and Posttest Scores of the Follow-up Group
12 Descriptive Categorization of the Children for Whom Complete andAcceptable Pretest and Posttest Data were Obtained
13 The Percent of Time Each Goal was Observed in Sesame Street Year Iand Year II
14 Treatment Composition of Some Goals
15 Goal Composition of Some Treatments
16 Pretest and Gain Scores for All Encouraged and Not-encouraged Children
17 Parent Questionnaire Scales for All Encouraged and Not-encouragedChildren
18 Selected Parent Questionnaire Items for All Encouraged and Not-encouraged Children
4
4
Table
19
20
21
it
Item Analysis: Percentage of Not encouraged and Encouraged ChildrenAnswering Each Item Correctly on Pretest and Posttest
\
Multivariate Analysis of Total Gain Scores for All New Study Children
Multivariate Analysis of Covariance of Total Gain Scores for All NewStudy Children
22 Multivariate Analysis of Miscellaneous Gain Scores for All New StudyChildren
23 Multivariate Analysis of Covariance of Miscellaneous Gain Scores forAll New Study Children
24 Multivariate Analysis of Pre-reading Gain Scores for All New Study.Children
25 Multivariate Analysis of Covariance of Pre-reading Gain Scores forA11 New Study Children
26 Multivariate Analysis of Numbers Gain Scores for All New StudyChildren
27 Multivariate Analysis of Covariance of Numbers Gain Scores for AllNew Study Childrdn
28 Multivariate Analysis of Classification Gain Scores for All New StudyChildren
29 Multivariate Analysis of Covariance of Classification Gain Scores for
All New Study Children
30 Pretest and Gain Scores for All Children in the New Study (by ViewingGroups)
31 Parent Questionnaire Scales for All Children in the New Study byViewing Groups
32 Selected Parent Questionnaire Items for All New Study Children (byViewing Groups)
33 a-b Pretest and Gain Scores for Not-encouraged and Encouraged Childrenin the New Study (by ViewingGroups)
34 a-b Parent Questionnaire Scales for Not-encouraged and EncouragedChildren in the New Study by Viewing Groups
35 a-b-c Pretdst and Gain Scores for Encouraged and Not-encouraged 3-, 4-, and
5-Year Olds
36 a-b-c Parent Questionnaire Scales for Encouraged and Not- encouraged 3-,4-, and 5-Year Olds
5
f
Table
37 a-b-c Selected Parent questionnaire Items for-Encouraged and Not-encouraged3-, 4-, and 5-Year Olds
38 Pretest and Gain Scores for Encouraged and Not-encouraged Girls and 1
Boys
39 a-b Parent Questionnaire Scales for Encouraged and Not-encouraged Girlsand Boys
40 a-b Selected Parent Questionnaire Items for Encouraged and Not-encouragedGirls and Boys
41 Pretest and Gain Scores for Spanish-background Children (by ViewingGroups)
42 Parent Questionnaire Scales for Spanish-background Children in theNew Study (by Viewing Groups)
43 Selected Parent Questionnaire Items for Spanish-background Children(by Viewing Groups)
44 Follow-up Children Who Were Ranked in the Fall of Year I ViewingQuartiles:Pretest Means and Gains in Year I
45 Teacher Rankings in the Fall of 1970Follow-up Subjects: Average Percentile Rank by Year I ViewingQuartiles
46 Year II Pretest Means for Follow-up Children who were Ranked in theFall (by Year I Viewing Quartiles)
47 Pretest and Gain Scores on Common Items and Peabody IQ's for AllFollow-up Children
48 Total Score Pretest and Posttest Means on Year I Tests and TotalScore Means and Gains on Year II Tests for All Follow-up Children
49 Total Score Means and Gains on Year II Tests for Follow-up ChildrenAt Home and At School
50 Parent Questionnaire Scales for Follow-up Children by ViewingGroups 3 - 6
51 Parent Questionnaire ScaTes-fer Follow-up Children by ViewingGroups 7 - 12
52 Correlation Matrix of Test Scores, Gains, and Viewing Scores forFollow-up Children
53 Follow-up Age cohorts Study
Table
54
55
56
57
Parent Questionnaire Scales for Age Cohorts
Univariate Analyses of Variance for the Follow-up Age Cohorts Study
Multivariate Analyses of Variance for the Follow-up Age Cohorts Study
Teacher Rankings in tne Fall of 1970
At-school Follow-up Subjects: Average Percentile Rank by RevisedViewing Groups
58 Correlations of Pretest (BelowDiagonal) Teacher' Rankings and
59 Teacher Rankings in the SpringAt-school Follow-up Subjects:Groups
the Diagonal) and Posttest (Above theChild Attitude Scales
of 1971Average Percentile Rank by Viewing
40
yigure,
1
2
3a
3b
4
5a
5b
5c
6a
6b
7a
4.I
N
\
FIGURE'S\
Volume 2
Pretest and Posttest Scores of 3-, 4-, an4 5-year old Disadvantaged
Children
Pretest and Posttest Scores of Disadvantagect,and Advantaged 4-year-old Children
Percentage of Items Answered Correctly by all Children at-Pretestand 'Posttest (Total Scores)'
Percentage of Items Answered Correctlyand Posttest (Selected Subtest Scores)
Percentage of Items Answered Correctlyand Posttest (by Viewing Groups) '-
Percentage of Items AnsweredPretest and Postest
Percentage of Items AnsweredPretest and Posttest
Percentage of Items AnsweredPretest and Posttest
by All Children at Pretest
by All Children at Pretest
Correctly by 3-Year-Old Children at
Correctly by 4-Year-Old Children at
Correctly by 5-Year-Old Children at
Percentage of Items Answered Correctly by girls at Pretest andPosttest
Percentage of Items Answered Correctly by Boys at Pretest andPosttest
Age CohortsPercentage of Items Answered Correctly on Total Tests by Cohorts1 and 2
lb Age CohortsPercentage of 'tems Answered Correctly on Selected Subscores byCohorts 1 and 2
8
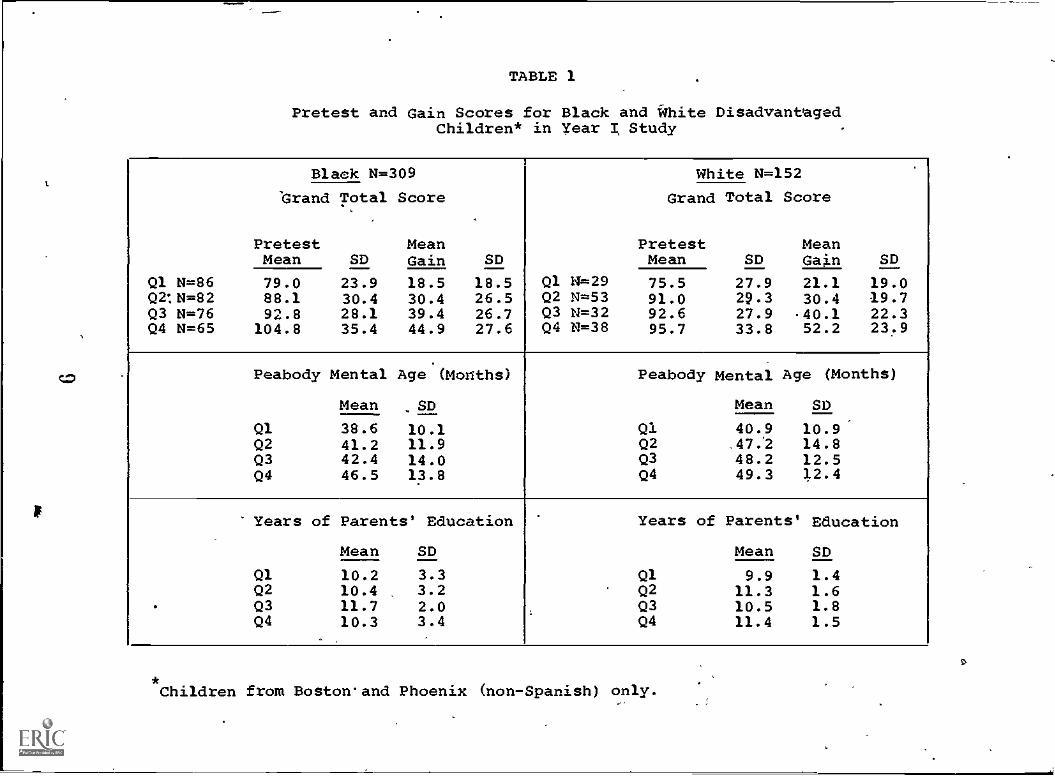
TABLE 1
Pretest and Gain Scores for Black and White DisadvantagedChildren* in Year 1, Study
Black N=3091
.
White N=152
Grand Total Score Grand Total Score
Pretest Mean Pretest MeanMean SD Gain SD Mean SD Gain SD
Ql N=86 79.0 23.9 18.5 18.5 01 N=29 75.5 27.9 21.1 19.002:N=82 88.1 30.4 30.4 26.5 Q2 N=53 91.0 29.3 30.4 19.7Q3 N=76 92.8 28.1 39.4 26.7 Q3 N=32 92.6 27.9 40.1 22.3Q4 N=65 104.8 35.4 44.9 27.6 Q4 N=38 95.7 33.8 52.2 23.9
Peabody Mental Age (Months) Peabody Mental Age (Months)
Mean SD Mean SD
01 38.6 10.1 Q1 40.9 10.9Q2 41.2 11.9 Q2 .47.2 14.8Q3 42.4 14.0 Q3 48.2 12.5Q4 46.5 13.8 Q4 49.3 12.4
Years of Parents' Education Years of Parents' Education
Mean SD Mean SD
01 10.2 3.3 01 9.9 1.4Q2 10.4 3.2 Q2 11.3 1.6Q3 11.7 2.0 Q3 10.5 1.8Q4 10.3 3.4 Q4 11.4 1.5
*Children from Boston'and Phoenix (non-Spanish) only.
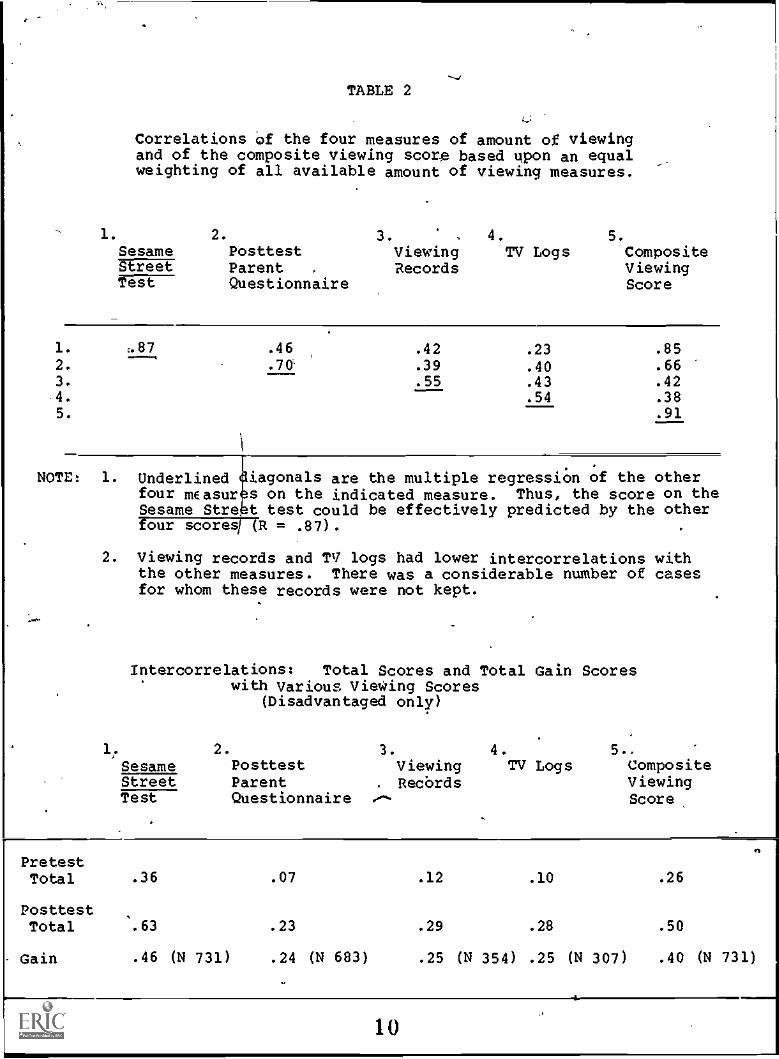
TABLE 2
4.:
Correlations of the four measures of amount of viewingand of the composite viewing score based upon an equalweighting of all available amount of viewing measures.
1.
SesameStreetTest
2.
PosttestParent .
Questionnaire
3. , 4.
Viewing TV LogsRecords
5.
CompositeViewingScore
1.
2.
3.
4.
5.
c.87 .46.70
.42
.39
.55
.23
.40
.43
.54
.85
.66
.42
.38
.91
NOTE: 1. Underlinedfour masurSesame Strefour scores
.
iagonals are the multiple regression of the others on the indicated measure. Thus, the score on thet test could be effectively predicted by the otherR = .87) .
2. Viewing records and TV logs had lower intercorrelations withthe other measures. There was a considerable number of casesfor whom these records were not kept.
Intercorrelations: Total Scores and Total Gain Scoreswith Various Viewing Scores
(Disadvantaged only)
1.
SesameStreetTest
2.
PosttestParentQuestionnaire
3.
Viewing. Recbrds
..----
4. 5..TV Logs Composite
ViewingScore,
PretestTotal .36 .07 .12 .10 .26
Posttest.
Total .63 .23 .29 .28 .50
Gain .46 (N 731) .24 (N 683) .25 (N 354) .25 (N 307) .40 (N 731)
10
4.
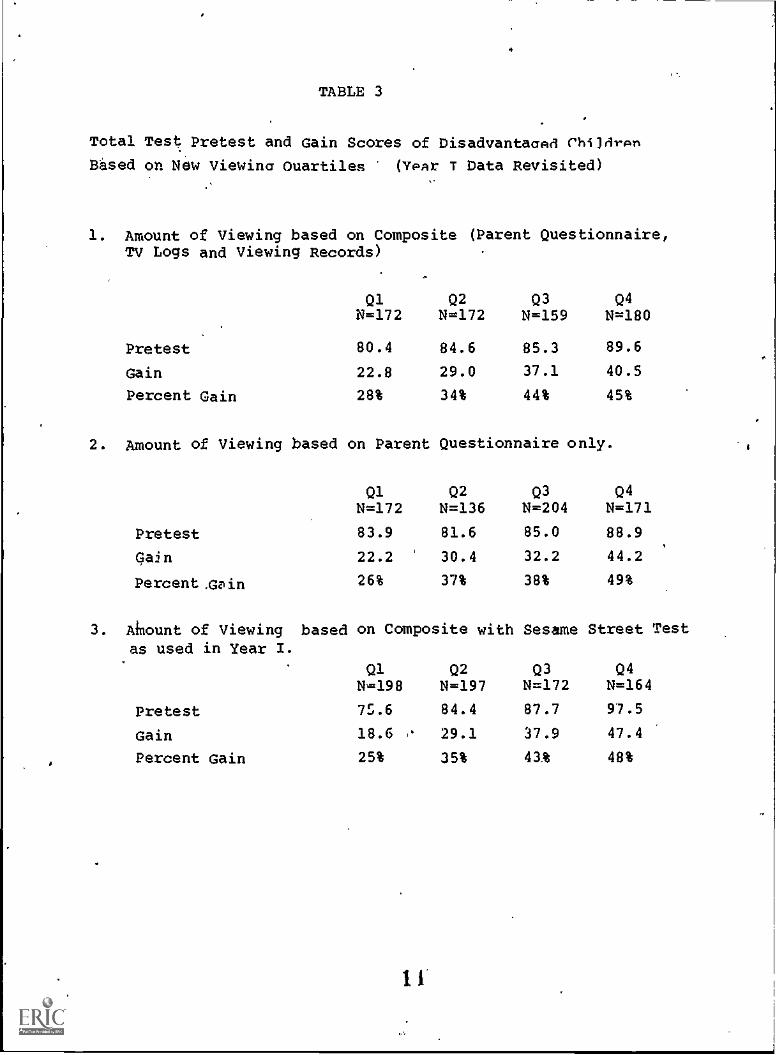
TABLE 3
Total Test Pretest and Gain Scores of Disadvantaasd rhildrpn
Based on New Viewina Ouartiles (Year T Data Revisited)
1. Amount of Viewing based on Composite (Parent Questionnaire,TV Logs and Viewing Records)
Q1 Q2 Q3 Q4N=172 N=172 N=159 N=180
Pretest 80.4 84.6 85.3 89.6
Gain 22.8 29.0 37.1 40.5
Percent Gain 28% 34% 44% 45%
2. Amount of Viewing based on Parent Questionnaire only.
Q1 Q2 Q3 Q4N=172 N=136 N=204 N=171
Pretest 83.9 81.6 85.0 88.9
Gain 22.2 30.4 32.2 44.2
Percent .Gain 26% 37% 38% 49%
3. AMount of Viewing based on Composite with Sesame Street Testas used in Year I.
Q1 Q2 Q3 Q4N=198 N=197 N=172 N=164
Pretest 75.6 84.4 87.7 97.5
Gain 18.6 ,* 29.1 37.9 47.4
Percent Gain 25% 35% 43.% 48%
II
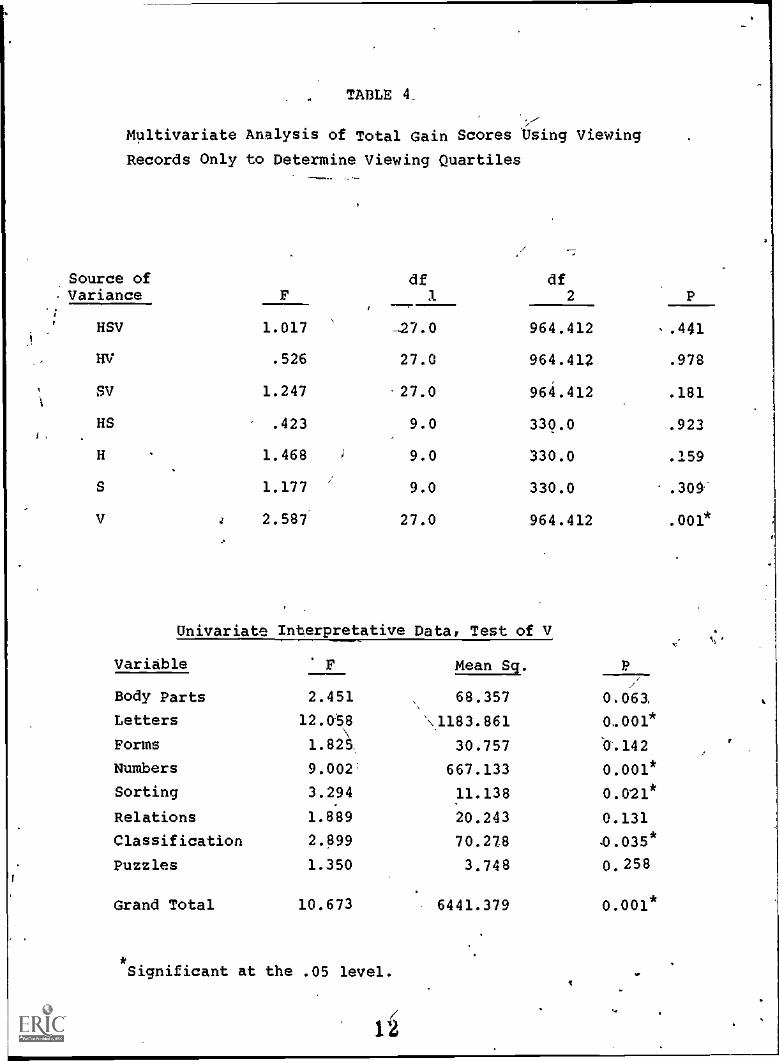
TABLE 4_
Multivariate Analysis of Total Gain Scores Using Viewing
Records Only to Determine Viewing Quartiles
Source of df
/
dfVariance F 1 2 p
HSV 1.017 -27.0 964.412 .441
HV .526 27.0 964.412 .978
SV 1.247 27.0 964.412 .181
HS .423 9.0 330.0 .923
H 1.468 9.0 330.0 .159
1.177 9.0 330.0 .300
V 2.587 27.0 964.412 .001*
Univariate Interpretative Data, Test of Vty
Variable F Mean Sq. P
/Body Parts 2.451 68.357 0.063.
Letters 12.058 N1183.861 0..001*\
Forms 1.825. 30.757 b.142
Numbers 9.002' 667.133 0.001*
Sorting 3.294 11.138 0.021*
Relations 1.889 20.243 0.131
Classification 2.899 70.278 .0.035*
Puzzles 1.350 3.748 0.258
Grand Total 10.673 6441.379 0.001*
*Significant at the .05 level.
1 (2
t
TABLE 5
Multivariate Analysis of Total Gain Scores using
composite of Parent Questionnaires, Viewing Records,
and TV Logs Only to Determine Viewing Quartiles
SourCe ofVariance F
df1
df2 P
HSV .953 27.0 1925.262 .535
HV 1.199 27.0 1925.262 .220
SV -662 27.0 1925.262 .907
t
HS .984 9.0 659.0 .452
H 4.089 9'.0 659.0 .001*
S 1.316 9.0 659.0 .225
V 3.203 27.0 1925.262 .001*
*
'\-
Univariate Interpretative Data, Test of V
Variable F 'Mean Sq..
Body Parts 1.522 44.821 0.207
LItters 18,156 . 1914.611 0.001*
Forms 7.026 111.817 0.001*
'Numbers 11.059 8f14.504 . - 0.001*
Sorting 5.708 19.083 0.001*
Relations 3.377 35.195 0.018
Classification 8.389 198.536 0.001*
Puzzles 0.4181 1.176 0.740
Grand Total 17.580 11123.242 0.001*
Significant at the .05 level.
13
4
TABLE C
Multivariate Analysis of Total Gain Scores using
Parent Questionnaires only to Determine Viewing Quartiles
Source of
H = Home /SchoolS = SexV = Viewing Quartile
df dfVariance p 1 2 / P
HSV 1.090 27.0 1925.262 .341
HV#
.958 27.0 1925.262 .526
SV .753 27.0 1925.262 .816
HS .995 9.0 659.0 .443
H 4.119 9.0 659.0 .001*
S . 1.319 9.0 659.0 .223
V 3364 27.0 1925.262 .001*,
1
Univariate interprotative Data Test'of V
PVariable Fad
Mean Sq.
Body Parts 1.002 29.456 0.391
Letters 20.346 2122.499 0.001*
Forms 12.679 197.764 0.001*
Numbers 12.990 1033.420 0.001*
Sorting 4.760 16.021 0.003*
Relations 5.035 51.515 0.002*.
Classification' 11.649 273.686 0.001*
Puzzles 1.949 5.459 0.120
Grand Total 22.021 13703.008 0.001*
*Significant at the .05 level.
4
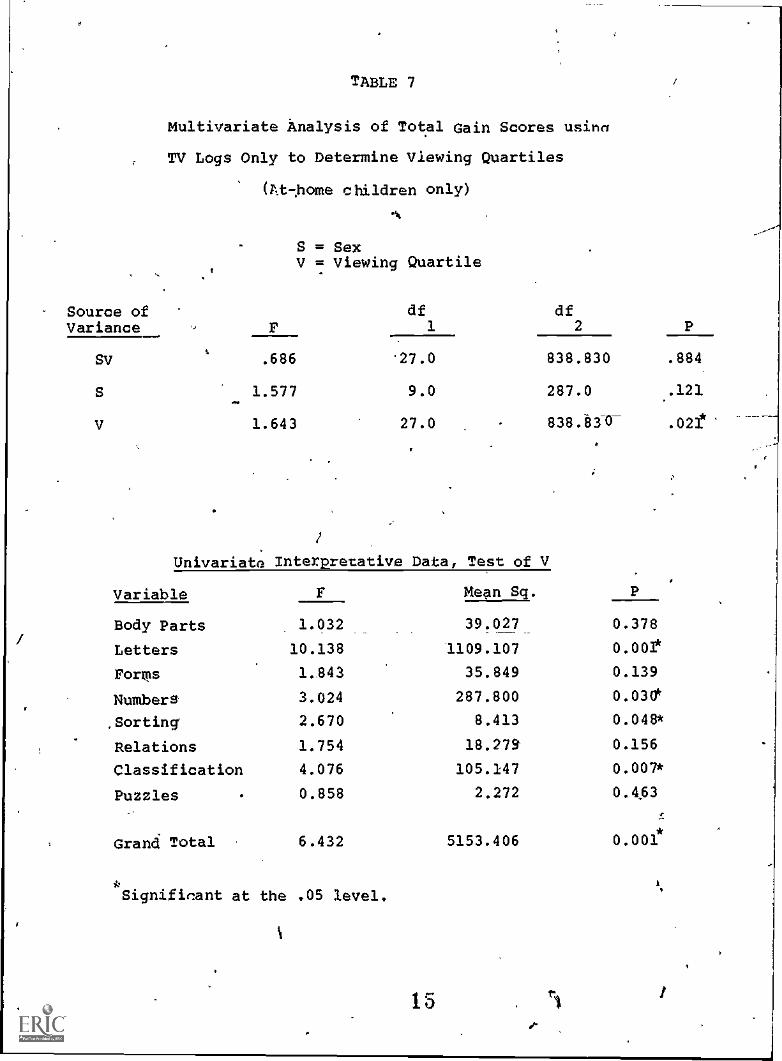
TABLE 7
Multivariate Analysis of Total Gain Scores usina
TV Logs Only to Determine Viewing Quartiles
(rethome children only)
S = SexV = Viewing Quartile
Source of df dfVariance F 1 2 P
SV .686 27.0 838.830 .884
S 1.577 9.0 287.0 .121
V 1.643 27.0 . 838.830 .0211.`
/
Univariato Interpretative Data, Test of V
PVariable F Mean Sq.
Body Parts 1.032 39.027 0.378
Letters 10.138 1109.107 0.001*
Forms 1.843 35.849 0.139
Numbers 3.024 287.800 0.030*
,Sorting 2.670 8.413 0.048*
Relations 1.754 18.279 0.156
Classification 4.076 105.147 0.007*
Puzzles 0.858 2.272 0.4,63
,
Grand Total 6.432 5153.406 0.001*
Signifinant at the .05 level.
15
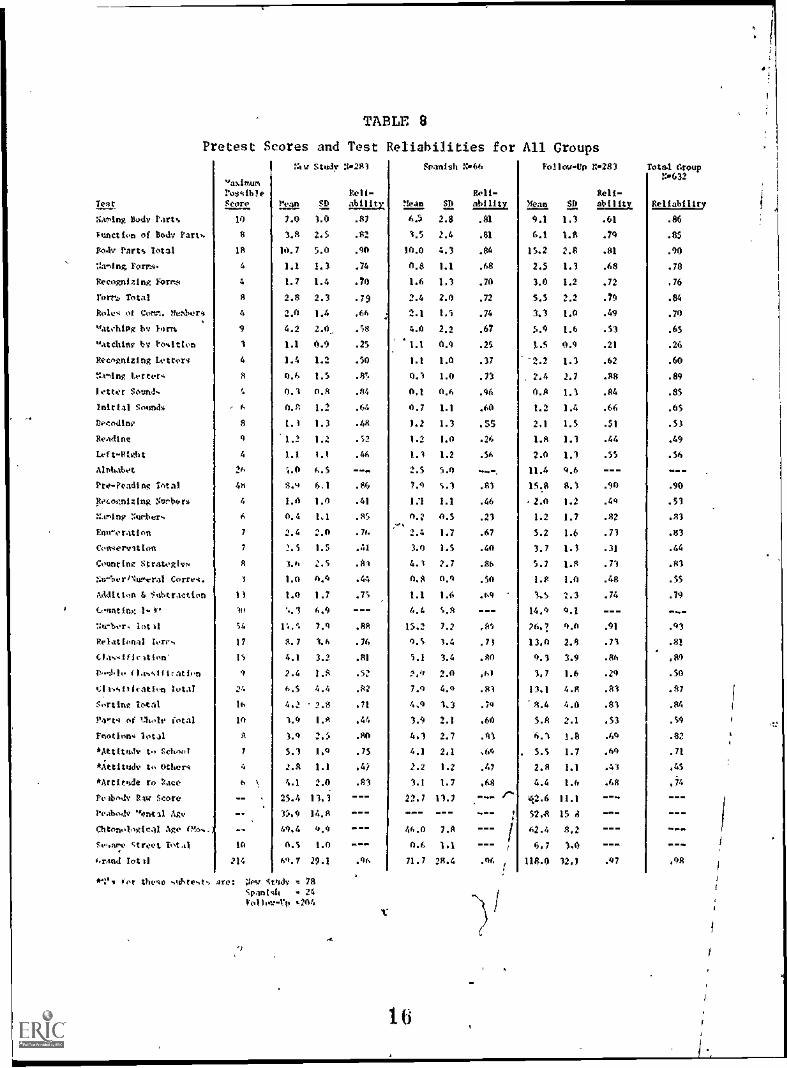
TABLE 8
Pretest Scores and Test Reliabilities for All Groups
vaxiftunpossible
NW Study 50283 SPanish X.66
Roli-
FollowATA ).283
Relt-
Total CroupN.632
Test Score Pean SD ability Mean SD ability Mean Sp &ULLA Reliability
NaPing Body Parts 10 2.0 3.0 .87 6.5 2.8 .81 9.1 1.3 .61 .86
Function of body Fart.. 8 1.8 2.5 .82 1.5 2.4 .81 4.1 1.8 .79 .85
Body Parts Total 18 10.7 5.0 .90 10.0 4.3 .84 15.2 2.8 .81 .40
;I:rdng, Form 4 1.1 1.3 .74 0.8 1.1 .68 2.5 1.3 .68 .78
Recognizing Form* 4 1.7 1.4 .70 1.6 1,3 .70 3.0 1.2 .72 .76
torra Total 2.8 2.3 .79 2.4 2.0 .72 5.5 2.2 .79 .84
Role. of Core . Neabor3 4 2.0 1.4 .66 2.1 1.5 .74 3.3 1.0 .49 .70
watehing by lorm
uatchinv by to.ition
9
1
4.2
1.1
2.0.,
0.9
.58
.25
4.01.1
2.20.9
.67
.25
5.4
1.5
1.6
0.9
.51
.21
.65
.26
Recognizing letters 4 1.4 1.2 .50 1.1 1.0 .17 2.2 1.1 .62 .60
tr.,Ing totter. 8 0.6 1.5 .85 0.1 1.0 .73 2.4 2.2 .08 .89
letter Sound,
initial Sounds 6
0.1
0.0
0.8
1.2
.84
.64
0,1
0.70.6
1.1
.96
.600.8
1.2
1.3
1.4
.84
.66
.85
.65
Decoding 8 1.1 1.3 .48 1.2 1.3 .55 2.1 1.5 .51 .53
Reading 1.2 1.2 .52 1.2 1.0 .26 1.8 1.3 .44 .49
Left-Bight 4 1.1 1.! .46 1.1 1.2 .56 2.0 1.1 .55 .56
Alphabet 26 s.0 6.5 =W. 2.5 5.0 11.4 4.6 ---
Pto-Peading Total 4n 8.9 6.1 .86 7.1 5.1 .83 15.8 8.3 .10 .90
recognizing Sorbets 1.0 1.0 .41 1.1 1.1 .46 .2.0 1.2 .44 .53
Xaning ::Other, 0.4 1.1 .84 4.2 0.5 .23 1.2 1.7 .07
Etworation 2.4 2.0 .74 2.4 1.7 .67 5.2 1.6 .73 .31
Con.orystion 7 2.5 1.5 .41 3.0 1.5 .40 3.7 1.3 .31 .44
Counting Stratogiv. 3.6 2,5 Ai 4.1 7.7 .86 5.7 1.8 .71 .81
Nu-ber/Sugyral Corral. 1.0 41.4 .44 0.0 0.9 .50 1.0 .48 .55
Addition 4 '5nbtraction 1) 1.0 1.7 .75 1.1 1.6 .49 3.5 1.3 .74 .79
Coma i n): i" 3 6.9 4.4 5.8 14.4 4.1 ---
':arbor. iotli 54 7.9 .80 15.2 7.7 .16 M.? 9.0 .91 .41
Relational Tem, 17 8.7 1.6 .76 4.5 1.4 .7) 13,0 2.8 .71 .81
I5 4.1 3.2 .81 5.1 3.4 .00 9.3 3.9 .86 .89
Ponbloi0a.o..1ftratim 1 7.4 1.8 .52 2.4 2.0 .61 3,7 1.6 .24 .50
.1.1)..)1tIcatin total 24 6.5 4,4 .82 7.4 4.0 .81 13.1 4.8 .81 .87
Sorting Total 14 6.2 2.8 .71 4,0 1.3 .74 '8.4 4.0 .83 .84
Poet. of Mlo fetal 10 1.9 1.8 .44 1.1 2.1 .60 5.8 2.1 .53 .51
Fuotion. Total A 1.4 2.5 .80 4.1 2.7 .81 4.1 1.8 .44 .82
*AttEtudir to School 5.1 1.0 .75 4.1 2.1 .49 5.5 1.7 .69 .71
*ittitudv. to Ocher. 2.8 1.1 .4i 2.2 1.2 .67 2.8 1.1 .43 .45
*Attitude to 111aCt 4.1 2.0 .81 14 1.7 .68 4.4 1.4 .68 ,24
Po body RA)/ Score 25.4 13.3 22.7 11.2 42.6 11.1
Peabody "ontzl 35,0 14.R =,. 52 15 4 11=
Cbtonologied1 ARe (m0%. 40,4 9.0 46.0 2.8 62.4 8.2 .1.101.01
$....aro street Total IA A.S 1.0 0.6 1.1 6,7 3.0
0.1-Aud Iota 214 O.? 29.1 .46 71.7 28.4 .46 118.0 32,1 .47 OR
61.1 oot thou ...ttfite,t., are: 4ftv Study 78
cpan1.1) 24
Fol1ow-rp .294
.4
16
)tf
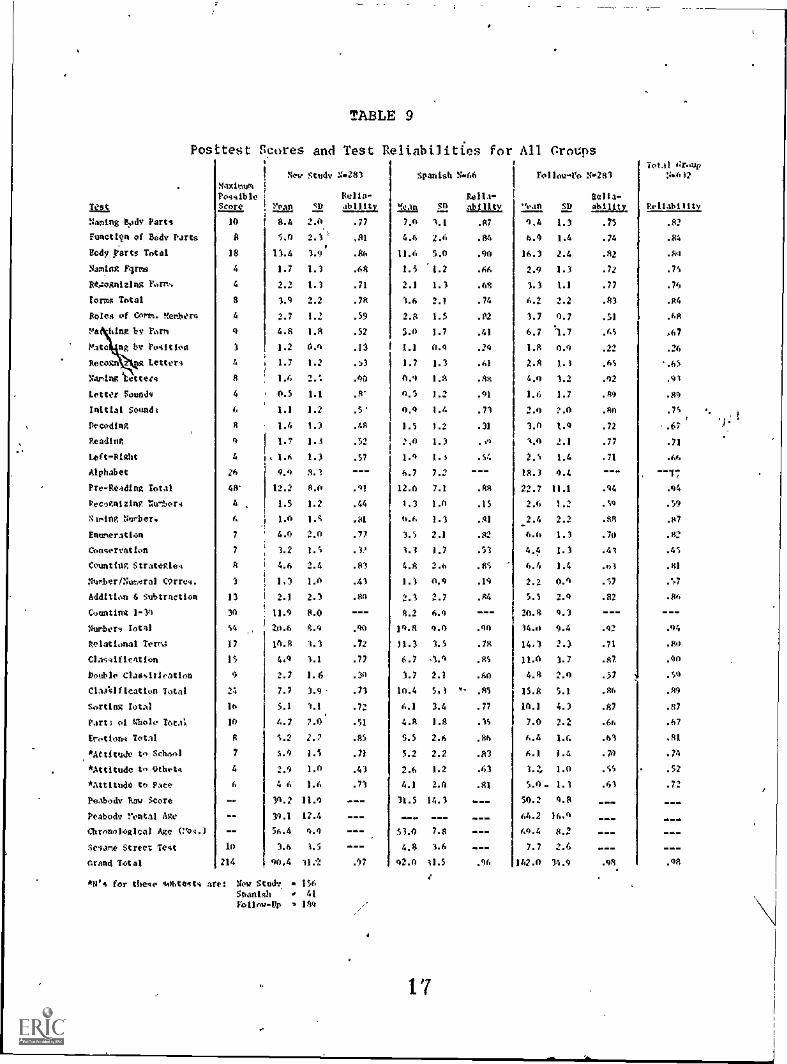
TABLE 9
Posttest :'cores and Test Reltabtlities for All Croups
Now Study N.283MaximumPossible Rena..
Spanish N66
Rella-
Follow -%' 0 N.283Total qroup
:4.612
Test Score Yuan sD .161114, jia SO abIIlty, "ean SD ability Reliability,
Naming Ikady Parts 10
;
1 8.4 2,0 .77 7.0 1.1 .87 9,4 1.3 .75 .82
FunctItn of Body Parts 8 3,0 2.3 ,81 4.4 2.6 .84 0.9 1.4 .74 .84
Body parts Total 18 13.4 1.9 .86 11.6 5.0 .90 16.3 2.4 .82 .89
Naming Firms 4 1.7 1.3 .64 1.3 -1.2 .66 2.9 1.3 .72 .75
ltvognialng Forms 4 2.2 1.3 .71 2.1 1.3 .68 3.3 1.1 .77 .76
Forms Total 8 3.9 2.2 .7R 3.6 2.1 .74 6.2 2.2 .83 .R4
Roles of Corm. ft:Item 4 2.7 1.2 .59 2.0 1.5 3.7 0.7 .51 .68
re hint by For 4 4.8 IA .52 5.0 1.7 .41 6.7 1.7 .65 ,67
Mato ng by Position 3 1.2 0.4 .13 1.1 0.9 .24 1.8 0.9 .22 .26
Recogn.N4eg Letters 4 1.7 1.2 .a3 1.7 1.3 .61 2.8 1.1 .65 ..65
Naming tette(' 1.6 2.5 .00 0.9 1.8 01$ 4.0 3.2 .42 .01
Letter Founds 4 0.5 1.1 .8' 0.5 1.? .91 1.6 1.7 .84 .80
Initial Sound: 6 1.1 1.2 .5' 0.4 i.4 .71 2.0 2.0 .88 .75
Decoding 1.4 1.3 .48 1.3 1.2 .31 3.0 1.0 .72 .67
Reading 1.7 1.3 .52 1.3 .01 A.0 2.1 .77 .71
Left-Right 4 i. 1.6 1.3 .57 1.0 I.' .54 2.5 1.4 .71 .66
Alphabet 26 9.9 8.1 6.7 7.2 18.3 4.4 mm, _ -1-
Pre.iltaiing Total 48' 12.2 8.0 .01 12.0 7.1 .88 22.7 11.1 .44 .94
Recognizing N.mbors 4 1.5 1.2 .44 1.3 1.0 .15 2.6 1.2 .%0 .59
Norbers 6 1.0 1.5 .81 0.6 1.3 .81 2.4 2.2 .88 .$7
Enumeration 7 4.0 2.0 .77 3.5 2.1 .82 6.0 1.3 .70 .83
Conservation 7 3.2 1.5 .1, 3.3 1.7 .53 4.4 1.3 .41 .45
Counting. Strategies * 4.6 2.4 .83 4.8 2.6 .85 6.6 1.4 .61 .10
Nurber/Nue.oral COrres. 3 1.3 1.0 .43 1.3 0.4 .14 2.2 0.4 .57
Addition 4 Subtraction 13 2.1 2.3 .84 2.3 2.7 .$4 5.5 2.9 .82 .116
Counting 1 -3') 10 11.9 8.0 11.2 4.4 20.8 4.1
Nurbers rotal $4 20.6 8.9 .40 14.4 0.0 .40 14.4 1.4 .43
Relational Term; 17 14.8 1.3 .72 11.3 3.5 ./R 14.1 2.) .71 .80
Classification 15 4.9 3.1 .77 6.7 -1.4 ,R$ 11.0 3.7 .87. .40
Double Classification 0 2.7 1.6 .30 3.7 2.1 .60 4.8 2.0 .57 .54
ClaAlfleatton Total 24 7.7 1.9- .73 10.4 5,1 *- .85 15.8 5.1 .86 .89
Sorting Iota! i6 5.1 3.1 .7: 6.1 3.4 .77 10.1 4.3 .87 .87
Part3 o1 Made 16C41 10 .2 7.0' .51 4.8 1.8 .35 7.0 2.2 .66 .67
Erotions Total 5.2 2.7 .85 5.5 2.6 .86 6.4 1.6 .63 .81
*Attitude to School 7 5.0 1.1 .71 5.2 2.2 .83 6.1 1.4 .M .74
*Attitude to °theta 4 2.9 1.0 .43 2.6 1.2 .63 3.2. 1.0 .52
*Attitude to Pate 6 4 6 1.6 .73 6.1 2.0 .81 5.0- 1.3 .63 .72
Peabody Raw Score 14.2 11.4 11.5 14.3 50.2 4.8 mPeabody Yenta' Age 14.1 12.4 64.2 16,0
Chronological Age Wes.) 56.4 4.0 53.4 7.8 - -- 69.4 8.2
Sesame Street Test 10 3.4 1.5 --- 4.8 3.6 --- 7.7 2.6 .-Grand Total 214 90,4 11.2 .17 02.0 31.5 .96 142.0 34.9 .98 .08
*N'4 for these sobtests are: Now Study, 156e
Spanish 41
Yollost-DP ' 144
17
tIn.414113) ...... .... moi4.00.,
%sa1,1443"0,0s0, t 2g===..AAA2:nur...1.....C.04/..AmesAftnm*OPP.O... 0. . . . . .
4."""414""I "'A. II1F!FAIFIi;;Arli7;1=Ag222:: paAtt-Arc.iw4p stf
I ;6vavd cS *0%M/ "a 7.32:14 ZZZZZZZ 2888V.:882288=88:ZOo.o..4 :OTZ:..;.
IMMO 4i OrTki ZZZZ "41 A.w N e'f ZZZZ c"".""44 .4..1.1.1f444ZZgAg=4:tteft..=ggqdr^"":4==TGOIOS 0% op
'Tao& 9441S0.41 "K
; ;
. .
timin ote0 s, Iry tt ".l'Uktb,2 ..... Z:4A:VAA*14848A7,8$17701:4.72::274A X484TV42S
("°L ";%1'7JD%1t) "K ......WKSvoutuctti.ViivS1 of ..... :11:1411t8rirrSO2........... ................. ...........
00 %1J',sz '.....;;I:rt:: ... MAAAA.4.1 .. ..,*,A2.1.11+.7 :742AggnX2:::t
..--1v.........................v. .........v..
4 64sas tluoivte4 Az r:e,...?:.g....-..g.::::.1r.r:...,,.....2.7.,vor ...74.277t;41...sz...v.-oo ,,, sr.,,,,,,,, ,, ,,,.. 40 0 A.. M M ',,t m Na 4# * M P WO 0 OS . *
-,:vt:4.:0.t.vle.to...t1.1.:,:v.n.,:l......1 11-Ar.:111.1114:0!.1.4
m ..-4,...,...--,....- ..... 00,10n N0,0w0 ..... 02....7.blzTVIT,O) IZ v.,....., on, es.....14 ft,* 4, NN ..... MV. . ........ 0 0. e.ose,v......11.......e....... .v0 ..
A utmtivv11 1 momm ., :+74":7r41=1".4V;X:14.73:t.r.14: ::6'.15:11,1=::4tr.1;:ro".14?4. ..... . . ....; .. ....0:0 ""331 "4":"}0.41-1'4 " 14 r'"! i7114.":"7477: r: IF:^ri:;1 '..i Vrt *. -. t -4.1 1-: o. cilot:0A 450.s.14.., butsuftc9 te lAfiXIi,iii,..11Virtir:11a,71,,;;?,.;,17,, ,t;;:.:r,...47.f.-Arx,:s=gsl04
uolvw.,gal04 "ez '7"'"*"'V=1=4,Ung to=e3t1An:W.11.74=7
mows,w141 .0 1.1=TV:Vr4g;MAI°44;V;0 ..........
0 43nAtahurzot "or ;:gX:gZAZAAATA:=2;:
vI''""T a""*uco0 tevasAmwsit "a T44;71n.7.;Igt: 1:7.4!44=2;:TAVX1.1=7,
,4141.1 "LT :-F47.,1%i=lx:747:gms"".;;.464K-4-1 FL:;22Aiit:tg:%21 ryOd
""'"' 1;lfIr!Tilri9g4t=1"2storG,... ;.:114WAA.=4;141: .1:11=nng===.1.1=1:2:%gtI
...... ......... OHN NO of
.(1 Irr,,1-477g41ig . Invs=TT ;.71,41".*'.'"""'""4"1;1-11mg
41411.eitmotsw,o.,..4 -111 rAr.ugAzzg Tt......g2:44=paagu;r4r.c:14sTmlx.42o ..a...... ....11................." I1
0 1$01%tiM1 4,1 ktriMti Z7:2;;I:,..., +,..r...........r c....' 1%`....,..................1""°^0...M
0 .;.;"M 1,...4...., o..,,O,...woo...40 ....... o ......... 4,....,
10VWJA7WaVVinft "ft ,11..tne! III,:. o...1.11..::.P.molm...r....N.A..m0.01.4,..0°00...0
At63.voz q,,, Jo go? hi , ;,4,'S0,,.... N.-.015-.0a>t...0 ....... A00,....011 eocK.r........,.
44 ...... 4.........s...s.VO............. ay
0Peat.aq! / 441:%: Tg4.11,tTAAP.:=1,1= ........ *ggt14 ..
O -, ,.. ... ...A.
. ...-,,
0 ",,,,,,,,,,,,,.... ,,,,A, ir,47,..:=0!el,.....,,..bowv.,,,,.... ...... ot.44.,...... . . . . . . . . . '`1. . . . .. . . 11":"V"""";ctl"""
I
4XMika4141 "* .4t.T. =Ur.= '''°4-7.-........ X . t . 4.04Mr.0Mn0n
... .......................1t.1. Qe.':A; . ;
14irnol *43.4 RAM .1. .1:44 :::;:i t+5 . ggiLf..7.ttr.:tleIrvirsggla re g 14 AT2 g . SS: ..1!0
1 8 00 4,4 ." PM N V 0 ....... 00,60./WMNI.PIMIM 044PIP .110 V Mh(Me./!..
8..s.................. ............1.0
14
0 .0104 Apou kilosoN j feKtw... ......... NoAMM0 ........w............... ...............gH 44.4 4.;.;!..1 g,4
6 IrrW7? .
V a:: 1. NO1110 091y 1.rt
..1.1.:::41.1..,Z4i" Is c ruisuts. of itay 4.Its
1. poly 1 4ts 744.1
4. 4.$144 14101
1. *491444.9 tTr.6
II ..14
; ...................7.
1°7.1 t'4". "WI."NX
4 . V V .. 4:".17/ by 4,4424
........ .......HV ...... Sacehlrq 1441414.
14 to.,14111.4 L.11./0
..... 11. both. 14440..
7.1.it.,*...... .... n. Letter Saw.L.. 9
1.1110 4...As
. 44. Vot,41.1
11. )h.adthl
.. wftRigh,
VW.. ...... ..... N4y,
..1 .....
.... .......... .............
- " ....... -
...... ..
$43.1t . sr
17. A14.044
js. 114.44m4 T44.4
k4C40A14401 ALM*
70. M401, 14unbrs
21, 24vor4t1.0.
22. 04421(
21. Countlr7 2ts.t.41.6
24. 41,01.41.W...7.1 (4.77.4.
21. A4414441. I Manretio"
24. Coctrio 1.44
27. 1440b4ss WA.)
21. ).1.4gcm.1 14V.1
21. c117*amto%
10. 1+41424.0..ti1flo.440ft
..... ...... 41. cc..Nat...tor, T..1
12. t4rtlay 7442
Y47.L 44.4ML:=;.i" 3 3
New
7.rt 97 geol. 244.4
14. nes... Sets)
2S. A4t4t44e to gtoei
N. Ault.44. v>t714o
..17 22. 1444.1. to
14. 74body or sow.
....................
11. 1b4Al MOA11
41. 14 ntrot IOt
11. C792 Tot.1
1-I
rr
yn0ol
.
rr0
0Ph
rort
ID
tr
rr
ID
0
i1
014./10ta
of
00'
0
0yn
00Ph
0
0
I.
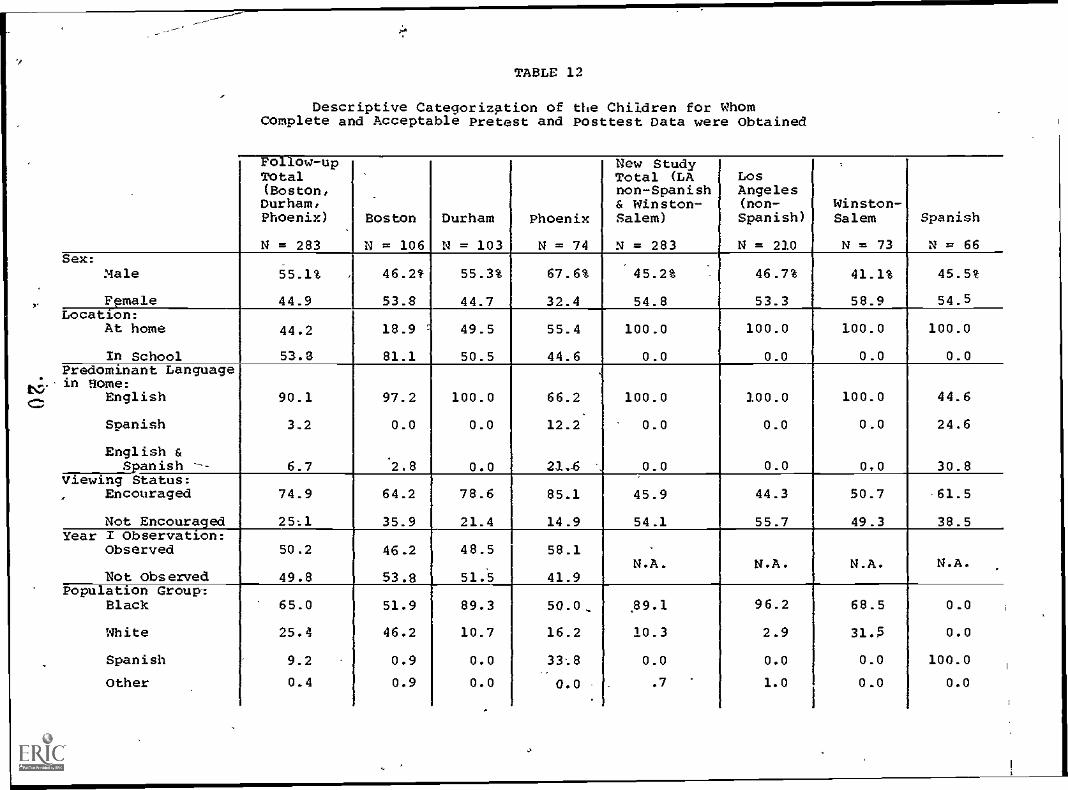
1TABLE 12
Descriptive Categorization of the Children for WhomComplete and Acceptable Pretest and Posttest Data were Obtained 1
Tallow-upTotal(Boston,Durham,Phoenix)
N = 283
Boston
N = 106
Durham
N = 103
Phoenix
N = 74
New StudyTotal (LAnon-Spanish& Winston-Salem)
N = 283
LosAngeles(non-Spanish)
N = 210
.
Winston-Salem
N = 73
Spanish
N= 66Sex:
Male 55.1% . 46.2% 55.3% 67.6% 45.2% 46.7% 41.1% 45.5%
Fpmale 44.9 53.8 44.7 32.4 54.8 53.3 58.9 54.5Location:
At home 44.2 18.9 , 49.5 55.4 100.0 100.0 1.00.0 100.0
In School 53.8 81.1 50.5 44.6 0.0 0.0 0.0 0.0Predominant Language'in Home:
English 90.1 97.2 100.0 66.2 100.0 100.0 100.0 44.6
Spanish 3.2 0.0 0.0 12.2 0.0 0.0 0.0 24.6
English &Spanish -- 6.7 42.8 0.0 21. -6 0.0 0.0 0,0 30.8
Viewing Status:Encouraged 74.9 64.2 78.6 85.1 45.9 44.3 50.7 61.5
Not Encouraged 2511 35.9 21.4 14.9 54.1 55.7 49.3 38.5Year I Observation:
Observed 50.2 46.2 48.5 58.1N.A. N.A. N.A. N.A.
Not Observed 49.8 53.8 51.5 41.9Population Group:
Black 65.0 51.9 89.3 50.0_ 89.1 96.2 68.5 0.0
White 25.4 46.2 10.7 16.2 10.3 2.9 31.5 0.0
Spanish 9.2 0.9 0.0 33.8 0.0 0.0 0.0 100.0
Other 0.4 0.9 0.0 0.0 .7 1.0 0.0 0.0
1
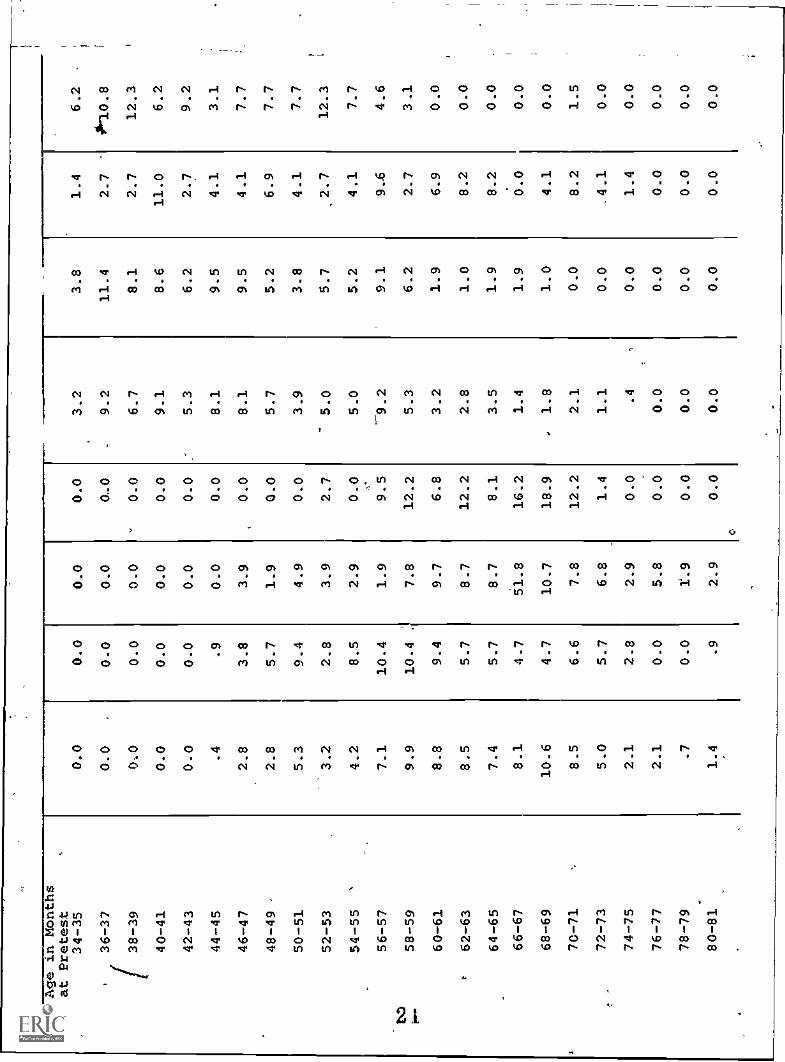
Age in Months
at Pretest
34-35
0.0
0.0
0.0
0.0
36-37
0.0
.0.0
0.0
0-0
i(
38-39
0.0
0.0
0.0
'0.0
40-41
0.0
0.0
0.0
0.0
42-43
0.0
0.0
0.0
0.0
44-45
.4
.9
0.0
0.0
46-47
2.8
3.8
3.9
0.0
48-49 -
2.8
5.7
1.9
0.0
50-51
5.3
9.4
4.9
0.0
52-53
3.2
2.8
3.9
2.7
54-55
'4.2
8.5
2.9
0.0
56-57
7.1
10.4
1.9
9.5
58-59
9.9
10.4
.7.8
12.2
60-61
8.8
9.4
9.7
6.8
62-63
8,5
5.7
8.7
12.2
64-65
7.4
5.7
8.7
8.1
66-67
8.1
4.7
51.8
16.2
68-69
10.6
4.7
10.7
18.9
70-71
8.5
6.6
7.8
12.2
72-73
t-
5.0
5.7
6.8
1.4
74-75
2.1
2.8
2.9
0.0
76-77
2.1
0.0
5.8
0.0
78-79
.7
0.0
1.9
0.0
80-81
1.4
.9
2.9
0.0
0
3.2
3.8
1.4
6.2
9.2
11.4
2.7
0620.8
6.7
8.1
2.7
12.3
9.1
8.6
11.0
6.2
5.3
6.2
2.7
9.2
8.1
9.5
4.1
3.1
8.1
9.5
4.1
7.7
5.7
5.2
6.9
7.7
3.9
3.8
4.1
7.7
5.0
5.7
.2.7
12.3
5.0
5.2
4.1
7.7
-9.2
9.1
4.6
5.3
6.2
2.7
3.1
3.2
1.9
6.9
0.0
2.8
1.0
8.2
0.0
3.5
1.9
8.2
0.0
1.4
1.9
0.0
0.0
1.8
1.0
4.1
0.0
2.1
0.0
8.2
1.5
1.1
0.0
4.1
0.0
.4
0.0
1.4
0.0
0.0
0.0
0.0
0.0
0.0
0.0
0.0
0.0
0.0
0.0
0.0
0.0
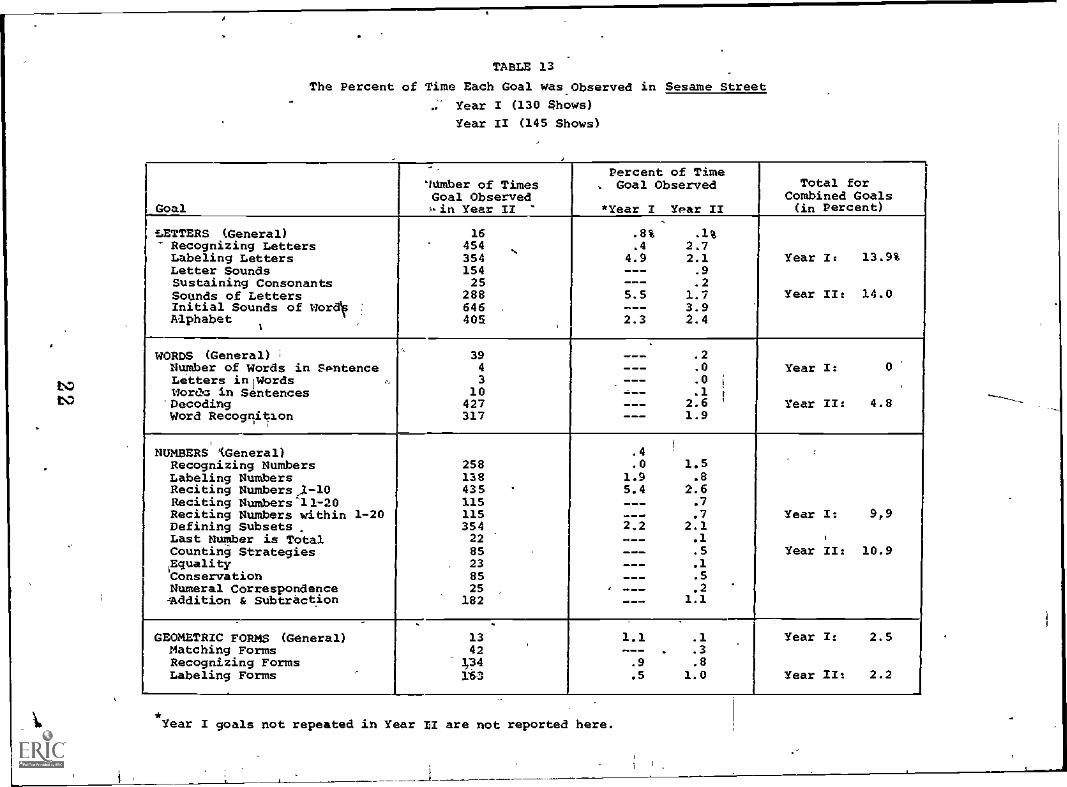
TABLE 13
The Percent of Time Each Goal was Observed in Sesame Street
Year I (130 Shows)
Year II (145 Shows)
Goal
ldmber of TimesGoal Observed.rt Year II '
Percent of Time. Goal Observed
*Year I Year II
Total forCombined Goals(in Percent)
,
LETTERS (General)Recognizing Letters .
16454
.8%
.4.1%
2.7Labeling Letters 354 4.9 2.1 Year I: 13.9%Letter Sounds 154 --- .9Sustaining Consonants 25 --- .2Sounds of Letters 288 5.5 1.7 Year II: 14.0Initial Sounds of War" 646 --- 3.9Alphabet 405 2.3 2.4
WORDS (General) 39 .2Number of Words in Sentence 4 --- .0 Year I: 0Letters injWords , 3 .0 i
Wordo in Sentences 10 - -- .1 1
'Decoding 427 --- 2.6 ' Year IX: 4.8Word Recognition 317 --- 1.9
NUMBERS '{General) .4Recognizing Numbers 258 .0 1.5Labeling Numbers 138 1.9 .8Reciting Numbers 435 5.4 2.6...1-10
Reciting Numbers `11-20 115 --- .7Reciting Numbers within 1-20 115 --- .7 Year I: 9,9Defining Subsets. 354 2,2 2.1Last Number is Total 22 --- .1Counting Strategies 85 --- .5 Year XI: 10.9Equality 23 --- .1Conservation 85 --- .5Numeral Correspondence 25 ,
--- .2Addition & Subtraction 182 --- 1.1
GEOMETRIC FORMS (General) 13 1.1 .1 Year X: 2.5Matching Forms 42Recognizing Forms 1,34 .9 .8Labeling Forms 163 .5 1.0 Year IX: 2.2
*Year I goals not repeated in Year M/ are not reported here.
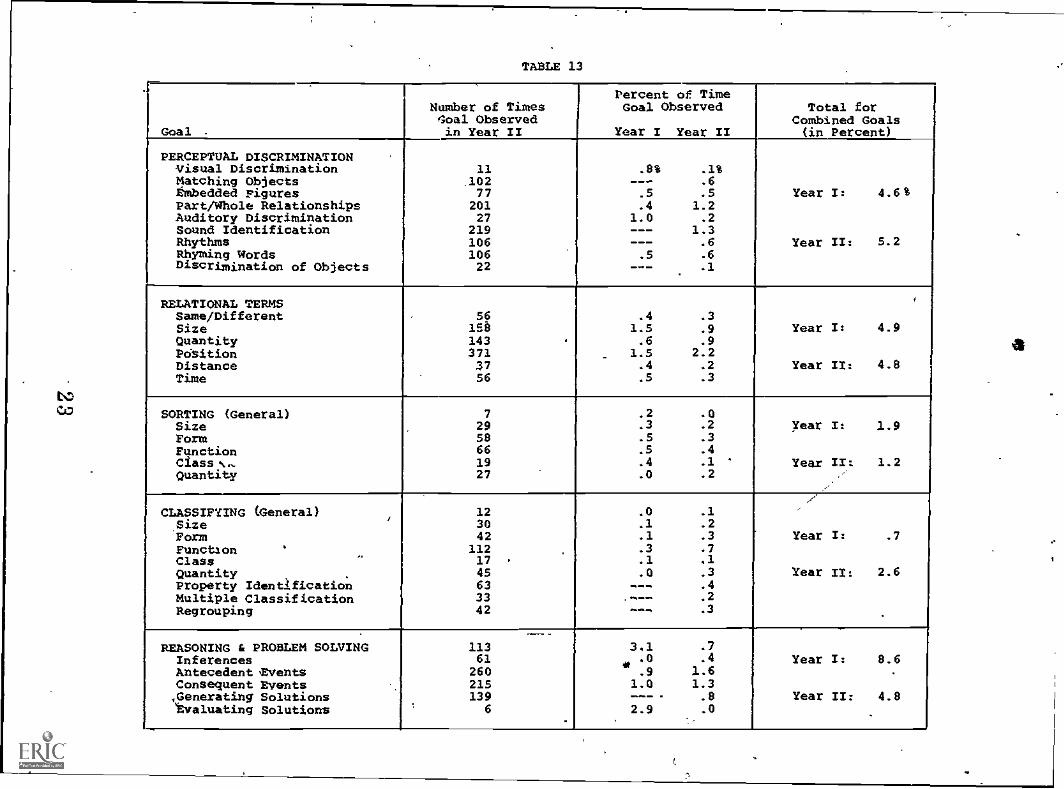
TABLE 13
Goal -
1
Number of Times6'oal Observedin Year II
Percent of TimeGoal Observed
Year I Year II
Total forCombined Goals(in Percent)
PERCEPTUAL DISCRIMINATIONVisual Discrimination 11 .8% .1%Matching Objects 102 --- .6Embedded Figures 77 .5 .5 Year I: 4.6%Part/Whole Relationships 201 .4 1.2Auditory Discrimination 27 1.0 .2Sound Identification 219 --- 1.3Rhythms 106 --- .6 Year II: 5.2Rhyming Words 106 .5 .6Discrimination of Objects 22 --- .1
RELATIONAL TERMSSame/Different 56 .4 .3Size 158 1.5 .9 Year I: 4.9Quantity 143 .6 .9PdSition 371 _ 1.5 2.2Distance 37 .4 .2 Year II: 4.8Time 56 .5 .3
SORTING (General) 7 .2 .0Size 29 .3 .2 Year I: 2.9Form 58 .5 .3
Function 66 .5 .4Class .-- 19 .4 .1 ' Year II: 1.2Quantity 27 .0 .2 .,
CLASSIFYING (General) 12 .0 .1
Size 30 .1 .2Form 42 .1 .3 Year I: .7Function ' 112 .3 .7Class 17 . .1 .1Quantity . 45 .0 .3 Year II: 2.6Property Identification 63 --- .4
Multiple Classification 33 ,..-- .2
Regrouping 42 --- .3
REASONING & PROBLEM SOLVING 113 3.1 .7Inferences 61 .0 .4 Year I: 8.6Antecedent Events 260 .9 1.6 .
Consequent Events 215 1.0 1.3,Generating Solutions 139 --- .8 Year II: 4.8Evaluating Solutions 6 2.9 .0
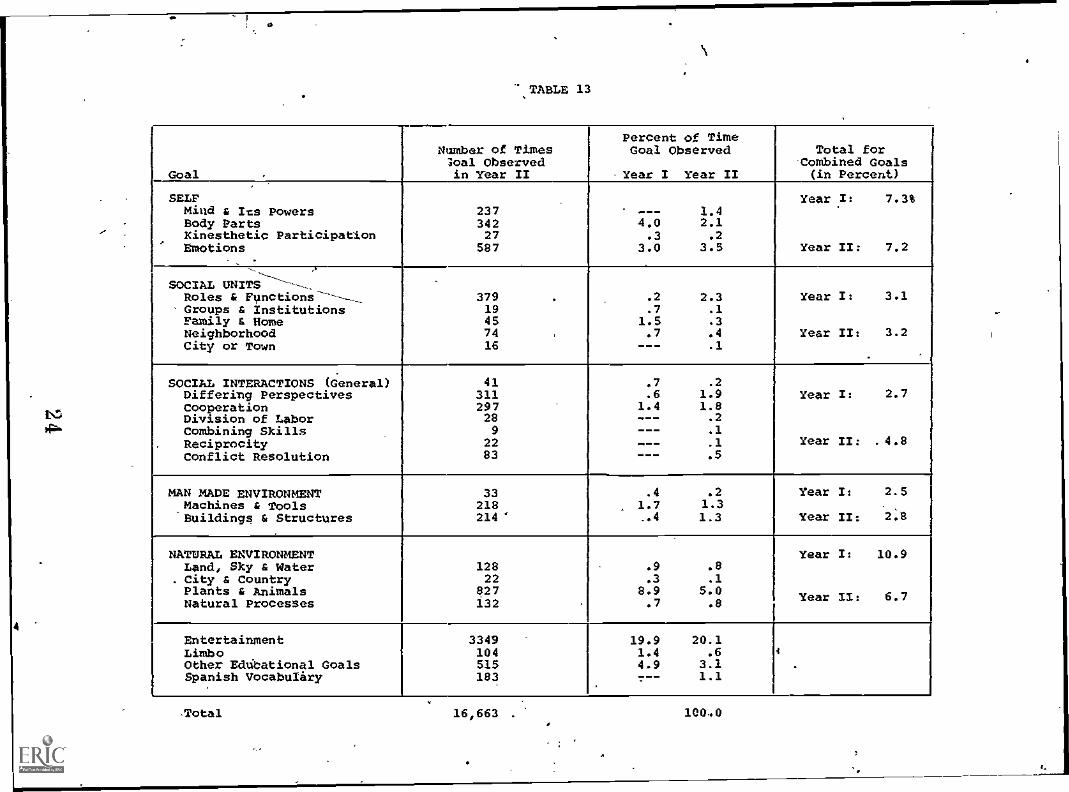
TABLE 13
Goal .
Number of Times"Joel Observedin Year II
Percent of TimeGoal Observed
'Year I Year II
Total forCombined Goals(in Percent)
SELF Year I: 7.3%Mind & Its Powers 237 --- 1.4Body Parts 342 4.0 2.1
,Kinesthetic ParticipationEmotions
27587
.33.0
.23.5 Year II: 7.2
--, :-....,_
SOCIAL UNITS ---,'-_.Roles & Functions ---____ 379 . .2 2.3 Year I: 3.1
Groups & Institutions 19 .7 .1Family 1 Home 45 1.5 .3Neighborhood 74 .7 .4 Year II: 3.2City or Town 16 --- .1
SOCIAL INTERACTIONS (General) 41 .7 .2Differing Perspectives 311 .6 1.9 Year It 2.7Cooperation 297 1.4 1.8Division of Labor 28 .2
Combining Skills 9 --- .1
Reciprocity 22 --- .1 Year II: .4.8Conflict Resolution 83 --- .5
MAN MADE ENVIRONMENT 33 .4 .2 Year I: 2.5Machines & Tools 218 1.7 1.3'Buildings & Structures 214' ,.4 1.3 Year II: 2.8
NATURAL ENVIRONMENT Year I: 10.9Land, Sky & Water 128 .9 .8
. City & Country 22 .3 .1Plants & Animals 827 8.9 5.0Natural Processes 132 .7 .8 1 Year II: 6.7
Entertainment 3349 19.9 20.1Limbo 104 1.4 .6 i
Other EdUbational Goals 515 4.9 3.1 .
Spanish Vocabulary 183 7--,
1.1I
Total 16,663 . 100,0
r-
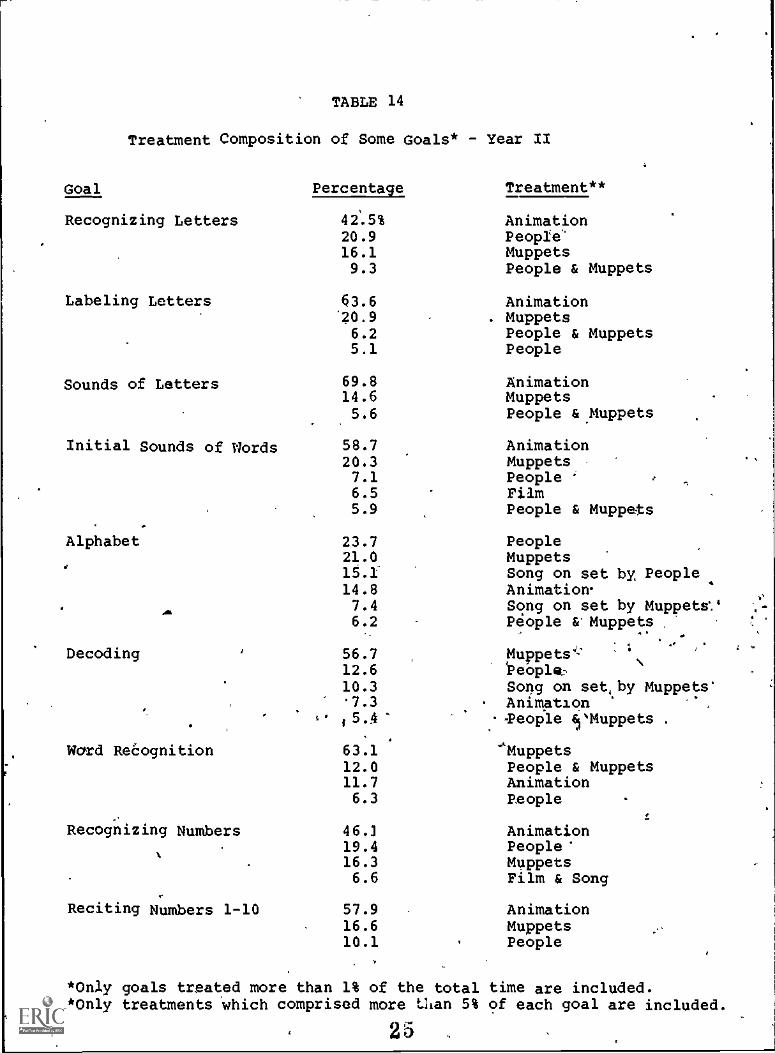
TABLE 14
Treatment Composition of Some Goals* - Year II
Goal Percentage Treatment**
Recognizing Letters 42'.5% Animation20.9 People'16.1 Muppets9.3 People & Muppets
Labeling Letters 63.6 Animation'20.9 Muppets6.2 People & Muppets5.1 People
Sounds of Letters 69.8 Animation14.6 Muppets5.6 People & Muppets
Initial Sounds of Words 58.720.3
AnimationMuppets
7.1 People6.5 Film5.9 People & Muppets
Alphabet 23.7 People21.0 Muppets15.1- Song on set by People14.8 Animation.
All 7.4 Song on set by Muppets'.`6.2 People & Muppets
Decoding
Word Recognition
Recognizing Numbers
Reciting Numbers 1-10
56.7 Muppete: '\12.6 i5eoplat,
10.3 Song on set, by Muppets'67.3 Animation
t 15.4" -People 'Muppets
63.1 "(Muppets12.0 People & Muppets11.7 Animation6.3 People
46.3 Animation19.4 People'16.3 Muppets6.6 Film & Song
57.9 Animation16.6 Muppets10.1 People
*On1y goals treated more than 1% of the total time are included.**Only treatments 'which comprised more than 5% of each goal are included.
25
,
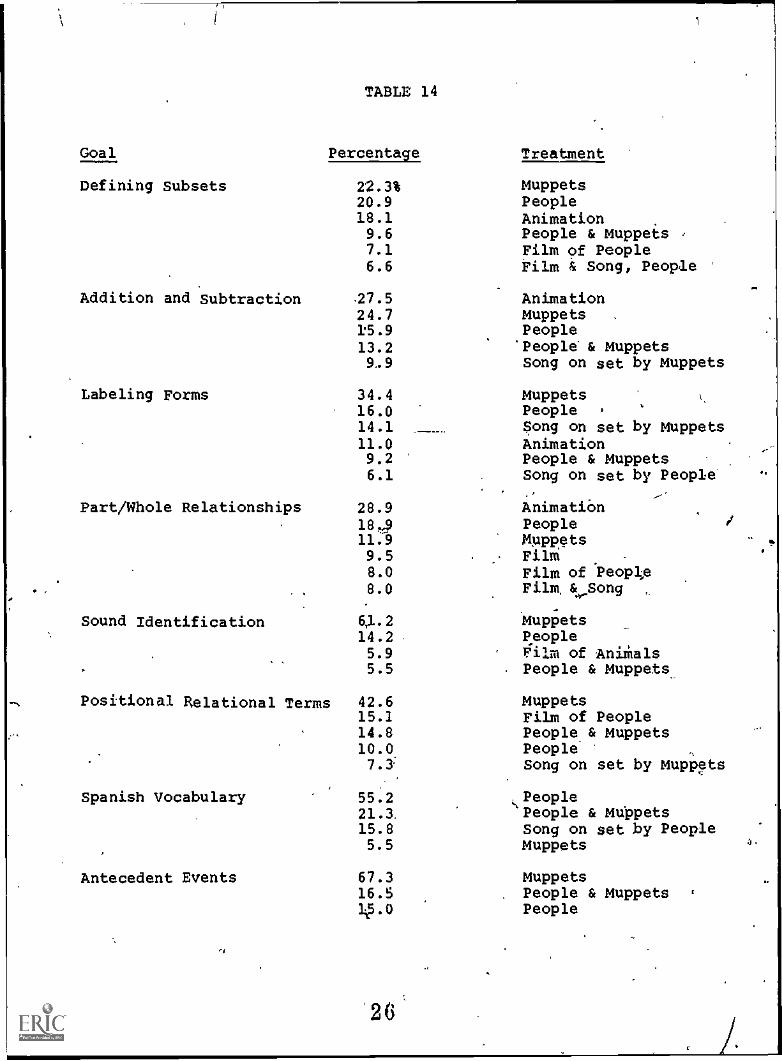
TABLE 14
Goal Percentage Treatment
Defining Subsets 22.3% Muppets20.9 People18.1 Animation9.6 People & Muppets7.1 Film of People6.6 Film & Song, People
Addition and Subtraction -27.5 Animation24.7 Muppets15.9 People13.2 'People & Muppets9.9 Song on set by Muppets
Labeling Forms 34.4 Muppets16.0 People14.1 Bong on set by Muppets11.0 Animation9.2 People & Muppets6.1 Song on set by People
Part/Whole Relationships 28.9 Animation184 People11.9 Muppets9.5 Film8.0 Film of People8.0 Film. keSong ,
Sound Identification 6,1.2 Muppets14.2 People5.9 Film of Animals5.5 - People & Muppets.
Positional Relational Terms 42.6 Muppets15.1 Film of People14.8 People.& Muppets10.0 People7.3: Song on set by Mupppts
Spanish Vocabulary 55.2 People21.3. \People & MuPpets15.85.5
Song on set by PeopleMuppets v.
Antecedent Events 67.3 Muppets16.5 People & Muppets31p.o People
26
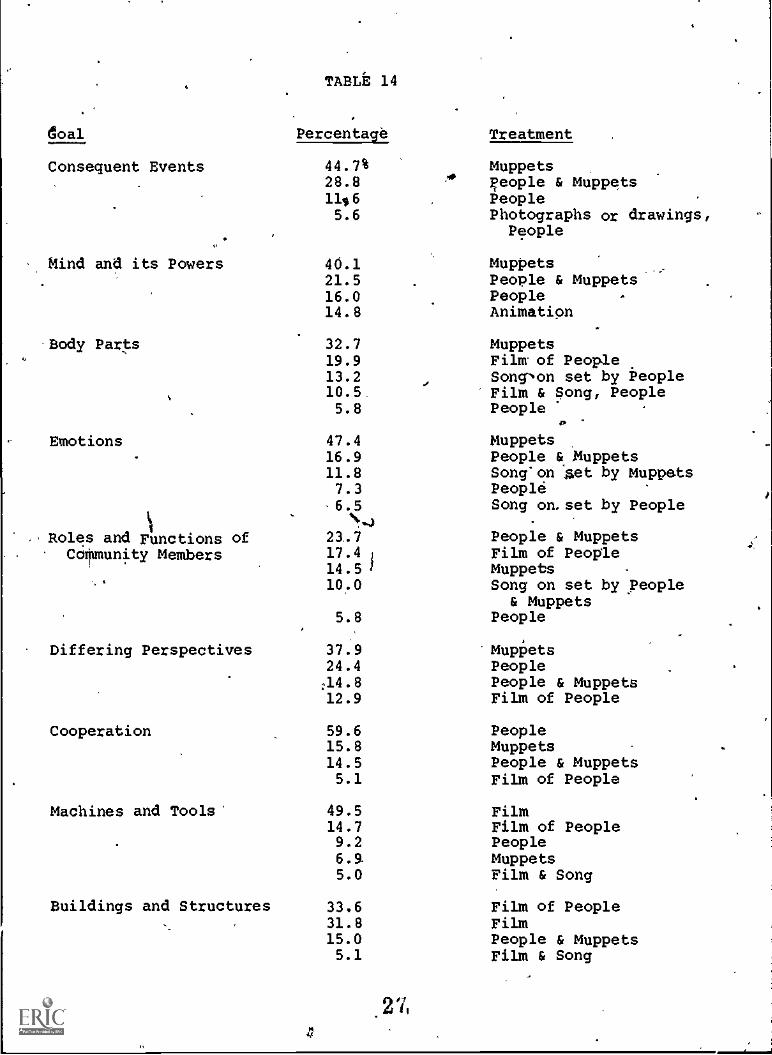
TABLE 14
Coal Percentage Treatment
Consequent Events 44.7% Muppets28.8 People & Muppets146 People5.6 Photographs or drawings,
People
Mind and its Powers 40.1 Muppets_-
21.5 People & Muppets16.0 People14.8 Animation
'Body Parts 32.7 Muppets19.9 Film of People13.2 Song"on set by People10.5. Film & Song, People5.8 People
0
Emotions 47.4 Muppets16.9 People & Muppets11.8 Song'onaet by Muppets7.3 People
-6.5 Song on, set by People.
-.)
Roles and Functions of 23.7 People & MuppetsCommunity Members 17.4 1 Film of People
14.51 Muppets4 10.0 Song on set by People
& Muppets5.8 People
Differing Perspectives 37.9 Muppets24.4 People:14.8 People & Muppets12.9 Film of People
Cooperation 59.6 People15.8 Muppets14.5 People & Muppets5.1 Film of People
Machines and Tools' 49.5 Film14.7 Film of People9.2 People
Muppets5.0 Film & Song
Buildings and Structures 33.6 Film of People31.8 Film15.0 People & Muppets5.1 Film & Song
27,
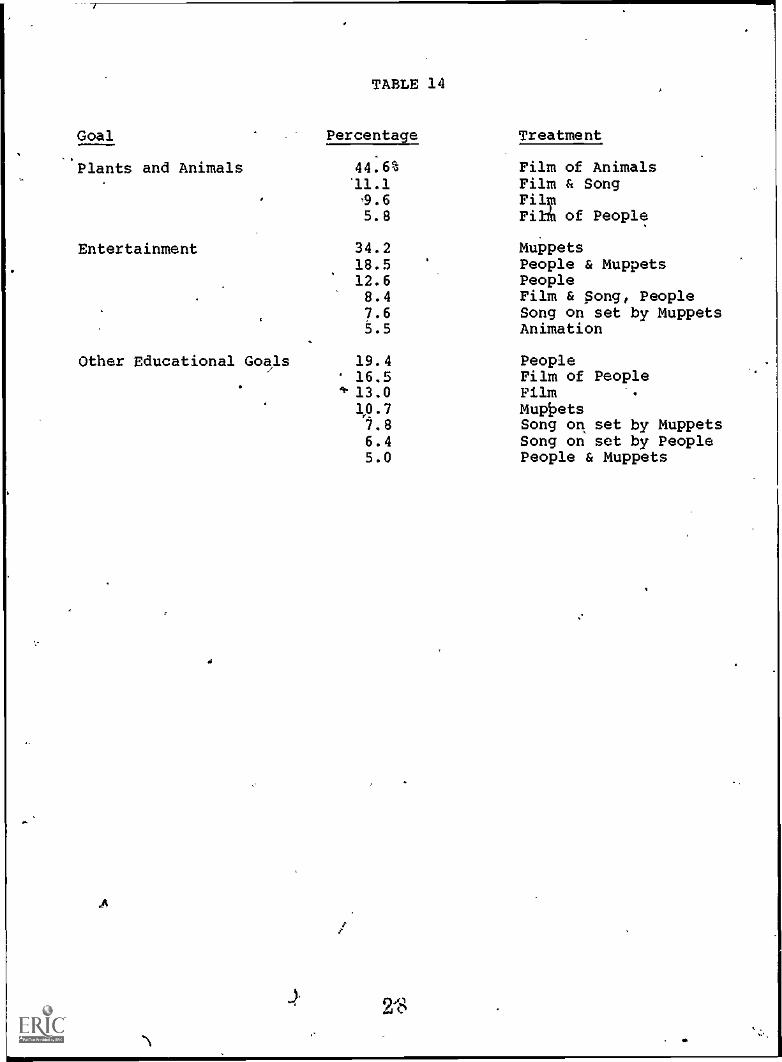
TABLE 14
Goal Percentage Treatment
Plants and Animals 44.6% Film of Animals11.1 Film & Song'9.6 FilT5.8 Film of People
Entertainment 34.2 Muppets18.5 People & Muppets12.6 People8.4 Film & Song, People7.6 Song on set by Muppets5.5 Animation
Other Educational Goals 19.4 People16.5 Film of People
1* 13.0 Film .
1,0.7 Muppets7.8 Song on set by Muppets6.4 Song on set by People5.0 People & Muppets
II
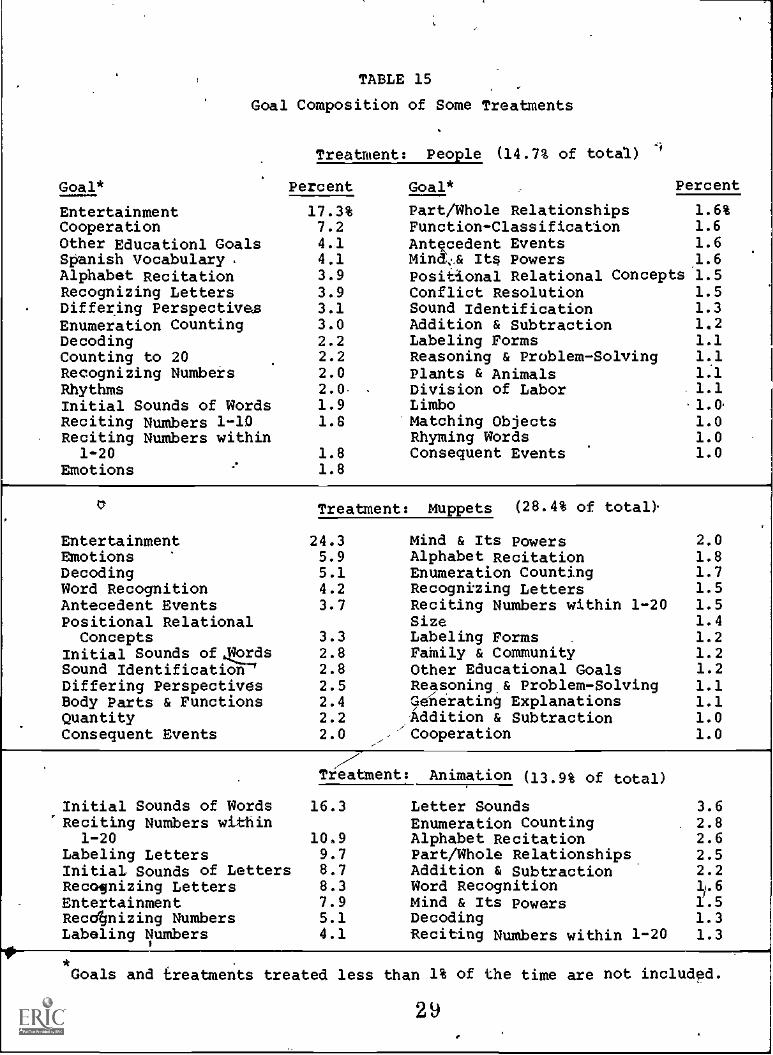
TABLE 15
Goal Composition of Some Treatments
Goal* Percent
Treatment: People (14.7% of total) '
Goal* Percent
Entertainment 17.3% Part/Whole Relationships 1.6%Cooperation 7.2 Function-Classification 1.6Other Educationl Goals 4.1 Antecedent Events 1.6Spanish Vocabulary. 4.1 Minct.,& Its Powers 1.6Alphabet Recitation 3.9 Positional Relational Concepts 1.5Recognizing Letters 3.9 Conflict Resolution 1.5Differing Perspectives 3.1 Sound Identification 1.3Enumeration Counting 3.0 Addition & Subtraction 1.2Decoding 2.2 Labeling Forms 1.1Counting to 20 2.2 Reasoning & Problem-Solving 1.1Recognizing Numbeks 2.0 Plants & Animals 1.1Rhythms 2.0 Division of Labor 1.1Initial Sounds of Words 1.9 LimboReciting Numbers 1-10 1.8 Matching Objects 1.0Reciting Numbers within Rhyming Words 1.0
1-20 1.8 Consequent Events 1.0Emotions 1.8
Treatment: Muppets (28.4% of total)
Entertainment 24.3 Mind & Its Powers 2.0Emotions 5.9 Alphabet Recitation 1.8Decoding 5.1 Enumeration Counting 1.7Word Recognition 4.2 Recognizing Letters 1.5Antecedent Events 3.7 Reciting Numbers within 1-20 1.5Positional Relational Size 1.4
Concepts 3.3 Labeling Forms 1.2Initial Sounds of,eards 2.8 Fakily & Community 1.2Sound Identification 2.8 Other Educational Goals 1.2Differing Perspectives 2.5 Reasoning & Problem-Solving 1.1Body Parts & Functions 2.4 Generating Explanations 1.1Quantity 2.2 Addition & Subtraction 1.0Consequent Events 2.0 - Cooperation 1.0
Treatment: Animation (13.9% of total)
Initial Sounds of Words 16.3 Letter Sounds 3.6'Reciting Numbers within Enumeration Counting 2.8
1-20 10.9 Alphabet Recitation 2.6Labeling Letters 9.7 Part/Whole Relationships 2.5Initial Sounds of Letters 8.7 Addition & Subtraction 2.2Recognizing Letters 8.3 Word Recognition ;.6Entertainment 7.9 Mind & Its Powers 1.5Recd4nizing Numbers 5.1 Decoding 1.3Labeling lumbers 4.1 Reciting Numbers within 1-20 1.3
*Goals and treatments treated less than 1% of the time are not includpd.
29
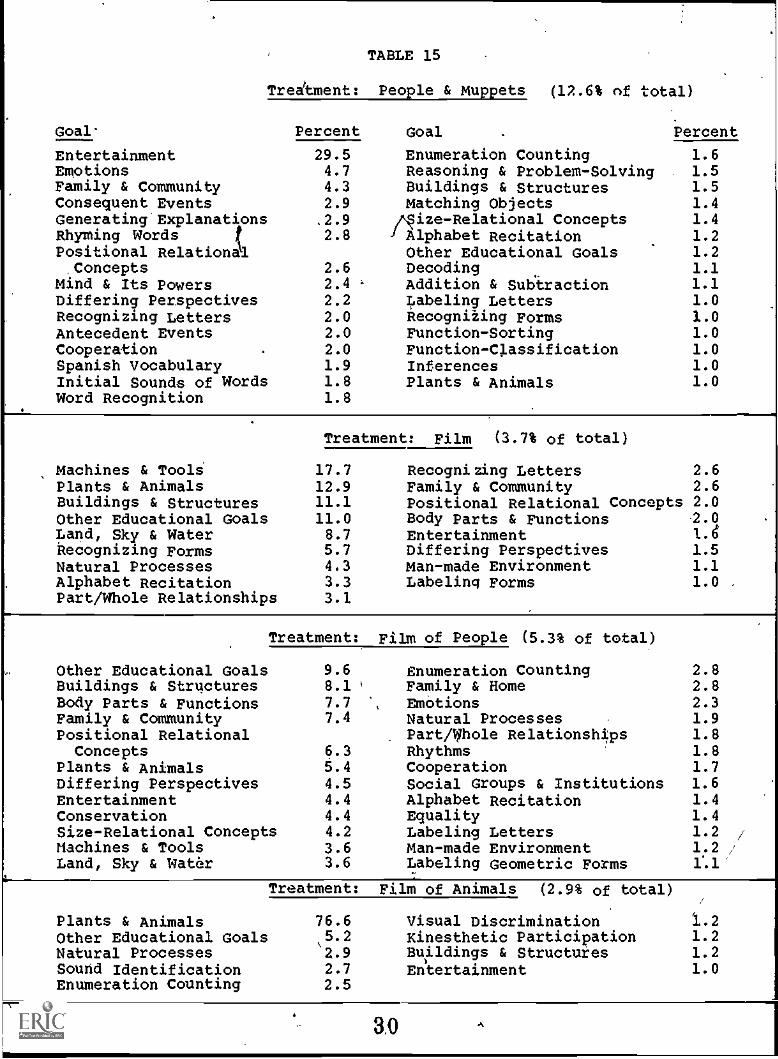
TABLE 15
Treatment: People & Muppets (12.6% of total)
Goal.
EntertainmentEmotionsFamily & CommunityConsequent EventsGenerating' ExplanationsRhyming WordsPositional RelationalConcepts
Mind & Its PowersDiffering PerspectivesRecognizing LettersAntecedent EventsCooperationSpanish VocabularyInitial Sounds of WordsWord Recognition
Percent
29.54.74.32.9.2.92.8
2.62.42.22.02.02.01.91.81.8
Goal
Enumeration CountingReasoning & Problem-SolvingBuildings & StructuresMatching Objects
,Size- Relational ConceptsI Alphabet RecitationOther Educational GoalsDecodingAddition & SubtractionLabeling LettersRecogniiing FormsFunction-SortingFunction-ClassificationInferencesPlants & Animals
Percent
1.61.51.51.41.41.21.21.11.11.01.01.01.01.01.0
Machines & ToolsPlants & AnimalsBuildings & StructuresOther Educational GoalsLand, Sky & WaterRecognizing FormsNatural ProcessesAlphabet RecitationPart/Whole Relationships
Treatment: Film (3.7% of total)
17.712.911.111.08.75.74.33.33.1
Recognizing Letters 2.6Family & Community 2.6Positional Relational Concepts 2.0Body Parts & Functions 2.0Entertainment 1.6Differing PerspeCtives 1.5Man-made Environment 1.1Labeling Forms 1.0 .
Treatment: Film of People (5.3% of total)
Other Educational GoalsBuildings & StructuresBody Parts & FunctionsFamily & CommunityPositional Relational
ConceptsPlants & AnimalsDiffering PerspectivesEntertainmentConservationSize-Relational ConceptsMachines & ToolsLand, Sky & Water
9.68.17.77.4
6.35.44.54.44.44.23.63.6
Enumeration CountingFamily & HomeEmotionsNatural ProcessesPart/Whole RelationshipsRhythmsCooperationSocial Groups & InstitutionsAlphabet RecitationEqualityLabeling LettersMan-made EnvironmentLabeling Geometric Forms
2.82.82.31.91.81.81.71.61.41.41.2 /
1.2 /
Plants & AnimalsOther Educational GoalsNatural ProcessesSound IdentificationEnumeration Counting
Treatment: Film of Animals (2.9% of total)
76.65.2'2.92.72.5
Visual DiscriminationKinesthetic ParticipationBuildings & StructuresEntertainment
l.21.21.21.0
3.0
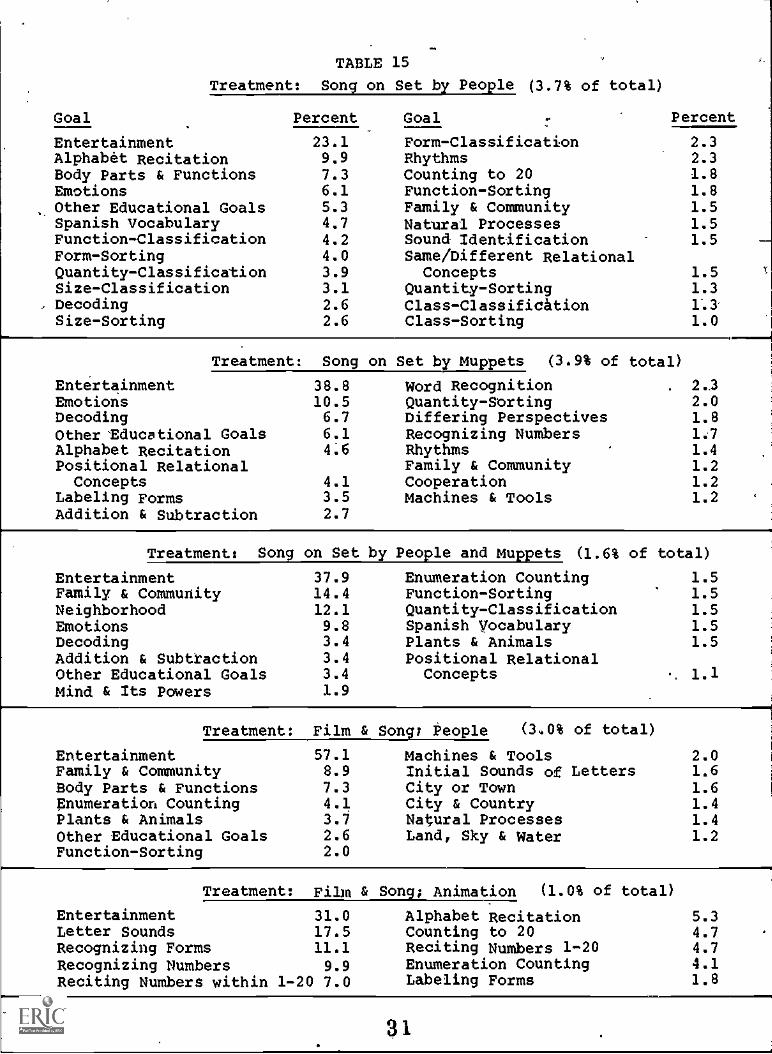
TABLE 15
Treatment: Song on Set by People (3.7% of total)
Goal
EntertainmentAlphabet RecitationBody Parts & FunctionsEmotionsOther Educational GoalsSpanish VocabularyFunction-ClassificationForm-SortingQuantity-ClassificationSize-ClassificationDecodingSize-Sorting
Percent
23.19.97.36.15.34.74.24.03.93.12.62.6
Goal
Form-ClassificationRhythmsCounting to 20Function-SortingFamily & CommunityNatural ProcessesSound IdentificationSame/Different RelationalConcepts
Quantity-SortingClass-C1assifiCitionClass-Sorting
Percent
2.32.31.81.81.51.51.5
1.51.3
1.0
Treatment:
EntertainmentEmotionsDecodingOther 'Educational GoalsAlphabet RecitationPositional RelationalConcepts
Labeling FormsAddition & Subtraction
Song on Set by Muppets (3.9% of total)
38.8 Word Recognition10.5 Quantity-Sorting6.7 Differing Perspectives6.1 Recognizing Numbers4.6 Rhythms
Family & Community4.1 Cooperation3.5 Machines & Tools2.7
2.22.01.81:71.41.21.21.2
Treatments Song on Set by People and Muppets (1.6% of total)
EntertainmentFamily & CommunityNeighborhoodEmotionsDecodingAddition & SubtractionOther Educational GoalsMind & Its Powers
37.914.412.19.83.43.43.41.9
Enumeration CountingFunction-SortingQuantity-ClassificationSpanish VocabularyPlants & AnimalsPositional RelationalConcepts
1.51.51.51.51.5
. 1.1
Treatment:
EntertainmentFamily & CommunityBody Parts & FunctionsEnumeration CountingPlants & AnimalsOther Educational GoalsFunction-Sorting
Film & Song; People (3.0% of total)
57.1 Machines & Tools8.9 Initial Sounds of Letters7.3 City or Town4.1 City & Country3.7 Natural Processes2.6 Land, Sky & Water2.0
2.01.61.61.41.41.2
Treatment: Film & Song; Animation (1.0% of total)
Entertainment 31.0Letter Sounds 17.5Recognizing Forms 11.1Recognizing Numbers 9.9Reciting Numbers within 1-20 7.0
Alphabet RecitationCounting to 20Reciting Numbers 1-20Enumeration CountingLabeling Forms
5.34.74.74.11.8
31
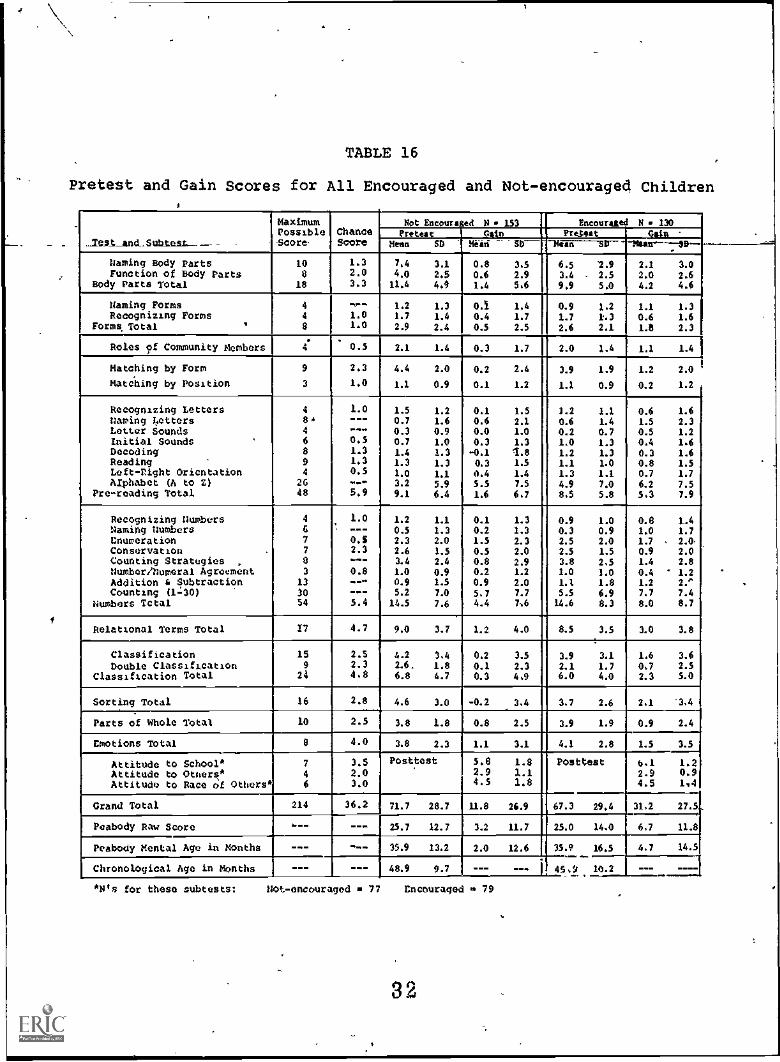
TABLE 16
Pretest and Gain Scores for All Encouraged and Not-encouraged Children
....IeSI_Ind_Subtest_ -SCOre,
MaximumPossible Chance
Score
Not &tours td N 153 Encouraied N 130Pretest fain Pretest , Cain
Mean SD MEid -'5D-- -Nun -31,- `Mar 15
Naming Body Parts 10 1.3 7.4 3.1 0.8 3,5 6.5 '2.9 2.1 3.0Function of Body Parts 8 2.0 4.0 2.5 0.6 2.9 3.4 . 2.5 2.0 2.6
Body Parts Total 18 3.3 11.4 4.9 1.6 5.6 9.9 5.0 4.2 4.6
Naming Forms 4 -,-- 1.2 1.3 0.i 1.4 0.9 1.2 1.1 1.3Recognizing Forms 4 1.0 1.7 1.4 0.4 1.7 1.7 1.3 0.6 1.6
Forms Total 8 1.0 2.9 2.4 0.5 2.5 2.6 2.1 1.8 2.3
Roles of Community Members 4 0.5 2.1 1.6 0.3 1.7 2.0 1.4 1.1 1.4
Matching by Form 9 2.3 4.4 2.0 0.2 2.4 3.9 1.9 1.2 2.0 i
Matching by Position 3 1.0 1.1 0.9 0.1 1.2 1.1 0.9 0.2 1.2
Recognizing Letters 4 1.0 1.5 1.2 0.1 1.5 1.2 1.1 0.6 1.6Naming Letters 8 A 0.7 1.6 0.6 2.1 0.6 1.4 1.5 2.3Letter Sounds 4 --- 0.3 0.9 0.0 1.0 0.2 0.7 0.5 1.2Initial Sounds ' 6 0.5 0.7 1.0 0.3 1.3 1.0 1.3 0.4 1.6Decoding 8 1.3 1.4 1.3 -0.2 1.8 1.2 1.3 0.3 1.6Reading 9 1.3 1.3 1.3 0.3 1.5 1.1 1.0 0.8 1.5Left-Right Orientation 4 0.5 1.0 1.1 0.4 1.4 1.3 1.1 0.7 1.7Alphabet (A to Z) 26 --- 3.2 5.9 5.5 7.5 4.9 7.0 6.2 7.5
Pre-reading Total 48 5.9 9.1 6.4 1.6 6.7 8.5 5.8 5.3 7.9
Recognizing Numbers 4 1.0 1.2 1.1 0.1 1.3 0.9 1.0 0.0 1.4Naming Numbers 6 --- 0.5 1.3 0.2 1.3 0.3 0.9 1.0 1.7Enumeration 7 0.5 2.3 2.0 1.5 2.3 2.5 2.0 1.7 2.0Conservation 7 2.3 2.6 1.5 0.5 2.0 2.5 1.5 0.9 2.0Counting Strategies , 8 --- 3.6 2.4 0.8 2.9 3.8 2,5 1.4 2.8Number/Numeral Agreement 3 0.8 1.0 0.9 0.2 1.2 1.0 1.0 0.4 1.2Addition i Subtraction 13 --- 0.9 1.5 0.9 2.0 1.1 1.8 1.2 2."Counting (1.:30) 30 --- 5.2 7.0 5,7 7.7 5.5 6.9 7.7 7.4
Numbers Total 54 5.4 14.5 7.6 4.4 7,6 16.6 8.3 8.0 8.7
Relational Terms Total 17 4.7 9.0 3.7 1.2 4.0 8.5 3.5 3.0 3.8
Classification 15 2.5 4.2 3,4 0.2 3.5 3.9 3.1 1.6 3.6Double Classification 9 2.3 2.6. 1.8 0.1 2.3 2.1 1.7 0.7 2.5
Classification Total 24 4.8 6.8 4.7 0.3 4,9 6.0 4.0 2.3 5.0
Sorting Total 16 2.8 4.6 3.0 -0.2 3,4 3,7 2.6 2,1 '3,4
Parts of Whole Total 10 2.5 3.8 1.8 0.8 2.5 3.9 1.9 0.9 2.4
Emotions Total 8 4.0 3.8 2.3 1.1 3.1 4.1 2.8 1.5 3.5
Attitude to School* 7 3,5 Posttest 5.8 1.8 Posttest 4,1 1.2Attitude to Others* 4 2.0 2.9 1.1 2.9 0.9Attitude to Race of Others* 6 3.0 4.5 1.8 4.5 1.4
Grand Total 214 36.2 71.7 28.7 11.8 26.9 67.3 29.4 31,2 27.5,
Peabody Raw Score .--- --- 25.7 12.7 3.2 11.7 25.0 14,0 4,7 11.8
Peabody Mental Age in Months --- --- 35.9 13.2 2.0 12.6 35.9 16.5 4,7 14.5
Chronological Age in Months --- --- 48.9 9.7 --- --- - 45,9 10.2 --- ----
"N's for these subtests: Not-encouraged 77 Encouraged . 79
32
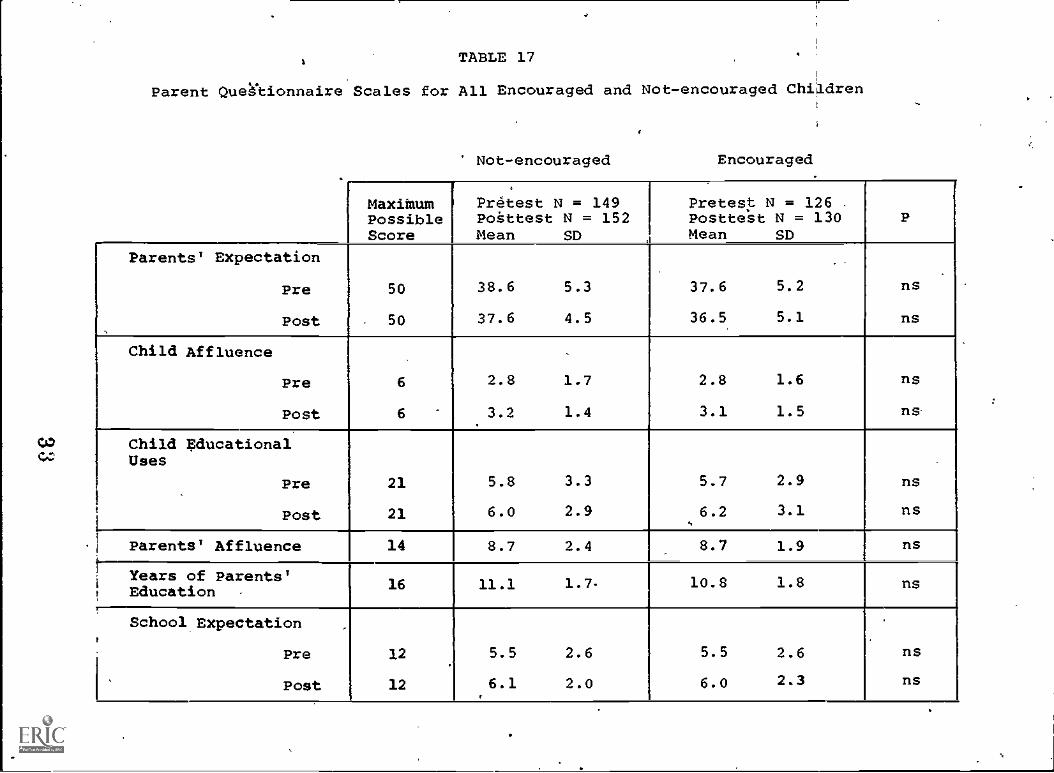
TABLE 17
Parent OueAionnaire Scales for All Encouraged and Not-encouraged Children
Not-encouraged Encouraged
MaxiMumPossibleScore
( .
PretestPoittestMean
N = 149N = 152SD
Pretest N = 126Postte'st N = 130Mean SD
P
Parents' Expectation
Pre 50 38.6 5.3 37.6 5.2 ns
,
Post 50 37.6 4.5 36.5 5.1 ns
Child Affluence
Pre 6 2.8 1.7 2.8 1.6 ns
Post 6 3.2 1.4 3.1 1.5 ns_
Child EducationalUses
Pre 21 5.8 3.3 5.7 2.9 ns
Post 21 6.0 2.9 6.2 3.1 ns
1
1 Parents' Affluence 14 8.7 2.4 8.7 1.9 ns
Years of Parents'Education -
16 11.1 1.7. 10.8 1.8 ns
School Expectation
Pre 12 5.5 2.6 5.5 2.6 ns
Post 12 6.1 2.0 6.0 2.3 ns
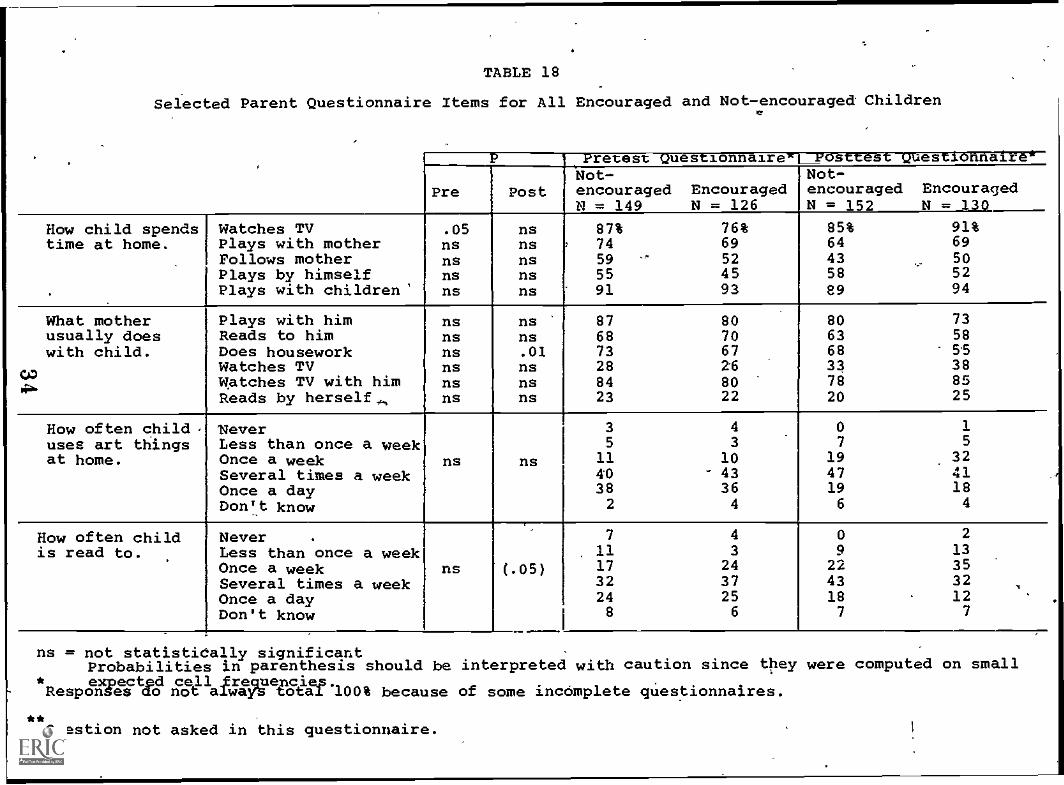
TABLE 18
Selected Parent Questionnaire Items for All Encouraged and Not-encouraged Children
.,
Pretest Questionnairel9 Posttest Questionnaire
Pre PostNot-encouragedN = 149
EncouragedN = 126
Not-encouragedN = 152
EncouragedN = 130
How child spends Watches TV .05 ns 87% 76% 85% 91%time at home. Plays with mother ns ns 74 69 64 69
Follows mother ns ns 59 " 52 43 50Plays by himself ns ns 55 45 58 52Plays with children' ns ns 91 93 89 94
What mother Plays with him ns ns 87 80 80 73usually does Reads to him ns ns 68 70 63 58with child. Does housework ns .01 73 67 68 55
GO4b.
Watches TVWatches TV with him
nsns
nsns
2884
2680
3378
3885
Reads by herself;, ns ns 23 22 20 25
How often child,uses art things
NeverLess than once a week
35
43
07
15
at home. Once a week ns ns 11 10 19 32Several times a week 40 43 47 41Once a day 38 36 19 18
Don't know 2 4 6 4
How often child Never . 7 4 0 2
is read to. Less than once a week 11 3 9 13
Once a week ns (.05) 17 24 22 35
Several times a weekOnce a day
3224
3725
4318 .
3212
Don't know 8 6 7 7
ns = not statistically significantProbabilities in parenthesis should be interpreted with caution since they were computed on smallexpected cell Srequepcies.
Responses ao not aiways total 100% because of some incomplete questionnaires.
**Question not asked in this questionnaire.
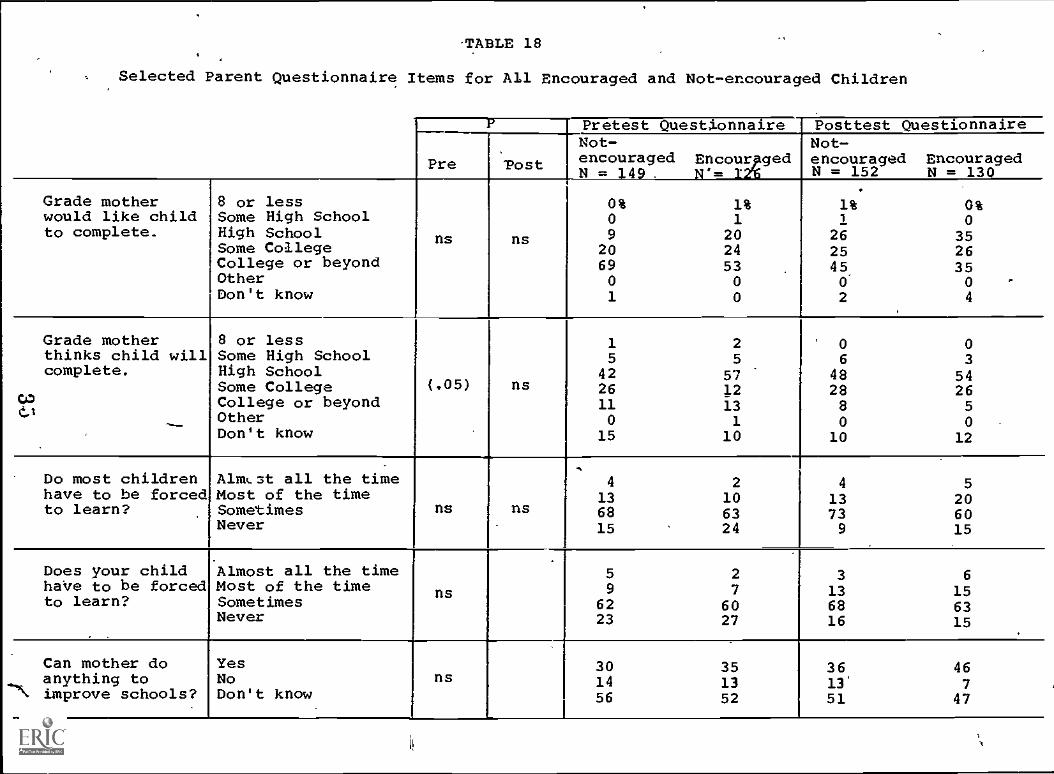
TABLE 18
Selected Parent Questionnaire Items for All Encouraged and Not-encouraged Children
''...', Pretest Questi.onnaire Posttest Questionnaire
Pre.
'Post
Not-encouragedN = 4 . '= '2%N'= 12%
Not-encouragedN = 152
EncouragedN = 130
Grade mother 8 or less 0% 1% 1% 0%would like child Some High School 0 1 1 0to complete. High School ns ns 9 20 26 35
Some College 20 24 25 26College or beyond 69 53 45 35Other 0 0 0' 0Don't know 1 0 2 4
Grade mother 8 or less 1 2 0 0thinks child will Some High School 5 5 6 3complete. High School 42 57 48 54
Some College (.05) ns 26 12 28 26OD College or beyond 11 13 8 5C.1 Other 0 1 0 0
Don't know 15 10 10 12
Do most children AlmL.-st all the time 4 2 4 5have to be forced Most of the time 13 10 13 20to learn? Sometimes
Neverns ns 68
15 .
6324
739
6015
Does your child Almost all the time 5 2 3 6haVe to be forced Most of the time ns 9 7 13 15to learn? Sometimes 62 60 68 63
Never 23 27 16 15
Can mother do Yes 30 35 36 46anything to No ns 14 13 13' 7
\ improve schools? Don't know 56 52 51 47
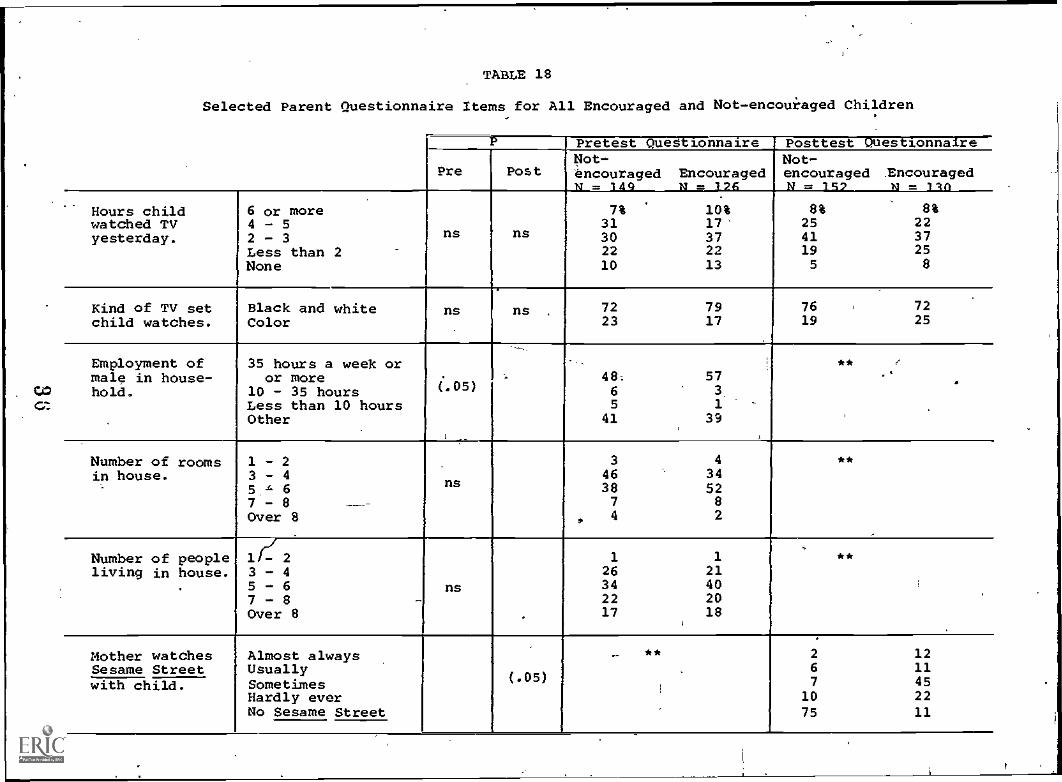
TABLE 18
Selected Parent Questionnaire Items for All Encouraged and Not-encouiaged Children
P Pretest Questionnaire Posttest Questionnaire
Pre PostNot-encouragedw = 140
EncouragedN = 126
Not-encouragedN = 152
EncouragedM = 11A
Hours child 6 or more 7% 10% 8% 8%watched TV 4 - 5 31 17' 25 22yesterday. 2 - 3 ns ns 30 37 41 37
Less than 2 22 22 19 25None 10 13 5 8
Kind of TV setchild watches.
Black and whiteColor
ns us .7223
7917
76 ,
197225
Employment of 35 hours a week or **
male in house- or more 48: 57 .hold. 10 - 35 hours (05) 6 3
Less than 10 hours 5 1Other 41 39
Number of rooms 1 - 2 3 4 **
in house. 3 - 4 46 345 - 6 ns 38 527 - 8 - -- 7 8
Over 8 4 2. ,
Number of people lr-42 1 1 **
living in house. 3 - 4 26 21. 5 - 6 ns 34 40
7 - 8 - 22 20Over 8 17 18
Mother watches Almost always - ** 2 12Sesame Street Usually
Sometimes (.05)67
1145with child.
Hardly ever 10 22No Sesame Street 75 II
J
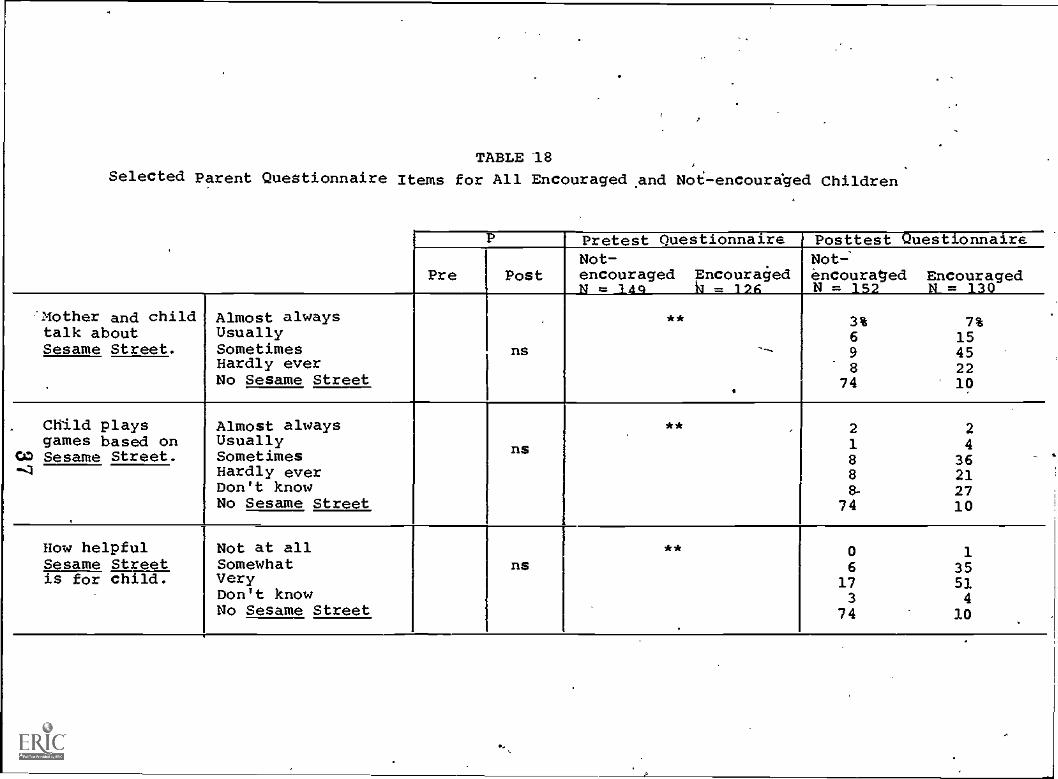
TABLE 18
Selected Parent Questionnaire Items for All Encouraged and Not-encoura.ged Children
P Pretest Questionnaire ' Posttest Questionnaire
Pre PostNot-encouragedN -...: 14Q
Encouragedk = 196
Not-'encouragedN = 1S2
EncouragedN_= 130
'Mother and child Almost always ** 3% 7%talk about Usually 6 15Sesame Street. Sometimes ns '-- 9 45
Hardly everNo Sesame Street
874
2210
I
.
Child playsgames based on
Almost alwaysUsually
ns
**, 2
124
GO Sesame Street. Sometimes 8 36- Hardly ever 8 21Don't know 8- 27No Sesame Street 74 10
How helpful Not at all ** 0 1Sesame Street Somewhat ns 6 35is for child. Very 17 51
Don't know 3 4No Sesame Street 74 10
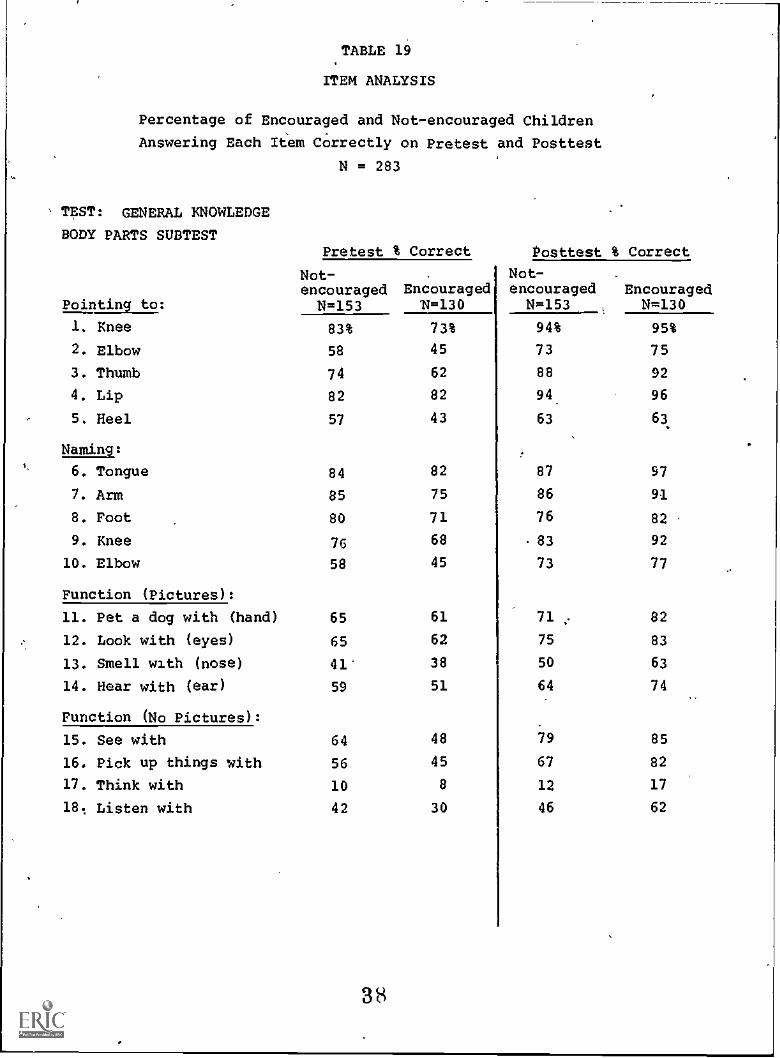
TABLE 19
ITEM ANALYSIS
Percentage of Encouraged and Not-encouraged Children
Answering Each Item Correctly on Pretest and Posttest
TEST: GENERAL KNOWLEDGE
BODY PARTS SUBTEST
Pointing to:
N = 283
Pretest % Correct
Not-encouragedN=153
Encouraged"N=130
1. Knee 83% 73%
2. Elbow 58 45
3. Thumb 74 62
4. Lip 82 82
5. Heel 57 43
Naming:
6. Tongue 84 82
7. Arm 85 75
8. Foot 80 71
9. Knee 76 68
10. Elbow 58 45
Function (Pictures):
11. Pet a dog with (hand) 65 61
12. Look with (eyes) 65 62
13. Smell with (nose) 41 38
14. Hear with (ear) 59 51
Function (No Pictures):
15. see with 64 48
16. Pick up things with 56 45
17. Think with 10 8
18. Listen with 42 30
38
Posttest % Correct
Not-encouraged Encouraged
N=153 , N=130
94% 95%
73 75
88
94
63
87
86
76
83
73
71
75
50
64
79
67
12
46
92
96
63
97
91
82
92
77
82
83
63
74
85
82
17
62
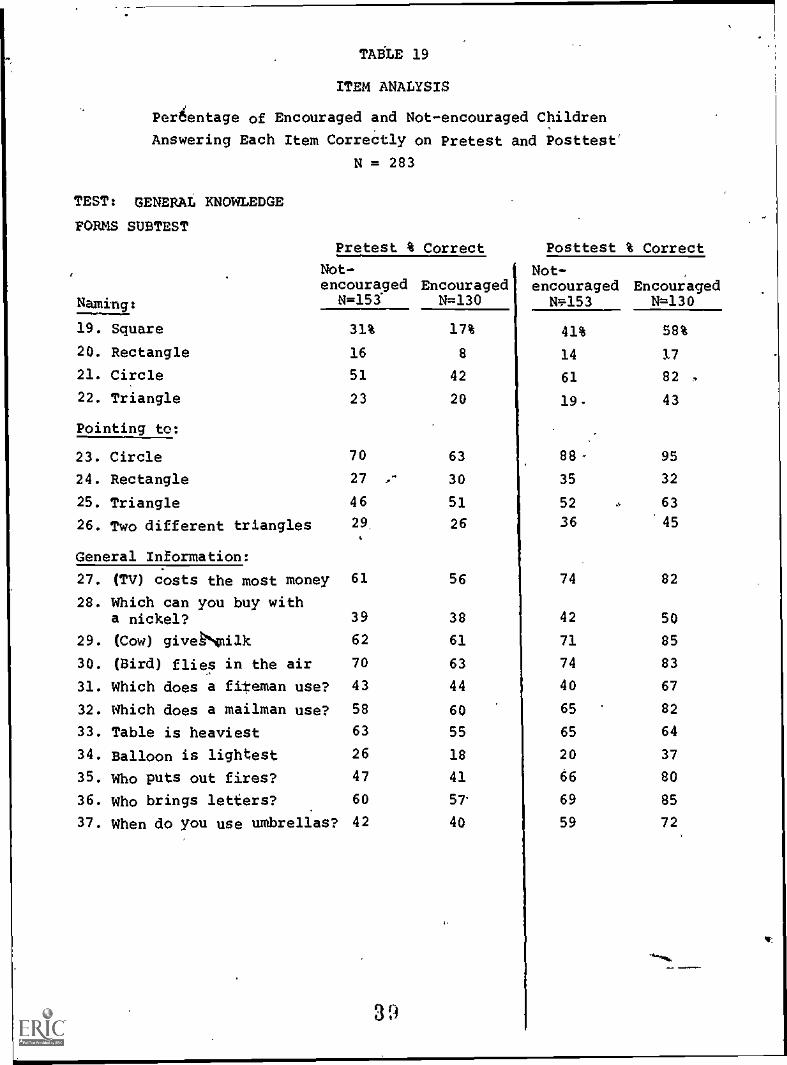
TABLE 19
ITEM ANALYSIS
Per6entage of Encouraged and Not-encouraged Children
Answering Each Item Correctly on Pretest and Posttest'
N = 283
TEST: GENERAL KNOWLEDGE
FORMS SDBTEST
Pretest % Correct Posttest t Correct
Not-.
encouraged EncouragedNaming: N=153 N=130
19. Square 31% 17%
20. Rectangle 16 8
21. Circle 51 42
22. Triangle 23 20
Pointing to:
23. Circle 70 63
24. Rectangle 27 30
25. Triangle 46 51
26. Two different triangles 29 26
General Information:
27. (Tv) costs the most money 61 56
28. Which can you buy witha nickel? 39 38
29. (Cow) giveNdlk 62 61
30. (Bird) flies in the air 70 63
31. Which does a fireman use? 43 44
32. Which does a mailman use? 58 60
33. Table is heaviest 63 55
34. Balloon is lightest 26 18
35. Who puts out fires? 47 41
36. Who brings letters? 60 537. When do you use umbrellas? 42 40
39
Not-encouraged Encouraged
N=153 N=130
41% 58%
14 17
61 82
19 43
88- 95
35 32
52 63
36 '45
74 82
42 50
71 85
74 83
40 67
65 82
65 64
20 37
66 80
69 85
59 72
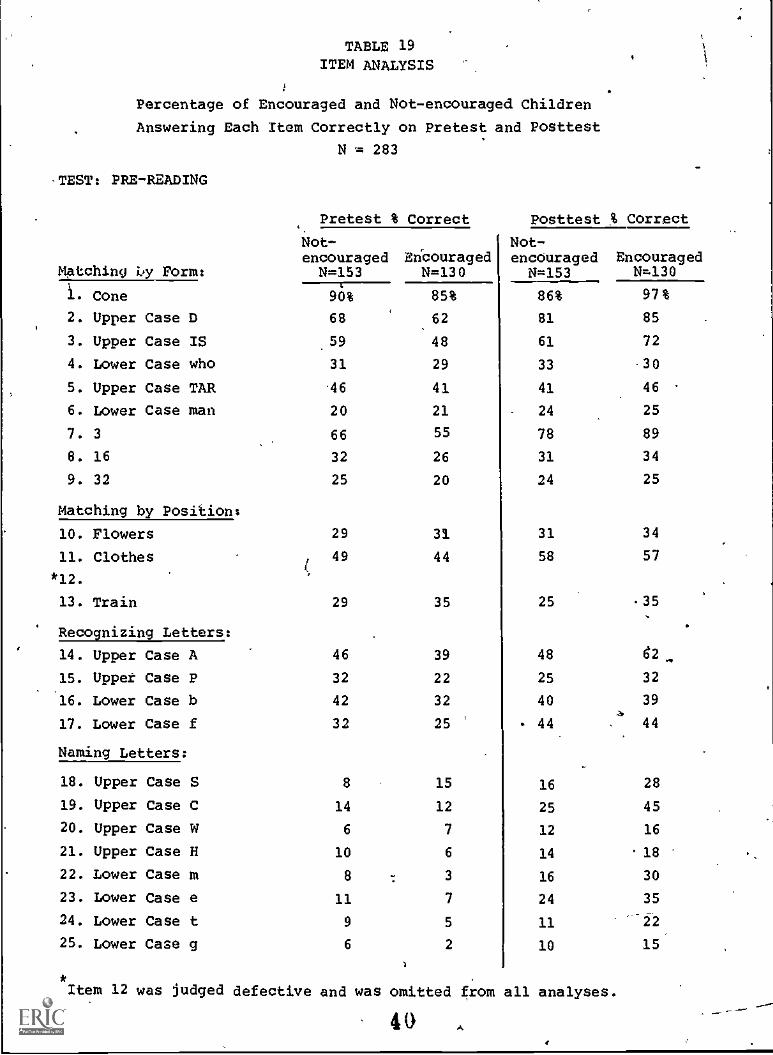
TABLE 19ITEM ANALYSIS
)
Percentage of Encouraged and Not-encouraged Children
Answering Each Item Correctly on Pretest and Posttest
N = 283
TEST: PRE-READING
4
Pretest % Correct Posttest % Correct
Not-encouraged Elicouraged
Not-encOuraged Encouraged
Matching LT Form: N=153 N=130 N=153 N=130
l. Cone 90% 85% 86% 97%
2. Upper Case D 68 62 81 85
3. Upper Case IS .59 48 61 72
4. Lower Case who 31 29 33 305. Upper Case TAR .46 41 41 46
6. Lower Case man 20 21 24 25
7. 3 66 55 78 89
O. 16 32 26 31 34
9. 32 25 20 24 25
Matching by Positions
10. Flowers 29 33. 31 34
11. Clothes 49 44 58 57
*12.(
13. Train 29 35 25 35
Recognizing Letters:
14. Upper Case A 46 39 48 d2
15. Uppet Case P 32 22 25 32
16. Lower Case b 42 32 40 39
17. Lower Case f 32 25 44 44
Naming Letters:
18. Upper Case S 8 15 16 28
19. Upper Case C 14 12 25 45
20. Upper Case W 6 7 12 16
21. Upper Case H 10 6 14 18
22. Lower Case m 8 : 3 16 30
23. Lower Case e 11 7 24 35
24. Lower Case t 9 5 11 22
25. Lower Case g 6 2 10 15
1
*
Item 12 was judged defective and was omitted from all analyses.
40 A
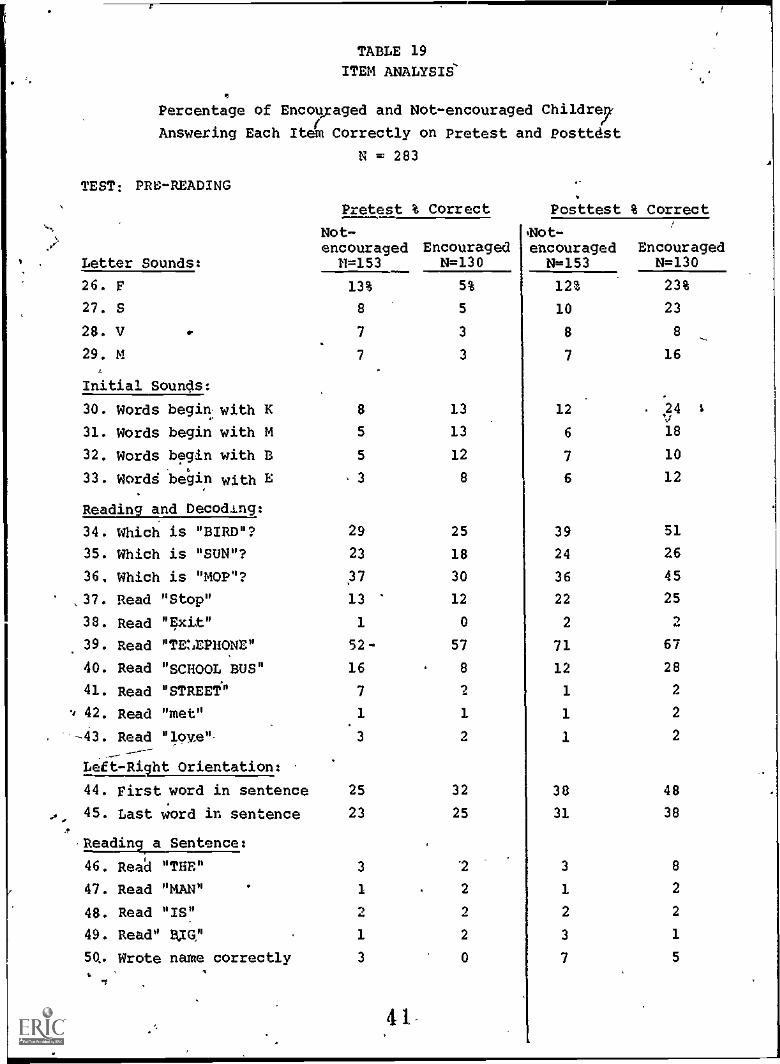
TABLE 19
ITEM ANALYSIS'.
Percentage of Encou ;aged and Not-encouraged Childre7
Answering Each Item Correctly on Pretest and Posttdst
N = 283
TEST: PRE-READING
Letter Sounds:
26. F
27. S
28. V
29. M
Initial Sounds:
30. Words begin: with K
31. Words begin with M
32. Words begin with B
33. Wordg begin with E
Reading and Decoding:
34. Which is "BIRD"?
35. Which is "SUN"?
36, Which is "MOP"?
,37. Read "Stop"
38. Read "Exit"
39. Read "TEMPHONE"
40. Read "SCHOOL BUS"
41. Read "STREET"
42. Read "met"
-43. Read "love"
Left-Right Orientation:
44. First word in sentence
45. Last word in sentence
Reading a Sentence:
46. Read "THE"
47. Read "MAN"
48. Read "IS"
49. Read" BXV
50,. Wrote name correctly
Pretest % Correct
Not-encouraged EncouragedN=153 N=130
13% 5%
8 5
7 3
7 3
8
5
5
3
29
23
13
1
52-
16
7
1
3
25
23
3
1
2
1
3
41.
13
13
12
8
25
18
30
12
0
57
8
2
1
2
32
25
'2
2
2
2
0
Posttest
%Not -
encouragedN=153
12%
10
8
7
12
6
7
6
39
24
36
22
2
71
12
1
1
J.
38
31
3
1
2
3
7
% Correct
EncouragedN=130
23%
23
8
16
:24 s
18
10
12
51
26
45
25
2
67
28
2
2
2
48
38
8
2
2
1
5
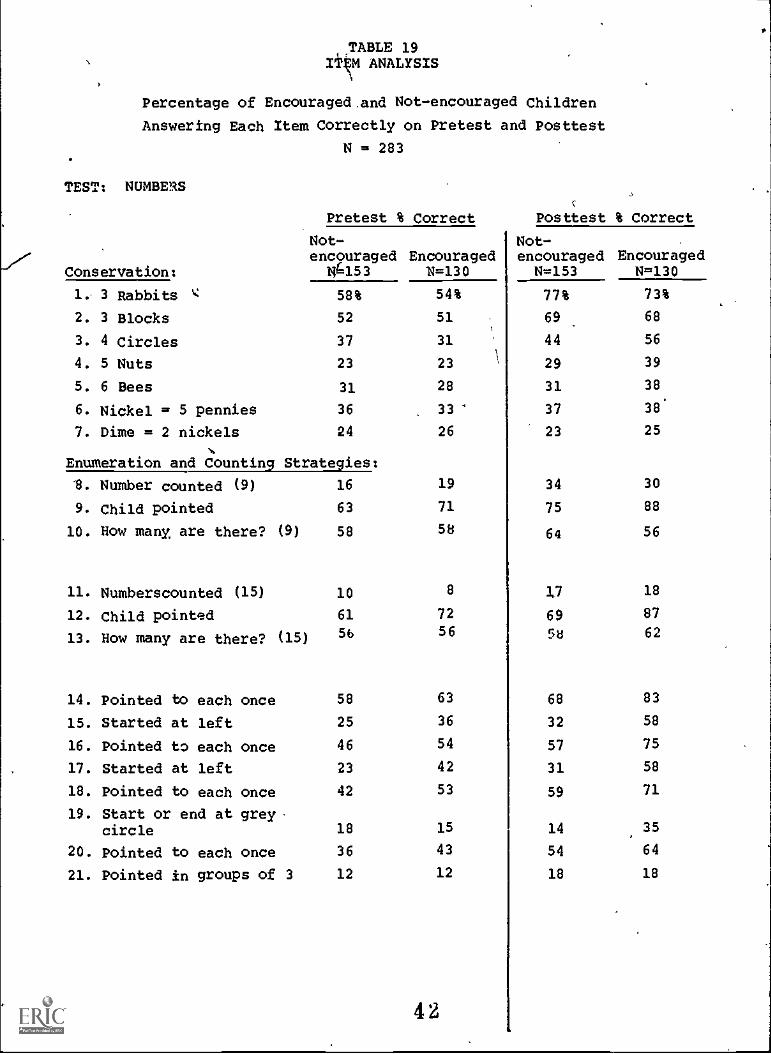
TABLE 19I44 ANALYSIS
Percentage of Encouraged and Not-encouraged Children
Answering Each Item Correctly on Pretest and Posttest
N = 283
TEST: NUMBERS
Pretest % Correct
Not-encouraged Encouraged
Conservation: r*153 N=130
1. 3 Rabbits 58% 54%
2. 3 Blocks 52 51
3. 4 Circles 37 31
4. 5 Nuts 23 23
5. 6 Bees 31 28
6. Nickel = 5 pennies 36 33
7. Dime = 2 nickels 24 26
wEnumeration and Counting Strategies:
1. Number counted (9) 16 19
9. Child pointed 63 71
10. How many, are there? (9) 58 58
11. Numberscounted (15) 10 8
12. Child pointed 61 72
13. How many are there? (15) 5656
14. Pointed to each once 58 63
15. Started at left 25 36
16. Pointed to each once 46 54
17. Started at left 23 42
18. Pointed to each once 42 53
19. Start or end at greycircle 18 15
20. Pointed to each once 36 43
21. Pointed in groups of 3 12 12
42
Posttest % Correct
Not-encouraged Encouraged
N=153 N=130
77% 73%
69 68
44 56
29 39
31 38
37 38'
23 25
34 30
75 88
64 56
17 18
69 87
58 62
68 83
32 58
57 75
31 58
59 71
14 35
54 64
18 18
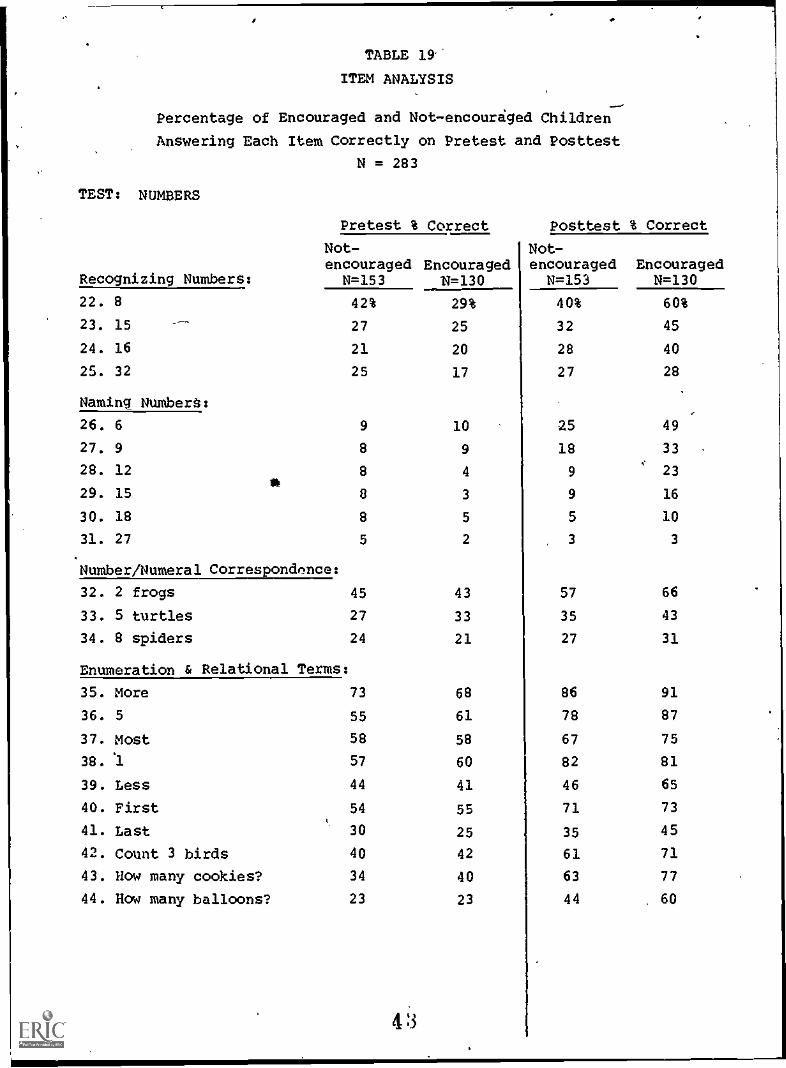
TABLE 19--
ITEM ANALYSIS
Percentage of Encouraged and Not-encouriged Children
Answering Each Item Correctly on Pretest and Posttest
N = 283
TEST: NUMBERS
Pretest % Correct Posttest % Correct
Not-encouraged Encouraged
Recognizing Numbers: N=153 N=130
22. 8 42% 29%
23. 15 27 25
24. 16 21 20
25. 32 25 17
Naming Numberb:
26. 6 9 10
27. 9 8 9
28. 12 8 4
29. 15 8 3
30. 18 8 5
31. 27 5 2
Number/Numeral Correspondence:
32. 2 frogs 45 43
33. 5 turtles 27 33
34. 8 spiders 24 21
Enumeration & Relational Terms:
35. More 73 68
36. 5 55 61
37. Most 58 58
38. '1 57 60
39. Less 44 41
40. First 54 55
41. Last 30 25
42. Count 3 birds 40 42
43. How many cookies? 34 40
44. How many balloons? 23 23
4:3
Not-encouraged Encouraged
N=153 N=130
40% 60%
32 45
28 40
27 28
25 49
18 33
9 23
9 16
5 10
3 3
57 66
35 43
27 31
86 91
78 87
67 75
82 81
46 65
71 73
35 45
61 71
63 77
44 60
41.
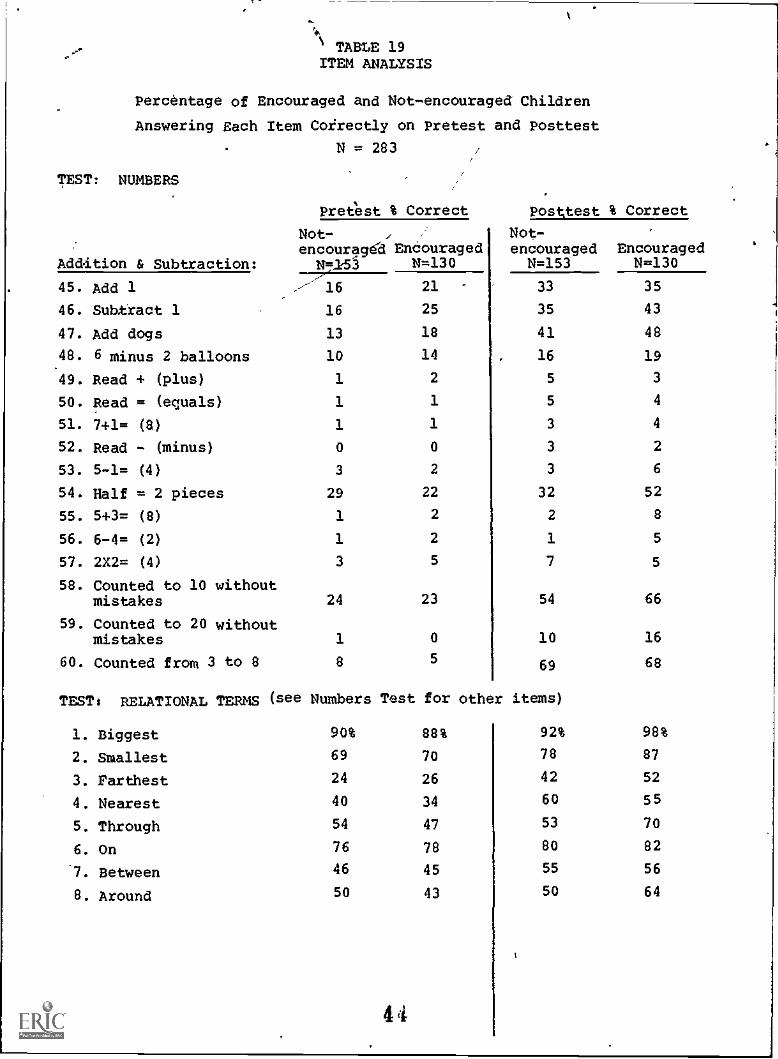
I TABLE 19ITEM ANALYSIS
Percentage of Encouraged and Not-encouraged Children
Answering Each Item Coirectly on Pretest and Posttest
N = 283
TEST: NUMBERS
Pretest % Correct Posttest % Correct
Not-encour9.gdd Encouraged
Not-encouraged Encouraged
Addition & Subtraction: N=153 N130 N=153 N=130
45. Add 1 - 16 21 33 35
46. Subtract 1 16 25 35 43
47. Add dogs 13 18 41 48
48. 6 minus 2 balloons 10 14 16 19
49. Read + (plus) 1 2 5 3
50. Read = (equals) 1 1 5 4
51. 7+1= (8) 1 1 3 4
52. Read - (minus) 0 0 3 2
53. 5-1= (4) 3 2 3 6
54. Half = 2 pieces 29 22 32 52
55. 5+3= (8) 1 2 2 8
56. 6-4= (2) 1 2 1 5
57. 2X2= (4) 3 5 7 5
58. Counted to 10 withoutmistakes 24 23 54 66
59. Counted to 20 withoutmistakes 1 0 10 16
60. Counted from 3 to 8 8 569 68
TEST: RELATIONAL TERMS (see Numbers Test for other items)
1. Biggest 90% 88%
2. Smallest 69 70
3. Farthest 24 26
4. Nearest 40 34
5. Through 54 47
6. On 76 78
7. Between 46 45
8. Around 50 43
44
92% 98%
78 87
42 52
60 55
53 70
80 82
55 56
50 64
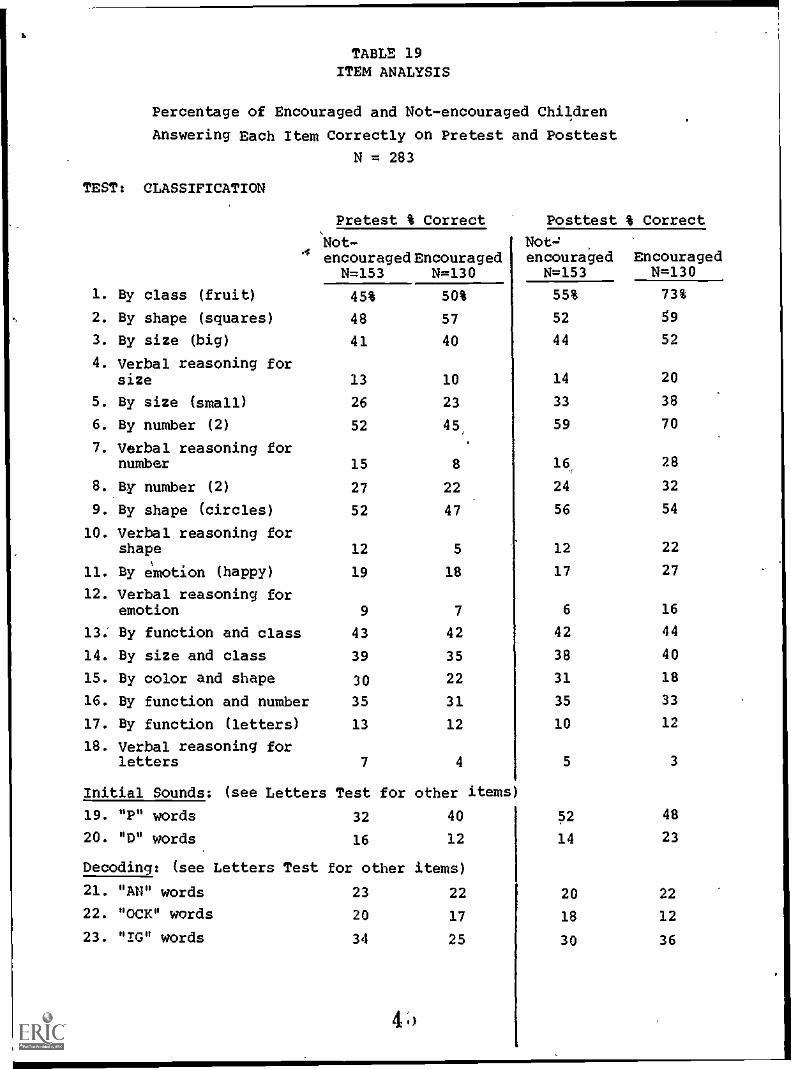
TABLE 19ITEM ANALYSIS
Percentage of Encouraged and Not-encouraged Children
Answering Each Item Correctly on Pretest and Posttest
N = 283
TEST: CLASSIFICATION
Pretest % Correct
Not-4
encouraged EncouragedN=153 N=130
1. By class (fruit) 45% 50%
2. By shape (squares) 48 57
3. By size (big) 41 40
4. Verbal reasoning forsize 13 10
5. By size (small) 26 23
6. By number (2) 52 45,
7. Verbal reasoning fornumber 15 8
8. By number (2) 27 22
9. By shape (circles) 52 47
10. Verbal reasoning forshape 12 5
11. By emotion (happy) 19 18
12. Verbal reasoning foremotion 9 7
13. By function and class 43 42
14. By size and class 39 35
15. By color and shape 30 22
16. By function and number 35 31
17. By function (letters) 13 12
18. Verbal reasoning forletters 7 4
Initial Sounds: (see Letters Test for other items
19. "P" words 32 40
20. "D" words 16 12
Decoding: (see Letters Test for other items)
21. "AN" words 23 22
22. "OCK" words 20 17
23. "IG" words 34 25
4 I)
Posttest % Correct
Not.J
encouraged EncouragedN=153 N=130
55% 73%
52 59
44 52
14 20
33 38
59 70
18 28
24 32
56 54
12 22
17 27
6 16
42 44
38 40
31 18
35 33
10 12
5 3
52 48
14 23
20 22
18 12
30 36
1
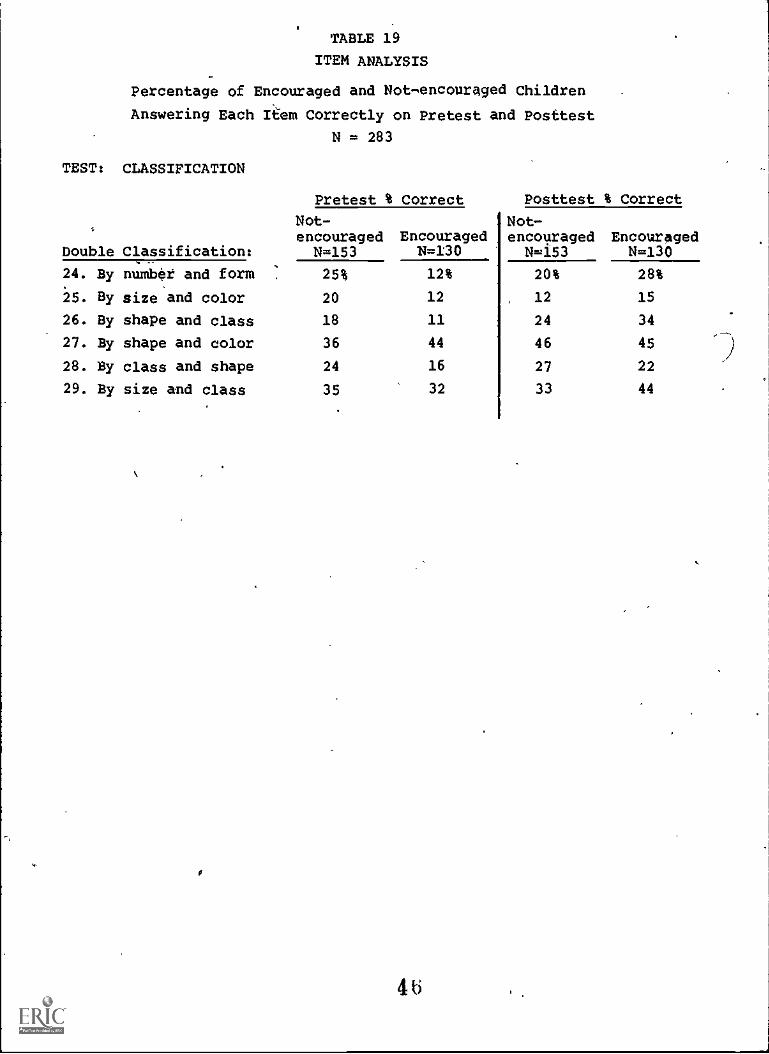
TABLE 19
ITEM ANALYSIS
Percentage of Encouraged and Not-encouraged Children
Answering Each Item Correctly on Pretest and Posttest
N = 283
TEST: CLASSIFICATION
s
Pretest % Correct Posttest % Correct
Not-encouraged Encouraged
Not-encouraged Encouraged
Double Classification: N=153 N=130 N=153 N=130..._
24. By numb4t and form .
.
25% 12% 20% 28%
25. By size and color 20 12 12 15
26. By shape and class 18 11 24 34
27. By shape and color 36 44 46 45
28. By class and shape 24 16 27 22
29. By size and class 35 32 33 44
4 ti
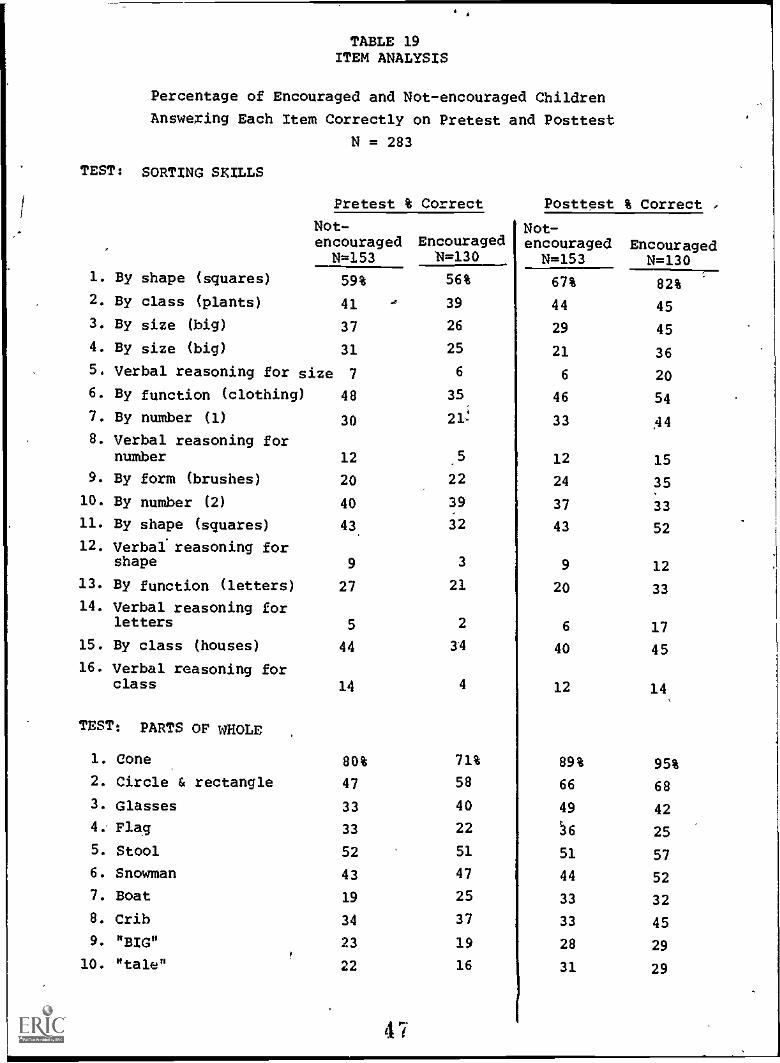
TABLE 19ITEM ANALYSIS
Percentage of Encouraged and Not-encouraged Children
Answering Each Item Correctly on Pretest and Posttest
N = 283
TEST: SORTING SKILLS
1. By shape (squares)
2. By class (plants)
3. By size (big)
4. By size (big)
5.
6. By function (clothing)
7. By number (1)
8. Verbal reasoning fornumber
9. By form (brushes)
10. By number (2)
11. By shape (squares)
12. Verbal reasoning forshape
13. By function (letters)
14. Verbal reasoning forletters
15. By class (houses)
16. Verbal reasoning forclass
Pretest %
NOt-encouraged
N=153
59%
41
37
31
Verbal reasoning for size 7
TEST: PARTS OF WHOLE
1. Cone
2. Circle & rectangle
3. Glasses
4. Flag
5. Stool
6.
7.
8.
9.
Snowman
Boat
Crib
"BIG"
10. "tale"
48
30
Correct
EncouragedN=130
56%
39
26
25
6
35
21,!
12 .5
20 22
40 39
43 32
9 3
27 21
5 2
44
14 4
80% 71%
47 58
33 40
33 22
52 51
43 47
19 25
34 37
23 19
22 16
4
Posttest % Correct ,
Not-encouraged
N=153
67%
44
29
21
6
46
33
12
24
37
43
9
20
6
40
12
89%
66
49
6
51
44
33
33
28
31
EncouragedN=130
82%
45
45
36
20
54
44
15
35
33
52
12
33
17
45
14
95%
68
42
25
57
52
32
45
29
29
{ .
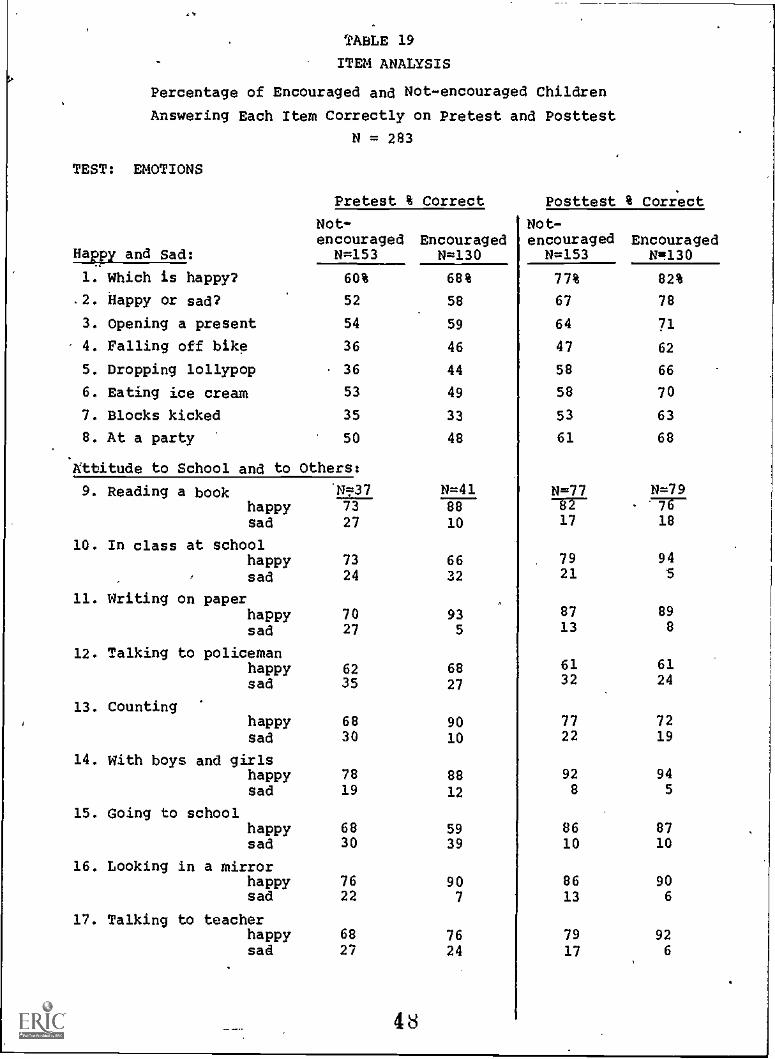
TABLE 19
ITEM ANALYSIS
Percentage of Encouraged and Not-encouraged Children
Answering Each Item Correctly on Pretest and Posttest
N = 283
TEST: EMOTIONS
Pretest % Correct
Not-encouraged Encouraged
Happy and Sad: N=153 N=130
1. Which is happy? 60% 68%
2. Happy or sad? 52 58
3. Opening a present 54 59
4. Falling off bike 36 46
5. Dropping lollypop 36 44
6. Eating ice cream 53 49
7. Blocks kicked 35 33
8. At a party 50 48
'Attitude to School and to Others:
9. Reading a book 'N=37 N=41happy 73 88sad 27 10
10. In class at schoolhappy 73 66sad 24 32
11. Writing on paperhappy 70sad 27
12. Talking to policemanhappy 62sad 35
13. Countinghappy 68sad 30
14. With boys and girlshappy 78sad 19
15. Going to schoolhappy 68sad 30
16. Looking in a mirrorhappy 76sad 22
17. Talking to teacherhappy 68sad 27
48
935
68
27
9010
88
12
5939
907
7624
Posttest % Correct
Not-encouraged Encouraged
N=153 N=130
77% 82%
67 78
64 71
47 62
58 66
58 70
53 63
61 68
N=77 N=7982 '7617 18
7921
8713
6132
7722
928
8610
8613
94S
898
6124
7219
945
8710
906
79 92
17 6
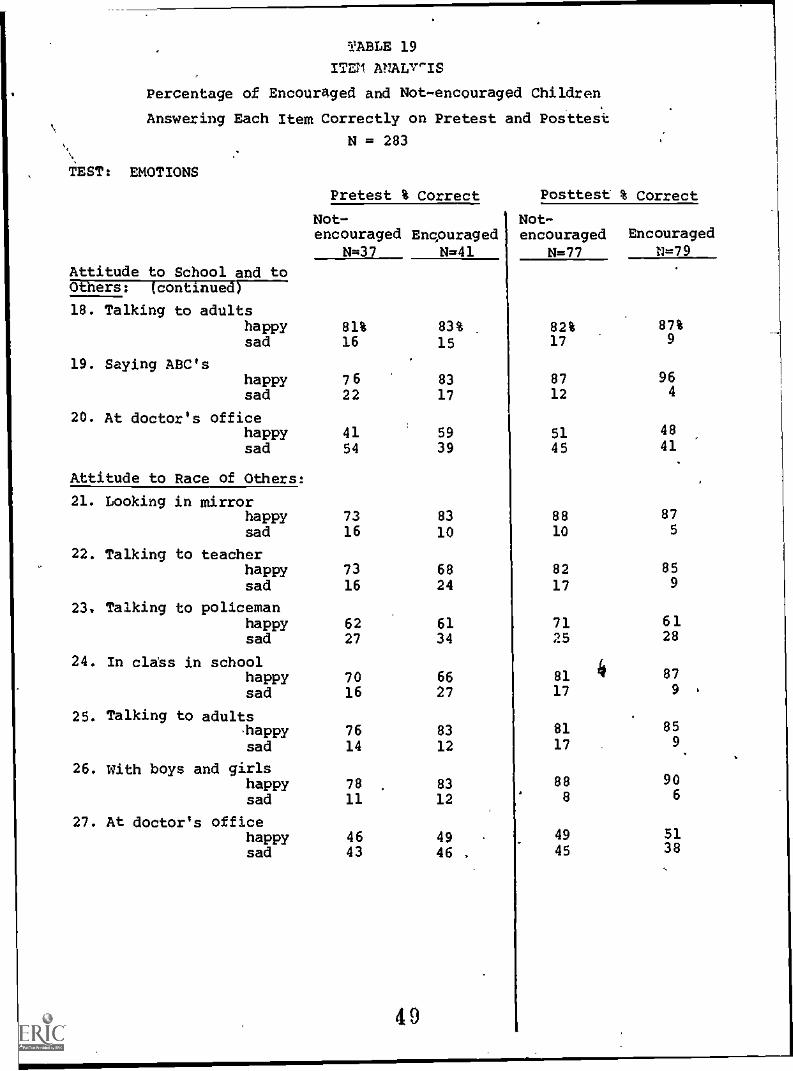
TABLE 19
ITEM ANALI.""IS
Percentage of Encouraged and Not-encouraged Children
Answering Each Item Correctly on Pretest and Posttest
TEST: EMOTIONS
Attitude to School and to
N = 283
Pretest % Correct
Not-encouraged Encouraged
N=37 N=41
81%16
7 6
22
41
83%15
8317
59
Others: (continued)
18. Talking to adultshappysad
19. Saying ABC'shappysad
20. At doctor's officehappysad 54 39
Attitude to Race of Others!
21. Looking in mirrorhappy 73 83sad 16 10
22. Talking to teacherhappy 73 68sad 16 24
23. Talking to policemanhappy 62 61sad 27 34
24. In cla'ss in schoolhappy 70 66sad 16 27
25. Talking to adultshappy 76 83sad 14 12
26. With boys and girlshappy 78 . 83sad 11 12
27. At doctor's officehappy 46 49sad 43 46 ,
49
Posttest % Correct
Not-encouraged
N=77
EncouragedN=79
82% 87%17 9
87 96
12 4
51 48
45 41
88 87
10 5
82 85
17 9
71 6125 28
81 4 87
17 9
81 85
17 9.
88 908 6
49 5145 38
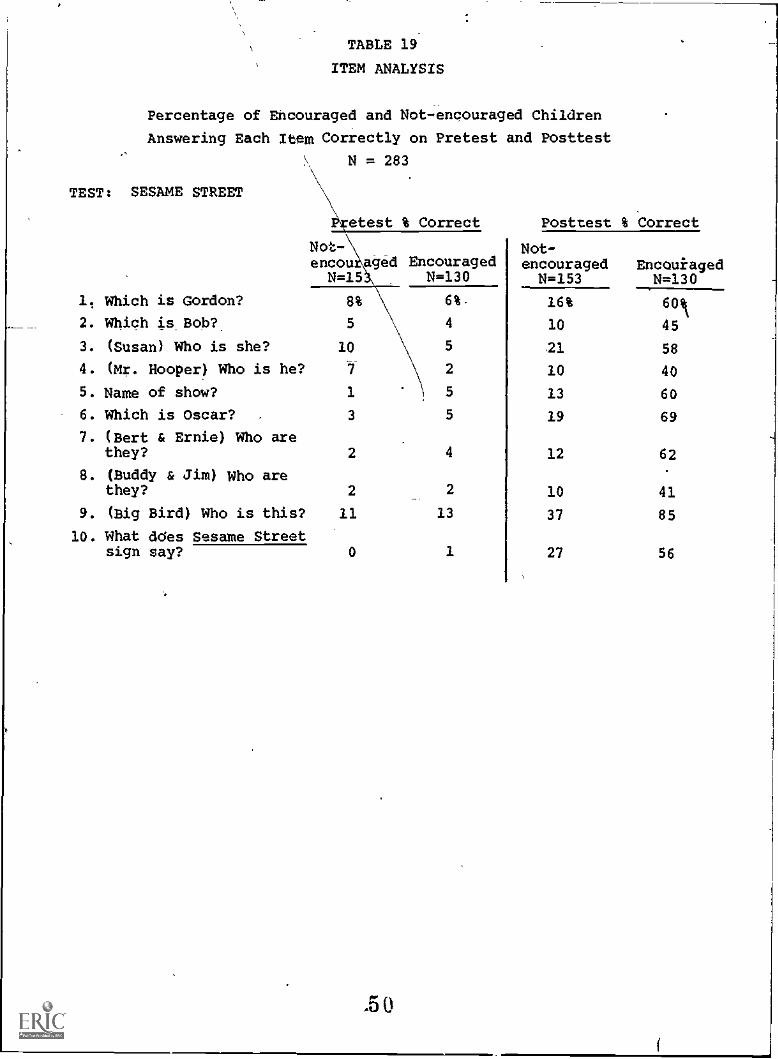
TABLE 19
ITEM ANALYSIS
Percentage of Encouraged and Notencouraged Children
Answering Each Item Correctly on Pretest and Posttest
N = 283\
TEST: SESAME STREET
etest % Correct
Not-encou ged EncouragedN=15 N=130
11 Which is Gordon? 8% 6%-
2. Which is Bob? 5 4
3. (Susan) Who is she? 10 5
4. (Mr. Hooper) Who is he? 7 2
5. Name of show? 1 5
6. Which is Oscar? . 3 5
7. (Bert & Ernie) Who arethey?
8. (Buddy & Jim) Who arethey? 2 2
9. (Big Bird) Who is this? 11 13
10. What ddes Sesame Streetsign say? 0 1
2 4
.5 0
Posttest % Correct
Not-encouraged
N=153Encouiaged
N=130
16% 6010 45
21 58
10 40
13 60
19 69
12 62
10 41
37 85
27 56
(
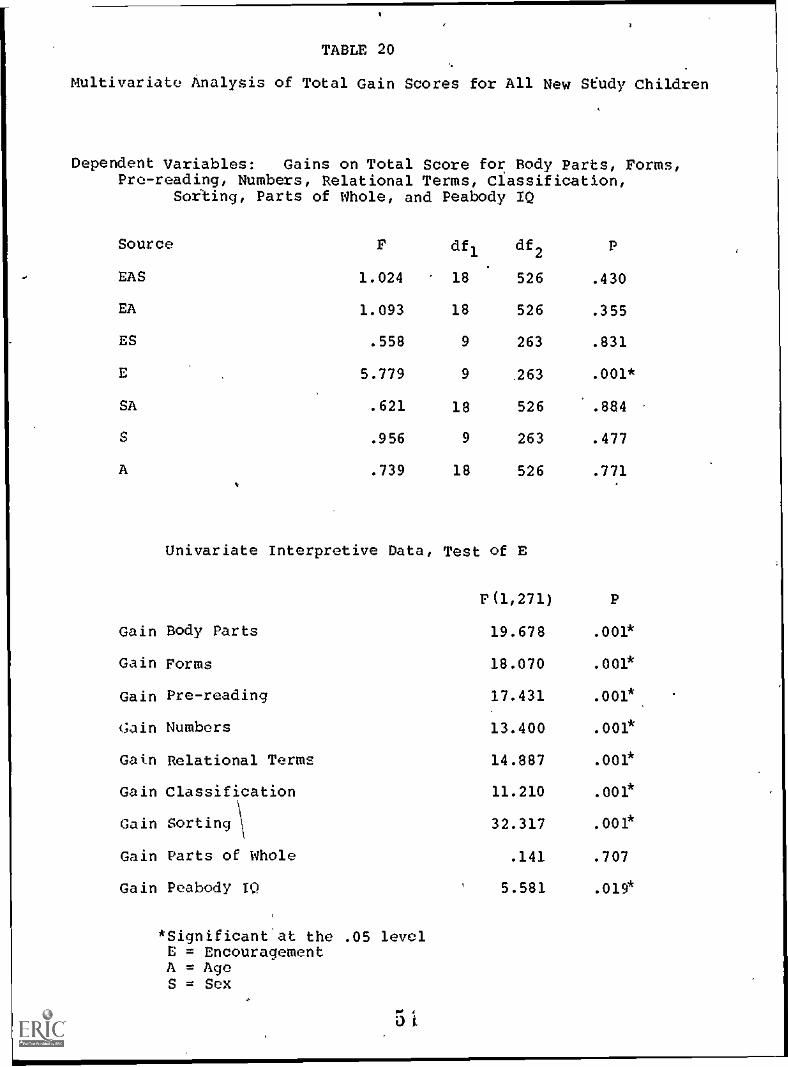
TABLE 20
Multivariate Analysis of Total Gain Scores for All New SEudy Children
Dependent Variables: Gains on Total Score for Body Parts, Forms,Pre-reading, Numbers, Relational Terms, Classification,
Sorting, Parts of Whole, and Peabody IQ
Source r df1 df2
P
EAS 1.024 18 526 .430
EA 1.093 18 526 .355
ES .558 9 263 .831
E 5.779 9 .263 .001*
SA .621 18 526 .884
S .956 9 263 .477
A .739 18 526 .771
Univariate Interpretive Data, Test of E
F(1,271) P
Gain Body Parts 19.678 .001*
Gain Forms 18.070 .001*
Gain Pre-reading 17.431 .001*
Gain Numbers 13.400 .001*
Gain Relational Terms 14.887 .001*
Gain Classification 11.210 .001*
Gain Sorting \ 32.317 .001*
Gain Parts of Whole .141 .707
Gain Peabody TO 5.581 .019*
*Significant'at the .05 levelE = EncouragementA ---- Age
S = Sex-
5 I
i
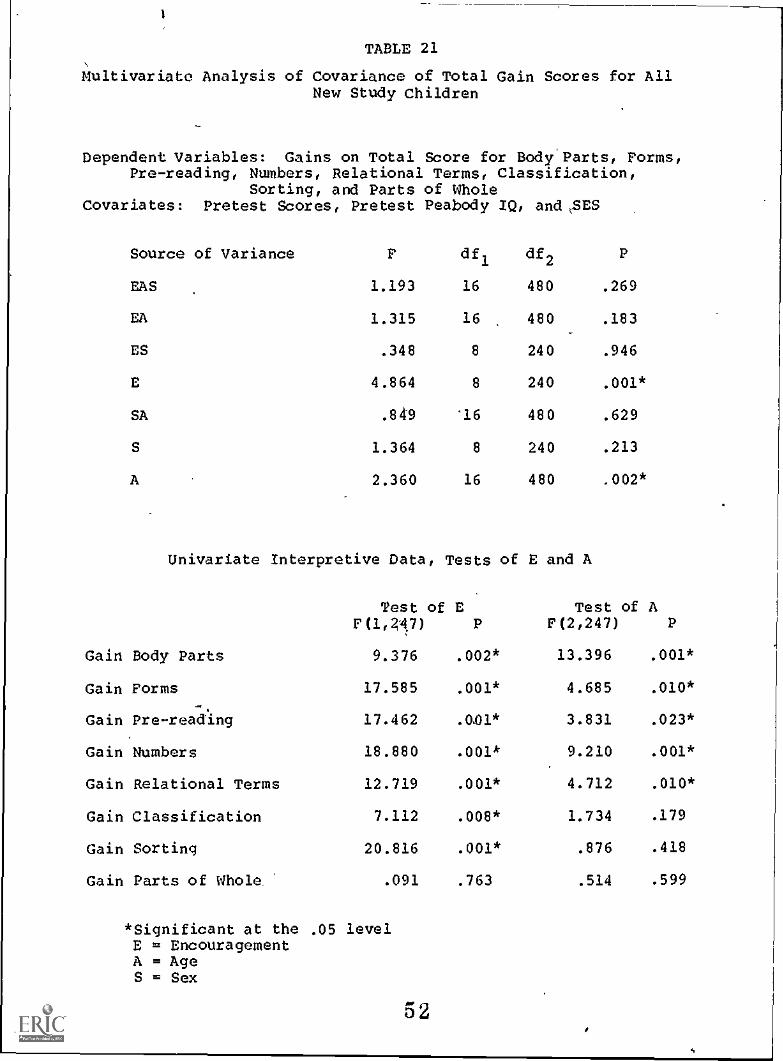
TABLE 21
Multivariate Analysis of Covariance of Total Gain Scores for AllNew Study Children
Dependent Variables: Gains on Total Score for Body'Parts, Forms,Pre-reading, Numbers, Relational Terms, Classification,
Sorting, and Parts of WholeCovariates: Pretest Scores, Pretest Peabody IQ, and SES
Source of Variance P df1
df2
P
EAS 1.193 16 480 .269
EA 1.315 16 480 .183
ES .348 8 240 .946
E 4.864 8 240 .001*
SA .849 '16 480 .629
S 1.364 8 240 .213
A 2.360 16 480 .002*
Univariate Interpretive Data, Tests of E and A
Test of E Test of AF(1,47) P F(2,247) P
Gain Body Parts 9.376 .002* 13.396 .001*
Gain Forms 17.585 .001* 4.685 .010*.
Gain Pre-reading 17.462 .041* 3.831 .023*
Gain Numbers 18.880 .001* 9.210 .001*
Gain Relational Terms 12.719 .001* 4.712 .010*
Gain Classification 7.112 .008* 1.734 .179
Gain Sorting 20.816 .001* .876 .418
Gain Parts of Whole. .091 .763 .514 .599
*Significant at the .05 levelE = EncouragementA = AgeS = Sex
52
i
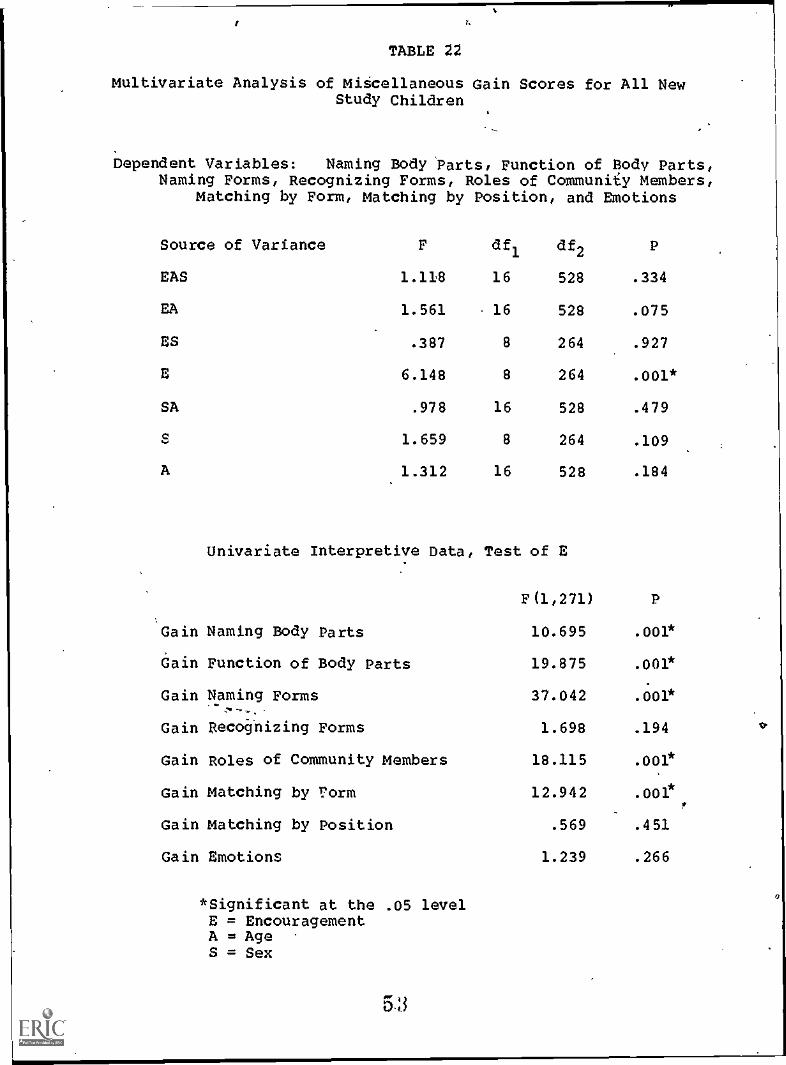
TABLE 22
Multivariate Analysis of Miicellaneous Gain Scores for All NewStudy Children
Dependent Variables: Naming Body Parts, Function of Body Parts,Naming Forms, Recognizing Forms, Roles of Community Members,
Matching by Form, Matching by Position, and Emotions
Source of Variance F df1
df2
P
EAS 1.118 16 528 .334
EA 1.561 16 528 .075
ES .387 8 264 .927
E 6.148 8 264 .001*
SA .978 16 528 .479
S 1.659 8 264 .109
A 1.312 16 528 .184
Univariate Interpretive Data, Test of E
F(1,271)
Gain Naming Body Parts 10.695 .001*
Gain Function of Body Parts 19.875 .001*
Gain Naming Forms 37.042 .001*
Gain Recognizing Forms 1.698 .194
Gain Roles of Community Members 18.115 .001*
Gain Matching by corm 12.942 .001*
Gain Matching by Position .569 .451
Gain Emotions 1.239 .266
*Significant at the .05 levelE = EncouragementA = AgeS = Sex
5 :3
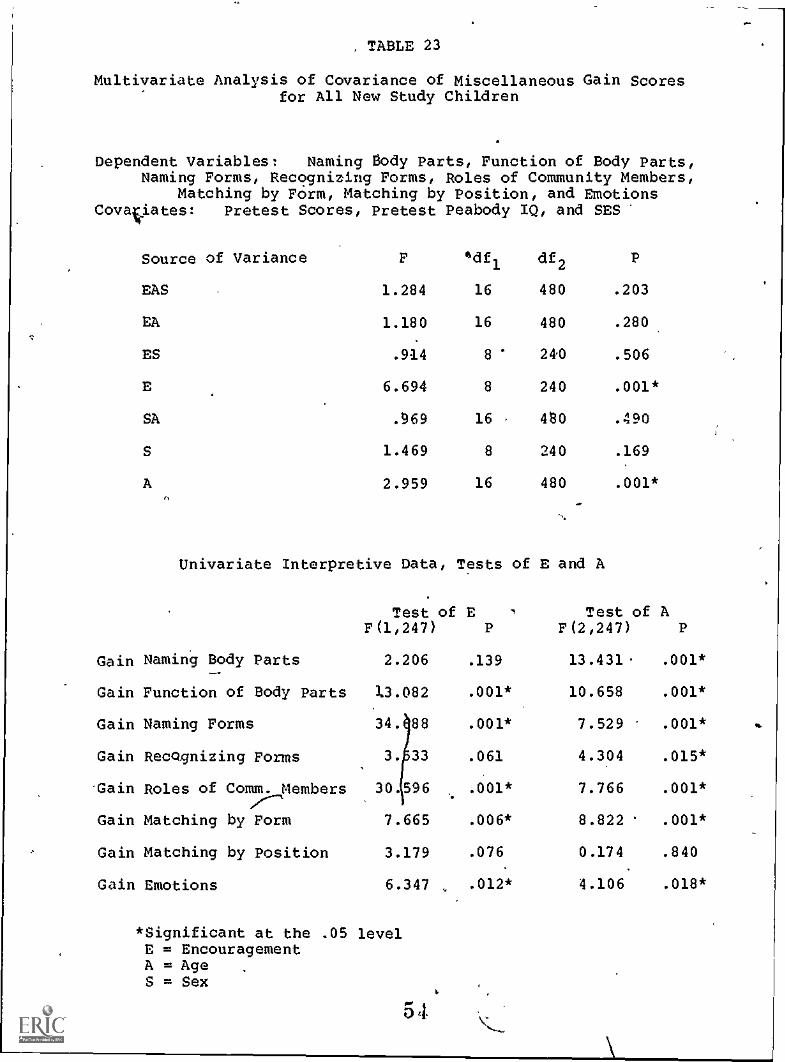
TABLE 23
Multivariate Analysis of Covariance of Miscellaneous Gain Scoresfor All New Study Children
Dependent Variables: Naming Body Parts, Function of Body Parts,Naming Forms, Recognizing Forms, Roles of Community Members,
Matching by Form, Matching by Position, and EmotionsCova0ates: Pretest Scores, Pretest Peabody IQ, and SES
Source of Variance F *cif1
df2
P
EAS 1.284 16 480 .203
EA 1.180 16 480 .280
ES .914 8 240 .506
E 6.694 8 240 .001*
SA .69 16 480 .490
5 1.469 8 240 .169
A 2.959 16 480 .001*
Univariate Interpretive Data, Tests of E and A
Test of EF(1,247) P
Test of AP(2,247)
Gain Naming Body Parts 2.206 .139 13.431 .001*
Gain Function of Body Parts X3.082 .001* 10.658 .001*
Gain Naming Forms 34. 88 .001* 7.529 .001*
Gain Recognizing Forms 3. 33 .061 4.304 .015*
Gain Roles of ComMembers 30.596 .001* 7.766 .001*
Gain Matching by Form 7.665 .006* 8.822 .001*
Gain Matching by Position 3.179 .076 0.174 .840
Gain Emotions 6.347 , .012* 4.106 .018*
*Significant at the .05 levelE = EncouragementA = AgeS = Sex
54
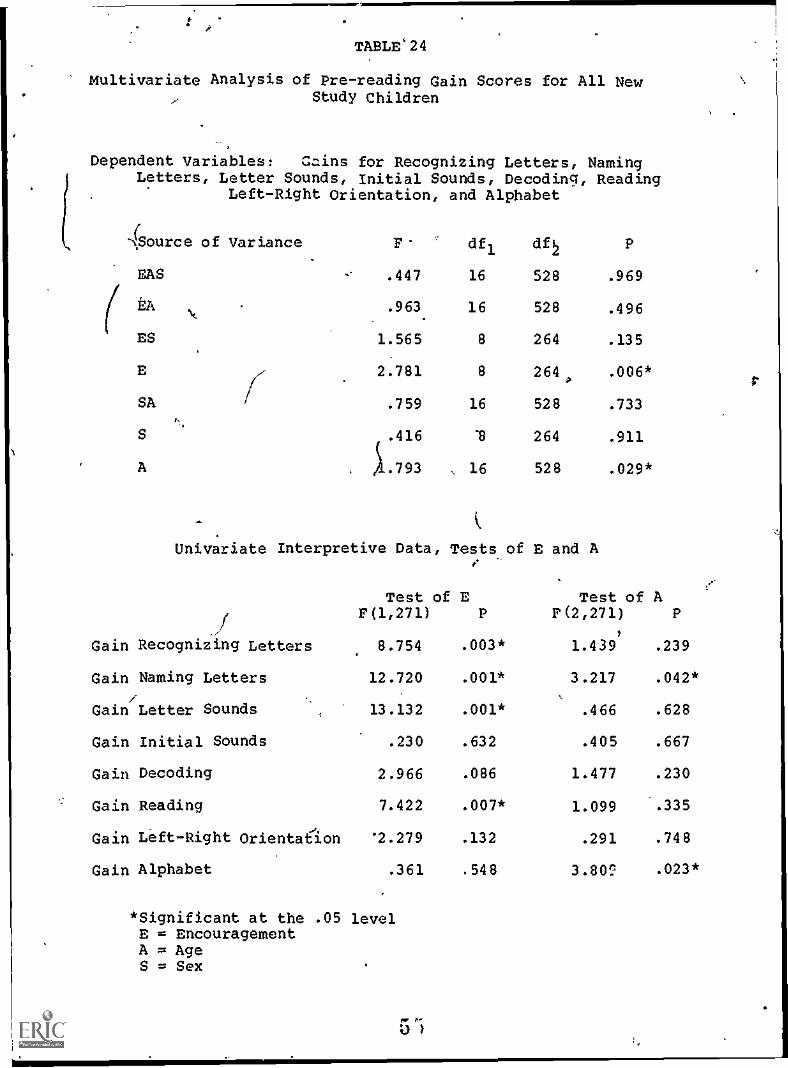
TABLE'24
Multivariate Analysis of Pre-reading Gain Scores for All NewStudy Children
Dependent Variables: Gains for Recognizing Letters, NamingLetters, Letter Sounds, Initial Sounds, Decoding, Reading
Left-Right Orientation, and Alphabet
Ar,Source of Variance r- df1
df P
EAS .447
( EA .963\
ES 1.565
E 2.781
SA i .759.
S .416
A . 1.793 ,
16 528 .969
16 528 .496
8 264 .135
8 264., .006*
16 528 .733
'8 264 .911
16 528 .029*
Univariate Interpretive Data, Tests of E and Ai
iGain Recognizing Letters
Gain Naming Letters
Gain/Letter Sounds
Gain Initial Sounds
Gain Decoding
Gain Reading
Gain Left-Right Orienta lon
Gain Alphabet
Test of EF(1,271) P
8.754 .003*
Test of AF(2,271) P
'
1.439 .239
12.720 .001* 3.217 .042*
13.132 .001* .466 .628
.230 .632 .405 .667
2.966 .086 1.477 .230
7.422 .007* 1.099 .335
'2.279 .132 .291 .748
.361 .548 3.80? .023*
*Significant at the .05 levelE = EncouragementA = AgeS = Sex
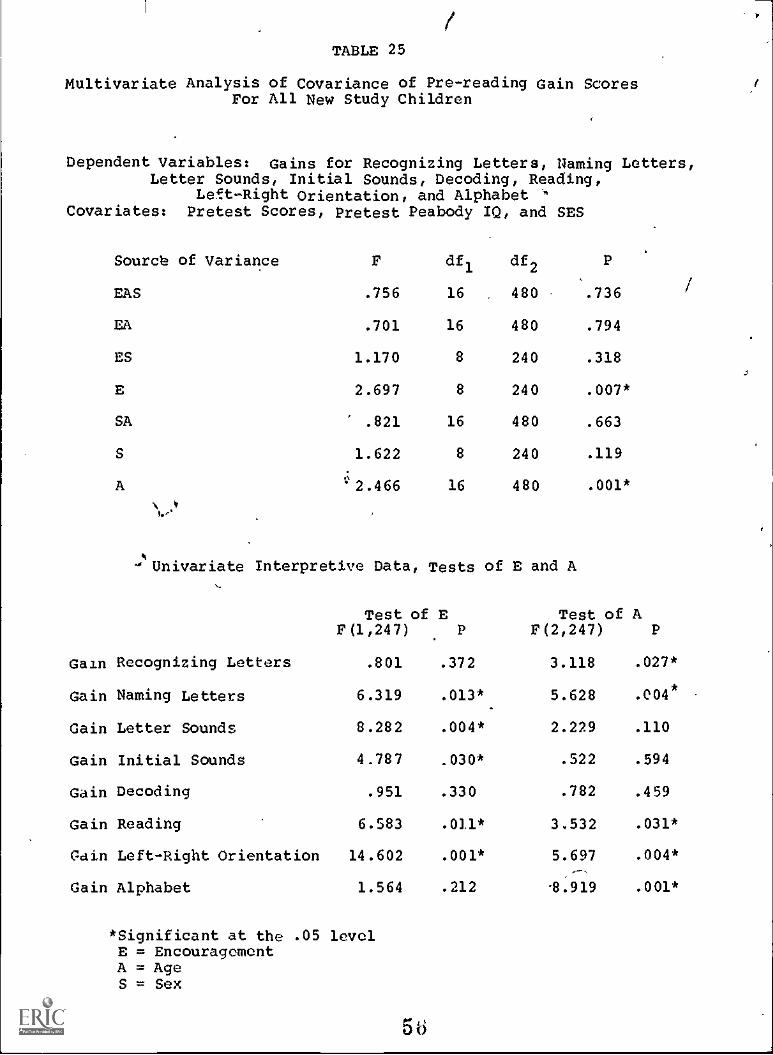
TABLE 25
Multivariate Analysis of Covariance of Pre-reading Gain ScoresFor All New Study Children
Dependent Variables: Gains for Recognizing Letters, Naming Letters,Letter Sounds, Initial Sounds, Decoding, Reading,
Lett-Right Orientation, and AlphabetCovariates: Pretest Scores, Pretest Peabody IQ, and SES
Source of Variance F df1
df2
P
EAS .756 16 480 .736 /
EA .701 16 480 .794
ES 1.170 8 240 .318
E 2.697 8 240 .007*
SA .821 16 480 .663
S 1.622 8 240 .119
A 2.466 16 480 .001*
-mi
Univariate Interpretive Data, Tests of E and A
Test of EF(1,247) P
Test of AF(2,247) P
Gain Recognizing Letters .801 .372 3.118 .027*
Gain Naming Letters 6.319 .013* 5.628 .004*
Gain Letter Sounds 8.282 .004* 2.229 .110
Gain Initial Sounds 4.787 .030* .522 .594
Gain Decoding .951 .330 .782 .459
Gain Reading 6.583 .011* 3.532 .031*
Odin Left-Right Orientation 14.602 .001* 5.697 .004*
Gain Alphabet 1.564 .212 -8.919 .001*
*Significant at the .05 levelE = EncouragementA = AgeS = Sex
58
/
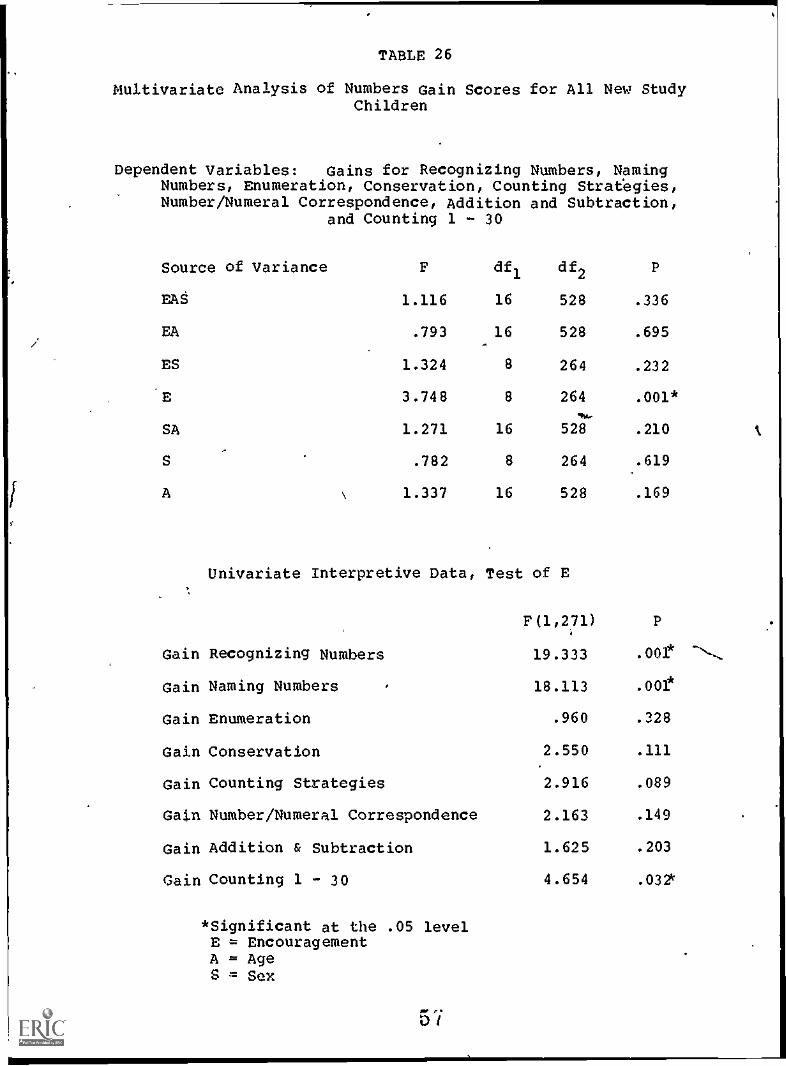
TABLE 26
Multivariate Analysis of Numbers Gain Scores for All New StudyChildren
Dependent Variables: Gains for Recognizing Numbers, NamingNumbers, Enumeration, Conservation, Counting Strat'egies,Number/Numeral Correspondence, Addition and Subtraction,
and Counting 1 - 30
Source of Variance F df1
df2
P
EAS 1.116 16 528 .336
EA .793 16 528 .695
ES 1.324 8 264 .232
E 3.748 8 264 .001*.
SA 1.271 16 528 .210
S .782 8 264 .619
A N. 1.337 16 528 .169
Univariate Interpretive Data, Test of E
F(1,271) P
Gain Recognizing Numbers 19.333 .001* -.`,,,
Gain Naming Numbers 18.113 .001*
Gain Enumeration .960 .328
Gain Conservation 2.550 .111
Gain Counting Strategies 2.916 .089
Gain Number/Numeral Correspondence 2.163 .149
Gain Addition & Subtraction 1.625 .203
Gain Counting 1 - 30 4.654 .032'
*Significant at the .05 levelE = EncouragementA = AgeS = Sex
57
n
/
I
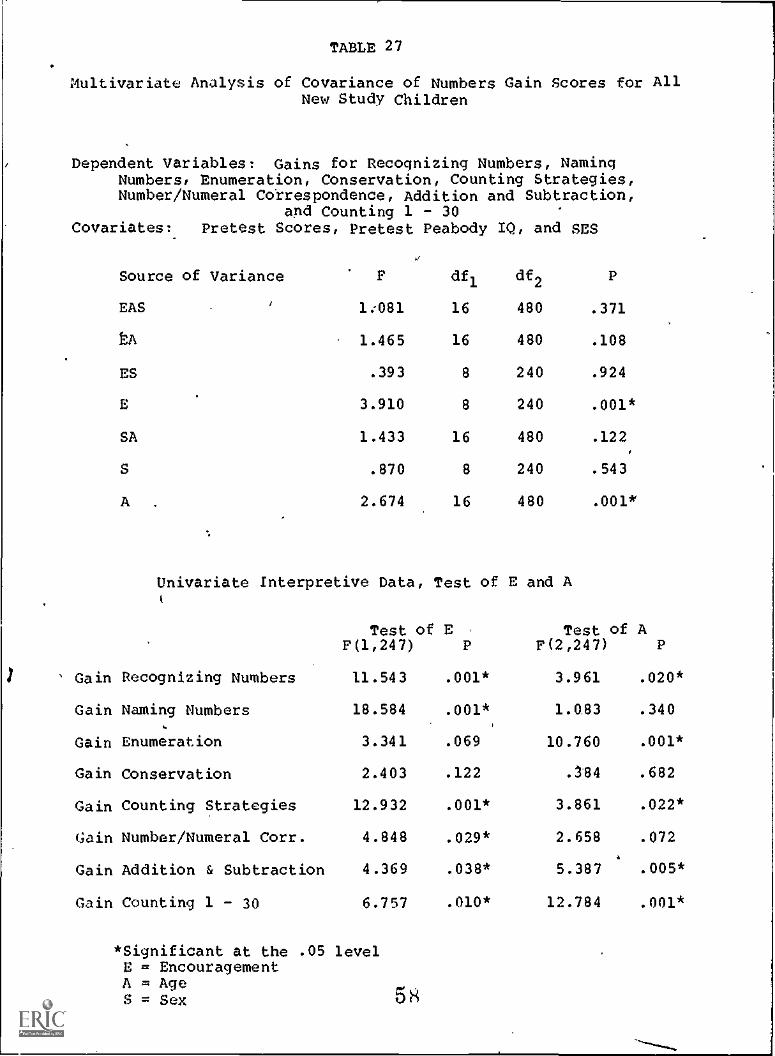
TABLE 27
Multivariate Analysis of Covariance of Numbers Gain Scores for AllNew Study Children
Dependent Variables: Gains for Recognizing Numbers, NamingNumbers, Enumeration, Conservation, Counting Strategies,Number/Numeral Co'rrespondence, Addition and Subtraction,
and Counting 1 - 30Covariates: Pretest Scores, Pretest Peabody IQ, and SES
Source of Variance r df 1df
2P
EAS 1:081 16 480 .371
1A 1.465 16 480 .108
ES .393 8 240 .924
E 3.910 8 240 .001*
SA 1.433 16 480 .122
S .870 8 240 .543
A . 2.674 16 480 .001*
Univariate Interpretive Data, Test of E and Ai
Test of E .
F(1,247) PTest of A
?(2,247) P
Gain Recognizing Numbers 11.543 .001* 3.961 .020*
Gain Naming Numbers 18.584 .001* 1.0.83 .340
Gain Enumeration 3.341 .069 10.760 .001*
Gain Conservation 2.403 .122 .3-84 .682
Gain Counting Strategies 12.932 .001* 3.861 .022*
Gain Number/Numeral Corr. 4.848 .029* 2.658 .072.
Gain Addition & Subtraction 4.369 .038* 5.387 .005*
Gain Counting 1 - 30 6.757 .010* 12.784 .001*
*Significant at the .05 levelE = EncouragementA = AgeS = Sex 5
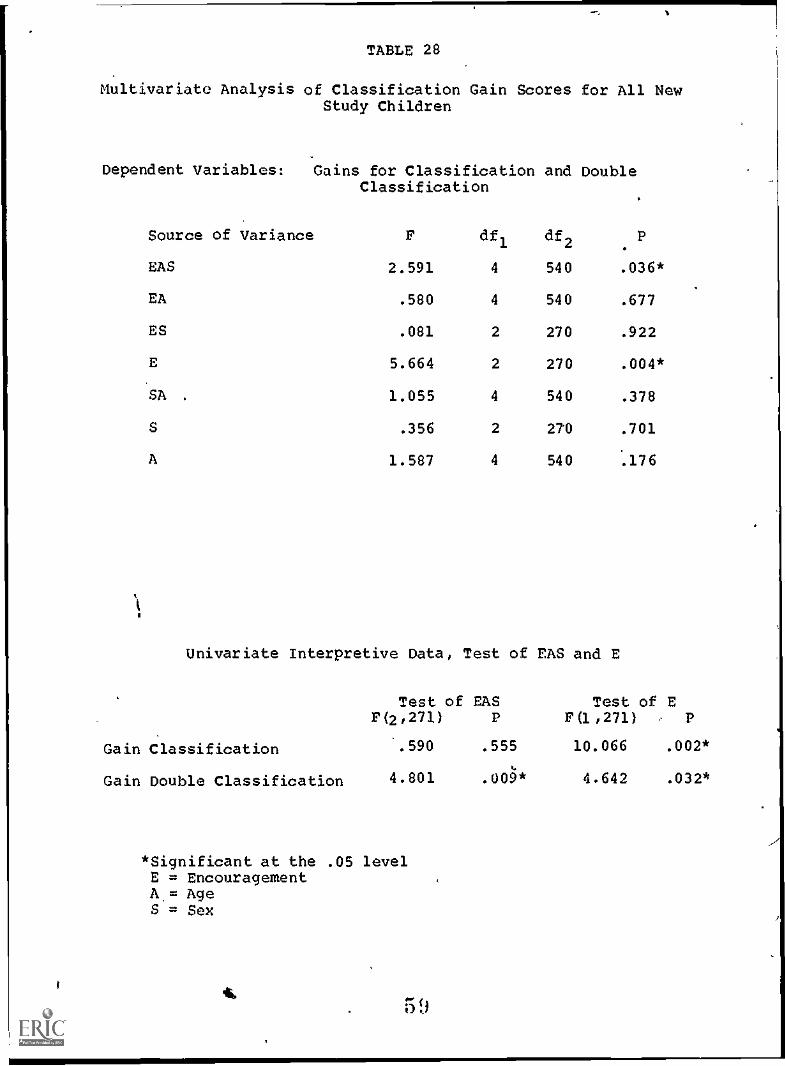
TABLE 28
Multivariate Analysis of Classification Gain Scores for All NewStudy Children
Dependent Variables: Gains for Classification and DoubleClassification
Source of Variance F df1
df2
P.
EAS 2.591 4 540 .036*
EA .580 4 540 .677
ES .081 2 270 .922
E 5.664 2 270 .004*
SA . 1.055 4 540 .378
S .356 2 270 .701
A 1.587 4 540 .176
\
Univariate Interpretive Data, Test of FAS and E
Test of EAS Test of EF(2,271) P F(1,271) , P
Gain Classification *.590 .555 10.066 .002*
Gain Double Classification 4.801 .009* 4.642 .032*
*Significant at the .05 levelE = EncouragementA= AgeS = Sex
41,5 9
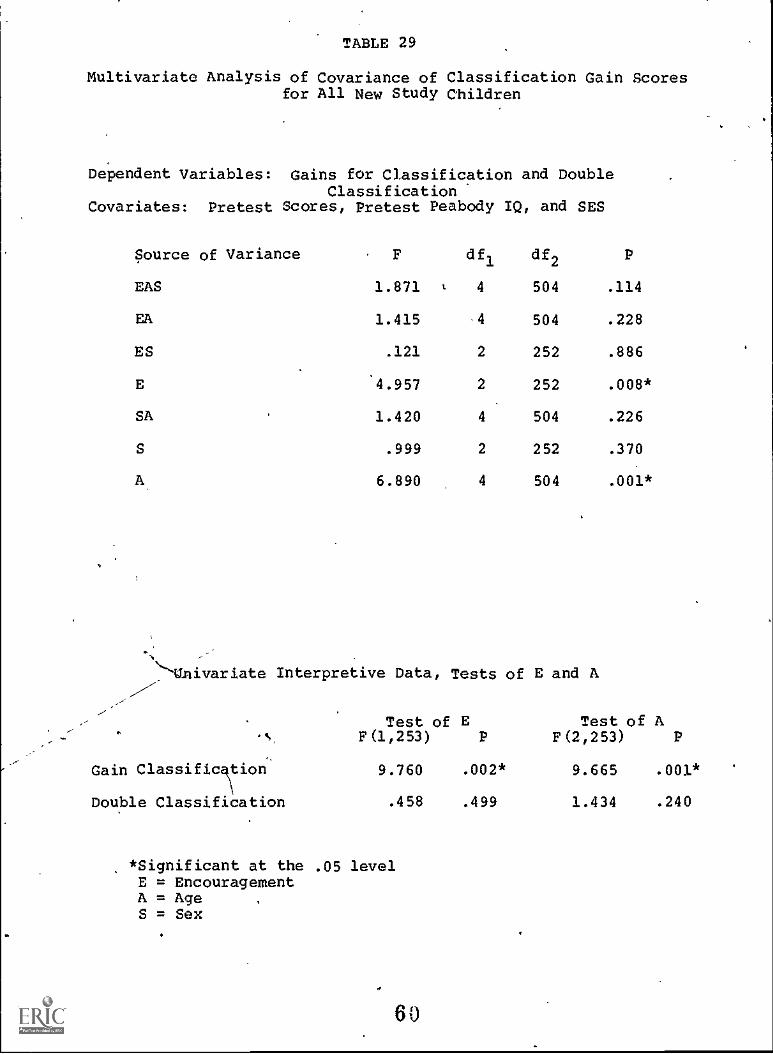
TABLE 29
Multivariate Analysis of Covariance of Classification Gain Scoresfor All New Study Children
Dependent Variables: Gains for Classification and DoubleClassification
Covariates: Pretest Scores, Pretest Peabody IQ, and SES
Source of Variance
LAS
EA
ES
E
SA
S
A
. F
1.871
1.415
.121
4.957
1.420
.999
6.890
1
df1
4
4
2
2
4
2
4
df2
504
504
252
252
504
252
504
P
.114
.228
.886
.008*
.226
.370
.001*
.
\'ilnivariate Interpretive Data, Tests of E and A/..
Test of E Test of As F(1,253) P F(2,253) P
Gain Classificion 9.760 .002* 9.665 .001*
Double Classification .458 .499 1.434 .240
*Significant at the .05 levelE = EncouragementA = AgeS = Sex
.
60
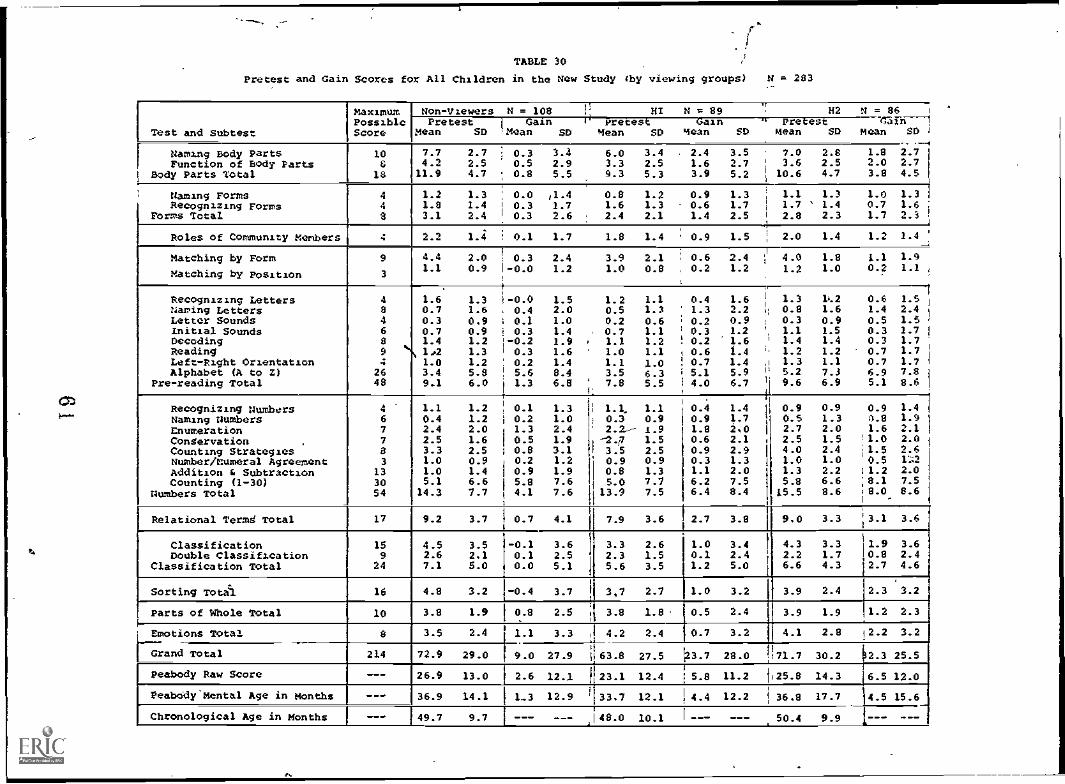
TABLE 30
Pretest and Gain Scores for All Children in the New Study (by viewing groups) N a 283
Test and subtest
MaximumPossibleScore
Non-Viewers N = 108 1! HI N = 89 H2 tl = 86 1
.,
-1Pretest I Gain 0 Pretest oain --1- Pretest iznMean SD 'Mean SD Mean SD Mean SD Mean SD Mean SD
Naming Body PartsFunction of Body Parts
Body Parts Total
106
18
--4
7.7 2.7 : 0.3 3.4 6.0 3.4 2.4 3.5 7.0 2.8 1.8 2.74.2 2.5 0.5 2.9 3.3 2.5 1.6 2.7 3.6 2.5 2.0 2.711.9 4.7 0.8 5.5 9.3 5.3 3.9 5.2 y 10.6 4.7 3.8 4.5
Naming FormsRecognizing Forms
Forms Total
448
1.2 1.3 0.0 /1.4 0.8 1.2 0.9 1.3 1.1 1.3 1.0 1.31.8 1.4 i 0.3 1.7 1.6 1.3 0.6 1.7 1.7 1.4 0.7 1.63.1 2.4 0.3 2.6 : 2.4 2.1 1.4 2.5 i 2.8 2.3 1.7 2.3
Roles of Community Members 4 2.2 1.4 0.1 1.7 1.8 1.4 ' 0.9 1.5 2.0 1.4 1.2 1.4
Matching by Form
Matching by Position
9
3
4.4 2.0 0.3 2.4 3.9 2.1 0.6 2.4 4.0 1.8 1.1 1.91.1 0.9 -0.0 1.2 1.0 0.8 . 0.2 1.2 1.2 1.0 0.2 1.1
Recognizing LettersNaming LettersLetter SoundsInitial SoundsDecodingReadingLeft-Right OrientationAlphabet (A to Z)
Pre-reading Total
4
8468
94
2648
.
1.6 1.3 -0.0 1.5 1.2 1.1 0.4 1.60.7 1.6 0.4 2.0 0.5 1.3 1.3 2.2 :
0.3 0.9 0.1 1.0 0.2 0.6 0.2 0.90.7 0.9 0.3 1.4 . 0.7 1.1 0.3 1.2 .
1.4 1.2 -0.2 1.9 . 1.1 1.2 0.2 1.614 1.3 0.3 1.6 ' 1.0 1.1 0.6 1.41.0 1.2 0.2 1.4 1-1 1.0 0.7 1.43.4 5.8 5.6 8.4 3.5 6.3 5.1 5.99.1 6.0 1.3 6.8 7.8 5.5 4.0 6.7
11.3 l.2 0.6 1.50.8 1.6 1.4 2.40.3 0.9 0.5 1.51.1 1.5 0.3 1.71.4 1.4 0.3 1.71.2 1.2 0.7 1.71.3 1.1 0.7 1.75.2 7.3 6.9 7.89.6 6.9 5.1 8.6
Recognizing NumbersNaming NumbersEnumerationConservation .
Counting StrategiesNumber/Numeral AgreementAddition 1. SubtractionCounting (1-30)
Numbers Total
4
67783
133054
1.1 1.2 .
0.4 1.22.4 2.02.5 1.63.3 2.51.0 0.91.0 1.45.1 6.614.3 7.7
0.1 1.30.2 1.01.3 2.40.5 1.90.8 3.10.2 1.20.9 1.95.8 7.64.1 7.6
' 1.1. 1.L0.3 0.92.2- 1.9-2,7 1.53.5 2.50.9 0.90.8 1.35.0 7.7
13.9 7.5
0.4 1.40.9 1.71.8 2,00.6 2.10.9 2.90.3 1.31.1 2.06.2 7.56.4 8.4
0.9 0.9 0.9 1.40.5 1.3 4.8 1.92.7 2.0 1.6 2.12.5 1.5 '1.0 2.04.0 2.4 :1.5 2.61.0 1.0 0.5 1:.'i2
1.3 2.2 11.2 2.05.8 6.6 ;8.1 7.5
15.5 8.6 .8.0 8.6 1
1
Relational Termd Total 17 9.2 3.7 0.7 4.1 7.9 3.6 2.7 3.8 9,0 3.3 i 3.1 3.61
ClassificationDouble Classification
Classification Total
159
24
4.5 3.52.6 2,17.1 5.0
-0.1 3.60.1 2.50.0 5.1
3.3 2.6 1.0 3.42.3 1.5 0.1 2.45.6 3.5 1.2 5.0
4.3 3.3 11.9 3.62.2 1.7 ,0.8 2.46.6 4.3 12.7 4.6
Sorting Totai 16 4.8 3.2 -0.4 3.7 3,7 2.7 1.0 3.2 3.9 2.4 2.3 3.2
Parts of Whole Total 10 3.8 1.9 0.8 2.5 I 3.8 1.8. 0.5 2.4 3.9 1.9 1.2 2.3
Emotions Total 8 3.5 2.4 1.1 3.3 1 4.2 2.4 0.7 3.2 4.1 2.8 2.2 3.2
72.9 29.0 9.0 27.9 63.8 27.5 3.7 28.0 71.7 30.2 132.3 25.5Grand Total 214
Peabody Raw Score --- 26.9 13.0 2.6 12.1 23.1 12.4 5.8 11.2 25.8 14.3 6.5 12.0
Peabody'Mental Age in Months --- 36.9 14.1 1-3 12.9 ' 33,7 12.1 .4.4 12.2 1 36.8 17.7 4.5 15.6
Chronological Age in Months --- 49.7 9.7 --- ,I48.0 10.1 --- --- 50.4 9.9 I--
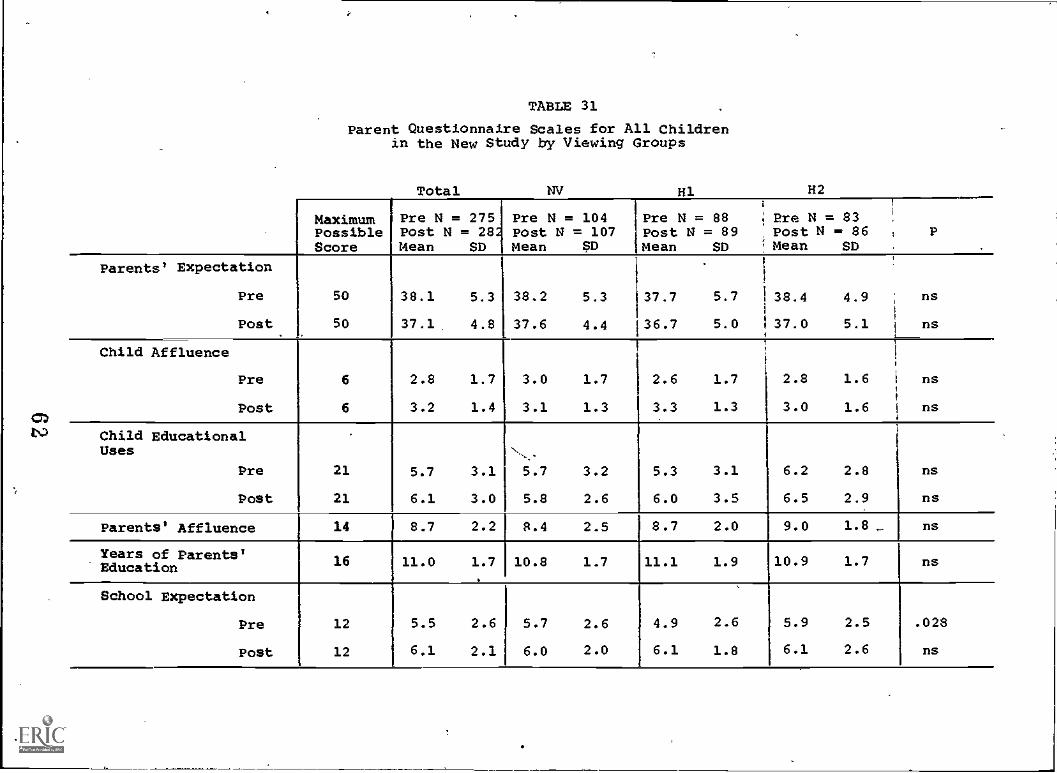
TABLE 31
Parent Questionnaire Scales for All Childrenin the New Study by Viewing Groups
Total NV H2
MaximumPossibleScore
Pre N =Post N =Mean
27528
SD
Pre N =Post N =Mean
104107
SD
Pre N = 88Post N = 89Mean SD
i
; Pre N =Post N
1Mean
83= 86 PSD
Parents' Expectationi
Pre 50 38.1 5.3 38.2 5.3 37.7 5.7 1 38.4 4.9 ns
50I
137.0Post 37.1 4.8 37.6 4.4 36.7 5.0 5.1 ns
Child Affluence
Pre 6 2.8 1.7 3.0 1.7 2.6 1.71
2.8 1.6 ns,
Post 6 3.2 1.4 3.1 1.3 3.3 1.3 3.0 1.6 1 ns
Child EducationalUses
Pre 21 5.7 3.1 5.7 3.2 5.3 3.1 6.2 2.8 ns
Post 21 6.1 3.0 5.8 2.6 6.0 3.5 6.5 2.9 ns
Parents' Affluence 14 8.7 2.2 R.4 2.5 8.7 2.0 9.0 1.8._ ns
Years of Parents'Education 16 11.0 1.7 10.8 1.7 11.1 1.9 10.9 1.7 ns
School Expectation
Pre 12 5.5 2.6 5.7 2.6 4.9 2.6 5.9 2.5 .028
Post 12 6.1 2.1 6.0 2.0 6.1 1.8 6.1 2.6 ns
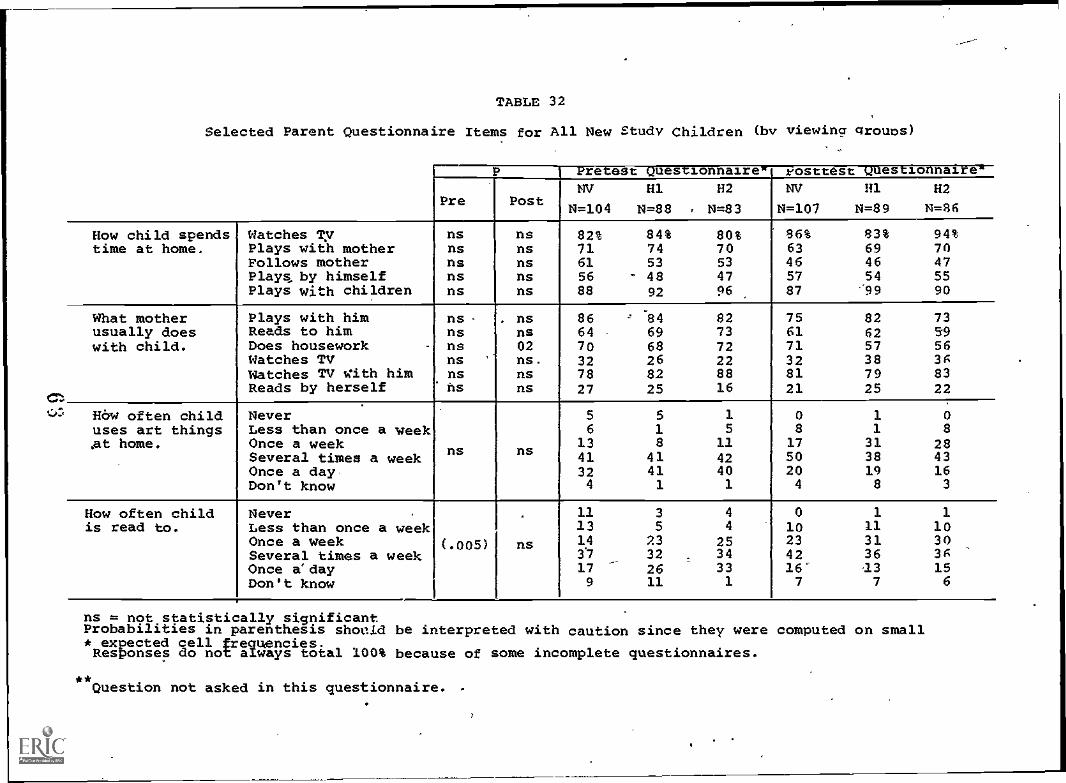
TABLE 32
Selected Parent Questionnaire Items for All New Study Children (by viewing groups)
1
Post
Pretest QuestionnairewNV H1 H2
N=104 N=88 N=83
rosrtest wuestionnaireNV H1 H2
N=107 N=89 N=85Pre
How child spends Watches Ty ns ns 82% 84% 80% 96% 93% 94%time at home. Plays with mother ns ns 71 74 70 63 69 70
Follows mother ns ns 61 53 53 46 46 47Plays, by himself ns ns 56 48 47 57 54 55Plays with children ns ns 88 92 96 87 '.99 90
.
What mother Plays with him ns- . ns 86 -' 84 82 75 82 73usually does Reads to him ns ns 64 - 69 73 61 62 59with child. Does housework - ns 02 70 68 72 71 57 56
Watches TV ns ns. 32 26 22 32 38 3gWatches TV with him ns ns 78 82 88 81 79 83Reads by herself ns ns 27 25 16 21 25 22
How often child Never 5 5 1 0 1 0
uses art things Less than once a week 6 1 5 8 1 8
oat home. Once a week 13 8 11 17 31 28Several times a week
ns nsi 41 41 42 50 38 43
Once a day 32 41 40 20 19 16Don't know 4 1 1 4 8 3
How often child Never . 11 3 4 0 1 1is read to. Less than once a week 13 5 4 10 11 10
Once a week (.005) ns 14 23 25 23 31 30Several times a week 37 32 . 34 42 36 3gOnce a' day 17 26 33 26" 13 15Don't know I
9 11 1 7 7 6
ns = not statistically significantProbabilities in parenthesis should be interpreted with caution since they were computed on small* expected cell frequencies.Responses do not always total 100% because of some incomplete questionnaires.
**Question not asked in this questionnaire.
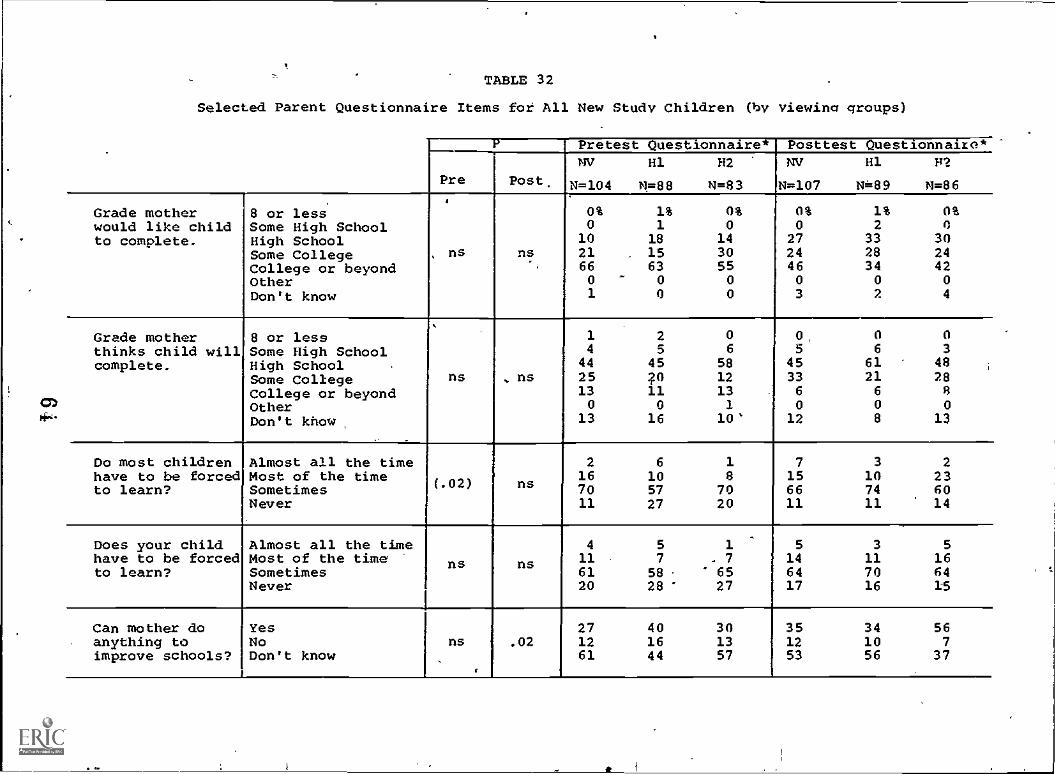
TABLE 32
Selected Parent Questionnaire Items for All New Study Children (by viewing groups)
--- Pretest Questionnaire* Posttest Questionnaixo
Pre Post.
NV
N=104
H1
N=88
H2
N=83
NV
N=107
H1
N=89
F2
N=86
Grade motherwould like childto complete.
8 or lessSome High SchoolHigh SchoolSome CollegeCollege or beyondOtherDon't know
ns ns.
0%0
10216601
1%1
18156300
0%0
14305500
0%0
27244603
1%2
33283402
0%0
30244204
Grade motherthinks child willcomplete.
8 or lessSome High SchoolHigh SchoolSome CollegeCollege or beyondOtherDon't khow
ns . ns
14
4425130
13
25
45
?0110
16
06
581213110'
0,5
45336
012
06
61216
08
03
482880
13
Do most childrenhave to be forcedto learn?
Almost all the timeMost of the timeSometimesNever
(. 02) ns
2167011
6
105727
18
7020
7156611
3107411
2236014
Does your childhave to be forcedto learn?
Almost all the timeMost of the timeSometimesNever
ns ns
4116120
57
5828 '
1. 76527
5146417
3117016
5166415
Can mother doanything toimprove schools?
I
YesNoDon't know
ns
,
.02271261
401644
301357
351253
341056
567
37
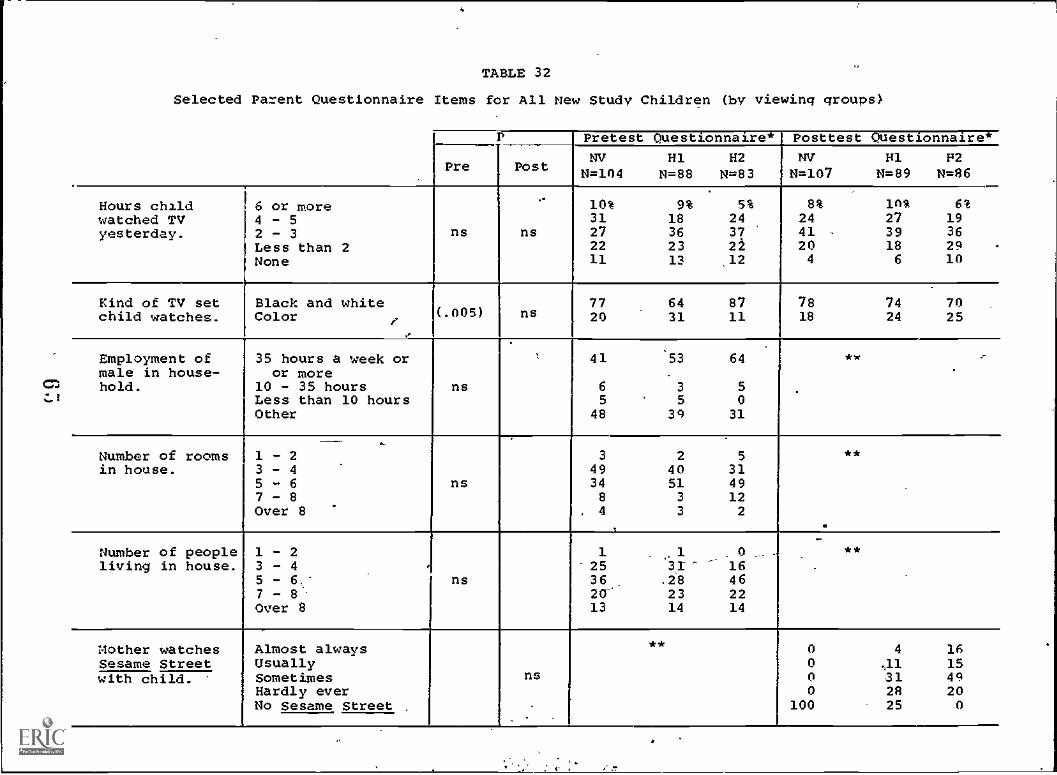
TABLE 32
Selected Parent Questionnaire Items for All New Study Children (by viewing groups)
Pretest Questionnaire*1
NV H1 H2N=104 N=88 N=83
Posttest Questionnaire*
Pre PostNV H1 F2N=107 N=89 N=86
Hours child 1 6 or more 10% 9% 5% 8% inik 6%watched TV 4 - 5 31 18 24 24 27 19yesterday. 2 - 3 ns ns 27 36 37 41 - 39 36
Less than 2 22 23 n 20 18 24None 11 13 .12 4 6 10
Kind of TV set Black and white 77 64 87 78 74 70child watches. Color e
(.005) ns 20 31 11 18 24 25
..
Employment ofmale in house-
35 hours a week oror more
41 53 64 **
hold. 10 - 35 hours ns 6 3 5.
Less than 10 hours 5 5 0Other 48 39 31
Number of rooms,
1- 2.
3 2 5 **
in house. 3 - 4 49 40 315 - 6 ns 34 51 497 - 8 8 3 12Over 8 4 3 2
Number of people 1 - 2 1 1 0 .**
living in house. 3 - 4 25 31 16 .
5 - 6,- ns 36 .2-8 467 - 8' 20- 23 22Over 8 13 14 14
Mother watches Almost always **0 4 16
Sesame Street Usually 0 ,11 15with child. Sometimes ns 0 31 49
Hardly ever 0 2R 20No Sesame Street 100 25 0
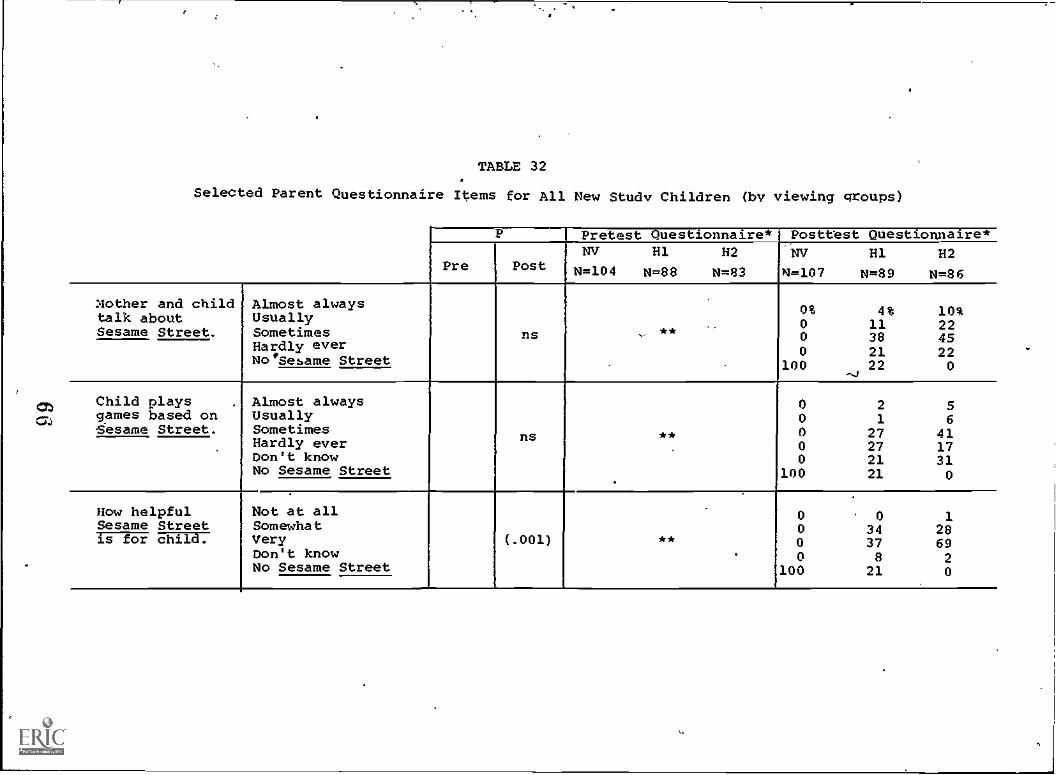
TABLE 32
Selected Parent Questionnaire Items for All New Study Children (by viewing groups)
P Pretest Questionnaire* Posttest Questionnaire*
Pre PostNV H1
N=104 N=88
H2
N=83
NVN=107
H1
N=89
H2
N=86
Mother and child Almost always 0% 4% 10%talk about Usually0 11 22Sesame Street. Sometimes ns **0 38 45
Hardly ever 0 21 22No'Sesame Street 100 22 0,..,
Child plays . Almost always 0 2 5games based on Usually 0 1 6sesame Street. Sometimes
ns ** 0 27 41Hardly ever 0 27 17Don't know 0 21 31No Sesame Street 100 21 0
. ..
How helpful Not at all .
0 0 1Sesame Street Somewhat 0 34 28is for child. Very (.001) ** 0 37 69
Don't know' 0 8 2
No Sesame Street 100 21 0
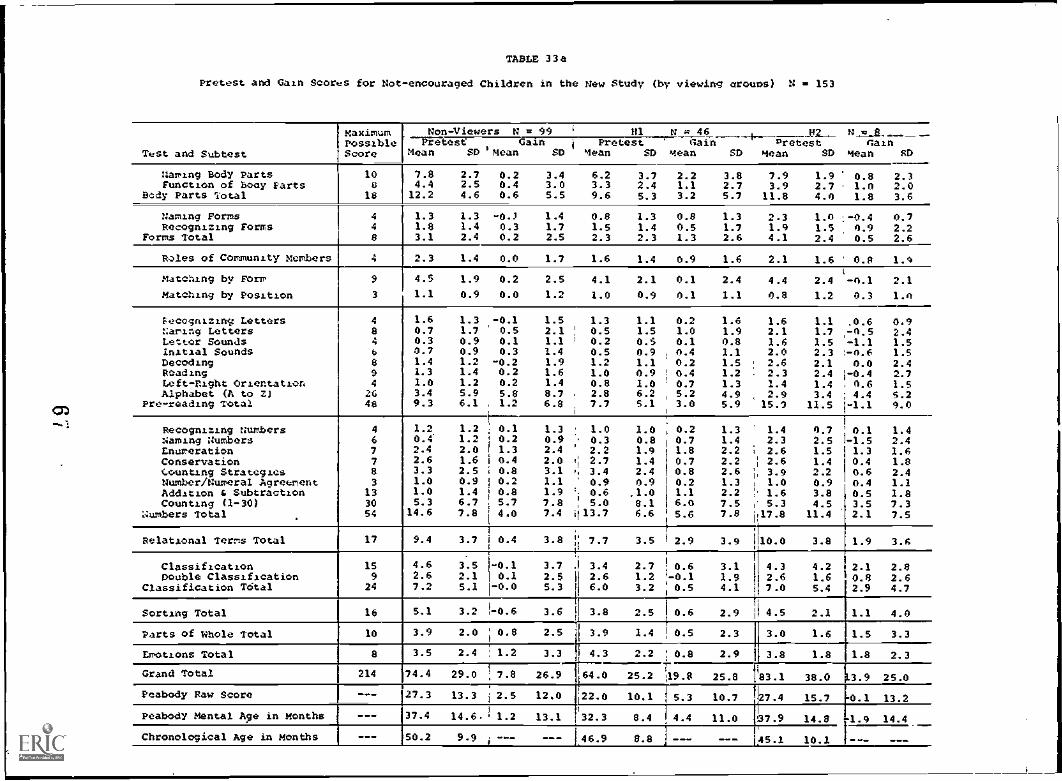
TABLE 33a
Pretest and Gain Scores for Not-encouraged Children in the Hew Study (by viewing croups) N = 153
Test and Subtest
MaximumPossibleScore
Non-Viewers N sr 99 H1 a 46 112.-_ 14_=_E...._-_-.N -4----VSA*se . Gall's i Pretest (lain pretest rainmean SD 'Mean SD Mean SD Mean SD Mean SD Mean SD
Naming Body PartsFunction of Boey karts
Body Parts Total
10a
1$
7.8 2.7 0.2 3.4 6.2 3.7 2.2 3.8 7.9 1.9 0.8 2.34.4 2.5 0.4 3.0 3.3 2.4 1.1 2.7 3.9 2.7 . 1.0 2.0
12.2 4.6 0.6 5.5 9.6 5.3 3.2 5.7 11.8 4.0 1.8 3.6
Naming FormsRecognizing Forms
Forms Total
448
1.3 1.3 -0.3 1.4 0.8 1.3 0.8 1.3 2.3 1.0 .-0.4 0.71.8 1.4 0.3 1.7 1.5 1.4 0.5 1.7 1.9 1.5 0.9 2.23.1 2.4 0.2 2.5 2.3 2.3 1.3 2.6 4.1 2.4 0.5 2.6
Roles of Community Members 4 2.3 1.4 0.0 1.7 1.6 1.4 0.9 1.6 2.1 1.6 0.9 1.4
Matching by Form
Matching by Position
9
3
4.5 1.9 0.2 2.5 4.1 2.1 0.1 2.4 4.4 2.4 -0.1 2.1
' 1.1 0.9 0.0 1.2 1.0 0.9 0.1 1.1 0.8 1.2 0.3 1.0
Fecognizinv LettersNaming LettersLetter SoundsInitial SoundsDecodingRoadingLeft-Right OrientationAlphabet (A to 2)
Pre-reading Total
484
b894
2648
1.6 1.3 -0.1 1.5 1.3 1.1 0.2 1.6 1.6 1.1 .0.6 0.90.7 1.7 0.5 2.1 ! 0.5 1.5 1.0 1.9 2.1 1.7 -0.5 2.40.3 0.9 0.1 1.1 , 0.2 0.5 0.1 0.8 1.6 1.5 -1.1 1.50.7 0.9 0.3 1.4 0.5 0.9 0.4 1.1 2.0 2.3 '-0.6 1.51.4 1.2 -0.2 1.9 1.2 1.1 0.2 1.5 2.6 2.1 0.0 2.41.3 1.4 0.2 1.6 1.0 0.9 0.4 1.2 , 2.3 2.4 1-0.4 2.71.0 1.2 0.2 1.4 0.8 1.0 0.7 1.3 1.4 1.4 0.6 1.53.4 5.9 5.8 8.7 . 2.8 6.2 5.2 4.9 2.9 3.4 4.4 5.29.3 6.1 . 1.2 6.8 7.7 5.1 3.0 5.9 15.1 11.5 -1.1 9.0
Recognizing NumbersNaming NumbersEnumerationConservationCounting StrategiesNumber/Numeral AgreementAddition 4 SubtractionCounting (1-30)
Numbers Total
46778
3133054
1.2 1.2 0.1 1.3 . 1.0 1.0 0.2 1.3 1.4 0.7OA' 1.2 l 0.2 0.9
'
0.3 0.8 0.7 1.4 2.3 2.5 1
2.4 2.0 1.3 2.4 2.2 1.9 j 1.8 2.2 2.6 1.52.6 1.6 1 0.4 2.0 I: 2.7 1.4 1 0.7 2.2 2.6 1.43.3 2.5 0.8 3.1 P. 3.4 2.4 0.8 2.6 i 3.9 2.21.0 0.9 0.2 1.1 0.9 0.9 10.2 1.3 1.0 0.91.0 1.4
i
0.8 1.9 '; 0.6 ,1.0 1.1 2.2 1.6 3.85.3 6.7 5.7 7.8 : 5.0 8.1 6.0 7.5 5.3 4.5
14.6 7.8 4.0 7.4 113.7 6.6 5.6 7.8 X17.8 11.4
0.1 1.4-1.5 2.41.3 1.60.4 1.80.6 2.40.4 1.10.5 1.83.5 7.32.1 7.5
Relational Terms Total 17 9.4 3.7 0.4 3.8 ' 7.7 3.5 2.9 3.9 110.0 3.83 1.9 3.9-
ClassificationDouble Classification
Classification Tetal
159
24
4.6 3.5 1-0.1 3.7 1 3.4 2.7 0.6 3.12.6 2.1 0.1 2.5 I 2.6 1.2 -0.1 1.97.2 5.1 1-0.0 5.3 6.0 3.2 0.5 4.1
4.3 4.22.6 1.67.0 5.4
2.1 2.80.8 2.62.9 4.7
Sorting Total 16 5.1 3.2 ,-0.6 3.6Ii
1 3.8 2.5 0.6 2.9 4.5 2.1 1.1 4.0
Parts of Whole Total 10 3.9 2.0 ' 0.8 2.5 I
1 3.9 1.4 0.5 2.3 3.0 1.6 1.5 3.3
Emotions Total 8 3.5 2.4 1.2 3.3--1.---
14.34.3 2.2 0.8 2.9 3.8 1.8
83.1 38.0
1.8 2.3
3.9 25.0 -Grand Total 214 74.4 29.0 7.8 26.9
fa'64.0 25.2 ;19.8 25.8
.
Peabody Raw Score --- 27.3 13.3 2.5 12.01
'22.0 10.1 1 5.3 10.7 27.4 15.7 0.1 13.2
Peabody Mental Age in Months --- 37.4 14.6 1.2 13.1 132.3 8.4 1 4.4 11.0 37.9 14.8 1.9 14.4
Chronological Age in Months --- 50.2 9.9 --- ---i
46.9 8.8 1 --- --- A5.1 10.1
--
--- ---
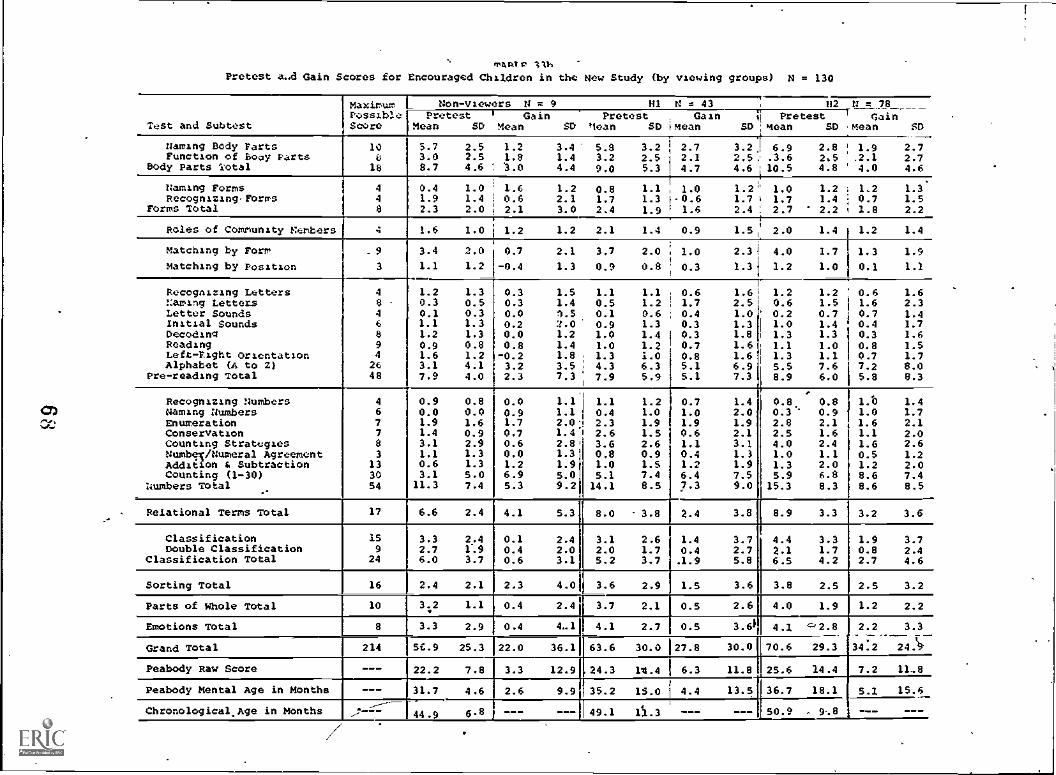
mut e -owPretest a"d Gain Scores for Encouraged Children in the New Study (by viewing groups) N = 130
Test and Subtest
MaximumPossibleScore
Non-Viewers N = 9 HI N m 43 H2 N m 78Pretest 0 Gain Pretest Gain ri Pretest r Gain
Mean SD Mean SD Howl SD 'mean SD ;Mean SD Mean SD
Naming Body PartsFunction of Bogy Parts
Body Parts Total
10018
5.7 2.5 1.2 3.4 5.8 3.2 I 2.7 3.2.1 6.9 2.8 1 1.9 2.73.0 2.5 1.8 1.4 3.2 2.5 2.1 2.5. .3.6 2.5 :.2.1 2.78.7 4.6 3.0 4.4 9.0 5.3 4.7 4.6 `10.5 4.8 ' 4.0 4.6
Naming FormsRecogniringFOrms
Forms Total
44
8
.
0.4 1.0 1.6 1.2 0.8 1.1 1.0 1.2' 1.0 1.2 1.2 1.3.
1.9 1.4 1 0.6 2.1 1.7 1.3 -0.6 1.7 5 1.7 1.4 0.7 1.52.3 2.0 ; 2.1 3.0 2.4 1.9 1.6 2.4 . 2.7 2.2 1.8 2.2
Roles of Community Members 4 1.6 1.0 i 1.2 1.2 2.1 1.4 0.9 1.5 2.0 1.4 1.2 1.4
Matching by Form
Matching by Position
- 9
3
3.4 2.0
1.1 1.2
0.7 2.1 3.7 2.0 1.0 2.3
-0.4 1.3 0.9 0.8 0.3 1.3
4.0 1.7
1.2 1.0
1.3 1.9
0.1 1.1
Recognizing LettersNaming LettersLetter SoundsInitial SoundsDecodingReadingLeft-Right OrientationAlphabet (A to Z)
Pre-reading Total
4
8468942648
1.2 1.30.3 0.50.1 0.31.1 1.31.2 1.30.9 0.81.6 1.23.1 4.17.9 4.0
0.3 1.5 1.1 1.10.3 1.4 0.5 1.20.0 3.5 0.1 0.60.2 2.0 0.9 1.30.0 1.2 1.0 1.40.8 1.4 1.0 1.2
-0.2 1.6 . 1.3 1.03.2 3.5 : 4.3 6.32.3 7.3 7.9 5.9
0.6 1.61.7 2.50.4 1.00.3 1.30.3 1.80.7 1.60.8 1.65.1 6.95.1 7.3
1.2 1.20.6 1.50.2 0.71.0 1.41.3 1.31.1 1.01.3 1.15.5 7.68.9 6.0
0.6 1.61.6 2.30.7 1.40.4 1.70.3 1.60.8 1.50.7 1.77.2 8.05.8 8.3
Recognizing NumbersNaming NumbersEnumerationConservationCounting StrategiesNumbel/Numeral AgreementAddition & SubtractionCoUnting (1-30)
Numbers Total
467783
133054
0.9 0.80.0 0.01.9 1.61.4 0.93.1 2.91.1 1.30.6 1.33.1 5.0
11.3 7.4
0.0 1.10.9 1.11.7 2.0!0.7 1.4'10.6 2.8,0.0 1.3'1.2 1.96.9 5.05.3 9.2
1 1.1 1.21 0.4 1.0!
2.3 1.92.6 1.53.6 2.60.8 0.91.0 1.55.1 7.414.1 8.5
0.7 1.41.0 2.01.9 1.90.6 2.11.1 3.10.4 1.31.2 1.96.4 7.57.3 9.0
0.8 0.80.3.- 0.92.8 2.12.5 1.64.0 2.41.0 1.11.3 2.05.9 6.8
15.3 8.3
1.b 1.41.0 1.71.6 2.11.1 2.01.6 2.60.5 1.21.2 2.08.6 7.48.6 8.5
Relational Terms Total 17 6.6 2.4 4.1 5.3 8.0 3.8 2.4 3.8 8.9 3.3 3.2 3.6
ClassificationDouble Classification
Classification Total
159
24
3.3 2.42.7 1-.96.0 3.7
0.1 2.40.4 2.00.6 3.1
3.1 2.62.0 1.75.2 3.7
1.4 3.70.4 2.7.1.9 5.8
4.4 3.32.1 1.76.5 4.2
1.9 3.70.8 2.42.7 4.6
Sorting Total 16 2.4 2.1 2.3 4.0 3.6 2.9 1.5 3.6 3.8 2.5 2.5 3.2
Parts of Whole Total 10 3.2 1.1.
0.4 2.4 3.7 2.1 0.5 2.6 4.0 1.9 1.2 2.2
Emotions Total 8 3.3 2.9 0.4 4"1 4.1 2.7 0.5 3.61 4.1 ,2.8 2.2 3.3
Grand Total 214 56.9 25.3 22.0 36.1 63.6 30.0 27.8 30.0 70.6 29.3 34.. 2 24.'
Peabody RaW Score --- 22.2 7.8 3.3 12.9 24.3 11.4 6.3 11.8 25.6 14.4 7.2 11-8
Peabody Mental Age in Months --- 31.7 4.6 2.6 9.9 35.2 15.0 4.4 13.5 36.7 18.1 5.1 15.6_
Chronological, Age in Months__
44.9 6.8 --- 49.1 11.3 --- --- 50.9 9.8 ---
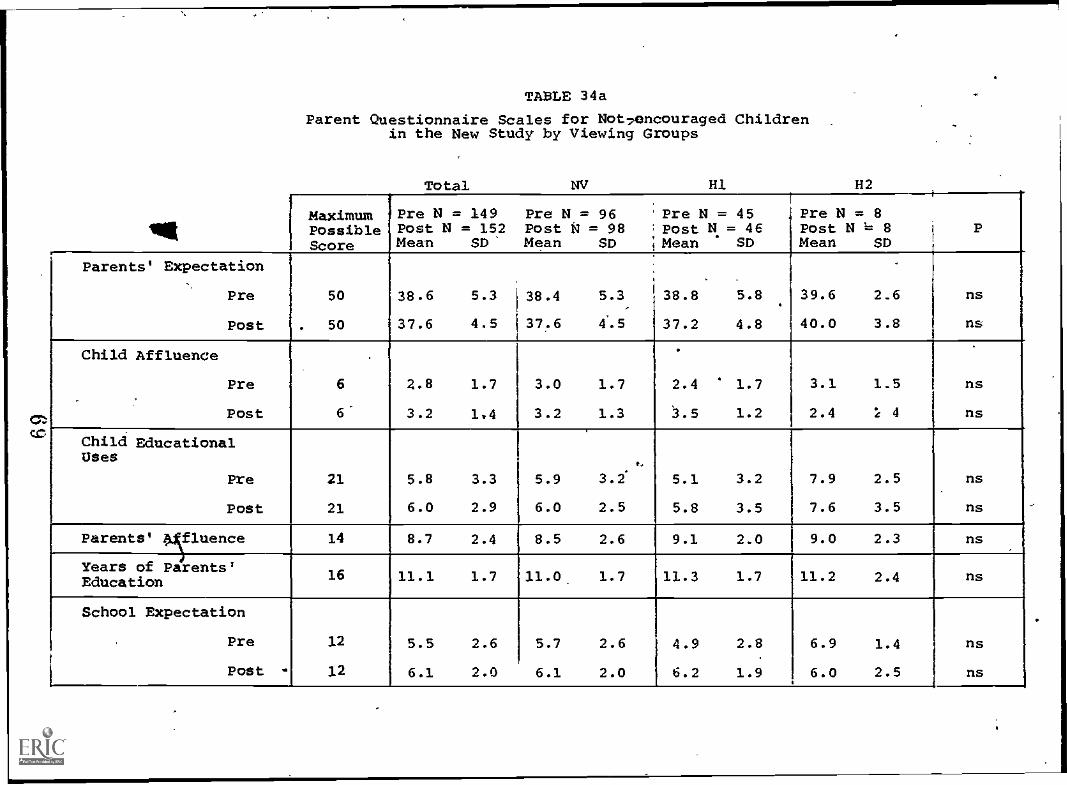
TABLE 34a
Parent Questionnaire Scales for Not,encouraged Childrenin the New Study by Viewing Groups
Total NV Hi H2
1iMaximumPossibleScore
1Pre N = 149 PrePost N = 152 PostMean SD Mean
N = 96 PreN = 98 Post
SD ;Mean
N = 45 ,
N = 46SD
PrePostMean
N = 8N '42 8
SDP
Parents' Expectation
Pre 50 38.6 5.3 138.4 5.3 38.8 5.8 39.6 2.6 ns
Post . 50 37.6 4.5 137.6 4.5 37.2 4.8 40.0 3.8 ns1
Child Affluence
Pre 6 2.8 1.7 3.0 1.7 2.4 1.7 3.1 1.5 ns
Post 6 3.2 1.4 3.2 1.3 3.5 1.2 2.4 4 ns
Child EducationalUses
.-
Pre 21 5.8 3.3 5.9 3.2 5.1 3.2 7.9 2.5 ns
Post 21 6.0 2.9 6.0 2.5 5.8 3.5 7.6 3.5 ns
Parents' MfluenceI
14 1 8.7 2.4 8.5 2.6 9.1 2.0 9.0 2.3 ns
Years of Parents'Education 16 11.1 1.7 11.0 1.7 11.3 1.7 11.2 2.4 ns
School Expectation
Pre 12 5.5 2.6 5.7 2.6 4.9 2.8 6.9 1.4 ns
Post - 12 6.1 2.0 6.1 2.0 6.2 1.9 6.0 2.5 ns
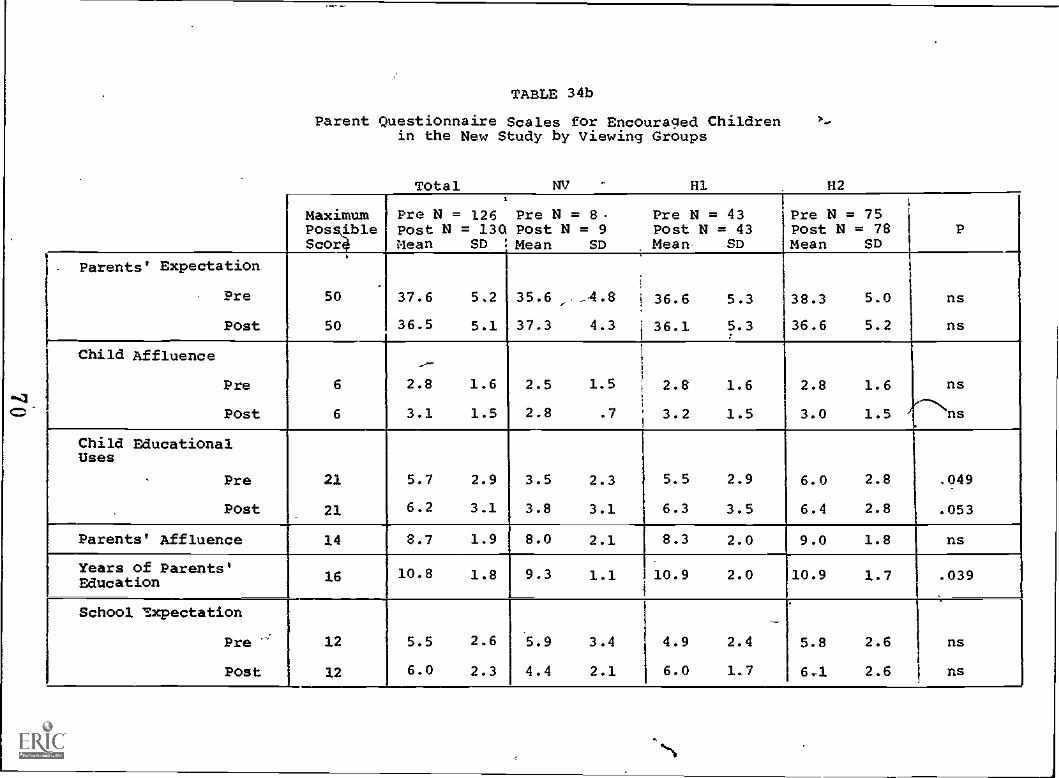
TABLE 34b
Parent Questionnaire Scales for Encouraged Childrenin the New Study by Viewing Groups
Total NV H1 112
MaximumPosspleScor#
PrePostMean
N = 126 Pre N = 8 Pre N = 43N = 13G Post N = 9 Post N = 43
SD :Mean SD Mean. SD
PrePostMean
N = 75N = 78
SDP
Parents' Expectation
Pre 50 37.6 5.2 35.6 -4.8 36.6 5.3 38.3 5.0 ns
Post 50 36.5 5.1 37.3 4.3 36.1 5.3 36.6 5.2 nsJ
Child Affluence
Pre 6 2.8 1.6 2.5 1.5 2.8 1.6 2.8 1.6 ns
Post 6 3.1 1.5 2.8 .7 3.2 1.5 3.0 1.5 ns
Child EducationalUses
Pre 21. 5.7 2.9 3.5 2.3 5.5 2.9 6.0 2.8 .049
Post 21 6.2 3.1 3.8 3.1 6.3 3.5 6.4 2.8 .053
Parents' Affluence 14 8.7 1.9 8.0 2.1 8.3 2.0 9.0 1.8 ns
Years of Parents'Education 16 10.8 1.8 9.3 1.1 10.9 2.0 10.9 1.7 .039
_
School expectation.
_
Pre 12 5.5 2.6 5.9 3.4 4.9 2.4 5.8 2.6 ns
Post 12 6.0 2.3 4.4 2.1 6.0 1.7 6,1 2.6 ns
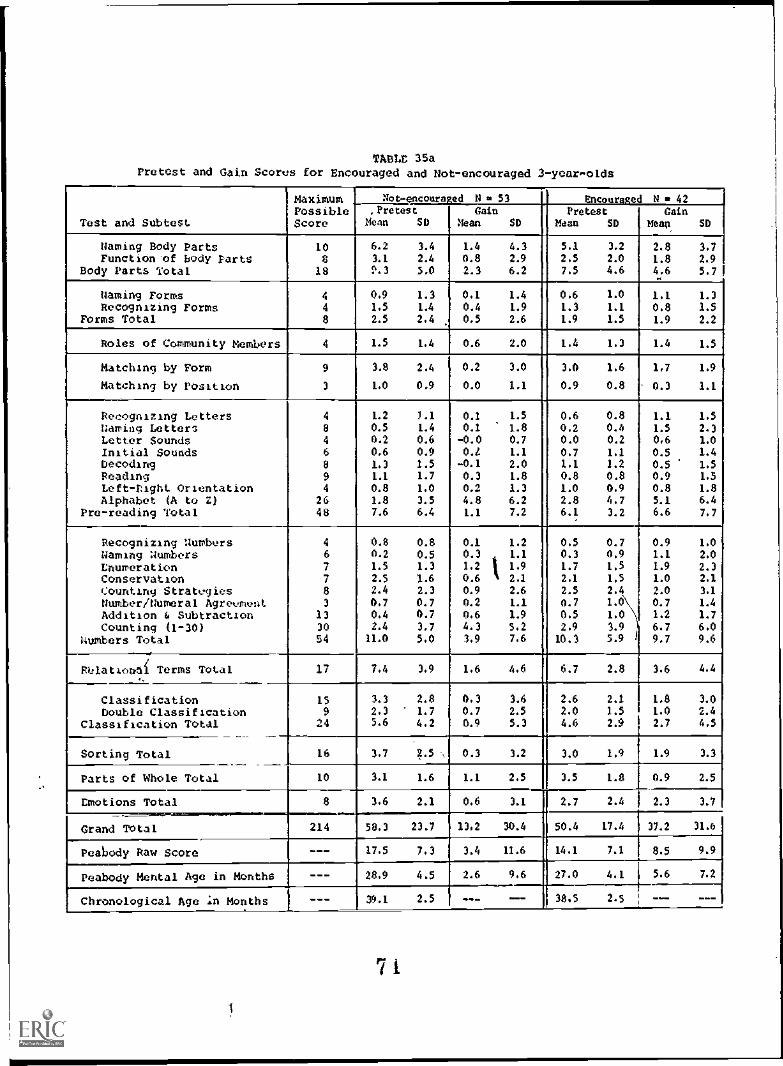
TABLE 35aPretest and Gain Scores for Encouraged and Not-encouraged 3- year -olds
Test and Subtest
Maximum Not-encouraged N 53 Encouraged N = 42PossibleScore
,PretestMean SD
GainMean SD
PretestMean SD
CainMean SD
flaming Body Parts 10 6.2 3.4 1.4 4.3 5.1 3.2 2.8 3.7Function 'of body Parts 8 3.1 2.4 0.8 2.9 2.5 2.0 1.8 2.9
Body Parts l'ota1 18 :%.3 5.0 2.3 6.2 7.5 4.6 4.6 5,7
flaming Forms 4 0.9 1.3 0.1 1.4 0.6 1.0 1,1 1.3Recognizing Forms 4 1.5 1.4 0.4 1.9 1.3 1.1 0.8 1.5
Forms Total 8 2.5 2.4 0.5 2.6 1.9 1.5 1.9 2.2
Roles of Community Members 4 1.5 1.4 0.6 2.0 1.4 1,3 1.4 1.5
Matching by Form 9 3.8 2,4 0.2 3.0 3.0 1.6 1.7 1.9
Matching by Position 3 1.0 0.9 0.0 1.1 0.9 0.8 0.3 1.1
Recognizing Letters 4 1.2 J.1 0.1 1.5 0.6 0.8 1.1 1.5Naming Letters 8 0.5 1.4 0.1 1.8 0.2 0.4 1.5 2.3Letter Sounds 4 0.2 0.6 -0.0 0.7 0.0 0.2 0.6 1,0Initial Sounds 6 0.6 0.9 0.t 1.1 0,7 1,1 0.5 1.4Decoding 8 1.3 1.5 -0.1 2.0 1.1 1.2 0.5 1.5Reading 9 1.1 1.7 0.3 1.8 0.8 0.8 0.9 1.5Left-Eight. Orientation 4 0.8 1.0 0.2 1.3 1.0 0.9 0.8 1.8Alphabet (A to 2) 26 1.8 3.5 4.8 6.2 2.8 4.7 5.1 6.4
Pre-reading Total 48 7.6 6.4 1.1 7.2 6.1 3.2 6.6 7.7
Recognizing :lumbers 4 0.8 0.8 0.1 1.2 0.5 0.7 0.9 1.0Naming numbers 6 0.2 0.5 0.3 1.1 0.3 0.9 1.1 2.0Enumeration 7 1.5 1.3 1.2 I 1.9 1.7 1,5 1.9 2.3Conservation 7 2.5 '1.6 0.6 2,1 2.1 1,5 1.0 2.1Counting Strategies 8 2.4 2.3 0.9 2.6 2.5 2.4 2.0 3.1number/Numeral Agreement 3 0.7 0.7 0.2 1.1 0.7 1.0\ 0.7 1.4Addition 6 Subtraction 13 0.4 0.7 0,6 1.9 0.5 1.0 1.2 1.7Counting (1-30) 30 2.4 3.7 4.3 5.2 2.9 3.9 6.7 6.0
numbers Total 54 11.0 5.0 3.9 7.6 10.3 5.9 I 9.7 9.6
Relationli Terms Total 17 7.4 3.9 1.6 4.6 6.7 2.8 3.6 4.4
Classification 15 3.3 2.8 0.3 3.6 2.6 2.1 1.8 3.0Double Classification 9 2.3 1.7 0.7 2.5 2.0 1.5 1.0 2.4
Classification Total 24 5.6 4.2 0.9 5.3 4.6 2.9 2.7 4.5
Sorting Total 16 1.7 2.5 -, 0.3 3.2 3.0 1.9-,
1.9 3.3
Parts of Whole Total 10 3.1 1.6 1.1 2,5 3.5 1.8 0.9 2.5
Emotions Total 8 3.6 2.1 0.6 3.1 2.7 2.4 2.3 3.7
Grand Total 214 58.3 23.7 13.2 30.4 50.4 17.4 37.2 31.0
Peabody Raw Score --- 17.5 7.3 3.4 11.6 14.1 7.1 8.5 9.9
Peabody Mental Age in Months --- 28.9 4.5 2.6 9.6 27.0 4.1 5.6 7.2
Chronological Age :n Months --- 39.1 2.5 --- -- 38,5 2.5 -- --
71
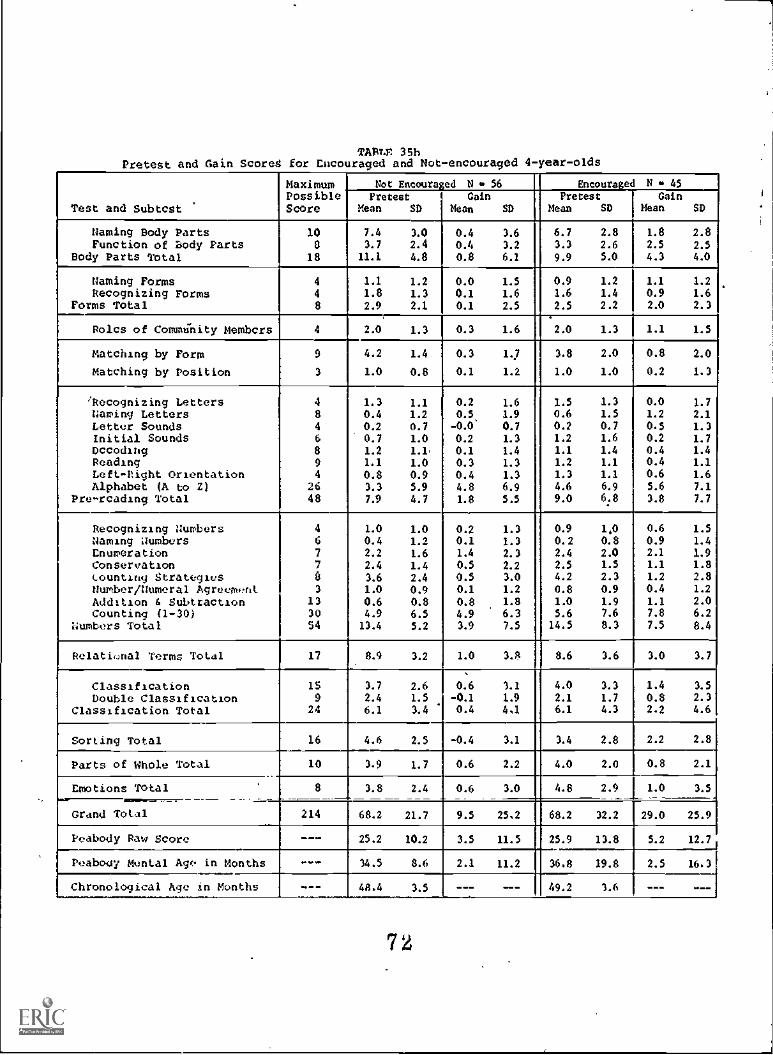
TAMP 3ShPretest and Gain Scored for Encouraged and Not-encouraged 4-year-olds
Test and Subtest
Maximum Not Encouraged N i 56 Encouraged N 45PossibleScore
Pretest 1
Mean SDCain
Mean SD
PretestMean SD
GainMean SD
Naming Body Parts 10 7.4 3.0 0.4 3.6 6.7 2.8 1.8 2.8Function of Body Parts 0 3.7 2.4 0.4 3.2 3.3 2.6 2.5 2.5
Body Parts Total 18 1.1.1 4.8 0.8 6.1 9.9 5.0 4.3 4.0
Naming Forms 4 1.1 1.2 0.0 1.5 0.9 1.2 1.1 1.2Recognizing Forms 4 1.8 1.3 0.1 1.6 1.6 1.4 0.9 1.6
Forms Total 8 2.9 2.1 0.1 2.5 2.5 2.2 2.0 2.3
Roles of Conunaity Members 4 2.0 1.3 0.3 1.6 2.0 1.3 1.1 1.5
Matching by Form 9 4.2 1.4 0.3 1.7 3.8 2.0 0.8 2.0Matching by Position 3 1.0 0.8 0.1 1.2 1.0 1.0 0.2 1.3
'Recognizing Letters 4 1.3 1.1 0.2 1.6 1.5 1.3 0.0 1.7Naming Letters 8 0.4 1.2 0.5 1.9 0.6 1.5 1.2 2.1Letter Sounds 4 0.2 0.7 -0.0' 0.7 0.2 0.7 0.5 1.3Initial Sounds 6 0.7 1.0 0.2 1.3 1.2 1.6 0.2 1.7Decoding 8 1.2 1.1. 0.1 1.4 1.1 1.4 0.4 1.4Reading 9 1.1 1.0 0.3 1.3 1.2 1.1 0.4 1.1Left - tight Orientation 4 0.8 0.9 0.4 1.3 1.3 1.1 0.6 1.6Alphabet (A to 2) 26 3.3 5.9 4.8 6.9 4.6 6.9 5.6 7.1
Pre-reading Total 48 7.9 4.7 1.8 5.5 9.0 6.8 3.8 7.7
Recognizing Numbers 4 1.0 1.0 0.2 1.3 0.9 1.0 0.6 1.5Naming Numbers 6 0.4 1.2 0.1 1.3 0.2 0.8 0.9 1.4Enumeration 7 2.2 1.6 1.4 2.3 2.4 2.0 2.1 1.9Conservation 7 2.4 1.4 0.5 2.2 2.5 1.5 1.1 1.8tounting Strategies 0 3.6 2.4 0.5 3.0 4.2 2.3 1.2 2.8Number/Numeral Agreerent. 3 1.0 0.9 0.1 1.2 0.8 0.9 0.4 1.2Addition & Subtraction 13 0.6 0.8 0.8 1.8 1.0 1.9 1.1 2.0Counting (1-30) 30 4.9 6.5 4.9 6.3 5.6 7.6 7.8 6.2
Numbers Total 54 13.4 5.2 3.9 7.5 14.5 8.3 7.5 8.4
Relational Terms Total 17 8.9 3.2 1.0 3.8 8.6 3.6 3.0 3.7
Classification 15 3.7 2.6 0.6 3.1 4.0 3.3 1.4 3.5Double Classification 9 2.4 1.5 -0.1 1.9 2.1 1.7 0.8 2.3
Classification Total 24 6.1 3.4 0.4 4.1. 6.1 4.3 2.2 4.6
Sorting Total 16 4.6 2.5 -0.4 3.1 3.4 2.8 2.2 2.8
Parts of Whole Total 10 3.9 1.7 0.6 2.2 4.0 2.0 0.8 2.1.Emotions Total 8 3.8 2.4 0.6 3.0 4.8 2.9 1.0 3.5...---
Grand Total 214 68.2 21.7 9.5 25.2 68.2 32.2 29.0 25.9
Peabody Raw Score --- 25.2 10.2 3.5 11.5 25.9 13.8 5.2 12.7
Peabody Mental Age in Months --- 34.5 8.6 2.1 11.2 36.8 19.8 2.5 16.3
Chronological Age in Months --- 48.4 3.5 --- --- 49.2 3.6 --- - --
72
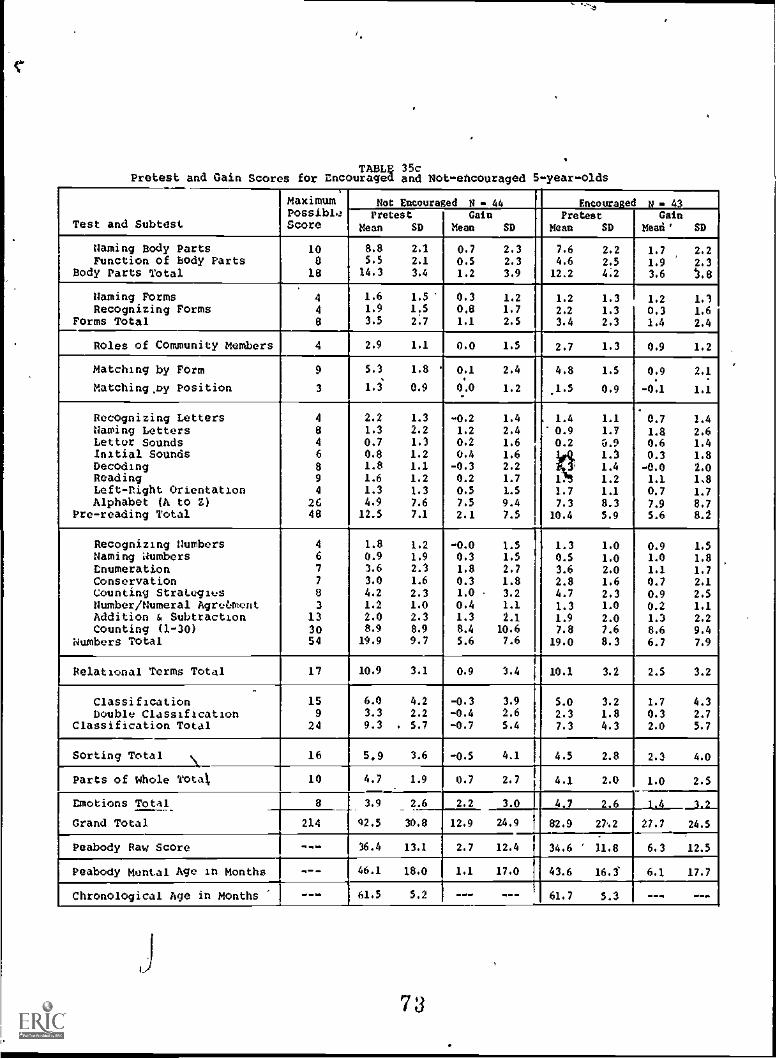
TABLE 35cPretest and Gain Scores for Encouraged and Not- encouraged 5-year-olds
Test and Subtdst
MaximumPossibleScore
Not Encouraged N 44 Encouraged N 43Pretest
Mean SDCain
Mean SDPretest
Mean SDGain
Mead' SD
Naming Body Parts 10 8,8 2.1 0.7 2.3 7.6 2.2 1.7 2.2Function Of body Parts 0 5,5 2.1 0,5 2.3 4.6 2,5 1.9 2.3
Body Parts Total 18 14.3 3.4 1,2 3.9 12.2 4,2 3.6 ..8Naming Forms 4 1.6 1.5 0.3 1,2 1,2 1.3 1.2 1.3Recognizing Forms 4 1.9 1,5 0.8 1.7 2,2 1.3 0.3 1,6
Forms Total 8 3.5 2,7 1.1 2.5 3.4 2.3 1.4 2.4
Roles of Community Members 4 2.9 1.1 0,0 1.5 2.7 1.3 0.9 1.2
Matching by Form 9 5.3 1.8 0.1 2.4 4.8 1.5 0,9 2,1Matching .by Position 3 1.3 0.9 0,0 1.2 .1,5 0,9 -0,1 1,1
Recognizing Letters 4 2.2 1.3 -0,2 1.4 . 1.4 1.1 0.7 1.4Naming Letters 8 1.3 2.2 1,2 2,4 0.9 1.7 1.8 2,6Letter Sounds 4 0.7 1.3 0.2 1,6 0.2 0.9 0.6 1.4Initial Sounds 6 0.8 1.2 0,6 1,6 1.3 0.3 1.8Decoding 8 1.8 1.1 -0.3 2.2 1.4 -0.0 2.0Reading 9 1.6 1,2 0.2 1.7 1. 1.2 1.1 1.8Left-Right Orientation 4 1.3 1.3 0.5 1.5 1.7 1.1 0,7 1.7Alphabet (A to 2) 26 4.9 7,6 7.5 9.4 7.3 8.3 7.9 8.7
Pre-reading Total 48 12.5 7.1 2.1 7.5 10.4 5.9 5.6 8.2
Recognizing Numbers 4 1.8 1.2 -0.0 1.5 1.3 1.0 0.9 1.5Naming ambers 6 0.9 1.9 0.3 1.5 0.5 1.0 1.0 1,8Enumeration 7 3.6 2.3 1.8 2,7 3.6 2.0 1.1 1,7Conservation 7 3.0 1.6 0.3 1.8 2.8 1.6 0.7 2.1Counting Strategies 8 4.2 2,3 1,0 3.2 4.7 2,3 0.9 2.5Number/Numeral Agre6ment 3 1,2 1.0 0.4 1.1 1.3 1.0 0.2 1.1Addition & Subtraction 13 2,0 2,3 1.3 2.1 1.9 2.0 1.3 2.2Counting (1-30) 30 8.9 8.9 8.4 10.6 7.8 7.6 8.6 9.4
Numbers TOtal 54 19.9 9.7 5.6 7.6 19.0 8.3 6.7 7.9
Relational Terms Total 17 10.9 3.1 0.9 3.4 10.1 3.2 2.5 3.2-
Classification 15 6.0 4.2 -0.3 3.9 5.0 3.2 1.7 4.3Double Classification 9 3.3 24 -0.4 2.6 2.3 1.8 0.3 2.7
Classification Total 24 9.3 . 5,7 -0.7 5.4 7.3 4.3 2.0 5.7
Sorting Total 16 5.9 3.6 -0.5 4.1 4.5 2.8 2.3 4.0
Parts of Whole Tota 10 4.7 1.9 0,7 2.7 4.1 2.0 1.0 2.5
Emotions Total 8 3.9 2.6 2.2 3.0 4.J 2.6 , 1.4 _3....2_
Grand Total 214 42.5 30.8 12.9 24.9 82.9 27'.2 27.7 24,5
Peabody Raw Score - -- 36.4 13.1 2.7 12.4 34.6 ' 11.8 6.3 12.5
Peabody Mental Age in Months - -- 46.1 18.0 1.1 17.0 43.6 16.3 6.1 17.7
Chronological Age in Months - -- 61.5 5,2 --- - -- 61.7 5.3 --- ---
J73
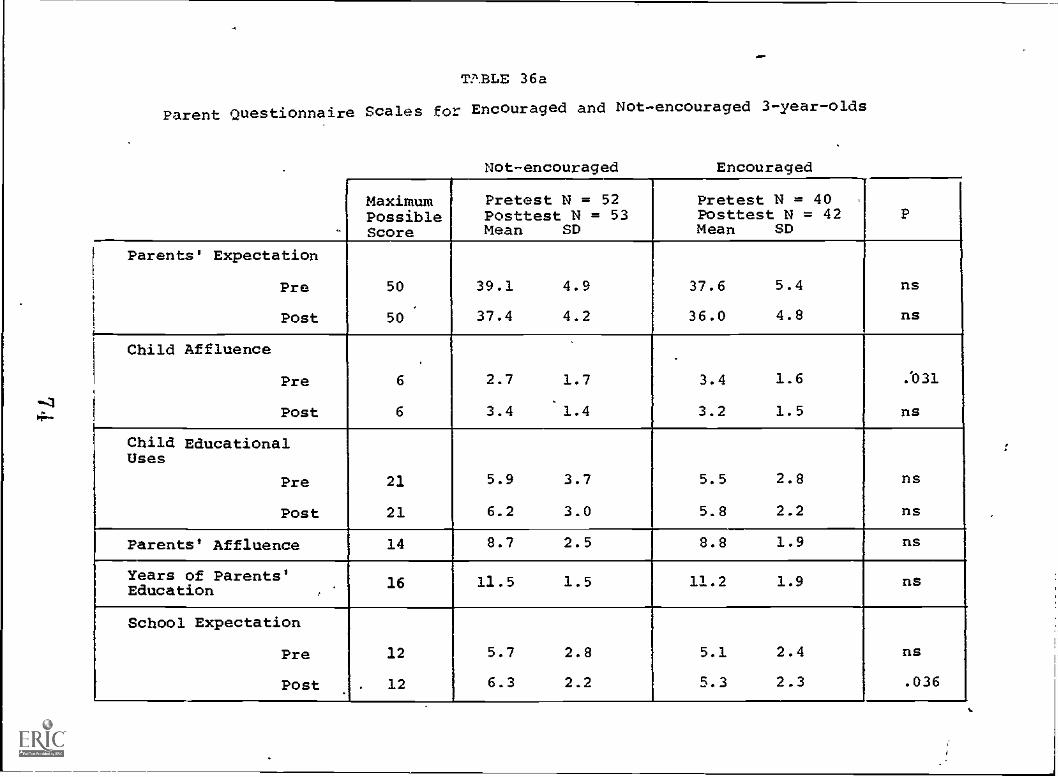
Vt.ELE 36a
Parent Questionnaire Scales for Encouraged and Not-encouraged 3-year-olds
Not-encouraged Encouraged
MaximumPossibleScore
Pretest N = 52Posttest N = 53Mean SD
Pretest N =Posttest N =Mean SD
4042 P
Parents' Expectation
Pre 50 39.1 4.9 37.6 5.4 ns
Post 50 37.4 4.2 36.0 4.8 ns
Child Affluence.
Pre 6 2.7 1.7 3.4 1.6 .'031
.
Post 6 3.4 1.4 3.2 1.5 ns
Child EducationalUses
Pre 21 5.9 3.7 5.5 2.8 ns
Post 21 6.2 3.0 5.8 2.2 ns
Parents' Affluence 14 8.7 2.5 8.8 1.9 ns
Years of Parents'16 11.5 1.5 11.2 1.9 ns
Education ,
School Expectation
Pre 12 5.7 2.8 5.1 2.4 ns
Post 12 6.3 2.2 5.3 2.3 .036( .
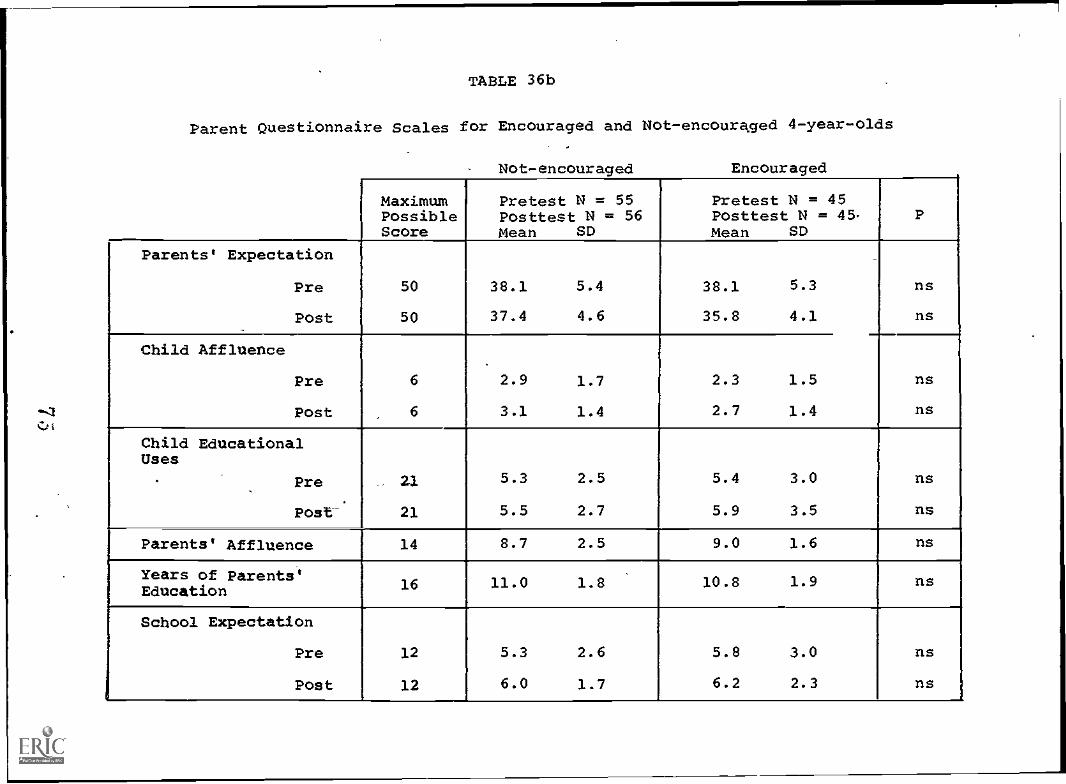
TABLE 36b
Parent Questionnaire Scales for Encouraged and Not-encouraged 4-year-olds
Not-encouraged Encouraged
MaximumPossibleScore
Pretest N = 55Posttest N = 56Mean SD
Pretest N = 45Posttest N = 45Mean SD
P
Parents' Expectation
Pre 50 38.1 5.4 38.1 5.3 ns
Post 50 37.4 4.6 35.8 4.1 ns
Child Affluence
Pre 6 2.9 1.7 2.3 1.5 ns
Post 6 3.1 1.4 2.7 1.4 ns
Child EducationalUses
Pre 21 5.3 2.5 5.4 3.0 ns
Post-' 21 5.5 2.7 5.9 3.5 ns
Parents' Affluence 14 8.7 2.5 9.0 1.6 ns
Years of Parents'Education 16 11.0 1.8 10.8 1.9 ns
School Expectation
Pre 12 5.3 2.6 5.8 3.0 ns
Post 12 6.0 1.7 6.2 2.3 ns
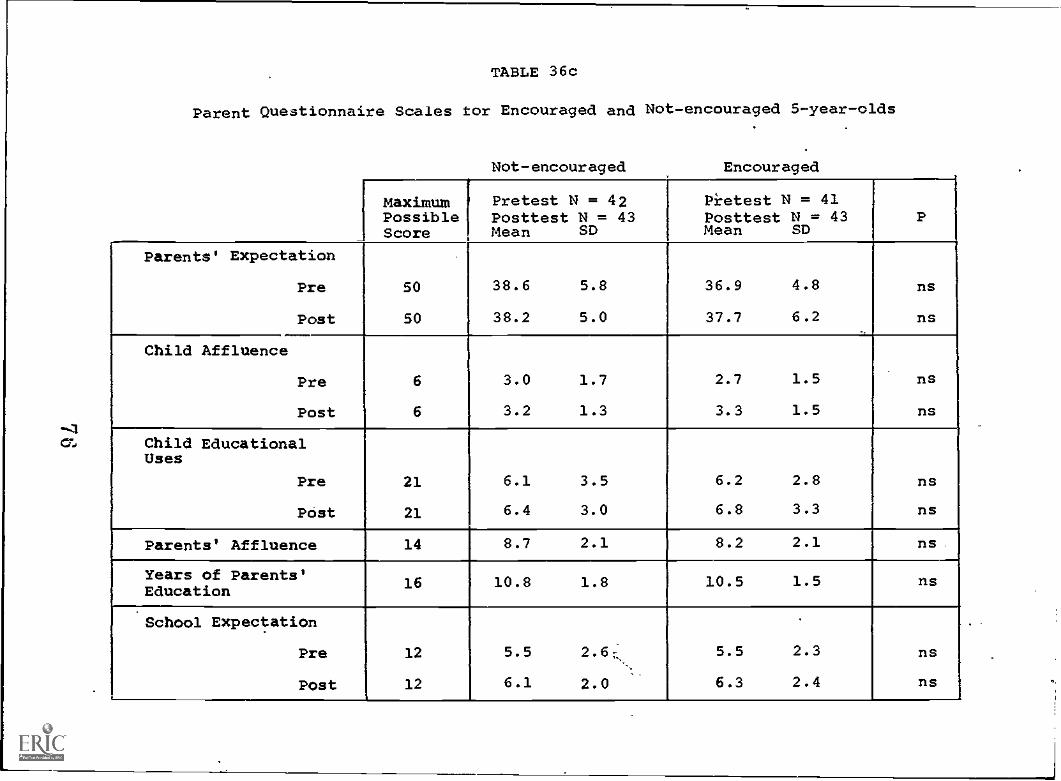
TABLE 36c
Parent Questionnaire Scales tor Encouraged and Not-encouraged 5-year-olds
Not-encouraged Encouraged
MaximumPossibleScore
Pretest N = 42Posttest N = 43Mean SD
Pretest N = 41Posttest N = 43Mean SD
P
Parents' Expectation
Pre 50 38.6 5.8 36.9 4.8 ns
Post 50 38.2 5.0 37.7 6.2 ns
Child Affluence
Pre 6 3.0 1.7 2.7 1.5 ns
Post 6 3.2 1.3 3.3 1.5 ns
Child EducationalUses
Pre 21 6.1 3.5 6.2 2.8 ns
Post 21 6.4 3.0 6.8 3.3 ns
Parents' Affluence 14 8.7 2.1 8.2 2.1 ns.
Years of Parents'Education 16 10.8 1.8 10.5 1.5 ns
School Expectation
Pre 12 5.5 2.6 5.5 2.3 ns
Post 12 6.1 2.0 6.3 2.4 ns
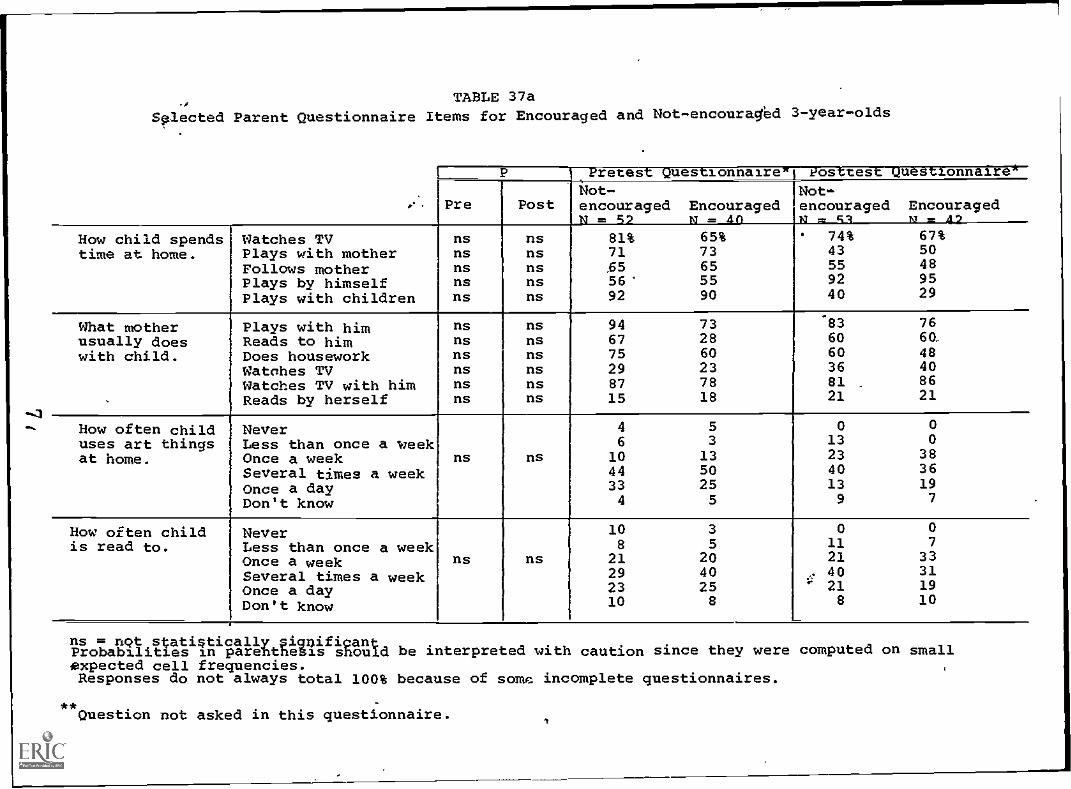
TABLE 37aSglected Parent Questionnaire Items for Encouraged and Not-encouraybd 3-year-olds
:.
L____ P
Post
IsPretest QuestionnaireNot-encouraged EncouragedN = 52 N = AA
1 vostest Questionnaire-1Not-encouraged EncouragedN = cl m = 42
Pre
How child spends Watches TV ns ns 81% 65% 74% 67%
time at home. Plays with mother ns ns 71 73 43 50
Follows mother ns ns ,65 65 55 48
Plays by himself ns ns 56' 55 92 95
Plays with children ns ns 92 90 40 29
What mother Plays with him ns ns 94 73.
83 76
usually does Reads to him ns ns 67 28 60 60.
with child. Does housework ns ns 75 60 60 48
Watches TV ns ns 29 23 36 40
Watches TV with him ns ns 87 78 81 86
Reads by herself ns ns 15 18 21 21
How often child Never 4 5 0 0
uses art things Less than once a week 6 3 13 0
at home. Once a week ns ns 10 13 23 38
Several times a week 44 50 40 36
Once a day 33 25 13 19
Don't know 4 5 9 7
How often child Never 10 3 0 0
is read to. Less than once a week 8 5 11 7
Once a week ns ns 21 20 21 33
Several times a week 29 40 , 40 31
Once a day 23 25 21 19
Don't know 10 8 8 10
ns = not statistically significanProbabilities in parehthesis should be interpreted with caution since they were computed on smallexpected cell frequencies.Responses do not always total 100% because of some incomplete questionnaires.
**Question not asked in this questionnaire.
1
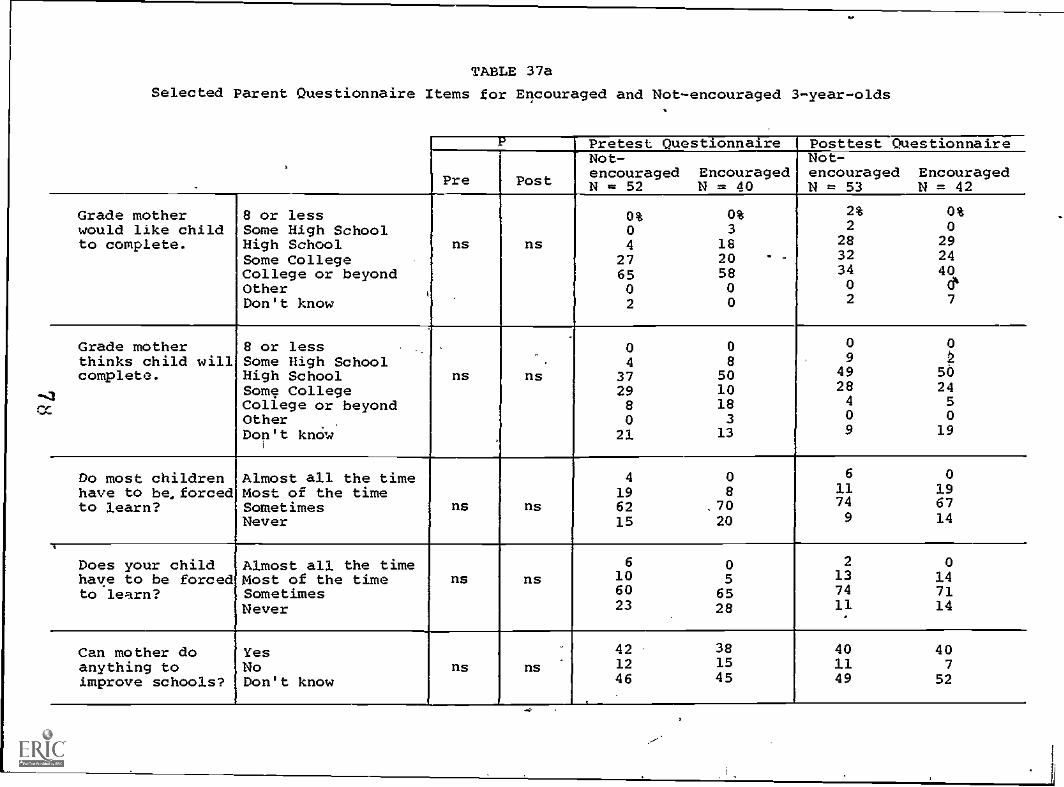
TABLE 37a
Selected Parent Questionnaire Items for Encouraged and Not-encouraged 3-year-olds
-
P Pretest Questionnaire Posttest Questionnaire
PrePre Post
Not-Encouraged
N = 52 N = 40
Not -encouragedN = 53
EncouragedN = 42
Grade mother 8 or less 0% 0% 2% 0%
would like child Some High School 0 3 2 0
to complete. High School ns ns 4 18 28 29
Some College 27 20 ' -32 24
College or beyond 65 58 34 40Other 0 0 0 014
Don't know 2 0 2 7
Grade mother 8 or less 0 0 0 0
thinks child will Some High School 4 8 9
complete. High School ns ns 37 50 49 sty
3Some CollegeCollege or beyond
298
1018
284
245
Other 0 3 0 0
Don't kndw1
21 13 9 19
Do most children Almost all the time 4 0 6 0
have to be.forced Most of the time 19 8 11 19
to learn? Sometimes ns ns 62 .70 74 67
Never 15 20 9 14
Does your child Almost all the time 6 0 2 0
have to be forced Most of the time ns ns 10 5 13 14to learn? Sometimes 60 65 74 71
NeverI
23 28 11 14
Can mother do Yes 42 38 40 40anything to No ns ns 12 15 11 7
improve schools? Don't know 46 45 49 52
1 .
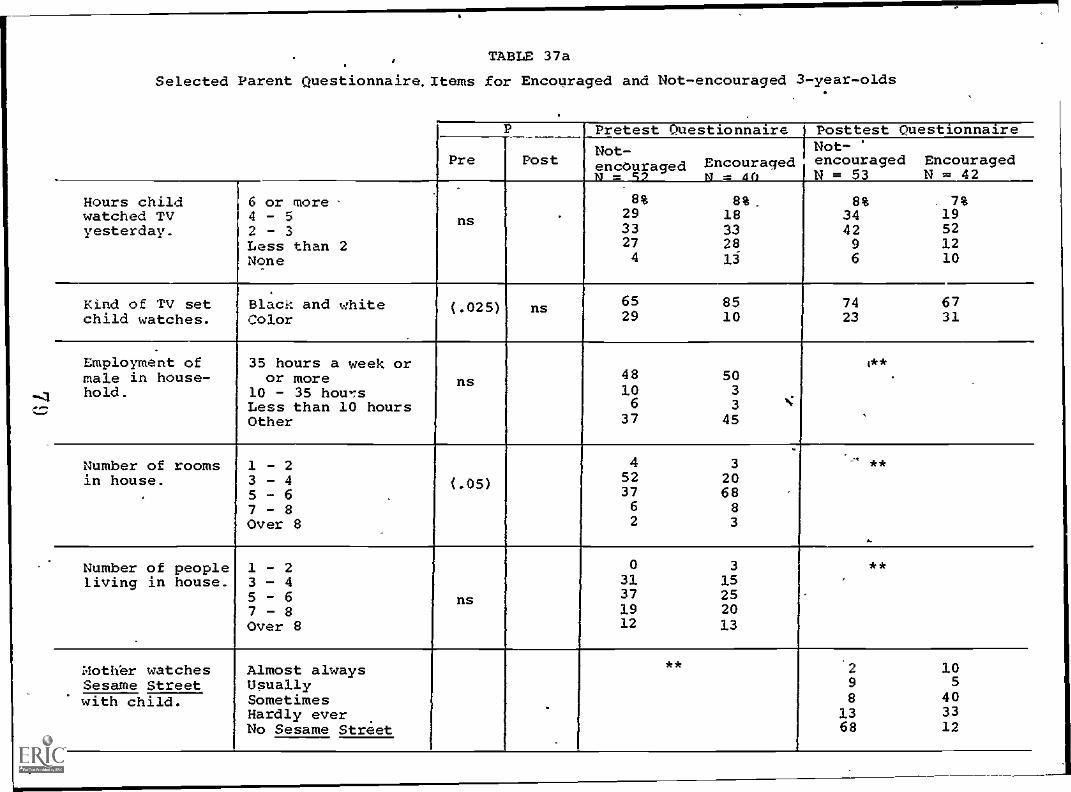
TABLE 37a
Selected Parent Questionnaire.Items for Encouraged and Not-encouraged 3-year-olds
P Pretest Questionnaire Posttest Questionnaire
Pre PostNot-encouragedm = S2
EncouragedN = 46
Not-encouragedN = 53
EncouragedN = 42
Hours child 6 or more. 8% at_ 8% 7%watched TV 4 - 5 ns . 29 18 34 19yesterday. 2 - 3 33 33 42 52
Less than 2 27 28 9 12None 4 lj 6 10
Kind of TV set Black and white (.025) ns 65 85 74 67child watches. Color 29 10 23 31.
Employment of 35 hours a week or 4 **
male in house- or more ns 48 50hold. 10 - 35 hours 10 3
Less than 10 hours 6 3
Other 37 45
Number of rooms 1 - 2 4 3 -" **
in house. 3 - 4 (.05)52 20
5 - 6 37 687 - 8 6 8
Over 8 2 3
..
Number of people 1. - 2 0 3 **living in house. 3 - 4 31 15
5 - 6 ns 37 257 - 8 19 20Over 8 12 13
Mothbr watches Almost always ** 2 10Sesame Street Upually 9 5
with child. Sometimes 8 40Hardly ever 13 33
No Sesame Striet 68 12
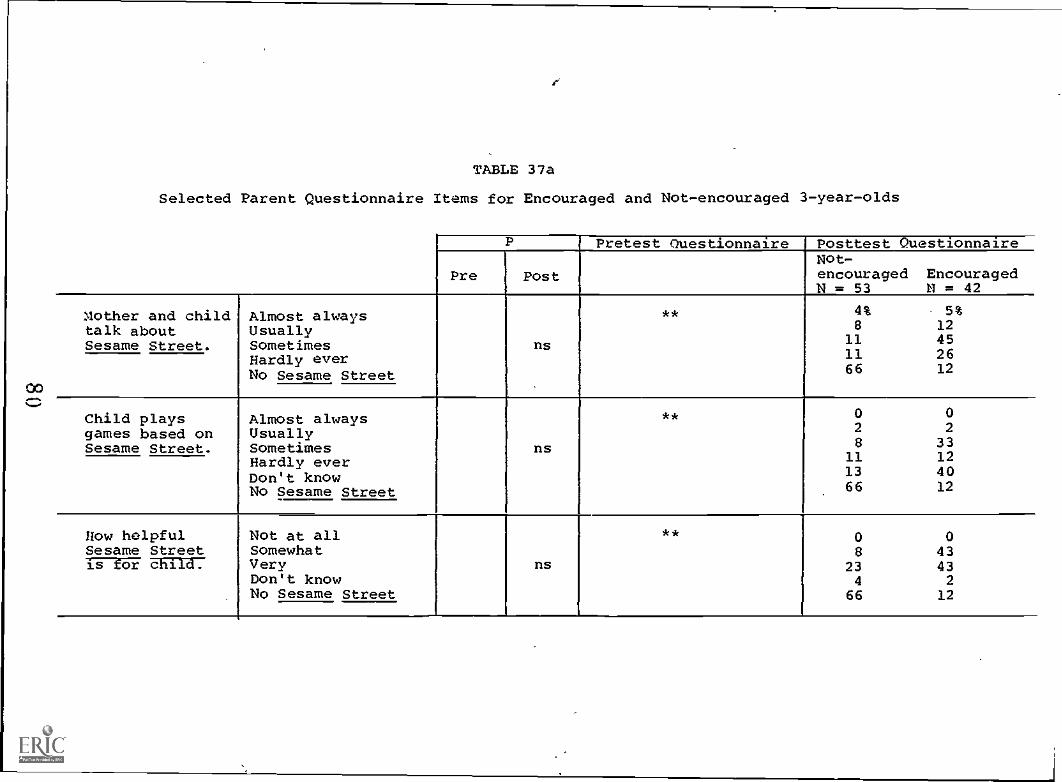
TABLE 37a
Selected Parent Questionnaire Items for Encouraged and Not-encouraged 3-year-olds
P Pretest Questionnaire Posttest Questionnaire
Pre PostNot-encouraged EncouragedN = 53 N = 42
Mother and child Almost always ** 4% , 5%
talk about Usually 8 12
Sesame Street. Sometimes ns 11 45
Hardly ever 11 26
No Sesame Street 66 12
Child plays Almost always ** 0 0
games based on Usually 2 2
Sesame Street. Sometimes ns 8 33
Hardly ever 11 12
Don't know 13 40
No Sesame Street 66 12
How helpful Not at all ** 0 0Sesame Street Somewhat 8 43is for child. Very ns 23 43
Don't know 4 2No Sesame Street 66 12
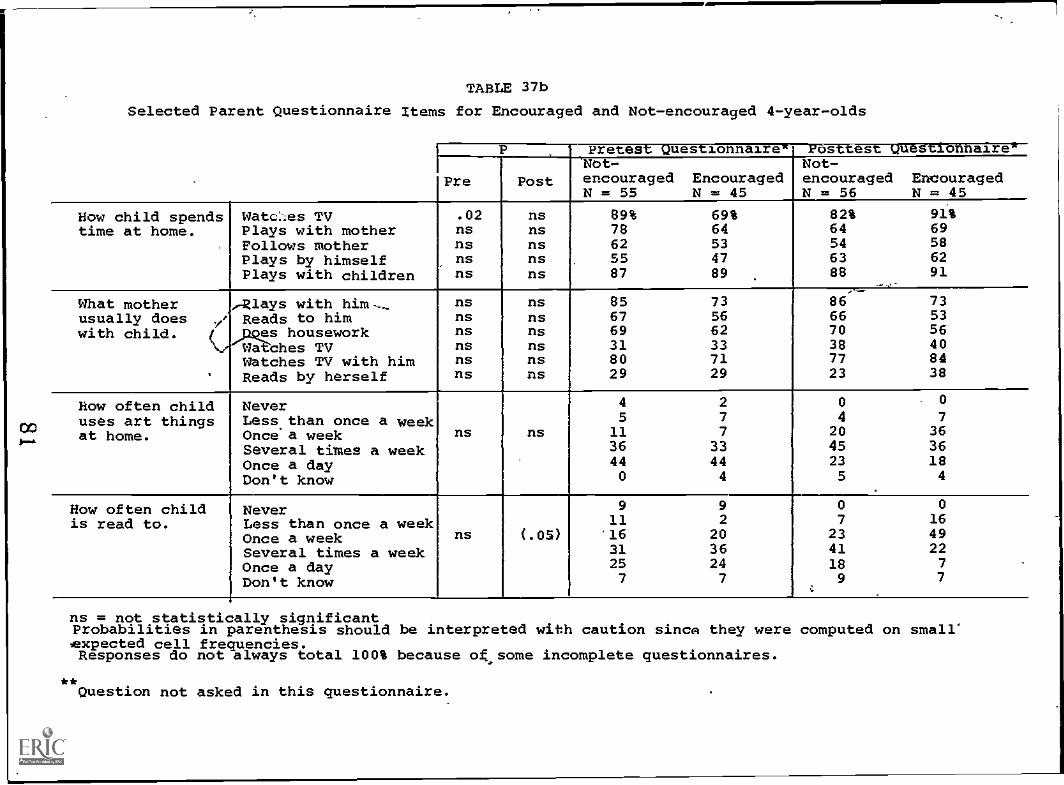
TABLE 37b
Selected Parent Questionnaire Items for Encouraged and Not-encouraged 4-year-olds
P----"Nbt-
' Pretest Questionnaire" POsttest QuestionnaireIf
Pre Post encouragedN = 55
EncouragedN = 45
Not-encouragedN = 56
EncouragedN = 45
How child spends Watc:-les TV .02 ns 89% 69% 82% 91%time at home. Plays with mother ns ns 78 64 64 69
Follows mother ns ns 62 53 54 58Plays by himself ns ns 55 47 63 62
Plays with children ns ns 87 89 88 91
What mother Rlays with htm-__ ns ns 85 73 86 73usually does ./ Reads to him ns ns 67 56 66 53
with child. es housework ns ns 69 62 70 56
Wa ches TV ns ns 31 33 38 40Watches TV with him ns ns 80 71 77 84
' Reads by herself ns ns 29 29 23 38
How often child Neverf
.
4 2 0 0
uses art things Less than once a week 5 7 4 7
at home. Once a week ns ns 11 7 20 36
Several times a week 36 33 45 36
Once a day 44 44 23 18
Don't know 0 4 5 4
How often child Never 9 9 0 0
is read to. Less than once a week 11 2 7 16
Once a week ns (.05) '16 20 23 49
Several times a week 31 36 41 22
Once a day 25 24 18 7
Don't know 7 7,:
9 7
ns = not statistically significantProbabilities in parenthesis should be interpreted with caution since they were computed on small'expected cell frequencies.Responses do not always total 100% because of.some incomplete questionnaires.
**Question not asked in this questionnaire.
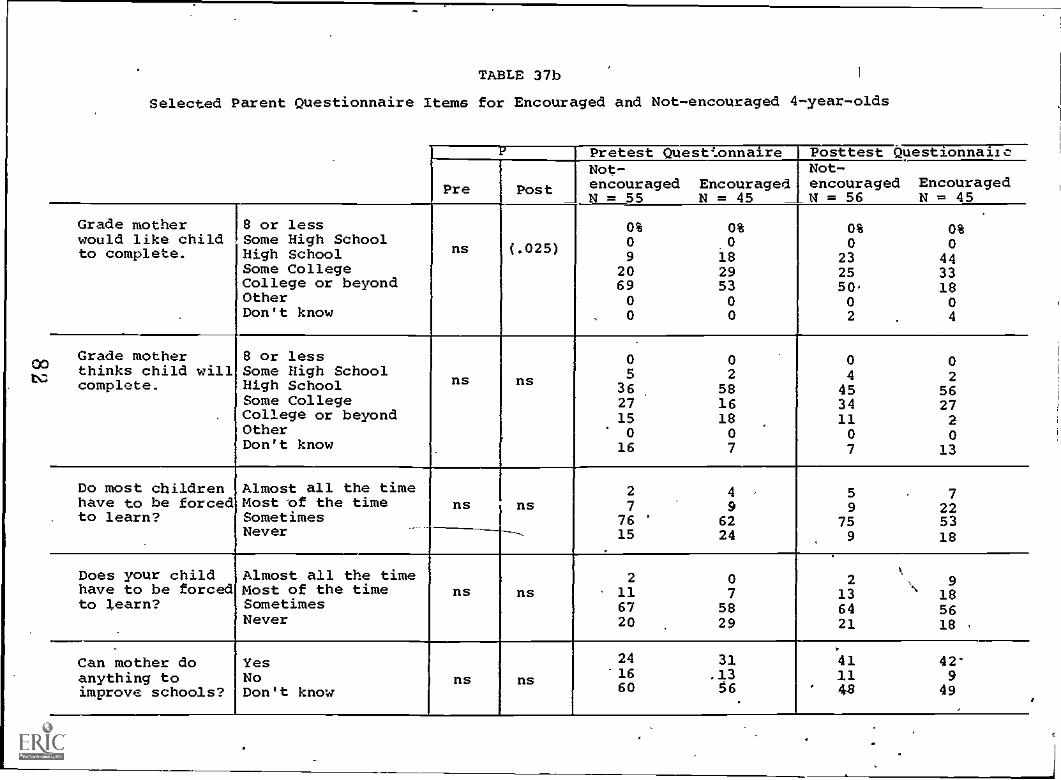
TABLE 37b 1
Selected Parent Questionnaire Items for Encouraged and Not-encouraged 4-year-olds
P Pretest Questionnaire Posttest Questionnaire
Pre Post
Not-encouragedN = 55
EncouragedN = 45
Not-encouragedN = 56
EncouragedN = 45
Grade motherwould like childto complete.
8 or lessSome High SchoolHigh SchoolSome CollegeCollege or beyondOtherDon't know
ns (.025)
0%0
9206900
0%0
18
295300
0%0
232550,02
0%0
44331804
Grade motherthinks child willcomplete.
.
8 or lessSome High SchoolHigh SchoolSome CollegeCollege or beyondOtherDon't know
ns ns
r
05
3627150
16
02
58161807
04
45341107
02
562720
13
Do most childrenhave to be forcedto learn?
Almost all the timeMost of the timeSometimesNever
ns27
7615
'
4 ,
96224
5
975
9
7225318
Does your childhave to be forcedto learn?
Almost all the timeMost of the timeSometimesNever
ns ns2
116720
07
5829
2136421
,
1g
185618 ,
-
Can mother doanything toimprove schools?
YesNoDon't know
ns ns
24-1660
31.1366
.
*411148
42'9
49
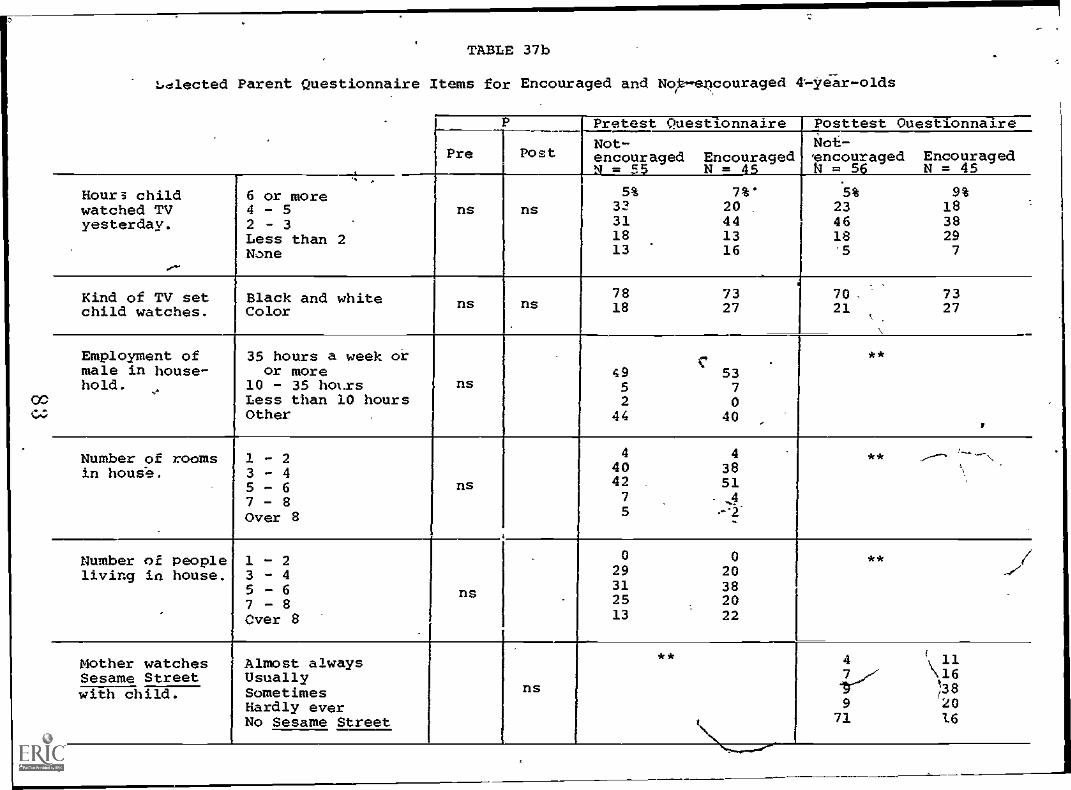
TABLE 37b
Ldlected Parent Questionnaire Items for Encouraged and No-encouraged 4- year -olds
.
P Pretest Questionnaire Posttest Ouestlonnaire
Pre PostNot- Not-encouraged Encouraged encouraged EncouragedN_ c5 N = 45 N = 56 N = 45
Hours childwatched TVyesterday.
6 or more4 - 52 - 3Less than 2None
ns ns5% 7%*
32 2031 4418 1313 16
5% 9%23 1846 3818 295 7
Kind of TV setchild watches.
Black and whiteColor
ns ns78 7318 27
70. 7321 27
Employment ofmale in house-hold.
35 hours a week oror more
10 - 35 hoLrsLess than 10 hoursOther .
ns
i49 535 72 0
44 40
**
l
Number of roomsin hous4.
1 - 23 - 45 -7 - 8Over 8
4 440 3842 517 -45
** ,-...._\
Number of peopleliving in house.
1 - 23 - 45 - 67 - 8Over 8
ns
0 029 2031 3825 2013 22
** /..../
Mother watchesSesame Street
Almost alwaysUsuallySometimesHardly everNo Sesame Street
ns
**
\
4(
11
g7r-V.
\16)
?g9 271 1.6
with child.
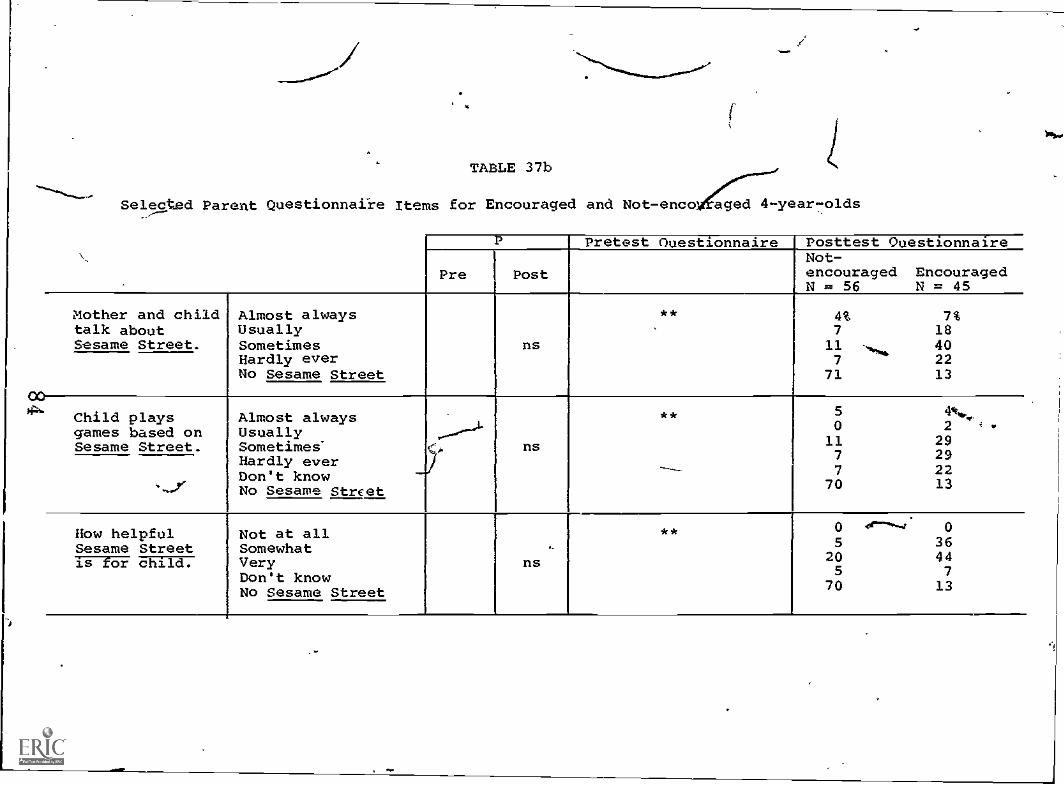
TABLE 37b
Selected Parent Questionnai-re Items for Encouraged and Not-enco aged 4-year-olds
`_
P Pretest Ouestionnaire Posttest Questionnaire
Pre PostNot-encouragedN = 56
EncouragedN = 45
Mother and childtalk aboutSesame Street.
Almost alwaysUsuallySometimesHardly everNo Sesame Street
ns
** 4%7
117
71
-..,...
7%18402213
t
Child playsgames based onSesame Street.
Almost alwaysUsuallySometimes'Hardly everDon't knowNo Sesame Street
ns
**
---
01177
70
4 21k'",i .
29292213-....,
How helpfulSesame Street
Not at allSomewhatVeryDon't knowNo Sesame Street
,
ns
** 05
205
70
44. 1 036447
13
IT-T3F child.
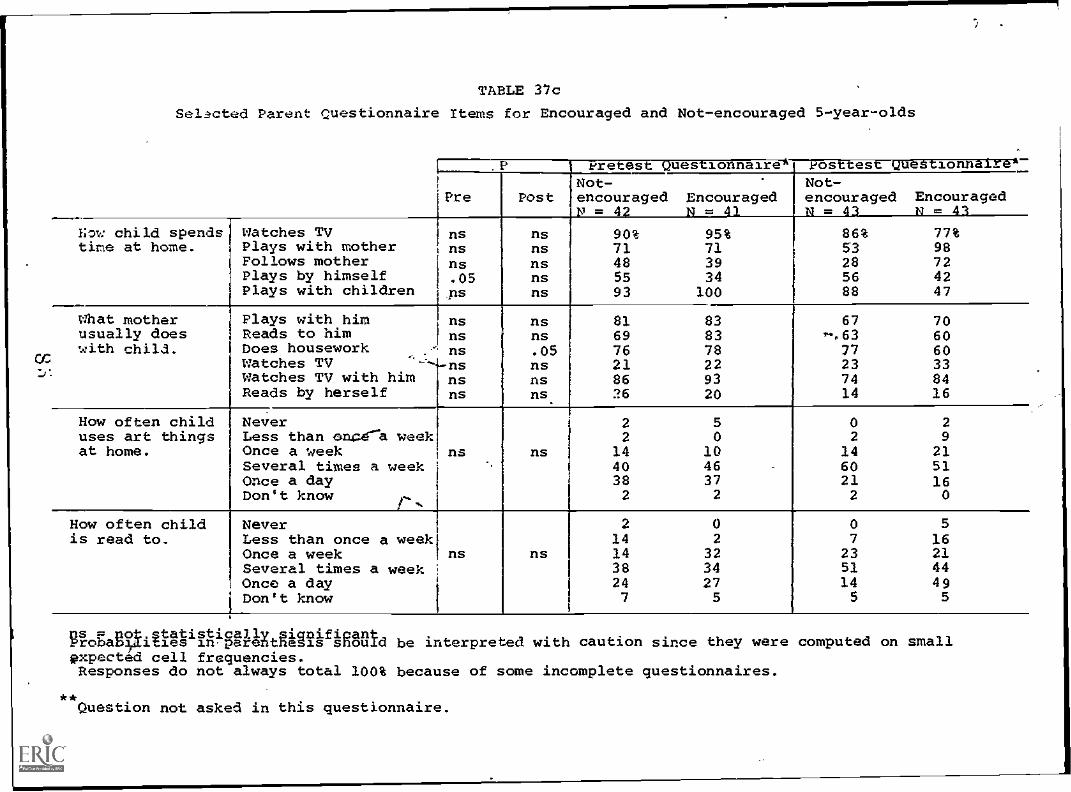
ccJ.
TABLE 37c
Selected Parent Questionnaire Items for Encouraged and Not-encouraged 5-year-olds
Pretest Questionnaires Posttest Questionnaire
Pre PostNot-encouragedV = 42
EncouragedN = 41
Not-encouragedN = 43
EncouragedN = 4I______
1
Eow child spends Watches TV ns ns 90% 95% 86% 77%time at home. Plays with mother ns ns 71 71 53 98
Follows mother ns ns 48 39 28 72Plays by himself .05 ns 55 34 56 42Plays with children As ns 93 100 88 47
what mother Plays with him ns ns 81 83 67 70usually does Reads to him ns ns 69 83 '-.63 60with child. Does housework ns .05 76 78 77 60
Watches TV ns 21 22 23 33Watches TV with him ns ns 86 93 74 84Reads by herself ns ns 26 20 14 16
How often child Never 2 5 0 2uses art things Less than en .a week 2 0 2 9at home. Once a week ns ns 14 10 14 21
Several times a week 40 46 60 51Once a day 38 37 21 16
knowDon't..
2 2 2 0
How often child Never 2 0 0 5is read to Less than once a week 14 2 7 16
Once a week ns ns 14 32 23 21Several times a week 38 34 51 44Once a day 24 27 14 49Don't know 7 5 5 5
s ok.statisticallv sianificantProban hies inparentnesis snows] be interpreted with caution since they were computed on smallexpected cell frequencies.Responses do not always total 100% because of some incomplete questionnaires.
**Question not asked in this questionnaire.
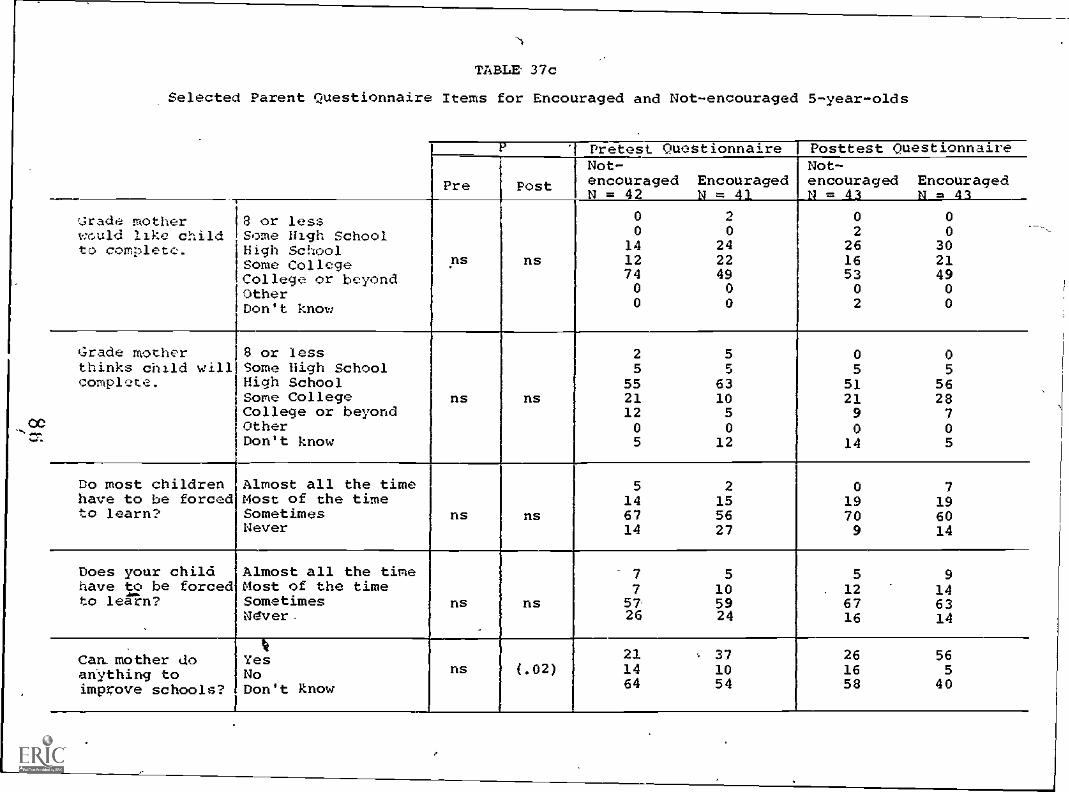
TABLE- 37c
Selected Parent Questionnaire Items for Encouraged and Not-encouraged 5-year-olds
P Pretest Questionnaire Posttest Questionnaire
Pre Post
Not-encouragedN = 42
EncouragedN = 41
Not-encouragedN = 43
EncouragedN = 41_
Grade mother 8 or less 0 2 0 0
wrsuld like child Some High School 0 0 2 0
to complete. High School 14 24 26 30
Some College Ps ns 12 22 16 21
College or beyond 74 49 53 49
Other 0 0 0 0
Don't know 0 0 2 0
Grade mother 8 or less 2 5 0 0thinks child will Some High School 5 5 5 5complete. High School 55 63 51 56
Some College ns ns 21 10 21 28College or beyond 12 5 9 7Other 0 0 0 0Don't know 5 12 14 5
Do most children Almost all the time 5 2 0 7have to be forced Most of the time 14 15 19 19to learn? Sometimes ns ns 67 56 70 60
Never 14 27 9 14
Does your child Almost all the time 7 5 5 9have to be forced Most of the time 7 10 12 14to learn? Sometimes ns ns 57. 59 67 63
.
N4ver..
26 24 16 14
Can mother do Yes 21 37 26 56
anything to No ns (.02) 14 10 16 5
improve schools? Don't know 64 54 58 40
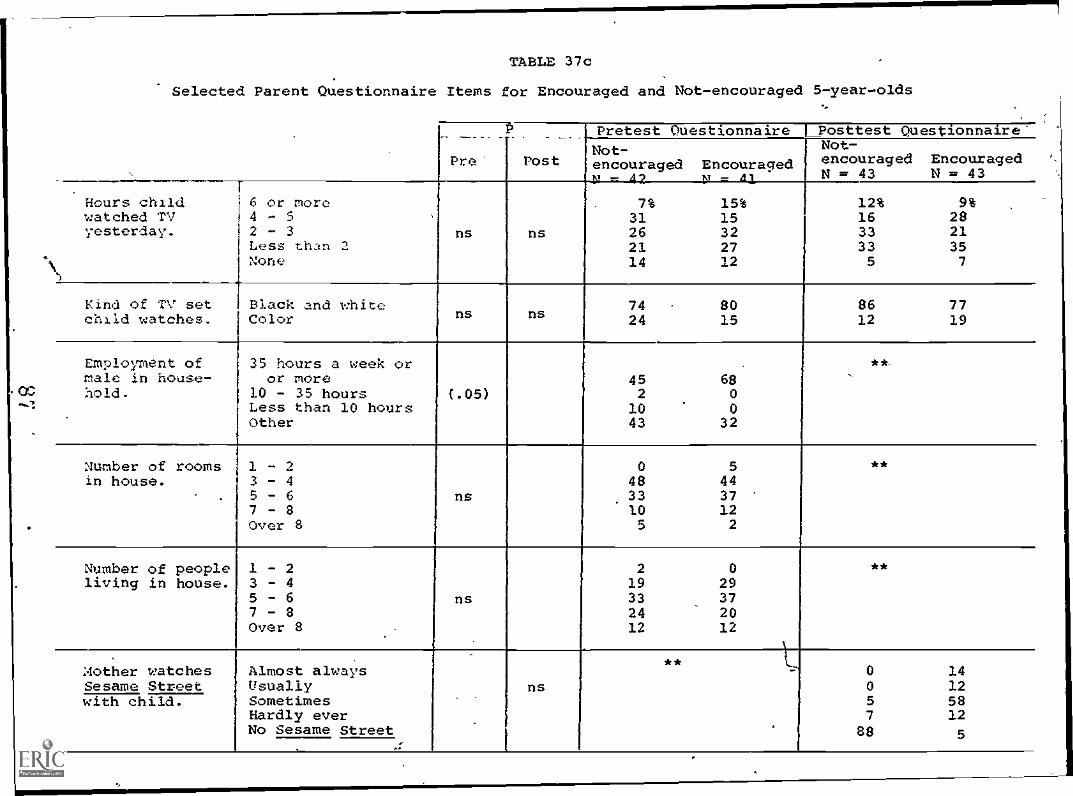
TABLE 37c
Selected Parent Questionnaire Items for Encouraged and Not-encouraged 5-year.-olds...
Pre' Post
Pretest Questionnaire Posttest QuestionnaireNot-encouraged Encouraged
J
Not-encouraged Encouraged
. T
Hours child 6 or more 7% 15% 12% 9%watched TV 4 - 5 31 15 16 28yesterday. 2 - 3 ns ns 26 32 33 21
Less than 2 21 27 33 35None 14 12 5 7
Kind of TV set Black and white 74 80 86 77chid watches. Color ns ns 24 15 12 19
Employment of 35 hours a week or **.
male in house- or more 45 68hold. 10 - 35 hours (.05) 2 0
Less than 10 hours 10 0Other 43 32
Number of rooms 1 - 2 0 5 **
in house. 3 - 4 48 44' . 5 - 6 ns 33 37
7 - 8 10 12Over 8 5 2
Number of people 1 - 2 2 0 **
living in house. 3 - 4 19 295 - 6 ns 33 377 - 8 24 20Over 8
.12 12
. . **Aother watches Almost always 0 14Sesame Street Usually ns 0 12with child. Sometimes 5 58
Hardly ever 7 12No Sesame Street 88 5
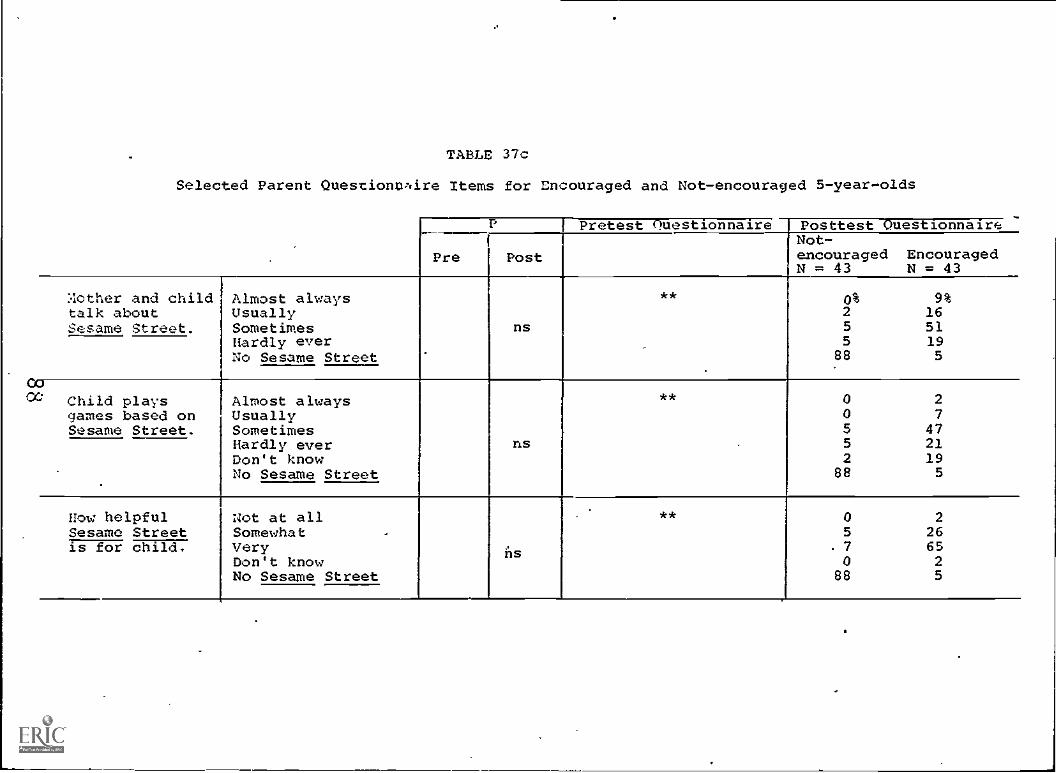
.IN TABLE 37c
Selected Parent Questiehnxtire Items for Encouraged and Not-encouraged 5-year-olds
Pretest Questionnaire Posttest Questionnaire
Pre PostNot-encouragedN = 43
EncouragedN = 43
:;other and child Almost always ** 0% 9%talk about Usually 2 16Sesame Street. Sometimes ns 5 51
Hardly ever 5 19No Sesame Street 88 5
J
Child plays Almost always ** 0 2
games based on Usually 0 7
Sesame Street. Sometimes 5 47Hardly ever ns 5 21Don't know 2 19No Sesame Street 88 5
How helpful Not at all ** 0 2
Sesame Street Somewhat - 5 26is for child. Very 7 65
Don't knowns
0 2No Sesame Street 88 5
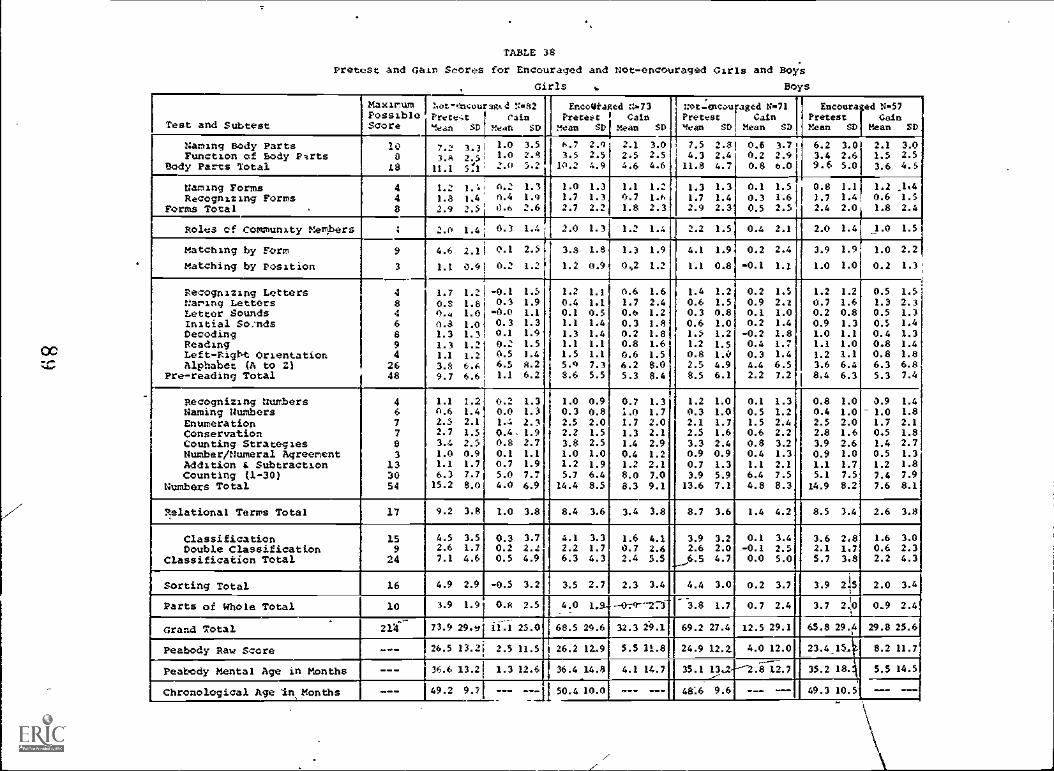
TABLE 3$
Pretest and Gain Scores for Encouraged and Not-encouraged Girls and Boys
Girls Boys
Test and Subtest
MaxirumPossibleScore
I Net-cneeurucd S82Prece,.z 1 rainmean SD mean SD
EneoUtasedPreter.c
Mean SD
SA73P Cainmean SR
Sot-EnecAlraged N-71Pretest Cain'lean SD Mean SD
EncouraPretest!lean SD
ed N-57 1
GainMean SD
Naming Body PartsFunction of Body Prts
Body Parts Total
100
ie
7,2 3,31 1.0 3.53.,1 2.s : 1.0 2.4
II./ sfi: Z.0 5.2
h.7 2.93.5 2.S
10.2 4.9
2.1 3.02.5 2.54.6 4.6
7.5 2.34.3 2.4
11.8 4.7
0.6 3.70.2 2.90.8 6.0
6.2 3.03.4 2.69.6 5.0
2.! 3.01.5 2.53.6 4.5
tItuning FormsRecognizing Forms
Forms Total'
448
1.2 1.: 0.2 1.31.3 1.4 0.4 1.92.9 2.; 0.6 2.6
1.0 1.31.7 1.32.7 2.2
1.1 1.29.7 1.61.8 2.3
1.3 1.31.7 1.42.9 2.3
0.1 1.50.3 1.60.5 2.5
0.8 1.11.7 1.42.4 2.0
1.2 ,1.40.6 1.51.8 2.4
Role:5 of Community Members I1
2.0 1.4 i 0-3 1.4 2.0 1.3 1.2 1.4 2.2 1.5 0.4 2.1 2.0 1.4 J.0 1.5
Matching by Form
Matching by Position
9
3
4.6 2./1 0.1 2.51.1 0.9' 0.2 1.2
3.3 1.81.2 0.9
1.3 1.90,2 1.2
4.1 1.91.1 0.8
0.2 2.4-0.1 1.1
3.9 1.91.0 1.0
1.0 2.20.2 1.3
ReOognizing LettersNaming LettersLettor SoundsInitial SoundsDecodingReadingLeft-Rigbt OrientationAlphabet (A to 2)
Pre- reading Total
1846894
2648
1.7 1.20.s 1.80.<, 1.00.3 1.01.3 1.31.3 1.21.1 1.23.8 6.69.7 8.8
-0.! 1.50.3 1.9
-0.0 1.10.3 1.30.1 1.90..2 1.50.5 1.46.5 A.21.1 6.2
1.2 1.1 0.6 1.60.4 1,1 1.7 2.40.1 0.5 0.6 1.21.1 1.4 0.3 1.81.3 1.4 0.2 1.81.! 1.1 0.8 1.61.5 1.1 0.6 1.55.9 7.3 6.2 8.03.6 5.5 5.3 8.4
1.4 1.20.6 1.50.3 0.80.6 1.01.5 1.21.2 1.50.8 1.02.5 4.98.5 6.1
0.2 1.:0.9 2.20.1 1.00.2 1.4
-0.2 1.80.4 1.70.3 1.44.4 6.52.2 7.2
1.2 1.20.7 1.60.2 0.80.9 1.31.0 1.11.1 1.01.2 1.13.6 6.4
I 8.4 6.3
0.5 1.51.3 2.30.5 1.30.: 1.40.4 1.30.8 1.40.8 1.86.3 6.85.3 7.4
Recognizing MuttersNaming NumbersEnumerationConservationCounting StrategiesNumber/Numeral AgreementAddition & SubtractionCounting (1-30)
Numbers Total
467703
133054
1.1 1.2A.6 1.42.5 2.12.7 1.53.4 2.51.0 0.91.1 1.76.3 7.7
15.2 8.0
0.2 1.30.0 1.31.4 2.30.4. 1.90.8 2.70.! 1.!0.7 1.95.0 7.74.0 6.9
1.0 0.9 0.7 1.30.3 0.8 i.0 1.72.5 2.0 I.7 2.02.2 1.5 1.3 2.13.8 2.5 1.4 2.91.0 1.0 0.4 1.21.2 1.9 1.2 2.15.7 6.4 8.0 7.0
14.4 8.5 8.3 9.1
1.2 1.00.3 1.02.1 1.72.5 1.63.3 2.40.9 0.90.7 1.33.9 5.9
13.6 7.1
0.1 1.30.5 1.21.5 2.40.6 2.20.8 3.20.4 1.31.1 2.16.4 7.54.8 8.3
0.8 1.00.4 1.02.5 2.02.8 1.63.9 2.60.9 1.01.1 1.75.1 7.5
14.9 8.2
0.9 1.41.0 1.81.7 2.10.5 1.81.4 2.70.5 1.31.2 1.87.4 7.97.6 8.1
Relational Terms Total 1'7 9.2 3.8 1.0 3.8 8.4 3.6 3.4 3.8 8.7 3.6 1.4 4.21
8.5 3.4 2.6 3.8
ClassificationDouble CLassification
Classification Total
159
24
4.5 3.52.6 1.77.1 4.6
0.3 3.70.2 2.t0.5 4.9
4.1 3.3 1.6 4.12.2 1.7 0.7 2.66.3 4.3 2.4 5.5
3.9 3.22.6 2.0
_...-6.5 4.7
0.1 3.4-0.1 2.50.0 5.0
3.6 2.82.1 1,75.7 3,8
1.6 3.00.6 2.32.2 4.3
Sorting Total 16 4.9 2.9 -0.5 3.2 3.5 2.7 2.3 3.4 4.4 3.0 0.2 3.7 3.9 215 2.0 3.4
Parts of Whole Total 10 3.9 1.9 0.8 2.5 4.0 1.9- -079---273. .
- -3.8 1.7 0.7 2.4 1
3.7 2.0 0.9 2.4
Grand TotaL 2/11- 73.9 29,N 11.1 25.0 68.5 29.6 32.3 29.1 69.2 27.4 12.5 29.1 65.8 29.4 29.8 25.6
Peabody Raw Score -- -- 26.5 13.2 2.5 11.5 26.2 11.9 5.5 U.S 24.9 12.2 4.0 12.0 23.4 15.. 8.2 11.7
Peabody Mental Age in Months --- 36.6 13.2 1.3 12.6 36.4 14.8 4.1 14.7 35.1 13.2---2.8--- 12.7 35.2 18. 5.5 14.5
--- ---Chronological Age in Months --- 49.2 9.71 --- -- -1 50.4 10.0 --- --- 48,6 9.6 --- --- 49.3 10.5
z
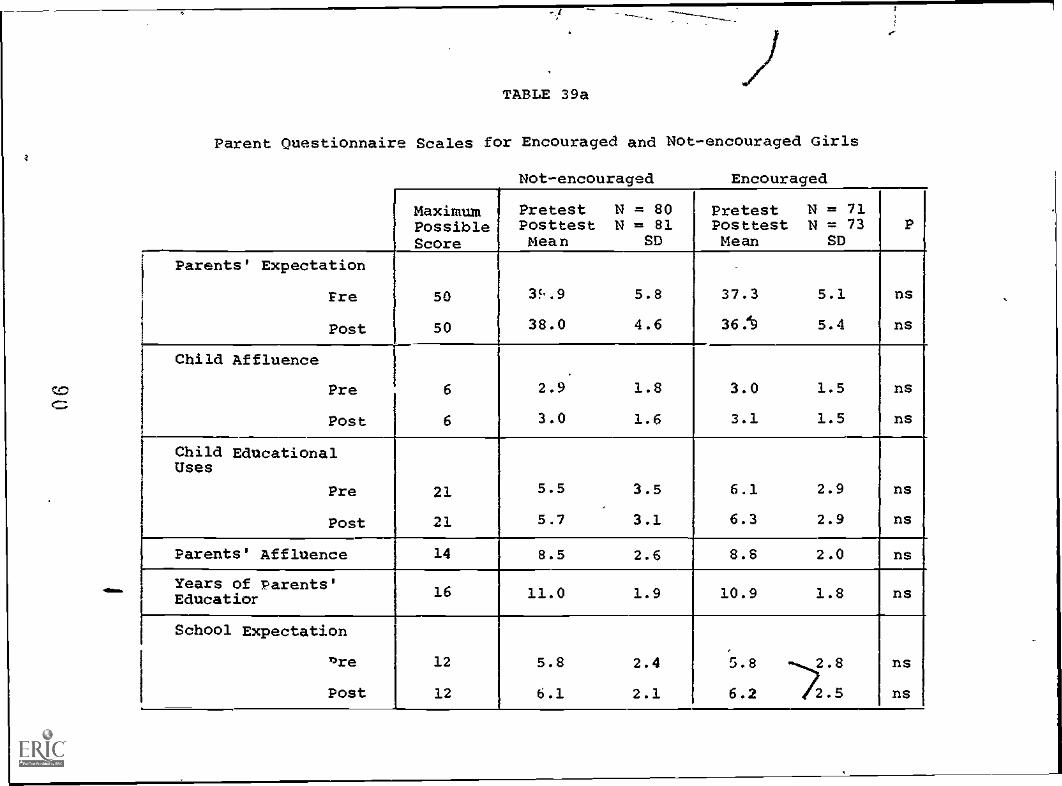
TABLE 39a
Parent Questionnaire Scales for Encouraged and Not-encouraged Girls
Not-encouraged Encouraged
MaximumPossibleScore
Pretest N = 80Posttest N = 81Mean SD
Pretest N = 71Posttest N = 73Mean SD
P
Parents' Expectation
Fre 50 35,.9 5.8 37.3 5.1 ns
Post 50 38.0 4.6 36.h1 5.4 ns
Child Affluence
Pre 6 2.9 1.8 3.0 1.5 ns
Post 6 3.0 1.6 3.1 1.5 ns
Child EducationalUses
Pre 21 5.5 3.5 6.1 2.9 ns
Post 21 5.7 3.1 6.3 2.9 ns
Parents' Affluence 14 8.5 2.6 8.8 2.0 ns
Years of Parents'Education 16 11.0 1.9 10.9 1.8 ns
School Expectation
'ire 12 5.8 2.4 5.8 2.8 ns
Post 12 6.1 2.1 6.2 4/2.5 ns
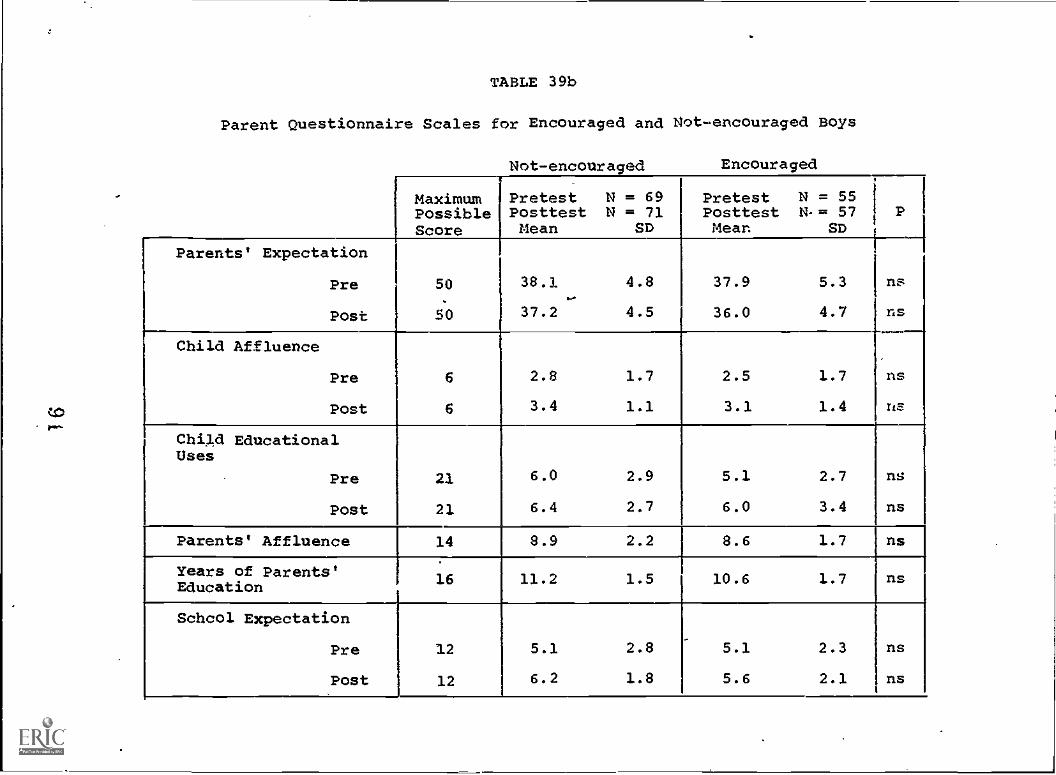
TABLE 39b
Parent Questionnaire Scales for Encouraged and Not-encouraged Boys
Not-encouraged Encouraged
MaximumPossibleScore
Pretest N = 69Posttest N = 71Mean SD
Pretest N = 55Posttest N-= 57Mean SD
P
Parents' Expectation
Pre 50 38.1 4.8 37.9 5.3 ns
Post 50 37.2 4.5 36.0 4.7 ns
Child Affluence
Pre 6 2.8 1.7 2.5 1.7 ns
Post 6 3.4 1.1 3.1 1.4 us
Child EducationalUses
Pre 21 6.0 2.9 5.1 2.7 ns
Post 21 6.4 2.7 6.0 3.4 ns
Parents' Affluence 14 8.9 2.2 8.6 1.7 ns
Years of Parents'Education 16 11.2 1.5 10.6 1.7 ns
School Expectation
Pre 12 5.1 2.8 5.1 2.3 ns
Post 12 6.2 1.8 5.6 2.1 ns
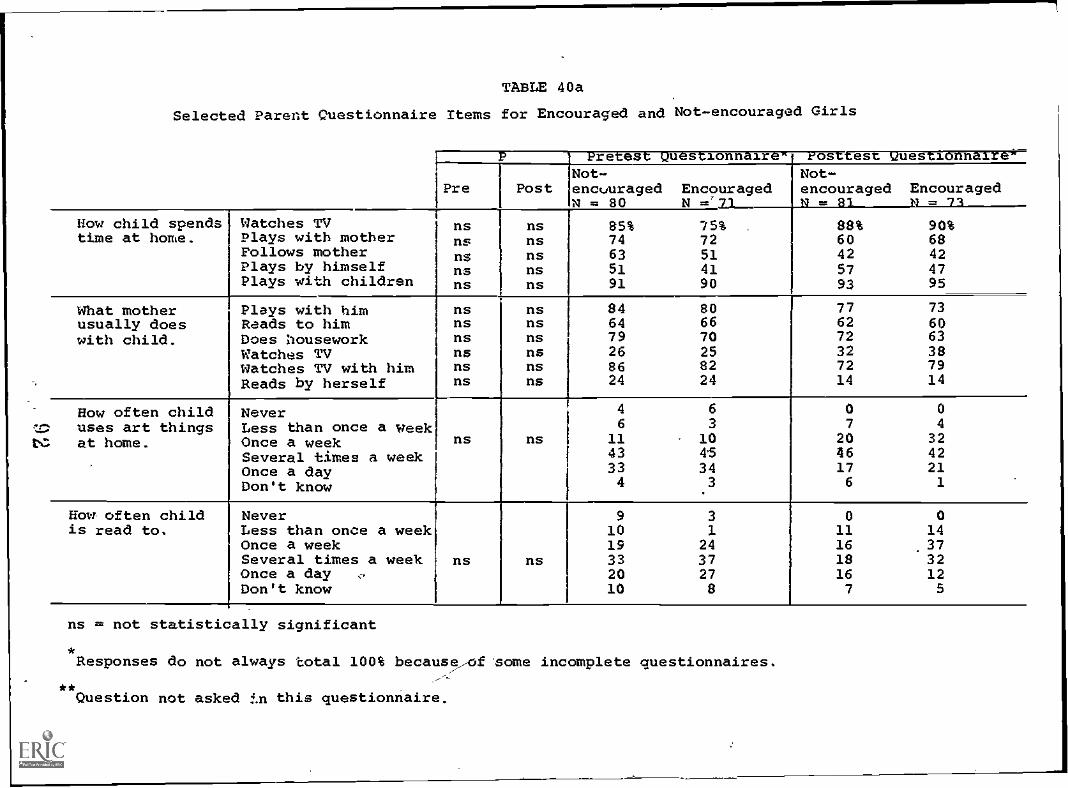
TABLE 40a
Selected Parent Questionnaire Items for Encouraged and Not-encouraged Girls
P Pretest Questionnaire'; rosttest Questionnaire-
Pre PostNot-encouragedN = 80
EncouragedN =-71
Not-encouragedN = 81
EncouragedN = 71
How child spends Watches TV ns ns 85% 75% 88% 90%time at home. Plays with mother ns ns 74 72 III 60 68
Follows mother ns ns 63 51 42 42Plays by himself ns ns 51 41 57 47Plays with children ns ns 91 90 93 95
J
What mother Plays with him ns ns 84 80 77 73usually does Reads to him ns ns 64 66 62 60with child. Does housework ns ns 79 70 72 63
Watches TV ns ns 26 25 32 38Watches TV with him ns ns 86 82 72 79
Reads by herself ns ns 24 24 14 14
How often child Never 4 6 0 0
uses art things Less than once a week 6 3 7 4
at home. Once a week ns ns 11 10 20 32
Several times a week 43 45 46 42
Once a day 33 34 17 21
Don't know 4 3 6 1
how often child Never 9 3 0 0is read to. Less than once a week 10 1 11 14
Once a week 19 24 16 .37Several times a week ns ns 33 37 18 32Once a day ; 20 27 16 12Don't know 10 8 7 5
ns = not statistically significant
Responses do not always total 100% because--of Some incomplete questionnaires.
**Question not asked tn this questionnaire.
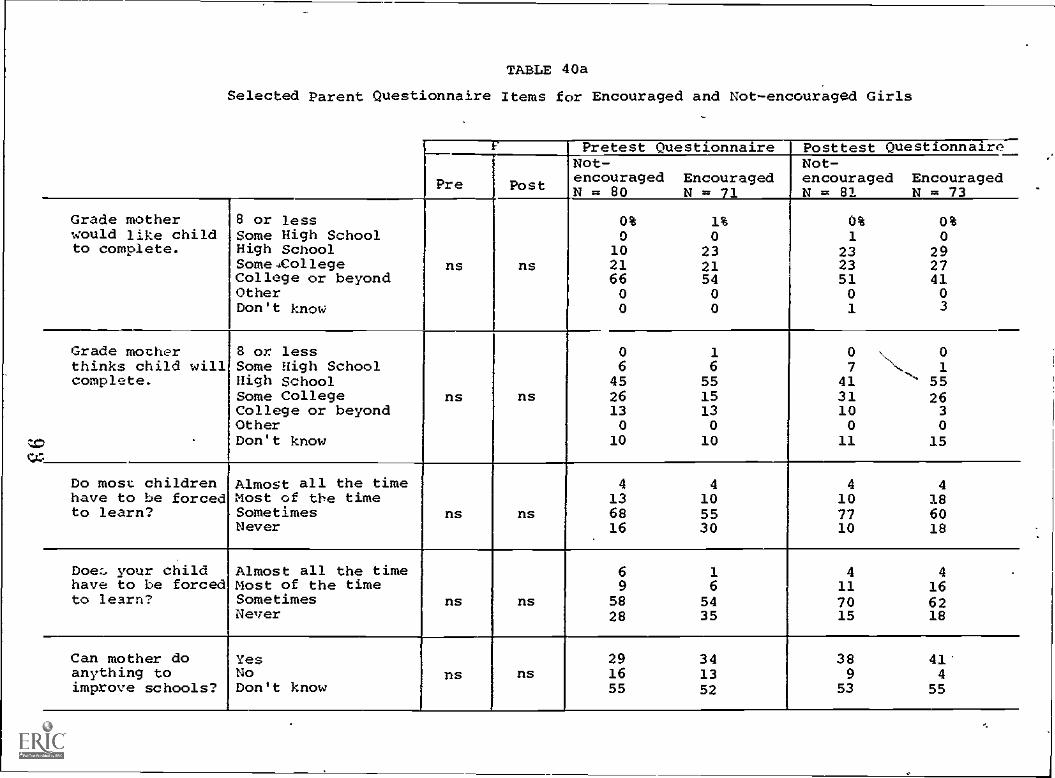
TABLE 40a
Selected parent Questionnaire Items for Encouraged and Not-encouraged Girls
Pretest Questionnaire Posttest Questionnaire
Pre Post
Not-encouragedN = 80
EncouragedN = 71
Not-encouragedN = 81
EncouragedN = 73
Grade mother 8 or less 0% 1% 0% 0%would like child Some High School 0 0 1 0to complete. High School 10 23 23 29
Some.College ns ns 21 21 23 27College or beyond 66 54 51 41Other 0 0 0 0Don't know 0 0 1 3
Grade mother 8 or less 0 1 0 \ 0thinks child will Some High School 6 6
\''complete. High School 45 55 41 5tSome College ns ns 26 15 31 26College or beyond 13 13 10 3Other 0 0 0 0
r - Don't know 10 10 11 15
Do most children Almost all the time 4 4 4 4have to be forced Most of the time 13 10 10 18to learn? Sometimes ns ns 68 55 77 60
Never 16 30 10 18
Doe:, your child Almost all the time 6 1 4 4 -
have to be forced Most of the time 9 6 11 16to learn? Sometimes ns ns 58 54 70 62
Never 28 35 15 18
Can mother do Yes 29 34 38 41'anything to No ns ns 16 13 9 4improve schools? Don't know 55 52 53 55
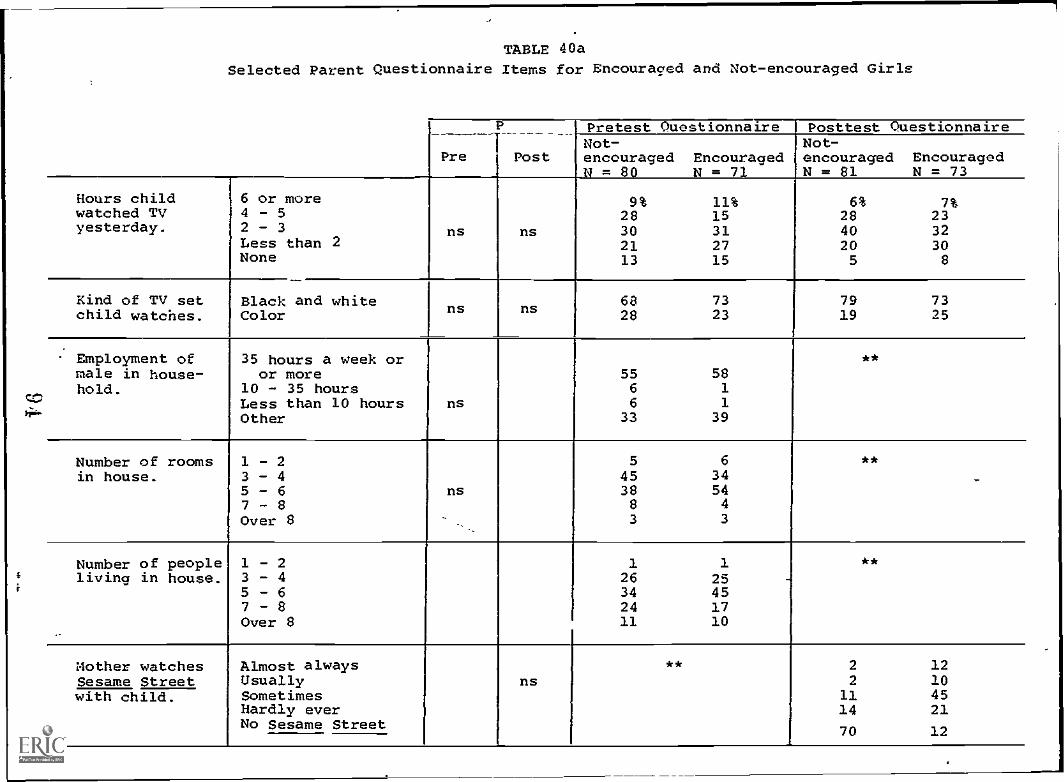
TABLE 40a
Selected Parent Questionnaire Items for Encouraged and Not-encouraged Girls
P
Pre Post
Pretest Questionnaire Posttest QuestionnaireNot-encouragedN = 80
EncouragedN = 71
Not-encouragedN = 81
EncouragedN = 73
Hours child 6 or more 9% 11% 6% 7%watched TV 4 - 5 28 15 28 23yesterday. 2 - 3 ns ns 30 31 40 32
Less than 2 21 27 20 30None 13 15 5 8
Kind of TV set Black and white 68 73 79 73child watches. Color ns ns
28 23 19 25
Employment of 35 hours a week or **
male in house- or more 55 58hold. 10 - 35 hours 6 1
Less than 10 hours ns 6 1
Other 33 39
Number of rooms 1 - 2 5 6 **
in house. 3 - 4 45 345 - 6 ns 38 547 - 8Over 8 ,
8
3
4
30
Number of people 1 - 2 1 1 **living in house. 3 - 4 26 25 .
5 - 6 34 457 - 8 24 17Over 8 11 10
Mother watches Almost always ** 2 12Sesame Street Usually ns 2 10with child. Sometimes 11 45
Hardly ever 14 21No Sesame Street
70 12
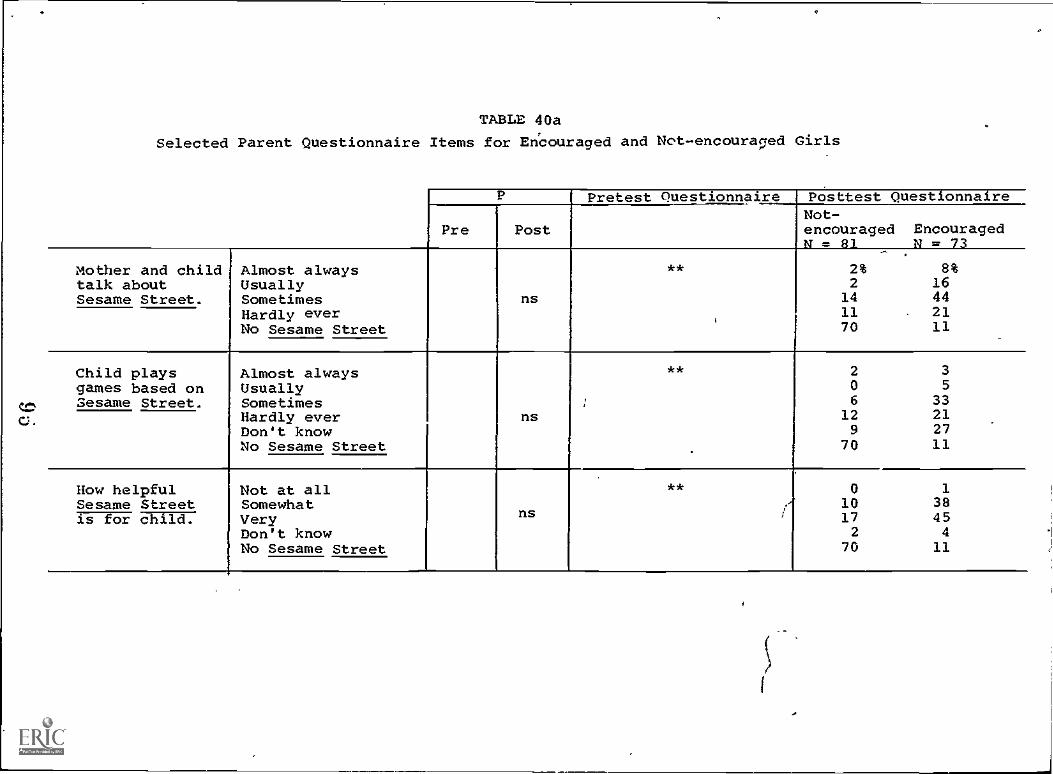
TABLE 40a
Selected Parent Questionnaire Items for EnCouraged and Not-encouraged Girls
P Pretest Questionnaire Posttest Questionnaire
Pre PostNot-encouragedN = 81
EncouragedN = 73
Mother and child Almost always ** 2% 8%talk about Usually 2 16Sesame Street. Sometimes ns 14 44
Hardly ever 11 . 21No Sesame Street 70 11
Child plays Almost always ** 2 3
games based on Usually 0 5
Sesame Street. Sometimes : 6 33Hardly ever ns 12 21Don't know 9 27No Sesame Street 70 11
How helpful Not at all ** 0 1
Sesame Street Somewhat ./ 10 38is for FHTET: Very ns I 17 45
Don't know 2 4
No Sesame Street 70 11
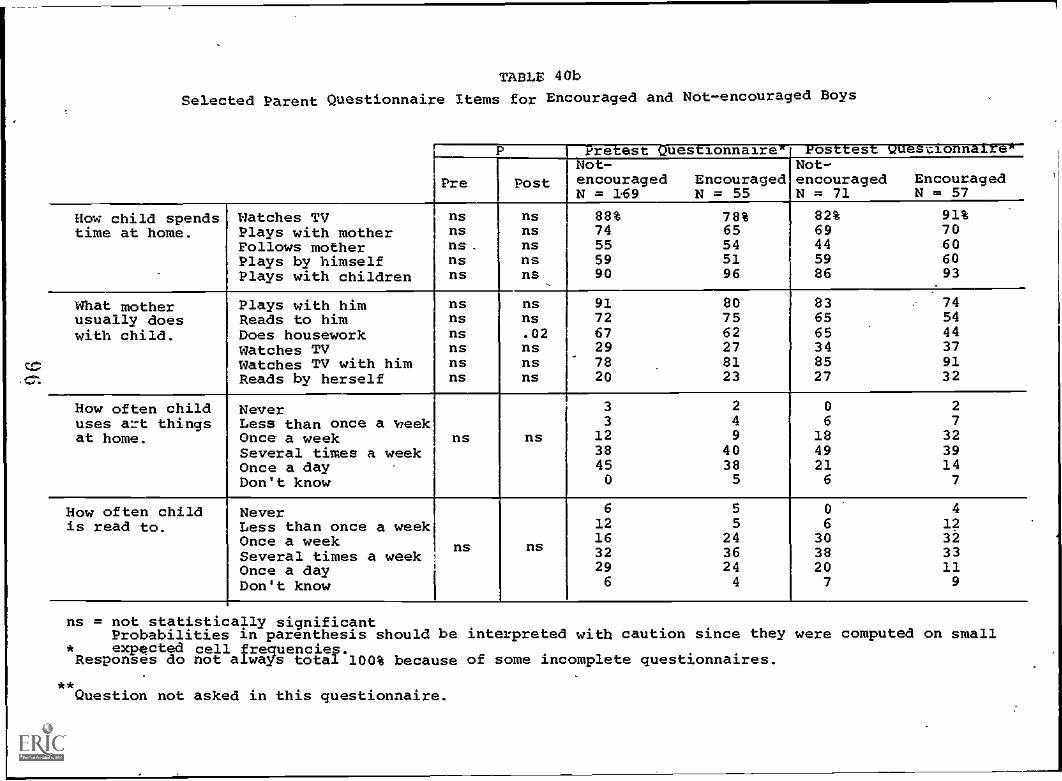
TABLE 40b
Selected Parent Questionnaire Items for Encouraged and Not-encouraged Boys
P Pretest QuestionnairewlNot-encouraged EncouragedN = 169 N = 55
Posttest Quesrionnalre-
Pre postNot-encouragedN = 71
EncouragedN = 57
How child spends Watches TV ns ns 88% 78% 82% 91%time at home. Plays with mother ns ns 74 65 69 70
Follows mother ne. ns 55 54 44 60Plays by himself ns ns 59 51 59 60
Plays with children ns ns.
90 96 86 93.
What mother Plays with him ns ns 91 80 83 74
usually does Reads to him ns ns 72 75 65 54
with child. Does housework ns .02 67 62 65 44
Watches TV ns ns 29 27 34 37Watches TV with him ns ns 78 81 85 91Reads by herself ns ns 20 23 27 32
How often child Never 3 2 0 2
uses a=t things Less than once a week 3 4 6 7
at home. Once a week ns ns 12 9 18 32
Several times a week 38 40 49 39
Once a day 45 38 21 14Don't know 0 5 6 7
How often child Never 6 5 0 4
is read to. Less than once a week 12 5 6 12
Once a week 16 24 30 32
Several times a weekns ns 32 36 38 33
Once a day 29 24 20 11Don't know 6 4 7 9
ns = not statistically significantProbabilities in parenthesis should be interpreted with caution since they were computed on smallexpected cell frequencies.
Responses do not always total 100% because of some incomplete questionnaires.
**Question not asked in this questionnaire.
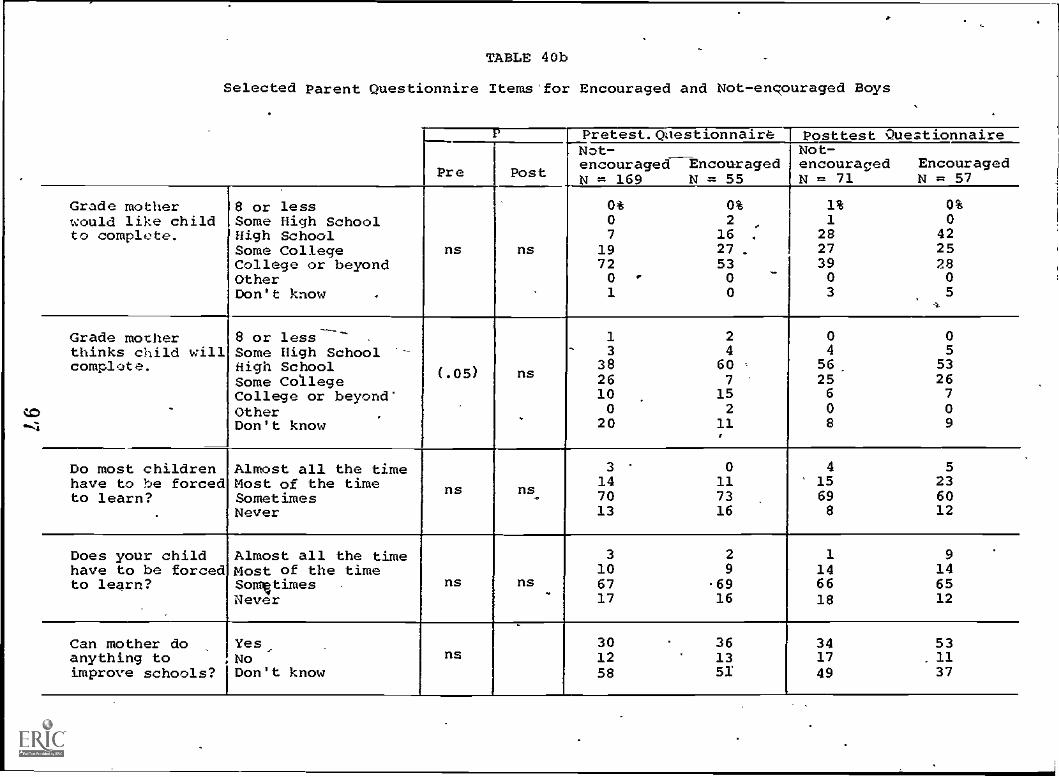
TABLE 40b
Selected Parent Questionnire Items'for Encouraged and Not-enqouraged Boys
P Pretest,Qoaestionnaire posttest Questionnaire
Pre Post
Not-encouragedtncouragedN = 169 N = 55
Not-Not -encouragedN= 71
EncouragedN = 57
Grade motherwould like childto complete.
8 or lessSome High SchoolHigh SchoolSome CollegeCollege or beyondOtherDon't know ,
ns ns
0*07
19720
1
,
0%2
27 .
530
0
.
1%1
2827390
3
0%0
4225280
5
Grade motherthinks child willcomplote.
8 or less .
Some High SchoolHigh SchoolSome CollegeCollege or beyond'OtherDon't know
(.05) ns
1- 3
382610020
24
607
152
11,
,
0
456 .
256
08
05
5326709
Do most children Almost all the timehave to be forced Most of the timeto learn? Sometimes
. Never
ns
. -
ns,
3147013
0117316
415698
5236012
Does your child Almost all the timehave to be forced Most of the timeto learn? Somlqtimes
Neverns ns
3106717
29
6916
1
146618
9.
146512
Can mother do Yes,anything to ,Noimprove schools? 'Don't know
ns301258
361351
341749
53.1137
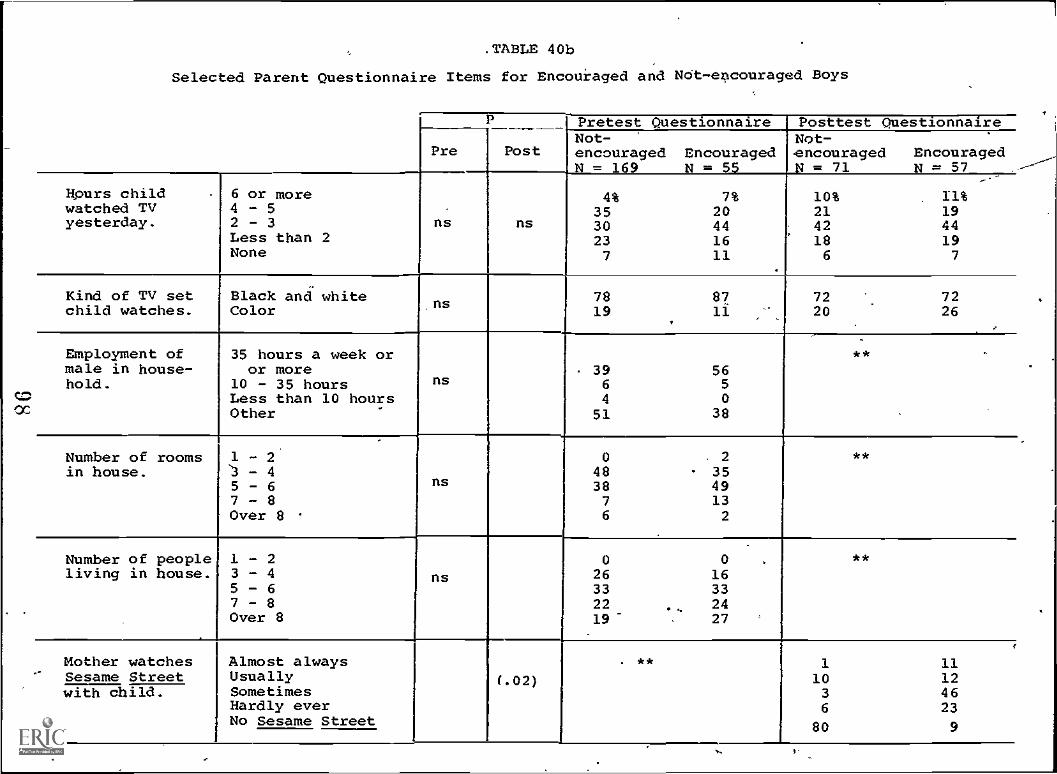
.TABLE 40b
Selected Parent Questionnaire Items for Encouiaged and Not -- encouraged Boys
Pretest Questionnaire Posttest Questionnaire
Pre PostNot-encouragedN= 169
EncouragedN= 55
Not-encouragedN= 71
EncouragedN = 57
Hpurs child 6 or more 4% 7% 10% 11%watched TV 4 - 5 35 20 21 19yesterday. 2 - 3 ns ns 30 44 42 44
Less than 2 23 16 18 19None 7 11 6 7
Kind of TV set Black and white 78 87 72 72child watches. Color ns
19.
11 20 26
Employment of 35 hours a week or ** .
male in house- or more 39 56hold. 10 - 35 hours ns 6 5
Less than 10 hours.
Other4
510
38
Number of rooms 1 - 2 0 . 2 **
in house. '3 - 4 48 355 - 6 ns 38 497 - 8 7 13Over 8 6 2
Number of people 1 - 2 0 0 **living in house. 3 - 4 ns 26 16
5 - 6 33 337 - 8 22 ... 24Over 8 19- 27
f
Mother watches Almost always ** 1 11Sesame Street Usually (.02) 10 12with child. Sometimes 3 46
Hardly ever 6 23No Sesame Street 80 9
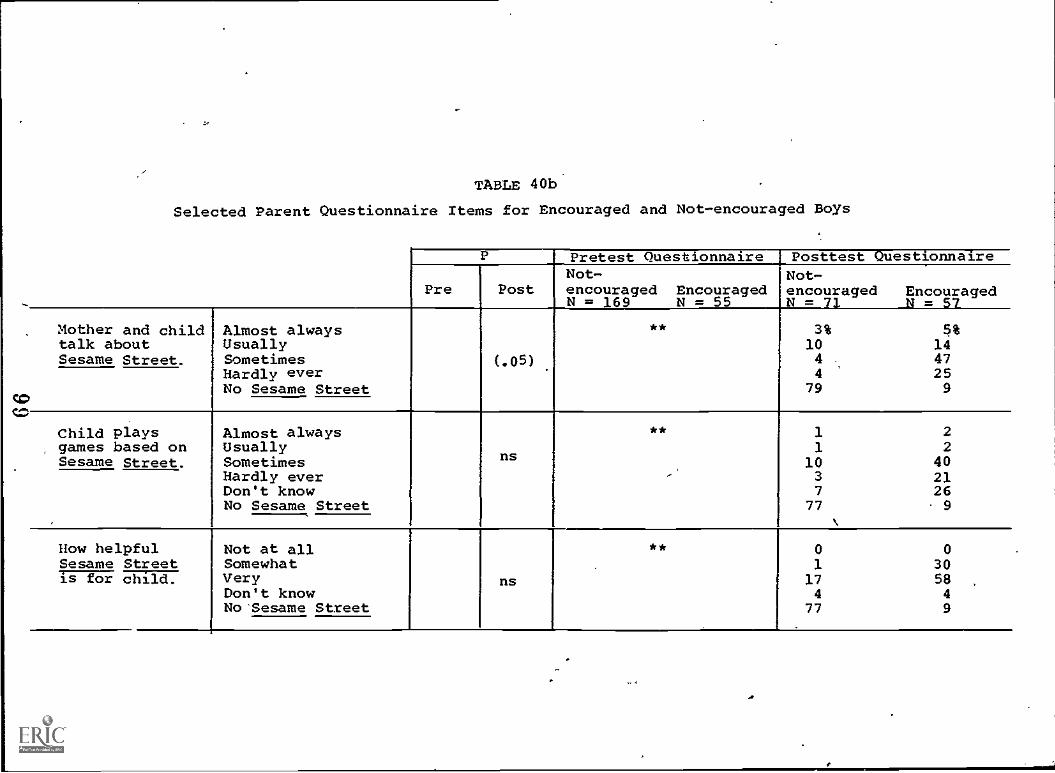
TABLE 40b
Selected Parent Questionnaire Items for Encouraged and Not-encouraged Boys
P Pretest Questionnaire Posttest Questionnaire
Pre PostNot-encouraged EncouragedN = 169 N = 55
Not-encouragedN = 71
EncouragedN = 57
Mother and child Almost always ** 3% 5%talk about Usually 10 14Sesame Street. Sometimes (.05) 4 . 47
Hardly ever 4 25No Sesame Street 79 9
Child plays Almost always ** 1 2games based on Usually 1 2Sesame Street. Sometimes ns 10 40
Hardly ever 3 21Don't know 7 26No Sesame Street 77 9
How helpful Not at all ** 0 0Sesame Street Somewhat 1 30ii-73T. child. Very ns 17 58
Don't know 4 4NoSesame Street 77 9
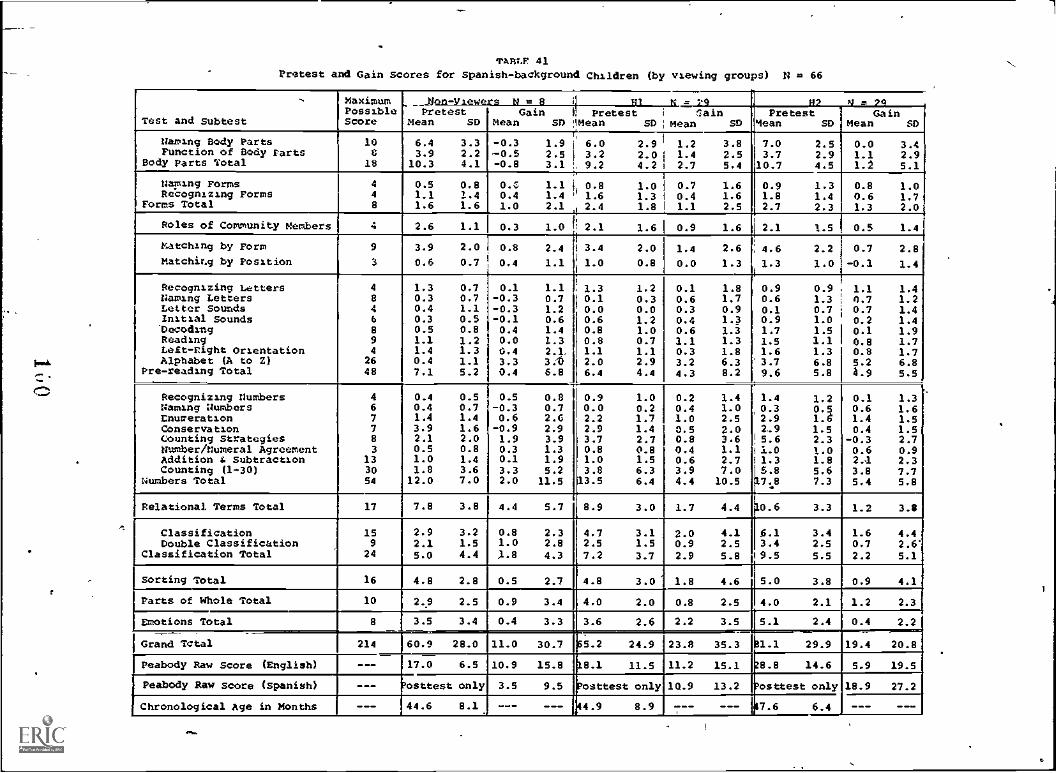
TancF 41
Pretest and Gain scores for Spanish- background Children (by viewing groups) N = 66
Test and Subtest
MaximumPossibleScore
Jon- Viewers N = 8 1 ' = 19 1112 N = 24Pretest
Mean SDGain I. Pretest 1 lain
mean SD Mean sD ;mean sDPretest
Mean sDGain
Mean SD
;caning Body PartsFunction of Body Farts
Body Parts Total
108
i8
6.4 3.33.9 2.2
10.3 4.1
.
-0.3 1.9 6.0 2.9 1 1.2 3.8-0.5 2.5 3.2 2.01 1.4 2.5-0.8 3.1 . 9.2 4.2 1 2.7 5.4
7.0 2.53.7 2.910.7 4.5
0.0 3.41.1 2.91.2 5.1
Naming FormsRecognizing Forms
Forms Total
44
8
0.5 0.81 .1 1.41.6 1.6
1
0.C. 1.1 0.8 1.0 i 0.7 1.610.4 1.4 1.6 1.3 i 0.4 1.6
1.0 2.1 2.4 1.8 I 1.1 2.5
0.9 1.31.8 1.42.7 2.3
0.8 1.00.6 1.71.3 2.0
Roles of Community Members 4 2.6 1.1 0.3 1.0 ; 2.1 1.6 0.9 1.6 2.1 1.5 0.5 1.4
Matching by Form
matchiLg by Position
9
3
3.9 2.0 i
0.6 0.7 1
0.8 2.4
0.4 1.1
E 3.4 2.0
1.0 0.8
1.4 2.6
0.0 1.3
4.6 2.2
1.3 1.0
0.7 2.8'
-0.1 1.4
Recognizing LettersNaming LettersLetter soundsInitial Sounds'DecodingReadingLeft-Right OrientationAlphabet (A to Z)
Pre-reading Total
4
846
894
2648
1.3 0.70.3 0.70.4 1.10.3 0.50.5 0.81.1 1.21.4 1.30.4 1.17.1 5.2
0.1 1.1-0.3 0.7-0.3 1.2-0.1 0.60.4 1.40.0 1.30.4 2.1,3.3 3.'
0.4 6.8
1.3 1.21 0.1 0.3i 0.0 0.00.6 1.20.8 1.00.8 0.71.1 1.12.0 2.96.4 4.4
0.1 1.80.6 1.70.3 0.90.4 1.30.6 1.31.1 1.30.3 1.83.2 6.34.3 8.2
0.9 0.90.6 1.30.1 0.70.9 1.01.7 1.51.5 1.11.6 1.33.7 6.89.6 5.8
1.1 1.40.7 1.20.7 1.40.2 1.40.1 1.90.8 1.70.8 1.75.2 6.84.9 5.5
Recognizing numbersNaming NumbersEnumerationConservationCounting StrategiesNumber/Numeral AgreementAddition 4 SubtractionCounting (1-30)
Numbers Total
467783
133054
0.4 0.50.4 0.71.4 1.43.9 1.62.1 2.00.5 0.81.0 1.41.8 3.6
12.0 7.0
0.5 0.8-0.3 0.70.6 2.6
-0.9 2.91.9 3.90.3 1.30.1 1.93.3 5.22.0 11.5
0.9 1.00.0 0.22.2 1.72.9 1.43.7 2.70.8 0.81.0 1.53.8 6.313.5 6.4
0.2 1.40.4 1.01.0 2.50.5 2.00.8 3.60.4 1.10.6 2.73.9 7.04.4 10.5
1.4 1.20.3 0.52.9 1.42.9 1.5
15.6 2.311.0 1.011.3 1.85.8 5.67.8 7.3
,
0.1 1.30.6 1.61.4 1.50.4 1.5
-0.3 2.70.6 0.92.1 2.33.8 7.75.4 5.8
Relational Terms Total 17 7.8 3.8 4.4 5.7 8.9 3.0 1.7 4.4 0.6 3.3 1.2 3.8
ClassificationDouble Classification
Classification Total
15924
2.9 3.22.1 1.55.0 4.4
0.8 2.31.0 2.81.8 4.3
4.7 3.12.5 1.57.2 3.7
2.0 4.10.9 2.52.9 5.8
6.1 3.43.4 2.59.5 5.5
1.6 4.40.7 2.62.2 5.1
sorting Total 16 4.8 2.8 0.5 2.7 4.8 3.0 1.8 4.6 5.0 3.8 0.9 4.1
Parts of Whole Total 10 2.9 2.5 0.9 3.4 4.0 2.0 0.8 2.5 4.0 2.1 1.2 2.3
Emotions Total 8 3.5 3.4 0.4 3.3 3.6 2.6 2.2 3.5 5.1 2.4 0.4 2.2
Grand Total 214 60.9 28.0 11.0 30.7 65.2 24.9 23.8 35.3 1.1 29.9 19.4 20.8
Peabody Raw score (English) --- 17.0 6.5 10.9 15.8 18.1 11.5 11.2 15.1 8.8 14.6 5.9 19.5
Peabody Raw Score (Spanish) --- Posttest only 3.5 9.5 Posttest only 10.9 13.2 osttest only 18.9 27.2
Chronological Age in Months --- 44.6 8.1 --- e44.9 8.9 --- 7.6 6.4 ---
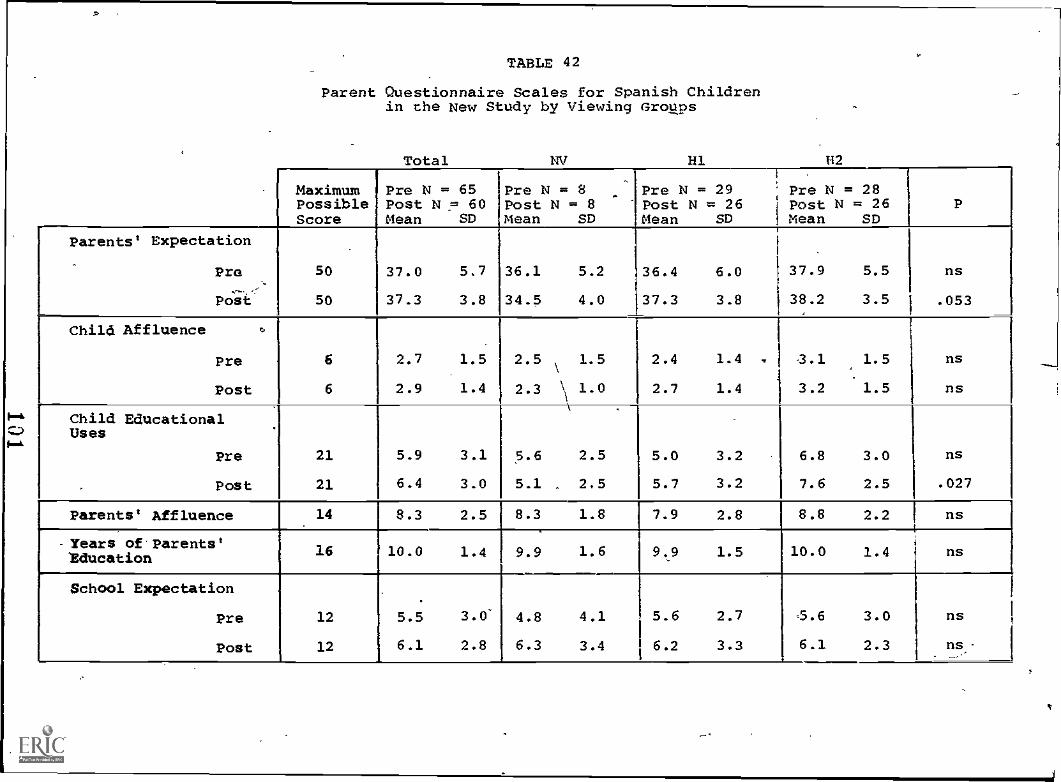
TABLE 42
Parent Questionnaire Scales for Spanish Childrenin the New Study by Viewing Groups
Total NV H1
MaximumPossibleScore
Pre N = 65Post N = 60Mean SD
PrePostmean
N = 8N = 8
SD
PrePostMean
N = 29 Pre N = 28N = 26 Post N = 26
SD Mean SDP
Parents* Expectation
Pre 50 37.0 5.7 36.1 5.2 36.4 6.0 37.9 5.5 ns
Nisi 50 37.3 3.8 34.5 4.0 37.3 3.8 38.2 3.5 .053
Child Affluence
Pre 6 2.7 1.5 2.5 1.5 2.4 1.4 . -3.1 1.5 ns
Post 6 2.9 1.4 2.3 \I
1.0 2.7 1.4 3.2 -1.5 ns
Child Educational. 1
Uses
Pre 21 5.9 3.1 5.6 2.5 5.0 3.2 6.8 3.0 ns
. Post 21 6.4 3.0 5.1 . 2.5 5.7 3.2 7.6 2.5 .027
Parents* Affluence 14 8.3 2.5 8.3 1.8 7.9 2.8 8.8 2.2 ns
-Years of Parents''Education 16 10.0 1.4 9.9 1.6 9.9 1.5 10.0 1.4 ns
School Expectation
Pre 12 5.5 3.0' 4.8 4.1 5.6 2.7 -5.6 3.0 ns
Post 12 6.1 2.8 6.3 3.4 6.2 3.3 6.1 2.3 ns,
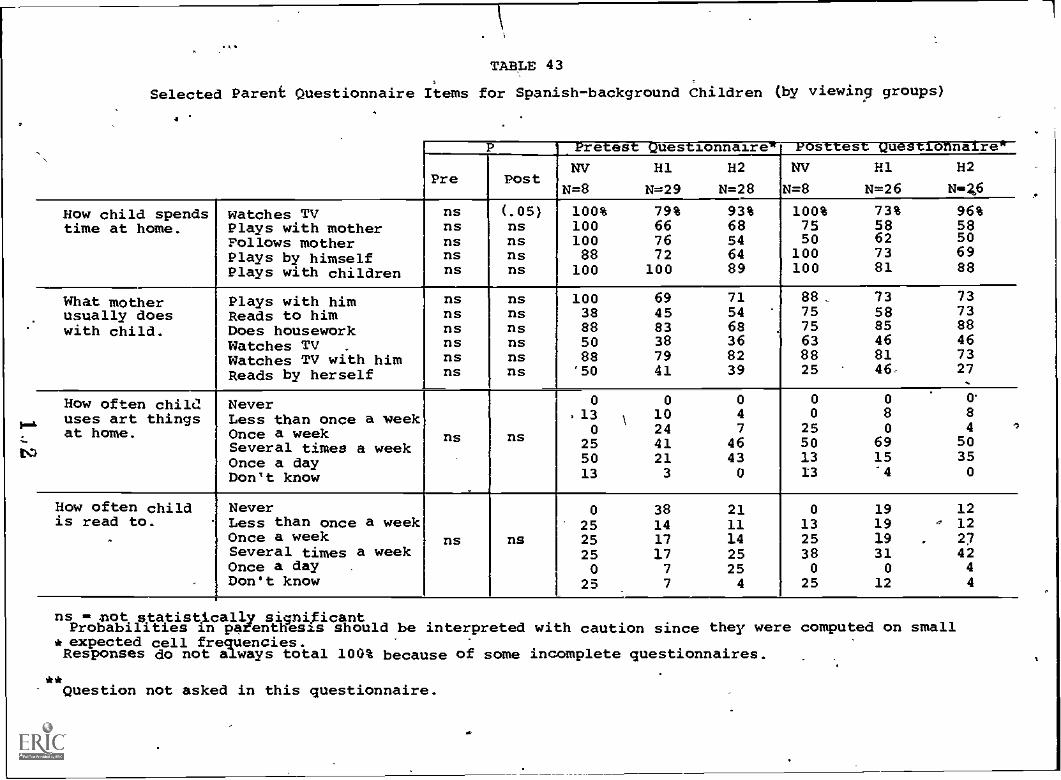
TABLE 43
Selected Parent Questionnaire Items for Spanish-background Children (by viewing groups)
4
P *--Pretest Questionnaire's Posttest Uuestionnasrew
Pre PostNV
N=8
H1
N=29
H2
N=28
NV
N=8
H1
N=26
H2
N=2.6
How child spendstime at home.
watches TVPlays with motherFollows motherPlays by himselfPlays with children
nsnsnsnsns
(.05)nsnsnsns
100%10010088100
79%667672100
93%68546489
100%7550
100100
73%58627381
96%58506988
What motherusually doeswith child.
Plays with himReads to himDoes houseworkWatches TVWatches TV with himReads by herself
nsnsnsnsnsns
nsnsnsnsnsns
10038885088'50
694583387941
715468368239
88_7575638825
735885468146,
737388467327
How often chile:uses art thingsat home.
NeverLess than once a weekOnce a weekSeveral times a weekOnce a dayDon't know
ns ns
.130
255013
102441213
4
746430
0
25501313
80
6915'4
8450350
I
How often childis read to.
.
NeverLess than once a weekOnce a weekSeveral times a weekOnce a dayDon't know
ns ns
0
2525250
[ 25
381417177
7
21111425254
01325380
25
191919 .
310
12
12, 12
27424
4
ns = mot ktatistically significantProbabilities in parenthesis should be interpreted with caution since they were computed on small
* expected cell frequencies.Responses do not always total 100% because of some incomplete questionnaires.
**Question not asked in this questionnaire.
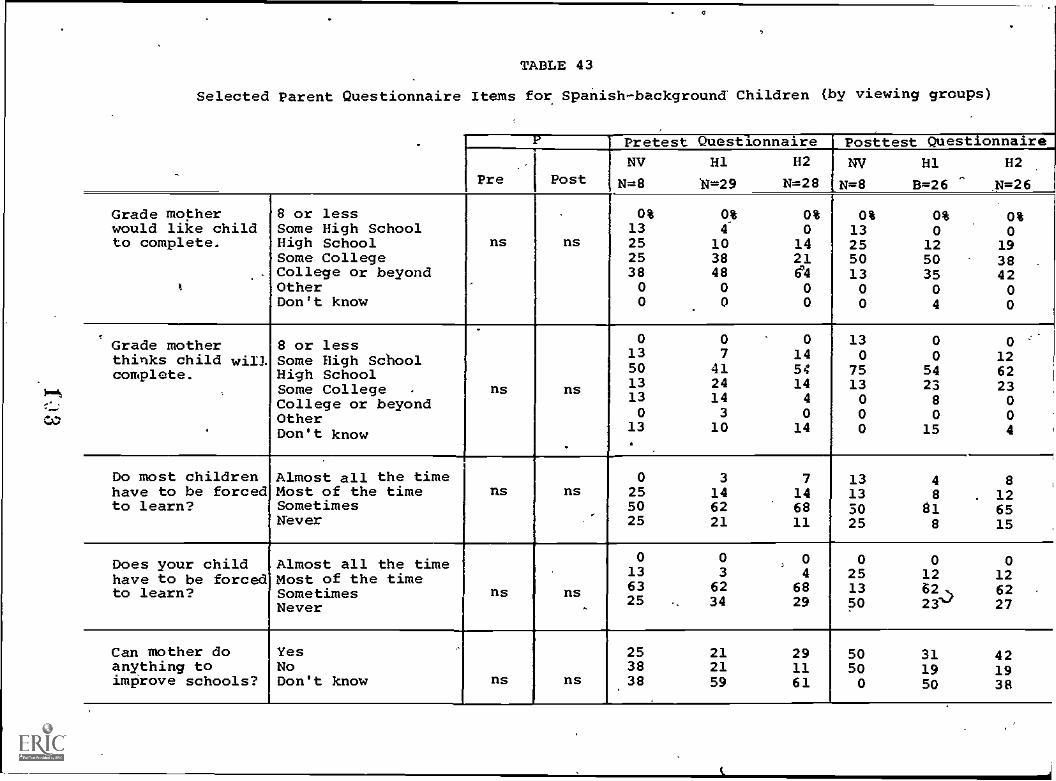
TABLE 43
Selected Parent Questionnaire Items for Spanish-background Children (by viewing groups)
. Pretest Questionnaire Posttest Questionnaire
Pre PostNV
N=8H1
N=29
H2
N=28
NV
N=8
H1
B=26
H2
N*26
Grade mother 8 or less 0% 0% at at 0% 0%would like child Some High School 13 4 0 13 0 0to complete. High School ns ns 25 10 14 25 12 19
Some College 25 38 21 50 50 38College or beyond 38 48 6'4 13 35 42
e Other 0 0 0 0 0 0Don't know 0 0 0 0 4 0
Grade mother 8 or less 0 0 0 13 0 0
thinks child will Some High School 13 7 14 0 0 12complete. High School 50 41 54 75 54 62
Some College - ns ns 13 24 14 13 2 3 23College or beyond 13 14 4 0 8 0
Other 0 3 0 0 0 0
Don't know 13 10 14 0 15 4
Do most children Almost all the time 0 3 7 13 4 8have to be forced Most of the time ns ns 25 14 14 13 8 . 12to learn? Sometimes 50 62 68 50 81 65
Never 25 21 11 25 8 15
Does your child Almost all the time 0 0 0 0 0 0
have to be forced Most of the time 13 3 4 25 12 12to learn? Sometimes ns ns 63 62 68 13 62.. 62
Never .25 34 29 50 23 27
Can mother doanything to
YesNo 38 21
2911
5050
3119
4219
improve schools? Don't know ns ns 38 59 61 0 50 38
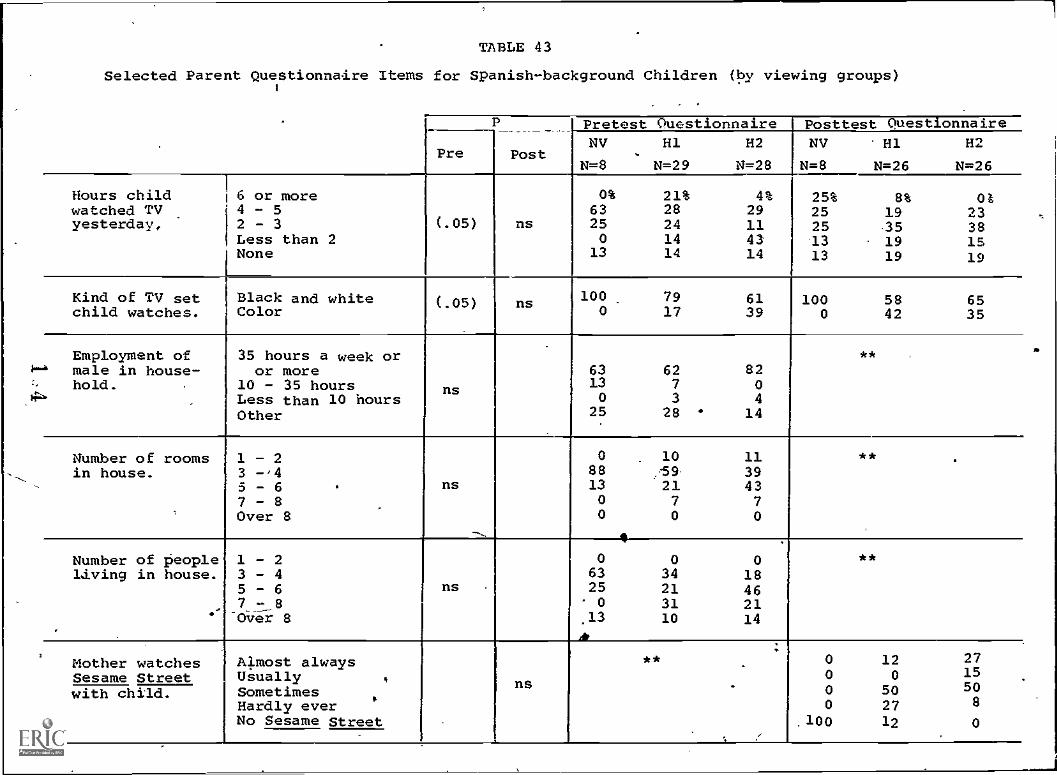
TABLE 43
Selected Parent Questionnaire Items for Spanish-background Children (by viewing groups)1
.
P Questionnaire Posttest Questionnaire
Pre Post
,PretestNV H1 H2
.
N=8 N=29 N=28
NV
N=8
H1
N=26
H2
N=26
Hours child j 6 or more 0% 21% 4% 25% 8% Otwatched TV 4 - 5 63 28 29 25 19 23yesterday, 2 - 3 (.05) ns 25 24 11 25 35 38
Less than 2 0 14 43 13 19 15None 13 14 14 13 19 19
Kind of TV set Black and white (.05) ns 100 79 61 100 58 65child watches. Color 0 17 39 0 42 35
Employment of 35 hours a week or **
' male in house- or more 63 62 82hold. . 10 - 35 hours 13 7 0
. Less than 10 hoursns
0 3 4
Other 25 28 - 14
Number of rooms 1 2 0 10 11 **
in house. 3 -A 88 /59 393 - 6 ns 13 21 437 - 8 0 7 7Over 8 0 0 0
_II._Number of people 1- 2 0 0 0 **
Living in house. 3 - 4 63 34 185 - 6 ns 25 21 467,- 8 0 31 21
'' -6.rer 8 .13 10 14.
..
Mother watches Almost always ** 0 12
.
27
Sesame Street Usually ns0 0 15
with child. Sometimes 0 50 50
Hardly ever.
0 27 8
No Sesame Street .100 12 0._
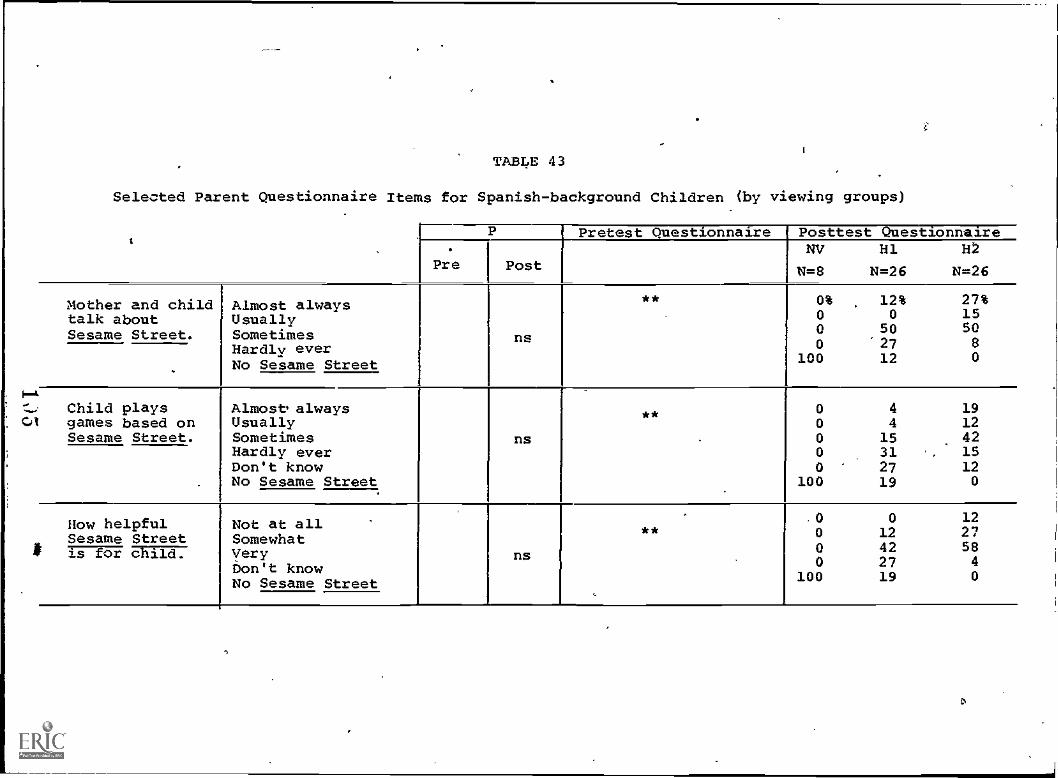
TABLE 43
Selected Parent Questionnaire Items for Spanish-background Children (by viewing groups)
s
P Pretest Questionnaire Posttest Questionnaire
Pre PostNV
N=8
H1
N=26
H2
N=26
Mother and childtalk aboutSesame Street.
Almost alwaysUsuallySometimesHardly everNo Sesame Street
ns
** 0%0
00
100
12%0
50
2712
27%15SO80
.
Child playsgames based onSesame Street.
Almost= alwaysUsuallySometimesHardly everDon't knowNo Sesame Street
ns
.-
** 0000
0100
44
15312719
19124215120.
How helpfulSesame Street
Not at allSomewhatVeryDon't knowNo Sesame Street
ns
**.200
00
100
0
12422719
1725840
is for Mild.
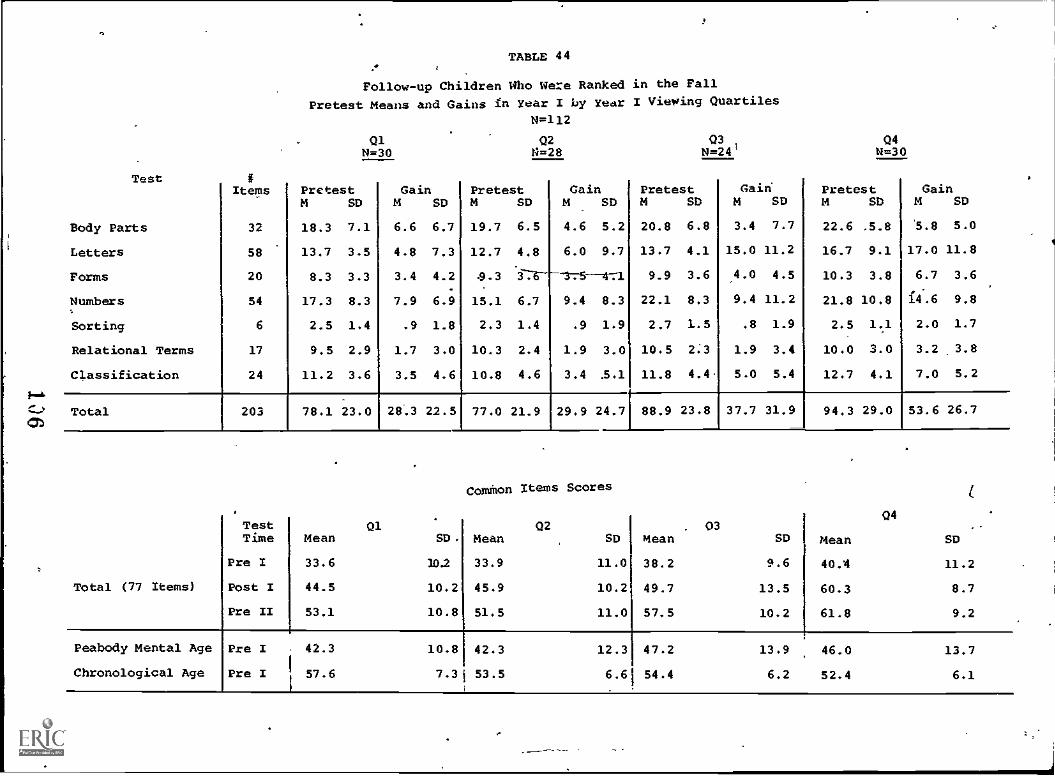
Test
Body Parts
Letters
Forms
Numbers
Sorting
Relational Terms
Classification
TotalGh
Items
32
58
20
54
6
17
24
TABLE 44
Follow-up Children Who Were Ranked in the Fall
Pretest Means and Gains in Y01::1I2by Year I Viewing Quartiles
Q1 Q2 Q3N=30 N=28 N=241
PretestM SD
18.3 7.1
13.7 3.5
8.3 3.3
17.3 8.3
2.5 1.4
9.5 2.9
11.2 3.6
203 78.1 23.0
Total (77 Items)
TestTime
Pre I
Post I
Pre II
Mean
33.6
44-5
53.1
Q1
Peabody Mental Age
Chronological Age
Pre I 42.3
Pre I I 57.6
Q4ts1=30
GainM SD
PretestM SD
GainM SD
PretestM SD
Gain.t4 SD
PretestM SD
GainM SD
6.6 6.7 19.7 6.5 4.6 5.2 20.8 6.8 3.4 7.7 22.6 .5.8 5.8 5.0
4.8 7.3 12.7 4.8 6.0 9.7 13.7 4.1 15.0 11.2 16.7 9.1 17.0 11.8
3.4 4-2 .9.3 376-- -1M1--471 9-9 3.6 4.5 10.3 3.8 6.7 3.6,4.0
7.9 6.9 15.1 6.7 9.4 8.3 22.1 8.3 9.4 11.2 21.8 10.8 14.6 9.8
.9 1.8 2.3 1.4 .9 1.9 2.7 1.5 .8 1-9 2.5 1.1 2.0 1.7
1.7 3.0 10.3 2.4 1.9 3.0 10.5 2.3 1.9 3.4 10.0 3.0 3-2 3.8
3.5 4.6 10.8 4.6 3.4 3.1 11.8 4.4 5.0 5.4 12.7 4.1 7.0 5.2
28.3 22.5 77.0 21.9 29.9 24.7 88.9 23.8 37.7 31.9 94.3 29.0 53.6 26.7
..
ComMon Items Scores
Q4Q2 . 03
SD. Mean SD Mean SD Mean SD
30.2 33.9 11.0 38.2 9.6 40.4 11.2
10.2 45.9 10.2 49.7 13.5 60.3 8.7
10.8 51.5 11.0 57.5 10.2 61.8 9.2
10.8 42.3 12.3 47.2 13.9 46.0 13.7
7.31 53.5 6.61 54.4 6.2 52.4 6.1
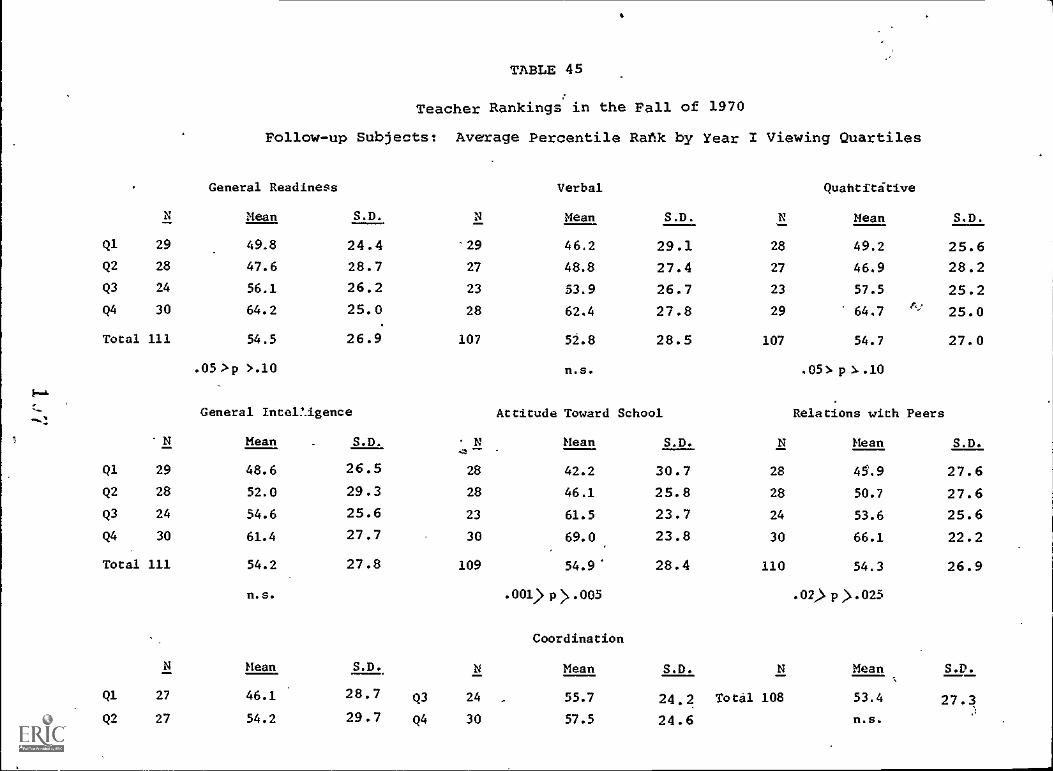
TABLE 45
Teacher Rankings in the Fall of 1970
Follow-up Subjects: Average Percentile Railk by Year I Viewing Quartiles
N
General Readiness
Mean S.D. N
Verbal
Mean S.D. N
Quantitative
Mean S.D.
Q1 29 49.8 24.4 '29 46.2 29.1 28 49.2 25.6
Q2 28 47.6 28.7 27 48.8 27.4 27 46.9 28.2
Q3 24 56.1 26.2 23 53.9 26.7 23 57.5 25.2
Q4 30 64.2 25.0 28 62.4 27.8 29 64.7A; 25.0
Total 111 54.5 26.9 107 52.8 28.5 107 54.7 27.0
.05 >p >.10 n.s. .05> p)...10
General IntelUgence Attitude Toward School Relations with Peers
N Mean S.D. N44 -
Mean S.D. N Mean S.D.
Q1 29 48.6 26.5 28 42.2 30.7 28 45.9 27.6
Q2 28 52.0 29.3 28 46.1 25.8 28 50.7 27.6
Q3 24 54.6 25.6 23 61.5 23.7 24 53.6 25.6
Q4 30 61.4 27.7 30 69.0 23.8 30 66.1 22.2
Total 111 54.2 27.8 109 54.9 28.4 110 54.3 26.9
n. s. .001> p > .005 .02)p>.025
Coordination
N Mean S.D. N Mean S.D. N Mean S.D.
Ql 27 46.1 28.7 Q3 24 , 55.7 24.2 Total 108 53.4 27.3Q2 27 54.2 29.7 Q4 30 57.5 24.6 n.s.
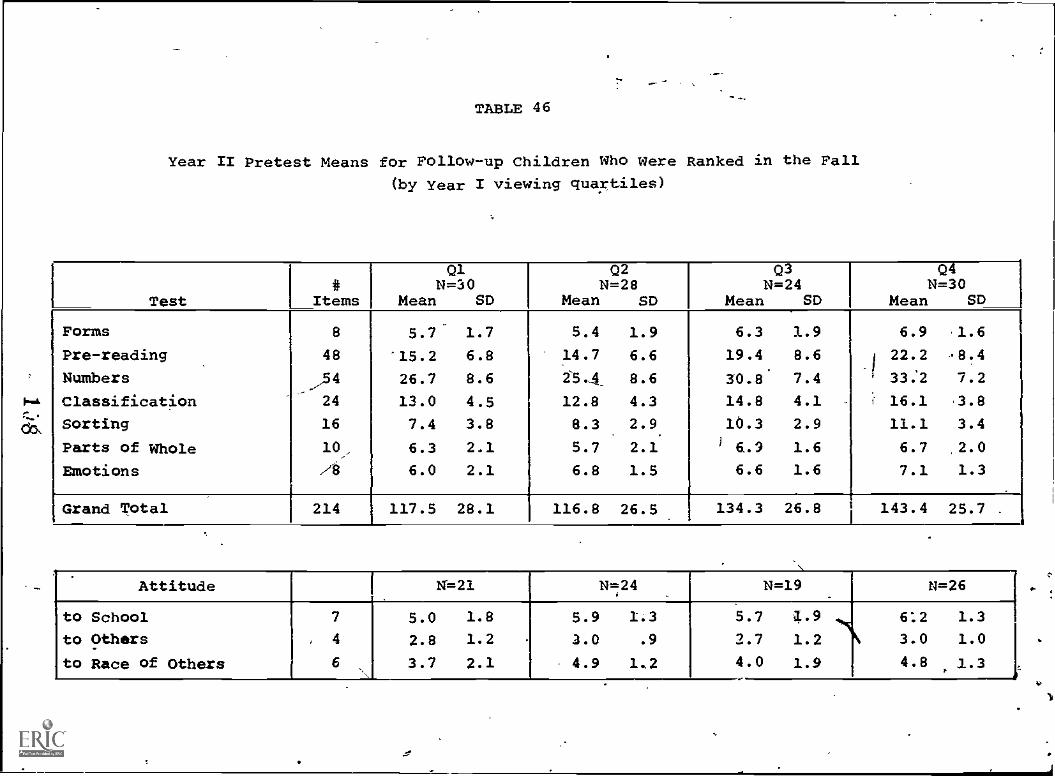
TABLE 46
Year II Pretest Means for Follow-up Children Who Were Ranked in the Fall
(by Year I viewing quartiles)
Test#
Items
Q1N=30
Mean SD
Q2N=28
Mean SD
Q3N=24
Mean SD Mean
Q4N=30
SD
Forms 8 5.7- 1.7 5.4 1.9 6.3 1.9 6.9 1.6
Pre-reading 48 '15.2 6.8 14.7 6.6 19.4 8.6 1 22.2 .8.4
Numbers 26.7 8.6 i5.* 8.6 30.8 7.4 1 33:2 7.2
Classification
_754
24 13.0 4.5 12.8 4.3 14.8 4.1 - i 16.1 .3.8
Sorting 16 7.4 3.8 8.3 2.9 10.3 2.9 11.1 3.4
Parts of Whole 10, 6.3 2.1 5.7 2.1 1 6.2 1.6 6.7 2.0
Emotions /8 6.0 2.1 6.8 1.5 6.6 1.6 7.1 1.3
Grand Total 214 117.5 28.1 116.8 26.5 134.3 26.8 i 143.4 25.7
Attitudel
I N=21 N= 24,
N=19 N=26
to School 7 5.0 1.8 5.9 1.3 5.7 1.9 6:2 1.3
to Others , 4 2.8 1.2 3.0 .9 2.7 1.2 3.0 1.0
to Race of Others 6 3.7 2.1 4.9 1.2 4.0 1.9 4.8 1.3
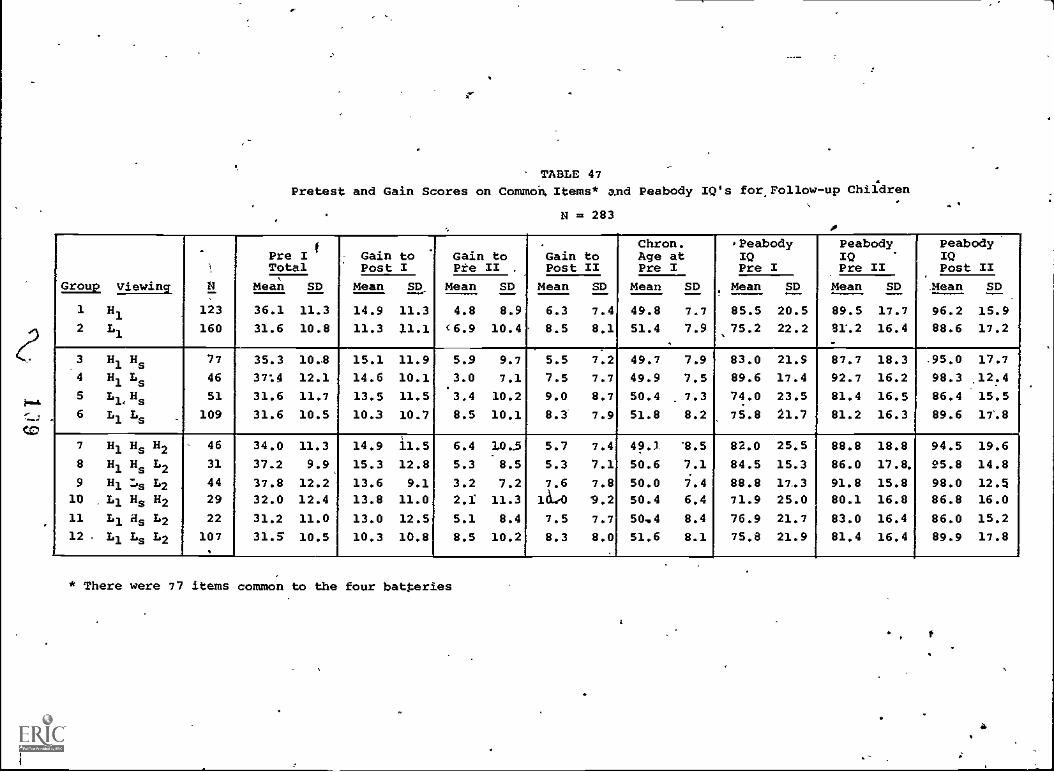
TABLE 47
Pretest and Gain Scores on Common. Items* and Peabody IQ's for, Follow -up Children
N= 283
Group viewing
-
N
123
160
fPre ITotal
-- Gain to
Post IGain toPie II .
.
Gain toPost II
Chron.Age atPre I
PeabodyIQPre I
PeabodyIQPre II
I PeabodyI()
Post II
Mean SD
11.3
10.8
Mean SD
11.3
11.1
Mean SD
8.9
10.4'
Mean SD
7.4
8.1
Mean SD
7.7
7.9
Mean SD
20.5
22.2
Mean SD
17.7
16.4
.Mean SD
15.9
17.2
1
2
H1
L1
36.1
31.6
14.9
11.3
4.8
<6.9
6.3
8.5
49.8
51.4.
85.5
.75.2
89.5
81.2-
96.2
88.6
3
4
5
6
H1Hs
H1Ls
L., Hs.1.4
L1 Ls
77
46
51
109
35.3
37.4
31.6
31.6
10.2
12.1
11.7
10.5
15.1
14.6
13.5
10.3
11.9
10.1
11.5
10.7
5.9
3.0
3.4
8.5
9.7
7.1
10.2
10.1
5.5
7.5
9.0
8.3
7.2
7.7
8.7
7.9
49.7
49.9
50.4
51.8
7.9
7.5
7.3
8.2
83.0
89.6
74.0
75.8
21.9
17.4
23.5
21.7
87.7
92.7
81.4
81.2
18.3
16.2
16.5
16.3
.95.0
98.3
86.4
89.6
17.7
.12.4
15.5
11.8
7
8
9
10
11
12
H1 Hs H2H1 Hs 12
H1 :.s L2
.L1 Hs H2
L1 as L2
. L1 Ls L2
46
31
44
29
22
107
34.0
37.2
37.8
32.0
31.2
31.5
11.3
9.9
12.2
12.4
11.0
10.5
14.9
15.3
13.6
13.8
13.0
10.3
11.5
12.8
9.1
11.0
12.5
10.8
6.4
5.3
3.2
2.1
5.1
8.5
10.5
8.5
7.2
11.3
8.4
10.2
5.7
5.3
7.6
161...0
7.5
8.3
7.4
7.1
7.8
9.2
7.7
8.0j
49.3
50.6
50.0
50.4
50,4
51.6
"8.5
7.1
7.4
6.4
8.4
8.1
82.0
84.5
88.8
71.9
76.9
75.8
25.5
15.3
17.3
25.0
21.7
21.9
88.8
86.0
91.8
80.1
83.0
81.4
18.8
17.8.
15.8
16.8
16.4
16.4
94.5
e5.8
98.0
86.8
86.0
89.9
19.6
14.8
12.%
16.0
15.2
17.8
* There were 77 items common to the four batteries
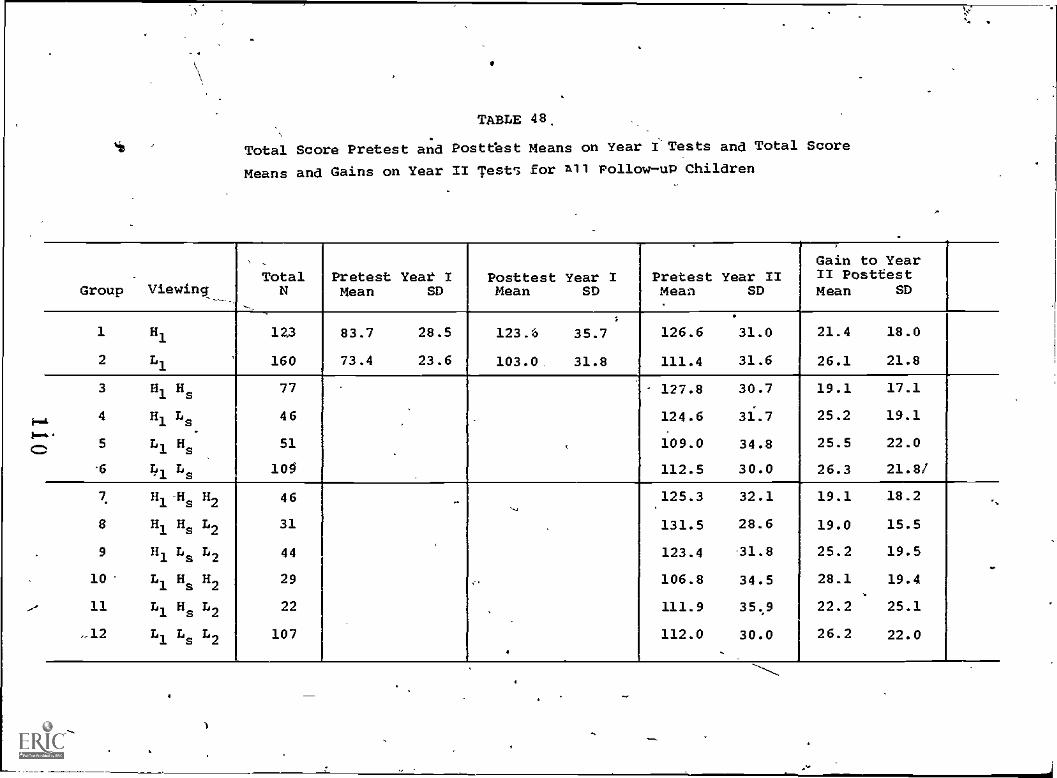
TABLE 48.
Total Score Pretest and Posttest Means on Year I Tests and Total Score
Means and Gains on Year II Tests for All Follow-up Children
Group Viewing__.
TotalN
Pretest Yeat 1Mean SD
Posttest Year IMean SD
Pretest Year IIMeat SD
Gain to YearII PosttestMean SD
1
1 H1 123 83.7 28.5 123.6 35.7 126.6 31.0 21.4 18.0
2 L1 160 73.4 23.6 103.0. 31.8 111.4 31.6 26.1 21.8
3 H1H 77 - 127.8 30.7 19.1 17.1
4 H1 Ls 46 124.6 31.7 25.2 19.1...
:5 L1 H$ 51 , 109.0 34.8 25.5 22.0
.6 L1Ls 100 112.5 30.0 26.3 21.8/
7 H -H H 46 125.3 32.1 19.1 18.21 s 2
-,
8 H1
Hs
L2
31 131.5 28.6 19.0 15.5
9 LH1L 44 123.4 31.8 25.2 19.5s 2
.
10 L1
Ha
H2
29 106.8 34.5 28.1 19.4
11 L1
H L2
22 111.9 35;9 22.2 25.1
-12 L1Ls 112 107 112.0 30.0 26.2 22.0
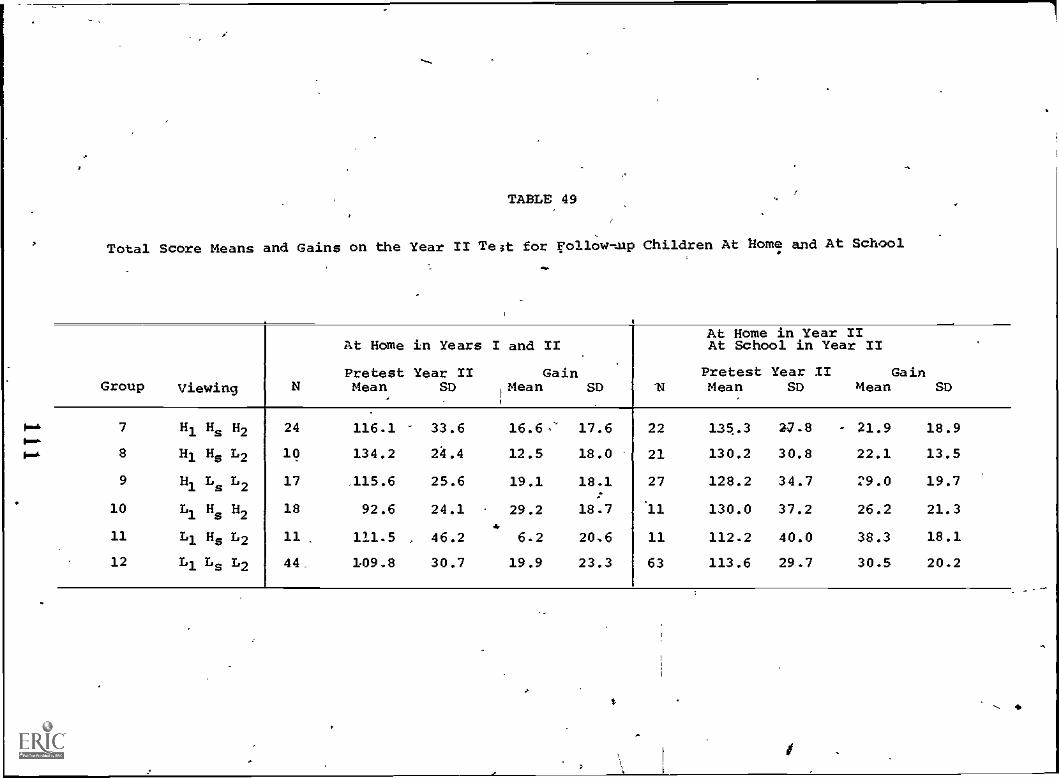
6-4
TABLE 49
Total Score Means and Gains on the Year II Tart for Follow -tap Children At Home and At School
Group Viewing N
At Home in Years I and II
Pretest Year II GainMean SD Mean SD Lei
At some in Year IIAt School in Year II
Pretest Year IIMean SD Kean
GainSD
7 Hi Hs H2 24 116.1 33.6 16.6,' 17.6 22 135.3 2.8 21.9 18.9
8 Hi Hs L2 10 134.2 24.4 12.5 18.0 21 130.2 30.8 22.1 13.5
9 Hi Ls L2 17 115.6 25.6 19.1 18.1 27 128.2 34.7 29.0 19.7
10 L H H1 s 2
18 92.6 24.1 29.2 18.7 '11 130.0 37.2 26.2 21.3
11 Li Hs L2 11 111.5 , 46.2 6.2 20.6 11 112.2 40.0 38.3 18.1
12 Li Ls L2 44 109.8 30.7 19.9 23.3 63 113.6 29.7 30.5 20.2
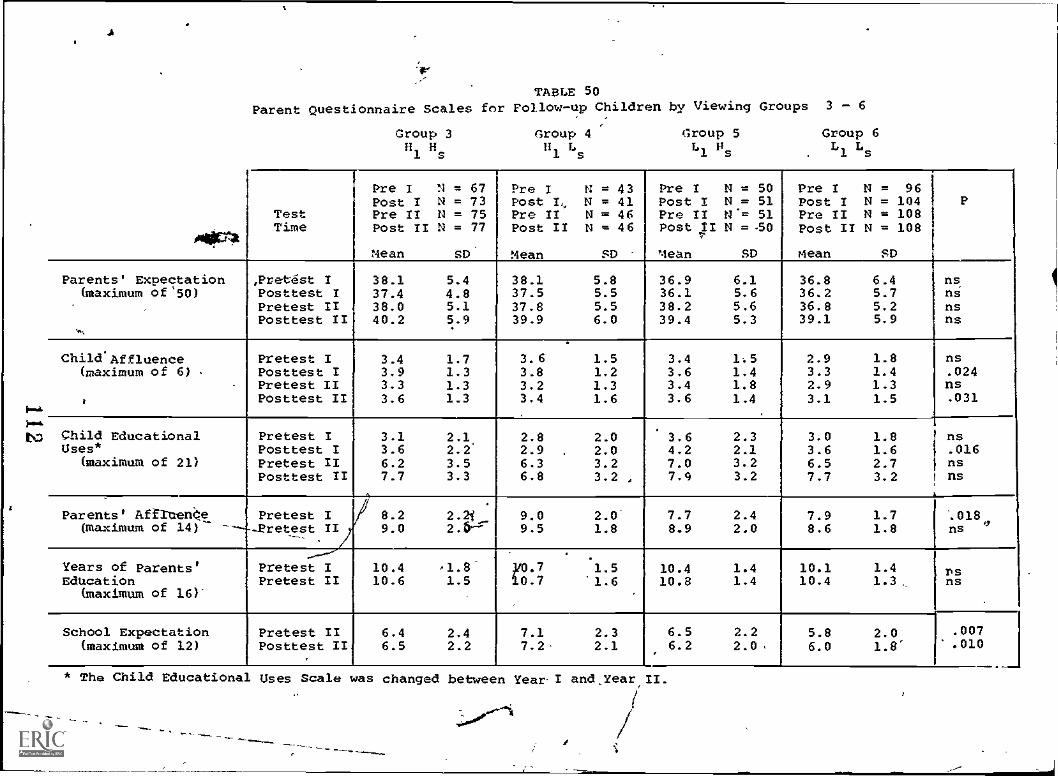
A
TABLE 50Parent Questionnaire scales for Follow-up Children by Viewing Groups 3 - 6
Group 3 Group 4H1
Hs
H1Ls
Group 5L1Ps
Group 6L1Ls
Alltrit
TestTime
PrePostPrePost
Mean
I N= 67I N = 73
II fl = 75II N = 77
SD
Pre 1Post /.,,Pre IIPost II
Mean
N= 43N = 41N = 46N = 46
SD
PrePostPrePost
Mean
I N= 50I N = 51II N= 51/I7 N =.50
SD
PrePostPrePost
mean
I N= 96I N = 104
II N = 108II N = 108
SD
P
Parents' Expectation ,Pret6st I 38.1 5.4 38.1 5.8 36.9 6.1 36.8 6.4 ns(maximum of'50) Posttest I 37.4 4.8 37.5 5.5 36.1 5.6 36.2 5.7 ns
Pretest II 38.0 5.1 37.8 5.5 38.2 5.6 36.8 5.2 nsPosttest II 40.2 5.9 39.9 6.0 39.4 5.3 39.1 5.9 ns
ChildAffluence Pretest I 3.4 1.7 3.6 1.5 3.4 1:5 2.9 1.8 ns(maximum of 6) Posttest I 3.9 1.3 3.8 1.2 3.6 1.4 3.3 1.4 .024
Pretest II 3.3 1.3 3.2 1.3 3.4 1.8 2.9 1.3 nsPosttest II 3.6 1.3 3.4 1.6 3.6 1.4 3.1 1.5 .031
Child Educational Pretest I 3.1 2.1 2.8 2.0 3.6 2.3 3.0 1.8 nsUses* Posttest I 3.6 2.2' 2.9 . 2.0 4.2 2.1 3.6 1.6 .016
(maximum of 21) Pretest II 6.2 3.5 6.3 3.2 7.0 3.2 6.5 2.7 nsPosttest II 7.7 3.3 6.8 3.2 , 7.9 3.2 7.7 3.2 ns
L.,
Parents' Affruene Pretest I 8.2 2.2/ 9.0 2.0' 7.7 2.4 7.9 1.7 '.018(maximum of 14) -Pretest /I
,....,9.0 2.647. 9.5 1.8 8.9 2.0 8.6 1.8 ns 0
.
X1.5Years of Parents'EdUcation
(maximum of 16)
Pretest IPretest II
10.410.6
1.81.5
Y0.710.7 .1.6
10.410.8
1.41.4
10.110.4
1.4ns1.3, ns
School Expectation Pretest II 6.4 2.4 7.1 2.3 6.5 2.2 5.8 2.0 .007(maximum of 12) Posttest II 6.5 2.2 7.2 2.1 6.2 2.0, 6.0 1.8 .010
* The Child Educational Uses Scale was changed between Year. I and Year II.
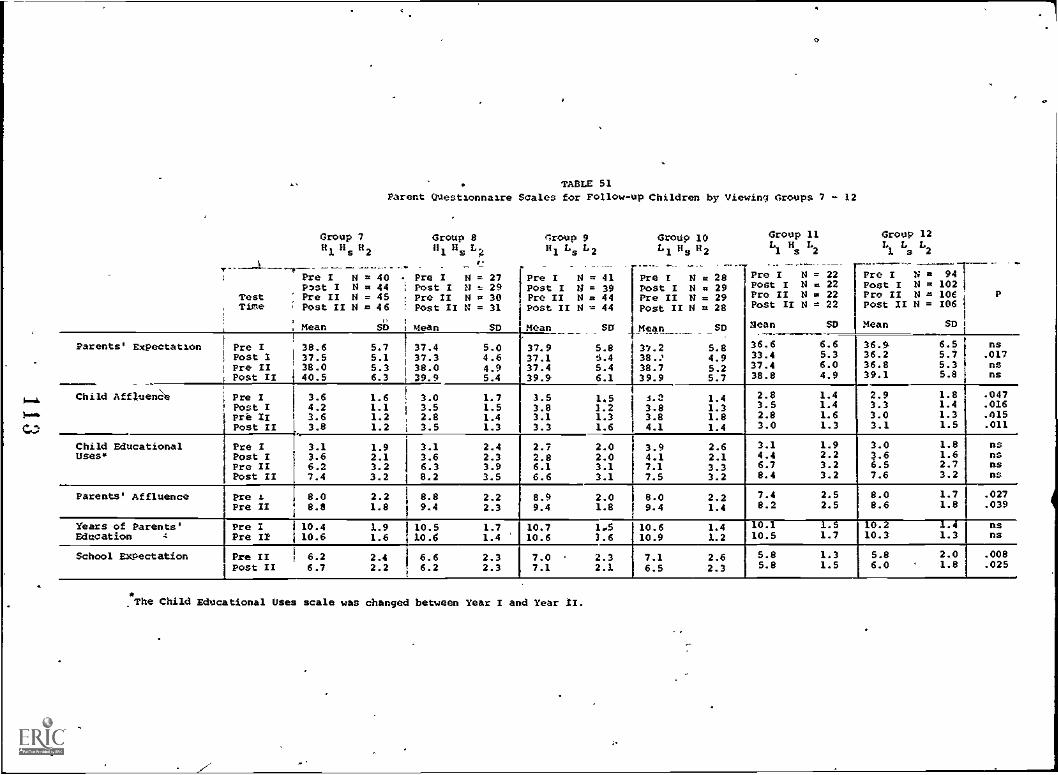
Group 7it1Hs H2
TABLE 51Parent Questionnaire Scales for Follow-up Children by Viewing Groups 7 - 12
Group 8Ill L.1 s z
Group 9H1Ls L2
GroUp 10LI Hs H2
Group 11LI Hs L2
Group 12Ll L
sL2
Pre I N = 40 - PrePast I N = 44 : Post
Test Pre II N = 45 : PreTime Post II N = 46
: Post, .
, Mean SD i Mean
I N = 27I N = 29
21 N = 30II N = 31
SD
_
Pre IPost IPre IIPost II
Mean
. ._ __
N = 41N = 39N = 44N = 44
Sp
.___
PrePostPrePost
Mean
-_ ___ ___
I N = 28I N = 29
II N = 29I/ N = 28
SD
Pre IPost IPre IIPost II
Mean
N = 22N a 22N 22N = 22
SD
PrePostPrePost
Mean
I IC = 94I N = 102
II N = 106XI N = 106
SD
P
Parents' Expectation Pre I 38.6 5.7 ! 37.4 5.0 37.9 5.8 17.2 5.8 36.6 6.6 36.9 6.5 nsPost I 37.5 5.1 i 37.3 4.6 37.1 6.4 38.: 4.9 33.4 5.3 36.2 5.7 .017
Pre I/ 38.0 5.3 1 38.0 4.9 37.4 5.4 38.7 5.2 37.4 6.0 36.8 5.3 nsPost /I 40.5 6.3 ' 39.9 5.4 39.9 6.1 39.9 5.2 38.8 4.9 39.1 5.8 ns
------
Child AffluenceiPre I 3.6 1.6 3.0 1.7 3.5 1,5 s.2 1.4 2.8 1.4 2.9 1.8 .047Post I 4.2 1.1 3.5 1.5 3.8 1.2 3.8 1.3 3.5 1.4 3.3 1.4 .016Pre II 3.6 1.2 2.8 1.4 3.1 1.3 3.8 1.8 2.8 1.6 3.0 1.3 .015Post II 3.8 1.2 3.5 1.3 3.3 1.6 4.1 1.4 3.0 1.3 3.1 1.5 .011
Child Educational Pre I 3.1 1.9 3.1 2.4 2.7 2.0 3.9 2.6 3.1 1.9 3.0 1.8 nsuses* Post I 3.6 2.1 3.6 2.3 2.8 2.0 4.1 2.1 4.4 2.2 3.6 1.6 ns
Pre II 6.2 3.2 6.3 3.9 6.1 3.1 7.1 3.3 6.7 3.2 6.5 2.7 nsPost II 7.4 3.2 8.2 3.5 6.6 3.1 7.5 3.2 8.4 3.2 7.6 3.2 ns
ParentS' Affluence Pre t 8.0 2.2 8.8 2.2 8.9 2.0 8.0 2.2 7.4 2.5 8.0 1.7 .027Pre II 8.8 1.8 9.4 2.3 9.4 1.8 9.4 1.4 8.2 2.5 8.6 1.8 .039
Years of Parents' Pre 1 10.4 1.9 10.5 1.7 10.7 1.4 10.6 1.4 757r- 1.5 10.2 37T- nsEducation A Pre 12 10.6 1.6 10.4 1.4 10.6 3.6 10.9 1.2 10.5 1.7 10.3 1.3 ns
School Expectation Pre II 6.2 2.4 6.6 2.3 7.0 2.3 7.1 2.6 5.8 1.3 5.8 2.0 .008
Post II 6.7 2.2 6.2 2.3 7.1 2.1 6.5 2.3 5.8 1.5 6.0 1.8 .025
.The Child Educational Uses scale was changed between Year I and Year XI.
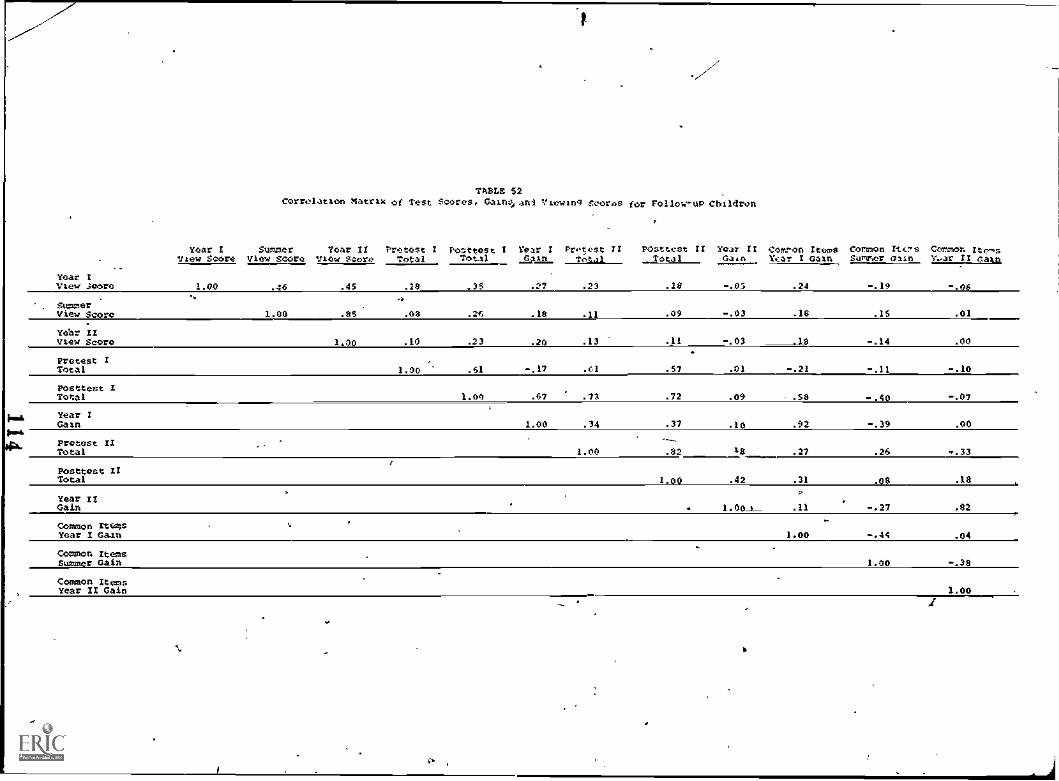
TAB= 52Correlation matrix of Test Scores, Cain,ani Viewing Scores for Follow-up Children
Year IView Score
SummerView Score
Year IIView Score
PretestTotal
1 Posttest ITotal
Year IGg
.27
Pretest 71Total
PostteSt ElTotal
Year IIGain
Cox; on ItemsYear I Gain
Common 11.(7sSumer Olin
Commot rte.'sY.ar II Gain
Year Iview Jeore 1.00 .46 .45 .28 .35 .23 .29 -.05 .24 -.19 -.OS
SummerView Score 1.00 .95 .08 .24'.. .18 .11 .09 -.03 .18 .15 .01
Year IIView Score 1.00 .10 .23 .20 .13 .11 -.03 .19 -.14 .00
Protest ITotal 1.00 .61 -.17 .61 .57 .01 -.21 -.11 -.10
Posttest ITotal 1.00 .67 .71 .72 .09 - .58 -.40 -.07
Year IGain 1.00 .34 .37 .10 .92 -.39 .00
Pretest IITotal 1.00 .82 ag .27 .26 -.33
Posttest IITotal 1.00 .42 .31 .08 .ta
Year IlGain . 1.001 .11
.
-.27 .$2
Common ItemsYear I Gain 1.00 -.44 .04
Common ItemsSummer Gain 1.00 -.38
Common ItemsYear II Gain 1.00
1
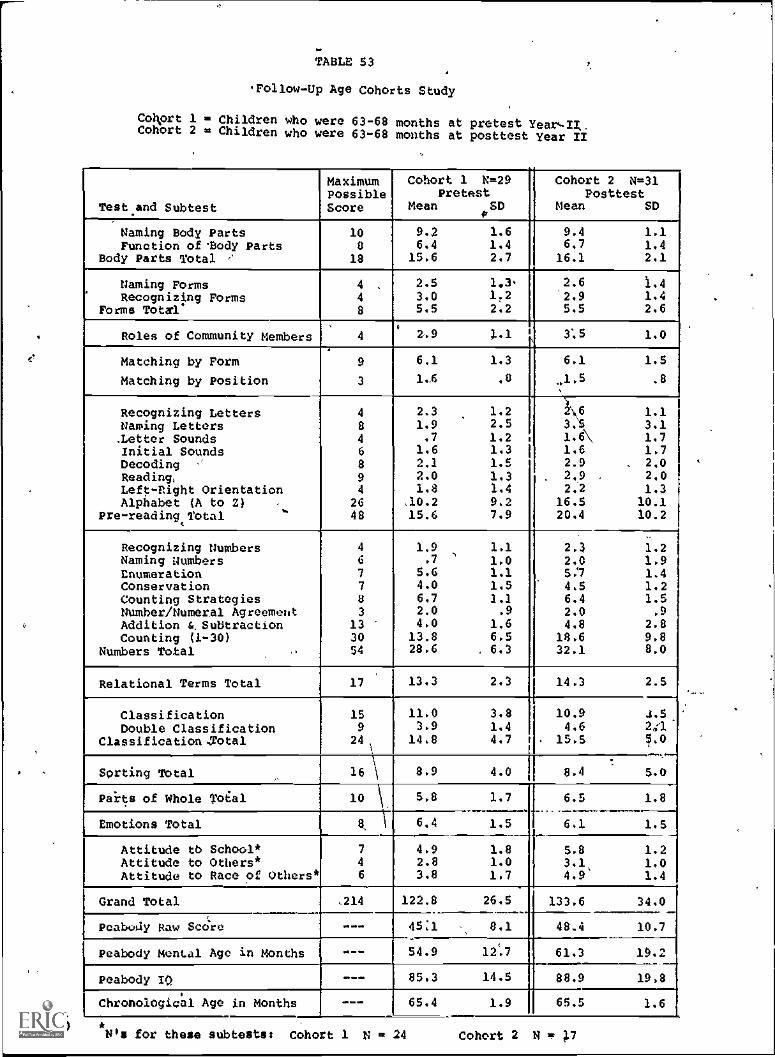
113
TABLE 53
.Follow-Up Age Cohorts Study
Collort 1 = Children who were 63-68 months at pretest Year..II.Cohort 2 = Children who were 63-68 months at posttest Year II
Test.and Subtest
MaximumPossibleScore
Cohort 1 N=29Pretest
Mean#SD
Cohort 2 N=31Posttest
Mean SD
Naming Body PartsFunction ofBody Parts
Body Parts Total ,
108
18
9.2 1.66.4 1.4
15.6 2.7
9.4 1.16.7 1.4
16.1 2.1
Naming FormsRecognizing Forms
Forms Total'
4 .
4
8
2.5 1.33.0 1,25.5 2.2
2.6 1.4'2.9 1.45.5 2.6
Roles of Community Members 4 29 X.1 3:5 1.0
Matching by Form
Matching by Position
9
3
4
8
4
6
8
94
2648
6.1 1.3
1.4 .8
2.3 1.21.9 2.5.7 1.2
1.6 1.32.1 1.52.0 1.31.8 1.4
.10.2 9.215.6 7.9
6.1 1.5
..1.5 .8
*/\6 1.13.1 3.11.6\ 1.71.6 1.72.9 , 2.02.9 . 2.02.2 1.3
16.5 10.120.4 10.2
Recognizing LettersNaming Letters.Letter SoundsInitial SoundsDecodingReading,Left-Right OrientationAlphabet (A to Z) -
...Pre-reading Total
Recognizing NumbersNaming NumbersEnumerationConservationCounting StrategiesNumber/Numeral AgreementAddition 6. SubtractionCounting (1-30)
Numbers Total
4
6
7
7
83
133054
1.9 1.1.7 1.0
5.6 1.14.0 1.56.7 1.12.0 .94.0 1.6
13.8 6.528.6 . 6.3
2.3 1.22.0 1.95:7 1.44.5 1.26.4 1.52.0 .9
4.8 2.818.6 9.832.1 8.0
Relational Terms Total 17 13.3 2.3 14.3 2.5
ClassificationDouble Classification
ClassificationNIotal
159
24
11.0 3.83.9 1.4
14.8 4.7
10.9 4.54.6 241'
15.5 1.0
Sorting Total 16 8.9 4.0 8.4 5.0
Pats of Whole total 10
8 c
5.8 1.7
6.4 1.5
6.5 1.8
6.1 1.5Emotions Total
Attitude tb School*Attitude to Others*Attitude to Race of Others*
7
4
6
4.9 1.82.8 1.03.8 1.7
5.8 1.23.1 1.04.9 1.4
Grand Total ,214 122,8 26.5 133.6 34.0
45:1 8.1 48.4 10.7Pcabo4y Raw Scdro ---
Peabody Mental Age in Months -__ 54.9 121.7 61.3 19.2
Peabody IO --- 85.3 14.5 88.9 19.8
ChronolOgical Age in Months - -- 65.4 1.9 65.5 1.6
Cohort 2 N m .7
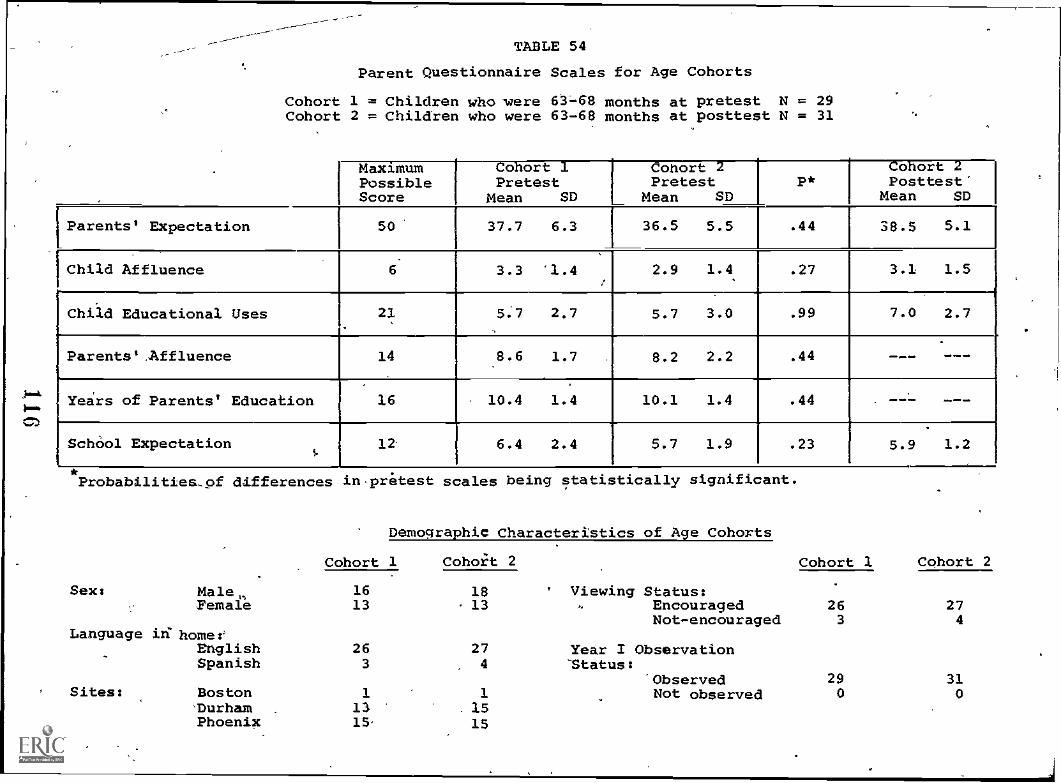
TABLE 54
Parent Questionnaire Scales for Age Cohorts
Cohort 1 = Children who were 63-68 months at pretest N = 29Cohort 2 = Children who were 63-68 months at posttest N = 31
. MaximumPossibleScore
Cohort 1Pretest
Mean SD
Cohort 2Pretest
Mean SDP*
Cohort 2Posttest'
Mean SD
Parents' Expectation 50 37.7 6.3 36.5 5.5 .44 38.5 5.1
1.5Child AffluenceI
6 3.3
,
'1.4, ,
2.9 1.4 .27 3.1
r
Child Educational Uses 21\.
5.7 2.7
.
5.7
-
3.0 .99 7.0 2.7
Parents' -Affluence 14 8.6 1.7 8.2 2.2 .44 --- -_-
Yeirs of Parents' Education 16 10.4 1.4 10.1 1.4 .44
SchOol Expectation 12 6.4 2.4 5.7 1.9 .23 5.9 1.2
*Probabilities_of differences in ,ritest scales being statistically significant.
Sex:
Demographic Characteristics of Age Cohorts
Cohort 1 Cohort 2
Male, 16 18 ' Viewing Status:Female 13 - 13 Encouraged
Language in home:English 26 27 Year I ObservationSpanish 3 4 Status:
ObservedSites: Boston 1 1 Not observed
Not-encouraged
'Durham 13 . 15Phoenix 15 15
Cohort 1 Cohort 2
26 273 4
29 310 0
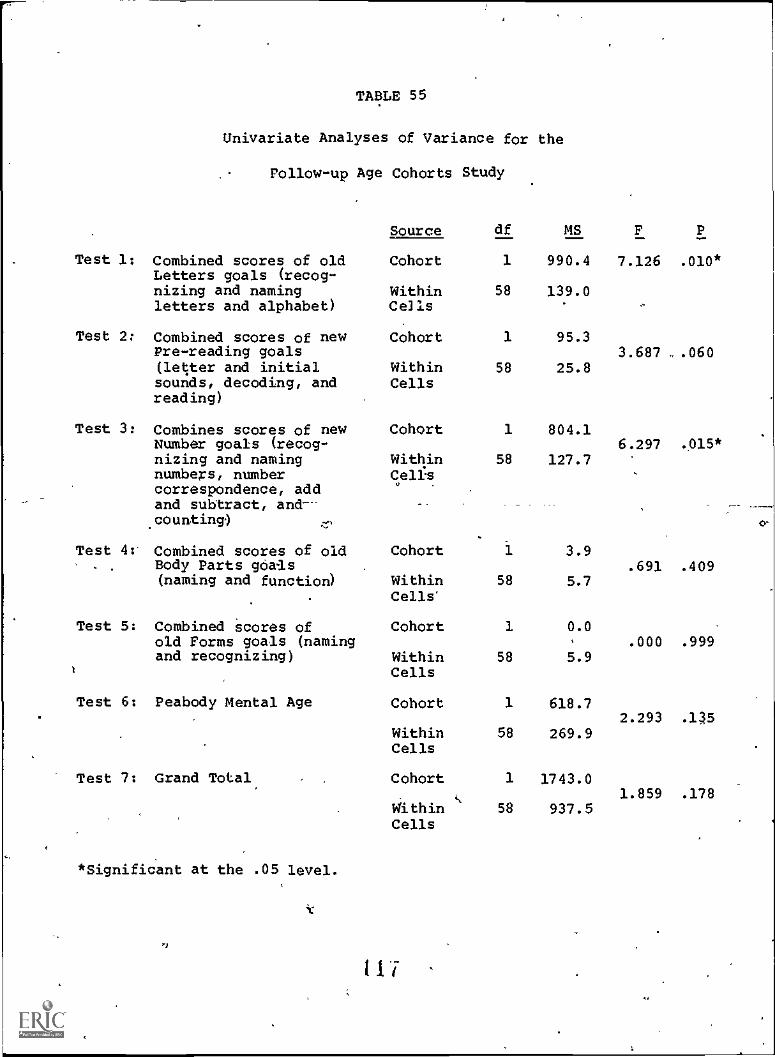
TABLE 55
Univariate Analyses of Variance for the
Follow-up Age Cohorts Study
Test 1: Combined scores of oldLetters goals (recog-nizing and namingletters and alphabet)
Test 2: Combined scores of newPre-reading goals(letter and initialsounds, decoding, andreading)
Test 3: Combines scores of newNumber goals (recog-nizing and namingnumbers, numbercorrespondence, addand subtract, and.counting)
Test 4v Combined scores of oldBody Parts goals(naming and function)
,
Test 5: Combined scores ofold Forms goals (namingand recognizing)
Test 6: Peabody Mental Age
Test 7: Grand Total
*Significant at the .05 level.
Source df MS F P
Cohort 1 990.4 7.126 .010*
Within 58 139.0Cells
Cohort 1 95.33.687 ..060
Within 58 25.8Cells
Cohort 1 804.16.297 .015*
Within 58 127.7CellsV
Cohort 1 3.9.691 .409
Within 58 5.7Cells'
Cohort 1 0.0.000 .999
Within 58 5.9Cells
Cohort 1 618.72.293 .135
Within 58 269.9Cells
Cohort 1 1743.01.859 .178
Within 58 937.5Cells
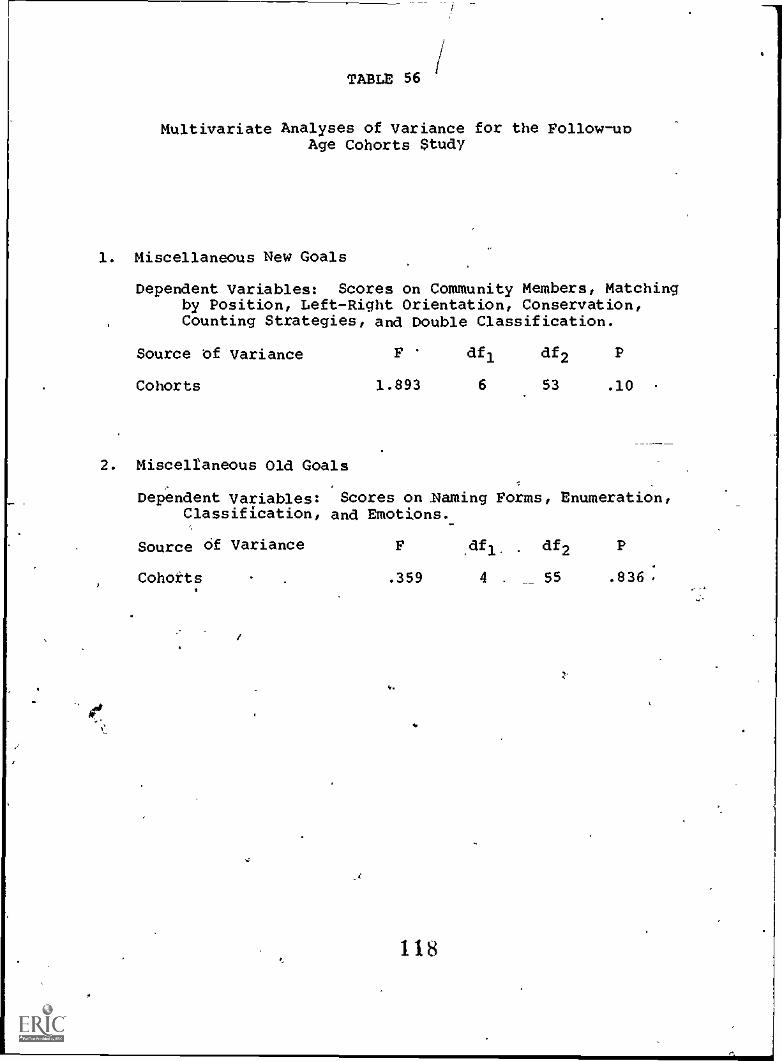
,
TABLE 56
Multivariate Analyses of Variance for the Follow-upAge Cohorts Study
1. Miscellaneous New Goals
Dependent Variables: Scores on Community Members, Matchingby Position, Left-Right Orientation, Conservation,Counting Strategies, and Double Classification.
Source of Variance
Cohorts
2. Miscellaneous Old Goals
F dfl df2 P
1.893 6 53 .10
Dependent Variables: Scores on Naming Forms, Enumeration,Classification, and Emotions.
Source of Variance F dfl df2 P
Cohorts .359 4 . 55 .836
Y.
..
118
,
c
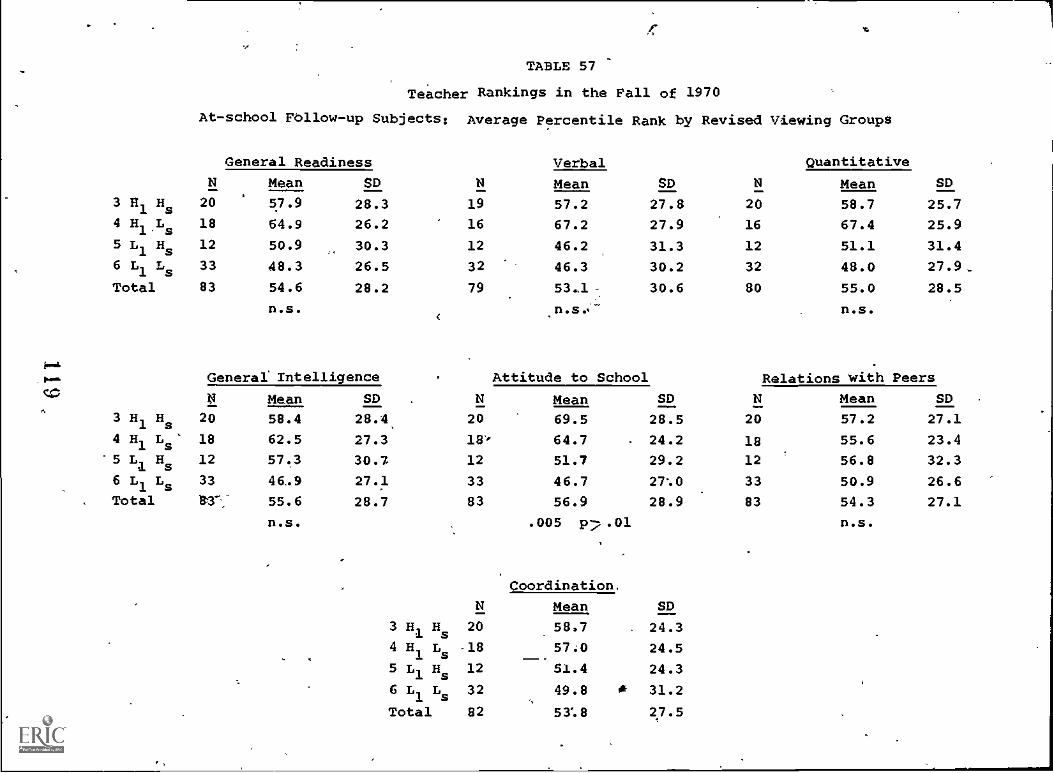
TABLE 57
Teacher Rankings in the Fall of 1970
At-school P011ow-up Subjects: Average Percentile Rank by Revised Viewing Groups
N
General Readiness
N
Verbal
SD N
Quantitative
SDMean SD Mean Mean3 Al H
s20 57.9 28.3 19 57.2 27.8 20 58.7 25.7
4 H1
Ls
18 64.9 26.2 16 67.2 27.9 16 67.4 25.9
5 L1
Hs
12 50.9 30.3 12 46.2 31.3 12 51.1 31.4
6 L1
Ls 33 A8.3 26.5 32 46.3 30.2 32 48.0 27.9_
Total 83 54.6 28.2 79 53-1 30.6 80 55.0 28.5
n.s. .n.se- n.s.
3 H1 Hs
General /ntelligence
N
20
Attitude to School
SD
28.5
N
20
Relations with Peers
N20
Mean SD . Mean Mean SD
58.4 28.4 69.5 57.2 27.1
4 H1
Ls 18 62.5 27.3 18' 64.7 . 24.2 18 55.6 23.4
5 L1
Hs
12 57.3 30.7 12 51.7 29.2 12 56.8 32.3
6 L1 Ls 33 46..9 27.1 33 46.7 27'.0 33 50.9 26.6
Total 8M",-- 55.6 28.7 83 56.9 28.9 83 54.3 27.1
n.s. .005 1)17.01 n.s.
N
Coordination.
SDMean
3 Hi Hs 20 58.7 24.3
4 H1
Ls
-18 57.0 24.5
5 L1
Hs
12 51.4 24.3
6 L1
Ls
32 49.8 * 31.2
Total 82 53'.8 27.5
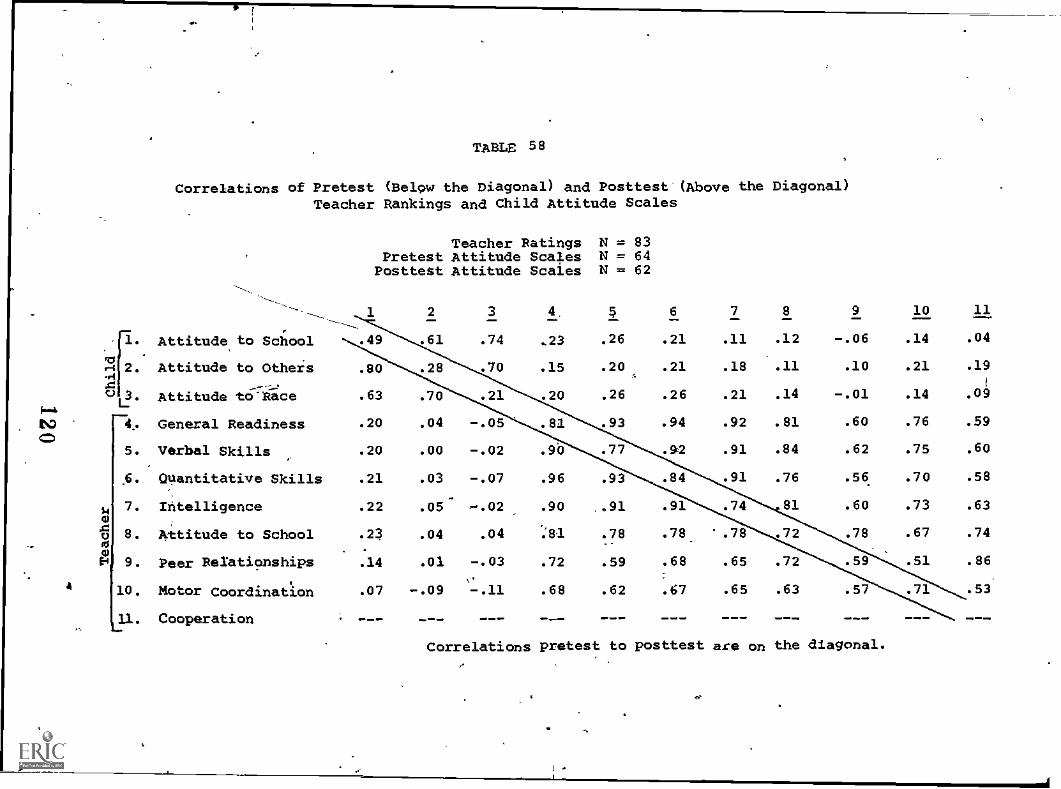
TABLE 58
Correlations of Pretest (Below the Diagonal) and Posttest (Above the Diagonal)Teacher Rankings and Child Attitude Scales
Teacher Ratings N = 83Pretest Attitude Scales N = 64Posttest Attitude Scales N = 62
1 2 3 4. 4 6
1. Attitude to School .49 .61 .74 .23 .26 .21
qv,-1 2. Attitude to Others .80 .28 .70 .15 .20 .21
8 L3. Attitude teridce .63 .70 .21 .20 .26 .26
4. General Readiness .20 .04 -.05 .81 .93 .94
5. Verbal Skills .20 .00 -.02 .90 .77 .92
6. Quantitative Skills .21 .03 -.07
k 7. Intelligence .22 .05 -.02
40 8. Attitude to School .23 .04 .04o
64 9. Peer Relationships .14 .01 -.03
10. Motor Coordination .07 -.09 -.11
11. Cooperation
.96 .93
.90 ..91
.
. 81 .78
.72 .59
.68 .62
.84
.91
7 8
.11 .12
.18 .11
.21 .14
.92 .81
.91 .84
.91 .76
.74 81
.78 '.78 .72
.68 .65 .72
.67 .65 .63
dmiw 111...1411. =11 ..1
9 10 11
-.06 .14 .04
.10 .21 .19
-.01 .14 .09
.60 .76 .59
.62 .75 .60
.56 .70 .58
.60 .73 .63
.78 .67 .74
.59 .51 .86
.57 .71 .53
Correlations pretest to posttest are on the diagonal.
1
c
,..m1r
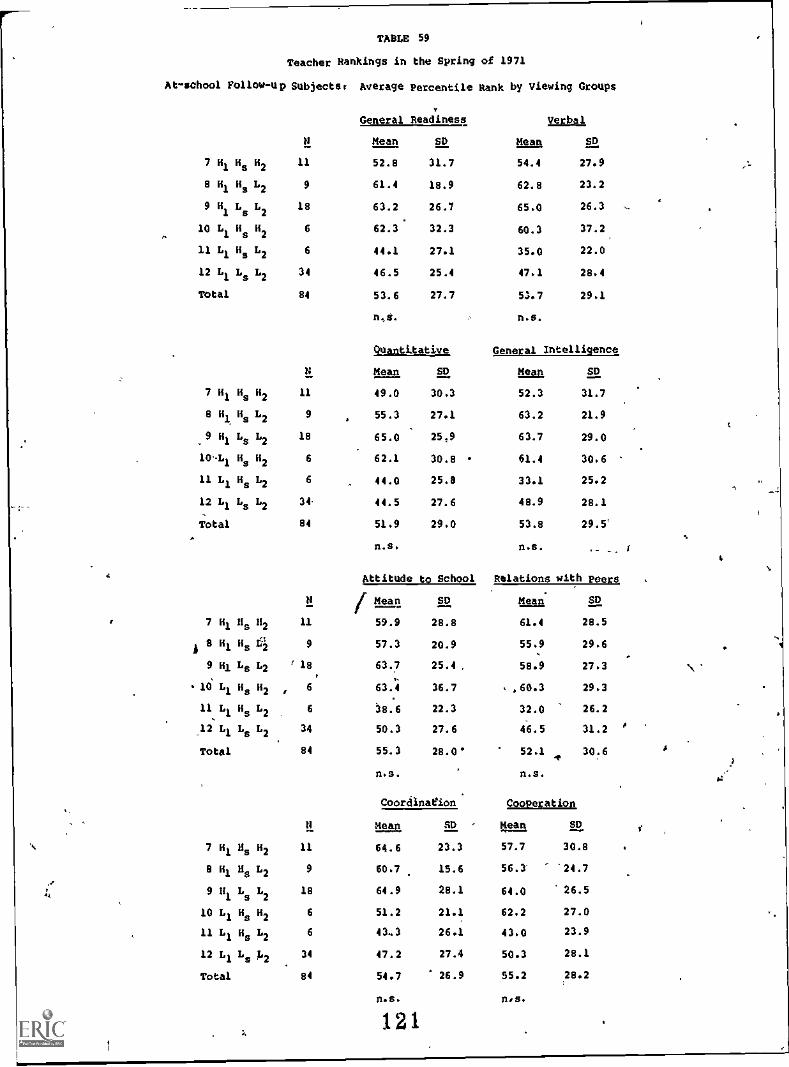
4
TABLE 59
Teacher Rankings in the Spring of 1971
At- school Follow-up Subjects:
N
Average Percentile Rank by Viewing Groups
,
General Readiness Verbal
Mean SD LIAR SD
7 H1
Hs 142 11 52.8 31.7 54.4 27.9
8 H1HsL2 9 61.4 18.9 62.8 23.2
9 H L L 18 63.2 26.7 65.0 26.31 s 2
.
10 L1
Hs
H2
6 62.3 32.3 60.3 37.2
11 L1
HsL2
6 44.1 27.1 35.0 22.0
12 L1LsL2
34 46.5 25.4 47.1 28.4
Total 84 53.6 27.7 53.7 29.1
n.,S. n.s.
Quantktative General Intelligence
N Mean SD Mean SD
7 H1
HsH2 11 49.0 30.3 52.3 31.7
6 H14Hs L
29 55.3 27.1 63.2 21.9
.
9 H1LsL2
18 65.0 25.9 63.7 29.0
10L1Hs
H2
6 62.1 30.8 61.4 30.6
11 L1Hs L
2 6 44.0 25.8 33.1 25.2
12 L1 L3 1a2 34 44.5 27.6 48.9 28.1
Total 84 51.9 29.0 53.8 29.5'
n.s. n.s.
Attitude to School Relations with Peers
N Mea n SD Mean SD
7 112 its 02 11
ir
59.9 28.8 61.4 28.5
8 H2 Hs X 9 57.3 20.9 55.9 29.6
9 HI Ls L2 ' 18 63.7 25.4 , 58.9 27.3 \18 L1 Hs H2 6 63.4 36.7 .60.3 29.3
.
11 L1 Hs L2 6 38.6 22.3 32.0 26.2
_12 L1 Ls L2 34 50.3 27.6 46.5 31.2
Total 84 55.3 28.0 52.1 v 30.6
n.s. n.s.
Coordination Cooperation
it mean SD , 4ssa SD
7 H1
Its H2
11 64.6 23.3 57.7 30.8
8 H1
HsL2
9 60.7 15.6 56.3 24.7
9 u1 LsL2
18 64.9 28.1 64.0 26.5
10 L1
Hs
H2
6 51.2 21.1 62.2 27.0
11 L1 H s 12 6 43. 3 26.1 43.0 23.9
12 L1 Ls L2 34 47.2 27.4 50.3 28.1
Total 84 54.7 26.9 55.2 28.2
n.s. 11,8,
121
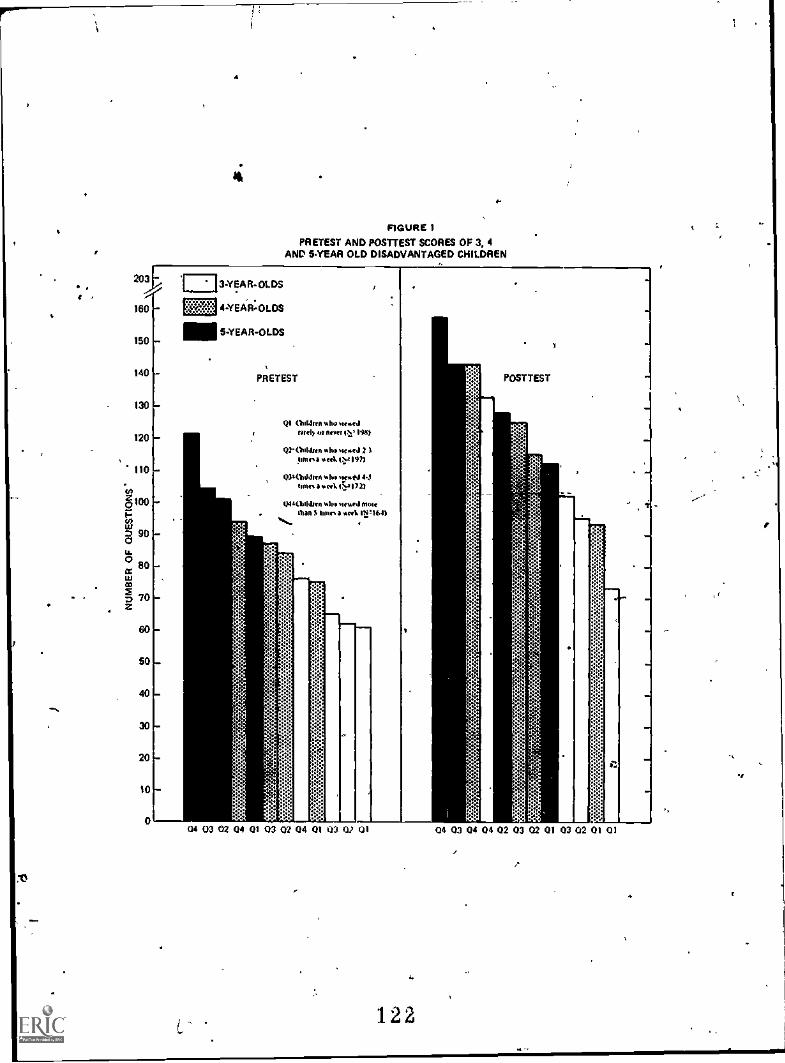
,4
203E,
.-/..100
150
140
130
120
110 L.
io02100I:MZ 900u.
80cctoto2 702
60
50
40
30
20
10
A
4..
FIGURE 1
PRETEST AND POSTTEST SCORES OF 3, 4AND 5YEAR OLD DISADVANTAGED CHILDREN
1=3-YEAR-OLDS
4-YEAR;OLDS
11111 5-YEAR-OLDS
EM
PRETEST
QI Oaken u he votomlratgly ot neva ill' N4)
Ql'011teen oho .104.411 1
pm ess *eel. it..11971
03taiddrol who veto,t1 4.$tunes a ....). I S'1721
POSTTEST
Ola(lulargn who .1...0.1ma.Man S bows a we, it:2164)
''.... ,
"D.
04 03 02 04 01 03 02 04 01 03 01 01
.,
..
122
......
04 03 04 04 02 03 02 01 03 02 01 01
r
.
t
Om
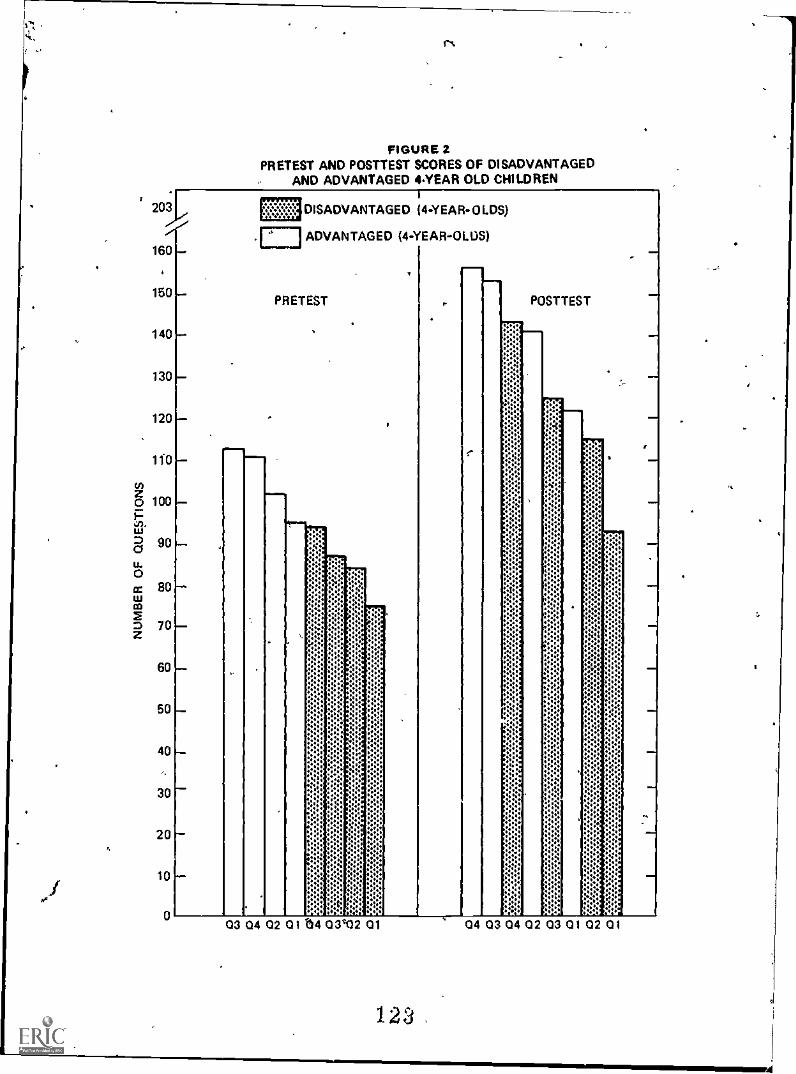
Ist
FIGURE 2PRETEST AND POSTTEST SCORES OF DISADVANTAGED
AND ADVANTAGED 4YEAR OLD CHILDREN
203
160
150
140
130
120
cr,
0 100
90
U.0SO
wco
z 70
60
50
40
30
20
10
yr,
DISADVANTAGED (4-YEAR-OLDS)
ADVANTAGED (4-YEAR-OLDS)
PRETEST POSTTEST
::: :0.:ili: :44:::: :::::
:.: .0. :::444,:': ::.:
4:44,$: t::0.44 n AS4.
4400.44*
::.
:.::!:: ::1
M.:,
444
:44:::44:444.::: :'AI:
i : : :::::::4..00
::4:::: 0
44. A. :::::::....
04 03 04 02 03 01 02 01
12S
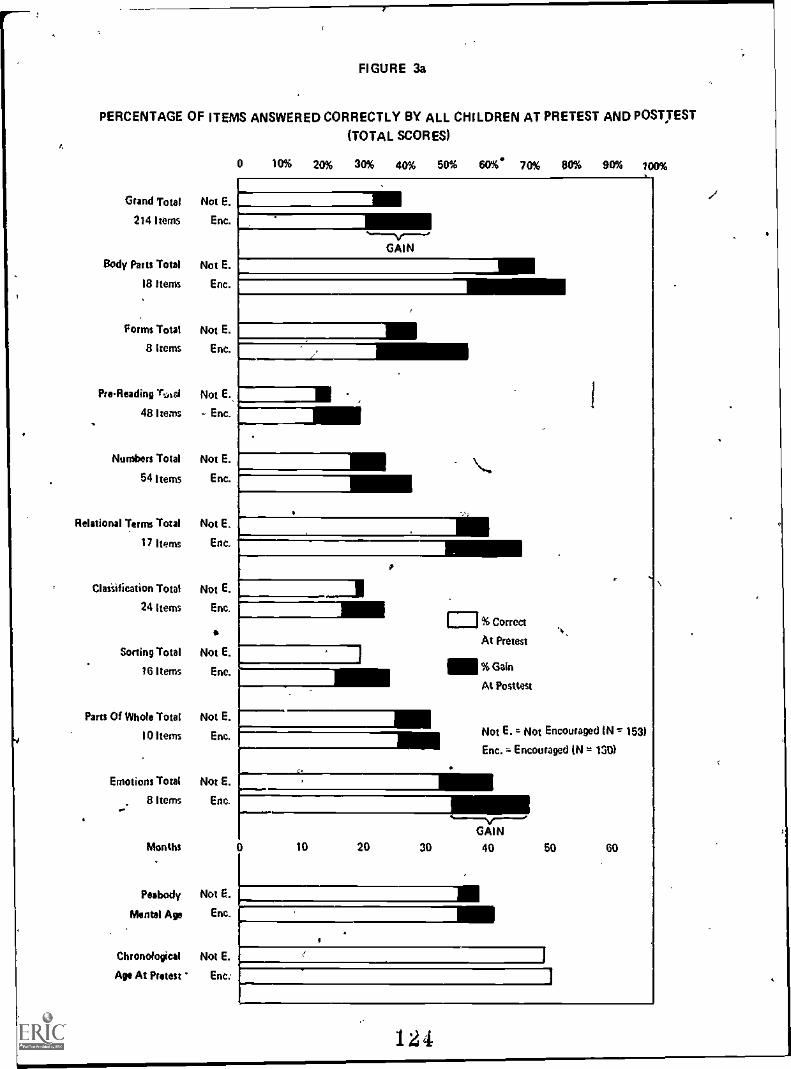
FIGURE 3a
PERCENTAGE OF ITEMS ANSWERED CORRECTLY BY ALL CHILDREN AT PRETEST AND POSTTEST
(TOTAL SCORES)
Grand Total Not E.
214 Items Enc.
Body Parts Total Not E.
18 Items Enc.
Forms Total Not E.
8 Items Enc.
PreReadingnAal Not E.
48 Items - Enc.
Numbers Total Not E.
54 Items Enc.
Relational Terms Total Not E.
17 Items Enc.
Clasiification Total Not E.
24 Items Enc.
rSorting Total Not E.
16 Items Enc.
Pam Of Whole Total Not E.
10 Items Enc.
Emotions Total Not E.
8 Items Enc....
Months
Peabody Not E.
Mental Age Enc.
Chronological Not E.
Age At Protest ' Enc..
0 10% 20% 30% 40% 50% 60%. 70% 80% 90% 100%
=GAIN
a i
1
o
MI
CD% CorrectAt Pretest
IM %GainAt Posttest
Not E. v Not Encouraged IN =153)
Enc. :, Encouraged IN =130)
GAIN10 20 30 40 50 60
124
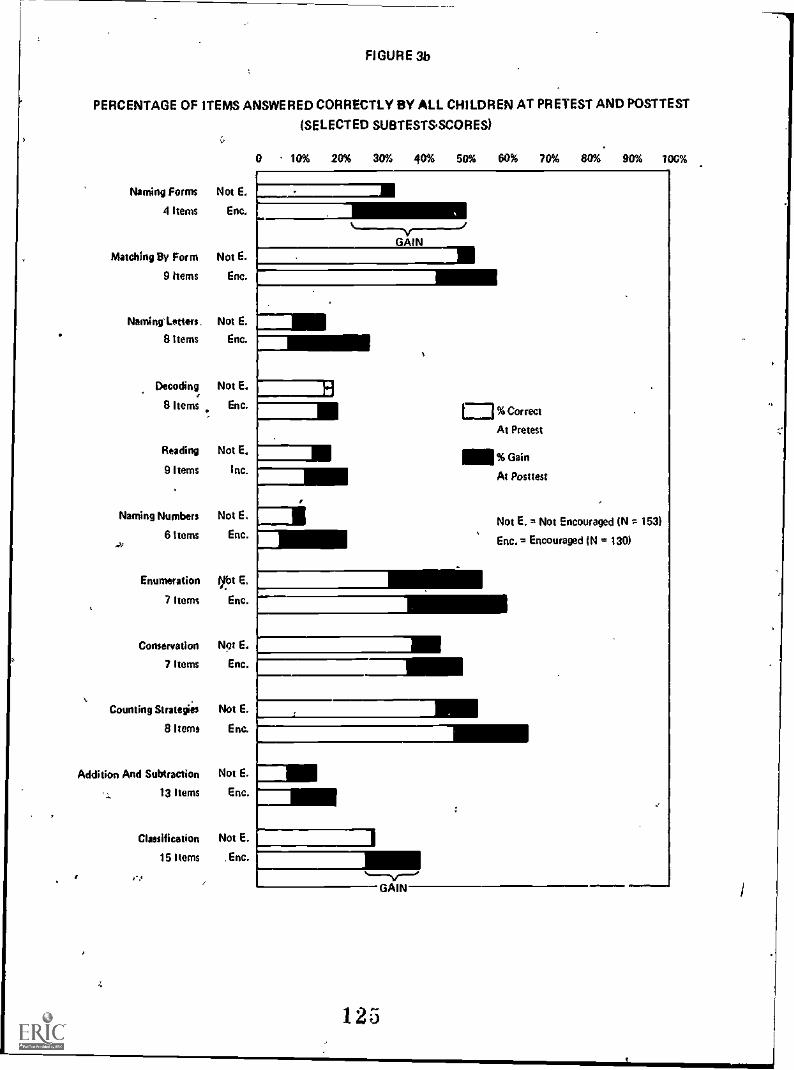
FIGURE 3b
PERCENTAGE OF ITEMS ANSWERED CORRECTLY BY ALL CHILDREN AT PRETEST AND POSTTEST
(SELECTED SUBTEST&SCORES)
0 10% 20% 30% 40% 50% 60% 70% 80% 90% 100%
Naming Forms Not E.
4 Items Enc.
Matching By Form Not E.
9 Hems Enc.
Naming'Letters. Not E.
8 Items Enc.
Decoding Not E.
8 Items Enc.
Reading Not E.
9 Items Inc.
Naming Numbers Not E.
6 Items Enc.
Enumeration Vbt E.
7 Items Enc.
Conservation Nnt E.
7 Items Enc.
Counting Strategies. Not E.
8 Items Enc.
Addition And Subtraction Not E.
13 Items Enc.
Classification Not E.
15 Items , Enc.
GAIN
=MI
a = %CorrectAt Pretest
MI% GainAt Posttest
Not E. = Not Encouraged IN z 153)
Enc.= Encouraged IN = 130)
125
0
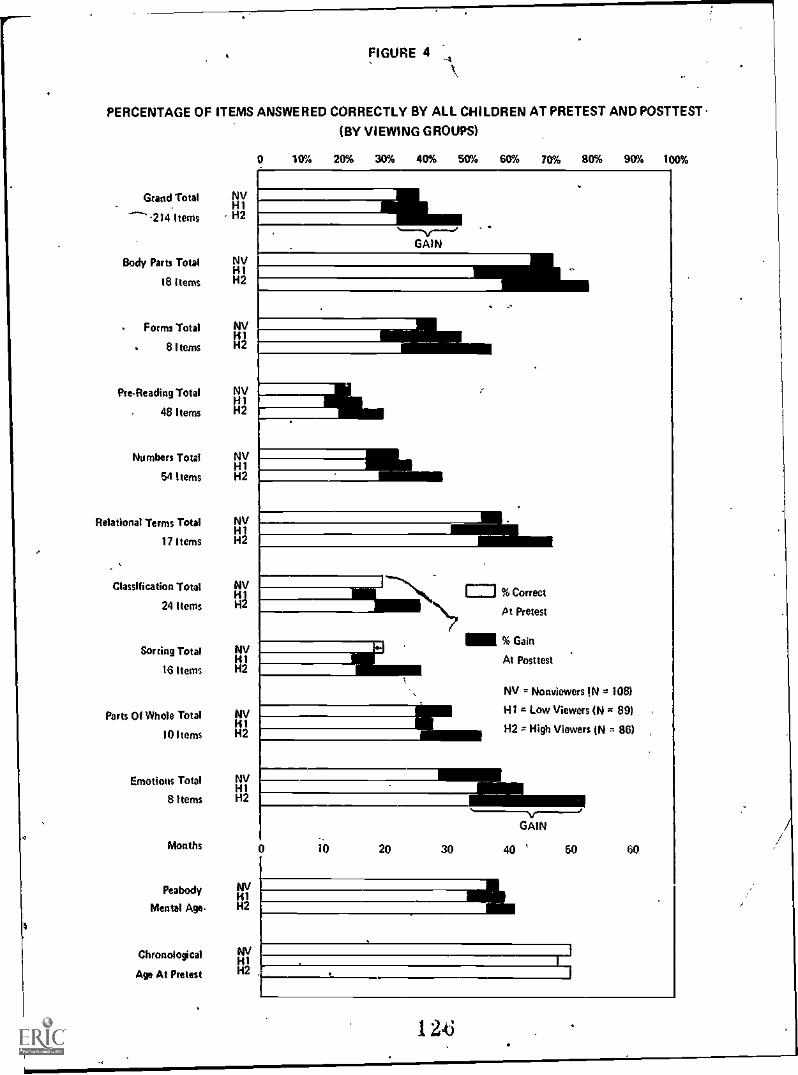
I
FIGURE 4 :4
PERCENTAGE OF ITEMS ANSWERED CORRECTLY BY ALL CHILDREN AT PRETEST AND POSTTEST
(BY VIEWING GROUPS)
Grand Total NV. 141
-----* -214 Items H2
Body Parts Total14NV1
18 Items H2
Forms Total NVH1
8 Items H2
PreReading Total NVHi
48 Items H2
Numbers Total NVH1
54 hems H2
Relational Terms Total NVH1
17 items H2
Classification Total NVH1
24 Items H2
Sorting Total NV141
16 Items H2
Parts Of Whole Total NVH1
II) items H2
Emotions Total NV1
8 Items H2
Months
Peabody
Mental A.
Chronological
Age At Pretest
NV
H2H1
10% 20% 30% 40% 50% 60% 70% 80% 90% 100%
..v.....GAIN
4-
-lb-CD % Correct
Pt Pretest
I= % Gain
At Pastiest
NV = Nonviewers (N ,- 108)
HI z Low Viewers IN x 89)
142 = High Viewers IN = 86)
-----1111111\r----0GAIN
i0 20 30 40 ' 50 60
46NVH1H2
I
t_
i!1
1 243
i.
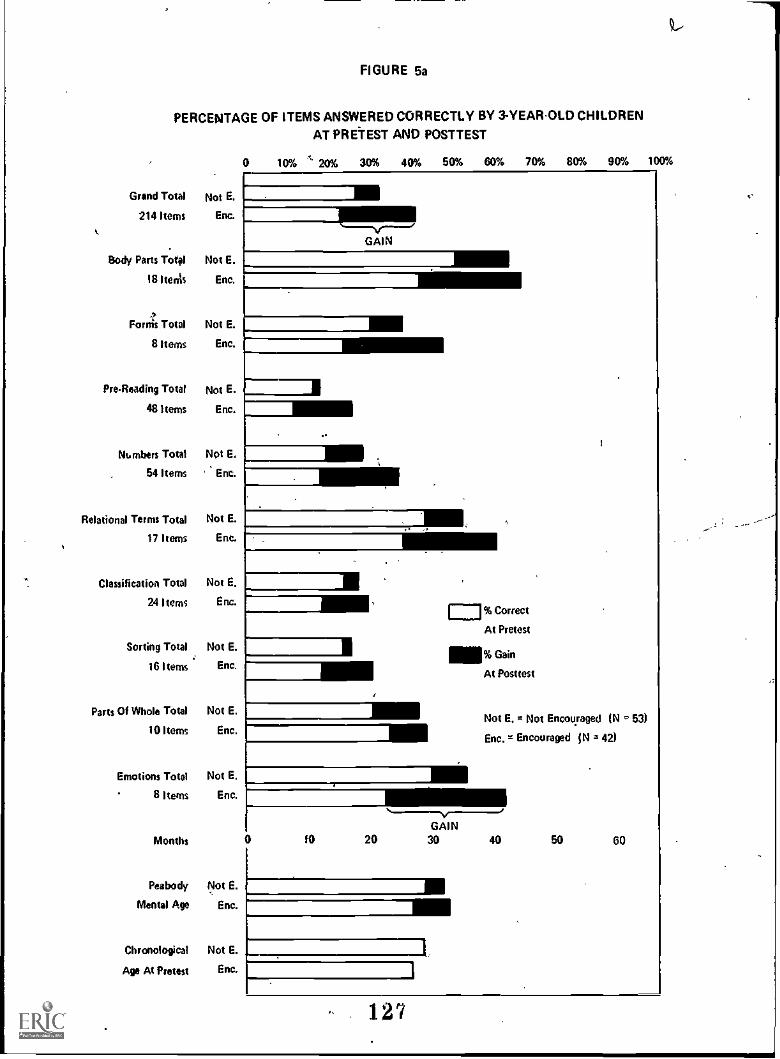
l
it.
FIGURE 5a
PERCENTAGE OF ITEMS ANSWERED CORRECTLY BY 3.YEAROLD CHILDRENAT PRETEST AND POSTTEST
0 10% 20% 30% 40% 50% 60% 70% 80% 90% 100%
Grand Total Not E.
214 Items Enc.
Body Parts Total Not E.
18 heats Enc.
1For ms Total Not E.
8 hems Enc.
PreReading Total Not E.
48 Items Enc.
Numbers Total Not E.
54 Items . Enc.
Relational Terms Total Not E.
17 hems Enc.
Classification Total Not E.
24 Items Enc.
Sorting Total Not E.
16 Items Enc.
Parts Of Whole Total Not E.
10 Items Enc.
Emotions Total Not E.
8 Items Enc.
, 7GAIN
ED % Correct
At Pretest
.111% GainAt Posttest
1
Not E. a Not Encouraged (N 3 53)
Enc. = Encouraged IN a 42/
Months 0
Peabody Not E.
Mental Age Enc.
Chronological Not E.
Age At Pretest Enc.
..-----v---,GAIN
10 20 30 40 50 60
a
127
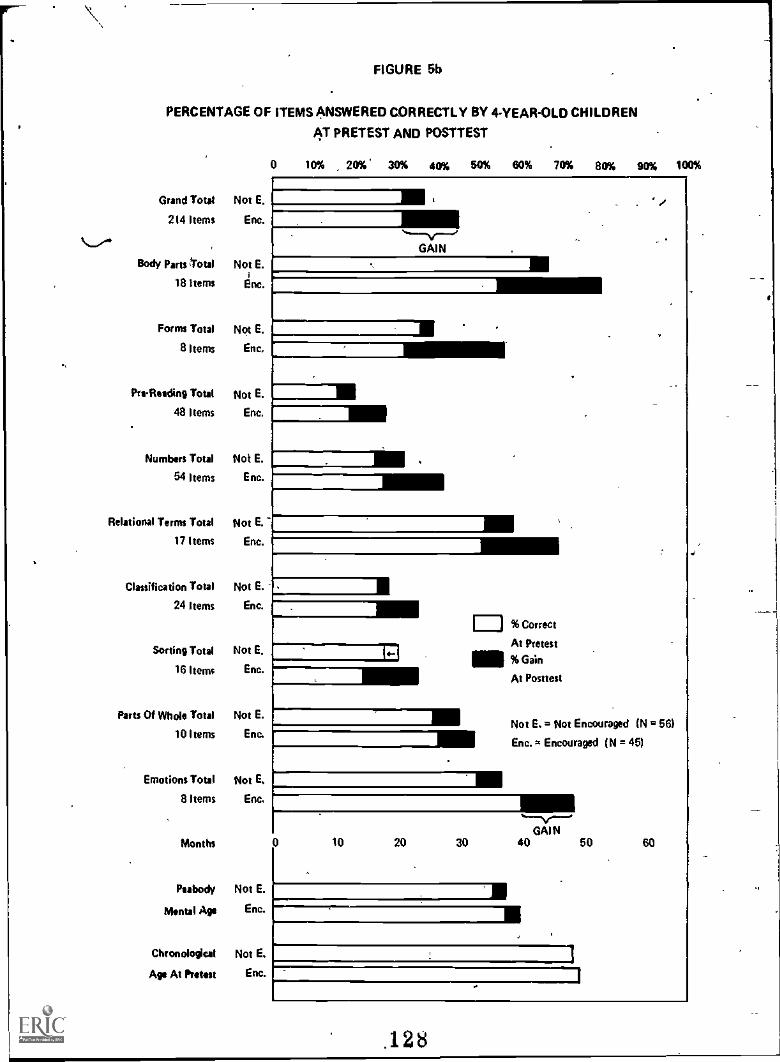
.
FIGURE 5b
PERCENTAGE OF ITEMS ANSWERED CORRECTLY BY 4YEAR-OLD CHILDREN
AT PRETEST AND POSTTEST
0 10% 20% 30% 40% 50% 60% 70% 80% 90% 100%
Grand Total Not E.
214 hems Enc.
Body Parts total Not E.
18 Items 4110.
Forms Total Not E.
8 Items Enc,
PreReeding Total Not E.
48 Items Enc.
Numbers Total Not E.
54 Items Enc.
Relational Terms Total Not E.
17 Items Enc.
Classification Total Not E.
24 Items Enc.
Sorting Total Not E.
16 Items Enc.
Parts Of Whole Total Not E.
10 Items Enc.
Emotions Total Not E.
8 Items Enc.
Months
Peabody Not E.
Monts, Age Enc.
Chronological Not E.
Age At Pretest Enc.
M...-.v....
GAIN
Il% Correct
At Pretest
11111 %GainAt Posttest
111. ' i
- Not E. = Not Encouraged DV = 56)
IMIEnc. u Encouraged (N = 45)
MEGAIN
10 20 30 40 50 60
-II
.128
1
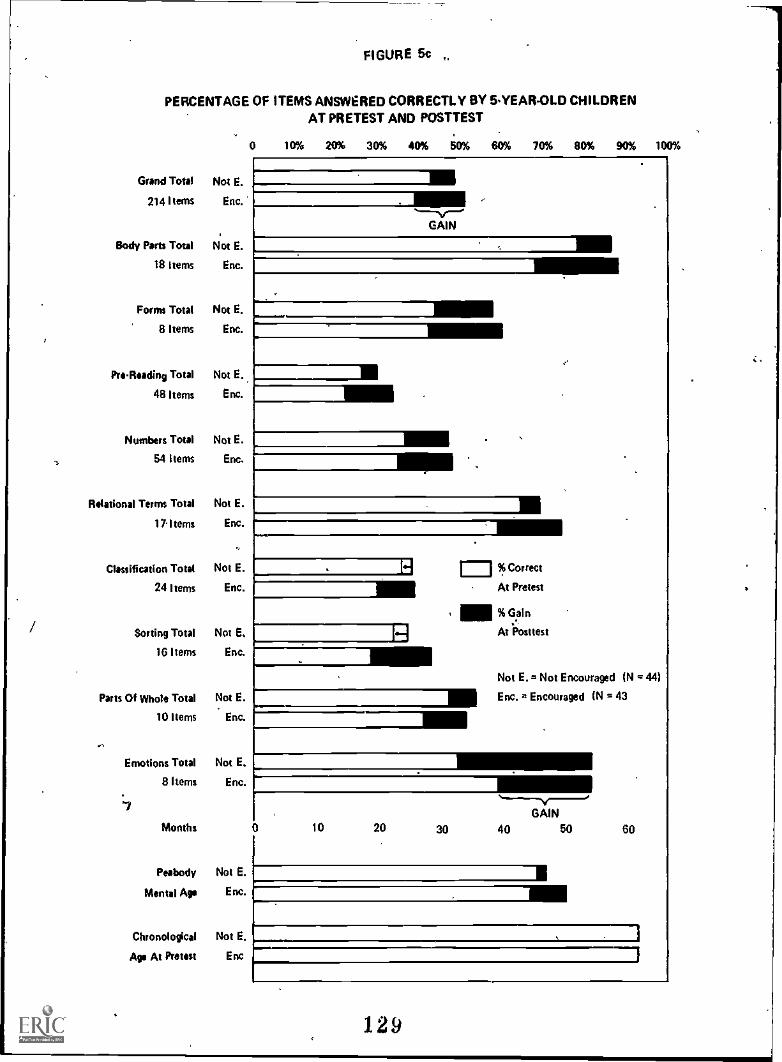
FIGURE 5c
PERCENTAGE OF ITEMS ANSWERED CORRECTLY BY 5-YEAR-OLD CHILDRENAT PRETEST AND POSTTEST
0 10% 20% 30% 40% 50% 60% 70% 80% 90% 100%
Grand Total Not E. r M214 Items Enc.
!Jody Parts Total Not E.
18 Items Enc.
Forms Total Not E.
8 Items Enc.
PreReading Total Not E.
48 Items Enc.
Numbers Total Not E.
, 54 Items Enc,
Relational Terms Total Not E.
17.1tems Enc.
Classification Total Not E.
24 Items Enc.
Sorting Total Not E.
16 Items Enc.
Parts Of Whole Total Not E.
10 Items Enc.
ol
Emotions Total Not E.
8 Items Enc.
"7
Months
Peabody Not E.
Mental Aga Enc.
Chronological Not E.
Aga At Pretest Enc
..Thf..GAIN
ME
M1-1
% Correct
At Pretest
IIIII % Gain.
At Posttest
Not E. Not Encouraged IN 44)
alEnc. n Encouraged IN r- 43
.-----y,GAIN
10 20 30 40 50 60
6OE
I
129
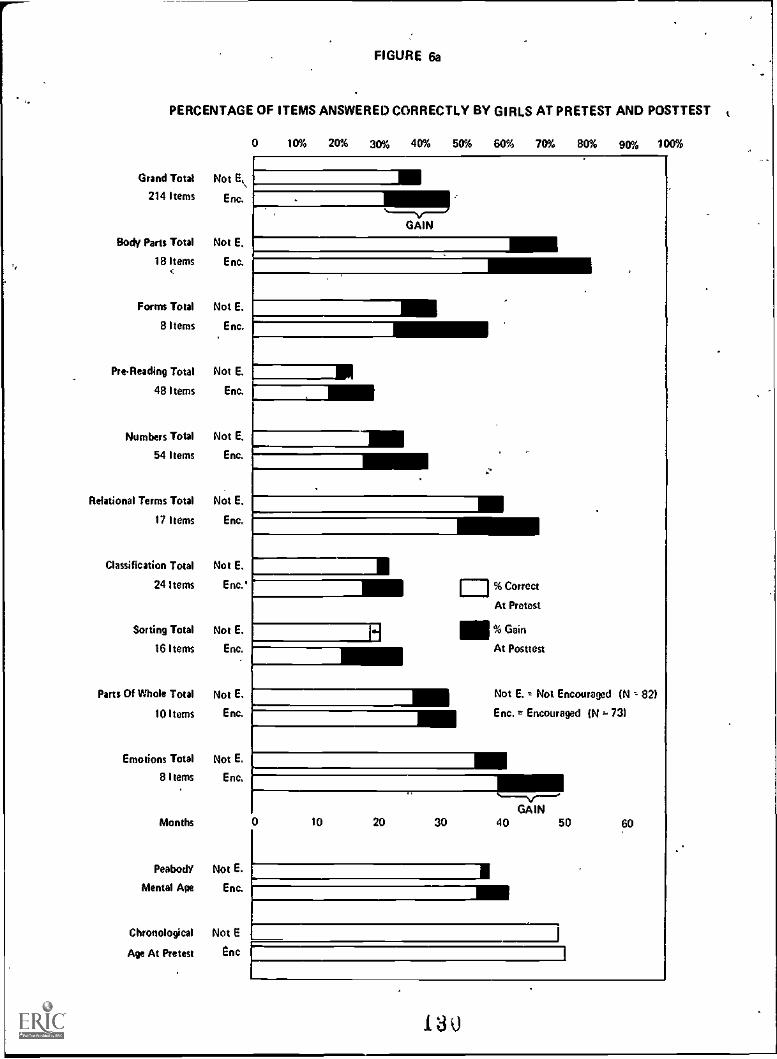
FIGURE 6a
PERCENTAGE OF ITEMS ANSWERED CORRECTLY BY GIRLS AT PRETEST AND POSTTEST t
Grand Total Not E\
214 Items Enc.
Body Parts Total Not E.
18 Items Enc.
Forms Total Not E.
8 Items Enc.
PreReading Total Not E.
48 Items Enc.
Numbers Total Not E.
54 Items Enc.
Relational Terms Total Not E.
17 Items Enc.
Classification Total Not E.
24 Items Enc.'
Sorting Total Not E.
16 Items Enc.
Parts Of Whole Total Not E.
10 Items Enc.
Emotions Total Not E.
8 Items Enc.
Months
Peabody Not E.
Mental Ape Enc.
Chronological Not E
Age At Pretest Eric
0 10% 20% 30% 40% 50% 60% 70% 80% 90% 100%
GAIN
-
H
0 % CorrectAt Pretest
1111 % Gain
At Posttest
Not E. = Not Encouraged (N -- 82)
Enc. ri Encouraged (N 73)
GAIN10 20 30 40 50 60
1------M
1 3 0
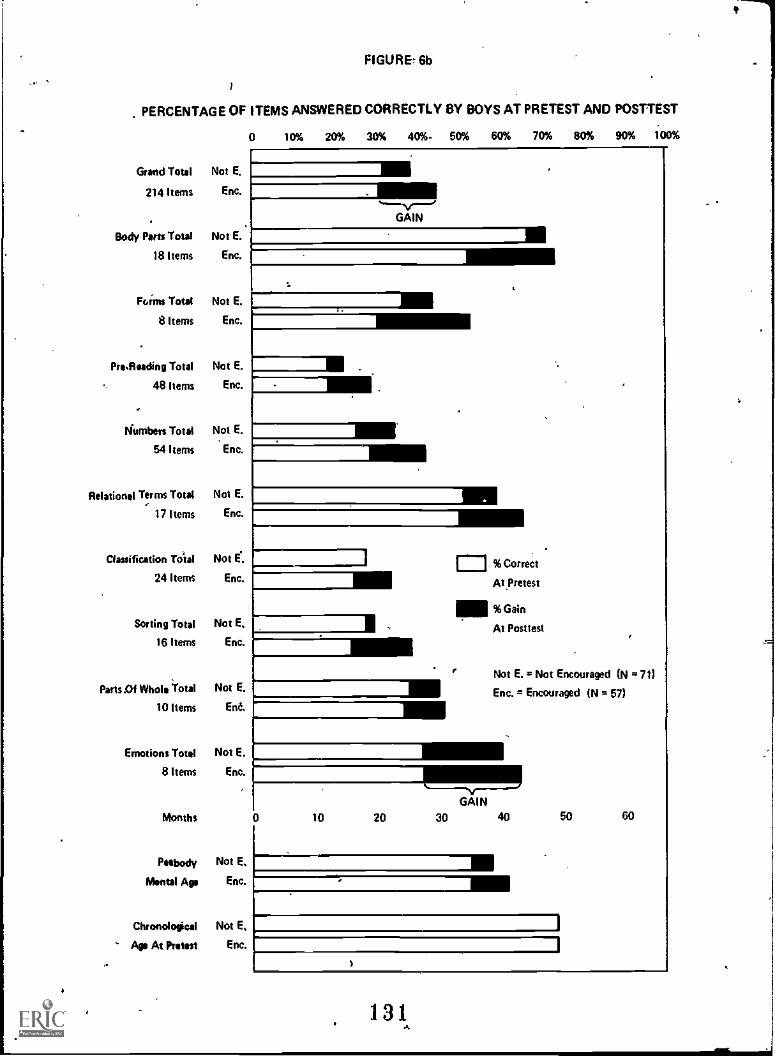
FIGUREt 6b
)
PERCENTAGE OF ITEMS ANSWERED CORRECTLY BY BOYS AT PRETEST AND POST-TEST
0 10% 20% 30% 40%. 50% 60% 70% 80% 90% 100%
Grand Total Not E.
214 Items Enc.
Body Parts Total Not E.
18 Items Enc.
Foims Total Not E.
8 Items Enc.
PraReading Total Not E.
48 Items Enc.
!slumbers Total Not E.
54 Items Enc.
Relational Terms Total Not E.
17 Items Enc.
Classification Tole! Not E.
24 Items Enc.
Sorting Total Not E.
16 items Enc.
Parts Of Whole Total Not E.
10 Items End.
Emotions Total Not E.
8 Items Enc.
Months
Peabody Not E.
Mental Age Enc.
Chronological Not E.
Ap At Pretest Enc.
.....v.--0GAIN
Ell1 ,
.
E3 %CorrectAt Pretest
MI %GainAt Posttest
. Not E. = Not Encouraged (N = 71)= Enc. = Encouraged (N L 57)
GAIN10 20 30 40 50 60
1
1314
.
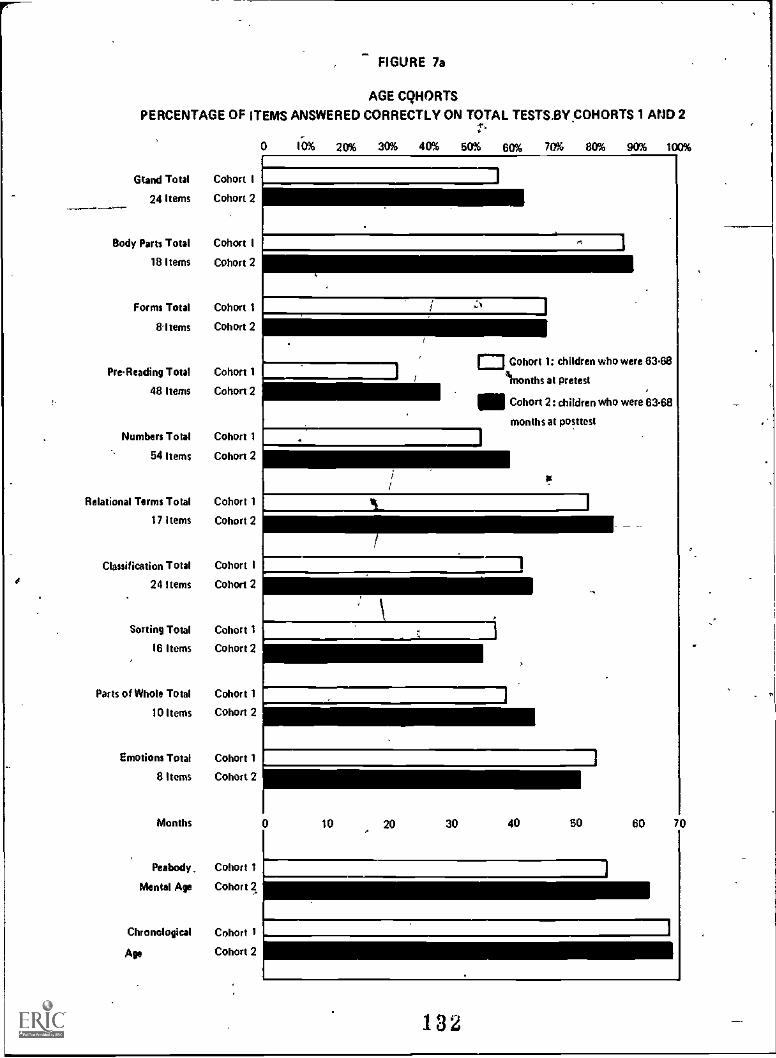
FIGURE 7a
AGE COHORTS
PERCENTAGE OF ITEMS ANSWERED CORRECTLY ON TOTAL TESTSBY COHORTS 1 AND 2;".
0 10% 20% 30% 40% 50% 60% 70% 80% 90% 100%
Gtand Total Cohort 1
24 Items Cohort 2
Body Parts Total Cohort 1
18 Items Cohort 2
Forms Total Cohort 1
8-Items Cohort 2
PreReading Total Cohort 1
48 Items Cohort 2
Numbers Total Cohort 1
54 Items Cohort 2
Relational Terms Total Cohort 1
17 Items Cohort 2
Classification Total Cohort 1
24 Items Cohort 2
Sorting Total Cohort 1
16 Items Cohort 2
Parts of Whole Total Cohort 1
10 Items Cohort 2
Emotions Total Cohort 1
8 Items Cohort 2
Months
Peabody. Cohort 1
Mental Age Cohort 2
Chronological Cohort 1
Age Cohort 2
..,
t
1:=3 Cohort 1: children who were 63.68
months at pretest
11111 Cohort 2: children who were 63.68
months at posttest
I
10 20 30 40 50 60 70
132
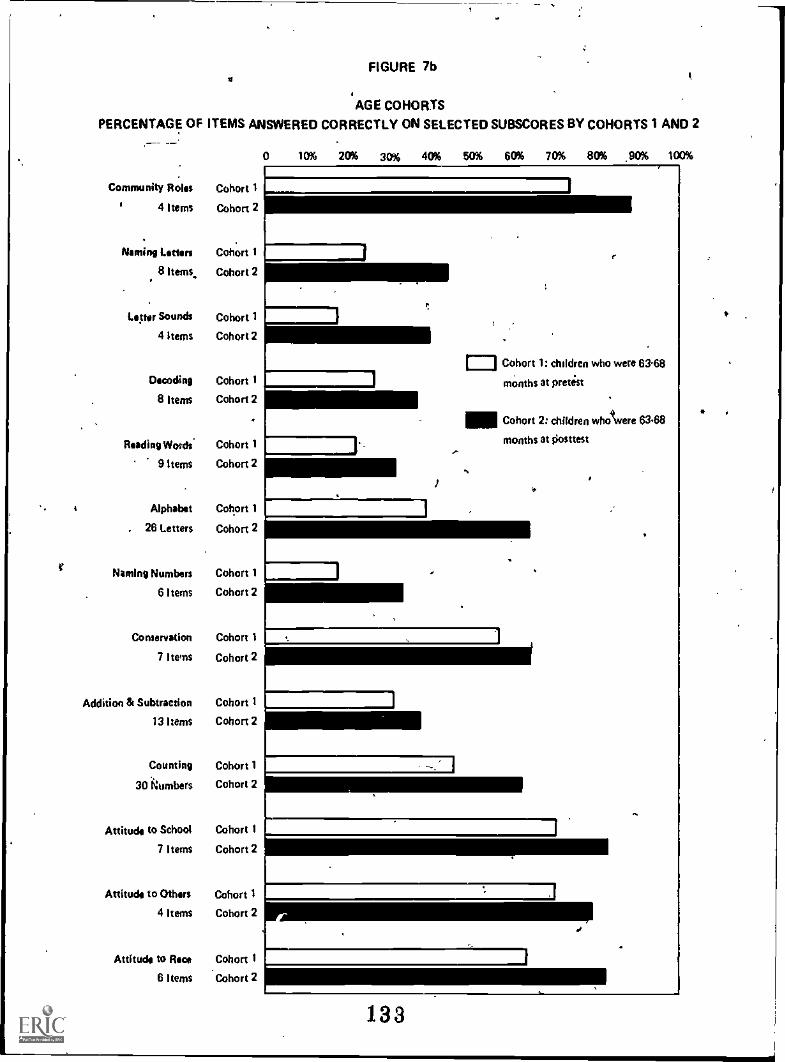
FIGURE 7be 4
AGE COHORTS
PERCENTAGE OF ITEMS ANSWERED CORRECTLY ON SELECTED SUBSCORES BY COHORTS 1 AND 2
Community Roles Cohort 11 4 Items Cohort 2
Naming Lefton Cohort 1
8 Items, Cohort 2
Letter Sounds Cohort 1
4 Items Cohort 2
Decoding Cohort 1
8 Items Cohort 2
Reading Words. Cohort 1
9 Items Cohort 2
Alphabet Cohort 1
. 26 Letters Cohort 2
Naming Numbers Cohort 1
6 Items Cohort 2
Conservation Cohort 1
7 items Cohort 2
Addition & Subtraction Cohort 1
13 Items Cohort 2
C01400449 Cohort 1
30 Numbers Cohort 2
Attitude to School Cohort 1
7 Items Cohort 2
Attitude to Others Cohort 1
4 Items Cohort 2
Attitude to Rea Cohort 1
6 Items Cohort 2
0 10% 20% 30% 40% 50% 60% 70% 80% 90% 100%
I
I
r
Cohort 1: children who were 6348
months at pretist
IIICohort 2: children who vere 63.68
months at Posttest
,
133
*
i