Embed Size (px)
Citation preview

DOCUMENT RESUME
ED 380 840 CS 508 861
AUTHOR Thompson, David RussellTITLE The Digital Daily: How Will Readers React?PUB DATE Mar 95NOTE 27p.; Paper presented at the Meeting of the
Association for Education in Journalism and MassCommunication, Southeast Colloquium (Gainesville, FL,March 9-11, 1995).
PUB TYPE Speeches/Conference Papers (150) ReportsResearch /Technical (143)
EDRS PRICE MF01/PCO2 Plus Postage.DESCRIPTORS *Computer Attitudes; Computers; Higher Education;
*Information Dissemination; *Journalism; Man MachineSystems; *Mass Media; *Mass Media Role; *Newspapers;Surveys; Television; Undergraduate Students
IDENTIFIERS Technological Adaptability
ABSTRACTAs publishers make the transition from ink-onpaper
to digitalized messages, researchers must ask whether the system isthe solution. Are there advantages to presenting newspaper content oncomputers? Or do people prefer to handle paper? A study reportedsubjects' self-report responses regarding interface between people(experimental subjects) and modality (paper, computer, multimedia).Each of the 75 subjects participating in the study were givenquestionnaires to rate their responses to the different media.Fifty-five of the participants were U.S. undergraduate studentsenrolled in journalism classes. Twenty subjects were universitylibrary employees, recruited as "expert" searchers. The studyrevealed significant effects for interestingness, pleasingness, imageinterestingness, and image p'easantness as a function of modality.For each of these measures, multimedia was rated the highest,followed by computer and p,per. Although the study did not addressmemory, the results suggest that the primacy of print theory may belosing its predictive power. No effect was found for text as afunction of modality. Perhaps perceived differences betweenmodalities are diminishing. Further research might confirm thissuggestion. Researchers may begin to notice less and less cognitiveand behavioral resistance to computerized information deliverysystems. And they may notice more resistance to ink-on-paper. To meetsuch evolving expectations, researchers and newspaper professionalsmay apply results of this study to design effective interactivemultimedia systems and content. (Seven figures and two data tablesare included. Contains 53 references.) (TB)
************************************************************************ Reproductions supplied by EDRS are the best that can be made *
f-om the original document. 7:
*********************A4U***********************************************
O00O00Cr)
The Digital Daily: How will readers react?
by
David Russell Thompson, Ph.D.Assistant Professor
University of South Carolina
Presented to the Newspaper Division,AEJMC Southeast Colloquium,
at the University of Florida, Gainesville, FL,March 9-11, 1995
David R. Thompson, Ph.D.College of Journalism & Mass CommunicationsUniversity of South CarolinaColumbia, South Carolina 29208(803) 777-6898fax (803) 777-4103e -mail: [email protected]
L.
U DEPARTMENT OF If DUCATOON(MK, of Educithonat Romarch and Unmans:hem
EDUCATIONAL RESOURCES INFORMATIONCENTER (ERIC)
)(his document has been reproduced etcowed from IN Paxson or orgamtatton
phonating ttO Mmor changes have been made to anproes
rProduchon Quality
Points of view Oe opinions stetted In thisdocu-mint do not rtectesanty footmen, officialOERI poanton or Poky
'PERMISSION TO REPRODUCE THISMATERIAL HAS BEEN GRANTED BY
TO THE EDUCATIONAL RESOURCESINFORMATION CENTER (ERIC)"
The Digital Daily: How will readers react?
ABSTRACT
This study anticipates a possible future method of newspaper design and delivery.
Some "digital dailies" may include multimedia content -- computer-based information that
includes audio and video presented by interactive technology.
As publishers make the transition from ink-on-paper to digitized messages, researchers
must ask: Is the system the solution? Are there advantages to presenting newspaper contenton computers? Or do people prefer to handle paper?
This paper reports subjects' self-report responses regarding the interface between
people (experimental subjects) and modality (paper, computer, multimedia).
The study revealed significant effects for interestingness, pleasingness, image
interestingness, and image pleasingness as a function of modality. For each of these measures,
multimedia was rated the highest, followed by computer and paper.
Although this stud:. does not address memory, these results suggest that the primacy of
print theory may be losing its predictive power. No effect was found for text as a function of
modality. Perhaps perceived differences between modalities are diminishing. Further research
may be conducted to confirm this suggestion.
Researchers may begin to notice less and less cognitive and behavioral resistance to
computerized information delivery systems. And they may notice more resistance to ink-on-
paper. Yesterday's students have grown up with television in the borne. Today's students are
growing up with computers in the home and in the classroom. Tomorrow's media consumers
may expLct interactive multimedia systems to deliver news and information.
To neet such evolving expectations, researchers and newspaper professionals may
apply results of this study to design effective interactive multimedia systems and content.
3
1
Introduction and Literature Review
This baseline study anticipates a possible future method of newspaper design and
delivery. New computer and telephone technologies have made it possible to conceive of
newspapers as computer-based information delivery systems that include audio and video
presented by interactive technology systems.
"New media," or interactive technologies are often referred to as multimedia.
Multimedia is a system that "supports data other than text" (Nelson 1991, p. 3). Multimedia is
sometimes called "hypermedia." The two terms are used interchangeably in this study.
The ink-on-paper newspaper may never be replaced (Fidler 1991b, p. 121), but news is
already being presented using interactive technology. Multimedia technology is here and in use
(Brand, 1988; Cook, 1984; Don, 1992; Elmer-Dewitt, 1993; Fidler, 1991a, 1991b, 1992;
Glushko, 1990; Marchionini, 1989; Matazzoni, 1992; Todd, 1993; Zoglin & Elmer-Dewitt,
1993). But, as researchers, we must ask: Is it better?
Although some research has tested memory and information location across print and
computer modalities, this researcher's literature review has failed to disclose research that
applied subjective, self-report measures to multimedia.
Actually, this research begins to challenge the primacy of print theory. The primacy of
print theory states that information is read faster and remembered better when presented in a
print modality than in other modalities (De Fleur, Davenport, Cronin, & De Fleur, 1992;
Furnham, Benson, & Gunter, 1987; Furnham & Gunter, 1985; Furnham, Proctor, & Gunter,
1988; Gunter & Furnham, 1986; Gunter, Furnham, & Gietson, 1984; Gunter, Furnham, &
Leese, 1986).
Several possible explanations may account for the primacy of print. These include
depth of processing, self-pacing, and interference (Furnham & Gunter 1989, p. 309).
4

2Furnham, Proctor, & Gunter (1988, p. 935) present possible explanations for the
"superiority of written communication for memorizing material":
It is argued that reading is self-paced while the speed of a radio or televisionbroadcast is determined by the producer. The reader is able to go back overmaterial which he may find difficult to understand. The viewer or listener, onthe other hand, has only one chance to comprehend information. Reading, andto some extent listening, involves more sophisticated mental processing sincethe reader and listener have to conjure up their own mental images toaccompany what they read and hear. The television viewer has both picture andsound arranged in a form which requires a more passive form of attention.When asked to recall information, it is argued that the greater mental activityinvolved in reading and listening will result in better retention.
Multimedia may change this argument. With an interar 've multimedia system, the
user is both reader and viewer. And television-type content may be seen "on demand" -- a
more active form of attention.
The interactive multimedia system used for this experiment is self-paced. The "viewer"
controls if, when, and how often the audio-video content is played.
By extension of the primacy of print theory, active involvement with a message and its
medium may be perceived as simple, interesting and pleasing. Perhaps, multimedia content
and the modality itself will be perceived as more simple, interesting and pleasing than content
presented on paper or on a computer screen. This study examines that possibility.
After exposure to news, sports and entertainment stories presented in three different
modalities, each subject rates the simplicity, interestingness, and pleasingness of the modality
in general (paper, computer, multimedia), of the text, and of the image. Finally, the
experimenter collects 1) open-ended responses about the subjects' memory for the digitized
videos they had seen and heard in the multimedia modality, and 2) comments about each
modality.
Self-report measures of using different modalities may provide evidence of the
of 'veness of the human-computer interface (Borgman, 1984; Clarke, 1986; Kerr, 1986;
Leung, 1989; Moran, 1981; Teshiba & Chignell, 1988). In other words, the post-test should
provide an answer to: What modality is most user-friendly?
This study intended to advance theoretical understanding of the communication process
by applying cognitive psychology, psychology of reading, educational psychology, information
science and human factors (study of the human-computer interface) to mass communication
research.
Results of this study may provide a baseline for cross-modality mass communication
research that assesses the human-computer interface.

3
Research Question & Method
This paper reports results of a post-test questionnaire, the "soft" measures of exposure
to and use of different modalities. Other portions of the study that measure reading time,
memory, and information location (search time and search errors) are reported elsewhere
(Thompson 1993, 1994a, 1994b).
After using each modality (paper, computer, multimedia) to perform reading tasks and
information location tasks, the subjects were asked to respond to a questionnaire.
No directional predictions were made. The research question for this study was: What
do subjects' responses tell us about the three modalities?,
The first part of the questionnaire has been adapted from Price (1972) whose study
examined "the effect of newspaper design complexity on readership, comprehension,
interestingness and pleasingness."
Items asked the subject to rate the simplicity (complexity), interestingness, and
pleasingness of each modality on a scale of 1 (not at all) to 99 (very). Other items measured
the same aspects of the image or "movie" (digitized video) and text. So, the independent
variables were subject (to control for individual differences) and modality (paper, computer,
multimedia). And the dependent variables were modality simplicity (complexity), modality
interestingness, modality pleasingness, image simplicity, image interestingness, image
pleasingness, text simplicity, text interestingness, and text pleasingness.
The last part of the questionnaire consisted of two open-ended questions that
encouraged subjects to write out their reactions to the experiments. The first question was a
free recall item that asked about the movies -- what did you see? what did you hear? The
second question simply encouraged comments about the three different methods of presenting
news content.
With this questionnaire completed, the experimental session was terminated and a
debriefing statement was issued to the subject.
Here is a description of the study's design, materials, and procedure. This provides an
overview of what the subject -- the media user -- encountered. The full description of the study
has been included to provide background for the subjective measures the post-test
questionnaire.

4
Experimental Design
A randomized 3 X 3 Latin Square design was used. The cells of the Latin Square were
constructed by combining modality (paper, computer, multimedia) and story type (news,
sports, lifestyle).1 The rows of the Latin Square were treated as experimental orders. (See
Figure 1.)
Figure 1. The Latin Square design
Order 1 C + N P + S M + E
Order 2 P + E M + N C + S
Order 3 M+ S C+ E P+ N
ModalityP = PaperC = ComputerM = Multimedia
Story TypeN = NewsS = SportsE = Entertainment
This Latin Square was treated as a within-subjects design. Each subject saw each
modality and each story type. The orders determined the combination of story type and
modality to which each subject was exposed, and subjects were randomly assigned to orders.
Subjects
Seventy-five individuals participated in this study. Fifty-five of those were U.S.
undergraduate students enrolled in journalism classes who participated for course credit.
Twenty subjects were university library employees, recruited as "expert" searchers (necessary
to test information location measures). These subjects volunteered their time. All subjects
were debriefed about the purposes of the study afterwards.
Materials
A selective sample of stories was used in order to accommodate the multimedia
condition. The multimedia condition required a short (5-8 second) "sound bite." This methodwas used to avoid the expense of producing news stories.
Story type is not a factor in this portion of the study. Story type was included as a control factor, tocontrol for prior knowledge of content domains. Actually, significant effects were found for reading time,memory, search time and search errors as a function of story type.
7
5
The source of the stories was CNN "Headline News," January 10-14, 1993 (Sunday -
Thursday). For the reading time and memory tasks, three stories from a sample of 48 were
selected one for each story type (news, sports, entertainment). For the information location
tasks, twelve stories were used -- four for each story type. These 12 stories were different from
the three stories used for the reading time and memory tasks, so no practice effects or learning
effects occurred. Stories considered for selection included enough information to write a 180
word print story and had a 5-8 second audio-video segment that could stand alone as a sound
bite.
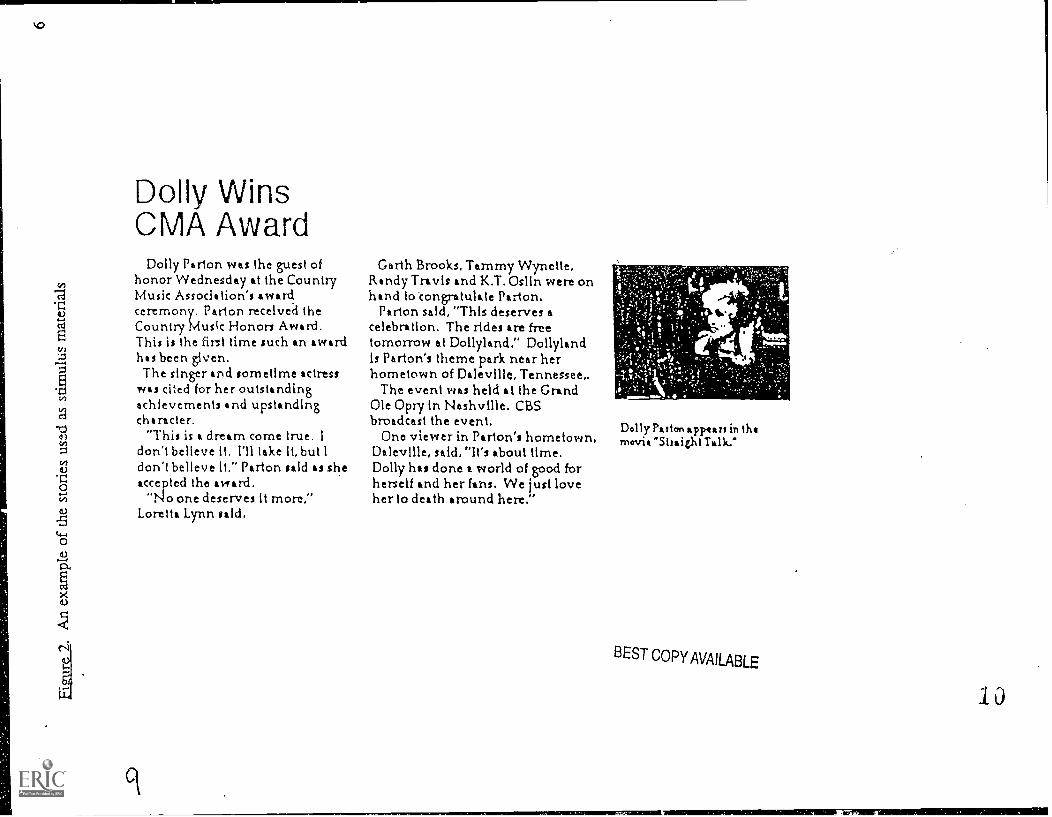
Following Oborne & Holton's (1988, pp. 4-5) suggestions for experimental controls,
stimulus materials used in this study were written by the researcher. See Figure 2 for an
example of a story layout used in this experiment. Each story unit included a headline, text,
photo, and photo caption. This story format was based on a review of mass communication
literature (Bain, 1980, p.2; Barnhurst, 1991, pp. 21-22; Dillon, Richardson, & McKnight, 1990,
p. 224; Kolers, Duchnicky, & Ferguson, 1981, p. 525; Matazzoni, 1992, pp. 18-19; Pasternack
& Utt, 1986, p. 33; Pipps, 1985, p. 1; Tinker, 1966, p. 169; Van Nes, 1986; pp. 116-117).
All stories were the same length, about 180 words. All stories were tested for
equivalence in readability. Story format and size was held constant across all stories and
modalities -- except when multimedia brought the images to life with video and audio.
One story per page or computer screen was used. Page turns and "jumps" to another
page were considered confounding variables and were avoided in this research, A landscape
(horizontal. 11 x 8-1/2) format was used. The story was set in three columns -- two even
columns of text with the image and caption in the third, right-hand column.
Headline type was set flush left/ragged right in 30-point Helvetica bold. Body type was
set flush left/ragged right in 12-point Palatino. Caption type was set flush left/ragged right in
10-point Palatino. Upper- and lower-case letters were used. And, the layout used ample white
space, so the page or screen would not be filled with text.
Pictures (four-color process) and graphics windows were placed in the same location on
the page and were the same size. This minimized confounding between experimental
conditions.
To construct the multimedia condition, the video clip was digitized for storage as a
computer file. The video was captured on VHS tape. The video output of the videocassette
recorder was plugged into a video spigot card on a Macintosh computer. The VHS audio
output was plugged into the built-in audio input on a Macintosh Quadra 950.
1
Dolly WinsCILIA Award
Dolly Parton was the guest ofhonor Wednesday at the CountryMusic Association's awardceremony. Parton received theCountry Music Honors Award.This is the first time such in awardhas been given.The singer and sometime actress
was cited for her outstandingachievements and upstandingcharacter.
"This is a dream come true. Idon't believe it. I'll lake it, but Idon't believe It," Parton said as sheaccepted the award.
"t4o one deserves it more,"Loretta Lynn said.
Garth Brooks, Tammy Wynette,Randy Travis and K.T.Oslin were onhand to congratulate Parton.
Parton said, "This deserves acelebration. The rides are freetomorrow at Dollyland." Dollylandis Parton's theme park near herhometown of Dleville, Tennessee,.
The event was held at the GrandOle Opry In Nashville. CBSbroadcast the event,
One viewer in Parton's hometown,Daleville, said, "It's about time.Dolly has done a world of good forherself and her fans. We just loveher to death around here."
Dolly Patton sprats in ih,movie "Sitaig.ht Talk.'
BEST COPY AVAILABLE
10

The application Screen Play was used to record the video clip and to save it on the
computer. Then, the Quick Time Movie Player application was used to edit the digitized
videos. The edited videos were then saved as self-contained Quick Time movies.
The digitized video files were not compressed. This avoided degradation of the quality
of the images.
Each video was then stored in a separate file on a reloadable hard disk. A HyperCard
command loaded the proper image or video into each story as needed.
HyperCard allowed the use of hypertext linkages. Hypertext is "a computer-based
system that allows immediate, nonsequential access to linked items of information" (Marmion
1990, p. 7).
This study did not test hypertext. However, the linkage between information nodes2
applied in hypertext provides a foundation for multimedia applications.
A story template in HyperCard determined the size and placement of the image. In the
multimedia condition, the video clip appeared as a still frame. This was actually the first frame
of the Quick Time movie. A "play" icon (a thin vertical bar near the botton left-hand corner)
appeared in the Quick Time control strip at the bottom of the image. (See Figure 3.) A click of
the mouse on this button activated the video. The subject controlled this interactive interface.
Figure 3. Movie control bar used to activate the Quick Time movie in the multimedia condition
This was the multimedia condition.
The computer condition was the same -- except there was no video control strip. The
same still image that was the first frame of the video served as a photograph in the computer
condition.
The paper condition was the same as the computer condition -- except it was a high-
quality color laser print.
2 Slatin (1990, p. 877) defines link and node. "Linkage, in h) pertext, plays a role corresponding to thatof sequence in conventional text. ... A node is any object which is Iked to another object."
11BEST COPY AVAILABLE
8
The information location task required subjects to: "Find [thisi specific information."
To test for differences in search performance across sear.th experience, modalities, and story
types, new stimulus materials were used. The search involved three information location tasks
in "stacks" of e. `, type of story -- one task per story type. Each stack contained four stories.
This means, for example, that Subject #1 was asked to find: 1) specific information
about a news story from a stack of four news stories presented in the computer modality;
2) specific information about a sports story from a stack of four sports stories presented in the
paper modality; and 3) specific information about an entertainment story from a stack of four
entertainment stories presented in the multimedia modality.
Story order in each stack was randomized in each of the three experimental orders.In the computer and multimedia modalities, the subject navigated by using four search
functions: 1) "Category" -- A list of the titles of the four stories in the order that they appeared
in the stack. The subject could select the title by clicking the mouse, click on "Okay" and jump
("go to") directly to that story. 2) "Previous" -- By clicking on this function, the subject could
move backward in the stack one story at a time. 3) "Next" -- By clicking on this function, the
subject could m -.ve forward in the stack one story at a time. 4) "Find" By clicking on this
function, the subject could type in a keyword for which the computer would search. If the word
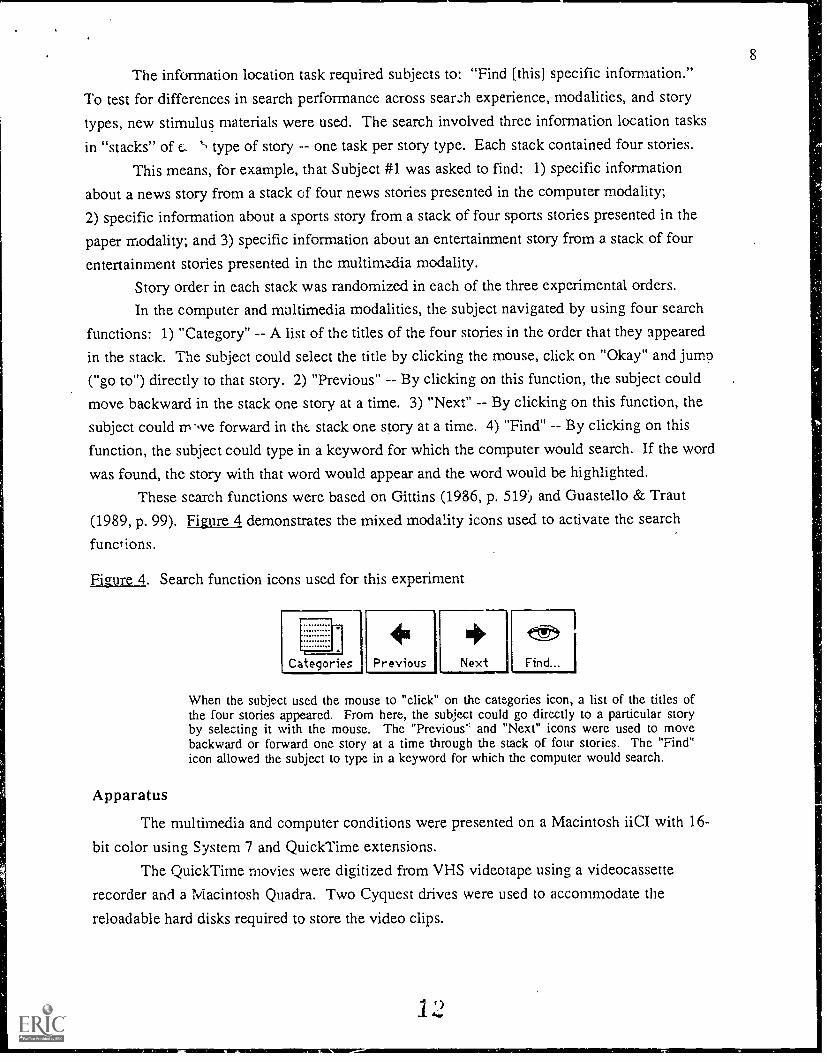
was found, the story with that word would appear and the word would be highlighted.These search functions were based on Gittins (1986, p. 519) and Guastello & Traut
(1989, p. 99). Figure 4 demonstrates the mixed modality icons used to activate the search
functions.
Figure 4. Search function icons used for this experiment
1-1
,Categories Next Find...
When the subject used the mouse to "click" on the categories icon, a list of the titles ofthe four stories appeared. From here, the subject could go directly to a particular storyby selecting it with the mouse. The "Previous' and "Next" icons were used to movebackward or forward one story at a time through the stack of four stories. The "Find"icon allowed the subject to type in a keyword for which the computer would search.
Apparatus
The multimedia and computer conditions were presented on a Macintosh iiCI with 16-
bit color using System 7 and QuickTime extensions.
The QuickTime movies were digitized from VHS videotape using a videocassette
recorder and a Macintosh Quadra. Two Cyquest drives were used to accommodate the
reloadable hard disks required to store the video clips.
1 `)

9The paper condition was produced by printing the computer condition using an Apple
color laser printer.
Hypercard was used to program the experimental orders and control the images and
movies.
The Post-Test Questionnaire was a pencil-and-paper instrument.
Procedure
After signing a Consent Form and completing a Search Experience Questionnaire (to
assess the subject's level of expertise in searching for information, necessary for analysis of the
information location task), the subject began the portion of the study that measured reading
time and memory. The subject was directed toward three different news stories (one per story
type -- news, sports, entertainment). Each story was presented in a different modality (paper,
computer, multimedia).
Determined by experimental order, the experimenter told the subject which story toread first, second, and third.
The word "read" was avoided in the instructions to avoid biasing the subject toward the
text. Because the subject controlled starting the video, the word "read" might have pre-emptedany motivation to "view."
Reading time was recorded by stopwatch.
A sample story was provided. The subject was informed about the possible presence of
the Quick Time movie. The subject practiced starting the video. A practice session was
conducted, including sample recall questions.
The subject was told the rumber of correct responses. Then, the subject had anopportunity to ask questions.
The experiment began. After exposure to the three stories, a short distractor task was
administered. The distractor task asked for the subj gender, ethnicity, and age. Then, therecall task was administered.
After that, the subject was instructed that the next portion of the study involved finding
specific information from three different stacks of stories, each stack containing four stories.
The subject was told he or she would be evaluated on how fast and how accurately the
information was found.
As determined by experimental order, the experimenter directed the subject to the stack
to search first, second, and third.
The subject was reminded that some stories included a movie that could be activated
with the mouse.
A training session was conducted to familiarize the subject with the computerized
search functions and to practice different strategies of finding specific information.
13

10
To begin, the experimenter asked a question (the search task) and said "Go" to begin
each search. The subject pointed at the answer and said the answer out loud to stop the
search. A stopwatch was used to time the search.
Three search tasks were administered -- one per stack. Each stack contained four
stories of one story type.
The subject could ask the experimenter to repeat the question at any time. And, if the
subject gave an incorrect answer, the experimenter said, "Continue your search."
The experimenter recorded the search path on paper. The search path was evaluated
later to determine the number of search errors (incorrect story choice, incorrect answer, errors
using the search functions).
Finally, the post-test questionnaire was administered. The results of that questionnaire
are the focus of this paper. These results provide a baseline for future cross-modality research
that assesses the "user-friendliness" of presentation format, or modality, of mass media
messages.
The questionnaire asked subjects to rate the simplicity (complexity), interestingness,
and pleasingness of each modality on a scale of 1 (not at all) to 99 (very). Other items
measured the same aspects of the image or "movie" (digitized video) and the text.
Two open-ended questions that encouraged subjects to write out their reactions to the
experiments were also included. The first question was a free recall item that asked about the
movies -- what did you see? what did you hear? The second question simply encouraged
comments about the three different methods of presenting news content.
Results
Remember, the results of the reading time, memory, search time, and search error tasks
are not reported in this paper. The full description of the study has been included to provide
background for the subjective measures -- the post-test questionnaire.
SPSS (version 4.0) was used for the data analysis.
Analysis of variance was used to analyze the results. The analysis of variance tested for
main effects. This allowed the researcher to make statements such as: The effect of modality
on (perceived) simplicity was [this].
Because the Latin Square design was not fully factorial, "Contrasts" were run to test
differences between the levels of the experimental factors. A Contrast is a one degree of
freedom F-test performed from within the ANOVA that allowed the researcher to specify a
hypothesis to compare one set of means versus another set of means. This allowed the
researcher to make statements such as: The paper modality was significantly different than the
computer modality for effects on image pleasingness. Contrasts have been reported in tables as
"[this level of a variable] vs [that level of a variable]."
14
11
Analysis of questions regarding simplicity, interestingness and pleasingness
Here is an example of a post-test question: How pleasing do you feel the computer
screen (with no video) method of presenting news stories is? Use a scale of 1 (not pleasing at
all) to 99 (very pleasing).Analysis of the questions regarding simplicity, interestingness and pleasingness
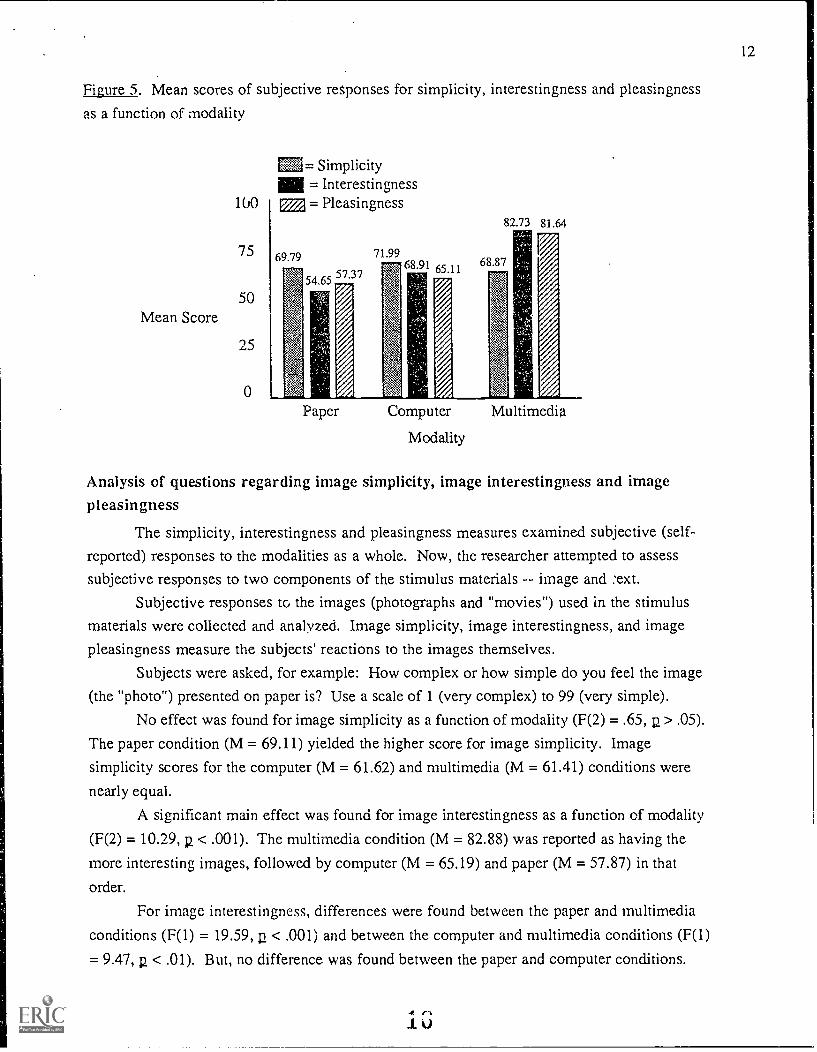
revealed the following.No main effect was found for simplicity as a function of modality (F (2) = .25, > .05).
The computer condition (M = 71.99) was reported as slightly more simple than the paper
condition (M = 69.79) and the multimedia condition (M = 68.87).A significant main effect was found for interestingness as a function of modality (F (2) =
12.20, 12 < .001). The multimedia condition (M = 82.73) was reported as most interesting,
followed by the computer condition (M = 68.91) and paper (M = 54.65) in that order.
For the interestingness measure, significant differences were found between each level
of modality: 1) paper vs multimedia (F(1) = 24.36, 12 < .001), 2) computer vs multimedia (F(1)
= 5.26,12. < .05), a__d 3) paper vs computer (F(1) = 2.06, < .01).
A significant main effect was found for pleasingness as a function of modality (F(2) =
8.91, p < .001). The multimedia condition (M = 81.64) was reported as most pleasing, followed
by computer (M = 65.11) and paper (M = 57.37) in that order.For pleasingness, significant differences were found between the paper and multimedia
conditions (F(1) = 17.27,12 < .001) and between the computer and multimedia conditions (F(1)
= 7.40, < .01). No difference was found between the paper and computer conditions.
To demonstrate the perceived simplicity, interestingness and pleasingness of the three
modalities, the mean scores these subjective responses are shown together in Figure 5.
lJ
12
Figure 5. Mean scores of subjective responses for simplicity, interestingness and pleasingness
as a function of modality
Mean Score
ilk
75
50
25
0
FM= Simplicity= Interestingness= Pleasingness1:PO.
69.79 7 .99
54.6557'37
82.73 81.64
68.91 65.11 68.87
1Paper Computer Multimedia
Modality
Analysis of questions regarding image simplicity, image interestingness and imagepleasingness
The simplicity, interestingness and pleasingness measures examined subjective (self-
reported) responses to the modalities as a whole. Now, the researcher attempted to assess
subjective responses to two components of the stimulus materials -- image and :ext.
Subjective responses to the images (photographs and "movies") used in the stimulus
materials were collected and analyzed. Image simplicity, image interestingness, and image
pleasingness measure the subjects' reactions to the images themselves.
Subjects were asked, for example: How complex or how simple do you feel the image
(the "photo") presented on paper is? Use a scale of 1 (very complex) to 99 (very simple).
No effect was found for image simplicity as a function of modality (F(2) = .65, p > .05).
The paper condition (M = 69.11) yielded the higher score for image simplicity. Image
simplicity scores for the computer (M = 61.62) and multimedia (M = 61.41) conditions were
nearly equal.
A significant main effect was found for image interestingness as a function of modality
(F(2) = 10.29, p. < .001). The multimedia condition (M = 82.88) was reported as having the
more interesting images, followed by computer (M = 65.19) and paper (M = 57.87) in that
order.
For image interestingness, differences were found between the paper and multimedia
conditions (F(1) = 19.59, p < .001) and between the computer and multimedia conditions (F(1)
= 9.47,12 < .01). But, no difference was found between the paper and computer conditions.
4? (-1
lv
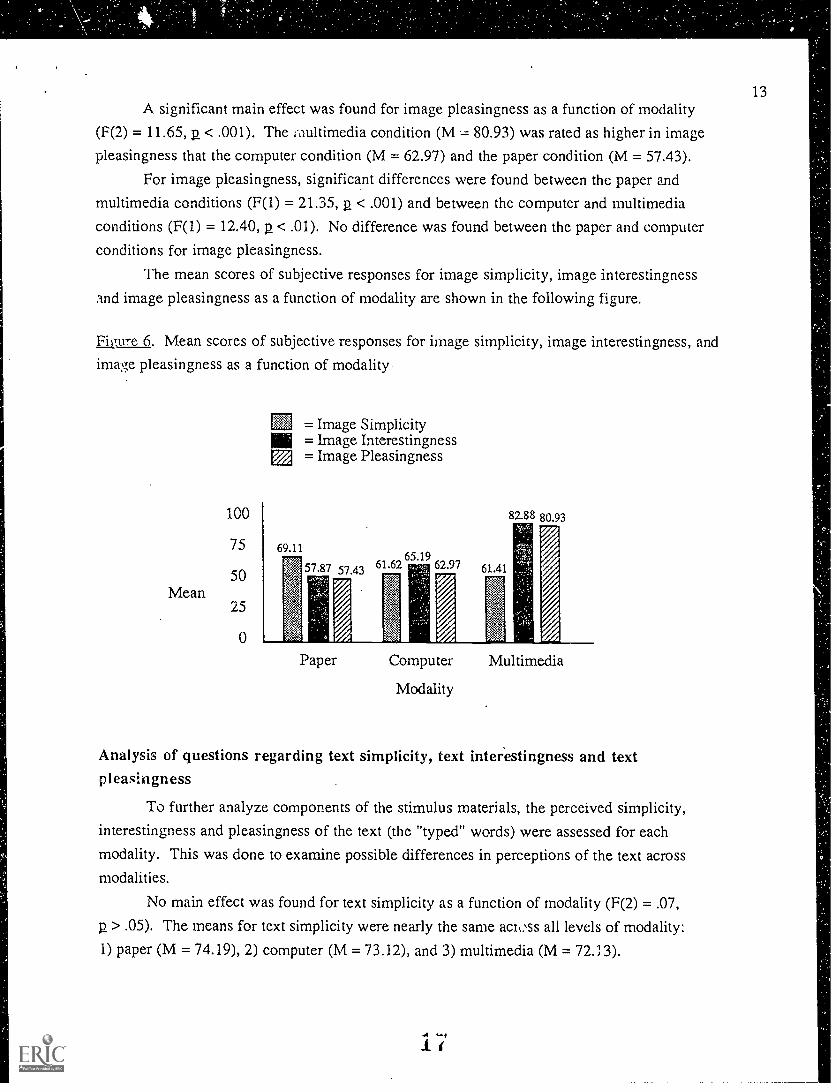
13A significant main effect was found for image pleasingness as a function of modality
(F(2) = 11.65, p. < .001). The i.aultimedia condition (M 80.93) was rated as higher in image
pleasingness that the computer condition (M = 62.97) and the paper condition (M = 57.43).
For image pleasingness, significant differences were found between the paper and
multimedia conditions (F(1) = 21.35, a < .001) and between the computer and multimedia
conditions (F(1) = 12.40, p < .01). No difference was found between the paper and computer
conditions for image pleasingness.
The mean scores of subjective responses for image simplicity, image interestingness
and image pleasingness as a function of modality are shown in the following figure.
Filrure 6. Mean scores of subjective responses for image simplicity, image interestingness, and
image pleasingness as a function of modality
Mean
100
75
50
25
0
= Image Simplicity= Image Interestingness= Image Pleasingness
69.11
57.87 61.6265.19
62.97 61.41
82.88 80.93
Paper Computer
Modality
Multimedia
Analysis of questions regarding text simplicity, text interestingness and textpleasingness
To further analyze components of the stimulus materials, the perceived simplicity,
interestingness and pleasingness of the text (the "typed" words) were assessed for each
modality. This was done to examine possible differences in perceptions of the text acrossmodalities.
No main effect was found for text simplicity as a function of modality (F(2) = .07,
> .05). The means for text simplicity were nearly the same across all levels of modality:
1) paper (M = 74.19), 2) computer (M = 73.12), and 3) multimedia (M = 72.13).

For text interestingness, a significant main effect was found as a function of modality
(F(2) = 6.04, p, < .01). The multimedia condition (M = 74.28) was rated higher for text
interestingness, followed by computer (M = 63.73) and paper (M = 58.51) in that order.
A significant difference was found between the paper and multimedia (F(1) = 12.03,< .01) conditions of modality by text interestingness. The difference between the computer
and multimedia conditions (F(1) = 3.66, p = .058) was approaching significance. No difference
was found between the paper and computer conditions for text interestingness.
No main effect was found for text pleasingness as a function of modality (F(2) = 2.46,p > .05). The multimedia condition (M = 71.08) was rated higher for text pleasingness,
followed by computer (M = 62.12) and paper (M = 58.51) in that order.
The mean scores of subjective responses for text simplicity, text interestingness, and
text pleasingness as a function of modality are shown together in the following figure.
Figure 7. Mean scores of subjective responses for modality by text simplicity, textinterestingness and text pleasingness
Mean
100
75
50
25
0
= Text Simplicity= Text Interestingness= Text Pleasingness
72.13 73.12
58.5158.51 63.73 62.12
72.13 7428
Paper Computer
Modality
Multimedia
Analysis of open-ended questions
Two open-ended questions encouraged subjects to make comments regarding the videoin the multimedia condition and the modalities in general.
Comments were categorized; then, frequencies of comments were tablulated bycategory. Some subjects made more than one comment per category.
.i.t,
14
15
This is baseline data. This information may be used to construct subjective
measurement instruments for future research.
Comments about the "movie"
To analyze the open-ended questions, the researcher simply counted the frequencies of
positive statements, negative statements, comments about the ease of seeing and hearing the
video, comments about the difficulty of seeing and hearing the video, comments on the ease of
finding information in the ), and comments on the difficulty of finding information in the
video.
The first question asked about the "movies." Subjects were asked to write about what
they remembered from the digitized videos they had seen and heard. The question was:
What do you remember about the "movies" you saw and heard? Please bespecific. What images did you see? What did you hear (music, announcers,people interviewed, sound effects, etc.)?
The following table summarizes the results.
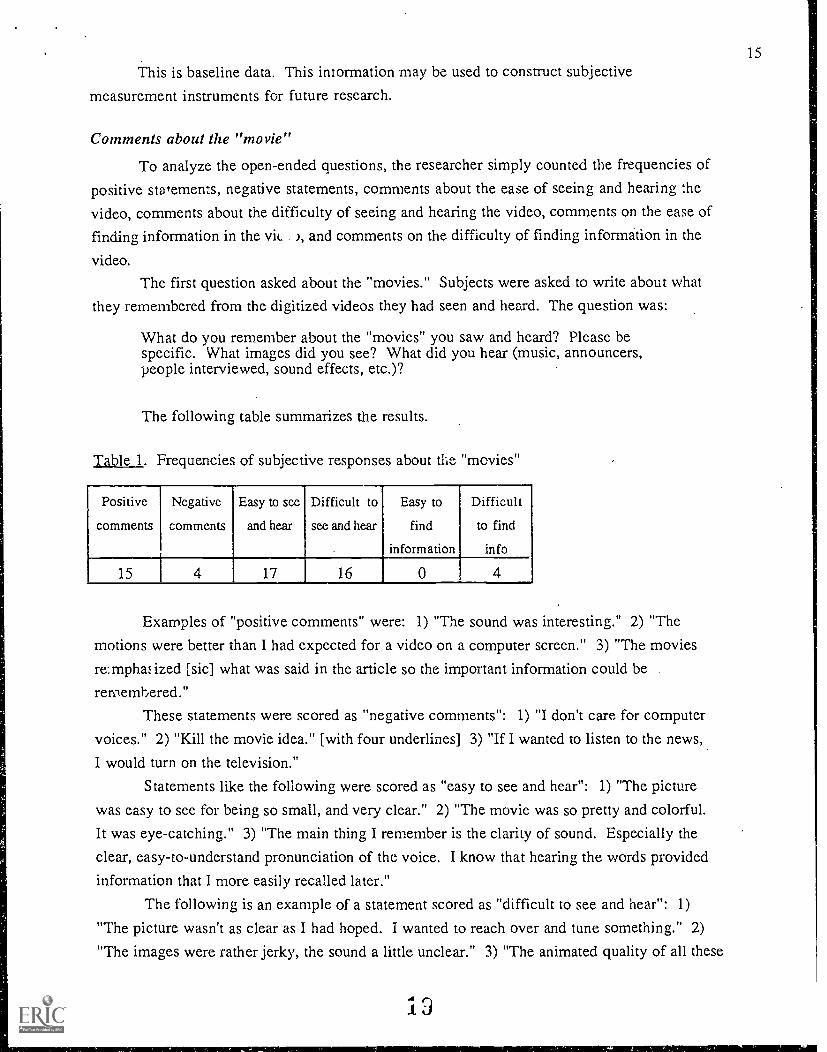
Table 1. Frequencies of subjective responses about the "movies"
Positive
comments
Negative
comments
Easy to see
and hear
Difficult to
see and hear
Easy to
find
information
Difficult
to find
info
15 4 17 16 0 4
Examples of "positive comments" were: 1) "The sound was interesting." 2) "The
motions were better than I had expected for a video on a computer screen." 3) "The movies
re;mpha:ized [sic] what was said in the article so the important information could be
remembered."
These statements were scored as "negative comments": 1) "I don't care for computer
voices." 2) "Kill the movie idea." [with four underlines] 3) "If I wanted to listen to the news,
I would turn on the television."
Statements like the following were scored as "easy to see and hear": 1) "The picture
was easy to see for being so small, and very clear." 2) "The movie was so pretty and colorful.
It was eye-catching." 3) "The main thing I remember is the clarity of sound. Especially the
clear, easy-to-understand pronunciation of the voice. I know that hearing the words provided
information that I more easily recalled later."
The following is an example of a statement scored as "difficult to see and hear": 1)
"The picture wasn't as clear as I had hoped. I wanted to reach over and tune something." 2)
"The images were rather jerky, the sound a little unclear." 3) "The animated quality of all these
1J
16
motion pictures is jumpy, resembling one of those flip books you used to get with monster
bubble gum."
A few subjects said it was "difficult to find information" in the video. For example:
1) "I did not want to use [the video] because you cannot go back and relocate information in a
visual way." 2) "Found my answers before needing to look at [the video]." 3) "I didn't activate
the movies -- I was anxious about doing things quickly and I know that waiting for the movies
to finish would have aggravated me -- I depended on my own speed."
Comments about each modality
The second question asked subjects to comment on each of the three modalities. Thesame categories were used to count frequencies of response. The question was:
What comments would you like to make regarding the three different ways ofpresenting news stories -- 1) ink-on-paper, 2) computer screen, 3) computerwith a "movie"?
The following table summarizes the results.
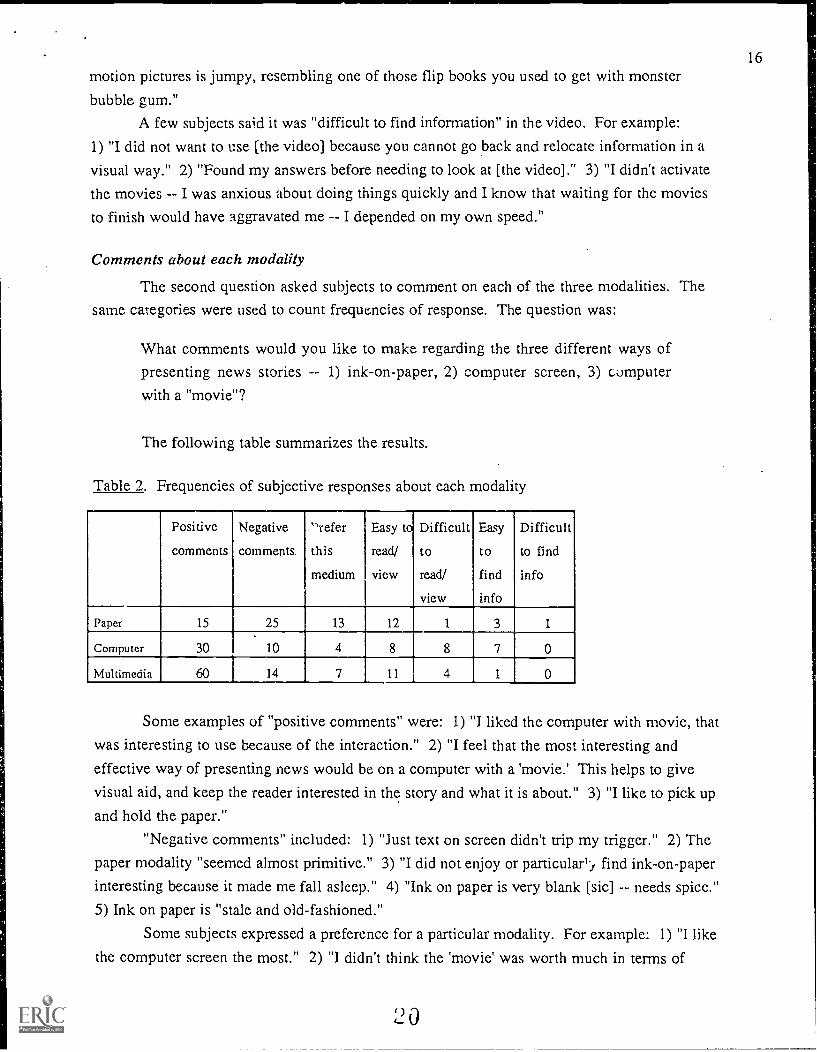
Table 2. Frequencies of subjective responses about each modality
Positive
comments
Negative
comments
'referthis
medium
Easy tci
read/
view
Difficult
to
read/
view
Easy
to
find
info
Difficult
to find
info
Paper 15 25 13 12 1 3 1
Computer 30 10 4 8 8 7 0
Multimedia 60 14 7 11 4 1 0
Some examples of "positive comments" were: 1) "I liked the computer with movie, that
was interesting to use because of the interaction." 2) "I feel that the most interesting and
effective way of presenting news would be on a computer with a 'movie.' This helps to give
visual aid, and keep the reader interested in the story and what it is about." 3) "I like to pick up
and hold the paper."
"Negative comments" included: 1) "Just text on screen didn't trip my trigger." 2) The
paper modality "seemed almost primitive." 3) "I did not enjoy or particular", find ink-on-paper
interesting because it made me fall asleep." 4) "Ink on paper is very blank [sic] -- needs spice."
5) Ink on paper is "stale and old-fashioned."
Some subjects expressed a preference for a particular modality. For example: 1) "I like
the computer screen the most." 2) "I didn't think the 'movie' was worth much in terms of
()

17getting facts. I still like ink on paper better, but computer screen isn't far behind."
3) "It's more likely for hearing-impaired people to prefer on-print information than voiced."
4) "I always enjoy paper best because it's more available P'id accessible at the moment."
5) "I really liked the computer with a 'movie' because it is easier, more convenient, and more
interesting to watch, read, listen to."
Each modality was considered "easy to read/view" by some subjects: 1) "I paid more
attention to the ink-on-paper stories because it is easier for me to read." 2) "Type seems easier
to read" on the computer screen. 3) With the computer screen and computer with movie, "the
words are easier (bigger) to read."
Only one subject found the paper modality "difficult to read/view." This subject said:
"It was hard to comprehend the articles without reading them twice." .
Others found the computer modality "difficult to read/view": 1) "I had to re-read a lot"
with the computer story. 2) "You cannot eat while reading" a computer screen. 3) "The
computer screen was god but at times it was hard to read." 4) "I found the words oncomputer screen less than clear. In other words, it takes longer to read than on print."
And a few found the multimedia modality "difficult to read/view." For example: The
videos "seemed to call too much attention to themselves." Another subject said, "Computer
with 'movie' is more appealing, but since it is not in text something can be missed, especiallyvital information."
Comments about modalities in which it is "easy to find information" included: 1) "Ink
on paper is easiest for me. You can look and find with your own eyes instead of having to look
for what you want to find on a computer." 2) Paper is "easier to find information on." 3) The
computer is "interesting because you can access other data very quickly." 4) "Computer screen
is easier to find specific information. Computer screen with movie has the same advantages as
the screen without movie, with the added benefit of sound and motion, making it interesting
and more like television." 5) "I think it's easier to find information on paper rather than on a
screen." 6) "It occurs to me that finding information typed on a computer screen is easier thanfinding it typed on paper."
Only one subject indicated that it was difficult to find information in the paper modality.
The subject said, "I hate to find information in paper. It takes too long!"

18
Discussion and Future Research
The results of this study provide some evidence of the effects of using different
modalities (ink-on-paper, computer, multimedia). What does this suggest to media designers,publishers, and researchers about presenting mass media messages in different modalities,
particularly multimedia and, by extension, other new media?
Several subjects expressed surprise when introduced to the digitized video. Future
research may include assessments of "level of experience" for multimedia use. This would
account for novelty effects.
In this study, surpris,:, fascination or curiosity about the multimedia condition did not
seem to lead to use of the digitized video (the video was only activated by an interactive mouse
click). Less than 70 percent of the subjects chose to see the video during the reading time task.
The experimenter was aware of a possible confound, so subjects were instructed to "go
through" the story, not "read" the story. For the information location task, only 14 percent of
the subjects chose to view the video.
Content factors did seem to affect the decision to view the digitized video. Two subjects
commented that news on paper was more trustworthy. Several subjects indicated that the
videos lacked substantial information.
By design, the videos supported the text. Many of the videos did not contain
information that was not in the text. Future studies may include more substantial information
that can be found only in the interactive videos.
The post-test questionnaire revealed that all the modalities were perceived as nearly
equally simple. This includes the modalities in general, the images used for each modality, andthe text used for each modality.
The interestingness measure revealed significant differences between all comparisons of
modality conditions. The multimedia condition was highly rated for interestingness.
The mean score for interestingness of the text jumped up almost 20 points from the
paper condition to the multimedia condition. The presence of the video apparently enhancedthe text. A few subjects commented that the video helped bring the story to life. And several
subjects mentioned that news on paper is "boring" or "old-fashioned."
For the multimedia condition, a few subjects indicated "surprise" that the audio was so
clear. They seemed to expect a computer-gen, ated voice.
But, one subject reminded the researcher that hearing-impaired persons prefer ink-on-
paper. This subject found the computer-based audio difficult to hear.
In general, these results suggest little resistance to computer-based multimedia
presentations of mass communication content. These subjects appeared to give the "digital
daily" a sign of approval and encouragement.

One subject said, "If I was at work and had this capability at desktop -- to read, see andhear the latest stories from around the world, it would be quite a service."
Another subject said, "I liked the 'movies.' It was very interesting to see a news storycome alive on a computer screen. I hope to see things like this on the market some day."
The findings of this study may be applied to further challenges of the primacy of print
theory. If, by extension, researchers argue that messages that are simple, interesting andpleasing also may be easy to read and memorable, then multimedia presentations deserve acloser look. Future research may address this issue.
This research applied existing technology to investigate future implications for1) publishers who are adapting to electronic technology, including multimedia, 2) consumerswho are adjusting to new media in order to obtain the most recent news, and 3) researcherswho are seeking to develop cognitive models for design and use of interactive media.
Researchers may begin to notice less and less resistance to computerized informationdelivery systems ... and more resistance to ink-on-paper. Yesterday's students have grown upwith television in the home. Today's students are growing up with computers in the home andin the classroom. Tomorrow's media consumers may expect interactive multimedia systems todeliver news and information.
Researchers must anticipate and examine "readers' expectations of efficient and
effective interactive multimedia systems and content. The results presented in this paper maybe used as a baseline for future studies of the transition from print to electronic media.
23
19
20
References
Bain, C. (1980). Newspaper design and newspaper readership: A series of four experiments,D.H. Weaver & I. Wood ley (Eds.), Research Report No. 10, Bureau of Media Research,Center for New Communications.
Barnhurst, K.G. (1991). News as art, Journalism Monographs, December, No. 130. Columbia,South Carolina: Association for Education in Journalism and Mass Communication.
Borgman, C.L. (1984). Psychological research in human-computer interaction. In M.E.Williams (Ed.), Annual Review of Information Science and Technology (ARIST), Vol.19. Knowledge Industry Publications.
Brand, S. (1988). The media lab: Inventing the future at MIT. New York: Penguin Books.
Clarke, A.A. (1986). A three-level human-computer interface model, International Journal ofMan-Machine Studies, 24(6):503-517.
Cook, P.R. (1984, July). Electronic encyclopedias, Byte, 9(7):151-170.
Crow, R.W., Jr., & Starbird, R.F. (1992). Easier said than done: Practical considerations inuser interface design, Government Information Quarterly, 9(2):169-185.
De Fleur, M.L., Davenport, L., Cronin, M., & De Fleur, M. (1992). Audience recall of newsstories presented by newspaper, computer, television and radio, Journalism Quarterly,69 (4):1010 -1022.
Dillon, A., Richardson, J., & McKnight, C. (1990). The effects of display size and text splittingon reading lengthy text from screen, Behaviour and Information Technology, 9(3):215-227.
Don, A. (1992).CineMacs: Quick Time makes movies on the small screen, Publish, May,7(5):50-57.
Dreher, M.J., & Guthrie, J.T. (1990). Cognitive processes in textbook chapter search tasks,Reading Research Quarterly, 25(4):323-339.
Elmer-Dewitt, P. (1993, April 12). Take a trip into the future on the electronic superhighway,TIME, 141(15):50-55.
Fidler, R. (1991a). Harnessing the new technology. Speech delivered at the American PressInstitute's "Journalism Educators Seminar" in Reston, Virginia, October 8, 1991.
Fidler, R. (1991b). Mediamorphosis, or the transformation of newspapers into a new medium,Media Studies Journal, Fall (pp. 114-12). The Freedom Forum Mectia Studies Center,New York: Columbia University.
Fidler, R. (1997). What are we so afraid of? Washington Journalism Revie.v, 14(8):22-27.
Furnham, A., Benson, R., & Gunter, B. (1987). Memory for television commercials as afunction of the channel of communication, Social Behaviour, 2:105-112.
Furnham, A., & Gunter, B. (1985). Sex, presentation mode and memory for violent and non-violent news, Journal of Educational Television, 11:99-105.
24

21
Furnham, A., Proctor, E., & Gunter, B. (1988). Memory for material presented in the media:The superiority of written communication, Psychological Review, 63(3):935-938.
Gittins, D. (1986). I. on -based human-computer interaction, International Journal of Man-Machine Studies, 24(6):519-543.
Glushko, R.J. (1990). Designing a hypertext electronic encyclopedia, Bulletin of the AmericanSociety for Information Science, February/March, 16(3):14-22.
Guastello, S.J., & Traut, M. (1989). Verbal versus pictorial representations of objects in ahuman-computer interface, International Journal of Man-Machine Studies, 31(1):99-120.
Gunter, B., & Furnham, A. (1986). Sex and personality differences in recall of violent andnon-violent news from three presentation modalities, Personality and IndividualDifferences, 7:829-837.
Gunter, B., Furnham, A., & Gietson, G. (3984). Memory for the news as a function of thechannel fo communication, Human Learning, 3:265-271.
Gunter, B., Furnham, A., & Leese, J. (1986). Memory for information from a party politicalbroadcast a function of the channel of communication, Social Behaviour, 1:135-142.
Guthrie, J.T. (1988). Locating information in documents: Examination of a cognitive model,Reading Research Quarterly, Spring, 23(2):178-199.
Guthrie, J.T., Britten, T., & Barker, K.G. (1991). Roles of document structure, cognitivestrategy, and awareness in searching for information, Reading Research Quarterly,26(3):300-324.
Guthrie, J.T., & Kirsch, I.S. (1987). Distinctions between reading comprehension and locatinginformation in text, Journal of Educational Psychology, 79(3):220-227.
Guthrie, 1.T., & Mosenthal, P. (1987). Literacy as multidimensional: Locating informationanc' reading comprehension, Educational Psychologist, 22(3&4):279-297.
Kerr, S.T. (1986). Instructional text: The transition from page to sci Visible Language,20(4):368-392.
Kirsch, I.S., & Guthrie, J.T. (1984). Adult reading practices for work and leisure, AdultEducation Quarterly, Summer, 34(4):213-232.
Kolers, P.A., Duchnicky, R.L., & Ferguson, D.C. (1981). Eye movement measurement ofreadability of CRT displays, Human Factors, 23(5):517-527.
Leung, L.W.C. (1989). Understanding human-computer communication: An examination oftwo interface models Doctoral study, The University of Texas at Austin, 1989).
Marchionini, G. (1989). Making the transition from print to electronic encyclopaedias:Adaptation of mental models, International Journal of Man-Machine Studies,30(6):591-618.
Marmion, D. (1990). Hypertext: Link to the future, Computers in Libraries, 10(6):7-9.
0 r"J
2'2
Matazzoni, J. (1992, October). Alice on disk! A California publisher experiments withelectronic books, Publish, 7(10):16-21.
Moran, T.P. (1981). An applied psychology of the user, Association for ComputingMachinery (ACM) Computing Surveys, 13(1): 1-12.
Muter, P., & Mayson, C. (1986). The role of graphics in item selection from menus,Behaviour and Information Technology, 5(1):89-95.
Nelson, M.J. (1991). The design of a hypertext interface for information retrieval, TheCanadian Journal of Information Science, 16(2):1-12.
Nielsen, J. (1990a). The art of navigating through hypertext, Communications of the ACM,March, 33(3):296-310.
Nielsen, J. (1990b). Traditional dialogue design applied to modern user interfaces,Communications of the ACM, October, 33(10):109-118.
Oboroe, D.J., & Holton, D. (1988). Reading from screen versus paper: There is no difference,International Journal of Man-Machine Studies, 28(1):1-9.
Pasternack, S., & Utt, S.H. (1986). Subject perception of newspaper characteristics based onfront page design, Newspaper Research Journal, Fall, 8(1):29-35.
Pipps, V.S. (1985). Measuring the effects of newspaper graphic elements on reader satisfactionwith a redesigned newspaper using two methodologies (Doctoral dissertation, SyracuseUniversity, 1985).
Price, H.T. (1972). The effect of newspaper design complexity on readership, comprehension,interestingness and pleasingness (Doctoral study, Michigan State University, 1972).
Slatin, J.M. (1990). Reading hypertext: Order and coherence in a new medium, CollegeEnglish, December, 52(8):870-883.
Teshiba, K., & Chignell, M. (1988). Development of a user model evaluation technique forhypermedia based interfaces. Proceedings of the Human Factors Society, 32nd Ann. _d1Meeting, pp. 323-327.
Thompson, D.R. (1993). Mass communication and the iicAvspaper of the future: Some effectsof modality, story type, and search experience on readily time, memory, andinformation location (Doctoral study, The University of Texas at Austin, 1993).
Thompson, D.R. (1994a). The human-computer interface and the newspaper of the future:Some cognitive effects of modality and story type on reading time and memory. Paperpresented at the International Communication Association 44th annual conference,Information Systems Division, July 11-15, Sydney, Australia.
Thompson, D.R. (1994b). New technology and the newspaper of the future: Some effects ofmodality, story type, and search experience on information location. Paper presented atthe International Communication Association 44th annual conference, Communicationand Technology Division, July 11-15, Sydney, Australia.
Tinker, M.A. (1966). Bases for effective reading. Minneapolis, MN: University of MinnesotaPress.
Todd, D. (1993, March). A ne' spin on the news: Newsweek Interactive, &Ash, 8(3):30-36.
26

23Van Nes, F.L. (1986). Space, colour and typography on visual display terminals, Behaviour
and Information Technology, 5(2):99-118.
Zoglin, R. Elmer-Dewitt, P. (1993, April 12). When the revolution comes, what will happen tochannels? networks? commercials? video stores? your bill?, TIME. 141(15):56-58.
27


![[XLS]spwebext1.dallascityhall.comspwebext1.dallascityhall.com/departments... · Web view13005 510 30000 500 6887 1500 125000 3572 21802 855 21420 840 10710 420 14917 585 10000 380](https://img.pdfslide.us/doc/110x75/5aecc8647f8b9ae5318f5b3e/xls-view13005-510-30000-500-6887-1500-125000-3572-21802-855-21420-840-10710-420.jpg)