Embed Size (px)
Citation preview
DOCUMENT RESUME
ED 370 835 SO 023 266
AT'THOR Garcia, Eduardo
T.,TLE A Survey of Schools. Literacy in the Arts, AnImperative for New Jersey Schools.
INSTITUTION Literacy in the Arts Task Force, Trenton, NJ.
SPONS AGENCY Alliance for Arts Education/New Jersey, Trenton.; NewJersey State Council on the Arts, Trenton.; NewJersey State Dept. of Education, Trenton.
PUB DATE Oct 89
NOTE 25p.; For relatgd documents, see SO 023 265-267.
AVAILABLE FROM Alliance for Arts Education/New Jersey, P.O. Box8176, Trenton, NJ 08650.
PUB TYPE Reports Research/Technical (143)
EDRS PRICE MF01/PC01 Plus Postage.
DESCRIPTORS Administrator Attitudes; *Art Education; CreativeWriting; *Curriculum Development; Dance; EducationalAttitudes; *Educational Objectives; EducationalResearch; Elementary Secondary Education; Music;*Public Schools; Surveys; *Teacher Attitudes;*Teaching Methods; Theater Arts
IDENTIFIERS *New Jersey
ABSTRACTThis document presents the results of a survey of New
Jersey schools districts examining the state of arts education in New
Jersey schools. Data from the department of education's annual series
of fall reports of vital educational statistics also was reviewed.
The information from the survey was combined with the data in the
fall report to provide a picture of arts education in New Jersey in
the 1987-88 school year. The survey form was sent to allsuperintendents of schools in the 592 operating school districts andto over 900 non-public schools. Respondents were requested to form a
team to address the questions asked in the survey. These teams
included the superintendent of schools, supervisor of curriculum,district arts coordinator or supervisor, a school business official,
and a teacher from each of the five art forms (visual arts, dance,
theater, music, and creative writing). Teams responded as a group to
questions about values, preferences, and priorities in arts educationin their districts. Results of the survey were divided into the areasof philosophy and goals, curriculum, staffing, instructional methods,
arts resources, arts schools and special arts programs, facilities
and equipment, evaluation, and funding. The section on curriculum
included information on currency of materials, non-western cultures,graduation credits, full or partial year programs, arts enrollments,and course offerings in arts education. Survey findings report that
only nine districts or two percent required more than one-year credit
in the arts for graduation from high school. The number of studentsper instructor was higher in the arts than for other courses. (DK)
***********************************************************************
Reproductions supplied by EDRS are the best that can be madefrom the original document.
***********************************************************************
s
9
\J\
'LAMENT OF EDUCATIONOfhce ot Educational Research and Improvarnem
EDUCATIONAL RESOURCES INFORMATIONCENTER (ERIC)
TAris document has been reproduced as*wed from the person or organization
originating it0 Minor changes have been made to improve
reproduction quality
Points of vow or opinions stated in this docu-ment do not necessarily represent officialOERI position or policy
LITERACYIN THE'ARTS
AN IMPERATIVE FORNEW JERSEY SCHOOLS
"PERMISSION TO REPRODUCE THISMATERIAL BEEN GRANTED BY
TO THE EDUCATIONAL RESOURCESINFORMATION CENTER (ERIC/
A
SURVEY
OF
SCHOOLS
2BEST COPY AVAMILE
TABLE OF CONTENTS Acknowledgements
Introduction
Philosophy & Goals
Curriculum
Staffing
Instructional Methods
Arts Resources
Arts Schools and Special Arts Programs
Facilities & Equipment
Evaluation
Funding
School Districts Which Offered Arts Courses in 1987-1988
2
3
4
6
12
13
15
17
18
19
20
91
3
a*,
ACKNOWLEDGEMENTS The four co-sponsors of the survey wish to thank, first and foremost,the teams of administrators and arts educators in the 471 schooldistricts who devoted time to respond to this survey.
The co-sponsors also wish to acknowledge the work of EduardoGarcia, the executive director of the Literacy in the Arts Task Force,in the preparation and writing of this report.
Special thanks are extended to John Dougherty of the department ofeducation for his professional advice, expertise and good counsel
The contributions of Joel Bloom, Jacqueline Cusack, Carol Scelza,Fran Pinkowski, and Julia Stapleton, from the New Jersey StatcDepartment of Education are also acknowledged with part:cularthanks to the staff of Information Resources Management whoprocessed the data.
The Survey Design Committee included Carol Belt, Alliance for ArtsEducation/New Jersey; John Dougherty, New Jersey StateDepart-ment of Education; Eduardo Garcia, Literacy in the Arts Thsk Fmce,Berda Rittenhouse, New Jersey State Council on the Arts; and CarolFineberg, C.E Associates, New York.
1 2 1
4
INTRODUCTION
e Literacy in the Arts Thsk Force7h
was directed by the State Legislature to examine the state of artseducation in New Jersey schools. A survey of New Jersey schooldistricts was conducted from January-April, 1989. Data from thedepartment of education's annual series of fall reports of vitaleducational statistics' was also reviewed. The information from thesurvey was combined with the data in the fall report to provide apicture of arts education in New Jersey in the 1987-1988 school year.The survey was co-sponsored by the New Jersey Department ofEducation, the New Jersey State Council on the Arts, and theAlliance for Arts Education/New Jersey.
The SurveyThe survey form was sent to all
superintendents of schools in the 592 operating school districts inNew Jersey and o over 900 non-public schools. Respondents wererequested to form a team to address the questions asked in thesurvey. These teams included representatives of major stakeholdersin arts education: Superintendent of Schools, Supervisor of Curricu-lum. District Arts Coordinator or Supervisor, a school businessofficial, and a teacher from each of the five art forms (visual arts,dance, theatre, music, and creative writing). Teams responded as agroup to questions about values, preferences and priorities in artseducation in their districts. It should be noted as a limitation of thissurvey that such responses represent best estimates by team mem-bers and are not necessarily a valid representation of the groupsreferred to in the report.
The response rate of 80% (471 ofthe 592 New Jersey school districts)2 was considered acceptable foranalysis and interpretation. Only 32 of the non-public schools in thestate responded to the survey and therefore no valid analysis can bemade about arts education in New Jersey's non-public schools.
Arts Edutation Survey Return Rate New Jersey 1989
County Rate of Return Country Rate of Return
Atlantic 68% Middlesex 76%Bergen 95% Monmwth 77%Burlington 60% N.Iris 88%Camden 92% Ocean 835Cape May 88% Passaic 80%Cumberland 69% Salem 100%Essex 74% Somerset 795Gkmcester 90% Sussex 65%Hudson 77% t 'nion 75%1 lunterdon 435 Warren 92%Mercer 91%
5
Total 80%
3
PHILOSOPHY &
GOALS
1 4 1
The survey form covered phil-osophy and goals, curriculum, staffing, methods, staff training, artsresources, arts schools and programs, facilities and equipment,evaluation of student art work, and funding of arts edumtion. Thearts include: visual arts, dance, theatre, music and creativewriting. These are broad areas which encompass many other artforms. For example, in this report, theatre includes film/radio/TVand visual arts includes photography, design and architecture.
State OverviewThere were a total of 1,092,982
students enrolled in New Jersey schools during the 1987-88 schoolyear. 746,086 were enrolled in grades Pre-K to 8 and 346.896 wereenrolled in grades 9-12. Of the 2,247 public schools in New Jersey,1.843 are elementary; 404 secondary.'
Of the 97,271 full time edumtors,7,335 were administrators. 78,335 were classroom teachers and11.601 were education support services personnel. Of the 78,335full-time teachers 34% were teaching elementaly and 66% wereteaching in a specific subject area. There were 1,990 (3.84%)teachers with the specific subject area assignment of music and1,923 (3.72%) with the specific subject area assignment in art. Dancehad 13 (.02%): theatre had 132 (.25%); and 49 (.09%) teachers hadthe specific subject area assignment of creative writing.
7he Getty Report' identified fourdisciplined-based components for teaching art:
1. Using artistic forms and media to communicate to others andto express oneself. (Art Making).
2. Understanding, interpreting and judging the arts. (ArtCriticism).
3. Learning about the arts, artists and cultures. (Art Heritage).4. Understanding, valuing and responding to the arts in all
forms. (Art Aesthetics).
School district respondents were asked to indicate the proportion oftheir arts programs that are devoted to each of the four majorstrands. On the average 57% of all the time spent in arts pro-grams in New Jersey schools is spent on "art making." Theaverage responses for the remaining strands were closely bunched ataround 15% each.
Priority of Arts EducationWhat is the place of arts educa-
tion in the total subject curriculum in New Jersey schools? Howimportant is this discipline in relation to math, science, and physicaleducation? Respondents to the survey were asked their opinion of
6
<,
what priority important stakeholders such as parents, school boardmembers and the community members gave to arts education. Theresults are reported in terms of three possible priority level choicesprovided in the survey question: very high, medium and low. Thefollowing are the overall proportions:
Very high Medium Low
Board members 32% 61% 7%School administrators 2%
rsThache42%
56(17 6%Parents
34%28% 66% 7%20%Community members 67% 14%
The teachers and administrators responding to the survey recognizethe importance of arts education in their school districts with anaverage 38% giving it a "very high" priority, 59% giving it a"medium" priority and only an average of 4% giving it a "low"priority. The respondents, however, envision that the community's(board members, parents and other community members) interest inthe arts is less than theirs with the three "community" groupsranked at an average of 26% "very high" priority, 65% "medium"priority and 9% at a "low" priority. Yet, in an unpublished study ccn-ducted by the New Jersey State Council on the Arts which inter-viewed people throughout the state, 95% of those interviewed said"the arts should get more emphasis in grade/high schools."5
Ads DisciplinesAs part of its charge, the Literacy
in the Arts Task Force set out to study five major disciplines: visualarts, dance, music, theatre and creative writing. Other arts courses inphotography, design, architecture and media arts were not part ofthis survey but are included in this report from information gleanedin Ma/ Educational Skitistics 1987-1988. Educators were asked to indi-mte how important they felt each of the five disciplines was in theirfull arts program. The scale provided was: essential, important, andnon-essential.
The results were as follows:
Essential Important Non-Essential
Visual Arts 47% 51% 9%Dance 4% 36% 60%Music 52% 46% 2%Theatre 13% 60% 26%Creative Writing 56% -13% 9%
It is clear that creative writing, music and visual arts are con-sidered as essential parts of the arts curriculum while dance isnot. Sixty percent (60%) of New Jersey's school districts rank danceas "non-essential." Theatre is also not considered essential by mostrespondents according to these findings. Still, on the average, abouthalf of all school districts did consider all five of the art forms as an"important" part of their curriculum.
51
CURRICULUM
r(T1
Distrkt ObjedivssNew Jersey public school districts
set critical goals each year to promote school ii.lprovement. Thislocal planning process is carried out in cooperation with the stateeducation department. Goals are based on a needs assessmentprocess which examines student academic performance and makesjudgments about apparent deficiencies which become the basis of ayearly educational plan. Respondents were asked to indicate whether,as part of this process, there had been an arts education objective forthe 1987-1988 school year. Two hundred and forty-three districts(52%) indicated that there was such an objective. Forty-three per-cent (202 districts) indicated that they did not have an artsobjective within the local planning process for the year. Twenty-six of the districts did not answer the question.
Of those districts that did have agoal, many used an adaptation of the State goal of: "Acquire theability and the desire to express himself or herself creatively in oneor more of the arts and to appreciate the aesthetic expressions ofother people: *6
417he next section of the surveyconcerns curriculum methods and material:- in arts educationincluding the use and dates of curriculum guides, graduation credits,instructional time, course enrollments, and modes of curriculumdecision-making.
Curriculum guides are localdocuments which embody the intent of the local school board inregard to what should be taught in the schools. Guides usuallycontain learning objectives, suggested activities, and textbookreferences. These documents guide teaching practice and help toinsure that the intent of the board is carried out in providing qualityeducation to all students. Effective guides are comprehensive in thatthey include a full range of learning objectives and they are develop-mental in that they provide appropriate &ctivities for each age levelof students.
Respondents were asked whethertheir districts had comprehensive, development guides in the arts.Eighty-nine percent (418 districts) indicated that they did havesuch guides in one or more arts education subjects; 6% (43districts) reported that they did not have such documents. Thefollowing is the complete listing of the number of districts and thetypes of curriculum materials used in those districts:
Curriculum MaterialsVisualArts Dance Music Theatre
CreativeWriting
Curriculum Guides 389 44 386 129 298Commercial lexts 202 8 363 122 246Commercial Materials 399 13 323 131 207Periodicals 328 98 241 105 215Locally Developed Materials 351 43 329 144 272Media (films, slides, TV etc.) 378 69 374 167 242Computer Software 150 3 158 25 204
N = 471
In general, use of all curricularmaterials was strongest in the visual arts and music education. Theleast reported use of such materials is in dance education. Only eightdistricts reported use of commercial textbooks in this subject ascompared with 363 districts using them in music education.
District guides are used mostheavily, the survey found, in the visual arts (83%) and in music(83%). The use of these materials in creative writing was also consid-erable with 63% of districts reporting such Us,. Commercialtextbook use was most prevalent in music (76%), creative writing(51%), and visual arts (12%).
Currency of /Work&Respondents were asked to
indicate the dates of adoption of guides in arts education in theirdistricts. The averages varied for each grade level. The overallaverage age of guides in the arts was four years. Selecting visualarts as a sample, this was the breakdown of the currency of theguides:
Tventy percent of elementary school guides were five yearsor older and 15% had been developed within the year.Twent:.-eight percent of the guides being used in middleschools were five years or older and 43% have been devel-oped within the year.Of the seventy districts with junior high schools 37% haddeveloped their guides within the last year and only 16% hadguides that were five years or older.
11. There were 175 districts that responded to the high schoolcomponent of the questionnaire of which 16% had guidesthat were five years or older and 43% had guides developedin the last year.
ol Of the thirty districts responding to the "Special Education"component, 13% had guides thz:,. were five years or older andone third had guides that had been developed within theyear.
9
In a recent survey7 of all schooldistricts throughout the United States, an average of 71% of theschool districts had curriculum guides and 40% used texts in thevisual arts. In New Jersey, 83% of school districts use visual artscurriculum guides and 43% use texts. In music, 75% of all schooldistricts in the United States use curriculum guides and 51% usetexts. In New Jersey, 82% of school districts use the guides inmusic and compared to the rest of the country, a high 77% usetexts. Combining dance, theatre and creative writing, an average of41% of school districts throughtout the country used curriculumguides, whereas, in New Jersey, an average of 33% used curricu-lum guides in dance, theatre and creative writing combined.Almost an equal proportion (28% nationwide and 27% statewide) ofschool districts used texts in the combined art forms of theati e,dance and creative writing.
Other types of commerciallearning materials, such as study prints for visual instruction, wereused by 84% of New Jersey school districts in visual arts and 70% ofthe districts used similar materials in music. They were rarely usedin dance (6%). Locally developed materials, however, were used by73% of school districts in visual arts, 69% in music, 31% in theatreand 79% in creative writing. Computer software was used mostly increative writing (43%), music (34%), and visual arts (32%).
Non-wstern CulturesSchool districts were asked
whether they had incorporated the teaching of non-western culturesinto their arts curriculum. Seventy-seven percent (365 districts)indicated that they had done so; fourteen percent had not andanother ten percent did not answer the question.
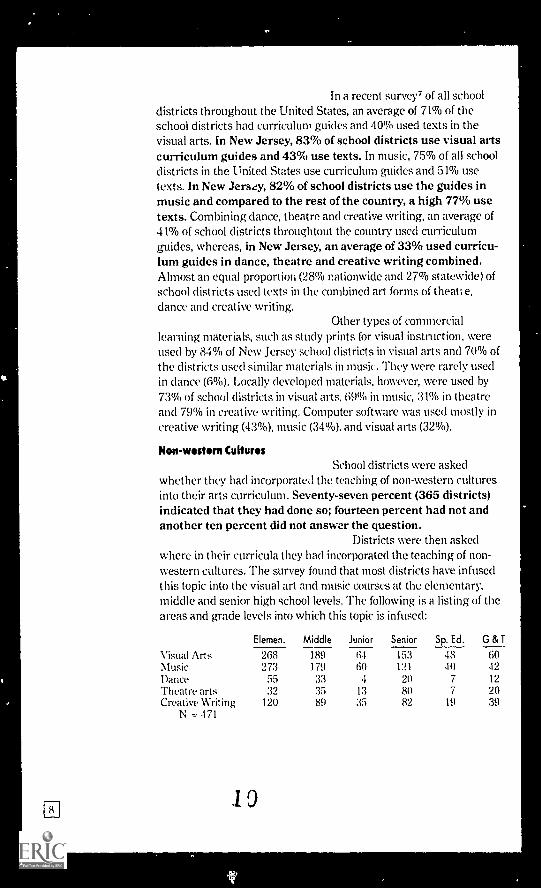
Districts were then askedwhere in their curricula they had incorporated the teaching of non-western cultures. The survey found that most districts have infusedthis topic into the visual art and music courses at the elementary,middle and senior high school levels. The following is a listing of theareas and grade levels into which this topic is infused:
Elemen. Middle Junior Senior Sp. Ed. G & T
Visual Arts 268 189 64 153 48 60Music 273 179 60 121 4(1 42Dance 55 33 4 90 7 12
Theatre arts 32 35 13 80 7 20Creative Writing 120 89 35 89 19 39
N - 471
1 9
Graduation Cradits in Arts EducationNew Jersey requires one credit
year in the arts which includes the fine, practical or performing arts!'The practical arts as defined by the state include: all the 1300 seriesbusiness and office courses (typing, steno, bookkeeping, etc.); the1700 series of home economics courses (consumer education, childcare Management food production etc.); and the 1800 series indus-trial arts courses (general shop, graphic arts, aeronautics, etc.). Thesurvey found that only nine districts (2%) required more thanthe one year credit in the arts for graduation from high school.lowever, 302 districts (64%) chose not to respond to this question.
Full or Partial-Yoar ProgramsMost of the schools in N..,w Jersey
have full year programs in the arts. There are 41 districts withelementary schools that have a quarter year or half-year program.There are also 107 school districts with middle schools and 137districts with eitlier junior or senior high schm)1 that have quarter-year or half-year programs as well.
Arts EnrollmentsThere were slightly noire than
one million pupils enndled in New Jersey's public schools in the1987-1988 school year. In that year, 661 different types of courseswere offered and there was a total pupil enrollment figure of.1,431,000. Music enrollment for the state in 1987-88 was 355,000.Enrollment in all other arts courses (visual arts, dance, theatre andcreative writing) was 281,800. This represents a total of 636,800K-12 enrollments in arts education courses. Below is the breakdownin each art form and the number of teachers with arts as a specificsubject area assignment.
Art Form 11 of Courses Enrollments % of Teachers
Visual Arts 34 261,0110 1,923Dance 4 800 13Theatre' 9 12,000 132Niusic 28 355,000 1,990Creat iye Writing 1 8,000 49
Total 79 636.800 4,107
-Irheatn. includes 6 media arts cinirses with 4,nou enrollments and 62 teachers
If we compare the total arts enroll-ment to the total number of teachers who have arts as a specific sub-ject area assignment, we find that on the average each arts educa-tor is responsible for 155 students. The oniy other educationprogram that is comparable is physical education where the average
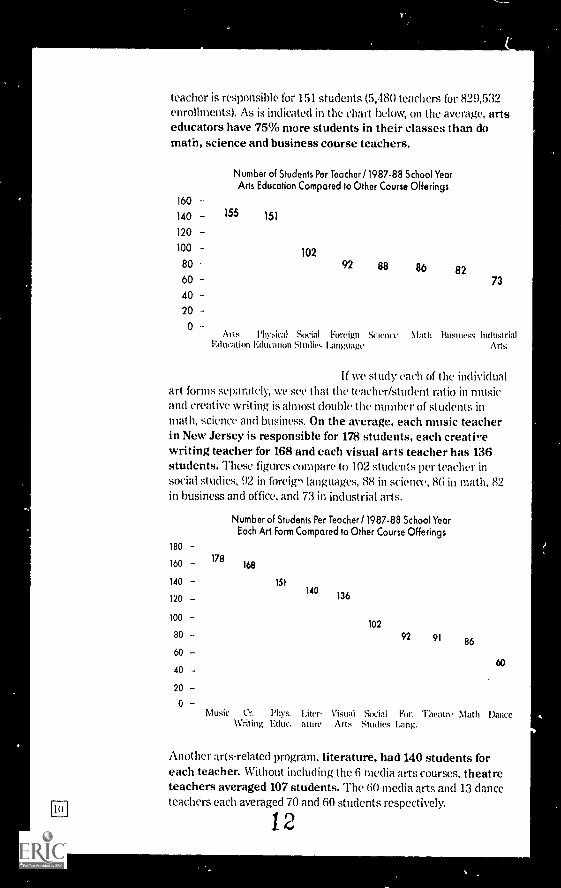
riTil
teacher is responsible for 151 students (5,480 teachers for 829,532enrollments). As is indicated in the chart below, on the average, artseducators have 75% more students in their classes than domath, science and business course teachers.
160
140
120 -100
80
60
40
20 -0
Number of Students Per Teacher /1987-88 School YearArts Education Compared to Other Course Offerings
155 151
10292 88 86 82
73
Arts Phy:-.ical Social Foreign Sieinc Math Business industrialEdliti(in Education Studies LailgThige Alt+
If we study each of the individualart forms separately, we see that the teacher/student ratio in musicand creative writing is almost double the number of students inmat h, science and business. On the average, each music teacherin New Jersey is responsible for 178 students, each creati!'ewriting teacher for 168 and each visual arts teacher has 136students. These figures compare to 102 students per teacher in
social studies, 92 in foreign languages, 88 in science, 86 in math, 82in business and office, and 73 in industrial arts.
180
160
140
120
100
80
60
40
20
178
Number of Students Per Teacher /1987-88 School YearEach Art Form Compared to Other Course Offerings
168
1511.40
136
102
92 9186
60
Music Cr. l'hys. Liter- Visual Social For. Theatre Math DanceWriting Educ. ature Arts Studies Lang.
Another arts-related program, literature, had 140 students foreach teacher. Without including the 6 media arts courses, theatreteachers averaged 107 students. The (i() media arts and 13 danceteachers each averaged 70 and 60 students respectively.
12
Looking only at arts education wealso learn from the department of education's 1987-88 fall reportthat the average class size for dance, theatre and creative writing is19 students. However, the average class size for visual arts andmusic is 48 studentsover two and one half times the number inother arts classes.
lb determine if there had beenany significant increases or decreases in enrollment, school districtswere asked to indimte their grades 9-12 enrollments in each of thefive art forms for the 1986-87, 1987-88, and 1988-89 school years.There was an increase of about 2% in the total enrollments forarts education (9-12) in 1987-88 and again in 1988-89. There wasa 2% increase in total arts enrollments in 1987-88 over the previousyear with an additional 2,600 enrollments. There was a similarincrease of about 2,400 enrollments in 1988-89 which represent a1.8% increase over the previous year.
Course Offerings in Ms EducationThe New Jersey State Board of
Education has adopted as one of the State Educational Goals andStandards: '"rhe public schools in New Jersey shall help every pupilin the State: to acquire the ability and the desire to express himselfor ,ierself creatively in one or more of the arts and to appreciate theaesthetic expressions of other people."9 However, only 402 of 508school districts (79%) which have elementary schools offer thebasic visual arts course Tirt-Elementary" (#1200) to theirchildren. Only 43% of the districts that responded to this surveyindicated they had a goal similar to the State Board of Edu,mtion artsgoal within their district.
Although 22 districts report danceenrollment in this survey,19 only 13 districts are reported offering thebasic dance course (#1261) in the department of education report,Vital Statistics. One quarter (151) of New Jersey's school districts offercreative writing (#1425). Twelve districts teach writing short stories(#1429), 11 teach playwriting (#1430), and 4 teach the writing ofpoetry (#1428) as specific courses.
The basic courses Stage/TheatreArts & Drama (#1446) taught within Communications andTheatre/Stagecraft 1Basic/Introduction 01274 taught withinPerforming Arts are offered in about 180 school districts or 30% ofall 592 school districts in the state. The media arts (Film/Radio/TV)are taught in approximately 90 school districts (15%) throughout thestate.
Please refer to appendix for complete listing of all arts courses offered inschool districts in New Jersey during 198788 school year.
13
,
STAFFING
12
Instructional Time in Arts EducationClassroom instructional time
provided for selected arts courses was reviewed in Mal EducationalStatistics 1987-1.988 and included both elementary and secondaryschools. Elementary schools report providing two 42 minuteclass periods per week of elementary visual arts education.Secondary schools provide 5 periods per week at 43 minuteseach in Art I, and Art H and Art HI. The latter provide roughly thesame amount of time for other courses examined.
The National Art EducationAssociation has recommended that elementary students have 100minutes of visual arts education by a certified arts teacher eachweek. In New Jersy, in those school districts teachingelementary art, students receive an average of 84 minutes perweek. The data cannot confirm that the the teachers have "arts"certification.
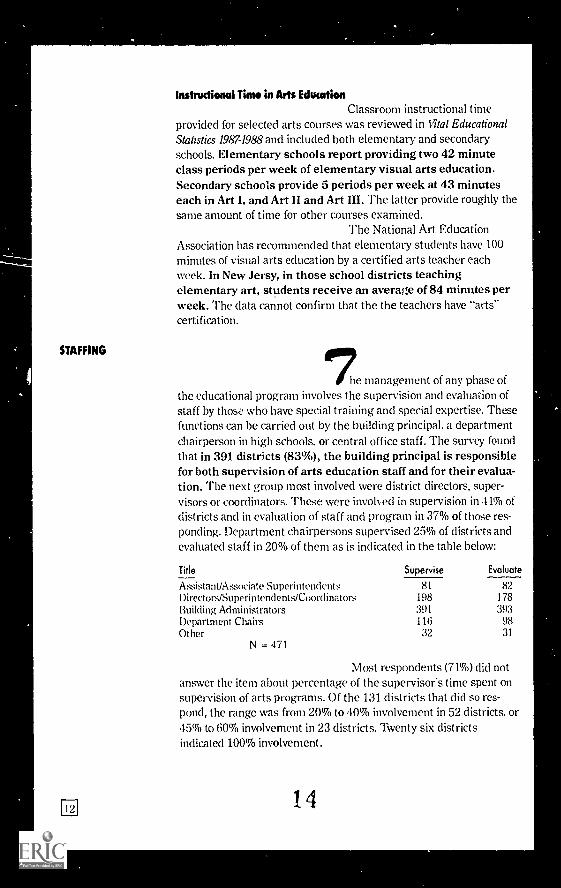
7he management of any phase ofthe educational program involves the supervision and evaluation ofstaff by those who have special training and special expertise. Thesefunctions can be carried out by the building principal, a departmentchairperson in high schools, or central office staff. The survey foundthat in 391 districts (83%), the building principal is responsiblefor both supervision of arts education staff and for their evalua-tion. The next group most involved were district directors, super-visors or coordinators. 'Nese were invohed in supervision in 41% ofdistricts and in evaluation of staff and program in 37% of those res-ponding. Department chairpersons supervised 25% of districts andevaluated staff in 20% of them as is indicated in the table below:
Title Supervise Evaluate
Assistant/Associate Superintendents 81 82
Directors/Superintendents/Coordinators 198 178
Building Administrators :391 393Department Chairs 116 98Other 32 31
N = 471
Most respondents (71%) did notanswer the item about percentage of the supervisor's time spent onsupervision of arts programs. Of the 131 districts that did so res-pond, the range was from 20% to 40% involvement in 52 districts, or45% to 60% involvement in 23 districts. Twenty six districtsindicated 100% involvement.
14
INSTRUCTIONAL Currkulum Polky and Dovidopawnt
METHODS
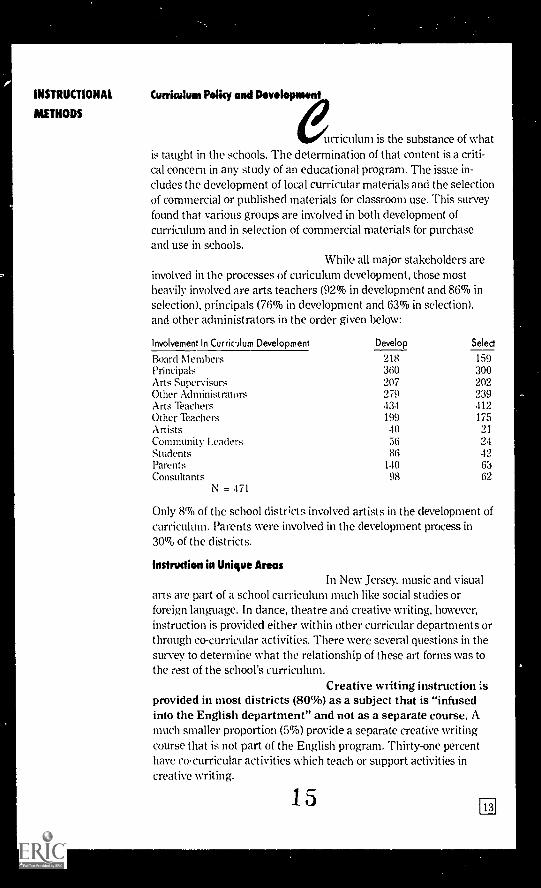
urriculum is the substance of whatis taught in the schools. The determination of that content is a criti-cal concern in any study of an edualtional program. The issue in-cludes the development of local curricular materials and the selectionof commercial or published materials for classroom use. This surveyfound that various groups are involved in both development ofcurriculum and in selection of commercial materials for purchaseand use in schools.
While all major stakeholders areinvolved in the processes of curiculum development, those mostheavily involved are arts teachers (92% in development and 86% inselection), principals (76% in development and 63% in selection).and other administrators in the order given below:
Involvement In Curricilum Development Develop Select
Board Members 218 159Principals 360 300Arts Supervisors 207 202Other Administrators 279 939Arts Teachers 434 412Other Teachers 199 175Artists 40 21
Community Leaders 56 94Students 86 42Parents 140 63Consultants 98 62
N = 471
Only 8% of the school distr;cts involved artists in the development ofcurriculum. Parents were involved in the development process in30% of the districts.
Instruction in Unique AreasIn New Jersey. music and visual
arts are part of a school curriculum much like social studies orforeign language. In dance, theatre and creative writing, however,instruction is provided either within other curricular departments orthrough co-curricular activities. There were several questions in thesurvey to determine what the relationship of these art forms was tothe rest of the school's curriculum.
Creative writing instruction isprovided in most districts (80%) as a subject that is "infusedinto the English department" and not as a separate course. Amuch smaller proportion (5%) provide a separate creative writingcourse that is not part of the English program. Thirty-one percenthave co-curricular activities which teach or support activities increative writing.
15
Dance instruction is providedwithin the physical education program in 197 districts (42%),and as a co-curricular or club activity in 129 districts (27%).Ten percent of the responding districts, however, list it. "as part of thecurriculum equal to music and art." Most districts (66%) provideinstruction in theatre as a co-curricular activity. Nineteenpercent have theatre as part of the curriculum "equal to music andart." Seven percent include it as part of their speech program and37% have theatre as a part of their English department.
Modern Technology in Arts Education
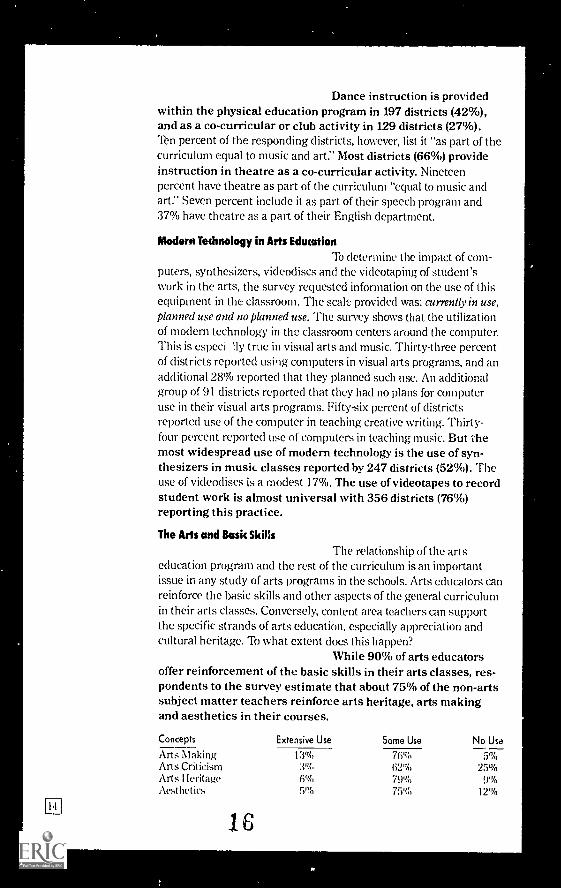
To determine the impact of com-puters, synthesizers, videodiscs and the videotaping of student'swork in the arts, the survey requested information on the use of thisequipment in the classroom. The scale provided was: currently in use,planned use and no planned use. The survey shows that the utilizationof modern technology in the classroom centers around the computer.This is especi Ily true in visual arts and music. Thirty-three percentof districts reported using computers in visual arts programs, and anadditional 28% reported that they planned such use. An additionalgroup of 91 districts reported that they had no plans for computeruse in their visual arts programs. Fifty-six percent of districtsreported use of the computer in teaching creative writing. Thirty-four percent reported use of computers in teaching music. But themost widespread use of modern technology is the use of syn-thesizers in musk classes reported by 247 districts (52%). Theuse of videodiscs is a modest 17%. The use of videotapes to recordstudent work is almost universal with 356 districts (76%)reporting this practice.
The Arts and Bask Skills
The relationship of the artseducation program and the rest of the curriculum is an importantissue in any study of arts programs in the schools. Arts educators canreinforce the basic skills and other aspects of the general curriculumin their arts classes. Conversely, content area teachers can supportthe specific strands of arts education, especially appreciation andcultural heritage. To what extent does this happen?
While 90% of arts educatorsoffer reinforcement of the basic skills in their arts classes, res-pondents to the survey estimate that about 75% of the non-artssubject matter teachers reinforce arts heritage, arts makingand aesthetics in their courses.
Concepts Extensive Use Some Use No Use
rts MakingArts CriticismArts IteritageAest het irs
16
A 1 3% 76% 5%3% 69% 25%6% 79% 9%5'N) 75% 12%
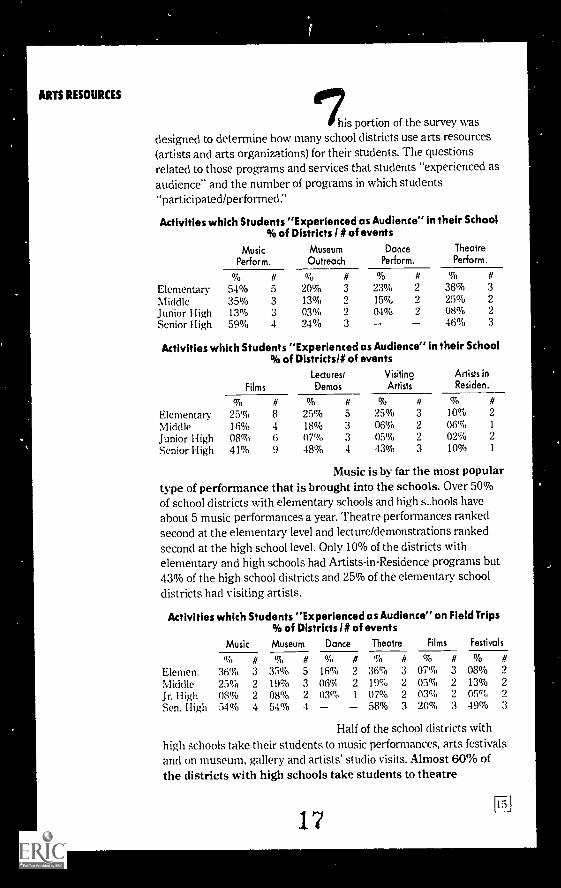
ARTS RESOURCES 7his portion of the survey wasdesigned to determine how many school districts use arts resources(artists and arts organizations) for their students. The questionsrelated to those programs and services that students "experienced asaudience" and the number of programs in which students"participated/performed."
Activities which Students "Experienced as Audience" in their School% of Districts I # of events
MusicPerform.
MuseumOutreach
DancePerform.
TheatrePerform.
% # % # % II
Elementary 54% 5 90% 3 93% 2 38% 3
Middle 35% 3 13% 2 15% 9 95% 2
Junior High 13% 3 03% 2 04% 9 08% 9
Senior High 59% 4 94% 3 46% 3
Activities which Students "Experienced as Audience" in their School% of Districtsl# of events
Films
LecturestDemos
VisitingArtists
Artists inResiden.
# % II % # % ft
Elementary 25% 8 25% 5 25% 3 10% 2
Middle 16% 4 18% 3 06% 2 06% 1
Junior High 08% 6 07% 3 05% 2 02% 9
Senior High 41% 9 48% 4 43% 3 10% 1
Music is by far the most populartype of performance that is brought into the schools. Over 50%of school districts with elementary schools and high s_hools haveabout 5 music performances a year. Theatre performances rankedsecond at the elementary level and lecture/demonstrations rankedsecond at the high school level. Only 10% of the districts withelementary and high schools had Artists-in-Residence programs but43% of the high school districts and 25% of the elementary schooldistricts had visiting artists.
Activities which Students "Experienced as Audience" on Field Trips% of Districts 1# of events
Music Museum Dance Theatre Films Festivals
% ft % # % if % # % # % ft
Elemen. 36% 3 33% 5 16% 2 36% 3 07% 3 08% 9
Middle 25% 2 19% 3 06% 2 19% 2 03% 9 13% 2
Jr. High 08% 2 08% 2 03% 1 07% 2 03% 2 05% 2
Sen. High 54% 4 54% 4 58% 3 20% 3 49% 3
Half of the school districts withhigh schools take their students to music performances, arts festivalsand on museum, gallery and artists' studio visits. Almost 60% ofthe districts with high schools take students to theatre
17FT) 1
performances. About one third of the districts with elementaryschools took pupils on field trips to music performances, museums,galleries, or theatre performances.
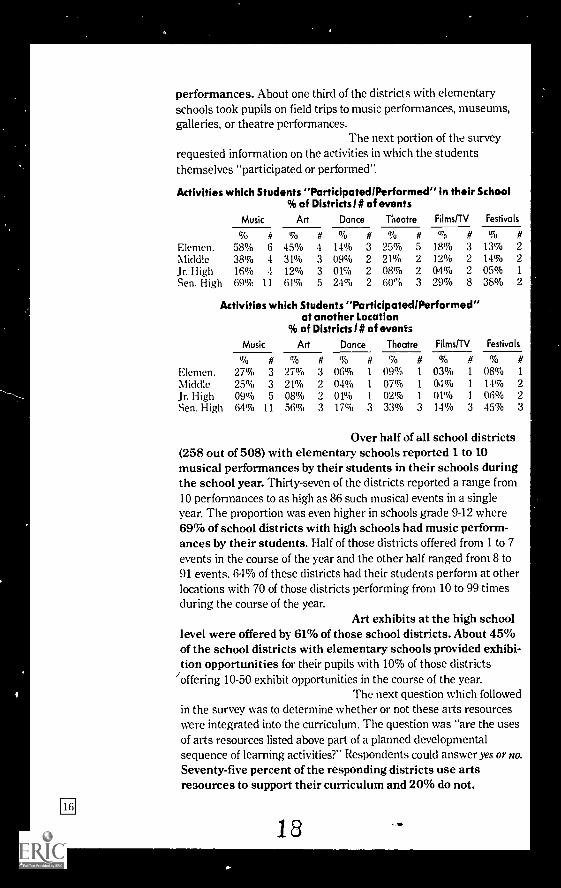
The next portion of the surveyrequested information on the activities in which the studentsthemselves "participated or performed".
Activities which Students "Participated/Performed" in their School% of Districts I# of events
Music Art Dance Theatre Films/TV Festivals
% II % # % # % # % II % #Elernen. 58% 6 45% 4 14% 3 95% 5 18% 3 13% 2
Middle 38% 4 31% 3 09% 2 21% 2 19% 9 14% 2
Jr. H igh 16% 4 12% 3 01% 2 08% 2 04% 9 05% 1
Sen. High 69% 11 61% 5 24% 2 60'"o 3 99% 8 38% 2
Activities which Students "Participated/Performed"at another Location
% of Districts 1 # of events
Music Art Dance Theatre Films/TV Festivals
% II % # % # % # % II % #
Elemen. 27% 3 27% 3 06% 1 09% 1 03% 1 08% 1
Middle 25% 3 21% 2 04% 1 07% 1 04% 1 14% 9
Jr. H igh 09% 5 08% 2 01% 1 02% 1 01% 1 06% 2Sen. High 64% 11 56% 3 17% 3 33% 3 14% 3 45% 3
Over half of all school districts(258 out of 508) with elementary schools reported 1 to 10musical performances by their students in their schools duringthe school year. Thirty-seven of the districts reported a range from10 performances to as high as 86 such musical events in a singleyear. The proportion was even higher in schools grade 9-12 where69% of school districts with high schools had music perform-ances by their students. Half of those districts offered from 1 to 7events in the course of the year and the other half ranged from 8 to91 events. 64% of these districts had their students perform at otherlocations with 70 of those districts performing from 10 to 99 timesduring the course of the year.
Art exhibits at the high schoollevel were offered by 61% of those school districts. About 45%of the school districts with elementary schools provided exhibi-tion opportunities for their pupils with 10% of those districts
'offering 10-50 exhibit opportunities in the course of the year.The next question which followed
in the survey was to determine whether or not these arts resourceswere integrated into the curriculum. The question was "are the usesof arts resources listed above part of a planned developmentalsequence of learning activities?" Respondents could answer yes or no.Seventy-five percent of the responding districts use artsresources to support their curriculum and 20% do not.
18
As a means of helping artsproviders learn how educators find out about arts resources, thesurvey questionnaire asked how school districts "learn of theavailability of such arts resources:'The results:
Direct Mailings 442Newsletters 343Periodicals 319Newspapers 340Resource Guides 215Conferences 288Oral (Word of Mouth) 359Other Means 65
N = 471
ARTS SCHOOLS AND
SPECIAL ARTS
PROGRAMS
The most used means of com-munication is direct mail which in this instance reached 90% ofthe target group. Word of mouth is the second most effective meansof communicating this information. Resource guides and directoriesusually list artists, arts organizations and other arts providers withfee schedules and the types of programs and services available. Thesurvey determined that this was the least effective instrument usedby edumtors to make their arts resource decisions.
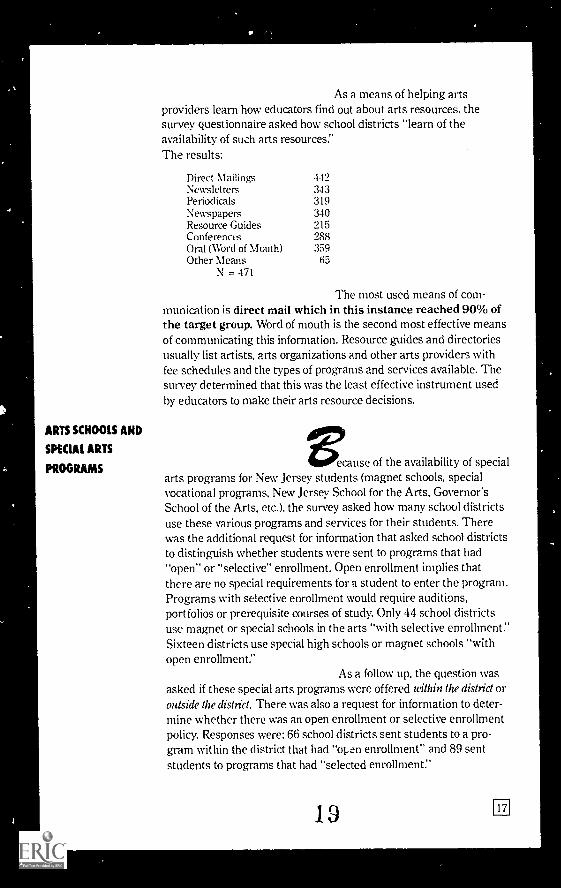
eecause of the availability of specialarts programs for New Jersey students (magnet schools, specialvocational programs, New Jersey School for the Arts, Governor'sSchool of the Arts, etc.), the survey asked how many school cliStrictsuse these various programs and services for their students. Therewas the additional request for information that asked school districtsto distinguish whether students were sent to programs that had"open" or "selective" enrollment. Open enrollment implies thatthere are no special requirements for a student to enter the program.Programs with selective enrollment would require auditions,portfolios or prerequisite courses of study. Only 44 school districtsuse magnet or special schools in the arts "with selective enrollment."Sixteen districts use special high schools or magnet schools "withopen enrollment."
As a follow up, the question wasasked if these special arts programs were offered within the district oroutside the district. There was also a request for information to deter-mine whether there was an open enrollment or selective enrollmentpolicy. Responses were: 66 school districts sent students to a pro-gram within the district that had "ol.en enrollment" and 89 sentstudents to programs that had "selected enrollment."
1 9
FACIUTIES
EQUIPMENT
Another question was whether ornot school districts send students outside the district to special pro-gram(s) with either open or selective enrollment. Responses were: 18school districts sent students to programs outside the district thathad an open enrollment policy and 93 districts sent students outsidethe district with a selective enrollment policy.
/4n effective arts education programrequires facilities and equipment which makes it possible to teachthe many aspects of a comprehensive program which supportsstudent learning. This includes specially equipped rooms, instru-ments, projectors, computer hardware and software, and artsupplies, for example.
This survey found varyingdegrees of adequacy in regard to both facilities and equipment inNew Jersey public schools. For example, 302 districts reportedhaving elementary or middle schools with auditoriums. This is 59%of the 508 districts which include elementary and middle schools inthe state. But 203 of the 280 districts with high schools have suchfacilities. Most elementary schools districts have cafetoriums ratherthan auditoriums.
The survey also found that inelementary districts, or districts which include elementary schools:
to Fifty-three percent have music rooms.N. Fifty-three pement have art rooms.
Only thirteen percent have music practice rooms.1%* Very few districts had darkrooms or dance studios.
Regarding districts which includemiddle and junior high schools, the data are difficult to interpretbecause, while there are only 63 approved junior high schools in thestate, there are numerous other districts which refer to schools asjunior high schools. Hence, for purposes of this anlaysis, thenumbers of such schools are combined. There are 258 schools with agrade span that could be considered middle or junior; specificallygrades 7 and 8. Of this group, using survey data, the following arethe survey findings:
I.-Seventy-six percent had auditoriums.IP. Fifty-five percent have music practice rooms.
All have art rooms.Few have dance studios, visual arts studios or small theaters.
1P-Tiventy-six percent have photographic darkrooms.
20
EVALUATION
Finally, for high school facilities in districts which include at leastone high school or have many, the following results were obtained:
II. Seventy-six percent have art rooms.IP' Seventy-five percent have music rooms.
Seventy-three percent have auditoriums.0' Sixty-one percent have music practice rooms.lb. Theaters, and visual arts and dance studios are found in only
a few districts.
Equipment
In arts programs, equipment isneeded in theaters, studios, photographic laboratories, and includesabroad array of often costly items such as kilns, musical instruments,printmaking devices, sound and lighting equipment and computerhardware and software.
In general, elementary districtstended to report having more equipment on hand than the otherschool levels. It sould be remembered that these data werereported by district, not by school and that reported frequenciesmean that some schools in that district of a given type have thespecified item but not necessarily all of the schools.
Elementary schools are bestequipped with art supplies (75%), musical instruments (69%),projectors (69%), and video equipment (67%). Middle schools arebest provided with art supplies, projectors, and musical instruments.Junior and senior high schools have the same profile with betterprovisions in the area of photographic equipment.
rt educators use a variety ofprocedures for evaluating student gmwth and development,including tests, product evaluations and portfolio reviews. Thissurvey found that the most frequent use of most of theseevaluation procedures occurs in visual arts, music and creativewriting. In numbers of districts reporting use of these procedures,the data for most frequent methods used were as follows:
Procedure Art Music WritingTeacher-made Tests 303 367 253Product Evaluations 402 224 298Performance Evaluations 268 384 169Portfolio 234 18 91Standardized Tests 23 46 87
N = 471
2, 1119
FUNDING
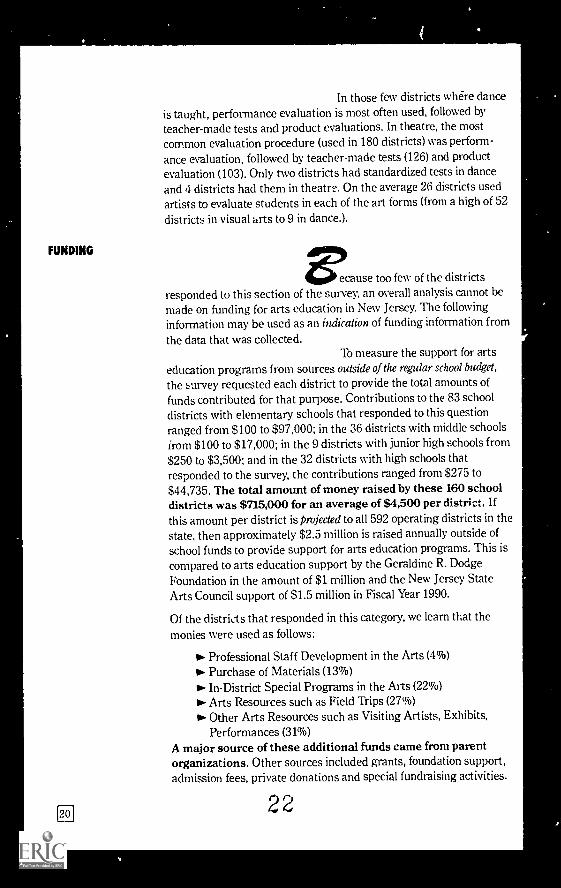
In those fcw districts whe-re danceis taught, performance evaluation is most often used, followed byteacher-made tests and product evaluations. In theatre, the mostcommon evaluation procedure (used in 180 districts) was perform-
ance evaluation, followed by teacher-made tests (126) and productevaluation (103). Only two districts had standardized tests in danceand 4 districts had them in theatre. On the average 26 districts usedartists to evaluate students in each of the art forms (from a high of 52districts in visual arts to 9 in dance.).
6emuse too few of the districtsresponded to this section of the survey, an overall analysis cannot bemade on funding for arts education in New Jersey. The followinginformation may be used as an indication of funding information fromthe data that was collected.
'lb measure the support for artseducation programs from sources outside of the regular school budget,the survey requested each district to provide the total amounts offunds contributed for that purpose. Contributions to the 83 schooldistricts with elementary schools that responded to this questionranged from $100 to $97,000; in the 36 districts with middle schoolsfrom $100 to $17,000; in the 9 districts with junior high schools from$250 to $3,500; and in the 32 districts with high schools thatresponded to the survey, the contributions ranged from $275 to$44,735. The total amount of money raised by these 160 schooldistricts was $715,000 for an average of $4,500 per district. Ifthis amount per district is projected to all 592 operating districts in thestate, then approximately $2.5 million is raised annually outside ofschool funds to provide support for arts education programs. This iscompared to arts edumtion support by the Geraldine R. DodgeFoundation in the amount of $1 million and the New Jersey StateArts Council support of $1.5 million in Fiscal Year 1990.
Of the districts that responded in this category, we learn that themonies were used as follows;
Professional Staff Development in the Arts (4%)P. Purchase of Materials (13%)
In-District Special Programs in the Arts (22%)Arts Resources such as Field Trips (27%)Other Arts Resources such as Visiting Artists, Exhibits,Performances (31%)
A major source of these additional funds came from parentorganizations. Other sources included grants, foundation support,admission fees, private donations and special fundraising activities.
22
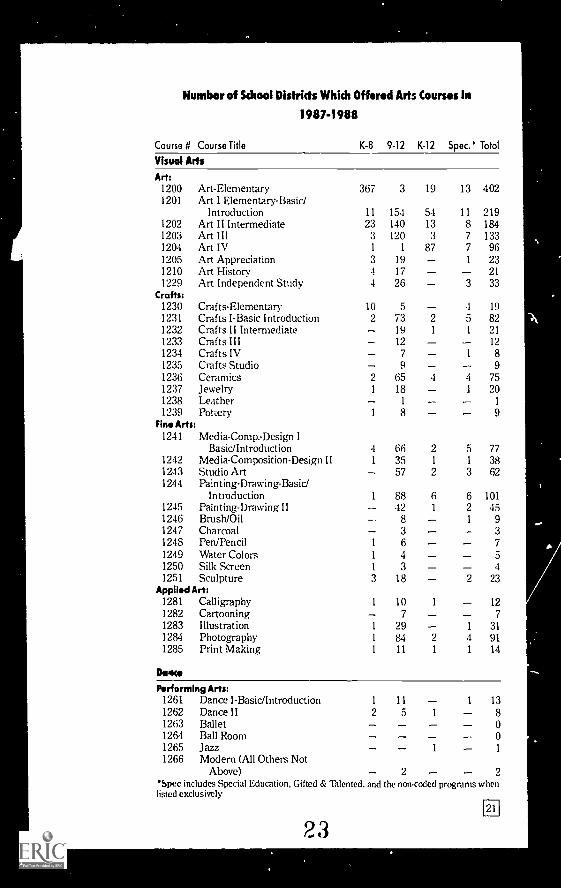
Number of School Districts Whkh Offend Arts Courses In
1987-1988
Course # Course Title K-8 9-12 K-12 Spec.' Total
Visual Arts
Art:1200 Art-Elementary 367 3 19 13 4021201 Art I Elementary-Basic/
Introduction 11 154 54 11 2191202 Art II Intermediate 23 140 13 8 1841203 Art III 3 120 3 7 1331204 Art IV 1 1 87 7 961205 Art Appreciation 3 19 1 231210 Art History 4 17 211999 Art Independent Study 4 26 3 33
Crofts:1230 Crafts-Elementary 10 5 4 191231 Crafts I-Basic Introduction 2 73 2 5 821232 Crafts II Intermediate 19 1 1 211233 Crafts III 12 121234 Crafts IV 7 1 81235 Crafts Studio 9 91236 Ceramics 2 65 4 4 751237 Jewelry 1 18 1 201238 Leather 1 1
1239 Pottery 1 8 9Fin. Arts:
1241 Media-Comp.-Design IBasic/Introduction 4 66 2 5 77
1242 Media-Composition-Design II 1 35 1 1 381243 Studio Art 57 9 3 621244 Painting-Drawing-Basid
Introduction 1 88 6 6 1011245 Painting-Drawing II 42 1 2 451246 BrushJOil 8 1 91247 Charcoal 3 31248 Pen/Pencil 1 6 71249 Water Colors 1 4 51250 Silk Screen 1 3 41251 Sculpture 3 18 2 23
ApplIsti Art:1281 Calligraphy 1 10 1 121282 Cartooning 7 71283 Illustration 1 29 1 311284 Photography 1 84 2 4 911285 Print Making 1 11 1 1 14
Dame
Psirfornilng Arts:1261 Dance I-Basic/Introduction 1 11 1 131262 Dance II 2 5 1 81263 Ballet 01264 Ball Room 01265 Jazz 1 1
1266 Modern (All Others NotAbove) 2 2
*Spec includes Special Edumtion, Gifted & Talented, and the non-coded programs whenlisted exclusively
23121
1221
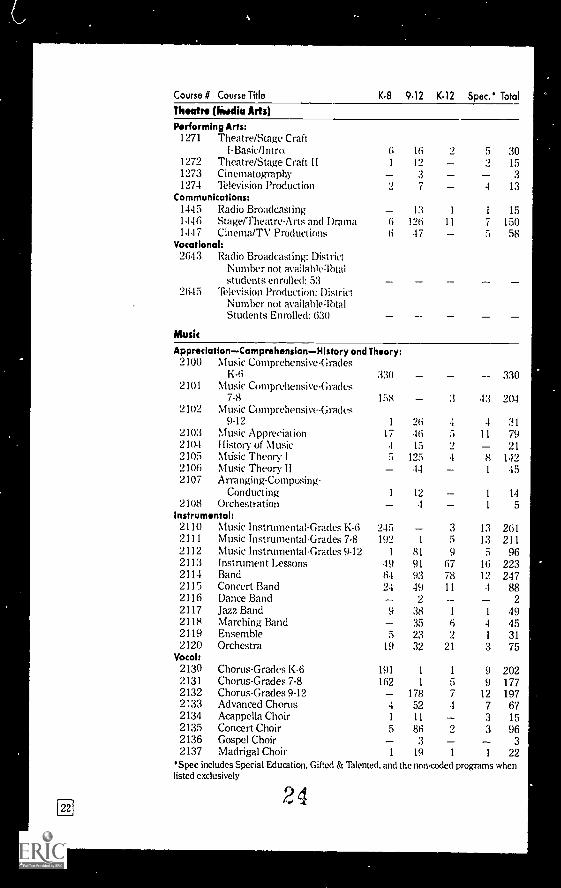
Course 11 Course Title K-8 9-12 K-12 Spec. Total
Thortre (kwalliu Arts)Performing Arts:
1271 Theatre/Stage CraftI-Basic/Intro. 6 16 9 5 30
1972 Theatre/Stage Craft II 1 12 2 151273 Cinematography 3 31274 "relevision Production 2 7 4 13
Communications:1445 Radio Broadcasting 13 1 1 1514461447
Stage/Theatre-Arts and DramaodCinema/TV Pructions
66
12647
11 75
15058
Vocational:2643 Radio Broadcasting: District
Number not availableatalstudents enrolled: 53
2645 Television Production: DistrictNumber not available:IbtalStudents Enrolled: 630
Musk
AppreciationComprehensionHistory and Theory:2100 Music Comprehensive-Grades
K-6 330 3302101 Music Comprehensive-Grades
7-8 158 3 43 2042102 Music Comprehensive-Grades
9-19 1 26 4 312103 NIusic Appreciation 17 46 5 11 792104 History of Music 4 15 9
2105 Mdsic Theory I 5 125 4 8 1492106 Music Theory II 1 452107 Arranging-Composing-
Conducting 1 12 1 142108 Orchestration 4 1 5
Instrumental:2110 Music Instrumental-Grades K-6 245 3 13 2612111 Music Instrumental-Grades 7-8 192 1 5 13 2112112 Music Instrumental-Grades 9-12 1 81 9 5 962113 Instrument Lessons 49 91 67 16 2232114 Band 64 93 78 12 2472115 Concert Band 24 49 11 4 882116 Dance Band 2 22117 Jazz Band 9 38 1 1 492118 Marching Band 35 6 4 452119 Ensemble 5 23 2 1 312120 Orchestra 19 32 21 3 75
2130 Chorus-Grades K-6 191 1 1 9 2022131 Chorus-Grades 7-8 162 1 5 9 1772132 Chorus-Grades 9-12 178 7 12 1972:33 Advanced Chorus 4 52 4 7 672134 Acappella Choir 1 11 3 152135 Concert Choir 5 86 2 3 962136 Gospel Choir 3 32137 Madrigal Choir 1 19 1 1 22
'Spec includes Special Education, Gifted & Talented, and the non-coded programs whenlisted exclusively
24
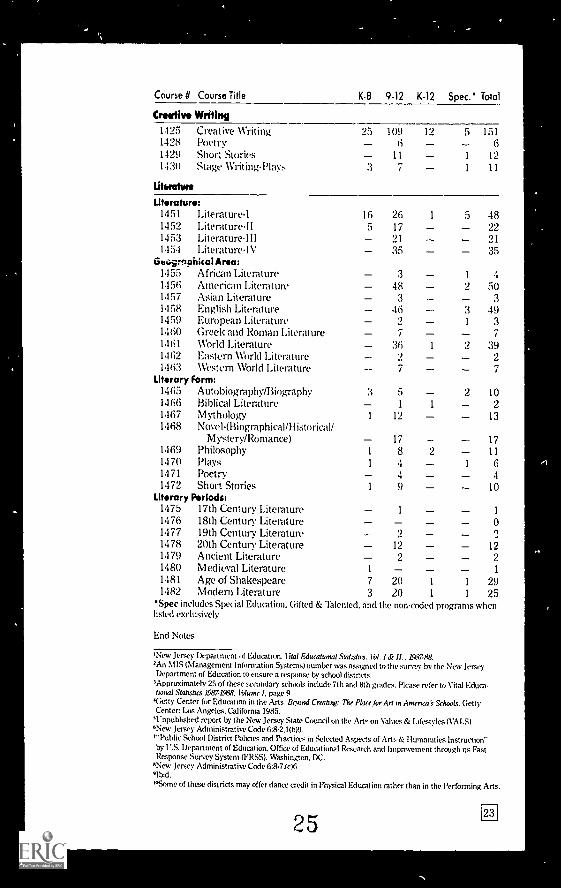
Course # Course Title K-13 9-12 K-12 Spec. Total
Dearth,* Writing1425 Creative Writing 95 109 12 5 1511428 Poetry ___ 6 61499 Short Stories 11 1 121430 Stage Writing-Plays 3 , 1 11
Literature
Literature:1451 Literature-I 16 26 1 5 481452 Literature-11 5 17 221453 Literature. I II 21 211454 Literature-1V 35 35
Cruroohlcal Aroa:1455 African Literature 3 1 41456 American Literature 48 9 501457 Asian Literature 3 31458 English Literature 46 3 491459 European Literature 2 1 31460 Greek and Roman Literature 7 71461 World Literature 36 1 2 391462 Eastern World Literature 2 21463 Western World Literature 7 7
Wormy Form:1465 Autobiography/Biography 3 5 2 101466 Biblical Literature 1 1 21467 Mythology 1 12 131468 Novel-(Biographicalllistoricall
M ystery/Romanee) 17 171469 Philosophy 1 8 2 111470 Plays 1 4 1 61471 Poetry 4 41472 Short Stories I 9 10
Literary Porlodst1475 17th Century Literature I 1
1476 18th Century Literature 01477 19th Century Literature 2 '2
1478 20th Century Literature 12 121479 Ancient Literature 2 21480 Medieval Literature 1 1
1481 Age of Shakespeare 7 20 1 1 291482 Modern Literature 3 20 1 I 25
Spec includes Special Edumtion. Gifted & Talented, and the non-coded programs whenlisted exclusively
End Notes
'New Jersey Department Edutation. (hal Educational Slat:silo. lig. 1 & 11., 1.9674l8.iAn MIS (Management Information S>stems) number was assigned to the survey by the New JetseyDepartment of Eduattion to ensure a response by school dist nets.
3Approximately 25 of these secondary schools include ith and 8th grades. Please refer to Vital Educa-tional Stahstio 19871988. tblumr I. page 9
"Getty Center for Education in the Arts Boond Crrahng: The Place to. Art in Antenca's Schools. GettyCenter: Los Angels, California 1985.'Unpublished report by the New Jersey State Council on the Art= on Values & Lifestyles (VA LSI"New Jersey Administrative Code 6:8-2.1(1)19.r"Public School District Policies and Plactices in Selected Aspects of Arts & I lumandies Instruction"by I S. Department of &WI...anon. Office of EducathinA Research and Improvement through its FastRponse Survey System (FRSSI. Washingmo DC.
"New Jersey Administrative Code 6:8-7.kgi
wSotne of the districts may offer dance credit in Physical Education rather than in the Performing Arts.
2512713
1.