Embed Size (px)
Citation preview

DOCUMENT RESUME
ED 344 639 JC 920 209
AUTHOR Stahl, Virginia V.; Pavel, D. MichaelTITLE Assessing the Bean and Metzner Model with Community
College Student Data.PUB DATE 21 Apr 92NOTE 49p.; Paper presented at the Annual Meeting of the
American Educational Research Association (73rd, SanFrancisco, CA, April 20-24, 1992).
PUB TYPE Reports - Evaluative/Feasibility (142) -- StatisticalData (110) -- Speeches/Conference Papers (150)
EDRS PRICE MF01/PCO2 Plus Postage.DESCRIPTORS occademic Persistence; Community Colleges; *Models;
Predictive Validity; *Predictor Variables; *ResearchMethoOology; Research Problems; *School HoldingPower; *Student Attrition; Two Year Colleges; TwoYear College Students
ABSTRACTThe Bean and Metzner Nontraditional Undergraduate
Student Attrition Model appeared to be a good model to addresscommunity college student attrition because it takes into account theenvironmental variables that colleges must consider to enhancepersistence. A study was conducted to determine how well the Bean andMetzner Model fit with community college student data and to maketheoretically consistent modifications to the model if the fit wereweak. Survey data collected from 597 respondents enrolled at an urbancommunity college were analyzed. Variables included age, gender,ethnicity/race, enrollment status, educational goals, high schoolrank, academic variables (e.g., study habits and absenteeism),environmental variables (e.g., finances, employment, and familyresponsibilities), grade point average, psychological outcomes (e.g.,satisfaction and stress), intent to leave (e.g., plan to re-enrolland transfer difficulty), and dropout. The method used to assess theBean and Metzner model with these data was structural equationmodeling, and statistical procedures were carried out using LISRELand LISCOMP. When the model was found to be a weak fit with communitycollege data, exploratory factor analysis was employed ana resultedin identifying a new model, the Community College Retention Model,which was tested with the community college data and further testedon two student subgroups. The Community College Rei-ention Modelproved to be a plausible model. (Author/AC)
***********************************************************************
Reproductions supplied by EDRS are the best that can be madefrom the original document.
**********************************************************************u

ASSESSING THE BEAN AND METZNER MODEL
WITH COMMUNITY COLLEGE STUDENT DATA
by
Virginia V. Stahl
Scottsdale Community College
and
D. Michael Pavel
University of California - Los Angeles
"PERMISSION TO REPRODUCE THISMATERIAL HAS BEEN GRANTED BY
V. V. Stahl_
TO THE EDUCATIONAL RESOURCESINFORMATION CENTER (ERIC)."
Presentation at the
AERA annual meeting
April 21, 1992
San Francisco
2
UST ellPY AVAILABLE
U S DEPARTMENT OP EDUCATIONOffice of Educations! Research and ImprovementEDUCATIONAL RESOURCES INFORMATION
CENTER IERICI
r This document hoe been reproduced asreceived prom the person Or organizationoriginating it
Minor changes have been made to Improvereproduction Qualify
Points of vie* Of OpnionS Stated in this documen? do not necessarily represent officialOEM position or policy

2
ABSTRACT
Reviewed in the context of the community college literature, the Bean and Metzner
Nontraditional Undergraduate Student Attrition Model (1987) appeared to be a good model to
address community college student attrition, particularly bechise it takes into account the
environmental variables that community colleges must consider to enhance persistence. However,
due to the lack of studies validating Bean and Metzner's model with community college student
data, the appropriateness of the model for explaining community colle 7,e student attrition has not
been clearly determined. The purpose of this study was to determine how well the Bean and
Metzner Model fit with community college student data and to make theoretically consistent
modifications to the model if a weak fit were to be found.
This study analyzed survey data collected from 597 respondents who were enrolled in an
urban community college at the time of the study. The survey items and variables were comparable
to those used in other published studies. The method selected to assess Bean and Metzner's model
with community college student data was structural equation modeling. The required statistical
procedures were carried out with two computer programs, L1SREL (Jöreskog & Stirbom, 1989)
and LISCOMP (Muthén, 1988). Both programs are increasingly recognized as formal
mathematical models; LISREL is more widely used than LISCOMP, but LISCOMP may be better
suited for student persistence research when using categorical data (Muthén, 1984).
When the Bean and Metzner model proved to have weak fit with the community college
student data, exploratory factor analysis was employed and resulted in identifying a new model,
the Community College Retention Model, that proved to be a better fit for the data when assessed
by structural equation modeling. The Community College Retention Model was further tested on
two student subgroups determined by gender and again proved to be a plausible model.
3

3Assessing the Bean & Metzner Model With Community College rata
Introduction
Once opportunities of access have been enhanced, the retention of students is recognized as
critical by all institutions of higher education. It is especially critical to community colleges
because the open door philosophy encourages students with varying degrees of academic
preparation to participate in postsecondary education. Many critics argue this open door has
resulted in a revolving door with many students entering and few persisting (Richardson &
Bender, 1987). The revolving door is costly in terms of monetary and human resources. The
student who drops out experiences psychological loss, disappointment, and decreased earning
power. The institution experiences an erosion of capacity and loss of credibility (Cope & Hannah,
1975).
The issue of attrition remains even more critical when it is recognized that community colleges
are the most likely point of entry for ethnic minorities and women (Lea, Sedlacek, & Stewart,
1979; McCool, 1984). Overall, students are less prone to complete a degree if they begin in a
comriunity college (Anderson, 1981; Kohen, Neste!, & Karmas, 1978). This is troublesome
because of the demographic changes that will occur over the next 10 years. A much higher
percentage of the youth cohort will be from minority backgrounds, from single-parent families,
from poverty households, from multiple earner families, and from "blended" families resulting
from remarriage of one original parent (Hodgkinson, 1983, 1984, 1990).
The growth market in higher education also will undergo significant changes during the next
two decades. Workers, he3ds of households, women, and/or ethnic minorities will become the
modal students. These dramatic demographic alterations will result in community colleges
attracting and enrolling more students with the very attributes associated with academic
underpreparation and nonpersistence (Astin, 1975, 1985; College Board, 1985; Hodgkinson,
1983, 1984; Stahl, 1986). The central role of the community college is very clear: Realizing the
potential dreams of a vast number of our citizens who seek a higher education.
Statement of the Problem
Few studies have advanced a comprehensive model of community college student attrition or
persistence. The Bean and Metzner (1987) Nontraditional Undergraduate Student Attrition Model
represents one attempt at identifying constructs and variables in a dynamic path diagram that define
4
4
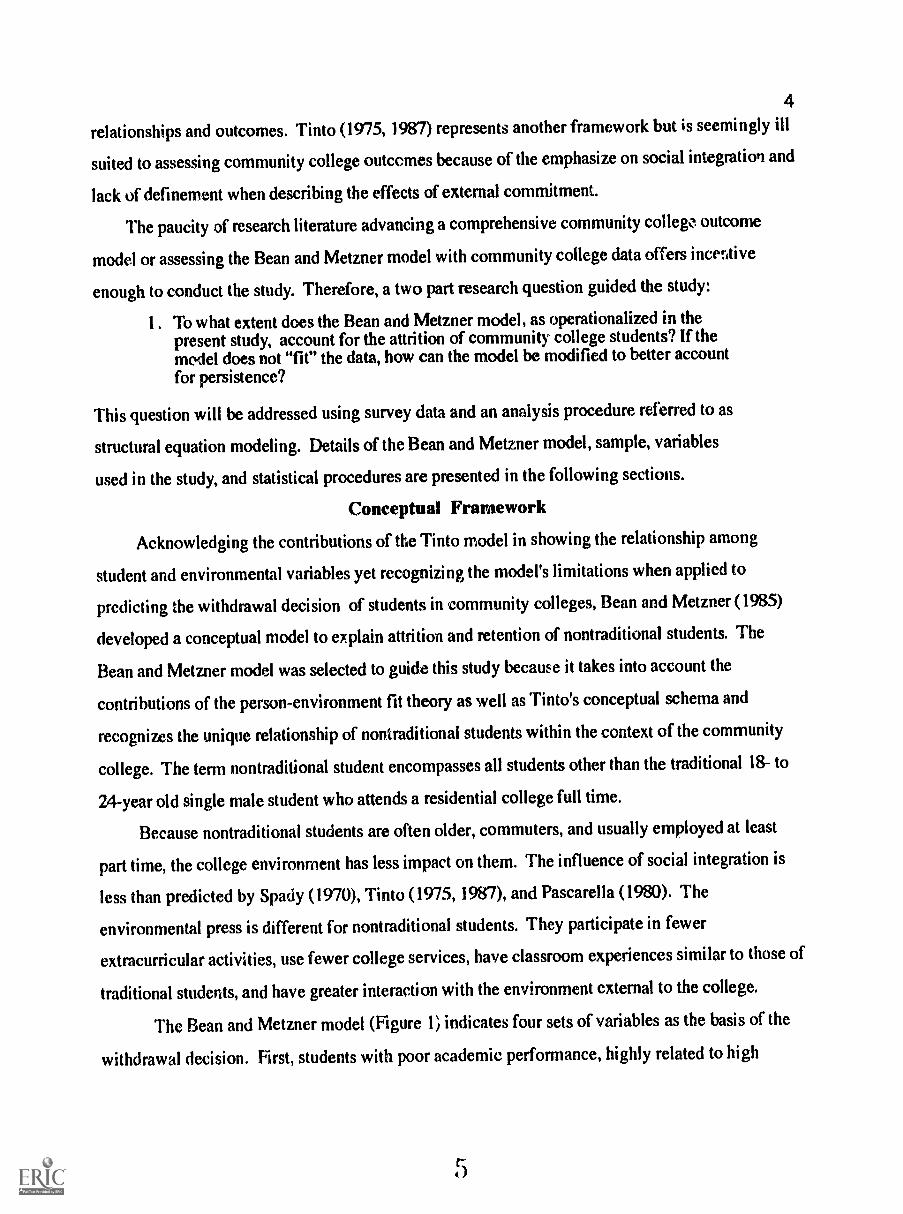
relationships and outcomes. Tinto (1975, 1987) represents another framework but is seemingly ill
suited to assessing community college outcomes because of the emphasize on social integration and
lack of definement when describing the effects of external commitment.
The paucity of research literature advancing a comprehensive community college outcome
model or assessing the Bean and Metzner model with community college data offers incentive
enough to conduct the study. Therefore, a two part research question guided the study:
1. To what extent does the Bean and Metzner model, as operationalized in thepresent study, account for the attrition of community college students? If themodel does not "fit" the data, how can the model be modified to better accountfor persistence?
This question will be addressed using survey data and an anaiysis procedure referred to as
structural equation modeling. Details of the Bean and Metznermodel, sample, variables
used in the study, and statistical procedures are presented in the following sections.
Conceptual Framework
Acknowledging the contributions of the Tinto model in showing the relationship among
student and environmental variables yet recognizing the model's limitations when applied to
predicting the withdrawal decision of students in community colleges, Bean and Metzner (1985)
developed a conceptual model to explain attrition and retention of nontraditional students. The
Bean and Metzner model was selected to guide this study because it takes into account the
contributions of the person-environment fit theory as well as Tinto's conceptual schema and
recognizes the unique relationship of nontraditional students within the context of the community
college. The term nontraditional student encompasses all students other than the traditional 18- to
24-year old single male student who attends a residential college full time.
Because nontraditional students are often older, commuters, and usually employed at least
part time, the college environment has less impact on them. The influence of social integration is
less than predicted by Spady (1970), Tinto (1975, 1987), and Pascarella (1980). The
environmental press is different for nontraditional students. They participate in fewer
extracurricular activities, use fewer college services, have classroom experiences similar to those of
traditional students, and have greater interaction with the environment external to the college.
The Bean and Metzner model (Figure 1) indicates four sets of variables as the basis of the
withdrawal decision. First, students with poor academic performance, highly related to high

school GPA, tend to dropout at a higher rate. A seconc. .fluence is intent to leave which is
affected by academic variables and psychological factors. Background and defining variables,
especially high school performance and educational goals, exert a third influence. Fourth,
environmental variables exert direct effect on the withdrawal decision.
Figure 1. Bean and Metzner's conceptual model of nontraditional student attrition
BACKGROUND ANDDEFINING VARIABLES
AgeEnrollment Status
ResidenceEducational GoalsHS Performance
EthnicityGander
ACADEMICVARIABLES
Study HabitsAcademic Advising
AbsenteeismMajor Certainty
Course Availability
ACADEMICOUTCOME
ERA
PSYCHOLOGICALOUTCOMES
Key:
romils Direct Effects
tigiTellotillitistp7rteasrlitined
ENVIRONMENTALVARIABLES
FinancesHours of Employment
Outside EncouragementFamily ResponsibilitiesOpportunity to Transfer
waySatisfaction
Goal CommitmentStress
law Possible Effects
Social IntegrationVariables
From "Thc Estimation of a Conceptual Model of Nontraditional Undergraduate Student Attrition" by J. P. Bean and
B. S. Metzner, 1987, Research in Higher Education, 27 (1), p. 17.
The model indicates that environmental factors exert more influence than academic variables
and can compensate for negative effects of the academic variables. That is, a student with adequate
financial and/or emotional support tnay persist despite poor advisement or uncertainty of major.
However, the reverse is not true. Positive academic variables cannot overcome negative effects of
the environmental variables; family responsibilities and job come first (Attinasi, Stahl, & Okun,
1982; Bean & Metzner, 1987).
t;

6
A second compensatory effect is between academic outcome (GPA) and psychological
outcomes. Positive psychological outcomes may compensate for lower GPA if students perceive
high levels of utility, satisfaction, or goal commitmaInt. However, the effects of high GPA cannot
overcome the negative effects of high levels of stress or low levels of utility, satisfaction, or goal
commitment.
Background variables are included ha the model because of effect on future performance. For
example, high school performance is the best indicator of college GPA. Defining variables must be
controlled for interaction with the other variables. The external environment reduces the likelihood
students will interact with peers and faculty and may exert negative effects on persistence.
Academic variables have direct effect on GPA as well as increasing interaction with the institution,
both of which increase commitment to persist. Both academic and environmental variables affect
psychological outcomes. GPA affects decision to persist or withdraw voluntarily.
Unlike the importance attributed to social integration in the Tinto model, social integration in
the Bean and Metzner nontraditional student model is assigned little importance but is included to
recognize the possible influence exerted in individual cases.
Background variables. A, .e is included as a significant variable because nontraditional
students are older, and older stu, s have been found to withdraw at a higher rate (Astin, 1975).
The model assumes older students have more family responsibilities and are employed which affect
absenteeism, an academic variable. The number of credits attempted, enrollment status, is included
because it is assumed that students enroll part time due to hours of employment and/or family
responsibilities.
Residence is the most critical variable in the model fordistinguishing nontraditional from
traditional students. Commuters spend little time on campus outside class, have fewer friends at
college, have less faculty contact, and participate in fewer extracurricular artivities. Commuters
usually express more concerns over financing their education. Because they are more likely to be
employed and have family responsibilities, commuters talk about demands on their time (Attinasi et
al., 1982). However, commuters do not differ substantially from residential students in amount
of time spent preparing for class or in classroom experiences.
Educational goals (certainty of major, intent to transfer, goal commitment, and intent to leave)
are included in the model as background variables because they have direct or indirect effect on
7

7persistence. Since many community college students are not seeking degrees, that subset should
be identified and should not be grouped with students seeking degrees. Another background
variable is high school academic performance. High school GPA and rank are positively related to
persistence (Astin, 1975; Cope & Hannah, 1975; De Vecchio, 1972; Peng & Fetters, 1978) and
may be the best predictor of penistence (Bean & Metzner, 1985). However, commuting students
frequently possesq lower grade point averages and achievement test scores (Chickering, 1974);
furthermore, extremely limited research has been conducted to assess the importance of high
school GPA on persistence for older, nontraditional students.
Although there are contradictory findings about the effect of ethnicity/race on persistence,
Bean and Metzner included ethnicity as a background variable with indirect negative effect on GPA
because they assumed a comparatively poorer high school education for minority students. Gender
affects attrition indirectly. Bean and Metzner stated that stereotypical roles still exist in the external
environment and affect persistence through family responsibilities (negative effects on persistence
for women) and lack of opportunity to transfer (positive effect on persistence for women).
Academic variables. The academic variables (study skills and habits, academic advising,
absenteeism, certainty of major, and course availability) have indirect effects on persistence
through GPA, through psychological outcomes, and through intent to leave. Older students report
they spend more time studying than traditional age students, but no research has yet related study
time to attrition.
Academic advising, as a variable, measures student usage and evaluation of the service.
Although the results of studies have been contradictory about the direct effect of advisement, a
recent study by Metzner found the indirect effects of high quality advisement are negatively related
to attrition, and low quality advisement affected persistence more than no advisement (Metzner,
1989). In informal studies, commuter dropout students have expressed dissatisfaction with
academic advisement or indicated improved advisement services might have kept them in college.
Absenteeism has a negative effect on persistence for students with low academic ability and
confidence but has no significance for students who perform better academically. It is included in
the model because nontraditional students typically fall in the former category. Certainty of major
has a significant positive effect on persistence regardless of the age or residence of the student.
Course unavailability is a strong predictor of dropout or transfer, especially for part time students.
t.1

8
Environmental variables. Environmental variables measure factors over which the institution
has little control yet may potentially puil the student away from the college. Lack of finances, long
hours of employment, lack of encouragement, family responsibilities, and opportunities to
have both direct effect on attrition as well as an indirect effect through the psychological outcome
variables. Financial difficulty leads to withdrawal reordless of age or enrollment status.
Furthermore, ability to pay has more effect on goal and institutional commitments than does
academic integration (Cabrera, Castaneda, Nora, & Hengstler, 1990).
Although results are often contradictory, it appears that employment for more than 20 hours a
week is negatively associated with persistence. Encouragement by parents is positively associated
with persistence for traditional students but the effect of spousal encouragement has been found to
be less clear. The influence of friends on the decision to persist or dropout is strong for both
traditional and nontraditional students. Although no empirical evidence about the efft.
employer attitude was found, Bean and Metzner assume a supportive employer who adjusts work
seLedules and remits tuition and fees will have a positive effect on persistence. In their model,
Bean and Metzner replaced Spady's and Tinto's normative (insider) support with outside
encouragement because of the importance of peers, friends, family, and employees. In studies
examining the effect of family responsibilities on persistence, the number of children in families of
community college nontraditional students was found to be positively associated with attrition.
Social integration. Social integration was omitted as a primary component of the model
because, unlike traditional students, nontraditional students do not make persistence decisions
based on the social life or fit of the college. Grade point average directly affects the persistence
decision. Although findings have been mixed, first semester grade point average is a highly
significant predictor of persistence for older students (Costa, 1984; Knoell, 1976).
Psychological outcomes and intent to leave. Academic and environmental variables directly
influence psychological outcomes (utility, satisfaction, goal commitment, and stress) which, in
turn, influence intent to leave. Commuter students are especially interested in the utilitarian aspects
of their education and will persist if they perceive a practical value to education (Chickering, 1974).
However, many older students also want personal rather than career development (Wolfgang and
Dowling, 1981).
9
Satisfaction measures the degree of enjoyment of the student role and of stimulation resulting
from courses. Although goal commitment has been found to be a strong predictor of persistence in
residential universities, its effect in community colleges is lessened because so many students
enroll to enhance vocational and personal development. Stress has a negative influence on
persistence. Commuter students experience stress from the external environment as well as from
college requirements and often talk of the many demands on their time by family, employment, and
cours work.
Intent to leave is the strongest predictor of persistence (Bean, 1980, 1982, 1985; Pascarella et
al., 198(3; -7;acement in the Bean and Metzner model shows that psychological outcomes are the
best predictors of intent, and intent is the best predictor of dropout. Intent to leave is closely
associated with Tinto's postmatriculation institutional commitment; however, intent to leave more
accurately reflects the shorter time frame used for most attrition studies.
Bean and Metzner attributed direct influence by academic variables on GPA and intent to
leave, the two strongest predictors of persistence. One of those academic variables, academic
advising, is a critical independent variable in this study. It is during academic advisement that
students learn of the results of their assessment testing and are advised about courses to take. If
there is a successful match between courses taken and the student's ability to succeed, the GPA
will be sufficient to allow the student the choice of returning to the institution. Academic variables
exert a direct influence on dropout as well as indirect effect through intent to leave and
psychological outcomes. GPA directly affects dropout as well as indirectly through intent to leave.
Research Design
This section reports the research design providing a description of the sample, data
collection procedures, and definition and measurement of the variablesl. This section also contains
a brief discussion of two analytical methods used during the analysis: exploratory factor analysis
and structural equation modeling. The computer program LISREL (Linear Structural
RELationships) was used to as1,zss the measurement and structural models needed to determine the
model's fit to the data. These results were later verified by another computer program LISCOMP
(Linear Structural equations with a COMPrehensive measurement model). Of the two, LISREL is
more refined, is easier to understand, and provides better statistical output; however, LISCOMP is
preferred when employing categorical, non-normal data (Ethington, 1987; Muthén, 1983, 1984,
0

101988; Stage, 1989). This study used both to takc advantage of the strengths and overcome the
weaknesses of each. Exploratory factor analysis was employed to suggest revisions to the model
to improve its "goodness-of-fit" for community college students.
Sample and Data Collection
Students from a single, comprehensive community college in an urban, multi-college district
composed the sample for this study. The college enrolls close to 10,000 students. The subjects
included were enrolled in beginning courses of reading, English, and mathematics. Only students
present in class on the day when the survey was administered were included in the sample.
The data were collected in several stages. First, class sections in beginning reading,
mathematics, and English courses were randomly selected for inclusion in the survey analysis
(Spector, 1981). If a faculty member requested that his/her class section not be included, a
randomly selected replacement section was substituted. Second, a survey was pilot tested during
the 12th week of the semester, and questions were revised to be understood more easily by the
students and, thereby. to obtain more accurate information (Babbie, 1973). The revised survey
was administered during the 14th week of the semester. A third step was to obtain information
about grade point averages and subsequent re-enrollment through the college student information
system after the Fall 1990 semester began.
Table 1 reports the numbers of students in each course who returned surveys and who
remained in the sample. Although the courses selected for this study are considered beginning
courses, two students in Reading 101 and three students in Mathematics 129 were enrolled in the
semester just prior to their graduation and were excluded from this study.
Table 1Survey Response Information
Courses
Students
Enrolled
SurveysReturned
%
Bstu_rnA
lncorr. lletc&law
CompletedSurveys
%
Students
Reading 081 16 11 69 2 (i 56
Reading 091 86 55 64 7 ..,; 56
Reading 101 212 130 62 29 ti9 47
English 071 108 67 62 10 .7 53
English 101 411 234 57 24 210 51
Mathematics 077 327 75 23 17 58 18
Mathematics 124 40 19 48 1 18 45
Mathematics 129 319 194 61 25 166 Slbtals 1519 785 52 115 665 44
1 1.
1 1
Variables and Data Analysis
Assessing the efficacy of the Bean and Metzner model required a method of causal analysis,
with the purpose not to prove causation but to determine if the causal inferences projected a priori
by a theoretical model were consistent with the empirical data (Bollen, 1989; Pedhazur, 1982).
Causal anaiysis is an efficient method for determining the indirect and direct influences of each
independent variable in a theoretically guided causal framework and provides more information to
the researcher than regression analysis (Pascarella & Terenzini, 1991).
Structural equation modeling was selected as the method of analysis because it, unlike path
analysis, can accommodate categorical variables (i.e., nominal or ordinal scale) error in
measurements, and residuals that may be correlated (Baldwin, 1989 ). Structural equation
modeling is a quantitative technique that estimates the covariances among the observed variables
and then uses the covariances to assess the hypothesized relationships among the latent constructs
proposed by a theoretical model. Basic concerns before beginning any research involving
structural equation modeling to test the fit of a theoretical framework include substantive theory that
is grounded in sound research (Baldwin, 1989; Pascarella & Terenzini, 1991) and a sample size
that is larger than the number of structural coefficients (hypothesized relationships) to be estimated
(Long, 1983a).
The first concern was addressed by the Bean and Metzner model which is an adaptation of
Tinto's theoretical model for use with nontraditional students. This framework addresses another
concern that relationships among the variables must be linear, additive, and causal (Stage, 1989).
The second consideration was also satisfied; the sample size far exceeded the number of structural
coefficients and indicated sufficient size to retain robustness (Boosma, 1983; Ethington, 1987).
A third assumption is multivariate normal distribution of the measured variables. "olation of
this assumption results in undependab:e t-values and very difficult model respecification (Baldwin,
1989). This concern was met by the selection and measurement of the observed variables retained
for the L1SREL analysis and by verification of the results with LISCOMP.
This study, as is the usual case, employed a structural equation model and two measurement
models in assessing the Bean and Metzner framework. The structural equation model is
represented by the linear structural equation
1 9

12In this equation, 1 (eta) is the vector of the endogenous variables; t (ksi) is the vector of the
exogenous latent variables; (zeta) is a vector of the residuals or errors. The constructs of the
model (nand are designated as latent variables while the measure of the constructs is performed
by the observed variables (X and Y). It is important that each latent construct be estimated by at
least two, but preferably three or more, indicators to overcome the problems of measurement error
and unreliability (Baldwin, 1989; Gallini & Mandeville, 1984; Marsh, 1988, 1990).
Latent variables are labeled exogenous when they are determined outside the model and, thus,
are not explained by the model (Long, 1983b). An exogenous variable acts only as a cause. In the
Bean and Metzner model, "Background and Defining Variables" are considered exogenous
variables. Endogenous variables, on the other hand, are latent constructs explained by the model.
They act as either a cause and/or as an effect. Examples of endogenous variables from the Bean
and Metzner framework include Academic Variables, Environmental Variables, Intent to Leave, and
Psychological Outcome variables.
In the linear structural equation, B (Beta) and r (Gamma) are designations for the structural
coefficient matrices. The B matrix represents the direct effects of the 1-variables on each other,
e.g., the effect of the external environment on psychological outcomes in the Bean and Metzner
model. The components of the r matrix represent the direct effects of x-variables on the 11-
variables. An example from the model is the effect of the Background and Defining Variables
section (x1) on all the other factors (rfs).
The values and changes in the latent constructs are determined by the observed variables,
labeled as X and Y. The equations for the observed variables are
X = /1 + 6
and
Y + 6.
Lambda X (A) is the matrix of factor loadings of the X independent, observed variables upon the
exogenous latent variables. Lambda Y (Ay) represents the matrix of factor loadings of the Y
dependent, observed variables upon the h endogenous latent variables. Delta (6) and epsilon (e)
are error terms.
Path diagrams and matrices illustrate the theorized relationships among the exogenous,
endogenous, and error variables within the iramework. The following conventions govern the
1 3

1 3
drawing of path diagrams in structural equation modeling (Joreskog & Sorbom, 1988):
I. Observed variables are enclosed in squares or rectangles. Latent variables are enclosed incircles or ellipses. Error terms are indicated but not enclosed.
2. Arrows point from latent constructs to the observed variables used to measure theconstructs.
3. Unidirectional arrows from one variable to another indicate direct influence of the firstvariable on the second.
4. Each arrow is represented by two subscripts. The first indicates the variable at which thearrow is pointing; the second subscript indicates the variable that is directly influencingthe second variable. When applying these concepts to developing matrices, the firstsubscript corresponds to the matrix row, and the second subscript represents the matrixcolumn.
The path diagram of Bean and Metzner's model is displayed in Figure 2. The Background
and Defining Variables compose the only exogenous constructs However, there are six
endogenous constructs: academic variables (ri), environmental variables (it), academic outcome
(13), psychological outcomes (14), intent to leave (15), and dropout (16)
Figure 2. Structural equation path diagram of the Bean and Metzner model
Note: Path subscripts are omitted to reduce clutter.
14

1 4
The next step in establishing the total path diagram was development of the two
measurement equation models that display the number of observed variables that load upon the
latent constructs of the framework. Figure 3 shows the six observed X-variables that load on i.
Figure 3. Path diagram of measurement equation of X-variables on
61
62
63
64
65
66
Note: Path subscripts are omitted to reduce clutter.
1 5

15
Table 2Descri tion of Observed Variables Used to Measure.
Variable Survey Question
Xi Age 43. What is your age? (1= 19 or younger; 5 = 35+)
Gender 44. What is your gender? (1= Female; 2 = Male)
X3 Ethnicity/Race 45. With which ethnic group do you identity?
(1 = White; 2 = Black; 3 = Hispanic; 4 =Indian (NativeAmerican); 5 = Other)
X4 Enrollment Status 38. How many credits are you currently carrying at this
;c? (1 = 0; 6 = 12+)X5 Educational Goals 3 1. at is the highest level of education you seek? k 1=
sscs only; 5 = graduate or professional study)
X6 High School Rank hat was your overall high school ranking? (1=top;
4 = below 75%)
Figure 4 illustrates how the 19 observed Y-variables load on the six is hypothesized in the
Bean and Metzner model. Again, the arrows indicate the relationship between the observed
variables and the corresponding latent constructs. These relationships correspond to the structural
coefficients to be estimated in Ax and AY.
Figure 4. Path diagram of measurement equation of Y-variables on
Note Path subscripts and error terms are omitted to reduce clutter
1 h

1 6
Table 3Pescnption of ObservelVarialAs_Use to lj'vleagatn VariablesVariable Survey Queston
Academic Variables
Y1
Study Habits
Y1 Academic Advising
Y3 Absenteeism
Y4 Certainty of Major
Y 5 Course Avai I a bi I i ty
Environmental Variables 0121
Y6 Finances
Y7 Employment
Y8 Encouragement
Y9
Y10 Opportunity
to Transfer
Family
Responsibilities
Academic Outcome (ii31
Yll Cumulative GPA
Y12 Semester GPA
17. Hours spent on homework weekly
(1 = 0-5; 2 = 6-10; 3 = 11-15; 4 = 16-20;5 = 21 or morc)
18. Confident that possess good study skills(1 = very confident; 5 = not at all confident)
19. Complete homework on time(1 = always; 5 = never)
15. Satisfaction with academic advisement
(1 = strongly agree; 5 = strongly disagree)16. Instructors will give extra help if requested
(1 = strongly agree; 5 = strongly disagree)23. Absent from class (1 = much more than other
students; 5 = never miss class)24. Considered withdmwing due to absences
(1 = strongly agree; 5 = strong disagree)20. Certain of major
(1 = very certain; 5 = very uncertain)21. Availability of desired courses
(1= all wanted; 5= none)22. Availability of courses at convenient times
(1=1111; 5 = none)
13. Able to obtain necessary finances for next
semester (1 = strongly agree; 5 = strongly disagree)1. How many hours work at job (1 r- 1-10;
2 = 1 l-20; 3 = 21-30; 4 = 31-40; 5 = 41+)8. Family supports college attendance
(1 = strongly agree; 5 = strongly disagree)10. Friends support college attendance
(1 = strongly agree; 5 = strongly disagree)12. Employer supports college attendance
(1 = strongly agree; 5 = strongly disagree)28. Family responsibilities interfere with college
(1 = not all all; 5 = a very great amount)
26. Likelihood to transfer (1 = very unlikely;
5 =very likely)37. Useful to attend another college next semester
(1 = very useful; 5 = very useless)
Student records
Student records

17
Psychological 01.M:_a)esj441
Y13 Utility 35. Beneficial for career to re-enroll
(1 = not at all; 5 = a very great amount)36. Desirable to re-enroll
(I= very desirable; 5 = very undesirable)Y14 Satisfaction 27. Loyalty to college
(1 = strongly agree; 5 = strongly disagree)30. Overall satisfaction with life
(1 = very satisfied; 5 = very dissatisfied)34. Satisfaction with quality of education
(1 = very satisfied; 5 = very dissatisfied)Y15 Coal Commitment 32. Importance of achieving educational goal
(1 = very important; 5 = not at all)33. Likelihood of achieving educational goal
( I = very likely; 5 = very unlikely)Y16 Stress 2. Interference of job with college commitments
(1 = a very great amount; 5 = not at all)29. Pleasant to bc a student
(1 = not at all; 5 = a very great amount)Intent to Leave (n5i
Y17 Plan to Re-enroll
Y 18 Trinsfer Difficulty
P):12 Amit_in61
Y19 Dropout
25. Likely to re-enroll next semester
(1 = very unlikely; 5 = very likely)14. DifficuIty to transfer next semester
(1 = very difficulty; 5 = very easy)
Student records
Measures of Fit
The overall "fit" of the model was assessed by examining the ratio of the chi square statistic
(x2) with the corresponding degrees of freedom (db. If the ratio of x2 with the degrees of freedom
is high, the fit is considered poor. However, the fit is considered acceptable when the ratio is
between s 2 (Byrne, 1989) and s 3 (Carmines & McIver, 1981). Some researchers even find a
ratio of s 5 reasonable (Wheaton et al., 1977). The x2 statistic is very much affected by sample
size. If the sample size is too small, the likelihood of accepting an incorrectly specified model is
increased. If the sample size is too large, there is greater iikelihood of rejecting a correctly
specified model (Baldwin, 1989; Gallini & Mandeville, 1984).
1 S

18
The probability level (p) reported is the likelihood of obtaining a higher z2 than the one
achieved, given a correct model (Joreskog & Sorbom, 1988). Because of this crucial difference,
the significance of path coefficients is estimated by t-values. T-values greater than + 1.96 indicate
that a coefficient is statistically different from zero (SPSS, 1990).
Another output statistic, root mean square residual (RMSR), also provides valuable
information about the goodness-of-fit. The RMSR is the average of variances and covariances and
assesses changes in the model when using the same data. The RMSR scale ranges from 0 to 1, but
values s .05 are preferred. Root mean square residual averages the differences between the
hypothesized covariance matrices and the actual structural covariance estimates. It is particularly
helpful in assessing the strengths and weaknesses of various model components in addition to the
overall goodness-of-fit.
In addition to assessing the overall goodness-of-fit, the fit of the individual components of
the model can be assessed through examination of the measurement and path coefficients with the
corresponding t-values. The component measures of fit are critical for improving the model by
identifying the significance of the contributions of observed variables to latent constructs and of the
path relationships between latent constructs.
Findings
The Bean and Metzner model (see Figure 1) was assessed using the path diagrams defining
measurement models and the structural equation model outlined earlier. Although the Background
and Defining Variable of ethnicity/race was of initial interest, the number of minority students
completing the survey information was inadequate for meaningful analysis (whites = 597;
minorities = 68). Therefore, the model was tested only on white students.
The adequacy of a proposed model can be judged on two criteria: first, the degree of
explanation for a significant portion of the variance, and, second, how well the findings conform
to the theorized causal model (Pascarella & Terenzini, 1991; Smart & Pascarella, 1987). Even after
exploring the Bean and Metzner model several ways and restricting the elements in the analyses to
the point of over-specifying the matrix parameters, the results from the structural equation
modeling analysis showed that the Bean and Metzner model was an extremely weak fitting model
for the empirical data of this study (Table 4). The goodness-of-fit indicator (GOF) and Adjusted
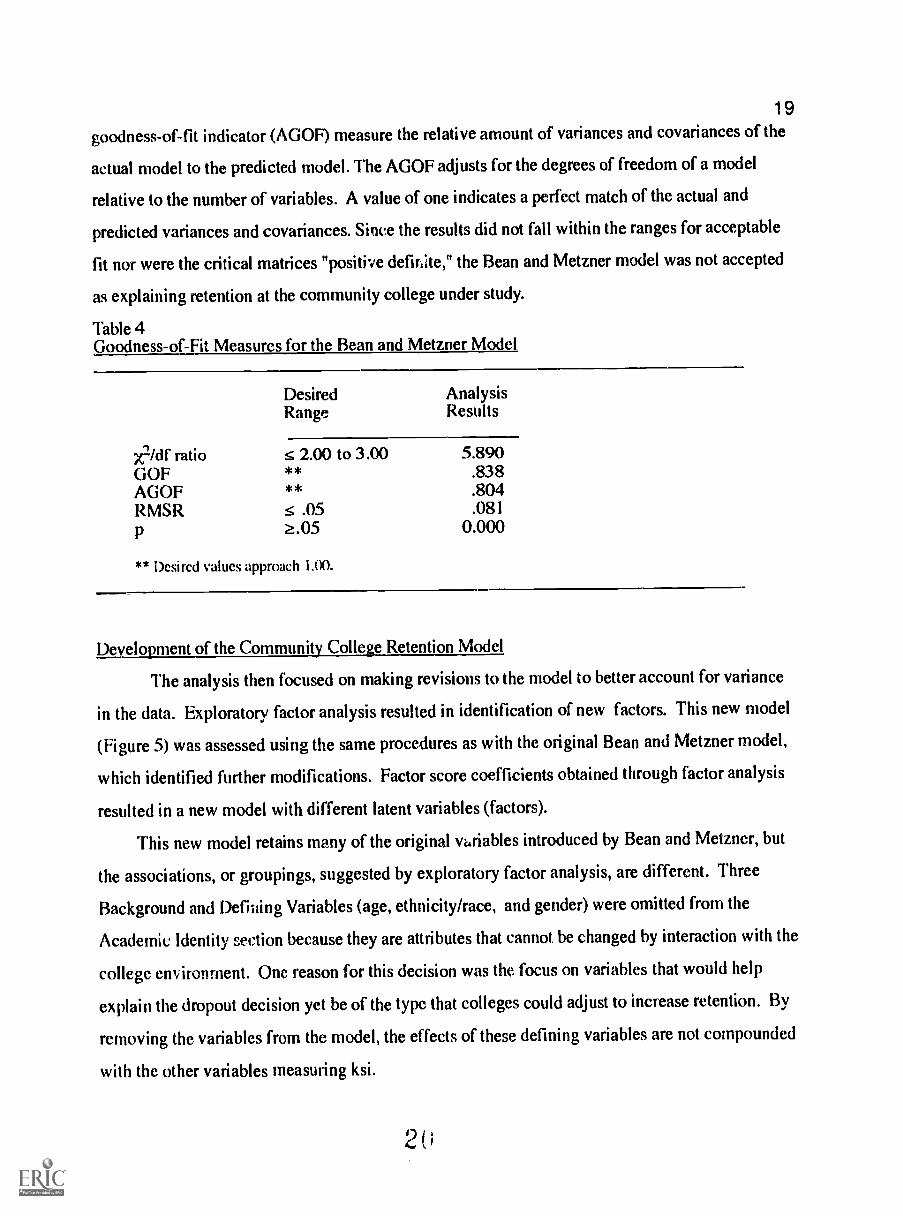
19goodness-of-fit indicator (AGOF) measure the relative amount of variances and covariances of the
actual model to the predicted model. The AGOF adjusts for the degrees of freedom of a model
relative to the number of variables. A value of one indicates a perfect match of the actual and
predicted variances and covariances. Since the results did not fall within the ranges for acceptable
fit nor were the critical matrices "positive defiLite," the Bean and Metzner model was not accepted
as explaining retention at the community college under study.
Table 4Goodness-of-Fit Measures for the Bean and Metzner Model
Desired AnalysisRange Results
x2/df ratio s 2.00 to 3.00 5.890GOF ** .838AGOF ** .804RMSR s .05 .081
P .05 0.000
** Desired values approach 1,(X).
Development of the Community College Retention Model
The analysis then focused on making revisions to the model to better account for variance
in the data. Exploratory factor analysis resulted in identification of new factors. This new model
(Figure 5) was assessed using the same procedures as with the original Bean and Metzner model,
which identified further modifications. Factor score coefficients obtained through factor analysis
resulted in a new model with different latent variables (factors).
This new model retains many of the original variables introduced by Bean and Metzner, but
the associations, or groupings, suggested by exploratory factor analysis, are different. Three
Background and Defining Variables (age, ethnicity/race, and gender) were omitted from the
Academic Identity section because they are attributes that cannot be changed by interaction with the
college environment. One reason for this decision was the focus on variables that would help
explain the dropout decision yet be of the type that colleges could adjust to increase retention. By
removing the variables from the model, the effects of these defining variables are not compounded
with the other variables measuring ksi.
2
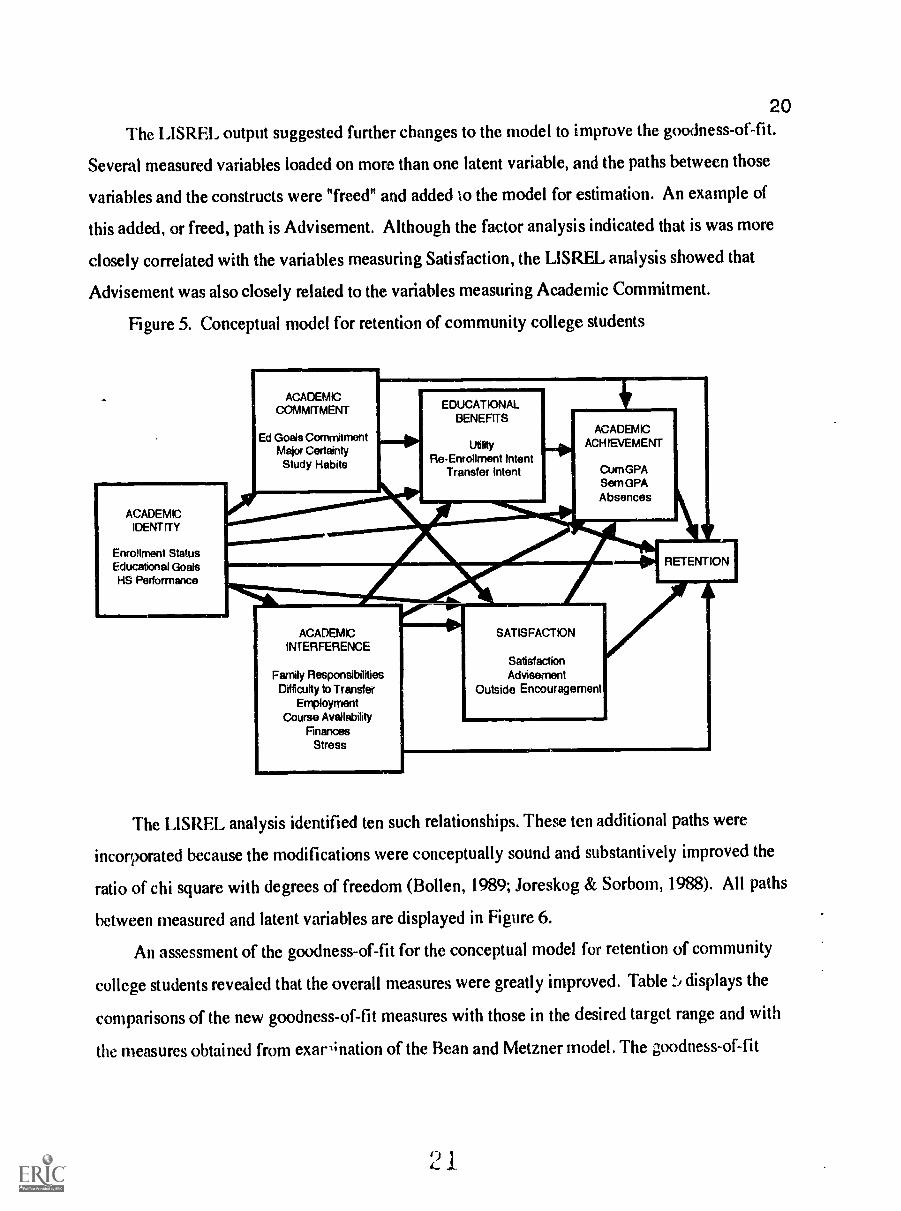
20The L1SREL output suggested further changes to the model to improve the goodness-of-fit.
Several measured variables loaded on more than one latent variable, and the paths between those
variables and the constructs were "freed" and added to the model for estimation. An example of
this added, or freed, path is Advisement. Although the factor analysis indicated that is was more
closely correlated with the variables measuring Satisfaction, the L1SREL analysis showed that
Advisement was also closely related to the variables measuring Academie Commitment.
Figure 5. Conceptual model for retention of community college students
Ar
HCADEMCIDENTfTY
Enrollment StatusEducational Goals
S Performance
ACADEMCCOMMfTMENT
Ed Goals CommitmentMajor Certainty
Study Habits
EDUCATIONALBENEFITS
UtilityRe-Enrollment Intent
Transfer Intent
ACADEMCACHIEVEMENT
Cum GPASem GPAAbsences
1.===l1MMIN. RETENTION
ACADEMCINTERFERENCE
Family ResponsibilitiesDifficulty to Transfer
EmploymentCourse Availability
RnancesStress
SATISFACTION
SatisfactionAdvisement
Outside Encouragement
The LlSREL analysis identified ten such relationships. These ten additional paths were
incorporated because the modifications were conceptually sound and substantively improved the
ratio of chi square with degrees of freedom (Bo llen, 1989; Joreskog & Sorbom, 1988). All paths
between measured and latent variables are displayed in Figure 6.
An assessment of the goodness-of-fit for the conceptual model for retention of community
college students revealed that the overall measures were greatly improved. Table 5 displays the
comparisons of the new goodness-of-fit measures with those in the desired target range and with
the measures obtained from exaHnation of the Bean and Metzner model. The goodness-of-fit
'2 1

21
measures indicated that the Community College Retention model represents a plausible model of
retention.
Once the overall goodness-of-fit measures for the Community College Retention model were
found to be within the desired ranges, the individual components of the model were examined to
determine the significance of the path coefficients of the observed variables to the latent variables.
Figure 6. Path diagram of measurement models
based on community college retention model
Satisfaction
Legend: -11. Orignal Path=sas. Added Path

22Table 5Comparison of.goodness-of-fit Mtasures
DesiredRange
Bean & MetznerAnalysis
New ModelAnalysis
x2 1563.74 441.66df 269.00 186.00x21df ratio s 3.00 5.81 2.37GOF ** 0.838 0.934AGOF ** 0.804 0.910RMSR s .05 0.081 0.056
.05 0.000 0.000** The desired values approach l.(X).
The Lambda X Matrix
The (ksi) variable is an exogenous latent variable; that is, it is determined outside the model
and acts only as a cause. In the Community College Retention Model, the variable, Academic
Identity, was estimated by three observed X-variables, Enrollment Status, Educational Goals, and
High School Performance. Table 6 reports the Ax (Lambda X) matrix with the factor loading
coefficients of the observed X-variables on the variable. Factor loadings that were not significant
are marked by asterisks. Significance is determined by a corresponding t-value greater than ±
1.96 which indicates that the value of the factor loading is statistically different from zero.
In specifying a model for analysis, some values are assigned a value of 1.00 to define the
scale for the latent variable. When these initial values are set to 1.00, they are called "start values,"
and t-values can not be computed for the observed variables. In this matrix, a start value was set
for High School Performance, and the t-value was not computed.
Table 6Lambda X Co_sfficients Based on the Community College Retention Model
Academic IdentityF.nrollment Status .143 *FAucational Goals .185High School Performance .220* Not significant
2 3

23Discussion of Sianifica.ice of X-Yariables
The t-values indicated that Enrollment Status did not contribute significantly to the
measurement of the ksi variable, Academic Identity. An assessment of the component fit measures
also indicated an extremely low (0.9%) amount of variance (R2) accounted for by Enrollment
Status. The variable Educational Goals was significant. In addition to the t-value indicator, the
variance of ksi accounted for by Educational Goals was 4.8%. Educational Goals had a very good
fit with Retention, but the association was negative. It appeared that goals for more education were
associated with non-retention at this community college. Although the t-value for High School
Performance was not computed, other component fit measures (R2 and fitted residuals) indicated a
good fit.
It appeared that the overall model and measurement of ksi would be improved for this study
with the omission of Enrollment Status. The other two variables, Educational Goals and High
School Performance, appeared to be good measures of ksi. However, the total coefficient for
determination estimated for all X variables on ksi was only 0.115, and 1.00 is the target value.
Lambda Y Matrix
The second matrix that reports the factor loadings of observed variables (Y) to the
endogenous variables (1) is Ay (Lambda Y). The endogenous variables are latent variables
explained by the model and can act as both cause and effect. Table 3 outlined the measurementof
these variables. Table 7 reports the factor loading coefficients of the Lambda Y matrix elements.
PJcussion of Si nificance of Y-Variables
The t-values indicated that all Y variables were significant in measuring the eta (ri) variables.
In addition, the R2 estimate for all Y variables was 1.00, and the fitted residuals also indicated
good fit. Overall, the Lambda Y measurement niodel represented a good fit between the measured
and latent variables.
Each observed variable is significant when measuring the latent variable in addition to the
paths added during the modifications. In each case, the coefficient for the added path is somewhat
smaller than the coefficient for the original path except for Absences and Stress. For all the
variables, except Absences and Stress, it appears that the clustering of variables identified through
factor analysis is reaffirmed by the LISREL analysis.

24Table 7Lambda Y Coefficients Based on the Co i_nutlly College Retent'on Model
AcademicCommitmcnt
Academieinterference
EducationalBenefits Satisfaction
AcademicAchievement Retention
Goal CommitMajor CertainStudy Habits
.371.414.446
-.127
Family Resp. .448Transfer Diff. -.506 -.230Employment .381Avail. Courses .212 -.142Finances .436 -.351 .134Stress -.120 .230Utility .667 .295Re-enr. Intent. .925Transfer Intent .916Satisfaction .500Advisement -.229 .532Encourage. .327 -.116Cum GPA .657Sem GPA .754Absences .303 .106Dropout .455
Gamma Matrix
The Gamma Matrix reports the stanuardized coefficients of the effects of the exogenous ksi
variable on the endogenous 4ta variables and the corresponding t-values. In this study, the Gamma
Matrix reports the coefficients estimated for ksi on the six eta variables: Academic Commitment,
Academic Interference, Educational Benefits, Satisfaction, Academic Achievement, and Retention.
The resulting path diagram of covariance coefficients of ksi to the eta variables is illustrated in
Figure 7.
Discussion of the Gamma Matrix
The direct effects of the exogenous variable on all six endogenous variables were significant
as indicated by the (-values. Further examination of the total and indirect effects of Academic
Identity on the six eta variables found that the effects were high. The negative relationships of
Academic Identity to Academic Interference, Educational Benefi'-., and Satisfaction should be
noted. It would appear that students who did well in high school and who aspire to higher

25educational goals experience less interference with their college commitments, do not feel it is so
useful to remain at this college, and experience less satisfactkm at this college and in their lives.
Figure 7. Path diagram of gamma effects within the community college retention model
Table 8Gamma Matrix Coefficients Based on theCommunity College...Retention Model
Academic Identity
Academic Commitment (i 1) .767
Academic Interference (112)
Educational Benefits (113) - 1.728
Satisfaction (14) -.902
Academic Achievement (15) 3.501
Retention (116) 5.585
Beta Matrix
Table 9 reports the standardized coefficients that estimate the strength of the effects of the
endogenous variables on each other.

26Table 9Beta Coefficients Based on the Community College Retention Model
Mad CommitAcad IntederEd BenefitsSatisfactionAcad AchieveRetention
AcademicCommitment
AcademicInterference
Educational
Benefits SatisfactionAcademic
Achievement Retention
1.026.982
-1.576-2.686
-.574-.6311.5272.169
1.5713.103
.400.425 * -1.199
* Not significant
These relationships are further illustrated in Figure 8 which is a path diagram of the
relationships among the eta variables.
Figure 8. Path diagram of beta effects within the community college retention model
Discussion of the Beta Matrix
The path coefficients from Academic Commitment to four other eta variables were all
significant; however, the negative relationships with Academic Achievement and Retention were
surprising. They indicate that high scores for Academic Commitment were negatively associated

27with high GPA's, low absences, and dropout. The positive relationships between Academic
Interference and Academic Achievement and Retention indicated that high values of variables
measuring Academic Interference were associated with high grade point averages, low absences,
and high retention rates.
The effects of Educational Benefits on Academic Achievement and Retention were positive
and significant. The direct effect of Satisfaction on Retention was not significant, nor were there
large indirect effects through Academic Achievement. The large negative effect of Academic
Achievement on Retention indicated that high GPA's and low absences have a negative relationship
with Retention at this college.
Gender Com aprjsais
As a further test of the efficacy of the revised Community College Retention Model, separate
analyses of structural equation modeling were initiated for the male students (N = 274) and the
female students (N = 323) in the sample used to test the full model. The following table reports the
findings for goodness-of-fit measures for the full Community College Retention Model and for the
separate analyses for gender comparisons.
Table 10Goodness-of-Fit Measures for Gender Comparisons
AcceptableRange
AnalysisFull Model
AnalysisFemales
AnalysisMales
.x2 441.66 374.46 291.63df 186.00 186.00 186.00
j2kif ratio s 3.00 2.37 2.01 1.57GOF ** .934 .900 .914AGOF ** .910 .864 .883RMSR s .05 .056 .072 .053
P .05 .000 .000 .000** The desired values approach 1.(X).
The overall goodness-of-fit measures indicated that the Community College Retention model
remained plausible for explaining retention for both genders although it appeared to be stronger for
male students.

28Discussion and Conclusion
When the Bean and Metzner model proved not to have good fit with the data, a new model,
the Community College Retention Model, was developed through explorator, tor analysis and
was assessed for its explanatory strength through structural equation modeling. The LISREL
analysis suggested modifications to the model and these were incorporated.
The first goal of developing the Community College Retention model was to explain the dal a
of this study more accurately. The Community College Retention Model proved to a plausible
model . The coefficient of determination (measure of variance accounted for) for the structural
equations for the overall Community College Retention Model was 0.995. Since 1.00 is the goal,
the model was accepted as having good fit with the data.
Table 10 compares the relationship of the original measurement variables and latent constructs
in the Bean and Metzner model with the realignment of those variables in the Community College
Retention Model.
Table 10
Comparison of Variables in the Bean & Metzner 'Mode at id Community College IZetention Model
Bean and Metzner Model Community College Retention Model
Backgmund and Defining VariablesEnrollment StatusEducational GoalsHS PerformanceAgeEthnicityGenderResidence
Academic VariablesStudy HabitsMajor CertaintyAcademic AdvisingAbsenteeismCourse Availability
Environmental VariablesFinancesHours of EmploymentFamily ResponsibilitiesOpportunity to TransferOutside Encouragement
Ae3demic IdentityEnrollment StatusEducational GoalsHS Performance
Academic CommitmentStudy HabitsMajor CertaintyEducational Goals Commitment
Academic InterferenceFinancesEmploymentFamily ResponsibilitiesDifficulty to TransferCourse AvailabilityStress

Academic OutcomeGPA
Psychological OutcomesSatisfactionUtilityGoal CommitmentStress
Intent to Leave
Dropout
Academic AchievementCumulative GPASemester GPAAbsences
SatisfactionSatisfactionAdvisementOutside Encouragement
Educational BenefitsTransfer IntentRe-Enrollment IntentUtility
Retention
29
All the latent constructs and some of the measurement variables were renamed. The Bean and
Metzner Background and Defining Variables of age, gender, ethnicity, and residence were omitted
in the Community College Retention Model. The variables of age, gender, and ethnicity identify
important student groups; in order for the model to be used effectively in studying retention
patterns for these student subgroups, it is best not to co-mingle the effects of the demographic
vadables with the other variables in the model. Residence was no', necessary because all students
in this sample were commuter students and, thus, met the Bean and Metzner definition of
nontraditional students. The Bean and Metzner variable of GPA was expanded to Cumulative GPA
and Semester GPA.
The relationship of many measurement variables to latent constructs remained the same in
both models: Enrollment Status, Educational Goals, High School Performance, Study Habits,
Major Certainty, Finances, Hours of Employment, Family Responsibilities, Opportunity to
Transfer, and Satisfaction. Other variables measured latent constructs different from the Bean and
Metzner model: Academic Advisement, Absenteeism, Course Availability, Outside
Encouragement, Utility, Goal Commitment, and Stress.
A serc)nd goal in developing a model that represents the data well is to assess the relative
strength of the individual variables in the model in accounting for retention. Two of the three
variables measuring the exogenous variable, Academic Identity, were found to be significant
although they accounted for little of the variarce.
3 (+

30Table 11Variance Table for Lambda X Variables
Variable Significant Squared Multiple Correlations*Educational Goals yes .048High School Performance yes .066Enrollment Status no .009
(Coefficient of Determination* for X Variables is .115)
* Desired values approach 1.00.
Goals for more education were associated with non-retention at this college. Prior studies
have reported positive relationships of high Educational Goals to retention (Webb, 1988);
however, they may not have reflected the retention patterns at a community college. To achieve
goals of higher degrees, the students must leave the community college. The time chosen for
transfer depends on many factors, such as finances, major, and difficulty to transfer. It is
important that community colleges account for these transfers and not count them as dropouts. In
flct, Okun, Ruehlman, & Karoly (1990) suggested that the term "institutional turnover" be used to
describe more accurately the kaving pattern of many community college students who transfer to
another college.
High School Performance was also negatively associated with retention although it has been
proposed as the best predictor of college grades and/or persistence for traditional students in
residential colleges (Astin, 1975; Bean and Metzner, 1985; Peng & Fetters, 1978). Prior research
was conducted using traditional students as the sample. In this study, more than half of the
students stated they were in the bottom half of their high school class. Since the community
colleges are attracting these students with records of low academic performance, the colleges must
address this problem as the student enrolls or the college will be a "cooling out" institution for
many students.
Enrollment Status was found not to be significant in measuring Academic Identity. Earlier
studies had found that a high number of credits was negatively associated with GPA because
students work education into already crowded schedules. Also, younger students tend to attend
full time and earn lower grades (Johnson & Wahlberg, 1988). The responses for this variable
were heavily skewed toward full time students and probably accounts for this result which is
31

31
contrary to expectations from the literature. It is important that advisors and instructors cue
students about time requirements so students can make informed choices about their ability to
succeed in the class and meet their obligations at home, work, and in other classes.
All the Y variables wece found to be significant for this study. Bean and Metzner had selected
tiiem to measure the endogenous variables because they were found to significant in previous
retention studies. The relative contributions of each variable in measuring the latent constructs, as
indicated by the squared multiple correlations, were varied. These indicators can provide
assistance when searching for variables to eliminate in making the model more parsimonious or for
variables to redefine in improving the model.
Table 12Variance Table for Lambda Y Variables
Variable Squared MultiRle Correlations*Cumulative Grade Point Average .861Semester Grade Point Average .826Satisfaction .632Intent to Transfer .613Utility .599Study Habits .461Intent to Re-Enroll .330Advisement .302Finances .282Transfer Difficulty .264Absences .230Goal Commitment .210Encouragement .202Stress .193Available Courses .17,,Family Responsibility .174Major Certainty .112Employment .072
(Coefficient of Determination* for Y Variables is 1.00.)
* Desired values approach 1.(X).
The direct effects of the exogenous variable, Academic Identity, to the six endogenous
variables were all significant (Figure 7). Pascarella, Duby, & Iverson (1983) found that the effects
of background variables were equal to, if not more important than, college experiences on
retention. The findings of this study also pointed out the importance of background on Retention
3 2

32(5.585) and Academic Achievement (3.501). Not so strong was the direct effect on Academic
Commitment (.767). However, the negative effects of Academic Identity on Educational Benefits
(-1.728) and Satisfaction (-.902) were at first surprising.
Background variables associated with previous academic success were negatively associated
with student perceptions of the benefits and satisfaction of remaining at the community college
under study. These two negative associations again bring forth the issue of accounting for transfer
..t,u&nts in retention studies of community college students. These findings raise questions about
students who have past academic success and who seek higher degrees. Do they transfer, stopout,
or dropout?
All but onc of the direct effects (Satisfaction on Retention) of the endogenous variables on
each other were significant (Figure 10). The paths from Academic Commitment to Educational
Benefits (1.026) and to Satisfaction (.982) were positive and expected from the literature. The
negative paths to Academic Achievement (-1.576) and to Retention (-2.686) were not expected.
High goal commitment, certainty of major, and confidence in study habits have been linked with
high GPA's and retention in other studies (Anderson, 1988; Pascarelia, Duby, Miller, & Rasher,
1981, 1983; Webb, 1988; Williamson & Creamer, 1988). Because measurement paths were added
as suggested by the the modification indices, the measurement of both constructs was affected by
five additional paths which could have led to this negative relationship.
The negative relationship of Academic Commitment with Retention is not surprising when it
is realized that students must leave the community college to attain higher degrees. That this
occurred at the end of the first year is also not surprising because other studies have reported that
dropout rate is highest at the end of the first year (Pascarella & Terenzini, 1979, 1983a; Tinto,
1987). The impact of thir, behavior is direct and expensive for the commuaity colleges.
Responding to so many new students each year puts a strain on college services, such as
advisement and registration. Second year programming is limited and puts a hardship on students
seeking sophomore level courses at times convenient to their working schedules. The morale of
the faculty is also affected. Many desire to teach other than introductory courses and P re
disheartened by the exoduc of students with high academic commitment.
The variables measimng Academic !nterference have been studied often. Previous findings
had been that family responsibilities would interfere with educational activities and lead to dropout.

33Difficulty in transferring would retain the student at the college longer, employment would
negatively affect persistence, and course at inconvenient times would lead to withdrawal (Bean and
Metzner, 1985). Inadequate finances have been linked to withdrawal (Bean and Metzner, 1985;
Cabrera et al., 1990; Okun ei al., 1990; Webb, 1988). Multiple demands on student time lead to
higher stress levels and withdrawal.
What was unexpected was that high indicators of Academie Interference were positively
associated with Retention (2.169) and Academic Achievement (1.527). The findings from this
analysis indicated that the external variables over which the college has no control did not exert the
negative influences on performance and persistence as projected by Bean and Metzner (1985,
1987) and Tinto (1987, 1988). The students in this sample earned good grades and remained in
college despite the traditional indicators of potential dropout. This might be because they are able
to accommodate education into their routines; another consideration is the large number of younger
students in this sample who are unmarried and without children. Their perception of family
responsibilities is much different from single parents with young children.
The negative relationships of Academic Interference with Educational Benefits (-.574) and
with Satisfaction (-.631) were expected. High indicators of Academic Interference were related to
low indicators of usefulness to continuing and intent to re-enroll and to high intent to transfer.
Indicators of high interference would also be associated with indicators of low overall satisfaction,
low satisfaction with advisement, of little outside encouragement to continue.
Because these external vanables are impossible for the institution to control, a benefit of
identifying these relationships is to assist students during advisement. Predictive advisement can
point out potential areas of trouble as well as identify college resources, such as child care,
financial aid, early registration deadlines, and on-campus employment, to combat the indicators of
Academic Interference.
The relationships between Educational Benefits and Academic Achievement (1.571) and
Retention (3.103) were positive and strong. Tne variables used to measure Educational Beuefits
have been found to be significant predictors in many previous studies. Chickering (1974) found
the practical value of continuing in college (utility) to be important to persistence. Okun et al.
(1990) found Intent to Re-Enroll to be the best predictor of retention, and Bean (1987) found Intent
to Transfer the best predictor of leaving the institution.
34The power of these indicators can be tapped by the college at registration to assist in academic
advising. Since student intent is so closely tied to retention, advisement can focus on specific short
and long range plans. An important function that is often ignored during the rush of registration
and advisement is followup tracking. Transfer students can be identified and tracked for their
success at the receiving institution. This important indicator of community college success is often
neglected but will become even more critical as the accrediting agencies demand plans for assessing
institutional effectiveness and student success.
Satisfaction (satisfaction with life overall, satisfaction with quality of education, loyalty to the
college, satisfaction with academic advisement, access to faculty outside of class, and outside
encouragement) was positively associated with Academic Achievement (.400) and Retention (.425)
although the relationship to Retention was not significant. These findings were supported by
earlier studies. Okun et al. (1990) found that loyalty to the institution was not significant and that
students viewed the college as a means rather than an end. Pascarella et al. (1983) determined that
commitment to two-year institutions was based on academic integration. Others found that parental
encouragement was important but there were no reported findings about spousal encouragement.
When the variables measuring Satisfaction in this study are examined, it is not surprising that
this path was not significant. More than 50% of the students were neutral when asked about
loyalty to the college although they expressed satisfaction with advisement and the quality of
education they were receiving. Their outside support systems encouraged college attendance more
strongly than they supported attendance at this particular college. This transitory view of the
community college for an overwhelming number of students brings special problems. Okun et al.
(1990) suggested that planning and intervention be aimed only at students who stated their intent to
stay; yet 82% of the Okun sample reported their intent to stay, and only 62% did. Others would
say that academic advising should be provided to all because it is often a key intervention that helps
retain students (Carroll, 1988).
Community colleges can address this problem in several ways. One is to recognize the
"passing through" nature of their students and continue to provide advisement services that take
into account both short and long range plans. A second is to develop students services programs
that build student loyalty and family encouragement for the college. Both can be expensive in
terms of college human resources, but the first appears to be more practical in an urban setting

35Awhere "swirling students" are so prevalent (de los Santos & Wright, 1990).
The relationship of Academic Achievement to Retention was negative (-1.199). High grade
point averages and low absences were related to higher withdrawal rates at this college. This
would not have been predicted by reported studies of four-year institutions in which high grade
point averages have been associated with persistence. The number of absences was not found to
be an important indicator for student- who did well academically but was an important predictor of
withdrawal for other students (Bean, 1985; Pascarella et al., 1981). That this study found
traditional indictors of persistence to be associated with withdrawal again points out the problem of
community colleges in retaining students who perform well academically and who appear to be
committed to academic success. Community colleges will continue to work with large numbers of
new enrollees who view the college with a transitory and utilitarian perspective.
In conclusion, the Community College Retention Model is comprehensive with 22
measurement variables, not all significant or indicating reasonable influence. A reined, more
parsimonious model may be developed by examining the measurement variables and selecting for
each latent construct the two variables that account for the most variance.
3

35 B
Bibliography
Abel, W. H. (1966). Attrition and the student who is certain. Personnel and Guidance Journal44, 1042-1045.
ACE issues a minority report. (1989, January 16). Higher Education & National Affairs, pp. 1, 7.
Agresti, A. (1989). Tutorial on modeling ordered categorical response data. PsychologicalBulletin, 105 (2), 290-301.
Aiken, L R., Jr. (1964). The prediction of academic success and early attrition by means of amultiple-choice biographical inventory. American Educational Research Journal, 1, 127-135.
Altieri, G. (1990, Spring). A structural model for student outcomes: Assessment programs incommunity colleges. Community College Review, 17 (4),15-21.
Anderson, K. L. (1981). Post-high school experiences and college attrition. Sociology ofEducation 54, 1-15.
Anderson, K. L. (1988, July). The impact of colleges and the involvement of male and femalestudents. 12cLols_g) of Ey_c_lucation, 61, 160-177.
Ashby, J. D., Wall, & Osipow, S. H. (1966). Vocational certainty and indecision incollege freshmen. Personnel and Guidance Journal, 44, 1037-1041.
Astin, A. W. (1963). Differential college effects on the motivation of talented students to obtainthe ph. d. degree. Journal of Educational Psychology, 54, 63-71.
Astin, A. W. (1964). Personal and environmental factors associated with college dropouts amonghigh aptitude students. Journal of Educational Psychology, 55, 219-227.
Astin, A. W. (1975). Preventing students from dropping out. San Francisco: Jossey-Bass, Inc.
Astin, A. W. (1985). Ashigykg_i educational excellence. San Francisco: Jossey-Bass, Inc.
Astin, A. W. (1990, Fall). Can state mandated assessment work? Educational Record, 71, 34-41.
Astin, A. W., & Holland, J. L. (1961). The environmental assessment technique: A way tomeasure college environments. Journal of Educational Psychology, 52, 308-316.
Attinasi, L. C., Jr., Stahl, V. V., & Okun, M. 0. (1982). A preliminary typology of motivationalorientations of community college students. Comm_x_y_iit/Junior College tQuarei____11/of
Research and Practice, 6 (4), 371-390.
Babble, E. R. (1973). Survey research methods. Belmont, CA: Wadsworth PublishingCompany, Inc.
Baldwin, B. (1989). Methods, plainly speaking: A primer in the use and interpretation ofstructural equation models. Measurement and Evaluation in Counseling mk..k.v.slo-22, 100-112.
3 "1

35C.
Baratz-Snowden, J. (1987). Good news, bad news. gltarg_l e, 19 (3), 50-54.
Bartholomew, D. J. (1983). Latent variable models for ordered categorical data. Journal ofEconometrics, 22, 229-243.
Bean, J. P. (1980). Dropouts and turnover: The synthesis and test of a causal model of studentattrition. Research in Hi her Education, 12, 155-187.
Bean, J. P. (1982). Student attrition, intentions, and confidence: Interaction effects in a pathmodel. Research in Hi her Education, 17, 291-320.
Bean, J. P. (1985). Interaction effects based on class level in an explanatory model of collegestudent dropout syndrome. American Educational Research Journal, 22, 35-64.
Bean, J. P., & Metzner, B. S. (1985). A conceptual model of nontraditional undergraduatestudent attrition. Review of Educational Research, 55 (4), 485-540.
Bean, J. P., & Metzner, B. S. (1987). The estimation of a conceptual model of nontraditionalundergraduate student attrition. Research in Higher Education, 27(1), 15-36.
Beck, M. C. (1980). Decreasing the risk of high risk students. Community and Junior CollegeJournal, 51, 4-6.
Bell, C. (1984, Fall). Grades as a predictor of ?ttrition. CommurjlifollegeL,eview 12 (2), 13-19.
Benjamin, E. (1990, July). The movement to assess students' learning will institutionalizemediocrity in colleges. The Chronicle of Higher Education, 17, B2-B3.
Bianchi, J. R., & Bean, A. G. (1980). The prediction of voluntary withdrawals from college: Anunsolved problem. Journal of Experimental Education, 49, 29-33.
Bollen, K. A. (1989). Structural equations with latent variables. New York: John Wiley & Sons.
Boosma, A. (1982). The robustness of LISREL against small sample sizes in factor analysismodels. In J. G. Joreskog & H. Wold (Eds.), S7stem Under Indirect Observations:Causality, Structure, Prediction. Amsterdam: North Holland.
Boyer, C. M., Ewell, P. T., Finney, J. E., & Mingle, J. R. (1987). Assessment and outcomesmeasurement: A view from the states. AAHE Bulletir, 39 (7), 8-12.
Braxton, J. M., & Brier, E. M. (1989). Melding organizational and interactional theories ofstudent attrition: A path analytic study. Review of Higher Education, 13, 47-61.
Brigman, S. L., Kul!. G. D., & Stager, S. F. (1982). Those who choose to leave: Whystudents v,)luntarily withdraw from college. Journal of the National Association for WomenDeans Administrators, and Counselors, 45, 3-8.
Brown, D. R. (1962). Personality, college environment, and academic productivity. In N.Sanford (Ed.), The american college (pp. 536-562). New York: John Wiley & Sons, Inc.
3 S

36
Byrne, B. M. (1989). tu2 'ruff of LIS1;. 1 E_._3aMcahcMk._p__ggisand ro rammin forconfirmatory factor analytic models. New York: Springer-Verlag.
Cabrera, A. F., Castaneda, M. B., Nora, A., & Hengstler, D. (1990, November). Timconvergeue between two theories of college persistence. Paper presented at the annualmeeting of the Association for the Study of Higher Education, Portland, OR.
Carmines, G. C., & McIver, J. P. (1981). Analyzing models with unobserved variables. In G.W. Bohrnstedt & E. F. Borgatta (Eds.), Social measurement: Current issues (pp. 65-110).Beverly Hills, CA: Sage.
Caris.11, J. (1988, January). Freshman retention and attrition factors at a predominantly blackurban community college. Journal of Colle e Student Develo ment, 29, 52-59.
Centra, J. A., & Rock, D. (1971). College environments and student academic achievement.American Educational Research Journal, 8, 623-634.
Chapman, D. W., & Pascarella, E. T. (1983). Predictors of academic and social integration ofcollege students. Research in Higher Education, 19, 295-322.
Chickering, A. W. (1974). Commuting versus resident students. San Francisco: Jossey-Bass,
Churchill, W. D., & lwai, S. I. (1981). College attrition, student use of campus facilities, and aconsideration of self-reported personal problems. Research in Hi her Education, 14, 353-365.
The College Board, (1985). Egitalit at_y_ jciexcellence: The educational status of black americans.New York: Author.
Cope, R., & Hannah, W. (1975). itevs:_inmdkgs_sioors. New York: John Wiley & Sons.
Costa, A. E. (1984). Selected correlates of achievement and persistence of adult communitycollege students. Dissertation Abstracts International, 44, 2989A (University MicrofilmsNo. 84-01,974).
Davis, J. A. (1966). The campus as a frog pond: An application of the theory of relativedeprivation to career decision of college men. American Journal of Sociology, 72, 17-31.
de los Santos, A. G., & Wright, I. (1990, June/July). Maricopa's swirling students: Earningone-third of arizona state's bachelor's degrees. Community. Technical, and Junior CollegeJournal 60, 32-34.
Demos, G. D. (1968). Analysis of college dropoutssome manifest and covert reasons.Personnel and Guidance Journal, 46, 681-684.
DeVecchio, R. C. (1972). Characteristics of nonreturning community college freshman. Journalof College Student Personnel, 13, 429-432.
Doherty, A., & Patton, G. W. (Fall, 1991). Criterion three and the aKessment of studentacademic achievement. NCA Quarterly, 66 (2), 406-414.

37
Drew, C. P. (1989). We can no longer love 'em and leave 'em: A paper on freshman retention.Community College Review, 17 (4), 54-60.
Durio, H. F., & Kildow, C. A. (1980). The nonretention of capable women engineering students.Research in Hioher Education, 13, 61-71.
Durkheim, E. (1951). `Likicic_k_Aslitly.1 sociolo . (J. Spauloing & G. Simpson, Trans.).Glencoe, IL: The Free Press.
Eckland, B. K. (1964). A source of error in college attrition studies. Sociology of Education, 38,60-72.
EI-Khawas, E. (1989, July). Campus trends, 19469. (Higher Education Panel Reports No. 78).Washington, DC: American Council on Education.
El-Khawas, E. (1990, July). Campus trends, 1990. (Higher Education Panel Reports No. 80).Washington, DC: American Council on Education.
Endo, J. J., & Harpel, R. L. (1982). The effect of student-faculty interaction on students'educational outcomes. Research in Flizher Education, 16, 115-138.
Enrollments have risen since 1980, despite dire forecasts. (1988, August 10). Chronicle ofNigher Education, pp. Al, A15-A16.
Ethington, C. A. (1987, Winter). The robustness of LISREL estimates in structural equationmodels with categorical variables. Journal of Experimental Education, 55, 80-88.
Ewell, P. T., & Boyer, C. M. (1988). Acting out state-mandated assessment. Chanoe, 20 (4),41-47.
Feldman, K. A., & Newcomb, T. M. (1973). The impact of coflege on students: Yojusnes I &San Francisco: Jossey-Bass, Inc.
Fienberg, S. E., & Meyer, M. M. (1983). Loglinear models and categotical data analysis withpsychometric and econometric applications. Journal of___clicnetrics, 22, 191-214.
Fox, R. N. (1986). Application of a conceptual model of college withdrawal to disadvantagedstudents. American Educational Research Journal, 23 (3), 415-424.
Gallini, J. K., & Mandeville, G. K. (1984, Fall). An investigation of the effect of sample size andspecification error on the fit of structural equation models. Journal of ExperimentalEducation, 53, 9-19.
Garcia, M. (1987). Cornmut_la_c_c_Altgedent persistence: A field application of the tintomodel. (Doctor of Education Project Report, No. 186). New York: Columbia University,Teacher's College.
Gates, A. G., & Creamer, D. C. (1984). Two-year college attrition: Do student or institutionalcharacteristics contribute the most? Community and Junior College Quarterly, 8, 39-51.
4

38
Gekoski, N., & Schwartz, S. (1961). Student mortality and related factors. Journal ofEducational Research, 54, 192-194.
Gosman, E. J., Dandridge, B. A., Nettles, M. T., & Thoeny, A. R. (1983). Predicting studentprogression: The influence of race and other student and institutional characteristics oncollege student performance. Research in1-Ier Education, 18, 209-236.
Gurin, G., Newcomb, T. M., & Cope, R. B. (1968). çracteristics of entering freAmen relatedto attrition_in thEhlgragsdkggiat Liar e state university. (Office of Education, U. S.Department of Health, Education, and Welfare, Project No. 1938). Ann Arbor, MI: SurveyResearch Center, Institute for Social Research, University of Michigan.
Hackman, J. R., & Dysinger, W. S. (1970). Research notes: Commitment to college as a factorin student attrition. Sociology of Eddcation, 43, 311-324.
Halpin, R. L. (1990). An application of the tinto model to the analysis of freshman persistence ina community college. CommunkSolcgclZeview, 17 (4), 22-31.
Heilbrun, A. B., Jr. (1965). Personality factors in ccllege dropout. Journal of AppliedPsychology, 49, 1-7.
Hodgkinson, H. L. (1983). Guess who's coming to colic e: Your students in 1990.Washington, DC: National Institute of Independent Colleges and Universities.
Hodgkinson, H. L. (1984). Demographics of education. kindergarten throughgraduate school. Washington, DC: Institute for Educational Leadership, Inc.
Hodgkiason, H. L. (1990, November/December). Hard numbers, tough choices. The Journal ofthe Associatioracin Boards of Universities ancepor,ts 32 (6), 12-17.
Hutchings, P. (1987, December). 7 questions...in search of answers. AAHE Bulletin, 40 (4),12-14.
Hutchings, P., & Marchese,T. (1990, September/October). Watching assessment: Questions,stories, and prospects. clharg_i e, 22 (5), 12-38.
Hutchings, P., & Reuben, E. (1988). Faculty voices on assessment. Chanoe, 20 (4), 48-55.
Hutchison, J. E., & Johnson, A. E., Jr. (1980). Identifying persisters, voluntary withdrawersand academic dropouts at a liberal arts college. NASPA Journal, 18, 41-45.
Iffert, R. E. (1957). Retention and withdrawal of collcge students (U. S. Department of Heath,Education, and Welfare, 1958 Bulletin, No. 1). Washington, DC: U.S. GovernmentPrinting Office.
Irby, A. J. (1979). Statewide assessment c: basic skills. Current Issues in Hi her Education, 5,11-16.
lwai, S. I., & Churchill, W. D. (1982). College attrition and the financial support systems ofstudents. Research in Higher Education, 17, 105-113.
41

39
Ja-i2hik, S. (1987, June 24). More uniform measures of student learning and higher standardsurged for 2-year colleges. The Chronicle of Higher Education, pp. 18-19.
Johnson, M. L., & Walberg, H. J. (1988). Factors influencing grade point averages at acommunity college. Community College Review, 16 (4), 50-59.
Jones, S. W. (1986, Fall). No magic required: Reducing freshman attrition at the communitycollege. Community College Review, 14 (2), 15-18.
Joreskog, K. G., & Sörbom, D. (1988). LISRE : A guide to the prsgram and applications.Chicago: SPSS Inc.
Kangas, J. A. (1989, March 3). Student access vs student success. San Jose: SanJose/Evergreen Community College District.
Knoell, D. M. (1960). Institutional research on orientation and withdrawal. In H. T. Sprague(Ed.), Research on college students (pp. 41-65). Boulder, CO: WICHE & Berkeley, CA:Center for Higher Education.
Knoell, D. M. (1976). Through the open door: A study of patterns of enrollment andperformance in california's com urr Sacramento: California StatePostsecondary Education Commission. (ERIC Document Service No. ED 119 752)
Kohen, A. I., Nestel, G., & Karmas, C. (1978). Factors affecting individual persistence rates inundergraduate college programs. American Educational Research Journal, 15, 233-252.
Koretz, D. (1989, January). The new national assessment: What it can and cannot do. NationalEducation Association, 32-37.
Lea, H. D., Sedlacek, W. E., & Stewart, S. S. (1979). Problems in retention research in highereduction. NASPA Journal, 17 2-8.
Lenn, M. P. (1989, Spring). Influence on institutional values: Accreditation and planning in theassessment movement. Educational Record, 70 (2), 48-49.
Little, J. K. (1959). The persistence of academically talented youth in university studies.Educational Record, 40, 237-241.
Long, J. S. (1983a). Confirmatory factor analysis. Sage University Paper Series on QuantitativeApplications in the Social Sciences, Series No. 07-033. Beverly Hills, CA: Sage.
Long, J. S. (1983b). Covariance structure models: An introduction to LISREL. Sage UniversityPaper Scries on Quantitative Applications in the Social Sciences, Series No. 07-034.Beverly Hills, CA: Sage.
Magidson, J. (1982, November). Some common pitfalls in causal analysis of categorical data.Journal of Marketing Research 19, 461-471.
Marchese, T. (1987, December). Third down, ten years to go. AAHE Bulletin, 40 (4), 3-8.
4 2

40
Maricopa Community Colleges. (1984, May). Report and recommendations of the commission onstudent assessment and initial course placemea. Phoenix, AZ: Author.
Marsh, H. W. (1988). Causal effects on academic self-concept on academic achievement: Areanalysis of newman (1984). Journal of Ex erimental Education, 56, 100-103.
Marsh, H. W. (1990). Cati.al ordering of academic self-concept and academic achievement: Amultiwave, longitudinal pane* analysis. Journal of Educational Psychology, 82, 646-656.
McConnell, T. R. & Heist, P. (1962). The diverse college student population. In N. Sanford(Ed.), The american colle e (pp. 225-252). New York: John Wiley & Sons.
McCool, A. C. (1984). Factors affecting hispanic student retention with the community college.Community anclhlior Cone e Ouartey, 8, 19-37.
Metzner, B. S. (1989, Fall). Perceived quality of academic advising: The effect on freshmanattrition. American Educational Research Journal, 26 (3), 422-442.
Morante, E. A. (1989, September). Beyond testing: Toward affective assessment ractices.Paper presented at the meeting of the Learning Assessment Retention Consortium, SanDiego, CA.
Murray, H. A. (1938). ExplorafiorI personality. New York: Oxford University Press.
Muskat, H. (!979). Educational expectations and college attrition. NASPA Journal, 17 17-22.
Mutha, B. 0. (1983). Latent variable structural equation modeling with categorical data. Journalof Econometrics, 22, 45-65.
Muthén, B. 0. (1984). A general strnctural equation model with dichotomous, orderedcategorical, and continuous Vitent variable indicators. Psychometrika, 49, 115-132.
Muthén, B. 0. (1988). LISCOMP: Analysis of linear structural equations with a com rehensivemeasurement model. Mooresville, IN: Scientific Software.
Nelson, R. B., Scott, T. B., & Bryan, W. B. (1984). Pre-college characteristics and early collegecxperiences as predictors of freshman year persistence. Journal of College.StudentPersonnel, 25 (1), 50-54.
Nettles, M. T. (1987). The emergence o colle eot1_.._g_iWw._.&1zwslip_Imnts:Pros ects 'or enhancingstate colleges and universities (Draft Paper 87-1). Princeton, NJ: Educational TestingService.
Newcomb, T. M. (1962). Student peer-group influence. In N. Sanford (Ed.), The americancollege (pp. 469-488). New York: John Wiley & Sons, Inc.
Nora, A. (1990, May/June). Campus-based aid programs as determinants of retention amonghispanic community college students. Journal of Higher Education, 61 (3), 312-331.
Nora, A., & Rendon, L. (1990). Determinates of predisposition to transfer among communitycollege students: A structural model. Research Higher Education, 31, 235-255.
4 3

41
Norusis, NI. J. (1988). SPSS-X introductory.. Chicago: SPSS Inc.
Okun, M. A., Ruehlman, L., & Karoly, P. (1990). Predicting institutional turnover from springto fall semester arnon art-time communit colle e students intending to ay (Final Reportto the Maricopa Community Colleges, No. C 08445). Tempe, AZ: Arizona StateUniversity, Psychology Department.
Ottinger, C. (1990, September 24). Majority of colleges conduct student assessments. HigherEducation and National Affairs, ACE, 3.
Pace, C. R. k1976). Standardized instruments for institutional assessment. In Marvin W.Peterson (Ed.), New Directions for Institutional Research No. 12 (pp. 1-15). SanFrancisco: Jossey-Bass, Inc.
Pace, C. R. (1981, April). Wasurins the quality of undergraduate education. Paper presented atthe annual meeting of the American Educational Research Association, Los Angeles, CA.(ERIC Document Reproduction Service No. ED 206 228)
Pace, C. R. (1982, May). AcvemerIt and tlw quality of student effort. Paper presented at themeeting of the National Commission on Excellence in Education, Washington, D. C. (ERICDocument Reproduction Service No. ED 227 101)
Pace, C. R. (1984a). Historical perspectives on student outcomes: Assessment with implicationsfor the future. NASPA Journal, 22, 10-18.
Pace, C. R. (1984b). Measuring the Quality of college student experiences. An account of thedevelo ment and use of the colle e student experiences questionnaire. Chicago, IL: SpencerFoundation. (ERIC Document Reproduction Service No. ED 255 099).
Pace, C. R., & Stern, G. G. (1958). An approach to the measurement of psychologicalcharacteristics of college environments. Journal of Educational Psychology, 49, 269-234.
Panos, R. J., & Astin, A. W. (1968). Attrition among college students. American EducationalResearch Journal, 5, 57-72.
Pantages, T. J., & Creedon, C. F. (1978). Studies of college attrition: 1950-1975. Review ofEducational Reserch, 48, 49-101.
Pascarella, E. T. (1980). Student-faculty informal contact and college outcomes. Review ofEducational Research, 50, 545-595.
Pascarella, E. T., & Chapman, D. W. (1983a). A multi-institutional, path analytic validation oftinto's model of college withdrawal. American Educational Research Journal, 20, 87-102.
Pascarella, E. T., & Chapman, D. W. (1983b). Validation of a theoretical model ofcollegewithdrawal: Interaction effects in a multi-institutional sample. Research in HigherEducation, 19, 25-48.
Pascarella, E. T., Duby, P. B., & Iverson, B. K. (1983, April). A test and reconceptualization ofa theoretical model of college withdrawal in a commuter institution setting. sps.pAs2gysi.Education, 56, 88-100.
4 4

42
Pascarella, E. T., Duby, P. B., Miller, V. A., Rasher, S. P. (1981). Preenrollment variables andacademic performance as predictors of freshman year persistence, early withdrawal, andstopout behavior in an urban, nonresidential university. Research in Higher Education, 15,329-349.
Pascarella, E. T., Smart, J. C., & Ethington, C. A. (1986). Long-term persistence of two-yearcollege students. Research in 1-U,L_IerEducation, N (1), 47-71.
Pascarella, E. T., & Terenzini, P. T. (1976). Informal interaction with faculty and freshmanratings of academic and non-academic experiences of college. Journal of EducationalResearch, 70, 35-40.
Pascarella, E. T., & Terenzini, P. T. (1977). Patterns of student-faculty informal interactionbeyond the classroom and voluntary freshman attrition. Journal of Higher Education, 48,540-552.
Pascarella, E. T., & Terenzini, P. T. (1978). Student-faculty informal relationships and freshmanyear educational outcomes. Journal of Educational Research, 71, 183-189.
Pascarella, E. T., & Terenzini, P. T. (1979). Interaction effects in spady's and tinto's conceptualmodels of college dropout. Sociology of Education, 52, 197-210.
Pascarella, E. T., & Terenzini, P. T. (1980a). Predicting freshman persistence and voluntarydropout decision from a theoretical model. Journal of Higher Education, 51, 60-75.
Pascarella. E. T., & Terenzini, P. T. (1980b). Student-faculty and student-peer relationships asmediators of the structural effects of undergraduate residence agreement. Journal ofEducational Research, 73, 344-353.
Pascarella, E. T., & Terenzini, P. T. (1983a). Predicting voluntary freshman yearpersistence/withdrawal behavior in a residential university: A path analytic validation oftinto's model. Journal of Educational Psychology. 75, 215-226.
Pascarelia, E. T., & Terenzini, P. T. (1983b). A test and reconceptualization of a theoreticalmodel of college withdrawal in a commuter institution setting. Sociology of Education, 56,88-1(X).
Pascarella, E. T., & Terenzini, P. T. (1991). How colle e affects students. Jossey-Bass: SanFrancisco.
Pascarella, E. T., Terenzini, P. T., & Hibel, J. (1978). Student-faculty interactional settings andtheir relationship to predicted academic performance. Journal of Higher Education, 49, 45°-463.
Pedhazur, E. J. (1982). Multiple regression in behavioral research: Ex lanation and rediction.New York: Holt, Rinehart, & Winston.
Peng, S. S., & Fetters, W. B. (1978). Variables involved in withdrawal during the first two yearsof college: Preliminary findings from the national longitudinal study of the high school classof 1972. American Educational Research Journal, 15, 361-372.

43
Pervin, L. A., & Rubin, D. B. (1967). Student dissatisfaction with college and the collegedropout: A transactional approach. Journal of Social Psychology, 72, 285-295.
Pfeifer, C. M., Jr. (1976). Relationship between scholastic, aptitude, perception of universityclimate and college success for black and white students. JourrPsycholo y,61, 341-347.
Pipho, C. (1990, October). Budgets, politics, and testing. Phi Delta Kappan, 72 (2), 102-103.
Reisman, D., & Jencks, C. (1962). The viability of the American college. In N. Sanford (Ed.),The american college (pp. 74-192). New York: John Wiley & Sons, Inc.
Richardson, R. C., Jr., & Bender, L. W. (1987). Fosterirg minorld achievement inhigher education. San Francisco: Jossey-Bass, Inc.
Rock, D. A., Centra, J. A., & Linn, R. L. (1970). Relationships between college characteristicsand student achievement. American Educational Research Journa 7, 109-121.
Rootman, I. (1972). Voluntary withdrawal from a total adult socializing organization: A model.Sociology of Education, 45, 258-270.
Ross, D. B., Cosner, S., & Freitag, W. (1987). Students who drop out before they begin: Astudy of potential community college students who initiate the registration process but fail toenroll. Community/Junior College Quarterly, 11, 93-101.
Sanford, N. (1962). The american college. New York: John Wiley & Sons, Inc.
Sewell, W. H., & Shah, V. P. (1968). Parents' education and children's educational aspirationsand achievements. American SociologkO Review, 33, 191-209.
Sexton, V. S. (1965). Factors contributing to attrition in college populations: Twenty-five yearsof research. Journal of General Psychology, 72, 301-326.
Simpson, C., Baker, K., & Mellinger, G. (1980). Conventional failures and unconventionaldropouts: Comparing different types of university withdrawals. Sociology of Education,53, 203-214.
Skinner, F. F., & Carter, S. (1987). Remedial education study. Tempe, AZ: National Center forPostsecondary Governance and Finance, Research Center at Arizona State University.
Slater, M. (1957). Perception: A context for the consideration of persistence and attrition amongcollege men. Personnel and Guidance Journal, 35, 435-440.
Smart J. C., & Pascarella, E. T. (1987, May/June). Influences on the intention to reenter highereducation. Journal of Higher Education, 58 (3), 306-321.
Smith, A. W., & Allen, W. R. (1984). Modeling black student academic peiformance in highereducation. Research in Higher Education, 21, 210-225.
f;

44
Smith, B. M. (1989). The personal develcoment of the commuter student: What is known fromcomparisons with resident students? An ERIC review. Community CollegeReykw, 17 (1),47-56.
Spady, W. G. (1970). Dropouts from higher education: An interdisciplinary review andsynthesis. Interchange, 1, 64-85.
Spady, W. G. (1971). Dropouts from higher education: Toward an empirical model.Interchange, 2, 38-62.
Spector, P. E. (1981). Research designs. Sage University Paper Series on QuantitativeApplications in the Social Sciences, Series No. 07-023. Beverly Hills, CA: Sage.
SPSS usR_ EL7a(n_.as:liwi.ls_aid- and reference. (1990). Chicago: SPSS Inc.
Stage, F. K. (1986). University persistece: Motivalional orientation wi hin the tintp tnodel.Unpublished doctoral dissertation. Arizona State University, Tempe.
Stage, F. K. (1989). An alternative to path analysis: A demonstration of LISREL using students'commitment to an institution. Journal of College Student Development, 30, 129-135.
Stahl, F. E. (Ed.). (1986). Challet_agthalienmunit cone e. Washington, DC:AACJC.
Starr, A., Betz, E. L., & Menne, J. (1972). Differences in college student satisfaction, academicdropouts, nonacademic dropouts, and nondropouts. Jo_urrial of Counseling Ps cholo 19,
318-322.
Stern, G. G. (1962). Environments for learning. In N. Sanford (Ed.), The american college (pp.690-730). New York: John Wiley & Sons, Inc.
Stern, G. G. (1971). Self-actualizing environments for students. School Revin3_,/ 80, 1-25.
Stoecker, J., Pascarella, E., & Wolfle, L. (1988). Persistence in highereducation: A 9-year testof a theoretical =del. Journal of College Student Development 29, 196-209.
Summerskill, J. (1962). Dropouts from college. In N. Sanford (Ed.), The american colleu (pp.627-657). New York: John Wiley & Sons, Inc.
Terenzini, P. T., & Pascarella, E. T. (1977). Voluntary freshman attrition and patterns of socialand academic integration in a university: A test of a conceptual model. ResearA in HigherEducation 6, 25-43.
Terenzini, P. T., & Pascarella, E. T. (1971). The relation of students' .r.vecollege characteristicsand freshman year experience to voluntary attrition. Research in Higher Education, 9, 347-366.
Terenzini, P. T., & Pascarella, E. T. (1980). Toward a validation of tinto's model of collegestudent attrition: A review of recent studies. Resear h in Higher Educatim, 12, 271-282.
17

45
Thistlewaite, D. L. (1959). College press and student achievement. Journal of EducationallAyslig,Ao y, 50 (5), 183-191.
Thistlewaite, D. L. (1960). College press and changes in study plans of talented students.Journal of Educational Psychology 51. (4), 222-234.
Tinto, V. (1975). Dropout from higher education: A theoretical synthesis of recent research.Review of Educational Research, 45, 89-125.
Tinto, V. (1982). Limits of theory and practice in student attrition. Jsirna1fJ1igher Eduation,53 687-700.
Tinto, V. (1987). Leaving college. Chicago: University of Chicago Press.
Tinto, V. (1988). Stages of student departure: Reflections on the longitudinal character of studentleaving. JournM of Higher Eclucation, 59 (4), 438-455.
Tracey, J., & Sedlacek, W. E. (1987), A comparison of white and black student academic successusing noncognitive variables: A LISREL analysis. Research in Higher Education, 27 (4),333-348.
Trow, M. (1960). The campus viewed as culture. In H. T. Sprague (Ed.), Research on collegestudents (pp. 105-123). Boulder, CC. WICHE & Berkeley, CA: Center for HigherEducation.
Van Gennep, A. (1960). The rites of passage. (M. Vizedon & G. Coffee, Trans.). Chicago:University of Chicago Press.
Vaughan, R. P. (1968). College dropouts: Dismissed vs. withdrew. Personnel and GuidanceJournal, 46, 685-689.
Voorhees, R. A. (1986). Toward building models of community college persistence: A log-linearanalysis. Paper presented at the Association for Institutional Research Annual Fbrum,Orlando, FL.
\borhees, R. A. (1987). Toward building models of community college persistence: A logicanalysis. Research in Higher alucation 26, 115-129.
Wattenberger, J. L., & McLeod, N. (1988). Placement in the mathematics curriculum: What arethe keys? Community College Review, 16 (4), 17-21.
Webb, M. (1988). A theoretical model of community college student degree persistence.CorAnnt 16 (4), 42-49.
Weber, J. (1985-86). Assessment and placement: A rewiew of the research. CornalunReview, 13 (3), 21-32.
Wheaton, B., Muthen, B.O., Alwin, D. F., & Summers, G. F. (1977). Assessing reliability andstability in Fanel models. In D. R. Heise (Ed.), Sociological methodology (pp. 84-136).San Francisco: Jossey-Bass, Inc.
1 Li

46
Williamson, D. R., & Creamer, D. G. (1988). Student attrition in 2- and 4-year colleges:Application of a theoretical model. Journal of College Student Development, 29, 210-217.
Wolfgang, M., & Dowling, W. (1981). Differences in motivation of adult and youngerundergraduates. Journal of Hi her Education, 52, 640-648.
Zaccaria, L., & Creaser, J. (1971). Factors related to persistence in an urban commuteruniversity. Joi&rit Persomiel, 12, 286-291.
4 iERIC Clearinghouse forJunior Col leges
!UN 1 2 1992


![[Dag Sorbom] LISREL 8 Structural Equation Modelin(BookFi.org)](https://img.pdfslide.us/doc/110x75/55cf947f550346f57ba26a7d/dag-sorbom-lisrel-8-structural-equation-modelinbookfiorg.jpg)