Embed Size (px)
Citation preview

DOCUMENT RESUME
ED 341 582 SE 052 712
AUTHOR McClure, John R.; Bell, Paul E.
TITLE Effects of an Environmental Education-Related STSApproach Instruction on Cognitive Structures ofPreservice Science Teachers.
INSTITUTION Pennsylvania State Univ., University Park. Coll. ofEducation.
PUB DATE 90
NOTE 24p.
PUB TYPE Reports - Research/Technical (143)
EDRS PRICE MF01/PC01 Plus Postage.
DESCRIPTORS *Cognitive Development; *Cognitive Structures;Environmental Education; Higher Education; MethodsCourses; *Preservice Teacher Education; *Science andSociety; Science Education; Secondary Education
IDENTIFIERS *Concept Maps; Science Achievement
ABSTRACTConcept maps provided a measure of subjects'
cognitive structures before and after completion of an environmentaleducation course. Concept maps were constructed from expressionstaken from the issue "global climate." Expressions were assigned toone of three domains: science, technology or society. Maps wereanalyzed by constituent propositions, which were categorized byvarious characteristics including the domains of the expressionsconnected, the relationship expressed and the strength, determined bya protocol developed for this study. Significant differences werefound in the frequencies of occurrence for various propositioncharacteristics and these were correlated with previous academicexperiences. Some proposition characteristics were also correlatedwith the results of a final examination. Comparison of concept mapsprepared before and after an environmental education course showedsome changes in proposition characteristics. A brief description ofthe course, the expressions used in the concept mapping activity, adescription of "networking" symbols and a sample map, the protocolused to evaluate the concept maps, and the resu:Lts of the statisticalanalysis are appended. (Author/KR)
***********************************************************************
Reproductions supplied by EDRS are the best that can be madefrom the original document.
***********************************************************************

"PERMISSION TO REPRODUCE THISMATERIAL HAS BEEN GRANTED BY
John R. McClure
TO THE EDUCATIONAL RESOURCESINFORMATION CENTER (ERIC)."
Effects of an Environmental Education-Related
STS Approach Instruction on Cognitive Structures
of Preservice Science Teachers'
John R. McClureand
Paul E. Bell, Director, Center for Education in STSThe Pennsylvania State University
Abstract
U.S. DEPARTMENT OF EDUCATIONUna e olE ducahonst Research and ImprovOment
EDUCATIONAL Fit SOURCES INFORMATIONCENTER IERICI
This document has been reproduced aSreceived horn Ihe person or organizationofiyinating
r !Amor changes have been made to improvereproduction Quality
Poinlsolviewor opinions Staled in this document do no! notesSarily represent officialOE RI position or policy
Concept maps provided a measure of subjects' cognitive structures before and aftercompletion of an environmental education course. Concept maps were constructedfrom expre,isions taken from the issue "global climate." Expressions were assignedto one of three domains: science, technology or society. Maps were analyzed byconstituent propositions, which were categorized by various characteristicsincluding the domains of the expressions connected, the relationship expressed andthe strength, determined by a protocol developed for this study.
Significant differences were found in the frequencies of occurrence for variousproposition characteristics and these were correlated with previous academicexperiences. Some proposition characteristics were also correlated with the resultsof a final examinations. Comparison of concept maps prepared before and after anenvironmental education course showed some changes in propositioncharacteristics.
Introduction. Martin (1985) identified four categories under which various goals of scienceeducation might fall. These categories are goals relating to: 1) the the acquisition ofknowledge, 2) the acquisitions of skills, 3) the building of understanding and 4) thedevelopment of propensities to behave in certain ways. STS curricula offer a uniqueopportunity for development in all four categories. STS education can be a vehicle forwidening the areas in which students perceive science information to be relevant.Associations between science concepts and other aspects of the students lives may result inreinforcement of the science concepts and allow more opportunities for transfer of theseconcepts to problems outside the classroom. A hieghtening of perceived relevance ofscience concepts may generate more interest in science courses and careers and a morepositive and realistic attitudes towards science. In spite of the potential cognitive benefits,the preponderance of investigation of STS curricula has focused on Martin's fourth goalonly (Waks and Prakash, 1985, Yager et al., 1988 and Rubba and Wiesenmayer, 1985).Mitchener and Anderson (1989) cited content and evaluation as concerns which causedscience teachers to question the acceptance of STS curriculum. If STS is to be accepted,work must be done to develop techniques for evaluating and exploiting the potential of STSr;urricula. This study was a is a beginning. .
The focus of this study was on the potential to affect two of Martin's four goals:goal 1, acquisition of knowledge and goal 3, building understanding. Concept mappingprovided the primary source of data for this study, and a method of evaluating conceptmaps is introduced. The study examined the effects of the "four goal" STS approach(Rubba and Wiesenmayer, 1985 and Bell and Wiesenmayer, 1990) on students cognitive
BEST COPY AVAILABLE
2

2
structures related to the environmental education issue, "global climate," the relationshipsof those structures to course credit hours accumulated in science, mathematics and socialscience courses and the relationship of those structures to subject performance on a finalexamination.
Research Questions. The main question of this study was, "how does STS instructionaffect cognitive structure?" The primary method of measuring cognitive structures wasconcept mapping. The utilization of concept maps as a measure allowed the respondentsome of the flexibility of an essay examination; however, with concept maps there is thepossibility of a quantitative analysis, more easily obtained than is po 'sible with an essayresponse (Surber, 1984). The use of concept maps resulted in a new question, "what is therelation between cognitive structure and concept maps?" To answer this question it wasnecessary to look at patterns within the concept maps, and to relate these patterns to othermore traditional measures, i.e. college course credits and examination scores.
Subjects, 16 college students enrolled in an environmental education course were thesubjects of this study; 8 female and 8 male. The subjects were working towards secondarycertification in one of three science areas: biology (12 subjects), earth and space science (3subjects) and physics (I subject).
Procedum, The cognitive structures of the subjects were measured at the beginning of anenvironmental education course in which they were enrolled. Cognitive structures weremeasured by analysis of concept maps produced in a concept mapping activity. Thesubjects then participated in discussions, projects and other class activities as part of thecourse. A brief description of rile course is found in Appendix A. On the last scheduledmeedng of the class the subjects completed a questionnaire soliciting information abouttheir previous academic experience, and produced a second concept map. The instructionsfor the concept mapping activities were identical for both occasions; however, the firstmaps were constructed as an out-of-class activity while the second maps were constructedduring class period. This difference did not seem to have an effect, as, on the secondmapping activity, all subjects completed their maps prior to the end of the class period.After completion of the course the subjects were evaluated by a final examination.
IngLumenta. The survey was a simple form which asked the subjects to report the numberof credit hours they had completed in one of three broad areas. The three areas weir: 1)science, 2) mathematics and 3) social science.
The final examination was constructed by the instructor of the course and covered awide range of environmental issues and concepts. The test consisted of 80 multiple choicequestions.
The concept mapping activity required subjects to construct a concept map using 36provided expressions and fohowing a mapping procedure called "networking" (Holley andDansereau, 1984). The expressions were selected from expressions occurring in conceptmaps constructed, as part of a previous study, on the topic "global climate" (McClure,1989, McClure 1990). The list of expressions appears in Appendix B. A description of"networking" symbols and a sample map appear in Appendix C. The same list ofexpressions was used in both mapping activities, and although "global climate" was one ofthe expressions listed, the subjects were not given this as a topic for their maps.
Analysis of the maps was accomplished by recording the frequencies andcharacteristics of the propositions composing individual concept maps. A propositionconsisted of two expressions connected by an arrow, labeled to indicate the nature of therelationship between the expressions. The expressions used were classified into threedomains: science, technology and society. Propositions were place into 1 of 6 categoriesdepending on the domains of the expressions connected. Thr. 6 categories are summarizedin Table 1 below.
3

3
Table 1,Proposition Categories and Descriptions
Category DescriptionScience Connecting two expressions from the science domain.
Technology Connecting two expressions from the technologydomain.
Society Connecting two expressions from the society domain.
Science/Technology Connecting two expressions one from the sciencedomain and one from the technolo domain.
Science/Society Connecting two expressions one from the sciencedomain and one from the society domain.
,
Technology/Society Connecting two expressions one from the technologydomain and one from the society domain.
A second characteristic of the propositions recorded was the relationship typeconnecting the expressions. As shown in Appendix C, there are 6 relationships allowed inthe networking scheme. The 6 can be grouped into three general types (Holley andDansereau, 1984). The 3 relationship types and their descriptions are summarized in Table2.
RelationshipTyie
Symbols Description
Hierarchy and "t" Relationships expressing asuperordinate/subordinato relationshipbetween two expressions.
Attributional "c", "e" and "a" Relationships describing one expressionas an attribute or amplifying descriptorof tho other exression.
Causal H I H Relationships which indicate that oneexpression influences or causes another,or occurs in a temporal ,ie qA,r
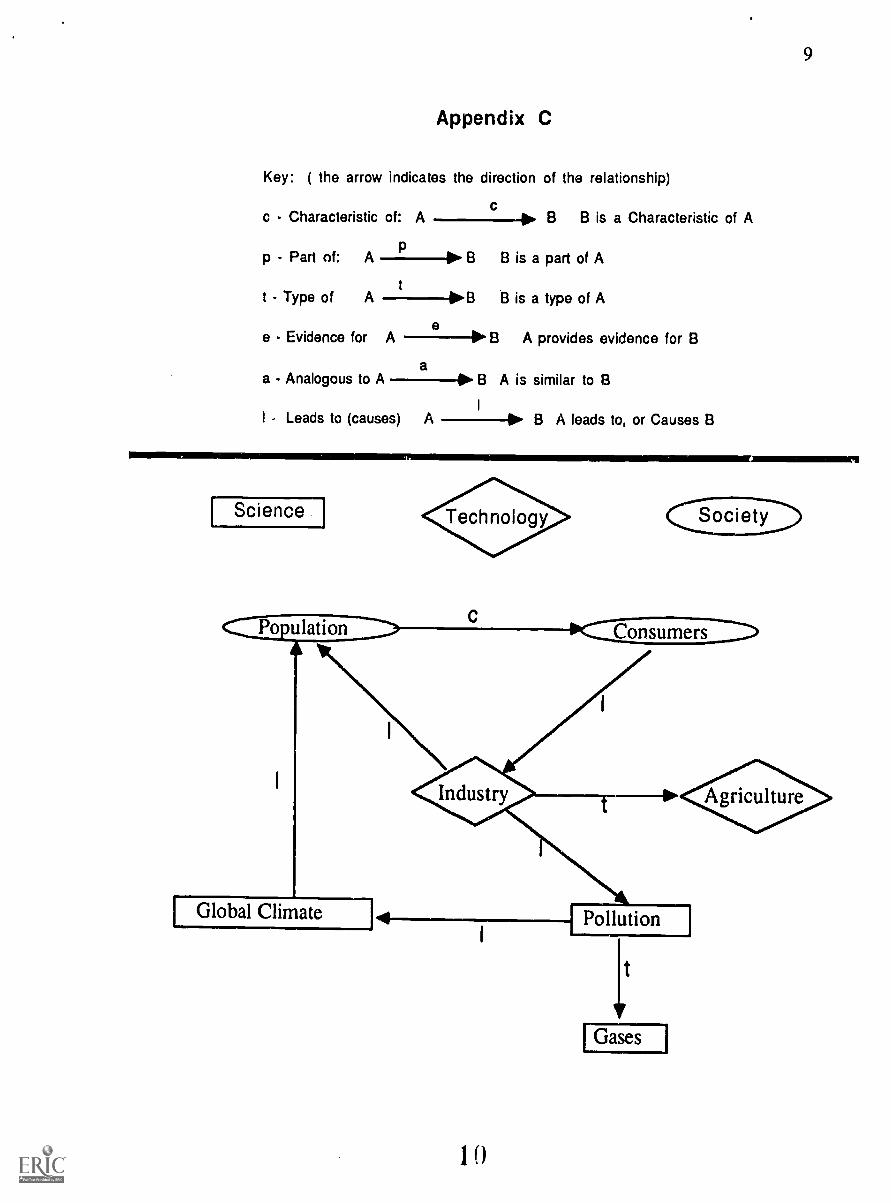
Finally the strength of each proposition was determined by the use of a protocol.The protocol is described in Appendix D and was developed for this study. Other scoringprotocols, such as that suggested by Novak and Gowin (1984), look at the overall qualityof the concept map. The protocol used in this study focuses on the quantification ofindividual propositions within the concept maps, allowing the analysis of substructureswithin the maps. The substructures in this case refers to propositions grouped by commoncharacteristics as described above.
Results. The data for the frequencies and average scores for the propositions of theconcept map are presented in the tables of Appendix E. Analysis of the concept maps
4

4
revealed several consistent patterns. As can be seen from these tables the science andsociety categories were the two which were most frequently constructed. These two typesof propositions occurred with approximately equal frequency, and occurred nearly twice asoften as any other type of proposition. Among proposition types connecting concepts fromdifferent concept domains, propositions connecting science concepts to technologyconcepts and technology concepts to society concepts occurred four times as frequently aspropositions connecting science to society concepts. ANOVA tables and pair-wisecomparisons between proposition categories are found in Appendix F.
There were also significant differences in the frequency with which subjectsidentified certain relationship types. Hierarchy types were identified most frequently,followed by causal types and attribution types were identified least frequently. Thedifference between hierarchy and attribution was significant for the first group of conceptmaps, while for the second group of concept maps the heirarchy relationship type wassegnific Indy higher then both other relatinship types. Appendix G provides the details ofthis analysis.
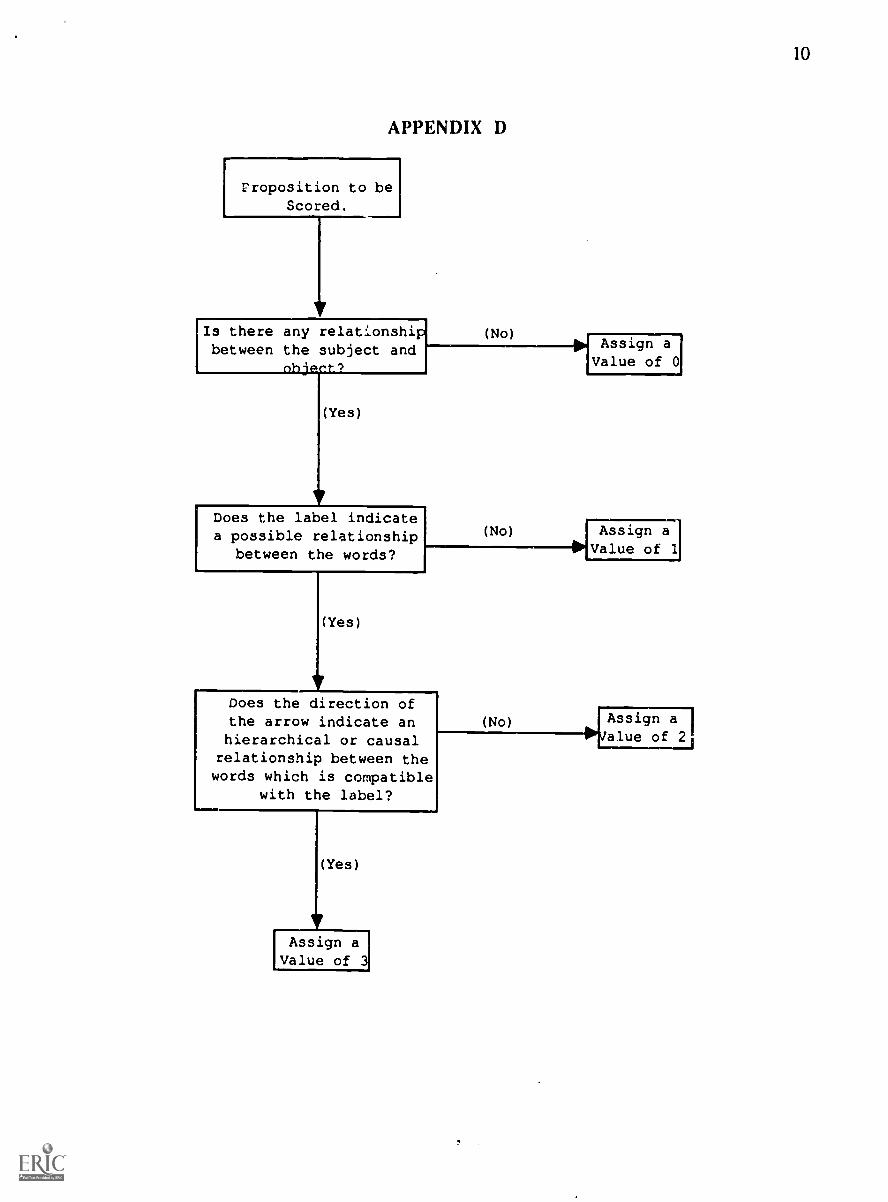
Significant interactions were found between relationship type and propositioncategory. Hierarchy type relationships were dominant in the science and technologyproposition types, while the frequency of 'relationships was more evenly distributed for thesociety propositions. Appendix H illustrates these interactions.
Because of the low numbers of propositions identified for some of the crossdomain proposition categories, these three categories were combined for the analysis of theaverage scores. Average scores for each proposition type were calculated for eachindividual concept map and the means of these averages were used in the analysis. For themaps constructed in the first mapping activity, there were no significant differences in theaverage scores of the different proposition categories. The ANOVA of the second group ofconcept maps, however did show some significant differences among the propositioncategories. Pair-wise comparison, by Fisher LSD, found differences between thetechnology and society categories and the cross domain proposition category. Appendix 1contains the ANOVA tables and the comparisons.
For relationship type, the highest average scores were found in propositionsexpressing causal relationships. Causal relationships from the first and second group werefound to have average scores significantly higher than for either hierarchy or attributiontype relationships. Appendix J contains the ANOVA table for this data.
Significant interactions occurred for average scores between the propositioncategories and the relationship types for concept maps from both groups. The variationbetween relationships with proposition seemed to occur mostly in the causal and attributionrelationship types, while propositions formed with hierarchy relationships seem to haveroughly the same average score. Appendix K shows the analysis of the interactions.
Correlations of concept map attributes to reported course credits resulted in severalinteresting results. A statistically significant correlation (r = .643) was found between thetotal.number of propositions of an individual's concept map and the number of sciencecredits reported by that individual. The correlation between science credits reported and thenumber of propositions connecting concepts from the technology domain was alsosignificant (r = .628), as was the correlations between reported science credits and theaverage score of propositions connecting concepts within the technology domain (r =.518).
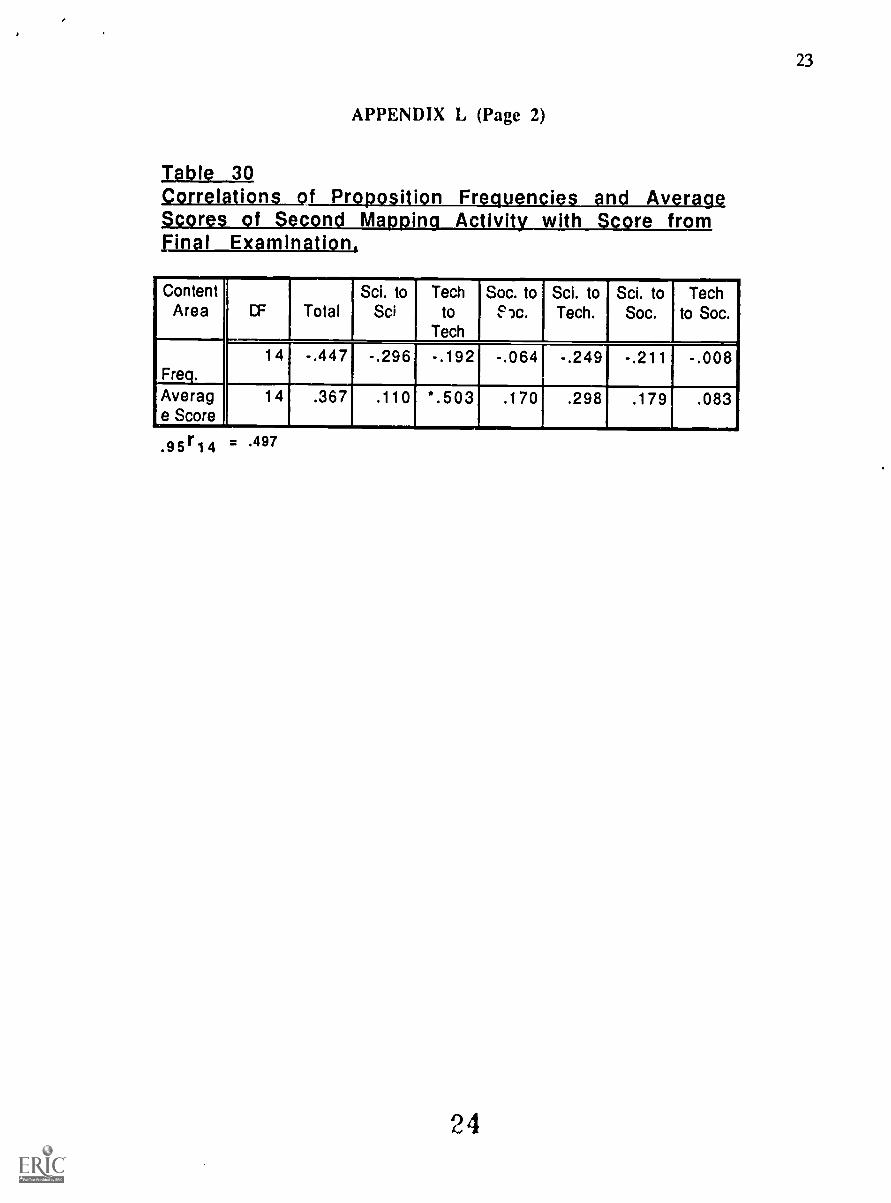
This same proposition type was correlated with the final examination score. Asignificant correlation was found between average score of propositions connectingconcepts within the technology domain and the final examinations score (r = .503). A tablesummarizing the correlation results is found in Appendix L.
ANOVA with proposition categories and relationship types indicated that nosignificant change occurred within the attributes either by frequency or by average scorefrom the first to the second mapping; however, a simple t-test of the total numbers ofpropositions constructed on the first and second mapping activities did show that there was

5
overall a significant increase. A similar analysis of the total average score of concept mapsfound no significant change from the first to the second mapping.
Discussion. The main purpose of this experiment was to evaluate changes in the cognitivestructure of subjects. Changes did occur although the design of the study does not allowthat these changes be definitely attributed to participation in the course. Increases werefound in the number of propositions identified from the first to the second mappingactivities.
The increase in the total number of propositions seemed to be limited to thosepropositions which connected concepts within the same domain, i.e. science-to-science andsociety-to-society. It was expected that the STS orientation of the course would result in anincrease in the propositions connecting concepts from different domains; this did not occur.It appears tnat the learning was limited to the addition of information to existing structures,and that no restructuring of information occurred. If this is the case, then it may beexpected that the richest domains would show the greatest increase, richer domains offeringmore ways to incorporate new information. The majority of the increase in propositions didoccur vithin those proposition types which connected concepts within the science andsociety domains, and were the most frequently occurring types in the first mapping activityreflecting the richness of the subjects' cognitive structures within these domains.
Correlations between concept map attributes and other measures lead to someinteresting speculations. The correlations between reported science credits and theattributes of propositions connecting concepts within the technology domain may indicatethat science was the source of the majority of these students' technological information.The correlation of the average score of propositions in this domain with the examinationscores is also a reflection of the course content.
The failure of science credits to correlate with the number of propositionsconnecting concepts from the science domain may be attributed to the nature of the sciencecourses completed by the subjects. The majority of subjects, 12 of 16, were in a biologyeducation program and it may be assumed that the science credits reported were generallyfrom this area. The expressions from the science domain, used in this study, would morelikely be found in earth science courses. Future studies must take a more detailed look atthe nature of credits reported by the students. Science as a type of previous academicexperience is too broad.
Some comments regarding the use of concept maps as a method of evaluatingcognitive structure can also be made. The mapping activity did seem to be somewhatsensitive to change in individuals cognitive structure. That the concept map analysis wassensitive to individual differences is supported by the correlations found between theconcept map attributes and previous academic experience and scores on the finalexamination.
There were several possible sources of noise in this study, which may have reducedthe sensitivity of the map analysis. The subjects' unfamiliarity with the concept mappingtechnique may have obscured the relationship between the cognitive structure of theindividual and the concept maps. Also, the content of the cou.se was very broad, and thechange in subjects' concepts of global climate may have been very small. Future studiesmust provide for thorough instruction in the concept mapping technique to be used, andfocus of the instruction and the mapping activities more closely matched.
The use of concept maps points out the complexity in the differences of cognitivestructures and the problems associated with assessing learning with any instrumentation.In the analysis of the maps it was apparent that the subjects had assumed meanings for theexpressions which had not been considered by the researchers. There is also somequestion of to what extent the cognitive structures indicated by the concept maps wereconstrained by the researchers choice of expressions, and what effect this constraint had onthe interaction of proposition attributes and changes from the first to the second mappings.
f;

6
The maps did provide a rich source of data, quantifiable in a variety of ways.Future studies will attempt to refine the use of maps, and to eliminate some of the noise ofthe system.
References
Holley, C. D. and Dansereau, D. F. (1984). The development of spatial learningstrategies. In C. D. Holly and D. F. Dansereau (Eds.), Spatial learning strategies:techniques, applications and related issues (pp. 3-19). New York: Academic PressInc.
Martin, M. (1985). Concepts of science education: a philosophical analysis. Lanham,MD: University Press of America Inc.
McClure, J.R. (1989). Analysis of two inservice workshops, Summer 1989.Unpublished report for the Center for Education in Science Technology and Society(CE-STS), The Pennsylvania State University.
McClure, J.R. (1990). Concept Map Analysis of Science Technology and Societyconceptualization by Environmental Education Students.. Masters of Science Thesis,The Pennsylvania State University.
Mitchener, C.P. and Anderson, R.D. (1989). Teachers' perspective: developing andimplementing an S/T/S curriculum. Journal of Research in Science Teaching, 26(4),321-369.
Novak, J.D. and Gowin, D.B. (1984). Learning How to Learn. New York, CambridgeUniversity Press.
Rubba, P. A. and Wiesenmayer, R. (1985). A goal structure for precollege STSeducation: a proposal based upon recent literature in environmental education.Bulletin of Science Technology and Society, 5, 573-580,
Surber, J. R. (1984). Mapping as a testing and diagnosis device. In C. D. Holly and D.F. Dansereau (Eds.), Spatial Learning Strategies: Techniques, Applications andRelated Issues. New York: Academic Press Inc.
Waks, L. J. and Prakash, M. S. (1985). STS education and its three step-sisters. TheBulletin of Science Technology and Society, 5(2), 105-116.
Yager, R. E. et al. (1988). Assessing impact of STS instruction in science in five domains:University of Iowa. (Eric Document Reproduction Service No, ED 292 641).
7

7
APPENDIX A
Nature and ScomoLvialS_Lisdaou-s nvir nm al Education Course
STS includes concerns that are derived from other educational movements,including the environmental education tradition. Some of those movements were alsoantecedents to or spin-offs from environmental education. Any environmental educationmethods course should review those traditions, preferably with meaningful activities.Students in the course will perform the following activities, representing other educationalthrusts:
TraditionsNatural History
onservation
EcologicilEnvironmental
TeCEE'iological
Acth,LneliEach student conducted a natural historystudy on a sub'ect of his/her choice.Each student performed two studies inwhich he/she conserves over the course ofthe semester:(1) some form of energy(2) use of some roduct.Flora, Fauna, Geology of Mt. NiEanx,____(1) Water quality of a duck pond.(2) Ground water preservation measures in
new commercial developments(3) ,3roups study the effects of differentfactors on the biodegradability of
________2;e22vs a er.(1) Each student traced the development ofa technology of his/her choice.(2) Groups determined the technologiesnecessary for removing water pollutants ofvarious kinds.
7cciety Groups analyzed the relative national valuesunderlying the funding of various kinds ofresearch (Federal bud et for 1987)
TS Issues (1) Each stu ent collect-I wee ly newsclippings on environmental issues.(2) Groups developed an STS teaching uniton some facet of global climate(3) Groups competed in a trade-offexercise which balanced nutrition againstfood cost, packaging, preparation energyancl_22222iii_itime and ene
In addition, students used as textbooks, Environmental Science, Third Edition, (S.H.Anderson, R.E. Beiswenger, and P.W. Purdom), and State of the World, 1989 (L.Brown, et al., 1989)
The course emphasis was not tightly conducted as a management by objectivesapproach. Field and hands-on experiences were emphasized as the reetrent for classroomdiscussions based on readings and selected topics from the video series,You, Me, andTechnology (M. Galey, 1987). Only three information lectures were given: one on thehistory of environmental education, a second on the history of environmentally relatedhuman values based on the book, Technology, Environment, and Human Values (I.G.Barbour, 1980), and chemical reactions in the atmosphere.

8
APPENDIX B
Science Expressions Technology Expressions Society Expressions
Atmosphere Industry Consumers
Radiation Power Generation Population
Volcanoes Agriculture Needs
Acid Rain Telecommunication Desires
Global Climate Biotechnology Government
Oceans Atomic Politics
Decomposition Fossil Fuel Jobs
Ultra Violet Computers Information
Infra Red House Attitude
Heat Engineering Awareness
Carbon Solution
Pollution Decisions
Chemicals
ses
Appendix C
Key: ( the arrow indicates the direction of the relationship)
c - Characteristic of: A ------* B B is a Characteristic of A
p - Part of: A -40. B B is a part of A
t - Type of A B is a type of A
e - Evidence for A --0B A provides evidence for Ba
a - Analogous to A B A is similar to B
I - Leads to (causes) A B A leads to, or Causes B
Science
9
L Global Climate
1 0
Gases
APPENDIX D
Proposition to beScored.
I
Is there any relationshipbetween the subject and
ohjp.fr?
(Yes)
(No)
I--Does the label indicate
IM'1
Assign aValue of 0
a possible relationship (No) Assign al
between the words?
1
Yes)
Does the direction ofthe arrow indicate anhierarchical or causalrelationship between thewords which is compatible
with the label?
(Yes)
Assign aValue of 3
Value of I
(No) Assign a I
--110\rallueof2
10

11
Appendix E
latlfc34Frequency _otP_LQgg_sijig_n_sC_a_team
Obser- Proposition Categoryvation
Statistic Total Sci.. Tech. Soc.Sci/Tech.
Sci./Soc.
Tech/Soc.
1st Freq. 565 166 74 140 75 19 91
Mapping
ActivityMean 35.3 10.4 4.6 8 8 4.7 1.2 5.7Std.Dev. 4.3 1.9 2.0 2.1 1.1 1.2 2.1
2nd
Mapping
Activity
Freq. 597 183 73 156 85 20 80Mean 37.3 11.4 4.6 9.8 5.3 1.3 5.0Std.Dev. 3.9 2.7, 1.3 2.2 1.8 1.1 1.8
Scores of Proposition by Category
Obse-1 1ositior Cate o
vation,==roStat. Total Sci, Tech, Soc.
.2,Sci/Tech.
Sci./Soc.
Tech/Soc.
1stMapping
Sum 1124 316 152 315 107 28 206Mean 70.3 19.8 9.5 19.7 6.7 1.8 12.9
Activity Std.Dev. 11.7 6.1 5.3 7.0 3.3 2.4 5.6
2nd
Mapping
Activity
Sum 1197 352 166 339 139 29 172Mean 74.8 22.0 10.4 21.2 8.7 1.8 10.8Std.Dev. 12.6 7.6, 3.5_ 7.0 3.8 2.2 4.5
Table 5AygtasmaQgCategory,
Obser- Proposition Categoryvation
Statistic Tot1 1 ScienceTech-nolo Societ
CrossDomain
15t Mean 2.044 1.885 1.876 2.233 1.837Mapping Std.Dev. .299 .449 .793 .463 .384
2nd Mean 2.011 1.908 2.258 2.148 1.867Mapping Std.Dev. .309 .450 .401 .476 .472
12

12
APPENDIX F
Table 6Ii I LO t .1. I u II II
Frequency 1st Mapping
SourceSum of
df Squares MeanS uares
F-Test P value
Between Sub ects 15 4 .24 .083 .2 7 .9'Within Subjects :0 1087.5 13.594
Cate 'ones 5 885.927 171.185 5c 442 .0001Residual 75 1.573 .008
Total 95 1133.74
Table 7sizoificant_Lat_25seisomparisonsCategories.Freauencv
ompanson Mean Diff. hef e F-testScience -Technology 5.75 17.133Society-Technology 4.125 8.817Science - Sciencenechnology 5 688 16.762Scierre - Science/society 9.188 . 43.741
S-67ce - Technology/society 4.688 11.386Technology - Science/society 3.438 6 123Society - Science/technology 4.062 8.552Society - Science/Society 7.562 29.636Societyechnology/society -7:0-62- I 4.86Science/technology -Science/socie
3.5 6.348
Technology/society -Science/society
4.5 I 4'3
13

13
APPENDIX F (Page 2)
One Factor ANO A-Repeated Measures for Proposition,EreauencLEAttgor.xign(LBADDin
SourceSum of
df Squares MeanSa uares
F-Test P value
Between Sub'ects 15 38.573 2.572 .148 .999Within Sub'ects 80 1393.833 17.423
Categones 5 1111.094 222.219 58.946 1001Residual 75 282.74 3.77
Total 95 1432.406
Table 9ncLi( A.L.25%) comparisons
Categories.Frequency 2nd Mapping
CoTnpanson Mean Diff. Sheffe F-testScience -Technology 6.875 20.06Society-Technology 5.188 11.421Science - Science/technology 6 125 15.922
cience - Science/societyScience
11 1: : 4 14:- Technology 6 438 17.50--
Technolo y - Science/society 3 3124.4T-3
4 6578 357Society - cience technology
Society - Science/Society 8.500 30.664oceity - Technology/society 4.75 9.576
Science/technology -Science/society
4.062 7.005
Technology/society -Science/so
3.750 5.968
4

Table 10
14
APPENDIX G
aI t.I 1 LiFrequency 1st Mapping
SourceSum of
df Squares MeanSa uares
F-Test P value
1.-----veeii-A-W-B-3-En.08 3.813 1.111 .2684Within Wects 19 658.667 3.431
2Relationshi es 2 42.25 21.125 6.511 .002
Residual 19 616.417 3.2440
Total 28 1020.8757
Table 11sons t n a
Frequency 1st Mapping
Corn s arison Mean Diff. Shefte F-testHierarch - Attribution .938 6.502
1 5

15
APPENDIX G (Page 2)
Table 121
Ertausna_ansLliauging
SourceSum of
df Squares MeanS uares
F-Test P value
Between Sub ects 95 462.302 4.866 1.209 .1357Within ubjects 1 772 .67 4 1 4
2Relationships 2 73.521 3. 7s 9.99 .001
Residual 19 699.146 '-7.68o
Total 28 1234.9697
Table 13R I n h
Frequency 2nd Mappne
Com sal-monHierarchy
Mean Diff. Sheffe F-test- Attribution 1.229
.749. .r-4--3.568Therach - Causal
16
APPENDIX H
Table 14
Relationship° Type X Proposition Category. Frequency 1stMapping
SourceSum of
df Squares MeanSa uares
F-Test P value
Relationshi (A) Ell 42. 5 MIENERIIIIME .005ub / amaj 45 15 ..958 =WM. tegory (repeated)
(B)5 4.1 5 52.825 7. 81 .0111
AB 10 ' 11.988 6.191 . 001B X Subjects w/
ou s22
5435.667 1.936
Table 15I 4 I '1
1st Maiming
RepeatedMeasure Sci Tech Soc
cVtech
ci----8-7"--rech/soc sac Totals
Causal 16 16 16 16 16 16 96Relazions 2.375 1.000 3.188 1.938 .688 2.062 1.875-76--Attribution 16 16 16 16 16 16Relations 2.812 .312 3.312 .750 .062 1.375 1.438
16 16 7-6- -9-6-Hierarchy 16 16 16Relation 4.75 3.188 2.000 1.625 .438 2.250 2.375
Totals 48 48 48 48 48 I 48 2883.312 1.500 2.833 1.438 .396 I 1.896 1.896
7

17
APPENDIX H (Page 2)
Table 16Two Factor Analysis of Variance. Repeated Measures,Relationship Type X Proposition Catcgary3irsauncx_2ndMapping
SourceSum of
df Squares MeanS uares
F-Test P value
Relationship (A) 2 73.521 36.76 10.699 .0002Subjects w/ groups 45 154 615 3.436Category (repeated)
(B)5 347.615 69.523 29.173 .0001
AB 10 123 021 12 302 5.162 .0001B X ubjects w
groups225
5 6 19: 2 83
1
2nd Mapping
RepeatedMeasure Sci Tech Soc
Sci/tech
Sci/soc
Tech/soc Totals
Causal 16 16 16 16 16 16 96Relations 3.000 1.562 2.312 2.375 .625 1.688 1.927
Attribution 16 16 16 16 16 -76- 96Relations 2.250 .500 3.750 1.125 .188 .812 1.438Hierarchy 16 16 16 16 16 16 96Relation 5.875 2.375 3.312 1.688 .375 2.375 2.667
Totals 48 48 48 48 48 48 2883.708 1.479 3.125 1.729 .396 1.625 2.010
1 8

18
APPENDIX I
Table 18One Factor ANOVA-Repeated Measures for Proposition Category.,Average Score_ 2nd Mapping
SourceSum of
df Squares MeanSquares
F-Test P value
Between Sub'ects 23 22.33 .971 2 282 0042Within Sub'ects 72 30.626 .425
ategories 3 4.137 1.379 3.592 .0179Residual 69 26.489 .384
Total 95 52.956.
Table 19m I CS.
Mappmff
Comparison Mean Diff. Fis er LSDTechnology - Cross Domains .357 2.514Societ - Cross Domains 4.438 8.357
Table 20One Factor ANOVA-Repeated Measures for Relationship Tyne,Average Score_Ist Mapping
SourceSum of
df Squares MeanS uares
F-Test P value
Between Subjects 6 22.44 56 .73 8 '7Within Subjects 74 56.829 .768Relationshi I s 2 7.288 3.644 5 296 .0072
Rem. ua 72 4 542Total 11
077.27
Table 21I ii I
Mapping
Corn arison Mean Diff. Sheffe F-testausal - Attribution 3 714ausal - Hierarc y 56 , 1 i
1 9

19
APPENDIX I (page 2)
TaklaAysiligc_lortinsi_Mauging
SourceSum of
df Squares MeanSa uares
F-Test P value
Between Subjects 36 28.869 .802 1.213 .2393Within Subjects
'---2--74 48.921 .601
Relationships 12.7 6.35 12.62 .0001Residual 72 36.221 .503
Total 11 77.7860
TaWe 235
Mapping
Comparison Mean Diff. Sheffe F-testCausal - Attribution"Titiierarchy
.679 8.487.75 10.354
2 0

Malian
Source
20
APPENDIX K
Sum ofdf Squares Mean
Sci uaresF-Test P value
Relationshy (A) 11.803 5.902.853
6.92 1055Sub ects wn. ous 19 16.205
. tegory (repeated)(B)
6
.36
6.771
.12
1 128
.294
2.76
.8297
.02ABB X Subjects w/
ous57 23.305 .409
Table 251 1 .1 1 1
EatEggry,_Aystagt_Sorg_isLAlagp.kLe
RepeatedMeasure
T
Sci Tech SocCross
Domains TotalsCausal 1 7 7 7 7 28
Relations 2.19 2.643 2.204 2.15 2.447Attribution 2 2 2 2 8Relations .9 .5 2.334 1.0 1.183Hierarchy 13 13 13 13 52Relation 1.946 1.966 1.619 1.946 1.869_Totals 22 22 22 22 88
1.929 2.048 2.061 1.925 1.991
21

21
APPENDIX K (Page 2)
Table 26Two Factor Analysis of Variance, Repeated Measures,
srMapping
SourceSum of
df Squares MeanSa uares
F-Test P value
1_torF7sr (A) : 28 4.314 II .0059Sulroups Tr 13.702 6527)(T6
.0017
Categories(Repeated)
(B)
3 4.137 1.379 4.548
4 .06-4AB 77.387 1.231B X Subjects w/
groups63 19.102 .303
Table 27Incidence Table Relationship Type X Proposition
I ie IA I
Repeated II
Measure Sci Tech SocCross
Domains TotalsCausal 9 9 9 9 36
Relations 2.315 2.907 2.901 1.862 2.496Attribution 2 2 2 2 8Relations 2 1.5 3 1 167 1.917Hierarchy 13 13 13 13 52Relation 1.751 2.051 1.765 1.919 1.862
Totals 24 24 24 24 961.983 2.326 2.294 1 835 2.11
2 2

APPENDIX L
Table 28Correlations of Proposition Frequencies withCompleted Credits, First Mapping
ContentArea
_
CF TotalSci. to
SciTech
toTech
Soc. toSoc.
Sci. toTech.
Sci. toSoc.
Techto Soc.
Science13 *.643 .177 *.628 .211 .328 -.090 .232
Math-ematics
14 .034 .015 .169 -.156 .161 -.024 -.019
SocialScience
13 .115-- .274 -.197 -.055 .133 .335. -.032
9 5 r 1 3 -512. and r 497.9 5 1 4 -
Table 29Correlatir2u_sfprwo HCompleted Credits. First Mapping
......Content
Area CF TotalSci. to
SciTech
toTech
Soc. toSoc.
Sci. toTech.
Sci. toSoc.
Techto Soc.
Science13 .447 -.410 *.518 .308 .223 .168 .265
Math-ematics
14 .102 .110 .154 .083 .372 .050 .354
SocialScience
13 .200 .385 .182 .044 -.148 .127 .198
r - 512.9 5 1 3 and .9 5r 1 4 -- .497
23
22
APPENDIX L (Page 2)
able 30Correlations of Proposition Frequencies and Average
r f n Ma Ac ivi with re fromattal_al_o_snin n
Tech
-.447 -.296 -.192 -.064 -.249 -.211
Average Score
14 .367 .110 '.5034,...
.170 .298 .179 .083
r - 497
24
23