Embed Size (px)
Citation preview
DOCUMENT RESUME
ED 322 169 TM 015 290
AUTHOR Oescher, Jeffrey; Kirby, Peggy C.TITLE Assessing Teacher-Made Tests in Secondary Math and
Science Classrooms.PUB DATE Apr 90NOTE 36p.; Paper presented at the Annual Meeting of the
National Council on Measurement in Education (Boston,MA, April 17-19, 1990).
PUB TYPE Reports - Research/Technical (143) --Speeches /Conference Papers (150) -- Tests/EvaluationInstruments (160)
EDRS PRICE MF01/PCO2 Plus PoW.uge.DESCRIPTORS *Classroom Techniques; High Schools; Inservice
Teacher Education; Item Analysis; *Mathematics Tests;*Science Tests; *Secondary School Teachers; *TeacherMade Tests; *Test Construction; Test Format; TestInterpretation
ABSTRACT
A model for use in identifying assessment needs inassociation with teacher-made mathematics and ncience tests at thesecondary level was developed. The model focuses on theidentification and narrowing of discrepancies between teachers'perceptions of their testing practices and actual practice. All 19math and 16 science teacilers at a 4-year high school in a mixedsuburban/rural school district participated in the project. Subjects'involvement consisted of completing a brief survey instrument andsupplying their most recently administered unit or quarter test. Datafrom 35 questionnaires and 34 tests containing more than 1,400 itemswere analyzed. Results cover the nature of classroom assessment,characteristics of teacher-made tests, item formats, cognitive levelstreated, quality of items, and teachers' confidence in testingskills. Topics identified as izlortant for inclusion in in-serviceactivities for teacher test construction are the use of tables ofspecifications, development of higher order items, item formatting,and the empirical analysis of test results. Instruments developedduring the study--the Test Analysis Guide and Teacher TestingQuestionnaire--are provided. Three data tables and two bar graphs areincluded. (TJH)
Reproductions supplied by EDRS are the best that can be madefrom the original document.
S DEPARTMENT OF EDUCATIONOftoci, of Educationai Research and Improvement
EDUCATIONAL RESCJRCES INFORMATIONCENTER (ERIC)
"This document has been reproduced asrecsived from the person or organizationoriginating it
P P.41nOt changes have been made to improvereproduction quality
Point sot new or opinions stated in this document do not necessarily represent officialOE RI position o. policy
Teacher-Made Tests
"PERMISSION TO REPRODUCE THISMATERIAL HAS BEEN GRANTED BY
J-Srp,epy_ OescocR
TO THE EDUCATIONAL RESOURCESINFORMATION CENTER (ERIC)
Assessing Teacher-Made Tests in
Secondary Math and Science Classrooms
Jeffrey Oescher
Peggy C. Kirby
University of New Orleans
Paper presented at the Annual Meeting of the NationalCouncil on Measurement in Education in Boston,Massachusetts, April, 1990. This paper has beenaccepted for publication in American SecondaryEducation.
BEST COPY AVAILABLE
2
Teacher-Made Tests
2
Introduction
The measurement of achievement is a critically
important part of Pfforts to improve student learning.
Instructional and evaluative decisions are based on the
type of formal and informal feedback gleaned from the
tests used to measure achievement. It is imperative
that these tests be as technically sound as possible.
Measurement experts have made great strides in
providing the technical background necessary to
accurately and reliably measure achievement. This
knowledge, however, is pot effectively communicated to
the classroom teacher. Courses in tests and
measurement are not typically required for teacher
certification; in-service training or technical support
for classroom assessment are equally rare. When
questioned about the tests they develop, teachers
consistently indicate lack of confidence about their
effectiveness and validity (Stiggins and Bridgeford,
1985).
Research indicates that teacher-made tests
dominate the assessments used by teachers, regardless
of test purpose, grade level, or subject area (Stiggins
and Bridgeford, 1985). Reliance on them increases with
grade level, with greater dependence shown by science
Teacher-Made Tests
3
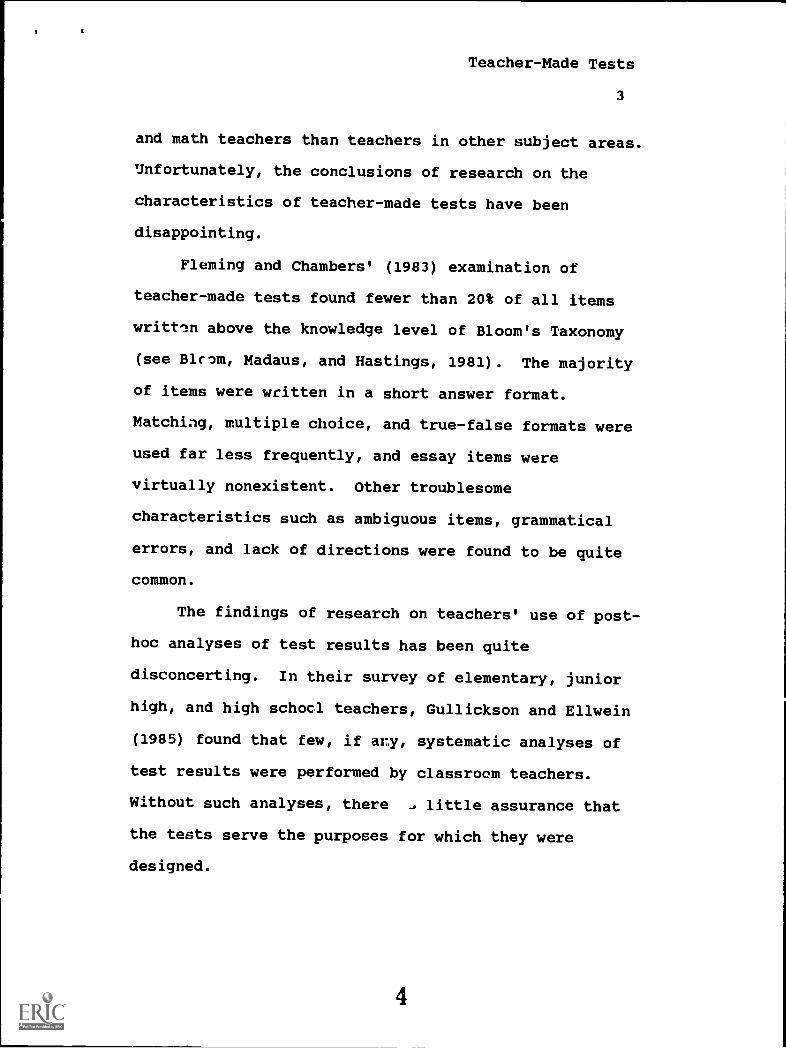
and math teachers than teachers in other subject areas.
Unfortunately, the conclusions of research on the
characteristics of teacher-made tests have been
disappointing.
Fleming and Chambers' (1983) examination of
teacher-made tests found fewer than 20% of all items
writt -n above the knowledge level of Bloom's Taxonomy
(see Blum, Madaus, and Hastings, 1981). The majority
of items were written in a short answer format.
Matching, multiple choice, and true-false formats were
used far less frequently, and essay items were
virtually nonexistent. Other troublesome
characteristics such as ambiguous items, grammatical
errors, and lack of directions were found to be quite
common.
The findings of research on teachers' use of post-
hoc analyses of test results has been quite
disconcerting. In their survey of elementary, junior
high, and high school teachers, Gullickson and Ellwein
(1985) found that few, if any, systematic analyses of
test results were performed by classroom teachers.
Without such analyses, there , little assurance that
the tests serve the purposes for which they were
designed.
4
Teacher-Made Tests
4
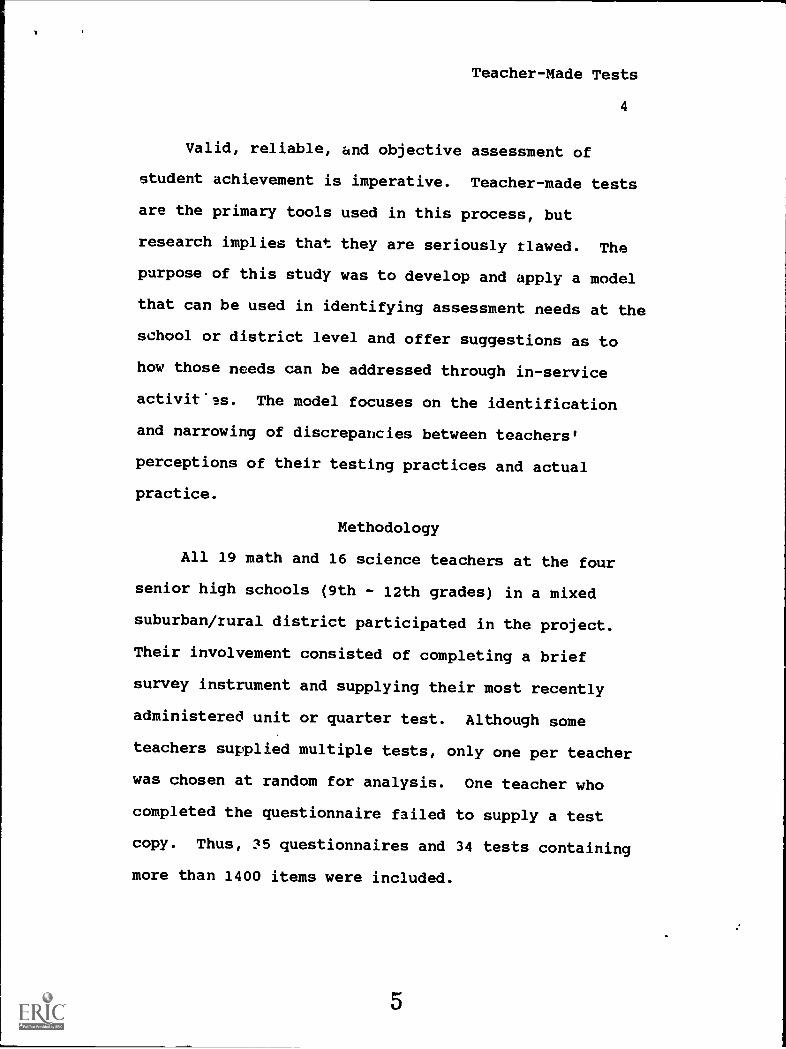
Valid, reliable, and objective assessment of
student achievement is imperative. Teacher-made tests
are the primary tools used in this process, but
research implies that they are seriously flawed. The
purpose of this study was to develop and apply a model
that can be used in identifying assessment needs at the
school or district level and offer suggestions as to
how those needs can be addressed through in-service
activit'ss. The model focuses on the identification
and narrowing of discrepancies between teachers'
perceptions of their testing practices and actual
practice.
Methodology
All 19 math and 16 science teachers at the four
senior high schools (9th - 12th grades) in a mixed
suburban/rural district participated in the project.
Their involvement consisted of completing a brief
survey instrument and supplying their most recently
administered unit or quarter test. Although some
teachers supplied multiple tests, only one per teacher
was chosen at random for analysis. One teacher who
completed the questionnaire failed to supply a test
copy. Thus, 35 questionnaires and 34 tests containing
more than 1400 items were included.
5
Teacher-Made Tests
5
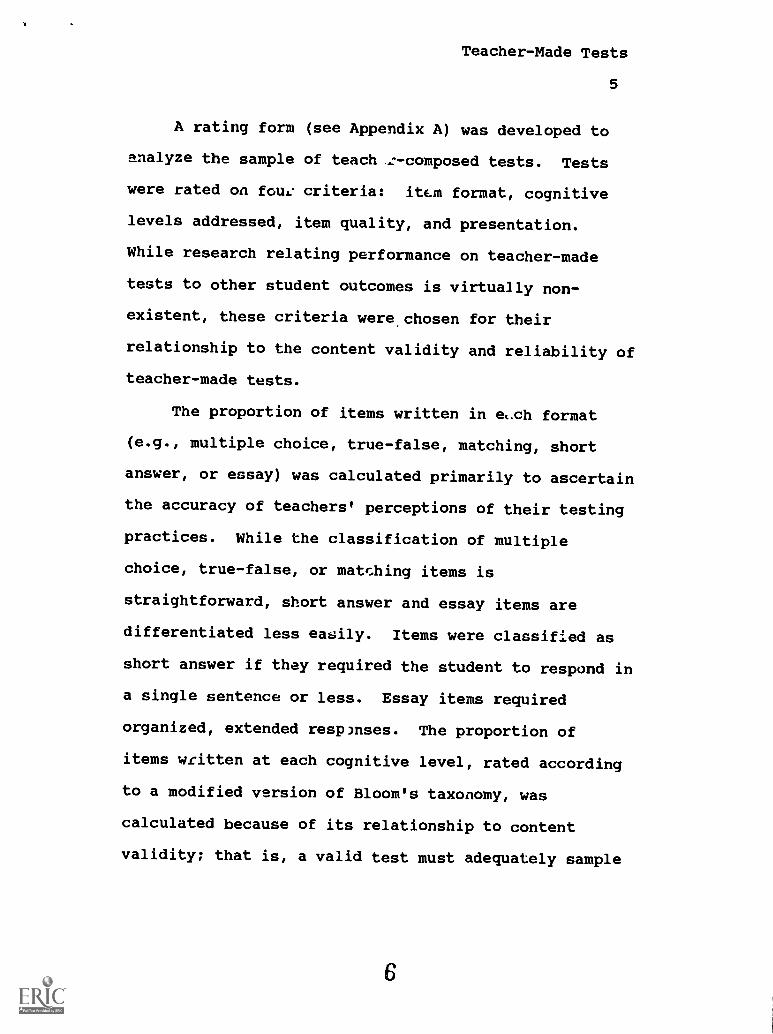
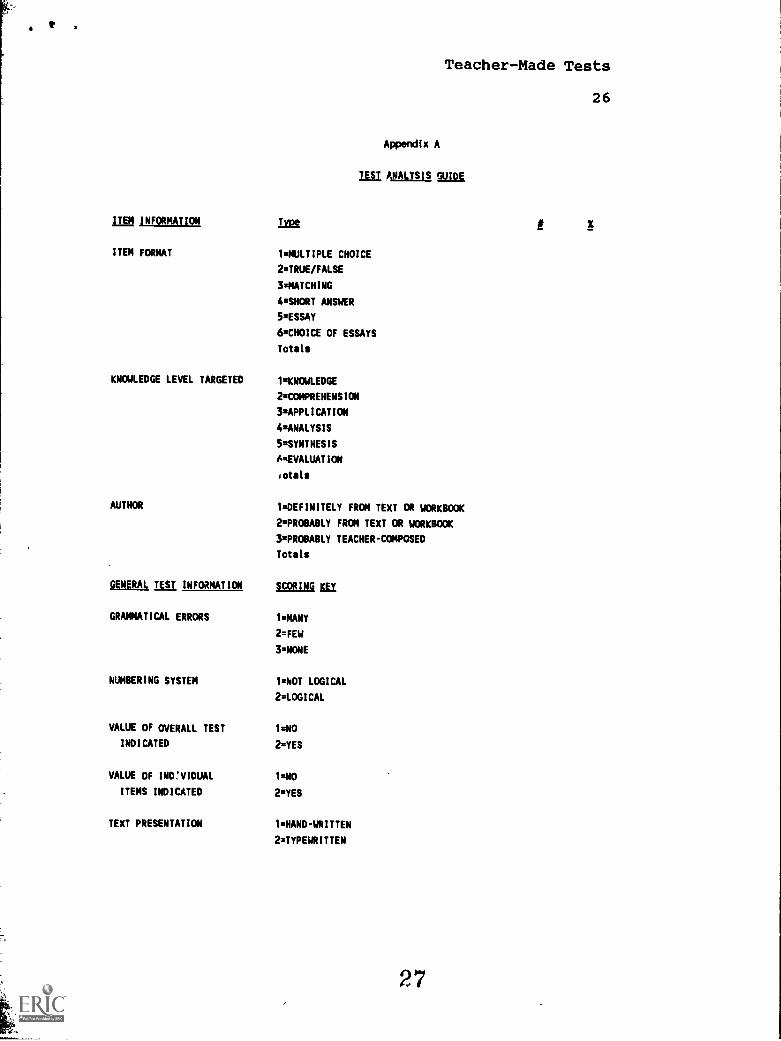
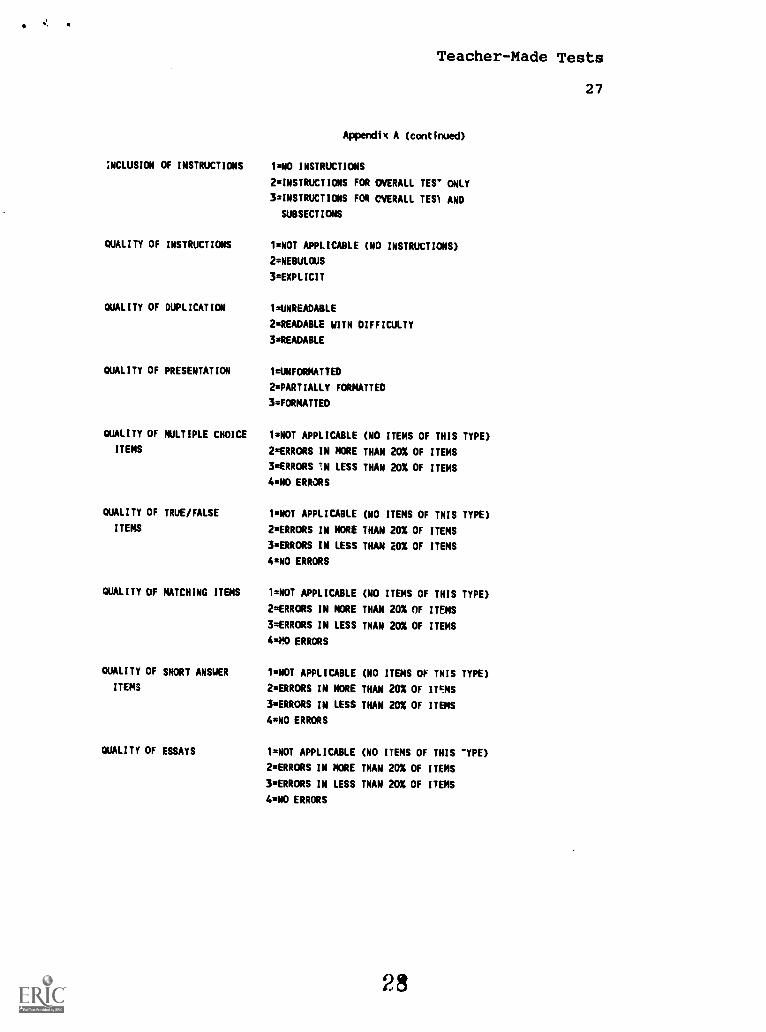
A rating form (see Appendix A) was developed to
analyze the sample of teach .:-composed tests. Tests
were rated on four criteria: item format, cognitive
levels addressed, item quality, and presentation.
While research relating performance on teacher-made
tests to other student outcomes is virtually non-
existent, these criteria were, chosen for their
relationship to the content validity and reliability of
teacher-made tests.
The proportion of items written in e,.ch format
(e.g., multiple choice, true-false, matching, short
answer, or essay) was calculated primarily to ascertain
the accuracy of teachers' perceptions of their testing
practices. While the classification of multiple
choice, true-false, or matching items is
straightforward, short answer and essay items are
differentiated less easily. Items were classified as
short answer if they required the student to respond in
a single sentence or less. Essay items required
organized, extended responses. The proportion of
items written at each cognitive level, rated according
to a modified version of Bloom's taxonomy, was
calculated because of its relationship to content
validity; that is, a valid test must adequately sample
6
Teacher-Made Tests
6
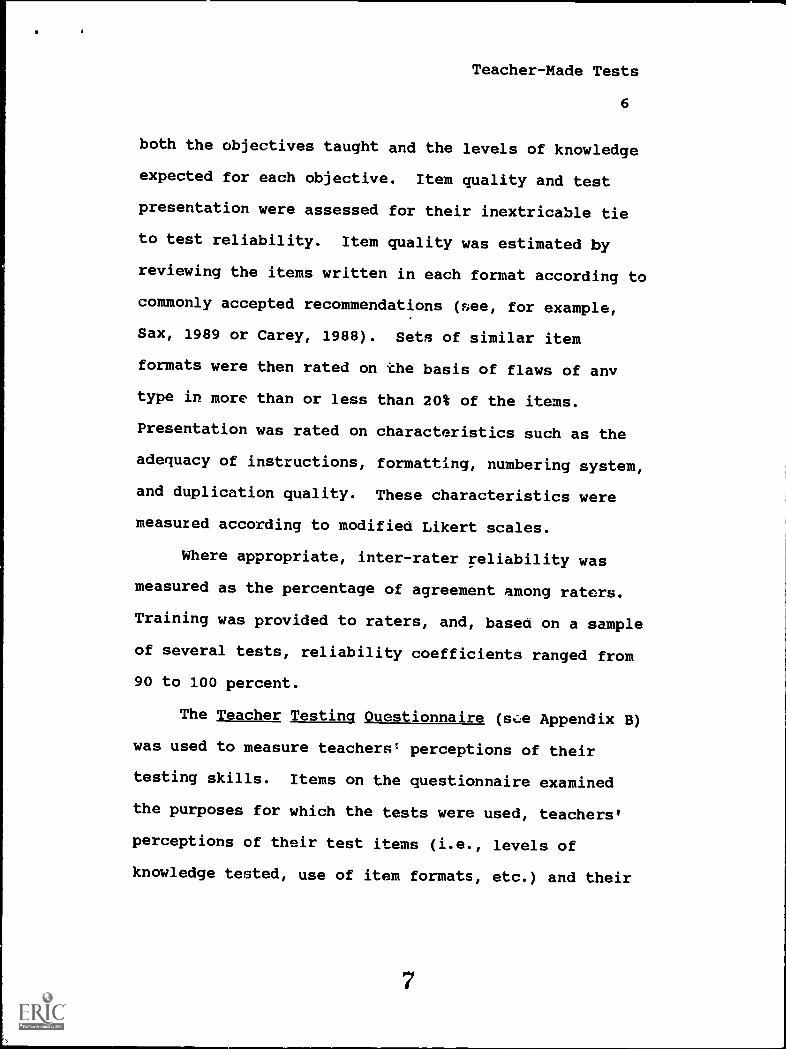
both the objectives taught and the levels of knowledge
expected for each objective. Item quality and test
presentation were assessed for their inextricable tie
to test reliability. Item quality was estimated by
reviewing the items written in each format according to
commonly accepted recommendations (see, for example,
Sax, 1989 or Carey, 1988). Sets of similar item
formats were then rated on the basis of flaws of anv
type in more than or less than 20% of the items.
Presentation was rated on characteristics such as the
adequacy of instructions, formatting, numbering system,
and duplication quality. These characteristics were
measured according to modified Likert scales.
Where appropriate, inter-rater reliability was
measured as the percentage of agreement among raters.
Training was provided to raters, and, based on a sample
of several tests, reliability coefficients ranged from
90 to 100 percent.
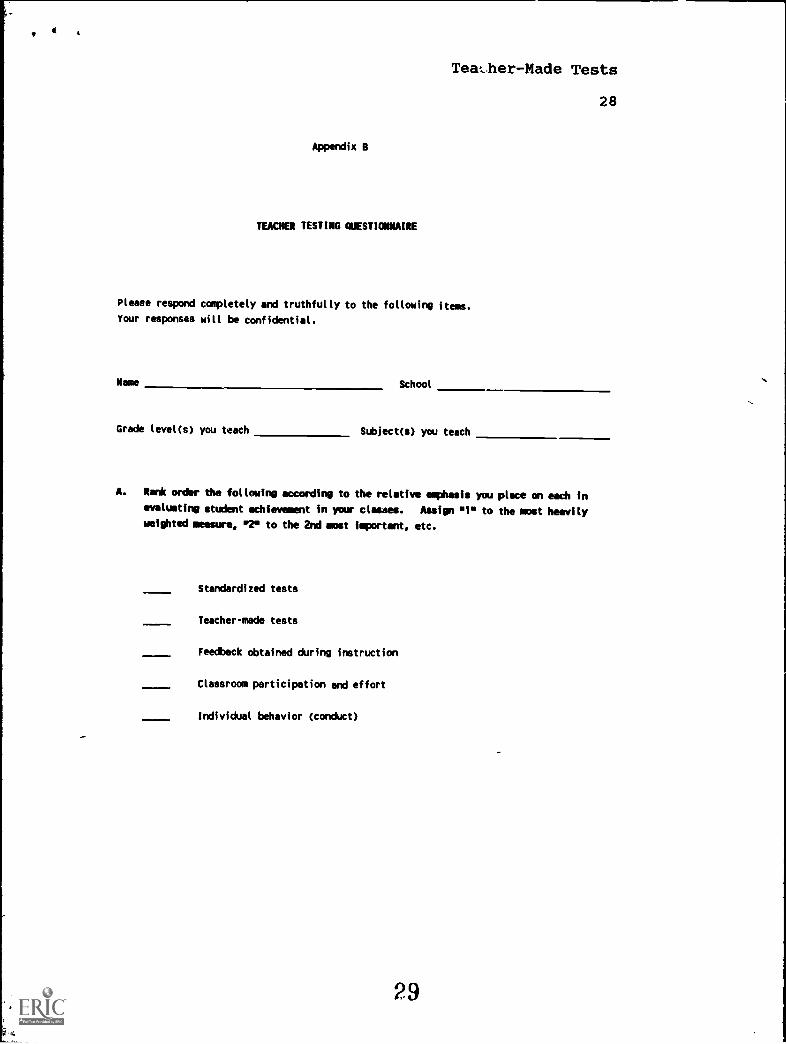
The Teacher Testing Questionnaire (see Appendix B)
was used to measure teachers' perceptions of their
testing skills. Items on the questionnaire examined
the purposes for which the tests were used, teachers'
perceptions of their test items (i.e., levels of
knowledge tested, use of item formats, etc.) and their
7
Teacher-Made Tests
7
general testing practices, the analyses performed on
test results, and the confidence teachers' had in their
test development skills.
Results
Nature of Classroom Assessment
There is conclusive evidence that teachers
perceive summative evaluation as the dominant purpose
of classroom testing and that teacher-made tests are
the most important source of information upol which
this evaluation is based. Teachers indicated that more
than 70% of all tests were administered for the primary
purpose of assigning grades. They also reported using
test results in formative manners, often to identify
student weaknesses and modify instruction, but such use
is secondary to the purpose of assigning grades.
While formative and summative use of test results
is commendable, the tremendous weight placed on
teacher-made tests in student evaluation underscores
the need to ensure that these tests are valid and
reliable indicators of student performance. In fact,
when asked to rank in importance the sources from which
they obtained the information needed to evaluate
students, 31 of the 35 teachers ranked their own tests
first. Classroom participation and feedback obtained
8
Teacher-Made Tests
8
from instruction were ranked next in importance.
Interestingly, standardized tests were ranked below
classroom behavior by 28 teachers!
Characteristics of Teacher-Made Tests
General Characteristics. More than 1,400 items
from 35 tests were examined. Teachers reported writing
about 65% of these items. The remaining items were
obtained from test guides, textbooks, workbooks, and
other sources. The number of items per test varied
widely from a minimum of 14 to a maximum of 103 items.
On average, there were 42 items per test. With few
exceptions, all tests were judged to be of reasonable
length.
Twenty-four of the tests (70%) were completely
type-written, two (6%) contained typed and hand-written
sections, and 8 (24%) were totally hand-written. In
only four cases was duplication quality judged to be
inadequate. Formatting was a problem in more than 70%
of the tests. Common examples of this deficiency were
crowding, inconsistent style and margins, and lack of
space for answers.
Written instructions were provided on 25 of the 34
tests (74%). All but two of these contained
instructions for the total test as well as subsections.
9
Teacher-Made Tests
9
Nine tests (26%) contained no instructions, despite the
fact that teachers reported on the questionnaire nearly
always including written instructions for each
subsection.
Instructions were deemed "nebulous" for 21 of the
25 tests (84%) that included written instructions.
"Nebulous" referred to instructions such as those that
ask students to choose an answer without indicating hot"
or where the choice should be recorded. This was
particularly problematic for matching items where two
long lists were often presented with no space provided
for answers. The student was left to decide whether to
match Column A to Column B, Column B to Column A, or
draw lines between the two.
Students were not typically informed of the point
value of any test or item. None of the 34 tests
contained a written explanation of the weight of that
test in determining a student's grade. The point value
of individual items or sections was specified in only
six tests (18%). Ironically, teachers reported
frequently informing students of item values. Unless
this information was verbalizea to the students prior
to testing, there is little evidence to support such a
contention.
10
Teacher-Made Tests
10
Item Formats. The results of the analyses
pertaining to item formats are reported in Figure 1.
According to the results observed by the researchers,
more than 60% of all items were written in a short
answer format. Multiple choice, matching, and true-
false formats accounted for about 20%, 15%, and 5% of
all items respectively. The most striking observation
was the inclusion of only 4 essay items among the more
than 1400 items examined.
As shown in Figure 1, similarities were found
between the percentages observed by the researchers and
those perceived by the teachers for multiple choice,
true-false, and matching formats. Teachers, however,
perceived themselves writing far fewer short answer
items and many more essay items than were observed.
Insert Figure 1 about here
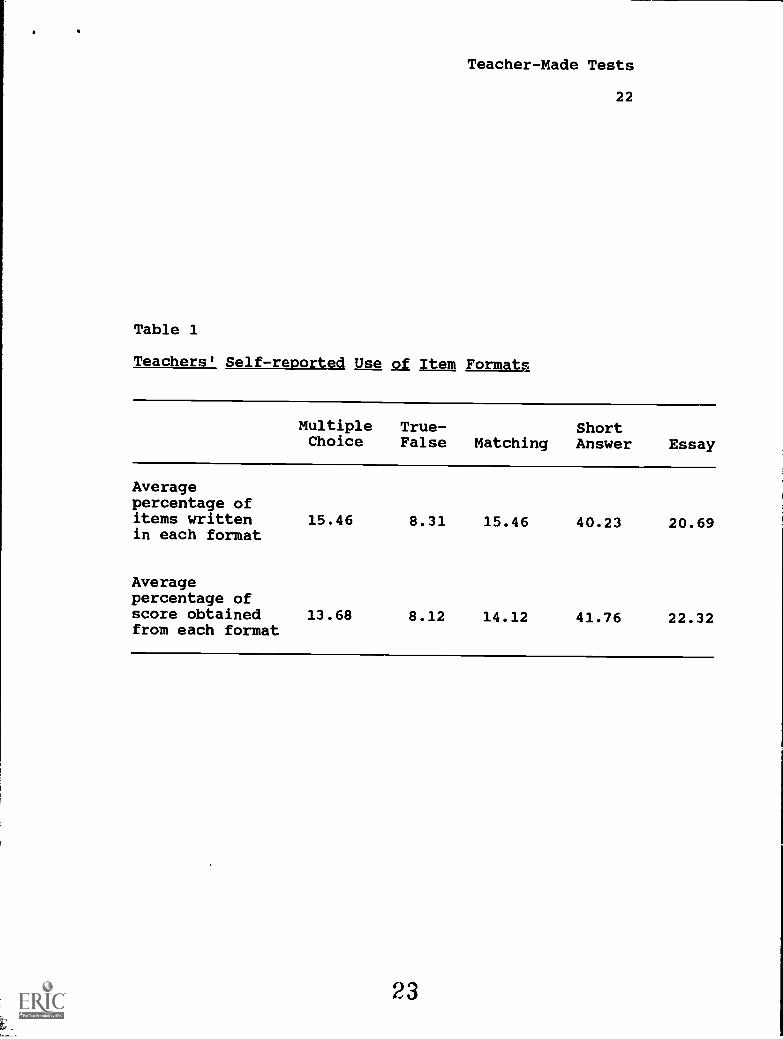
Teachers did not routinely weight item formats
differently. As revealed in Table 1, the self-reported
percentage of a student's score determined by any one
item format paralleled the percentage of items written
in that format.
Insert Table 1 about here
11
Teacher-Made Tests
11
Cognitive Levels Tested. Teachers agree that the
vast majority of items were written at the lower
cognitive levels of knowledge and comprehension (Bloom,
Madaus, & Hastings, 1981). A major discrepancy lies,
however, in the perceived percentage of items written
at higher levels. Although teachers reported that
roughly one-fourth of all items were written at the
application, analysis, synthesis, or evaluation level,
the researchers' analyses placed less than 8% of all
items at these cognitive levels, with virtually no
items requiring students to synthesize or evaluate (see
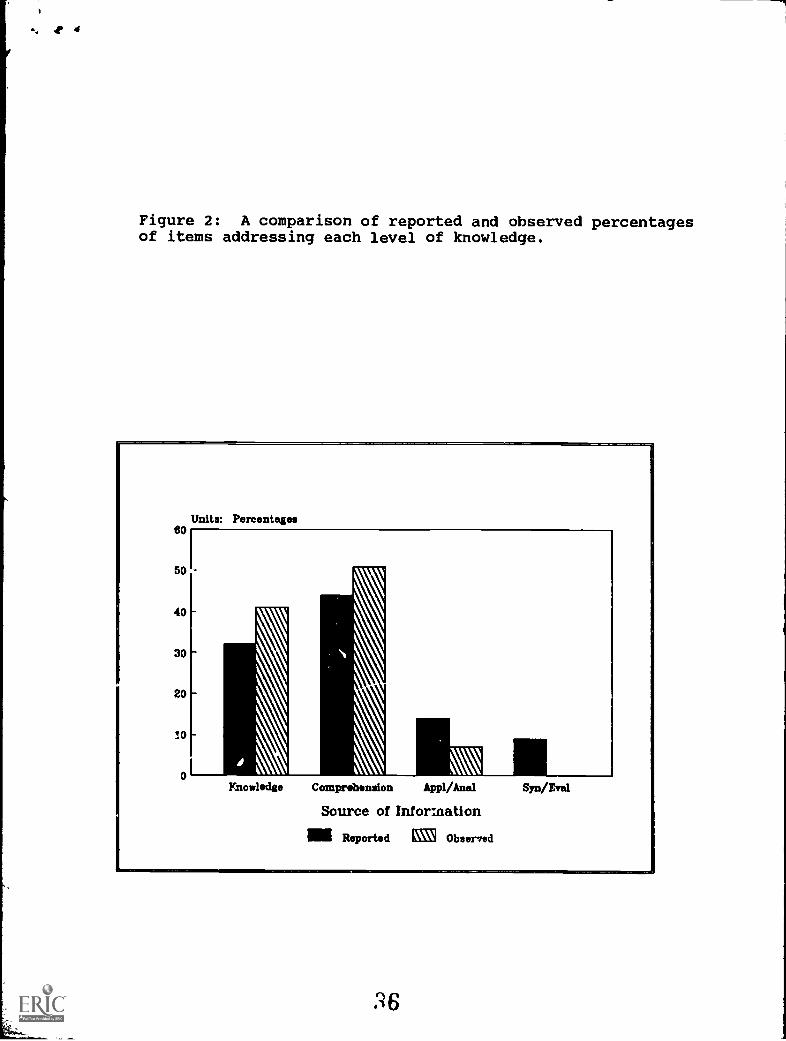
Figure 2). A t-test of mean differences between
teacher perceptions of the percentage of items written
at the levels of synthesis or evaluation and rater
judgments of percentage of items at these levels was
statistically significant (t=4.76, 2<.001 with
Bonferroni (Dunn, 1961) correction]. This discrepancy
confirms Carter's (1984) finding that teachers tend to
inaccurately classify higher order items.
Insert Figure 2 about here
Possible effects of school and subject taught were
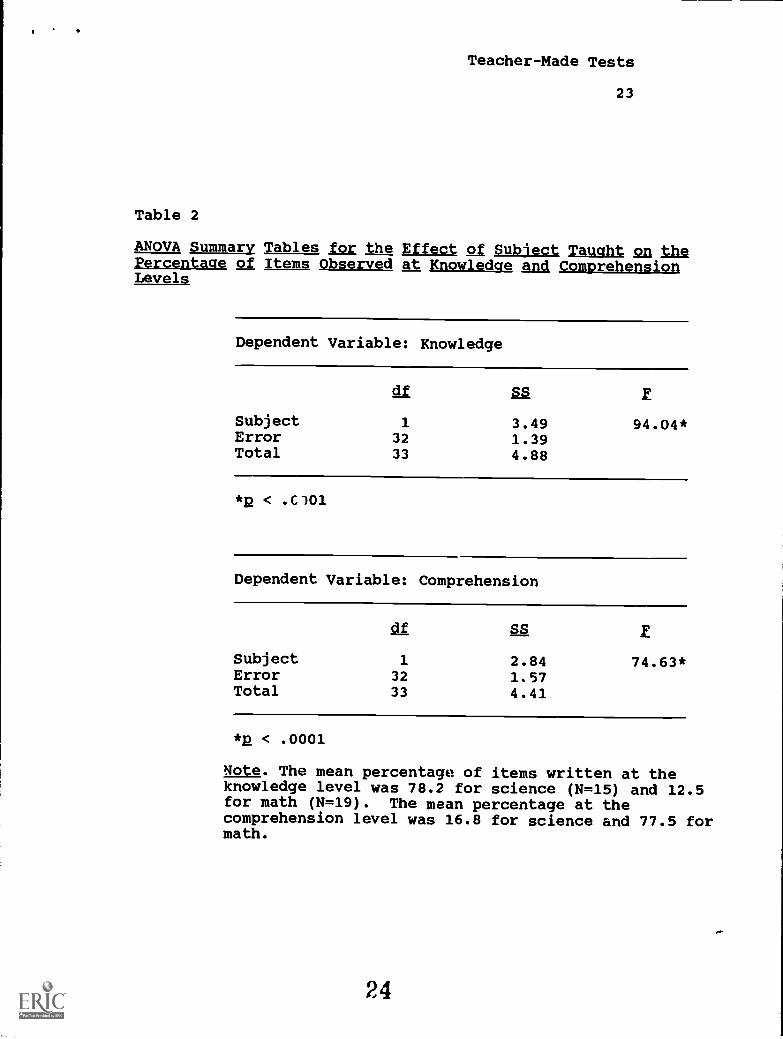
analyzed (see Table 2). Results indicated that the
individual school had no efLect on teachers' use of
12
Teacher-Made Tests
12
higher level test items. However, the subject - math
or science - did siqaificantly affect the percentage of
items judged to be written at :the knowledge and
comprehension levels. No differences by subject were
found at other cognitive levels. Although teachers of
both disciplines wrote the nmjoritv of items at these
two lower levels, math teachers ihcluded significantly
greater numbers of comprehension items on their exams.
While the science tests analyzed contained, on average,
78% of all items at the knowledge level and 17% at the
comprehension level, math tests had an average of 78%
of all items written at the comprehension level with
about 13% at the knowledge level. This finding can be
attributed to the tendency to test math skills by
requiring students to solve number problems
(comprehension level).
Insert Table 2 about here
The finding of major importance here is not the
differences by subject at the lower levels of
knowledge, but the lack of items in either subject at
higher levels. Interestingly, few math teachers
required students to apply knowledge of procedures to
new situations. Word problems were regretfully
13
Teacher-Made Tests
13
scarce.
Quality gl Items. Grammatical errors discovered
by the raters were few in number, but other item
writing flaui were quite common across all formats. Of
the four essay items examined, all contained major
flats. None contained information to guide the student
in structuring a response or tapped higher level
thinking skills. Of the 18 tests containing multiple
choice items, 17 were judged to have flaws in more than
20% of these items. Common errors were more than one
correct answer, posing the question in the distracters
rather than the stem, grammatical inconsistencies
between the stem and distracters, inappropriate use of
"all of the above" and "none of the above", and asking
more than one question in the stem. Similar results
were obtained for tests containing matching items, with
perfect matching and the lack of response guidelines
the most common deficiencies in this format. A sliyht
improvement was observed for short answer and true-
false items, but errors were still found in more than
half of the tests containing items of these types. Of
these, the most consistent were the use of vague stems,
multiple blanks within an item, and the use of
negative statements.
14
Teacher-Made Tests
14
Teachers' Confidence in Testing Skills.
Teachers were asked to respond on a five point
Likert scale (1 equals "strongly disagree" to 5 equals
"strongly agree") as to how confident they felt about
their testing skills. They reported, on average,
feeling confident in their ability to construct valid
and reliable tests (M=4.40) and assess the validity and
reliability of those tests (M=4.29). They tended to
rate their pre-service training in tests and
measurement as adequate (M=3.71) and were only slightly
less assured of the adequacy of their in-service
training (M=3.49).
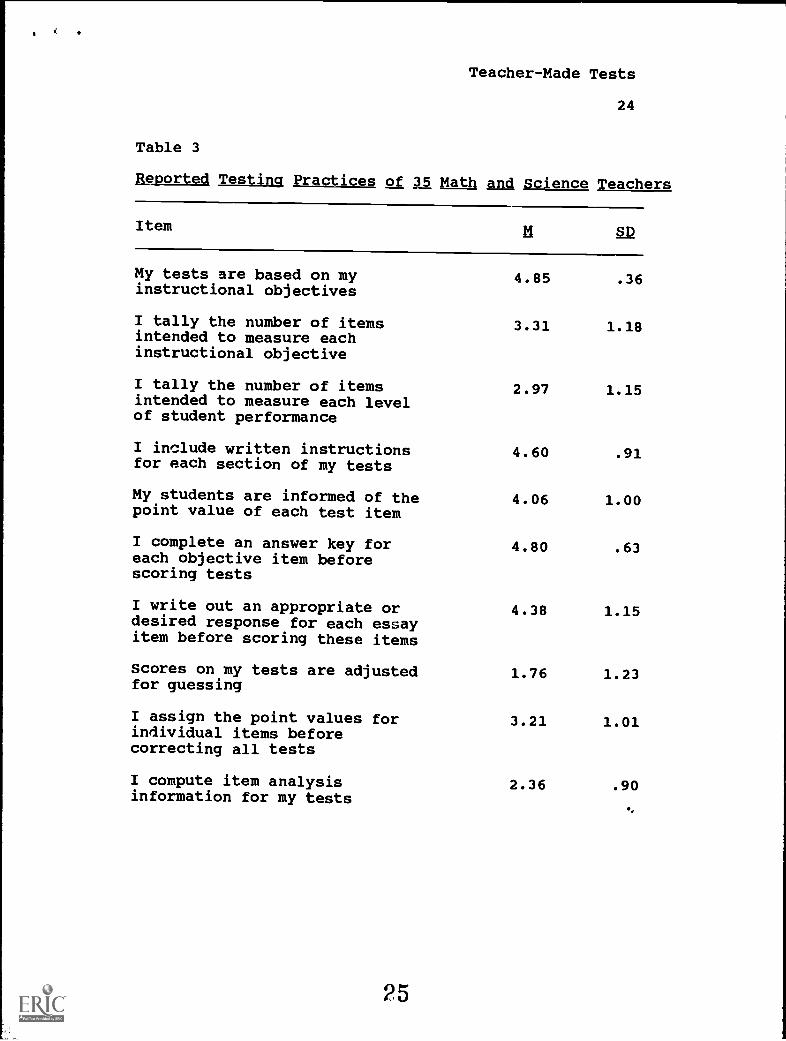
Teachers reported routinely practicing some
commonly accepted test development procedures (see
Table 3). They indicated that tests wen?. almost always
based on instructional objectives, that objective
scoring procedures were used, and that test results
were reviewed with students.
Insert Table 3 about here
It appears that teachers do not consistently use
tables of specifications to cctstruct their tests, nor
do they empirically analyze item or test level data
(see Table 3). Response data indicates they only
15
Teacher-Made Tests
15
occasionally tally the number of items per
instructional objective or per level of knowledge,
compute item statistics, eliminate items on the basis
of iten statistics, or compute an arithmetic mean for
the test. As indicated by the. own responses,
teachers appear confident in their knowledge about
these empirically related practices, but they tend to
disregard them when analyzing their own tests.
Discussion
Utilizing test analysis guides and self-report
questionnaires are excellent means of identifying
misconceptions and concerns of classroom teachers
regarding their own tests. Some caveats related to
these analyses are in order here. First, test ratings
should not be considered as a means of teacher
evaluation. Many decisions will be subjective, and the
quality of one or two tests will not necessarily be
indicative of all tests composed by that teacher.
Secondly, it should be recognized that test
quality is usually a reflection of training, not
ability. Teachers can be taught to construct valid and
reliable tests, but such instruction and subsequent
test development are time-consuming. Even with proper
training, teachers may not find the time to perform the
16
Teacher-Made Tests
16
recommended test analyses. They must, therefore, be
presented time-saving tips that are easily understood
and implemented.
The most difficult area to address will be
development of items testing higher order thinking
skills. Developing and classifying such items require
practice. An item that appears to be a higher order
item may, because of the instruction provided, actually
be written at the level of knowledge or comprehension.
Thus, raters must recognize that classification of
iters is occasionally subjective. Illustrative
examples of Bloom's Taxonomy such as those offered in
Bloom, Madw.zs, and Hastings (1981) or Gronlund (1990)
and alternative taxonomies like that offered by
Quellmalz (1985) are helpful in reducing such
subjectivity. Finally, teachers should be advised to
avoid classifying items based on format; all essay
items are not higher order items!
Recommendations
The Test Analysis Guide and Teacher Testing
Questionnaire (Appendices A and B) are useful in
providing in-service activities that are tailored to
the needs of the school or distrilt. Our results
suggested four topics for inclusion in such activities.
17
Teacher-Made Tests
17
First, the preponderance of knowledge and comprehension
level items and the failure of teachers to map test
items to targeted objectives suggest a need to provide
instruction in the use of tables of specifications.
Opportunity for practice in constructing the table and
mapping items can greatly improve the content validity
of teacher-made tests.
A related weakness was noted in the lack of items
addressing higher order skills. Writing items at the
levels of analysis, synthesis and evaluation requires
practice. In-service workshops can provide the
mechanism through which teachers of the same discipline
could help one another in developing higher order
items. Measurement textbooks such as Gronlund's (1990)
provide descriptions of the major categories of the
cognitive domain, illustrative objectives and suggested
ve,bs to use in stating student outcomes. An excellent
source for tips in writing higher order items is Sax's
(1989) text. With practice, teachers can write items
that cover a breadth of content and learning outcomes.
A third in-service activity should address
weaknesses in specific item formats. Again, a basic
measurement text will provide guidelines. As an
example, multiple choice items should present the
18
Teacher-Made Tests
18
problem or question in the stem. The correct answer
should not be discernible from its length in relation
to the distracters or from language association with
the stem. Guided practice, perhaps using some of their
own items, will help teachers recognize and correct
such common errors that compromise item reliability.
Finally, the empirical analysis of test results
should be discussed, but it is most important here to
recognize that this is the phase that the already
overburdened classroom teacher is least likely to
incorporate into routine testing practices. Although
computerized analyses are possible, analysis of any
detail requires entering individual student responses
into the computer either directly or through optical
scan readers. This process can be simplified with
software designed for use by classroom teachers
(Oescher and DeGolyer, 1989). Of course, objective
tests are required. Although computerized analysis is
to be encouraged where possible, simple techniques to
estimate item and test reliability can be mastered
quickly. Again, suggestions are offered by Gronlund,
(1990), Sax (1989), and Carey (1988) that will greatly
reduce the time involved in item and test analyses.
In concluding, it should be emphasized that the
;9
Teacher-Made Tests
19
primary purpose of analyzing teacher testing practices
is to inform the process of training for improvement.
When the stakes for students are admittedly high, the
tools of evaluation must be above reproach.
20
Teacher-Made Tests
20
References
Bloom, B.S., Madaus, G.F., & Hastings, J.T. (1981).
Evaluation to imarove learning. New York: McGraw-
Hill.
Carey, L.M. (1988). Measuring and, evaluatinct school
learning. Boston: Allyn and Bacon.
Carter, K. (1984). Do teachers understand principles
for writing tests? Journal of Teacher
Evaluation. 35, 57-60.
Dunn, 0. J. (1961). Multiple comparisons among means.
112urnal of the Ame ican Statistical Association,
Afi, 52-64.
Fleming, M., & Chambers, B. (1983). Teacher-made tests:
Windows on the classroom. In W.E Hathaway (Ed.),
Testing in the Schools: New Directions for
Testing and Measurement, 19, (pp. 29-38). San
Francisco: Jossey-Bass.
Gronlund, N.E. (1990). Measurement and Eval ation in
Teaching (6th ed.). New York: Macmillan Publishing
Co.
Gullickson, A.R., & Ellwein, M.C. (1985). Post hoc
analysis of teacher-made tests: The goodness-of-
fit between prescription and practice.
Educational Measurement: Issues and Practice, A,
21
Teacher-Made Tests
21
15-18.
Oescher, J. and DeGolyer, J.H. (1989). Test reliability
statistics [Computer Program] New Orleans, LA.
University of New Orleans, Department of
Educational Leadership and Foundations.
Quellmalz, E.S. (1985). Developing reasoning skills. In
Baron, J.R. & Sternberg, R.J. (Eds.). Teaching
thinking skills: Theory and, practice. New York:
Freeman.
Sax, G. (1989). Principles gf Educational and
Psychological Measurement and Evaluation (3rd ed.).
Belmont, CA: Wadsworth Publishing Co.
Stiggins, R.J., & Bridgeford, N.J. (1985). The ecology
of classroom assessment. Journal of Educational
Measurement, 22, 271-286.
22
Teacher-Made Tests
22
Table 1
Teachers' Self-reported Use of Item Formats
Multiple True- ShortChoice False Matching Answer Essay
Averagepercentage ofitems writtenin each format
Averagepercentage ofscore obtainedfrom each format
15.46 8.31 15.46 40.23 20.69
13.68 8.12 14.12 41.76 22.32
23
Teacher-Made Tests
23
Table 2
ANOVA Summary Tables for the, Effect of Subject Taught on thePercentage of Items Observed At Knowledge and ComprehensionLevels
Dependent Variable: Knowledge
df
SubjectErrorTotal
1
3233
3.491.394.88
94.04*
*p < .C101
Dependent Variable: Comprehension
df SS
SubjectErrorTotal
1
3233
2.841.574.41
74.63*
*p < .0001
Note. The mean percentage of items written at theknowledge level was 78.2 for science (N=15) and 12.5for math (N=19). The mean percentage at thecomprehension level was 16.8 for science and 77.5 formath.
Teacher-Made Tests
24
Table 3
Reported Testing Practices of 3.5 Math and Science Teachers
Item
My tests are based on myinstructional objectives
I tally the number of itemsintended to measure eachinstructional objective
I tally the number of itemsintended to measure each levelof student performance
I include written instructionsfor each section of my tests
My students are informed of thepoint value of each test item
I complete an answer key foreach objective item beforescoring tests
I write out an appropriate ordesired response for each essayitem before scoring these items
Scores on my tests are adjustedfor guessing
I assign the point values forindividual items beforecorrecting all tests
I compute item analysisinformation for my tests
0
4.85 .36
3.31 1.18
2.97 1.15
4.60 .91
4.06 1.00
4.80 .63
4.38 1.15
1.76 1.23
3.21 1.01
2.36 .90
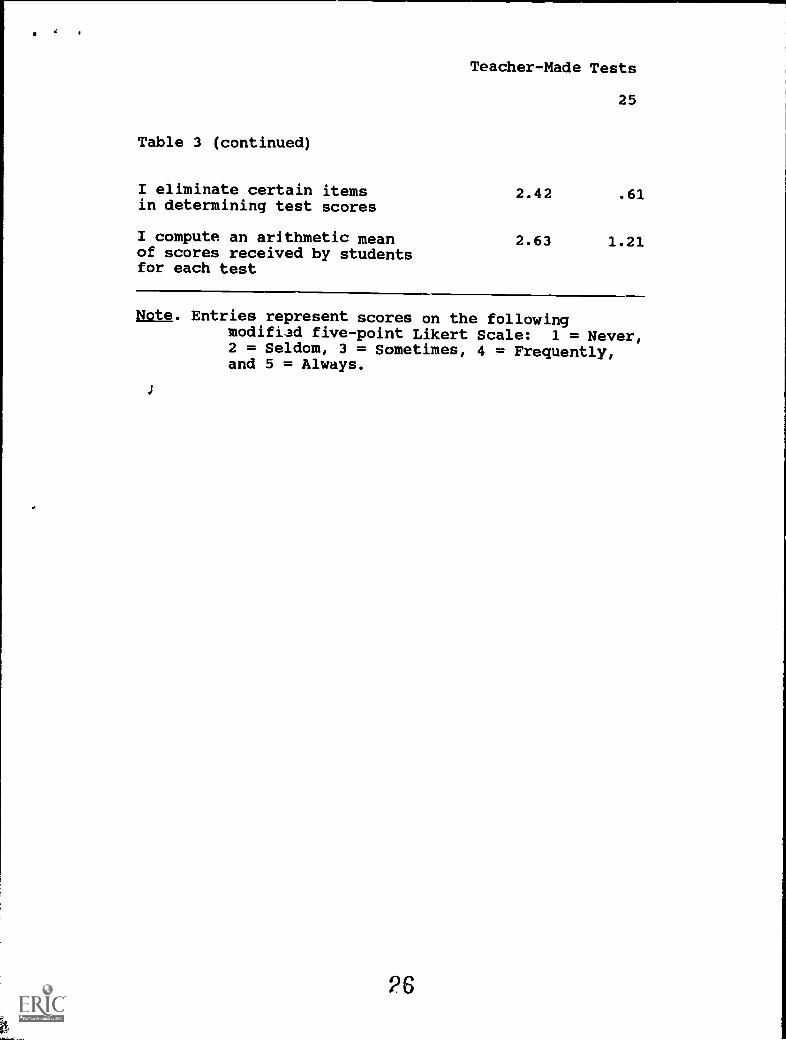
Table 3 (continued)
I eliminate certain itemsin determining test scores
I compute an arithmetic meanof scores received by studentsfor each test
Teacher-Made Tests
25
2.42 .61
2.63 1.21
Note. Entries represent scores on the followingmodified five-point Likert Scale: 1 = Never,2 = Seldom, 3 = Sometimes, 4 = Frequently,and 5 = Always.
J
26
Teacher-Made Tests
26
Appendix A
kNALYSIS GUIDE
TE iNFORMATION Tie X
ITEM FORMAT
KNOWLEDGE LEVEL TARGETED
AUTHOR
IsMULTIPLE CHOICE
2sTRUE/FALSE
3sMATCHING
4sSHORT ANSWER
5sESSAY
6sCHOICE OF ESSAYS
Totals
lsKNOWLEOGE
2sCOMPRENENSION
3sAPPLICATION
isANALYSIS
5=SYNTNESIS
AsEVALUATION
otals
IsDEFINITELY FROM TEXT OR WORKBOOK
2sPROBABLY FROM TEXT OR WORKBOOK
3sPROOABLY TEACHER-COMPOSED
Totals
GENERA' T INFORMATION SCORING mi
GRAMMATICAL ERRORS
NUMBERING SYSTEM
1sMANY
2=FEW
3=NONE
1=NOT LOGICAL
2sLOGICAL
VALUE OF OVERALL TEST IsNO
INDICATED 2sYES
VALUE OF INWVIDUAL
ITEMS INDICATED
TEXT PRESENTATION
1sNO
2=YES
1 =HAND-WRITTEN
2=TYPEWRITTEN
27
INCLUSION OF INSTRUCTIONS
Teacher-Made Tests
Appendix A (continued)
1=NO INSTRUCTIONS
2=INSTRUCTIONS FOR OVERALL TES' ONLY
32Immucrlows FOR OVERALL TES) AND
SUBSECTIONS
QUALITY OF INSTRUCTIONS 1=NOT APPLICABLE (NO INSTRUCTIONS)
2=NEBULOUS
3=EXPLICIT
QUALITY OF DUPLICATION 1=UNREADABLE
2=READABLE WITH DIFFICULTY
3=READABLE
QUALITY OF PRESENTATION 1=UNFORMATTED
2=PARTIALLY FORMATTED
3=FCRMATTED
QUALITY OF MULTIPLE CHOICE 1=NOT APPLICABLE (NO ITEMS OF THIS TYPE)
ITEMS 2=ERRORS IN MORE THAN 20% OF ITEMS
3=ERRORS IN LESS THAN 20% OF ITEMS
4,43 ERRORS
QUALITY OF TRUE/FALSE
ITEMS
QUALITY OF MATCHING ITEMS
QUALITY OF SNORT ANSWER
ITEMS
QUALITY OF ESSAYS
1=NOT APPLICABLE (NO ITEMS OF THIS TYPE)
2=ERRORS IN MORE THAN 20% OF ITEMS
3=ERRORS IN LESS THAN 20% OF ITEMS
4=NO ERRORS
1=NOT APPLICABLE (NO ITEMS OF THIS TYPE)
2=ERRORS IN MORE THAN 20% OF ITEMS
3=ERRORS IN LESS THAN 20% OF ITEMS
4=M0 ERRORS
1=NOT APPLICABLE (NO ITEMS OF THIS TYPE)
2=ERRORS IN MORE THAN 20% OF ITEMS
3=ERRORS IN LESS THAN 20% OF ITEMS
4=NO ERRORS
1=NOT APPLICABLE (NO ITEMS OF THIS -YPE)
2=ERRORS IN MORE THAN 20% OF ITEMS
3=ERRORS IN LESS THAN 20% OF ITEMS
4=NO ERRORS
2
27
Ea
Teather-Made Tests
28
Appendix B
TEACHER TESTING QUESTIONNAIRE
Please respond completely and truthfully to the following items.
Your responses will be confidential.
Name School
Grade level(s) you teach Subject(s) you teach
A. Rank order the following according to the relative emphasis you place on each in
evaluating student achievement in your classes. Assign "la to the most heavily
weighted measure. nu to the 2nd most important, etc.
Standardized tests
Teacher-made tests
Feedback obtained during instruction
Classroom participation and effort
Individual behavior (conduct)
Teacher-Made Tests
29
Appendix B (continued)
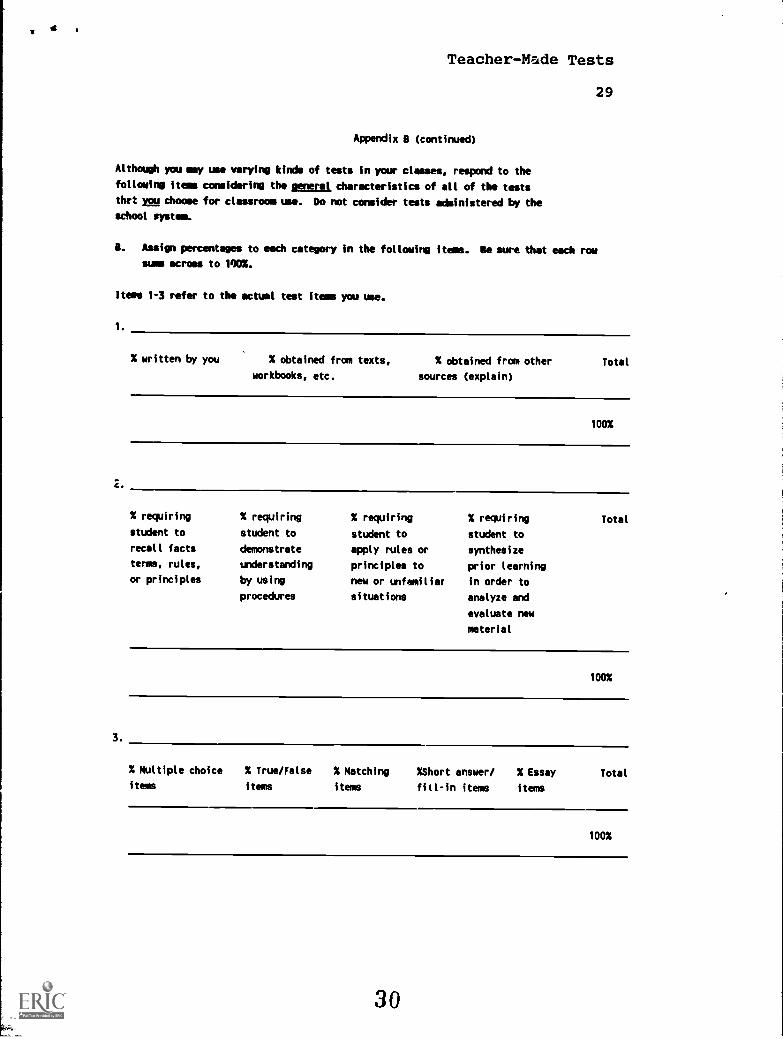
Although you may use varying kinds of tests in your classes, respond to the
following items considering the general characteristics of all of the tests
thrt ygg choose for clasennis use. Do not consider tests administered by the
school system.
D. Assign percentages to each category in the following items. Be sure that each row
sums across to 100X.
Item 1-3 refer to the actual test items you use.
1.
Z.
3.
X written by you % obtained from texts, X obtained from other
workbooks, etc. sources (explain)
Total
100%
X requiring X requiring
student to student to
recall facts demonstrate
terms, rules, understanding
or principles by using
procedures
X requiring
student to
apply rules or
principles to
new or unfamiliar
situations
X requiring
student to
synthesize
prior learning
in order to
analyze and
evaluate new
material
Total
100%
X Multiple choice X True/False X Matching
items items items
%Short answer/
fill-in items
% Essay Total
items
100%
30
Teacher-Made Tests
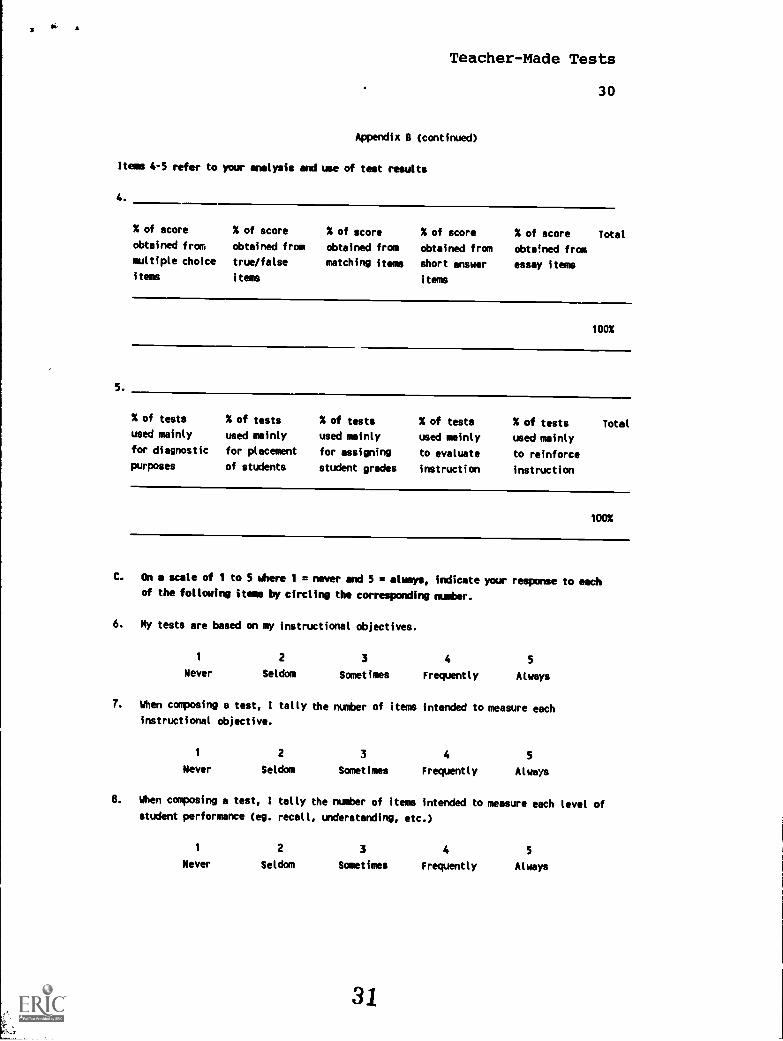
Appendix 8 (continued)
Items 4-5 refer to your analysis and use of test results
4.
5.
30
% of score
obtained from
multiple choice
items
% of score
obtained from
true/false
items
% of score
obtained from
matching items
% of score
obtained from
short answer
items
% of score Total
obtained from
essay items
100%
% of tests
used mainly
for diagnostic
purposes
% of tests
used mainly
for placement
of students
% of tests
used mainly
for assigning
student grades
% of tests % of tests Total
used mainly used mainly
to evaluate to reinforce
instruction instruction
100%
C. On a scale of 1 to 5 where 1 = never and 5 = always, indicate your response to eachof the following It by circling the corresponding number.
6. My tests are based on my instructional objectives.
1
Never
2
Seldom
3
Sometimes
4
Frequently
5
Always
7. When composing a test, I tally the number of items intended to measure each
instructional objective.
1
Never
2
Seldom
3
Sometimes
4
Frequently
5
Always
8. When composing a test, I tally the number of items intended to measure each level of
student performance (eg. recall, understanding, etc.)
1
Never
2
Seldom
3
Sometimes
4
Frequently
5
Always
Teacher-Made Tests
31
Appendix B (continued)
9. My tests are hand-written.
1 2 3 4 5
Never Seldom Sometimes Frequently Always
10. I include written instructions for each of the sections of my tests.
1 2 3 4 5
Never Seldom Sometimes Frequently Always
11. My students are informed of the point value of each item on my tests.
1 2 3 4 5
Never Seldom Sometimes Frequently Always
12. I complete an answer key for objective items before scoring my tests.
1 2 3 4 5
Never Seldom Sometimes Frequently Always
13. I write out an appropriate or desired response for each essay item before scoring
these items on i;ly tests.
1 2 3 4 5
Never Seldom Sometimes Frequently Always
14. Scores on my tests are adjusted for guessing.
1 2 3 4 5
Never Seldom Sometimes Frequently Always
15. I assign the point values of individual test items after correcting all tests.
1 2 3 4 5
Never Seldom Sometim's Frequently Always
16. I assign test grades based on how well students perform relative to others in the
group (normreferenced perspective).
1 2 3 4 5
Never Seldom Sometimes Frequently Always
32
a.
Teacher-Made Tests
2
Appendix B (continued)
17. I assign test grades based on mastery of content regardless of performance of others
in the group (criterion-referenced perspective).
1 2 3 4 5
Never Seldom Sometimes Frequently Always
18. I compute item analysis information for my tests.
1 2 3 4 5
Never Seldom Sometimes Frequently Always
19. I eliminate certain items in determining test scores.
1 2 3 4 5
Never Seldom Sometimes Frequently Always
20. 1 compute an arithmetic mean of the scores received by students for each test.
1 2 3 4 5
Never Seldom Sometimes Frequently Always
21. 1 review tests with students after administering and scoring them.
1 2 3 4 5
Never Seldom Sometimes Frequently Always
22. I use test results to identify student weaknesses.
1 2 3 4 5
Never Seldom Sometimes Frequently Always
23. 1 revise my instructional plans based on test results.
1 2 3 4 5
Never Seldom Sometimes Frequently Always
24. I assign remedial or supplemental work to individual students based on test results.
1 2 3 4 5
Never Seldom Sometimes Frequently Always
-,,
Teacher-Made Tests
33
Appendix B (continued)
D. On a scale of 1 to 5 Where 1 = strongly disagree and 5 = strongly agree, indicate
your response to each of the following items by circling the corresponding number.
25. 1 feel confident in my ability to construct valid and reliable tests.
1 2 3 4 5
Strongly disagree Disagree Not sure Agree Strongly agree
26. 1 feel confident in my ability to assess the reliability and validity of my tests.
1 2 3 4 5
Strongly disagree Disagree Not sure Agree Strongly agree
27. 1 received adequate pre-service training in testing and student evaluation.
1 2 3 4 5
Strongly disagree Disagree Not sure Agree Strongly agree
28. 1 received adequate in-service training in testing and evaluation.
1 2 3 4 5
Strongly disagree Disagree Not sure Agree Strongly agree
THANK YOU FOR YOUR PARTICIPATION!!!!
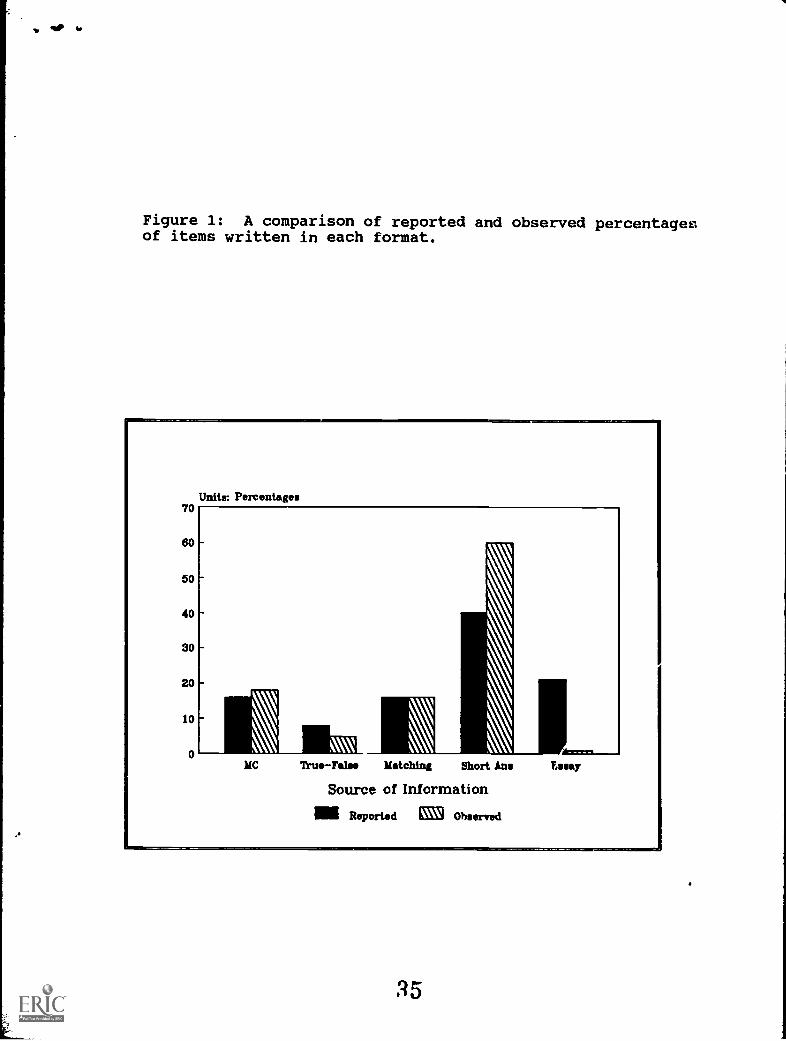
Figure 1: A comparison of reported and observed percentagesof items written in each format.
70
50
40
10
Units: Percentages
MC TrueFalse Matching Short Ans
Source of Information
MN Reported FM Observed
, 4
Figure 2: A comparison of reported and observed percentagesof items addressing each level of knowledge.
80
50
40
30
20
10
0
Units: Percentages
Knowledge Comprehension Appl/Anal Syn/Eval
Source of Information
OM Reported ESN Observed
N6


![Today’s webinar: Putting tests to test – on formative assessment … · 2020. 10. 22. · 0 [ Putting tests to test / 07.09.2020 ] Today’s webinar: Putting tests to test –on](https://img.pdfslide.us/doc/110x75/60ee44b4042e517036635a3f/todayas-webinar-putting-tests-to-test-a-on-formative-assessment-2020-10-22.jpg)