Embed Size (px)
Citation preview

ED 319 984
AUTHORTITLEINSTITUTION
REPORT NOPUB DATENOTE
AVAILABLE FROM
PUB TYPE
EDRS PRICEDESCRIPTORS
DOCUMENT RESUME
CE 054 968
Ross, Myron H., Ed.The Economics of Aging.Upjohn (W.E.) Inst. for Employment Research,Kalamazoo, Mich.ISBN-0-88099-032-585
140p.; Papers presented in a seminar series sponsoredby the Department of Economics, Western MichiganUniversity, 1983-84.
W. E. Upjohn Institute for Employment Research, 300South Westnedge Avenue, Kalamazoo, MI 49007 ($8.95paperback, ISBN 0-88099-032-5; $17.95 clothbound,ISBN 0-88099-033-3).
Books (010) -- Speeches/Conference Papers (150) --Reports - Research/Technical (143)
MF01 Plus Postage. PC Not Available from EDRS.Adult Development; Age Discrimination; *Aging(Individuals); *Economic Factors; Economics;*Economic Status; Gerontology; Health; Incentives;Independent Living; Inflation (Economics); OlderAdults; Old Old Adults; *Quality of Life; Retirement;*Retirement Benefits
IDENTIFIERS *Social Security
ABSTRACT
Papers included are as follows: "An Overview" (Ross);"The Outlook for Social Security in the Wake of the 1983 Amendments"(Bunnell); "The Economics of Aging: Doomsday or Shangrila?" (Schulz);"Retirement Incentives--the Carrot and the Stick. (Why No One Worksbeyond 65 Anymore)" (Quinn); "Inflation and the Economic Well-Beingof Older Americans" (Clark, Sumner); and "Over the Hill and Under theWeather: Age v. Health" (Berkowitz). (CML)
***********************************************************************Reproductions supplied by EDRS are the best that can be made
from the original document.****************r*****************************************************

U.S. DEPARTMENT OF EDUCATIONOnce of Educatronal Research and ImprovementE CATIONAL RESOURCES INFORMATION
CENTER (ERIC)
This document has been reproduced asreceived from the person or organizationonginating IL
C Minor changes have been made to improvereproduction Quality
Pants Otwew Or OpenOn3 stat ad mn PHs docu-
The OERI poseion or policymeet do not necessanty represent Moat
Economicsof
Aging"PERMISSION TO REPRODUCE THISMATERIAL IN MICROFICHE ONLYHAS BEEN GRANTED BY
dariLl,.,.TO THE EDUCATIONAL RESO ACESINFORMATION CENTER (ERIC):
Papers presented in a seminar seriessponsored by the
Department of Economicsat Western Michigan University
Myron H. RossEditor
1985
W. E. Upjohn Institute for Employment Research
2 BEST COPY AVAILABLE

Library of Congress Cataloging in Publication DataMain entry under title:
The Econcmics of aging.
1. AgedUnited StatesEconomic conditionsCongresses. 2. Social securityUnited StatesCongresses. 3. Old age pensionsUnited StatesCongresses. 4. Retirement incomeUnited StatesEffect of inflation onCongresses. I. Ross, Myron H.II. Western Michigan University. Dept. of Economics.HD57125.E27 1985 330.973'00880565 85-25470ISBN 0-88099-032.5 (pbk.)ISBN 0-88099-033-3 (hardcover)
Copyright © 1985by the
W. E. UPJOHN INSTITUTEFOR EMPLOYMENT RESEARCH
300 South Westnedge Ave.Kalamazoo, Michigan 49007
THE INSTITUTE, a nonprcfit research organization, was establishedon July 1, 1945. It is an activity of the W. E. Upjohn UnemploymentTrustee Corporation, which was formed in 1932 to administer a fu .(1 setaside by the late Dr. W. E. Upjohn for the purpose of carrying on"research into the causes and effects of unemployment and measures forthe alleviation of unemployment."
ii

The Board of Trusteesof ne
W. E. UpjohnUnemployment Trustee Corporation
Preston S. Parish, ChairmanCharles C. Gibbons, Vice Chairman
James H. Duncan, Secretary-TreasurerE. Gifford Upjohn, M.D.
Mrs. Genevieve U. GilmoreJohn T. Bernhard
Paul H. ToddDavid W. BrenemanRay T. Parfet, Jr.
The Staff of the Institute
Robert G. SpiegelmanExecutive Director
Saul J. BlausteinJudith K. Gentry
Phyllis R. BuskirkH. Allan Hunt
Timothy L. HuntLouis S. JacobsonRobert A. Straits
Stephen A. WoodburyJack R. Woods
iii
4

Acknowledgments
The Economics of Aging, the 19th of a seminar series produced by theDepartment of Economics of Western Michigan University, was madepossible by the contributions of many individuals and institutions. Weare extremely pleased to have the W. E. Upjohn Institute for Employ-ment Research and the College of Health and Human Services and theCollege of Arts and Sciences as co-sponsors of the series. In addition, theseries benefitted significantly from the contribution of the Seminar Com-mittee composed of Profcssors Phillip Caruso, Sisay Asefa and MichaelPayne of the Department of Economics. Finally, we owe thanks to Ms.Becky Ryder and Bonnie Kuminski of the secretarial staff of the Depart-ment of Economics for keeping the seminar on track.
Z'iv 0

CONTENTS
I An Overview 1
Myron H. RossWestern Michigan University
Financing Social Security
2 The Outlook for Social Security in theWake of the 1983 Amendments 11
Alicia MunnellFederal Reserve Bank of Boston
3 The Economics of Aging: Doomsday or Shangrila? 41James H. Schulz
Brandeis University
The Retirement Decision and the Welfare of the Elderly
4 Retirement Incentivesthe Carrot and the Stick(Why No One Works Beyond 65 Anymore) 57
Joseph F. QuinnBoston College
5 Inflation and the Economic Well-Beingof Older Americans 77
Robert Clark and Daniel SumnerNorth Carolina State University
Qualitative Aspects of Aging
6 Over the Hill and Under the Weather: Age v. Health ... 113
Monroe BerkowitzRutgers University
v

1An Overview
Myron H. RossWestern Michigan University
The purpose of this chapter is to comment on and give thegeneral flavor of the papers presented in the seminar on theEconomics of Aging given by the Department of Economicsof Western Michigan University during the academic year1983-84.
Munnell Schulz
Alicia Munnell provides an excellent account of the finan-cial outlook for the social security system over the next 75years. In retrospect she notes that the present day financialproblems of the system have come about because offorecasting errors with regard to demographics and theeconomy.
Munnell emphasizes that the key relationship is the growthof nominal wages relative to the growth of the price le Jel,i.e., the growth of real wages. Taxes depend mainly on thenominal wage level and social security ber.efits depend main-ly on the price level because benefits are indexed. Thus, ifnominal wages grow faster than the price level, taxes willgrow relative to benefits.
In addition, Munnell underscores the fact that small errorsin forecasting can have significant effects on how one viewsthe viability of the social security system. In general, shefinds that for the next 75 years the system will run surpluses.Munnell summarizes matters by asserting:
During the period 1990-2020, almost no uncertain-ties exist about the adequacy of social security
1
rii

2
financing. Even under the pessimistic mortality andeconomic assumptions the system will run surplusesuntil 2013 and have positive fund balances until2020.
She notes that even if the economy performs more poorlythan anticipated under the pessimistic assumption that realwages grow less than 1 percent, revenues will still be ade-quate to cover benefits.
Could there be problems of managing this surplus? Mun-nell indicates that Congress has three alternatives:
(1) reduce social security tax rates.(2) divert these surpluses to finance other programs.(3) let tax rate increases planned in 1990 take effect.
Suppose surpluses are generated in excess of expectationsand Congress does not reduce social security taxes or divertsurpluses to finance other programs. It is possible that thesurpluses generated may be so large that the trustees of thesystem (the Secretaries of Health and Human Services,Labor and Treasury) may be compelled to invest these fundsin private securities, rather than public securities. Whicheveralternative is chosen, there are potential problems.
If the trustees were to invest in privately held securities, itcan be asked how the trustees will do this without destroyingthe traditional boundary between the private and public sec-tors. It is not out of the question that such a policy mightresult in cabinet officers deciding which large corporationsto take over.
To give a rough order of magnitudes involved, for 1984benefits from OASI, DI, a: .1 HI totaled $221.3 billion. Sup-pose, not unrealistically, the trust fund were double benefits,or $442.6 billion. The trustees could then purchase aoout 15percent of the $3 trillion publicly held stock on the New York

3
Stock Exchange. By concentrating purchases of stock, thetrustees could obtain a controlling interest in some corpora-tions. If the trustees alternatively invested the surplus in theprivate bond market, the trustees may find that they have acontrolling interest in corporations that end up in bankrupt-cy, as the bondholders are converted to stockholders.'
If the annual surplus of $442.6 billion were totally investedin U.S. Treasury securities, the trustees v% ould be holdingabout 28 percent of the national debt. With a smaller percen-tage of the national debt held by the public and the bankingsystem, it would probably significantly diminish the powerof the Fedtral Reserve to control bank reserves via openmarket operations. In any event, the prospect of larger socialsecurity fund surpluses will not only change the social securi-ty system, but will also have a significant effect on the func-tioning of the economy.
In essence Munnell holds that the "crisis" in financing thesocial security system is almost entirely due to unforeseencircumstan esparticularly the economic malaise of the lastdecade, with its low and declining growth rates, reduced pro-ductivity levels and high unemployment rates.
Schulz emphasizes that there is little payoff if we merelyshift from social security to private pensions. He emphasizesthat social security developed as a result of the failure ofalternatives. In one sense, the development of social securitywas hardly revolutionary, since prior to World War II wealready had an informal pay-as-you-go system wherebyfamily members took care of the elderly. This informalprivate system, because of its shortcomings, gave way to thepresent social security system.
There is reason to believe that we need diversity of old ageprovisions, private as well as public. Ifwe think of the provi-sion for old age as an investment problem, then our aim is to
9

4
minimize risk by minimizing the variance around the meanretirement income, for a given return. This would call fordiversification. That is, the variance for (say) a single publicsystem of social security would be higher than a combinedpublic and private system, as long as the returns from thetwo systems are independent. If the returns from private andpublic pension plans are negatively correlated, then theoverall variance will be reduced further. Perhaps thisnegative relationship may have held during the last decade.With high rates of inflation the public social security benefitsimproved because of the upward bias in the consumer priceindex, while the private pension benefits worsened becauseof the lack of indexing. Thus in real terms the returns fromprivate and public benefits appear to have moved in oppositedirections.
This relationship may be changed if the U.S. Treasurywere to issue (as the British Treasury does) a fully indexedbond. This would protect the individual against inflation andput private pensions on a par with public pensions when itcomes to indexing.
Clark-Quinn
Clark makes the fundamental point that the elderly are nomore vulnerable to inflation than the rest of the population.The converse is a common and erroneous conclusion basedon the argument that the elderly live on fixed incomes. Clarkputs the problem in perspective when he says,
Real income from current assets depends on therate of return ompared with the change in prices.The elderly experience inflation effects differentfrom others only if the makeup of their portfoliosdiffers.
Empirical support for Clark's conclusion is found in the factthat in 1982, coming after years of double-digit inflation, the
1 0

5
percentage of the elderly poor was less than the percentage ofthe general population which were poor.
These results must be handled cautiously, because Clarkdepends on the consumer price index to deflate incomes.Clark recognizes that the CPI has an upward bias, thoughthere is considerable controversy as to the magnitude of theupward bias. Not only is the CPI biased upward because it isa Laspeyre index, but it also fails to take into account thefact that the elderly receive a wide range of discounts inmany restaurants, motels, movies, pharmacies, etc. In fact,one of the most important discounts is given by the tax col-lector, with the federal government providing for a doubleexemption under the personal incoirx tax regulations. In ad-dition, many states, such as Michigan; have a "circuitbreaker" which limits the increase in property taxes.
If these discounts in favor of the, elderly developed in ashort period of time, they would have no effect on changes inthe relative status of the elderly. However, if the discountsdeveloped graduallyand this seems to be the casetheywould bias the year-to-year changes in the relative status ofthe elderly.
The red thread running through Quinn's presentation isthat incentives to retire at age 65 are quite strong. If a workerdoes not retire at age 65, "social security and employer pen-sions impose pay cuts. . . . Many older workers respond ex-actly how you might expect to pay cutsthey stop workingand retire." These paycuts are not direct reductions of thepaycheck. Rather, the paycuts involve a reduction in thewealth of the worker.
Quinn believes that workers' perceptions with regard tohow the social security system operates are reasonably ac-curate. Workers' behavior suggests that they have calculatedthe benefit-cost ratio of retiring. By taking the net presentvalue of future income streams, Quinn demonstrates that it
11

pays to retire. The cost is the loss of social security benefitsfor one year; the benefits are the increase in future benefitsassociated with delayed retirement. Put differently, the in-dividual has a choice between two income streams, one thatbegins immediately to pay social security benefits andanother which is delayed for one year. Most frequently, theformer stream is preferred to the latter stream, and workersbehave rationally by retiring.
Quinn notes that because the actuarial adjustment inbenefits is to increase from the current 1 percent to 7 percent,beginning in 1990, for each year of delayed retirement, thedisincentives for working will be significantly diminished,and later retirement should occur.
Berkowitz
Berkowitz raises in bold relief the difference betweenchronological age and functional age. Since functional age ismore difficult to determine than chronologicaleventhough the former is more important than the latterthere is"statistical" age discrimination when firms assume a closecorrelation between functional and chronological age. Firmsare inclined to use chronological age as a proxy for determi-ing functional age.
But if we discard the use of chronological agewhich isdefinite and objectivewhat alternative criteria are there?Berkowitz spells out the many difficulties involved in deter-mining functional age in workers' compensation cases and inthe disability program under social security. He notes that,,
. . . nothing in the disability experience provides any aid orcomfort to those who allege that we should eliminate com-pulsory retirement and judge persons by their ability to dothe job."
Berkowitz cites experience with workers' compensation inFlorida and Michigan. The Michigan experience is par-
12

ticularly illuminating. In Michigan, many workers whoretired from automobile plants simultaneously filed a claimfor workers' compensation. Berkowitz makes it clear that nostate program has a perfect solution to the workers' compen-sation problem.
Other problems in determining functional age are il-lustrated by the operation of the disability program underthe social security system. For one thing, the law is written sothat a worker is considered either disabled or not disabled.No allowance is made for partial disability. This problem isparticularly acute in the case of disability resulting frommental illness. Diagnosis of mental disability is difficult andthe worker may often appear able fcr an extended period oftime and yet suffer severe mental problems at other times.
Berkowitz points out that we are uncertain whether the in-crease in mortality increases morbidity or whether increase inmortality decreases morbidity. Thus at the present time wehave no firm empirical evidence regarding the link betweenmortality and morbidity. Finally, if we were to abolish com-pulsory retirement, we would need, according to Berkowitz,a better measure of functional limitation. He concludes:
. . . the argument for abolition of compulsoryretirement centers around the notion thatchronological age is irrelevant. The sword cuts bothways. Some older people are competent past theage of retirement and some younger people are in-competent prior to the age of retirement.Eliminating compulsory retirement means that wehave to get serious about tests of performance foryounger workers.
A general comment should be made in conclusion. Inmuch of the discussion and analysis of the social securitysystem during the seminar and at other times, it is recognizedthat changes in the economy will have a significant ;mpact on

8
the social security system. However, it is not alwaysrecognized (or at least it is poorly recognized) that changes inthe went security system's functioning will have an impacton the . -,onomy. The social security system is not akin toAlfred Marshall's fish market, because income effects loomlarge. To get some perspective on this problem of mutualcausation, let us examine a fairly simple illustration.
What is the impact of an increase in social security, benefitson the surplus of the social security system? To answer thisquestion it is necessary to utilize a standard macro model.The surplus (S) is the difference between tax revenues andbenefits paid out. Tax revenues are endogenous, equaling theproduct of the social security tax rate and the level of real na-tional income (tY). Benefits (B) are considered to be ex-ogenous. Thus we have,
S=tY - BdS/dB = t(dY/dB) - 1
If there is significant unemployment, the benefitmultiplier, dY/d13, might be as high as two, i.e., a one dollarincrease in benefits will be associated with a two dollar in-crease in national income. This also signifies that the surplusin the social security system will not fall by one dollar forevery dollar increase in benefits. Rather, assuming a tax rateof 0.10 and using the above equation, the surplus willdecrease by eighty cents for a dollar increase in benefits.Thus,
dS/dB = .10(2) - 1=-O.8
Some qualifications to this result should be noted. Withthe economy operating close to full employment, much ofthe increase in benefits will tend to crowd out other expen-ditures, or may be spent in price level increases rather thanincreases in real income. The dY/dB would then be in theneighborhood of zero and dS/dB would be equal to minus
14

9
one. At the other extreme it should be noted that it is possi-ble to postulate a reasonable model where dS/dB is positive.By "reasonable" it is meant that the model is stable, and in-vestment is not only a function of the interest rate, but alsothe income level. By the same reasoning, it may be concludedthat a one dollar increase in social security taxes will not in-crease the surplus by one dollar, since the tax increase willtend to decrease real national income.
There are many other problems which focus upon themutual causation of social security and the economy. For ex-ample, to take a long run problem, does a change in socialsecurity taxes change the growth rate of national income, ordoes it change the level of national income. The conclusionswill vary depending upor what growth model is consideredrelevant. These questions, however, are topics for anotherseminar.
NOTE
1. Some of these issues are raised by Stuart Street, "A Looming FederalSurplus," Wall Street Journal, March 28, 1984, p. 23. Peter Druckerllso discusses similar problems with regard to private pension funds inThe Unseen Revolution (Harper and Row, 1976).
.1 cJ

The Outlook for Social Securityin the Wake of the1983 Amendments
Alicia H. Munnell*Federal Reserve Bank of Boston
Twice during the last ten years, social security's financialproblems have thrust the system onto the front page ofnewspapers and the cover o weekly magazines. Questionswere raised about the progra..._ s ability to continue to paybenefits and some observers predicted the system's imminent"bankruptcy." Yet now, only a year after the peak of thewhoopla, the social security program is out of the headlinesand few question its financial soundness. This seems like anappropriate time to explore what led to the recent financialcrises, how the changes enacted in 1983 restored financialbalance according to the intermediate assumptions of thesystem's Board of Trustees, and what are the major areas ofuncertainty that necessarily attend any estimates of incomeand expenditures over a 75-year period.
I. The Social Security Program Today
The social security system consists of three programsfinanced through separate trust funds. The Old-Age andSurvivors Insurance (OASI) program, which pays benefits toretired workers, their dependents and survivors, is the largestprogram and will dispense $158 billion in benefits to 32million beneficiaries in 1984 (see Table 1). The Disability In-surance (DI) program, which awards benefits to disabledworkers and their dependents, will pay $17 billion to roughly4 million beneficiaries in 1984. The third program, HospitalThe author would like to thank Robert M. Ball and Robert J. Myers for valuable com-ments.
11
IC

Table 1Benefits, Benlficiaries and Trust Fund Reserves under Old-Age and Survivors Insurance (OASI),
Disability Insurance (DI) and Hospital Insurance (HI), Selected Years, 1950-1984
Benefits Beneficiariesa(S billions) (millions) Trust fund
reservescYear OASI DI HI Total OASI DI Total HIb ($
1950 1.0 - - 1.0 2.9 - 2.9 - 13.7
1960 10.7 0.6 - 11.3 13.7 0.5 14.2 - 22.6
1970 28.8 3.1 5.1 37.0 22.6 2.6 25.2 20.4 41.3
1980 105.1 15.5 25.1 145.6 30.4 4.7 35.1 27.6 40.1
1984- 158.2 17.2 45.9- 221.3- -32.5- 3.9 36.4 29.8 38.3d
SOURCE: Social Security Administration, 1983 Annual Report of the Board of Trustees of the Federal Old-Age and Survivors Insurance andDisability Insurance Trust Funds (Government Printing Office, 1983), Table 20, p. 60, Table 22, p. 64, Table 28, p. 75,Table A3, p. 93, TableA4, p. 95; 1983 Annual Report of the Board of Trustees of the Federal Hospital Insurance Trust Fund (GPO, 1982), Table 6, p. 31; and datafrom Office of the Actuary and Division of Medicare Cost Analysis.
a. Beneficiaries with monthly benefits in current-payment status as of June 30th.
b Includes both aged and disabled eligible individuals. As of July 1, 1973 hospital insurance protection was extended to disabled persons whohad been on the disability rolls for 24 months.
c. Reserves in OASI, DI and HI trust funds at end of period.d. Estimated by Office of the Actuary, November 16, 1983, using Intermediate Assumption II-B.

13
Insurance (HI), pays benefits to individuals covered byOASDI and the Railroad Retirement program. Benefitpayments from this fund will amount to $46 billion in 1984.Must HI beneficiaries also participate in the voluntary Sup-plementary Medicai Insurance (SMI) program. The follow-ing discussion will center primarily on the Old-Age, Sur-vivors, and Disability portion of the program, since this wasthe area addressed by the National Commission on SocialSecurity Reform and subsequently by Congress in itsdeliberations on the 1983 Amendments.
The social security system is financed on a pay-as-you-gobasis. The 120 million active workers and their employerspay taxes to finance the benefits for the 36 million retiredand disabled workers and their dependents and survivors.The idea is not to build up a large reserve from whichbenefits will be paid, but rather to accumulate sufficientfunds to provide a buffer against brief, unanticipatedeconomic fluctuations. At one time it was thought that areserve equal to one year's benefits would be appropriate,but since 1970 the trust funds have held substantially lessthan that amount.
Generally, the smallness of trust fund reserves should notbe a source of concern in a social insurance program as itwould in a private insura..ice plan. Because private plans can-not be certain of receiving future premiums, they must haveadequate funding procedures to meet all prior and currentcommitments. In contrast, the social security system is amandatory and permanent program which can rely on thegovernment's taxing power to meet its obligations and canlevy taxes on successive generations of workers to pay forretirement, disability, and hospital benefits. Thus, thesystem has evolved into a compact between generations, eachgeneration depending on the next one to finance promisedbenefits.

II. Reasons for the Financial Problems
Pay-as-you-go financing, however, makes the financialstatus of the social security system sensitive to economic anddemographic developments. Short-run problems can arise ifeconomic fluctuations adversely affect receipts or outlaysand contingency reserves are not adequate to cover theresulting deficits. Long-run financing problems can arise ifthe size of the beneficiary population increases relative to heworking-population-and- the-full extent of -this shift -has-notbeen taken into account in the financing provisions.
In 1983, the social security system faced both of these dif-ficulties. The system was confronted with an immediateshort term cash flow problem and a conceptually distinctlong-run imbalance between revenues and outlays. Theshort-run difficulties were almost entirely the result of theunanticipated poor performance of the economy during the1970s, while the long-run deficits were primarily attributableto projected cost increase associated with the rising ratio ofbeneficiaries to covered workers after the turn of the cen-tury.
Short-Run Financial Difficulties. The year 1972 is a usefulpoint from which to trace the origins of the short-run finan-cial cirses, since legislation passed in that year introduced anew social security financing and benefit schedule. For thefirst time, benefits would be adjusted automatically to keeppace with inflation and the taxable wage base would increaseeach year to reflect the growth in average wages. Inretrospect, the 1972 legislation contained two problems.
The first was a flaw in the indexing procedure which,under assumptions of high future inflation rates, caused thereplacement rate (the ratio of benefits to preretirement earn-ings) to increase over time. The second was a forecasting er-ror which resulted in tax rates that were based on overly op-
19

15
timistic economic assumptions. Essentially, the social securi-ty Trustees assumed that the economy in the 1970s wouldoperate at roughly the level experienced during the 1960s. Apay-as-you-go system with automatic indexing provisions isvery sensitive to economic conditions, particularly to therelationship between the rate of price increase and the rate ofwage growth. Tax revenues vary with the growth of wages,while benefits rise with increases in the consumer price index.
In order to understand the sensitivity of the social securitysystem tG forecasting errors, consider the effect on a trustfund (equal to one year's outgo) of first overestimating thegrowth of wages by 2 percentage points.' If wages grow by 2percentage points less than projected, payroll tax revenueswill fall 2 percent short of the anticipated level and, wherebalance had been predicted between revenues and expen-ditures, a 2 percent shortfall will emerge. This shortfall willbe covered by drawing down trust fund reserves and thereserve ratio (the ratio of reserves on hand to annual expen-ditures) will fall by 2 percentage points from the leveloriginally projected. Even if wages grow in all subsequentyears by the rate forecasted, the level of average wages, andhence tax revenues, will continue to be 2 percent lower thanprojected. The revenue-expenditure gap will never close, andin each subsequent year the 2 percent shortfall will require atransfer from the trust fund, causing the fund ratio to beanother 2 percentage points lower than projected. In otherwords, after four years the one-shot error in forecastingwage growth will cause the trust fund ratio to be 8 percentagepoints lower than projected.
Should the forecasting error persist, that is, actual wagegrowth continue to fall below projected growth for severalyears, then the financial health of the program deterioratesfar more rapidly. The social security actuaries havedeveloped a simple rule of thumb that relates the C ifference
20

between the actual and projected reserve ratio ( A RR) in agiven year (n) to the forecasting error (ERR) in each year (t):
n
A RR = I (n-4-1)) ERRtt 1
According to this rule, a persistent 2 percentage pointdiscrepancy between actual and projected wage growthreduces the reserve ratio by 2 percentage points after oneyear, 6 points after two years, 12 points after three years and20 points after four years.
On the other hand, if the error is one of overestimating theinflation rate by 2 percentage points, benefits, which are in-dexed to inflation, will be 2 percent less than projected.Thus, a one-shot error in forecasting inflation will allow thetrust fund to increase each year by roughly 2 percentagepoints, while a persistent error will allow the trust fund to in-crease by 2, 6, 12 and 20 percentage points after the first, sec-ond, third and fourth year as discussed above.
As you can see, a 2 percent error in forecasting both wagegrowth and inflation would have largely offsetting effectsand virtually no impact on the financial status of the pro-gram. In contrast, overestimating wage growth andunderestimating inflation each by 2 percent would have adevastating effect on trust fund reserves. Hence, the keyrelationship is not the level of wage growth and inflation, butthe difference between the rate of growth of wages and therate of increase in prices. This number is generally referredto as the real wage differential.2
When the new tax and benefit schedules were establishedin 1972, it was assumed that the real wage differential wouldreturn to the trend rate of growth set in the 1960s (see Table2). That .s, the social security revenue and outlay projectionswere based on a real wage differential of 2.25 percent peryear. Under this assumption, the reserve ratio would have re-
-im

17
mained fairly steady at 30 percent. Over the next five years,however, that is, from 1973 to 1977, the real wage differen-tial actually averaged -0.3 percent rather than 2.25 percent.Primarily because of this difference, social security began torun annual deficits, which required annual transfers fro,'the trust fund, so that by 1977 the reserve ratio had fallen 4.less than one-half of the projected 80 percent.'
Table 2Annual Percent Change in Prices and Average Covered Wages,
Real Wage Differential and OASDI Reserve RatioSelected Periods, 1950.1982
Year
Annual percent changeReal wagedifferentiala
(percent)
OASDIreserve ratio
end ofperiodb
Coveredwages
Consumerprices
1950-59 5.1 2.1 3.0 180
1960-64 3.4 1.3 2.1 110
1965-69 5.4 3.4 2.0 103
1970-72 5.7 4.5 1.2 80
1973-77 7.4 7.7 -.0.3 37
1978-82 8.0 9.7 1.7 7c
SOURCE: Social Security Administration, Office of the Actuary, 1983 Annual Report ofthe Board of Trustees of the Federal Old-Age and Survivors Insurance and Disability In-surance Trust Funds (GPO, May 1983), Table 10, pp. 37-38 and Table 14, p. 51; and SocialSecurity Bulletin, Annual Statistical Supplement, 1982 (GPO 1982), Table 16, p. 21.a. The difference between the percentage increase in average atu,,tal wages and the percen-tage increase in the annual CPI.
b. The ratio of reserves on hand at the end of one year to total expected expenditures thenext year.
c. Excludes reserves borrowed from HI trust fund.
Legislation passed in 1977 dramatically revised the socialsecurity financing and benefit provisions in order to restorebalance to the program. However, once again the taxschedule was set on the assumption that historical rates of
22,

18
real wage growth would reappear, that is, that the real wagedifferential would averaged roughly 2.0 percent from 1978through 1982. After 1977, however, the rate of price increaseexceeded the rate of earnings growth producing persistentnegative real wage differentials that averaged -1.7 percentover the 1978-82 period. With inadequate revenues, thesystem once again began to run annual deficits that resultedin a rapid decline in trust fund reserves, leading to the needfor financing changes in 1983.
Long-Run Problems. Social security's long-run financingproblems began to appear after 1973, when the social securi-ty actuaries started to incorporate developing demographictrends into the long-run projections. In the next few years,the projected 75-year deficit worsened steadily as the flaw inthe indexing provision and high forecasted :nflation ratescaused continuing increases in projected replacement rates.The 1977 legislation stabilized replacement rates and therebysubstantially reduced the long-run deficit (from 8.2 percentof taxable payrolls to 1.4 percent), but further revisions indemographic assumptions and lowered real wage growthprojections after 1977 forced the 75-year deficit to increasegradually to a level of 1.82 percent of taxable payrolls by1982. Thus, both demographic and economic factors deter-mine the long-run financial status of the social security pro-gram.
The demographic factors are important because theydetermine the number of people who will be receivingbenefits as compared to the number of workers who will bepaying taxes. In the case uf those people already born, thekey demographic variable is the mortality rate. Althoughmost of the startling gains in life expectancy during this cen-tury are attributable to a substantial reduction in neonatalmortality and diminution of childhood diseases, the life ex-pectancy of older persons has also increased significantly.
2 00
19
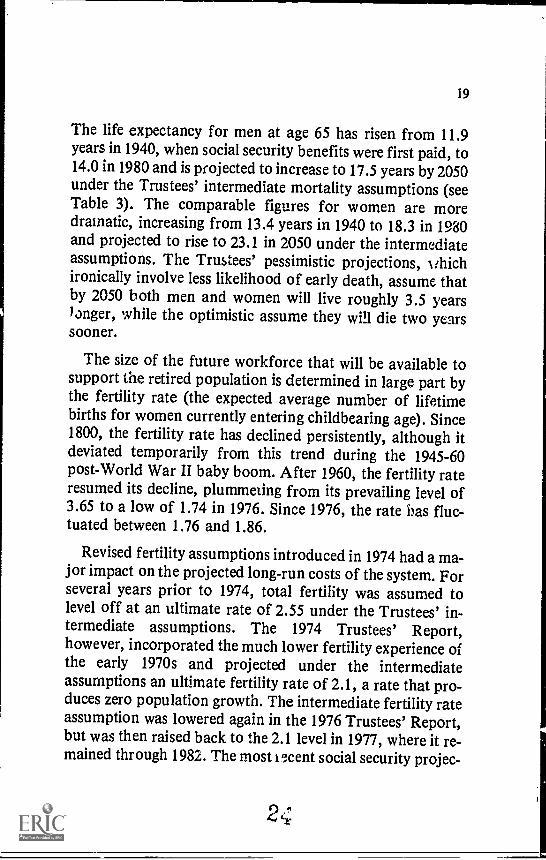
The life expectancy for men at age 65 has risen from 11.9years in 1940, when social security benefits were first paid, to14.0 in 1980 and is projected to increase to 17.5 years by 2050under the Trustees' intermediate mortality assumptions (seeTable 3). The comparable figures for women are moredramatic, increasing from 13.4 years in 1940 to 18.3 in 1980and projected to rise to 23.1 in 2050 under the intermediateassumptions. The Trustees' pessimistic projections, t,hichironically involve less likelihood of early death, assume thatby 2050 both men and women will live roughly 3.5 yearslonger, while the optimistic assume they will die two yearssooner.
The size of the future workforce that will be available tosupport the retired population is determined in large part bythe fertility rate (the expected average number of lifetimebirths for women currently entering childbearing age). Since1800, the fertility rate has declined persistently, although itdeviated temporarily from this trend during the 1945-60post-World War II baby boom. After 1960, the fertility rateresumed its decline, plummeting from its prevailing level of3.65 to a low of 1.74 in 1976. Since 1976, the rate bas fluc-tuated between 1.76 and 1.86.
Revised fertility assumptions introduced in 1974 had a ma-jor impact on the projected long-run costs of the system. Forseveral years prior to 1974, total fertility was assumed tolevel off at an ultimate rate of 2.55 under the Trustees' in-termediate assumptions. The 1974 Trustees' Report,however, incorporated the much lower fertility experience ofthe early 1970s and projected under the intermediateassumptions an ultimate fertility rate of 2.1, a rate that pro-duces zero population growth. The intermediate fertility rateassumption was lowered again in the 1976 Trustees' Report,but was then raised back to the 2.1 level in 1977, where it re-mained through 1982. The most i ....cent social security projec-
4gx
1
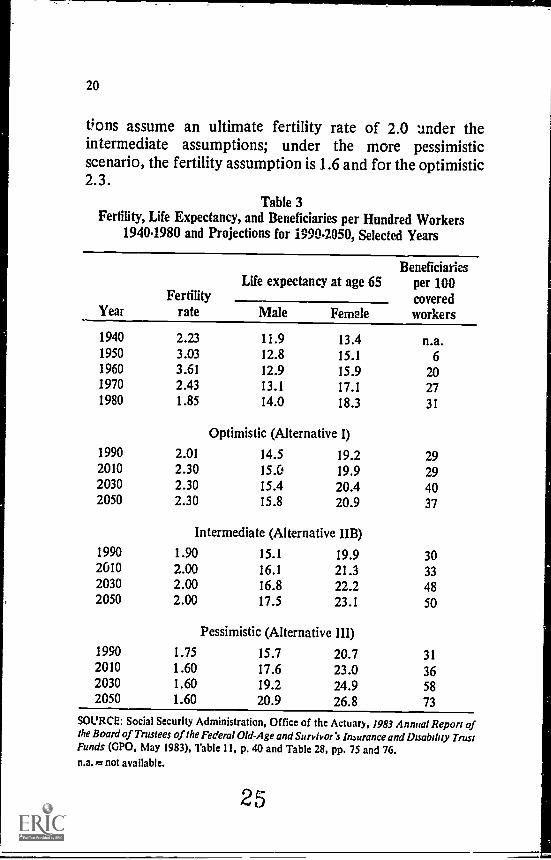
20
Lions assume an ultimate fertility rate of 2.0 under theintermediate assumptions; under the more pessimisticscenario, the fertility assumption is 1.6 and for the optimistic2.3.
Table 3Fertility, Life Expectancy, and Beneficiaries per Hundred Workers
1940.1980 and Projections for 1990.2050, Selected Years
YearFertility
rate
Life expectancy at age 65Beneficiaries
per 100coveredworkersMale Female
1940 2.23 11.9 13.4 n.a.1950 3.03 12.8 15.1 61960 3.61 12.9 15.9 201970 2.43 13.1 17.1 271980 1.85 14.0 18.3 31
Optimistic (Alternative I)
1990 2.01 14.5 19.2 292010 2.30 15.0 19.9 292030 2.30 15.4 20.4 402050 2.30 15.8 20.9 37
Intermediate (Alternative 11B)1990 1.90 15.1 19.9 302010 2.00 16.1 21.3 332030 2.00 16.8 22.2 482050 2.00 17.5 23.1 50
Pessimistic (Alternative III)1990 1.75 15.7 20.7 312010 1.60 17.6 23.0 362030 1.60 19.2 24.9 582050 1.60 20.9 26.8 73
SOURCE: Social Security Administration, Office of the Actuary, 1983 Annual Report ofthe Board of Trustees of the Federal Old-Age and Survivor's Insuranceand Disability TrustFunds (GPO, May 1983), Table 11, p. 40 and Table 28, pp. 75 and 76.n.a.= not available.
25

21
The seemingly small differences in the fertility and mor-tality rates that are incorporated into the alternative projec-tions produce dramatic differences in the ratio ofbeneficiaries to workers when compounded over a longperiod of time. The intermediate demographic assumptionsimply that the number of beneficiaries per hundred workerswill increase from 30 in 1984 to 50 by the year 2050; thelower fertility and longer life expectancy incorporated in thepessimistic assumptions produce 73 beneficiaries for eachhundred workers, while the higher fertility and greater mor-tality in the optimistic assumptions imply 37 beneficiaries perhundred workers. With a pay-as-you-go system, an increasein the beneficiary/worker ratio implies an proportional in-crease in costs as a percentage of payrolls.
Long-run cost increases due to demographic shifts couldbe offset, however, by greater productivity on the part of theworking population. The difficulty has been that the increas-ingl! adverse demographic projections have been accom-panied by steadily worsening economic assumptions. Theprojected real wage differential has been reduced severaltimes from 2.25 percent in 1973 to the present projection of1.5 percent, reflecting the low levels of productivity growthexperienced during the 1970s. With only modest projectedincreases in productivity, a consensus emerged that currentfertility and mortality trends would result in a significant in-creasr in social security costs and that additional fundswo.;.'sd be required to finance the program in the twenty-firstc.:ntury.
III. The Social Security Amendments of 1983
In response to the continuing deterioration in both theshort- and long-run financial position of the social securitysystem and the inability of Congress to agree upon a solu-tion, President Reagan in December 1981 established abipartisan National Commission on Social Security Reform.
2CC
I

22
After more than a year of debate, the Commission finallyproposed a delicately balanced package of tax increases,benefit cuts, and extension of coverage, which was projectedto produce $166 billion between 1983 and 1990. Thesechanges also eliminated two-thirds of the long-run deficitthat was projected under the intermediate assumptions toarise., after the turn of the century as the baby boom starts toretire (see Table 4). In the process of adopting the Commis-sion's recommendations, Congress also introduced an exten-sion of the normal retirement age to close the remaining gapbetween outlays and expend...tires over the next 75 years.Several other provisions were also adopted in an attempt tostabilize the financing of the system and prevent repeatedshort term crises.
Short-Run Impact: 1983-1989. The two largest producersof additional short-term revenues, each contributing nearlyone-quarter of the total increase over the 1983-1989 period,were the proposals to delay for six months the automaticcost-of-living adjustment on retirement and disabilitybenefits' and the provision to accelerate the OASDI payrolltax rate increases that were already scheduled to take effectin 1985 and 1990.5 Another major contributor to thesystem's finances, accounting for roughly 15 percent of thetotal short-run revenues produced by the legislation, was theproposal to tax 50 percent of social security benefitsthehalf that is generally associated with the employer's share ofthe payroll taxfor higher income recipients and to directthe new receipts to the OASDI trust funds.6
The legislation produced another 10 percent of the short-run revenue increases by increasing the tax rate for self-employed people. While in the past the self-employed havepaid taxes equal to about 75 percent of the combinedemployee and employer contributions for OASDI and 50percent for HI, under the new legislation they will pay 100percent of the combined employee-employer rate. In order to
27

23
allow for the portion of the self-employed tax that cor-responds to the employer's share, the self-employed will beallowed to deduct one-half their payroll tax liability for per-sonal income tax purposes.'
Table 4Projected Cost Impact on the OASDI Program
of the 1983 Social Security Amendments
Cost impact
CF1983-1989(S billions)
Long-term(% of payroll)
Benefit reductions/tax increases1. Delay COLA from July to January 39.4 0.302. Accelerate scheduled rate increases 39.4 0.033. Tax 50% of OASDI benefits for
higher-income people 26.6 0.614. Increase tax rate for self-employed 18.5 0.19
Coverage extension5. Cover all nonprofit employees
and new federal workers 21.8 0.386. Ban withdrawal of state/local employers 3.2 0.06
Other7. Payment from general revenues for military service
credits and uncashed checks 17.7 0.018. Benefit changesa -0.4 -0.13
Total 166.2 1 .38b
Extension of retirement age 0.71
Total 166.2 2.09
SOURCE: Social Security Administration, Office of the Actuary, 1983 Annual Report ofthe Board of Trustees of the Federal Old-Age and Survivor's Insurance and Disabduy TrustFunds (GPO, May 1983); and unpublished data.
a Benefit changes include the following. Eliminating windfall benefits for persons withpensions from noncovered employment, continuing benefits for remarried disabledwidow(er)s and for divorced widow(er)s, indexing deferred widow(er)'s benefits based onthe lesser of wages and prices; permitting divorced aged spousc to receive benefits whenhusband is eligible; and increasing benefit rate for disabled widow(er)s aged 50-59 to 71.5percent of primary benefit. Also included in this figure, however, is SI billion increase inrevenue that results from accelerating state and local tax collections.
b. Total effect of reforms on trust funds as percent of payroll is not the sum of individualpercentages. Rather the total reflects the interaction of individual reforms upon oneanother, including the following additional reforms. taxation of certain salary plans, alter-ing of the earnings test and adjustment of self-employment income.

24
Roughly 15 percent of the total increase in short termrevenues was gained from extending coverage to new federalemployees and the uncovered workers in the nonprofit sec-tors and from banning future withdrawals of state and localemployers.' The remaining 10 percent of short term revenuescame from the proposal to make a payment from generalrevenues to the OASDI trust funds to compensate the systemfor gratuitous military service wage credits granted before1983 and to provide reimbursement for social security checksissues but never redeemed."
The Long Run and Extension of the Retirement Age. Inaddition to raising a projected $166 billion over the period1983-1989, the National Commission's proposals enacted inthe 1983 Amendments eliminated two-thirds of the 75-yeardeficit." Although the Commission members who had votedin favor of the consensus package had agreed that the longrange deficit should be reduced to approximately zero, theywere unable to agree on a specific proposal to accomplishthis. Members selected by the Democratic leadership sup-ported an increase in contribution rates in 2010 (about 0.5percent of earnings for the employee and a like amount forthe employer), while the remaining designees favored agradual increase in the retirement age.
Congress opted for extending the retirement age as ameans of eliminating the long-run deficit. As a result of the1983 Amendments, the retirement age will rise to 66 by 2009,then to 67 by 2027.12 People can still elect early retirement at62, but benefits paid to early retirees will be reduced by 25percent in 2009 and by 30 percent in 2027. Early retirees arecurrently penalized 20 percent. Raising the retirement agereduces long-run costs by 0.71 percent of taxable payrolls,thereby creating a small surplus in the OASDI program overthe 75-year projection period under the intermediateassumptions.
29

Revenue Stabilizers. The 1983 Amendments also contain-ed three provisions designed to improve the system's abilityto continue paying benefits on a timely basis even duringadverse economic conditions. These include a speed-up inmonthly transiers from the Treasury, an extension of inter-fund borrowing, and a revised indexing procedure.
Normalizing Transfers: To protect against potential cashflow problems created by the uneven way in which benefitsare paid and taxes are transferred to social security, Con-gress introduced a revised procedure for crediting taxes tothe trust funds. Under the previous procedures benefits werepaid on the third of the month, creating the need for highbalances in the OASDI trust fund during the first week.Taxes, however, were transferred to the trust funds daily,based on Treasury estimates of amounts collected. Under therevised procedure, the Treasury is authorized to estimateamounts to be collected in a given month and transfer suchsums to the trust funds on the first or second day of themonth. This technical procedure will help ensure that thecash is available at the time benefit payments are made.
Extending Interfund Borrowing: Amendments to the Om-nibus Reconciliation Act, passed on December 29, 1981,authorized borrowing through December 1982 among theOASI, DI, and HI trust funds to finance deficits up to June1983. The OASI fund borrowed $17.5 billion from the otherfunds ($5.1 billion from DI and $12.4 billion from HI) inNovember and December 1982 in order to ensure benefitpayments through June 1983. The 1983 Social SecurityAmendments extended the authority for interfund borrow-ing for calendar years 1983-1987 with the provision that allprincipal and interest be paid by the end of 1989.'3
Revising the COLA: As noted above, the short term fi-nancing problem in social security was entirely the result ofthe unanticipated poor performance of the economy during
30

26
the past few years. Tax rates were set on the assumption thattaxable wages would grow at the rate of increase in pricesplus an additional amount for productivity growth. After1977, however, the traditional relationship between priceand wages was reversed and price increases exceeded wagegrowth. With prices rising faster than wages, benefits, whichare linked to the consumer price index, increased faster thanpayroll tax revenues, which are dependent on the growth inwages. As a result, trust fund balances were rapidly depleted.
In an attempt to avoid this problem in the future, Con-gress established that if OASDI reserves ever drop below 15percent (20 percent beginning in 1989) of the following year'splanned outlays, the automatic cost-of-living adjustmentwould be based on the lower of the CPI increase or the in-crease in average wages until the trigger ratio is restored.Subsequently, when the reserves reach 32 percent of outlays,benefits would be adjusted to make up for any payments thatwere less than those called for by the price adjustnnnt. Thepayback would occur only so long as reserves met the 32 per-cent standard. This change will help avoid a repetition of therecent short-run financial 'isis.
IV. Some Uncertainties
With any luck in terms of the performance of the economyand demographic developments, the financial packageenacted in the 1983 Amendments should ensure the solvencyof the retirement and disability programs for the next 75years. The need for luck, however, highlights the fact thatsome uncertainties surround both the short-run and long-runoutlook for the social security system. These uncertaintieshave little to do with the intrinsic health of the program, butrather with the fact that tax rates are set on the basis ofassumed economic and demographic developments and therevenues produced by these tax rates will provide inadequateor excessive if the actual performance of the economy differs

27
from that projected. In order to assess the reliability of theprojections, it is useful to identify some of the major uncer-tainties and estimate the magnitude of their potential impacton the financial status of the program. This exercise shouldprovide some comfort to those who continue to worry aboutthe solvency of the social security program, since the analysisreveals that potential deviations from the assumed perfor-mance would require relatively minor increases in OASDItax rates.
1984-1989: Economic Performance. For the period fromnow through 1989, the 1983 social security package was con-structed so that the system would be adequately financed notonly under the Trustees' intermediate economic assump-tions, but also under the more pessimistic scenario. Most ofthe additional revenues under the pessimistic assumptionsare attributable to the revised indexing procedure, wherebybenefits are adjusted by the lesoer of increases in prices orwages when trust fund reserves are low. The problem is thatduring the 1970s the economy performed even more poorlythan the social security Trustees' pessimistic assumptionsand, therefore, a legitimate question can be raised aboutwhether the revenue and outlay projections for the rest of the1980s are realistic.
In fact, no mechanism exists to answer that question; in-sead, the only basis for assessment is to compare the socialsecurity assumptions with those of independent forecasters.As of April 1983, the month the 1983 Amendments weresigned into law, the projections of the private forecastersclustered around the social security Trustees' intermediateand pessimistic assumptions and updated forecasts fromData Resources, Inc. and Chase Econometrics show theprivate projections bracketing these assumptions. Thus, thesocial security forecasts appear to be based on reasonableassumptions about future economic trends (see Table 5).

28
Table 5Comparison of Projections, as of Fourth Quarter 1983,
of the Real Wage Differentia la by Social Securityand Private Forecasters, 1984-1989
Social security Private forecasters'Intermediate Pessimistic Chase DRI
1984 1.1 -1.8 0.4 -0.61985 0.2 -0.3 0.0 -0.21986 0.9 0.1 0.2 -0.11987 1.2 0.7 1.9 0.51988 1.3 0.9 1.4 0.41989 1.4 1.1 1.9 0.7
SOURCE: Social Security Administration, Office of the Actuary, "Possible 'AutomaticOperations' in 1984-85," memorandum (November 16, 1983), Table 1 and unpublisheddata; and Data Resources, Inc. and Chase Econometrics/Interactive Data Corp., projec-tions based on data available before December 30, 1983.
a. The difference between the percentage increase in average annual wages in coveredemployment and the percentage increase in the annual CPI for all wage and salariedworkers.
b Since the private forecasters do not project wages in covered employment, wage growthis calculated on th° basis of wages and salaries per worker in the private sector. For Chaseand DRI standard long-term forecasts were used, moderate growth and tend, respectively.
Moreover, the really difficult period for social securityfinancing is only the four years 1984 through 1987, sincerevenues will jump markedly in 1988, when a scheduledOASDI tax rate increase of 0.36 percent each for theemployee and employer takes effect. (Another 0.14 percentincrease becomes effective in 1990.) Little likelihood of aneconomic downturn exists for 1984 and while a serious reces-sion in 1985 could cause some problems, such a developmentis very unlikely. By 1986, even with a repetition of thedisastProus conditions of 1979 and 1980, the OASI and DItrust funds should have adequate reserves to continuepayments through 1988 when the new revenues will beavailable. In addition to their own reserves, the OASI and DI

29
funds can borrow from the HI trust fund until 1988. Thecombination of borrowing capability, substantial reserves,and a reasonably health economic outlook makes thepossibility of another short term social security financingcrisis very unlikely.'4
1990-2020 Accumulation of Trust Fund Reserves. Inmarked contrast to the 1980s, the outlook for OASDI finan-cing for the period 1990-2020 has always been favorable. Theprimary reason is demographic. The low fertility rates duringthe late 1920s and the 1930s will be reflected in a con-siderable reduction in the rate of increase in the populationover age 65 during the 1990s and the first decade of thetwenty-first century. While the average annual increase inthe number of persons over 65 will be about 600,000 duringthe 1980s, the net increase will drop to around 400,000 a yearunder the intermediate assumptions between 1990 and 2010in spite of the improvement in the mortality rate. At thesame time, the baby boom generation born after World WarII will continue to swell the labor force. As a result, the ratioof beneficiaries to workers, which has increased continuallysince 1940, is estimated to remain stable for the next 20 to 30years at its current level of roughly 30 beneficiaries per hun-dred workers. With a stable ratio of beneficiaries to workers,even modest productivity gains will reduce the cost of socialsecurity as a percent of payroll.
At the same time costs are projected tl decline, revenuesare scheduled to increase since a combined employee-employer payroll tax increase of 1.0 percent is slated to takeeffect by 1990. With lower costs and higher revenues, theretirement and disability program is projected to runsubstantial annual surpluses and the ratio of assets to outlaysis estimated to increase from 38 percent in 1990 to 538 per-cent by 2020 under the intermediate assumptions. These ac-cumulated reserves are then scheduled to be drawn down tocover annual deficits in the years between 2020 and 2057.

During the period 1990-2020, almost no uncertainties existabout the adequacy of social security financing. Even underthe pessimistic mortality and economic: assumptions thesystem will run surpluses until 2013 and have positive trustfund balances until 2020. Should the economy perform morepoorly than the pessimistic assumptions, particularly shouldthe real wage differential fall below 1 percent, revenues willstill be adequate to cover benefit commitments, although notsufficient to produce substantial surpluses.
The uncertainty surrounding social security financing dur-ing the period 1990-2020 arises then not from possibleadverse economic or demographic developments, but ratherfrom the possibility of congressional action. The major ques-tion is whether Congress will glow a substantial accumula-tion of assets in the OASDI trust funds or whether it willdivert scheduled payroll taxes to finance other programs orsimply not allow the 1990 rate increase to take effect. Ifreserves are not accumulated during the period, then taxrates will have to be raised after 2020 in order to finance theannual deficits on a current cost basis. It is important tonote, however, that the rate hike that would be required ifreserves are not accumulated is fairly modestroughly 1percent each for the employee and employer under the in-termediate assumptions (see Table 6).
The Role of the Hospital Insurance Program. A majorobstacle to the buildup of assets in the OASDI trust fundmay be the financial requirements of the Hospital Insuranceprogram. Although the HI trust fund was a source ofstrength during the recent financial crisis, it faces seriousfinancing problems in the near future. Unless further policychanges are implemented, the Congressional Budget Officeprojects the depletion of the HI fund by the end of thedecade. The deficits would be small initially, but they wouldincrease each year so that by 1995 the annual deficit would

31
be $60 billion and the cumulative deficits would total over$200 billion.
Table 6Estimated Average Cost Rate, Average Total Income Rateand Actuarial Balance for OASDI, and HI Trust Funds,Under Three Assumptions, Selected Periods, 1983-2057
Period
Percent of projected taxable payroll
Averagecost rate
Average totalincome rate
Actuarialbalance
1983-2057
(OASDI)
Pessimistic 16.56 13.04 - 3.51Intermediate 12.84 12.87 + 0.02Optimistic 9.81 12.73 + 2.92
1983-2007Pessimistic 11.44 12.53 + 1.08Intermediate 10.66 12.50 + 1.83Optimistic 9.22 12.45 + 3.23
2008-2057Pessimistic 15.50 13.08 - 2.42Intermediate 12.64 12.95 + 0.32Optimistic 9.80 12.83 + 3.03
2033-2057Pessimistic 22.73 13.52 -- 9.21Intermediate 15.23 13.15 - 2.08Optimistic 10.42 12.91 + 2.49
(HI)
1983-2007Pessimistic 5.38 2.87 - 2.51Intermediate 4.11 2.87 - 1.24Optimistic 3.21 2.87 - 0.34
SOURCE: Social Security Administration, Office of the Actuary, 1983 Annual Report ofthe Board of Trustees of the Federal Old-Age and Survivors Insurance and Disability In-surance Trust Funds (GPO, May 1983), Table 31, pp. 79-80; and 1983 Annual R port ofthe Board of Trustees of the Federal Hospital Insurance Trust Fund, Table 11, p. 47.
.36

32
Projected deficits could be substantially lower if cost-containment efforts are successful. For example, theSecretary of Health and Human Services has the power to sethospital reimbursement rates after 1985. If the Secretarydecided to limit the increase in payments per admission toonly 1 percentage point mre tnan the rate of increase ofhospital input prices, the depletion date for the HI trust fundwould be postponed until 1992 and the cumulative deficitwould amount to roughly $85 billion by 1995.
Even with successful cost-containment efforts, therefore,some residual deficits appear almost inescapable. Hence, it isquite possible that Congress may decide to cover some of HIdeficit by reallocating to the Hospital Insuranc' trust fund aportion of the payroll tax revenues now scheduled to go intothe retirement and disability programs after 1990.
2020-2057: Demographic and Economic Assumptions.The financial solvency of the social security program afterthe year 2020 hinges crucially on demographic developmentsbeing in line with the social security Trustees' intermediateprojections and to a somewhat lesser extent on productivitygrowth producing an adequate real wage differential.
Demographic Projections: The intermediate assumptionof the social security Trustees, that the fertility rate will in-crease from its current level of 1.8 to an ultimate value of 2.0by 2005, is slightly higher than the most recent projections bythe Census Bureau. Until October 1982, the Census Bureau's"middle" series had assumed a long-run fertility rate of 2.1,the rate that produces zero population gt owth over the long-run. Now the Census assumes that fertility rates will remainfairly steady, increasing slightly from 1.80 to 1.96 in 2000and then decreasing gradually to 1.9 births per woman in2050. Supporting the somewhat higher social securityprojec-tions, however, is the fact that data on expected births in-dicate that young women continue to expect to have more
37

33
than two children over their lifetimes. Thus, the socialsecurity intermediate projection of a long-run fertility rate of2.0 appears more likely than either the optimistic orpessimistic projections of 2.3 or 1.6, respectively. That is, itwould be very difficult to make a convincing case for a fer-tility rate assumption substantially different from that incor-porated in the Trustees' intermediate projections."
Economic Assumptions: While the central projectionsseem to be based on realistic demographic assumptions, theymay incorporate a somewhat optimistic assumption aboutdie rate of productivity growth. The intermediate projec-tions of the retirement and disability funds a-e based on anassumed long-run real wage differential of 1.5 percent.Although this number is considerably below the 3.0 percentdifferential experienced in the 1950s and the 2.1 percent dur-ing the 1960s, it exceeds the average of 1.2 percent over thelast 30 years. In addition, the real wage differential of 1.5percent implies long-run productivity gains of 2.1 percent,which is somewhat higher than most estimates."
The interesting fact, however, is that the long-run costs ofthe program are not all that ser.o.live to the real wage dif-ferential. For example, if the long-run real wage differentialwere 1 percent instead of 1.5 percent, the cost of the systemin the 2020-2057 period would be roughly 1.0 percent of tax-able payrolls higher and the cost of the program over the en-tire 75-year forecasting horizon would be 0.8 percent higher.This would mean that instead of being in long-run balance,the system would have a 75-year deficit of 0.8 percent of tax-able payrolls. To put this deficit in perspective, it must becompared with the total cost of the program, which would beroughly 13.7 percent of taxable payrolls. Of this total cost,12.9 percent would be covered by scheduled payroll taxes,while 0.8 percent would be unfunded. In other words, thedeficit produced by a real wage differential of 1 percentrather than 1.5 percent would amount to only 6 percent of

34
program expenditures over the 75 years. Under the tradi-tional rule of thumb adopted by the social security Trustees,the system is considered to be in close actuarial balance ifrevenues are equal io plus or minus 5 percent of plannedoutlays. Thus, even a substantial deviation from the assumedreal wage growth will require only a relatively modest in-crease in the payroll tax rate to restore financial balance tothe retirement and disability programs.
After 2057. To even discuss the outlook for social securityafter the year 2057 verges on the ridiculous. It is comparableto having concluded in 1909 that a program was adequatelyfinanced through 1984 and then worrying about what wasgoing to happen in 1985. Nevertheless, for the sal, !, of com-pleteness, it is probably useful to mention two factors thatpertain to the end of the forecast period. The first is that thereserves that are scheduled to accumulate during the period1990-2020 will be exhausted by 2057. Hence, the OASDIpayroll tax rate will have to be raised under the intermediateassumptions by roughly 1 percentage point each foremployees and employers in the middle of the next century tocover the costs of the program.
The second factor is that because of the mechanics ofcalculating the long-run financial status of the program,future estimates will begin to show small deficits even if theintermediate assumptions turn out to be completely ac-curate. This will occur because the 75-year projection is arolling average of individual years, and as time progressesthe near-term years of projected surpluses will be replaced bythe years of deficit after 2057, the end of the current projec-tion horizon. The magnitude of this phenomenon is verysmall, however, and it will probably be dwarfed by otherdevelopments.

35
V. Conclusion
Congress passed major legislation in 1983 which raisedtaxes, reduced benefits, and broadened coverage in order toprovide financial balance to the social security program overthe next 75 years. The preceeding analysis indicates that the1983 Amendments have done the job. In the critical periodbetween now and the 1988 rate hike, the system appears ade-quately financed even under the pessimistic set of economicassumptions. Moreover, the economic forecasts used bysocial security are consistent with those prepared by privatefirms.
Between 1988 and 2020, there is little question thatrevenues will be sufficient to cover promised benefits. In-deed, the major question is how large the trust funds willbecome as the system experiences successive annualsurpluses. This depends somewhat on economic anddemographic developments, but the determining factor willbe Congress' willingness to deviate from pay-as-you-gofinancing and allow an accumulation of reserves. If fundsare needed to finance the Hospital Insurance program, adecision might be made to divert some of the scheduledpayroll taxes to finance HI. Even in th event of such a diver-sion, however, the system appears to have plenty of moneyfor the next 40 years.
After 2020, the program starts to run annual deficits and apossibility exists that some additional financing might be re-quired if either adequate reserves are not allowed to ac-cumulate during the 1990-2020 period or the real wage dif-ferential turns out to ly ".ower than projected. Even if eitherof these events should occur, however, the size of the tax in-crease that would be required to compensate appearsrelatively modestperhaps 1 percent each for the employeeand employer. Hence, the financing of the retirement anddisability programs appears well under control for theforeseeable future.
4 0

36
NOTES
1. This discussion of the effect of forecasting errors is based on a presen-tation by Lawrence H. Thompson, "Social Security Financing: RecentProblems and Current Uncertainties," prepared for annual meeting ofIndustrial Relations Research Association, San Francisco, December 30,1983 and on Dwight K. Bartlett and Joseph A. Applebaum, "EconomicForecasting: Effect of Errors on OASDI Fund Ratios," Social SecurityBulletin 45 (1) (January 1982), pp. 9-14.
2. Because of the time lag in adjusting benefits, the level of inflation doeshave a small impact on the cost of the system even with a constant realwage differential. For example, the 75-year deficit would range from-0.33 percent of taxable payrolls to + 0.36 percent as the underlying in-flation rate ranged from 2 percent to 6 percent even with a constant realwage differential of 1.5 percent.
3. Other factors contributing to social security's financial problems werea higher-than-expected unemployment rate which further reducedrevenues and an unprecedented increase in disability claims.
4. Since 1975 cost-of-living adjustments were made annually in June(payable in Juiy) to reflect changes in the consumer price index (CPI),measured by the first quarter of the current year over the first quarter ofthe previous year. The legislation shifted the 1983 COLA from June toDecember and provided that all subsequent increases be awarded inDecember (payable in January), based on the elevel of the CPI in thethird quarter of that year over the level in the third quarter of theprevious year.
5. The 1983 legislation moved the scheduled 1985 OASDI rate increase to1984 and part of the scheduled 1990 increase to 1988. As a result, the1984 OASDI tax is 5.7 percent each for employers and employees and isslated to rise to 6.06 percent in 1988 and 6.2 percent in 1990. With a HItax of 1.45 percent beginning in 1986, the total social security payroll taxwill rise from its present level of 7.0 percent to 7.51 percent in 1988 and7.65 percent in 1990. In order to postpone the impact of the 1984 increaseuntil 1985, however, the legislation provided employees a c-- lit of 0.3percent of taxable wages so that net OASDI tax remains unchanged at5.4 percent for 1984.
6. One-half of social security benefits are subject to taxation if 50 per-cent of the benefits, combined with other income plus certain nontaxable
41.

37
income, exceed $32,000 in the case of a married couple and $25,000 forsingle individuals.
7. The deduction becomes effective in 1990. In the interim, the tax in-crease will be accompanied by a tax credit of 2.7 percent of taxable earn-ings in 1984, 2.3 percent in 1985 and 2 percent in 1986 through 1989.
8. Before the 1983 Amendments, the social security system covered 90percent of jobs in paid employment. The 10 percent of workers who werenot covered by social security included most federal civilian workers (2.4out of 2.7 million), about 30 percent of state and local employees (ap-proximately 3 million), and 15 to 20 percent of employees of nonprofitorganizations (up to 1 million). The 1983 Amendments extendedcoverage to all newly hired federal civilian employees and to uncoveredworkers in nonprofit institutions. For these groups, this provision notonly eliminates the windfall component of benefits that arises whenformerly uncovered workers have minimum coverage and profit fromsocial security's progressive benefit formula, but also improves the pro-tection for many workers, particularly in the area of disability and sur-vivors insurance. The windfall component for those groups who con-tinue to remain uncovered is partially eliminated in the legislation bymodifying the benefit formula for persons with pensions from non-cov :red employment.
9. Since 1950 social security coverage for employees of the states andlocalities has been available on a voluntary basis through agreements be-tween the political entity and the Secretary of Health and Human Ser-vices. States could voluntarily terminate coverage with two years' ad-vanced notice. Until the mid-1970s the number of employees leaving thesystem was always exceeded by the number of newly coveredemployeesin most years by 50,000 or more. After 1975, however, thenumber of workers for whom coverage was terminated exceeded thenumber of newly covered employees. These terminations not only reduc-ed the payroll tax base, but also caused some employees to lose protec-tion and created resentment on the part of other workers who werecovered on a mandatory basis. To alleviate these problems, the 1983Amendments prohibited state and local governments from terminatingcoverage after April 14, 1983.
10. The military have been covered under social security since 1957, butmilitary personnel pay contributions only on the cash paid to them. Thegovernment pays the costs of the benefit credits made on the basis ofnonpecuniary allowances for room and board. However, the government
4 °4

did not make current payments for these credits, but rather transferredthe money to the social security trust funds only when the benefits werepaid. Moreover, prior to 1957, free credits of $160 per month weregranted for service in the armed forces. These credits, too, were paid on-ly after the benefits were awarded, and the cost was amortized over along period of time. The 1983 Amendments provided for the OASDItrust funds to receive a lump-sum payment from the Treasury to make upfor the back amounts owed by the government. In the future the OASDItrust funds will be reimbursed on a current basis for the employee andemployer taxes on the benefit credits made in lieu of allowances for roomand board.
11. The relative importance of the specific proposals on long-run costsand revenues, however, differed somewhat from their impact on thesystem in the short run. The change that had the greatest long range ef-fect was the proposal to tax one-half of social security benefits. While theincome limits initially restrict the taxation to less than 10 percent of thepopulation, eventually about half of all beneficiaries will be affected.The proposal to bring employees of nonprofit institutions and newlyhired federal workers under social security also has a favorable longrange impact. The saving arises because an estimated 73 percent ofthoseinvolved would have qualified for sizable social security benefits as aresult of other employment even without the extension of coverage.Also, federal employees tend to have wages that are higher than averageand, therefore, are entitled to less heavily weighted benefits.
12. Specifically, the age for full benefits will be increased to 66 by twomonths a year for six years so that provision would be fully effectivebeginning with those attaining age 62 in 2005 (66 in 2009); maintained atage 66 for people reaching are 62 in 2006-2016; increased by two monthsa year for people reaching age 62 in 2017-2022; and maintained at age 67for people reaching 62 after 2022.
13. The 1983 legislation puts restrictions on interfund borrowing, par-ticularly: 1) interest must be paid monthly on any outstanding loans;2) no fund can borrow from the other in any ma th in which the other'strust fund ratio is under 10 percent; 3) in 1983-1987, each fund mustrepay loans whenever its fund ratio at yearend exceeds 15 percent; and4) in 1988-1989, the loan balance outstanding at the end of 1987 must berepaid in 24 equal monthly payments.
14. Some speculation has emerged that trust fund reserves may fallslightly below 15 percent in 1984 or 1985, triggering the revised indexing
43

39
procedure. Even if this should occur, it would probably have no effect onbenefits, since wages will almost certainly rise faster than prices. Hence,no changes in benefits or taxes are likely in the short run.
15. On the other hand, the enormous fluctuation experienced in fertilitytrends would argue against being too complacent about any projection offuture fertility rates. The hazards of forecasting population growth canbe easily demonstrated by historical experience. In 1943 it wasauthoritatively estimated that the 1980 United States population wouldbe perhaps as low as 146 million, or perhaps be as high as 179 million; in1958 the corresponding low and high forecasts of the 1975 populationwere 231 million and 273 million; the eventa population of 228millionconfounded both these projections. See Warren S. Thompsonand P.K. Whelpten, "Estimates of the Future Population of the UnitedStates, 1940 to 2000," paper presented for the National Resources Plan-ning Board (1943) and U.S. Bureau of the Census, Current PopulationReports, "Illustrative Projections of the Population of the UnitedStates, by Age and Sex, 1960 to 1980," series P-25, No. 187 (GPO,1958).
16. An ultimate rate of productivity gains of 2.1 percent per year wasderived from the projected real-wage differential of 1.5 percent per yearby increasing it by 0.3 percent for the relative annual growtli of fringebenefits; 0.2 percent for the average number of hours worked per week;and 0.1 percent for the average number of weeks worked per year.
44

3The Economics of Aging*
Doomsday or Shangrila?
James H. SchulzBrandeis University
The well-known social commentator Gunnar Myrdal(1963), writing in the early Sixties, had this to say about theelderly in America:
The treatment of old people in America, many ofwhom have a hard life behind them, isremarkable. . . [This is illustrated by] the terrifyingextent to which old people are left in poverty anddestitution. . . . It cannot possibly be the con-sidertvi opinion of the majority of Americans thatso many of those who in America are often called"senior citizens" should be left in misery, squalor,and often forbidding loneliness, unattended thoughthey are in need of care. The situation is overripefor a radical reform of the old age security system.
Contrast Myrdal's comment with a recent story that ap-peared in the Washington Post:
A new Census Bureau study shows that the elderlyin this country are much better off than previouslybelieved and, in fact, are better off than the averageAmerican. . . .
The article by Spencer Rich (1983) in the Washington Postgoes on to describe how the per capita, after-tax income of
'This presentation was based on an article by James Schulz published in Charles M. Gaitz,et al., Aging 2000: Our Health Care Destiny, Vol. II (New York. Springer-Verlag, 1985),and is reprinted with permission.
41
45

42
the elderly was $6,300 in 1980 versus $5,964 for me popula-tion as a whole.
Looking at these new Census Bureau findings and anumber of other recent studies, one can begin to see theoutlines of a very fundamental change with regard to theeconomic status of the elderly. From a statistical point ofview, the elderly in this country are beginning to look a lotlike the rest of the population: some very rich, lots with ade-quate income, lots more with very modest incomes (oftennear poverty), and a significant minority still destitute. Thisis very different from the past when most were destitute.
The past three decades have been marked by steady im-provements in the economic situation of the elderly. Pensioncoverage has spread rapidly, real benefit levels have increas-ed, and health protection is generally financially obtainable.Moreover, the general economic prosperity of the post-World War II period (that is, up until recently) has served tofacilitate among those middle-aged and older the accumula-tion of an impressive stock of economic wealth in the formof housing, durables, and pension accurals.
But just when we thought the problem of providing ade-quate income in retirement for most elderly was solved, awhole new set of uncertainties arose:
1. Life-Threatening Economic Instability. I say "life-threatening" as a way of dramatizing the differences in thecharacter of the macro problems that suddenly appeared inthe Seventies. Inflation and unemployment unexpectedlybecame both more severe and of longer durationto the ex-tent that the resulting economic deprivation, mental stress,inadequate medical care, and malnutrition threatened lifeitself for a much broader spectrum of the American popula-tion.

43
As families attempted to cope with the harsh realiti :s ofthis economic instability, few realized (or had the time or in-clination to think about) the simultaneous erosion of thebase for their retirement security that was also occurring.Wealth in housing and consumer durables deteriorated. Anda private pension system, des'gned to reward long-termworkers at the expense of those who lose or change jobs,proceeded to wipe out billions of dollars in potential pensionaccruals as millions of workers changed jobs without vestedpension rights. And probably what is more serious is thegradual, invisible erosion of pension benefit rights that willtake place over the coming years. The forced mobility of theSeventies and Eighties also produced a gigantic pool of pen-sion benefit accruals for those job changers fortunateenough to be eligible for vesting. But since these accruals arenot indexed, they are highly vulnerable to monetarydepreciation from the inflation that can be expected in theyears ahead. Few people today (even policymakers) are sen-sitive to this problem. Few see that this is the great retirement"legacy" of the Carter-Reagan years: lost pension benefits.Instead, most attention has been focused on social security,the next uncertainty to be discussed.
2. Chaotic Social Security Financing. It is almost amusingto look back over the social security events of the recent past:a nation bumbling along from one social security financialcrisis to another, like a little mom and pop grocery storealways on the brink of bankruptcy. What we have witnessedis one of the great social programs of the richest country inthe world seemingly almost brought to its knees by theeconomic instability discussed above. The result: cries ofanguish, much handwringing, and finally a financial "fix"until the next crisis arises.
To me, a pension expert who has given years of attentionto pension financing issues, events seem more the result of
47

44
political maneuvering than the product of fundamentaleconomic problems. But to others, the problems (botheconomic and political) seem very real.. And for the first timesince it was established, support for social security seems indoubt as confidence deteriorates among policymakers andprogram participants. What was once unthinkablemajorcutbackshave become a reality: benefit cuts, benefit taxa-tion, and a scheduled rise in the retirement age.
For purposes of this paper, then, it only remains to ask thequestion: if social security is in a state of change, what can becounted on? Obviously this new uncertainty makes it dif-ficult to plan for the future.
3. The Early Retirement Bomb. For many years nowanalysts have pointed with great anxiety to the dramaticdeclines in labor force participation among the older popula-tion. For reasons we .,ummarize below, many have referredto this social phenomenon as a ticking bomb that might ex-plode in the nation's face at some future time.
It is important to distinguish the growing interest andability to retire in general from the phenomenon of exercis-ing the retirement option at increasingly early ages. The"right to retire" is not what is at issue. Rather the issue is theage of election and who will pay the costs. For example, ac-tuaries point out that pension costs increase by about 50 per-cent once the normal age of retirement is reduced from age65 to age 60.
Yet, throughout the country, powerful forces are at workto remove people from the labor force before age 65. In-creasing numbers of workers are retiring under the socialsecurity early retirement option. Federal employees canretire on full benefits at age 55 with 30 years of service; infact, the President's Commission on Pension Policy reportedthat 59 percent of retiring male civil service servants (fiscal
4 C

45
1978) were age 60 or younger. Most state and local govern-ment employee plans also have very liberal retirement provi-sions. Early retirement is usually possible after 20 to 30 yearsof serviceoften as early as age 50 or 55.
Less well known are the retirement options provided underprivate pension plans. The generous provisions of the bigplansfor example, in the auto industryare well known.Few data are published, however, on the hundreds ofthousands of plans in other industries. One recent study ofpension plans by the U.S. Bureau of Labor Statistics (1980),has found that more than half of covered workers were eligi-ble to receive normal retirement benefits before age 65. Andalmost a third were eligible for normal benefits at age 60 orearlier!
Another stud; of defined benefit plans covering about 23million workers in 1974 (Schulz, et al., 1980) shows that 70percent of these workers were eligible for early retirementbenefits at age 60 (provided service requirements, if any,were met). Over half could retire as early as age 55, and 15percent were in plans with even earlier eligibility ages (or noage requirement at all).
But these numbers do not tell the whole story. More than90 percent of all workers covered by private pensions are inplans having "early retirement" options. When a workerretires early, that is before the "normal" retirement age, thebenefit is usually reduced. A large m.inber of employers,however, encourage their employees to retire early by absorb-ing some of the costs of paying pensions over a longer periodof time. Thus, while some plans reduce benefits by the fullactuarial discount, many plans, in effect, give actuarialbonuses to workers who retire early.
The study of defined benefit plans in 1974 indicated thatpowerful economic incentives are provided in many plans.
4 9

46
For example, there were about seven million workers in 1974covered by plans permitting their retirement at age 60 withless than a full actuarial reduction in benefits.
Thus, we see that social security is not the sole forcepushing workers into retirement. Certainly social security in-coml, when it becomes available, encourages workers toretire. But for many workers it is military, federal,state/local, or private plans that make it possible to retire atincreasingly early ages.
Pensions have become an important tool of personnelmanagement, especially in dealing with excess labor situa-tions. As Juanita Kreps (1977) pointed out a few years ago,"retirement, a relatively new lifestage, has quickly becomea . . . device for balancing the number of job seekers withthe demand for workers at going rates of pay." But make nomistake, early retirement is also very popular with unionsand the workers themselves.
This trend of early retirement raises new uncertainties. Tothe extent that early retirement benefits are reduced benefits,will the resulting retirement income be adequate? Will thelower benefits ultimately trigger demands for higher ones?Will meeting the costs of paying pension benefits over in-creasing periods of time create financing problems for publicand private pension sponsorsthreatening the viability ofthe pension plans themselves? Since the costs of early retire-ment policies are relatively low but grow rapidly over time(as the trend continues and qpreads)., some see this situationakin to a quiet bomb that is ct.-rently dormant but capableof suddenly exploding sometime hi thc future. Already manysee social security costs out of control. Concern aboutprivate pension costs may soon follow.
Given these uncertainties (economic instability, problemsof social security financing, and the trend toward earlyretirement), what can we say about the future? Here we find

47
very little agreement among analysts. Of course, such a stateof affairs is not too surprising. We have learned not to be toosurprised by the unpredictable, especially given the largenumber of unknown factors surrounding a socialphenomenon like "the economics of aging." Still, for thosewho have taken more than a passing interest in this area, thecurrent situation represents a significant and somewhatunexpected watershed.
Some analysts see us at the beginning of a long period ofeconomic stagnation and decline. Others see currenteconomic problems as just another temporary setback in thelong-run history of economic growth and the ever-rising pros-perity that has characterized the American economy formore than a century. Economic policies for the aging andultimately the future economic status of the aged dependcritically on which viewpoint is the more realistic.
Rather than taking sides in this dispute, it may be moreuseful at this point to enumerate some of the key assump-tions that lie behind the two very different points of view.Our ability to finance economic programs for the aged infuture years will be influenced greatly by the following fac-tors:
1. The Growth of Real Wages. Until the late Sixties thegrowth in American productivity was relatively high formost of the post-World War II period. Since then, however,the rate has slackened and in recent years the slowdown hasbeen quite dramatic. Moreover, this downturn has not beenconfined to a few special industries but has been experiencedby a very broad spectrum of industries in the United States.Despite much research, economists have not been able tosatisfactorily explain the changes in productivity that havetaken place and, as a result, there is currently a great deal ofuncertainty with regard to what is likely to happen in theyears ahead.

48
Pessimistic projections generally assume that recent ex-perience results from fundamental changes in the economythat are not likely to change quickly. They therefore assumethat real wage increases based on productivity gains will bevery low, averaging significantly less than 1.0 percent peryear.
Optimistic projections, in contrast, assume that the recentexperience is transient and in large part associated with theunexpected economic shocks of the last couple ofdecadeswar, OPEC, crop failures, etc. These projectionsassume a return to rates closer to those of the 1940-60 periodand real wages soon increasing between 1.0 and 2.0 percentper year.
2. Unemployment. Intimately relatd to productivity andgrowth is the level of employment. In addition to the generaleconomic stagnation depressing employment opportunities,pessimists point to an apparent increase in structural prob-lems associated with the American labor force as its age, sex,and race composition changes dramatically and as we shiftaway from manufacturing production and toward services.Thus, pessimistic projections assume unemployment will notdecline to the earlier low levels but will r Inge between 6 and 8percent (high by historical standards). Optimistic projectionsassume rates only slightly higher than those of "bettertimes"declining to below 6 percent.
3. Fertility Rates and Mortality. We have witnessed widefluctuations in fertility over the past century, creating anunevenness in the population structure and resulting dif-ficulties in planning (for housing, schools, pensions, etc.)The sharp decline in fertility following the "baby boom" ofthe late Forties and early Fifties is currently the cause ofserious concern with regard to the costs of the elderlypopulation in the 21st century. But trends in fertility over thenext several decades are also important, since they will in
52

49
great part determine the number of working-age personsavailable when the "baby boom" retires.
While most demographers continue to stress the volatility,and hence unpredictability, of future fertility, the projec-tions we make now must guess as to the likely trends.Pessimistic projections assume that fertility will continue tofall to about 1.6-1.7 children per woman; while the op-timistic ones assume fertility will increase slightly to 2.1-2.4births per woman. (All projections fail to include illegal im-migration.)
Remaining life expectance at age 65 is currently about 18.0years for women and 14.0 years for men, up from 1940 byfour and two years respectively. For projection purposes, themajor breakthroughs in prolonging life that some predict aregenerally not made a part of the projections, and almost allprojections generally assume some continuing but gradualimprovement in mortaility experience at the later ages. Thus,the optimistic and pessimistic projections differ only by rateof improvement in life expectancy assumed, and this dif-ference is typically small.
4. Private Pensions. Private pensions have growndramatically during the post-World War II periodincoverage, in types of protection, and in benefit levels provid-ed. Optimistic projections see this mechanism for income inold-age continuing to increase in importance. With liberaliz-ed tax provisions for IRAs and a variety of new pension op-tions (e.g., 401(K) cash-or-deferred plans), private pensioncoverageand hence pension benefitsare assumed to in-crease significantly. In contrast, the pessimistic projectionssee pension coverage growing slowly (perhaps even declin-ing) as a result of (a) government regulations which makepensions a much less flexible management tool and raise ad-ministrative expenses, (b) higher benefit costs arising fromcontinuing demands to liberalize benefits, and (c) escalating

50
premiums to the Pension Benefit Guaranty Corporation toprotect against plan termination resulting from industry, andhence plan, instability.
5. ffealth Care Costs. There is now growing awarenessamong analysts and policymakers that the rapid rise inhealth care costs of the recent past is not likely to abate in theyears to come. With regard to the elderly, most of the atten-tion is focused on Medicare, which currently finances about45 percent of their health care costs and most of acute careexpenses. Since its enactment, Medicare expenditures havegrown at a rate far faster than the other social security pro-grams. In early 1983, the White House issued statistics tosupport President Reagan's "health care incentive reformproposal." "This year," said the fact sheet, "Medicare andMed!caid will spend more every two weeks than they did dur-ing the entire year of 1966, their first full year of operation"(White House, 1983). If the early retirement bomb isthreatening us, many would argue that the Medicare bombhas already exploded, and the only argument is over howmany more will follow.
Moreover, there seems to be general agreement amonganalysts that, in the absence of intervention, Medicare costswill continue to accelerate in future years. And many thinkthat only very fundamental and radical changes in our healthcare delivery system will have any appreciable effect onfuture costs trends. In their Annual Report for 1983, theTrustees of the Social Security Administration project ("im-mediate" assumptions) that Medicare costs will continueto grow by 8 to 13 percent over the next twodecadessignificantly faster than the increase in revenuesfrom taxable payrolls. The resulting costs (and deficits) arehuge by any standard of comparison.
The Trustees attribute slightly over half of the annualgrowth in health costs to economic and demographic factors.
54La farra=--

51
But the rest is expected to result from the continuing costpressures within the health care industry itselfwage setting,insurance disincentives, and the costs of new technology.Peterson (1983) warns, for example, that the ". . . newmedical technologies are priming the HI [Medicare] programfor a cost explosion without precedent. . . ." And AlanGreenspantestifying before the Subcommittee on SocialSecurity, U.S. House Committee on Ways and Means(February 1, 1983) as Chairman of the National Commissionon Social Security Reformwarns: "We cannot substantial-ly constrain the cost of Medicare unless we slow the im-provements in technology (a dubious goal) or choose not toemploy the technology that is currently available. These deci-sions, of course, would raise very difficult ethical and moralquestions."
Again, projecting future costs becomes a seemingly im-possible exercise. Munnell (1983), arguing against thepessimistic projections of Peterson, counters in the followingway:
Outlays for HI [Medicare] today account for only18 percent of total expenditures under the socialsecurity program; it is difficult to believe that wewill allow the HI program to grow to a point wherethe cost for hospital insurance (20 percent of tax-able payrolls) roughly equals the total cost to sup-port the aged, disabled, their dependents and sur-vivors (24 percent of payrolls). [Emphasis added.]
Thus, given agreement over the need for cost constraint, theoptimists and pessimists tend to differ on how soon and howmuch we will change our health care system.
It is tempting to close by throwing up one's hands infrustration and exclaiming, "Who knows what the futurewill bring?" As our survey of the key factors has shown,
.--_---1
Jt./ LA
there is clearly much intellectual justification for uncertain-tyand anxiety!
Instead, I want to close by adding a reactive note of cau-tion. In recent years, good economic news has been virtuallynonexistent. For this and other reasons it is quite clear thatthe pessimistic projections and the problems they portendare being taken very seriously these days by "the people thatcount." Given the seriousness in recent years of our generaleconomic problems and a number of major problems arisingin connection with old-age and disability pensions, state andlocal pension financing, private pension reinsurance, andMedicare/Medicaidthe possibility of continuing and in-creasing problems is not likely to be ignored.
And for a number of years now a variety of "solutions"or remedial steps have been proposed. The changes arealmost all pointed in one directiondrastic cutbacks inbenefits to reduce social security costs. As I have pointed outpreviously (Schluz 1983), the logical question that followsfrom such proposed action is: What else changes in re :tionto cutbacks in social security (i.e., what takes the place ofsocial security)?
In examining the ability of alternatives to pick up the slackfrom a pared down social security program, we should notignore economic history. Despite what Martha Derthick(1979) says about bureaucratic elites engineering the expan-sion of social security, the development of OASDHI was to avery large extent a reaction to the failure of the alter-nativesnamely "employment of the old" and "providingfor old age through personal savings." Both these alter-natives are largely untenable due to the vicissitudes of oureconomic system over the years:
a) past periods of unemployment and inflation that havemade preparation for retirement (i.e., financial plan-
56

53
ning) extremely difficult for individuals (if not im-possible);
b) an inability to achieve sustained fullemploymentexcept in periods when the nation waspreparing, fighting, or recovering from warcausingthe government to actively discourage employment byolder workers and to develop pelision mechanismsthat encourage retirement; and
c) both social security and private pensions with a longhistory as tools of business management to deal withcyclical and long -term shifts in demand (see, e.g.,Graebner 1980).
What then are the alternatives proposed today? Not surpris-ingly, we find that they are the same as in the past: privatesaving, private insurance, and employment of the old.
Thus, there is a high probability that the solutions beingproposed today are simplistic and unworkable. If we cutback social security drastically, we are likely to see theeconomic status of the elderly decline over time. More im-portant, this decline will fall disproportionately on the disad-vantaged segments of the populationlow income pers ns,women, and minorities who now depend almost entirely onsocial security for their support in old age.
The long term implications of this are quite serious. AsWilliam Graebner has recently argued, the elderly may beviewed by our society as a residual group to remain in ormove out of the labor force, according to themacroeconomic situation:
If elderly people of the turn of the century couldcompare notes with those of us approaching thiscentury's end, the two generations might well con-
5 7'

54
elude that, whatever else has changed, the fate ofthe elderly remains the same: to serve the needs ofother age groups and to be retired, or put back towork in the interest of someone else's conception ofthe general welfare (Graebner 1983).
If that is true, then it is quite unlikely that many people in thefuture can actually count on the rosy retirement period (theShangrila) so much the fashion today in the stories of themedia and the speeches of politicians.
REFERENCES
Derthick, M. Policymaking for social security. Washington, DC: TheBrookings Institution, 1979.
Graebner, W. A history of retirement. New Haven, CN: Yale UniversityPress, 1980.
Graebner, W. U.S. is reversing itself on the promise of retirement. N.Y.Times. Reprinted in Seattle Post-Intelligencer, October 9, 1983.
Kreps, J. Age, work, and income. S. Econ. J. 43, 1423-1437 (1977).
Munnell, A. Calmer look at social security. New York Review of Books30 (March 17, 1983).
Myrdal, G. Challenges to affluence. New York: Pantheon Books, 1963.
Peterson, P. A reply to critics. New York Review of Books, 48-57(March 17, 1983).
Rich, S. Census finds elderly's after-tax income higher than average.Washington Post. Reprinted in Boston Globe, August 19, 1983.
Schulz, J. The economics of aging, 2nd ed., pp. 69-71. Belmont, CA.Wadsworth, 1980.
Schulz, J. Private pensions, inflation, and employment. In H. Parnes,ed., Policy issues in work and retirement. Kalamazoo, MI: W. E. Up-john Institute for Employment Research, 1983.
Schulz, J., Borowski, A., Kelly, L., Leavitt, T., Spector, W. Privatepension policy simulations. Final report to the U.S. Department ofLabor. Walthan, MA: mimeo.
58

1
5_,
Trustees of the Federal Hospital Insurance Trust Fund. 1983 annualreport. U.S. House of Representatives document number 98-75.Washington, DC: U.S. Government Printing Office, 1983.
U.S. Bureau of Labor Statistics. Employee benefits in industry: a pilotstudy. Report 615. Washington, DC: U.S. Department ofLabor, 1980.
White House. White House fact sheet on President Reagan's health careincentives reform proposal. Washington, DC: mimeo, February 18,1983.

Retirement Incentivesthe Carrot and the Stick*
Why No One WorksBeyond 65 Anymore
Joseph F. QuinnBoston University
Introduction
The topic of this year's Economic Lecture series is theEconomics of Aging. I am delighted with this choice oftopic. It is an extremely interesting, important, and timelyone, and it is one of the few issues on which I have any exper-tise. There are many aspects of the economics of aging thatyou will hear discussed this year. I have chosen only one ofthem, the retirement decision"Why No One WorksBeyond 65 Anymore: the Carrot and the Stick."
The presentation has four parts. I will first point out thatsomething is happening. Retirement patterns have changed,and changed dramatically. Second, I will speak briefly aboutwhy this is important. Third, I will ask why this is occurringand finally, what we can do about it.
I will concentrate on the third 01 these. Why is it that thesechanges in retirement patterns are occurring? Why are peo-
Much of this presentation was drawn from an article by Richard V. Burkhauser (Vander-bilt University) and Joseph F. Quinn, "Influencing Retirement Rehavior: A Key Issue forSocial Security," Journal of Policy Analysis and Management, Fall 1983. More technicalbackground material can be found in two earlier papers by the same authors, "Is Man-datory Retirement Overrated? Evidence from the 1970's," Journal of Human Resources,Summer 1983 and "The Effect of Pension Plans on the Pattern of Life-Cycle Compensa-tion," in The Measurement of Labor Cost (Jack Triplett, editor), NBER Studies in Incomeand Wealth, Volume 48, University of Chicago Press, 1983.
57
60

58
ple retiring earlier than they used to? I will emphasize onlyone component of the answer to what is obviously a verycomplex question. That component concerns economic in-centivesincentives imbedded in our social security and pen-sion systems, incentives that induce retirement, I will argue,by penalizing the work effort of older workers. Social securi-ty and employer pensions impose pay cuts, large pay cuts insome cases, on older workers. These cuts do not occurthrough the paycheck, but through a much more subtle butno less effective mechanism. Many older workers respondexactly how you might expect to the pay cutsthey stopworking and retire.
Retirement Trends
Table 1 lays out the facts to be explainedthe mystery tobe solved. It includes longitudinal data on labor force par-ticipation rates from 1950 to 1981, by age and by sex. I drawyour attention to the last two columnsdata for men andwomen aged 55-64 and 65 and over. You will notice here aremarkable demographic trend. As recently as 1950, nearlyhalf of American men ever 64 were still in the labor force.A mere 30 years later, that proportion is down to less than1 in S.
Obviously, my title is a bit inaccurate. It is not true thatnobody works beyond 65 anymore, but it is true that whatwas once a very common phenomenon, men over 65 work-ing, is now relatively rare.
For the next category of men, 55-64, people of early retire-ment age, the pattern is similar though less dramatic. Withinthese same 30 years, the proportion still in the labor forcehas dropped from near 90 percent to near 70 percent.Something is happening.
As you can see, the statistics for women are quite dif-ferent. The reawn is that there are two trends underway
01

59
simultaneously. First, folks are retiring earlier. But second,more women are working than used to. These trends tend tooffset each other for women over 65. The participation ratehas stayed in the 8 to 10 percent range since 1950. Forwomen of early retirement age, the increased labor force par-ticipation has dominated the early retirement trend, and theproportion working has grown from 27 to 41 percent.
Table 1Labor Force Participation Rates
by Age and Sex
Males
Age
25-34 35.44 45.54 55.64 65+
1950 96.2 97.6 95.8 86.9 45.81955 97.6 98.1 96.5 87.9 39.61960 97.5 97.7 95.7 86.8 33.11965 97.3 97.3 95.6 84.6 27.91970 96.4 96.9 94.3 C3.0 26.81975 95.2 95.6 92.1 75.6 21.61981 94.9 95.4 91.4 70.6 18.4
Females1950 34.0 39.1 38.0 27.0 9.71955 34.9 41.6 43.8 32.5 10.61960 36.0 43.4 49.8 37.2 10.81965 38.5 46.1 50.9 41.1 10.01970 45.0 51.1 54.4 43.0 9.71975 54.9 55.8 54.6 40.9 3.21981 66.7 66.8 61.1 41.4 8.0
SOURCE U.S. Department of Labor, Employment and Training Report of the President(1982).
Chart 1 is a picture of the same phenomenon, except thatit uses individual ages rather than broad categories. If wedefine normal retirement age as the age at which half of thecohort are out of the labor force, we can use this chart to
'62

60
Chart 1Labor Force Participation Rates
Males and Females, 1950 to 1982
LABOR FORCE PARTICIPATION BY AGEMote.. 1950 19821.00 -.
00.90 .
0.80
0.70
0.60 -
0.50
0.40 .
0.30 -
0.20 -
0.10 -
0.00 , ...1950
..---."'----v."---4----.
-----_,,,,-
1960 1070 1980
0 55 t- 00 0 03 A 05 x 08 8 70
1.00
0.90
0.80
0.70 -
0.60 -
0.50 -
0.40 -
0.30
0.20
0.10
LABOR FORCE PARTICIPATION BY AGEForneles. 1950 1982
0 00
-----.--"'"-,__._.4------.-__.-.....
1950 1960 1970I
1980
0 55 t- 00 0 05 A 05 x 08 8 70

61
show what has happened to normal retirei. ...!nt age over theseyears. Back in 1950, for example, it was not until age 70 thathalf the men were out of the labor force. By 1970, 20 yearslater, 65 was the age at which half the mer, had withdrawn.Today that age is below 63. As you have seen, the picture forwomen is different. Despite a downturn in the early 1970s, atime, by the way, when social security benefits rosedramatically in real terms, the general trend for women hasbeen up or steady, even in the oldest categories.
When one aggregates men and women, which I have notdone here, the conclusion is clear: people are retiring earlierthan they used to. Our mission, should we decide to acceptit, is to find out why people retire when they do. It may bethat people retire when they have to, when debilitating healthproblems or mandatory retirement rules drive them fromtheir jobs. On the other hand, people may retire when theychoose to. They face financial incentives that encourageretirement, and many may be induced to do so.
A Source of Concern?
My second question is "why is this an issue?"a politeway of asking "who cares?" Until recently, I think there wasno particular alarm over these retirement trends. If anything,they were applauded. One of the goals of the early architectsof the social security system, it has been argued, was to in-duce older workers out of the very weak labor markets of the1930s.
But that goal, I suspect, faded during the war years andthe more prosperous decades that followed. Nonetheless,this trend towards early retirement was viewed as a logicaldevelopment in an increasingly wealthy society. Some of thiswealth was spent on leisure, and some of this leisure wastaken in the form of early retirement.

62
But this retirement trend is no longer viewed as benign forat least two reasons. One is the financial crisis facing socialsecurity. The social security trust funds are basically nonexis-tent these days. Current receipts from social security con-tributors are paid directly to current recipients. It is a pay-as-you-go system. There is nothing wrong with a pay-as-you-gosystem as long as future receipts are adequate to meet futureobligations. But this was recently not the case.
Some of the social security funding crisis was a temporaryphenomenon due to the recessionary years of the 1970sifyou are willing to call more than a decade of recession tem-porary. But part of the crisis is also due to these trendstowards early retirement and to the early receipt of benefitsby recipients.
The other reason for concern is anything but temporary. Itderives from the well-known demographic fact that the agestructure of America is changing. Currently, about 11 per-cent of our population is 65 or older. By 2025, this will growto between 17 and 20 percent. The whole country will soonlook like Florida, not with respect to winter weather, unfor-tunately for you Michigan residents, but with respect to theage distribution.
Even without changing retirement patterns, fewer workersper retiree would put strains on the social security system,implying either higher taxes for contributors, lower benefitsfor recipients, or both. When this demographic trend is com-bined with the fact that people are retiring earlier, the prob-lems are compounded.
I think that older workers will be very much needed in thelabor force of the future because they will be a larger propor-tion of the population. I fear that the elderly may be unwill-ing to work unless the financial incentives that I will discussthis evening are changed.
65

63
Retirement Determinants
In 1977, Congress changed the age of earliest mandatoryretirement from 65 to 70. With a couple of minor exceptions,it is now illegal to have a mandatory retirement prior to age70. Many people, including President Reagan and Rep.Claude Pepper, a leading spokesman for older American inCongress, favor outlawing mandatory retirement altogether.The entire concept may be legislated out of existence.
An interesting research question is whether this wouldmake a difference. At first blush, it appears that it would.Prior to 1977, mandatory retirement provisions were awidespread phenomenon in the U.S. Between 40 and 50 per-cent of workers faced them, and many people retired at theirmandatory retirement age. When one compares the behaviorof people with and without mandatory retirement, theirbehavior is quite different.
Richard Burkhauser and I followed a sample of employedolder workers (aged 62 to 64 in 1983, drawn from the SocialSecurity Administration's Retirement History Study (RHS))over a two-year period during which some of them facedmandatory retirement. Of those who did, only 17 percentwere still working in 1975. Of those who did not face man-datory retirement, nearly 60 percent were still employed.'Ms is a big difference in behavior and a large potentialmandatory retirement effect.
But coincidence does not imply causation. I will arguetonight that there are important financial incentives that gointo effect (or increase in magnitude) at exactly the sametime that mandatory retirement occurs. It is difficult to saywithout considerable investigation that mandatory retire-ment was the reason why these people retired when they did.It is not easy to discern "who dunnit?" or in this case "whatdunnit?"
66

64
Social security, pensions and mandatory retirement are allvery closely intertwined. It is extremely important to under-stand how each of these determinants (and others, such ashealth, marital status, attitudes and expectations) influencethe retirement decision. Why is it important? If mandatoryretirement was forcing people out of the labor force at age65, then a change in the mandatory retirement law, as we hadin 1977, or its outright elimination will have a substantial im-pact on aggregate behavior. On the other hand, if it was notmandatory retirement but other factors that occur at thesame time, then changing the mandatory retirement law willhave very little effect on retirement trends.
Mandatory retirement and pensions tend to come handand hand. In the sample of older workers mentioned above,nearly all (91 percent) of those facing mandatory retirementalso had pensions. Most became eligible at exactly the sametime as mandatory retirement and most were eligible for fullrather than reduced benefits at that time. On the other hand,of those people who were not subject to mandatory retire-ment, fewer than half (47 percent) had pensions. If pensionsinduce people to retire, and I think they do, then much ofwhat may look like a mandatory retirement effect may be theimpact of these pensions.
Mandatory retirement and social security are even easierto link. The age of full social security eligibility is age 65.That is also the age, we will see, when a very importantchange in the social security law occurs. This change willplay a key role in solving the mystery below.
Age 65 is importaliZ for another reason. Prior to 1977, thiswas by far the most popular age for mandatory retirement.If social security induces people to retire, and I think it does,much of its effect might also be attributed to mandatoryretirement.
67

65
Let's look at the modus operandi of our suspects. Man-datory retirement is the simplest, although there aresubtleties in some of the provisions. They generally state thatan individual must leave the job when turning a certain age,or at the end of that calendar year. It is a stnjahtforwa.dand blunt instrument. It is the "stick" or the title of thistalk.
Social security and employer pensions, on the other hand,are promises of income streams in the future. They are verycomplicated promises, and have many important dimen-sions, such as the age of eligibility, the size of the retirementbenefit, whether that amount is adjusted for inflation afterretirement, and what happens to that amount if one decidesto delay retirement and continue working.
All of these aspects of the retirement contract are impor-tant determinants of how valuable these promises are. In em-pirical work, one must describe these complicated ar-rangements in a simple summary form. How big are an in-dividual's pension and social security rights? The mostpopular way to answer this question is in terms of the annualbenefit; for example, $6,000 per year. But that answer ig-nores other aspects of the pension that are extremely impor-tant. It says nothing about when one is eligible. It saysnothing about what happens to tne benefit after retirement.Is the $6,000 fixed, or does it grow with the cost of living?And what happens to the benefit if one decides to forgo thepension and work another year? Will the annual benefit in-crease, and if so, by how much?
A far superior summary statistic of the value of a pensionis the wealth or asset equivalent of that promise. Ineconomists' terms, it is the present discounted value of thefuture income streamthe amount of money that wouldhave to be invested today to provide exactly the incomestream that is promised. Because investments pay interest,
CC
66
dollars promised farther and farther in the future are theequivalent to smaller and smaller amounts today.
As an example, with an interest rate of 10 percent, an in-vestment of $60,000 would provide an annual income of$6,000 forever. A gift of $60,000 and a gift of $6,000 peryear forever are exactly equivalent, given the 10 percent in-terest rate. By lending or borrowing, one could always turneither one into the other.
If $6,000 annual income will not last forever (for example,it terminates at death) then the asset equivalent is less than$60,000. The precise amount can easily be calculated.
There are tremendous advantages to defining the value ofsocial security or pension promises in terms of their assetequivalent. First, the age of eligibility is important. The far-ther away it is, the lower current asset value of a given an-nual benefit.
In addition, inflation protection is easily incorporated intothis calculation, via the discount rate that translates futuredollars into today's dollars. Indexed benefits are discountedat the real rate of interest, whereas nominal benefits that donot grow with the cost of living are discounted at thenominal ratethe real rate plus the rate of inflation.
With the concept of present discounted value in mind, letme ask the following question. The answer to this question iskey to my view of the financial incentives in our pensionplans. Suppose an individual is currently eligible for retire-ment benefits of $6,000 per year until death. What happensto this annual benefit if the individual instead chooses to re-main on the job and work another year?
There is good news and bad news. The bad news, withrespect to the pension, is that the individual loses the $6,000.One does not draw pension benefits while continuing on the
6

67
job. The good news is that future annual benefits (employerpension or social security) are likely to exceed $6,000 becauseof that additional year of work.
Why are they higher? It is important to understand this.With respect to social security, future benefits increase fortwo reasons. First, annual benefits are based on a socialsecurity concept called average monthly earnings. With anadditional year of work, average monthly earnings will rise,as will the subsequent benefit calculation.
In addition, there is a second reasonan actuarial adjust-ment, which is basically a reward from ti, Social SecurityAdministration for claiming checks for one fewer year. Be-tween 62, the earliest age of social security eligibility, and 65,the actuarial adjustment is about 7 percent per year of delay.At 65, prior to 1983, it dropped to 1 percent. This adjust-ment applies to all future checks. Most people recognize it ina slightly different form. Anyone contemplating retirementrealizes that retirement at 62, the earliest age, rather thanthree years later, the normal age, entails a benefit reductionof 20 percent. This 20 percent is approximately three timesthe 7 percent annual figure that I have introduced.
Employer pensions are more complicated, because thereare thousands of them, and each has its own individual re-quirements, rules and regulations. But pension benefits areusually based on either years of service or on average earn-ings over the last few years with the firm. Either of these islikely to grow with an additional year of work. In addition,some pension plans also have actuarial adjustments similarto that I described for social security.
The pension implication of the choice to retire or to workanother year is not as simple as the choice between $6,000and zero. It is a choice between two pension streamsonethat begins immediately and provides $6,000 per year, and
70

68
another that pays nothing in the first year, but higher annualbenefits (say, $6,500) in the future. Which one of thesestreams is worth more? It dependsalways a safe answer ineconomics. It depends on whether the future $500 annual in-crements are sufficient to compensate for the $6,000 loss inthe first year.
It is difficult to decide by looking at the streams, since theamounts arrive at different times. But as soon as they aretranslated into present discounted value, the answer isclearthe stream with the higher asset equivalent.
Suppose today's value of the first stream ($6,000, $6,000,$6,000, etc.) is $45,000, and the second ($0, $6,500, $6,500,etc.) is $50,000. Then working another year yields twobenefitspaychecks for that year, which is certainly goodnews, and a $5,000 increase in the value of pension (or socialsecurity) rights. The latter increases by $5,000 because of thedecision to work that year. As such, it is really a componentof compensation. If the straight salary was $20,000 for theyear, the true compensation was $25,000$20,000 plus the$5,000 increment in pension wealth.
Unfortunately, it can work both ways. Suppose the pres-ent discounted value of the second stream were $40,000rather than $50,000. What would true compensation bethen? While the individual earns $20,000 in salary, the valueof the pension rights drops by $5,000. Th true compensationis only $15,000 for the year of work.
An interesting question is which of these two scenarios ismore likely to describe the situation facing older workers to-day. Before presenting some actual data, let me just sum-marize the results and describe the bottom line. Social securi-ty and many pensions are structured so that at somepointand certainly by 65the second scenario holds. Thepresent discounted value of social security and employerpension rights begin to decrease with continued work. One
71

69
pocket is filled by paychecks, while the other is picked bysocial security and pension rules. One's true compensation isless than it looks. This is the surreptitious pay cut I alludedto in the introduction.
When do these losses occur? They occur at different timesfor different people. But a major change in the incentiveshappens at age 65precisely the age at which mandatoryretirement was most likely to go into effect back when theRetirement History sample was being studied. Thissimultaneity makes it difficult, through not impossible, todiscern exactly what was influencing individual behavior.Was it mandatory retirement, "the stick," or these financialincentives, "the carrot"the pay cuts that often accompanyage 65?
Table 2 shows actual data for a sample of employed menaged 63 to 65 in 1974. It illustrates what would have happen-ed to the present discounted values of pension (top) andsocial security (bottom) rights if these workers had chosen towork another year. For 63 year old men, for example, thereis relatively little change in the asset value of pensions.Similar proportions have them increased and decreased (themedian is -$148), and most of the change is less than $1,000.(The 43 percent "unchanged" are those not eligible for pen-sions.)
At age 64, however, there are significantly more losersthan gainers, and the size of the losses has increased. Themedian person, ignoring those unchanged, would lose over$1,100 in pension wealth. By age 65, nearly everyone losesand the median loss exceeds $2,000.
The changes in social security wealth are much moredramatic. Until 65, the median person gainsover $1,800 atage 63 and $800 at 64. But at 65, beware. Everyone wouldlose social security wealth with continued work. The medianloss for this particular sample of men was over $3,000.

70
Table 2Changes in Present Valueof Employer Pensions
and Social Security Associated with an Additional Yearof Work, for Full-Time Employed Men
Age 63 to 65 in 1974(Distribution in percent)
Employer pensionsAge of employed men
63(percent)
64(percent)
65(percent)
Reduced by more than $5000 2 1 6$3001 to $5000 2 4 8$1001 to $3000 7 26 27$1 to $1000 20 19 11
Unchanged 43 46 47Increased by $1 to $1000 22 4 1
$1001 to $2000 3 0 0Total 100 100 100Medianb -$148 -$1,156 -$2,062
Social Security
Reduced by $3001 to $6000 0 0 40$1501 to $3000 0 1 43Si to $1500 12 16 3
Unchanged 6 3 6
Increased by $1 to $1500 29 45 1
$1501 to $3000 51 34 0Sn01 to $6000 3 1 0
Total 100 100 100
Medianb $1,852 $857 -$3,044SOURCES- Data from the Retirement History Study of Social Security Administration;calculations by Burkhauser and Quinn.
a. Present values calculated with a 5 percent discount rate.
b. Median calculation omits those with no change.
73

Why the big change at 65? The reason is the legislateddecrease in the actuarial adjustment, from 7 percent per yearof delay between 62 and 64 to only 1 percent (in 1974) foreach year of postponement after 65. The social securityreward for continued work decreased dramatically, andbecame insufficient to compensate for a year of foregonebenefits.
Whether these gains and losses are considered big dependson the object of comparison. Table 3 compares them to theindividual's before-tax earnings. It calculates the wealthchanges as a percent of salary.
The top half of the table refers to people who do not havepensions and are eligible for social security only. As was seenin table 2, the median person gains social security wealth at63 and at 64, but loses substantially at 65. The median loss inthis sample is estimated to equal about a third of an annualsalary.
Below are individuals eligible for both social security andpensions. At the median, there is a modest net gain in totalretirement income wealth at 63, a small loss at 64, and adramatic loss at 65. The median 65 year old in this samplewould be working for approximately halfpay because of thepenalties implicit in the social security and pension systems.
These estimates are very rough, and may exaggerate thesize of the pay cut. They ignore issues of taxation, andassume that anybody who works full time loses all socialsecurity benefits. In fact, with low enough earnings, one canboth work and collect social security benefits. The point ofthe table is that the work disincentives can be large. Andkeep in mind that there are distributions around these me-dian values. There are losers even at ages when the medianperson gains.

72
Table 3Changes in Present Value of Employer Pensions
and Social Security Associated wiiii an Additional Yearof Work, as a Percentage of Annual Before Tax Earnings,
for Full-Time Employed MenAge 63 to 65 in 1974
(Distribution in percent)
Ad,e of employed men
Eligible for social security only 63 64 65(percent) (percent) (percent)
Loss of 30 percent or more 0 6 7410 to 30 percent 3 4 171 to 10 percent 17 18 9
Gain of 0 to 10 percent 23 22 010 to 20 percent 24 32 0
20 to 30 percent 23 10 030 percent or more 11 S 0
Total 100 100 100Median change + 13 + 10 -35
Eligible for social security and employer pension
Loss of 30 percent or more 6 15 9210 to 30 percent 1 18 61 to 10 percent 18 22 2
Gain of 0 to 10 percent 18 19 010 to 20 percent 34 22 020 to 30 percent 17 4 030 percent or more 7 0 0
Total 100 100 100
Median changes +12 -38 -48
SOURCES- Data from the Retirement HisLory Study of Social Security Administration;calculations by Burkhauser and Quinn.
75

73
Let me summarize what we have seen thus far. I am con-vinced that there are financial incentives to retire. At someagecertainly by 65, but earlier for many peoplethevalues of social security and pension rights begin to decline ifone continues to work.
Second, these work disincentives can be large relative ,othe paycheck. Third, these work disincentives growsignificantly in magnitude at age 65, precisely the age ofmandatory retirement prior to the 1977 legislation.
What I have not yet shown is that these incentives affectpeople's behavior. For that to occur, people must under-stand them and respond to them. Richard Burkhauser and Ihave analyzed the impact of these incentives, using samplesof older workers drawn from the Retirement History Study,and find strong evidence that this is the case. Variablesdescribing the size of social security and pension wealthchanges associated with continued work are very significantin explaining differences in individual retirement behavior.The larger the wealth losses, the more likely people are towithdraw from the labor force and retire. The people in thesample certainly behave as though they understand and res-pond to financial incentives.
I can summarize about four years of research in a simpleanalogymuch as I hate to admit it. Consider the followingcontract. For any hour that you work before noon, you willbe paid $10 per hour; for any hour you work after noon, youwill be paid $6 per hour. How would you respond? Mostpeople would try to pack all the work hours in before noonand head for the beach in the afternoon.
To oversimplify a bit, this is exactly what social securityand pension systems do, except that noon is age 65. After age65, or earlier for some, true compensation decreases becausesocial security and pension rights become less and less
7C

74
valuable with continued work. This occurs because higherbenefits in the future do not adequately compensate forbenefits foregone today.
Burkhauser and I have also found that about half of thedifference in behavior we observed between people who didand did not have mandatory retirement could be explainedby other factors, primarily the financial incentives I havedescribed. Mandatory retirement is nowhere near as impor-tant as it looks. We predict, therefore, that changing the law,as we did in 1977, or eliminating mandatory retirementaltogether would have only a modest effect on aggregatebehavior.
Changing the mandatory retirement law was a good idea,because people who really want to remain at their jobs cando soat least until age 70. But, I think it will have onlysmall impact on retirement patterns. Why? I return to thetitle of this talk"the Carrot and the Stick." Even if depriv-ed of the stick, mandatory :etirement, employers still retainthe carrot, the incentives built into their pensions systems.Mandatory retirement and actuarially unfair pensionsystems are alternative means to the same end.
To change retirement behavior, it is essential to change theincentives. To some extent we already have. The 1 percentactuarial adjustment that social security applies after age 65has already been increased in 1982 to 3 percent per year ofdelay. Although this is still far from actuarially fair, it doesdecrease the size of the work disincentives, and is a move inthe right direction.
The incentives will be changed even further by a rarelypublicized and little understood pat t of the legislation passedin April of 1983. This legislation delayed the cost of livingadjustment for social security recipients for six months. It in-troduced the taxation of the social security benefits of high

75
income recipients. It proposes delaying the age of full socialsecurity eligibility from 65 to 67 by the year 2027. But mostimportant from our perspective, it increases the actuarial ad-justment from 3 to 8 percent over a twenty year period begin-ning in 1990. This may seem like a minor component of thelegislation, but I think it is an important one. It makes socialsecurity wealth much less dependent on the age of retire-ment, and significantly decreases the size of the implicit paycuts accompanying old age.
As an economist, I believe that people respond to financialincentives. My research confirms this. However, I will be thefirst to admit, if you haven't beaten me to it, that people re-spond to many other things as well. I do not mean to implythat this is the whole story of retirementthe whole answeris the question of why people retire when they do. Attitudestowards work are very important, as are health status, livingarrangements, and expectations about the future. But the in-centives that I have described tonight are also important.And they are more easily changed by public policy, such aslegislation, than many of the other determinants.Acknowledging the incentives that are hidden in our pensionand social security systems is essential to understanding whathas occurred in the past and influencing what will happen inthe future.
7

Inflation and the EconomicWell-Being of Older Americans*
Robert Clarkand
Daniel A. SumnerNorth Carolina State University
Introduction
It has long been believed that the elderly have fixed or con-stant incomes and thus are more adversely affected by infla-tion than other demographic groups. For example, at thebeginning of the 1970s, Arthur Okun (1970, p. 14) concludedthat the ". . retired aged are the only major specificdemographic group of Americans that I can confidentlyidentify as income losers," in response to inflation. Il-lustrating the continuing prevalence of this view is the assess-ment of the 1981 White House Conference on Aging, whichstated in its final report (p. 27, 30) that "the elderly are par-ticularly vulnerable to loss from inflation" and that "reduc-ed inflation is especially beneficial to retired persons becauseit allows them to be better able to take care of themselves."These comments express a widely believed conclusion thathas influenced the development of public policy toward theelderly. During the past few years, that belief has beenchallenged in the public press and in scholarly papers. Thispaper contributes to an understanding of the response of theincome of the elderly to rising prices, and documents the ex-perience of the 1970s.
This paper, presented by Robert Clark, was based in part an research reported in moredetail in R.L. Clark, G.L. Maddox, R.A. Schrimper, and D.A. Sumner, Inflation and theEconomic Well Being of the Elderly. (Baltimore. Johns Hopkins University Press, 1984.)
77
79

78
The hypothesis that the elderly are more vulnerable to in-flation is carefully examined in this paper and then rejected.The mistake in the above argument is assuming that olderpersons live on fixed incomes. In the recent past, the majorincome sources of the elderly have been earnings, socialsecurity payments, pensions, other federal transfer programsand returns on accumulated assets. Wages and interest ratesthat the elderly earn rise with expected inflation just as forthe rest of he population. Explicit indexation, ad hoc ad-justments, and in-kind benefit payments have maintainedthe real value of federally administered transfers to the elder-ly. Employer pension benefits also tend to rise with inflation,though these do not seem to have kept pace with price in-creases. Finally, informal transfers from family and con-sumption from accumulated durable assets are hard tomeasure but make up a significant factor in the well-being ofthe elderly. Since most of the sources of income for the elder-ly are not fixed but increase along with price increases, thereal questions are the changes in elderly income relative tochanges in the price of goods they purchase and relative tothe incomes of other groups and the diversity in consump-tion and income among older persons.
Our measures of economic well -being indicate that real in-come of older persons rose during much of the 1970s. Thisrising real income for persons in the older age groups pro-duced an increase in real consumption for most of the elder-ly. By contrast, wage increases did not keep up with infla-tion, so the median weekly real earnings of most groups offull -time wage and salary workers were approximately 10percent lower in 1981 than in 1973. As a result the income ofthe elJcrly as a percent of income of the total populationrose. Thus, during the past inflationary decade, the real andrelative economic status of the elderly improved. These con-clusions are based on comparing the experience of differentsets of elderly households over time. Changes in real incomes
80

79
and expenditures for the same set of households in a cohortwere negative; but this is not the result of inflation, rather itis a part of life-cycle patterns in income and spending.
A review of the experience of the 1970s will be helpful inunderstanding the future only if general relationships can beidentified. Thus, in examining each source of income, we ex-amine past changes in response to inflation and the adjust-ment mechanism. In the final section, we reexamine thesegeneral relationships in an attempt to assess the vulnerabilityof the elderly to price changes i a the 1980s.
Measuring Well-Being and Inflation
In order to examine the effect of inflation on well-being, ameasure of well-being must be adopted. We use the prin-ciples of a subjective utility function or satisfaction index asour general measure of well-being. Individuals and familiesare assumed to allocate their productive resources to earn in-come and to allocate their income and time among goodsand services to make themselves as well off as possible. Fordetailed discussions of utility maximization see textbooks byLayard and Walters (1978) or Henderson and Quandt(1980). The concept of economic welfare is discussed and ap-plied in Moon and Smoler.sky (1977).
Changes in prices affect both sides of the income-expenditure relationship. For most families wage and in-terest rates are the most important prices on the income side,but other prices also diiectly affect the incomes of farmersand other self-employed persons. The amount of goods andservices people may consume with their limited resourcesalso depends on prices. Prices that matter most are, ofcourse, those of the goods with the largest budget shares.These budget shares vary from household to householdbecause of differences in age, income and other factors.
81

80
Most transactions in our economy use dollars to measurethe goods and services being traded. Absolute or moneyprices are the rates of exchange between dollars and par-ticular goods and services. The general price level or the levelof the price index is an average level of the money prices inthe economy. This average, however, must be compared tosomething to be meaningful. Typically, the general pricelevel is compared to past price levels or to prices in othercountries or regions. Inflation is the ratio of the sustained in-crease in the general level of prices compared to past levels.It might be thought of as a shrinking of the measuring rodwe use to measure incomes and expenditures. To say that theprices of goods and services in general have risen is to saythat the value of a unit of money has fallen. The magnitudeof this decline is indicated by an increase in the price index.
Several indicators are available for measuring the increasein prices in the United States. Throughout this analysis weuse the consumer price index (CPI) as our indicator of pricechanges. Wahl (1982) and Kahn (1982) recently have debatedthe use of the consumer price index as a measure of inflation.It is generally agreed that changes in the CPI have tended tooverstate the rate of inflation in the United States. Thus, anupward trend in real income will be understated if nominalincome is deflated by the CPI, but for our purposes thisproblem is not severe. For a discussion of the CPI and othermeasures of price changes in the context of the elderly, seeClark et al. (1981).
Information about price changes is valuable but costly, soconsumers and producers use rt.sources to discover howprices have changed. For example, a workers who received awage increase may not know if the wages of workers in otherfirms or occupations have risen. She may then not know if achange of employers would be in her interest without search-ing in the labor market. Especially with variable rates of in-flation, the cost of gathering price information and the costs

81
of mistakes in allocation may be quite sizable. If all pricesrise In exact proportion, and if we all knew that this was hap-pening, inflation would have little effect because we woulddesign our institutions and transactions in a way so as tonullify the influence of these price changes. But in anyeconomy, relative prices of goods and services are constantlychanging along with wages and other determinants of con-sumer incomes. In response, people change the quantities ofgoods and services they buy and sell. They also change hoursof work, occupations, and other determinants of im.ome.With inflation added to normal movement of relative prices,allocative mistakes are more common and this constitutes areal cost of inflation in the economy (Dornbusch and Fischer1981, Gordon 1981).
When people have the opportunity to substitute goods thathave become cheaper for goods that become more expensive,they often can mitigate the negative effects of price changes.In fact, if nominal prices and incomes change in a way thatleaves the original consumption bundle available, the con-sumer could always be bett off after the price change. Oneof the major shortcomings of the CPI as a measure of thecost of living is that it does not allow for substitution inresponse to changes in relative prices.
Major factors in understanding the effects of inflation are:(a) the accuracy of anticipation of inflation, (b) confusionbetween relative price changes and inflation, and (c) (as animportant corollary to the above) the spec,J and cost of in-stitutional adjustments to inflation. If high rates of inflationwere to persist, perceptions, expectations and institutionswould more fully reflect potential inflation and its effectwould be mitigated. This very important distinction betweenanticipate(' inflation and actual inflation should be kept inmind in any discussion of the effects of inflation andespecially in drawing conclusions from past inflations aboutthe potential effects of future inflations.

82
Income ad Expenditures of the Elderlyand Their Sensitivities to Inflation
The major sources of income of elderly households in theUnited States are labor market earnings, social security,employer pensions, government cash transfers, private cashtransfers, in-kind government transfers, asset income andthe use of consumer durables. Some of these income sourcesare effectively fixed by past choices and circumstances,whereas others are responsive to current decisions. Somedecisions are adjusted to changes in the economic environ-ment facing the family (such as changes in actual or an-ticipated rates of inflation) whereas fixed income sources re-spond to changes in the economic environment only throughinstitutional or other channels outside a person's direct con-trol.
The elderly might be distinguished from others by theirshares of income derived from each of the sources. For ex-ample, almost all persons over 65 receive some social securitypayments, which are now indexed for inflation. But sharesof social security income vary widely among the elderlyforsome it is the major income source, for others only a minorsupplemeAt. Another income source almost universal incoverage is medicare benefits, which form a part of the in-kind government transfers. The importance of medicaredepends on the total amount of income available and aoo onthe health of the elderly family. Since this transfer is an in-kind benefit, it is also effectively protected from inflation.Note that as is true for all in-kind transfers, the relative priceof the commodity is affected by the form of the transfer.
Income received in the form of specified quantities of con-sumed goods and services is particularly hard to evaluate.Consider medical services, for example. A household that iseligible for medicare has received a low- (perhaps zero-) pric-
,
84

83
ed insurance plan. Part of the household's income is thevalue of this insurance. Even if a market value for the in-surance could be established, however, some householdswould not have purchased it at that price. Tnus, thehousehold's income is overestimated in valuing medicare atits market value.
The 3e income sources do not depend directly on the cur-rent choices of the elderly, but others do depend on in-dividual choice. The choice to retire or to change hours ofwork are potentially flexible, and the wage earned will be af-fected by inflation. The value of pension benefits and thedecision to accept pensions are also affected by current andanticipated inflation.
Changes in wealth and income from changes in the pricesof assets and durable goods affect potential consumptionand well-being in each period, even if the asset is not soldand the capital gain is not realized. Take housing services,for example. For a family owning the house in which itresides, part of its total income is the service flow in eachperiod from the house. The family housing expenditure in-cludes use of the house (rather than renting or selling it). Anunanticipated increase in the price of houses increaseswealth, but on the expenditure side it also increases the valueof the service flow of housing received and hence the "ex-penditure" on housing.
These examples illustrate that inflation may affect theelderly differently from other families and that this effectwill not be homogeneous among different segments of theelderly population. The amounts and shares of incomereceived from each source and the decisions about work andother investments determine these differential imitcts.
Consumption patterns of the elderly may also differ fromthe rest of the population. Consumption may be decompos-

84
ed as current purchases of good and services, service flowsfrom durables, private in-kind transfers, government in-kindtransfers, net savings, and taxes and government services.The issue of taxes is usually dealt with either by using netafter-tax income or by letting taxes be an expenditurecategory. If income tax payments are thought of as a pay-ment for se-vices, then gross income is the measure of in-come and taxes are one of the expenditure categories.
Given stocks of assets and income, the consumer makes aconsumption-savings decision (that is, hew much to add orsubtract from net wealth) and a portfolio decision (that is,how to allocate savings or dissavings between assets and con-sumer durables). The saving decision of the householddepends on the expected inflation-adjusted interest rate andother factors like expected length of life. The consumer alsodecides the allocation of current consumption among thepotential goods and services. Allocation of consumptiondepends on the total income to be allocated, prices, and theother constraints that may be placed on the household. Anexample of these other constraints is the amount and form ofin-kind income. Inflation may affect the consumption bun-dle by affecting relative prices, real current income, or otherconstraints that apply to the household.
Putting the income and expenditure together allows an ac-counting of the effect of inflation on potential consumption.In application to elderly Americans, specific facts about in-stitutions, behavior patterns, and relative price changes areconsidered. This framework does not formally incorporatethe increase in costs of mistakes in allocation of resource thatfollow necessarily from anticipated price changes. Nor doesit incorporate the cost of additional resources spent ts ac-quire the process information ab ut price changes.

85
Measuring the Real Income of the Elderlywith the Retirement History Study
This section reports changes in income of older persons us-ing populations from the Retirement History Study (RHS).We show the pattern of income as these groups lived throughthe inflationary period of the early 1970s. Examining the in-come of a group of older persons as they age will show theinfluences of lifecycle decisions along with changingeconomic conditions.
The EHS is a series of surveys conducted for the SocialSecurity Administration using respondents aged 58-63 in1969. Married men, nonmarried men, and nonmarriedwomen were interviewed every two years. For this analysis,we use data from the 1969, 1971, 1973 and 1975 surveys. Acomprehensive list of income, work and health questions wasasked of over 11,00o respondents. The RHS has become themost widely used data for examining the income and workpatterns of older persons (Irelan 1972). In each interview,respondents were asked detailed questions concerning theircash income in the preceding year. We focus on averagenominal and real income for mairied couples.
This cohort analysis reveals significant declines in incomrwith aging as earnings decline in response to reduced laboisupply. This expected lifecycle pattern of income must dot beconfused with an inflation effect. The limited evidence sug-gests that the real income of older persons remained fairlystable during the years before retirement and through theretirement period.
Real Inc ,me Patterns
The sources of income in the RHS used to determine fami-ly income are earnings, social security, employer pensions,
8'"i

86
other governmental cash transfers, and asset income. TheRHS survey does not include enough information to assesscarefully the movements in other income sourc, s. Earningsare shown separately for husband and wife and representboth wage and self-employment earnings. The other transferincome includes income from disability and welfare pro-grams. Asset income is composed of income from rent, stockand bonds, and savings accounts.
The sample population of families consists of all husbandand wife couples that remained together throughout thesurvey period; i.e., only those couples interviewed in everysurvey year are included in the base sample. The mean foreach income source is calculated from the set of respondentswith useable answers to the question concerning the specificincome source in question including zero values.
Table 1 shows the income history of husband-wife couplesas the ages of the husbands rise from 57 to 62 in 1968 to 63 to68 years old by 1974. The mean nominal income of $9,773 in1968 falls slightly over the six-year period to $9,129 in 1974.During this period, the consumer price index (CPI) rosefrom 104.2 to 147.7. As a result, the real inconie in 1967dollars of this sample declined sharply from $9,380 to$6,181, a fall of 3' percent. The decline in real income occursin responc;: to inflation and changes in other economic con-ditions ',hat alter the real returns to assets and labor supply.But the income pattern mostly reflects individual lifecycledecisions, especially declining hours of work in old age.
The changing composition of income is of particular in-terst to this study. In 1968, earnings represented 88.2 percentof family income; however, by 1974, nominal earnings of thehusband had dropped by almost half, and family earningsa 'counted for only 45.0 percent of total income. This declineis primarily the result of fevvei hours worked per workersand fewer workers. These are expected lifecycle patterns. But
S' C

87
the earnings decline is also influenced by 'tonging real wagesand family income, which may be altered by inflation.Though earnings are less important to the elderly, even whenthe husbands are aged 64 to 69, they comprise half of theaverage family income.
Table 1Mean Income for Couples in Retirement History Survey
1968-74
Source 1968 1970 1972 1974
EarningsHusband $7,066 $6,545 $5,247 $2,938Wife 1,550 1,546 1,396 1,172
Social security income 190 320 967 2,102Pension income . ... 340 551 1,026 1,709
Other government transfers 63 220 291 262Asset income 565 738 937 1,039
Total nominal income 9,773 9,762 9,863 9,129Total real incomea 9,380 8,394 7,728 6,181
Sample size 3,361 3,416 3,376 3,725
SOURCE: Retirement History Study, 1969-75 interviews.
a. Values in 19u7 dollars as measured by the consumer price index.
Employer pension and social security benefits account foran increasing proportion of average family income as thehousehold ages. Pensions represented 3.5 percent and socialsecurity 1.9 percent of family income in 19( 8, but they in-crease in importance to 18.7 and 23.0 percent, respectively,in 1974. Growth in the mean pension and social security in-come is primarily attributable to the increased proportion ofpersons receiving these payments. Inflation may alter pen-sion income by influencing labor supply choices and byreducing the real value of a given nominai pension. Othermonetary government transfers represent less than 3.0 per-
8 0o

88
cent of income in all years. The effect of inflation on thisform of income depends on the government response tohigher prices in the form of increased benefits.
The significant rise in mean asset income between 1968and 1972, while the average age of the sample increases for60 to 64 years, is consistent with a growth in personal wealthin the years immediately prior to retirement. Hurd andShoven (1982b) found that the real value of stocks and bondsfor RHS .ouples fell, but the real value of bank accountsrose. Real income from current assets depends on the rate ofreturn compared with the change in prices. The elderly ex-perience inflation effects Ccferent from others only if themakeup of their investment portfolios differs.
Table 1 suggests that the fall in real income is due primari-ly to the change in labor market income. This finding is sup-ported by the data in Table 2, which shows real income isfairly stable during the final work years, declines at retire-ment, and then remains constant during the retirement yea's.Disaggregating this sample by age of husband, race andrec4lence reveals a similar pattern of decline in real incomewith age. This decline and changing composition of incomeis also observed for nonmarrierl men and women. This con-clusion is further supported by an examination of oldercohorts in the Panel Survey of Income Dynamics and ofrespondents in the 1972-73 Consumer Expenditure Survey(see Clark et al., 1984). These findings concerning trends inthe real income of older persons as they age are also ingeneral agreement with related findings of Hurd and Shoven(1982a), Barnes and Zedlewski (1981) and Bridges andPackard (19c 1). For a better understanding of the responseof real income to inflation, specific income sources are ex-amined in more detail. This analysis cle,irly indicates thatmost sources of income of the elderly rise with increases inconsumer prices.
90

89
Table:.Real Income for Families in the Retirement History Study
by Year of Husband's Retirement
Real incomea
1968 1970 1972 1974
Retire between 1969-71 10,036 7,281 5,229 5,154Retire between .1971-73 9,953 9,994 7,712 5,327
Retire between 1973-75 9,972 9,602 9,754 7,051
In labor force 1969-75 9,980 9,711 9,718 9,003
SOURCE: Retirement History Study, 1969-75 interviews.
a. Values in 1967 dollars are measured by the consumer price index.
Earnings
Individuals develop lifecycle plans for time and resourceallocation that generate anticipated age-earnings patterns.As persons age, they tend to reduce their labor supply eitherby entirely leaving the labor force or by working fewerhours. The declines in mean cohort earnings reported earlierare not unexpected and should not be considered mainly aresponse to inflation. However, unanticipated events such asunexpectedly high rates of inflation may cause persons tochange their lifetime plans of work and retirement. Thesechanges would occur in response to changes in the real wagerate and to shifts in the real value of wealth.
As long as real wages and real wealth are unchanged inresponse to inflation, older persons would likely not modifytheir work and retirement plans during periods of risingprices. The important issues are how inflation alters the realcompensation package and wealth that ,., person expects.ClearIy, the wage may change in late life even without pricechanges. The wage could be changing in response toeconomy-wide productivity gains, other macroeconomic
9.

90
conditions, individuals augmenting their skills, or personssuffering declin.s in their talents, perhaps because of healthdeclines. Lifecycle models usually predict declining realwages during the final work years (Ghez and Becker 1975).
Various institutional al rangements such as labor contractsand equal opportunity la vs may limit wage adjustments byhampering reductions in Aominal wage rates while allowingreal wage reductions. Inflation may permit some firms tolower real wages and encourage earlier retirement. Even ifthe cash wage rises at the same rate as prices, the total com-pensation may fall because of the effect of inflation on thereal value of fringe benefits. For example, the real value ofinitia; pension benefits decline with rising prices if the benefitis determined using a salary averaging period (Clark andMcDermed 1982).
Table 3 shows that the labor force participation rate forhusband; fell from 79.4 to 25.2 percent between 1968-1974.For men in the labor force, average hours of work declinedfrom 42.6 to 34.4 hours per week. Smaller declines occurredfor wives in both of these measures of labor supply. Thesereductions in labor supply reflect declines in work with ageand responses to inflation and other economic events.
Table 3Labor Supply of Couples
Husbands Wives
Labor forceparticipation
Hours perweek
Labor forceparticipation
Hours perweek
1969 79.4 42.6 33.1 35.9
1971 65.1 41.3 31.7 35.8
1973 40.5 39.4 25.5 34.9
11.5 25.2 34.4 20.1 32.9
SOURCE: Retirement History Study, 1969.75 interviews.

91
During this period, average earnings for men declined bymore than 57 percent, reflecting reduced market work. Earn-ings of wives fell by 23 percent. These declines in nominalearnings occurred despite rising nominal wages. The averagenominal wage of working men rose by one-third from $3.71in 1969 to $4.93 in 1975 and the mean nominal wage ofworking wives rose by 60 percent. However, the real wage ofmen fell by almost 10 percent and average real earningsdropped 70 percent. By contrast, the real wage of the wives,who are usually slightly younger than their husbands, rose by10 percent, but their real earnings fell because of reducedlabor supply.
Social Security
Throughout the first three decades of the existence of thesocial security system, benefits were increased periodicallyby specific congressional action. The 1972 amendments pro-vided for automatic indexing of benefits starting in 1975.Past earnings records were indexed to provide for rising realinitial benefits. Both the indexing and the a,.: hoc changeshave actually increased the real value of social securitybenefits for many retirees. For example, the benefits of aperson retired in 1967 would have risen by 171 percent be-tween 1968 --Id 1979. Since the CPI rose by 117.7 percent,real social security benefits have increased by approximately25 percent. Most of these real increases occurred between1968 and 1972, prior to the automatic adjustment ofbenefits. Since that time, benefits have risen in step with in-creases in the CPI, and the real value of benefits has by andlarge remained constant. Nominal increases in benefits afterretirement between 1968 and 1982 are shown in Table 4.
An examination of increases in social security benefits inthe RHS sample indicates that real social security incomewas largely insulated from erosion by price increases. The ad
9n0

Table 4Social Security Benefits in January of Each Yeara as a Percent of Initial Benefits
Year 1968 1969 1970 1971 1972 1973 19 fe; 1975 1976 1977 1978 1979 1980 1981 1982
1968 100 113 130 143 143 172 In 190 106 219 212 247 271 310 3451969 100 115 127 127 152 152 168 182 194 205 218 240 274 3051970 100 110 110 132 132 147 158 168 178 190 209 239 2661971 100 100 120 120 133 144 153 162 173 190 217 2411972 100 120 120 133 144 153 162 173 190 217 2411973 100 100 III 120 128 135 144 158 181 2011974 100 III 120 128 135 144 158 181 2011975 100 108 115 122 130 142 162 1801976 100 106.4 113 120 132 151 1681977 100 105.9 113 124 142 1581978 100 106.5 117 134 1491979 100 109.0 126 1401980 100 114.3 1271981 100 111.21982 100
SOURCE: Social Security Bulletin: Annual Statistical Supplement, 1977-79, p. 26 and recent issues of Social Securtc dullettn.a The values along a row indicate the Social Security benefit ;a each year as a percent of benefits in the year a person retired. For example, findthe year of retirement on the left hand column, say 1971. In 1974, the benefit for a person who retired in 1971 is 120 percent of the initial benefitreceived in 1971. These percentages represent the minimum percentage increase in primary insurance amounts.

93
hoc increases in post-retirement benefits were sufficient tostabilize or increase real benefits during this decade. Initialbenefits were rising more rapidly than the rate of inflation.These findings have important implications :or the impact ofinflation on the well-being of the elderly. First, this impor-tant component of income of older persons has not declinedwith price increases. Since over 90 percent of persons 65 andover receive social security benefits, this is a significantobservation. Second, low income persons rely more heavilyon social security benefits since they tend not to have otherforms of cash income. For example, the 1970 Survey of New-ly Entitled Beneficiaries indicated that for the lowest incomegroups social security benefits accounted for over 80 percentof total cash income, but for high income groups, socialsecurity is less than 20 percent of income.
Initial benefits at retirement also have risen rapidly. Table5 illustrates the rise in initial benefits when average monthlyearnings are held constant over time. Rising lifetime earningsof successive cohorts of retirees have produced additionalgains in initial benefits because of higher average monthlyearnings.
Pension Benefits
The real value of pension benefits during retirement isdetermined by the rate of inflation and the extent of anypost-retirement benefit increases. One method of illustratingthe effect of inflation on the real value of pension benefits isto calculate the expected wealth value of a constant benefitover a person's life. In this formulation, the value of the pen-sion annuity is discounted by an interest rate and the prob-ability of remaining alive to receive the benefit. For a60-year-old male retiree, a 7 percent annual rate of inflationlowers the discounted value of his pension wealth by 58 per-cent (Clark and McDermed 1982).
95

94
Table 5Benefits for Persons Starting Payment at Age 65
in Various Years When Average Monthly Earningsare $250, $500, $750, $1,000
AME
Year $250 $500 $750 $1,000
1969 114.51 117.51 218.00a 218.00a
070 131.68 209.13 250.70a 250.70a
071 144.85 224.56 295.40a 295.40a
197 2 144.85 224.56 295.40a 295.40a
1973 173.82 269.46 354.97 404.50a
1974 192.93 299.10 394.01 449.54
1975b 208.37 323.03 425.53 485.48
1976b 221.69 343.66 . 452.73 516.50
1977b 234.77 363.94 479.454 547.00
1978b 250.03 387.60 510.62 582.57
1979b 274.78 425.60 561.18 640.25
SOURCE: Derived from information in Social Security Bulletin. Annual Statistical Sup-plement, 1977-79, pp. 15-19.
a. Reached or exceeded the maximum level of PIA.
b. Law was effective in June of the given year.
This illustration assumes that pension benefits are not in-creased after a person retires and begins receiving benefits.Many pension plans, however, are increased in response toinflation, so benefits rise when the CPI increases. For exam-ple, the Federal Civil Service Retirement system has been ful-ly indexed since 1962 and many private plans provide ad hocincreases (King 1982). Allen, Clark and Sumner (1984)report that the average pension benefit for persons whoNiired before 1973 rose by 24 percent between 1973 and1979. This represented 40 percent of the CPI rise during theperiod. These increases were widespread, as 75 perceni of allbeneficiaries received at least one increase.
9G
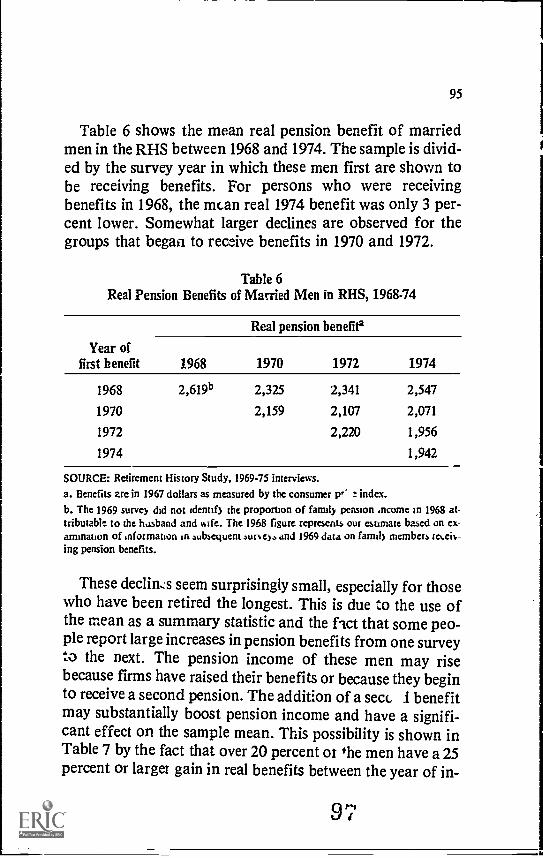
95
Table 6 shows the mean real pension benefit of marriedmen in the RHS between 1968 and 1974. The sample is divid-ed by the survey year in which these men first are shown tobe receiving benefits. For persons who were receivingbenefits in 1968, the mean real 1974 benefit was only 3 per-cent lower. Somewhat larger declines are observed for thegroups that began to receive benefits in 1970 and 1972.
Table 6Real Pension Benefits of Married Men in RHS, 1968-74
Real pension benefit'
Year offirst benefit 1968 1970 1972 1974
1968
1970
1972
1974
2,619b 2,325
2,159
2,341
2,107
2,220
2,547
2,071
1,956
1,942
SOURCE: Retirement History Study, 1969-75 interviews.
a. Benefits are in 1967 dollars as measured by the consumer pr" t index.
b. The 1969 survey did not identify the proportion of family pension income in 1968 at-tributablz to the husband and wife. The 1968 figure represents out estimate based on ex-amination of information in subsequent surveys and 1969 data on family members mum-ing pension benefits.
These declines seem surprisingly small, especially for thosewho have been retired the longest. This is due to the use ofthe mean as a summary statistic and the flu that some peo-ple report large increases in pension benefits from one surveyto the next. The pension income of these men may risebecause firms have raised their benefits or because they beginto receive a second pension. The addition of a sect I benefitmay substantially boost pension income and have a signifi-cant effect on the sample mean. This possibility is shown inTable 7 by the fact that over 20 percent or the men have a 25percent or larger gain in real benefits between the year of in-
9 "r

96
itial benefits and 1974. Table 7 also shows that when thesample is divided at the mean of initial benefits, fewer per-sons with initial benefits below the mean had a decline in thereal value of their benefits. Further evidence that much ofthe gain in real pension income is due to the starting of a sec-ond pension is the finding that almost 90 percent of personswith gains of 25 percent or more are persons who had pen-sion income below the mean when they first started receivingbenefits. Thus, it seems likely that these men began pensionsfrom previous jobs as soon as they were eligible for benefits.These relatively low benefits were eventually supplementedby retirement income from more recent employment.
Table 7Percent of Beneficiaries with Change in Pension Income
Between Initial Year of Benefits and 1974
1968retirees
1970retirees
1972retirees
Any increase innominal benefits 49.1 52.9 53.2
Loss in real benefits 70.0 64.7 69.0
Gain in real benefits 30.0 35.3 31.0
Above mean benefitLoss in real benefits 79.3 78.3 81.4Gain in real benefits 20.7 21.7 18.6
Below mean benefitLoss in real benefits 64.9 57.7 62.1Gain in real benefits 35.1 42.3 37.9
SOURCE: Retirement History Study, 1969-75 interviews.
These results are generally consistent with the findings ofThompson (1978) that the median pension benefit for com-pletely retired pensioners in the RHS aged 63-64 rose from$1,980 in 1970 to $2,160 in 1974. This represents a fall in the
9C

97
real value of the benefits, since the CPI increased by 14 per-cent and the nominal benefits rose by on'.3, 9 percent. The useof completely retired persons probably eliminates many per-sons who acquired a second pension but continued employ-ment. This restricting of the sample population reduces thevariability of pension income over the period and reducesmuch of the gains in pension income.
Evidence on Real Incomes of Persons 65 and Older
In contrast to the cohort analysis that follows a specificgroup of individuals over time, this section uses aggregatedata to indicate the rising real income of all persons 65 andolder in each year. This analysis starts with a review of thetrend in cash income and then extends the discussion to in-clude the use of time and the value of in-kind benefits.
The median cash income, deflated by the CPI, of familieswhose head is aged 65 or older rose by almost 100 percentbetween 1950 and 1980. This rising real income of the elderlyis own in Table 8. Compared to that of all families, therelative income of older families declined by 10 percent in the1950s, remained fairly stable during the 1960s and rose by 20percent during the 1970s. Because the median income of allfamilies can be substantially affected by the age-compositionof the population, the real income of older families is com-pared in Table 8 with that o.7 families whose head is age45-54. Heads of these families are in their peak earningsyears, thus the ratio of the income of elderly families to thatof families with heads aged 45-54 will be lower than whencompared to the relative income of all families. Compared tothe income of these middle-aged families, the relative incomeof older families fell by 13.4 percent during the 1950s and by6.7 percent in the 1960s before rising by 13.4 percent duringthe 1970s (see Table 9). During these decades, the consumerprice index rose by 23.3 percent, 31.1 percent, and 112.4 per-

98
cent, respectively. Thus, the loss in relative income wasgreatest when inflation was the lowest and there was asignificant gain in relative income during the high-inflationdecade of the 1970s. It could be argued that the rise inrelative income of the elderly occurred because of the virtualcessation of real economic growth daring the 1970s whichstopped the growth in the real income of workers. By con-trast, the real income of the elderly continued to rise with in-creases in the real value of government transfers.
Table 8Real Median Family Income
Head of family65 and over
(1)
Head of familyaged 45-54
(2)
Relative incomeof elderly families
I(1+2)x1001
1950 S2,639 $ 5,110 51.61955 2,900 6,344 45.7
1960 3,266 7,303 44.71961 3,377 7,491 45.11962 3,536 7,770 45.51963 3,655 8,086 45.21964 3,634 8,344 43.6
1965 3,661 8,717 42.01966 3,750 9,116 41.11967 3,927 9,676 40.61968 4,348 10,012 43.41969 4,374 10,561 41.4
1970 4,345 10,422 41.71971 4,495 10,706 42.01972 4,763 11,218 42.51973 4,827 11,437 42.21974 5,081 11,210 45.3
1975 4,998 10,899 45.91976 5,115 11,165 45.81977 5,019 11,478 43.71978 5,193 11,580 44.81979 5,202 11,661 44.6
1980 5,215 11,035 47.3
SOURCE: U.S. Bureau of Census, Current Population Reports, Series P-60, various years.a. Values derived by deflating nominal income by CPI, 1967=100.
100

99
Table 9Change in Real and Relative Income
Percent increase in realcash median income
Perceat changein relathe Percent change
Family head Family head income of in consumeraged 65 & otter aged 45.54 elderlya price index
1950-60 23.8 42.9 -13.4 23.31960-70 33.0 42.7 -6.7 31.11970-80 20.0 5.9 13.4 112.*
SOURCE: Table 8.
a. Percent change in last column of Table 8.
A further indication of the improving relative income ofthe elderly is the decline in the incidence of poverty amongolder Americans. Table 10 shows this decline along with thechange in the poverty rate for the total population. Thedecline of poverty among the elderly has been much greaterthan among other groups, and in 1982 for the first time thepoverty rate of the elderly was less than that for tht popula-tion at large.
The subsection on earnings showed that households alsovary the way in which they allocate their time in order to in-fluence their level of living. Instead of market work, timecan be used to produce services consumed by the family.These services may be in the form of meal preparation, homerepairs, leisure time, etc. Time at home is an importantaspect of family well-being. The trends in cash incomepresented above do not include changes in time at home thatwould affect family well-being.
Age-specific labor force participation rates are onemeasure of the intensity of market work by a populatit,ngroup and hence are an indirect measure of time availablefor home activities. Table 11 shows that the participation

100
rate for males aged 65 and over fell by over 50 percent be-tween 1950 and 1980. Participation rates for older womenhave fallen slightly during this period. Thus, the rise in realincome reported in Table 8 understates the increase inwelfare because of significant increases in home time by theelderly. By contrast, the total work effort of persons 45-54increased during these three decades and the gains in incomefor them overstates the rise in their well-being.
Table 10Poverty Rates of the Elderly and Total Population
Elderly Total population
Povertyrate
Number ofpersons
Povertyrate
Number ofpersons
(in millions) (in millions)
1959 32.2 5.5 22.4 39.5
1968 25.0 4.6 12.8 25.41969 25.3 4.8 12.1 24.1
1970 24.5 4.7 12.6 25.41971 21.6 4.3 12.5 25.61972 18.6 3.7 11.9 24.51973 16.3 3.4 11.1 23.01974 15.7 3.3 11.6 24.31975 15.3 3.3 12.3 25.91976 15.0 3.3 11.8 25.01977 14.1 3.2 11.6 24.71978 14.0 3.2 11.4 24.51979 15.2 3.7 11.6 25.31980 15.7 3.9 13.0 29.31981 15.3 3.9 14.0 31.81982 14.6 3.8 15.0 34.4
SOURCES. U.S. bureau of Census, C.:rrent Population Reports, Series P-60, No. 127,"Money Income and Poverty Status of Families and Persons in the United States. 1980'.(Advance Data from the March 1981 Current Population Survey), t,PO, Washington,1981, r. 29 and U.S. Bureau of Census, Current Population Reports, - -,es P-60, No. 140,"Money Imo= and Poverty Status of Families and Persons in the Unites' States. 1982,"GPO, Washington, 1983, p. 4.
102
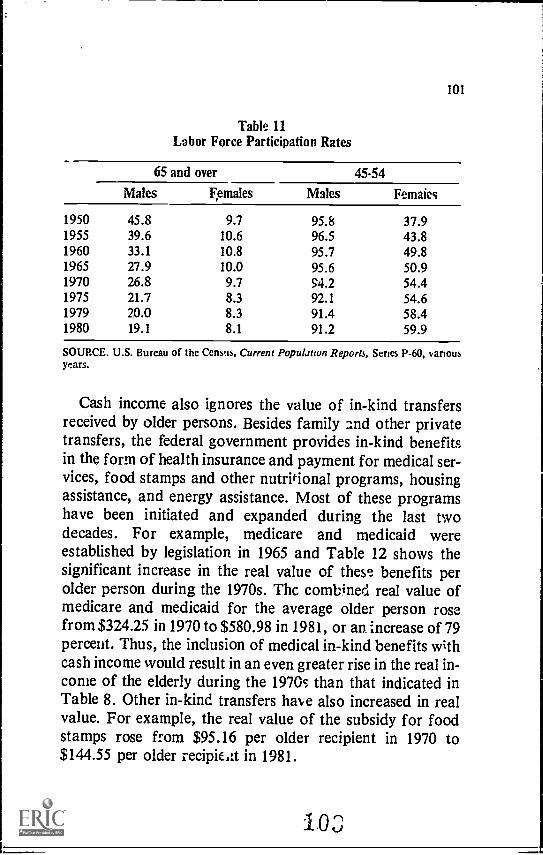
101
Table 11Labor Force Participation Rates
65 and over 45.54
Males Females Males Females
1950 45.8 9.7 95.8 37.91955 39.6 10.6 96.5 43.81960 33.1 10.8 95.7 49.81965 27.9 10.0 95.6 50.91970 26.8 9.7 S4.2 54.41975 21.7 8.3 92.1 54.61979 20.0 8.3 91.4 58.41980 19.1 8.1 91.2 59.9
SOURCE. U.S. Bureau of the Census, Current Population Reports, Series P-60, variousyears.
Cash income also ignores the value of in-kind transfersreceived by older persons. Besides family and other privatetransfers, the federal government provides in-kind benefitsin the form of health insurance and payment for medical ser-vices, food stamps and other nutritional programs, housingassistance, and energy assistance. Most of these programshave been initiated and expanded during the last twodecades. For example, medicare and medicaid wereestablished by legislation in 1965 and Table 12 shows thesignificant increase in the real value of these benefits perolder person during the 1970s. The combined real value ofmedicare and medicaid for the average older person rosefrom $324.25 in 1970 to $580.98 in 1981, or an increase of 79percent. Thus, the inclusion of medical in-kind benefits withcash income would result in an even greater rise in the real in-come of the elderly during the 1970s than that indicated inTable 8. Other in-kind transfers have also increased in realvalue. For example, the real value of the subsidy for foodstamps rose from $95.16 per older recipient in 1970 to$144.55 per older recipient in 1981.
10

102
Table 12Real In-Kind Transfers of Medical Services
Per Persons Aged 65 and Over
Medicare' Federal Medicaidb
Health Supplementalinsurance health insurance
1970 215.07 47.26 61.92
1975 278.70 69.72 76.72
1978 309.42 92.38 90.95
1981 370.54 126.54 83.9C
a. Values deflated by the medical component of the consumer price index, 1967 = 100.b. Estimates for total medicaid expenditures for persons aged 65 and over are divided bypopulation aged 65 and over. Expenditure estimates are from unpublisned data fromDepartment of Health, Education anc: Welfare (1978), Califano (1978) and U.S. Congres-sional Budget Office, 1982. Nominal values are deflated by the medical component of theconsumer price index.
The Growth of Federal Transfer Programsto the Elderly
This section provides documentation of the role of federaltransfers in the income of the elderly. During the past halfcentury, the federal government has played an increasingrole in the determination of the economic well-being of theelderly. The growth and development of cash and in-kindbenefit programs has significantly altered the sources of in-come for most older persons. Federal expenditures on theelderly include payments through retirement programs, oldage survivors disability insurance (OASDI), health-care sub-sidies, welfare programs, housing assistance and social ser-vices. Table 13 lists the specific programs and the costs oftransfers from these programs in fiscal 1982 (U.S. Congres-sional Budget Office 1982; also see Califano 1978).
These federal expenditures have risen dramatically sincethe early 1960s because of legislative changes and growth in
104

103
the older population. The number of people aged 65 andover has increased by 57.5 percent, from 16.7 million in 1960to 26.3 million in July 1981. Benefit programs to the elderlywere $12.8 billion in 1960, whereas expenditures in 1982reached $196.2 billion, a fifteenfold increase. These figuresdo not include the value of preferential tax treatment givento the elderly.
Table 13Estimated Federal Outlays for Persons 65 and Older
by Program, Fiscal Year 1982(in billions of dollars)
Program Outlays
Social Security 111.8Medicare 39.7Other federal retirement and survivor programs 21.1Medicaid 6.5Veterans' benefits 4.3Housing Assistance 3.3Supplemental Security Income 2.9Other federal health programs 2.3Administra 'ion on Aging 0.7Food stamps 0.6Title XX Social Services 0.4Energy Assistance 0.2Other 2.4
Total 196.2
SOURCE: U.S. Congressional Budget Office, Work and Retirement. Options for Con-tinned Employment of Older Workers, Washington: GPO, July 1982, p. 55.
Between 1960 and 1982, the CPI more than tripled. As aresult, expenditures measured in 1967 dollars were $14.4billion in 1960, and real spending on these programs in 1982was five times the 1960 level. Thus, although two-thirds ofthe growth rate in annual spending on the elderly is due toprice increases. there still has been a significant increase in
105

104
the real resources allocated to these programs. The propor-tion of the federal budget used to finance these programsrose from 13 percent in 1960 to 26.6 percent in 1982; the pro-portion of the gross national product allocated to thesebenefit programs rose from 2.5 to 5.9 percent (Califano1978; Torrey 1982).
Another way to measure this growth is to note that theaverage benefit per person aged 65 and older increased from$768 in 1960 to $7,948 in 1982. If benefits had been increasedonly to reflect price increases, the average benefit wouldhave been $2,516 in 1982; if benefits had risen in accordancewith the growth in per capita disposable income, on the otherhand, the transfer per elderly person would have been $3,663in 1982. This increase is the result of the introduction of newprograms, higher benefits under existing programs and lessrestrictive eligibility conditions. Thus, much of the"graying" of the federal budget has occurred because of ex-plicit policy changes by the federal government (Clark andMenefee 1981). One important change in federal policy hasbeen the indexing of government programs to changes inconsumer prices. Presently, 86 federal programs now haveone or more provisions that increase in response to a rise insome index, usually a measure of prices or wages (U.S. Con-gressional Research Service 1981). Indexing reduces the lagand uncertainty of increases caused by ad hoc adjustments.
The Relative ImpactImperfectly Anticipated Inflation
In addition to changes in real income, there are general ef-fects of inflation on well-being that arise from its unpredict-ability. Correctly ticipated inflation not entailing relativeprice changes causes people to hold less cash and make morefrequent transactions, but these are relatively minor costs(Dornbusch and Fischer 1981; Gordon 1981). However, the
106

105
rate of inflation is seldom fully anticipated and higher ratesof inflation tend to be accompanied by more relative pricevariability and by more variability in the rate of inflation(Vining and Elwertowski 1976; Bordo 198]; Parks 1978;Cukierman 1979; Logue and Willett 1976). When incorrectlyanticipated, an inflation factor is not built into market trans-actions and institutions of an economy. This causes the basiclosses in well-being and sense of unfairness that make infla-tion so unpopular.
The elderly share in losses to the whole economy from notfully anticipated inflation, but they are not likely to suffermore, on average, than other groups. Two factors are in-volved in their relative losses. First, any group that tends tobe more mistaken in its inflation expectations would losemore. Given that the elderly have had more experience witheconomic and political change and have more time awayfrom work to devote to market tratisaztions, they may welldo a better job of correctly anticipating inflation rates. Sec-ond, any group that has higher costs of adjusting investmentand consumption patterns to changes in relative prices im-plied by inflation would lose more. The elderly are more like-ly to be retired and thus potentially more mobile; they havemore time away from jobs to be used for leisure and con-sumption, so they may be more flexible in their buyi.ig andinvestment decisions. Thus, there is no presumption that theelderly suffer more or less from the welfare losses due tomistakes and adjustment costs than do others as theeconomy faces inflation.
Summary and Implications
Earlier sections of this paper have been devoted to examin-ing the historical record of improving real income of theelderly. this analysis will be seful for current policymakingonly if general and continuing relationships exist. The objec-
' ''''1 0 1

106
tive of this final section i., to assess the findings of thisresearch for projecting the future status of the elderly.
The elderly tend to spend larger proportions of their in-comes on food at home, medical care, and utilities than doyounger families. Reasons for these differences includelower income for older families, more time at home, anddeclining health with age. These different spending patternsimply different sensitivities to relative price changes.
There is no theoretical reason to expect relative pricechanges of the 1970s to continue into the future. For exam-ple, house prices rose rapidly during the 1970s but rose at aslower rate during the early 1980s. Also, food prices haverisen more than the CPI in some years and less in others. Theimportance of relative price changes in determining changesin well-being should not be overlooked, but existing researchon age-specific price indices suggests that price increases af-fecting particular demographic groups do not deviatesubstantially from the increase for the general population.Recognizing substitution in consumption further moderatesthe effects of differences in relative price changes on the in-crease in the price of the market basket actually purchasedby different gro "ps.
These basic concepts and review of recent price changes in-dicate that relative price changes within a general inflationwill have only minor effects on the well-being of the elderlycompared to those for other demographic groups. Thus, theprimary issue governing the effect of inflation on real in-come of the elderly is the responsh eness of their incomes torises in the general price level and costs imposed by im-perfectly anticipated price changes.
Earnings are determined by the amount of labor suppliedand the market wage rate. Although labor supply falls withage, earnings remain an important source of income for
1 0 r'

107
many older persons. Real wages rise with growth in produc-tivity. There is no theoretical reason why growth in the realwage rate for older workers would deviate from this generalpattern of wage growth in the economy. This source of in-come should not cause changes in relative income betweenthe elderly and the total population, and, in general, realwage growth wii contribute to rising real income.
Social security retirement benefits and other governmentaltransfers have increased rapidly in real value during the pasttwo decades. Since government transfers are now a majorsource of income for older persons, their responsiveness toprice increases is an important determinant in the effect ofinflation on real income. If the recent legislative patternswere to continue along with the existing indexation of pro-grams, the trend in real income of the elderly establishedduring the last two decades could be expeaed to continue.However, many demographic, economic and political fac-tors are changing in ways that will limit the growth oftransfer payments to the elderly.
Social security legislation passed in 1983 represented theculmination of years of debate concerning the long- andshort-run financial crises the system was facing. This legisla-tion provided for significant changes in the system and pro-vided for a projected funding balance over the next 75 years.While the basic tenants of the program were left unchanged,the 1983 cost-of-living increase was delayed six months andfull indexing in the future was made conditional on therelative size of wage and price increases. These changesslightly reduce the inflation protection guaranteed throughthis major source of income to the elderly.
The aging of the population, especially in the first 20 yearsof the next century, will require a major restructuring of thetotal income maintenance system for the elderly. Either taxesmust be raised substantially, benefits must be lowered or
1. 0 9

108
funds diverted from other national priorities. The 1983social security legislation attempted to address this long-runnroblem by raising the age of eligibility for full benefits to 67
the next century. In addition, medicare must beicevaluated to prevent rapidly rising costs from producinglarge deficits; in the coming decades other transfers likelywill be affected by this demographic pressure which maylimit their future growth.
The increase in real benefits for older persons wasstimulated in large measure by the belief that many olderpersons were destitute and private methods would not pro-vide the necessary transfers. The rise in real and relative in-come of the elderly, along with a sharp decline in the in-cidence of p werty, has reduced or eliminated some of thepressures for major new programs or increases in realbenefits for the elderly in general. Recent budgetary in-itiatives have reduced benefits and tightened eligibility condi-tions for medicaid, A.,od stamps, and other welfare programsthat provide benefits to some older persons. Social securityand medicare benefits have also been altered during the early1980s.
The trend toward indexation of these benefit programs isattributable to the still commonly held view that the elderlylive on fixed incomes. The full and perhaps over indexationof benefits during the past decade when real wages were fall-ing has sharply challenged this belief. As a result, the indexa-tion of social security, government pensions, and othertransfers has been critically examined and numerous pro-posals for their reductions have been made. Changes in themethods of indexing federal pensions and food stamps havealready been enacted and further modification of other in-dexing provisions seems likely during the 1980s.
High rates of inflation may cause financial institutions tobe altered so that future payments reflect price changes. For
11
4

109
the elderly, one of the most important of these institutions isthe employer pension system. Available evidence indicatesthat real pension benefits after retirement have declined withinflation. This is despite the fact that many firms provide adhoc increases. A more for:nal adjustment mechanism wouldseem likely if high rates of inflation were to continue foranother decade.
Real income from assets depends on changes in the relativerate of return to the items in an individual's investment port-folio. Rates of return fluctuate over time, with price changesin houses, gold, diamonds, and stocks being recent ex-amples. Wealth allocation decisions of the elderly will bebased on expected future inflation rates and real rates ofreturn to their assets. In such a framework, the expected ef-fects of inflation on the real wealth of the elderly should notdiffer greatly from its effects on the rest of the population.
Older persons also consume from their stock of durablegoods. These goods include the family car, home, furniture,appliances, etc. The nominal value of consumption rises asthe replacement costs of these durables rise. The real value ofconsumption from durable goods should be unaffected byprice increases and since the elderly often have a relativelylarge stock of durables, the "indexation" of this incomesource is important.
This summary indicates that most sources of income of theelderly rise in response to increasing prices. There is no fun-damental reason to expect real earnings or return to assets tofall with inflation. Most government transfer programs arecurrently indaxed to reflect price increases automatically.However, policy changes in the next few years may alterthese provisions. Nominal pension benefits have been in-creased, but, in general, these increases lag behind pricechanges; howe "er, future institutional changes maymoderate this effect. Thus, income from private sources isnot fixed.
I11
110
Our analysis shows that currently it is not true that theelderly live on fixed incomes and are, therefore, morevulnerable to inflation than the total population. This isespecially true for low-income older persons who receivealmost all of their income from public sources. Did the elder-ly ever live on fixed incomes? This question is beyond thescope of this paper; however, several issues are relevant.Prior to World War II, over half the men aged 65 and overremained in the labor force and thus had earnings that rosealong with those of other workers. Many lived on farms andretained control of the extended family's resources.Transfers from thr family may have been replaced bygovernment transfer, uring the past several decades.
In the future, the effect of inflation on the real income ofthe elderly will depend on private responses and governmentchanges. Will children increase their support for their agedparents? Will individuals alter their lifecycle savingsplans toprovide increased wealth for old age? Will the trend towardearly retirement be reversed? Will changes in political andeconomic climate lead to a reversal of existing inflation pro-tection of the income of the elderly? Answers to these ques-tions will determine the future level of income and the effectsof inflation on the well-being of the elderly.
Bibliography
Allen, Steven, Robert Clark and Daniel Sumner "Post-Retirement Ad-justments of Pension Benefits," North Carolina State Working PaperNo. 44, January 1984.
Barnes, Roberta and Sheila Zedlewski, The Impact of Inflation on theIncome and Expenditure of Elderly Families, Working Paper 1401-1,The Urban Institute, Washington, DC, April 1981.
Bordo, Michael David, "The Effects of Monetary Change on RelativeCommodity Prices and the Role of Long-Term Contracts," Journalof Political Economy, December 1980, pp. 1088-1109.
112

1 1 1
Bridges, Benjamin and Michael Packard, "Price and Inc ne Changesfor the Eder ly," Social Security Bulletin, January 1981, pp. 3-15.
Ca lifano, Joseph, "The Aging of America: Questions for the Four-Generation Society," Annuals of the American Academy of Politicaland Social Science, July 1978, pp. 96-107.
Clark, Robert and Ann McDermed, "Inflation, Pension Benefits andRetirement," Journal of Risk and Insurance, March 1982, pp. 19-38.
Clark, Robert and John Menefee, "Federal Expenditures for the Elder-ly," The Gerontologist, April 1981, pp. 132-37.
Clark, Robert, George L. Maddox, Ronald A. Schrimper and Daniel A.Sumner, Inflation and the Economic Well-Being of the Elderly,Baltimore: John., Hopkins University Press, 1984.
Cukierman, Alex, "The Relationship between Relative Prices and theGeneral Price Level: A SugEested Interpretation," AmericanEconomic Review, June 1979, p?. 444-47.
Dornbusch, Rudiger and Stanley Fischer, Macroeconomics, New York:McGraw-Hill, 1981.
(,hez, Gilbert and Gary Becker, The Allocation of Time andGoods Overthe Life - Cycle, New York: National Bureau of Economic Research,1975.
Gordon, Robert, Macroeconomics, Boston: Little, Brown and Com-pany, 1981.
Henderson, James and Richard Quandt, Microeconomic Theory, NewYork: McGraw-Hill, 1980.
Hurd, Michael and John Shoven, "Real Income and Wealth of theElderly," American Economic Review, May 1982, pp. 314-18.
Hurd, Michael and John Shoven, "The Economic Status of the El-derly," Working Paper No. 914, National Bureau of EconomicResearch, 1982.
Irelan, Lola, "Retirement History Study: Introduction," Social SecurityBulletin, November 1972, pp. 3-8.
Kahn, Alfred E., "A Comment on Wahl's Argument." Jcurnal ofPolicy Analysis and Management, Vol. 1, No. 4, Summer 1982, pp.511-515.

112
King, Francis, "Indexing Retirement Benefits," The Gerontologist,December 1982, pp. 488-92.
Layard, P.R.G. and A.A. Walters, Microeconomic Theory, New York:McGraw-Hill, 1978.
Lowe, Dennis and Thomas Willet, "A Note on the Relation between theRate and Variability of Inflation," Economica, May 1976, pp.151-158.
Moon, Marilyn and Eugene Smolenski, Improving Measures of Well-Being, New York: Academic Press, 1977.
Okun, Arthur, *Inflation: The Problems and Prospects Before Us," inArthur Okun, Henry Fowler and Milton Gilbert (eds.), Inflation: TheProblems It Creates and Policies It Requires, New York: NYU Press,1970.
Parks, Richard, "Inflation and Relative Price Variability," Journal ofPolitical Economy, February 1978, pp. 79-95.
Thompson, Gayle, "The Impact of Inflation on the Private PensionBenefits of Retirees, 1970-74: Findings from the Retirement HistoryStudy." Social Security Bulletin, November 1978, pp. 16-25.
Torrey, Barbara, "Guns vs. Canes: The Fiscal Implications of an AgingPopulation," American Economic Review, May 1982, pp. 309-13.
U.S. Congressional Budget Office, Work and Retirement: Options forContinued Employment of Older Workers, Washington: GPO, July1982.
U.S. Congressional Research service, Indexation of Federal Programs,Washington: GPO, 1981.
Vining, Daniel and Thomas Elwertowski, "The Relationship betweenRelative Prices and the General Price Level," American EconomicRe "iew, September 1976, pp. 699-708.
Wahl, Richard W., "Is the Con.amer Price Index a Fair Measure ofInflation?" Journal of Policy Analysis and Management, Vol. 1, No.4, Summer 1982.
White House Conference on Aging, Final Report, 1981, Vol. I.
I 1 4

6
Introduction
Over the Hilland Under the Weather
Age v. Health
Monroe BerkowitzRutgers University
If there is an article of faith among gerontologists, it isthat chronological age is irrelevant. Over and over again, weare told that some persons are ready for retirement in their30s and 40s, while others are responsible for greatphilosophical or scientific achievements well intc their eighthand ninth decade of life.
Examples of age v nd creativity are cited in the column byCyril F. Brickfield, executive director cf the Association ofRetired Persons.' Jessica Tandy at age 74 opened trium-phantly on Broadway in the demanding role of AmandaWinfield in the revival of Tennessee Williams' "GlassMenagerie." Her performance was widely acclaimed by thedrama critics. Just down the street, Rex Harrison, at age 75,opened successfully in the revival of "Heartbreak House"by George Bernard Shaw, who continued to write plays untillate in life.
The same evidence is clear from last year's Nobel Prizeawards. At age 81 Barbara McClintock won the Nobel formedicine while Subrahmanyan Chandrasekhar, 73, andWilliam Fowler, 72, shared the prize for physics.
Other examples abound. Benjamin Franklin inventedbifocals at age 78; Giovanni Co lle at age 70 provided the first

114
definitive description of blood transfusion and BenjaminDuggar discovered a life-saving antibioLic at age 76.Brickfield conclude that creativity can occur at any age,even at advanced ages, and creativity in old age is not foundonly among the rare individuals who are famous.
The absurdity of the compulsory retirement age isdramatized neatly in a letter from Bernard L. Baer in theNew York Times, February 19, 1984. At age 73 Baer volun-tarily retired and after a year of frustrating idleness began tclook for jobs. He maintains he was 100 percent able mentallyand physically but was consistently and regretfully turneddown because of age. His background was in sales promo-tion, advertising and management. In desperation, he revis-ed he vita, simply lying by taking 11 years off his age. Withintwo months he had a job.
Seven years later, even though he claimed he receivedmerit increases and additional responsibilities every year, hewas mandatorily retired at age 70. He was actually 81 at the
me and as able physically and mentally as when he retired,according to his own version of events. This is one illustra-tion of how ridiculous mandatory retirement can be. Henotes, as many others have, "some people become incapablein their 70s, 50s, 40s and 30s; many retain the capabilitybeyond their 70s. They should be appraised accordingly andnot automatically dispensed with."
I do not challenge this precept. Personal observation con-firms that some people of rather tender age would be happierretired or at least not working in their current occupations.But I cite one fundamental advantage of chronologicalagethat is its definitiveness. All one needs to prove age is abirth certificate, but once we discard the criterion of achronological age, we must seek substitutes. If there are dif-ferences among people in terms of ability and performanceon the job, how does one begin to think &)out measuring
116

115
them? Once we forget the number of years one has spent inthis world, we must move on to less definite criteria to judgeability to do the job at hand.
As it turns out, this is the mirror image of the problem thatthose of us who have been interested in the economics ofdisability have been struggling with for years. To distinguishamong those persons in the population who should beclassified as disabled and those who should not, to determinewho is qualified to receive a transfer payment because of adisabling condition and who is not, is a very old problem. Inthe disability case, the quest is for a measure of physical andmental functional limitations; in the retirement case, it is asearch for measures of performance which probably dependon residual functional capacities.
In this paper we examine the disability experience to showhow difficult the problem of determining disability statushas been. Nothing in the disability experience provides anyaid or comfort to those who allege that we should eliminatecompulsory retirement and judge persons by their ability todo the job.
We first look briefly at the improvements in longevitywhich are the reasons for the problem receiving so much re-cent attention. Scholars disagree as to whether the declines inmortality are associated with improvements ci declines inhealth status. We discuss that controversy and conclude thatif our interest is in work ability, then it is something morethan health that we must be concerned with. It is not even"active life expectancy," but the deci ,ion to participate ornot participate in the labor force.
We examine the disability record from ancient days to pre-sent to show how difficult disability determination decisionshave been. Even where sophisticated models seek to includeall relevant variables, it is the health measures which prove tobe most elusive. Examination of that experience leads us to
1.1'7

advice caution in eliminating employers' freedom to retirepersons after a certain age.
Improvement in Longevity
What seems to he undisputed is the improvement I. .mor-tality rates in this century.2 The greatest relative in.. ./ve-merit has occurred at the young ages, resulting largely fromthe control of infectious diseases. The probability of death atage 0 decreased 90 percent between 1900 and 1980, but lookwhat has happened to those who survived to age 65. At age65 the probability of death decreased 30 percent from 190uto 1980 for males and 61 percent for females, a gap I expectto see narrowed as women become increasingly subject to thesame pressures and hazards as men. In the meantime, thosemales lucky enough to survive can look forward to this un-balanced -relationship among the sixes.
We are dealing with a relatively new phenomenon. Life ex-pectancy at age 65 increased very little from 1900 to 1930,but since that time there have been rapid gains in Lfe expec-tancy at age 65 that have occurred for both males andfemales, though again the females having the greater guins.
Incidentally, in spite of these improvements in mortalityrates, we should expect a decline in the net annual increase inthe number of social stcurity benefkiaries at the turn of thecentury. The low fertility rates during the 1930' /ill bereflected in a considerable reduction in the rate of increase inthe population over 65 during the 1990s in spite of any hr.provements in the mortality rate. This will come about jutat the time when the baby boom ger :ration born after WorldWar II will be swelling the labor force.
After 2015, the growth in the labor force is expected tslow down reflecting the decline of fertility rates whic.1began in the mid 60s. It is then that we expect social security
118

117
financing problems, which can be alleviated if workers retirelater.
Improvements or Declines in Health
fhere come now the controversial issues. Alicia Munnellforecasts that tomorrow's elderly will have improved life ex-pectancy, better health, and more education than those retir-ing today.' On two of these accounts, there can be nofaulting Ms. Munnellimproved life expectancy and moreeducation. The question of better health is one that is inquestion.
In sharp contrast to Munnell's position is that taken byJames H. Schulz who beiieve that increased longevity doesnot necessarily mean more surviving older persons will beable to work. He emphasizes the many health factors thatoperate to reduce mortaility may also reduce theemployability of older persons. Examples include: improvedsurvival from myocardial infarctions among the disabled;the persistence of the incidence of arthritis or any of anumber other disabling conditions that do not generallycause death; successful treatment of individuals with prob-lems such as diabetes that previously would cause earlydeaths but that are still disabling, and alcohol or drugabuse.'
This discrepancy in the viewpoints :..f these two eminentscholars has been pointed out by Michael Taussig in hisdiscussion of the two papers and it is Taussig who note; thatpension policy decisions depend critically on who is right.
"We expect that continued improvements inmedical care and technology willin the absence ofnuclear war or some other catastrophe of com-parable magnitudecause a large increase in thenumber of persons who survive until, and well past,
11 9

118
the traditional retirement ages in this country. Wedo not yet know, however, whether the expected in-crease in longevity will cause a corresponding in-crease :n the number of dependent aged persons. Ifthe aged workers of tomorrow is healthier thaneither his or her counterpart today, and if there aresufficient attractive job opportunities, then increas-ed longevity will not necessarily mean increaseddependency."
The same controversy runs through the early repot Ls of theNational Commission on Social Security, as Jacob J.Feldman has pointed out. Ili the March 1981 report, the ma-jority position was that increased longevity will be accom-panied by a corresponding increase in active life. Also, thatperiods of dinilnisheet vigor associated with aging willdecrease so that the chronic disease will occupy a smallerproportion of the typical life span. Yet a minority of theCommission contended that the evidence does not supportany claim that longer life is equivalent to longer years ofgood health. Feldman notes that the current state ofknowledge does not permit a definitive resolution of thatcontroversy.'
Noting the dramatic decline in death rates, Feldman askswhether that decline among persons 50 to 69 years of age istantamount to improved health and working capacity. Henotes first of all some short term trends. Using data from theNational Health Interview Survey, he notes that 21.9 percentof men aged 65 to 69 answered that they had activity limita-tions that prevented them from working in 1970 a percentagethat increased to 14.9 in 1975 and 25.2 in 1980.
Even greater differences are to be found among the otherage groups in the 50 to 54, 55 to 58 and 60 to 64 ages. This in-crease took place during a period of rapid decline in deathrates for men in these age groups. Some suggestive data
12 0

119
Feldman cites indicate that if we go back further, thedisability or activities limitation rate for men age 55 towas about 10 percent in 1949 and even lower in 1935.
As Feldman notes, morbidity is difficult to quantify as op-posed to the relative ease of measuring mortality. Socialsecurity actuaries rationalize theil ignoring morbidity rateson the grounds that mortality and morbidity are correlated;when mortality improves, morbidity also tends to improve.'Feldman disagrees. He believes that a decline in mortalityrates can be connected with an increase in morbidity rates.Life-threatening conditions are not the same as disablingconditions. While there is obviously some overlap, a greatdeal of disability is caused by conditions that are not lethal.Musculoskeletal conditions are the cause of a large propor-tion of work disability. Arthritis, for instance, does not ap-pear to shorten one's life span to any great extent. In hisview, there is no reason why reductions in mortality ratesshould result in a reduction in the prevalence of arthritis orany of a number of other disabling conditions that aregenerally not lethal.
Active Life Expectancy
Since there is sharp disagreement about whether mortalityand morbidity are closely correlated, it is necessary to havesomething other than improvements in mortality rates if weare to have confidence in estimates of the future labor supplyof older workers. The problem has been addressed by aMassachusetts research team headed by Dr. Sidney Katz whodeveloped a concept of "active life expectancy." They uselife tables techniques to analyze the expected remaining yearsof functional well-being for their sample of noninstitu-tionalized elderly people living in Massachusetts in 1974.Waves of these people were interviewed at periodic intervals.They found that the expected years of active life expectancyrange from 10 years for those 65 to 70 years to 2.9 years for
12 1

120
those 85 years or older. Active life expectancy is shorter forthe poor than others and women had a longer average dura-tion of expected dependency than men.'
It is a clever idea to construct life tables, not in terms ofexpected date of death, but expected date of incapacity; thecontrast is between active versus inactive life. But the dif-ficulty is that the contrast is too sharp, the division tooabrupt. Scales of activities of daily living measure too much.The scales measure six basic functions; bathing, dressing, go-ing to the bathroom, transfer, continence and eating. Theseare essential biological functions.
If, however, interest is in whether people are ready to go towork or not go to work, then it is obvious that some personswho may score quite high on these activities of daily livingscales are still not necessarily able to jump into the labormarket. Measuring limitations of persons based on essentialbiological functions is to move just one step from the mor-tality scales themselves.
Health, Labor Supply and Survey
One of the problems noted by Newquist and Robinson' isthat health data, especially fo_ he older population, hasbeen gathered for purposes other than employment policyanalysis. The problem is that the investigators discuss theproblem in terms of morbidity factors, or in terms of ac-tivities of daily living and these are clearly inappropriate.What is necessary is to get some concept of health which isapplicable to the work decision and, at the same time, torecognize that health is only one of the factor: that will af-fect whether older persons are going to be active participantsin the job market. In short, what we are dealing with here is acomplex labor supply issue, complicated by this notion ofwhat constitutes health and what does not constitute healthand how one can measure it.
122

121
This is a relatively old problem. It arises in theoretical andempirical models of labor supply as researchers attempt toinclude a health variable. The problem is present in surveyswhich attempt to examine the number and characteristics ofdisabled persons in the population. It has been a leadingproblem for years in all of the programs designed to compen-sate persons who :lave disabling conditions. These includetort cases where juries set indemnity payments according todisability status, workers' compensation programs, and ofcourse, the Social Security Disability Insurance program.
The Ancient Origins of the Problem
The notion of compensation for injuries can be tracedback to the code of Hammurabi (1945-1902 B.C.). Theessential advance in Hammurabi's code was the partialsubstitution of "compensation" to replace "retaliation."'°
One clear illustration of how compensation replacedretaliation is found in Exodus, Chapter 21, verses 18 and 19:
18. And if men contend, and one smite the otherwith a stone, or with his fists, and he die not, butkeep his bed;
19. If he rise again and walk abroad upon his staff,then shall he that smote him be quit; only he shallpay for the loss of his time and shall cause him tobe thoroughly healed.
The commentaries explain that compensation is awardedon five grounds for damage, for pain, for healing, for loss oftime and for insult. (Insult apparently refers to paymentsmade when the harm was intentionally inflicted.) Liabilityfor healing extended to payment of medical costs. The com-mentaries are quite specific as to when liability ceases andunder what conditions the case may be reopened, to use themodern phrase.

122
The commentaries speak of payment for damages in whatappears to be strikingly modern terms. The idea was to lookat the injured person, to appraise his worth before the in-jury, and to contrast it with what he would be worth with theimpairment. In a perfect market, the difference would be thepresent value of the future net product of the whole personas contrasted with the impaired one. Of course, in thosedays, there were examples at hand with slave markets, andthese capitalized values could be observed. They did not haveto be eftin.-ted by probabilistic functions dependent on im-perfect knowledge.of future earnings streams.
The ancient examples permit us to look at several facets ofdisability. In ancient codes and in modern day workers' com-pensation, disability is often equated with a loss of limb, lossof an eye, or loss of hearing. Such losses are, of course, per-manent. For purposes of both labor market analysis anddisability analysis, it is permanent, chronic or long term, notshort term, phenomena or acute illness, that is relevant. Thepermanent aspects are rather gruesomely exemplified by am-putation, which is not only long term but quite permanent.
Another dimension that has to be focused on is the con-cept of partial versus total disability and it is obvious, even inancient days, that a man could sustain rather extensivephysical damage and still participate to some extent in work.Thus a persons is not either disabled or not disabled, butthere are various degrees of disability. The extent of disabili-ty becomes particularly important when trying to assess thelabor force chances of older persons.
Workers' Compensation Experience
Soon after workers' compensation was itnroduced in thiscountry, beginning in 1911, the state laws provided forschedules derived from experience with private insurancecarriers and from some of the European laws. Schedules
124

123
soon became hallmarks of compensation statutes. Essential-ly, these provided for a price, possibly the number of weeksof compensation that was to be paid, for specified losses.They detailed the prices of parts of the body. If a person losta finger, toe, or wrist and arm, the amounts of compensationdue him would be listed in the schedule, thereby minimizingadministrative discretion.
Eminent legal scholars argue about the nature of thesystem. Larson believes it was a matter of operationalizing awage-loss system appropriate to large scale mass social in-surance programs." In effect, the schedules provided a wayto proxy the wage loss suffered by some average person withthese particular losses. Whatever the intellectual andtheoretical justification, the schedules never lived up to theirpromise. The trouble was that persons simply did not alwayslose limbs at the particular joints specified in the schedule.More important, if the law that is going to compensate a per-son for loss of an arm triggers a particular amount of com-pensation, why not pay an equal amount for the loss of useof that arm? But once you consider loss of use and injuries toparts of the body not specified on the schedule, such as theback or head, you are into an area where discretion has to beused, thus defeating the purpose of the schedules.
The point to be made is that there are difficulties involvedin assessing the amount of disability payments due a personwith a particular type of work injury. The problem leas beeni ecognized for years and years under our workers' compen-sation statutes.
In workers' compensation, the worker alleges either thathe cannot now work at all, or that he cannot now work at thelevel of energy or capacity that he could prior to his injury,or that his injury has left him in a condition that will in-terfere with his future ability to perform tasks in the samemanner and method as he could have, had he not incurred
125

124
that injury. The workers' compensation commissionstherefore have the task of deciding whether there has beenany such interference with the work potentiality of the in-dividual and if so, how that deficiency can be measured. Asnoted above this is the mirror image of the problem faced bythe aged. In the retirement case, it is the worker who allegesthat his ability to work at his task, in the same degree of effi-ciency and manner as before, has not been impaired. Theemployer who advocates retirement of the worker, allegesotherwise. Consequently, the question arises as to the ap-propriate tests of limitation or residual capacity.
In workers' compensation where the schedules are not ap-propriate (the vast majority of cases in most states), the com-missions have developed several different theories to deter-mine payment.
In some jurisdictions, payments will be made if the workercan demonstrate specific physical or mental impairment.Other states will not pay unless the worker can demonstrateactual wage loss. Jurisdictions in between, as it were, at-tempt to evaluate a worker's loss of wage-earning capacity.
In any event, each of these methods has its distinct limita-tions. Physical impairment is difficult to measure and moredifficult to translate into compensation payments. It is onething to be able to evaluate physical losses and another to beable to price these losses in some way that is meaningful inthe labor market.
When it comes to wage loss, a method that is now beingwidely touted because of its recent adoption in the State ofFlorida, there are obvious difficulties. Michigan, for manyyears, had a wage-loss system in workers' compensation, butunfortunately, the complexities of the system, the institu-tional arrangements, or other factors resulted in most casesending up in compromise and release settlements.12 So,although Michigan technically had a wage-loss system, it was
126

125
to all intents and purposes really a bargaining system basedon a workers' physical condition.
Michigan also had a problem which was unique among thestates. Many workers who retired from automobile plantssimultaneously filed workers' compensation claims. The so-called retirement problem exposed, in raw relief, the essen-tial issue with which we are concerned. To what extent areworkers who formally retired realistically in the labormarket? Interestingly enough, in the Michigan cases, theclaim was that the retirement status did not bar access to thelabor market, rather it was alleged that some physical condi-tion incurred during working life prevented working at thewages that otherwise would have been earned. The terriblecomplexities of that situation again argue for a certain ar-bitrariness in defining an age of retirement, no matter howinequitable this may be to particular individuals.
It seems to be quite clear that no workers' compensationprogram had the lock on 1 perfect solution to its problems.All that can be said is that ome states that actively interven-ed in the administration p. ess and combined rehaNlitationtechniques with its admini. ation of benefits were more suc-cessful than others who depended on purely legal ad-ministrative methods.
Social Security Disability Insurance
The problems of workers' compensation were well knownto the framers of our national Society Security Disability In-surance Act." Although it was thought that disability in-surance would come on stream early in the history of socialsecurity, as a matter of fact the federal government enteredthe field with the disability freeze in the 1950s and it was notuntil 1960 that we began a full-fledged disability insuranceprogram.
12 7
126
Two of the pitfalls were neatly eliminated in the disabilityinsurance program of social security. One was the decisionnot to pay any permanent partial benefits. Either a workerwas to be considered disabled or not disabled. This decisioncreated a host of problem., even as it solved others. Therewas no easy way to dispose of doubtful cases. The otherproblem eliminated was the confusion over retirement anddisability. Workers could collect disability insurance only upto the age of 64. At age 65 they would receive social securityretirement benefits. No one over the age of 65 was eligible toreceive disability insurance benefits on their own account.
The definition of disability under the Act was the inabilityto engage in substantial gainful activity that is due to aphysical or mental impairment that is expected to last at least12 months. To be considered disabled under this rather strin-gent definition, a person has to be unable to perform anywork which he is reasonably qualified to perform, anywherein the economy. It was not a test that depended on the abilityto perform th duties of one's job, or even one's occupation.
Although all workers age 50 and over were entitled to col-lect disability insurance payments as early as 1956, it was notuntil 1960 that the program became a general one for allcovered workers below age 65. Thus we have not yet seen afull generation of workers who are covered by the SocialSecurity Act disability provisions pass through their workinglives.
By 1970 we were paying out about $2.7 billion a year indisability insurance benefits, an amount that increased to$7.6 billion by 1975, a 175 percent increase. The increases inthe program continued between 1975 and 1976, reaching$11.1 billion in 1977. Although payments have not peaked,the number of beneficiaries did at about that year, and sincethen, the increases in payments have been modest, rangingabout 9 to 10 percent each year in payments as wage levels
128

127
have escalated. All told, from 1970 to 1980, there has been a436 percent increase in disability insurance payments.
Al' hough the decline in the numbers of beneficiaries beganto come as early as 1977, the public consciousness of thisdecline did not surface until a good bit later. It was the 1980amendments to the Act which tightened the administrativeregulations as to who should or who should not receivebenefits. More important, they provided for a review ofthese benefits and it is the administration of this reviewwhich has created a great deal of public conccrn over the lastseveral years, especially for those persons with mental ill-nesses.
The problem is a familiar one and it is exactly the sameproblem that we have had in workers' compensation and inevery disability program. How does one tell whether one isdisabled; under what conditions does one buy this ticket outof the labor force? Bear in mind that the pressure to increaseretirement ages and to stay in the labor force has beenmatched by this pressure for certain people to get out via thedisability benefits.
The problem has been that the criteria actually used de-pend a great deal on the showing of some severe medical im-pairment. Probably 80 percent of the awards are made to ap-plicants who have one or more impairments equivalent tothose listed in the federal regulations. It is only for peoplewho do not meet these so-called "medical listings" that con-sideration is given other factors such as the person's training,education and experience.
This possibility excessive reliance on medical conditionsignores the fact that there is a large gap between medical con-dition, on the one hand, and the withdrawal from the laborforce which is the prerequisite for disability benefits, on theother.
129

128
Not Medical Conditior Alone
My reasons for zmphasizing this difference comes fromtwo sources, one sociological and one economic. Thesociologists, largely influenced by Saad Nagi and others,'4have emphasized the differences between medical condition,impairment, functional limitation, and the resulting disabili-ty. They recognize that a medical diagnosis based uponsymptoms and signs and classified largely according to bodysystems, is useful to the physician interested in cure, butpossibly irrelevant to the problem of work, in part becauseof the large differences in the extent of severity of any condi-tion.
The issue is whether or not that medical condition leads toan impairment, the enervation of a nerve or the loss of a limbto take an extreme case. From there, we need to knowwhether or not that impairment results in any functionallimitation. We are thinking of such things as ability to lift, tocarry, to stoop, to bend, to walk, or in the case of mental im-pairments, the equivalent of functional limitations whichmay be the ability to relate to others or to tolerate the stressesof a normal job. I will return to that problem of getting theequivalent of functional limitations in mental illnesses in amoment.
From an economic point of view, it is essential that wehave some measure of functional limitations as a healthvariable in an attempt to explain whether or not people withdisabilities choose or do not choose to participate in thelabor force. What the framers of the disability insurance lawand, for that matter, workers' compensation laws neverrecognized explicitly, but always recognized implicitly, isthat there are disincentive effects to these benefits. Thesedisincentive effects are related to the generosity and theleniency of the disability transfers generally. The matter iswell put by Barbara L. Wolfe:
13 0

129
The older disabled person's work/retirementchoice depends on potential earnings in the labormarket, the availability and generosity ofdisability-related transfers and other income sup-port programs and the disability status of the in-dividual. Disability status reflects limitations ofphysical, mental or emotional sort which reduce theworker's ability to perform the required functionsof jobs which- he is on other grounds qualified tohold. It is a concept that links impairment with therequirements of specific jobs."
The work that as been done thus far attempts to measurethe income and substitution elasticities associated withchanges in net wage rates on unearned income generated byincome transfers. Several studies have attempted to look atthis problem.'6 Wolfe points out the problem with thesestudies, including their choice of the variable to representhealth is that some of them do not capture severity, durationor the relation of functional limitations to past or availableoccupations. There are other problems relating to themeasurement of availability of disability-related transfersand the fact that some of these leave out labor demandvariables and include only a few labor supply variables.
Some of the problems with the so-called first generationstudies have been remedied in the second generations ofthese studies." Each of the later studies is a fairlysophisticated work-choice model, and each of them has dif-ficulties in dealing with so-called true health status of theemployee.
Parsons, as Wolfe points out, uses subsequent mortality ashis health status measure. But as we have discussed above,there is a great deal of controversy about the relationshipbetween mortality and morbidity. Wolfe also points out thatLeonard's disability status indicator consists of 27 specific
13.E

130
health problems, diseases, conditions and infirmities. Itposes a number of difficulties. It gives no indication ofseverity, it gives no indication of degree of functional limita-tions and it is not linked to job requirements.
Slade's disability measure indicates whether or not the in-dividual reports that he or she is limited in getting around.This simple self-reported status has a number of problems.Wolfe notes that since it is measured contemporaneouslywith labor force participation, it may reflect the individual'staste for work and, hence, it may be endogenous to themodel.
The Haveman and Wolfe disability measures are self-reported measures and while they convey duration and inten-sity, they are very general and may be subject to the chargethat they allow the legitimization of failnie. Persons who areunsuccessful at work may be motivated to define themselvesas permanently sick in order to legitimize their self-definedfailure. All of these measures capture only some limiteddimensions of the relevant concept of disability.
Functional Limitations Again
What is needed for purposes of econometric surveys, forthe various transfer payment programs, and I believe for thereti:ement decisions for aged persons, is a hater measure offunctional limitations.
The search for these measures has been going on for sometime. The American Medical Association, as far back as1971, under the guidance of a committee chaired by Dr.Henry Kessler, issued the Guides to the Evaluation of Per-manent Impairment." Here we have a detailed look at essen-tially physical impairment or functional limitation measures.Such measures required a physical examination to deter-mine, for example, the extent of flexion of the extremities.The Guides specify the exact percentage of disability that
132

ought to be assigned for pa-ticular conditions. This is aheroic attempt to deal not only with the extremities but todeal with the evaluation of permanent impairment of backs,heart disease and a number of other types of condition whichwould not ordinarily be thought of as being scheduled.
We also have to note the atterr:t by the Social SecurityAdministration in its survey to deal with measures of func-tional limitations by self-reported responses. These obvious-ly do not go far enough. It should be possible to developthese scales so as to give us some clue as to whether or not aperson is capable of working, insofar as his health is con-cerned.
We think a promising beginning is made in the so-calledfunctional assessment inventories developed by the Universi-ty of Minnesota. We are currently engaged in a research pro-ject where we are trying to test these as measures of func-tional limitation in a vocational rehabilitation program."
What all this boils down to is that the same issues thatarise as we deal with disability can crop up as we seek tomeasure ability. If one wishes to eliminate compulsory retire-ment age, residual functional capacity measures become im-portant. We have to get down to looking not at a medicalcondition classification or even impairments, but ratherwhether or not a person is able to carry out the physical andmental functions required by the job or by any job. In thisregard, there is no doubt that the area we know least abouthas to do with mental impairments. That evaluating mentalimpairments and the residual functioning capacity is atroublesome problem is nowhere more apparent than in theDisability Insurance program. Most of the controversy hasarisen in this area as more and more persons have beendenied benefits in this review process which began in 1981.
Ove 900,000 beneficiaries were evaluated as to theireligibility status and almost 400,000 of these lost benefits as a
13.3

132
result of these investigations. A disproportionate amount ofthose who lost benefits were persons with mental im-pairments of one sort or another. Conceptually, we are justbeginning to understand what the equ'mlent of physicallimitation or functional capacity for mental impairment is. Itis obviously necessary that we consider such things as carry-ing out and remembering instructions, responding ap-propriately to supervision and coworkers and reacting tocustomary work pressures in a routine work setting.
Measuring Ability of Older Workersand Retirement Issues
Ability or inability to work because of a mental or physicalimpairment is difficult to determine, but however the issue isdecided, we know that examination of that person's medicalcondition is not enough. It is not the medical condition, butthe consequences of that conditionhow that condition af-fects an individual human being's mental and physical func-tioning that counts, and even that is not enough. We mustlook at how the limitations or residual functioning capacityinteracts with a host of other factors to determine that per-son's labor market chances.
These complex considerations are the same whether we areconsidering the injured worker fighting to retain his job,another worker doing his best to maximize his disabling con-ditions so as to leave the labor force, the older worker who isseeking to retain his position or the employer seeking toretire him at age 65.
The dispute that rages over whether improvements inlongevity will mean an increase in healthier workers fightingto stay in the labor force or an increase in impaired older per-sons who will become dependent on the working populationprobably centers around the wrong issues. Here again, it isnot simply a question of possible changes in morbidity levels
134

133
of older workers. Their health must be considered togetherwith such factors as their education, their training, the con-dition of the labor market and the levels of social insurancebenefits. Does that mean that health is not important? No,but it is their physical and mental functioning, not theirmedical conditon, that is going to be the important healthvariable to be considered.
Are we serious about wanting to encourage the participationof older workers in the labor force? Are we serious abouteliminating compulsory retirement age? If we are, it calls foraction on all fronts, n -merely passing legislation which im-poses costs withov .su ...es of corresponding benefits.We will have to not about education and trainingprograms but rel.,- programs as workers progressthrough their life cycles. If we are going to live in a ra. ;idlychanging high technology economy, and if we want to .laveworkers equipped to deal with its problems, it is obvious thatone injection of education which concludes at age 22 or 23 isnot sufficient to carry workers over the next four, let alongfive or six decades of life.
It is just as obvious that our retirement policy is affectedby levels of social insurance benefits and particularly by howwe penalize workers who retire early or reward them forstaying past the normal retirement age. The 1983 amend-ments to the Social Security Act will increase normal retire-ment age to 67 by 1990 and increase the benefits for workersstaying past their normal retirement age.
Bear in mind that the argument for abolition of com-pulsory retirement centers around the notion thatchronological age is irrelevant. That sword cuts both ways.Some older people are competent past the age of retirementand some younger people are incompetent prior to the age ofretirement. Eliminating the compulsory retirement agemeans that we have to get serious about tests of performance
13S

134
for younger workers, and to the extent that health is imp_.:-tant, as I think it is, we have to get serious about devisingmeasures of physical and mental limitations which can be ap-plied in sufficiently standardized fashion sc as to move thediscussion away from medical diagnosis to tests of function.
Our experience with 'inability programs should give uspause, but at least the _.6ht questions can be asked. If wehave no compulsory ending point to the work experience andwe substitute tests of performance, these may well be appliedto workers long before they reach what used to be the ar-bitrary age of retirement.
Is has always been an eligible de.. nse against a charge ofpoor performance for a worker to note that, whatever hislevel of performance, it has not changed. If it has been con-doned for years by the employer, arbitrators have been un-willing to view low levels of performance as a cause for ter-mination. That kind of argument is spreading as dismissalcases move into law courts in nonunion situations as the doc-trine of "employment at will" seems to be deteriorating. Inshort, if one seeks to terminate an employee, it is necessaryto show that something has changed. For this and otherreasons, we need particularly sensitive measures of physicaland mental functioning, if not general performance ap-praisals.
Possibly this may be placing too great a burden on ar-bitrary tests and on our systems of dispute settlement, bethey arbitration or the courts. It might be that we couldmake use of the doctrine of presumptions. We could set anage of retirement, be it 65, 67 or 68, and if an employer seeksto retire someone prior to that age, we could require him toshow that the wor, zrs is no longer able to meet the legitimaterequirements of the job. Or that his physical or mental func-tioning, if we deal with it at that level, has deteriorated to thepoint where he is not able to carry on. The presumption
136

135
would be used in the opposite way for situations past thatage where the employee would have to carry the burden ofproof. In short, if the employer sought to retire a person pastthat age, the presumption would be that that would be O.K.but that the employee would now have the burden of show-ing that he or she was competent to perform the re-quirements of the job and that he or she has the requisitephysical and mental capacities to perform the necessarytasks.
The use of presumptions might minimize litigation but onecannot be too sanguine about its possibilities. It is sad buttrue that, since the ancient days of Babylonia, we have foundno satisfactory way to determine the disability status of anindividual. There simply is no reason to believe that we coulddo much better if we seek to determine, in some legal sense,the "ability" status of an older person who the employerseeks to retire.
We should recognize that there are limits on what govern-ments can accomplish in this field. It is one thing to say thatcompulsory retirement at a predetermined age is a badpolicy; it is another to say that governments she Id attemptto forbid an employer from retiring a person at that age.
The arguments against governmental interference in thisarea go beyond the usual ones which relate the advantages ofprivate decisionmaking. We simply lack the technicalknowledge to derive administered tests of ability applicableto the wide range of occupations and industries in the U.S.Without such substitute tests, eliminating the chronologicalage test promises to usher in extensive litigation a.Lci to im-pose other costs on private employers to the detriment of ourcompetitive situations. If this is too extreme a position and ifnotions of discrimination on the basis of age, any age, arefirmly entrenched, then laws prohibiting compulsory retire-
137

136
ment are not enough. An integrated national policy requiresus to move on several fronts: to reexamine our programs ofeducation and training and our prevailing pay practices, torecognize the incentives and disincentives posed by the socialinsurance programs, and possibly simply to brace ourselvesfor yet another wave of litigation as arbitrators and courtsconsider essentially the same kinds of issues they have beenstruggling with in the disability area.
NOTES
1. Cyril F. Brickfield, executive director of the Association of RetiredPersons. "Creativity and Age: Times are Changing." Modern Maturity(February/March, 1984):19.
2. Information about mortality rates is from the Life Tables for theUnited States 1900-2050, Acturial Study No. 87, U.S. Department ofHealth and Human Services, Social Security Administration, Office ofthe Actuary, September 1982, SSA Publication No. 11-11534.
3. Alicia H. Munnell, "Financing Options for Social Security," inHerbert S. Parnes, ed., Policy Issues in Work and Retirement(Kalamazoo: W. E. Upjohn Institute for Employment Research, 1983),chapter 8.
4. James H. Schulz, "Private Pensions, Inflation and Employment," inHerbert S. Parnes, Work and Retirement, chapter 9.
5. Michael K. Taussig, discussion of chapters 8 and 9, in Herbert S.Parnes, Work and Retirement, p. 281.
6. Jacob J. Feldman, "Work Ability of 'he Aged Under Conditions ofImproving Mortality." Statement before the National Commission onSocial Security Reform, June 21, 1982.
7. F. R. Bayo and N. J. Faber, "Equivalent Retirement Ages,1940-2050." Social Security Administration Acturial Note, No. 105(June 1981):5-6.
8. Sidney Katz, Laurence G. Branch, Michael H. Branch, Joseph A.Papsidero, John C. Beck, and David S. Greer, "Active LifeExpectancy." The New England Journal of Medicine 20 (November 17,1983):1213-1223.
138
137
9. Deborah Newquis: and Pauline K. Robinson, "Health and ExtendedWork Life." Unpublished paper, National Center on Employment andRetirement, Andrus Gerontology Center, University of SouthernCalifornia, p. 11.
10. The history and background of disability benefits is from MonroeBerkowitz, John Burton and Wayne Vroman. "Permanent DisabilityBought in the Workers' Compensation Program." Final report to theNational Science Foundation (No. APR75-01067), 1979.
11. Arthur Larson, Workmen? Compensation (New York: MatthewBender, 1982), Vol. 1, Sec. 57.14.
12. H. Allan Hunt, Workers' Compensation System in Michigan(Kalamazoo, MI: W. E. Upjohn Institute for Employment Research,1982).
13. Edward Berkowitz and Kim McQuaid, Creating the Welfare State(New York: Praeger, 1980), chapter 8.
14. Saad Nagi, "The Concept and Measurement of Disability" in Ed-ward Berkowitz, ed., Disability Policies and Government Programs(New York: Praeger, 1979), chapter 1.
15. Barbara L. Wolfe, "Economics of Disability Transfer Policies."Paper prepared for the session on Multidisciplinary Perspective on CostIssues and Disability and Rehabilitation, APHA meetings, November14, 1983.
16. Monroe Berkowitz, Edward H. Murphy and William G. Johnson,Public Policy toward Disability (New York: Praeger, 1976); Harold Lift,"The Impact of Poor Health on Earnings." Review of Economics andStatistics 57 (1975):43-57; and "Job Requirements: Effects on LaborForce Choices," in Policy Analysis with Social Security Research Files,U.S. Department of Health, Education and Welfare, Social Security Ad-ministration (Washington, DC: U.S. Government Printing Office,1978), pp. 447-460; Thomas Chirikos and Gilbert Nestel, "Impairmentand Labor Market Outcomes: A Cross-Set Iona' and LongitudinalAnalysis," in Herbert S. Parnes, Work and Retirement (Cambridge,MA: MIT Press, 1981).
17. Donald Parsons, "The Decline in Male Labor Force Participation."Journal of Political Economy 88 (1980:117-134; Frederic P. Slade,"Labor Supply Under Disability Insurance," National Bureau ofEconomic Research, Cambridge, MA, Working Paper r.'. 800, 1982;
139

138
'Robert Haveman and Barbara Wolfe, "Disability Transfers and EarlyRetirement: A Causal Relationship." Journal of Public Economics,forthcoming; and Jonathan Leonard, "The Social Security DisabilityProgram and Labor Force Participation," National Bureau of EconomicResearch, Cambridge, MA, Working Paper No. 392, 1979.
18. American Wdical Association, Guides to the Evaluation of Perma-nent Impairment, 1971.
19. Enhanced Understanding of the Economics of Disability researchproject #133AH30005.
140