Embed Size (px)
Citation preview

DOCUMENT RESUME
ED 155'282 UD 018 319
AUTHOR Irwin, Paul M..TITLE An Analysis of "Using Achieve,ment lest Scores to
Allocate Title I Funds."INSTITUTION Library, of Congress, Washington, D.C. Congressional
Research Service. --PUB DATE 17 Feb 78NOTE 37p.; For related documents, see:UD 018,317-318
EDRS PRICE MF-$0.83 HC-$2.06 Plus Postage.DESCRIPTORS *Achievement Tests; *Change 'Strategies; *Compensatory
Education Programs; Elementary Secondary Education; -
*Federal Programs; *Resolirce Allocations; *ScoresIDENTIFIERS *Elementary Secondary Education Act Title I
ABSTRACTThis paper is a review and analysis of a report on
compensatory education which was prepaied.by the National Instituteof Education (NIE) . The Tort focused ton the problem of theallocation of funds on th basis of achievement test scores ratherthan on the poverty criteria. It discussed issues regarding theallocation of Elementary Secondary Education Act Title I fuids bytest scores, the procedures.and estimated costs of developing apdimplementing a system to obtain'test scores, and the possible- "changesin the distribution of funds that iight result from a shift in thebasis forTitle I allocations from poverty data to kchievemebtscores. This analysis indicates that currently available data do notprovide the information required to distribute Title I funds on thebasis of aplievement test scores either to school districts 'or tostates,. However, test data for this purpose could be produced withina three year period. (Author /All)
***********1************************************************************ Repioductiops supplied by EDRS are the best that can'be made **. from the original document. . ************************************************************************0

Ce)00
Oasz
78-54 ED
AN ANALYSIS OF "USINGACHIEVENITNTTEST SCORES TOALLOCATE TITLE I FUNDS"
CONGRESSIONAL RESEARCH SERVICE
LIBRARY OF CONGRESS
F.
r EP1RTMEST DA olt AE Du A* ^H A.W£L,AA£P41 `NA. OF
F OUC A r
.
PAUL M. IRWINAnalyst in EducationEducation and Public Welfare Division
February 17, 1928
The Congressional Research Service NA,orks e \clu'si\el, forthe Congress. conducting research, anal} zing legislation. andpr9vidin2 in formOon at the request of Committees. Mem-bers and their staffs
Tlie Ser\iCe makes such research available. without partisanbias. in many forms including studies. reports comlitlations.digests, and background briefings Upon request. the CRSassists Committees in anal, zing le2islative proposals andissues, and in assessing the possible effects of these proposalsand then- alternatives. The Service's senior specialists and sub,.sect analys'is are also available for personal consultations intheir respective fields of expertise
I
ip
4
r
.
,
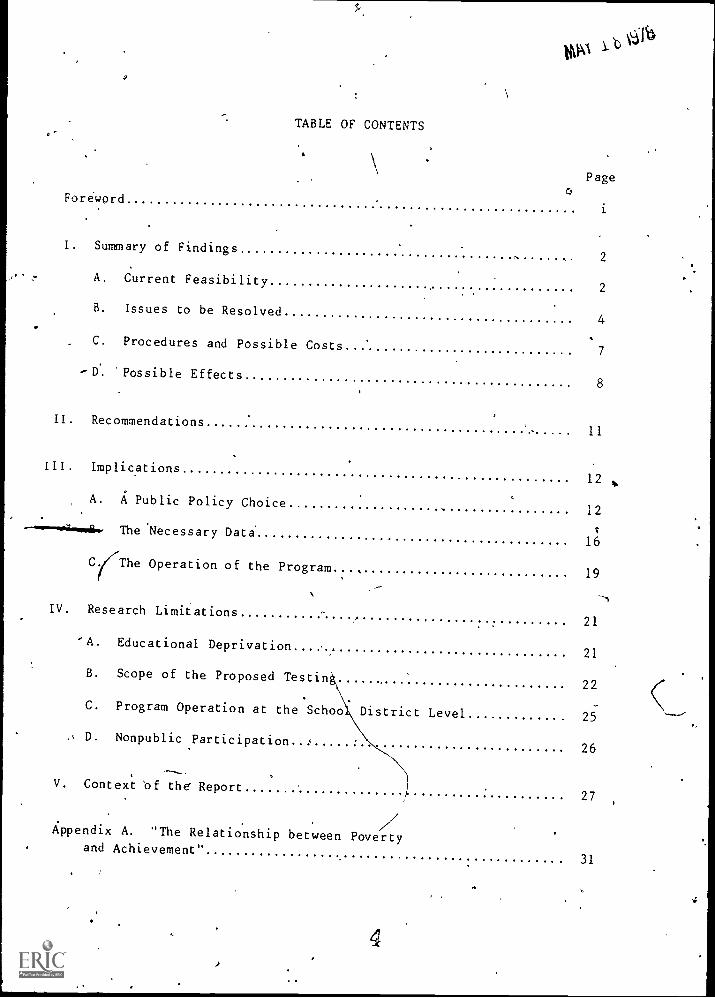
TABLE OF CONTENTS
).
\
b 1`61b
.
\Page
0Forewprd
i
I. Summary of Findings, 2
,.; ... A. Current Feasibility2
B. Issues to be Resolved4
.
.. C. Procedures and Possible Costs
7
-D.. 'Possible Effects8
II. Recommendations11
III. Implications12 y
,A. A Public Policy Choice. 12
-----fi..- The Necessary Data1i6
C.
///The Operation of the Program
19
N -1IV. Research Limitations
, 21
'A. Educational Deprivation21
B. Scope of the Proposed Testin22
.
_C. Program Operation at the Schoo District Level 25
., D. Nonpublic ,Participation ,
26
.
4
V. Context 'of the Report,
27
, /.4pendix A. "The Relationship between Poverty
and Achievement"31
)
4

CRS -i
'OREWQRD
. ,
A study Of he fundamental purposes and effectiVehess of compensatoryeducation was 'ma dated by the Education Amendments of'1974. The CongressTi3de the National\Institute of Education (NIE) responsible for investiga-ting both tne Tiae I program sof tne Elementary and Secondary EducationAct of 1965 (ESEA)\and similar programs funded by some of the States.
The legislation authorizing the NIE41study does not specifically3e'tfine "compensatory education," but the ESEA Title I declaration ofpolicy has sometimes 'been considered a useful guideline:
In recognition'of the special educational needs ofchildren of low-income families and the impact thatconcentrations of low-income families have on theability of local educational agenCies to support ade-quate educational programs, the Congress herebydeclares it to be the policy of the United States foprovide financial assistance (as set forth in thefollowing parts of'this title) to local educationalagencies serving areas with concentrations of childrenfrom loW-income fa ilies to expand and improve theireducational progra s by various means (including pre-school programs) w ich contribute,particularly tomeeting the special educational needs of educationallydeprived children. ,(Section 101, ESEA)
ESEA Title I is the largest Federal program for elementary andsecondary education; more than $20 billion have been appropriatedthe Title I program in its first 13 years (fiscal years 1966-78), andthe fiscal year 1979 appropriation would be $2.735 billion under the pro-
, visions of P.L. 95-205 (Continuing Appropriations, Fiscal, Year 1978). Thefiscal year 1979 Administration budget proposal includes a Title I requestf6,r S2.979 billion for fiscal year 1980, plus $400 million for proposedadditions to the Title I legislation.
Compensatory education programs in nearly 90 percent (about 14-,000)of the 'Nation's school districts, plus some 240 Bureau of Indian Affairs(BIA) schools, are funded through Title .1. Approximately five millionpublic school children, 225,000 private schOol children, and 31,000 BIAschool children participate in these programs.
In its report of December 1976, the NIE found that 16 States operatedcompensatory education programs during the 1975-76 school year, with a'funding level of'00 million ("Evaluating Compensatoiy Education,
III-13).,
4
5
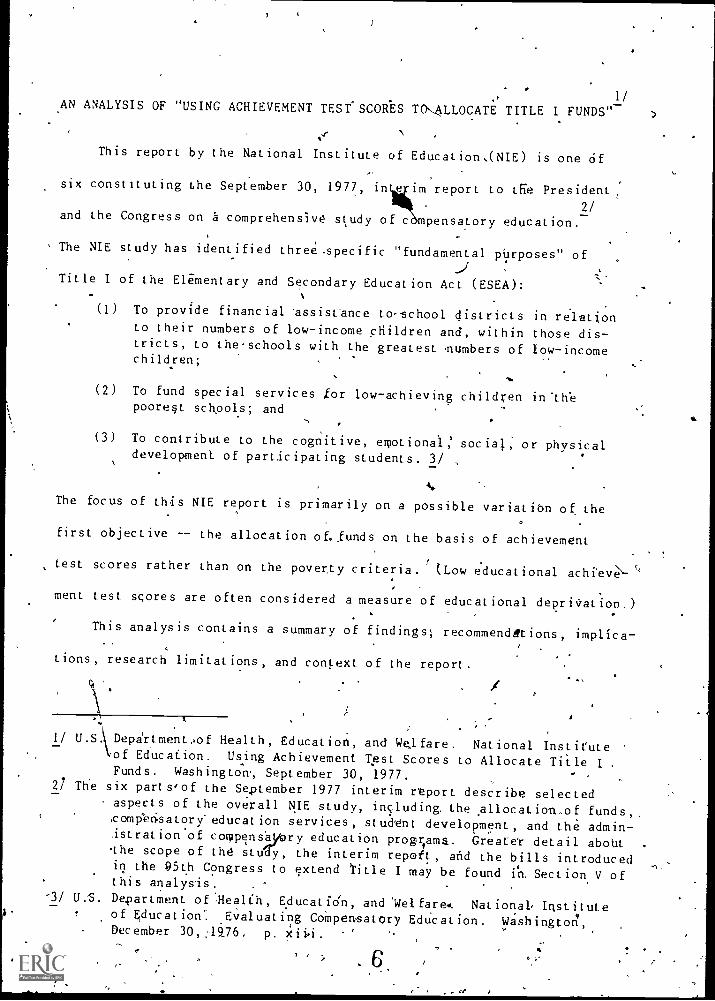
1/AN ANALYSIS OF "USING ACHIEVEMENT TEST'SCOAS TON4LLOCATE TITLE I FUNDS"
This report by the National Institute of Education,(NIE) is one of
IL
six constituting the September 30, 1977, in e
*im report to t5e President,
2/and the Congress on a comprehensive study of c pensatory education.
The NIE study has identified three.specific "fundamental pUrposes" of
Title I of the Elementary and Secondary Education Act (ESEA):
(1) To provide financial assistance to school districts in relationto their numbers of low-income children and, within those dis-tricts, to theschools with the greatest numbers of low-incomechildren;
"6,
(2) To fund special services for low-achieving children in 'thepoore§t schools; and
(3) To contribute to the cognitive, emotional: social, or physicaldevelopment of participating students. 3/
The focus of this NIE report is primarily on a possible variation of the
first objective -- the allocation of.funds on the basis of achievement
test scores rather than on the poverty criteria.r
(Low educational achieve-
ment test scores are often considered a measure of educational depriVation.)
This analysis contains a summary of findings; recommendations, implica-
Lions, research limitations, and context of the report.
. fi
1/ U.S. Depa'rtmentA3f Health, Education, and Welfare. National Instituteof Education. Using Achievement Test Scores to Allocate Title I .
Funds. Washington, September 30, 1977.21 The six partsiof the September 1977 interim report describe selected
aspects of the overall NIE study, including, the allocationof funds,,,comPen.satory'education services, student development , and the admin-istration'of compensayory education progrtama. Greater detail aboUt .
the scope of the study, the interim repoit, and the bills introducedin the 95th Congress to extend Title I may be found in. Section V ofthis analysis.,
-3/ U.S. Department of Health, Educaticin, and 'Welfare.. National, Institute4 r of Education: Evaluating CoMpensatbry Education. Washington,December 30,,4976. p. xii.i .
4
60

CRS-2
I. Summary of Findings
"Using Achievement Test Sco4es to Allocate Titre I 'Funds"cliscuSses.
ai'ssues regarding the allocation of funds by test scores, th'e procedures
and estimated costs of developing and implementing a system to obtain
test score's, and the possible changes in.the distribution of'funds that
might result from a shift in the- basis for'Title I allo6ations from pov,
erty data to achievement scores. The NIE discussion is limited to the
distribution of basic grants to school districts, g*ants that account
for 81 percent of the Title I 'appropriation, Alt hough, several States
(e.g., Michigan, New York) Have enacted compensatory educastion programs
'with achievement-based running, there is no ment ion of the in the report.
rhe report indicates that currently available data do not provide the ,
information required to distribute Title I funds on the basis of a5liteve-
merit test scores either to school districts ox to States"; powever, test
data for this purpose could 1).--broduced within a tree -year period. The
NIE.. findings on current feasibility.will be discussed first, followed -by
a discussion of the issues to be tesolved, the procedures and. casts of a
°
national testing system, and the posstble'effects of achirem4nt2bas'ed
Title I alloc,ations.
A. Current Feasibility
The ESEA Title I formula currently uses poverty criteria at three
stages of the allocation process., for determining St'at.4 and county allo-
cations, for determining school district allocations within.counties, and
for selecting eligible schools within districts. In addition,. poverty
criteria are comet Imes used at a fourtr-s ge C for determining allocations
# g

O
CRS -3
to eligible schools. According to the NIE report, the Congress over
the years has considered changing one of the fundamental purposes off
Title I so that funds would be allKated on the basis of low-achieving.
4/children rather than low-income children. Such a change mightbe
made at one or mor'e,of the stages in the Title I allocatiou process..
(Some bills introduced in the 95th Congress to amend or extend Title I
are described in Section V below.)
After an investigation of available achievement test data, the NIE
report concludes that achievement based. funding currently is not possible5/
on a national basis. The federally-ePlonsored National Assessment of
getucational Progress, the largest testing program in the Nation, provides
comprehensive information:on the educational skills of children and young
adults, but the program is not designed to provide either State or school-
district data.. Several commercial,tests are widely used for the evalua-.6/ '\Lion of Title I as well as for other purposes." Although not discussed
in the report, presumably none of these tests has been administered
nationwide in a way .hal could provide the data required for the alloca-.
LiA of funds on a national or State-by-State basis.
O
4/ U.S, Department of Health, Education,,and Welfare% National Institute4of Education. Using Achievement Test' Scvres to Allocate Title I
Funds. p. 1.
5/ Ibid., pp. 11-15.
6/ Eight' commercial reading tests.used in grades 4, 5, and 6 were. studied.and analyzed by the Office of Education's "Anchor Test Study", inorder to provide statistrcalltequivalent. scores that are compar-atile among these tests. Thein'sts are listed and the analysesdescribed in U.S. Department of Health, Education, and Welfar.0Cfcce of Education. 'Anchor Test Study: Equivalence a Norms'Tables for Selected Reading,Achievement Tests. Washing on (74-,
305), 1974.1 pp. 1-10.

CRS -4
Tit le I funds are currently allocated to the- -county level only
because the Commissioner of Education has determined that poverty data
are not available for makizng direct, national allocations to school
districts within States. Ddta at t he county level on low-achieving
children presumably .:do not exist, although the NIE report does 'not di s-
cuss this matter. Some States have test data for school districts, and
the NIE judgttsgehal up to 22 States could allocate Title I funds on that7/'
basis in a -limited system of within Stale allocations. However, the
reportfinds that such immense differences eXist..in current testing pro-
grams that it is impossible to compare the numbers of low-achieving chil-8/
drn among States at the present time.
On the basis of 13 'spec ial demonstration school districts,, the
report concludes t hat achievement-based funding of schools within dis-
tracts is now possible. Howev.er, the report makes no estimate of the num-.
h. r-.or p.rc agc of school districts t hat act ually have achievement scores
available for t his purpose.
H. Issues t o b. Resolved
Aeachievement -based Tit le I allocation system could be implemented,
but, t he report claims t hat a number of issues must be resolved before the9/
data for the system--are.collect ed These issues 'involve the definition
of low achievement, the size of the t-esting sample, and the guarantees of
accurac y.
7/ U.S. Department of Health, Educat ion, and Welfare. Nat ional Instituteof Educ at i.on. Using Achievement Test -Scores to Allocate Title I
Rinds. p. 15.
8/ Ibid., 'P. 14.
9/ 'bid pp. 27TO.

(CRS15
For the definition of low achievement, both the subject area and8the level of achievement must be determined. Since achievement tests
typically are focused'on a specific subject area, such as reading or
mathematics, a choice of areas must, be made. A Single area might be
chosen, or -- since low-achieving students in onp area are not neces-
sarily low scorers in another -- an alternative might be selected, such
as the devselopmeot of a multiple area test or a method for combining
scares from several tests.
The Level of achievement could be either absolute or relative.
An absolute level would requireidefinint a set of minimum skills that
.'eery child amust lern. However, test developers and educators currently
...
do not agree on what these skills.should be, according to the report, and10/
reaching a consensus might be diffiEult. The selection of a specific
set of skills .probably would influence the distribution of funds.
A relative level of achievement, in contrast, Would onlyrequire the%
ranking of test scores and the selection of a specific cutoff point.
the 15th percentile, for example below which-all students would be con-,
'a
sidered as low achievers.. The cutoff could be at any level, but the actual.
point selected.is likely to influence the distribution of funds.
The size of thesample involves questions of accuracy and cost;
larger samples are both more accurate and more costly. A small sample of
children from each State might be sufficient for determining the alloca-4
tiohs to States. A larger sample including childfen from each school dis-
trict would be required for determining the allocations to school, distric:,1.s.
10/ Ibid., p. 4.. .
111111111
0I.

CRS-6,
For the selectibn of schools and children within districts, all
dren might hove to be tested to determine those that actually would
receive Title I services; however:the report does not mention this
possibility or estimate its cost.
The sampling could be made'representative of all children aged
5 to 17 years the age range of the poverty statistics currently used,'
-- or it could be made repreAentatie of a single afe orgrade level.,
For the purpose of distributing funds, testing at a single grade level
would require an assumption that low achievement in the third grade, for
example, is proportional, to Jow achievement in all other grades; the .
lower cost of testing at'a single grade level might make such an assump-
tion attractive. Testing a sample of all schoolTaged children might
not require a larger sample, but would require designing different tests
for each age or grade level. Special arrangements apparently, would be
nadi for counting and, testing (or excluding) handicapped children, non-
hjigltsh speaOrs, absentees, dropouts, and nonpublic school children.
According to the report, a guarantee of accuracy that test results
reflect the:incidence of low achievement "would be.crucial to acceptance11/
of an achievement-based system." The guarantee would require both
"th-i-it the data be up-to-date and that possible problems of negative,
incentives be avoided." The report states that a testing program could
provide data more. timely than the poverty statistics based On the, decen-.
nial census of populgtion, and hence might reflect more accurately and
II/ p: 8.tit

CRS-7
validly the- incidence of need, Achievement testing every two to four
years isAsuggested by tikireport,with cost .,11d timelOess the major
considerations .(discussed below).
There would also neeed to be a guarantee that potential benefici-3
4
aries' could not manipulate the test results, according Co the report.
Specifically,'.States and schodl districts have little or no capacity
to influence poverty statistics, vt they might be able to Manipulate
e .
students' 'achievement test scores; thereby.increasing the amount ofsa
Title I funding'for themselves. urthermQre, there is a possible neg-'V
'ative incentive in achievement- based, funding in that improved educational
performance might result in a decrease of funds. Thp report co cl&des
N4Lhat "a combitation of simple administrative arrangements" would Make12/
such manipulation unlikely.
C. Procedures and Possible Costs
,.
cz. c- The NIE''"report estimates that three years would be required to;
- produce the initial achievement test data suitable for Title I alloca-,s,
r
tions.13/
.
. 4The cost of a testing program pasically'would depend on whether, ,
.
it would beused for State-level or district-le'vel allocatidns. Test.
.
data'for State allocations are estimated to cost $7.2 million, and the
costs'data for district allocations are estimated at $53 million.. These co:.
Jare based on the assumptions.that only nine - year -olds would be tested,
that reading skills would be the only subject tested, and that testing
. 12/ Ibid., p. 9.
13/ Ibid., p. 16.
-4°
1
4 ,`
,11
CRS-8
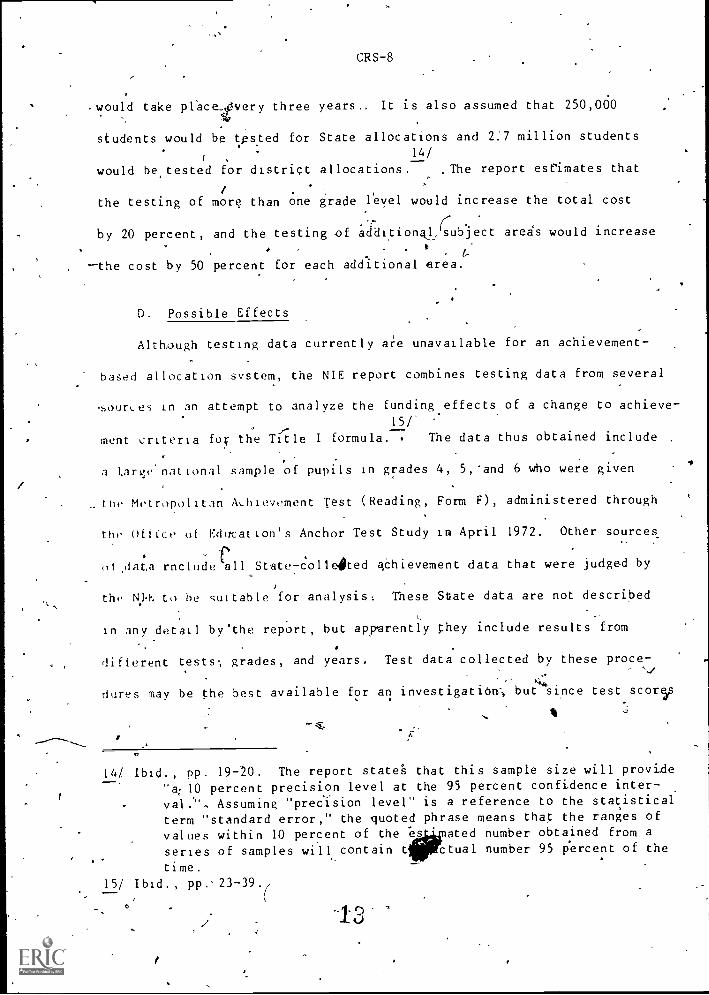
. would take plece4very three years.. It is also assumed that 250,000
students would be tested for State allocations and 2.7 million students
r
14/
would be tested for district allocations. .The report estimates that
the testing of more than one grade level would increase the total cost
b'y 20 percent, and the testing of additionk6Ubject areas would increase_
-the cost by 50 percent for each additional area.
D. Possible Effects
Alth,ough testing data currently are unavailable for an achievement-
based allocation system, the NIE report combines testing data from several
-sources in an attempt to analyze the funding effects of a change to achieve
15/'
ment criteria fog the Title I formula. The data thus obtained include
a large national sample of pupils in grades 4, 5,-and 6 who were given
the Metropolitan ALhievement Test (Reading, Form F), administered through
the 0itice of Education's Anchor Test Study in April 1972. Other sources
f'.t rnclude all Stete-colleOted 4Chieyement data that were judged by
the to he suitable for analysis: These Sate data are not described
in any detail by'the report, but apparently they include results from
difterent tests, grades, and years, Test data collected by these proce-
-dures may be the best available for an inyestigation,--, but since test scores
lf
14/ Ibid., pp. 19-20. The report state that this sample size will provide
"a; 10 percent precision level at the 95 percent confidence inter-
val", Assuming "precision level" is a reference to the statisticalterm "standard error," the quoted phrase means that the ranges of
values within 10 percent of the es ated number obtained from a
series of samples will contain t ctual number 95 percent of the
time.
15/ Ibid., pp.-23-39./
o
10

,CRS-9
ov,er the years and few tests 'are fully comparable, the result-\
ing analysis must be treated tentative. The report infact warns
that the estimates "do little to reduce uncertainty about the likely con-16/
sequences" of changing to achievement-based funding:-- Nevertheless,
the report tentatively estimates the effects of changing the Title I
formula fromits current poverty basis to an achievement standard.
At the regional leyel, no significant effects were detected from the
'17/proposed change in the formula.
At the State level, data Vol- analysis were considered accurate
enough to analyze funding changes in 34 States and the District'of Columbia.
(States where the error of estimation was calculated to be greater than 40
percent were excluded from this analys,is.) When compared with the poverty
data used in the Title I formula 23 of the StaEds and the District of
Columbia wertatimaeed to gain or lose More than 15 percent of their share
of formpla-eligle children. The largest proportional increases would be
for the District of Columbia and Connectidut and the Largest decreasps
18/ I
would be for Oklahoma, West Virginia, And Arizona.
At the school district level, it was estimated that nonmetropolitan
districts generally would lose funds if achievement-based funding were
implemented. However, large funding variations were found for urban and
suburban districts;.some of these districts would be likely47Kin funds,
others would be likely. to lose. Districts with'high percentages of black
16/ Ibid., p. 27.
17/ Ibid., p. 33.
18/ Ibid., p. 27.
14

a
11
CRS-10
thildren were estimated generally to gain funds under achievement basedor
funding; districts with high percentages of whites would likely lose;
and there generally would be no major changes for districts with high
., percentages of Spanish surnamed children.
For those analyses, tne report uses an achievement level at or
below the 15th percentile. At higher cutoff levels, the distribution
4
of lowachieving children was estimated t'o be approximately the same as19/
th. distrtbution of all children aged 5 to 17 years. Cutoff levels
below the 15th percentile would appear to favor cities at the expense
of the suburbs in general, but are estimated to have no impact an non
metropolitan areas. Lower cutoff levels are likely to favor district-s
20/, with high concentrations of black children, according to the report.
19/ Ibid., p. 35.
20/ Ibid.
15

CRS-11
II. Recommendations
The focus of "Using Achievement Test Scores to Allocate Title I
'Funds" is on the issues, procedures, costs, and effects of implementing
an achievement-based allocation system as an alternative to the poverty-
based allocations in the current ESEA Title I legislation. This report
makes no explicit recommendations for legislative action. (The NIE is
obligated to make recommendations as part of the overall study, but the
final report is not due until September 30, 1978.)
IC

UL Implications
CRS-12 yj
Several aspects of the achievement-based Title I funding discussion
might be of particular interest to the Congress, includin&: )
\/ -- a public policy choice;
- - the necessary data; and
the operation of the program.
,--)
A. A Public Policy Choice
The NIE report explores the use of achievement -based funding as a
possible alternative to the existing poverty-based forla of ESEA Title
I. The selection of a formula i§ a basic public policy choice whether
Title I primarily should assist poor schools and poverty children or
whether it should assist educationally deprived children and low achievers.
Research can illuminate some of the formula issues, bu othe ultimate
choice-of the funding objective must rely on basic legislative preferences
and value judgments about the priorities of the program itself. The
dimensions of the choice inclu the mixed objectives of Title I, the
original assumptions of the legislation, the research findings on the rela-
tionship between poverty and. educational deprivation, and the legislative
preferences themselves.
As indicated by the three'"fundamental purposes" identified in the NIE
study, the objective of Title I contains elements of assisting both poverty
and educationally deprived children. The formula includes both poverty and
educ.itianal deprivation standards for the allocation of funds; it uses pov-
erty as the sole allocation criterion for determining the funding of school
districts, poverty to select eligible schools, poverty or educational
1.7.
CRS-13
deprivation to fund schools, and educational deprivation for the selec-
lion of children to receive services within schoolS. Despite this mixture
of poverty and educational deprivation as the allocation mechanism within
school districts, the initial distribution o nds to the school district
level is completely determined by poverty criteria; thus, the program can
be referred to as having a "poverty-based" formula even though the funds
are 'used within schools to.purchase services for educationally deprived
children. A county or School district without any eligible poverty chil-r
dren cannot receive Title I funds, whatever its number of educationally
deprived children. The report indicates that some Congre-ssional considey- .
Lion has been given to changing from poverty standards to measures of edu-
cational deprivation `in the initi 'al allocation of funds,'as the basic21/
objective of the program and as the basis for the formula.
7It might b'e argued that one of the original' assumptions of the Title I
legislation was the existence of a close correlation between poverty and
educational deprivation (or low achievement test scores, Which are often
considered a.measure eif)f educational deprivation) If the correlation were
great enough, then there would, be noreal,need to decide the relative impor-
tanCe of the two elements the funding consequences would be 'the same and
the program could'be justified equally well as assistance to either poverty
-or eduptionally deprived children.
Acco.rding to the report, some would question the tstrength of the rela-22/
tionship between poverty and educational *deprivati.pn. An imperiect
j
21/ Ibid. , p. 1.
22/ Ibid.
L.
CRS-14
corresp6ndence betweerr\poverty and low achievement is implied byI
the NIE,4funding compdrisons. Although the reyort'does not directly address the
23/degiee of the relationship, a later NIE report does examine this question.
Based on a survey of existing research, it. indicates that, at the individual
level, educational achievement and family income are correlated on the24/
average at about the 0.3 level. The 0.3 correlation coefficient shows
that poor children armore likely to be low achievers than those from other
backgrounds; however, it also shows that many poor children are not low
achievers and that many low achievers are not poor.
The square of the correlation coefficient can be used to show the per-
centage of variance in one characteristic (e.g., achievement scores) that
can te explained or predicted from another (e.g., family income). For
example, if a correlation of 0.3 were found between achievem9At and income,
the square of 0.3 is 0.09, meaning that 9 percent of the variance in achieve-,
25/ment can be explained by changes in income. The correlation coefficient
cannot be used to imply that one characteristic causes another, but merely
the degree to which several characteristics vary together.
23/ U.S. Department Of Health, Education, and Welfare. Natidnal Instituteof Education. The Relationship between Poverty and AchievementbyamiAAli, Wolf. Washington, December, 1977. The summary of thisriloort is attached as Appendix A.
24/ Correlation coefficients are used to show the degree of a statisuicalrelattonshiP between two characteristics and can.have a range from-1.0 to +1.0, for perfect,negative and positive relationships,respectively., A coefficient of 0.0 would show absolutely no rela-
\ tionship to exist .
25/ The range of the, square of the correldtibn coefficient is- between 0.0 and+1.0, but except for these extremes,'the square will always bepmaller than the corresponding correlation coefficient.
.19

ICRS -.15
The correlation betweeb the proportions al'ahildren in povIrty and
low achievers was also-examined at the school and Scliool district levels.. -
Results vary markedly' at the school level, but'
fo0 r the country.as, a whole,
.0 7-
a 0.5 or 0.6 correlation was found: At the-school. district revel,
national average was not obtain'able; for the districts in:the limited num-
ber of States where data were available, a 'range between 0.0 and 0.6 was
fotind. Unlike the individual level correlations, ,proportional correlations
merely show that poorer districts generally have more low actpevers than
other districts it does not necessarily mean that the low achievers and
poverty children are the same individuals.
For the poverty-based Title I formula generally to assist low achievers,
there would only need to be correlations between poverty and row achievement
at (a) the district level within Slates and (b) the school level within dis-
tricts. The existence of an individual level relationship would not be
necessary since the funds would be allocated to schools with low achievers
anyway under the above conditions:
The interpretation of these findings may depend on basic legislative .
preferences. 'If the correlations are weaker than originally assumed, hen
the range of public policy choice is greater as to whether poverty or edu-
cati.onal deprivation shou1.21, be the primary basis of allocations. For those.
who consider Title I a poverty program -- or a program that allocates furids
to the poorest schools. for services to educationally deprived childrenl
within them -- these findings.may support, or be inponsequential to, their
legislative preferences. Specifically, the findings generally indicate that
in many States' and school districts, Title I funds are more 4ikel to beAy,
20
CRS-16
concentrated in schools with greater proportionsof low achievers than
;in 'other schools.
For those who think that the pt gram should be oriented toward
as sisting low-achieving children, the findings may suppo rt a legislative
change:" The findings indicate that allocations would be made somewhat
differently if ach evement-based funding werd, implemented and that the
existing formula does of provide assistance completely in proportion
to-the number of low-acilieving children.0
For those who think that he Title Ilorogram should contain a mix-
ture of poverty and achievement objectives, the findings might be examined
in conjunction with the current provisions to see what the appropriltt&
balance should be. .The correlations generally show that poverty-based
funding reaches many loW achievers and that achievement-based funding
would reach many,povety childre. However, the distribution of funds
could change -- at least margina ly, and significantly for some places
-- if achievement -based allocati ns were implemented.
B. The Necessary Data
Despite the amount of testing tliat occurs in elementary and secondary
education, the NIE report finds(that existing test data are insufficient
vfor achievement -based funding at either the State or school district' level.
Before obtaining the necessary data, the Congresi, or perhap.s an agency
suchas the NIE or the Office of Education, would have to resolve the
issues regarding the definition of low achievement and a guarantee of
accuracy of the resulting data -- issues on which test developers and edu7
cators apparently-disagree. The resolution of each specific issue is
21

°
CRS -17
expected to have an impact on the measurement of low achievement thus_
defined, and hence affect the dist`ribui ion f fund s that might be a.1 lo-
sated on that basis.t
According to the NIE report', a Federal system to collect test dat a
as a basis for school. district allocat ion s would take three years to
implement at an estimated list of $53 million (assuming that only nine-
year-old6 would be sampled and t hat only a single subject area would be
tested). If data Were coalected solely for making St ate ''1.1..ocat ion's, a
smaller cost is estimated. However, if States were required to undertalte
7 'their ',own test ing for school district allocations, the total Lost to
Tit le I might be the same as the cost for a Federal system to collect- sim-f
ilar data,. In either case some Tit le .I funds otherwise available for
direc,t educat ional services might be used to absorb t he cost s of t
testing program. ($53 million would amount to nearly 2 percent of t he Ti! le
I -appropr iat ion ,of, $2,735 million for fiscal rear 1979.)
The decennial' census collects poverty data a t hat are 'used in t he al lo-.
( at ion formulas, in various Federal programs; the achievement,Llat a collected
under the .proposed 'ystem do not appear to have any immediate utility for
Federal programs out side of educat ion. The data might be of some research
value for analyzing t he condition of American educat ion, although the
Nat ional Assessment of Ethical tonal ogress already undert akes such resear( h
with t he data it collects. The reports does not explore the potential for
,sharing t he cost s of collect ing achievement data with other Federal programs
or with h State government s.
A compar ison, of the collect ion of poverty :clat a with h t he proposed
.60cy

e
o
CRS-18
a( n I vVcMcnt ,tat d be useful. At no cost to t he Title I program,
poverty (hi ldren are count ed every ten years by t he decennial census
( a l t hough I he 1985 mid- decades census may provide more requent updates) .
At somp cost to t he program, achievement data coul8 be collect ed every
t hree years , accord ing to the report. Considerable fluct uat ions i n t)te
d ist r i but Ian of both poverty and low achievement are estimated to occur
over time, a l t hough th4 magnitude and frequency of change appear 'd i ffi--/
( ult to specify precisply.Assuming that the variation indicates an
ulider 1 ying change in t he'need for funds, t he fluctuating statistics
-1)ght be an argument in favor of more frequent data collection. For $53
omi 1 1 Ion from 1 he Title I program, however, equally current and accurate'
st i at es of he'!'number of poverty children might .be collected. Theti'
report does not explore this possibility nor is there a discussion of
'the current cost to the Tit le I program of allocating funds on the basis
o f out -of-date st at i st ics.
The report present s tentative estimates of allocations that might
incur under an achievement -based funding system; no precise comparisons
wi 1 1 be possible u t i 1 t he proposed three-year data collect ion is cora-
.
.. ».
"441.wt eq'. The syst veil s expected t o measurepal terns o f low achievement
tit f fvrent from any exist ing achievement data for two reasons. First,_,o
i fit. pattern of low 'achievers among school districts can be expeeted 0,o26/
t hange during any t tree -year per iod . Second , assuming that the low
42h/ 'U.S. Deport menl of Health, Educat ion, and Welfare. Nat ional Institute
of Educal ion. Using Achievement. Test Scored to. Allocate, Ti tie ,IFunds. p. 8.
I

CRS-19
achievement measure is different from any existing definition, a Federal
test would identify and couqt a different se,t. of low achievers that'.04
might be obtained through any existing test.
C. The Operationof the Program
On the basis of the NIE-repors, it would appear that some pyssible
complications of the existing Title I program might be alleviated by
achievement.-based funding, while some others wouldbe unikeeted. For
example, if counts of low achievers were estimated for every school dis-
trict , then the determination by States of subcounty allocation's could
be eliminated as'a sep-kfate stage Oi the allocations proc'ess. This stage
.- .
currently requi4'es States 'to 'o determine. school distrit allocations from
county alloc lions on he basis of some poverty criteria where county
and district boundaries do not coincide. The removal of this stage might
also allow an earlier report to disftict.s ofChe amount of Title I funds
they would receive for any fiscal year..
Other aspects of Title I program operations, especially those per-.
)taining to the administration of the program by school districts, are27/
unaddressed by the report. If school, istricts were sampled for low
achievers', special provisions would be necessary to include low'achievers
in nonpublic schools on an equitable basis in the Title I program. Several
27/ A companion report discusses the results of special demonstrationstudies of school districts which were allowed to use achievement-_based funding on infra- district allocations. U.S. Department ofHealth, Education, and Welfare. NatiAnal Institute of Education.Demdnstration Studies of Fdnds-Allocation.Within Districts.
Washington, September 30, 1977.
24 44

CRS-20
,
t
thatrequirements hdvL bevn designed to ensure Title I funds currently.).-
will be used for additional services to educationally deprived children,
but there is no indication whether these would be affected by achievement= '4:
based funding. Concentration, or targeting, of funds under the existing
program has been required to insure that services would b'e intensive
enough to meet the needs of participating children -- targeting of funds
might also t;e'necessary under achievement-based funding as well, but this
Is not discussed in the report.
I'
.,
,
o
...
t
1
0
,,
.,
25
al
A
,o-
o>
,
a
41
CRS-21
IV. Research Limitations44M
The N1E report disc,usses a possible change in one part of the ESEA
. ,
Title I formula, including the issues Involved, the estimated cost,a, and
,...--)
some, possi le effects. The overall usefulness of the findings is limited,
however, by the omIssion of certain-topics and espects related to a pos-
.
sible change in the,Title I formula: These include: ° -.
-- educational deprivation; c-
--, scope ofthe proposed testing;
-- program operation at the district level; and
nonpublic participation.
It might also be noted that the inadequacy of existing achievement data
/)6prevents the accurate prediction of the consequences of changing the
formula. that a discussion of current State programs using achievement-
basedbased fun ing would haveI
broadened the utility of the report; and that...v .
, .
little msention,i§vMade of how Tittle I State agency programs and State1 ,
administi'ative grants world be modified under achievement-based floadine.
..Educational Deprivation
The Title I declarationof policy indicates that programs should b,e
funded that "contribute particularly to meeting the special educational
needs of educationally deprived children." Although the majority of suck
children probably have low scores on achievemen't tests, it might be argu
that several types of chi.ldren would be excluded from assistance if low
achievement were used as the sole criterion for educational deprivation.
These children might include the. moderate achievers who could be high
achievers with special assistance,. gifted and talented" children with
26
it
44-

CRS-22
. special educational needs, and children with learning disabilities who
otherwise score well on ahievement tests. Using low achievement scores
ight% also include who are -poo"rly motivated in test taking
but are not educatiorially deprived otherwise. Low achievement scores
are often used as.an indic or of educational d pri.vation; nevertheless,
41:k
a discussion of the broader aspects of educa -tonal deprivation and its**.j measureMent would have been useful in t ,hAe report .
o
B. 5cope of the Proposed Test
The report might benefit"' from a mre thorough discussion of some of
he issues that woOd require resilutioq-1 i 43'natiokial testing system
were designed. For example, not all children.with lcifw scores in reading
also have low scores in.mathematics. A legislatUre definition of eduCa-:
tipnal deprrivat ion might benefit from- nowledge about the extent of theover p bet ween low achievement in, reading and mat hemat,icsb si411. as
tifrom some -est imat es on how d i f ferent ly funds might be allocated i f testing
)
were rest rioted to a 'Single subject area as opposed to several areas.I.T,, re ort 'indicates that low achieveinent varies according to the
A" ,40 or grade level -1 tst ed, but no figures are supplied to show the extent(\/of variation or the differences in allocations if a single or severalgrade levels were tested. It is claimed that seven.years /is the youngest
ad §abl ag for 'testing and that even at this age, the development and/
administration of tests would be compl icaterby the lack olest7taking28/.
abilities -of such young children,. More discussion of I he problems of
28/ U. Department of Health, Education, and Welfare. National Institute of. *
Education. Using Achievement Test Scores to Allocate.Title I Funds.p. 6.,
27
61,
CRS-23
testing at various age levels might assist the resolution of this issue.
Ab.Unlike poverty data, testing data may be subject to mcipulation by
teachers and school officials, thereby increasing the amount of funding29/
for themselves, according to the report. Methods of counteracting
this possibility are discussed, and it is concluded tilat a combination
of administrative procedures would make data Manipulation unlikely. How-
ever, this problem is also discussed in another report, written under NIE
contract but apparently not a part of the'compensatoryeducation study,
that suggests the wide range of opportunities for educators to mi§educate
children, or for schools to give the appearance of low achievement (such'
30/as early promotion to Ihe grade level where testing might take place.) 7
,The contract report also indicates that teachers May take enough pride in
Producing high-scoring students to:/counterbalance the incentives to gain
more funds, but -concludes that additional research is needed on the entireAt*.topic.
The national testing system discussed in the report would provide
estimates of numbers of low achievers at ;the "10 percent precision level"s
(meaning that the ranges of values within 10 percent of the estimated num-
ber obtained from a series of samples will contain the act-ual number 9531/
percent of the time). Some may consider this level of accuracy too
29/ Ibid., pp. 8-10.30/ Feldriiesser, Robert A. The Use of Test Scores as a Basis or AllocatingEducational Resources. (Final Report of 'a Study Conducted forthe National Institilte of Education under Grant No. NIE-G-74-0066.)
Princeton, Educational Testing Service, November, 1975. pp. 71-74.31/ U.S: Department of Health, Education, and Welfare. National Institute ofEducation. Using Achievement Test Scores to Allocate Ti:tle ,,I Funds.p. 19.
28
CRS-24
imprecise. For example,' the largest allocation for any State under the
"Listing Title I program is about $200 million (received by New York).
A leeway of 10 percent in the estimation 'error in this case would mean
a gain or loss of up to $20 million, or a range of $40 million for the
largest State allocation. Information an the accdracy of the estimates
of poverty'children counted in the decennial census might have provided
a useful basis of co9parison4 might have been helpful to have a
summary of the levels of accuracy current17 found in other Federal alloca-
tion formulas using estimated data as a basis for the distribution, of
funds.4
The report mignt have benefitted from a revie%.of the literature
regarding the development or emergence of national curriculum standards32/
as a possible*consequence of a national testing system.- Widely dif-
ferent points of view are possiBle on this issue, including:
(a) national testing would not lead to national curriculum standards;
(b) testing might not lead to national standards, but local educatorsmight nevertheless feel compelled to "teach to the test" anyway;
(c) testmg would lead to national standards, and the nation's schoolsneed them; and
(d) testing would lead to national standards, but their responsibilitytraditionally and properly should reside at State and local levels
of governance.
32/ See, for example, Olson, Paul A. Power and the National Assessment ,
of Educational Progress. National Elementary Principal, v. 54,
July7August 1975, pp. 46-53;Tyler, Ralph W. Some Comments on Power and the NAEP.
National Elementary Principal, v. 54, July-August 1975, pp. 54-56;
and
Cawejti, Gordon. Requiring Competencies for Graduation
Some Curricular Issues. Educatia.91 Leadership, November 1977,
pp. 86-92%
29

CRS-25
The creation of the National Assessment of Educational Progress' NAEP)
in the late 1960's aroused somelfears of the advent of national curriculum
standards. An evaluation of the actual consequences of the NAEP might
have been useful as a basis for judging the impact of the national testing
system discussed in the NIE_uport.
C. Program Operation'at the School District Level
Achievemant-based funding as an alternative to the Title I formula
would'appear to have two distinct parts: allocations among school dis-
tricts and allocations within school districts. The report,however,
focuseson the part of the formula that allocates among school districts,
'and claims that "achievement-based funding within school districts is pos-, 33/
sible
A companiqn report discusses demonstration projects in 13 school dis-t,
34/tricts that volunteered for a special NIE study, but these districts
provide insufficient evidence onthe extent to which the 1 ,000 existing
%school districts have test data suitable for achievement-based funding.?
,,,/,,,'
-.
FurtilermOr'6' 4:14-SYlit''Intdgt.a,m,,ii.ling'-mall sample of children from each\a4
school district may be sufficient for the; Allocation of funds to school
districts, but a testing program of all children may be,. necessary. to select
the students in seed of services within each district. There is no discus=
sion on whether Federal achievement standards should prevail in achievement-
33/ U.S. Department of Health, Education, and Welfare. National Instituteof Education. Using Achievement eTest Scores to Allocate Title IFunds. p. 12.
34/ U.S. Department of Health, Education, and Welfare. National Instituteof Education. Demonstration Studies of Funds Allocation withinDistricts.
30.
tr-CRS-26
based allocations within school districts, or whether local discretion
might be allowed at this stagq in t formula. Assuming that allocations
will be ,insufficient to meet the needs of all education'ally deprived
children, the alternatives to a full scale testing program to identify
each individual low achiever throughout every school district would appear
to be the restriction of services to specific grade levels or specific
6
target schools, but neither this report nor the companion volume discusses
this question.
D. Nonpublic Participation
All poverty children, either in or out of public schools, are counted
for allocation purposes under the current Title I formula. Beyond indicat,ing
that nonpublic school enrollment figures would have to be federally collected,
under the achievement-based funding proposa,l, there is no mention of how
nonftAlblic-children would be tested or how the funds would be distributed for
serving these children. A discussion of how nonpublic schools would fare
under a(hievement-based funding might have increased the utility of the NIE
"report .

7
CRS-27
V. Context of the Report
One of th.4 prOVisions of the Education Amendments of 1974 r.equ.ired
that the NIE make a study of the purposes and effectiveness of compen-
satory education (section 821, Public Law 93-380). Specifically, the
study shall
a. an examination of the'fundamental purposes of compensatoryeducation;
b. an analysis of the means to identify the children with\thegreatest need for such programs;
an analysis' of the effectiveness of methods and proceduresfor meeting the educational needs of such children;
c.
an exploration of alternative methods for distributing com-pensatory .education funds to States and school districts ina timely and effective manner;
e. not more than 20 experiMental programs, geographically rep-resentative to assist the NIE in carrying out the 'purposesof this study; and
f. findings and recommendations, including recommendations forchanges in'ESEA Title I or for new legislation.
Funding for the -NIE study amounted to $15 million, to be obligated
during fiscal years 1975 through 1977. As amended by Public Law 94-482,
the law requires the NIE to submit interim reports to the President and
the Congress on December 31, 1976, and on Iptember 30, 1977, and to sub-
mit a final report on September 30, 1978.
%
32

`s.
J
I-
CRS -28
Six report s constitute t he NIE interim report' of Sept ember 1977. These
are ent i
"Adm in i st rat ion ACompensat ory Educat ion"
"Compensator y Educat ion Services" -
"Demonstration Studies of Funds Allocation Within Districts"
"Tne Effect s of Services on St udent Development"
"Title I Funds Allocation: The Current Formula"
"Using Achievement Test Scores to Allocate Title I Funds"
fne interim report of, December 1976 is ent it led "Evaluating Compensatory
!:d ut at ion . It di susses NIEI s strategy for t he overall study and presents
pre 1 iminary findings of a survey of compensatory educational services in 100
school districts.
the N1h. has ,designed 35 research projects to make a comprehensive
response to t he mandates o f t h e .legislation. The spec ific projects, t hef
( ont ract or, and t he complet ign dates of each project are described in
Append ix. N of "Eval-uat ing Compensatory Educat ion." The NIE! has divided t he
pro lo( t s into f9ur major' areas of inquiry:
funds al local ion research, 'including alt ernat,ekasures of pov-
erty, not more than 20 experimental programs for school districts(16 districts participated in t he first year, 13 in the second
year) , a computerized simulat ion model, an analysis o-f t he rela-
y ionshi p bet ween poverty and "educational achievement , t he di stri-
but'Lanal,consequencesof using student achieement measures, andt he subcount y al local ion -process;
b. ' research on services, including a survey of compensatory edu-cat ion' int 100 school districts, case studies on noninste uct i nal
services provided under ESEA Tit le I, and a feachen-training st'ud'y';' '
33

1
CRS-29
c. research concerning effects on children, including-alternativeapproaches to education, such as cross-age tutoring, client-con-trolled elementary schools, the extent of parental involvement,and some studies of teaching basic skills in reading and math-ematics; and
d. administration, including a study of the Federal administrationof ESEA Title I, a survey of how States regulate ESEA Title Iand State compensatory education programs, a case study on ESEATitle I and desegiegation, a study of parent advisorycouncils,a study of the participation of nonpublic schoolOildreri in com-pensatory education programs, a review of test bias and theclassification of children. (A study of the problems of imple-menting ESEA Title I in tural schools was originally planned,
. ,
but has been cancelled.)
The ESEA, Title I 'authorization for appropriations was extended through
fiscal year 1979 under the provisions of the Education Amendments of 1977
(P.L. 95-112, September 24, 1977). Without further Congressional action,
section 414, of the General Education Provisions Act will automatically
extend Title I for one additional year. Several bills have been -introduced
in the 95th Congress to extend Title I authorization for additional years,
including:
H.R. 15 (Perkins), "Elementary and Secondar EducationAct of 1977." Among other provisions, extends the Title Iauthorization through fistal year 1983, making no otherchanges in Title I legislat ion.
S. 1753'(Pell), "Elementary and Secondary Education Actof 19T7." Contains Title I provisions similar to H.R. 15.
H.R. 7571 (Qqie), "Elementary and Secondary EducationAct of 1977." Amqng other provisions, exten'ls the Title Iauthorization through fiscal year 1982, but changes the pur-pose of Title I to provide financial assistance for programsthat help overcome deficiencies in children's basic learningskills, and would allocate funds according to educationalneed as measured by an assessment of reading, mathematics,and language arts..
34

CRS 32
SIMIARY
NIE examined the available evidence on the relationship between_a
student or location's pterty and their average level of achievement. Thls
was done separately for four different categories: individual pupils,
schools, districts, and states, Information on the relation4glp between
other social indicators and achievement was also examined. The results
indicated that the strength Of the relationship is different for each of
the four categories, and also varies from place to place.
relationships.
Studies using national samp es of students are generally consistent
in their results and show"thievement and family income to be correlated
about the 0.3 level. Many poor children are not low-achi6ring and many
law-achievers are not poor.
However, poor children are more likely to be low:-achieving than those
ffrom other backgrounds. The percentages of poor children classified as
low achieving naturally vary with the definition of low-achievement used,
but in genera/ they are about twice as likely perform poorly as are 'their
peers. (,Other social measures, such as parents' education,show -similar
tesults.6
These figures are national averages. When students.in particular
districts are studied the relationship between their family inch and
their attainment is often quite different. In NIE's monstration districts,
the correlation between family income and achievement anged from a high of
.46 to a law of .03. In one of the districts, 66% of oor children read
a year or more below grade level. In another, the figure was 30%.
School-level relationships A
NIE also examined the relationship between the proportion of a school's
pupils in poverty and its average achievement level. The results indidate

CRS - 33II
.1r
that'ili many large cities, the poorest schools are most often also the lowest
'achieiiing. Correlations are generally as high as .8 or .9. In other
districts, however, schools' pov1erty and achievement are far less closely
related, and correlations are sometimes very low. This probably reflects. ,
the fact that in many lar cities, neighborhoods vary markedly in income
level and type, Whereas el where residential patterns are mAe' mixed: For
the country as a whole, thg...eorrslation Is about .5 oz.:6. No other single
social measure-is consistently. more strongly related than poverty to school
achievement. r
We should emphasize that a high correlation.at the school level does-$
not mean that all poor pupils or ldw-achievers are in the poorest schools.
Rather it indicates that schools will tend to have the same ranking when
ordered in terms of, their proportions of poor and proportions'of low-achieving
pupils. In some districts, most poor and low-achieving pupils are concen-
trated ina limited ber o schools. In others they are quite evenly
distributed-across the district.
District-level relationshirs
The relationship between the proportion of a district's students who
are low- achieving and the proportion of its children.in povty varies
omarkedly from state to state., In some it'is fairly close, with correlations
going as high as .6. In othes, there is virtually no relationship. The7!.
same is true for other social indicators, such as the'percentage of female-.
headed or welfare families in a district, or whether the district is urban,
surban,_or rural. In some states, these characteristics are clearly
correlated with district achievementrin °tilers, no such relationship is
apparent.'
3 6

Vot
III
, .
State -level relationshins
The final-level at which the poverty-achievement relationship was
examined was that of the states. Heie the relationship appears to be fairly
strong. The poorer;states tend also to have lower average achievement.
However, this is probably in large part because the South, which remains
the poorest region of the country, also shows markedly lowet achievement
CRS - 34
7
thart do othet regions. In other words, Southern states are at the top when
States are ranked by either their percent poor or their percent low-achieving.
However, within regions, the relationship is considerably less close.. e
1
1
$
I
37
a
c