Embed Size (px)
Citation preview
ED 050 874
TITLE
INSTITUTIONSPONS AGENCY
PUB DATENOTEAVAILABLE FROM
EDRS PRICEDESCRIPTORS
ABSTRACT
DOCUMENT RESUME
RC 005 307
The Economic and Social Condition of Rural Americain the 1970's: Part 1.Economic Research Service (DOA), Washington, D.C.Congress of the U.S. , Washington, D.C. SenateCommittee on Government Operations.May 71159p.Superintendent cf Documents, U.S. GovernmentPrinting Office, Washington, D.C. 20402 ($1.00)
EDRS Price MF-$0.65 HC Not Available from EDRS.*Demography, Development, *Education, *Employment,Federal Aid, Health, Housing, Income, Programs,*Rural Areas, Services, *Socioeconomic Influences
As part of a report by the Economic DevelopmentDivision of the Economic Research Service, U.S. Department ofAgriculture, to tte 1st session of the 92nd Congress, thesocioeconomic conditions and trends of rural America in the 70's aredescribed by way of statistical compilation of data. The reporthighlights the problems of rural people according to where they livein contrast to where others live. The document presents the materialin 5 categories: Population, Income and Employment, Health andEducation, Housing, and Government Services and Facilities. ftEach ofthese sections is introduced by an overview statement on the subjectmatter included. The tables and charts are accompanied by a briefnarrative on the particular set of figures presented." (EL)
CO
CJLCN
UJ
92d Congress 11st Session f ,COMMITTEE PRINT
MS. DEPARTMENT OF HEALTH. EDUCATION& WELFARE
OFFICE OF EDUCATIONTHIS DOCUMENT HAS BEEN REPRODUCEDEXACTLY AS RECEIVED FROM THE PERSON ORORGANIZATION ORIGINATING IT. POINTS OFVIEW OR OPINIONS STATEO DO NOT NECESSARI LY REPRESENT OFFICIAL OFFICE OF EDO.CATION POSITION OR POLICY.
THE ECONOMIC AND SOCIAL CONDITIONOF RURAL AMERICA IN THE 1970's
PREPARED BY:
ECONOMIC DEVELOPMENT DIVISIONECONOMIC RESEARCH SERVICE
U.S. DEPARTMENT OF AGRICULTUREFOR THE
COMMITTEE ON GOVERNMENTOPERATIONS
UNITED STATES SENATENINETY-SECOND CONGRESS
FIRST SESSION
Part 1
MAY 1971
Printed for the use of the Committee on Government Operations
U.S. GOVERNMENT PRINTING OFFICE
60-2970 WASHINGTON : 1971
For sale by the Superintendent of Documents. U.S. Government Printing OfficeWashington, D.C. 20402 - Price v.
Stock Number 0704077
1
COMMITTEE ON GOVERNMENT OPERATIONS
JOHN L. McCLELLAN, ArkaL.,as, ChairmanHENRY M. JACKSON, WashingtonSAM J. ERVIN, Jn., North CarolinaEDMUND S. MUSKIE, MaineABRAHAM RIBICOFF, ConnecticutFRED R. HARRIS, OklahomaLEE METCALF, MontanaJAMES B. ALLEN, AlabamaHUBERT H. HUMPHREY, MinnesotaLAWTON CHILES, Florida
U
KARL E. MUNDT, South DakotaJACOB K. JAVITS, New YorkCHARLES H. PERCY, IllinoisEDWARD J. GURNEY, FloridaCHARLES McC. MATHIAS, JR., MarylandWILLIAM B. SLIME, OhioWILLIAM V. ROTH, JR., DelawareBILL BROCK, Tennessee
JAMES R. CALL.01VA'., Chief Counsel and Staff DirectorJAY E. Goosmaw, Assistant Chief Clerk,
ELI B. Nom, mull, Professional Staff MemberCHARLES M. RYAN, Professional Staff MemberTHOiAa M. GUNN Professional Sta.!, MemberS. ARNOLD SMITH, Professional Staff Member
ARTHUR A. SHARP, Staff Editor
2
FOREWORD
The committee is pleased to present this study, which was preparedfor its use by the Economic Research Service of the Department ofAgriculture. The information was requested in connection with thecommittee's hearings on S. 10, a bill to revitalize rural and other eco-nomically distressed areas.
This studythe first of a seri?s and the first of its kindis an over-view of the economic and social conditions of rural America. It mar-shals relevant statistics to demonstrate existing problems, highlightstrends, and faciEtates a better understanding of the needs in theseareas. The study contains five categoriespopulation ; income and em-ployment; health and education; housing; and government services andfacilitieswhich graphically compare rural regions with our metro-politan centers.
The statistical data indicates dolt large segments of rural Americaare underdeveloped pockets within our highly industrialized econ-omy. It underscores the compelling need for action to correct the eco-nomic and social imbalance between rural and urban communities.
The factual material on income, education, and employment tells itsown storyindicating that the standard of living in rural America isfar below the national average. The committee looks forward to fur-ther studies from the Economic Research Service. These will buildupon this informational base and explore existing trends and alterna-tive policies for the future.
The committee is indebted to the Department of Agriculture forcompiling this information and particularly grateful to Mrs. HelenW. Johnson, Dr. Lynn M. Daft, Dr. William C. Motes, Mr. CalvinBeale, and Dr. Lindley E. Juers for their help.
JOHN L. MCCLELLAN,Chairman, Comiraittee on Government Operations.
ILE
3
LETTER OF TR/ TSMITTAL
U.S. Dm. ARTALiNT OF AGRICULTURE:,ECONOMIC RESEARCH SERVICE,
Washington, D .0 May 3,1971.Hon. JOHN R. MCCLELLAN,Chirman,Committee on Government Operations,U.S. Senate, W cshington,D.C.
DEAR MR. CHAIRMAN : In response to your letter of March 18, 1971,to Secretary Hardin and subsequent discussions with your staff, I amhereby transmitting a descriptive report of the economic and socialcondition of rural America.
I trust this information will be helpful to the work of yo, Com-mittee on Government Operations. We will be submitting otherstudies you requested as they are completed.
Sincerely,M. L. UroluRcH, Administrator.
4
CONTENTS
ForewordLetter of Transmittal_IntroductionWhat Is Rural America?
I. PopulationPopulation of the United States, by urban and rural residc_ce,
1900-70Farm Population and Migration, 1920-69Average Annual Net Outmigration from the Farm PopulationMajor Streams of Nonmetro Migration to Selected Metro Areas,
1955-60U.S. Population by Residence, Race, and Migration Status, 1967Population Mobility Rates (1947-48 to 1967-68)Rates of Mobility by Age, 1967-68Natural Decrease Counties, 1950-66, With Projections to 1970_ __ _Small Towns StudiedU.S. Population Change, 1960-70Rapidly Growing Places in Nonmetropo]itan AmericaTrends in Population RetentionThe Distribution of Population Trends During the 1960's and 1050's_
II. Income and Employment
PageIII
VXI
1
246
81012141618202224
29Per Capita Personal Income by Metropolitan Residence (1929-68)__ 30Average Annual Rates of Change in Personal Income, Metro-Non-
metro, by Regions, 1950-59 and 1959-68 32Personal Income of the Farm Population 34Income Per Farm Operator Family by Major Source and by Value of
Sales Classes, 1969 36Number of Farms by Value of Sales Classes, 1960-69 38Number of Commercial Farms, and Average Farm Size and Value,
by Farm Production Regions, March 1, 1964, and 1969 40FarmsNumber, by Size, 1940 to 1964, and Percent Distribution of
Number of Farms, 1964 42Earnings by Industrial Sources Where Earned, 1968 44Persons Below Poverty Level, by Family Status, 1959-69 46Persons by Poverty Status, by Type of Residence, 1969_ 48Percentage of Central City Populations That Live in Poverty Areas,
by Migration Status, 1967 50Employment, by Industry, United States, Metropolitan and Non-
metropolitan Areas, March 1960 and March 1970Employment Gains for Industry Groups by Metro-Nonmetro
Location, 1960-70Employed Persons 16 Years and Over by Type of Industry: Annual
Averages, 1950-70 56Government Purchases of Goods and Services and Compensation of
Employees in Government Enterprises, 1962-69 58Employment Resulting from Government Purchases of Goods and
Services, and Employment in Government Enterprises, 1962-69 60Distribution of Farm Wageworkers by Selected Characteristics, 1970_ 62Average Number of Days Worked and Wages Earned Per Day at
Farm and Nonfarm Wagework, for all Farm Wageworkers, 1960and 1965-70 66
Unemployment Rates of Persons 16 Years of Age and Over, byIndustryndustry Group: Annual Averages, 1£50-70 68
Trideices of Output Per Man-Hour, 1950-70 70
VII
5
V31( CONTENTS
PagoIII. Health and Education 73
Physicians and Hospital Beds by Metropolitan Status, UnitedStates, 1969 74
Health Personnel Per 100,000 Population 76Nonmetro Shortage in Medical Specialists and Accredited Hospitals_ 78Location of Physicians, Dentists, Hospital Beds, and Nursing Home
Beds, South Dakota 80Health Manpower, 1980 82Infant Mortality Rate by Color, County Group, and Per Capita
Income Group of States: United States, 1961-65 84Visits to Physicians 86Dental Visits 88Hospital Insurance Coverage 90Educational Attainment of Persons 25 Years and Over, by Color
and Residence, March 1970 92Median Years of School Completed for Persons 25 to 29 Years Old,
1969 and 1960 94Years of School Completed for Males 25 to 54 Years of Age, 1969
and 1960 96Median Income for Males 25 to 54 Years of Age, by Years of School
Completed, 1968 and 1959 98Lifetime Income of Men, by Years of School Completed: United
States, 1966 100Total Expenditures for Education Related to Gross National Product:
United States, 1929-30 to 1969-70 102Expenditures Per Pupil of Local Public School Systems, by Metro-
politan Status, 1967-68 104
IV. Housing 107Occupied Substandard Housing Units by Metropolitan Residence,
1950-1970 108Percent of Occupied Housing Units Outside Metro Areas Without
Complete Plumbing, by States, 1970 110New Housing Units StartedSelected Characteristics: 1960, 1965,
and 1970 112
V. Government Services and Facilities 115Number of Local Governments by Type and Metropolitan Status,
1957 and 1967 116General Revenue from Own Sources of Federal, State, and Local
Governments, 1946 through 1968-69 118Per Capita Expenditures of Local Governments for Selected Services,
by Metropolitan Status, 1966-67 120Selected Items of Local Government Revenues Per $1,000 of Personal
Income, by Metropolitan Status, 1967 122Relative Revenue Effort in Individual States, by Level of Govern-
ment, 1966-67 124Measures of Relative Nonproperty Tax Capacity, for States, 1960,
and 1966-67 126Total Employees of Federal and State-Local Governments, United
States, 1951-69 128
VI. Areawide Planning and Development Districts 130State-Designated Planning and Development Areas EffectiveJanuary 1, 1971 131
Air Quality Control Regions Designated by the National Air Pollu-tion Control AdministrationStatus as of February 1, 1971 132
Districts Receiving Planning Funds from the Law EnforcementAssistance Administration of the Department of JusticeEffectiveMay 1 1970 133
Metropolitan Planning Agencies and Nonmetropolitan DistrictsReceiving Comprehensive Planning (701) Grants from HUD inFY 1969 and FY 1970Boundaries Effective January 1, 1970 134
Cooperative Area Manpower Planning System (CAMPS) SubstateAreas Effective July 1, 1970 135
Community Action Agencies Funded by the Office of EconomicOpportunityEffective July 1, 1970 136

CONTENTS DC
PageEconomic Development Districts Designated and/or Funded Through
January 1, 1971 137Regional Action Planning Commissicns Formed Under Title V of
P.L. 89-136 and Local Development Districts Designated by theAppalachian Regional Commission, Effective June 1, 1970 138
Resource Conservation and Development Project Areas, EffectiveAugust 1 1970 139
Comprehensiveomprehensive Health Planning Agencies Funded UnderSection 314 of the Public Health Service Act, Effective July 1,1970 140
Metropolitan and Reg, °nal Clearinghouses Established UnderBureau of the Budget Circular A-95, Effective January 1, 1971_ _ 141
INTRODUCTION
What Is Rural America?
This document is designed to describe the economic and social con-ditions and trends of rural America. It is a statistical compilation eventhough it is recognized that statistics do not do full justice to humanCharacteristics. It highlights the problems of rural people accordingto Nvlere they live, and in contrast to where others live.
The concept of rural America is widely used and understood, butin fact is not precise. It has different meanings when viewed philo-sophically, historically, and statistically. In general, the problems char-acteristic of rural Americans are found in the areas which lie outsideof metropolitan centers. Problems of availability of data sometimesdictate that rural and urban designations be used in place of metro-politan-nonmetropolitan. Neither of these concepts is discrete nor easyto apply statistically.
The rural population, as defined by the Bureau of the Census, in-cludes persons living in the open country or in towns of less than2,500 people. It is subdivided into the rural farm population whichcomprises all rural residents living on farms, and the rural non-farm populatioh which includes the remaining rural population. Theurban population comprises all persons living in urbanized areas andin places of 2,500 or more outside of urbanized areas.
The concept of urbanized areas was adopted by the Bureau of theCensus in 1950 to provide a better separation of urban and rural popu-lation near the larger cities. An urbanized area contains at least onecity of 50,000 population (or twin central cities with a combined popu-lation of at least 50,0N), and may be thought of as divided into thecentral city, or cities, and the remainder of the area, or the urbanfringe.
The metropolitan-nonmetropolitan residence categories are basedon delineations or standard metropolitan statistical areas. SMSA___metropolitan areas, contain centers of 50,000 population or more. N'on-SMSA's, or nonmetro areas, comprise the remainder. There are cur-rently 243 standard metropolitan statistical areas in the United States.States.
These are broad definitions which do not explain many variationsin their application. As population setttlement and density patternsdiffer in and around cities and in outlying areas, arbitrary decisionsare made about how to classify the resident population. People livein a variety of situations today that defy easy classification. For ex-ample, a subdivision of 50 homes and only 200 people, outside theboundaries of a small city (less than 50,000 population), but clearly
TX'
8
XII INTRODUCTION
the outgrowth of that cit.,. , is treated as rural. A military installationout in the country, with thousands of men and hundreds of depend-ents
2and containing streets, schools, stores, and other typical features
of cities was previously classified as rIel. but is now included in theurban population. Farms inPide an incorporated area are also con-sidered urban if the incorporated population is 2,500 o_ more.
In a sense, we are the slaves of the data available to us. The readershould be aware that narrow statistical definitions that remain largelyconstant over time can fail to capture the full significance of emergingsituations. A neat compartmentalization of society into urban andrural, or even metro and nonmetro, categories can show differencesand trends and is the best tool available, but it hides many complexdegrees and variations in rural and urban America.
The data presented are 1970 data whenever possible, but, in othercases, they are for the most current year available.
PRESENTATION OF THE DATA
The material in this document is presented in five categories : (I)Population; ( II) Income and :Employment; (III) Health and Edu-cation; (IV) Housing; and (V) Government Services and Facilities.Each of these sections is introduced by an overview statement on thesubject matter included. The tables and charts are accompanied by abrief narrative on the particular set of figures presented.
The data are from the Economic Research Service and other sources,which are indicated in each case.
9 0
THE ECONOMIC AND SOCIAL CONDITIONOF RURAL AMERICA IN THE 1970's
I. POPULATION
The principal characteristic of change in U.S. population sinceWorld War I has been urbanization. Urban growth from migrationawl natural increase has gone on apace. The rural sector has becomepredominantly nonfarm. Our population has become increasingly con-centrated in the metropolitan land areas, while other large portions ofthe country have been partly emptied out.
The coastal areas of the United States continue to attract ruralmigrants, although at a lower rate than was true in the 1950's, whilethe Great Plains, intermountain and other areas are becoming moresparsely populated. Three States, two of them in the northern GreatPlains, had a net loss in population between 1960 and 1970North andSouth Dakota and West Virginia.
Although the rural population has remained at about the same level,54 million, for the past five (^3ades, the farm population has become asteadily smaller proportion of it. Thrt." fifths of the rural populationwas composed of farm people in 1920; by 1970, the portion was onlyone-fifth. Decline in agricultural employment has accounted for con-tinuing outmigration of the farm population, especially where non-fklrm jobs have not filled the gap in farm employment.
The most significant, and continuous, migration over the past twoclk,cades has been from rural to urban areas. Even though the pace ofthis migration has slowed, the U.S. population is still highly mobile.Every year since the late 1940's, about one-fifth of the people havechanged their residence.
1
10
2 ECONOMIC AND SOCIAL CONDITION OF RURAL AMERICA
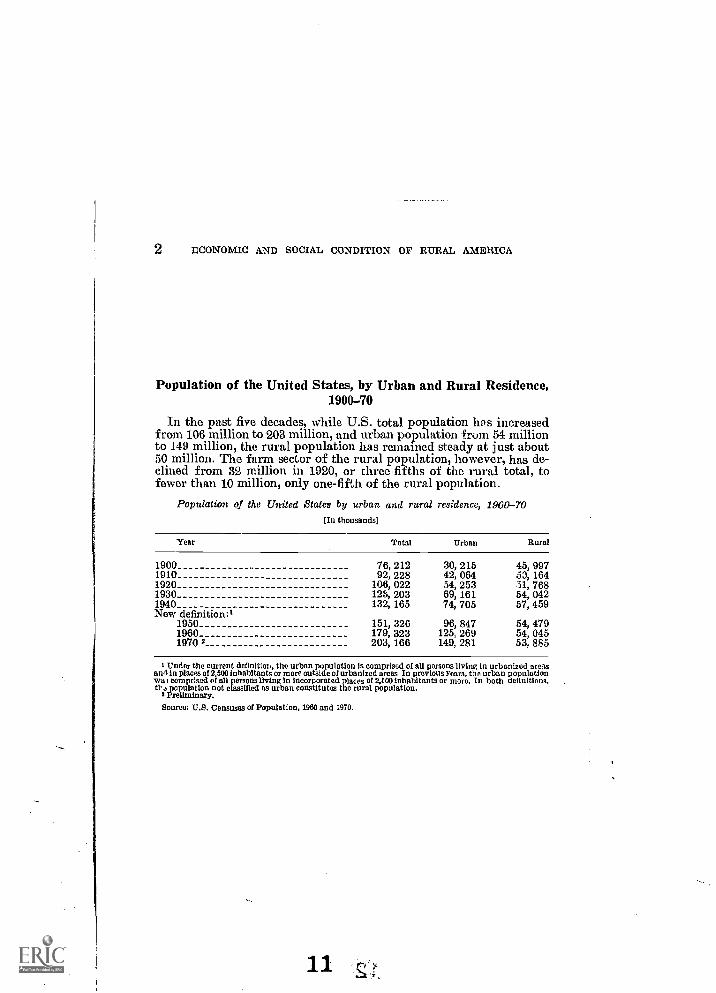
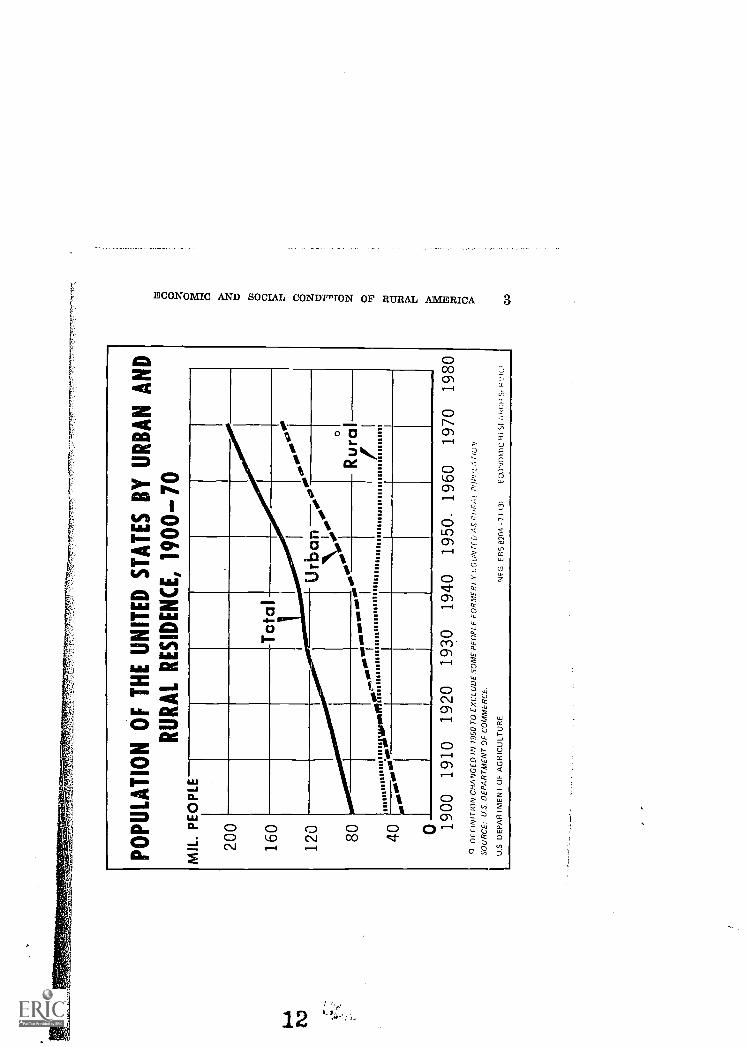
Population of the United States, by Urban and Rural Residence,1900-70
In the past five decades, while U.S. total population has increasedfrom 106 million to 203 million, and urban population from 51 millionto 149 million, the rural population has remained steady at just about50 million. The farm sector of the rural population, however, has de-clined from N million in 1920, or three-fifths of the rural total, tofewer than 10 million, only one-fifth of the rural population.
Population of the United States by urban and rural residence, 1900-70[In thousands]
Year Total Urban Rural
1900 76, 212 30, 215 45, 9971910 92, 228 42, 064 53, 1641920 196, 022 54, 253 31, 7681930 123, 203 69, 161 54, 0421940 132, 165 74, 705 57, 459New definition:1
1950 151, 326 96, 847 54, 47919601970 3
179,203,
323166
125,149,
269281
54,53,
045885
I Under the current definition, the urban population is comprised of all persons living in urbanized areasand in places of 2,590 inhabitants or more outside of urbanized areas. In previous Years, the urban populationwa comprised of all persons living In incorporated places of 2,600 inhabitants or more. In both definitions,th a population not classified as urban constitutes the rural population.
Preliminary.Source: U.S. Censuses of Population, 1900 and 1970.
11
PO
PU
LAT
ION
OF
TH
E U
NIT
ED
ST
AT
ES
BY
UR
BA
N A
ND
RU
RA
L R
ES
IDE
NC
E, 1
900-
70
MIL
. PE
OP
LE
200
160
120 80 40
Tot
al
Urb
an \,0R
ura
iiiiii
iiiiii
iiiiii
iiiiii
iiiiii...
.iiii
0.00
*".°
0 1900
1910
1920
1930
1940
1950
_ 19
6019
7019
80O
DE
FIN
ITIO
N C
HA
NG
ED
IN 1
950
TO
EX
CLU
DE
SO
ME
PE
OP
LE F
OR
ME
RLY
LO
LA/ r
FO
AS
RD
PA
I PIR
IFIL
4 H
ON
SO
UR
CE
: U.S
. DE
PA
RT
ME
NT
OF
CO
MM
ER
CE
.
U.S
. DE
PA
RT
ME
NT
OF
AG
RIC
ULT
UR
EN
EG
. ER
S 8
204
-71
(3fC
UN
OM
tU 4
}- S
i Atic
:Fi
PvI
ci
0 0

4 ECONOMIC AND SOCIAL CONDITION OF RURAL AMERICA
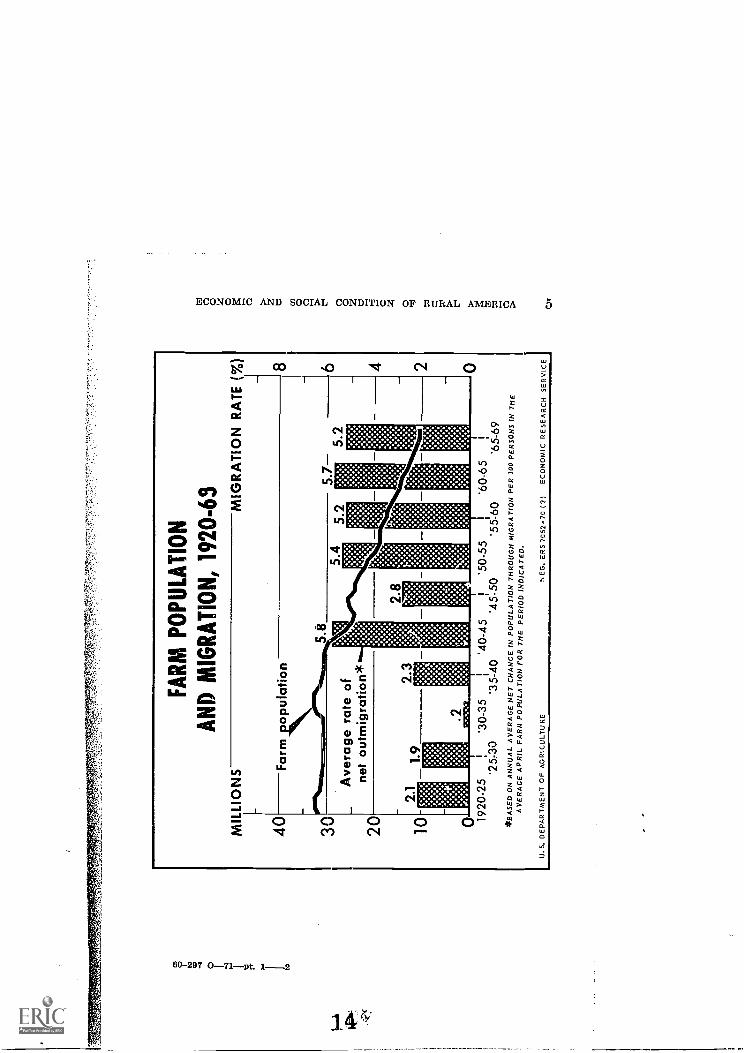
Farm Population and Migration, 1920-1969
For the past three decades, except for the years 1945 to 1950, theaverage rate of net outmigration of the farm population has beenabove 5 percent.
Although the rate of outmigration has remained high, the numberof outmigrants has declined from about 1 million per year in the1950's to about 600,000 in the 1960's, due to the greatly reduced farmpopulation base.
Farm population, 1920-1970
YearFarm population
(In thousands)Percent of total
T.I.S. population
1920 31, 974 30. 11925 31, 190 27. 01930 30, 529 24. 91935 32, 161 25. 31940 30, 547 23.21945 24,420 17. 51950 23, 048 15. 31955 19, 078 11. 61960_ 15,635 8.71965 12,363 6. 41970 9, 712 4. 8
Source: Economic Research E (3, U.S. Department of Agricultore.
13 t t
MIL
LIO
NS
40 30 20 10 0 1920
-25
!'3
0-35
I'4
0-45
I'5
0-55
I'6
0-65
!'2
5:30
'35-
40'4
5-50
'55-
60'6
5-69
*BA
SE
D O
N A
NN
UA
L A
VE
RA
GE
NE
T C
HA
NG
E IN
PO
PU
LAT
ION
TH
RO
UG
H M
IGR
AT
ION
PE
R 1
00 P
ER
SO
NS
IN T
HE
AV
ER
AG
E A
PR
IL F
AR
M P
OP
ULA
TIO
N F
OR
TH
E P
ER
IOD
IND
ICA
TE
D.
FA
RM
PO
PU
LAT
ION
AN
D M
IGR
AT
ION
, 192
0-69 M
IGR
AT
ION
RA
TE
( %
)
Far
m p
opul
atio
n
s.s
5.7
5.2
Ave
rage
rat
e of
net o
utm
igra
tion*
8 6
U.S
. DE
PA
RT
ME
NT
OF
AG
RIC
ULT
UR
EN
EG
. ER
S 7
052-
20 (
2)E
CO
NO
MIC
RE
SE
AR
CH
SE
RV
ICE
6 ECONOMIC AND SOCIAL CONDITION OF RURAL AMERICA
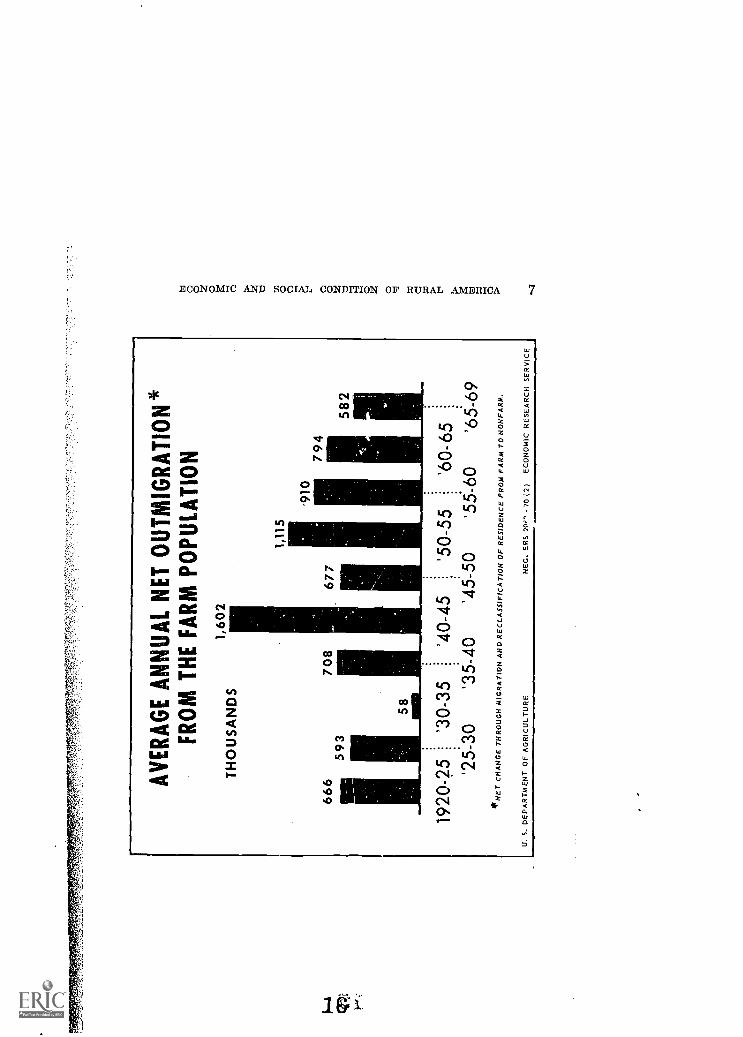
Average Annual Net Outmigratioa From the Farm Population
Although the rate of movement of people away from farms hasremained high, the number of people involved has dwindled as the sizeof the farm population has declined. For example, during World WarII, an average of 1.6 million people left the farm population annually,compared with about 600,000 annually during the period 1965-69. Yet,with many more people living on farms at the time, the outmigrationin 1940-45 amounted to less than 6 percent of the farm populationannually. The much smaller numerical loss in -very recent years hasreflected a loss of more than 6 percent a year.
From the farm point of view, the propensity to migrate has beenas high in recent years as ever. Because fewer people are involved,the impact on nonfarm areas of destination has lessened. And withonly a third as many people on farms now as in the 1930's, the potentialfor further large-scale migration from farms i:3 limited.
AV
ER
AG
E A
NN
UA
L N
ET
OU
TM
IGR
AT
ION
*F
RO
M T
HE
FA
RM
PO
PU
LAT
ION
TH
OU
SA
ND
S
666
708
593
1,60
2
1,11
5
-910
677
794
582
1920
-25
'30-
35'4
0-45
'50-
55'6
0-65
'25-
30'3
5-40
'45-
50'5
5-60
'65-
69*N
ET
CH
AN
GE
TH
RO
UG
H M
IGR
AT
ION
AN
DR
EC
LAS
SIF
ICA
TIO
N O
F R
ES
IDE
NC
E F
RO
M F
AR
M T
O N
ON
FA
RM
.
U. S
. DE
PA
RT
ME
NT
OF
AG
RIC
ULT
UR
EN
EG
. ER
S 2
09, -
.70
(2)
EC
ON
OM
IC R
ES
EA
RC
H S
ER
VIC
E
8 ECONOMIC AND SOCIAL CONDITION OF RURAL AMERICA
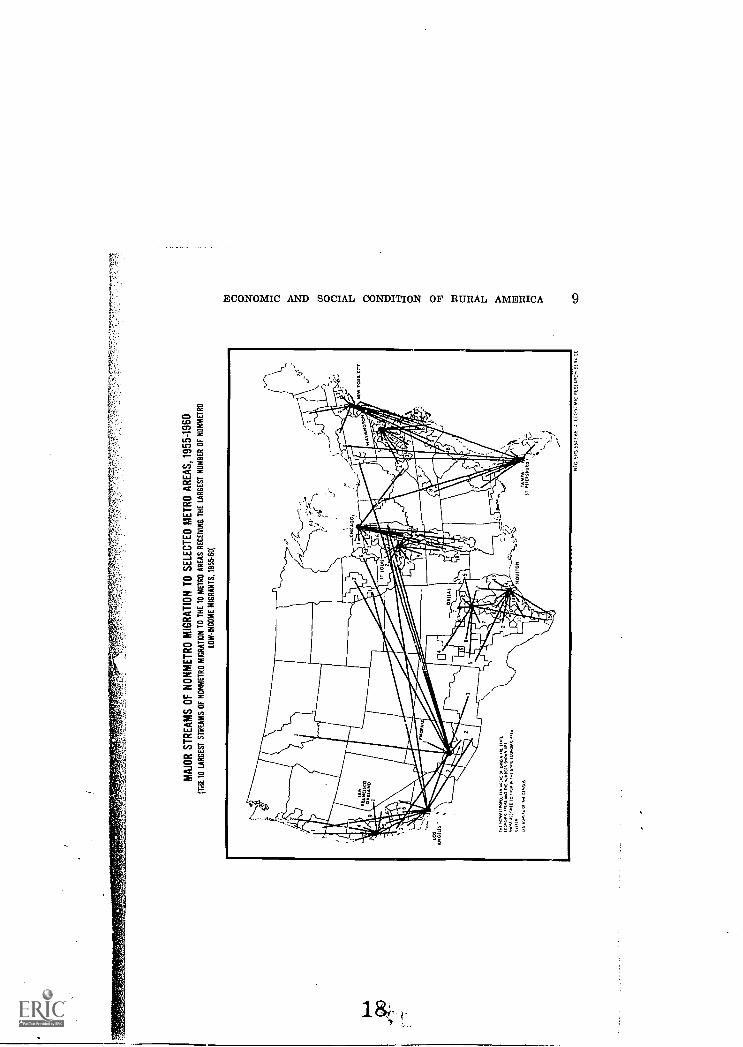
Major Streams of Nonmetro Migration to Selected Metro Areas,1955-60
From 1955 to 1960, the 10 metropolitan areas that ed thelargest number of low-income migrants from nonmetropolitan areaswere Chicago, Dallas, Houston, Los Angeles, New York City, Phoenix,St. Louis, San Francisco-Oakland, Tampa-St. Petersburg, and Wash-ington. The accompanying map illustrates the fact that areas drawtheir migrants from different parts of the country.
Some areas, such as Dallas and Houston, primarily attractedmigrants from within the same State. Cities such as Chicago andNew York drew more heavily from regions other than their own,especially from the Lower South. Areas that attracted many migrantsfor retirement or because of climate, such as Phoenix and Tampa-St.Petersburg, drew people from very long distances.
There is some overlap, among the areas shown, in the sources ofnonmetropolitan migrants. For example, Chicago and St. Louis drewfrom the Mississippi Delta, and New York and Washington attractedpeople from the North Carolina Coastal Plain. But, in general, themap makes clear that conditions impelling migrants out of a particularnonmetropolitan area are much more likely to have an impact oncertain metropolitan areas than on others. Although this map reflectsmigration trends of 1955-60, it is believed that the same generalpattern still prevails.
P;..
MA
JOR
ST
RE
AM
S O
F N
ON
ME
TR
O M
IGR
AT
ION
TO
SE
LEC
TE
D M
ET
RO
AR
EA
S, 1
9554
960
WA
10
LAR
GE
ST
ST
RE
AM
S O
F N
ON
ME
TR
O M
IGR
AT
ION
TO
TH
E 1
0 M
ET
RO
AR
EA
S R
EC
EIV
ING
TH
E L
AR
GE
ST
NU
MB
ER
OF
NO
NM
ET
RO
LOW
-IN
CO
ME
MIG
RA
NT
S, 1
955-
601
55,,E
0 10
Tn.
Tm
t PO
I IC
0,0[
41,
SyS
Or
u` B
UT
u ,
NE
C (
.555
4± E
S.E
SE
AP
SE
,CE
ti cD
10 ECONO",:aC AND SOCIAL CONDITION OF RURAL AMERICA
U.S. Population by Residence, Race, and Migration Status, 1967
According to a study based on the Survey of Economic Opportunity,only one-fifth of the adult urban population, white and Negro, hadcome from rural areas.
Nearly half of the urban Negroes were nonmigrants, another one-third had moved within urban areas, leaving only about one-fifth whohad migrated from rural to urban areas.
About one-fourth (24 percent) of the rural white-population hadcome from urban areas ; in the case of Negroes, the proportion was onlyabout one-tenth (11 percent).
Data in the survey show that 46 percent of all Negro adults of ruralchildhood origin were living in urban places in 1967. The comparablefigure for white was 39 percent. (Not shown on chart.)
In this study, migration refers to moves of at least 50 miles.
19 C

% O
FT
OT
AL&
80 60 40 20
U.S
. PO
PU
LAT
ION
BY
RE
SID
EN
CE
, RA
CE
,A
ND
MIG
RA
TIO
N S
TA
TU
S, 1
967
UR
BA
N P
OP
ULA
TIO
NR
UR
AL
PO
PU
LAT
ION
NO
NM
IGR
AN
TS
46
WH
ITE
NE
GR
O
NO
NM
IGR
AN
TS
47#W
HIT
EN
EG
RO
A P
OP
ULA
TIO
N Id
YE
AR
S O
LD A
ND
OV
ER
BY
I967
RE
SID
EN
CE
AN
D R
ES
IDE
NC
E A
T A
GE
76
OR
EA
RLI
ER
-*
MIG
RA
NT
S A
RE
PE
RS
ON
S W
HO
HA
VE
EV
ER
LIV
ED
MO
RE
TH
AN
50
MIL
ES
FR
OM
TH
EIR
196
7 A
DD
RE
SS
.D
AT
A F
RO
M T
HE
196
7 S
UR
VE
Y O
F E
CO
NO
MIC
OP
PO
RT
UN
ITY
.
U.S
. DE
PA
RT
ME
NT
OF
AG
RIC
ULT
UR
EU
NIV
ER
SIT
Y O
F G
EO
RG
IAN
EG
. ER
S 7
099-
70
(9)
EC
ON
OM
IC R
ES
EA
RC
H S
ER
VIC
E
12 ECONOMIC AND SOCIAL CONDITION OF RURAL AMERICA
Population Mobility Rates(1947-48 to 1967-68)
The rate at which A 7.,0, loans movewhether from one residence toanother, one county to another, or one State to anotherhas been oneof the most stable social processes in recent American history.
Each year since 1947, tLbout 19 to 21 percent of the people havechanged their house, apartment, or other place of residence. Duringthese years, the level of the economy and the housing supply havevaried, the marriage rate has fluctuated, periods of peace and war havealternated, sharp changes in agriculture have come and gone, and thepattern of racial integration and laws of equal access to housing havechanged. But the overall frequency of movement has scarcely varied.
The proportion of people moving from one county to another hasranged between 6 and 8 percent a year. Of this group, somewhat morethan half move far enough to cross a State boundary.
A high rate of mobility from one residence to another is a character-istic feature of our society, and, indeed, of all open societies. It is notthe overall level of movement and migration that has crer"-,ed the prob-lems popularly associated with migration in recent years, but ratherthe circumstances and directions of the particular moves and the peo-ple who have made them.

PE
RC
E
20 15 10 5 019
47-4
8
PO
PU
LAT
ION
MO
BIL
ITY
RA
TE
SJT
*
(incl
udin
gT
otal
mov
ers
mig
rant
s)
Inte
rcou
nty
mig
rant
s
..0
......
......
......
.....
. ,,,,,,,
,,,,,,
,,,0
,,,,,,
,,,,,,
v
1 Inte
rsta
tem
igra
nts
1952
-53
1957
-58
1962
-63
1967
-68
*PE
RC
EN
T O
F P
OP
ULA
TIO
N O
NE
YE
AR
OLD
AN
D O
VE
R W
HO
EIT
HE
R M
OV
ED
OR
MIG
RA
TE
D.
U.S
.DE
PA
RT
ME
NT
OF
AG
RIC
ULT
UR
EN
EG
. ER
S 7
082-
69 (
10)
EC
ON
OM
IC R
ES
EA
RC
H S
ER
VIC
EC
AD

14 ECONOMIC AND SOCIAL CONDITION OF RURAL AMERICA
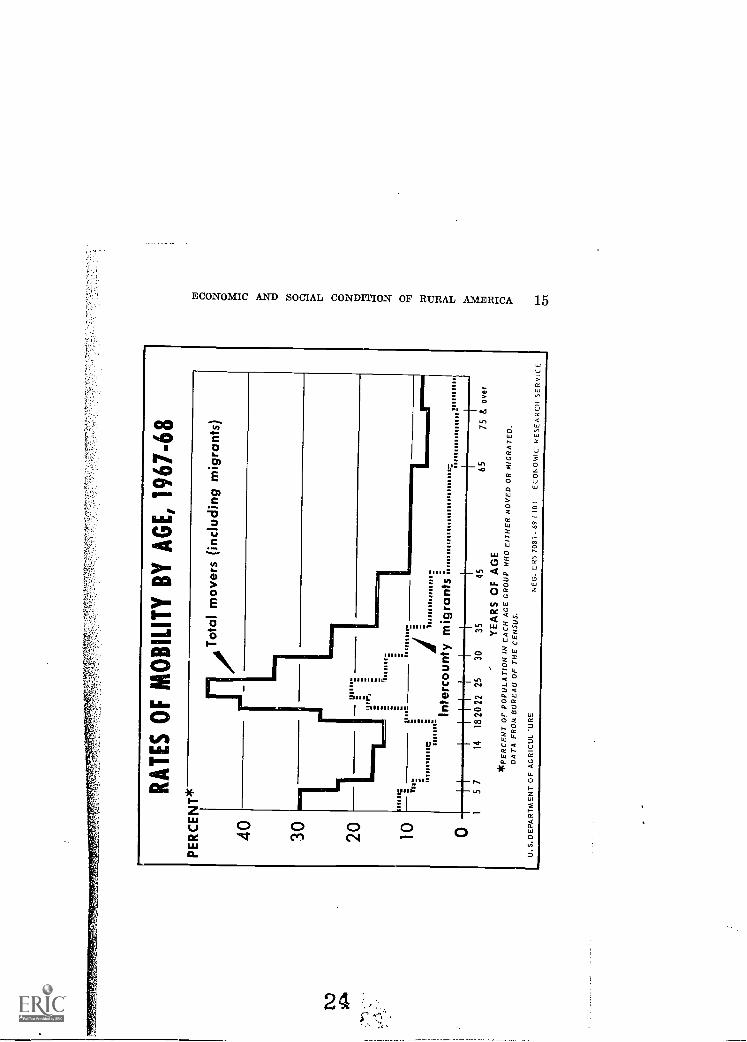
Rates of Mobility by Age, 1967-68
No personal, social, or economic characteristic is so highly correlatedwith movement and migration as is age of the individual.
Whereas about 19 to 21 percent of all people move each year, at 22to 24 years of agewhen people are leaving college, getting married,having their first children, or starting career jobsthe rate reachesabout 47 percent a year. It is also over 40 percent for young adults20 to 21 years old. After the middle twenties, the frequency of move-ment diminishes with age until age 65 and over, when only 7 to 9percent of the people move annually.
The same age pattern applies to intercounty migrants, whose movestypically take them to a different community, or in many cases, adifferent State. At the peak age of migration, 22 to 24 years, a fifthof the population migrates annually. By middle age, the rate declinesto just 3 percent.
The movements of children generally correspond to the stage in thelife cycle of their parents. Very young children are frequent movers,but teenagers still of school age are only half as likely as preschoolchildren to move.
23
RA
TE
S O
F M
OB
ILIT
Y B
YA
GE
, 196
7-68
PE
RC
EN
T*
40 30 20 10
Tot
al m
over
s (in
clud
ing
mig
rant
s)
Lm
1111
111
liar,
Inte
rcou
nty
mig
rant
s'tf
-1IiI
I-t
I5
714
18 2
0 22
25
3035
4565
75 8
ove
rY
EA
RS
OF
AG
E*P
ER
CE
NT
OF
PO
PU
LAT
ION
IN E
AC
H A
GE
GR
OU
PW
HO
EIT
HE
R M
OV
ED
OR
MIG
RA
TE
D.
DA
TA
FR
OM
BU
RE
AU
OF
TH
E C
EN
SU
S.
U. S
.DE
PA
RT
M E
NT
OF
AG
RIC
UL
UR
EN
EG
. E R
S 7
081-
69 1
101
EC
ON
OM
IC R
ES
EA
RC
H S
ER
VIC
E
16 ECONOMIC AND SOCIAL CONDITION OF RURAL AMERICA
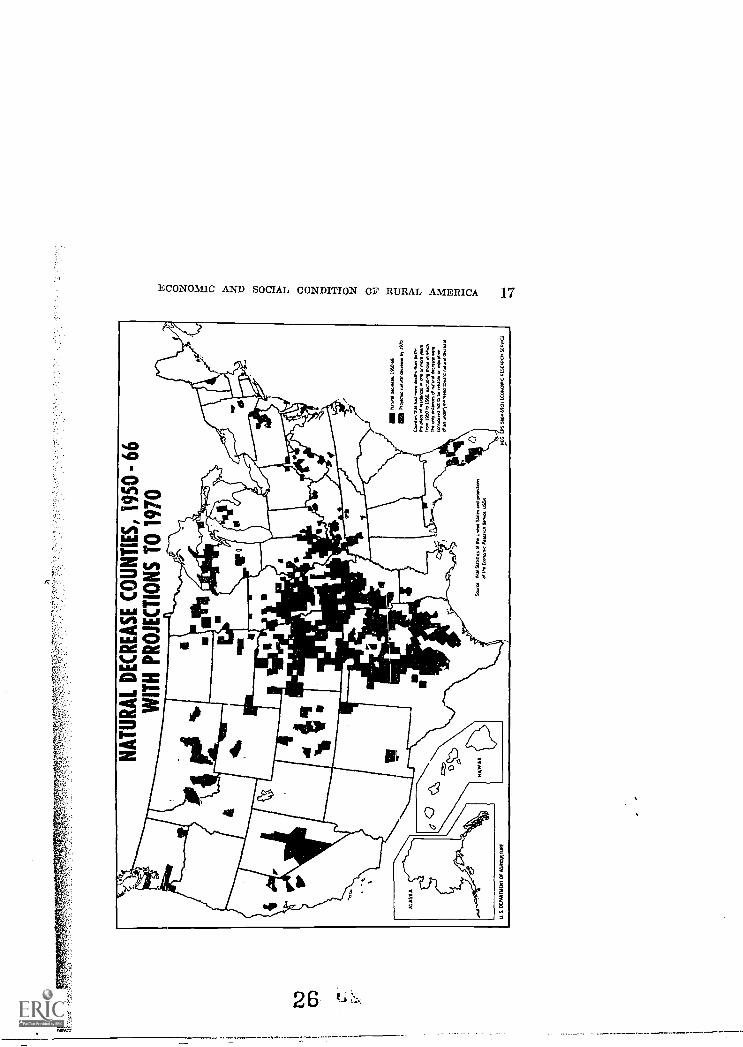
Natural Decrease Counties, 1950-66, With Projections to 1970
A natural decrease in population, when more deaths than birthsoccur, has been rare in America. In 1967, however, there were moredeaths than births in about 345 -xmnties. In 1960, there were only 38such counties, and in 1950, just two.
In most cases, this unusual condition has been caused by prolongedand heavy outmigration of young adults from agricultural or miningcounties. The remaining young families of childbearing age produceda normal number of children per family, but they have been too fewto offset deaths occurring among the much larger older population.In a minority of areas, the excess of deaths has been due solely tothe existence of retirement communities, such as in Florida.
Most counties now experiencing a natural decrease in population,because of the severity of past outmigration, are in the center of thecountry. In sizable contiguous groups of counties in Missouri, Kansas,Nebraska, Texas, and Illinois, there have been fewer births thandeaths.
It is expected that 1970 data will show that more than 500 countieshave had a natural decrease in population. This is more a startlingsymbol of distortion of the normal age composition than it is a problemin itself. But it usually reflects conditions in which great difficultyis being experienced in obtaining new sources of employment or inretaining the present population level.
25
NA
TU
RA
L D
EC
RE
AS
E C
OU
NT
IES
, 195
0-
66W
ITH
PR
OJE
CT
ION
S T
O 1
970
1111
1 SU
MS
sear
. 195
066
1111
111
.C.1
nat
IO5
alte
bl. h
191
5
0....
n r.
no
mer
e 00
11,,
0.1
PR.
07 6
.... M
14..1
0, 0
.. m
ot M
IIo
n, 1
950
tO 1
966
.0..e
Mae
...e
aM
. ofu
ncs
nolv
e L
ecfo
s w
oe..t
o be
fed
. cr
...le
an ~
tr..
ff. f
oft
. nal
uffi
Ow
es,.
Sevr
esV
aal S
tom
a N
V U
m. S
UM
mf
pcM
Cttn
sof
O. t
rofx
rt. R
ms.
Sen
a. 0
502
UPA
RT
ISIX
f O
f A
CO
VU
LIU
RE
6t6G
CR
S U
M 6
901
(00M
105,
0 8(
5049
00 5
0 00
(0
18 ECONOMIC AND SOCIAL CONDITION OF RURAL AMERICA
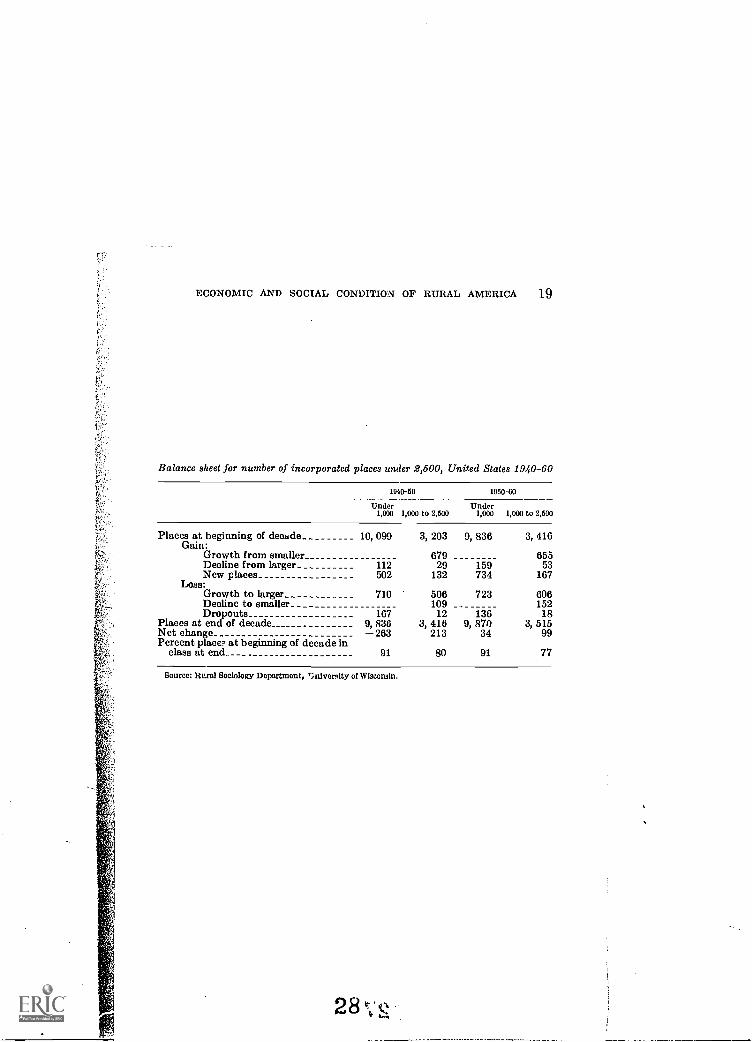
Small Towns StudiedPreliminary evidence in a study of incorporated places under
2,500 population in the United States for the two decades, 1940-60,indicates that towns in this size class have shown considerable sta-bility. Some 80 to 90 percent of them were in the same size group atthe end of each decade as at the beginning. Where shifts occurred insize category, they were generally to a larger town size.
Factors which appear to be operating in the shift of small tolarger size of towns are initial size and location relative to a largercenter. While many small towns have died or become disincorporated,those of larger size in the beginning of the decade (1,000 to 2,500) andthose near a larger center have grown. Some have become commutertowns, some provide specialized shopping, and many are retirementcommunities, as indicated by the disproportionate share of olderresidents.
As 1970 census data become available on incorporated places under2,500 population, they will be added to the ongoing analysis of smalltowns. It is expected that preliminary findings will be available in thefall of 1971.
2 7.1':
ECONOMIC AND SOCIAL CONDITION OF RURAL AMERICA 19
Balance sheet for number of incorporated places under 2,500, United States 1940-60
1940-50 1950-60
Under1,000 1,000 to 2,500
Under1,000 1,000 to 2,500
Places at beginning of decadeGain:
Growth from smallerDecline from largerNew places
Loss:Growth to largerDecline to smallerDropouts
Places at end of decadeNet changePercent place:, at beginning of decade in
class at end..
10, 099
112502
710
1679, 836263
91
3,
3,
203
67929
132
506109
12416213
80
9,
9,
836
159734
723
136870
34
91
3,
3,
416
65553
167
606152
18515
99
77
Source: Rural Sociology Department, T:niversity of Wisconsin.
2 8
20 ECONOMIC AND SOCIAL CONDITION OF RURAL AMERICA
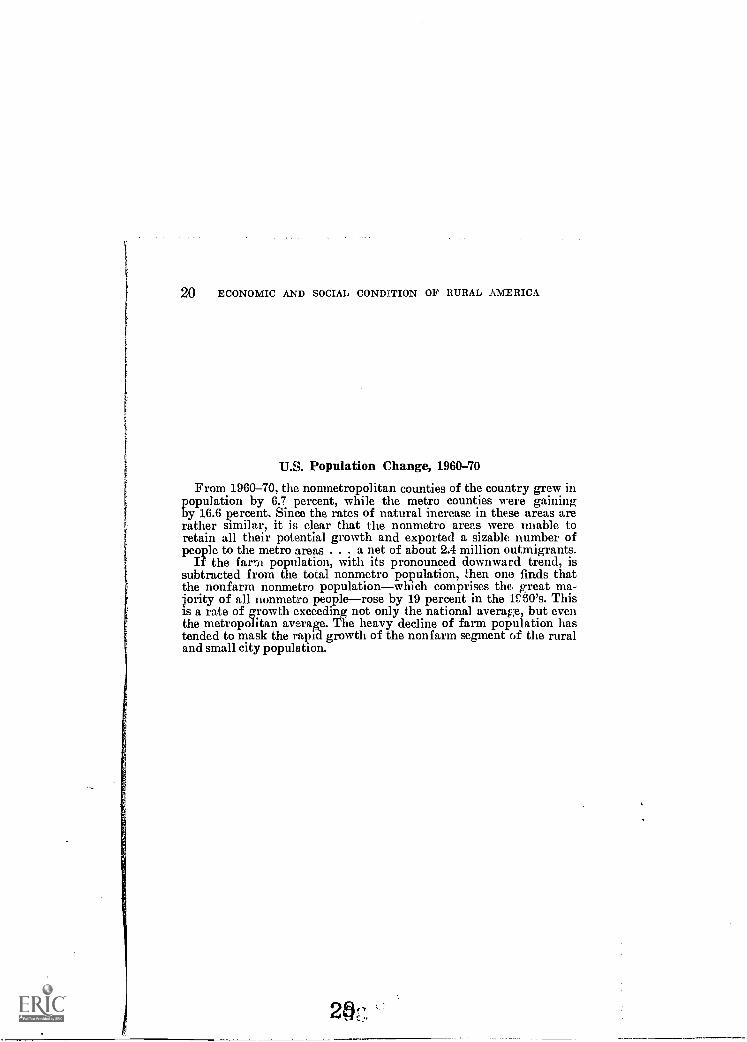
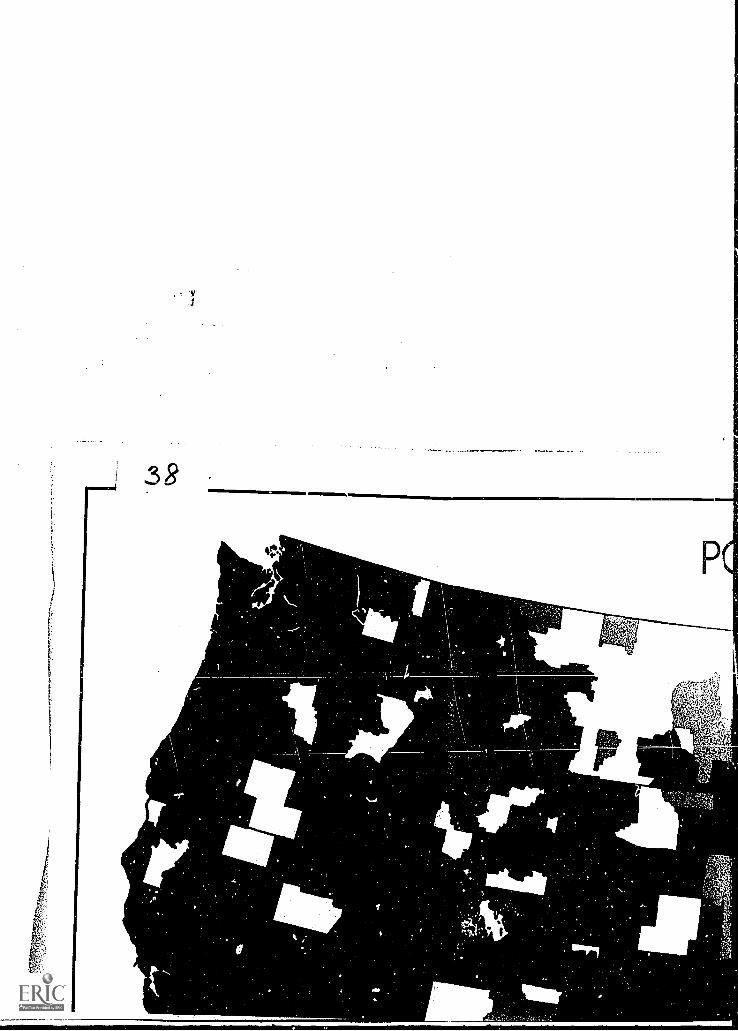
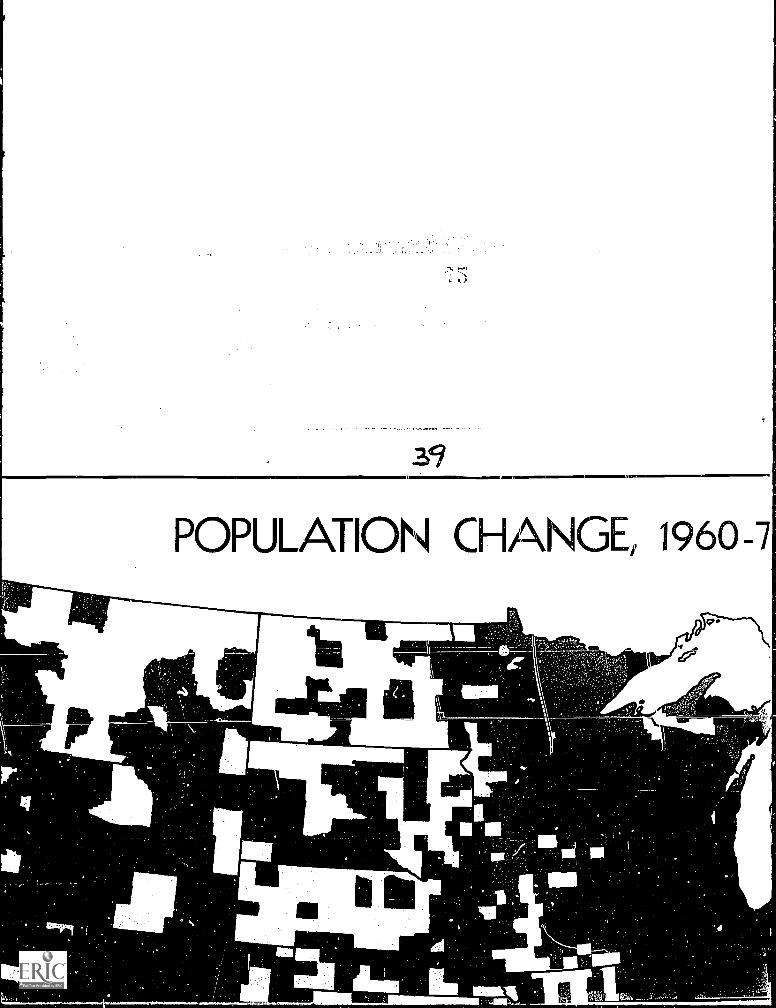
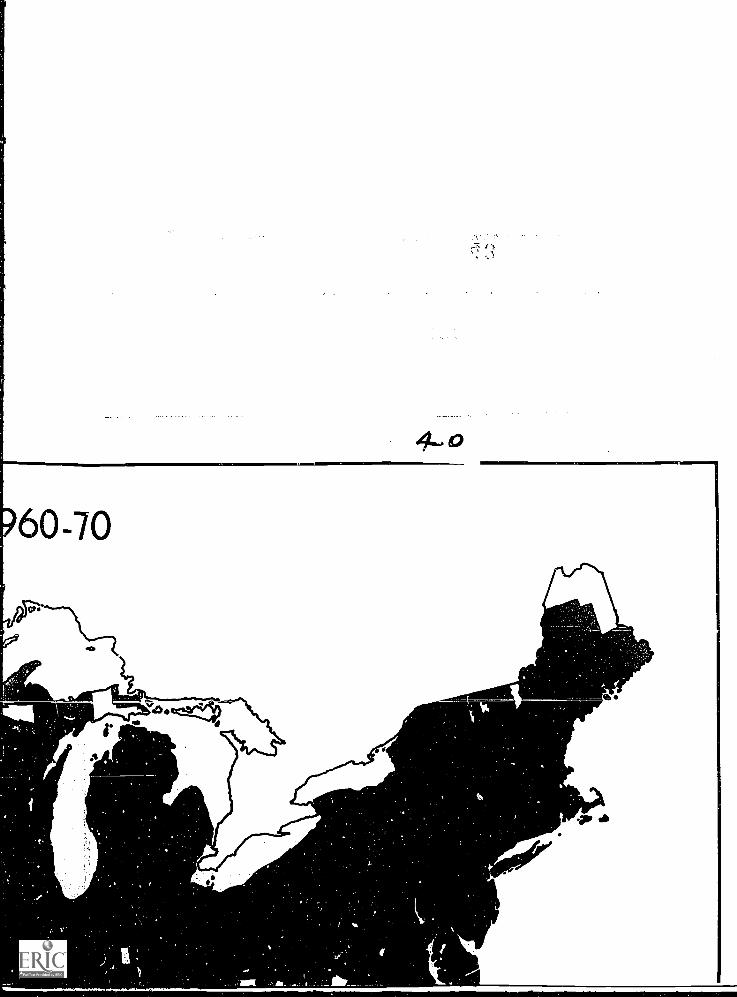
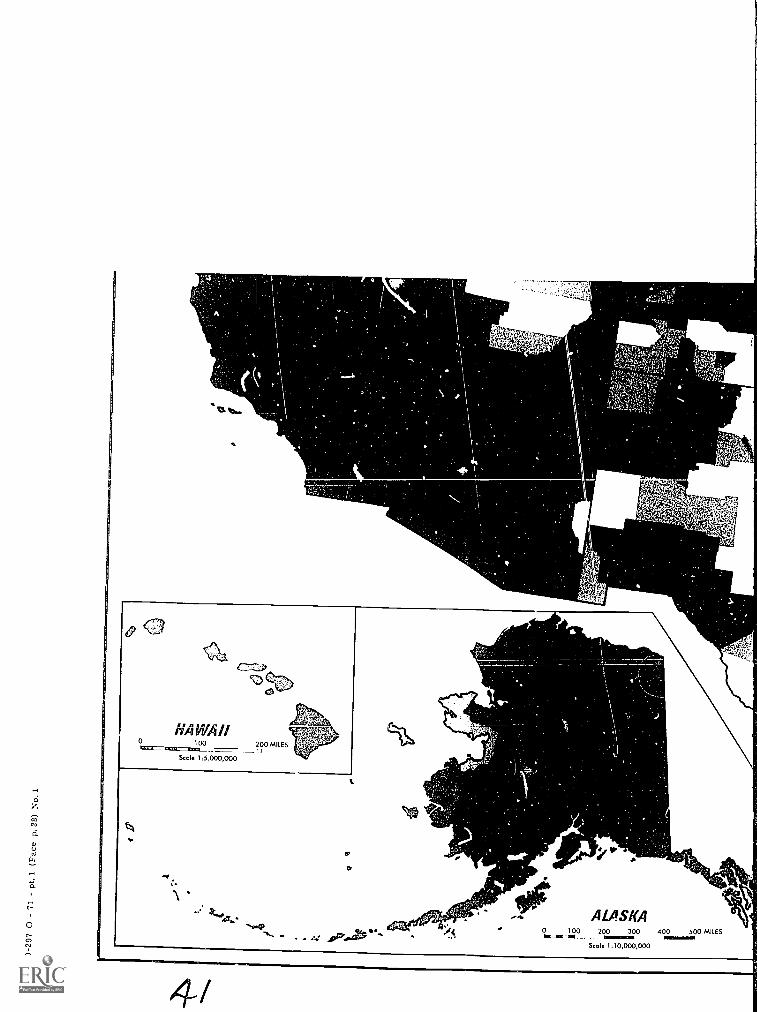
U.S. Population Change, 1960-70
From 1960-70, the nonmetropolitan counties of the country grew inpopulation by 6.7 percent, while the metro counties were gainingby 16.6 percent. Since the rates of natural increase in these areas arerather similar, it is clear that the nonmetro areas were unable toretain all their potential growth and exported a sizable number ofpeople to the metro areas . . . a net of about 2.4 million outmigrants.
If the farm population, with its pronounced downward trend, issubtracted from the total nonmetro population, then one finds thatthe nonfarm nonmetro populationwhich comprises the great ma-jority of all nonmetro peoplerose by 19 percent in the 1E60's. Thisis a rate of growth exceeding not only the national average, but eventhe metropolitan average. The heavy decline of farm population hastended to mask the rapid growth of the nonfarm segment of the ruraland small city population.
PO
PU
LAT
ION
CH
AN
GE
, 196
0-70
20U
S. T
OT
AL
TO
TA
L M
ET
RO
NO
NM
ET
RO
NO
NF
AR
M19
.3
SO
UR
CE
BU
RE
AU
OF
TH
E C
EN
SU
SP
repr
ed I
h E
co,:a
nc fl
eset
rch
Sea
nce.
US
DA

22 ECONOMIC AND SOCIAL CONDITION OF RURAL AMERICA
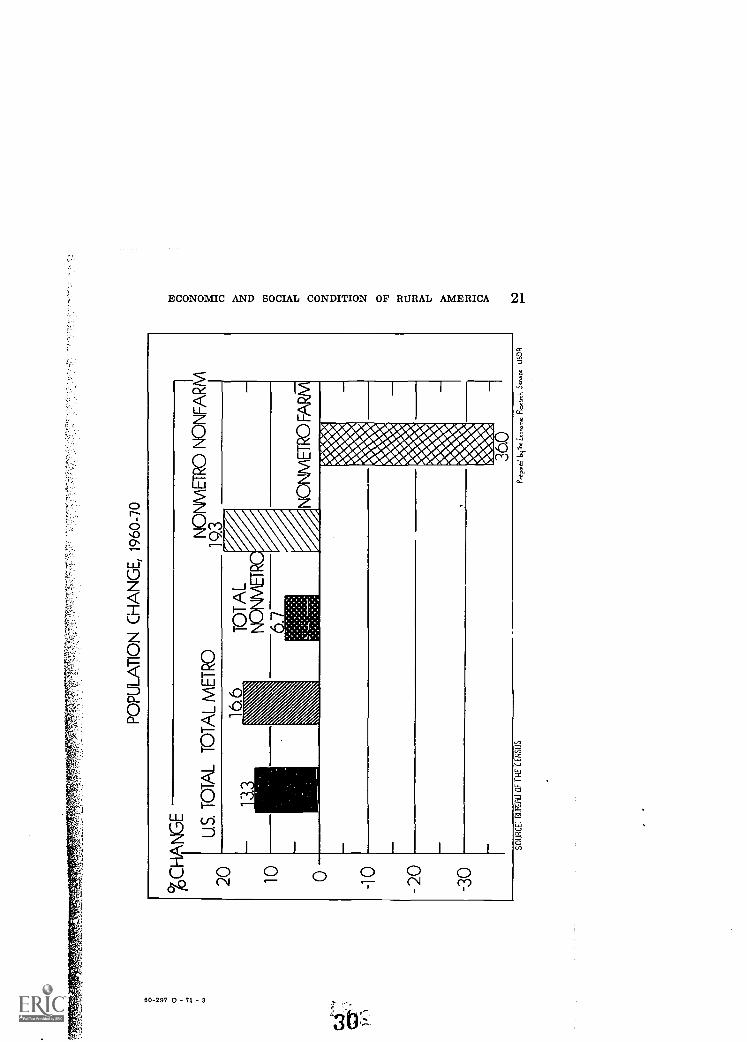
RapidlyGrowing Places in Nonmetropolitan America
In the 1960's, about 200 nonmetro towns of 10,000 to 50,000 popu-lation grew by 15 polTent or more;, that is, at a rate clearly abovethe national average of 13 percent, thus implying net immigration.About half of these places are located in the South. Two featuresthat characteri-e many of them are the presence of a State collegeor university and their location on an interstate highway.
31
LOC
AT
ION
OF
NO
NM
ET
RO
TO
WN
S O
F 1
0,00
0-50
,000
PE
OP
LE T
HA
T H
AD
15
PE
RC
EN
TM
OR
E P
OP
ULA
TIO
N G
RO
WT
H F
RO
M 1
960-
70

24 ECONOMIC AND SOCIAL CONDITION OF RURAL AMERICA
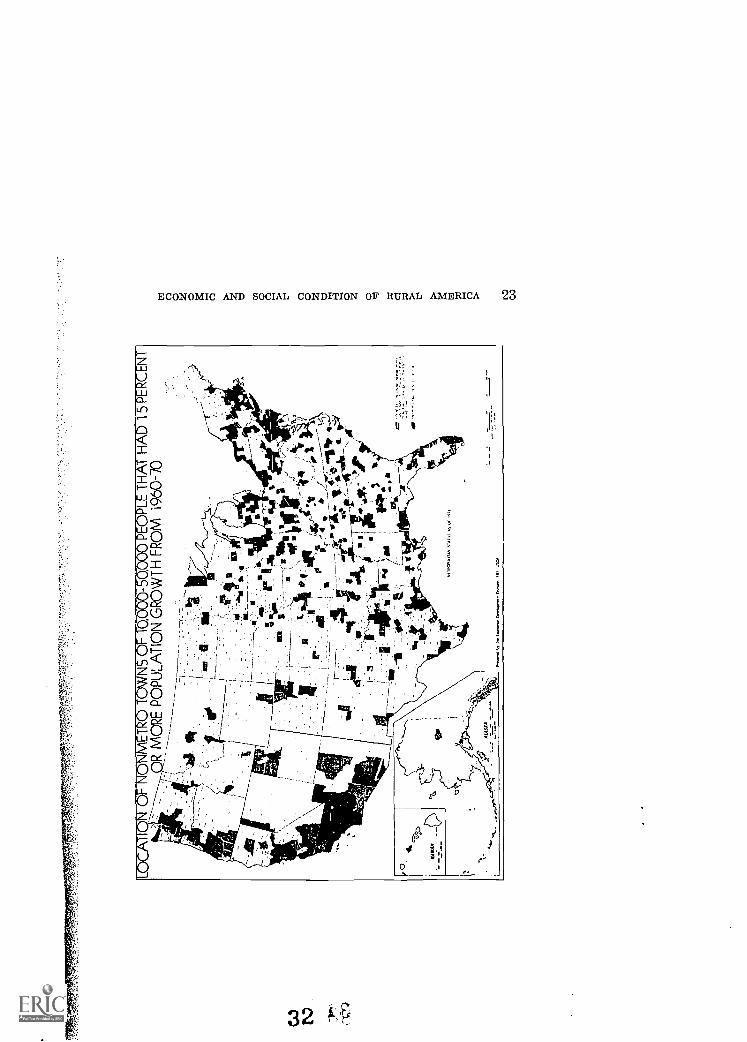
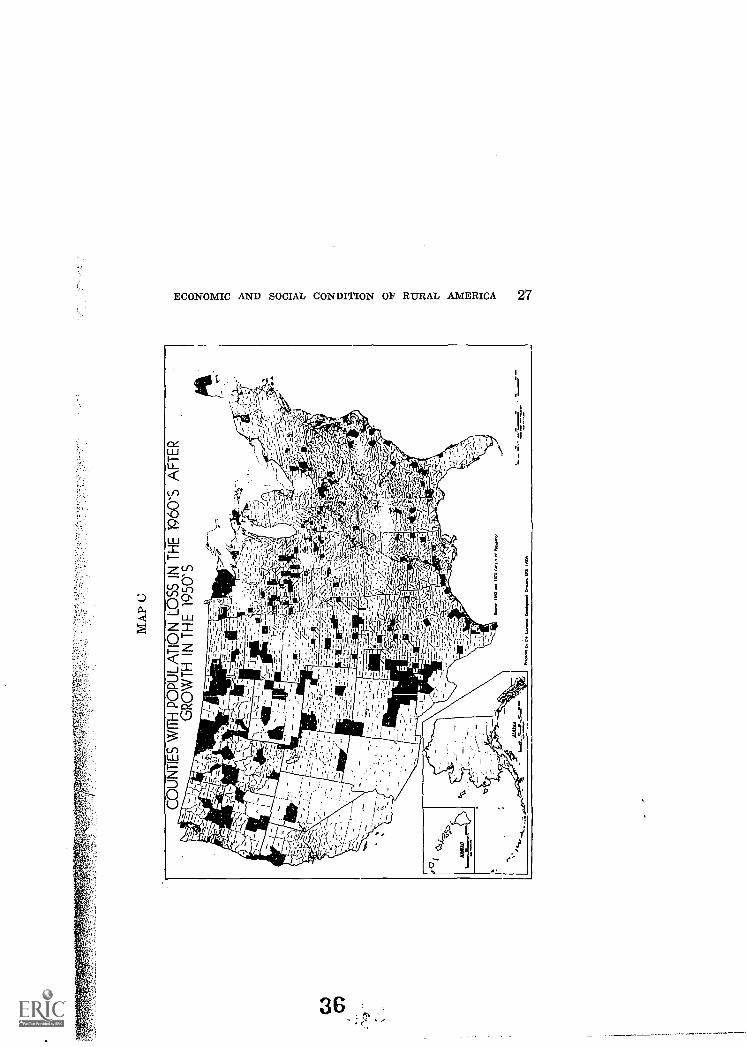
Trends in Population RetentionDuring the 1960's, sonic counties showed: (1) decidedly improved
population retention; (2) a deterioration in their ability to holdpeople; and (3) a continuation of their 1, .vious growth patterns.
The counties lightly shaded on map A, are those which had inade-quate population retention ability in the 1950's but ii .proved ability inthe 1960's. In nearly 500 of these counties (shown separately on mapB), the extent of the 1960-70 population growth was dramatic enoughto cause a shift from population loss to gain. This occurred mostly inthe upland parts of the South. In particular, there has been a remark-able recovery in a large area of northern and western Arkansas andeastern Oklahoma, where outmigration was ver:T severe in the preced-ing 20 years. The lower Tennessee Valley was another area of previ-ously unimpressive socioeconomic status that, moved to a position ofpopulation growth in the 1960's.
The darkly shaded counties on Map A, are those of inadequate anddeclining population retention ability. Almost 300 of these counties(shown separately on map C) lost population in the 1960's after havinggained in the 1950's. There were seven contiguous States, stretchingfrom Idaho through the Northern Plains to Minnesota and Iowa, inwhich a majority of all counties had net outmigration or decline anda deteriorating ability to retain population.
3

MA
P A
TR
EN
D O
F P
OP
ULA
TIO
N R
ET
EN
TIO
N,1
960-
70 V
S.1
950-
60 A
26 ECONOMIC AND SOCIAL CONDITION OF RURAL AMERICA
ala
ECONOMIC AND SOCIAL CONDITION OF RURAL AMERICA 27
36

28 ECONOMIC AND SOCIAL CONDITION OF RURAL AMERICA
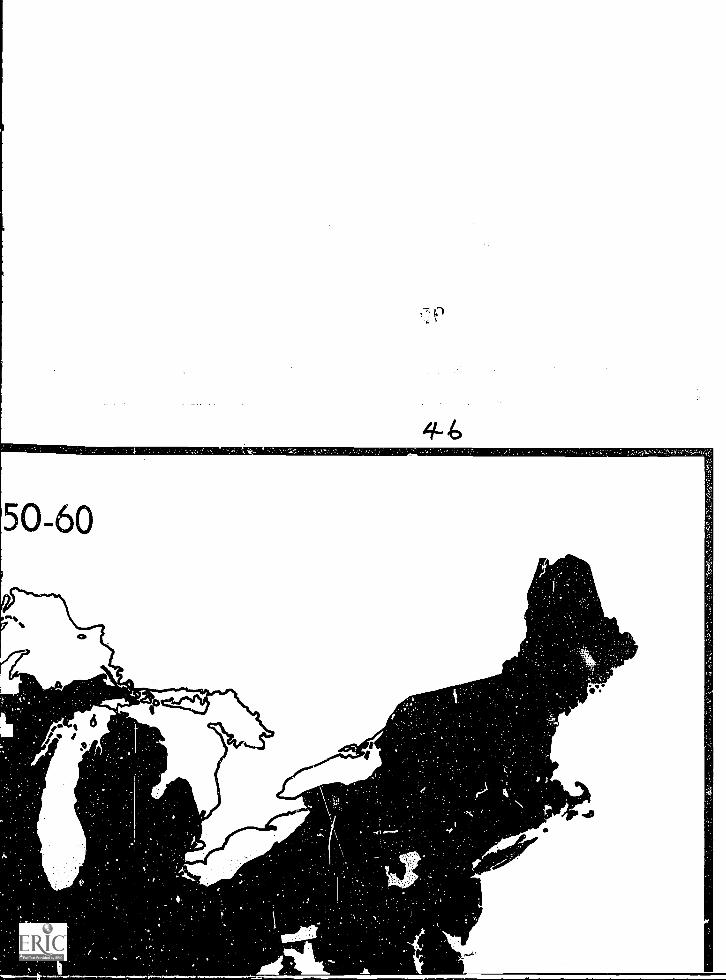
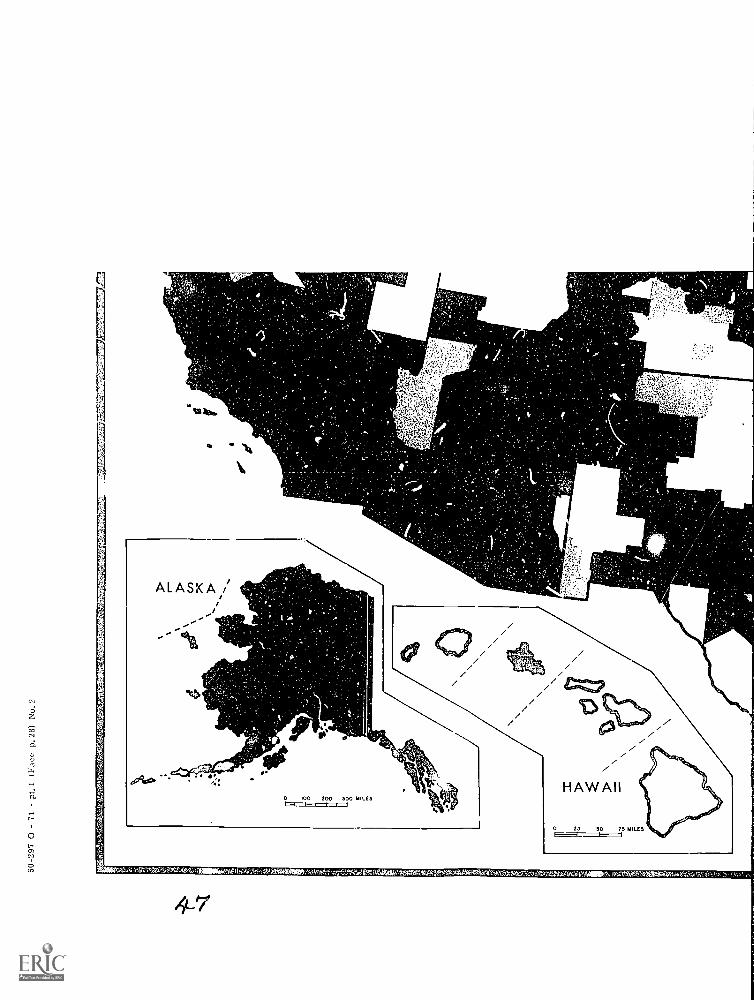
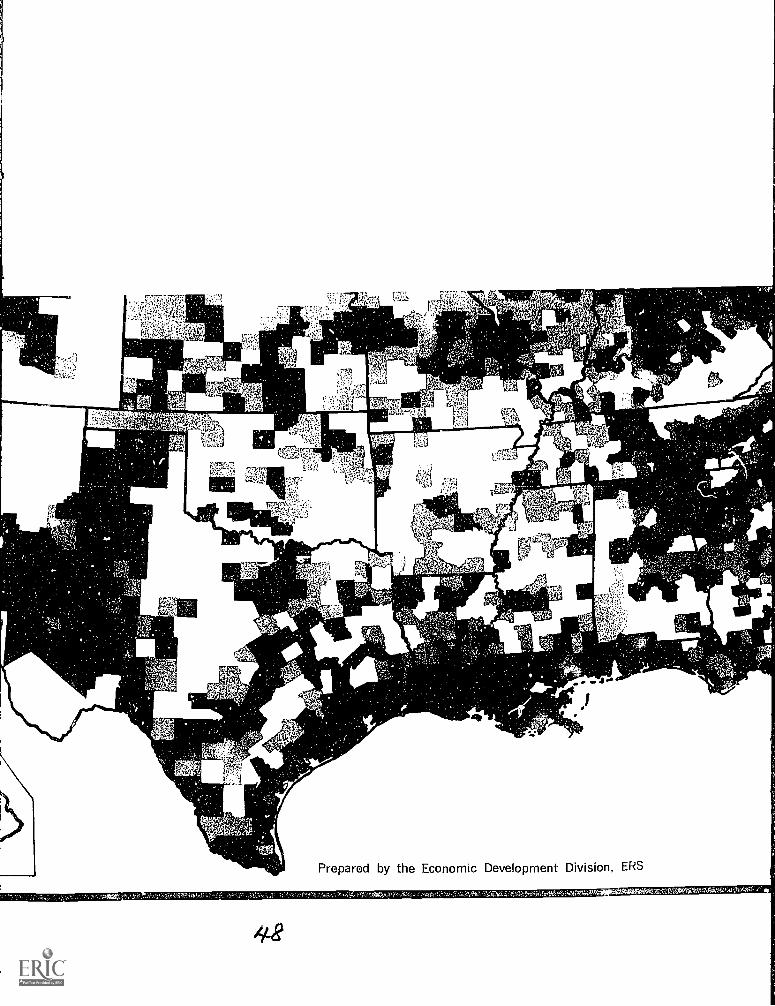
The Distribution of Population Trends During the 1960's and1950's
About 1,350 counties had such heavy outmigration during the 1960'sthat they declined in population. However, this is an improvementover the 1950's when 1,500 counties decreased. For both periods, thelosing counties were overwhelmingly rural in character. The decliningcounties are heavily concentrated in the Great Plains and Corn Belt,the heart of Appalachia, and sections of the Southern Coastal Plains.The great majority of rural counties in the Northeast, and East North-Central States and the Far West, gained in both the 1950's and 1960's.
37r
1111111F
'.
POPULATION CHANGE, 1960-7
GP*
O
;tif .1.41T/ir
HAWAII100
Scale 1 5,000,000
200 MILE5
t
N
Alltmiack.
kr
ALASKA100 200 300 400 500 MILE5
onsass.s.Scale 1:10,000,000

IL,
4
..=1111
%.,1A"*.
5KA300 400 500 MILES
low risonsai000,000
P."
Prepared by the Economic Development Division, ERS
. ,)
42

)
INCREASE OF 10% OR MORE
INCREASE OF LESS THAN 10%
DECREASE OF LESS THAN 10%
C2 DECREASE OF 10% OR MORE
Based on Returns of the 1970 Census
0 I00 200 300 400 500 MILES
ALBERS EQUAL AREA PROJECTIONScale 1:5,000,000
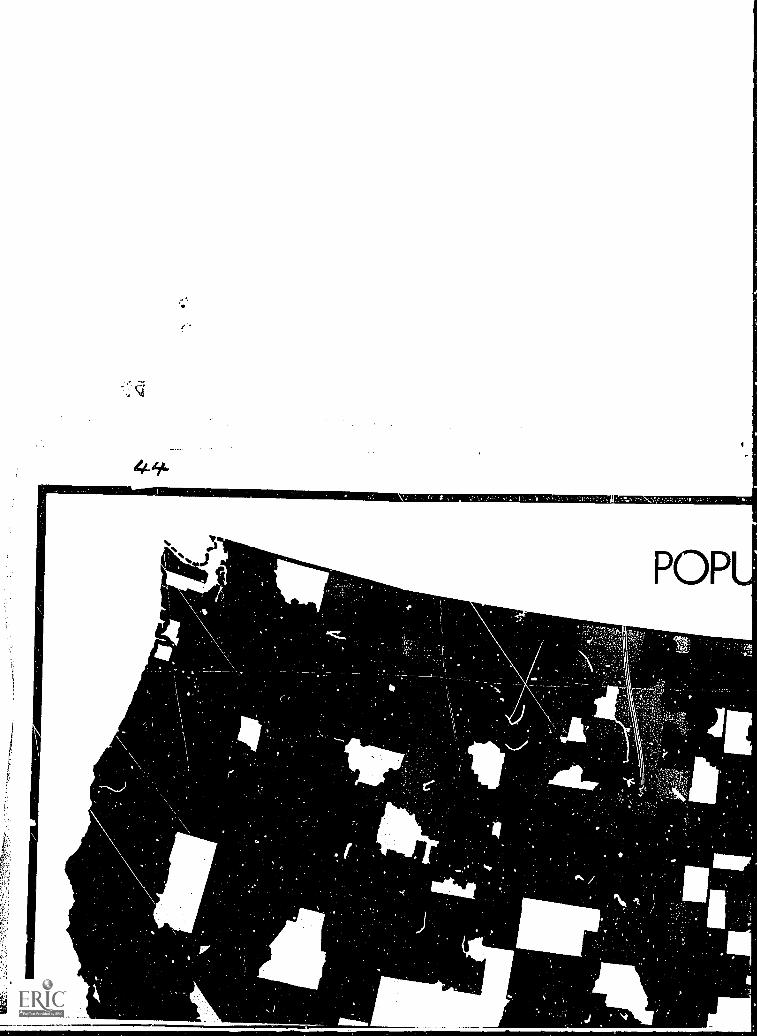
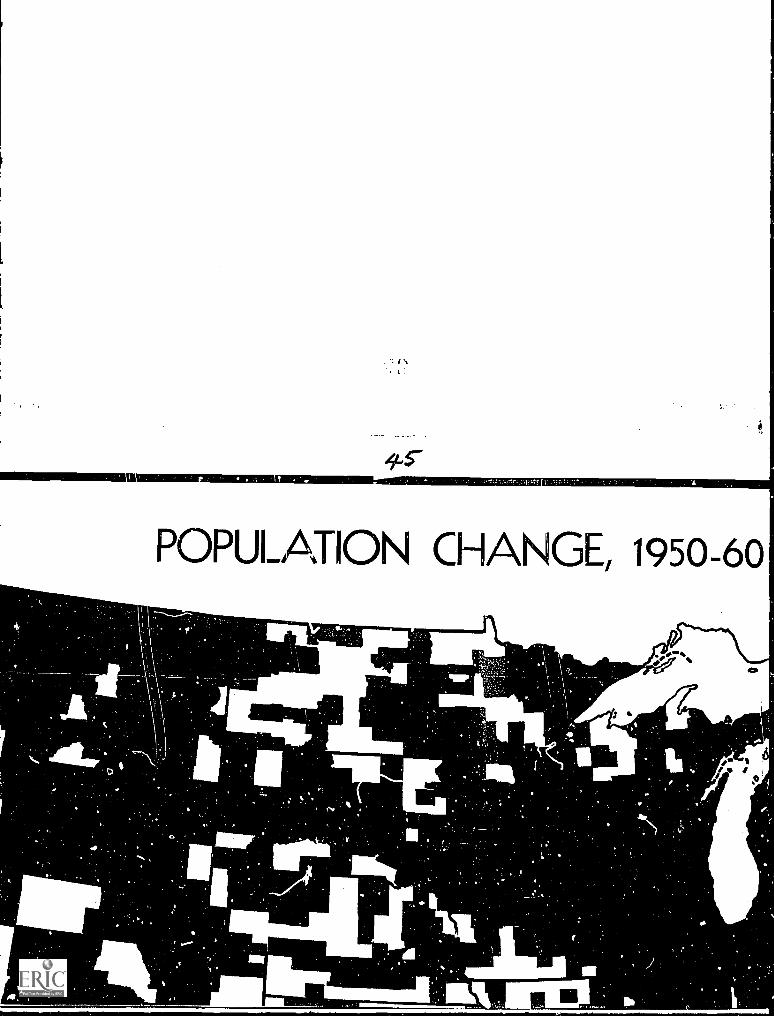
POPULATION CHANGE, 1950-60
_4111115
E
II 61' /:4
lialrstr-s .!
r f
:OW cro.,:,VrtgittiANDI, \t.44.0iiitflgAWAYI, li!,,Atkult&S.'ZiaiWy.nc.-Ageka.04-.10,-,varmawarrr,frztp042.44132Fgc,kurr,,:,,,,,
1=44.*
1..,1,0
Prepared by the Economic Development Division, ERS
11041.rePorisl;TOWSVINZAVAv:,4PAM
xte

1
ni Division, ERS
11
-
Ns.
INCREASE OF 10% OR MORE
INCREASE OF LESS THAN 10%
= DECREASE OF LESS THAN 10%
DECREASE OF 10% OR MORE
SCALE 1: 7,500,000APPROXIMATELY In MILES TO 1 INCH
so 0 50 100 150 200 250 300 MILES=KO
ECONOMIC AND SOCIAL CONDITION OF RURAL AMERICA 29
II. INCOME AND EMPLOYMENT
Along with increased urbanization of the population, there is acontinuing rural-urban disparity in income and economic activity.Although per capita income in nonmetropolitan areas has been risingat a faster rate than in metro areas for the past 40 years, the percentagegain has not been fast enough to narrow the gap between metro andnonmetro incomes. In fact, the dollar gap has widened over the years.Nonmetro personal income, which increased at an average rate of 7.4percent per year, compared with 5.9 percent metro, would have had togrow at the rate of 8.5 percent per year for this 40-year period to haveclosed the gap.
Improvement in personal income varied among the regions of theUnited States. The most striking percentage advance was in the South-east where the level of per capita income was lowest. The Southeasthad the top income growth rate in the country in the 1959-68 period.greatly stimulated by increased employment in manufacturing and ingovernmentFederal, State, and local.
The greatest acceleration in the growth rate of nonmetro income,however, was in the Plains, rising from a rate of change of 2.9 in the1950's to 6.2 in the 1960's. Recovery in farm income from the low levelof 1959 and large gains in manufacturing earnings, accounted for theaccelerated rate of the 1960's in non-SMSA's in this region. In theSouthwest, Rocky Mountain, and Far West regions, nonmetro incomegrowth continued to lag while in the other regions, the metro-non-metro growth rates continued to show almost no differential during1959-68.
In spite of improvement in nonmetro income in the 1960's thegenerally lower level of income in nonmetro than metro areas has pro-duced a disproportionate extent of poverty among families outsidemetro areas. In a national farm-nonfarm comparison, the percentageof farm families below the poverty level has remained consistentlymuch higher than among nonfarm families. Similarly, the percentagein poverty outside metro areas continues higher than the percentagewithin.
To understand the relative income disadvantage in nonmetro areas,it is useful to consider the sources of that income. Agriculture repre-sents a substantial component of nonmetro personal income, about10 percent in 1959, only half as important a source of income as in1950. However, manufacturing was the most significant industrialsource of income in both metro and nonmetro rt7 as in the 1960's.
Although nonmetropolitan counties had a smaller share of L.S.employment in each of seven industries in 1970 than in 1960, the gainsmade in three Industries which obtained a larger share of U.S. em-ployment revetaed a significant nonmetro competitive performance.The most important industry boosting nonmetro employment wasmanufacturing, which grew much faster in the Nation as a.whole,and more than twice as fast as in metro areas. Contributing to thisgrowth were: a blue-collar labor force, lower land values, and specialtax incentives offered by small communities.
50
30 ECONOMIC AND SOCIAL CONDITION OF RURAL AMERICA
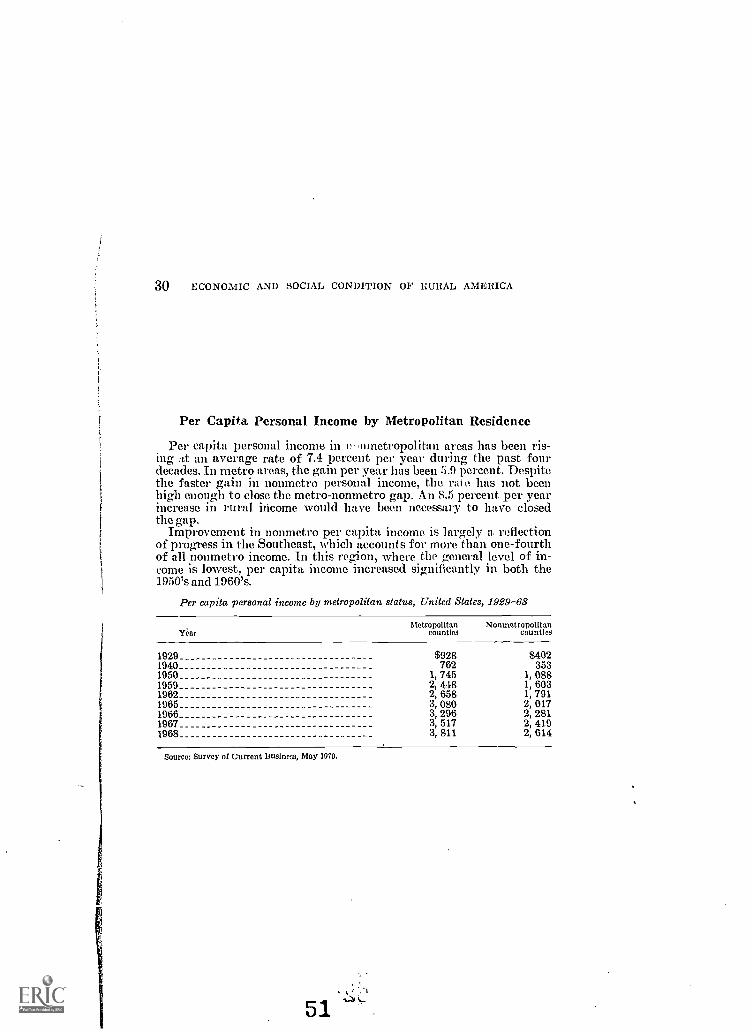
Per Capita Personal Income by Metropolitan Residence
Per capita personal income in u,nmetropolitan areas has been ris-ing an average rate of 7.4 percent per year during the past fourdecades. In metro areas, the gain per year has been 5.9 percent. Despitethe faster gain in nonmetro personal income, the rai e has not beenhigh enough to close the metro-nonmetro gap. .An 8.5 percent per yearincrease in rural income would have been necessary to have closedthe gap.
Improvement in nonmetro per capita income is largely a reflectionof progress in the Southeast, which accounts for more than one-fourthof all nonmetro income. In this region, where the general level of in-come is lowest, per capita income increased significantly in both the1950's and 1960's.
Per capita personal income by metropolitan status, United States, 1929-68
YearMetropolitan Nonmetropolitan
counties counties
1929 $928 $4021940 762 3531950 1, 745 1, 0881959 2, 418 1, 6031962 2, 658 1, 7911965 3, 080 2, 0171966 3, 296 2, 2811967 3, 517 2, 4191968 3, 811 2, 614
Source: Survey of Current Business, May 1070.
51

Uni
ted
Sta
tes
$ T
HO
US
.
4
1
PE
RC
AP
ITA
PE
RS
ON
AL
INC
OM
E
BY
ME
TR
OP
OLI
TA
NR
ES
IDE
NC
E
01
l
1929
1940
DA
.1,1
FR
OM
SU
RV
EY
OF
CU
RR
EN
TB
US
INE
SS
U.S
. OE
PA
RT
ME
NT
OF
AG
RIC
ULT
UR
E
1950
1960
IslE
ti E
NS
112
1471
13i
Cov
1970
GJ

32 ECONOMIC AND SOCIAL CONDITION Or RURAL AMERICA
Average Annual Rates of Change in Personal Income, Metro-Nonmetro, by Regions, 1950-59 and 1959-68
It will be seen in the accompanying table that the rates of changein personal income varied among the regions of the country in rehtion to the national average and in metro-nonmetro comparisons.
It might also be pointed out that the direct effect of the decline infarm income in the earlier period on metro-nonmetro earnings can beseen by comparing total earnings and nonfarm earnings in the twotypes of areas. In the 1950-59 r3riod, the percentage change in totalearnings in metro areas was percent and in nonmetro areas, 49percent. Nonfarm earnings, on the other hand were 78 percent changein metro areas and 71 percent in nonmetro areas.

ECONOMIC AND SOCIAL CONDITION OF RURAL AMERICA 33
Average annual rates of change in personal income, metropolitan-nonmetropolitan,by regions, 190-59 and 1969-68
1060-59 1059-68
Region MetropolitanNonmetro-
politan MetropolitanNonmetro-
politan
United States 6. 5 -. 8 6. 7 6. 6New England 5. 6 5. 6 6. 5 6. 5Mideast 5. 6 5. 3 6. 2 6. 4CI-eat Lakes 5. 9 5. 0 6. 3 6. 5Plains 6. 3 2. 9 6. 3 6. 2Southeast 7. 5 5. 0 7. 6 7. 6Southwest 7.4 4. 9 7. 6 5. 6Rocky Mountain 8. 0 4. 3 6. 8 4. 8Far West 8. 3 5. 0 7. 3 5. 9
(Compou"c1 annual growth rates from initial to terminal year).Source: Data from Survey of Current Business, May 1970.
States included in Office of Business Economics' regions
New England.-Maine, New Hampshire, Vermont, Massachusetts RhodeIsland, and Connecticut.
Mideast.-New York, New Jersey, Pennsylvania, Delaware, Maryland, andDistrict of Columbia.
Great Lakes.-Michigan, Ohio, Indiana, Illinois, and 77iscons'ii.Plains.-Miunesota, Iowa, Missouri, North Dakota, South Dakota, Nebraska,
and Kansas.Southeast. - Virginia, West Virginia, Kentucky, Tennessee, North Carolina,
South Carolina, Georgia, Florida, Alabama, Mississippi, Louisiana, and Arkansas.Southwai.-Oldahoma, Texas, New Mexico, and Arizona.Rocky Mountain.- Montana, Idaho, Wyoming, Colorado, and Utah.Far West. - Washington, Oregon, Nevada, California, Alaska, and Hawaii.
54 i't'kr r,.1
34 ECONOMIC AND SOCIAL CONDITION OF RURAL AMERICA
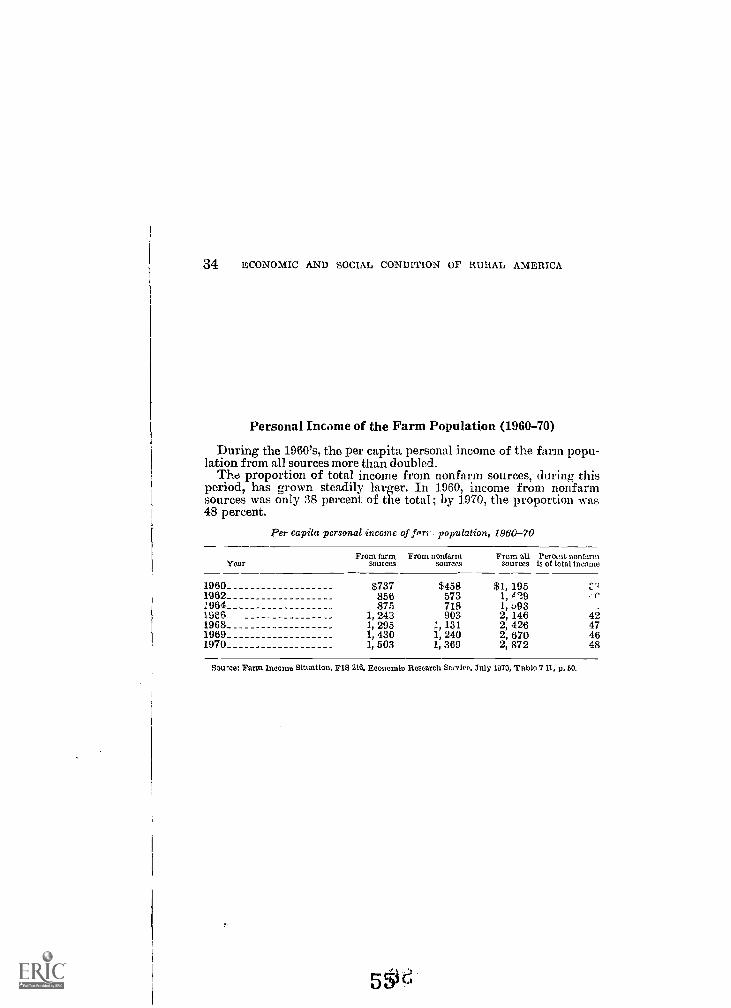
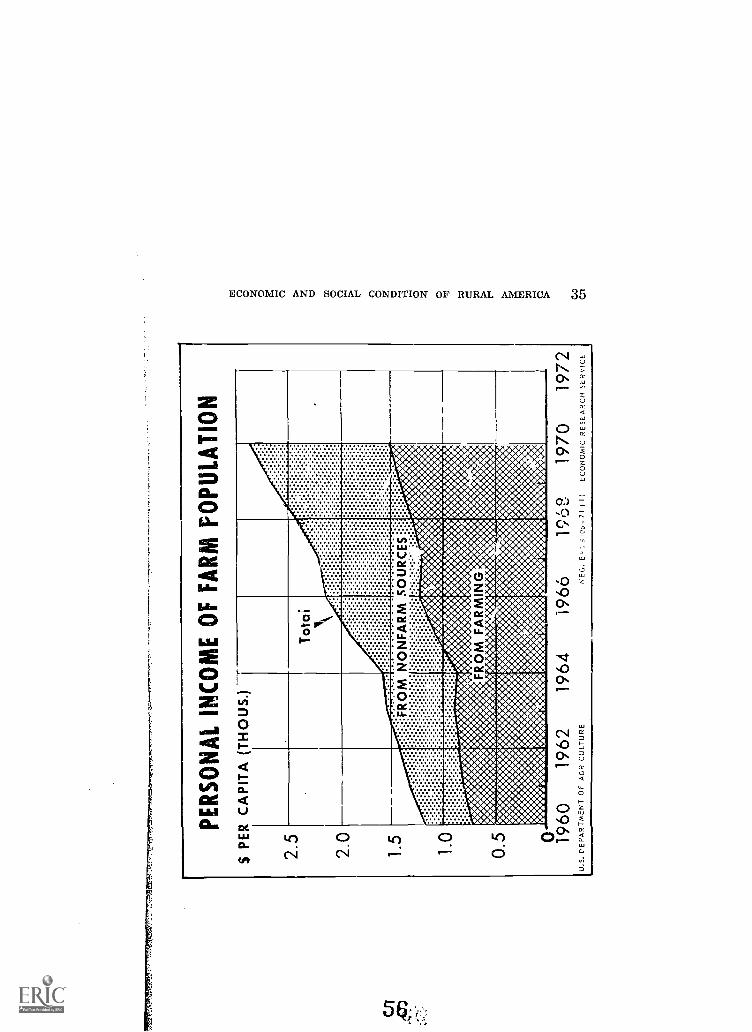
Personal Income of the Farm Population (1960-70)
During the 1960's, the per capita personal income of the farm popu-lation from all sources more than doubled.
The proportion of total income from nonfarm sources, during thisperiod, has grown steadily larger. In 1960, income from nonfarmsources was only 38 percent of the total; by 1970, the proportion was48 percent.
Per capita personal income of Pm population, 1960-70
YearFront farm
sourcesFrom nonfarm
sourcesFrom all
sourcesPerctlit nonfarmis of total Income
1960 $737 $458 $1, 195 :.'"
1962 856 573 1, 449 . I'1964 875 718 I, o931906 1,243 903 2,146 421968 1,295 1,131 2,426 471969 1,430 1,240 2,670 461970 1,503 1,369 2,872 48
Source: Farm Income Situation, FIB 218, Economic, Research Se,rfee, July 1970, Table 7 Ii, p.
5514
Cn
.(SP
$ P
ER
2.5
2.0
1.5
1.0
n g
PE
RS
ON
AL
CA
PIT
A (
TH
OU
S.)
INC
OM
E O
F F
AR
M P
OP
ULA
TIO
N-
Tot
al lk
..
.
ii f
Ror
in;:;
:;:;:;
;:;i:i
:i
.
NO
NF
AR
M S
OU
RC
ES
:::,..
4.;4
0:E
:i:ii:
Eii:
.::::*
'i':'
.:.'..
;-:$
::::*
**:::
:::i;i
;:;:ii
::.:0
0.1'
..**4
:"".
****
:. .
......
.....,
.... .
.,,.4
V.,
.V, 6
*. "
.1 I
.W, .
1I.V
44,
.:'#.e
vAgg
iaa;'st F
RO
M
ttate
KV
VSV
ivrV
4S+
+!
:NO
MIN
t"41
*4..
,e:
.4;e
:,. .
:.....
....
,.. w
.t.t..
....
1000
WW
WO
MM
44' W4NNAA" WOOMMMAA;
x***N.
FA
RM
ING
:***
4444
0.. v
. tow
tie :1
40.:
Atitea
t.ace
st-
:..4
,*.
A:::
:::8:
Mo.
****
*4...
......
. 4.v
.t.01
4446
:46:
44V
a s
0 1960
1962
1964
1966
1969
1970
1972
U.S
. DE
PA
RT
ME
NT
OF
AG
R C
ULT
UR
EN
EG
. EP
; d 1
0b -
71
(11
EC
ON
OM
IC R
ES
EA
RC
H S
ER
VIC
E
36 ECONOMIC AND SOCIAL CONDITION OF RURAL AMERICA
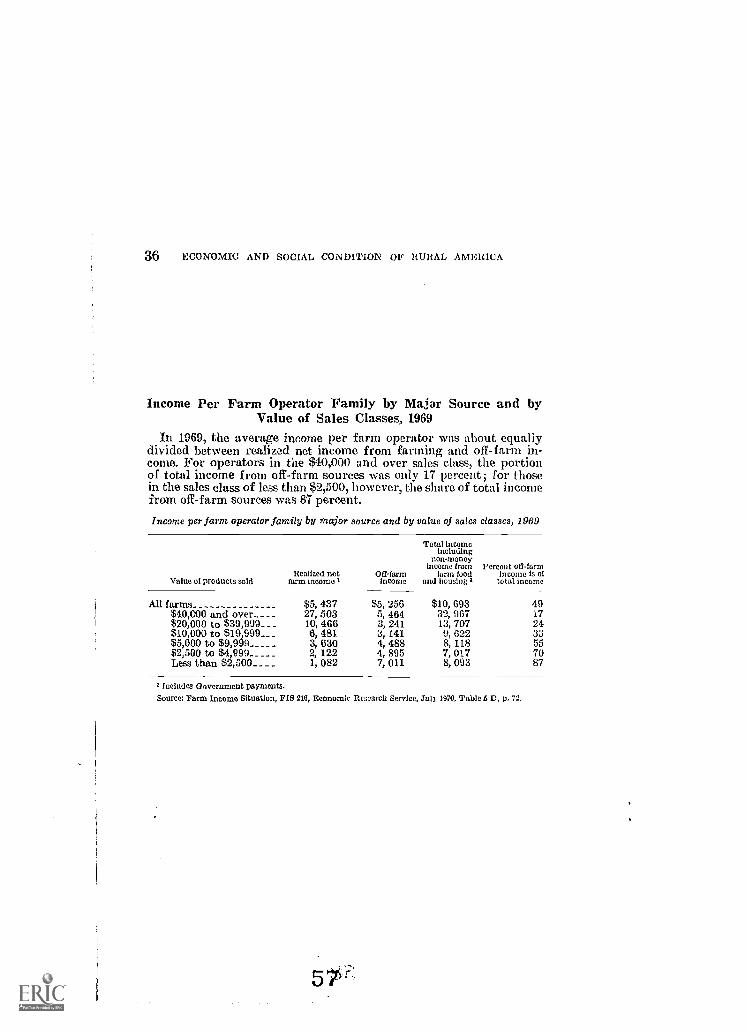
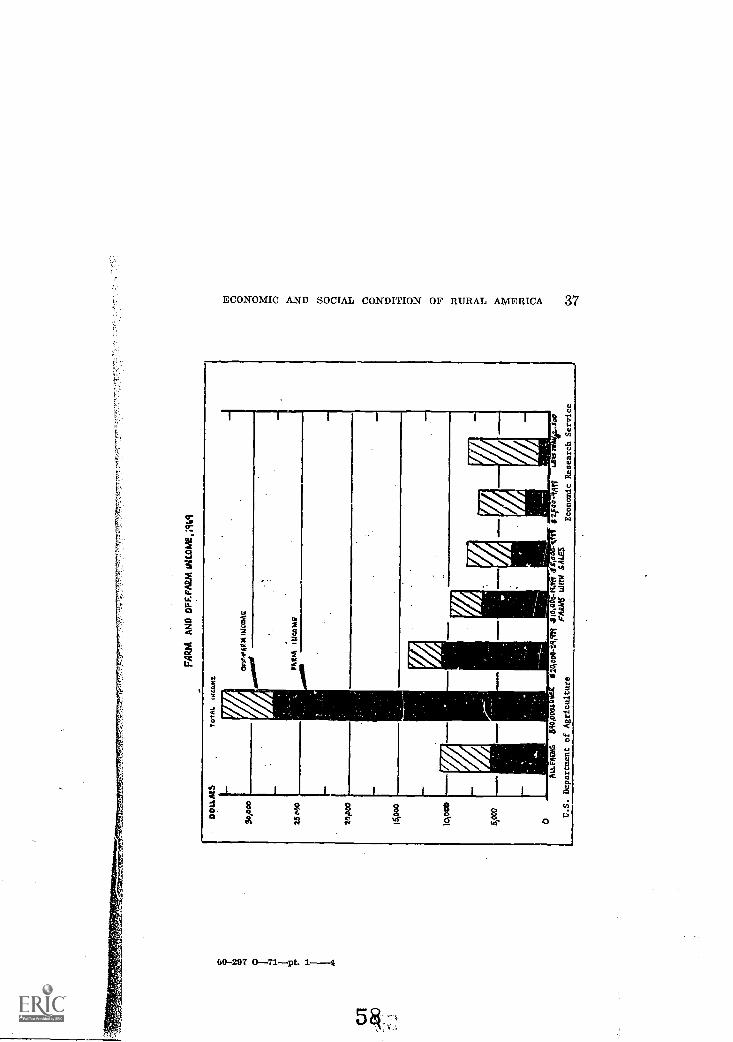
Income Per Farm Operator Family by Major Source and byValue of Sales Classes, 1969
In 1969, the average income per farm operator was about equallydivided between realized net income from farming and off -farm in-come. For operators in the $40,000 and over sales class, the portionof total income from off-farm sources was only 17 percent ; for thosein the sales class of less than $2,500, however, the share of total incomefrom off-farm sources was 87 percent.
Income per farm operator family by major source and by value of sales classes, 1969
Total incomeincluding
non-moneyincome from Percent off-farm
Realized net Off-farm farm food income is ofValue of products sold farm income 1 Income and housing i total Income
All farms $5, 437 $5, 256 $10, 693 49$40,000 and over_ _ _ _ 27, 503 5, 464 32, 967 17$20,000 to $39,999_ _ _ 10, 466 3, 241 13, 707 24$10,000 to $19,999 6, 481 3, 141 9, 622 33$5,000 to $9,999 3, 630 4, 488 8, 118 55$2,500 to $4,999Less than $2,500_ _
2,1,
122082
4,7,
895011
7, 0178, 093
7087
Includes Government payments.Source: Farm Income Situation, VS 216, Economic Research Service, July 1970, Table b D, p. 72.
5PP-
FAR
M A
HD
OFF
.FA
VA
MO
*, ii
1D9
DO
LL
M$
Sopa
,
23M
0
2fhD
oo
15,0
00
UN
0216
TWAL INCOME.
Ors
,S4R
alM
tMA
R
AL
LFA
ros
0004
.110,0 a.pioss
0$2I
auFA
RM
S. W
U S
AL
ES
U.S. Department of Agriculture
Economic Research Service
cAD
38 ECONOMIC AND SOCIAL CONDITION OF RURAL AMERICA
Number of Farms by Value of Sales Classes, 1960-69
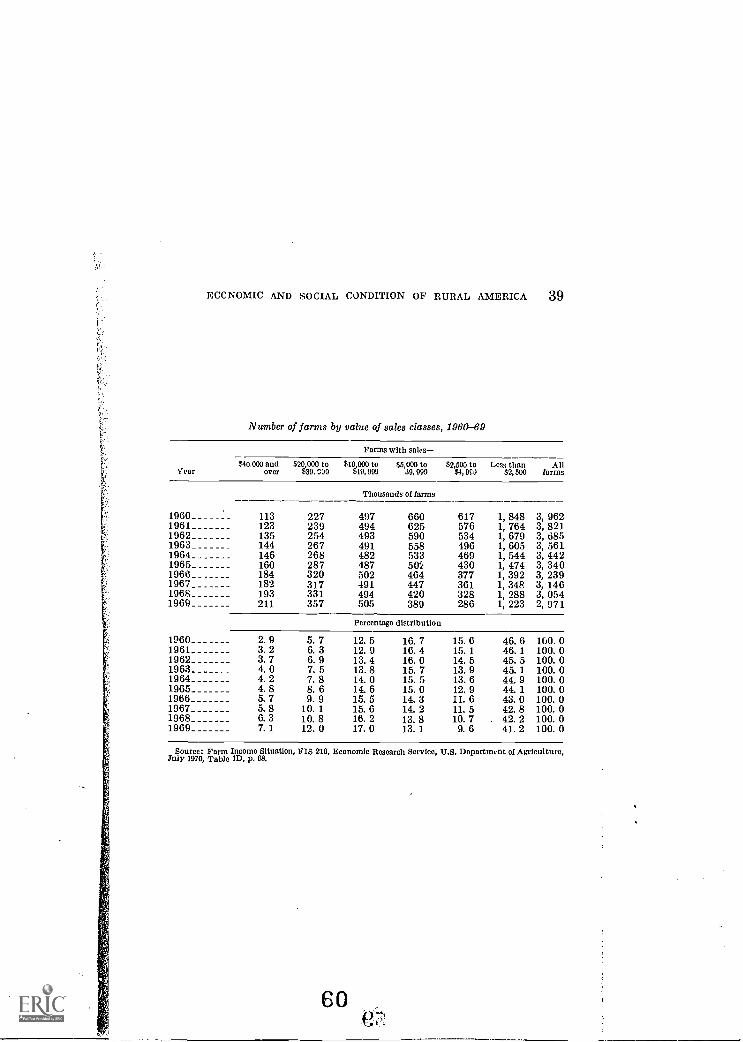
The number of farms in the United States has declined from nearly4 million in 1960 to about 3 million in 1969.
Nearly half (47 percent) of the farms in 1960 were in the sales classof less than $2,500; by 1969, the proportion was two-fifths. At theother end of the scale, farms with sales of $40,000 and over rose from3 percent in 1960 to 7 percent in 1969.
59
ECONOMIC AND SOCIAL CONDITION OF RURAL AMERICA 39
Number of farms by value of sales classes, 1960-69
Year
Farms with sales-
$40000 andover
$20,000 to$39, C39
$10,000 to$19, 999
$6,000 to49, 999
$2,600 to$4, 9C0
Less than$2, 500
Allfarms
Thousands of farms
1960 113 227 497 660 617 1,848 3,9621961 123 239 494 625 576 1,764 3,8211962 135 254 493 590 534 1,679 3,6851963 144 267 491 558 196 1,605 3,5611964 146 268 482 533 469 1,544 3,4421965 160 287 487 502 430 1,474 3,3401966 184 320 502 464 377 1,392 3,2391967 182 317 491 447 361 1,348 3, 1461968 193 331 494 420 328 1,288 3,0541969 211 357 505 389 286 1,223 2,971
Percentage distribution
1960 2. 9 5.7 12. 5 16. 7 15. 6 46. 6 160. 01961 3. 2 6. 3 12. 9 16. 4 15. 1 46. 1 100. 01962 3. 7 6. 9 13. 4 16. 0 14. 5 45. 5 100. 01963 4. 0 7. 5 13. 8 15. 7 13. 9 45. 1 100. 01964 4. 2 7.8 14. 0 15. 5 13. 6 44. 9 100. 01965 4. 8 8. 6 14. 6 15. 0 12. 9 44. 1 100. 01966 5.7 9.9 15. 5 14. 3 II. 6 43. 0 100. 01967 5. 8 10. 1 15. 6 14. 2 11. 5 42. 8 100. 01968 6.3 10.8 16. 2 13. 8 10. 7 42. 2 100. 01969 7. 1 12. 0 17. 0 13. 1 9. 6 41. 2 100. 0
Source: Farm Income Situation, FIS 210, Economic Research Service, U.S. Departmolt of Agriculture,July 1970, Table ID, p, 08.
60
40 ECONOMIC AND SOCIAL CONDITION OF RURAL AMERICA
Number of Commercial Farms, and Average Farm Size and Value,by Farm Production Regions, March 1, 1964 and 1969
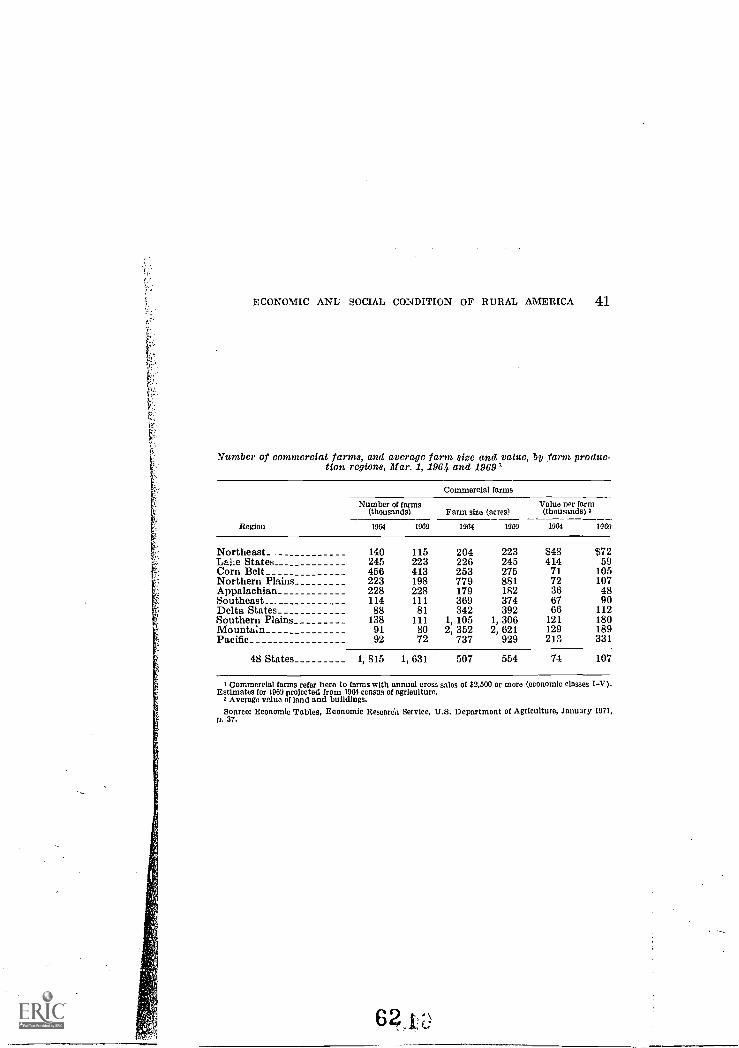
The number of commercial farms in 48 States declined from 1.Smillion in 1964 to 1.6 million in 1969, while the size of farms rose froman average of 507 acres in 1964 to 554 acres in 1969.
This downward trend in number of farms prevailed in all farm pro-duction regions except Appalachia, where there was no change. Farmsize increased in all regions during these 5 years.
The average value of land and buildings went up in all regions ex-cept the Lake States which experienced a precipitate decline.
6 1 -A
ECONOMIC ANL SOCIAL CONDITION OF RURAL AMERICA 41
Arumber of commercial farms, and average farm size and value, by farm produc-tion regions, Mar. 1, 1964 and 1969
Region
Commercial farms
Number of farms(thousands) Farm size (acres)
Value nor farm(thousands) a
19601964 1969 1961 1960 1064
Northeast_ 140 115 204 223 $48 $72LaLe States 245 223 226 245 414 59Corn Belt 456 413 253 275 71 105Northern Plains 223 198 779 881 72 107Appalachian 228 228 179 1R2 36 48Southeast_ 114 111 369 374 67 90Delta States 88 81 342 392 66 112Southern Plains 138 111 1, 105 1, 306 121 180Mountain 91 80 2, 352 2, 621 129 189Pacific 92 72 737 929 213 331
48 States 1, 815 1,631 507 554 74 107
Commercial farms refer hero to farms with annual gross sales of $2,500 or more (economic classes IV).Estimates for 1969 projected from 1964 census of agriculture.
2 Average value of land and buildings.Source: Economic Tables, Economic Research Service, U.S. Department of Agriculture, January 1971,
p. 37.
621:D
42 ECONOMIC AND SOCIAL CONDITION OF RURAL AMERICA
FarmsNumber, by Size, 1940 to 1964, and Percent Distributionof Number of Farms, 1964
Over the years, from 1940 to 1964, the total number of farms hasdeclined from 6 to 3 million.
In the size class up to 260 acres, the number of farms has becomesmaller. In the case of the largest farms, however, 260 acres and over,the number has generally increased during this period.
,,

ECONOMIC AND SOCIAL CONDITION OF RURAL AMERICA 43
FarmsNumber, by size, 1940 to 1964, and percent distribution of number of farms1964
[In thousands]
Size of fa-in (acres)
Under 10 509.10 to 49 1, 78250 to 99 1, 291100 to 179 1, 310180 to 259 486260 to 499 459500 to 999 1641,000 to 1,999
11012,000 and over
Total 6, 102
1950 1951 1953 1064
1001 per-eeat dis-tribution
489 484 244 183 5. 81, 480 1, 213 813 637 20. 21, 048 864 658 542 17. 21, 103 953 773 633 20. 1
487 464 414 355 11. 3478 482 472 451 14. 3182 192 200 210 6. 6
121 130 {1
79578560
2. 71. 9
5, 388 4, 782 3, 711 3, 158 100. 0
Source: Department of Commerce, Bureau of the Census; U.S. Census of Agriculture: 19134, vol.
44 ECONOMIC AND SOCIAL CONDITION OF RURAL AMERICA
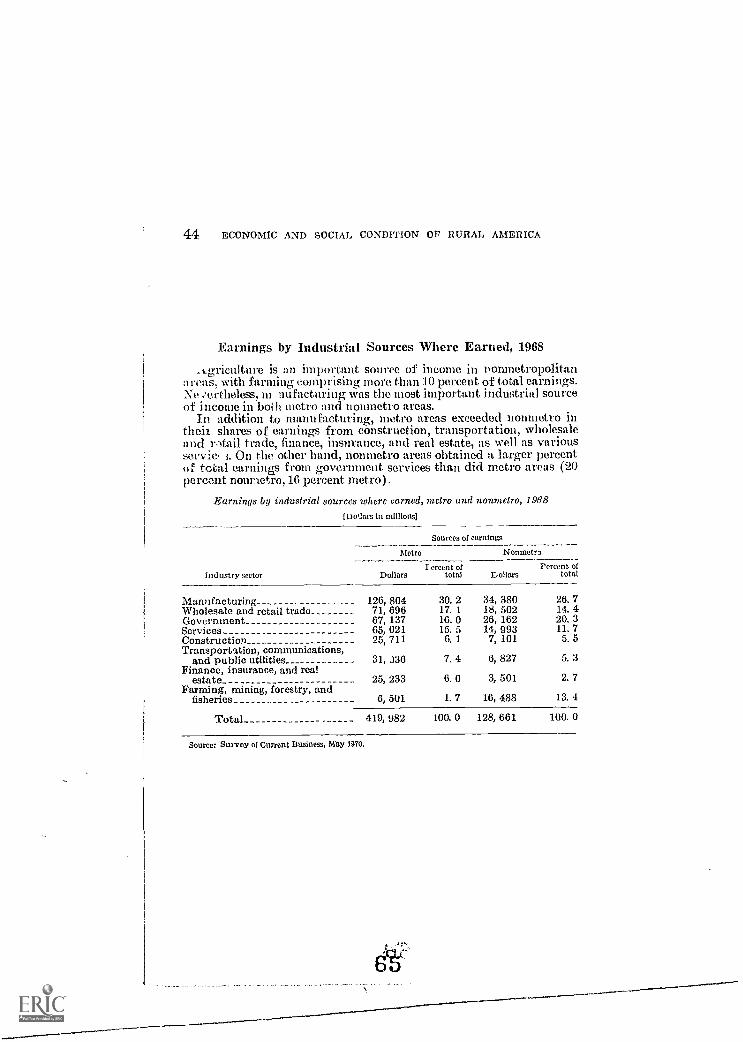
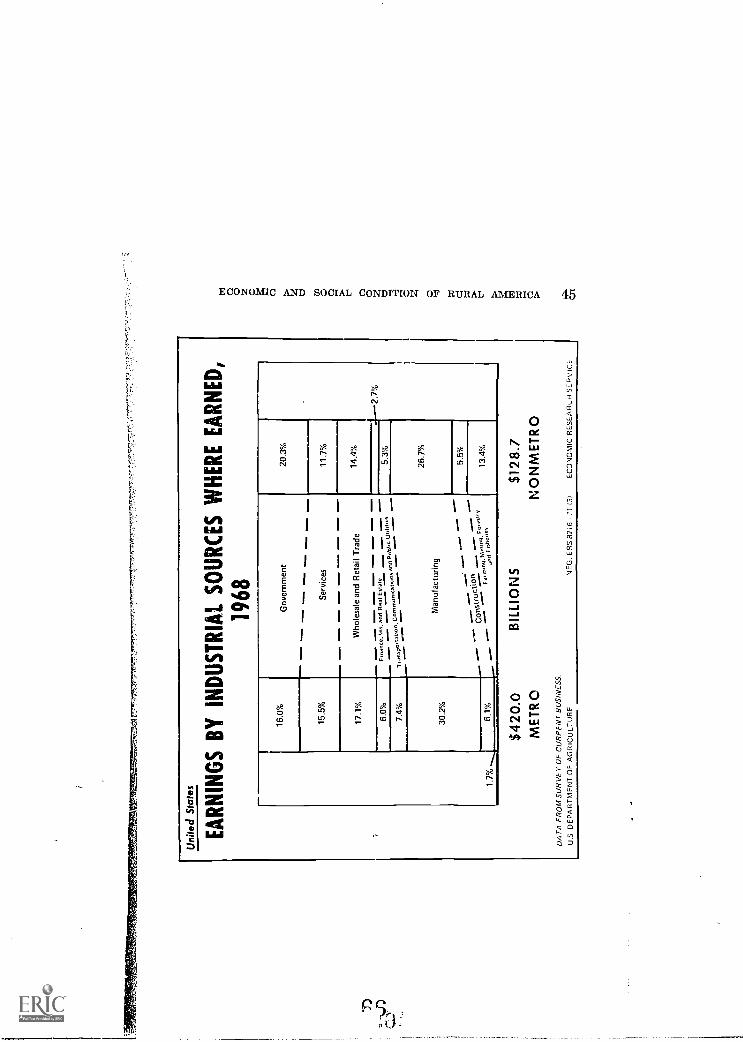
Earnings by Industrial Sources Where Earned, 1968
:tgriculture is an important source of income in nomnetropolitana was, with farming comprising more than 10 percent of total earnings.Ne/ertheless, m nufacturing was the most important industrial sourceof income in boili metro and nomnetro areas.
In addition to manufacturing, metro areas exceeded nomnetro inthen shares of earnings from construction, transportation, wholesaleand r.-tail trade, finance, insurance, and real estate, as well as variousservic, On the other hand, nonmetro areas obtained a larger percentof total earnings from government services than did metro areas (20percent nonmetro, 16 percent metro).
Earnings by industrial sources where earned, 'metro and nonmetro, 1968(Dollars in millions]
Sources of earnings
Industry sector
Metro
DollarsI crcent of
total
Nonmetra
DollarsPercent of
total
Manufacturing 126, 804 30. 2 34, 380 26. 7Wholesale and retail trade 71, 696 17. 1 18, 502 14. 4Government 67, 137 16. 0 26, 162 20. 3Services 65, 021 15. 5 14, 993 11. 7Construction 25, 711 6. 1 7, 101 5. 5Transportation, communications,
and public utilities 31, J36 7. 4 6, 827 5. 3Finance, insurance, and real
estate 25, 233 6. 0 3, 501 2. 7Farming, mining, forestry, and
fisheries 6, 501 1. 7 16, 488 13. 4
Total 419, 982 100. 0 128, 661 1(10. 0
Source: Survey of Current Business, May laTO.
-
Uni
ted
Sta
tes
EA
RN
ING
S B
Y IN
DU
ST
RIA
L S
OU
RC
ES
WH
ER
E E
AR
NE
D,
1968
1.7%
-
16.0
%G
over
nmen
t20
.3%
2.7%
15.5
%
17.1
%
Ser
vice
s11
.7%
Who
lesa
le a
nd R
etai
l Tra
de14
.4%
6.0
°E
mel
t., In
s an
d R
eal E
stat
e_
__._
Unn
t.es
5.3%
7.4%
Tra
nspo
rTtto
n7C
omm
un.c
at__
_.to
ns a
nc._
..1P
oblte
26.7
%
30.2
%M
anuf
actu
ring
-- -
--.
Con
stru
ctio
...,..
m.n
,n,,F
.
5.5%
13.4
%6.
1%F
.es
$420
.0M
ET
RO
DA
TA
FR
OM
SU
RV
EY
OF
CU
RR
EN
T B
US
INE
SS
.
U.S
DE
PA
RT
ME
NT
OF
AG
RIC
ULT
UR
E
BIL
LIO
NS
$128
.7N
ON
ME
TR
O
NE
G. E
RS
82
i6 -
'113
1E
CO
NO
MIC
RE
SE
AR
L.H
SE
RV
ICE
14-
Cat
46 ECONOMIC AND SOCIAL CONDITION OF RURAL AMERICA
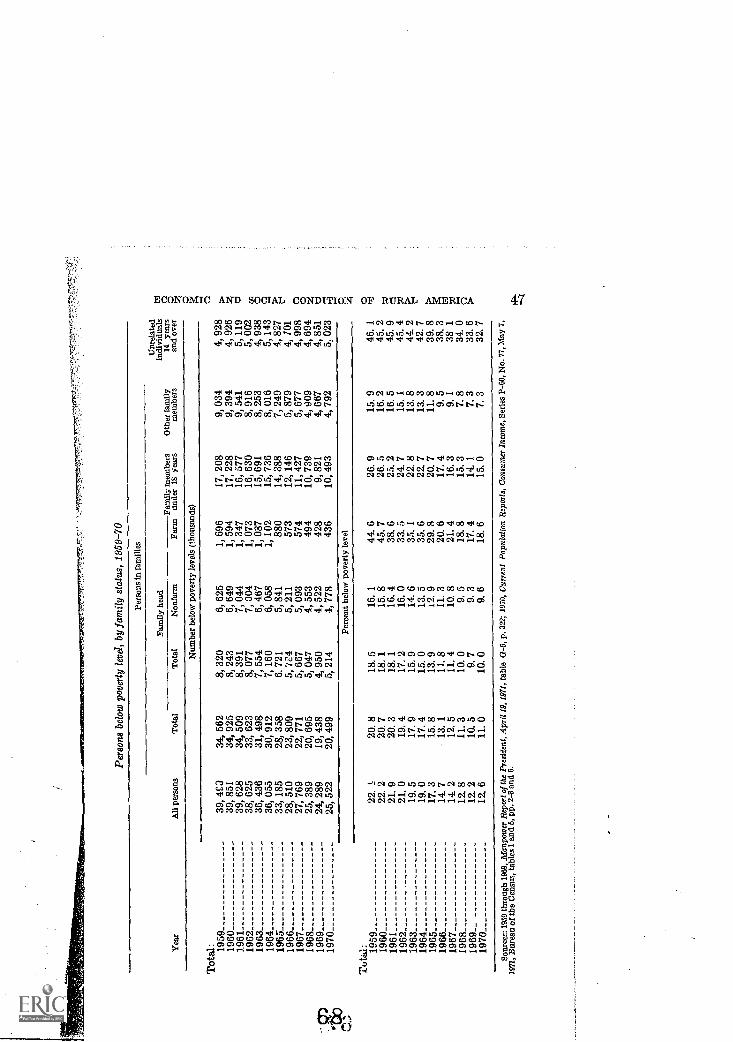
Persons Below Poverty Level, by Family Status, 1959-70
Although the total number of persons in farm families below thepoverty level is smaller than in nonfarm families, the percentage ofpersons in farm families in poverty remains about twice as high asnonfarm.
Poverty level, as used here, is based on a modified Social SecurityAdministration definition adopted by a Federal interagency commit-tee in 1969. The definition of poverty takes into account a range ofincome adjusted by such factors as family size, sex of the family head,number of children under 18 years old, and farm-nonfarm residence.For example, the weighted average threshold at the poverty level in1969 for a nonfarm family of four was $3,743 and for a farm family offour, $3,195.
Reversing a 10-year decline in numbers of people in poverty, the mostrecent figures released by the Census Bureau reveal an increase of 1.2million persons considered to be poor. The increase occurred from thebeginning of 1969 to the end of 1970, bringing the total number in pov-erty to 25.5 million people, or 13 percent of the U.S. population.
The average annual decline in poverty numbers during the 1960's was4.9 percent. Between 1969 and 1970, however, the number increased by5.1 percent.
The weighted average threshold at th3 poverty level in 1970 for anonfarm family of four was $3,968 and for a farm family, $3,385.
,fle
seer
mov
esem
aam
orea
t°F-
7
Pers
ons
belo
w p
over
ty le
vel,
by f
amily
sta
tus,
195
9-70
Yea
rA
ll pe
rson
s
Pers
ons
in f
amili
es
Unr
elat
edin
divi
dual
s14
yea
rsan
d ov
er
Fam
ily h
ead
Fam
ilym
embe
rs18
yea
rsO
ther
fam
ilym
embe
rsT
otal
Tot
alN
onfa
rmFa
rm u
nder
Num
ber
belo
w p
over
ty le
vels
(th
ousa
nds)
Tot
al: 19
5939
, 4C
034
, 562
8,32
06,
625
1, 6
9617
,20
89,
034
4,92
819
6039
, 851
34, 9
258,
243
6, 6
491,
594
17,
228
9,39
44,
926
1961
39,
628
34, 5
098,
391
7, 0
441,
347
16,
577
9,54
15,
119
1962
38,
625
33, 6
238,
077
7, 0
041,
073
16,
630
8,91
65,
002
1963
36,
436
31, 4
987,
554
6, 4
671,
087
15,
691
8,25
34,
938
1964
36,
055
30, 9
127,
160
6, 0
581,
102
15,
736
8,01
65,
143
1965
33,
185
28, 3
586.
721
5, 8
4188
014
,38
87,
249
4,82
719
6628
,51
023
, 809
5,72
45,
211
573
12,
146
5,87
94,
101
1967
27,
769
22, 7
715,
667
5, 0
9357
411
,42
75,
677
4,99
819
6825
,38
920
, 695
5,04
74,
553
494
10,
739
4,90
94,
694
1969
24,
289
19, 4
384,
950
4, 5
2242
89,
821
4,66
74,
851
1970
25,
522
20, 4
995,
214
4, 7
7843
610
,49
34,
792
5,02
3
Perc
ent b
elow
pov
erty
leve
l
Tot
til: 19
5922
. (20
. 818
. 516
. 144
. 626
. 915
. 946
. 119
6022
. 220
. 718
. 115
. 845
. 726
. 516
. 245
. 219
6121
. 920
.318
. 116
. 438
. 625
. 216
. 545
. 919
6221
. 019
. 417
. 216
. 033
. 524
. 715
. 145
. 419
6319
. 517
. 915
. 914
. 635
. 122
. 813
. 844
.219
6419
. 017
. 415
. 013
. 535
, 622
. 713
. 342
. 719
6517
. 315
. 813
. 912
. 929
. 820
. 711
. 839
. 819
6614
. 713
. 111
. 811
. 320
. 617
. 49.
538
. 319
6714
. 212
. 511
. 410
. 821
. 416
. 39.
138
119
6812
. 811
. 310
. 09.
518
. 815
. 37.
834
. 019
6912
. 210
. 59.
79.
317
. 414
. 17.
333
. 619
7012
. 611
. 010
. 09.
618
. 615
. 07.
332
. 7
Sour
ces:
195
9 th
roug
h 19
69, M
anpo
wer
Rep
ort o
f th
e Pr
esid
ent,
Apr
il 19
,197
1, ta
ble
0-6,
p. 3
22; 1
970,
Cur
rent
Pop
ulat
ion
Rep
orts
, Con
sum
er I
ncom
e, S
erie
s P-
60, N
o. 7
1,M
ay 7
,19
71, B
urea
u of
the
Cen
sus,
tabl
es 1
and
9, p
p. 2
-3 a
nd 6
.M
I,--
1
48 ECONOMIC AND SOCIAL CONDITION OF RURAL AMERICA
Persons by Poverty Status, by Type of Residence, 1969
The percentage of persons in poverty in nonmetropolitan areas wasnearly twice as high in 1969 as those living in metropolitan areas.
For all races, the proportic n of persons in poverty status in non-metro areas was also higher than in the central cities (17 percent non-metro ; 13 percent central city).
In nonmetropolitan areas, more than half of the total Negro popu-lation was below the poverty level in 1969.

Pers
ons
by p
over
ty s
tatu
s, b
y ty
pe o
f re
side
nce,
196
9
[Num
ber
of p
erso
ns in
thou
sand
s]
All
race
s
Bel
ow p
over
ty le
vel
Whi
teN
egro
Bel
ow p
over
ty le
vel
Bel
ow p
over
ty le
vel
Res
iden
ce ty
peT
otal
Num
ber
Perc
ent
of to
tal
Tot
alN
umbe
rPe
rcen
tof
tota
lT
otal
Num
ber
Perc
ent
of to
tal
Uni
ted
Stat
es19
9,84
924
,28
912
.2
175,
231
16,6
689.
522
,34
97,
214
32. 3
Met
ropo
litan
130,
017
12,
320
9.5
112,
440
8,20
07.
315
,82
43,
855
24. 4
Cen
tral
city
Met
ro r
ing
57,
72,
781
236
7, 4,76
056
013
. 6.4 3
44,
68,
392
049
4, 3,52
767
410
. 5.2 4
12, 3,
439
384
3,06
878
624
. 723
. 2
Non
met
ropo
litan
69,
831
11,
969
17.
162
,79
18,
468
13.
56,
525
3,35
951
. 5
Sonm
e: B
urea
u of
the
Cen
sus,
Cur
rent
Pop
ulat
ion
Itep
orts
, "C
onsu
mer
Inc
ome,
" P-
60, N
o. 7
6, ta
ble
3.
CC
50 ECONOMIC AND SOCIAL CONDITION OF RURAL AMERICA
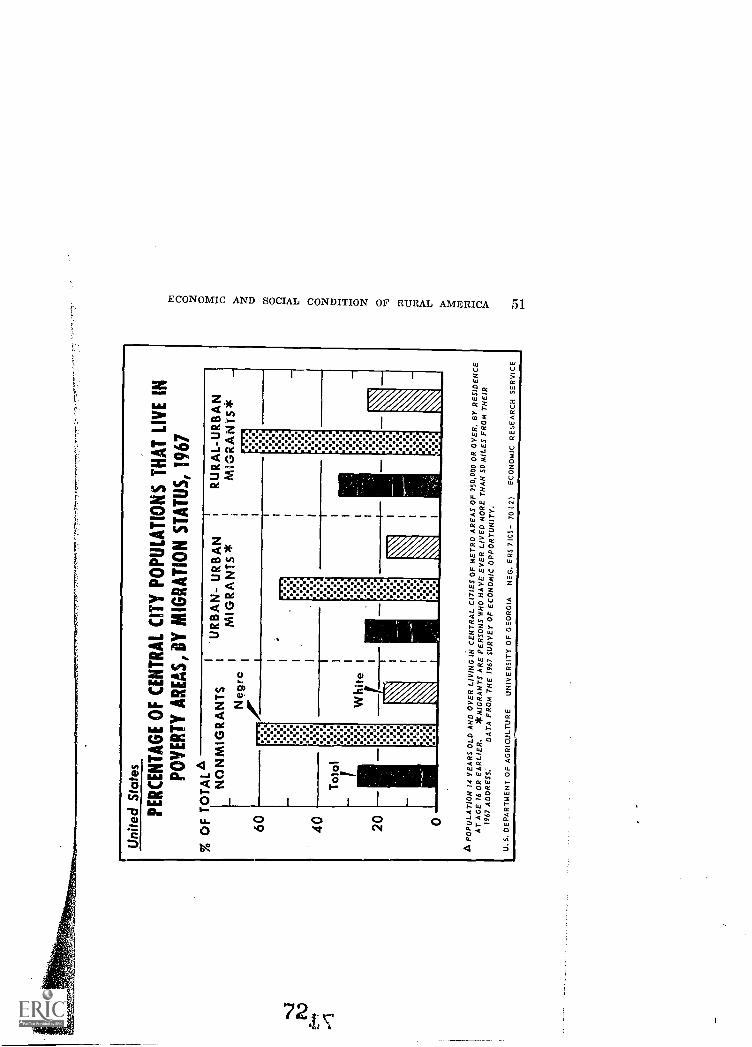
Percentage of Central City Populations That Live in PovertyAreas, by Migration Status, 1967
In 1967, about 28 percent of the central city population of medium-and large-sized metro areas lived in poverty areas. The remainder wasin sections not characterized by very low income and other featuresof widespread poverty.
Migrants of rural origin who had moved to central cities were morelikely than nonmigrants or migrants of urban origin to live in povertyareas. This was true for whites and blacks, but more so for the blacks.Two-thirds of the black rural-to-urban central-city residents were inpoverty areas. Among blacks who had moved to central cities fromsome. other urban background, half were living in poverty areas. Blacl:nonmigrants were more likely to be in poverty areas than were urban-to-urban migrants, but less likely than rural-to-urban migrants.
For the white population, differences in location of the variousmigrant-status groups were not great, although they were in the samedirection as those for blacks, with rural-to-urban migrants being thegroup most likely to live in poverty areas.
The most striking feature of the data is the high percentage ofblacks who were living in poverty areas, regardless of their migra-tion background. The black group with the lowest poverty area con-centration 1,,as twice as likely to be in a poverty area as was the whitegroup with the highest poverty area location.
Poverty areas, in central cities of metro areas of 250,000 or more,are groups of tracts falling in the lowest quartile on an index basedon several items relating to composition of families, their economicstatus, and housing condition.
Migrants are persons who have ever lived more than 50 miles fromtheir 1967 address.
Uni
ted
Sta
tes
PE
RC
EN
TA
GE
OF
CE
NT
RA
L C
ITY
PO
PU
LAT
ION
S T
HA
T L
IVE
INP
OV
ER
TY
AR
EA
S, B
Y M
IGR
AT
ION
ST
AT
US
, 196
7%
OF
TO
TA
LA
60 40 20 0
NO
NM
IGR
AN
TS
Neg
ro
UR
BA
N-
UR
BA
NM
IGR
AN
TS
*R
UR
AL-
UR
BA
NM
IGR
AN
TS
*
A P
OP
ULA
TIO
N 1
4 Y
EA
RS
OLD
AN
D O
VE
R L
IVIN
GIN
CE
NT
RA
L C
ITIE
S O
F M
ET
RO
AR
EA
S O
F 2
50,0
00 O
R O
VE
R, B
Y R
ES
IDE
NC
EA
T A
GE
16
OR
EA
RLI
ER
.*M
IGR
AN
TS
AR
E P
ER
SO
NS
WH
O H
AV
E E
VE
R L
IVE
D M
OR
E T
HA
NS
O M
ILE
S F
RO
M T
HE
IR19
67 A
DD
RE
SS
:D
AT
A F
RO
M T
HE
196
7 S
UR
VE
Y O
F E
CO
NO
MIC
OP
PO
RT
UN
ITY
.
U.S
. DE
PA
RT
ME
NT
OF
AG
RIC
ULT
UR
EU
NIV
ER
SIT
Y O
F G
EO
RG
IAN
EG
. ER
S 7
105-
70
(2)
EC
ON
OM
IC R
ES
EA
RC
H S
ER
VIC
E
52 ECONOMIC AND SOCIAL CONDITION OF RURAL AMERICA
Employment, by Industry, United States, Metropolitan and Non-metropolitan Areas, March 1960 and March 1970
In the 1960-70 decade, nonmetropolitan America added 3.4 millionnew workers, or 17 percent more employed in 1970 than in 1960. Thisrepresented an increase from 19.9 million workers to 23.3 million. Dur-ing the same period, however, metro areas increased their numberof workers from 46.2 million to 58.5 million, a 27-percent change. Thetrend for the United State was a rise of 24 percent.
Nonmetropolitan areas surpassed metro areas in percentage changefrom 1960 to 1970 in manufacturing by 31 percent nonmetro to 12percent metro, and in construction by 46 percent nonmetro to 29 per-cent metro. Finance, insurance, and real estate was the only group in.the service sector that grew faster in nonmetro than metro counties.In "fast- growing industries," such as government, service, and trade,metro areas outpaced nonmetro in employment gains.
Despite this favorable nonmetro con.petition in employment, an im-portant factor in the continuing metro-nonmetro income gap is re-vealed by the comparative industrial mix in the two areas. Althoughmanufacturing plays a significant role in both areas, "fast-growing in-dustries" (exceeding the overall national growth rate of 23.8 percent)grew faster in metro than nonmetro areas in the 1960's. The only fast-growing industry with a notably higher growth rate in nonmetro areaswas construction. The nonmetro lag in employment and income is ac-counted for by the industrial mix which favors metro areas, includingthe continued decline in agricultural employment in nonmetro areas.This decline is due in part to high productivity rates in the farmsector, from increased use of mechanization and other labor-savingtechnology.
The most promising source of development for many rural areas isnew nonfarm employment supported by the necessary social and eco-nomic infrastructure that will attract new residents and new businessto nonmetropolitan regions. Much of this employment will be in plantsthat are most efficient in relatively urban environments. So new jobcreation needs to be in or near smaller urban centers within commut-ing distance of the rural poor and the displaced farmers.
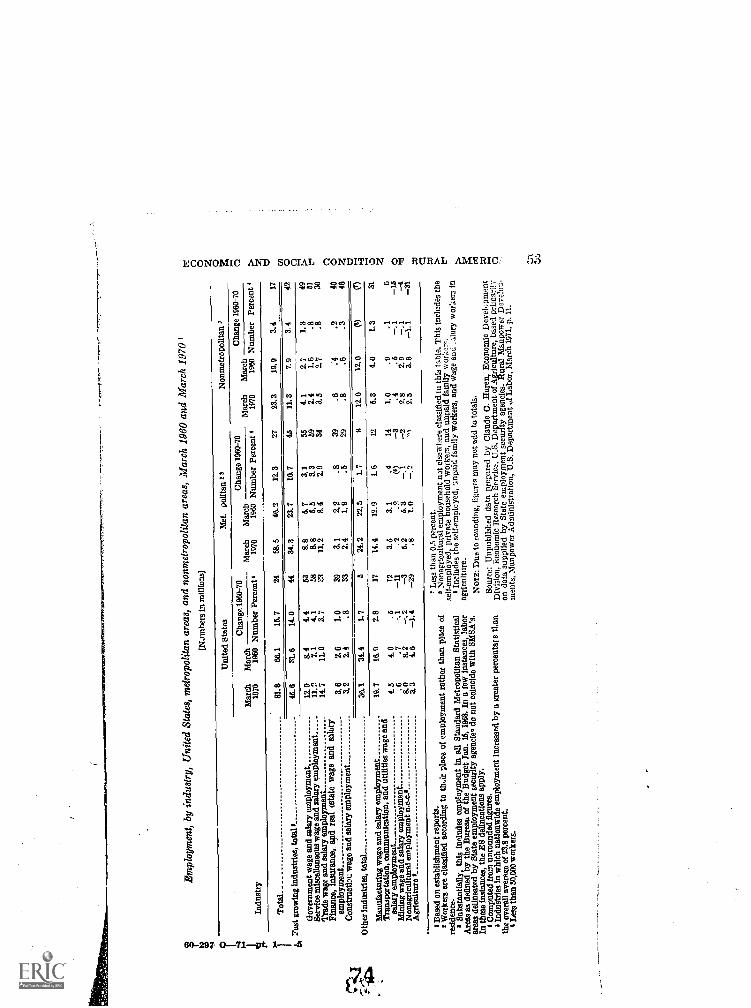
Em
ploy
men
t, by
indu
stry
, Uni
ted
Stat
es, m
etro
polit
an a
reas
,an
d no
nmet
ropo
litan
are
as, M
arch
196
0 an
d M
arch
197
0
[Num
bers
in m
illio
ns;
Indu
stry
Mar
ch19
70
Tot
al81
.8
4,, '
Fast
gro
win
g in
dust
ries
, tot
al,
46.6
Gov
ernm
ent w
age
and
sala
ry e
mpl
oym
ent
12. 9
Serv
ice
mis
cella
neou
s w
age
and
sala
ry e
mpl
oym
ent
11. 1
Tra
de w
ap a
nd s
alar
y em
ploy
men
t14
.7Fi
nanc
e, in
sura
nce,
and
rea
l Mat
e w
age
and
sala
ryem
ploy
men
t3.
8C
onst
antin
wag
e an
d sa
lary
em
ploy
men
t3.
2
Oth
er in
dust
ries
, tot
aL36
.1
Man
ufac
turi
ng w
age
and
sala
ry e
mpl
oym
ent
19.7
Tra
nspo
rtat
ion,
com
mun
icat
ion,
and
util
ities
wag
e an
dsa
lary
em
ploy
men
t4.
5M
inin
g w
age
and
sala
ry e
mpl
oym
ent
.6N
onag
ricu
ltura
l em
ploy
men
t n.e
.c.,.
8.0
Avi
cultu
re s
3.3
Uni
ted
Stat
es
Cha
nge
1960
-70
Mar
ch19
60 N
umbe
r Pe
rcen
t
Met
. pol
ltan
13N
OII
Met
TO
P011
3221
11
Mar
chM
arch
Cha
nge
1960
-70
Cha
nge
1960
-70
Mar
chM
arch
1970
1960
Num
ber
Perc
ent 4
1970
1960
Num
ber
Perc
ent
66.1
15.7
31.1
314
.0
8.4
4.4
7.1
4.1
11. 0
a 7
2, 6
1.0
2.4
.8
34.4
1.7
2458
.546
.212
.327
23.3
19.9
3.4
17
4434
.323
.710
. 745
11.3
7.9
3.4
42
538.
85.
73.
155
4.1
2. 7
1.3
49
588.
85.
53.
359
2.4
1.6
.851
2311
.28.
42.
934
3.5
2.7
.830
393.
12.
2.8
39.6
.240
332.
41.
0.5
29.8
.6.3
46
524
.222
.51.
78
12.0
12.0
(90
16.9
2.8
4.0
.5. 7
-.1
8.2
4.6
-1.4
1714
.412
.9L
612
5.3
4.0
1.3
31
123.
53.
1.4
141.
0.9
.16
-11
.2.2
(4)
-3.4
. 5-.
1-1
5-3
5.2
5.3
-.1
-22.
82.
9-.
1-4
-29
.81.
0_.
,,2.
53.
6-1
.1-3
1
1 B
ased
on
esta
blis
hmen
t rep
orts
.2
Wor
kers
are
cla
ssif
ied
acco
rdin
g to
th.ir
pla
ce o
f em
ploy
men
t rat
her
than
pla
ce o
fre
side
nce.
I Su
bsta
ntia
lly, t
his
Incl
udes
em
ploy
men
t in
all S
tand
ard
Met
ropo
litan
Sta
tistic
alA
reas
as
defi
ned
by th
e B
urea
u of
the
Bud
get I
an. 1
6, 1
968.
In
a fe
w in
stan
ces,
labo
rar
eas
delin
eate
d by
Sta
te e
mpl
oym
ent s
ecur
ity a
genc
ies
do n
ot c
oinc
ide
with
SMSA
's.
In th
ese
inst
ance
s, th
e E
S de
linea
tions
app
ly.
Com
pute
d fr
om u
nrou
nded
fig
ures
.'In
dust
ries
in w
hich
nat
ionw
ide
empl
oym
ent i
ncre
ased
by
a gr
eate
r pe
rcen
tage
tl.a
nth
e ov
eral
l ave
rage
of
23.9
per
cent
.'L
eas
than
50,
000
wor
kers
.
2 L
ess
than
0.5
per
cent
.N
onag
ricu
ltura
l em
ploy
men
t fia
t els
ewhe
re c
lass
ifie
d in
this
tabl
e. T
his
incl
udes
the
self
-em
ploy
ed, p
riva
te h
ouse
hold
wor
kers
, and
unp
aid
fam
ily w
orlz
er.
3 In
clud
es th
e se
lf-e
mpl
oyed
, unp
aid
fam
ily w
orke
rs, a
nd w
age
and
alar
y w
or:ie
rs in
agri
cultu
re.
Nor
z: D
ue to
rou
ndin
g, f
igur
es m
ay n
ot a
dd to
tota
ls.
Sour
ce: U
npub
lishe
d da
ta p
repa
red
by C
laud
e C
. Har
en, E
cono
mic
Dev
elop
men
tD
ivis
ion,
Eco
nom
ic R
esea
rch
Serv
ice,
U.S
. Dep
artm
ent o
f A
gric
ultu
re, b
ased
pri
mar
ilyon
dat
a su
pplie
d by
Sta
te e
mpl
oym
ent s
ecur
ity a
genc
ies.
Rur
al M
anpo
wer
Dev
elop
-m
ents
, Man
pow
er A
dmin
istr
atio
n, U
.S. D
epar
tmen
t vl L
abor
, Mar
ch 1
971,
p.
11.
Gz
54 ECONOMIC AND SOCIAL CONDITION OF RURAL AMERICA
Employment Gains for Industry Groups by Metro-NonmetroLocation, 1960-1970
The rate of gain in nonfarm wage and salary employment from1960 to 1970 was somewhat greater in rural and other nonmetropolitancounties than in metropolitan areas.
In manufacturing, the annual rate of nonmetro gain was nearlythree times that in the metro areas. Construction jobs and employmentin finance, insurance, and real estate also irwreased more rapidly be-yond the loig cities and their suburbs.
Rates of .gain of about 5-percent per year in nonmetro employmentin the service industries and government were moderately below therates of increase in metropolitan areas.
Rural and partly rural counties, with only a tenth of the manufac-turing jobs in 1960, accounted for about a fifth of the gain in manu-facturing workers in the 1960-40 decade.
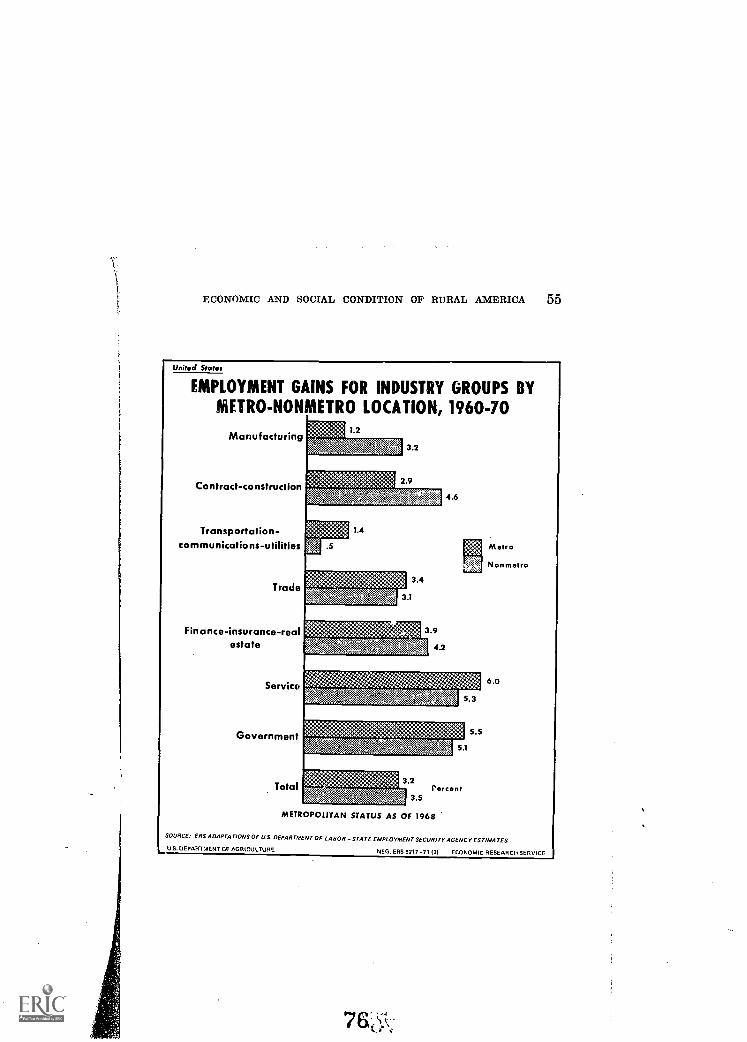
ECONOMIC AND SOCIAL CONDITION OF RURAL AMERICA 55
United States
EMPLOYMENT GAINS FOR INDUSTRY GROUPS BYMETRO-NONMETRO LOCATION, 1960-70
Manufacturing
Contract-construction
Transportation-communications-utilities
Trade
Finance-insurance-realestate
Service
Government
Total
1.2
3.2
2.9
tEL gfirqdt-A-,
1.4
1:111:1:111111;11111inilifillin
3.1
3.4
3.9
.-A5.emA 4.2
4.6
niggig..tganaffegg:%WM
5.3
5.5
5.1
3.2
3.5Percent
METROPOLITAN STATUS AS OP 1968
Metro
N on metro
6.0
SOURCE: ERS ADAPTATIONS OF U.S. DEPARTMENT OF LABOR - STATE EMPLOYMENT SECURITY AGENCY ESTIMATES.
U.S. I/ EPART7AENT OF AGRICULTURE NEG. ERS 8217 -It 13) ECONOMIC RESEAR Cm SERVICE
7a
56 ECONOMIC AND SOCIAL CONDITION OF RURAL AMERICA
Employed Persons 16 Years and Over by Type of Industry:Annual Averages, 1950-1970
As the size of the employed labor force has grown from about 59million in 1950 to nearly 79 million in 1970, the numbers employed inagriculture have decreased from 7 million to about 3.5 million duringthe same period.
The percentage of the total employed, who are engaged in agricul-ture, has declined from 12.2 to 4.4 percent in the 20-year period.
7.
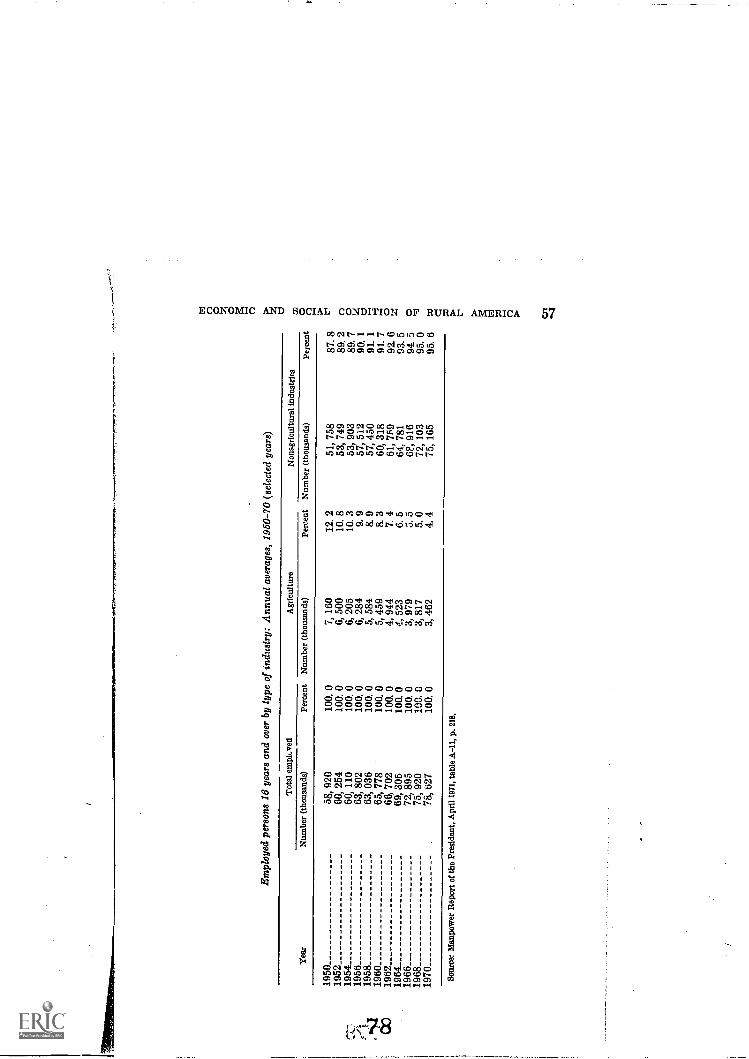
Em
ploy
ed p
erso
ns 1
6 ye
ars
and
over
by
type
of
indu
stry
: Ann
ual a
vera
ges,
195
0-70
(se
lect
ed y
ears
)
,---
--
Al "4
400
Yea
r
Tot
al e
mpK
ved
Agr
icul
ture
Non
agri
cultu
ral i
ndus
trie
sN
umbe
r (t
hous
ands
)Pe
rcen
tN
umbe
r (t
hous
ands
)Pe
rcen
tN
umbe
r (t
hous
ands
)Pe
rcen
t
1950
1952
1954
_19
5619
5819
6019
6219
64_
1966
_19
6819
70
58, 9
2060
, 254
60, 1
1063
, 802
63, 0
3665
, 778
66, 7
0269
, 305
72, 8
9575
, 920
78, t
i27
100.
010
0. 0
100.
010
0.0
100.
010
0. 0
100.
010
0. 0
100.
010
0. 0
100.
0
7, 1
606,
500
6, 2
056,
284
5,58
45,
459
4, 9
444,
523
3, 9
793,
817
3, 4
62
12. 2
10. 8
10. 3 9. 9
8. 9
8. 3
7. 4
6. 5
5. 5
5. 0
4. 4
51, 7
5853
, 749
53, 9
0357
, 512
57, 4
5060
, 318
61, 7
5964
, 781
6F, 9
1672
, 103
75, 1
65
87. 8
89. 2
89. 7
90. 1
91. 1
91. 7
92. 6
03. 5
91 5
95. 0
95. 6
Sour
ce: M
anpo
wer
Rep
ort o
f th
e Pr
esid
ent,
Apr
il 19
71, t
able
A.-
11, p
. 218
.
Cn

58 ECONOMIC AND SOCIAL CONDITION OF RURAL AMERICA
Government Purchases of Goods and Services and Compensationof Employees in Government Enterprises, 1962-69
Government purchases of goods and services and compensation ofemployees in government enterprises have increased in total, from alllevels of government, from $123 billion in 1962 to $223 billion in 1969.Approximately half of the total in 1969 was from the Federal leveland half from State and local governments.
The striking feature about government purchases of goods andservices during the 19o0's was the very high rate of increase, account-ing for one-fourth of the growth in GNP from 1963 to 1970. Nearlytwo-thirds of the government contribution was traceable to Stateand local purchases, reflecting the increasing demand for services atState and local government levels.
While it is not possible to state precisely the role of Federal grants -in yid the rise of State, and ,local purchases, certain inferences canbe drawn from their concomitant rise. According to preliminar7 fig-ures, by 1970, Federal grants, up from about one-seventh of the 1963total, lmounted to nearly one-fifth (19 percent) of State and localexpenditures, nine-tenths of which went for purchases of goods andservices. This relationship of grants to spending varies by function,but for some functions, the rate of growth in grants approximatelymatched that in State and local spending throughout the 1963-70period.
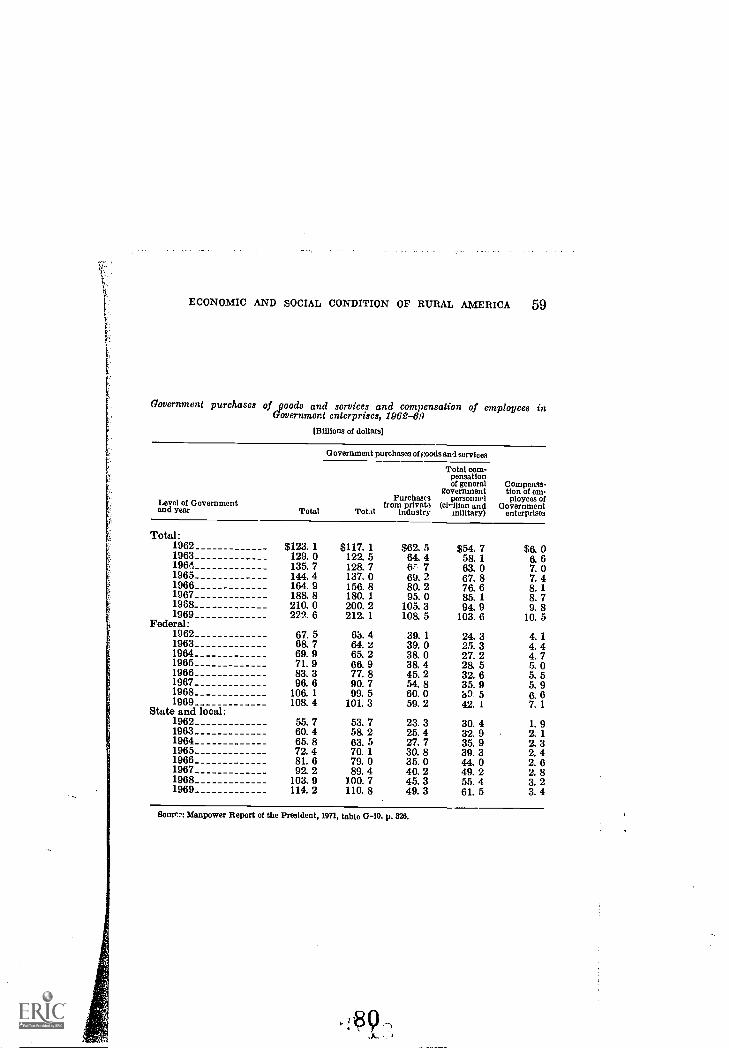
ECONOMIC AND SOCIAL CONDITION OF RURAL AMERICA 59
Government purchases of goods and services and compensation of employees inGovernment enterprises, 1968 -89
Millions of dollars)
Government purchases of f;oods awl services
Total com-pensationof general Compensa
government Hon of emPurchases personnel ployces ofLevel of Government from privet:, (c1^111an and Governmentand year Total Total industry military) enterprises
Total:1962 $123. 1 $117. 1 $62. 5 $54. 7 $6. 01963 129. 0 122. 5 64. 4 58. 1 6. 61964 135. 7 128. 7 6r 7 63. 0 7. 01965 144. 4 137. 0 69. 2 67. 8 7. 41966 164. 9 156. 8 80. 2 76. 6 8. 11967 188. 8 180. 1 95. 0 85. 1 8. 71968_ 210. 0 200. 2 105. 3 94. 9 9. 81969 222. 6 212. 1 108. 5 103. 6 10. 5Federal:1962 67. 5 6a.4 39. 1 24. 3 4. 11963 68. 7 64. 2 39. 0 25. 3 4. 41964 69. 9 65. 2 38. 0 27. 2 4. 71965 71. 9 66. 9 38. 4 28. 5 5. 01966 83. 3 77. 8 45. 2 32. 6 5. 51967 96. 6 90. 7 54.8 35. 9 5. 91968 106. 1 99. 5 60. 0 b9.5 6. 61969 108.4 101.3 59.2 42.1 7.1
State and local:1962 55. 7 53. 7 23. 3 30. 4 1. 91963 60. 4 58. 2 25. 4 32. 9 2. 11964 65. 8 63. 5 27. 7 35. 9 2. 31965 72. 4 70. 1 30. 8 39. 3 2. 41966 81. 6 79. 0 35. 0 44. 0 2. 61967 92. 2 89. 4 40. 2 49. 2 2. 81968 103. 9 100. 7 45. 3 55. 4 3. 21969 114. 2 110. 8 49. 3 61. 5 3. 4
BOUM% Manpower Report of the President, 1971, table 0-10. p. 326.
60 ECONOMIC AND SOCIAL CONDITION OF RURAL AMERICA
Employment Resulting from Government Purchases of Goodsand Services, and Employment in Government Enterprises,1962-69
Public and private employment resulting from Government pur-chases of goods and services, as well as employment in Governmententerprises, totaled about 30 percent of U.S. employment in 1969, andmore than the total of rural jobs. Eleven million were Federal em-ployees and about 13 million State and local, a ratio that has remainedabout the same since 1962.
81
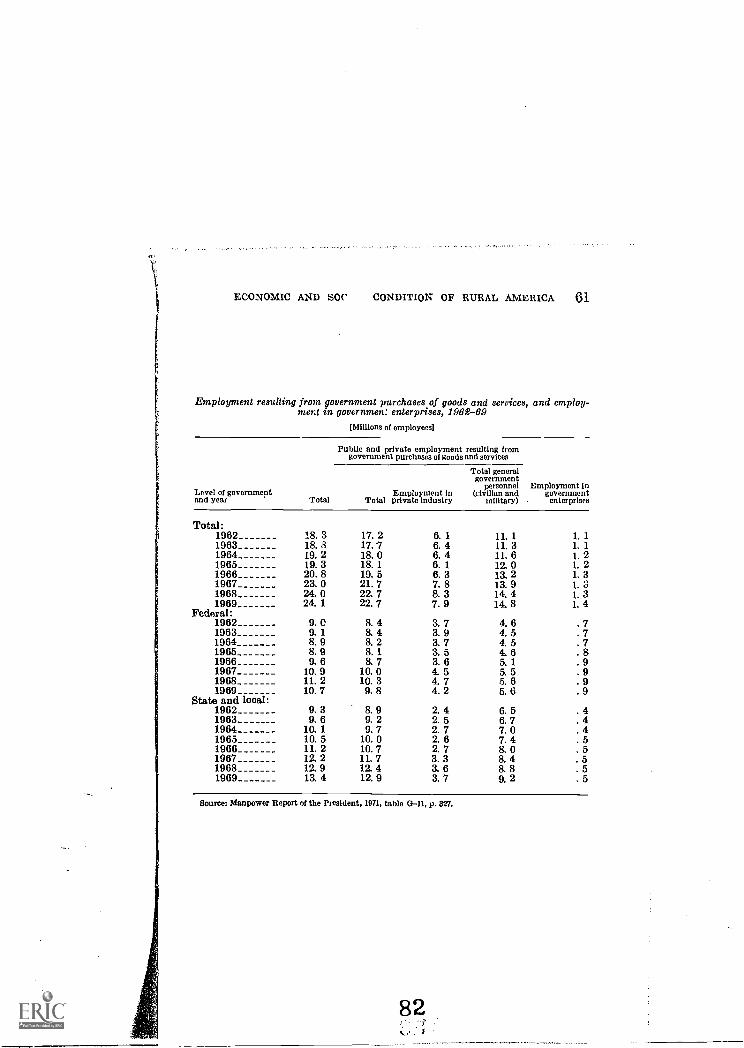
ECONOMIC AND SOC CONDITION OF RURAL AMERICA 61
Employment resulting from government purchases of goods and services, and employ-ment in gov6rnmen." enterprises, 1962-69
[Millions of employees]
Public and private employment resulting fromgovernment purchases of goods and services
Level of governmentand year Total
Employment InTotal private industry
Total generalgovernment
personnel(civilian and
military)
Employment ingovernment
enterprises
Total:1962 18. 3 17. 2 6. 1 11. 1 1. 11963 18. 8 17. 7 6. 4 11. 3 1. 11964 19. 2 18. 0 6. 4 11. 6 1. 21965 19. 3 18. 1 6. 1 12. 0 1. 21966 20. 8 19. 5 6. 3 13. 2 1. 31967 23. 0 21. 7 7. 8 13. 9 1. 31968 24. 0 22. 7 8. 3 14. 4 1. 31969 24. 1 22. 7 7. 9 14. 8 1. 4
Federal:1962 9. C 8. 4 3. 7 4. 6 . 71963 9. 1 8. 4 3. 9 4. 5 .71964 8.9 8.2 3.7 4.5 .71965 8. 9 8. 1 3. 5 4. 6 . 81966 9. 6 8. 7 3. 6 5. 1 .91967 10. 9 10. 0 4.5 5.5 .91968 11. 2 10. 3 4.7 5. 6 .91969 10. 7 9. 8 4. 2 5. 6 .9
State and local:1962 9. 3 8. 9 2. 4 6. 5 .41963 9. 6 9. 2 2. 5 6. 7 .41964 10. 1 9. 7 2. 7 7. 0 .41965 10. 5 10. 0 2. 6 7.4 .51966 1L 2 10. 7 2. 7 8. 0 .51967 12. 2 11. 7 3. 3 8. 4 . 51968 12. 9 12. 4 3. 6 8. 8 . 51969 13. 4 12. 9 3.7 9. 2 .5
Source: Manpower Report of the President, 1971, table 0-11, p. 327.
82
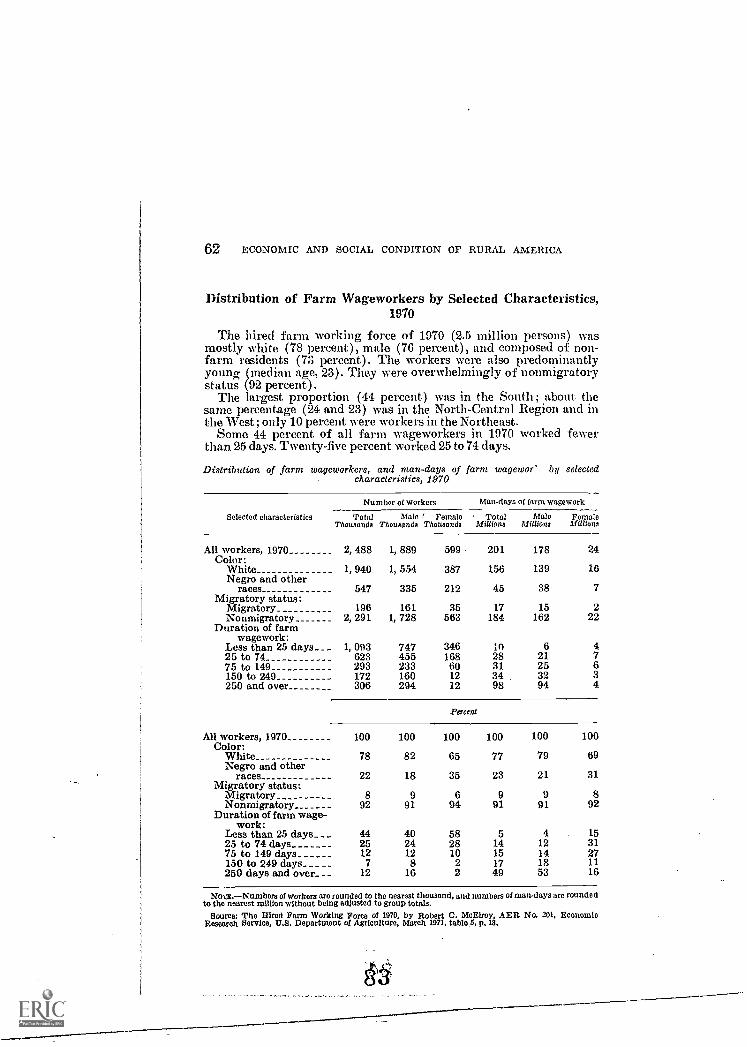
62 ECONOMIC AND SOCIAL CONDITION OF RURAL AMERICA
Distribution of Farm Wageworkers by Selected Characteristics,1970
The hired farm working force of 1970 (2.5 million persons) wasmostly white (78 percent), male (76 percent), and composed of non-farm residents (73 percent). The workers were also predominantlyyoung (median age, 23). They were overwhelmingly of nonmigratorystatus (92 percent).
The largest proportion (41 percent) was in the South ; about thesame percentage (21 and 23) was in the North-Central Region and inthe West ; only 10 percent were workers in the Northeast.
Some 41 percent of all farm wageworkers in 1970 worked fewerthan 25 days. Twenty-five percent worked 25 to 74 days.
Distribution of farm wageworkers, and man-days of farm wagewor* by selectedcharacteristics, 1970
Number of workers Man-days of farm wagework
Selected characteristics Total Male / FemaleThousands Thousands Thousands
TotalMillions
AloisMillions
FemaleMillions
All workers, 1970 2, 488 1, 889 599 201 178 24Color:
White 1, 940 1, 554 387 156 139 16Negro and other
races 547 335 212 45 38 7Migratory status:
Migratory 196 161 35 17 15 2Nonmigratory 2, 291 1, 728 563 184 162 22
Duration of farmwagework:
Less than 25 days_ _ _ 1, 093 747 346 10 6 425 to 74 623 455 168 28 21 775 to 149 293 233 60 31 25 6150 to 249 172 160 12 34 32 3250 and over 306 294 12 98 94 4
Percent
All workers, 1970 100 100 100 100 100 100Color:
White 78 82 65 77 79 69Negro and other
races 22 18 35 23 21 31Migratory status:
Migratory 8 9 6 9 9 8Nonmigratory 92 91 94 91 91 92
Duration of farm wage-work:
Less than 25 days_ _ _ 44 40 58 5 4 1525 to 74 days 25 24 28 14 12 3175 to 149 days 12 12 10 15 14 27150 to 249 days 7 8 2 17 18 11250 days and over.. _ _ 12 16 2 49 53 16
NO'41E.Numbers of workers are rounded to the nearest thousand, and numbers of man-days are roundedto the nearest million without being adjusted to group totals.
Source: The Hired Farm Working Force of 1970, by Robert C. McElroy, AER. No. 201, EconomicResearch Service, U.S. Department of Agriculture, March 1971, table 5, p. 13.
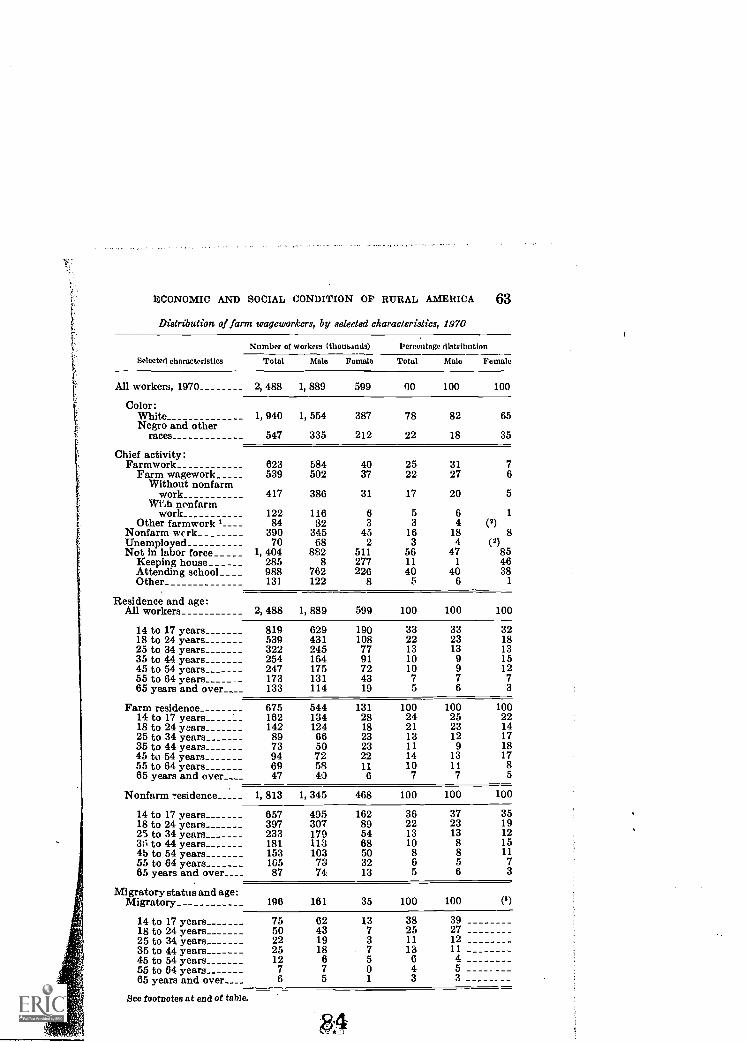
ECONOMIC AND SOCIAL CONDITION OF RURAL AMERICA
Distribution of farm wageworkers, by selected characteristics, 1970
63
Number of workers (thousands) Percentage distribution
Selected characteristics Total Maio Female Total Maio Female
All workers, 1970 2,488 1,889 599 00 100 100
Color:White 1, 940 1, 554 387 78 82 65Negro and other
races 547 335 212 22 18 35
Chief activity:Farmwork 623 584 40 25 31 7
Farm wagework 539 502 37 22 27 6Without nonfarm
work 417 386 31 17 20 5With ncmfarm
work 122 116 6 5 6 1
Other formwork' 84 82 3 3 4 (2)Nonfarm wcrk 390 345 45 16 18 8Unemployed 70 68 2 3 4 (2)Not in labor force 1, 404 882 511 56 47 85
Keeping house 285 8 277 11 1 46Attending school_ _ 988 762 226 40 40 38Other 13] 122 8 5 6 1
Residence and age:All workers 2, 488 1, 889 599 100 100 100
14 to 17 years 819 629 190 33 33 3218 to 24 years 539 431 108 22 23 1825 to 34 years 322 245 77 13 13 1335 to 44 years 254 164 91 10 9 1545 to 54 years 247 175 72 10 9 1255 to 64 years 173 131 43 7 7 765 years and over____ 133 114 19 5 6 3
Farm residence 675 544 131 100 100 10014 to 17 years 162 134 28 24 25 2218 to 24 years 142 124 18 21 23 1425 to 34 years 89 66 23 13 12 1735 to 44 years____ 73 50 23 11 9 1845 to 54 years 94 72 22 14 13 1755 to 64 years 69 58 11 10 11 865 years and over 47 10 6 7 7 5
Nonfarm ' esidence 1,813 1,345 468 100 100 100
14 to 17 years 657 495 162 36 37 3518 to 24 years 397 307 89 22 23 1925 to 34 years 233 179 54 13 13 123; to 44 years 181 113 68 10 8 154b to 54 years 153 103 50 8 8 1155 to 64 years 1G5 73 32 6 5 765 years and over 87 74 13 5 6 3
Migratory status and age:Migratory 196 161 35 100 100 (3)
14 to 17 years 75 62 13 38 3918 to 24 years 50 43 7 25 2725 to 34 years 22 19 3 11 1235 to 44 years 25 18 7 13 11 _ ______ _45 to 54 years 12 6 5 6 455 to 64 years 7 7 0 4 565 years and over 6 5 1 3 3
See footnotes at end of table.
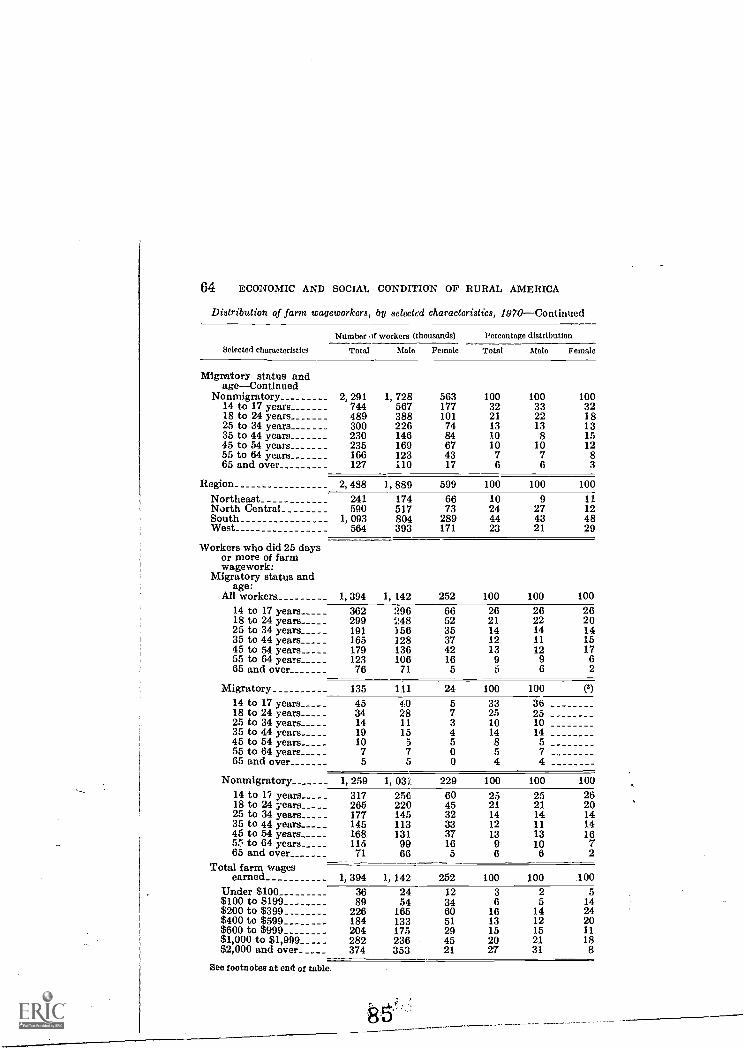
64 ECONOMIC AND SOCIAL CONDITION OF RURAL AMERICA
Distribution of farm wageworkers, by selected characteristics, 1970Continued
Selected characteristics
Number of workers (thousands) Percentage distribution
Total Male Female Total Male 'vernal°
Migratory status andageContinued
Nonmigratory 2, 291 1, 728 563 100 100 10014 to 17 years 744 567 177 32 33 3218 to 24 years 489 388 101 21 22 1825 to 34 years 300 226 74 13 13 1335 to 44 years 230 146 84 10 8 1545 to 54 years 235 169 67 10 10 1255 to 64 years 166 123 43 7 7 865 and over 127 110 17 6 6 3
Region 2,488 1,889 599 100 100 100
Northeast 241 174 66 10 9 11North Central 590 517 73 24 27 12South 1, 093 804 289 44 43 48West 564 393 171 23 21 29
Workers who did 25 daysor more of farmwagework:
Migratory status andage:
All workers 1, 394 1, 142 252 100 100 100
14 to 17 years 362 2,96 66 26 26 2618 to 24 years 299 248 52 21 22 2025 to 34 years 191 356 35 14 14 1435 to 44 years 165 128 37 12 11 1545 to 54 years 179 136 42 13 12 1755 to 64 years 123 106 16 9 9 665 and over 76 71 5 5 6 2
Migratory 135 1.11 24 100 100 (3)
14 to 17 years 45 4.0 5 33 3618 to 24 years 34 28 7 25 2525 to 34 years 14 11 3 10 1035 to 44 years 19 15 4 14 1445 to 54 years 10 5 5 8 555 to 64 years 7 7 0 5 765 and over 5 5 0 4 4
Nonmigratory 1, 259 1, 031 229 100 100 100
14 to 17 years-__ - _ 317 256 60 25 25 2618 to 24 years 265 220 45 21 21 2025 to 34 years 177 145 32 14 14 1435 to 44 years 145 113 33 12 11 1145 to 54 years 168 131 37 13 13 165; to 64 years 115 99 16 9 10 765 and over 71 66 5 6 6 2
Total farm wagesearned 1, 394 1, 142 252 100 100 100
Under $100 36 24 12 3 2 5$100 to $199 89 54 34 6 5 14$200 to $399 226 165 60 16 14 24$400 to $599 184 133 51 13 12 20$600 to $999 204 175 29 15 15 11$1,000 to $1,999 282 236 45 20 21 18$2,000 and over 374 353 21 27 31 8
See footnotes at end of table.
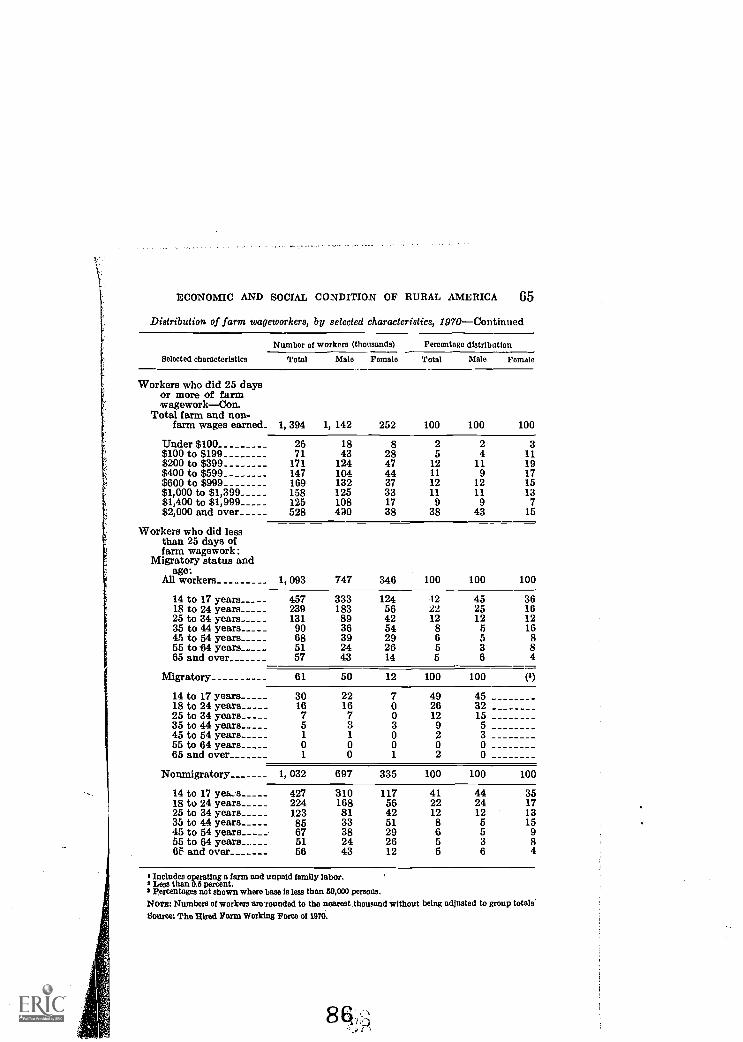
ECONOMIC AND SOCIAL CONDITION OF RURAL AMERICA 65
Distribution of farm wageworkera, by selected characteristics, 1970Continued
Number of workers (thousands) Percentage distribution
Selected characteristics Total Male Female Total Male Female
Workers who did 25 daysor more of farmwageworkCon.
Total farm and non-farm wages earned_ 1, 394 1, 142 252 100 100 100
Under $100 26 18 8 2 2 3$100 to $199 71 43 28 5 4 11$200 to $399 171 124 47 12 11 19$400 to $599 147 104 44 11 9 17$600 to $999 169 132 37 12 12 15$1,000 to $1,399 158 125 33 11 11 13$1,400 to $1,999 125 108 17 9 9 7$2,000 and over 528 00 38 38 43 15
Workers who did lessthan 25 days offarm wagework:
Migratory status andage:
All workers 1,093 747 346 100 100 100
14 to 17 years__ 457 333 124 12 45 3618 to 24 years 239 183 56 22 25 1625 to 34 years 131 89 42 12 12 1235 to 44 years 90 36 54 8 5 1645 to 54 years 68 39 29 6 5 855 to 84 years 51 24 26 5 3 865 and over 57 43 14 5 6 4
Migratory 61 50 12 100 100 (3)
14 to 17 years 30 22 7 49 4518 to 24 years 16 16 0 26 3225 to 34 years 7 7 0 12 1535 to 44 years 5 3 3 9 545 to 54 years 1 1 0 2 355 to 64 years 0 0 0 0 065 and over 1 0 1 2 0
Nonmigratory 1, 032 697 335 100 100 100
14 to 17 yet...s 427 310 117 41 44 3518 to 24 years 224 168 56 22 24 1725 to 34 years 123 81 42 12 12 1335 to 44 years 85 33 51 8 5 1545 to 54 years 67 38 29 6 5 955 to 64 years_.._ 51 24 26 5 3 865 and over 56 43 12 5 6 4
I Includes operating a farm and unpaid family labor.3 Less than 0.5 percent.s Percentages not shown where base is leas than 50,000 persons.NOTE: Numbers of workers are rounded to the nearest. thousand without being adjusted to group totalsSource: The Hired Farm Working Force of 1970,

66 ECONOMIC AND SOCIAL CONDITION OF RURAL AMERICA
Average Number of Days Worked and Wages Earned per Day atFarm and Nonfarm Wagework, for All Farm Wageworkers,1960 and 1965-70
The number of all farm wageworkers has declined from 3.7 millionin 1960 to 2.5 million in 1970, reflecting the continued growth ofmechanization in agriculture.
Although the number of days worked per year in farm and nonfarmwork has fluctuated and sometimes decreased, the wages earned perday have increased from 1960 to 1970. For farmwork, wages per dayhave gone up from :;6.25 in 1960 to $11.10 in 1970; for nonfarm work,from $8.50 to $16.35. The steady increase in daily wage levels hasbrought yearly wages up in each year except for nonfarm work in 1967and 1968.
Although yearly earnings for farm and nonfarm work doubled be-tween 1960 and 1970, the average annual earnings in 1970 for 127days worked were only $1,640.
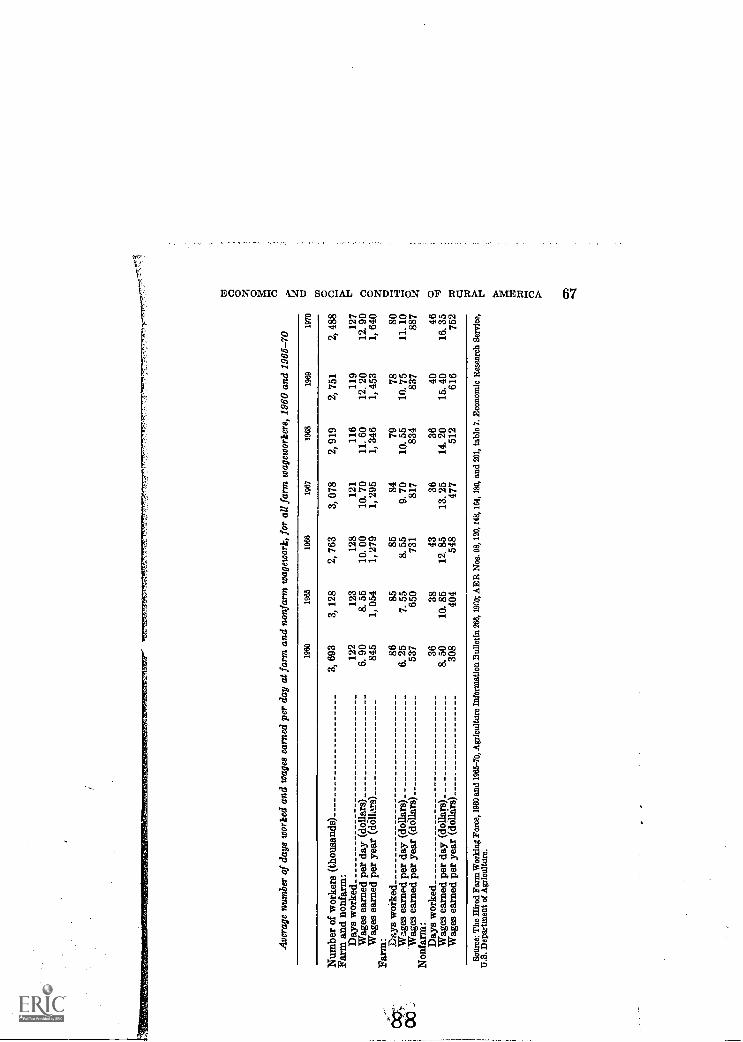
Ave
rage
num
ber
of d
ays
wor
ked
and
wag
es e
arne
d pe
r da
y at
far
m a
nd n
onfa
rm w
agew
ork,
for
all
farm
wag
ewor
kers
, 196
0 an
d 19
65-7
0
1960
1965
1966
1967
1968
1969
1970
Num
ber
of w
orke
rs (
thou
sand
s)3,
693
3, 1
282,
763
3, 0
782,
919
2, 7
512,
488
Farm
and
non
farm
:D
ays
wor
ked
122
123
128
121
116
119
127
Wag
es e
arne
d pe
r da
y (d
olla
rs)
6. 9
08.
55
10. 0
010
. 70
11. 6
012
. 20
12. 9
0W
ages
ear
ned
per
year
(do
llars
)84
51,
054
1, 2
791,
295
1, 3
461,
453
1, 6
40Fa
rm: Day
s w
orke
d86
8585
8479
7880
Wag
es e
arne
d pe
r da
y (d
olla
rs)
8. 2
57.
55
8. 5
59.
70
10. 5
510
. 75
11. 1
0W
ages
ear
ned
per
year
(do
llars
)53
765
073
181
783
483
788
7N
onfa
rm:
Day
s w
orke
d36
3843
3836
4046
Wag
es e
arne
d pe
r da
y (d
olla
rs)
8. 5
010
. 85
12. 8
513
. 25
14. 2
015
. 40
16. 3
5W
ages
ear
ned
per
year
(do
llars
)30
840
454
847
751
261
675
2
Sour
ce: T
he H
ired
Far
m W
orki
ng F
orce
, 196
0 an
d 19
65-7
0, A
gric
ultu
re I
nfor
mat
ion
Bul
letin
266
, 19C
0; A
ER
Nos
. 98,
120
, 148
, 164
, 180
, and
201
, tab
le 7
. Eco
nom
ic R
esea
rch
Serv
ice,
U.S
. Dep
artm
ent o
f A
gric
ultu
re.
68 ECONOMIC AND SOCIAL CONDITION OF RURAL AMERICA
Unemployment Rates by Major Industry Group: AnnualAverages, 1950-70 (Selected Years)
Unemployment rates for all experienced wage and salary workersi6 years of age and over in the 1950's and 1960's have ranged from alow of 3.3 in 1952 to a high of 7.3 in 1958.
During this period of two decades, unemployment rates in agri-culture have remained consistently higher than in nonagriculturalindustries.
In the accompanying table, unemployed experienced wage andsalary workers are those whose last full-time job of at least 2 weeks'duration was as a wage and salary worker in agriculture or in a non-agricultural industry (including Government).
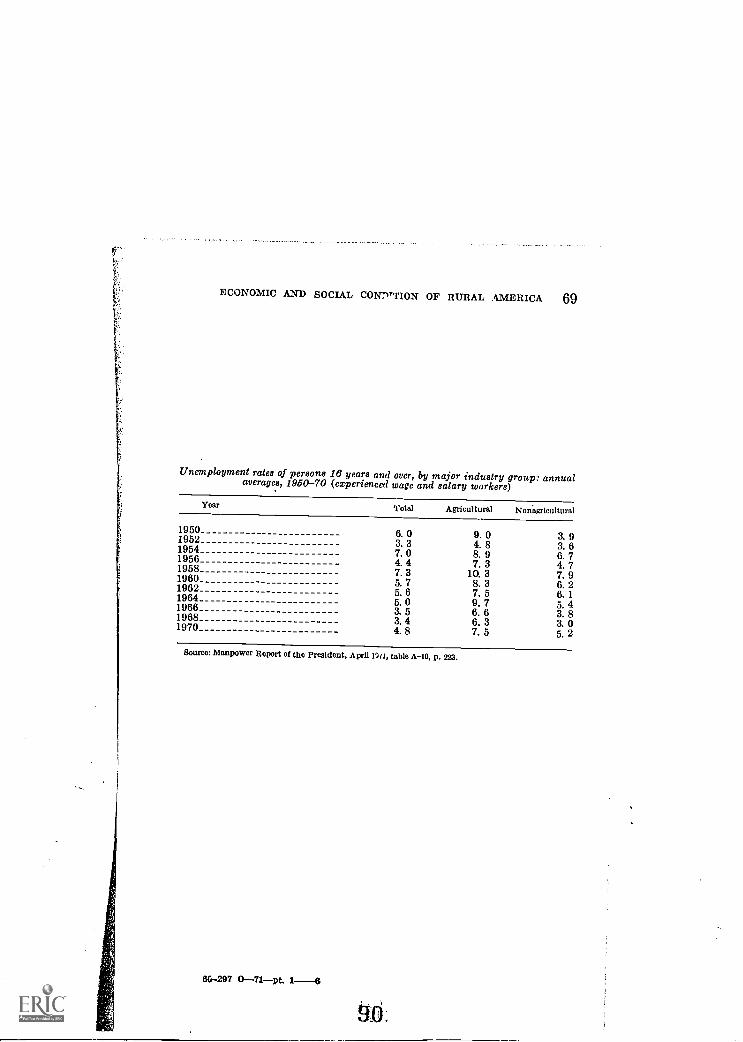
ECONOMIC AND SOCIAL CONnITION OF RURAL AMERICA 69
Unemployment rates of persons 16 years and over, by major industry group: annualaverages, 1950-70 (experienced wage and salary workers)
Year Total Agricultural Nonbgrleultund
1950195219541956
6. 03. 37.04. 4
9. 04. 88.97. 3
3. 93. 66.74. 71958
19607. 3 10.3 7. 95.7 8.3 6.1962 5. 6 7. 5 6. 11964
1966 5. 0 9. 7 5. 43. 5 6. 6 3. 81968 3. 4 6. 3 3. 01970 4. 8 7. 5 5. 2
Source: Manpower Report of tho President, April 12n, table A-16, p. 223.
60-297 0-71-pt. 1--6
70 ECONOMIC AND SOCIAL CONDITION OF RURAL AMERICA
Indexes of Output Per Man-Hour, 1950-70
Productivity, as measured by indexes of output per man-hour, hasrisen much more in the farm sector in the past two decades than in thenonfarm. 8tarting from an index of 37.7 in 1950, farm output perman-honr went up by 75.4 points to 113.1 in 1970, whereas nonfarm output rose by 38.8 points, from 65.0 in 1950 to 103.8 in 1970.
On a 1967 base of 100, farm productivity had outpaced nonfarmby 1969 when the farm index of output was 107.3 and nonfarm was103.2. By 1970, the farm figure was considerably higher than nonfarm.
9
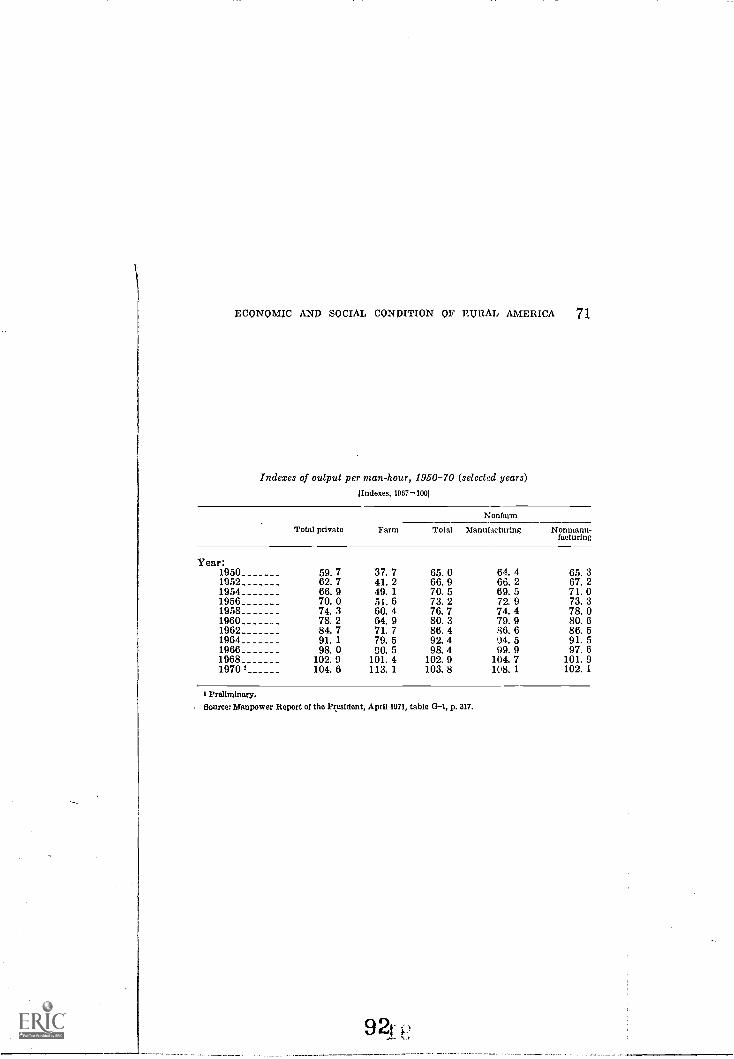
ECONOMIC AND SOCIAL CONDITION OF RURAL AMERICA 71
Indexes of output per man-hour, 1950-70 (selected years)[Indexes, 1967=100]
Total private
Nonfarm
Farm Total Manufacturing Nonmanu-lecturing
Year:1950 59. 7 37. 7 65. 0 64. 4 65. 31952 62. 7 41. 2 66. 9 66.2 67. 21954 66. 9 49. 1 70. 5 69. 5 71. 01956 70. 0 51. 6 73. 2 72. 9 73. 31958 74. 3 60. 4 76. 7 74. 4 78. 01960 78. 2 64. 9 80. 3 79. 9 80. 61962 84. 7 71. 7 86. 4 86.6 86. 51964 91. 1 79. 5 92. 4 94. 5 91. 51966 98. 0 90.5 98. 4 99. 9 97. 61968 102. 9 101. 4 102. 9 104. 7 101. 91970 1 104. 6 113. 1 103.8 108. 1 102. 1
Preliminary.Source: Manpower Report of the President, April 1971, table 0-1, p. 317.
92t t:

ti
ECONOMIC AND SOCIAL CONDITION OF RURAL AmERICA7. 7
III. HEALTH AND EDUCATIONAmong the deficits in social overhead in nonmetropolitan areas is the
quality of both medical care and education. Tools to measure qualityare difficult to find. However, available evidence indicates that metroareas surpass nonmetro in certain kinds of health care and in someaspects of the educational process.
In general, most rural areas fare quite well in terms of availability ofgeneral practitioners and hospital beds, but they suffer in comparisonwith urban centers when it comes to specialized services and fullyaccredited hospitals. Generally lower rural income also places ruralareas at a disadvantage in providing quality medical care.
In the field of education, there is essentially no rural-urban differencein median years of school completed up to about 12 years of schooling.It is in post-high school education, primarily, that metro areas havethe better record. To the extent that a college education adds signifi-cantly to average lifetime income, the relative deficit in higher educa-tion in nonmetro areas constitutes a substantial disadvantage.
Other aspects of quality education which compare unfavorably innonmetro areas as compared with cities include : the very small sizeof many rural school systems, less variety in the curriculum, andfewer specialized educational services, especially those requiring lab-oratory or other costly equipment.
As the costs of medical care and educatiot. continue their steepupward climb, the income position of nonmetro areas and their abilityto provide these services become increasingly critical factors influenc-ing the quality of rural living. Rural communities are not now com-petitive with larger centers in providing quality health care andeducation.
93
74 ECONOMIC AND SOCIAL CONDITION OF RIMAL .LMERICA
Physicians and Hospital Beds by Metropolitan Status,United States, 1969
Medicine today is an increasingly specialized field, and most Amer-icans turn to specialists when they need help. Rural people have aboutequal access to general practitioners and hospital beds as do metropoli-tan Americans, except in areas of extremely sparse population.
But rural people face long hours of traveling to see a specialist. Newand more effective ways of providing services of specialists are neededin areas where the population is too sparse to keep them busy andincomes are too low to attract them,
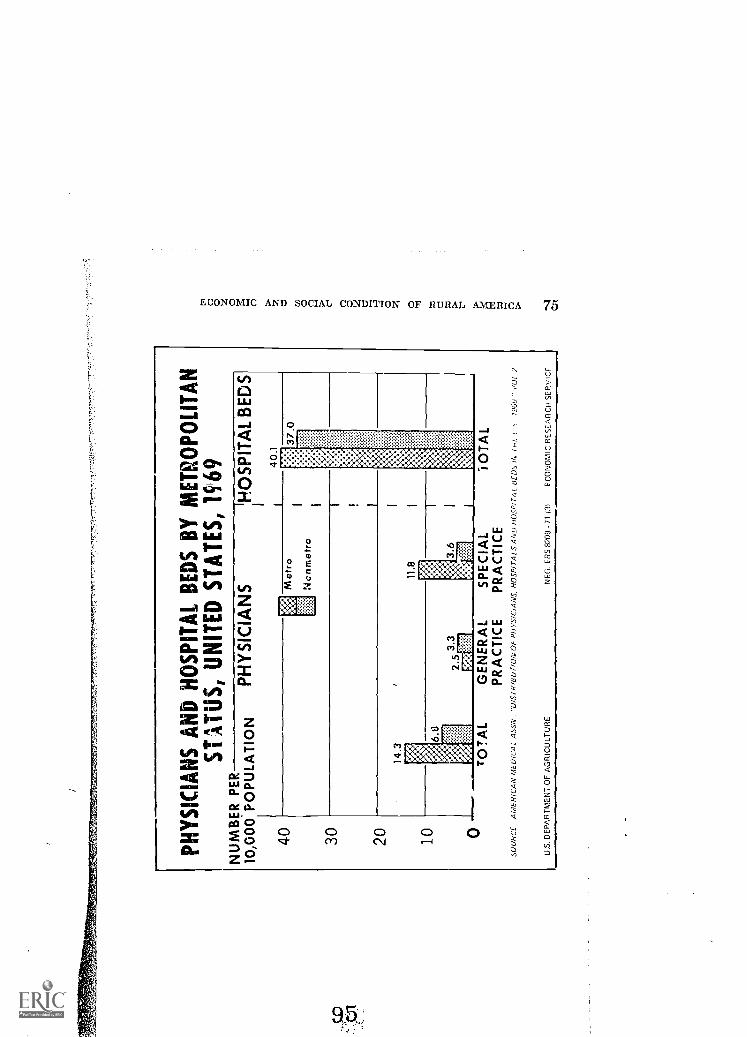
PH
YS
ICIA
NS
AN
D H
OS
PIT
AL
BE
DS
BY
ME
TR
OP
OLI
TA
NS
T1T
US
, UN
ITE
D S
TA
TE
S, l
gi'6
9N
UM
BE
R P
ER
10,0
00 P
OP
ULA
TIO
NP
HY
SIC
IAN
S'H
OS
PIT
AL
BE
DS
40.1
40 30 20 10 0T
OT
AL
GE
NE
RA
LS
PE
CIA
LP
RA
CT
ICE
PR
AC
TIC
ES
OU
RC
E A
ME
RIC
AN
ME
DIC
AL
AS
SN
. "D
IST
RIS
L/T
I011
t OF
PH
YS
ICIA
NS
. HO
SP
ITA
LS A
ND
HO
SP
ITA
L R
ED
S IN
IpL
1959
VO
L 2
OT
AL
U.S
. DE
PA
RT
ME
NT
OF
AG
RIC
ULT
UR
EN
EG
ER
S 8
209
-71
131
EC
ON
OM
IC R
ES
EA
RC
H S
ER
VIC
F
76 ECONOMIC AND SOCIAL CONDITION OF RURAL AMERICA
Health Personnel per 100,000 Population
The more rural a county the poorer its health care services are likelyto be. Lower income and sparse population make it difficult for thesecounties to compete with metropolitan areas.
High and rapidly rising costs of modern medical equipment andservices increase the disadvantage of rural areas.
Rural counties have about as many general practitioners as metro-politan counties, but fewer other professionals.
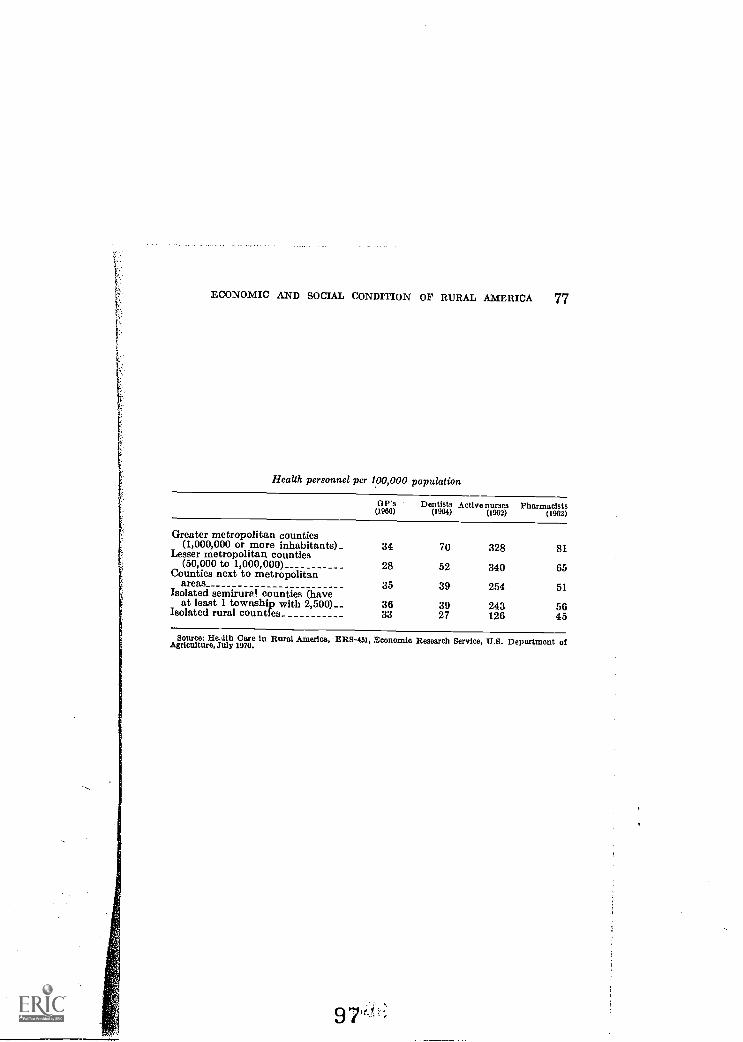
ECONOMIC AND SOCIAL CONDITION OF RURAL AMERICA 77
Health personnel per 100,000 population
GP's(1060)
Dentists Active nurses(1964) (1962)
Pharmacists(1962)
Greater metropolitan counties(1,000,000 or more inhabitants)_ 34 70 328 81Lesser metropolitan counties(50,000 to 1,000,000) 28 52 340 65Counties next to metropolitanareas 35 39 254 51Isolated semirural counties (haveat least 1 township with 2,500) 36 39 243 56Isolated rural counties 33 27 126 45
Source: HeAth Care in Rural America, ERS-451, Economic Research Service, U.S. Department ofAgriculture, July 1970.
9 7'1',
A
78 ECONOMIC AND SOCIAL C014DITION OF RURAL AMERICA
Nonmetro Shortage in Medical Specialists and AccreditedHospitals
Medical specialists are in particularly short supply in isolated ruralareas.
Rural counties often have more hospitals than urban counties, butthey usually are smaller, more often inadequately staffed, poorlyequipped, and lacking in out-patient and extended care facilities.
The proportion of hospitals accredited by the Joint Commission onAmerican Hospitals in 1966 was much lower in nonmetro countiesthan in metro counties with central cities.
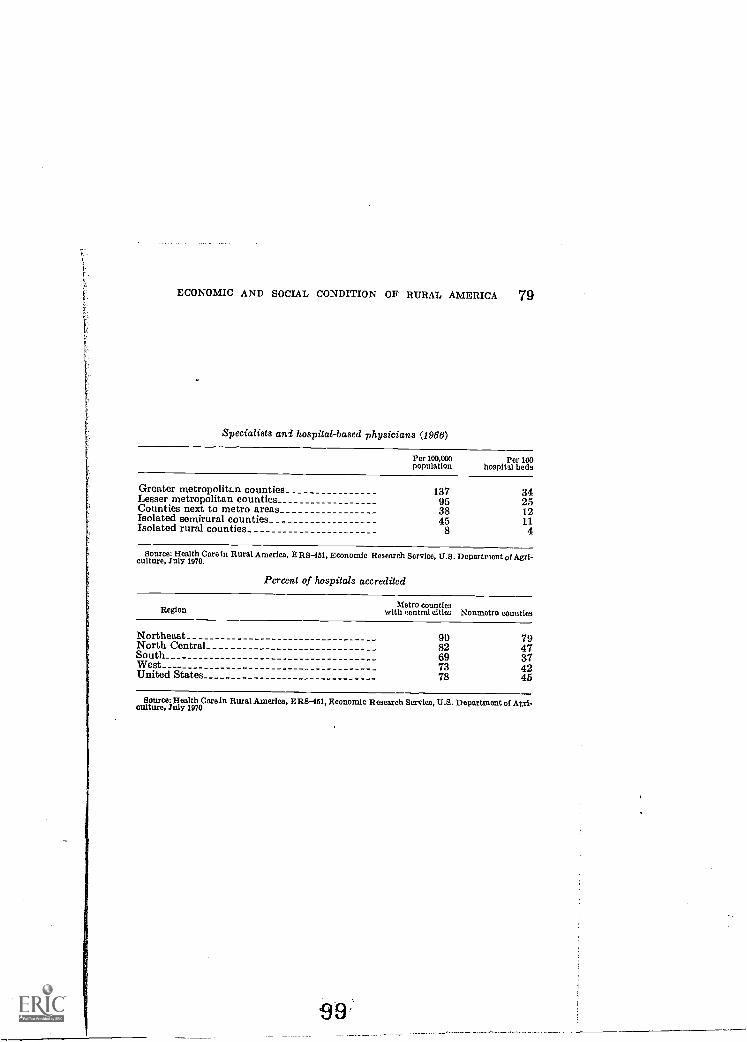
ECONOMIC AND SOCIAL CONDITION OF RURAL AMERICA 79
Specialists and hospital-based physicians (1966)
Per 100,000 Per 100population hospital beds
Greater metropolitan counties 137 34Lesser metropolitan counties 95 25Counties next to metro areas 38 12Isolated semirural counties 45 11Isolated rural counties 8 4
Source: Health Caro in Rural America, E RS-461, Economic Research Service, U.S. Department of Agri-culture, July 1070.
Percent of hospitals accredited
RegionMetro counties
with central cities Nonmetro counties
Northeast 90 79North Central 82 47South 69 37West 73 42United States 78 45
Source: Health Care In Rural America, E RS-461, Economic Research Service, U.S. Department of Agri-culture, July 1970
.9 9
80 ECONOMIC AND SOCIAL CONDITION OF RURAL AMERICA
Location of Physicians, Dentists, Hospital Beds and NursingHome Beds, South Dakota
While the availability of general practitioners and hospital beds isgenerally adequate in nonmetropolitan areas, there are portions ofthe country in which there is a shortage. In parts of 'he Great Plains,where the population is relatively sparse, doctors, dentists, hospitaland nursing home beds are scarce.
In Sough Dakota, for example, there were 11 counties in the mid-1960's in which there were no doctors, and 16 counties which had nodentists. This is at least partly due to the fact that doctors and dentists,formerly widely scattered, are now concentrating in the larger towrsand cities. .
There are some 26 counties with no nursing home bads available.This is important in view of the rowing proportion of older peoplein this area. Nearly all of the nursing homes are located in the smallertowns near the centers where doctors and hospitals are located.
There were four counties in South Dakota with no physicians, den-tists, hospital or nursing home beds. The concentration of these medi-cal resources tends to be within certain counties and largely in theeastern portion of the State.
iqg
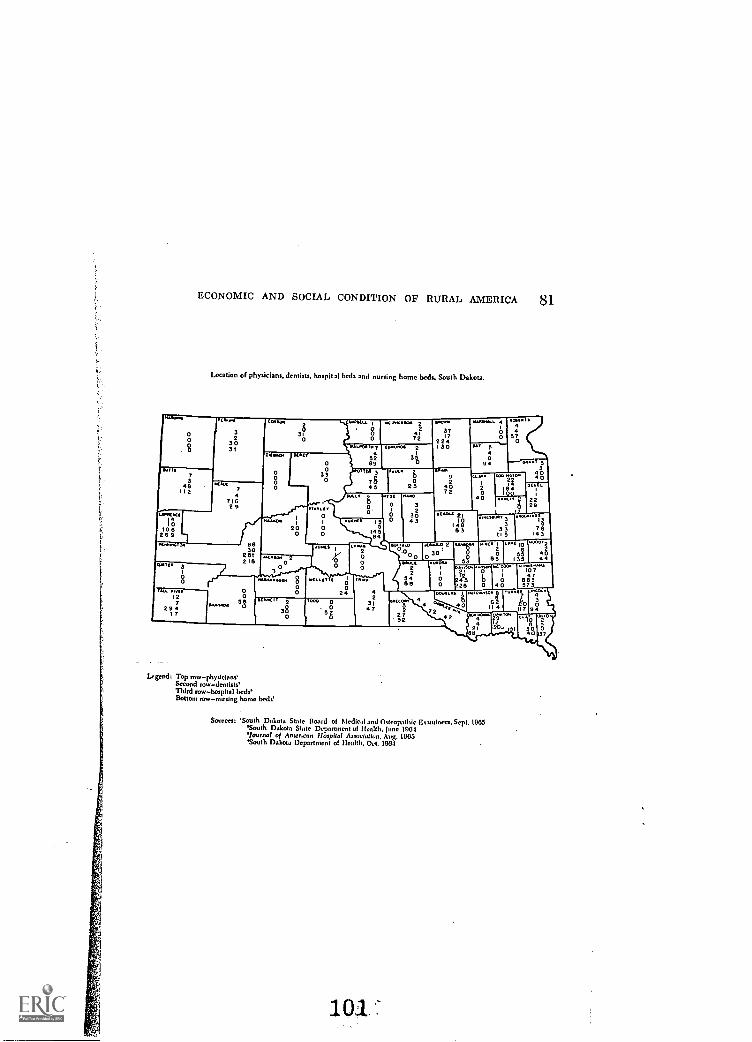
U.
ECONOMIC AND SOCIAL CONDITION OF RURAL AMERICA 81
Location of physicians, dentists, hospit at beds and nursing home beds, South Dakota.
0000
73
481 1 2
3
3031
LONOCOOf140
106269
KU(
471629
wart.
00
mytof127
2 9 417
6630
251216
0
1S Yta,
0000
j20
0
144C60.
9172
to.unoa
52
330
00
0Of AAAAA
00
...ass. 20
JO
0
0
2 ?
" 1"OO
Ltgend: Top rowphyslcIoneSecond row dentists'Third rowhospital beds'Bottom rownursing home beds'
55
19564
42
317
350
WAII
37
2213 0
X301.1. 4
00
u. 6
3
303
1111
9
9072
Ooo
40
94
Ol.el0
Kota"
570
"" 2°Z°"A
0 regib,
vest. 21
11063
a
596
(VT2
2 752
0100.
00
526
72 44 2
GM
333
1 1 5
<WANT 53
9 090
2229
a
17 3
a, 55 9065 135 4.
bO 0
107663573
62 Po119 '12
12lan
X1If90. al
Sources: 'South Dakotu Stole Board of Medical and Osteopathic EX:11111,1M, Sept. 1963' South Dukotn Stole Department of Wrath, lone 1001' learned of American Hospital A.sociation, Aug. 1905'South Dakota Department of Health, 00. 1964
101
094
"Vg
?4B
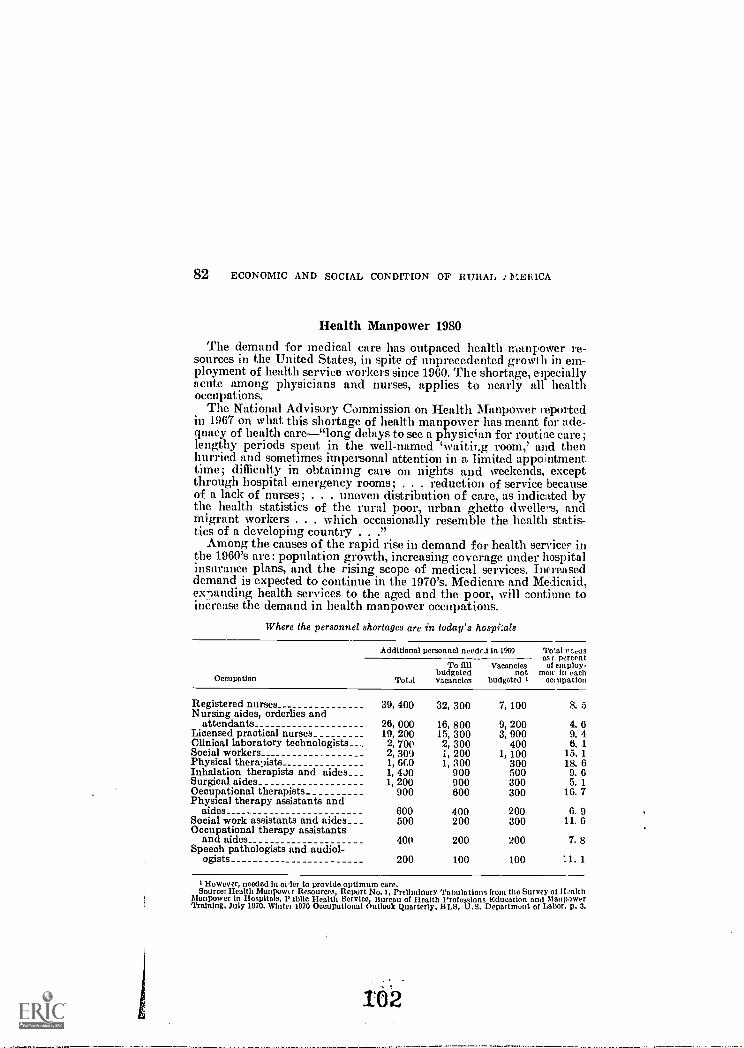
82 ECONOMIC AND SOCIAL CONDITION OF RURAL i MER ICA
Health Manpower 1980
The demand for medical care has outpaced health manpower re-sources in the United States, in spite of unprecedented growth in em-ployment of health service workers since 1960. The shortage, e3peciallyacute among physicians and nurses, applies to nearly all healthoccupations.
The National Advisory Commission on Health Manpower reportedin 1967 on what this shortage of health manpower has meant for ade-quacy of health care"long delays to see a physician for routine care;lengthy periods spent in the well-named `waitir.g, room,' and thenhurried and sometimes impersonal attention in a limited appointmenttime; difficulty in obtaining care on nights and weekends, exceptthrough hospital emergency rooms; . . . reduction of service becauseof a lack of nurses; . . . uneven distribution of care, as indicated bythe health statistics of the rural poor, urban ghetto dwellus, andmigrant workers . . . which occasionally resemble the health statis-tics of a developing country . . ."
Among the causes of the rapid rise in demand for health services inthe 1960's are: population growth, increasing coverage under hospitalinsurance plans, and the rising scope of medical services. Increaseddemand is expected to continue in the 1970's. Medicare and Medicaid,ex-landing health services to the aged and the poor, will continue toincrease the demand in health manpower occupations.
Where the personnel shortages are in today's hospitals
Occupation
Additional personnel needei in 1969 To'-al l':.clisDS t. percent
To fill Vacancies of employ -budgeted not men in each
Total vacancies budgeted I occupation
Registered nurses 39, 400 32, 300 7, 100 8. 5Nursing aides, orderlies and
attendants 26, 000 16, 800 9, 200 4. 6Licensed practical nurses_ 19, 200 15, 300 3, 900 9. 4Clinical laboratory technologists 2, 700 2, 300 400 6. 1Social workers 2, 300 1, 200 1, 100 15. 1Physical therapists 1, 6C0 1, 300 300 18. 6Inhalation therapists and aides__ _ 1, 4J0 900 500 9. 6Surgical aides 1, 200 900 300 5. 1Occupational therapists 900 600 300 16. 7Physical therapy assistants and
aides__ 600 400 200 6. 9Social work assistants and aides__ _ 500 200 300 11. 6Occupational therapy assistants
and aides 400 200 200 7. 8Speech pathologists and audiol-
ogists 200 100 100 11. 1
However, needed In oiler to provide optimum care.Source: Health Manpowtr Resources, Report No. 1, Preliminary Tabulations from the Survey of Iloalth
Manpower in Hospitals, 1' Mile Health Service, Bureau of Health Professions Education and ManpowerTraining, July 1970. Winter 1970 Occupational Outlook Quarterly, BLS, U.S. Department of Labor, p. 3.
102

An
aver
age
of 2
83,0
00 h
ealth
car
eer
jobs
will
ope
n up
eac
h ye
ar d
urin
g th
e 19
70's
Occ
upat
ion
Est
imat
edem
ploy
men
t,19
68
Proj
ecte
dre
galr
emea
ts,
1980
Ave
rage
ann
ual o
peni
ngs.
196
9-80
Perc
ent
chan
ge,
1968
-80
Tot
al
Cau
sed
byem
ploy
men
tch
ange
Cau
sed
byde
ath
and
retir
emen
t
Phys
icia
ns29
5, 0
0045
0, 0
0053
. 120
, 000
13, 0
007,
000
Ost
eopa
thic
phy
sici
ans
12, 0
0018
, 500
54. 2
800
500
300
Den
tists
_10
0, 0
0013
0, 0
0031
. 74,
900
2, 6
002,
300
Der
-al h
ygie
nist
s16
, 000
33, 5
0010
9. 4
2, 4
001,
500
900
Den
tal l
abor
ator
y te
chni
cian
s27
, 000
37, 5
0038
. 92,
100
900
1, 2
00R
egis
tere
d nu
rses
660,
000
1, 0
00, 0
0051
. 565
, 000
28, 0
0037
, 000
Opt
omet
rist
s17
, 000
21, 0
0023
. 580
030
050
0
E4
= C
D
Phar
mac
ists
Podi
atri
sts
Chi
ropr
acto
rs
121,
000
8, 5
0016
, 000
130,
000
9, 5
0019
, 000
7.0
11. 8
18. 8
4,40
020
090
0
700
100
250
3,70
010
065
0',W
Occ
upat
iona
l the
rapi
sts
7, 0
0019
, 000
171.
41,
500
1, 0
0050
0Ph
ysic
al th
erap
ists
14, 0
0036
, 000
157.
12,
800
1, 8
001,
000
Spee
ch p
atho
logi
sts
and
audi
olog
is18
, 000
33, 0
0083
. 32,
300
1, 3
001,
000
Med
ical
labo
rato
ry w
orke
rs10
0, 0
0019
0, 0
0090
. 012
, 800
7, 5
005,
300
Rad
iolo
gica
l tec
hnol
ogis
ts75
, 000
120,
000
60. 0
7, 3
003,
800
3, 5
00M
edic
al r
ecor
d lib
rari
ans
12, 0
0020
, 000
66. 7
1, 4
0070
070
0D
ietit
ians
30, 0
0042
, 100
40. 3
2, 7
001,
000
1, 7
00H
ospi
tal a
dmin
istr
ator
s15
, 000
22, 0
0046
. 790
0G
OO
300
Sani
tari
ans
10, 0
0014
, 000
41. 0
600
300
300
Vet
erin
aria
ns24
, 000
34, 0
0041
. 71,
400
800
600
Lic
ense
d pr
actic
al n
urse
s32
0, 0
0060
0, 0
0087
. 548
, 000
23, 0
0025
, 000
Hos
pita
l atte
ndan
ts80
0, 0
001,
500
, 000
87. 5
100,
000
58, 0
0042
, 000
Sour
ce. I
bid.
GO
84 ECONOMIC AND SOCIAL CONDITION OF RURAL AMERICA
Infant Mortality Rate by Color, County Group, and Per CapitaIncome Group of States; United States, 1961-65
Infant mortality rates are related to both place of residence andlevel of income, and the rate is highest in the most rural and povertystricken areas.
Even in the high per capita income States, the most rural countieshave an infant mortality rate nearly seven percentage points abovethe national average for that group of States.
For "nonwhite infants" in rural counties, even in the high incomeStates, infant mortality rates are more than twice as high as for allinfants in rural counties in that group of States.
104:
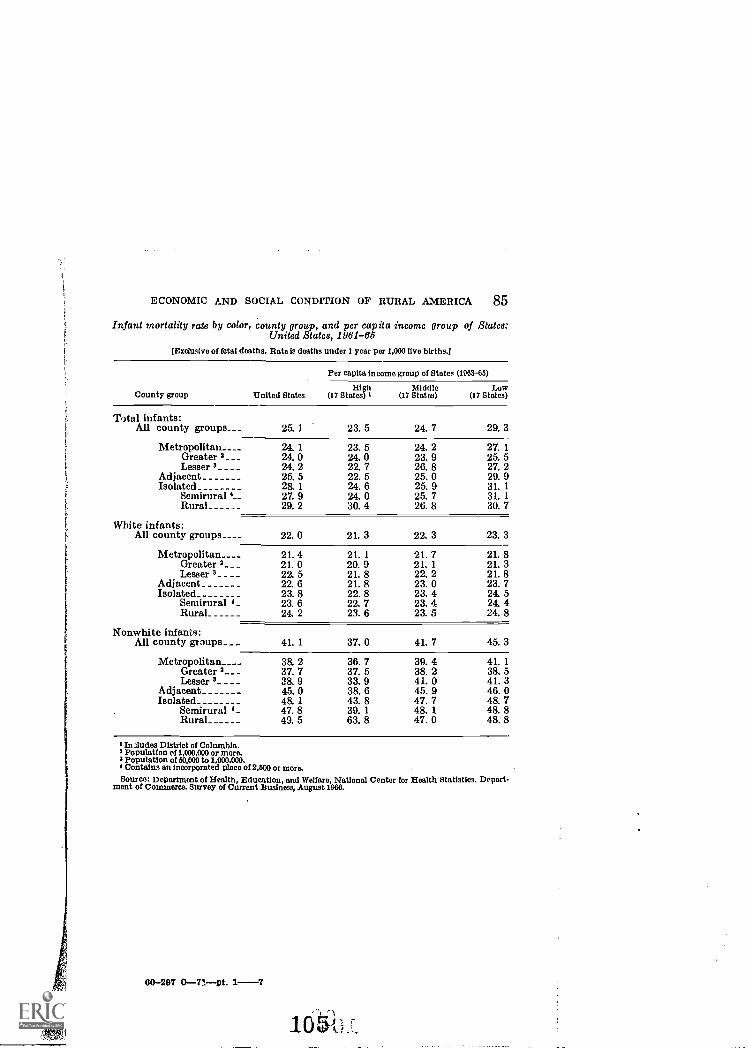
ECONOMIC AND SOCIAL CONDITION OF RURAL AMERICA 85
Infant mortality rate by color, county group, and per capita income group of States:United States, 1961-66
(Exclusive of fetal deaths. Rate is deaths under 1 year per 1,000 live births.]
County group
Per capita income group of States (1903-86)
United StatesHigh
(17 States) aMiddle
(17 States)Low
(17 States)
Total infants:All county groups___ 25.1 23.5 24.7 29. 3
Metropolitan____ 24. 1 23. 5 24. 2 27. 1Greater 2 - - - 24. 0 24. 0 23. 9 25. 5Lesser 8_ - - - 24. 2 22. 7 26. 8 27. 2
Adjacent 25. 5 22. 5 25. 0 29. 9Isolated 28. 1 24. 6 25. 9 31. 1
Semirural 4 27. 9 24. 0 25. 7 31. 1Rural 29. 2 30. 4 26. 8 30. 7
White infants:All county groups 22.0 21. 3 22.3 23. 3
Metropolitan 21. 4 21. 1 21. 7 21. 8Greater a _ _ _ 21. 0 20. 9 21. 1 21. 3Lesser 3 - - - - 22.5 21. 8 22. 2 21.8
Adjacent 22. 6 21. 8 23. 0 23. 7Isolated 23. 8 22. 8 23. 4 24. 5
Semirural 4_ 23. 6 22. 7 23. 4 24. 4Rural 24. 2 23. 6 23. 5 24. 8
Nonwhite infants:All county groups__ _ 41.1 37. 0 41.7 45. 3
Metropolitan 38. 2 36. 7 39. 4 41. 1Greater a - - - 37. 7 37. 5 38. 2 38. 5Lesser'_ - - - 38. 9 33. 9 41. 0 41. 3
Adjacent 45. 0 38. 6 45. 9 46. 0Isolated 48. 1 43. 8 47. 7 48. 7
Semirural 4- 47. 8 39. 1 48. 1 48. 8Rural 49. 5 63. 8 47. 0 48. 8
Includes District of Columbia.2 Population of 1,000,000 or more.a Population of 80,000 to 1,000.000.
Contains an incorporated place of 2,500 or more.Source: Department of Health, Education, and Welfare, National Center for Health Statistics. Depart-
ment of Commerce. Survey of Current Business, August 1988.
60-297 0-71-0t. 1-7
10 5i
86 ECONOMIC AND SOCIAL CONDITION OF RTJRAL AMERICA
Visits to Pi_:sieians
Children and young people living in metro areas had the highestnumber of visits to ph, -qietans per person per year, on the average.Those living on farms httd the lowest number.
The met ro-nonmetro disparity was less marked for persons 25 ye TSof age and ,er than among the very young.
1066
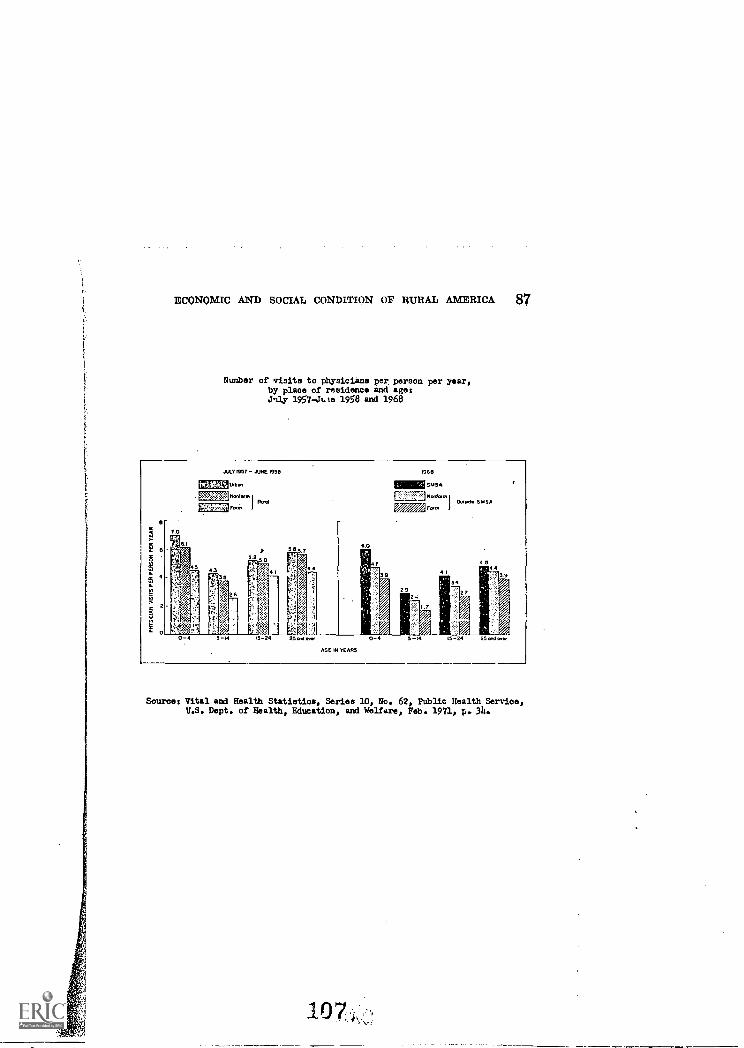
ECONOMIC AND SOCIAL CONDITION OF RURAL AMERICA 87
Number of visits to physicians per, person per year,by place of residence and ages.Pay 1957-Jule 1958 and 1968
JULY ISST- JUNE 1958 1968
1111112sms4=. WWI SMSA
AGE IN TEARS
Sources Vital and Health Statistics, Series 10, No. 62, Public Health Service,U.S. Dept. of Health, Education, and Welfare, Feb. 1971, p. 34.
107
88 ECONOMIC AND SOCIAL CONDITION OF RURAL AMERICA
Dental VisitsPersons 15 to 24 years of age, especially in metro areas, visited the
dentist more frequently than other age groups or those living in non-metro areas.
Farm people generally had the fewest visits among these residencegroups.
10'81 8t
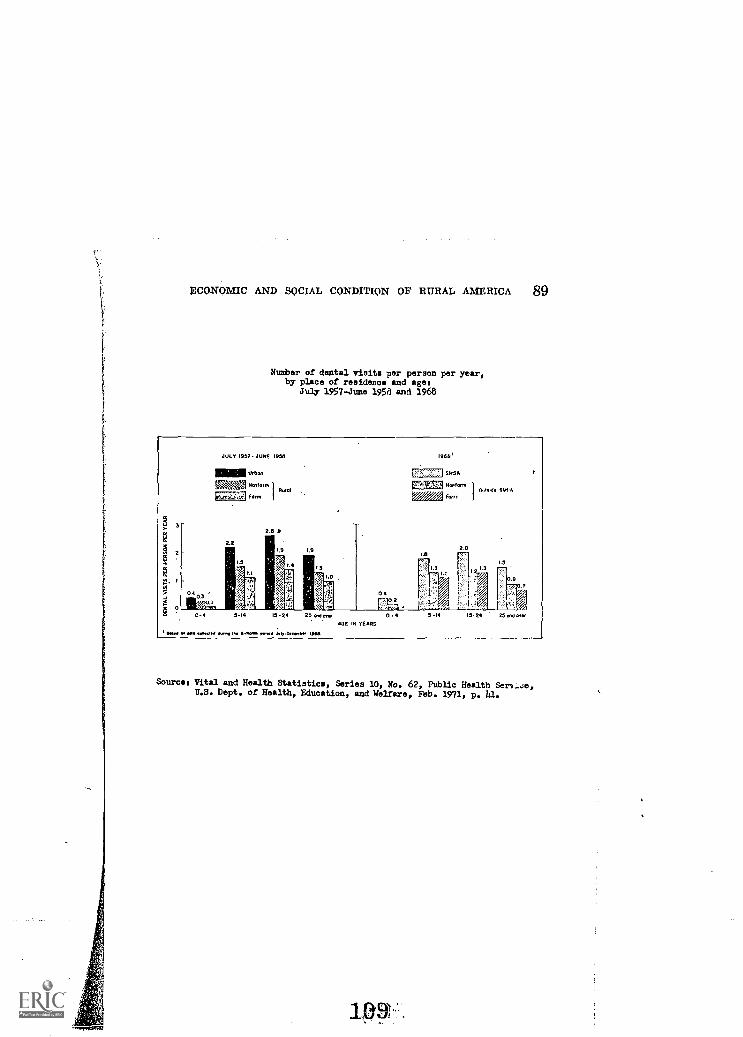
PCONOMIC AND SOCIAL CONDITION OF RURAL AMERICA 89
Number of dental visits per person per year,by place of residence and ages
July 1957-June 1958 and 1968
JULY 1957 JUNE me
ming.Halform
(Form
2.6)
1969'
50911
,ELM Noo 01t1 9614
1.9
1.5
5-10 5.24 25 .0nd over
AGE IN YEARS
1 go ....v., airing Ow 441,0011 JulyOem., 1,414.
04
-7e:20.4 5.14 5.24 25 and ow.
Sources Vital and Health Statistics, Series 10, No. 62, Public Health Serv;.Je,U.S. Dept. of Health, Education, and Welfare, Feb. 1971, p. 41.
1OR
90 ECONOMIC AND SOCIAL CONDITION OF RURAL AMERICA
Hospital Insurance CoverageMetro coverage for hospital insurance was considerably higher than
nonmetro for all age groups, and farm people had the lowest pro-portion of persons covered.
For all residence groups, percentages were higher for persons 25years of age and over than for younger people.
1 1
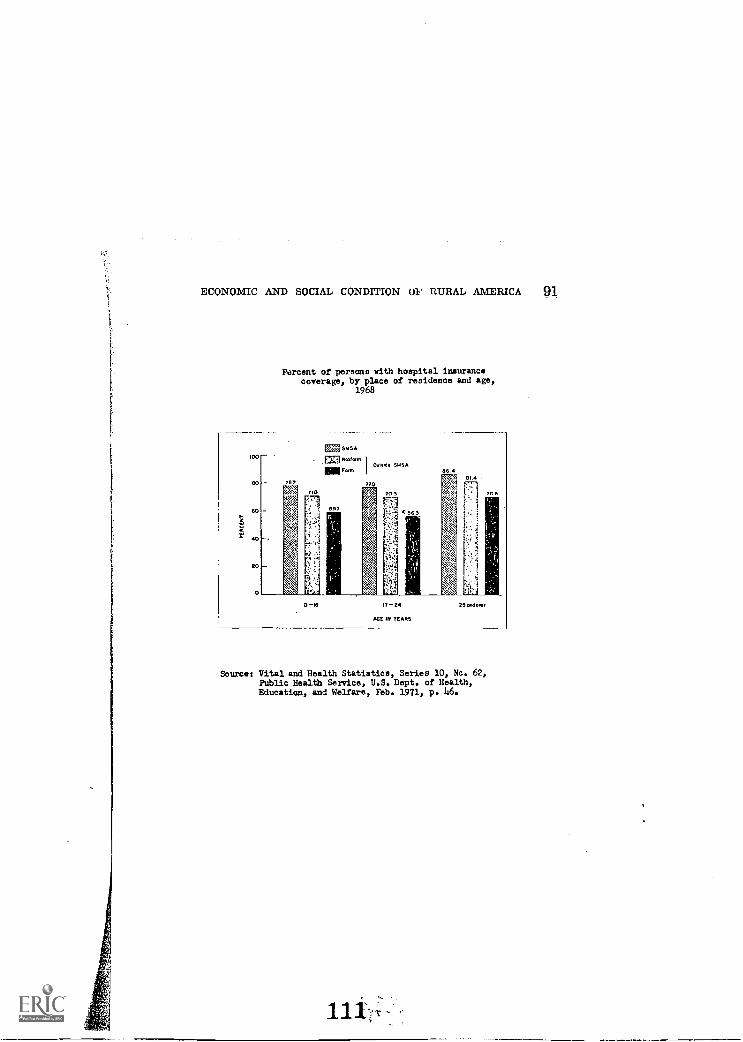
ECONOMIC AND SOCIAL CONDITION 01' RURAL AMERICA 91
Percent of persons with hospital insurancecoverage, by place of residence and age,
1968
Source, Vital and Health Statistics, Series 10, Nc. 62,Public Health Service, U.S. Dept. of Health,Education, and Welfare, Feb. 1971, p. 46.

92 ECONOMIC AND SOCIAL CONDITION OF RURAL AMERICA
Educational Attainment of Persons 25 Years and Over, by Colorand Residence, March 1970
Levels of educational attainment have improved in both metroand nonmetro areas in recent years. In March 1970, among nonmetrowhites, the percent who had completed high school was two out ofthree (65.9 percent) for those aged 25 to 44 years, compared with notquite two out of five (38.7 percent) of those 45 years of age or older.
Among Negroes, improvement has been relatively more rapid, buttheir education still lags far behind that of whites. In nonmetropolitanareas, three-fourths of the Negro farm population 25 years old andover had 8 years of schooling or less, compared with three-fifths ofnonfarm and 36 percent in metro areas. Eighty-six percent of theNegro farm population 45 years old and over had 8 years or less ofschooling, and even among those in the acre group 25 to 44 years, morethan half had attained only this level of education Less than one-fourth (23.7 percent) were high school graduates.
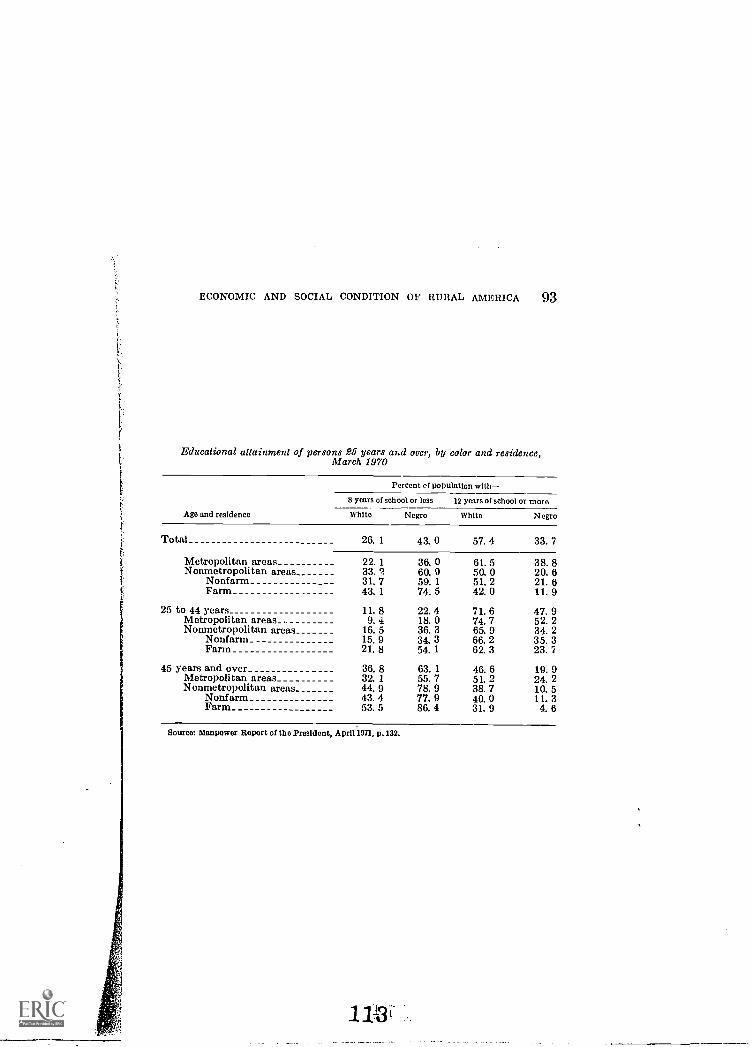
ECONOMIC AND SOCIAL CONDITION OF RURAL AMERICA 93
Educational attainment of persons 25 years and over, by color and residence,March 1970
Percent of population with-
8 years of school or less 12 years of school or more
Ago and residence White Negro White Negro
Total 26. 1 43. 0 57. 4 33. 7
Metropolitan areas 22. 1 36. 0 61. 5 38. 8Nonmetropolitan areas 33.2 60. 9 50. 0 20. 6
Nonfarm 31. 7 59. 1 51. 2 21. 6Farm 43. 1 74. 5 42. 0 11. 9
25 to 44 years 11. 8 22. 4 71. 6 47. 9Metropolitan areas_ 9. 4 18. 0 74. 7 52. 2Nonmetropolitan areas 16. 5 36. 3 65. 9 34. 2
Nonfarm 15. 9 34. 3 66. 2 35. 3Farm 21. 8 54. 1 62. 3 23. 7
45 years and over 36. 8 63. 1 46. 6 19. 9Metropolitan areas 32. 1 55. 7 51. 2 24. 2Nonmetropolitan areas 44. 9 78. 9 38. 7 10. 5
Nonfarm 43. 4 77. 9 40. 0 11. 3Farm 53. 5 86. 4 31. 9 4.6
Source: Manpower Report of the President, April 1971, p. 132.
113 L
94 ECONOMIC AND SOCIAL CONDITION OF RURAL AMERICA
Median Years of School Completed for Persons 25 to 29 YearsOld, 1969 and 1960
The average educational attainment at 12 -plus years showed someimprovement between 1960 and 1969 for all races, within and outsidemetropolitan areas, among persons 25 to 29 years old. Metro medianswere slightly higher than nonmetro in both years.
Differences in median school years completed were marked betweenwhites and Negroes in both years, especially in nonmetropolitan areas.
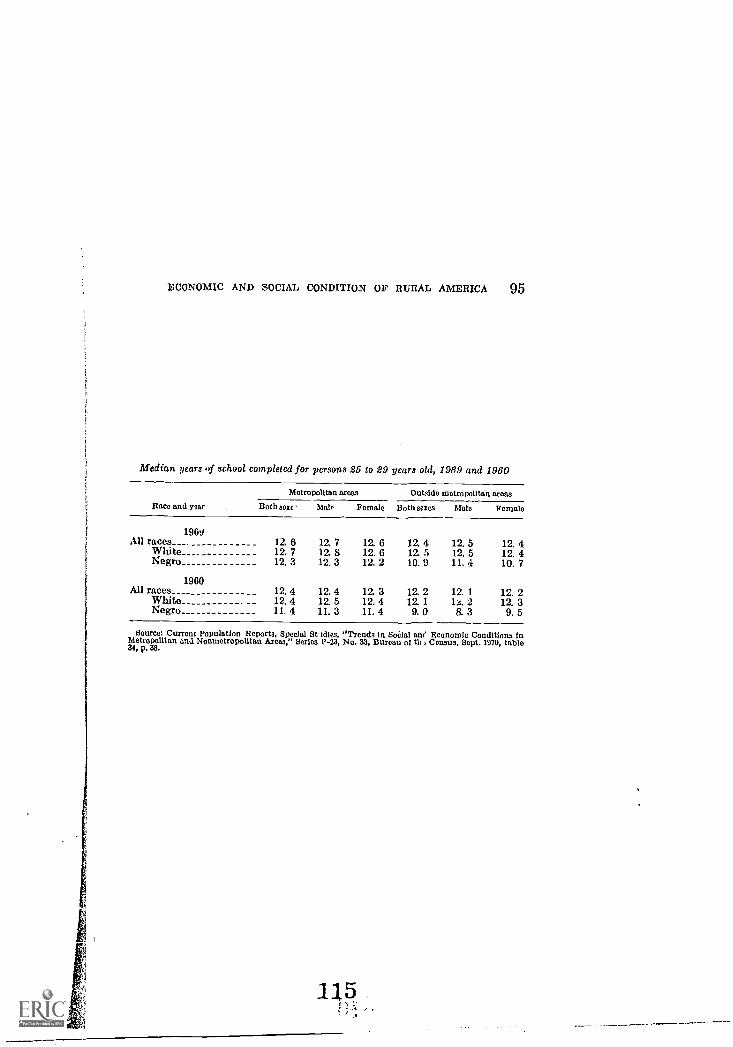
ECONOMIC AND SOCIAL CONDITION OF RURAL AMERICA 95
Median years of school completed for persons 25 to 29 years old, 1969 and 1960
Race and year
Metropolitan areas Outside metropolitan areas
Both sac- Male Female Both sexes Male Female
1969All races_ 12. 6 12. 7 12. 6 12. 4 12, 5 12. 4
White_ 12. 7 12. 8 12. 6 12. 5 12. 5 12. 4Negro 12, 3 12. 3 12. 2 10. 9 11. 4 10. 7
1960All races 12. 4 12. 4 12. 3 12. 2 12. 1 12, 2
White 12. 4 12. 5 12. 4 12. 1 1.4.2 12. 3Negro 11, 4 11. 3 11. 4 9. 0 8. 3 9. 5
Source: Current Population Reports, Special St Wks, "Trends in Soelal an( Economic Conditions inMetropolitan and Nonmetropolitan Areas," Series P-23, No. 33, Bureau of th Census, Sept. 1970, table34, p. 38.
115
96 ECONOMIC AND SOCIAL CONDITION OF RURAL AMERICA
Years of School Completed for Males 25 to 54 Years of Age,1969 and 1960
Men between 25 and 54 years of age residing in metropolitan areashad a better record of educational attainment than their nonmetropoli-tan counterparts in both 1969 and 1960, particularly at the collegelevel.
Within metropolitan areas in 1969, about two-thirds (68 percent)of the men 25 to 54 years old had at least completed high school, andabout one-fifth (19 percent) had completed 4 years of college or more.In nonmetropolitan areas, the percentages were 57 and 12 percent,respectively.

ECONOMIC AND SOCIAL CONDITION OF RURAL AMERICA 97
Years of school completed for males 25 to 54 ?fears of age, 1969 and 1960
Educational attainment and year Metropolitan areasOutside
netropolltan areas
1969Number (millions) 22. 6 11. 1Percent 100 100Elementary: 8 years or le:-.,s 15 27High school:
1 to 3 years 17 164 years 36 35
College:1 year or more _________________ 32 214 years or more 19 12
Percent completing high school 68 57
1960Number (millions) ______________________ 21. 4 11. 2Percent 100 100Elementary: 8 years or less 26 39High school:
1 to 3 years 22 204 years 26 26
College:1 year or more 25 154 years or more_________________________ 14 8
Percent completing high school 52 41
Source: Current Population RepOrts, Special Studio ;, "Trends In Social and Economic Conditions inMetropolitan and NonmetropolItan Areas," Series No. 33, Sept. 3, 1970, Bureau of Census, table 37,p. 41.
114,_
98 ECONOMIC ^ ND SOCIAL CONDITION OF RURAL AM &RICA
Median Income for Males 25 to 54 Years of Age, by Years of SchoolCompleted, 1968 and 1959
(1968 dollars)
The median income for men between 25 and 54 years of age washigher within metropolitan areas than in nonmetro areas at all levelsof educational attainment in both 1968 and 1959.
The median income of those residing outside metropolitan areas withsome high school education more nearly matched that of comparablemetropolitan area residents than did the median income of those withonly an elementary school education.
For men with only some elementary education, the median incomeoutside metropolitan areas was 79 percent of the median metro income,whereas with high school completion, it was 87 percent.
118. _
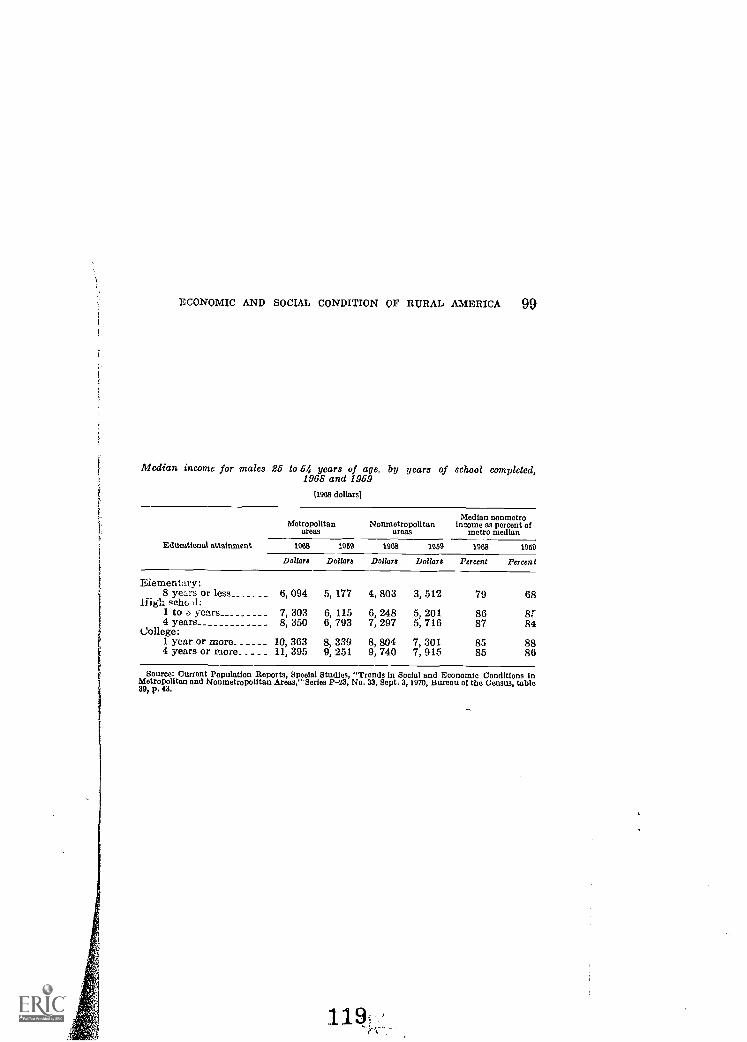
ECONOMIC AND SOCIAL CONDITION OF RURAL AMERICA 99
Median income for males 95 to 54 years of age, by years of school completed,1968 and 1959
[Ms dollurs1
Median nonmetroMetropolitan Nonmetropolitan income as percent of
MOS areas metro median
Educational attainment 1968 1959 1968 1959 nas 1969
Dollars Dollars Dollars Dollars Percent Percent
Elementary:8 years or less 6, 094 5, 177 4, 803 3, 512 79 68
High gehc 4:1 to 0 years 7, 303 6, 115 6, 248 5, 201 86 8r4 years 8, 350 6, 793 7, 297 5, 716 87 84
College:1 year or more 10, 363 8, 339 8, 804 7, 301 85 884 years or more 11, 395 9, 251 9, 740 7, 915 85 86
Source: Current Population Reports, Special Studies, "Trends in Social and Economic Conditions InMetropolitan and Nonmetropolitan Areas," Series P -23, No. 33, Sept. 3, 1970, Bureau of the Census, table39, p.43.
11 9 3
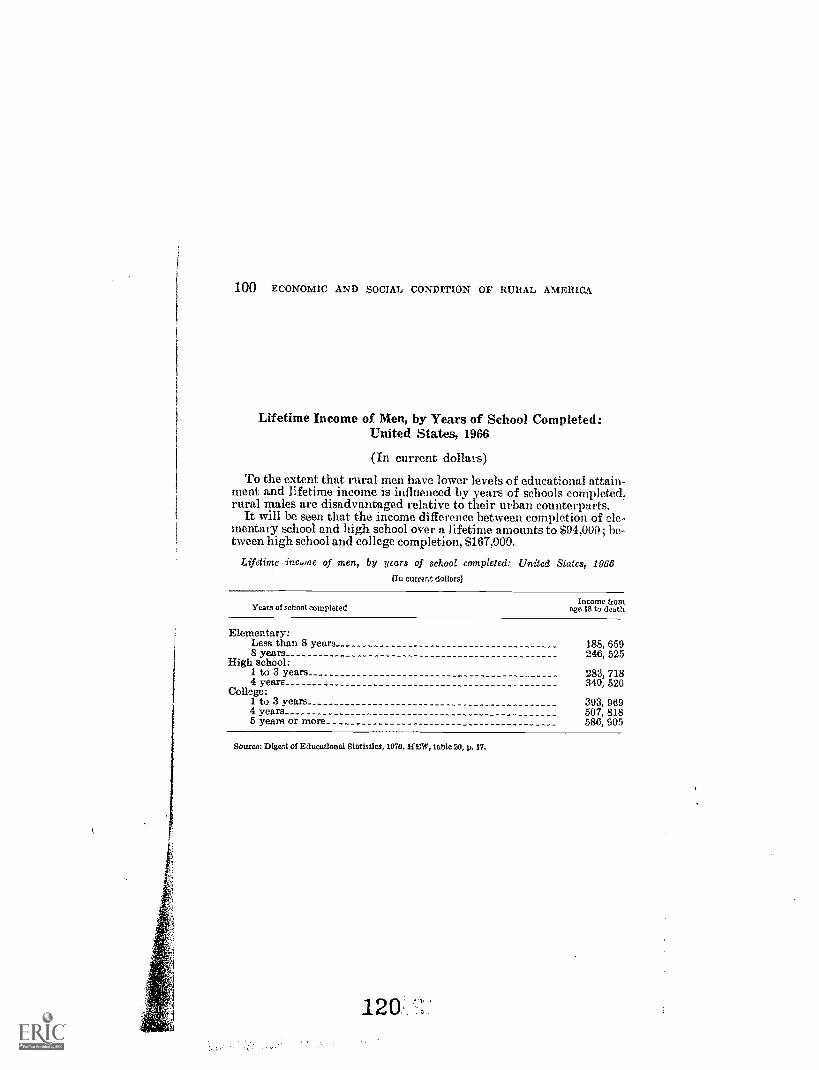
100 ECONOMIC AND SOCIAL CONDITION OF RURAL AMERICA
Lifetime Income of Men, by Years of School Completed:United States, 1966
(In current dollars)
To the extent that rural men have lower levels of educational attain-ment and lifetime income is influenced by years of schools completed,rural males are disadvantaged relative to their urban counterparts.
It will be seen that the income difference between completion of ele-mentary school and high school over a lifetime amounts to $94,000; be-tween high school and college completion, $167,000.
Lifetime ine.me of men, by years of school completed: United States, 1966(In current dollars]
Years of school completedIncome from
ago 18 to death
Elementary:Less than 8 years 188, 6598 years 246, 525
High school:1 to 3 years 283, 7184 years 340, 520
College:I to 3 years 393, 9694 years 507, 8185 years or more 586, 905
Source: Digest of Educational Statistics, 1070, IIEW, table 20, p. 17.
120
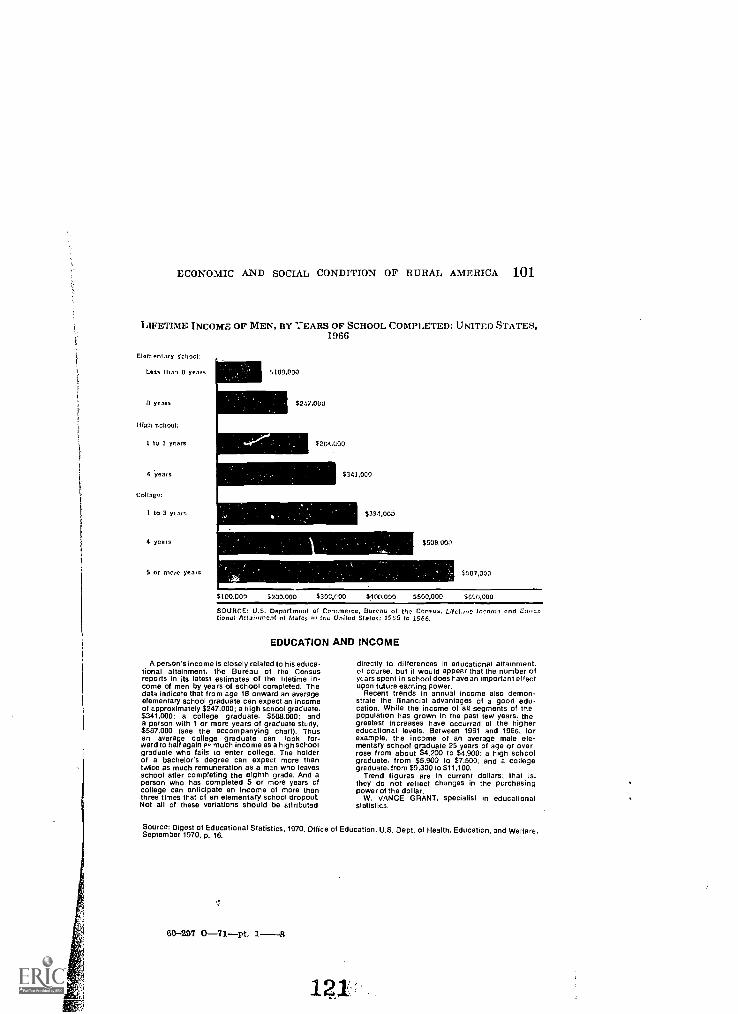
ECONOMIC AND SOCIAL CONDITION OF RURAL AMERICA 101
LIFETIME INCOME OF MEN, BY YEARS OF SCHOOL COMPLETED: UNITED STATES,1966
Elementary school:
Less than 0 years
13 years
liFth School:
1 to 3 years
College,
1 to 3 yearn
4 years
5 or more year
',189,000
$247.000
Mill 12E4.000
$341,000
111111111111M $19.
11111111111111MINIE $508,001,
$557,030
$100,001 5200.000 0300.000 $400.000 3500,000 $630,000
SOURCE! U.S. Department 01 Commerce, Bureau of the Census, Lifer,nre Income and Edw.,bona! Attainment of Mates in !fru United Stales: 1556 to 1016.
EDUCATION AND INCOME
A person's income is closely related to his educa-tional attainment, the Bureau of the Censusreports in its latest estimates of the lifetime in-come of men by years of school completed. Thedata indicate that from age 18 onward an averageelementary school graduate can expect an incomeof approximately $247,000; a high school graduate,$341,000; a college graduate. $508,000; anda person with 1 or more years of graduate study.$507,000 (see the accompanying chart). Thusan average college graduate can look for-ward to half again much income as a high schoolgraduate who fails to enter college. The holderof a bachelor's degree can expect more thantwice as much remuneration as a man who leavesschool alter completing the eighth grade. And aperson who has completed 5 or more years ofcollege can anticipate an income of more thanthree times that of an elementary school dropout.Not all of these variations should be attributed
directly to differences in educational attainment,of course. but it would appear that the number ofyears spent in school does have an important effectupon future earning power.
Recent trends in annual income also demon-strate the financial advantages of a good edu-cation. While the income of all segments of thepopulation has grown in the past low years, thegreatest increases have occurred at the highereducational levels. Between 1961 and 1966. forexample, the income of an average male ele-mentary school graduate 25 years of age or overrose from about $4,200 to $4500: a high schoolgraduate, from $5500 to $7.500, and a collegegraduate, from $9,300 to $11,100.
Trend figures are in current dollars; that is.they do not reflect changes in the purchasingpower of the dollar.
W. VANCE GRANT, specialist in educationalstatistics.
Source: Digest of Educational Statistics, 1970, Office of Education, U.S. Dept. of Health, Education, and Welfare,September 1970, p. 16.
00-297 0-71pt. 1-8
p
121
102 ECONOMIC ND SOCIAL CONDITION OF RURAL AMERICA
Total Expenditures for Education Related to Gross NationalProduct: United States, 1929-30 to 1969-7:s
(Selected years)
Educational expenditures have increased rapidly in recent years,reflecting the growth of the school-age population and increased effortto provide quality education.
The annual expenditure is now eight times its 1949-50 total, andnearly three times the outlay just 10 years ago.
Expenditures in 1969-70 were at an all-time high, both in termsof actual dollars and as a percentage of the Gross National Product.
In low-income rural areas, funds are difficult to find for qualityeducation at steadily rising cost. This is especially true in areas ofheavy outmigration where the tax base has been shrinking.
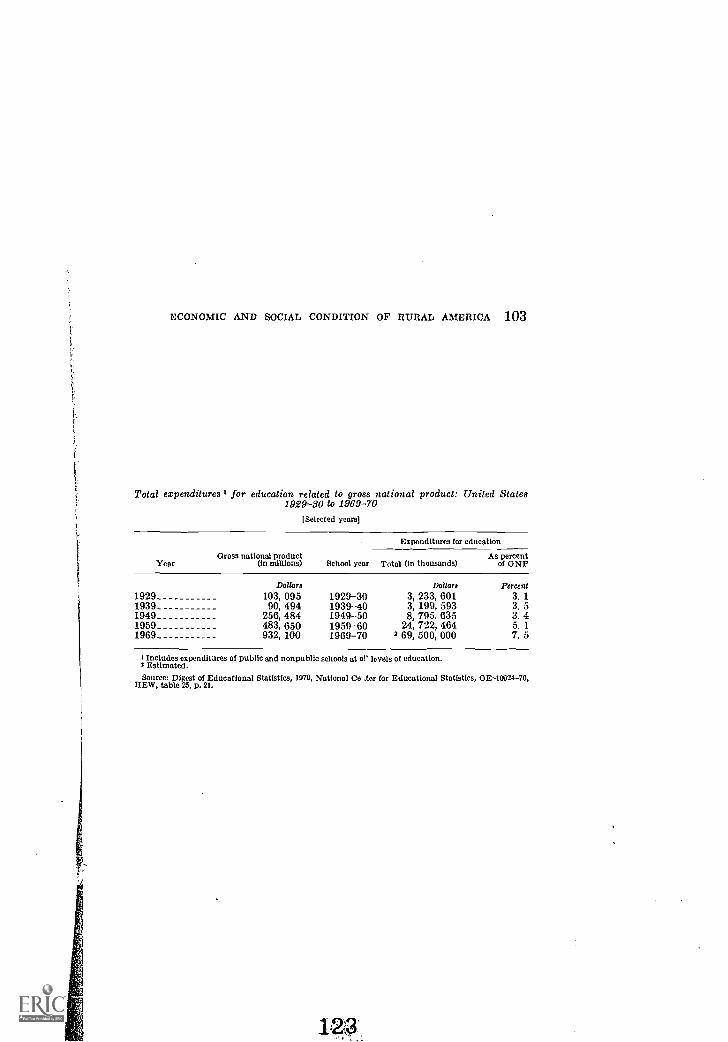
ECONOMIC AND SOCIAL CONDITION OF RURAL AMERICA 103
Total expenditures I for education related to gross national product: United States1929-50 to 1969-70
[Selected years]
Year
Expenditures for education
Gross national product As percent(in millions) School year Total (In thousands) of GNP
Dollars Dollars Percent19291939194919591969
103,90,
256,483,932,
095494484650100
1929-301939 -401949501959-901969-70 2
3,3,8,
24,69,
233,199,795,722,500,
601593635464000
3. 13. 53. 45. 17. 5
I Includes expenditures of public and nonpublic schools at al' levels of education.2 Estimated.Source: Digest of Educational Statistics, 1970, National Co .ter for Educational Statistics, OE-10024-70,
HEW, table 23, p. 21.
104 ECONOMIC AND SOCIAL CONDITION OF RURAL AMERICA
Expenditures Per Pupil of Public School Systems, byMetropolitan Status, 1967-68
According to one widely used, rough index of educational quality,educational services in rural areas are substantially poorer thanthose in either the central cities or their suburbs.
On the average, rural areas spend only about three-fourths as muchper pupil as do urban areas. (These figures have been adjusted byercluding transportation costs, school lunches, and similar expendi-tures which do not contribute directly to the educational process.)
Another measure which is sometimes used, expenditures per teacl-er,tells the same story of poor educational services in rural areas
1.24:
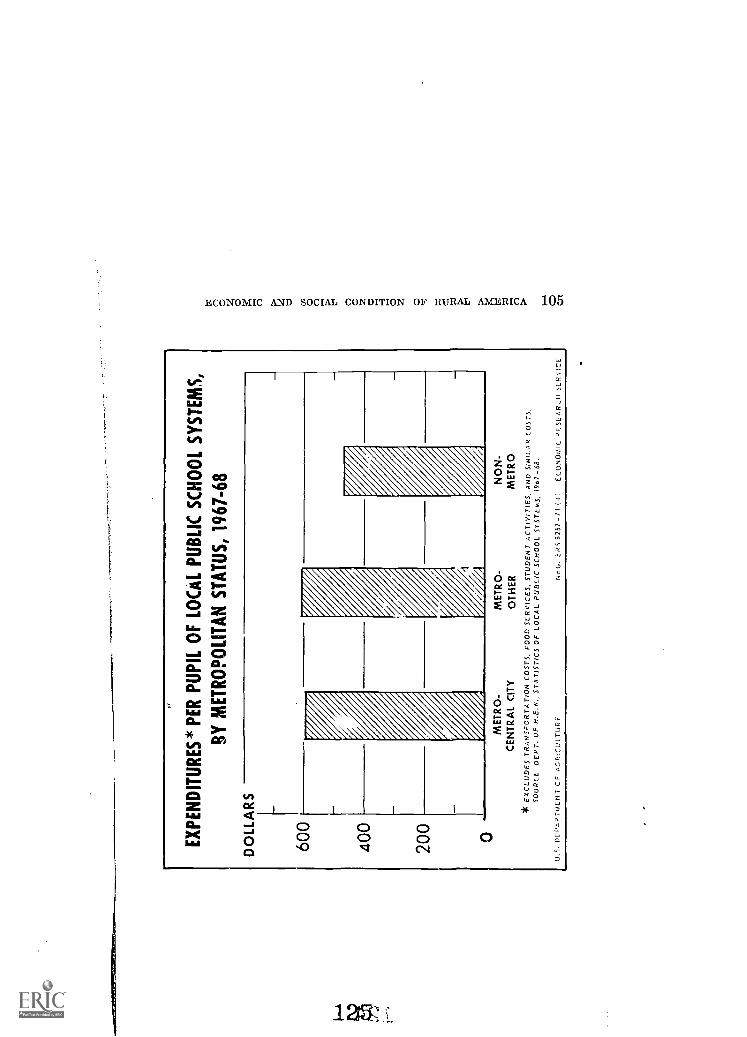
EX
PE
ND
ITU
RE
S*
PE
R P
UP
IL O
F L
OC
AL
PU
BLI
C S
CH
OO
L S
YS
TE
MS
,
BY
ME
TR
OP
OLI
TA
N S
TA
TU
S, 1
967-
68
DO
LLA
RS
600
400
200
0M
ET
RO
ME
TR
ON
ON
CE
NT
RA
L C
ITY
OT
HE
RM
ET
RO
* E
XC
LUD
ES
TR
AN
SP
OR
TA
TIO
N C
OS
TS
, FO
OD
SE
RV
ICE
S, S
TU
DE
NT
AC
TIV
ITIE
S. A
ND
Sim
IIR
CO
ST
S.
SO
UR
CE
DE
PT
. OF
H.E
.W.,
ST
AT
IST
ICS
OF
LO
CA
L P
UB
LIC
SC
HO
OL
SY
ST
EM
S, 1
967-
68.
U.S
. DF
PA
PT
ME
NT
Cr
6CR
CU
LTU
R6
Neb
. EP
S 8
257-
71 (
41
EC
ON
OM
IC R
ES
EA
RC
H S
E92
%10
E
/06,ECONOMIC AND SOCIAL CONDITION OF RURAL AMERICA 0
IV. HOUSING
Adequate housing is an important component of successful ruralcommunity development. It not only contributes to the well-being offamilies and individuals, but helps to create a satisfying environmentfor th3 whole community.
Over the past two decades, there has been considerable improve-ment in the housing picture in the United States. Although non-metro areas, with Z3 percent of the popm. 6ion, still have 60 percentof the substandard units, this figure is down from 65 percent in 1950.The number of occupied substandard unit$, in nonmetro areas declinedby 7.2 million in 20 yea-
This improvement is closely related to the reduction in number offamilies with poverty-level incomes and to the fact that in nonmetroareas there were more new housing starts and more renovation thannew households formed. During the two decades, 1950-1970, therewere 10.1 million new housing units started in nonmetro areas. Duringthis same period, 1.2 million new households were added in nonmetroareas. Thus the 10.1 million new housing units substantially accountedfor improvement in housing by replacing .1.2 million substandardhouses, providing housing for 1.2 million added households, and takingthe place of the 1.7 million lost by fire, demolition, or other causes.
126
108 ECONOMIC AND SOCIAL CONDITION OF RITUAL AMERICA
Occupied Substandard Housing Units by MetropolitanResidence, 1950-1970
In 1950, more than one-third of the housing in the United Stateswas substandard. By 1970, this share was down to one-fourteentha decline in the number of substandard units in 20 years from 15.2million to 4.4 million units.
Substandard housing units located outside metropolitan areasdeclined from 10.1 million occupied units in 1950 to 2M million in 1970,whereas in metro areas, the number declined from 5 million in 1950 toabout 1.8 million in 1970.
The decline in substandard housing is closely correlated with therise in family incomes. In 1969, there were 2.5 million families withincomes under 83,000 in nonmetro areas, and 2.6 million families livedin substandard housing in 1970. In 1959, there were 5.3 million familieswith incomes under $3,000, and 5.3 million families lived in sub-standard housing in 1960.
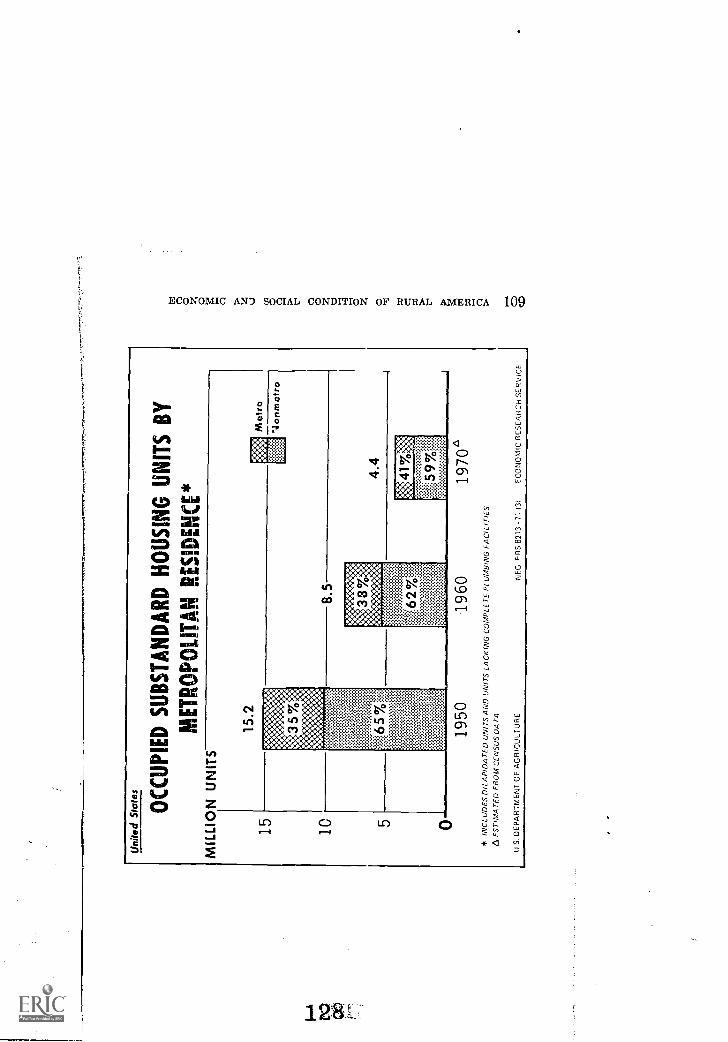
Uni
ted
Sta
tes
OC
CU
PIE
D S
UB
ST
AN
DA
RD
HO
US
ING
UN
ITS
BY
ME
TR
OP
OLI
TA
N R
ES
IDE
NC
E*
MIL
LIO
N U
NIT
S
15 10
15.2
Met
roon
met
ro
8.5
NiL
yWA
NtiN
i!
4to:
.
019
5019
60*
INC
LUD
ES
DIL
AP
IDA
TE
D U
NIT
S A
ND
UN
ITS
LA
CK
ING
CO
MP
LET
E P
L U
MB
ING
FA
CIL
ITIE
SA
ES
TIM
AT
ED
FR
OM
CE
NS
US
DA
TA
U.S
. DE
PA
RT
ME
NT
OF
AG
RIC
ULT
UR
E
1970
°
NE
G F
RS
821
3 -7
1 13
;E
CO
NO
MIC
RE
SE
AR
CH
SE
RV
ICE
110 ECONOMIC AND SOCIAL CONDITION OF RURAL AMERICA
Percent of Occupied Housing Units Outside Metro Areas WithoutComplete Plumbing, by States, mo
In 1970, 12 percent of the 19.5 million occupied housing unitsoutside of SMSA's lacked complete plumbing. In comparison, 3 per-cent of the occupied housing in SMSA's lacked these facilities.
Regional differences are apparent from the map. In the South, 19percent of the occupied housing units were without adequate plumb-ing, whereas in the Northeast and West, the percentages wore lessthan 6 percent. The North-Central Region had about 9 percent.
Of all units without adequate plumbing, about two-thirds werelocated in the South, one-fifth in the North-Central Region and theremainder in the West and Northeast.
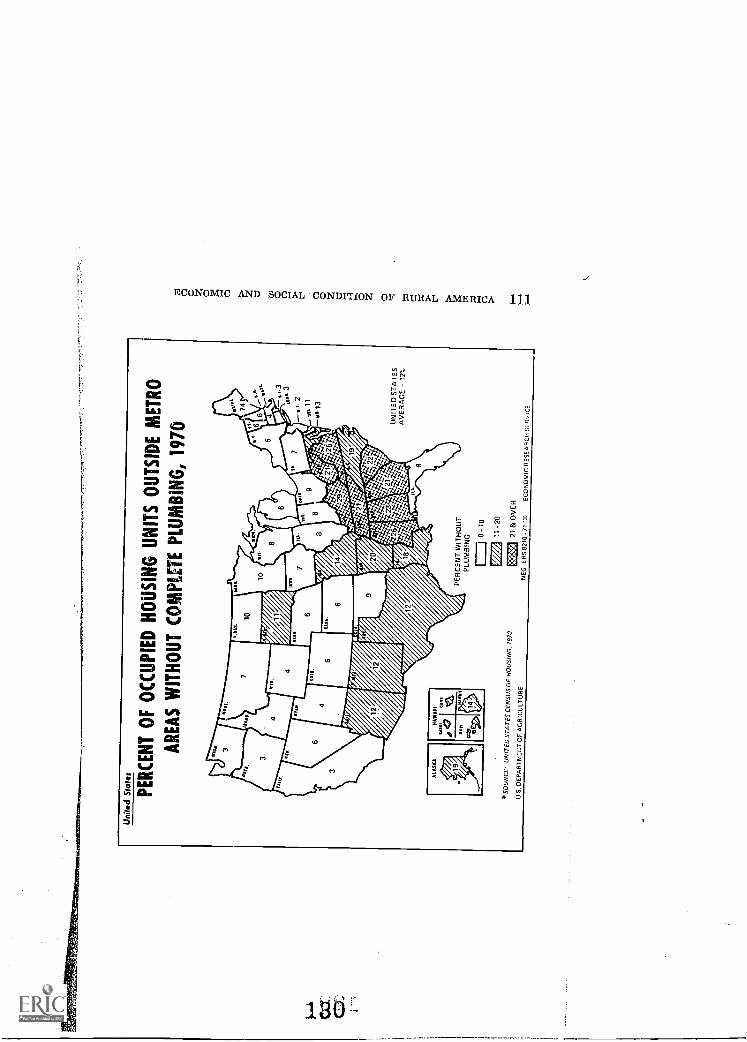
Uni
ted
Sta
tes
PE
RC
EN
T O
F O
CC
UP
IED
HO
US
ING
UN
ITS
OU
TS
IDE
ME
TR
O
AR
EA
S W
ITH
OU
T C
OM
PLE
TE
PLU
MB
ING
, 197
0
HA
M II
* S
OU
RC
E: U
NIT
ED
ST
AT
ES
CE
NS
US
OF
HO
US
ING
, 197
0
U S
. DE
PA
RT
ME
LT O
F A
GR
ICU
LTU
RE
PE
RC
EN
T W
ITH
OU
TP
LUM
BIN
G 0 -1
0
EE
1 I I
- 2
0
21 &
OV
ER
0.43
55:
UN
ITE
D S
TA
TE
SA
VE
RA
GE
- 1
2%
NE
G E
RS
821
0 -
71 '3
)E
CO
NO
MIC
RE
SE
AR
CH
SE
RV
ICE
112 ECONOMIC AND SOCIAL CONDITION OF RURAL AMERICA
New Housing Units StartedSelected Characteristics:1960, 1965, and 1970
Governmental aid for housing construction has increased markedly.In 1970, about 41 perce.at of the new housing was constructed withgovernmental help, as compared with 19 percent in 1965 and 30 per-cent in 1960. Also, the number of housing starts in 1970 increased about13 percent above the 1960 level.
The South continues to have the largest number of new housingstarts, and the housing trend since 1960 has been toward the construc-tion of multiple-type dwellings, which are normally rental units.
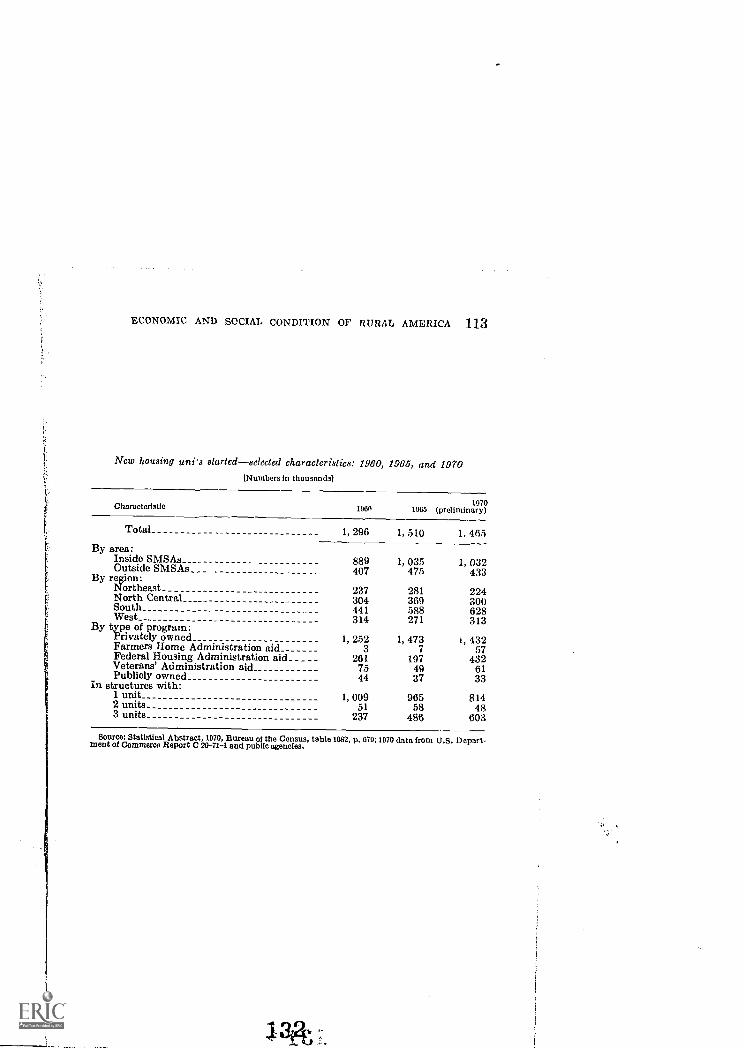
ECONOMIC AND SOCIAL CONDITION OF RURAL AMERICA 113
New housing units started selected characteristics: 1960, 1965, and 1970(Numbers in thousands]
Characteristic 1966 10651070
(preliminary)
Total 1, 296 1, 510 1. 465By area:
Inside SMSAs 889 1, 035 1, 032Outside SMSAs 407 475 433By region:Northeast 237 281 224North Central 304 369 30()South 441 588 628West 314 271 313By type of program:Privately owned 1, 252 1, 473 1, 432Farmers Home Administration aid 3 7 57Federal Housing Administration aid 261 197 432Veterans' Administration aid 75 49 61Publicly owned
in structures with:44 37 33
1 unit2 units
1, 00951
96558
814483 units 237 486 603
Source: Statistical Abstract, 1070, Bureau of the Census, table 1082, p. 670; 1070 data from U.S. Depart-ment of Commerce Report C 20 -72 -1 and public agencies.

(
ECONOMIC AND SOCIAL CONDITION OF RURAL AMERICA 115
V. GOVERNMENT SERVICES AND FACILITIES
Attributes of efficient local government are coordinated, stream-lined administration and adequate revenue resources. Many State andlocal governments have been suffering from a plethora of local gov-ernment units and an inadequate tax base. Problems that develop inthe local communities are increasingly beyond their scope and capa-bility to resolve.
The number of general government units is high in rural areas, es-pecially in proportion to rural population, although the number ofthese units has dc,Trcased more than 10 percent in the past 10 years.The number of districts to 'handle special problems has increasedsharply. School districts, however, have decreased dramatically innumber, in the effort to consolidate rural schools.
In trying to provide adequate services and facilities, nonmetro-politan communities spend slightly more than metro areas of theirrevenues in relation to their personal income. State and Federal aidsupplement their own resources, but the local base, essentially theproperty tax, does not keep pace with the increasing demands on it.
Education is the leading function for which local governments spendtheir tax money. For all services except roads, metro areas spend morethan nonmetro areas on a per capita basis. And the gap is widening.
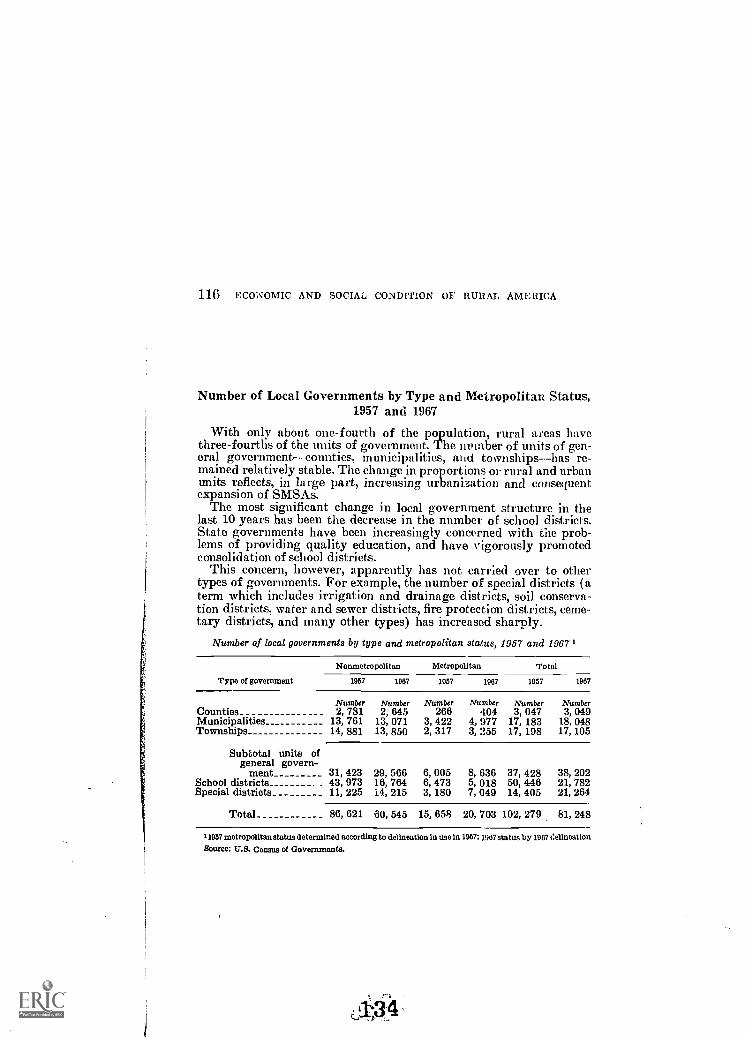
116 ECONOMIC AND SOCIAL CONDITION OP RURAL AMERICA
Number of Local Governments by Type and Metropolitan Status,1957 and 1967
With only about one-fourth of the population, rural areas havethree-fourths of the units of government. The number of units of gen-eral government-counties, municipalities, and townships-has re-mained relatively stable. The change in proportions or rural and urbanunits reflects, in large part, increasing urbanization and consequentexpansion of SMSAs.
The most significant change in local government structure in thelast 10 years has been the decrease in the number of school districts.State governments have been increasingly concerned with the prob-lems of providing quality education, and have vigorously promotedconsolidation of school districts.
This concern, however, apparently has not carried over to othertypes of governments. For example, the number of special districts (aterm which includes irrigation and drainage districts, soil conserva-tion districts, water and sewer districts, fire protection districts, ceme-tary districts, and many other types) has increased sharply.
Number of local governments by type and metropolitan status, 1957 and 1967 1
Typo of government
Nonmetropolitan Metropolitan Total
1957 1087 1967 1967 100 1967
Number Number Number Number Number NumberCounties 2, 781 2, 645 266 404 3, 047 3, 049Municipalities 13, 761 13, 071 3, 422 4, 977 17, 183 18, 048Townships
Subtotalgeneral
ment
units ofgovern-
14, 881 13, 850 2, 317 3, 255 17, 198 17, 105
31, 423 29, 566 6, 005 8, 636 37, 428 38, 202School districts 43, 973 16, 764 6, 473 5, 018 50, 446 21, 782Special districts 11, 225 14, 215 3, 180 7, 049 14, 405 21, 264
Total 86, 621 60, 545 15, 658 20, 703 102, 279 81, 248
11967 metropolitan status determined according to delineation in use in 1967; 1967 status by 1967 4alineatiouSource: U.S. Census of Governments.
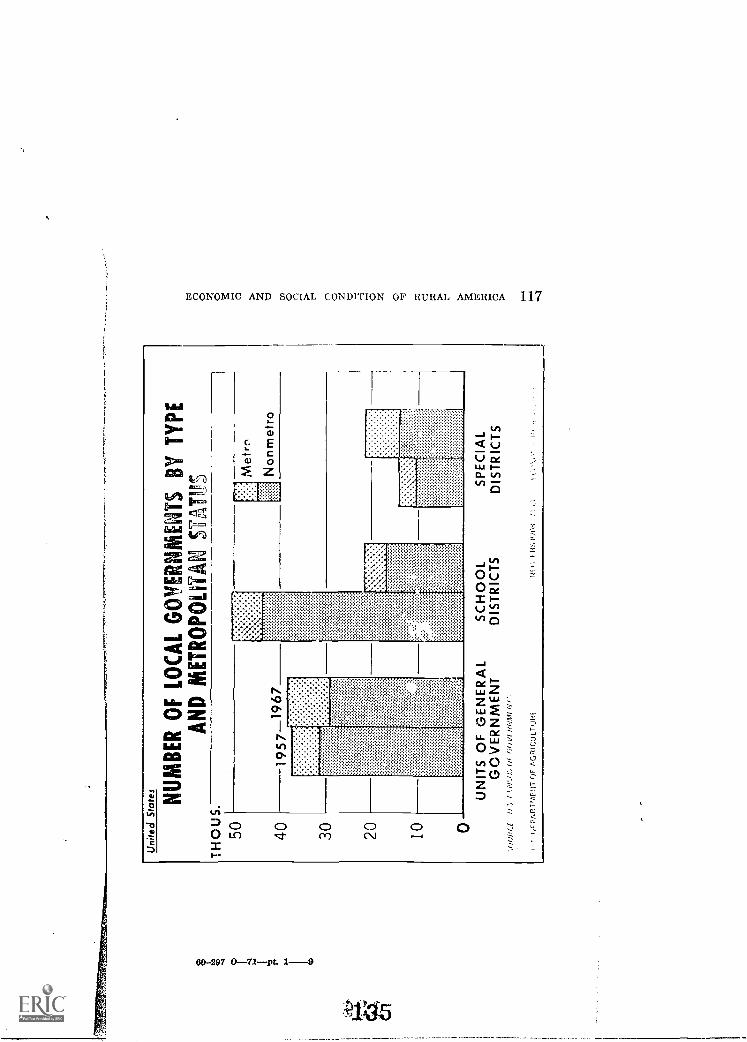
Uni
ted
Sta
tes NU
MB
ER
OF
LO
CA
L G
OIIE
RN
ME
NT
S B
Y T
YP
EA
ND
ME
TR
OP
OU
TA
N 5
1171
15
UN
TS
OF
GE
NE
RA
LG
OV
ER
NM
EN
Tyj
ukrf
U.;
I !.1
'1',N
.; 01
CO
VI W
W1
Ii I.
'IE
E-P
AP
.TE
AF
EIT
OF
AG
RIC
ULT
UR
E
SC
HO
OL
DIS
TR
ICT
S
IS F
ill!!
,.;
SP
EC
IAL
DIS
TR
ICT
S
118 ECONOMIC AND SOCIAL CONDITION OF RURAL AMERICA
General Revenue from Own Sources of Federal, State, and LocalGovernments, 1946 through 1968 -69
In the face of rapidly inc-easing demand for their services, Stateand local governments have increased their revenues from their ownsourcts about eightfold during the post-World War II period. By con-trast, Federal revenues have increased only fourfold.
Nontex revenues, such as charges for specific services provided bylocal governments, have increased most rapidly. At the State level,they increased sixteenfold.
Perhaps the major inference to be drawn from these data is thatState and local governments have not been lax in tapping old revenuesources and finding new ones to meet their rapidly rising needs formoney.
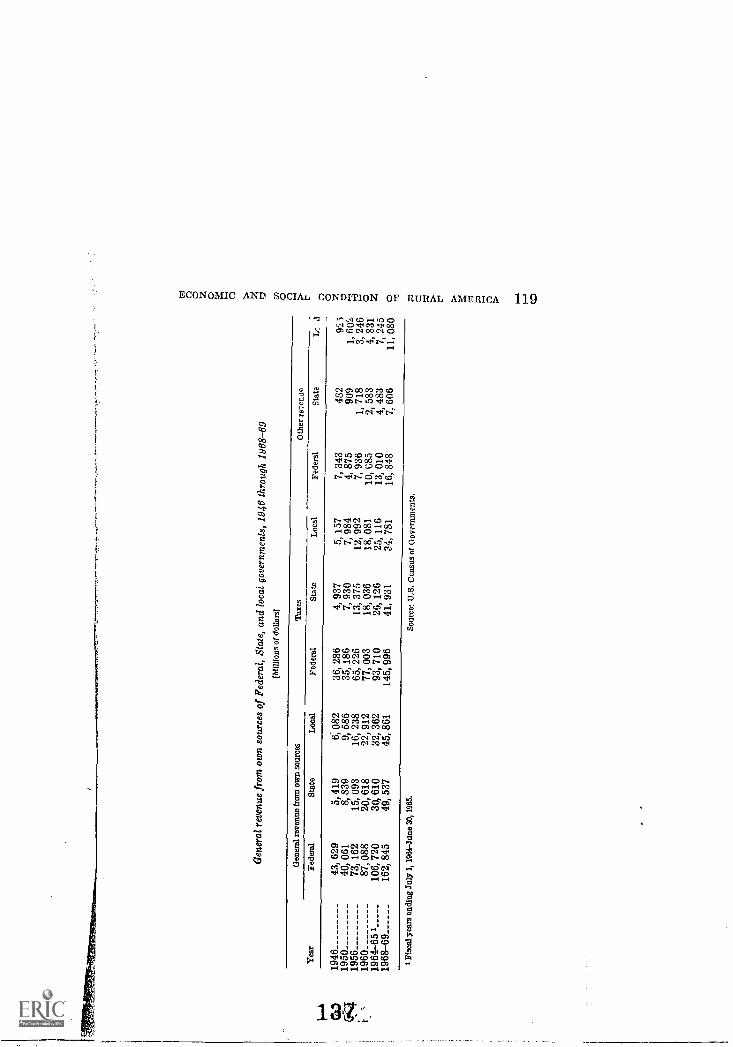
Gen
eral
rev
enue
fro
m o
wn
sour
ces
of F
eder
al, S
tate
, and
loca
l gov
ernm
ents
, 194
6 th
roug
h 19
68-6
9ID
3llli
ons
of d
olla
rs]
Gen
eral
rev
enue
fro
m o
wn
sour
ces
Tax
esO
ther
re7
eim
eY
ear
Fede
ral
Stat
eL
ocal
Fede
ral
Stat
eL
ocal
Fede
ral
Stat
e1/
:.
1946
1950
1956
1960
1964
-65
119
68 -
69
43,
40,
73,
87,
106,
162,
629
061
162
088
720
845
5, 8, 15,
20,
30,
49,
419
839
093
618
610
537
6, 9,16
,22
,32
,45
,
082
586
238
912
362
861
36,
35,
65,
77,
93,
145,
286
186
226
003
710
996
4, 7,13
,18
,26
,41
,
937
930
375
036
126
931
5, 7,12
,18
,25
,24
,
157
984
992
081
116
781
7, 4, 7,10
,13
,16
,
343
875
936
t:,85
010
848
1, 2, 4, 7,
482
909
718
583
483
606
1, 3, 4, 7, 11,
92 3
60 2
246
831
245
080
I Fi
scal
yea
rs e
ndin
g Ju
ly 1
, 196
4-Ju
ne 3
0,19
65.
Sour
ce'.
U.S
. Cen
sus
of G
over
nmen
ts.
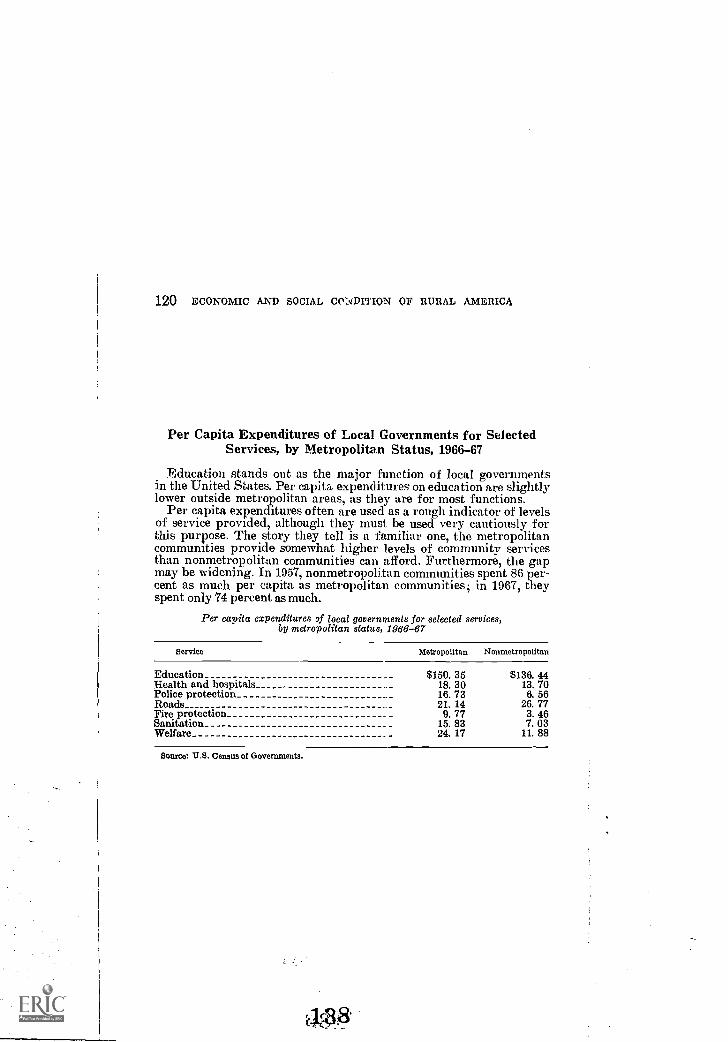
120 ECONOMIC AND SOCIAL C01,4 AMON OF RURAL AMERICA
Per Capita Expenditures of Local Governments for SelectedServices, by Metropolitan Status, 1966-67
Education stands out as the major function of local governmentsin the United States. Per capita expenditures on education are slightlylower outside metropolitan areas, as they are for most functions.
Per capita expenditures often are used as a rough indicator of levelsof service provided, although they must be used very cautiously forthis purpose. The story they tell is a familiar one, the metropolitancommunities provide somewhat higher levels of community servicesthan nonmetropolitan communities can afford. Furthermore, the gapmay be widening. In 1957, nonmetropoli.tan communities spent 86 per-cent as much per capita as metropolitan communities; in 1967, theyspent only 74 percent as much.
Per capita expenditures 9f local governments for selected services,by metropolitan status, 1966-67
Service Metropolitan Nonmetropolltan
Education $150.35 $136. 44Health and hospitals 18. 30 13. 70Police protection 16. 73 6. 56Roads 21. 14 26. 77Fire protection 9. 77 3. 46Sanitation 15. 83 7. 03Welfare 24. 17 11. 88
Source: GAL Census of Governments.
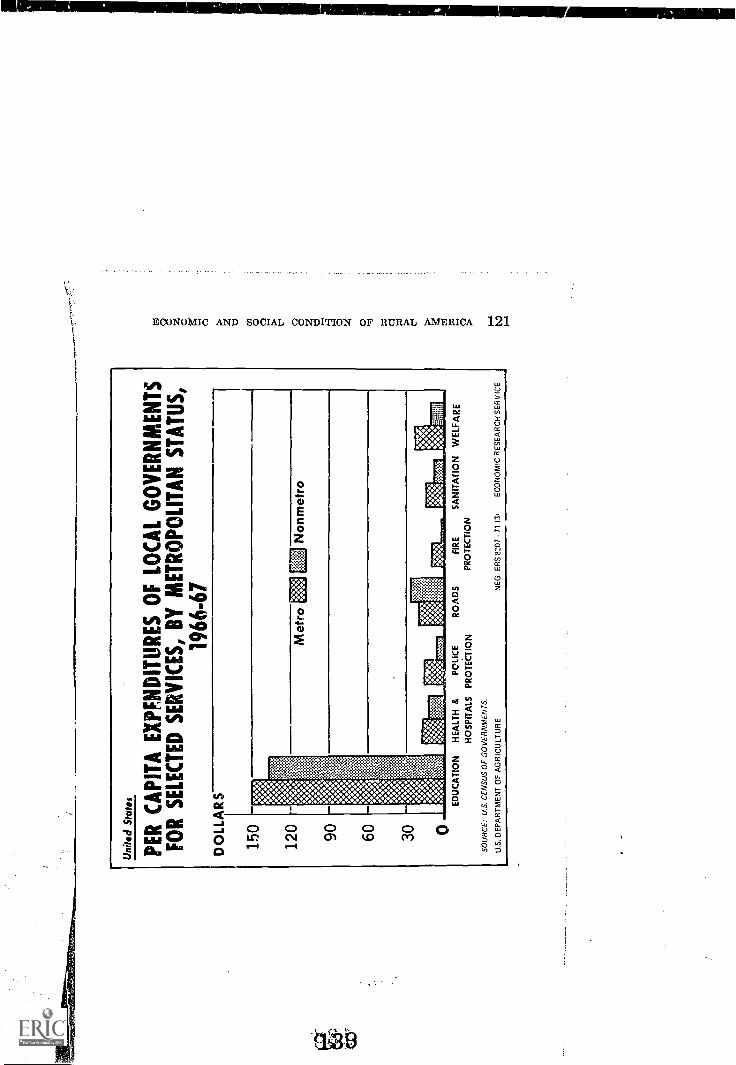
Uni
ted
Sta
tes
PE
R C
AP
ITA
EX
PF
ND
ITU
RE
S O
F L
OC
AL
GO
VE
RN
ME
NT
SF
OR
SE
LEC
TE
D S
ER
VIC
ES
, BY
ME
TR
OP
OLI
TA
N S
TA
TU
S,
1966
-67
DO
LLA
RS
150
120 90 60 30 0
Met
ro g
git
etro
171
Non
met
ro
ED
UC
AT
ION
HE
ALT
H &
PO
LIC
E
HO
SP
ITA
LS P
RO
TE
CT
ION
SO
UR
CE
: U.S
. CE
NS
US
OF
GO
VE
RN
ME
NT
S.
U.S
. DE
PA
RT
ME
NT
OF
AG
RIC
ULT
UR
E
RO
AD
SF
IRE
SA
NIT
AT
ION
WE
LFA
RE
PR
OT
EC
TIO
N
NE
G. E
RS
820
7 -7
1 13
1E
CO
NO
MIC
RE
SE
AR
CH
SE
RV
ICE
cz
122 ECONOMIC AND SOCIALCONDITION OF RURAL AMERICA
Selected Items of Local Government Revenues Per $1,000 ofPersonal Income, by
Metropolitan Status, 1967Nonmetropolitancommunities may spend less per capita on local
government services, but they allocate slightly more of their incomes
to financing these services.State aids tononmetropolitan areas partially offset the effects of
lower incomes in these areas. Without these aids, local governmentservices would certainly be poorer.Direct Federal payments to local governments are small and allo-cated slightly more to metropolitan areas.
14.f.40
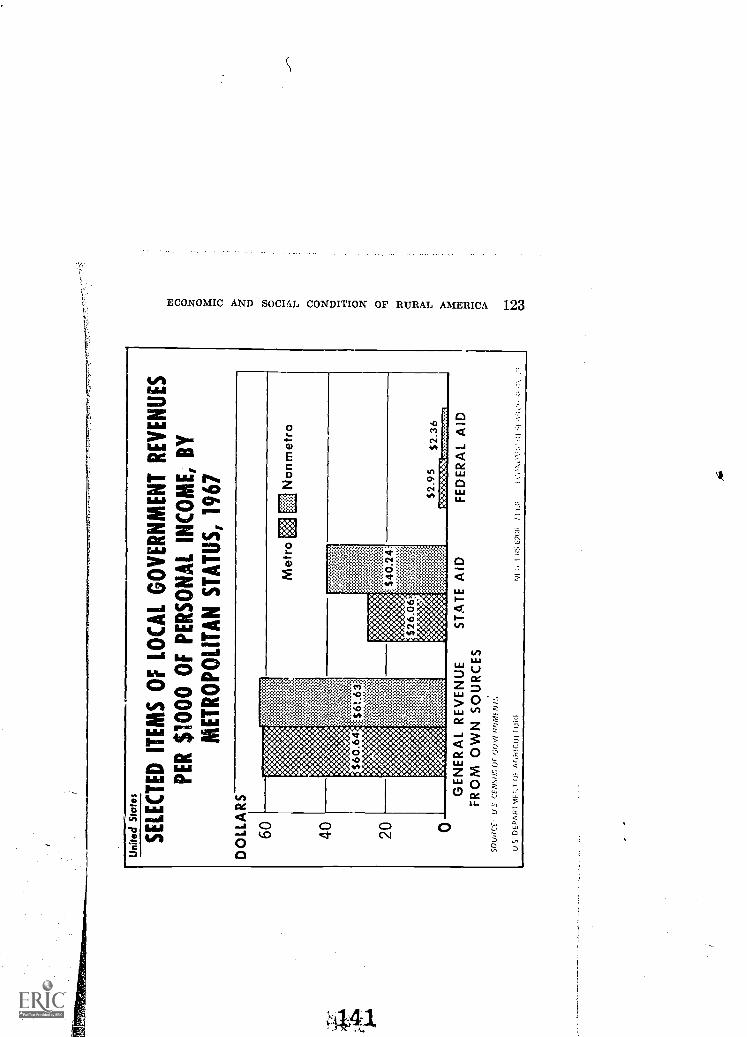
Uni
ted
Sta
tes
SE
LEC
TE
D IT
EM
S O
F L
OC
AL
GO
VE
RN
ME
NT
RE
VE
NU
ES
PE
R $
1000
OF
PE
RS
ON
AL
INC
OM
E, B
YM
ET
RO
PO
LIT
AN
ST
AT
US
, 196
7
Met
ro §
titi
Non
met
ro
GE
NE
RA
L R
EV
EN
UE
ST
AT
E M
DF
RO
M O
WN
SO
UR
CE
SS
O ll
r?C
'EU
S C
EN
SU
S O
F D
OV
E k
iVM
E N
EL
US
DE
PA
RT
MF
NT
qi A
l,1:1
CU
L T
UF
O
$2.9
5$2
.36
Min
3:7M
.rn=
nr=
tF
ED
ER
AL
AID
NI I
.87
G6
I
124 ECONOMIC AND SOCIAL CONDITION OF RURAL AMERICA
Relative Revenue Effort in Individual States, by Level ofGovernment, 1966-67
A recent study by the Advisory Commission on IntergovernmentalRelations calculated the rates for an average State-local revenue sys-tem in the Unitr.d. States. The Commission then applied these rates tothe revenue base in each State, to obtain a measure of revenue capacity.
The accompanying table shows actual State and local revenues as apercentage of this measure of capacity. An index of 100 means that aState has an average revenue effort ; an index above 100 means the State"tries harder."
Revenue efforts are variable in different regions of the country. Forexample, the States of the Rocky Mountains and Far West regionstend to be somewhat above average, but two of them are more than 10points below average. Minnesota and Wisconsin, among the Mid-western States, are significantly above average, but Illinois and Ohioare below. There is some tendency for the Southeastern States to ranklow, but Mississippi is slightly above the average, and most of theremaining States are near average.
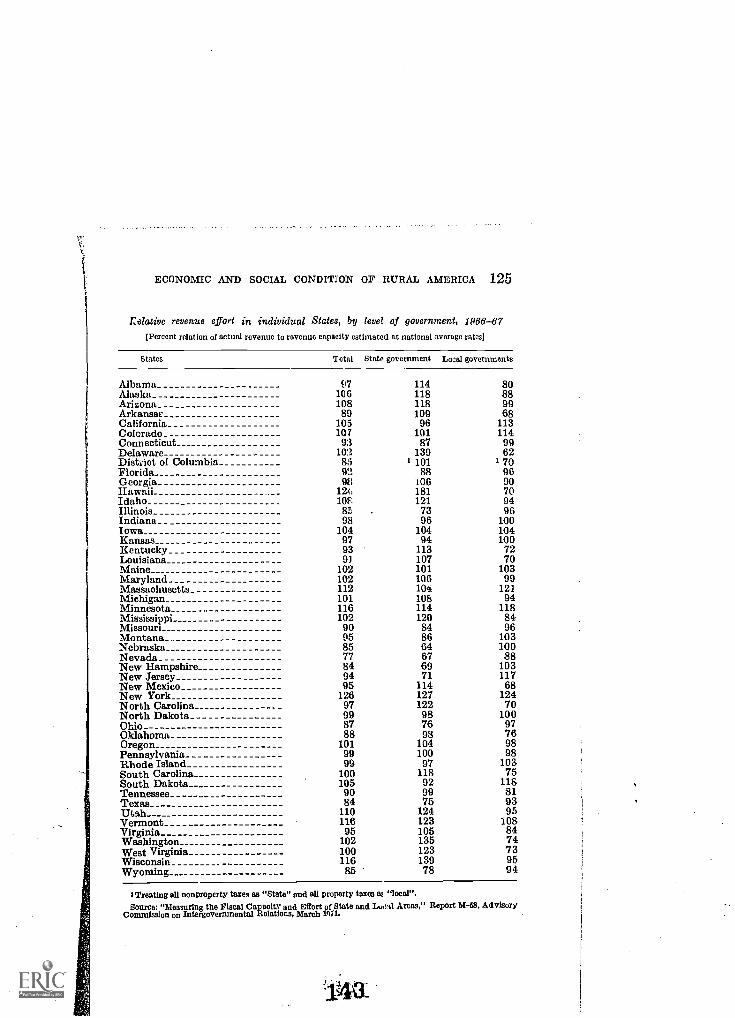
ECONOMIC AND SOCIAL CONDITION OF RURAL AMERICA 125
Relative revenue effort in individual States, by level of government, 1986-67[Percent relation of actual revenue to rovenuo capacity estimated at national average rates]
States Total State government Local governments
Albama li7 114 80Alaska 106 118 88Arizona 108 118 99Arkansar 89 109 68California 105 96 113Colorado 107 101 114Connecticut 93 87 99Delaware 102 139 62District of Columbia 85 1 101 1 70Florida 92 88 96Georgia 98 106 90Hawaii 12: 181 70Idaho 10F. 121 94Illinois 85 73 96Indiana 98 96 100Iowa 104 104 104Kansas 97 94 100Kentucky 93 113 72Louisiana 9l 107 70Maine 102 101 103Maryland 102 106 99Massachusetts 112 104 121Michigan 101 106 94Minnesota 116 114 118Mississippi 102 120 84Missouri 90 84 96Montana_.. 95 86 103Nebraska 85 64 100Nevada 77 67 88New Hampshire 84 69 103New Jersey 94 71 117New Mexico 95 114 68New York 126 127 124North Carolina 97 122 70North Dakota 99 98 100Ohio 87 76 97Oklahoma_ 88 98 76Oregon 101 104 98Pennsylvania 99 100 98Rhode Island 99 97 103South Carolina 100 118 75South Dakota 105 92 115Tennessee 90 99 81Texas 84 75 93Utah 110 124 95Vermont 116 123 108Virginia 95 105 84Washington 102 135 74West Virginia 100 123 73Wisconsin 116 139 95Wyoming_ 85 78 94
:Treating all nonproperty taxes as "State" and all property taxes as "local".Source: "Measuring the Fiscal CapaoitY and Effort of State and L....11 Areas," Report M -68, Advisory
Commission on Intergovernmental Relations, March 1e71.
126 ECONOMIC AND SOCIAL CONDITION OF R-ott,,T. AMERICA
Measures of Relative Nonproi, arty Tax Capacity, for States,1960 and 1966-67
Capacity is measured here in terms of the amount of taxes thatcould be raised if the State imposed a tax system like the average.,ystem used by State and local governments in the United States. Fortechnical reasons, it was not possible to include the property tax basein the comparison.
Several conclusions emerge from these data. There has been sometendency toward a narrowing of interstate differences in taxable ca-pacity, but changes in capacity are, by and large, slow. ',egionally,the States of the Southeast have gained capacity, but st-eral of theGreat Plains and Intermountain States have lost.
Perhaps the most important conclusion is that there are still im-portant differences in the capacity of State and local governments tosupport adequate public services.

ECONOMIC AND SOCIAL CONDITION OF RURAL AMERICA 127
Measures of relative nonproperty tax capacity, for Sta.,e, 1960 and 1966-67
Index of per capita capacity (U.S.=100)State 1960 1066-67 Difference
Alabama 69 73 1-4Alaska 84 102 + 18Arizona 92 95 +3Arkansas 70 79 +9California 119 118 1Colorado 110 106 4Connecticut 115 116 +1Delaware 119 120 +1District of Columbia 138 120 18Florida 100 102 +2Georgia 75 85 +10Hawaii 76 90 +14Idaho 98 95 3Illinois 112 112 0Indiana 97 102 +6Iowa 96 99 +3Kansas 106 101 5Kentucky 76 81 +5Louisiana.. 97 101 +4Maine 85 87 +2Maryland 94 102 +8Massachusetts 101 101 0Michigan 100 105 +5Minnesota 100 99 1Mississippi 60 67 +7Missouri 102 99 3Montana 111 103 8Nebraska 103 104 +1Nevada 149 181 +32New Hampshire 101 112 ±11New Jersey 109 107 2New Mexico 105 100 5New York 111 103 8North Carolina 74 81 +7North Dakota 98 98 0Ohio 101 100 1Oklahoma 102 101 1Oregon 104 105 +1Pennsylvania 94 93 1Rhode Island 94 96 +2South Carolina_ 66 74 +8South Dakota 91 87 4Tennessee 75 81 +6Texas 113 105 8Utah 93 86 7Vermont 88 97 +9Virginia 83 86 +3Washington 103 106 +3West Virginia 78 76 2Wisconsin 96 94 2Wyoming 154 143 11
Source: Ibid.
5
128 ECONOMIC AND SOCIAL CONDITION OF RURAL AMERICA
Total Employees of Federal and State-Local Governments,United States, 1951-69
State and local employment has risen sharply during the post-WorldWar II period, but Federal employment has changed very little. Stateand local employment in education, health and hospitals, and publicwelfare has shown particularly strong growth.
These trends mirror the strong upsurge in public demand for serv-ices provided by States and by local governments. The steady expan-sion in this demand, together with revenue sources which tend to re-main rather fixed, has led to the present "fiscal crisis" at the State andlocal levels, and to the strong interest in some quarters in Federalrevenue-sharing.
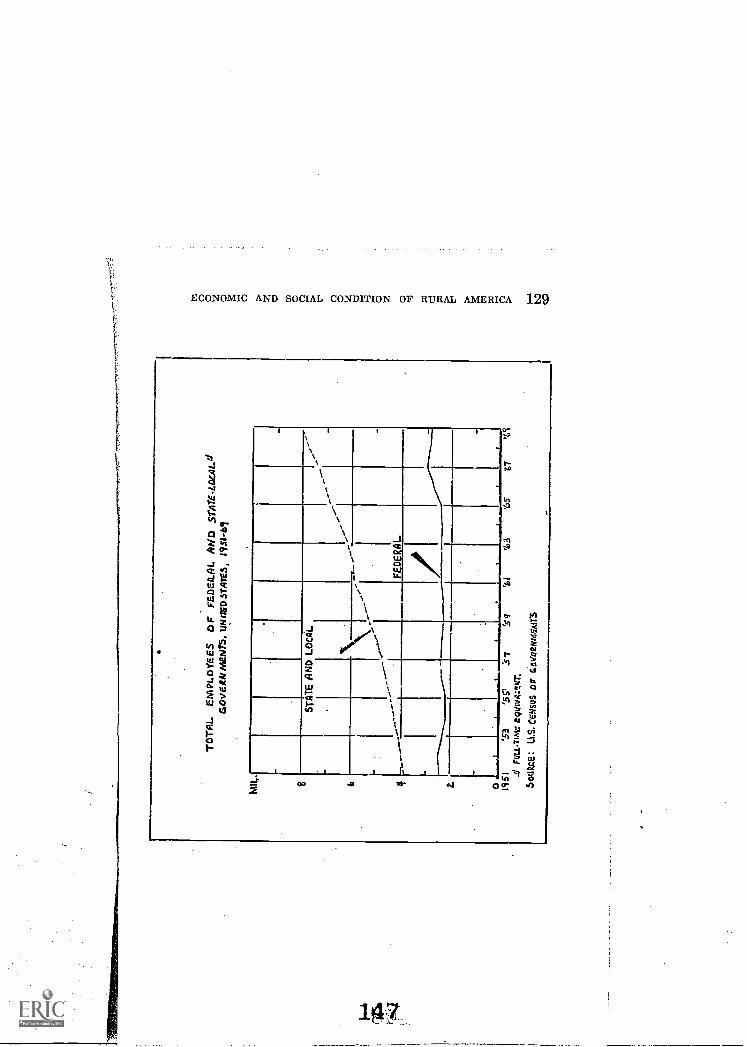
4
TO
TA
L E
MPL
OY
EE
S O
F FE
DE
R.A
L A
ND
SrA
TE
1144
t-d
GO
VE
RN
ME
NT
S. U
N r
in S
TA
TE
S,
1951
-14
STA
TE
AN
D L
OC
AL
1951
'53
'551
37FU
LL
.TIM
E e
gtlI
VA
VIN
T.
SCU
MS:
U.S
. CE
NSU
S 0
Gov
a2N
t8ai
r5
61'6
5'4
4
tC
130 ECONOMIC AND SOCIAL CONDITION OF RURAL AMERICA
VI. .AREAWIDE PLANNING AND DEVELOPMENTDISTRICTS
Multi-county planning and development districts have been desig-nated for a variety cf purposes by many different State and Federalagencies. Some of these districts adhere to common boundaries andoperate through a single district organization; but many d not. Themaps that follow show the locations of local districts organized undera few of these programs.
The final map in the series shows metropolitan and regional clear-inghouses established under OMB Circular A-95. It is through theseclearinghouses that the Federal government is now seekin,z; to attaina higher order of program coordination. The present network in-cludes over 350 metropolitan and regional (nonmetropolitan) clear-inghouses covering nearly one-half of the Nation's counties and about85 percent of the population.
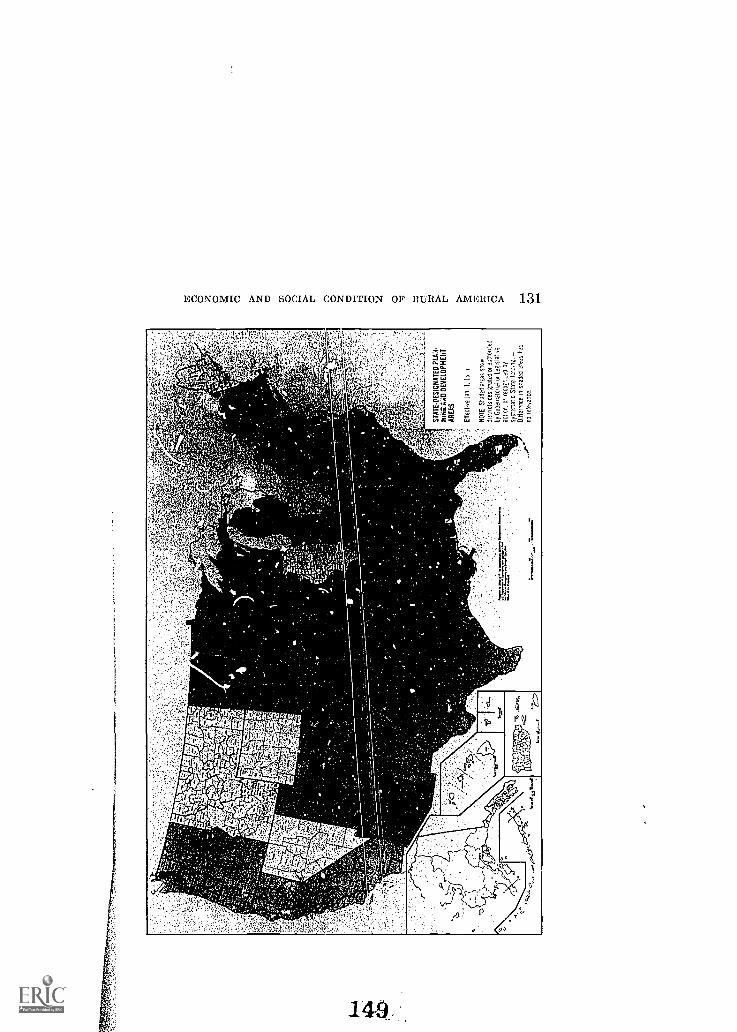
ECONOMIC AND SOCIAL CONDITION OF RURAL AMERICA 131
140
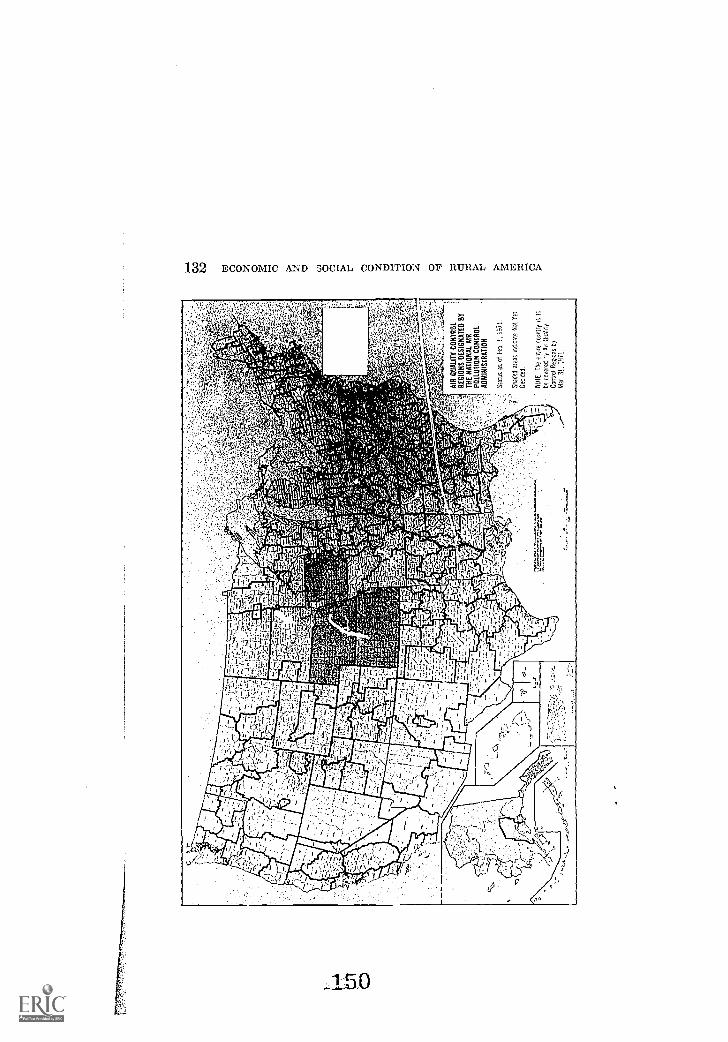
132 ECONOMIC AND SOCIAL CONDITION OF RURAL AMERICA
_150

I I
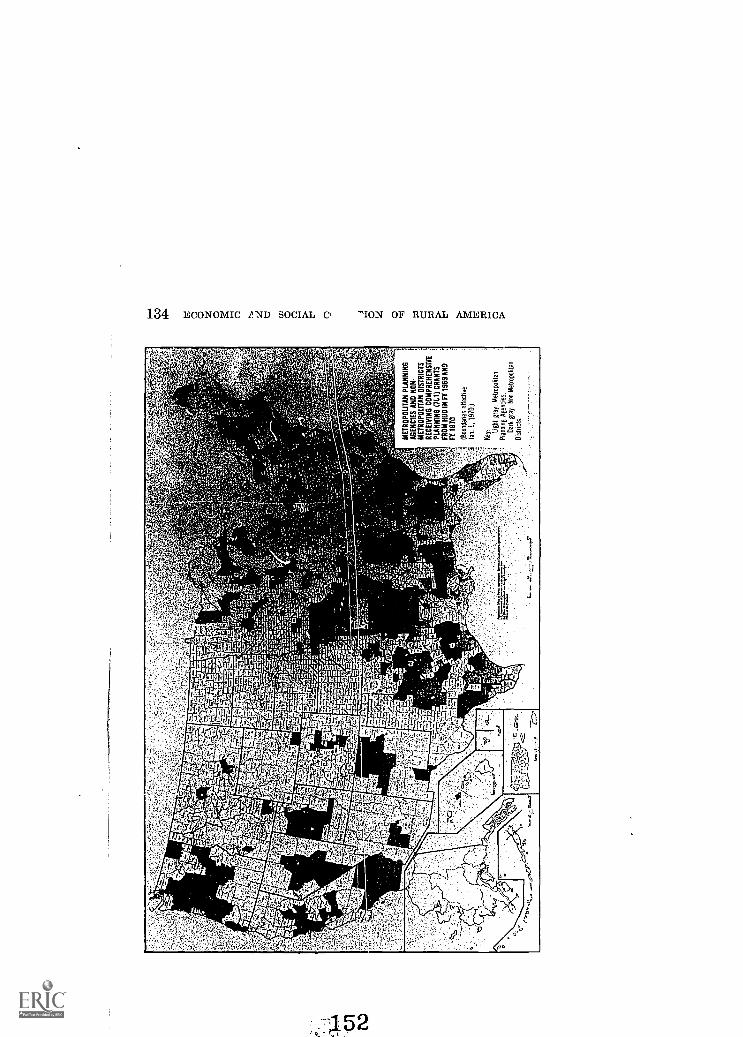
134 ECONOMIC 4ND SOCIAL C, -"ION OF RURAL AMERICA
452
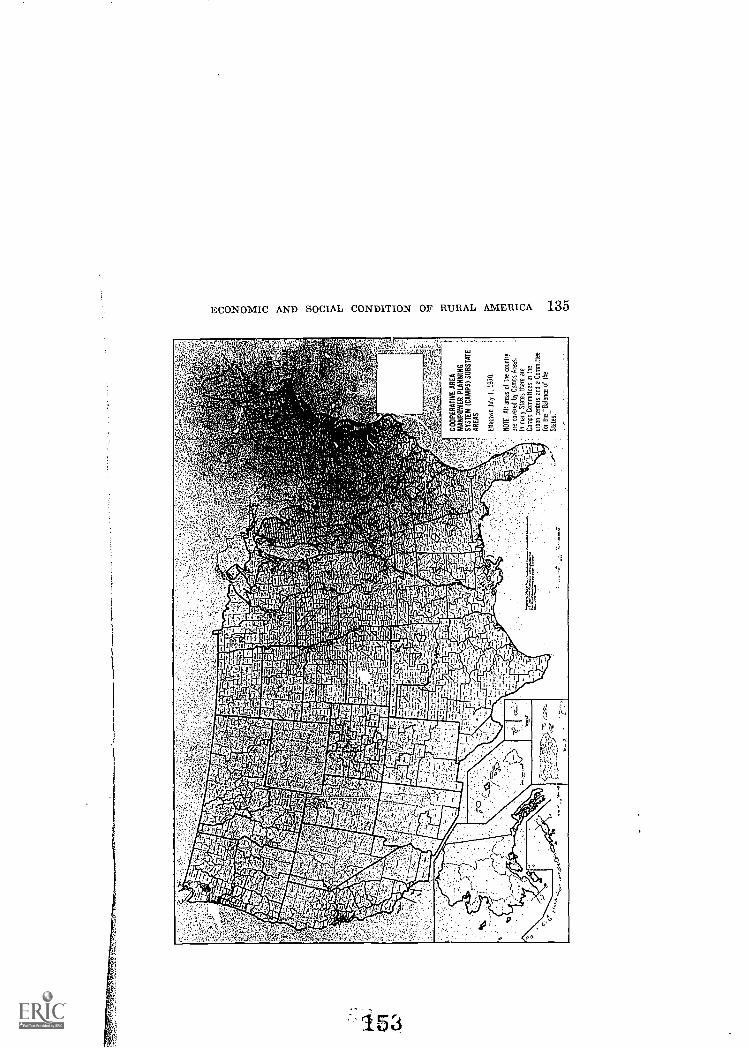
ECONOMIC AND SOCIAL CONDITION OF RURAL AMERICA 135
153
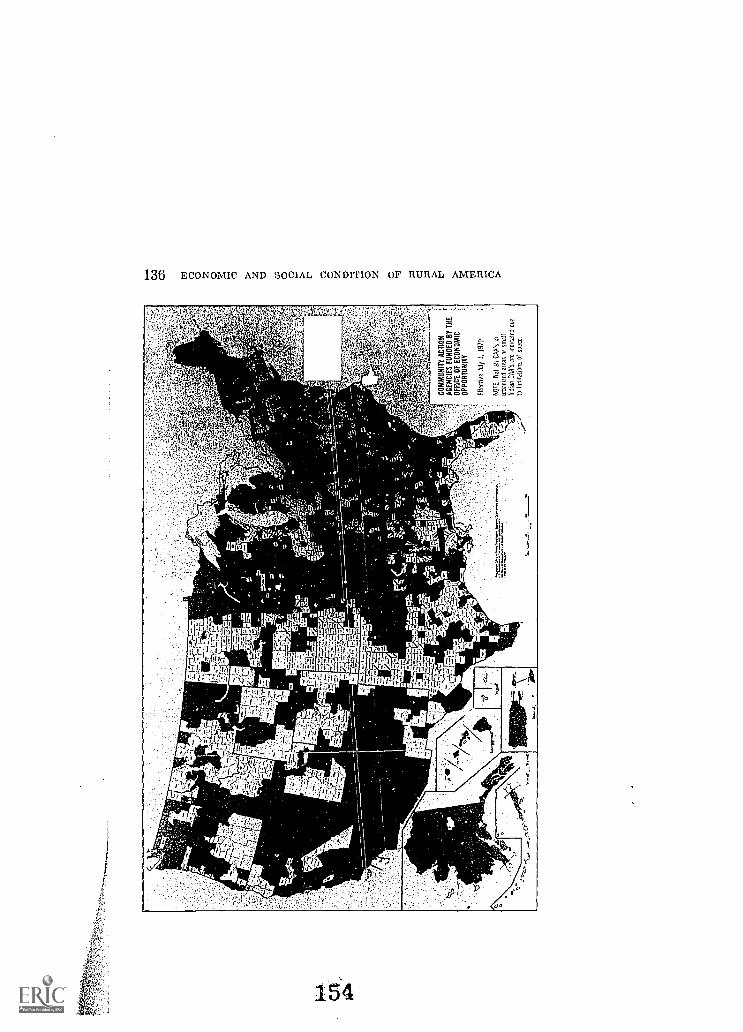
136 ECONOMIC AND SOCIAL CONDITION OF RURAL AMERICA
154
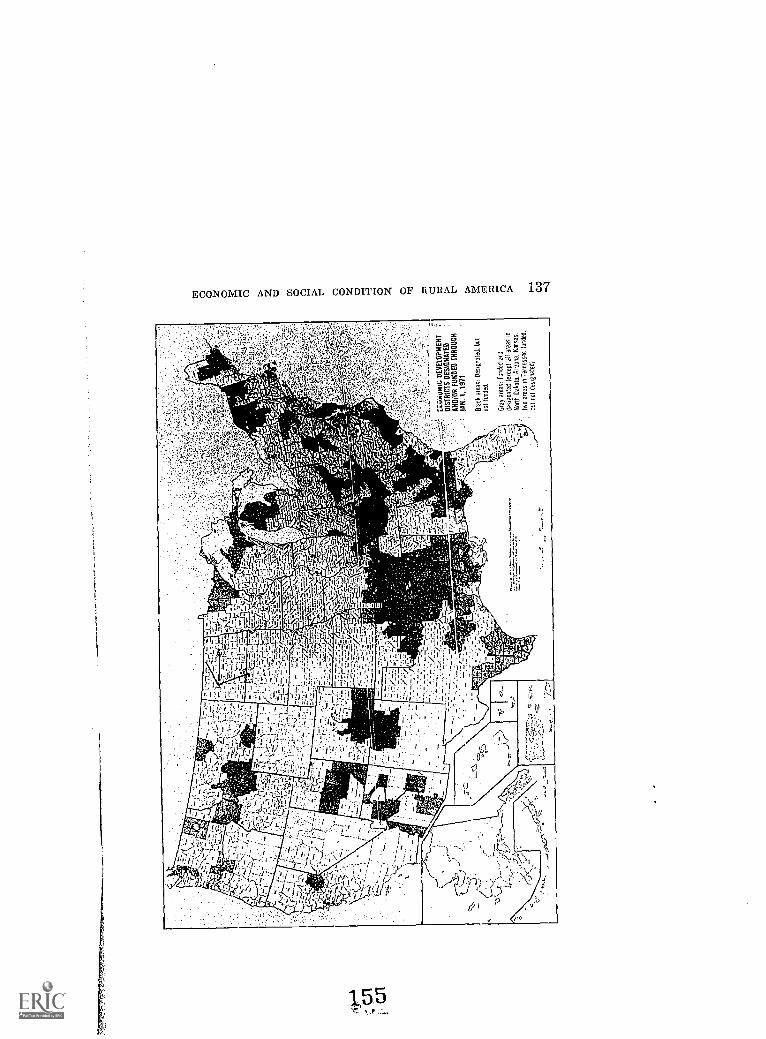
ECONOMIC AND SOCIAL CONDITION OF liURAL AMERICA 137
15,5
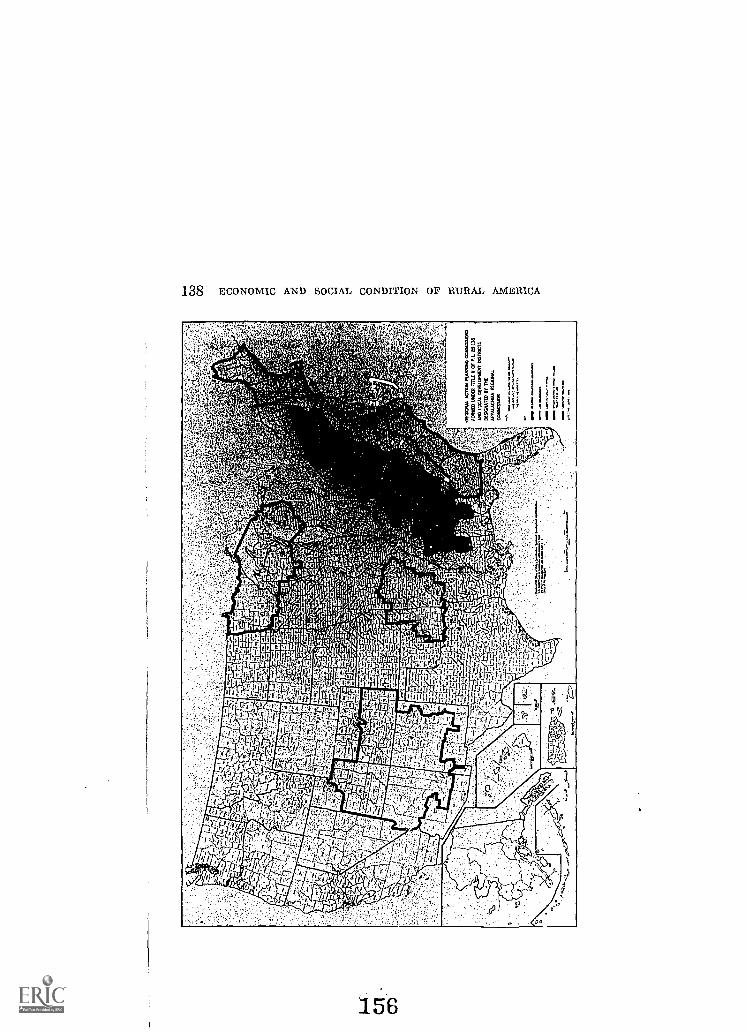
aI
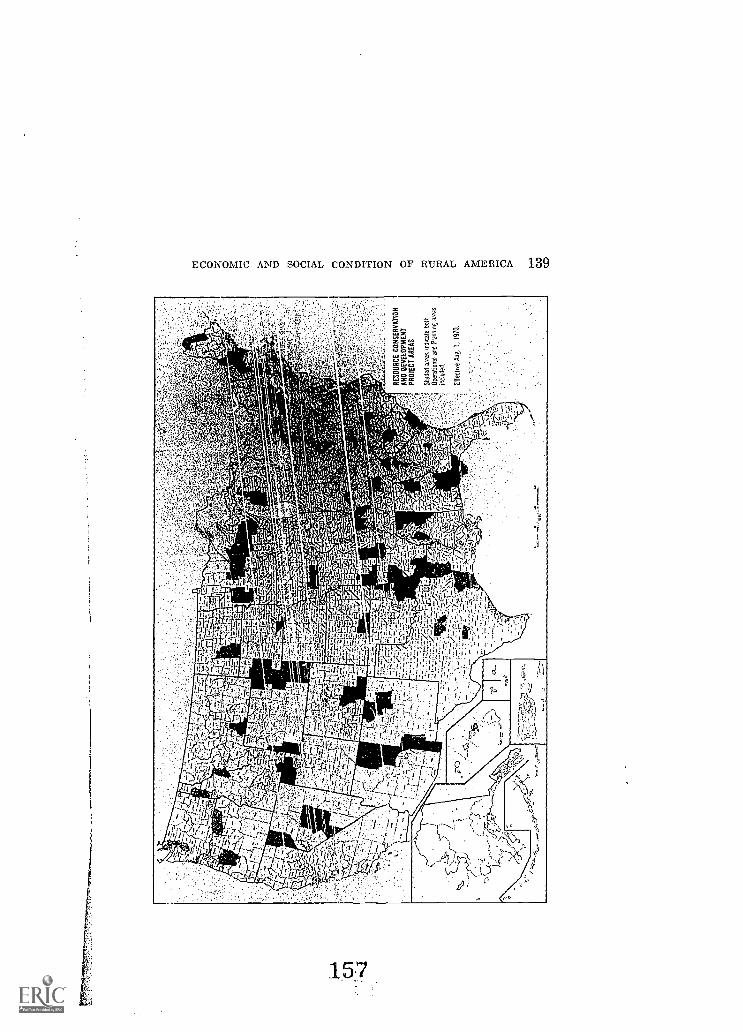
ECONOMIC` AND SOCIAL CONDITION OF RURAL AMERICA 139
157
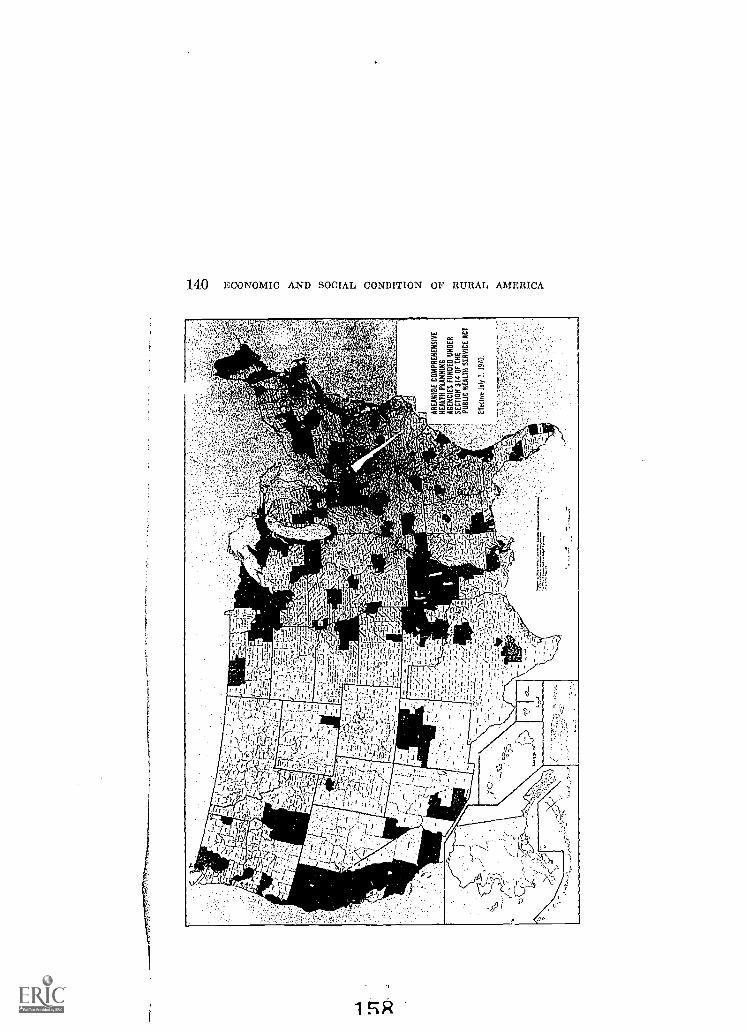
140 ECONOMIC AND SOCIAL CONDITION OF RURAL AMERICA
15R

ECONOMIC AND SOCIAL CONDITION OF RURAL AMERICA 141
159
![[XLS]tax.vermont.govtax.vermont.gov/sites/tax/files/documents/SPAN Data List... · Web view015-005-10947 015-005-10091 015-005-11649 015-005-10773 015-005-11222 015-005-10889 015-005-11109](https://img.pdfslide.us/doc/110x75/5ac161e67f8b9a5a4e8d129a/xlstax-data-listweb-view015-005-10947-015-005-10091-015-005-11649-015-005-10773.jpg)