Embed Size (px)
Citation preview

DOCUMENT RESUME
ED 223 827 CE 034 347
AUTHOR Fall, John C.; And OthersTITLE The Out-of-State Placement of Children: Western State
Profiles. Major Issues in Juvenile JusticeInformation and Training.
INSTITUTION Academy for Contemporary Problems, Columbus, Ohio.SPONS AGENCY National Inst. for Juvenile Justice and Delinquency
Prevention (Dept. of Justice/LEAA), Washington,D.C.
REPORT NO NCJ-80816PUB DATE 82GRANT 78-JN-AX-0038NOTE 278p.; For related documents see CE 034 348 and CE
034 395-402.PUB TYPE Reports - Research/Technical (143) -- Information
Analyses (070)
EDRS PRICE MF01/PC12 Plus Postage.DESCRIPTORS Adolescents; *Agency Role; Children; Child Welfare;
Delinquency; *Delinquent Rehabilitation; FosterChildren; Laws; Legal Responsibility; *Placement;Public Policy; State Action; *State Agencies; StateLegislation; State (Uncials; State Programs; StatesPowers; State Standards; State Surveys; StatewidePlanning
IDENTIFIERS *Out of State Placement of Children; *United States(West)
ABSTRACTThis document, 1 in a series of 10, presents state
profiles of the results of a systematic examination of child careagencies and their involvement with out-of-state residential care forchildren. This volume contains profiles of the Western states ofAlaska, Arizona, California, Hawaii, Idaho, Montana, Nevada, Oregon,Utah, Washington, and Wyoming. Each state profile contains fivesections. The first two sections identify the officials in stategovernment who facilitated the completion of the study and describethe general methodology used to collect the information presented.The third section offers a basic description of the organization ofyouth services as they relate to out-of-state placement policies. Thefourth section offers annotated tables about that state'sout-of-state placement practices. The discussion of the surveyresults includes: (1) theAlumber of children placed in out-of-stateresidential settings; (2) the out-of-state placement practices oflocal agencies; (3) detailed data from agencies that placed five ormore children; (4) use of interstate compacts by state and localagencies; (5) the out-of-state placement practices of state agencies;and (6) state agencies' knowledge of out-of-state placement. Thefinal section presents observations and conclusions about state andlocal out-of-state placement practices that were gleaned from thedata. (Data reported are for 1978.) (KC)
MAJOR ISSUES IN JUVENILE JUSTICEINFORMATION AND TRAININGThe Out-of-State Placement of Children:
Western State ProfilesAloska Arizona California Hawaii Idaho Montana
Nevada Oregon Utah Washington Wyoming
AlRHORS
John C. Hall, Principal Invesfigator
Bruce S. Barker, Research Associate
Molly A Parkhill, Research Associate
Judith L Pllotta, Research AssociateJoseph L White, Project Director
Academy for Contemporary ProblemsColumbus, Ohio
4982
U.S. DEPARTMENT OF EDUCATIONNATIONAL INSTITUTE OF EDUCATION
EDUCATIONAL RESOURCES INFORMATIONCENTER IERICI
"vs/This document has been reproduced asreceived from the person or organization
originating it,Minor changes have been made to improve
reproduction quality.
Points of view or opinions Sta ted in this docu.
went do not necessarily represent official NIE
position or policy.
U.S. Department of Justice
Office of Juvenile Justice and Delinquency Prevention
National Institute for Juvenile Justice and Delinquency Prevention
Staff
Kathryn BaybuttLisa BeachKaren BellBrenda S. BrownSandra ClapsaddleSherry FlanneryJack Foster, Ph.D.Sandra GardnerLori GilbertRosetta GoodenElizabeth GrayJean GriggsGina HoyKathy KuechenmeisterFred McKinneyKaren Morgan
John MurphyWayne MurphyRamon R. Priestino, Ph.D.Marian RadebaughMarcia RammSylvia RobinsonGrant SavageAndrew SchneidermanBruno S. Sestito, Jr.Peggy Siegel, Ph.D.Joan SuttnerJames N. Upton, Ph.D.Susan WarnerKurt WeilandDavid Wilder
Prepared under Grant Number 78-JN-A X-0038 from the National Institute for Juvenile Justice and Delinquency Prevention,Office of Juvenile Justice and Delinquency Prevention. U.S. Department of Justice.
Points of view or opinions in this document are those of the authors and do not neCessarily represent the official position or policiesof the U.S. Department of Justice, the Academy for Contemporary Problems, its member organizations. or the Academy'sProject MUT Advisory Committee members.
The Office of Juvenile Justice and Delinquency Prevention reserves the right to reproduce. publish, translate, or otherwise use,and to authorize others to publish and use, all or any part of the original materials contained in thk publication.
Printed in the United States of America
Library of Congress Catalog Card Number: 81-65995
Graphic arts by Production Circuit, Inc.
Logo design by Sara Halt
NCJ-80816

ABOUT THE STATE PROFILES
This is one of six volumes which report the most ambitious study of the
out-of-state placement of children ever undertaken in America. The master volume,
The Out-of-State Placement of Children: A National Survey, contains the main text
of the study report, plus appendixes which explain the methodology of the study and
detail relevant interstate compacts on the subject.
Central to the usefulness of the study report, however, is the use of the
detailed profiles of out-of-state placement practices in the 50 States and in the
District of Columbia. This volume contains, in the order listed, these State
profiles:
AlaskaAK
ArizonaAZ
CaliforniaCA
HawaiiHI
IdahoID
MontanaMT
NevadaNV
OregonOR
UtahUT
WashingtonWA
WyomingWY
Other volumes, as listed in the master volume, report on North Central, South
Central, Northeastern, and Southeastern States. A further report on the study, in
two volumes,,is called Out-of-State Placement of Children: A Search far Rights,
Boundaries, Services.
Each state profile presents the results of a systematic examination of their child care agencies and
their involvement with out-of-state residential care for children. The information is organized in a
manner which will support comparisons among agencies of the same type in different counties or among
different types within the state. Comparisons of data among various states, discussed in Chapter 2, are
based upon the state profiles that appear here.
The states, and the agencies within them, differed markedly in both the manner and frequency of
arranging out-of-state placements in 1978. The organizational structures and the attendant policies also
varied widely from state to state. Yet, all .state governments had major responsibilities for regulating
the placements of children across state lines for residential care. The methods employed by state
agencies for carrying out these responsibilities and their relative levels of effectiveness in achieving
their purposes can be ascertained in the state profiles. As a result, the state profiles are suggestive
of alternative policies which agencies might select to change or improve the regulation of the
out-of-state placement of children within their states.
Descriptive information about each state will also serve to identify the trends in out-of-state
placement policy and practice discussed in Chapter 2. State governments can and do constitute major
influences upon the behavior of both state and local public agencies as they alter their policies,
funding patterns, and enforcement techniques. The effects can be seen in changes in the frequencies with
which children are sent to live outside their home states of residence. Ideally, these state
profiles will serve as benchmarks for measuring change, over time, 4ith respect to the involvement of
public agencies in arranging out-of-state placements.
CONTENTS OF THE STATE PROFILES
Each profile contains four sections. The first two sections identify those officials in state
government who facilitated the completion of the study in the particular state. These sections also

describe the general methodology used to collect the information presented. The third section offers abasic description of the organization of youth services as they relate to out-of-state placementpolicies. The fourth section offers annotated tables about that state's out-of-state placementpractices. The discussion of the survey results include:
The number of children placed in out-of-state residential settings.The out-of-state placement practices of local agencies.Detailed data from Phase II agencies.Use of interstate compacts by state and local agencies.The out-of-state placement practices of state agencies.State agencies' knowledge of out-of-state placement.
The final section presents some final observations and conclusions about state and local out-of-stateplacement practices that were gleaned from the data.
It is important to remember when reading the state profiles that the tables contain self-reporteddata for 1978, collected by the Academy in 1979. They may not reflect all organizational changes thathave occurred since that time and the data might be at variance with reports published after this surveywas completed.

A PROFILE OF OUT-OF-STATE PLACEMENT POLICY AND PRACTICE IN ALASKA
I. ACKNOWLEDGMENTS
The Academy gratefully acknowledgesthe assistance of the many state and local public officials who
contributed their time and effort to the project, particularly Mike Mosher, Program Manager, Office for
Exceptional Children, Depar*ment of Education; James Scoles Compact Administrator, Division of Mental
Health and Developmental Disabilities, Department of Heaeth and Social Services; Amy Webb, Deputy
Interstate Compact Coordinator, and Lew Reece, Alternative Care Coordinator, Division of Corrections,
Department of Health'and Social Services; William Hitchock, Master of Juvenile Matters, Alaska State
Court; and Nina Kinney, ICPC Coordinator, Department of Health and Social Services.
II. METHODOLOGY
Information was systematically gathered about Alaska from a variety of sources using a number of data
collection techniques. First, a search for relevant state statutes and case law was undertaken. Next,
telephone interviews were conducted with state officials who were able to report on agency policies and
practices with regard to the out-of-state placement of children. A mall survey was used, as a follow-up
to the telephone interview, to solicit information specific to the out-of-state placement practices of
state agencies and those of local agencies subject to state regulatory control or supervisory oversight.
An assessment of out-of-stateplacement policies and the adequacy of information reported by state
agencies suggested further survey requirements to determine .the involvement of public ogencies In
arranging out-of-state placements. Pursuant to this assessment, further data collection was undertaken
if it was necessary to:
verify out-of-state placement data reported by state government about local agencies; and
collect local agency data which was not available from state government.
A summary of the data collection effort in Alaska appears below in Table 02-1.
TABLE 02-1. ALASKA: METHODS OF COLLECTING DATA
Levels ofGovernment
ChildWelfare
Survey Methods, by Agency TypeJuvenTle mental Healtn and
Education Justice Mental Retardation
State TelephoneAgencies Interview
LocalAgencies
Mailed Survey:DHSS Officials
TelephoneInterview
Mailed Survey:DOE Officials
Not Applicable Telephone(State Offices) Survey:
All 52 schooldistricts
TelephoneInterview
Mailed Survey:DHSS Officials
Telephor9Interview
Mailed Survey:DHSS Officials
Not Applicable Not Applicable(State Offices) (State Offices)
Al< -1
1.4
The Academy also conducted an intensive on-site case study In Alaska. The results from the casestudy are included In a companion publication entitled The Out-of-State Placement of Children; A Searchfor_Rights, Boundaries Services.
III. THE ORGANIZAT1CM OF SERVICES AND OUT-OF-STATE PLACEMENT POLICY'IN 1978
A. Introductory Remarks
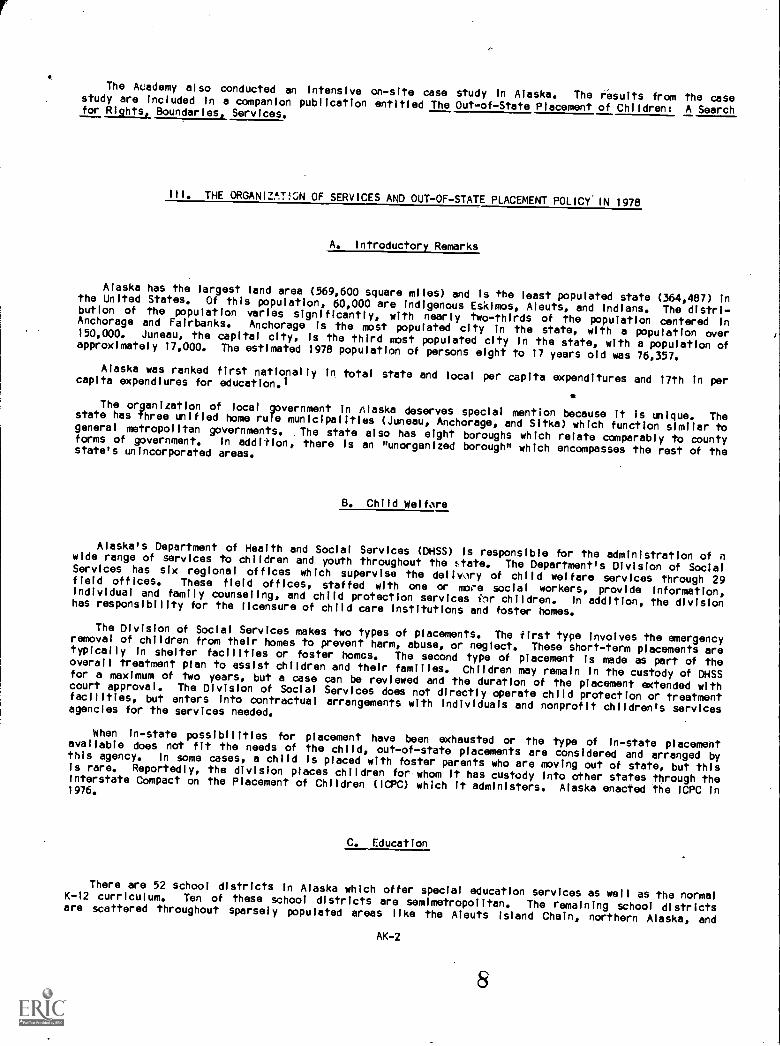
Alaska has the largest land area (569,600 square miles) and Is the least populated state (364,487) Inthe United States. Of this population, 60,000 are indigenous Eskimos, Aleuts, and Indians. The distri-bution of the population varies significantly, with nearly two-thirds of the population centered InAnchorage and Fairbanks. Anchorage Is the most populated city In the state, with a population over150,000. Juneau, the capital city, Is the third most populated city In the state, with a population ofapproximately 17,000. The estimated 1978 population of persons eight to 17 years old was 76,357.
Alaska was ranked first nationally In total state and local per capita expenditures and 17th In percapita expendiures for education.1*
The organization of local government In Alaska deserves special mention because it Is unique. Thestate has three unified home rule municipalities (Juneau, Anchorage, and Sitka) which function similar togeneral metropolitan governments. .The state also has eight boroughs which relate comparably to oountyforms of government. In addition, there Is an "unorganized borough" which encompasses the rest of thestate's unincorporated areas.
B. Child Welfore
Alaska's Department of Health and Social Services (DHSS) Is responsible for the administration of nwide range of services to children and youth throughout the $tate. The Department's Division of SocialServices has six regional offices which supervise the delivory of child welfare services through 29field offices. These field offices, staffed with one or more social workers, provide information,individual and family counseling, and child protection services ior children. In addition, the divisionhas responsibility for the licensure of child care institutions and foster homes.
The Division of Social Services makes two types of placements. The first type Involves the emergencyremoval of children from their homes to prevent harm, abuse, or neglect. These short-term placements aretypically In shelter facilities or foster homes. The second type of placement Is made as part of theoverall treatment plan to assist children and their families. Children may remain In the custody of DHSSfor a maximum of two years, but a case can be reviewed and the duration of the placement extended withcourt approval. The Division of Social Services does not directly operate child protection or treatmentfacilities, but enters into contractual arrangements with individuals and nonprofit children's servicesagencies for the services needed.
When 1n-state possibilities for placement have been exhausted or the type of in-state placementavailable does not flt the needs of the child, out-of-state placements are considered and arranged bythis agency. In some cases, a child is placed with foster parents who are moving out of state, but thisIs rare. Reportedly, the division places children for whom It has custody into other states through theInterstate Compact on the Placement of Children (1CPC) which It administers. Alaska enacted the ICPC In1976.
C. Education
There are 52 school districts In Alaska which offer special education services as well as the normalK-12 curriculum. Ten of these school districts are semimetropolitan. The remaining school districtsare scattered throughout sparsely populated areas like the Aleuts Island Chain, northern Alaska, and
AK-2

along the western edge of the state. These areas are primarily populated by Native Alaskans and
settlers. Until recently, the practice was to place school children from these areas into programs In
the lower 48 states. It was reported that rather than attempting to remove children from these remote
areas, the practice has now been to support the local school district with additional facilities and serv-
ices.
According to other information provided by the State Department of Education (DOE), Office for
Exceptional Children (OEC), local school districts may request out-of-districtplacements when the needs
of the exceptional child cannot be met locally.However, the state will only fund.out-of-state place-
ments for those severely handicapped. This type of placement must be approved b)i the district child
study team and the Office forExceptional Children for the State Commissioner of Education. Other types
of placements (e.g.,learning disabilities and gifted children) are funded either by parents or totally
by the school district andtherefore do not need approval of the Department of Education.
D. Juvenile Justice
Jurisdiction over dependent, neglected, and delinquent children is held by state superior courts,
organized into four districts. Judicial statute 4710.0, Section 2047, requires that all juveniles on
probation or parole be placed in the custody of the commissioner of Alaska's Department of Health and
Social Services (DHSS).
The Division of Corrections (DOC) wi
services to juveniles. The division mai
Anchorage. In addition, probation and
and several field offices. When a res
regional classification committee conspublic defenders, and others, to select
thin DHSS is responsible for probation, parole, and Institutional
ntains one juvenile correctioncenter, McLaughlin Youth Center In
parole services are administered by the DOC through six regions
idential placement needs to be made, the commissioner appoints a
!sting of a regional administrator, probatfon officers, judges,
an appropriate placement.
Alaska has been a member of the Interstate Compact on Juveniles (ICJ) since 1960 which Is
administered by the DOC.
E. Mental Health and Mental Retardation
Alaska's mental health and mental retardation services are the responsibility of the Division of
Mental Health and Developmental Disabilities (DMHDD) in the Department of Health and Social Services
(DHSS). The demand has established 21 local community mental health districts which are subsidized by
state funds from the Conmunity Health Services Act. Every mental health district submits a yearly plan
to the DMH00 for funding.According to DMHDD regulations, the state-to-local matching ratio is 90-10 in
designated poverty areas. In designated nonpoverty areas, the state-to-local matching ratio is 75-25
percent. In 1978 there were no mental health districts offering direct services to the community;
rather, a network of privateproviders were funded to deliver services.
The division reports that It does place children out of state on a voluntary basis or through
assisting the child's parents or guardians. Other out-of-state placementsmay involve the transfer of
patients from Aiaska state hospitals to state hospitals in other states. This latter type of placement
Is arranged through the Interstate Compact on Mental Health (1CMH) which Alaska adopted in 1959. The
ICMH Is administered by the DMHDD.
IV. FINDINGS FROM A SURVEY OF OUT-OF-STATE PLACEMENT PRACTICES IN 1978
The survey of Alaska state and local public agenciesresulted In the findings discussed and tabularly
displayed in the following sections. The information is presented in a manner to highlight the major
questions regarding public agencies' Involvement with the out-of-state placement of children.
AK-3
9

A. The Number of Children Placed In Out-of-State Residential Settings
Table 02-2 gives an overview of the total number of out-of-state placements of children reported byAlaska state and local public agencies, by agency type, In 1978. Unfortunately, the DHSS Division ofSocial Services was unable to report the number of children it placed out of state in 1978, although suchplacements were arranged. Therefore, the total of 85 placements displayed In Table 02-2 Is anunderrepresentation of the actual sum.
Table 02-2 shows the State Department of Education did not arrange any out-of-state placements in1978; however, the local school districts reported being involved In 11 such placements during that year.It can also be seen that the DHSS Division of Corrections reported arranging 74 placements fc, i. childrenoutside of Alaska while the Division of Mental Health andDevelopmental Disabilities had no involvementwith placements.
TABLE 02-2. ALASKA: NUMBER OF OUT-OF-STATE PLACEMENTSARRANGED BY STATE AND LOCAL PUBLIC AGENCIESIN 1978, BY AGENCY TYPE
Levels ofGovernment
Number of CHILDREN, by Agency TypeChild
Welfare EducationJuvenileJustice
Mental Health andMental Retardation Total
State AgencyPlacementsa
Local AgencyPlacements
Total
0
- 11
11
74
74
0
0
74
11
85
* denotes Not Available.-- denotes Not Applicable.
a. May include placements which the state agency arranged and funded inde-pendently or under a court order, arranged but did not fund, helped arrange, andothers directly Involving the state agency's assistance or knowledge. Refer toTable 02-9 for specific Information regarding state agency Involvement inarranging out-of-state placements.
Table 02-3 displays the geographic area or division included within the jurisdiction of the 52 Alaskaschool districts and Its estimated 1978 population of persons eight to 17 years old. Therefore, thetable allows for an examination of the relationship betweengeography, population, and the 1978 incidenceof out-of-state placements arranged by the state's school districts. It is important to bear In mindthat the jurisdiction of school districts contacted is smaller than the divisions containing them. Forthat reason, multiple agencies may have reported from each division and the incidence reports In the tableare the aggregated reports of all within them. It Is important to note that school districts In the twodivisions with the largest juvenile populations, Anchorage and Fairbanks, had two and four childrenplaced out-of-state, respectively. Juneau was the only other division to report more than one out-of-state placement arranged by its school districts.
AK-4
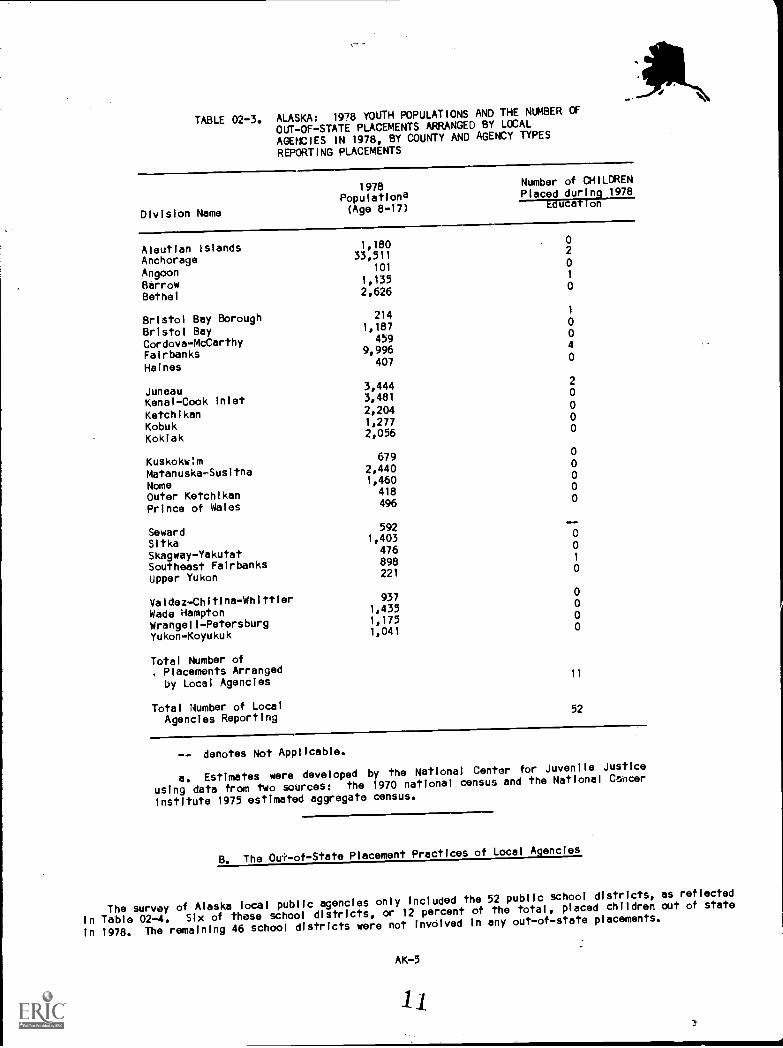
TABLE 02-3. ALASKA: 1978 YOUTH POPULATIONS AND THE NUMBER OF
OUT-OF-STATE PLACEMENTS ARRANGED BY LOCAL
AGENCIES IN 1978, BY COUNTY AND AGENCY TYPES
REPORTING PLACEMENTS
Division Name
1 978
Populationa(Age 8-17)
Number of CHILDRENPlaced during 1978
hducaTion
Aleutian Islands 1,1800
Anchorage 33,5112
Angoon101
0
Barrow 1,1351
Bethel 2,6260
Bristol Bay Borough 2141
Bristol Bay 1,1870
Cordova-McCarthy 4590
Fairbanks 9,9964
Haines407
0
Juneau 3,4442
Kenal-Cook Inlet 3,4810
Ketchikan 2,2040
Kobuk 1,2770
Kokiak 2,0560
Kuskokwim 6790
Matanuska-Susitna 2,4400
Nome1,460
0
Outer Ketchlkan 4180
Prince of Wales 4960
Seward592
Sitka1,403
0
Skagway-Yakutat476 0
Southeast Fairbanks 8981
Upper Yukon221
0
Valdez-Chitina-Whittier937 0
Wade Hampton 1,4350
Wrangell-Petersburg 1,1750
Yukon-Koyukuk 1,0410
Total Number ofPlacements Arrangedby Local Agencies
11
Total Number of LocalAgencies Reporting
52
-- denotes Not Applicable.
a. Estimates were developed by the National Center for Juvenile Justice
using data from two sources: the 1970 national census and the National Cancer
Institute 1975 estimated aggregate census.
B. The Ovi-of-State PlacementPractices of Local Agencies
The survey of Alaska local public agencies only included the 52 public school districts, as reflected
In Table 02-4. Slx of these school districts, or12 percent of the total, placed children out of state
in 1978. The remaining 46 school districts were not involved In any out-of-state placements.
AK-5

TABLE 02-4. ALASKA: THE INVOLVEMENT OF LOCAL PUBL!C AGENCIESIN ARRANGING OUT-OF-STATE PLACEMENTS IN 1978
Number of AGENCIES, by Agency TypeResponse CategoriesEducation
Agencies Which Reported Out-of-State Placements 6
Agencies Which Did Not Know If They Placed, or Placedbut Could Not Report the Number of Children 0
Agencies Which Did Not Place Out of State 46
Agencies Which Did Not Participate In the Survey 0
Total Local Agencies52
The reasons given by 46 school districts for not arranging any out-of-state placements In 1978 mayhelp to understand more fully the previously mentionedlow placement rate by these agencies. The mostpredominant reason given for not placing children outside of Alaska, reported In Table 02-5, was thatsufficient services were available within the state. This broad statement was also reflected in a largenumber of agencies commenting on there being no need for
out-of-state placements In 1978, a responseIncluded in the "Other" category 32 times.
TABLE 02-5. ALASKA: REASONS REPORTED BY LOCAL PUBLIC AGENCIESFOR NOT ARRANGING OUT-OF-STATE PLACEMENTS IN 1978
Reasons for Not PlacingChildren Out of Statea
Number of Local AGENCIES, by Reported Reasonts/
Education
Lacked Statutory Authority2
Restricted0
Lacked Funds0
Sufficient Services AvailableIn State
37
Otherb38
Number of Agencies Reporting NoOut-of-State Placements
46
Total Number of AgenciesRepresented In Survey
52
a. Some agencies reported more than one reason Nor not arranging out-of-state placements.
b. Generally included such reasons as out-of-state placements were againstoverall agency policy, were disapproved by parents, involved too much red tape,and were prohibitive because of distance.
AK-6
1 2

A great deal of Interagency cooperation to arrange out-of-stateplacwments was reported by the school
districts. All ht one school district cooperated with state agencies in order to place children out of
state In 1978. Table 02-6 reflects thisprevalence, showing.that 83 percent of the school districts
worked with some other agency to place 91 percent of the children out of state. Flve school districts
reported cooperating with the State Department of Education and one also cooperated with a state superior
vzourt.
TABLE 02-6. ALASKA: THE EXTENT OF INTERAGENCY COOPERATION
TO ARRANGE OUT-OF-STATE PLACEMENTS BY LOCAL
AGENCIES IN 1978
Number and Percentage, by Agency Type
hducationNumber Percent
AGENCIES Reporting Out-of-State Placements 6 128
AGENCIES Reporting Out-of-State Placements
with Interagency Cooperation5 83
Number of CHILDREN Placed Out of State 11 100
Number of CHILDREN Placed Out of State
with interagency Cooperation10 91
a. See Table 02-4,
The types of children which were placed out of state by school districts are reflected in Table 02-7.
Children with special education needs, understandably, was the most common condition designated.
Physical, mental, and emotional handicaps were also characteristics of these children. It is of interest
to note the involvement of one local education agency in placing a child designated as a Juvenile
delinquent. This is the same school district which cooperated with asuperior court to arrange an out-
of-state placement.
AK-7

TABLE 02-7. ALASKA: CONDITIONS OF CHILDREN PLACED OUT OFSTATE IN 1978, AS REPORTED BY LOCAL AGENCIES
Types of Conditionsa Number of AGENCIES Reporting
Education
Physically Handicapped2
Mentally Retarded or Developmentally Disabled 2
Unruly/Disruptive1
Truant0
Juvenile Delinquent1
Mentally 111/Emotionally Disturbed2
Pregnant0
Drug/Alcohol Problems0
Battered, Abandoned, or Neglected0
Adopted0
Special Education Needs3
Multiple Handicaps1
Others0
Number of Agencies Reporting6
a. SGme agencies reported more then one type of condition.
Because none of the Alaska school districts placed more than four children out of state, informationreported In other state profiles was not gathered from Alaska local agencies.
C. Use of Interstate Compacts by State and Local Agencies
It was determined that an interstate compact was never used by any of the six Alaska school districtswhich arranged out-of-state placements In 1978. The exclusion of Institutionsprimarily educational incharacter from the purview of a compact gives a likely explanation to thIs practice.
Alaska state egencies were also surveyed about the utilization of interstate compacts. Table 02-8shows that the child welfareagency (the Division of Social Services) was unable to report on compact usefor the placements with Which it was involved, a number it also could not report. However, theDepartment of Education and the state Juvenile Justice
agency (DOC) were able to supply this informationabout compact utilization. The DOE gave a similar response to the six local school districts whichreported placements, saying no child was processed through a compact In 1978. In contrast, almost 14percent of the 74 placements made by the state Juvenile Justice agency were reported to be arranged withthe use of an interstate compact.
AK-8
14

TABLE 02-8. ALASKA; UTILIZATION Cf INTERSTATE COMPACTSREPOR1:0 BY STATE AGENCIES IN 1978, BYAGENC% TYPE
ChildWelfare Education
JuvenileJustice
Total Number of State and Local Agency-
Arranged Placements * 11 74
Total Number of Compact-ArrangedPlacements Reported by State Agencies
* 0 10
Percentage of Compact-Arranged Placements * 0 14
* denotes Not Available.
D. The Out-of-State Placement Practices of State Agencies
The involvement of Alaska's state agencies in the out-of-state placement of children Is directly
related to the fact that two of these agencies, the Divisions of Social Services (DSS) and Corrections
(DOC), are the public providers 63r community services, and two contribute to the funding of local
services, the Department of Education (DOE) and the Division of Mental Health and Developmental
Disabilities (DMHDD). However, as Table 02-9 Illustrates, the ability of these state agencies to report
their involvement In arranging out-of-state placement varies. The DSS, as sole public provider of child
welfare services and as the agency responsible 6or the administration of the Interstate Compact on the
Placement of Children, was unable to provide much of the information requested In the survey. Also, the
Department of Education was only able to report about four children placed out of state by local school
districts with the use of state funds; however, these districts reported cooperating In some manner with
the DOE on the out-of-state placement of ten children.
AK-9
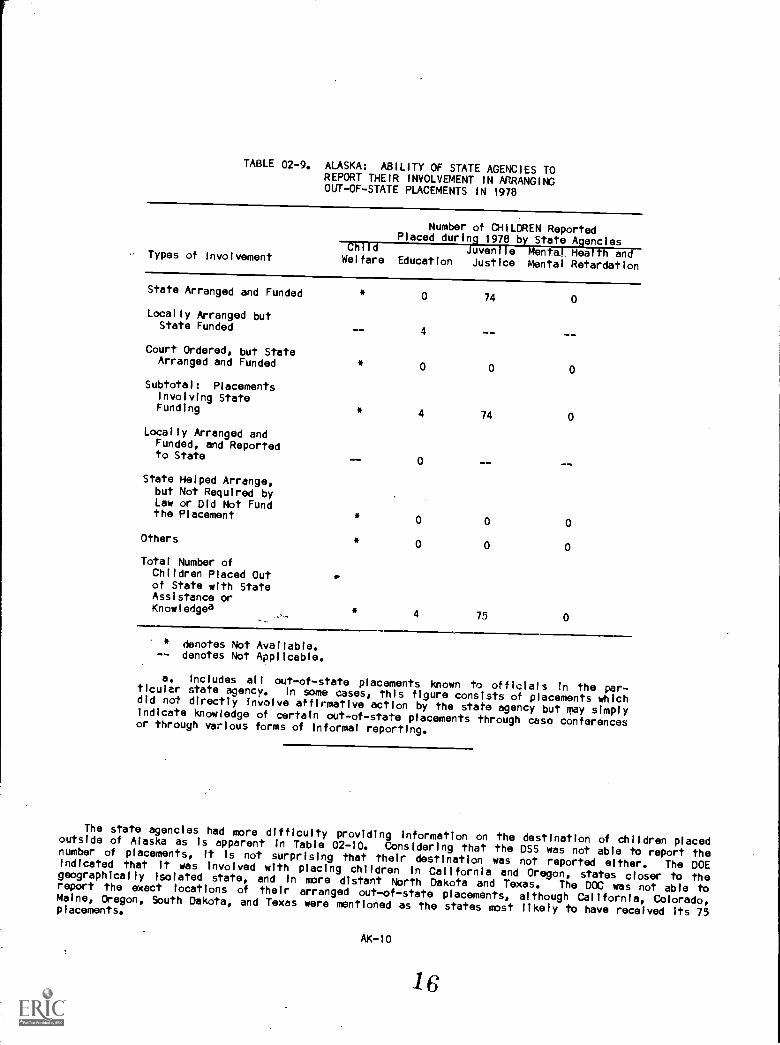
TABLE 02-9. ALASKA: ABILITY OF STATE AGENCIES TOREPORT THEIR INVOLVEMENT IN ARRANGINGOUT-OF-STATE PLACEMENTS IN 1978
Types of Involvement
Number of CHILDREN ReportedPlaced during 1978 by State Agencies
Child JUvenile Mental Health andWelfare Education Justice Mental Retardation
State Arranged and Funded * 0 74 0
Locally Arranged butState Funded -- 4
Court Ordered, but StateArranged and Funded * 0 0 0
Subtotal: PlacementsInvolving StateFunding *
4 74 0
Locally Arranged andFunded, and Reportedto State
0
State Helped Arrange,but Not Required byLaw or Did Not Fundthe Placement
Others
- -
Total Number ofChildren Placed Outof State with StateAssistance orKnowiedgea
4 75 0
* denotes Not Available.-- denotes Not Applicable.
a. Includes all out-of-state placements known to officials In the par-ticular state agency. In some cases, this figure consists of placements whichdid not directly involve affirmative action by the state agency but may simplyindicate knowledge of certain out-of-state placements through case conferencesor through various forms of informal reporting.
The state agencies had more difficulty providing information on the destination of children placedoutside of Alaska as Is apparent in Table 02-10. Considering that the DSS was not able to report thenumber of placements, it Is not surprising that their destination was not reported either. The DOEindicated that it was involved with placing children In California and Oregon, states closer to thegeographically isolated state, and in more distant North Dakota and Texas. The DOC was not able toreport the exact locations of their arranged out-of-state placements, although California, Colorado,Maine, Oregon, South Dakota, and Texas were mentioned as the states most likell to have received Its 75placements.
AK-10
16

TABLE 02-10. ALASKA: DESTINATIONS OF CHILDREN PLACED OUT
OF STATE IN 1978 REPORTED BY STATE AGENCIES,
BY AGENCY TYPE
Number of CHILDREN Placed
Destinations ofChild Juvenile
Children PlacedWelfare Education Justice
California1
North Dakota1
Oregon1
Texas1
Placements for Which DestinationsCould Not be Reported by State
AgenciesAll 0 All
Total Number of Placements4 75
* denotes Not Available.
Only two of the state agencies were able to.provideinformation about the types of children they had
helped to place out of state. The DOE's response parallels closely the local school districts' reports
of arranging out-of-state placements for physically, mentally, and emotionally handicapped children, In
Table 02-11, one can see diversity in the characteristics ofchildren placed out of state by the Division
of Corrections. This table reflects a broader scope of court Involvement than Just with children In
conflict with the taw.
TABLE 02-11. ALASKA: CONDITIONS OF CHILDREN PLACED OUT
OF STATE IN 1978, AS REPORTED BY STATE
AGEACIES, BY AGENCY TYPE
Types of Conditions
AGENCY TypeaEd ucat ion Juven119 7CPPFTZTr
Physically HandicappedX X
Mentally HandicappedX X
Developmentally DisabledX 0
Unruly/Disruptive0 0
Truants0 0
Juvenile Delinquents0 X
Emotionally DisturbedX X
Pregnant0 0
Drug/Alcohol Problems0 X
Battered, Abandoned, or Neglected 0 0
Adopted Children0 0
Foster Children0 0
Other0 0
a X indicates conditions reported.
AK-11
17

A review of Table 02-12 reveals information about the expenditure of public funds by state agenciesfor out-of-state placements In 1978. The DSS was not able to report its expenditures for the care ofchildren outside of Alaska. The Department of Education could only report that $19,000 in state fundswas used to place children out of state In 1978. The DOC, In contrast, reported that a total of $600,000of state revenue was expended by the agency for the children It placed out of state in 1978.
TABLE 02-12. ALASKA: PUBLIC EXPENDITURES FOR OUT-OF-STATE PLACEMENTS IN 1978, ASREPORTED BY STATE AGENCIES
Levels of Government
Expenditures, by AGENCY TypeChild JuvenileWelfare Education Justice
State* $19,000 $600,000
Federal* *
0
Uocal* *
0
Other* * 0
Total Reported Expenditures ** $600,000
* denotes Not Available.
E. State Agencies' Knowledge of Out-of-State Placements
A final review of Alaska state and local agencies out-of-state placement involvement and the stateagencles1 knowledge of their local public counterparts placement activity are presented in this portionof the state profile. Alaska's services to children are primarily state generated, but the one surveyedservice type which has locallyoperated agencies, education, reflects a knowledge gap between the twolevels of government as shown in Table 02-13. The Department of Education (DOE) could only report 36percent of the placements determined
by the local survey to have been made by school districts in 1978.The state-operated service areas, with the exception of child welfare's unavailable information, had ful:knowledge of their own agency's placement activity.
TABLE 02-13. ALASKA: STATE AGENCIES' KNOWLEDGE OFOUT-OF-STATE PLACEMENTS
ChildWelfare Education
JuvenileJustice
Mental Health andMental Retardation
Total Number of State andLocal Agency Placements *
11 74 0
Total Number of PlacementsKnown to State Agencies * 4 75 0
Percentage of PlacementsKnown to State Agencies * 36 100a 100
* denotes Not Available.
a. The state Juvenile Justice agency reported having knowledge of oneadditional placement than it reported to have arranged itself in 1978.
AK-12
18

Because state agencies are responsible for the administration of Interstate compacts, Figure 02-1
Illustrates an Important portion of the state agency's placement knowledge.Unfortunately, the state
child welfare agency could not report 1978 Incidence of placement or its utilization of Interstate
compacts for them. The DOE repeated the locally reportedInformation about no 1978 compact utilization
of education placements,desplte its inaccurate report of locally arranged Incidence of placement. The
state juvenlle justice agency, in contrast, reported a much greater number of children placed out of
Alaska than the ten, or nearly 14 percent, which were processedthrough a compact in 1978, reflecting
agency out-of-state placement recordkeepingother than that of a compact office. Not shown in the flgure
Is the report of no placements or compactutilization by the state mental health and mental retardation
agency.
80
70
60
50
40
30
20
10
0
FIGURE 02-1. ALASKA: THE TOTAL NUMBER OF STATE AND LOCAL
PLACEMENTS AND USE OF COMPACTS AS REPORTED
BY STATE AGENCIES, BY AGENCY TYPE
Child Welfare Education Juvenile Justice
* denotes Not Available.
State and Local Placements
11111 State and Local Placements Known toState Agencies
State and Local Compact-Arranged Placements Reported by
State Agencies
a. The state juvenile justice agency reportedhaving knowledge of one
additional placement than it reported
to have arranged itself in 1978.
AK-13
19

V. CONCLUDING REMARKS
A systematic review of the information obtained from the survey of Alaska state and local publicagencies draws several conclusions about Alaska'sout-of-state placement practices In 1978. Certainly, a
primary finding Is the difficulty Inascertaining Information about the Division of Social Service's
involvement in the practrEe. rhis if5e child welfareagency acknowledged the arrangement of such place-ments, but could give no other comparable informationabout the agency's practices in 1978. Since localgovernment is not involved In child welfare services,a large facet of Alaska's services to children Isrepreswoted In this agency's
activities which were not available for examination.
Further conclusions arising from the survey results include:
The State Department of Education reported fewer placements than were actually made by localschool districts, although these local agenciesreported cooperation with the state agency onall their placements.
The state juvenile justice agency reported a low rate of interstatecompact utilization andcould not report'detalled
information about the destination of the children it helped placeout of state.
Agencies had difficulty in identifying placement destinations, but it can be safely saidthat, because of Alaska's geographical location, any out-of-state placements are a greatdistance from the children's homes. The Implications of this long distance for transpor..tation expenses and on-site monitoring costs are Importantconsiderations.
The reader is encouraged to compare national trends described in Chapter 2 with the findings whichrelate to specific practices In Alaska In order to develop further conclusions about the statelsInvolvement with the out-of-state placement of children.
"
FOOTNOTE
I. General information about states, counties, cities, and SMSAs Is from the special 1975 populationestimates based on the 1970 national census contained In the U.S. Bureau of the Census, County and CityData 11112.11,_ 1977 (A Statistical Abstract Supplement), Washington, D.C., 1978.IfIRITiii11777i6Out direct ge7RFT-Ttate and-local tota1 per capita expenditures and expenditures foreducation and public welfare were also taken from data collected by the U.S. Bureau of the Census andthey appear in Statistical Abstract of the United States: 1979 (100th Edition), Washington, D.C., 1979.The 1978 estimatedpopulT117F-ErrsonreTUfirlErrryears OTT-OR-57/74155ed- by the National Centerfor Juvenile Justice using two sources: the 1970 national census and the National Cancer
Institute 1975estimated aggregate census, also prepared by the U.S. Bureau of the Census.

A PROFILE OF OUT-OF-STATEPLACEMENT POLICY AND PRACTICE IN ARIZONA
I. ACKNOWLEDGMENTS
The Academy gratefullyacknowledges the assistance of the many state and local officials who contri-
buted their time and effort to the project, particularly Diane Petersen, Deputy Associate Superintendent
of Special Education, Department of Education; Calvin Patterson, interstate Placement Specialist,
Administration for Children, Youth and Families, Department of Economic Security; Pat Terry, Community
Program Director for Special Populations,Division of Behavioral Health Services,
Department of Health
Services; Brian Lensink, Assistant Director, Division of DevelopmentalDisabilities and Mental Retarda-
tion Services, Department of Health Services; and Elmo Dickerson, Deputy Compact Administrator, Inter-
state Compact on Juveniles, Department of Corrections.
METHODOLOGY
Information was systematically gatheredabout Arizona from a variety of sources using a number of
data collection techniques. First, a search for relevant state statutes and case law was undertaken.
Next, telephone interviews were conducted with state officials who were able to report on agency policies
and practices with regard to the out-of-state placement of children. A mall survey was used, as a
follow-up to the telephoneinterview, to solicit information specific to the out-of-state placement
practices of state agencies and thoso of local agencies subject to state regulatorycontrol or supervi-
sory oversight.
An assessment of out-of-state placementpolicies and the adequacy of information reported by state
agencies suggested further survey requirements to determine the involvement of public agencies in
arranging out-of-state placements. Pursuant to this assessment, further data collection was undertaken
if it was necessary to:
verify out-of-stateplacement data reported by state government about local agencies; and
collect local agency data which was not available from state government.
A summary of the data collection effort in Arizona appearsbelow in Table 03-1.
TABLE 03-1, ARIZONA: METHODS OF COLLECTING DATA
Survey Methods, by Agency TypeMental Health and
Levels of Government Child Welfare Education Juvenile Justice Mental Retardation
State Agencies Telephone interview Telephone interview Telephone Interview Telephone interview
Mailed Survey: Mailed Survey: Mailed Survey: Mailed Survey:
DES Officials SDE Officials DOC Officials DHS Officials
Local Agencies Not Applicable(State Offices)
Telephone Survey: Telephone Survey:
10 percent sampleAll 14 locally
of the 233 school operated probation
districts to verify departments
state informationa
Not Applicable(State Offices)
a. Information attributed in this profile to the state's school districts was gathered from the
state education agency and the ten percent sample.
AZ-1
2i

III. THE ORGANIZATION OF SERVICES AND OUT-OF-STATE PLACEMENT POLICY IN 1978
A. Introductory Remarks
Arizona has the sixth largest land area (113,414square miles) and is the 32nd most populated state(2,225,007) In the United States. The distribution of the population varies significantly, withapproximately 75 percent of the statels population residing in two of Arizona's 14 counties, Marlcopa(Phoenix) and Pima (Tucson).
Phoenix, the capital city, Is the most populated city in the state. Theestimated 1978 population of persons eight to 17 years old was 407,828.
Arizona has two Standard Metropolitan Statistical Areas; Phoenix (includes Marlcopa County) andTucson (includes Pima County). Its border states are California, Colorado, Nevada, New Mexico, and Utah,and Its southernmost
border is shared with Mexico.
Arizona was ranked 23rd nationally In total state and local per capita expenditures, ninth in percapita expenditures for education, and last in per capita expenditures for public welfare.'
B. Child Welfare
The Department of Economic Security (DES), Administration for Children, Youth and Families (ACYF), Isresponsible for child welfare services In Arizona. The ACYF Is divided Into six districts and 25suboffices which administer
services including child protection, day care, shelter care, adoption, andfoster care. The ACYF does allocate funds for the out-of-state
placement of children In its custody aswell as children that are In the custody of the juvenileprobation departments.
Since 1976, Arizona has been a member of the Interstate Compact on the Placement of Children (ICPC)and has delegated the responsibility for administering this compact to ACYF. ACYF also has Involvementwith the interstate placement of children by monitoring all child care facilities in Arizona.
C. Education
The Arizona State Department of Education (SDE) is responsible for the implementation of legislationand statewide policy concerning public and private education. The SDE also has importantresponsibilities related to regulating the out-of-stateplacement of children by local school districts.In Arizona there are 233 local school districts which provide, In addition to a normal curriculum,specialized programs for children. These school districts can place children'in
an out-of-state specialeducation school. However, these placements must be made In accordance with the State Board of Educationadministrative oode.2 The code limits out-of-state placements to children diagnosed as handicappedpursuant to Arizona Revised Statutes3 (the categories of physically handicapped, visually handicapped,hearing handicapped,
trainable mentally handicapped,multiple handicapped, and seriously emotionallyhandicapped). Further, the request for
out-of-state placements must be made with and approved by theDivision of Special Education, State Department of Education.- In addition, the prospective out-of-statefacility must be approved and licensed by the other statels Department of Education. The administrativecode also states that out-of-state placements may only be arranged whenno adequate program exists within
Arizona and the designatedout-of-state facility In the "least expensive alternative." Reportedly, the
SDE can report the number of children placed out of state by the 233 school districts because the agencyis required to approve all such placements.
D. Juvenile Justice
The Juvenile Division within the Arizona Department of Corrections (DOC) has responsibility forjuvenile, corrections and aftercare. The major services administered by this agency include theoperation of institutions, camps, ranches, aftercare supervision, and community-based
corrections. Theagency also administers theinterstate Compact on Juveniles (ICJ) since adoption by the state legislatureIn 1961.
AZ-2
22

The superior courts of Arizona have jurisdiction in all matters affecting dependent, neglected,
incorrigible, or delinquent children. Both courts and probation departments are county-operated
agencies. Separate juvenile courts have been established In each oounty and have direct administrative
responsibility for probation. Although out-of-state placements ordered by courts or initiated by
probation staff should be arranged through an Interstate compact, some placements, particularly those
made without the expenditure of public funds, are made without compact intervention and therefore would
be unknown to DOC or ACYF officials.
E. Mental Health
The Arizona Department of Health Services (DHS) has responsibility for mental health care through Its
Division of Behavioral Health Services (BHS). More specifically, the BHS has two basic functions. The
first function Is to provide in-patient care and adolescent services at the Arizona State Hospital,
located In Phoenix. The second function of BHS involves the allocation of funds to private community
centers which provide mental health services. Community centers responsible for providing mental health
services are subsidized by the BHS through grant awards and by private contracting. The BIHS_makes
recommendations to ACYF and DOC concerning the placement of certain clients upon their discharge from
state facilities, but has no authority or funds to independently arrange residential placements in
Arizona or other states.
Arizona has not enacted the interstate Compact on Mental Health.
F. Mental Retardation
The Arizona Department of Economic Security (DES) also has responsibility for providing mental
retardation services through its Division of DevelopmentalDisabilities and Mental Retardation Services
(ODD/MRS). There are no local mental retardation services under the auspices of county governments.
Instead, local services are arranged through contractualagreements between DDD/MRS and private agencies.
In addition, DDD/MRS has recently assumed responsibility for foster care of retarded children and
directly operates three state mental retardation Institutions and 12 group homes. Similar to the BHS,
DDO/MRS has no authority or funds to independently arrangeresidential placements for children in Arizona
or other states.
One major Issue which may encourage out-of-state placements is the reported lack of In-state
facilities for severely disturbed youth. Although there are numerous residential treatment facilities In
Arizona for youth, most of them will not accept severely disturbed youth. The BHS is presently Involved
In an intergovernmentalcooperative effort to address this issue with representatives from DES, DOC, the
juvenile court system, and DDD/MRS. It was suggested by state officials that unless more in-state
services are made available to severely emotionally disturbed youth, out-of-state placements may be
required.
IV. FINDINGS FROM A SURVEY OF OUT-OF-STATE PLACEMENT PRACTICES IN 1978
The following discussion presents findings from the survey of Arizona state and local public
agencies. The discussion and tabular display Is organized to include the major questions asked about
out-of-state placement of children.
A. The Number of Children Placed In Out-of-State Residential Settings
Table 03-2 presents an overall picture of the number of out-of-state placements arranged by Arizona
state and local public agencies In 1978, by agency type. The table shows that a maximum of 186 children
were reported placed out of state by Arizona state and local agencies in 1978. H644Ve0, that figure is,
in fact, an underrepresentation of the total sum of out-of-state placements made that rear. The
AZ-3
23

Department of Corrections (DOC) was unable to oompletely report about its involvement in arranging out-of-state placements, leaving a lack of information about ,this agency's practices.
A further review of Table 03-2 closely reflects the out-of-state placement policies discussedearlier. The BHS and DDD/MRS do not have direct placement authority and are restricted financially fromplaclng children out of state. Consequently, these agencies were not involved in arranging anyout-of-state placements except for two children the DDD/MRS helped place without the expenditure ofstate funds.
The Arizona agencies with direct placement authority, with the exception of DOC, were able to provideInformation about the total number of children they placed out of state in 1978. The ACYF helped arrange163 such placements, which was the highest number reported by any agency type In either level ofgovernment. In contrast, only one child was placed outside of Arizona by local education agencles, andlocal Juvenile Justice agencies reported arranglng placements for a total of 20 children out ofstate.
TABLE 03-2. ARIZONA: NUMBER OF OUT-OF-STATE PLACEMENTSARRANGED BY STATE AND LOCAL PUBLIC AGENCIESIN 1978, BY AGENCY TYPE
Number of CHILDRENt by Agency TypeLevels of Child Juvenile 14entaT MentalGovernment Welfare Education Justice Health Retardation Total
State AgencyPlacementsa 163 0 0 2 165
Local AgencyPlacements
1 2021
Total 163 1 20 0 2 186
* denotes Not Available.-- denotes Not Applicable.
a. May 17;clude placements which the state agency arranged and fundedindependently or under a court order, arranged but did not fund, helped arrange,and others directly involving the state agency's assistance or knowledge. Referto Table 03-12 for specific informationregarding state agency Involvement Inarranging out-of-state placements.
AZ-4
24
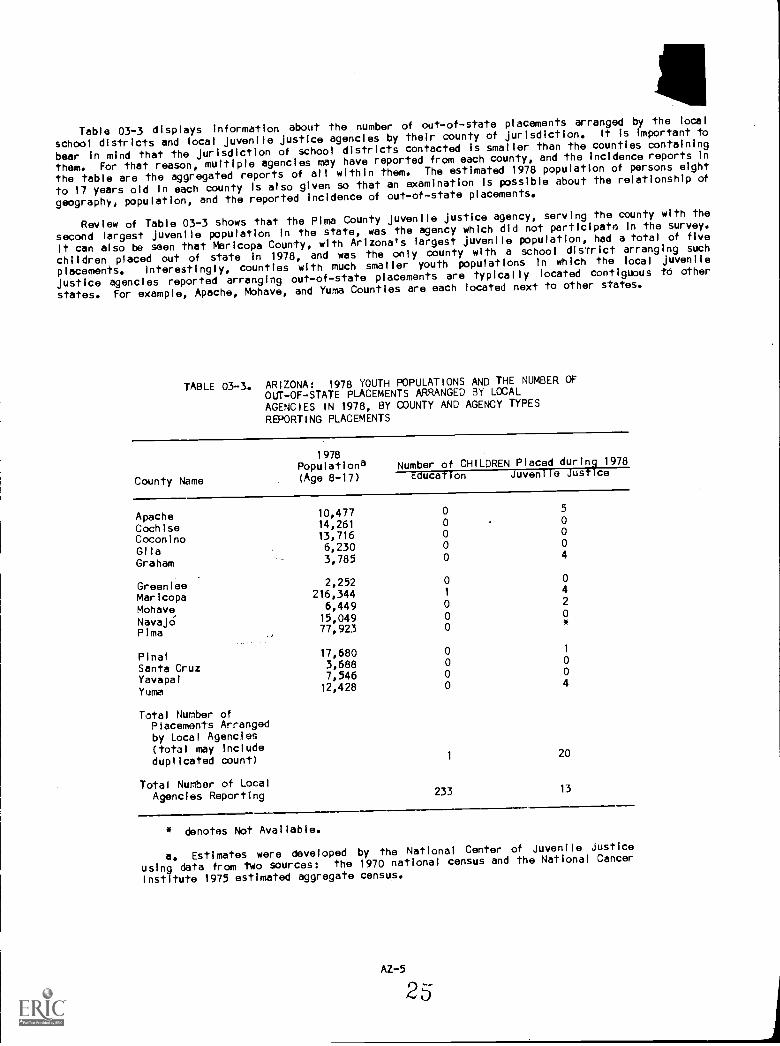
Table 03-3 displays information about the number of out-of-state placements arranged by the local
school districts and local juvenile justice agencies by their county of jurisdiction. It Is important to
bear in mind that the jurisdiction of school districts contacted ls smaller than the counties containing
them. For that reason, multiple agencies may have reported from each county, and the incidence reports In
the table are the aggregated reports of all within them. The estimated 1978 population of persons eight
to 17 years old in each oounty is also given so that an examination is possible about the relationship of
geography, population, and the reported incidence of out-of-state placements.
Review of Table 03-3 shows that the Pima County juvenile justice agency, serving the county with the
second largest juvenile population In the state, was the agency which did not participate in the survey.
It can also be seen that Mericopa County, with Arizona's largest juvenile population, had a total of five
children placed out of state in 1978, and was the only oounty with a school district arranging such
placements. Interestingly, counties with much smaller youth populations In which the local juvenile
justice agencies reported arranging out-of-state placements are typically located contiguous to other
states. For example, Apache, Mohave, and Yuma Counties are each located next to other states.
TABLE 03-3. ARIZONA: 1978 YOUTH POPULATIONS AND THE NUMBER OF
OUT-OF-STATE PLACEMENTS ARRANGED BY LOCALAGENCIES IN 1978, BY COUNTY AND AGENCY TYPES
REPORTING PLACEMENTS
County Name
1 978
Populationa(Age 8-17)
Number of CHILDREN Placed during 1978education Juvenile Justice
Apache 10,477 0 5
Cochise 14,261 0 0
Coconino 13,716 0 0
Gila 6,230 0 0
Graham 3,785 0 4
Greenlee 2,252 0 0
Maricopa 216,344 14
Mohave 6,449 0 2
Navajo' 15,049 0 0
Pima 77,923 0*
Pinal 17,680 0 1
Santa Cruz 3,688 0 0
Yavapal 7,546 0 0
Yuma 12,428 0 4
Total Number ofPlacements Arrangedby Local AgencJes(total may Includeduplicated count) 1
20
Total Number of LocalAgencies Reporting 233 13
* denotes Not Available.
a. Estimates were developed by the National Center of Juvenile Justice
using data from two sources: the 1970 national census and the National Cancer
institute 1975 estimated aggregate ce6sus.
AZ-5

B. The Out-of-State Placement Practices of Local A encies
The involvement of Arizona's local public agencles in arranging out-of-state placements in 1978 isdisplayed In Table 03-4. These local public agencies represent a total of 247 agencies: all 233 localschool districts and 14 local Juvenile Justice agencies. As illustrated by Table 03-4, over 99 percentof the local school districts and 54 percent of the responding local Juvenlle Justice agencies did notplace children out of state In 1978. Therefore, only about three percent of the 246 reporting localagencies were involved In arranging out-of-state placements for children. One local Juvenlle Justiceagency refused to participate in the survey.
TiBLE 03-4. ARIZONA: THE INVOLVEMENT OF LOCAL PUBLIC AGENCIESIN ARRANGING OUT-OF-STATE PLACEMENTS IN 1978
Response CategoriesNumber of AGENCIES, by Agency TypeEducation Juvenile Justice
Agencies Which Reported Out-of-State,Placements
1 6
Agencies Which Did Not Know If TheyPlaced, or Placed but Could NotReport the Number of Children 0 0
Agencies Which Did Not Place Out of State 232 7
Agencies Which Did Not Participate in theSurvey 0 1
Total Number of Local Agencies 233 14

The reporting local agencies which did not arrange out-of-state placements (97 percent) were able to
provide reasons for not becoming involved in the practice. Table 03-5 indicates that both local
education and Juvenile Justice agencies most frequently reported that sufficient services were available
tor children within Arizona. Local school districts also noted frequently that they simply had no need
for any out-of-state services In that year (Other category). It is of interest to note that three
Juvenile Justice agencies reported having no funds for out-of-state placements.
TABLE 03-5. ARIZONA: REASONS REPORTED BY LOCAL PUBLICAGENCIES FOR NOT ARRANGING OUT-OF-STATEPLACEMENTS IN 1978
Reasons for Not PlacingChildren Out of Statea
Number of Local AGENCIES, by Reported Reason(s)
Education Juvenile Justice
Lacked Statutory Authority 8 0
Restrictedb 10
Lacked Funds 2 3
Sufficient Services AvailableIn State 230 6
Otherc 214 0
Number of Agencies Reporting NoOut-of-State Placements 232
Total Number of AgenciesRepresented in Survey 233 13
a. Some agencies reported more than one reason for not arranging out-of-
state placements.
U. Generally included restrictions based on agency policy, executive
order, compliance with certain federal and state guidelines, and specific court
orders.
c. Generally included such reasons as out-of-state placements wero against
overall agency policy, were disapproved by parents, involved too much red tape,
and were prohibitive because of distance.
AZ-7

The extent of Interagency cooperation to arrange out-of-state placements by local school districtsand Juvenile Justice agencies Is represented In Table 03-6. Interagency cooperation for the oneeducational placement involved arrangements for securing the approval of the State Department ofEducation. One local Juvenile Justice agency also reported Interagency cooperation to arrange fiveout-of-state placements. This cooperation was related to receiving funding assistance from the ACYF.Because these locally arranged placements involved cooperation only with state agencies, it can beassured that an unduplicated count of 21 children were placed out of state by local public agencies.
TABLE 03-6. ARIZONA: THE EXTENT OF INTERAGENCY COOPERATIONTO ARRANGE OUT-OF-STATE PLACEMENTS BY LOCALAGENCIES IN 1978
Number and Percentage, by Agency TypeEducation Juvenile Justice
Number Percent Number Percent
AGENCIES Reporting Out-of-StatePlacements
1 0.004 6 468
AGENCIES Reporting Out-of-StatePlacements with Interagency
1 100 1 17Cooperation
Number of CHILDREN Placed Out ofState
1 100 20 100
Number of CHILDREN Placed Out ofState with Interagency
1 100 5 25,Ccoperation
a. See Table 03-4.
Information about the types of children who were placed out of state in 1978 by Arizona's local pub-lic pgenclee Is displayed In Table 03-7. Consistent with their service population, unruly/disruptive,Juvenile delinquent, and battered, abandoned, or neglected children were most frequently reported by theJuvenile probation departments and superior courts. The one school district that arranged an out-of-state placement characterized the child as multiple handicapped. Due to Arizona education laws, whichlimit the types of children that can be placed, It could be assumed that the school districts mould beplacing only those children falling under the statute's definition.
TABLE 03-7. ARIZONA: CONDITIONS OF CHILDREN PLACED OUT OFSTATE IN 1978, AS REPORTED BY LOCAL AGENCIES
Types of ConditIonsa Number of Agencies Reporting._Education Juvenile Jusflce
Physically Handicapped 0 0
Mentally Retarded or Developmentally Disabled 0 0
Unruly/Disruptive 0 3
Truant 0 0
AZ-8
28

TABLE 03-7. (Continued)
Types of Conditionsa
Number of Agencies Reporting
Education Juvenile Justice
Juvenile Delinquent 0 5
Mentally 111/Emotionally Disturbed 0 0
Pregnant0 0
Drug/Alcohol Problems 0 0
Battered, Abandoned, or Neglected 0 2
Adopted0 0
Special Education Needs 0 0
Multiple Handicaps 10
Others 0 0
Number of Agencies Reporting 1 6
a. Some agencies reported more than one type of condition.
C. Detailed Data from Phase II Agencies
If more than four out-of-state placements were reported by a local agency, additional information was
requested. The agencies from which-the second phase of data was requested became known as Phase II
agencies. Table 03-3 revealed that only one Phase 11 agency existed in Arizona, a local Juvenile Justice
agency. This section reviews the additional responses given by this agency.
The relationship between the number Of local Juvenile Justice agencies surveyed and the number of
out-of-state placements reported, and the Phase 11 Juvenile Justice agency's and placements Is illus-
trated In Figure 03-1, It Is shown in thls figure that the one Phase II agency was among six placing
Juvenile Justice agencies, and had arranged 25 percent of the total local Juvenile Justice placements.
Table 03-3 revealed that thls Phase 11 Juvenile Justice agency had Jurisdiction in Apache County, which
borders the states of New Mexico, Colorado, and Utah,
AZ-9
29

FIGURE 03-1. ARIZONA: RELATIONSHIP BETWEEN THE NUMBER OF LOCALAGENCIES SURVEYED AND PLACEMENTS REPORTED, ANDAGENCIES AND PLACEMENTS IN PHASE II, BY AGENCY TYPE
Juvenile Justice
Number of AGENCIES
Number of AGENCIES Reporting Out-of-State PlacementsIn 1978
Number of AGENCIES Reporting Flve or More Placementsin 1978 (Phase 11 Agencles)
13
f
f I
Number of CHILDREN Placed Out of State In 1978
Number of CHILDREN Placed by Phase 11 Agencies
Percentage of Reported Placements In Phase II
The one local Juvenile Justice agency which arranged flve out-of-state placements In 1978 was askedto report the destinations of the children placed. As'can be seen In Table 03-8, three of the flve.children were placed by the agency Into California, one of Arizona's border states. The other twochildren were sent to residential care In Arkansas and Kansas.
TABLE 03-8. ARIZONA: DESTINATIONS OF CHILDREN PLACED BYLOCAL PHASE II AGENCIES IN 1978
Destinations of Children Number of CHILDREN PlacedPlaced Out of State
Juvenile Justice
ArkansasCallfornla 3Kansas
1
Placements for Which Destinations Could Not beReported by Phase II Agencies
Total Number of Phase II Agencies
Total Number of Children Placed by Phase II Agencles,r
0
1
5
The one local Phase II Juvenile Justice agency was asked to describe the reasons for arranging thoseplacements. It was indicated that the placements were arranged so that the children could live withrelatives. Monitoring of these placements was generally oonducted on a quarterly basis, by means ofon-slte vlsits, written progress reports, and periodic telephone calls. No pubilc revenue was expendedby the agency for arranging those flve placements. It was reported that transportation costs ware paldby relatives, parents, and ACYF.
AZ-10
30
. Use of Interstate Com acts by State and Local A encies
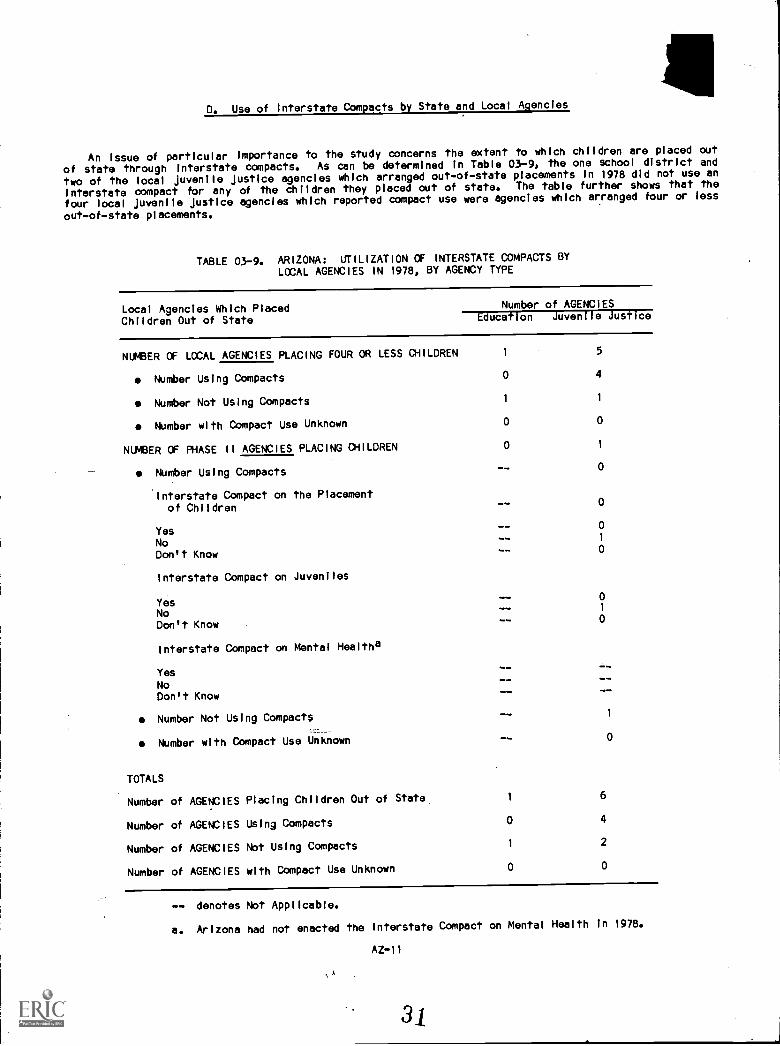
An issue of particular importance to the study concerns the extent to which children are placed out
of state through interstate compacts. As can be determined in Table 03-9, the one school district and
two of the local Juvenile Justice agencieswhich arranged out-of-state placements in 1978 did not use an
interstate compact for any of the children they placed out of state. The table further shows that the
four local Juvenile Justice agencies which reported compact use were agencies which arranged four or less
out-of-state placements.
TABLE 03-9. ARIZONA: UTILIZATION OF INTERSTATE COMPACTS BYLOCAL AGENCIES IN 1978, BY AGENCY TYPE
Local Agencies Which Placed Number of AGENCIES
Children Out of State Education Juvenile Justice
NUMBER OF LOCAL AGENCIES PLACING FOUR OR LESS CHILDREN 1 5
Number Using Compacts 0 4
Number Not Using Compacts 1 1
Number with Compact Use Unknown 0 0
NUMBER OF PHASE 11 AGENCIES PLACING CHILDREN 0 1
Number Using Compacts 0
Interstate Compact on the Placementof Children
0
Yes0
No1
Don't Know 0
Interstate Compact on Juveniles
Yes0
No1
Don't Know0
Interstate Compact on Mental Healtha
YesNoDon't Know
Number Not Using Compacts
-
Number with Compact Use Unknown 0
TOTALS
Number of AGENCIES Placing Children Out of State 1 6
Number of AGENCIES Using Compacts 0 4
Number of AGENCIES Not Using Compacts 1 2
Number of AGENCIES with Compact Use Unknown 0 0
-- denotes Not Applicable.
a. Arizona had not enacted the Interstate Compact on Mental Health in 1978.
AZ-11
A
31

Further Information about the utilization of interstate compacts for arranging out-of-state place-ments Is given In Table 03-10. Table 03-10 indicates the number of children who were or were not placidout of state In 1978 with a compact. It can be seen that a total of ten chIldren--one placed by a localeducation agency and nine placed by local Juvenile Justice agencles--were placed out of state In 1978without a compact. Of the remaining 11 out-of-state placements arranged by local Juvenile Justiceagencies, four were placed through a compact and compact use was not determined for the other seven.
TABLE 03-10. ARIZONA: NUMBER OF PLACEMENTS AND THEUTILIZATION OF INTERSTATE COMPACTS BYLOCAL AGENCIES IN 1978
Children Placed Out of StateNumber of CHILDREN
-Education Juvenile Justice
CHILDREN PLACED BY AGENCIESREPOKIING FOUR OR LESS PLACEMENTS
1 15
Number Placed with Compact Use 0 4
Number Placed without Compact Use1 4
Number Placed with CompactUse Unknowne 0 7
CHILDREN PLACED BY PHASE II AGENCIES 0 5
Number Placed with Compact Use 0
Number through Interstate Compacton the Placement of Children 0
Number through InterstateCompact on Juveniles 0
Number through InterstateCompact on Mental Healthb - _
Number Placed without Compact Use 5
Number Placed with Compact UseUnknown - _
TOTALS
Number of CHILDREN Placed Outof State
1 20
Number of CHILDREN Placedwith Compact Use 0 4
Number of CHILDREN Placed withoutCompact Use
1 9
Number of CHILDREN Placedwith Compact Use Unknown 0 7
a. Agencies which placed four or less children out of state were not askedto report the actual number of oompact-arranged placements. Instead, theseagencies simply reported whether or not a compact was used to arrange any out-of-state placements. Therefore, If a compact was used, only one placement isindicated as a compact-arranged placement, and the others are included in thecategory "number placed with compact use unknown."
b. Arizona had not enacted the Interstate Compact on Mental Health In 1978.
AZ-12
32

A graph1c summarization about theutilization of interstate compacts for the 20 children placed out
of state by Arizona local juvenile justice agencies Is Illustrated In Flgure 03-2. The flgure clearly
shows the porportion of the 20 out-of-state placements made by these agencies which were non-compact
arranged, compact arranged, and undetermined with respect to compact use.
FIGURE 03-2. ARIZONA: THE UTILIZATION OF INTERSTATE COMPACTS
8Y LOCAL JUVENILE JUSTICE AGENCIES IN 1978
20cHILDREN PLAcEDOUT OF STATE:89AR/20NA LOCALJUVENILE JUSTICE
AGENcIES
=IMMO MM.'S.
6''
1%()(42
.0'
45% NONCOMPAcl0.00alm aim! WINN. 111* amass MaNINID
20% cOMPAcT ARRANGED
1 1111
35% COMPAcrv4.
414166). N
Table 03-11 provides a summary analysls of compact utilization by local and state agencies. Thls
table exam1nes the relationship between the total number of out-of-state placements arranged by both
state and local agencies In 1978, and the number of compact-arranied placements reported bystate
agencies. All 163 out-of-state placements reported by the state child welfare agency were arranged
through a compact. It should be recalled that the agencyadministratively houses the interstate Compact
on the Placement of Children. Thirty-two placements were known to DOC to have been processed through an
Interstate compact. DOC, however, coutd not report how many placements they had arranged and, there-
fore, compact utilization for juvenlle justice could not be determined. It can be concluded, however, by
referencing Table 03-10, that at least nine local juvenile justiceplacements dld not make compact use
and, therefore, there was not complete compact utilization.
AZ-13
33

Finally, the two children placed out of state with the help of the state mental retardation agencywere not arranged through a compact; nor was the placement reported by the state education agency.
TABLE 03-11. ARIZONA: UTILIZATION OF INTERSTATE COMPACTSREPORTED BY STATE AGENCIES IN 1978,BY AGENCY TYPE
ChildWelfare Education
JuvenileJustice
MentalRetardation
Total Number of State andLocal Agency-ArrangedPlacements
Total Number of Compact-Arranged PlacementsReported by State Agencies
Percentage of Compact-Arranged Placements
163
163
100
1
0
0
32
2
0
0
* denotes Not Available.
E. The Out-of-State Placement Practices of State Agencies
Table 03-12 illustrates the abillty of state agencies In Arizona to report their involvement Inarranging out-of-state placements In 1978. It Is clear In the table that the Administration forChildren, Youth and Families (the state child welfare agency) was the state agency most involved Inplacing children out of state. This state agency could report the number of children it helped placeoutside of Arizona in 1978 and the agency's specific types of involvement. Over one-half of these 163out-of-state placements involved state funding. The remaining placements were arranged with relatives Inother states and involved no state funding.
The Department of Corrections (DOC), on the other hand, could report only the total number of chil-dren placed out of ,state with its assistance or knowledge and could not specify its involvement with theparticular types of placement arrangements. This state agency's inability to isolate those out-of-stateplacements, which were arranged and possibly funded by local probation departments, relates directly tothe discussion preceding Table 03-2 about the problem of avoiding a duplicative total.
AZ-14
34

Table 03-12 also reveals the involvement of state agencies responsible for education, mental health,
and mental retardation In arranging out-of-state placements in 1978. The SDE reported that one out-of-
state placement was arranged by local school districts, and the preceding discussion of local agen:ly
practices confirmed the accuracy of this information. It should also be observed that the involvement of
the BHS and DOD/MRS Indicated In Table 03-12 is consistent with the policies described In Section III.
TABLE 03-12. ARIZONA: ABILITY OF STATE AGENCIESTO REPORT THEIR INVOLVEMENT INARRANGING OUT-OF-STATE PLACEMENTSIN 1978
Types of Involvement
Number of CHILDREN ReportedPlaced during 1978 by State Agencies
ChrldWelfare Education
Juvenffe Mental Mental
Justice Health Retardation
State Arranged and Funded 53 0 0 0 0
Locally Arranged butState Funded -- 0 *
Court Ordered, but StateArranged and Funded 40 0 * 0
Subtotal: PlacementsInvolving StateFunding 93 0 *
Locally Arranged andFunded, and Reportedto State 1
* --
State Helped Arrange,but Not Required byLaw or Did Not Fundthe Placement 0 0 0 0 2
Others 70a 0 0 0 0
Total Number ofChildren Placed Outof State with StateAssistance orKnowledgeb 163 1 32 0 2
* denotes Not Available.
-- denotes Not Applicable.
a. The Administration for Children, Youth and Families indicated that these
70 placements involved no state funding and were all placements with relatives
In other states.
b. Includes all out-of-state placements known to officials In the par-
ticular state agency. In some cases, this figure consists of placements which
dld not directly Involve affirmative action by the state agency but may simply
indicate knowledge of certain out-of-state placements through case conferences
or through various forms of Informal reporting.
AZ-15

The variance In state agencies' ability to provide certain information about the out-of-state place-ments in which they wer involved is further reflected in Table 03-13, which displays reported informa-tion about the destination of out-of-state placements known to state agencies. Neither the Departmentsof Corrections nor Education was able to supply such information. However, the ACYF and DDD/MRS re-ported the destinations of all the children placed out of state involving their agencies. A closerreview of Table 03-13 reveals lhat the majority of the children placed out of state by the ACYF wereplaced in the pacific, mountain, and west south-central regions of the country. Included in these threeregions are Arizona's oontiguous states, which received 36 percent of ACYF's total reported out-of-stateplacements and one of DDD/MRS$ reported out-of-state placements.
TABLE 03-13. ARIZONA: DESTINATIONS OF CHILDREN PLACED OUTOF STATE IN 1978 REPORTED BY STATE AGENCIES,BY AGENCY TYPE
Destinations ofChildren Placed
Number of CHILDREN PlacedChild
WelfareJuvenile
Education JusticeMental
Retardation
Alaska 2 0California 38
1
Colorado 10 0Connecticut 1 0Delaware 1 0
Florida 3 0Georgia 1 0Idaho 6 0Illinois 2 0Iowa 3 0
Kansas 1 0Kentucky 1 0Louisiana 10 0Maryland 3 0Massachusetts 3 0
Minnesota 1 0Mississippi 2 0Missouri 3 0Montana 1 0Nebraska 2 0
New Mexico 9 0New York 3 0North Carolina 1 0Ohio 6 0Oklahoma 9 0
Oregon 3 0Pennsylvania 2 0Texas 16
1
Utah 3 0Washington 9 0
West Virginia 1 0Wyoming 7 0
Placements tor WhichDestinations Could Notbe Reported by StateAgencies 0 Ail All 0
Total Numbar of Placements 163 1 32 2
AZ-16

Table 03-14 illustrates the conditions of the children placed out of state In 1978, as reported by
Arizona state agencies. The state child welfare agency (ACYF) reported a wide range of conditions,
Including all handicaps and Juvenile delinquency. It should be realled that Section III of this profile
discussed ACYF's provision of funds for Juvenile probation departments' placements. The other state
agencies reported conditions typically serviced by their agency. Total public expenditures for these
state agency out-of-state placements In 1978 were not accessible. However, the most frequently used
category of placement reported was psychiatric hospitals by the state education agency; residential
treatment centers by the mental retardation agency; and relatives' homes by the state child welfare and,
Juvenile Justice agencies.
TABLE 03-14. ARIZONA: CONDITIONS OF CHILDREN PLACED OUT OFSTATE IN 1978, AS REPORTED BY STATE AGENCIES,BY AGENCY TYPE
Types of Conditions
Agency TypeaChildWelfare
JuvenTieEducation Justice
mentalRetardation
Physically Handicapped X o o o
Mentally Handicapped X o o x
Developmentaily Disabled X o ,c) o
Unruly/Disruptive X o x o
Truants X o x o
Juvenile Delinquents X o x o
Emotionally Disturbed X o o o
Pregnant X o o o
Drug/Alcohol Problems X o o o
Battered, Abandoned, orNeglected X o o o
Adopted Children X o o o
Foster Children X o o o
Multiple Handicaps 0 x o o
a. X Indicates conditions reported.
AZ- 17
37
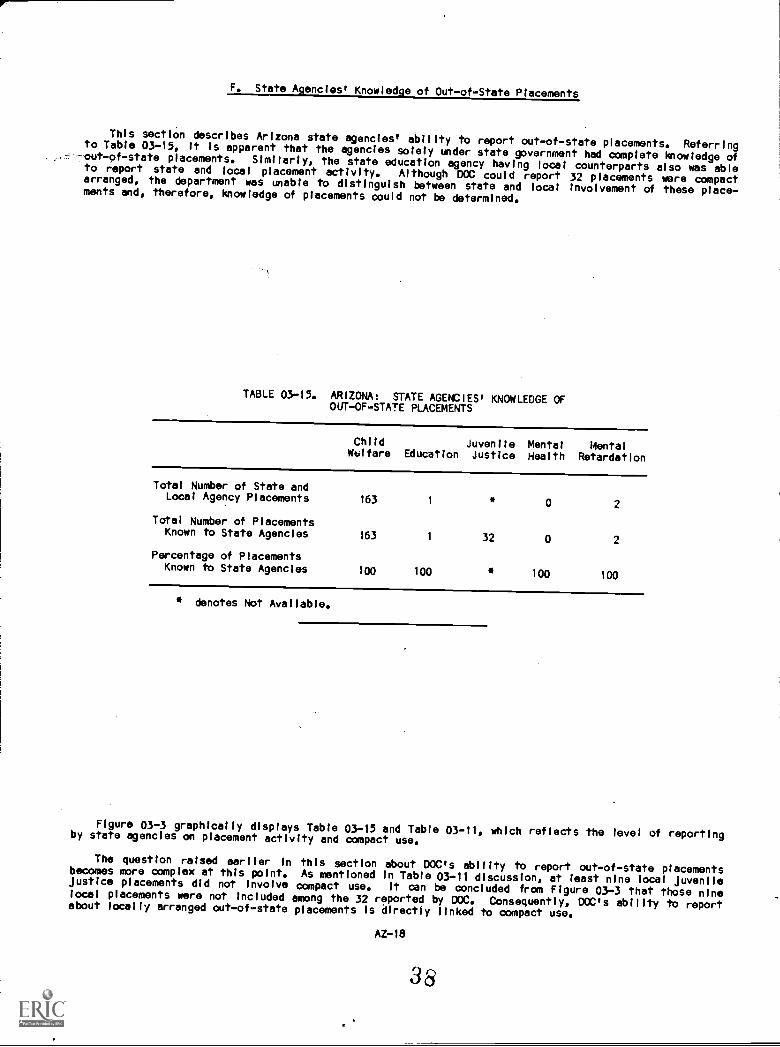
F. State Agencies' Knowledge of Out-of-State Placements
Thls section describes Arizona state agencies' ability to report out-of-state placements. Referringto Table 03-15, it is apparent that the agencies solely under state government had complete knowledge ofout-of-state placements. Similarly, the state education agency having local counterparts also was ableto report state and local placement activity. Although DOC could report 32 plecements were compactarranged, the department was unable to distinguish between state and local Involvement of these place-ments and, therefore, knowledge of placements could not ba determined.
TABLE 03-15. ARIZONA: STATE AGENCIES' KNOWLEDGE OFOUT-OF-STATE PLACEMENTS
ChildWilfare
JuvenileEducation Justice
MentalHealth
MentalRetardation
Total Number of State andLocal Agency Placements 163 1
* 0 2
Total Number of PlacementsKnown to State Agencies 163 1 32 0 2
Percentage of PlacementsKnown to State Agencies 100 100 * 100 100
* denotes Not Available.
Figure 03-3 graphically displays Table 03-15 and Table 03-11, which reflects the level of reportlngby state agencies on placement activity and compact use.
The question raised earlier In this section about DOC's ability to report out-of-state placementsbeoomes more complex at this polnt. As mentioned in Table 03-11 discussion, at least nine local JuvenileJustice placements did not involve compact use. It can be concluded from Figure 03-3 that those nlnelocal placements were not Included among the 32 reported by DOC. Consequently, DOC's ability to reportabout locally arranged out-of-state placements Is dIrectly !Inked to compact use.
AZ-18
38

200
175
150
125
100
75
50
25
0
FIGURE 03-3. ARIZONA: THE TOTAL NUMBER OF STATE AND LOCAL
PLACEMENTS AND USE OF OOMPACTS AS REPORTED BY
STATE AGENCIES, BY AGENCY TYPE
163 163 163
ChildWelfare
1 1
vlimmiammar 0
Education
0
32 32
JuvenileJustice
2 20
Mental
Retardation
State and Local Placements
State and LocalPlacements Known to State Agencies
State and Local Compact-Arranged PlacementsReported by State Agencies
a. DOC repoeted 32 placements, but could not distinguish between local or state involvement har
these placements.
V. CONCLUDING REMARKS
Several conclusions can be drawn from the survey of Arizona state and local public agencies about
their involvement in the out-of-state placement of children. An Important finding was two state
agencies' reports of 100 percent utilization of Interstate compacts for the placement of these children
Into other states.Considering the child welfare agency's (DES-ACYF)
involvement In over 82 percent of
the state agency-reported placements, the high rate of compact use withln that agency Is very
sIgnificant.
Additional Implications that have emerged aboutout-of-state placement practices Include:
The conditions of the chIldren placed out of state by DES-ACYF reflect a very wide range of
needs serviced by the child we!fare agency, which Is influenced by the agency's subsidization
of local Juvenile Justice agency out-of-state placements.
The state Juvenile Justice agency had an apparent lack of knowledge of at least 45 percent
(nine children) of local Juvenile Justice agency-arranged out-of-state placements. Thls lack
of knowledge appears to be linked to the fact that these placements were not compact
A2-19
3 9
arranged, which Is the probable source of Information about locally Initiated out-of-stateplacements.
The Division of Developmental Disabilities and Mental Retardation Services, despite reportedfinancial restrictions, has helped to place children out of state without the use of publicfunds.
The State Department of EdudatIoneffectively regulated the out-of-state placement practicesof local school districts in 1978, as evidenced by Its ability to accurately report thenumber of children placed out of state by the local education agencies.
The reader Is encouraged to compare national trends described in Chapter 2 with the findings whichrelate to specific practices in Arizona In order to develop further conclusions about the state'sinvolvement with the out-of-state placement of children.
FOOTNOTES
1. General Information about states, counties, cities, and SMSAs Is from the special 1975 populationestimates based on the 1970 national census contained in the U.S. Bureau of the Census, County and CityData...1122/5_ 1977 (A Statistical Abstract.Supplement), Washington, D.C., 1978.liffrdiiiifn7i6Out direct ggrigir-Ttate and local total per capita
expenditures and expenditures foreducation and public welfare were also taken from data collected by the U.S. Bureau of the Census andthey appear in Statistical Abstract of the United States: 1979 (100th Edition), Washington, D.C., 1979.The 1978 estimated populIII7F75fpersonT-FTFt'f577years or6753-35WiliDed by the National Centerfor Juvenile Justice usimj two sources: the 1970 national census and the National Cancer institute 1975estimated aggregate census, also prepared by the U.S. Bureau of the Census.2. Arizona State Board of Education, Administrative Code R7-2-403.3. Arizona Revised Statutes, Section 15-1011.
AZ-20
40
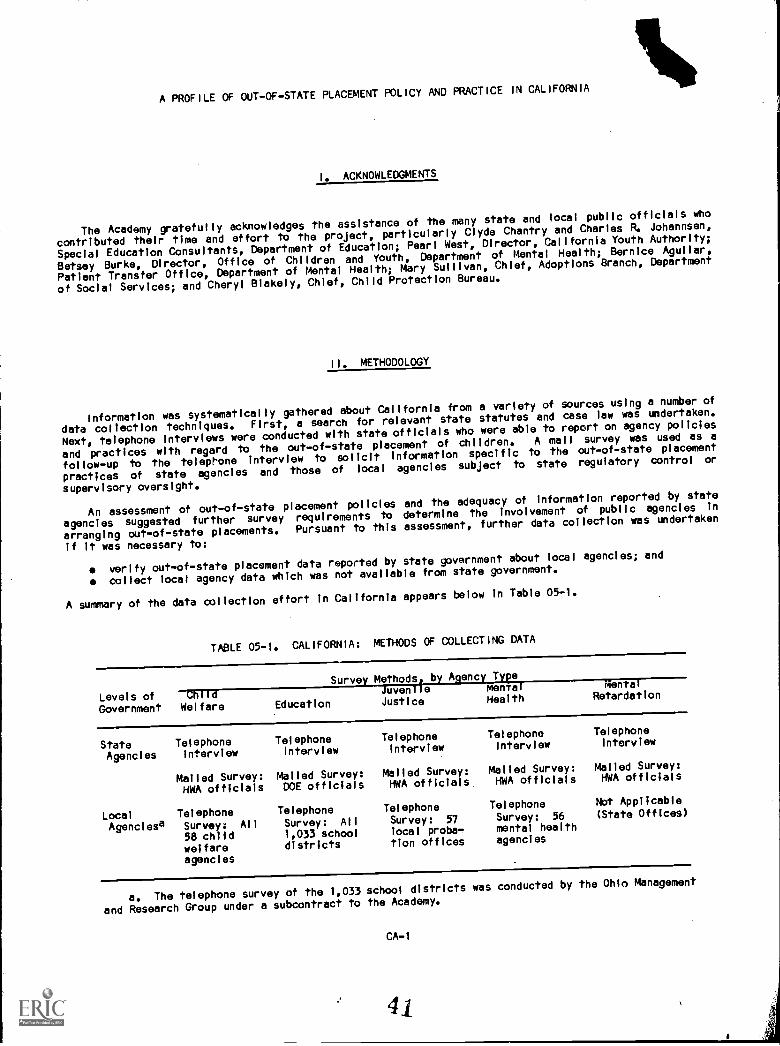
A PROFILE OF OUT-OF-STATEPLACEMENT POLICY AND PRACTICE IN CALIFORNIA
ACKNOWLEDGMENTS
The Academy gratefullyacknowledges the assistance of the many state and local public officials who
contributed thelr time and effort to the project, particularlyClyde Chantry and Charles R. Johannsen,
Special Education Consultants,Department of Education; Pearl West, Director, California Youth Authority;
Betsey Burke, Director, Office of Children and Youth, Department of Mental Health; Bernice Aguilar,
Patient Transfer Office, Department of Mental Health; Mary Sullivan, Chief, Adoptions Branch, Department
of Social Services; and Cheryl Blakely, Chief, Child Protection Bureau.
II. METHODOLOGY
Information was systematically gathered about California from a variety of sources using a number of
data collection techniques. First, a search for relevant state statutes and case law was undertaken.
Next, telephone interviews wereconducted with state officials who were able to report on agency policies
and practices with regard to the out-of-state piacement of children. A mall survey was used as a
follow-up to the telepf'one interview to solicit information specific to the out-of-state placement
practices of state agencies and those of local agencies subject to state regulatory control or
supervisory oversight.
An assessment of out-of-stateplacement policies and the adequacy of Information reported by state
agencies suggested further survey requirements to determlne the involvement of public agencies In
arranging out-of-state placements. Pursuant to this assessment, further data collection was undertaken
if it was necessary to:
verify out-of-state placementdata reported by state government about local agencies; and
collect local agency data which was not available from state government.
A summary of the data collection effort in California appears below In Table 05-1.
TABLE 05-1, CALIFORNIA: METHODS OF COLLECTING DATA
Survey Methods, by Agency Type
Levels of Child Juvenile Ponta!
Government Welfare Education Justice Health
MentalRetardation
State TelephoneAgencies Interview
Mailed Survey:HWA officials
Local TelephoneAgenclesa Survey: All
58 childwelfareagencles
TelephoneInterview
Mailed Survey:DOE officials
TelephoneSurvey: All
1,033 schooldistricts
TelephoneInterview
Mailed Survey:HWA officials
TelephoneSurvey: 57local proba-tion offices
TelephoneInterview
Mailed Survey:HWA officials
TelephoneSurvey: 56mental healthagencies
Telephoneinterview
Mailed Survey:HWA officials
Not Applicable(State Offices)
a. The telephone survey of the 1,033 school districts was conducted by the Ohio Management
and Research Group under a subcontract to the Academy.
CA-1
4i
The Academy also conducted an intensive on-site case study in California. The results from the casestudy are included in a companion publication entitled TheOut-of-State Placement of Children: A Searchfor RightsBoundaries Services.
111. THE ORGANIZATION OF SERVICES AND OUT-OF-STATE PLACEMENT POLICY IN 1978
A. Introductory Remarks
California has the third largest land area (156,361 square miles) and Is the most populatedstate (21,202,559) in the United States. It has 125 cities with populations over 25,000 and 21 citieswith populations over 100,000. In addition, it has 57 counties and one city-county consolidation (SanFrancisco), with five counties having populations of over 1,000,000: Alameda.(0akiand), Los Angeles (LosAngeles), Orange (Anaheim), San Diego (San Diego), and Santa Clara (San Jose). Ws Angeles Is the mostpopulated city in the state, with a population over 2,000,000. Sacramento, the capital, is the sixthmost populated city In the state with a population of approximately 260,000. The 1978 estimatedpopulation of persons eight to 17 years old was 3,596,506.
California has 17 Standard Metropolitan Statistical Areas and over 95 percent of the state'spopulation lives In them. States contiguous to California are Nevada, Arizona, and Oregon. Mexicoborders on the south and southwest for a short distance.
California has a vast and complex system for administering services to children and youth. Withinthe recently reorganized Health and Welfare Agency, there are six major departments responsible forchildren and youth programs: Social Services, Health Services, Developmental Services, Mental Health,Employment Development, and Youth Authority. The state was ranked sixth nationally in total state andlocal per capita expenditures, 10th in per capita expenditures for education, and third In per capitaexpenditures for public welfare.1
B. Child Welfare
The California Department of Social Services' (DSS) Adult and Family Services Division Is the primaryagency responsible for children and youth services within the state's Health and Welfare Agency (HWA).This division has branches and bureaus handling child protection, foster care, adoption, and also hascoordinating responsibilities with other state agencies serving children.
The Family and Children Services Branch of the Adult and Family Services Division has responsibilityfor establishing minimum standards for services administered In the 58 county child welfare agencies.The Adoptions Branch of the division has similar responsibilities for public and private adoptionagencies. Licensing of all types of foster care settings is the responsibility of the Community CareLicensing Division.
The administration of the Interstate Compact on the Placement of Children (ICPC), of which Californiahas been a member since 1974, occurs in several areas of the DSS. The Adoptions Branch of the Adult andFamily Services Division administers 1CPC for adoption cases. The Family and Children Services Branch ofthe same division administers the compact for foster care placements. However, operations for thiscomponent of 1CPC are located in the Public inquiry and Response Section of the Planning and ReviewDivision.
California's 58 county-administeredwelfare departments receive 75 percent of their funding from DSSand 25 percent from local sources. The specific organization of child welfare services at the locallevels varies by oounty but, in general, adoption services are in a separate division from childprotection, dependency, and placement services. In Los Angeles County, adoptions are handled by acompletely separate public agency, the Los Angeles County Department of Adoptions, and services areprovided to the Bureau of Social Services within the Los Angeles County Department of Public SocialServices under a contract agreement. In addition, in some counties, the county commissioners have chosento retain services for dependency cases within probation departments, along with services for statusoffenders and delinquents. Counties in which dependency cases are the responsibility of probationdepartments include Alpine, Imperial, inyo, Mariposa, Modoc, Mono, Santa Clara, Siskiyou, Tehama, and
CA-2
42
Tolumne. Counties In which responsibilityfor dependency cases is shared by the local child welfare and
probation agencies include Alameda, Calaveras, Glenn, Lake, Merin, Napa, San Benito, San Francisco, and
Sonoma.
C. Education
The California Department of Education (DOE) has the major responsibility for the state's educational
system. The 1,033 school districts In California are 90 percent funded by state revenue.
Local education agencies can place handicapped children out of state in accordance with the
Department of Education administrative code.2 The code stipulates that children may be placed in
nonpublic residential programs out of state when no appropriate public or private day program Is
available to meet their specific educational needs within a reasonable distance from their home. All
costs incurred by school districts resulting from placing children in public special education programs
and 70 percent of the costs associated with placements In private special education programs are paid by
the DOE. When placing children out of state for special education services, the local education egency
may contract only with facilities which have been approved by the DOE. In addition, Sections 3107 and
3307 of the Department of Education's Administrative Code require that a child's individualized education
program must be reviewed at least annually by the-loCal school district.
D. Juvenile Justice
The California Youth Authority (CYA) was one of six major components of the Health and Welfare Agency
(HWA) responsible for children and youth programs at the time of the study. Since that time, the CYA has
been merged into the newly created Department of Youth and Adult Corrections. CYA agencies are still
responsible for the confinement and aftercare of all youth adjudicated delinquent and committed to the
agency by superior courts In each of California's 58 counties.
CYA's Institutions and Camps Branch manages 16 facilities for delinquents and the Parole Service
Branch supervises parole In all of the counties. Detention, residential treatment facilities, and
probation programs are operated by the counties.
Under Section 887 of the Welfare and Institutions Code, CYA may reimburse counties for the cost of
maintaining a child In a home or camp which meets the standards established by the CYA. The proportion
, of expenditures for which counties may be reimbursed Is 50 percent of the maintenance cost per child, or
$95 per child per month, whichever Is lower.
California has been a member of the Interstate Compact on Juveniles (ICJ) since 1955, and the CYA
administers this compact. It was reported that the juvenile divisions of the superior courts as well as
juvenile probation departments may place juveniles out of state without arranging the placements through
the ICJ.
E. Mental Health
Within the Health and Welfare Agency, the Department of Mental Health (DMH) Is responsible for the
administration of state mental health hospitals and the supervision of county-administered community
mental health services. There are 57 county, multicounty, or municipally (Berkley and Pomona)
administered mental health agencies In California.
The DMH operates under legislation that provides for allocations from the general fund to be made to
each of the county mental health agencies, after approval of an annual plan. Upon approval of that plan,
state revenue is awarded to each of the counties to use, as stated In the plan, for specified services
and target groups. Monies allocated for children's mental health services may be used to purchase
residential care In public and private facilities, either out of county or out of state. Since counties
allocate differing proportions of their annual mental health budget to programs for children and youth,
the level and type of services offered vary in the state.
California is not a member of the Interstate Compact on Mental Health, but there are some policies
and restrictions on placing children in other states. The supervision of patient transfers, originating
CA-3
43
from county mental health agencies, regional centers of the Department of Developmental Serwices (DOS),and state hospitals operated by either DMH or DDS, are processed by the DMH Patient TranSfer Office.Personnel In the Patient Transfer Office report that Sections 4119-4120 of the California Welfare andInstitutions Code authorize the office to arrange placements in public hospitals in other states whenthere Is a change of legal residence, such as when a parent or guardian of a hospitalized child moves toanother state.
F. Mental Retardation
Services to California mentally retardedor developmentally disabled children are provided by 21private nonprofit agencies In service regions which are funded and supervised by the Department ofDevelopmental Services (DDS) which Is also within the State Health and Welfare Agency.
DOS negotiates an annual contract for funding with each 4 these regional centers and monitorscontract, implementation by receiving fiscal and programmatic reports from each of the centers. Thecenters must receive a reimbursement from DDS for all residential care which Is to bs funded wIth.DDSrevenues. It was reported that DDS does not provide such reimbursements for placements In other states.
G. Recent Developments
Since January 1, 1975, the California Youth Authority (CYA) has refused to accept commitments of"601s," i.e., status offenders as defined by Section 601 of the California Welfare and Institutions Code.It has been reported that since January 1, 1977, CYA may not accept 601s for placement In Its secureinstitutions as a matter of state law. Thus, among all juveniles who are referred to the juvenilecourts, only delinquents (602s) may be committed to the custody of the CYA.
CYA also receives youthful offenders committed to it by criminal courts. California recently workedout an agreement with the Office of Juvenile Justice and Delinquency Prevention to come into fullcompliance with federal requirements for the deinstitutionalization of status offenders and theseparation of young offenders from those over 18 years old. California's Office of Criminal JusticePlanning Is In charge of developing federally funded community programs for status offenders anddelinquents. Many of these programs are contracted to private nonprofit or public agencies. Theyinclude diversion, restitution, intervention, and prevention projects.
IV. FINDINGS FROM A SURVEY OF OUT-OF-STATE PLACEMENT PRACTICES IN 1978
The following discussion and presentation of data includes the findings from the survey of state,andlocal public agencies In California. The data Is presented In such a way that it addresses the majorIssues and questions relating to out-of-state placements that were raised In the introduction. It Isimportant to note that data relating to the state child welfare agency Is portrayed in two segments.This action was taken because informationwas collected separately from the divisions responsible forfoster care and adoptions within DSS. This separation has also been maintained because of the presenceof noteworthy differences In out-of-state placement practices between the two operations. The surveyinformation has been presented In the following tables with the designations of Child Welfare
1 h)radoptions data and Child Welfare Il for foster care data.
A. The Number of Children Placed In Out-of-State Residential Settings
Table 05-2 provides a summary of the incidence of out-of-state placements In 1978 reported byCalifornia state and local public agencies. A total of 508 children were reported placed out of state byCalifornia state and local public agencies In 1978. However, this figure should be considered with anunderstanding that the number of placements reported by any single agency may have involved another
CA-4
44

agency's cooperation. Therefore, the total figure presented may be an overrepresentation of the
involvement of public agencies in arranging out-of-state placements. (Further Information about
interagency cooperation is given In Table 05-6.)
One of the most interesting findings shown in Table 05-2 Is the lack of out-of-state placements
arranged by state agencies. Only the California YouthAuthority placed children out of state In 1978,
but the agency was unable to report the number of children Involved.
Table 05-2 also shows that local probation departments reported arranging 230 out-of-state placements
which represents 45 percent of all SUCh placements Identified in the survey. The second highest number
of out-of-state placements were reported by local child welfare agencies which placed 175 children out of
state. School districts reported being Involved in the placement of nearly 100 children out of the state
for purposes which included special education. Mental health agencies showed minor involvement In
placing children Into other states, reporting involvement in only six such placements.
TABLE 05-2. CALIFORNIA:,_NUMBER OF OUT-OF-STATE PLACEMENTS
ARRANGED BY STATE AND LOCAL PUBLIC AGENCIES
IN 1978, BY AGENCY TYPE
Number of CHILDREN, by Agency Type
Levels of Child Welfare, Juvenile Mental Mental
Government I II Education Justice Health Retardation Total
State AgencyPlacements° 0 0 0 0 0 0
Local AgencyPlacements 175 97 230 6 508
Total 175 97 230 6 0 508
* denotes Not Available.
-- denotes Not Applicable.
a. Child Welfare I indicates data reported by the HWA Department of Social
Services' adoptions branch and Child Welfare II indicates data reported by HWA
Department of Social Services foster care branch.
b. May include placements which the state agency arranged and funded independently
or.under a court order, arranged but did not fund, helped arrange, and others directly
involving the state agency's assistance or knowledge. Refer to Table 05-15 for speci-
fic information regarding state agency Involvement In arranging out-of-state
placements.
The number of out-of-state placements reported arranged by each local agency with its county of
Jurisdiction and the estimated youth population of that county are displayed, by agency type, In Table
05-03. It is important to bear in mind that the Jurisdiction of school districts contacted is smaller
than the counties containing them. For that reason, multiple agencies may have reported from each county
and the incidence reports In the table are the aggregated reports of all within them. This table also
shows the counties In which child welfare agencies either declined to participate In the survey or were
unable to provide specificinformation about the number of children placed out of state. If placements
by these counties were included In the data, especially from areas such as Fresno, San Bernadino, Santa
Clara, San Diego, Solano, and Sonoma, the, total number of out-of-state placements could greatly exceed
the 175 that wore reported.
Interestingly, among local child welfare agencies, agenciesserving counties of relatively small
populations often make as large or larger contributions to the total incidence of out-of-state placement
as the agencies in more populated counties. Notable among these agencies in smaller counties are Kern,
San Joaquin, Santa Barbara, and Tulare, which together account for 36 percent of all out-of-state
placements arranged by local child welfare agencies.
The out-of-state placement of children by school districts tends to be an urban phenomenon In
California. AboutA63 percent of the placements reported by these agencies were arranged by school
CA-5
43

districts In the larger counties of Los Angeles, Orange, San Mateo, and Santa Clara. School districts Inthe remaining counties made relatively few out-of-state placements, with Alameda, Merced, and San Diegocounty school districts arranging most of the remaining placements.
The 230 children placed out of state by local probationdepartments and courts are also displayed bycounty In Table 05-03. Most notable Is the fact that San Diego made 60 such placements In 1978 and, likeeducation agencies, the practice of using residential care In other states by local Juvenile Justiceagencies seems to be largely an urban phenomenon. After San Diego, such agencies with a higher Incidenceof out-of-state placement are In Imperial, Kern, WS Angeles, Sacramento, San Joaquin, and San MateoCounties. These slx probation agencies each placed between ten and 20 children out of state; and whencombined with the placements from the agency In San Diego, they account for 63 percent of all localJuvenile Justice out-of-state
placements arranged in 1978.
Mental health agencies were minimally involved In placing children into other states, with only threeagencies making such placements.These agencies placed a total of six children out of California In1978.
TABLE 05-3. CALIFORNIA: 1978 YOUTH POPULATIONS AND THE NUMBEROF OUT-OF-STATE PLACEMENTS ARRANGED BY LOCALAGENCIES IN 1978, BY COUNTY AND AGENCYTYPES REPORTING PLACEMENTS
County Name
1978Populationa(Age 8-17k
Number of CHILDRENPlaced during 1978
ChildWelfare Educationb
Juvenllejustice
MentalHealth
Alameda 173,762 16 5 est 2 0Alpine147 0 0 **
0Amador 2,247 0 0 0 **Butte 18,541 0 0 3 est 0Calaveras 2,160 0 0 0 0
Colusa 2,227 *0 0 0Contra Costa 107,104 0 1 4 0Del Norte 3,057 1 0 0 0El Dorado 9,892 3 est 0 0 0Fresno 81,314 * 1 1 0
Glenn 3,228 0 0 0 0Humboldt 17,878 0 *1 0Imperial 18,337 3 1 10 est 0lnyo 2,948 1 0 1 0Kern 67,020 11 0 12 0
Kings 13,853 2 0 0 0Lake 3,439 0 0 3 0Lassen 3,096 2 est 0 2Los Angeles 1,141,065 7 23 est 20 est 0Madera 8,866 3 0 3 est
Marin 35,966 0 4 4 0Mariposa 1,287 0 0 0Mendoclno 9,808 3 0 1 0Merced 24,525 4 7 est 2 est 0Modoc 1,320 0 0 0 0
Mono 1,245 2 0 0 0Monterey 44,972 2 0 8 est 3Napa 14,975 0 0 0 0Nevada 5,605 0 0 1 0Orange 309,663 18 est 15 est 1 0
CA-6

TABLE 05-3. (Continued)
County Name
1978
Populatione(Age 8-17)
Number of CHILDRENPlaced during 1978
ChildWelfare Educationb
Juvenllejustice
MentalHealth
Placer 15,740 3 0 1 0
Plumas 2,591 2 1 1
Riverside 92,037 7 0* 0
Sacramento 123,865 11 est 1 15 est 0
San Benito 3,898 0 0 0 0
San Bernardino 126,331 * 1 3 est 0
San Dlego 261,623 * 6 est 60 est 0
San Francisco 74,418 0 0 1 0
San JoaquIn 51,638 14 0 17 est 0
San Luls Obispo 17,949 4 est * 3 est*
San Mateo 92,586 6 13 11 0
Santa Barbara 46,274 14 0 6 est 0
Santa Clara 217,909 * 10 5 est 0
Santa Cruz 23,767 3 3 4 0
Shasta 17,055 3 0 1 2
Sierra 394 0 0 0 0
Siskiyou 5,866 0 1 3 est 0
Solano 34,362 * 0 0 0
Sonoma 42,439 * 0 4 est 0
Stanislaus 41,173 1 1 3 1
Sutter 8,575 2 0 0
Tehama 5,970 0 0 4 est 0
Trinity 1,789 0 0 0 0
Tulare 40,736 24 0 2 est 0
Tuolumne 3,903 0 0 2 0
Ventura 87,908 2 1 0
Yoio 16,749 2 1 0 0
Yuba 9,414 1 0 4 est
Multicounty Jurisdictions
Lassen, PlumasMN.
Madera, MariposaSutter, Yuba
:DOW -
Subcov!ty Jurisdictions
Berkley CityTri-City, Pomona
WOWS 0
CA-7
4 7

TABLE 05-3. (Continued)
County Name
Number of CHILDREN1978 Placed during 1978
Population* Child Juvenile Mental(Age 8-17) Welfare Education* Justice Health
Total Number ofPlacements Arrangedby Local Agencies(total may includeduplicate count) 175 est 97 est 230 est 6
Total Number of LocalAgencies Reporting 54 1,029 56 55
** denotes Not Available.denotes Not Surveyed.denotes Not Applicable.
a. Estimates were developed by the National Center of Juvenile Justiceusing data from two sources: the 1970 national census and the National Cancerinstitute 1975 estimated aggregate census.
b. Wore than one school district may be reflected In a county's placementtotal. There was a total of four school districts abstaining from participationin the survey in Humboldt and San Luis Obispo Counties. The *not available*designation which occurs for those counties should be read to apply only tothose school districts and not all school districts In those counties. Allother school districts that were contacted In Humboldt and San Luls Obispo Coun-ties responded to the survey and none of them placed any children out of state.
B. The Out-of-State Placement Practices of Local Agencies
An,overview of the involvement of local agencies in arranging out-of-state placements in 1978 Isshown In Table 05-4 by agency type. A total of 124 local agencies reported arranging out-of-stateplacements, which included over one-half of ell local probation departments and child welfare agencies.in contrast, only about five percent of all school districts or mental health agencies reported involve-ment In arranging such 'placements.
The response'rate from California local agencies was generally good, with not more than four agenciesof any type abstaining from participation In the research. Problems with agencies having made out-of-state placements but -being unable to report the number of children involved were most prevalent amongchild welfare agencies. Nonparticipatlon or Inability to report the number of children placed out ofstate occurred In a total of eight child welfare agencies which, as shown in Table 05-3, most often werelocated In more populated areas of the state.
CA-8
4 8
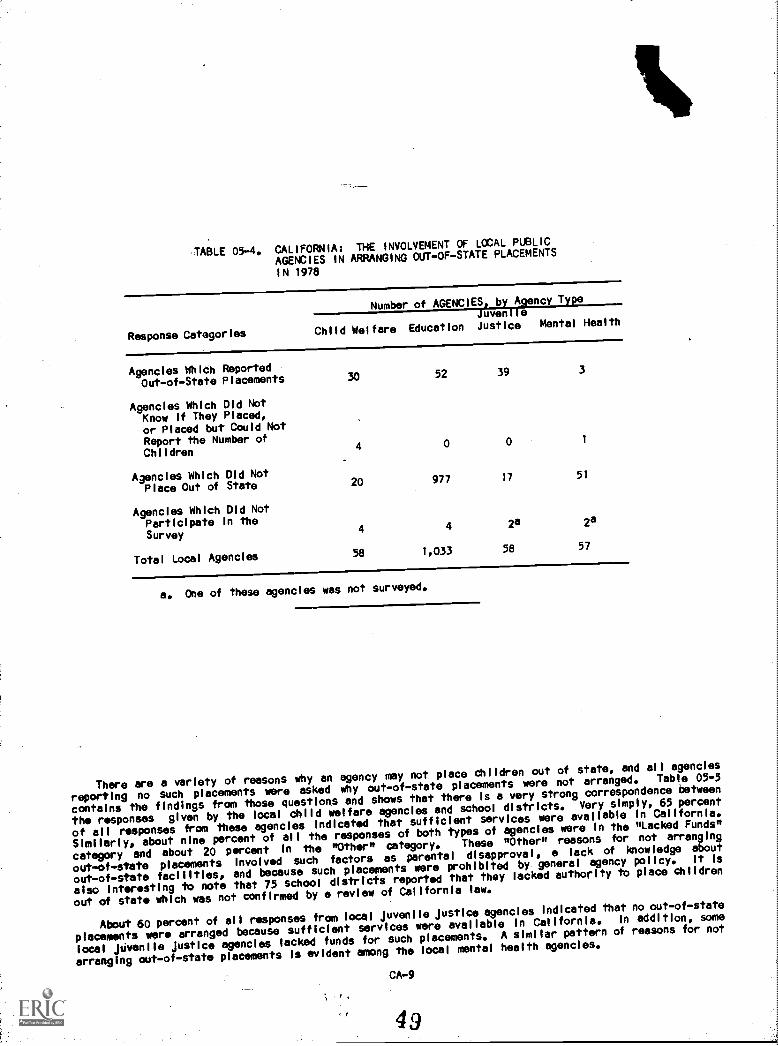
TABLE 05-4. CALIFORNIA: THE INVOLVEMENT OF LOCAL PUBLIC
AGENCIES IN ARRANGING OUT-OF-STATE PLACEMENTS
IN 1978
Response Categories
Number of AGENCIES, by Agency TypeJuvenile
Child Welfare Education Justice Mental Health
Agencles WhiCh ReportedOut-of-State Placements 30 52 39 3
Agencies Which Did NotKnow If They Placed,or Placed but Could NotReport the Number ofChildren
4 0 0 1
Agencies Which Did NotPlace Out of State 20 977 17 51
Agencles Which Old NotParticipate In the
Survey4 4 2a
Total Local Agenclesse 1,033 58
28
57
a. One of these agencles was not surveyed.
There are a variety of reasons Why an agency may not place children out of state, and all agencles
reporting no such placements were asked Ohy out-of-state placements were not arranged. Table 05-5
contains the findings from those questions andshows that there Is a very strong correspondence between
the responses given by the local child welfare agencles and school dlstricts. Very simply, 65 percent
of all responses from these agencies indicated that sufficient services were available In California.
Similarly, about nine percent of all the responses of both types of agencies were In the "Lacked Funds"
category and about 20 percent In the "Other" category. These "Other" reasons for not arranging
out-of-wtate placements involved such factors as parentaldisapproval, a lack of knowledge about
out-of-state facilities, and because such placements were prohiblted by general agency policy. It is
also interesting to note that 75 school districtsreportd that they lacked authority to place chIldren
out of stat whlch was not confirmed by a review of Californin law.
About 60 percent of all responses from local Juvenile Justice agenclesindicated that no out-of-state
placements wer arranged because sufficient servlces were available In California. In addition, some
local Javenlie Justice agencles lacked funds for such placements. A similar pattern of reasons for not
arranging out-of-stateplacements Is evident among the local mental health agencies.
CA-9
4 9

TABLE 05-5. CALIFORNIA: REASONS REPORTED BY LOCAL PUBLICAGENCIES FOR NOT ARRANGING OUT-OF-STATEPLACEMENTS IN 1978
Reasons for Not PlacingChildren Out of Statea
Number of Local AGENCIES, by Reported Reason(s)Child
WelfareJuvenile
Education Justice Mental Health
Lacked Statutory Authority1 75 1 8
Restricteda0 3 0 3
LaCked Funds2 132 5 24
Sufficient Services Availablein State
15 905 16 32
Otherc5 281 5 26
Number of Agencies Reporting NoOut-of-State Placements 20 977 17 51
Total Number of AgenciesRepresented In Survey 54 1,029 56 55
a. Some agencies reported more than one reason for not arranging out-of-stateplacements.
b. Generally included restrictions based on agency policy, executive order,compliance with certain federal and state guidelines, and specific court orders.
c. Generally included such reasons as out-of-state placements were againstoverall agency policy, were disapproved by parents, involved too much red tape, andwere prohibitive because of distance.
Table 05-6 illustrates the extent of interagency cooperation among local public agencies for placingchildren Into other states. Seventy-three percent of all child welfare agencies reporting out-of-stateplacements cooperated with other agencies In the placement process, compared to only about one-fourth ofthe education and Juvenile Justice agencies arranging such placemenfl. The cooperative placements madeby the child welfare agencies account for about six of every ten out-of-state---placements that werereported by these agenclet. . in contrast, less than 25 percent of education and Juvenile Justiceplacements that were reported included the involvement of other public agencies in the state. Table 05-6also shows that all six placements tvported by local mental health agencies were cooperatively arrangedwith other agencies.
Generally, this interagency cooperation involved the solicitation of information such as diagnosticevaluations, Individualized Education Plans,/ from school personnel, and facility identification datafrom officials knowledgeable about existing out-of-state facility programs. In many cases, interagencycooperation occurred In the course of arranging a placement through an interstate compact.
CA-10
50

TABLE 05-6. CALIFORNIA: THE EXTENT OF INTERAGENCY COOPERATION
TO ARRANGE OUT-OF-STATEPLACEMENTS BY LOCAL
AGENCIES IN 1978
Number and Percentage, by Agency Type
ChlId Welfare Education Juvenile Justice-lIrr-U-7-741r7Crenun
Mental Health
Number Percent Number Percent 'Number Percent
AGENCIES ReportingReporting Out -
of -State
Placementsa 30 56 52 5 39 70 3 5
AGENCIES ReportingOut-of-StatePlacements withInteragency
22 73 13 25 9 23 3 100
,Cooperailon,
Number of CHILDRENPlaced Out ofState 175 100 97 100 230 100 6 100
Number of CHILDRENPlaced Out ofState withInteragency
99 57 22 23 39 17 6 100
Cooperation
a. See Table 05-4.
The conditions of children that were placed out of state In 1978 are noted In Table 05-7. The most
frequent category of conditions indicated as characteristic of children placed out of state by child
welfare agencies was battered, abandoned, or neglected; and by probation departments as Juvenile
delinquent and unruly/disruptive. The local education agencies frequently mentioned that the children
they placed out of state had special education needs and also typically stated that the children were
mentally ill/emotionally disturbed. Thls would seem to Indicate that mental or emotlonal impairment Is
prevalent among children being placed across state !Ines by California schooldistricts for special
education purposes. The local mental health agencies also placed children out of state who were mentally
III/emotionally disturbed, but also characterized the children as pregnant, battered, abandoned,
neglected, and adopted.
Table 05-7 also indicatesthat local child welfare, education, and Juvenile Justice agencies appear
to be involved In placing children out of state with a wide variety of conditions, including those for
which the agencies are not usually thought of as addressing. This could Imply that the agencies are
placing children with problems for which they are less than optimally equipped to address. This overlap
of problems may also imply that this is why the previously discussed interagency cooperation occurs.
These factors would depend upon local agency resources and the relationship amongdifferent agencies In a
particular locale.
As noted In section ill, 19 county probationdepartments have sole Jurisdiction over dependency cases
or share that responsibility with child welfare agencies. This fact may account for the nine Juvenile
probation agencies reporting the placement of children who are battered,abandoned, or neglected out of
California. All but one child welfare agency reflected In the table also reported placing such chlidren
out of California.
CA-11
51

TABLE 05-7. CALIFORNIA: CONDITIONS OF CHILDREN PLACEDOUT OF STATE IN 1978 AS REPORTED BY LOCALAGENCIES
Types of Conditionsa
Number of AGENCIES ReportingChild Juvenile Mental
Welfare Education Justice Health
Physically Handicapped 3 6 1 0Mentally Retarded orDevelopmentally Disabled 4 7 1 0
Unruly/Disruptive 5 4 30 0Truant
2 3 13 0
Juvenile Delinquent2 1 35 0
Mentally III/EmotionallyDisturbed
3 24 6 2Pregnant
1 0 0 1
Drug/Alcohol Problems 2 3 13 0
Battered, Abandoned, orNeglected
29 0 9 1
Adopted16 0 0 1
Special Education Needs 2 16 1 0Multiple Handicaps 2 7 0 0Otherb
4 0 2 0Number of Agencies Reporting 30 52 39 3
a. Some agencies reported more than one type of condition.
b. Generally included foster care placements, autistic children, andstatus offenders.
C. Detailed Data from Phase 11 Agencies
When more than four placements were reported by a local agency,additional information was requested,These agencies placing more than four children from which the second phase of data was collected becameknown as.Phase II agencies. Throughout this section of the California profile, information provided bythe Phase II agencies will be reviewed.
Figure 05-1 illustrates the relationship between the number of agencies surveyed and placementsreported, and those Phase II agencies and their placements, It can be observed from this table that ofthe local child welfare agencies and Juvenile Justice agencies which placed out of state, approximatelyone-third were Phase II agencies. These Phase II agencies reportedlyarranged 73 and 71 percent of allchild welfare and Juvenile Justice placements, respectively.
A smaller percentage of local education agencies were involved In arranging out-of-stateplacements,with only three of the 52 placing agencies being Phase 11 agencies. Only 30 percent of the totaleducational placements were attributed to these agencies.
CA-12
52

FIGURE 05-1. CALIFORNIA: RELATIONSHIP BETWEEN THE NUMBER OF
LCCAL AGENCIES SURVEYED AND PLACEMENTS REPORTED,
AND AGENCIES AND PLACEMENTS IN PHASE II, BY
AGENCY TYPE
ChildWelfare Education
JuvenileJustice
Number of AGENCIES
Number of AGENCIES ReportingOut-of-State Placements in
1978
Number of AGENCIES Reporting
Five or More Placements in
1978 (Phase II Agencies)
30 I
[ 1,029J
56 I
i
1
I 31 1101
Number of CHILDREN PlacedOut of State In 1978
Number of CHILDREN Placedby Phase II Agencies
Percentage of Reported Placements
In Phase II
11751 I.
97 1 230
11!
I
i30
1 1
71
Flgure 05-2 displays the location or Jurisdiction of k)cal Phase 11 agencies In California. Most of
the Phase II agencies are located In California SMSA'ssurrounding the Pacific coast. The Imperial
County local Juvenile Justice agency and local Tulare County child welfare agency also weretPhase,11
agencies with their counties of Jurisdiction bordering SMSAs.
CA-13
53-

FIGURE 05-2. CALIRORNIA: COUNTY LOCATION OF LOCAL PHASE II AGENCIES
County
A. Alameda8. ImperialC. KernD. Los AngelesE. MercedF. MontereyG. OrangeN. RiversideI. SacramentoJ. San DiegoK. San JoquinL. San MateoM. Santa BarbaraN. Santa Clara0. Tulare
KEY
Child Welfare Phase IIAgency Jurisdiction
BOJuvenile Justice Phase IIAgency Jurisdiction
IPEducation Phase /I AgencyJurisdiction
CA.-14
54

Table 05-8 displays the Phase II agency responses about the destinations of those placements arranged
by them. Local Phase 11 child welfare and education agencies were able to report the destinations of
about 75 percent of the children they placed out of state. In contrast, destination data were available
for only 18 percent of the 164 placements which were arranged by local Juvenile Justice agencies.
Child welfare agenciesplaced children In 32 states (In every region of the country) and in Europe
and Asia. No single state predominates among those receiving children sent by California local child
welfare agencies. There Is a fairly even distribution of placements tostates as distant as Florida and
Hawaii and as close as Nevada. The range In numbers of children sent to different states Is as few as
one to as many as ten. The states receiving nine to ten children placed by local child welfare agencies
included Oregon, Pennsylvania, Texas, and Washington.
Local school districts tended to favor Utah as a destination for children with special education
needs and sent as many children there as the other three receiving states combined. Among the 29
children for which destinations could be given by local Juvenile Justice agencies, over 85 percent were
placed in Texas.
TABLE 05-8. CALIFORNIA: DESTINATIONS OF CHILDREN PLACED BY
LOCAL PHASE 11 AGENCIES IN 1978
Destinations of ChildrenPlaced Out of State
Number of CHILDREN Placed
Child Welfare EdUcation Juvenile Justice
Alabama2
Alaska1
Arizona4 6
Arkansas1
Colorado1
12
Connecticut1
Florida1
Georgia1
Hawaii2
Idaho7
Illinois2
IowaKansas
2
Kentucky3
Loulsiana1
MassachusettsMississippi
2
Missouri1
Montana1
Nevada 5
New Mexico1
New York 2
North Carolina1
Ohio4
Oklahoma 1
Oregon10
Pennsylvania9
South Carolina1
Texas9 4 25
Utah2 11
Virginia1
Washington10
Wisconsin1
Wyoming4
Europe1
Asia
CA-15

TABLE 05-8. (Continued)
Destinations of ChildrenNumber of CHILDREN PlacedPlaced Out of State
TIFT11 weltare tducatIon Juvenile Justice
Placements for Which DestinationsCould Not be Reported byPhase II Agencies
32 7 135
Total Number of Phase 11 Agencies 10 3 10
Total Number of Children Placedby Phase 11 Agencies
128 29 164
The number of children placed in Mexico and states contiguous to California by Phase II agencies isIllustrated in Figure 05-3. States contiguous to California were not mentioned by those probationdepartments which oould report on children's destinations,so that agency type is not represented in thefigure. Because information was typically not available from these agencies, it should not beinterpreted that probation departments did not place children into these border states or Mexico.
Children placed into contiguous states by local Phase II child welfare and education agenciesconstitute 27 percent of the destinations reported by the education agencies and 20 percent of the childwelfare out-of-state placement destinations.
FIGURE 05-3. CALIFORNIA: THE NUMBER OF CHILDREN REPORTED PLACEDIN STATES CONTIGUOUS TO CALIFORNIA BY LOCALPHASE II AGENCIESa
10 (CW)
5 (cW)
4 (CW)
6 (ED)
a. Local Phase II child welfare agencies reported destinations for 96 chil-dren. Local Phase II education agencies reported destinations for 22 children.
CA-16
56

The local Phase II agencies were asked to give the reasons associated with arranging such placements.
Table 05-9 indicates that the most frequently mentioned reason for arranging out-of-state placements
concerned an interest in having children live with relatives other than parents. This reason was the
most frequent response given by both local child welfare and Juvenile Justice agencies. Many local
Juvenile Justice agencies also explained thatout-of-state placements were alternatives to in-state
public institutionalization. Remaining reasons for placing children out of state, including those
reported by school districts, cover all response categories.
TABLE 05-9. CALIFORNIA: REASONS FOR PLACING CHILDREN
OUT OF STATE IN 1978, AS REPORTED BY LOCAL
PHASE II AGENCIES
Reasons for Placementa
Number of AGENCIES ReportingJuvenile
Child Welfare Education Justice
Receiving Facility Closer to Child's Home,
Despite Being Across State Lines 2 0 0
Previous Success with Receiving Facility 2 14
Sending State Lacked Comparable Services 0 3 3
Standard Procedure to Place Certain Children
Out of State1 1
0
Children Failed to Adapt to In-State
Facilities2 1 3
Alternative to In-State Public
Institutionalization2 2 9
To Live with Relatives (Non-Parental) 9 0 10
Other6 2 0
Number of Phase II Agencies Reporting 10 3 1(4
a. Some agencies reported more than one reason for placement.
The most frequently used categories of placement forchildren placed out of state is reflected In
Table 05-10 for those local Phase II agencies. These findings correspondto the reasons for placing
children out of state In the sense that relatives'homes are most often used by local child welfare and
Juvenile probation agencies.While school districts said that they placed
children out of California for
a variety of reasons, the three responding agencies indicated thatresidential treatment or child care
facilities and psychiatric hospitals were the most frequent categories of placement for children leaving
the state.
CA-17
5 7

TABLE 05-10. CALIFORNIA: MOST FREQUENT CATEGORIES OFRESIDENTIAL SETTINGS USED BY LOCALPHASE II AGENCIES IN 1978
Categories OfResidential Settings
Number of AGENCIES Reporting
JuvenIleChild Welfare Education Justice
Residential Treatment/Chltd Care Facility 0 2 1
Psychiatric Hospital0
1 0'
Boarding/Military School 0 0 0
Foster Home1 0 0
Group Home0 0 0
Relatives' Home (Non-Parental)5 0 9
Adoptive Home1 0 0
Other2 0 0
Number of Phase II Agencies Reporting 98 3 10
a. One Phase II agency did not respond to this question.
One of the major concerns related to the out-of-state placement of children Is the type and frequencyof monitoring practices einployed by the agencies responsible for the placements. For thls reason,Information about these practices was collected_from Phase 11 agencies, and the findings are displayed InTable 05-11.
Among all local agencies, the most common type of monitoring was the use of written quarterlyprogress reports. The child welfare and juvenile probation agencies also frequently reported makingperiodic telephone calls to check on children placed out of state. It Is noteworthy that on-slte visitswere rarely mentioned as a method of monitoring.
TABLE 05-11. CALIFORNIA: MONITORING PRACTICES FOROUT-OF-STATE PLACEMENTS AS REPORTED BYLOCAL PHASE II AGENCIES IN 1978
Methods of MonitoringFrequency ofPractice
Number of AGENCIEsaChild JuarTITE
Welfare Education Justice
Written Progress Reports Quarterly 6 0 6Semiannually 2 2 3Annually 0 0 0Otherb 0 1 1
On-Site Visits Quarterly 0 0 1
Semiannually 0 0 0Annually 0 0 0Otherb 2 0 1
Telephone Calls Quarterly 1 0Semiannually 1 0 1
Annually 0 0 0Otherb 6 1 6
CA-18
58

14.
TABLE 05-11. (Continueci)
Methods of Monitoring
Frequency ofPractice
Number of AGENCIESaChild
Welfare Education
JualTrITJustice
Other Quarterly 1 0 0
Semiannually 1 0 0
Annually 0 1 0
Otherb 3 2 0
Total Number of Phase 11Agencies.Reporting
10 3 10
a. Some agencies reported more than one method of monitoring.
b. Included monitoring practices which did not occur at regular intervals.
Local Phase II agencies were asked to report their expenditures for these placements in 1978. Four
local child welfare agencies reported a total expenditure of $57,116, one school district reported
spending $120,000, and seven local probation departmentsreported spending a sum of $30,000 for their
out-of-state placements. Obviously, these major differences In costs incurred by the three types of
agencies Is directly related to the categories of placement used for the children they placed out of
state.
D. Use of Interstate Compacts by State and Local Agencies
An issue of particular Importance to a study about the out-of-state placement of children involves
the extent to which interstate compacts are utilized for arranging such placements. Table 05-12 reports
findings about the utilization of compacts In 1978 by the 124 local agencies in California which reported
placing children out of state. Information Is given by agency type and allows for an examination of
differences In oompact utilization by agencies which placed four or less and five or more children out of
state. In addition, the table indicates the specific type of compact which was reported to have been
used by those agencies arranging five or more out-of-state placements.
Review of Table 05-12 reveals that a total of 69 agencies placed children out of state in 1978 and
dld not use a compact for those placements. The majority of those agencies not using compacts were local
education agencies, whose placements are generally not subject to compact provisions. None of the three
local mental.health agencies arranging out-of-state placements in 1978 used a compact. Among the local
child welfare and Juvenile justice agencies, Table 05-12 shows that 17 of these agencies did not use a
compact; however, they included only agencies which arranged four or less out-of-state placements.
CA-19
59
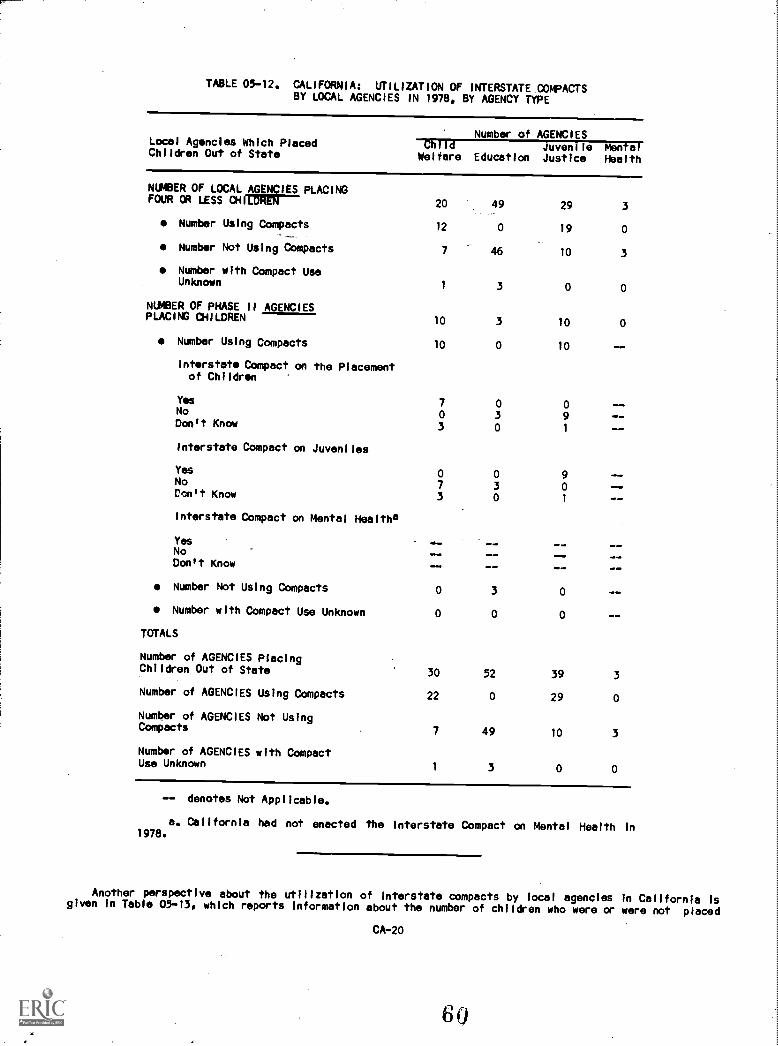
TABLE 05-12. CALIFORNIA: UTILIZATION OF INTERSTATE COMPACTSBY LOCAL AGENCIES IN 1978, BY AGENCY TYPE
Local Agencies Which PlacedChildren Out of State
Number of AGENCIESChild Juvenile Mental
Welfare Education Justice Health
NUMBER OF LOCAL AGENCIES PLACINGFOUR OR LESS OHIMMIT--- 20 49 29 3
Number Using Compacts 12 0 19 0---
Numbor Not Using Compacts 7 46 10 3
Number with Compact UseUnknown
1 3 0 0
NUMBER OF PHASE II AGENCIESPLACING CHILDREN 10 3 10 0
Number Using Compacts 10 0 10 --
interstate Compact on the Placementof Children
Yes 7 0 0No 0 3 9Don't Know 3 0 1
Interstate Compact on Juveniles
Yes 0 0 9No 7 3 0Don't Know 3 0 1
Interstate Compact on Mental Healtha
YesNoDon't Know
IMMO _ -
- -
- -
Number Not Using Compacts 0 3 0 --
Number with Compact Use Unknown 0 0 0 --
TOTALS
Number of AGENCIES PlacingChildren Out of State 30 52 39 3
Number of AGENCIES Using Compacts 22 0 29 0
Number of AGENCIES Not UsingCompacts 7 49 10 3
Number of AGENCIES with CompactUse Unknown
1 3 0 0
-- denotes Not Applicable.
a, California had not enacted the Interstate Compact on Mental Health In1978.
Another perspective about the utilization of interstate oompacts by local agencies In California Isglven In Table 05-13, which reports Information about the number of children who were or were not placed
CA-20
60

out of state through a oompact In 1978. This type of tabulation provides a fuller understanding about
compact utilization and examines the possibility that agencies whlch reported using compacts did not do
so for all their out-of-state placements. Agaln, the information Is displayed by agency type, Indicates
the number of children placed through the specific types of oompacts by agencies arranglng five or more
out-of-state placements, and allows for an examination of differences in oompact utilization among
agencies placing four or less and five or more children out of state.
A total of 170 children were known to have been placed out of state in 1978 wIthout a compact. Table
05-13 shows that thls figure included 22 children placed by local child welfare agencies, 92 children
placed by local education agencies, 50 children placed by local Juvenlle Justice agencies, and all six
children placed by local mental health agencies. Considering only those children placed out of state by
local child welfare and Juvenile Justice agencies for which oompact information was determined, 79
percent of the child welfare placements and 75 percent of the Juvenile Justice placements were arranged
through a oompact.
TABLE 05-13. CALIFORNIA; NUMBER OF PLACEMENTS AND THEUTILIZATION OF INTERSTATE COMPACTS BYLOCAL AGENCIES IN 1978
Number of CHILDRENChild Juvenile Mental-
Children Placed Out of State Welfare Education Justice Health
CHILDREN PLACED BY AGENCIESREPORTING FOUR OR LESS PLACEMENTS
Number Placed with Compact Use
Number Placed without CoMpact Use
Number Placed with CompactUse Unknowna
CHILDREN PLACED BY PHASE II AGENCIES
Number Placed with Compact Useb
Number through Interstate Compacton the Placement of Children
Number through InterstateCompact on Juveniles
Number through InterstateCompact on Mental Healthc
Number Placed without Compact Use
Number Placed with Compact UseUnknown
TOTALS
Number of CHILDREN Placed Outof State
Number of CHILDREN Placedwith Compact Use
47 68 66
12 0 19
15 63 19
20 5 28
128 29 164
72 0 128
69 0 0
0 0 128
7 29 31
49 0 5
175 97 230
84 0 147
6
0
6
0
0
--
6
0
CA-21
61
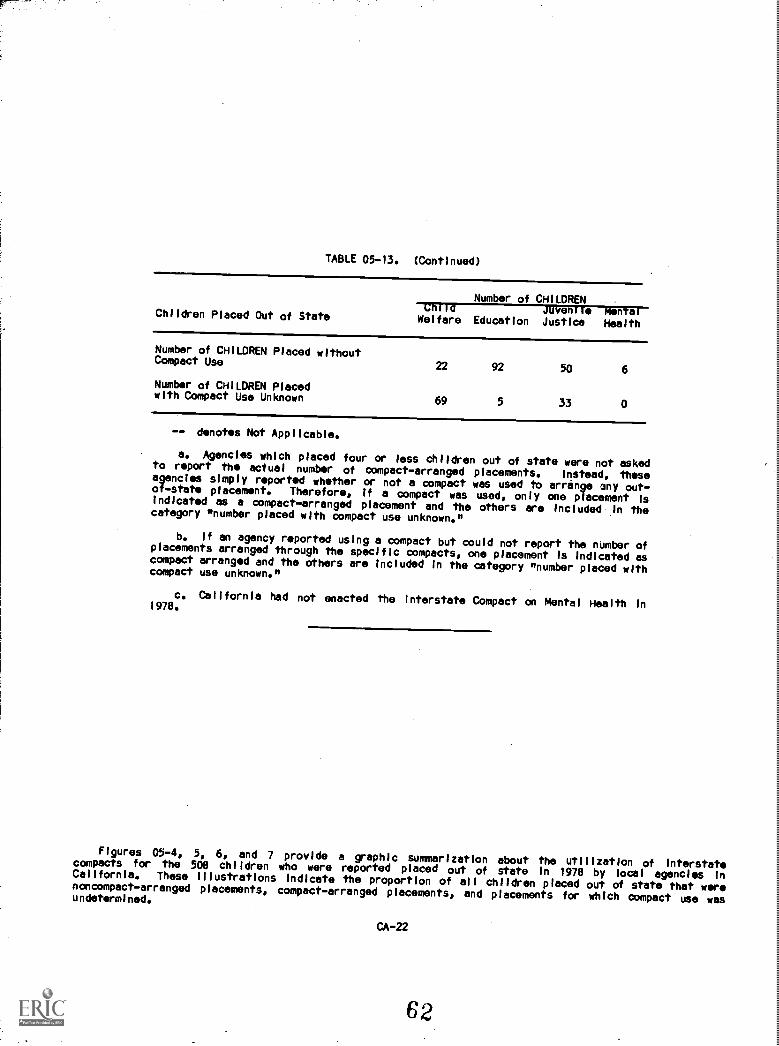
TABLE 05-13. (Continued)
Children Placed Out of State
Number of CHILDREN111102 Juvenile mentai
Welfare Education Justice Health
Number of CHILDREN Placed withoutCompact Use
Number of CHILDREN Placedwith Compact Use Unknown
22 92 50 6
69 5 33 0
-- denotes Not Applicable.
a. Agencies which placed four or less children out of state were not askedto report the actual number of compact-arranged placements. Instead, theseagencies simply reported whether or not a compact was used to arrange any out -of -state placement. Therefore, If a compact was used, only one placement isindlcated as a compact-arranged placement and the others are included In thecategory "number placed wlth compact use unknown."
b. If an agency reported using a compact but could not report the number ofplacements arranged through the specific compacts, one placement Is Indicated ascompact arranged and the others are Included In the category "number placed withcompact use unknown."
c. California had not enacted the Interstate Compact on Mental Health In1978.
Flgures 05-4, 5, 6, and 7 provlde a graphic summarization about the utilization of interstatecompacts for the 508 children who were reported placed out of state In 1978 by local agencies inCalifornla. These Illustrations indicate the proportion of all children placed out of state that worenoncompact-arranged placements, compact-arranged placements, and placements for which compact use wasundetermined.
CA-22
62

FIGURE 05-4. CALIFORNIA: THE UTILIZATION OF INTERSTATE COMPACTS
BY LOCAL CHILD WELFARE AGENCIES IN 1978
.1110
175
CHILDREN PLACEDOUT OF STATE BYCALIFORNIA LOCALCHILD WELFARE
AGENCIES
111
.0'
13% NONCOMPACT PO4-6
48% COMPACT ARRANGED
COMp4cr N% N44:0
4).N,
CA-23
63
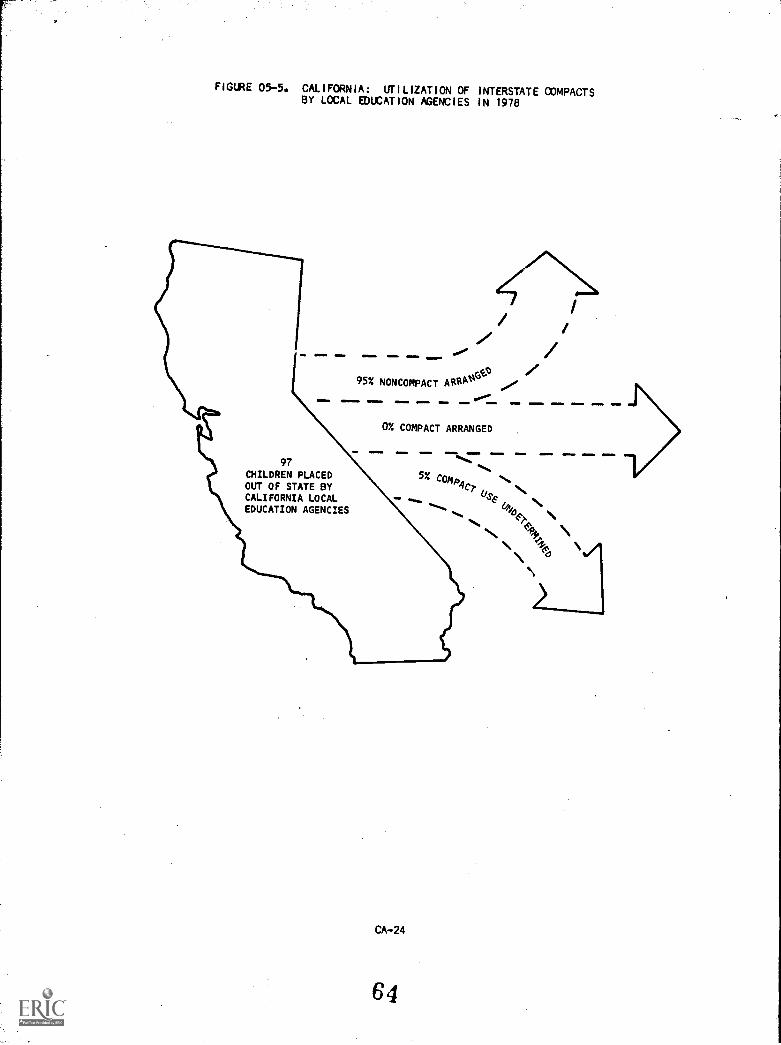
FIGURE 05-5. CALIFORNIA: UTILIZATION OF INTERSTATE COMPACTSBY LOCAL EDUCATION AGENCIES IN 1978
111==1 1110.1. =Ms WSW =11.0.
97CHILDREN PLACEDOUT OF STATE BYCALIFORNIA LOCALEDUCATION AGENCIES
95% NONCOMPACT A9 °9
01110 WW, W.1=11., =Eno =Mb =MD WW,
0% COMPACT ARRANGED
OW= WNW , WI= MN= =am 41=0 1=INE
5% comp4c, N.
o \
CA-24
6 4
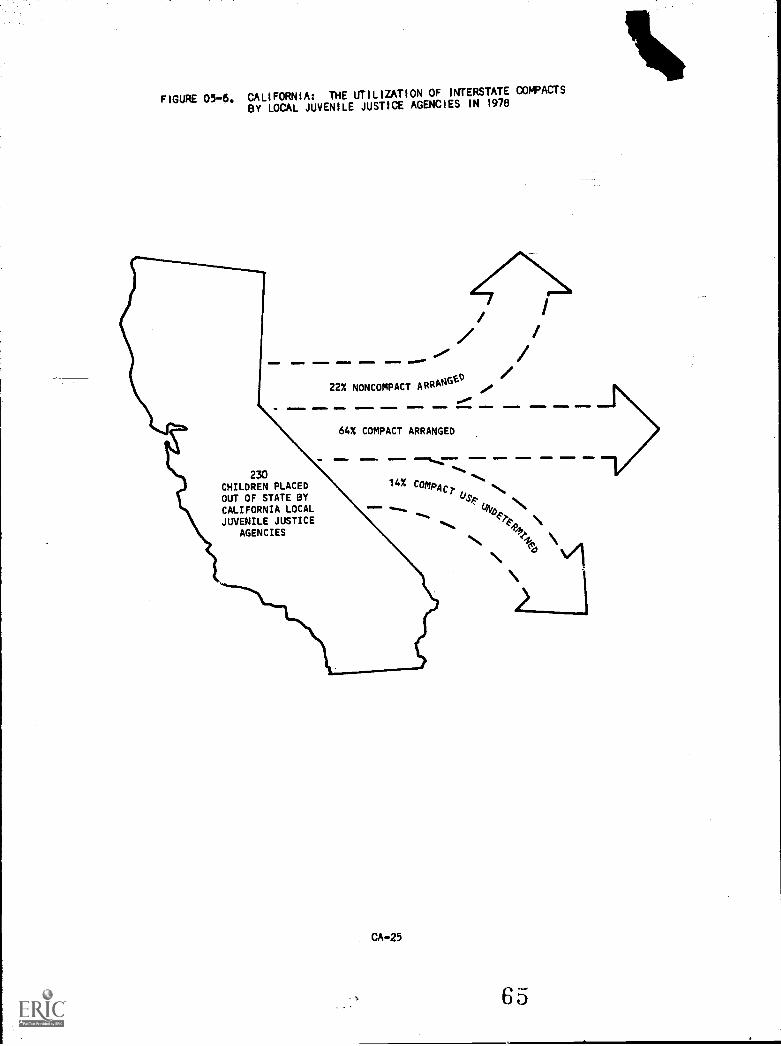
FIGURE 05-6. CALIFORNIA: THE UTILIZATION OF INTERSTATE COMPACTS
BY LOCAL JUVENILE JUSTICE AGENCIES IN 1978
=1111. WM= =NINO
22% NONCOMPACT ARRANG°
. ....... ....... .... .....- ......00
.**#
..., ...... ......
64% COMPACT ARRANGED
-
CHILDREN PLACED 14% C%":230
--
OUT OF STATE BYAC7 sk
JUVENILE JUSTICE
-... NCALIFORNIA LOCAL
AGENCIES....,
si.....
4-44, N..?..:.
'lb 14\
CA-25
65
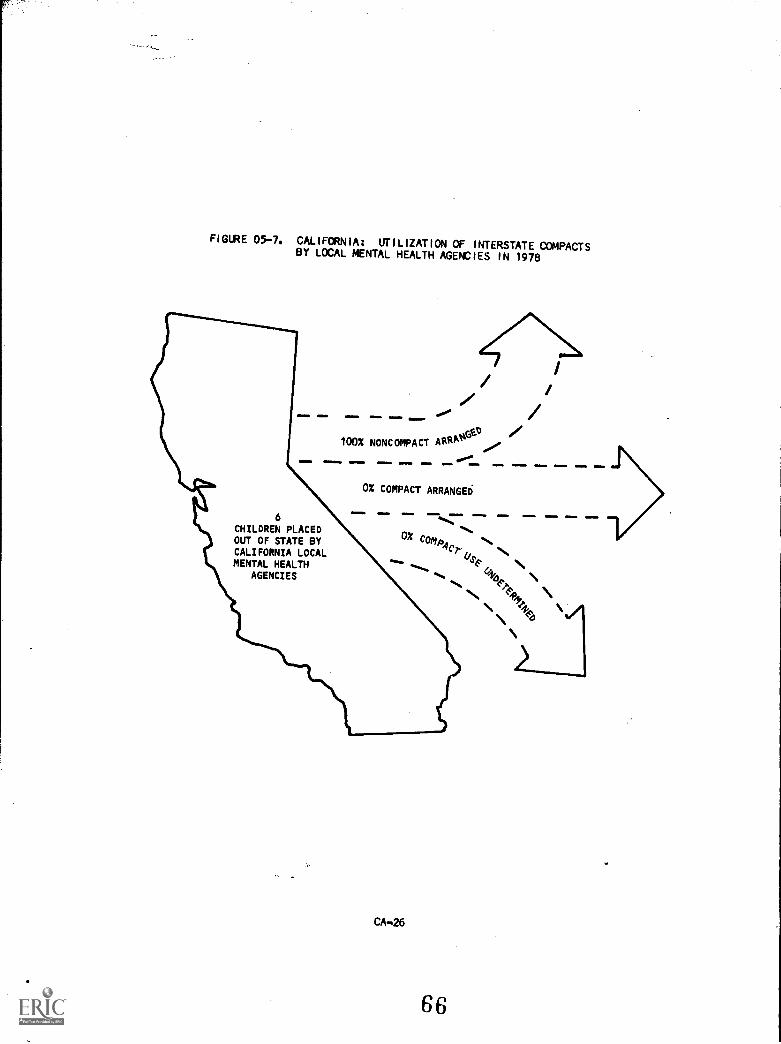
FIGURE 05-7. CALIFORNIA: UTILIZATION OF INTERSTATE COMPACTSBY LOCAL MENTAL HEALTH AGENCIES IN 1978
MINO =WO INIIMMI OMER *Now
100% NONCOMPACT ARROW°OININO OIMISM MINN. .0111 SIM
6CHILDREN PLACEDOUT OF STATE SYCALIFORNIA LOCALMENTAL HEALTH
AGENCIES
00"
0% COMPACT ARRANGED
INmi amm,
(I% COMp.4Cr %.
(Ape
% \to\
110 am= admil. =11
CA -.26

IRkTable 05-14 provldes a summary of compact utilization by 'state and local agencies as reported by
state agencies. It should be recalled that data werecollected from two branches of the Department of
Social (Services. The Family and Children Services Branch of the DSS could, not provide placement or
compact information. Only compact information from the Adoptions Branch is provided in Table 05-14. In
that partial Information provided, the 45 percent reported compact utilization Is an underrepresentation
of compact use.
None of the local school districts'placements were known to have been processed through a compact.
This Is not surprising because placements made to facilities which solely provide educational services
are not subject to any compact provisions.
The Cilifornia Youth Authority was not able to report on placement activity and compact utilization,
although Ue local juvenlle justice agencyreported 230 placements, 147 of which were processed through a
compact (see Table 05-13).
TABLE 05-14. CALIFORNIA: UTILIZATION OF INTERSTATE COMPACTSREPORTED BY STATE AGENCIES IN 1978, BY AGENCYTYPE
Child Welfare EducationJuvenileJustice
MentalHealth
Total Number of State andLocal Agency-ArrangedPlacements
Total Number of Compact-Arranged PlacementsReported by State Agencies
Percentage of Compact-Arranged Placements
175
70
45
97
0
0
*a
*
*
6
*
*
* denotes Not Available.
a. The local juvenile justice agencies reported 230 placements; however,
the state agency could not report their placement activity.
b. Only includes adoption placements. The Family and Children Services
Branch was unable to report on placement activity and compact utilization.
Similarly, the Department of Mental Health could not report the number of-state placements and use of
compacts. Table 05-13 revealed that the local mental health agencies reported six placements, none of
which were compact processed. No placement activity was reported by the Department of Mental
Retardation.
CA-27
6 7

E. The Out-of-State Placement Practices of State Agencies
Tha Involvement of Callfornla state agencies In out-of-state placement often takes the form ofsupervising and funding placements, rather than being directly Involved In the actual case management,decislonmaking, and placement arrangements. The exception to this rule ls, of course, the directplacement of children In other states by the California Youth Authority and the involvement excercised byboth the CYA and the DSS through administering interstate compacts. As seen In Table 05-15, data weregenerally not available about the involvement of state agencies in either type of arrangement.
One of the more interesting findings in Table 05-15 is the difference In reporting between the twostate child welfare agency divisions which responded to the survey. The Adoptions Branch of the DSS1Adult and Family Services Division, designated as Child Welfare I, was able to respond to Inquiries aboutthe agency's Involvement with out-of-state placements. In contrast, the Family and Children ServicesBranch of the O$P Adult and Famlly Services Division, which Is responsible for foster care placements,was unable to report 1,-in placement which involved local child welfare agencies and state foster carefunds. This Is especially important because, as previously noted, the state agency Is not involved Inthe arranging of placements, this being the responsibility of the 58 local child welfare agencies. It isimpossible to make comparisons between state and locally reported child welfare incidence flgures becauseof tha lack of information In the foster care area at the state level.
This is not true, however, for education agencies. The state education agency reported that therewere 36 out-of-stata placements arranged locally and pald for by the state department. However, localcalls to all 1,033 school districts revealed 97 out-of-state placements. This figure Is regarded as aminimum because four school districts abstalned from participation In the survey.
The state juvenlie justice agency also had difficulty In reporting Its involvement with out-of-stateplacements. Data were not available from the state mental health agency, which also prevents drawingcomparisons between state and local agencies. The state agency responsible for mental retardation anddevelopmental disabilities reported Involvement with no out-of-state placements In 1978.
TABLE 05-15. CALIFORNIA: ABILITY OF STATE AGENCIES TO REPORTTHEIR INVOLVEMENT IN ARRANGING OUT-OF-STATEPLACEMENTS IN 1978
Types of Involvement
Number of CHILDREN ReportedPlaced during_ 1978 by State Agencies
Child Welfarea
EducationJuvenileJustice
MentalHealth
MentalRetardation11
State Arranged and Funded 0 0 0 a 0 0
Locally Arranged butState Funded 0 * 36 0 * --
Court Ordered, but StateArranged and Funded 0 0 0 0 0 0
Subtotal: PlacementsInvolving StateFunding 0 . * 36 0
CA-28
6 8

11%
TABLE 05715. (Continued)
Types of Involvement
Number of CHILDREN ReportedPlaced during 1978 by State Agencies
Child Welfarea Juvenile Mental Mental
II Education Justice Health Retardation
Locally Arranged andFunded, and Reportedto State
State Helped Arrange,but Not Repmired byLaw or Did Not Fundthe Placement
Other
Total Number ofChildren Placed Outof State with StateAssistance orKnowledgeb
0
0
91C
91
0
0 0
36 0
* denotes Not Available.-- denotes Not Applicable.
a. Child Welfare Iindicates data reported by the HWA Department of Social Services'
adoptions branch and Child Welfare II indicates data reported by the HWA Department of Socla!
Services' foster care branch.
b. Includes all out-of-state placements known to officials in the particular state
agency. In some cases, this figure consists of placements which dld not directly involve
affirmative action by the state agency but may simply Indicate knowledge of certain out-of-
state placements through case conferences or through various forms of Informal reporting.
c. The state agency arranged but did not fund 91 adoptive placements out of state.
Among the state agencies contacted for information on the destination of children placed out of state
In 1978, only the state education agency and the Adoptions Branch of DSS could report what states
received children from California.Out-of-state adoptions were arranged in 29 states, and the greatest
,number were sent to Oregon and Utah, receiving 15 and ten children, respectively. Arizona, Illinois,
Nebraska, and Washington received six to seven children, and the remaining placements were distributed in
small numbers among 23 states. Paralleling the data reported by local school districts, the state
education agency clearly reported more placements to Utah than any other state. Remaining placements
went in small numbers to Arizona, Colorado, and Oregon.
CA-29
69

TABLE 05-16. CALIFORNIA: DESTINATIONS OF CHILDREN PLACEDOUT Of STATE IN 1978 REPORTED BY STATE AGENCIES,BY AGENCY TYPE
Destinations ofChildren Placed
Number of CHILDREN PlacedChild Welfarea
educationJuvenileJustice
MentalHealthI Ii
Arizona 6Colorado 2 2Connecticut
1
Florida1
Georgia 3
Idaho 2Illinois 6Iowa
1
Kansas 2Kentucky 2
Louisiana1
Maine1
Massachusetts1
Missouri1
*Interne 3
Nebraska 7New Mexico
1
New York 3North Carolina
1
North Dakota 1
Ohio1
Oklahomi 4Oregon 15 2Pennsylvania 4Tennessee
1
Texas3
Utah 10 28Virginia
1
Washington 7Wyoming 2
Placements tor WhichDestinations Could Notbe Reported by StateAgencies 0 All 0 All All
Total Number of Placements 91 36
* Denotes Not Available.
a. Child Welfare 1 indicates data reported by the HWA Department of SocialServices' adoptions branch and Child Welfare II indicates data reported by theHWA Department of Social Services' foster care branch.
Conditions describing children placed out of California are listed by agency type In Table 05-17.The Adoptions Brench of DSS noted that there were physically and mentally handicapped children amongthose placed out of California In 1978. Foster care officials at the state level reported the placementof a wide variety of children Into other states, much the same as the information provided by local childwelfare agencies. Correspondence between state and local agencies also occurs in the area of education,where the state agency reported on the placement of emotionally disturbed children. The state juvenilejustice agency only reported the placement of adjudicated delinquents.
CA-30
70

TABLE 05-17. CALIFORNIA: CONDITIONS OF CHILDREN PLACEDOUT OF STATE IN 1978, AS REPORTED BY STATEAGENCIES, BY AGENCY TYPE
Types of Conditions
Agpncy TypeaChild Welfare"
EducationJuvenileJustice11
Physically Handicapped X X 0 0
Mentally Handicapped X X 0 0
Developmentally Disabled 0 X 0 0
Unruly/Disruptive 0 X 0 0
Truants 0 0 0 0
Juvenile Delinquents 0 0 0 X
Emotionally Disturbed 0 X X 0
Pregnant 0 0 0 0
Drug/Alcohol Problems 0 0 X 0
Battered, Abandoned, orNeglected 0 X 0 0
Adopted Children X 0 0 0
Foster Children 0 X 0 0
Other 0 0 0 0
a. X indicates conditions reported.
b. Child Welfare 1Indicates data reported by the HWA Department of Social
Services' adoptions branch and Child Welfare II indicates data reported by the
HWA Department of Social Services' foster care branch.
Finally, state agencies were asked to report their expenditures for out-of-state placement In 1978.
Table 05-18 shows that the state education agency spent $380,000 In state funds and was aware of $240,000
in local funds, and that the Juvenile justice agency spent $92,000 In state funds. All other expenditure
information, either by source of funds or agency type, was unavailable.
CA-31

TABLE 05-18. CALIFORNIA: PUBLIC EXPENDITURES FOROUT-OF-STATE PLACEMENTS IN 1978, ASREPORTED BY STATE AGENCIES
Levels of Government
Expenditures, by AGENCY TypeChild
Welfare EducationJuvenileJustice
MentalHealth
MentalRetardation
State *$380,000 $92,000 * 0
Federal ** * *
0
local *$240,000 * *
0
Other * * * *0
Total Reported Expenditures * * * *0
* denotes Not Available.
F. State Agencies' Knowledge of Out-of-State Placements
In California, state and local officials were asked to report on their involvement in placementactivity. Local officials were specifically asked to report about placements arranged by- theirrespective agencies. State officials were asked for similar data about such placements arranged by theiragencies as well as the number of placements made by their counterparts in local government. Table 05-19reflects the placement information available in California from state and local agencies. As mentionedearlier, the DSS/ Family and Children Services Branch placement Information was not available. TheAdoptions Branch reported 91 placements. In that only partial information was supplied by the statechild welfare agency, the percentage of known placements by this agency is hot complete.
In Contrast, the Department of Education supplied information about state and local involvement inout-of-state placements in 1978. However, only 37 percent of the placements reported were known by thestate agency, although the Department of Education approves the receiving facIlity and pays 70 percent oithe cost incurred.
A possible explanation for the discrepancy is that five percent of local school districts reported ona sequence of months representing 1978which differed from the state agency's. However, this differencedoes not explain the total discrepancy. In the initial stages of the Californla local data collection,the state provided the incidence of placements in 1978 by each local agency. The sample of local schooldistricts which reported on the same sequence of months, however, dld not confirm the state's response.
The Department of Corrections and Department of Mental Health had difficulty in reporting theirknowledge of state and local placemenls. Their local counterparts, however, did report 230 (localJuvenile Justice agencies) -15rld six placements (local mental health agencies). As mentioned earlier, noplacement activity was reported by the Department of Mental Retardation.
CA-32
72

TABLE 05-19. CALIFORNIA: STATE AGENCIES' KNOWLEDGE OF
OUT-OF-STATE PLACEMENTS
ChildWelfare Education
JuvenileJustice
MentalHealth
MentalRetardation
Total Number of State andLocal Agency Placements
Total Number of PlacementsKnown to State Agencies
Percentage of PlacementsKnown to State Agencies
175
*b
*
97
36
37
* a
*
*
6
*
*
0
0
100
* denotes Not Avallablel
a. The state Juvenile Justice agency did not report their placement activ-
ity for 1978. The local Juvenile Justice agency did report 230 placements.
b. The OSS Family and Children Services Branch dld not report the number of
placements known to their office. The Adoptions Branch reported 91 out-of-state
placements to adoptive settings.
Figure 05-8 graphically describes the data In Table 05-19, in addition to oompact utiOzation as
reported by state agencies. In reviewing the state child welfare agency responses, two factor; must be
reviewed. The first factor is that only partial information was available from MS. As mentioned
previously, the Family Nnd Children Services Branch was unable to report on placement activity; nor were
they able to report on Gompact utilization. The second factor is that the local child welfare agencies
reported that 84 of the 175 placements were processed through a compact (see Table 05-13). In reviewing
these factors, it can be ascertained that complete compact utlization did not occur by local child
welfare agencies.
The number of mental health and Juvenile Justice placements and compact utilization also were not
available by their respective state agencies. Only the local counterparts reported this Information.
The Department of Mental Retardation reported no placement activity and had no local counterparts to
contact for information.
None of the 36 out-of-state placements reported by the state education agency were compacv ;arranged.
Similarly, none of the 27 locally reported educational placements went through a compact office. These
findings are not surprising in that there Is no compact for ptacements to facilities primarily
ducational In character.
CA-33
7 3

275
250
225
200
175
150
125
100
75
50
25
FIGURE 05-8. CALIFORNIA: THE TOTAL NUMBER OF STATE AND LOCALPLACEMENTS AND USE OF COMPACTS AS REPORTED BYSTATE AGENCIES, BY AGENCY TYPE
230
Child Welfare Education Juvenile Justice Mental Health
* denotes Not Available.
State and Local Placements
State and Local Placements Known to State Agencies
State and Local Compact-Arranged Placements Reported by State Agencies
a. Only includes adoption placements. The Family and Children ServicesBranch was unable to report placement activity and compact utilization.
V. CONCLUDING REMARKS
California is a large, complex, and varied state, which answers the most cautious of generalizationswith exceptions. Nevertheless, some overall trends do come forth in the preceding findings anddiscussion which deserve comment.
State agencies providing or supervising services to children generally had incomplete orinaccurate knowledge of the numbers and destinations of children that were placed out ofCalifornia under their authority.
CA-34
74

Only a small number of the children placed out of state by local child welfare and juvenile
probation agencies were placed into neighboring states. In general, children were sent great
distances, throughout the oountry. In addition, local probation departments were shown to be
unable to report upon the desf7nation of most of the children they placed In other states.
MbnItoring practices reported by child welfare agencies, juvenile probation departments, and
school districts most often took the form of written progress reports. Farely, If ever, were
children visited In placement; when this was a practice, it was conducted on an Irregular
basis.
Local probation departments appear to be the local agency least subject to direct state-level
supervision, least involved In interagency 000peration In the placement process and, by far,
most involved in sending children out of California. However, the extent to which these
agencies arranged out-of-state placements through Interstate oompacts was examined and their
Jae was a relatively oommon practice.
The reader Is encouraged to oompare national trends described in Chapter 2 with the findings which
relate to specific practices In California in order to develop further conclusions about the statels
involvement with the out-of-state placement of children.
CA-35 75
FOOTNOTES
1. General information about states, counties cities, and SMSAs is from the special 1975 populationstimates based on the 1970 national census contained in the U.S. Bureau of the Census, County and CityData.82211, 1977 (A Statistical Abstract Supplement), Washington, D.C., 1978.laTTEout dlr.ct g.n.ral state and local total per capita expenditures and expenditures forducation and public welfare were also taken from data collected by the U.S. Bureau of the Census andthey appear in Statistical Abstract of the United States: 1979 (100th Edition), Washington, D.C., 1979.The 1978 estimated person7111P7777years ararawmFiw by the National Centerfor Juvenile Justice using two sources: the 1970 national census and the National Cancer Institute 1975estimated aggregate census, also prepared by the U.S. Bureau of the Census.2. California Department of Education Administrative Code 3208-3210.

A PROFILE OF OUT-OF-STATE PLACEMENT POLICY AND PRACTICE IN HAWAII
I. ACKNOWLEDGMENTS
The Academy gratefully acknowledgesthe assistance of the many state and local public officials who
contributed their time and effort to the project, particularly Emiko Kudo, Deputy Superintendent,
Department of Education; Marjole Barrett,Administrator, Public Welfare Division, Department of Social
Services and Housing; Mary Jane Lee, Director, Family Court of the First Circuit; Michael Kakesako,
Administrator, Corrections Division, Department of Social Services and Housing; Dennis Mee-Lee, Chief,
Division of Mental Health, Department of Health; Carol Miyamoto, Admissions Social Worker, Waimano
Training School and Hospital, Department of Health; and Beatrice Yuh, Assistant Program Administrator,
Public Welfare Division, Department of Social Services and Housing.
11. METHODOLOGY
Information was systematically gatheredabout Hawaii from a variety of sources using a number of data
collection techniques. First, a search for relevant state statutes and case law was undertaken. Next,
telephone interviews were conducted with state officials who were able to report on agency policies and
practices with regard to the out-of-state placement of children. A mall survey was used, as a follow-up
to the telephone interview, to solicit information specific to the out-of-state placement practices of
state agencies. A summary of the data collection effort in Hawaii appears below in Table 12-1.
TABLE 12-1. HAWAII: METHODS OF COLLECTING DATA
Survey Methods, by Agency Type
Levels of Child Juvenile AstIceo Mental Mental
Government Welfare Education II Health Retardation
State Telephone Telephone Telephone Telephone Telephone Telephone
Agencies interview Interview Interview Interview Interview interview
Mailed Mailed Mailed Mailed Mailed Mailed
Survey: Survey: Survey: Survey: Survey: Survey:
DSSH DOE Family DSSH DH DH
officials officials court officials officials officials
officials
Local 'Not Not Not Not Not Not
Agencies Applicable Applicable Applicable Applicable Applicable Applicable
(State (State (State (State (State (Stat-1
Offices) Offices) Offices) Offices) Offices) Offices)
a. Juvenile Justice 1represents the state family oourts and Juvenile Justice
II represents the Corrections Division within the Department of Social Services and
Housing.
HI -1 7 7

III. THE ORGANIZATION OF SERVICES AND OUT-OF-STATE PLACEMENT POLICY IN 1978
A. Introductory Remarks
Hawaii has the 47th largest land area (6;425 square miles) and Is the 40th most populated state(868,396) in the United States. It has nine cities with populations over 10,000. Honolulu, the capital,.Is the most populated city in the state, with a population of approximately 350,000. The combinedcity-county of Honolulu has more than 700,000 people. The estimated 1978 population of persons eight to17 years old was 156,075.
The state consists of eight major islands and numerous atolls and reefs In the Pacific Ocean. Theprincipal islands Include Oahu(containing Honolulu), Hawaii, Kahoolawe, Kauai, Lanai, Maul, Molokai, andNiihau. It has three counties (Hawaii, Kauai, and Maul) and one city-county consolidation, Honolulu. Inaddition, Hawaii has one Standard Metropolitan Statistical Area (SMSA), Honolulu (which includes HonoluluCounty).
Hawaii was ranked 35th nationally in total state and local per capita expenditures, 17th in percapita education expenditures, and 23rd In per capita expenditures for public welfare.1
B. Child Welfare
The Public Welfare Division (PWD) within the Department of Social Services and Housing (DSSH) isresponsible for supervising and administering the child welfare system. Services are provided throughthe PWD branch offices on the islands of Oahu, Hawaii, Maul, and Kauai. The PWD is also responsible forlicensing private organizations for foster and adoptive care.
Hawaii Is not a member of the Interstate Compact on the Placement of Children (ICPC). However, thePWD reportedly maintains statewideinformation on the number of children placed out of state.
C. Education
Hawaii has an educational system which is completely supervised and administered by the HawaiiDepartment of Education (DOE). The state educational system has one superintendent, one deputysuperintendent, and one school board. In addition, there are four assistant superintendents and sevendistrict superintendents responsible to the state superintendent. The state totally funds theeducational system with the exception of school lunches, athletic programs, and summer programs, whichare pertially funded from special revenues.
DOE personnel report that Hawaii has adequate public and private facilities and services which meetthe needs of children requiring special education. Consequently, DOE has no specific policies relevantto the placement of children in other states for educational purposes.
D. Juvenile Justice
Hawaii has a state-operated Circuit Court system, with family court divisions having jurisdictionover delinquent, dependent, and neglected children. The court operates in circuits based on the islandsof Oahu, Maul, Hawaii, and Kauai. The family oourts are also responsible for probation services and theoperation of detention facilities.
Adjudicated delinquents may be committed to the Department of Social Services and Housing'sCorrections Division, which operates a correctional facility for youths In Honolulu and also administersparole or aftercare services.
Out-of-state placements involving family courts and the DOC are reported to be made pursuant to theprovisions of the interstate Compact on Juveniles (ICJ) wh1cn Hawaii has been a member of since 1955.
HI -2
78

0
E. Mental Health and Mental Retardation
The Department of Health (DH) is responsible for both mental health and mental retardation services
In Hawaii. The DH maintains one state facility for the mentally retarded. In addition, the DH funds and
administers eight mental health centers which are located in eight catchment areas. Each center has a
mental health team assigned to it.
As a member of the interstate Compact onMental Health (1CMH) since 1973, all applicable out-of-state
placements from Hawaii are required to go through the compact.
IV. FINDINGS FROM A SURVEY OF OUT-OF-STATEPLACEMENT PRACTICES IN 1978
The out-of-state placement practices of public agencies In Hawaii is described in this section of the
state's profile in summary tables and Is accompanied by brief descriptive remarks. The finds have been
organized to support consideration of the major issues relevant to the out-of-state placement of children
that were identified In Chapter 1.
A. The Number of Children Placed In Out-of-State Residential Settings
A brief summary of the total number of out-of-state placements arranged by Hawaii public agencies
precedes more specific findings about agency practices. This summary, In Table 12-2, generally
introduces the out-of-state placement issue as it exists In Hawaii, and serves to frame subsequent
findings In the profile. Local data, as found In other states described In this volume, does not appear
in the following tables because public children's services are entirely a function of agencies within
Hawaii's state government. In addition, information is presented for two state-level juvenile justice
agencies, designated as Juvenile Justice 1 and Juvenile Justice II. The first juvenile justice agency
refers to the family courts of thestate-operated Circuit Court system, while the second agency refers to
the Department of Social Services and Housing, Corrections Division. Information has been collected and
presented for these two agencies because it was determined that they could place children out of Hawaii
independent of one another. Similarly, mental health and mental retardation data Is presented
separately, despite the fact that both services are the responsibility of the Division of Mental Health
of the Department of Health. This separation exists because it was necessary to oontact both mental
health and mental retardation officials to obtain complete information on out-of-state placements from
the division.
One of the most notable findingsreflected In Table 12-2 Is the relative infrequency of out-of-state
placements arranged by public agencies In Hawaii. Only 22 children left the state by the actl,ns of
these agencies and 68 percent of these children were placed by the family courts. The DSSH Public
Welfare and Corrections Divisions were the only other agencies reporting out-of-state placements in 1978.
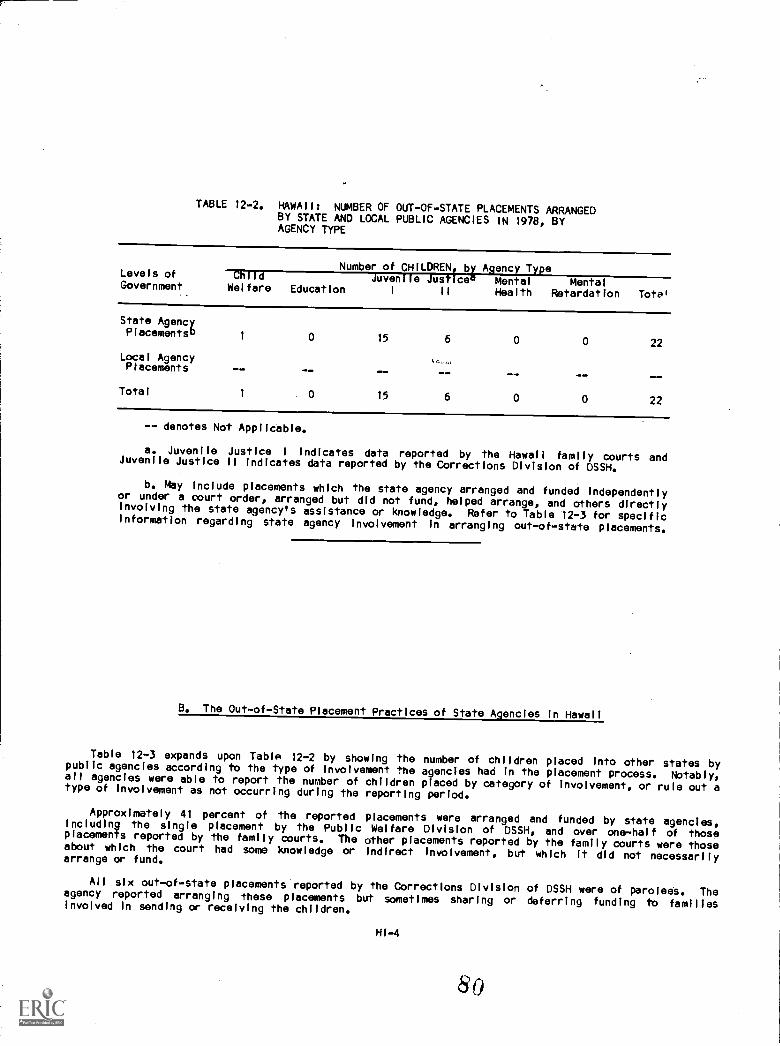
TABLE 12-2. HAWAII: NUMBER OF OUT-OF-STATE PLACEMENTS ARRANGEDBY STATE AND LOCAL PUBLIC AGENCIES IN 1978, BYAGENCY TYPE
Number of CHILDREN, by Agency TypeLevels of Child Juvenile Justicea Mental MentalGovernment Welfare Education I II Health Retardation Tote'
State AgencyPlacements!) 1 0 15 6 0 0 22
Local AgencyPlacements
Total
MOM'MOM - _ O. /Ma MOON.
1 0 15 6 0 0 22
-- denotes Not Applicable.
a. Juvenile Justice I indicates data reported by the Hawaii family oourts andJuvenile Justice II indicates data reported by the Corrections Division of DSSH.
b. May include placements which the state agency arranged and funded independentlyor under a court order, arranged but did not fund, helped arrange, and others directlyinvolving the state agency's assistance or knowledge. Refer to Table 12-3 for specificinformation regarding state agency Involvement In arranging out-of-state placements.
B. The Out-of-State Placement Practices of State A encies In Hawaii
Table 12-3 expands upon Table 12-2 by showing the number of children placed Into other states bypublic agencies according to the type of involvement the agencies had In the placement process. Notably,all agencies were able to report the number of children placed by category of involvement, or rule out atype of involvement as not occurring during the reporting period.
Approximately 41 percent of the reported placements were arranged and funded by state agencies,including the single placement by the Public Welfare Division of DSSH, and over one-half of thoseplacements reported by the family oourts. The other placements reported by the family courts were thoseabout which the court had some knowledge or Indirect Involvement, but which It did not necessarilyarrange or fund.
All slx out-of-state placements'reported by the Corrections Division of DSSH were of paroleet. Theagency reported arranging these placements but sometimes sharing or deferring funding to familiesinvolved In sending or receiving the children.
HI-4
80
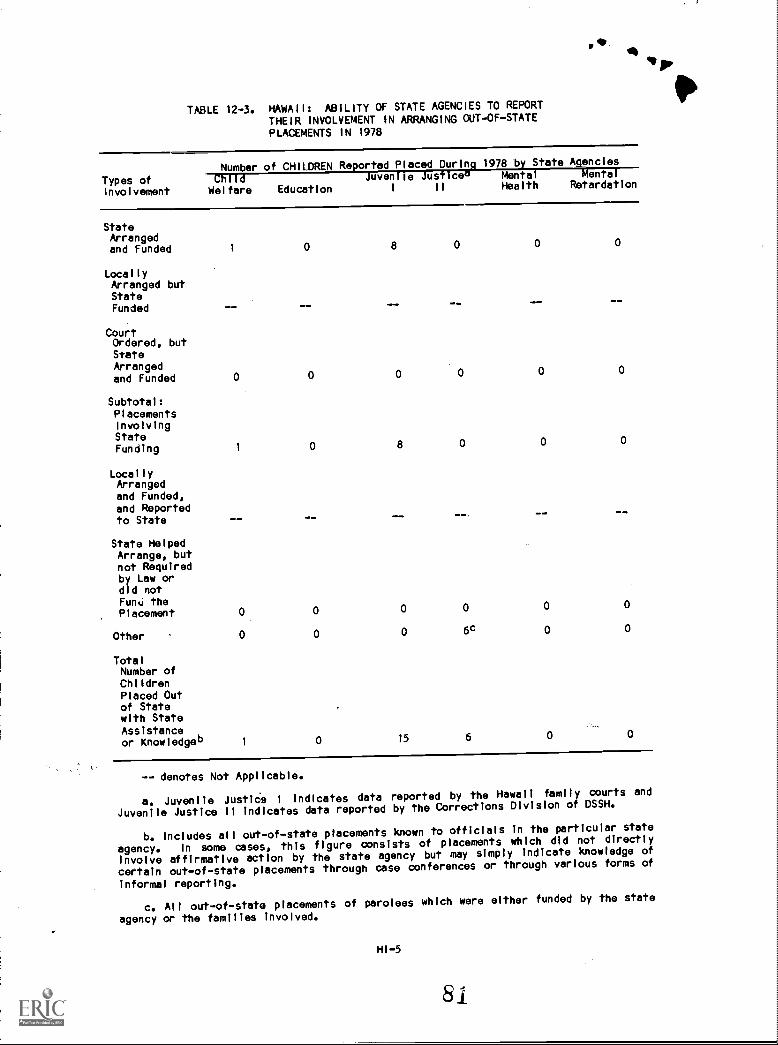
TABLE 12-3. HAWAII: ABILITY OF STATE AGENCIES TO REPORTTHEIR INVOLVEMENT IN ARRANGING OUT-OF-STATEPLACEMENTS IN 1978
Types ofInvolvement
Number of CHILDREN Re orted Placed Durin 1978 b State A.encies
uven ie us ce Menta enta
1 II Health RetardationWelfare Education
StateArrangedand Funded 1
LocallyArranged butStateFunded
CourtOrdered, butStateArrangedand Funded 0
Subtotal:PlacementsInvolvingStateFunding 1
LocallyArrangedand Funded,and Reportedto State
State HelpedArrange, butnot Requiredby Law ordid notFunU thePlacement
Other
- -
0 0 0
0 0 0 6c
TotalNumber ofChildrenPlaced Outof Statewith StateAssistanceor Knowledgeb 1 0 15 6
OM.
-- denotes Not Applicable.
a. Juvenile Justids Iindicates data reported by the Hawaii family courts and
Juvenile Justice 11 indicates data reported by the Corrections Division of DSSH.
b. Includes all out-of-state placementsknown to officials in the particular state
agency. In some cases, this figure consists of placements which dld not directly
involve affirmative action by the state agency but may simply Indicate knowledge of
certain out-of-state placements through case conferences or through various forms of
informal reporting.
c. All out-of-state placements of parolees which were either funded by the state
agency or the families involved.
HI-5
8i
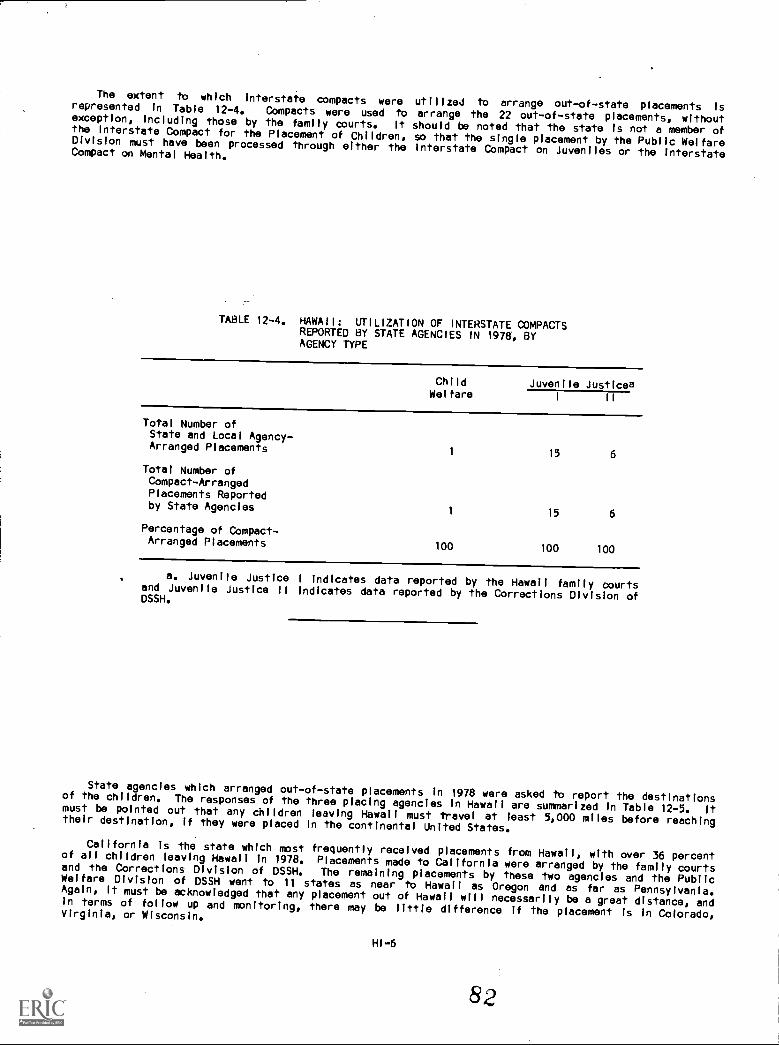
The extent to which interstate compacts wererepresented in Table 12-4. Compacts were used toexception, including those by the family courts. Itthe Interstate Compact for the Placement of Children,Division must have been processed through either theCompact on Mental Health.
utilized to arrange out-of-state placements Isarrange the 22 out-of-state placements, withoutshould be noted that the state Is not a member ofso that the single placement by the Public WelfareInterstate Compact on Juveniles or the Interstate
TABLE 12-4. HAWAII: UTILIZATION OF INTERSTATE COMPACTSREPORTED BY STATE AGENCIES IN 1978, BYAGENCY TYPE
ChildWelfare
Juvenile Justicea1 II
Total Number ofState and local Agency-Arranged Placements
1 15 6
Total Number ofCompact-ArrangedPlacements Reportedby State Agencies
1 15 6
Percentage of Compact-Arranged Placements
100 100 100
a. Juvenile Justice 1 indicates data reported by the Hawaii family courtsand Juvenile Justice 11 indicates data reported by the Corrections Division ofDSSH.
State agencies which arranged out-of-state placements In 1978 were asked to report the destinationsof the children. The responses of the three placing agencies in Hawaii are summarized In Table 12-5. Itmust be pointed out that any children leaving Hawaii must travel at least 5,000 miles before reachingtheir destination, if they were placed In the continental United States.
California is the state which most frequently received placements from Hawaii, with over 36 percentof all children leaving Hawaii in 1978. Placements made to California were arranged by the family courtsand the Corrections Division of DSSH. The remaining placements by these two agencies and the PublicWelfare Division of DSSH went to 11 states as near to Hawaii as Oregon and as far as Pennsylvania.Again, It must be acknowledged that any placement out of Hawaii will necessarily be a great distance, andin terms of follow up and monitoring, there may be little difference If the placement is in Colorado,Virginia, or Wisconsin.
HI-6
82
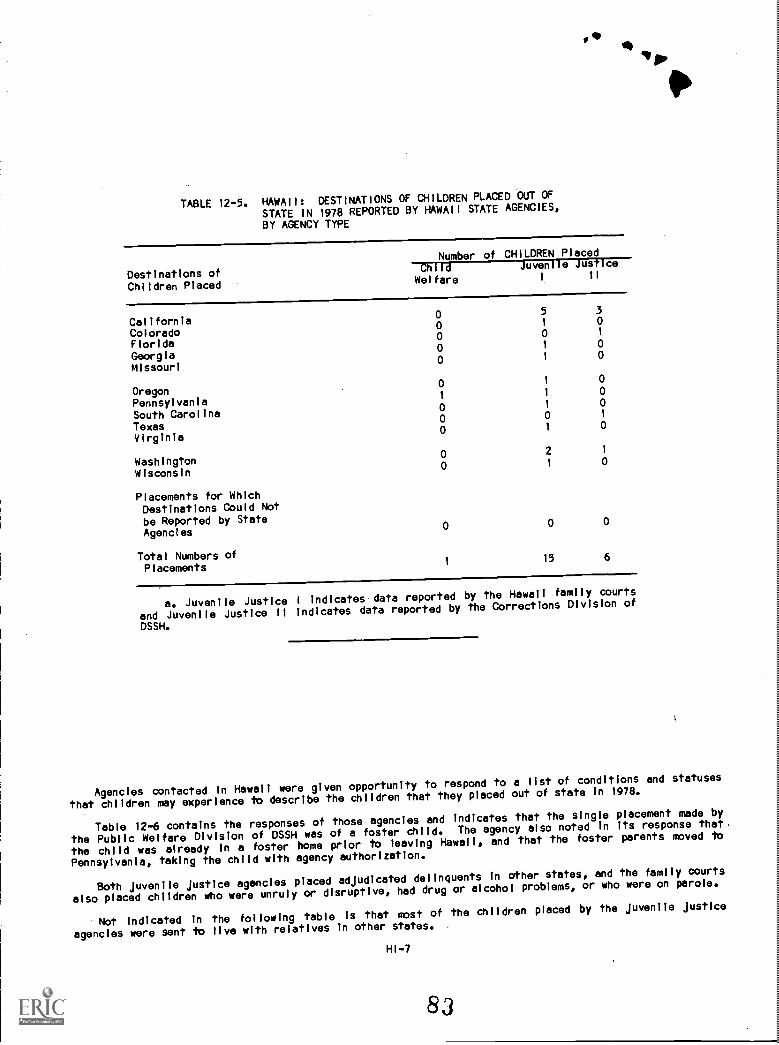
v.
TABLE 12-5. HAWAII: DESTINATIONS OF CHILDREN PLACED OUT OF
STATE IN 1978 REPORTED BY HAWAII STATE AGENCIES,
BY AGENCY TYPE
Destinations ofChildren Placed
Number of CHILDREN PlacedChildWelfare
Juvenile JusticeI 11
California0 5 3
Colorado0 1 0
Florida0 0 1
Georgia0 1 0
Missouri0 1 0
Oregon0 1 0
Pennsylvania1
1 0
SOuth Carolina0 1 0
Texas0 0 1
Virginia0 1 0
Washington0 2 1
Wisconsin0 1 0
Placements for WhichDestinations Could Notbe Reported by StateAgencies
0
Total Numbers ofPlacements
1 15 6
a. Juvenile Justice Iindicates data reported by the Hawaii family courts
and Juvenile Justice II indicates data reported by the Corrections Division of
DSSH.
Agencies contacted In Hawaii were given opportunity to respond to a !1st of conditions and statuses
that children may experience to describe the children that they placed out of state in 1978.
Table 12-6 contains the responses of those agencies and indicates that the single placement made by
the Public Welfare Division of DSSH was of a foster child. The agency also noted In its response that.
the child was already in a foster home prior to leaving Hawaii, and that the foster parents moved to
Pennsylvania, taking the child with agency authorization.
Both juvenile justice agencies placed adjudicated delinquents In other states, and the family courts
also placed children who were unruly or disruptive, had drug or alcohol problems, or who were on parole.
Not indicated In the following table Is that most of the children placed by the juvenile justice
agencies were sant to live with relatives In other states. -
HI-7
63

TABLE 12-6. HAWAII: CONDITIONS OF CHILDREN PLACED OUT Of STATEIN 1978, AS REPORTEDBY STATE AGENCIES, BY AGENCYTYPE
Types of ConditionsAgency Typeti
Child Juvenile JusticebWelfare
1 ii
Physically Handicapped0 0 0
Mentally Handicapped0 0 0
Developmentally Disabled0 0 0
Unruly/Disruptive0 X 0
Truants0 0 0
Juvenile Delinquents0 X X
Emotionally Disturbed0 0 0
Pregnant0 0 0
Drug/Alcohol Problems0 X 0
Battered, Abandoned, or Neglected 0 0 0Adopted Children
0 0 0Foster Children
X 0 0Other
0 X 0
a. X indicates conditions reported.
b. Juvenile Justice 1 indicates data reported by the Hawaii family °courtsand Juvenile Justice 11 indicates data reported by the Corrections Division ofDSSH.

The final piece of Information to be presented In this profile relates to public expenditures for the
placements that were reported. All placing agencies were asked to report their expenditures for
out-of-state placements by the source of funds, whether they be state, federal, local, or other monies.
Table 12-7 summarizes the responses that were received.
The Public Welfare Division of DSSH did not report its expenditures for the single foster child
leaving the state In 1978, but the respondent noted that a small portion of the funds spent on this
placement came from the federal Title XX program.
The juvenile justice agencies spent a combined $8,848 for the 21 placements that were reported. A
5Izable proportion of these expenses likely went toward transportation costs to get children to the Nomes
of relatives.
TABLE 12-7. HAWAII: PUBLIC EXPENDITURES FOR OUT-OF-STATEPLACEMENTS IN 1978, AS REPORTED BY STATE
AGENCIES
Levels of Government
Expenditures, by AGENCY Type
ChildWelfare
Juvenile Justicea
State* $2,552 $6,296
Federal* * 0
Local* * 0
Other* * 0
Total Reported Expenditures* * $6,296
* denotes Not Available.
a. Juvenile Justice Iindicated data reported by the Hawaii family courts
and Juvenile Justice II indicates data reported by the Correction's Division of
OSSH.
V. CONCLUDING REMARKS
From the foregoing information there would appear to be a sound basis for the following conclusions.
Placing children out of Hawaii was not a widespread practice among public agencies in the
state. The most difficult children to place, such as the emotionally disturbed or mentally
and physically handicapped, did not leave the state.
Out-of-state placements which were arranged by juvenile Justice agencies were done so that
unruly or disruptive, delinquent,_orparoled children could live with relatives.
Interstate compacts were consistently utilized to place these children to all areas of the
continental United States, and therefore offered more protection from ambiguous legal
situations.
The reader is encouraged to compare national trends described in Chapter 2 with the findings which
relate to specific practices In Hawaii In order to develop further conclusions about the state's
involvement with the out-of-state placement of children.
HI-9
85

FOOTNOTES
1. General information about states, counties, cities, and SMSAs Is from the special 1975 populationestimates based on the 1970 national census contained In the U.S. Bureau of the Census, County and ,CityData_Book,L 1977 (A StatisticalAbstract Supplement), Washington, D.C., 1978.riffZiffiaTTOW15651-71-77rege7terTtri-tate and local total per capita expenditures and expenditures foreducation and public welfare wore also taken from data collected by the U.S. Bureau of the Census andthey appear In Statistical Abstract of the United States: 1979 (100th Edition), Washington, D.C.,1979.
The 1978 estimatedpopulation of persons eight to 17 years old was developed by the National Centerfor Juvenile Justice using two sources: the 1970 national census and the National Cancer
institute 1975estimated aggregatecensus, also prepared by the U.S. Bureau of the Census.

A PROFILE OF OUT-OF-STATE PLACEMENT POLICY AND PRACTICE IN IDAHO
I. ACKNOWLEDGMENTS
The Academy gratefully acknowledges the assistance of the many state and local public officials who
contributed their time and effort to the project, particularly Judy Schrag, Supervisor of Special
Education, Department of Education; Martha Noffsinger, Consultant,Department of Education; and John
Shuler, Coordinator, Youth Rehabilitation Ser.lces Office, Department of Health and Welfare.
METHODOLOGY
Information was systematically gathered about Idaho from a variety of sources using a number of data
collection techniques. First, a search for relevantstate statutes and case law was undertaken. Next,
telephone interviews were conducted with state offInials who were able to report on agency policies and
practices with regard to the out-of-state placemt of children. A mail survey was used, as a follow up
to the telephone interview, to solicit information specific to the out-of-state placement practices of
state agencies and those of local agencies subject to state regulatory control or supervisory oversight.
An assessment of out-of-stateplacement policies and the adequacy of information reported by state
agencies suggested further survey requirements to determine the involvement of public agencies In
arranging out-ot-state placements. Pursuant to this assessment, further data collection was undertaken
If it was necessary to:
verify out-of-state placement data reported by state government about local agencies; and
ooliect local agency data which was not available from state government.
A summary of the data collection effort in Idaho appears below in Table 13-1.
TABLE 13-1. IDAHO: METHODS OF COLLECTING DATA
Survey Methods, by Agenty Type
Levels of Child Juvenile -Renter Hearrn and
Government Welfare Education Justice Mental Retardation
State Agencies Telephone Telephone Telephone Telephone
interview Interview interview Interview
Mailed Mailld Mailed Mailed
Survey: Suivey: Survey: Survey:
DHW DOE DHW DHW
officials officials officials officials
Local Agenciesa Not Telephone Telephone Not
Applicable Survey: Survey: Applicable
(State 10 percent All 39 (State
Offices) of 115 school district Officen)
districts to courts
verify stateinformationb
a. The telephone survey was conducted by the Idaho League of Women Voters of
Pocatello under a subcontract to the Academy.
b. Information attributed In this profile to the state's school districts
was gathered from the state education agency and the ten percent sample.
ID-1
111. THE ORGANIZATION OF SFRVICES AND 0U7-0E-STATE PLACEMENT POLICY IN 1978
A. Introductory Remarks
Idaho has the lith largest landarea (82,677 square miles) and is the 41st most populated (813,765)state In the United States. It has 10 cities with populations over 10,000 and three cities withpopulations over 30,000: Boise Idaho Falls and Pocate4lo. It has 44 counties with Ada County (Bolse)being the most populated county in the st;te, with a population of approximtely 150,000. The 1978estimated populations of persons eight to 17 years old was 150,326.
Idaho has only one StandardMetropolitan Statistical Area (SMSA), Boise (includes Ada County). Itsborder states are Utah, Wyoming, Montana, Nevada, Oregon, and Washington. It also shares a common borderwith Canada for a short distance.
Idaho was ranked 33rd nationally In total state and local per capita expenditures, 42nd In per capitaexpendhaires for public welfare, and 3Ist in per capita expenditures for education.1
B. Child Welfare
The Idaho Department of Health and Welfare (DHW) is a consolidated agency which, among Its manyfunctions, has responsibility to provide child welfare services for the children of Idaho. Specifically,the department's Division of Welfare administers and supervises children's services In Idaho through itsseven regional offices and through branch offices in many counties. Services include adoption, childprotection, day care, and youth rehabilitation. Idaho has been a member of the interstate Compact on thePlacement of Children (ICPC) since 1976.
C. Education
The Idaho Department of Education (DOE) has major responsibility for the supervision, coordination,and delivery of public educationalservices through relevant state agencies and the state's 115 schooldistricts. State law also authorizes the State Board of Education to assist Idaho's school districts Inthe development of appropriate educational programs and services for exceptional children. Accordingly,the Special Education Section of DOE funds, evaluates, coordinates, and monitors programs for exceptionalchildren.)
While the school districts have the authority to send children to suitable programs In other states,the Department of Education must approve all out-of-state placements funded with state revenue (PublicLaw 33-2004).2 Since 90 percent of the local educational revenue Is allocated by the state, and theremainder from the federal government with st:Ate oversight, state officials reported that schooldistricts could not afford to Independently arrange out-of-state placements. The only exception wouldinvolve a school district's decision to refer a child to the DHW or a district court for placement.
D. Juvenile Justice
In Idaho, district courts have jurisdictionover juveniles and dependent and neglected children.However, some localities have juvenile courts which operate under the magistrate divisions of districtcourts. Adjudicated delinquents are committed to the Youth Rehabilitation Services Office (YRSO) In DHW.The YRSO determines whether a youth should be detained at the Idaho Youth Services Center or providedcommunity-based residential or nonresidential alternatives to institutionalization. Aftercare servicesare the responsibility of the DHW's seven regional directors. In 1978, the regional offices of DHW alsoprovided juvenile probation services In all but seven counties, which had probation staffs reporting tothe county commissioners. These seven counties were Ada, Canyon, Bingham, Latah, Elmore, Valley, andBoise.
ID-2
8 d
The YRSO reportedly utilizes the Interstate Compact on Juveniles (IC:) for arranging out-of-state
placements. Idaho has been a member of this compact since 1961. However, it was reported that because
of the different interpretations of Judicial authority to place a child out of state, not all adjudicated
delinquents are referred to DHW for placement out of state. This practice also occurs, in some cases,
when there Is no expenditure of funds for an out-of-state placement.
E. Mental Health and Mental Retardation
The Division of Community Rehabilitation (DCR) within DHW Is responsible for mental health and mental
retardation services In Idaho. There are no public mental healthand mental retardation agencies at the
local level. These si:wvices are provided locally by private agencies and by decentralized units of state
government through regional offices. All applicable out-of-state placements involving the DCR are
reported to be made pursuant to the provisions of the Interstate Compact on Mental Health (ICMH). Idaho
has been a member of the compact since 1961.
IV. FINDINGS FROM A SURVEY OF OUT-OF-STATE PLACEMENT PRACTICES IN 1978
The survey of Idaho state and local public agencies resulted in the findings discussed and tabularly
displayed In the remainder of this profile. The information Is organized to include the major questions
regarding public agencies, involvement with theout-of-state placement of children in 1978.
A. The Number of Children Placed in Out-of-State Residential Settings
Table 13-2 provides a summary Introduction of out-of-state placement activity which was detected
among the Idaho state and local public agencies that were surveyed. It should be re:ailed that the
Department of Health and Welfare is a consolidated agency which administers programs for children needing
services In the areas of child welfare, Juvenile Justice, mental health, and mental retardation. Only
one figure, therefore, Is reported for these combloed types of services in Table 13-2. All figures
provided should be reviewed with an understanding that the number of placements reported by any single
agency may also have involved another agency. The total figure, then, may be an overrepresentation of
the number of children placed out of state in 1978. The reader should review Table 13-6 to examine the
extent to which interagency cooper.Jlon occured in the course of arranging out-of-state placements, and
as a result learn the probable number of duplicated placements reported.
In total, 248 children were reported placed in out-of-state residential settings in 1978.
Sixty-seven percent of these placements were arranged by state agencies, specifically, CHW. Local school
districts arranged out-of-state placements for 16 children and the 39 district courts were Involved In
the placement of 65 children in other states.
1D-3
89

TABLE 13-2. IDAHO: NUMBER OF OUT-OF-STATE PLACEMENTS ARRANGED BYSTATE AND LOCAL PUBLIC AGENCIES IN 1978, BY AGENCYTYPE
Number of CHILDREN, By Agency TypeChild Welfare/Juvenile
Levels of Justice/Mental Health JuvenileGovernment and Mental Retardation Education Justice Total
State AgencyPlacementsa 167 0 167
Local AgencyPlacements
16 65 81
Total 167 16 65 248
-- denotes Not Applicable.
a. May include placements which the state agency arranged and fundedIndependently or under a court order, arranged but did not fund, helped arrange,and others directly involving the state agency's assistance or knowledge. Referto Table 13-15 for specific information regarding state agency involvement Inarranging out-of-state placements.
Table 13-3 focuses further attention on the number of out-of-state placements arranged by the loCaleducation and Juvenile Justica agencies by county of Jurisdiction, or location In the case of schooldistricts. It Is important to bear In mind that the Jurisdiction of school districts contacted issmaller than the counties containing them. For that reason, multiple agencies may have reported fromeach county and the incidence reports In the table are the aggregated reports of all within them. Inaddition, the 1978 estimated population of persons eight to 17 years old In each county Is displayed Inorder to facilitate an examination of the relationship between population differences and the incidenceof reported out-of-state placements.
It can ba observed from this table that In counties where out-of-state placements were reported, onlyone type of agency arranged the placements (excluding the multicounty jurisdiction of Lewis, Idaho,Clearwater, Latah and Nez Perce counties). Consideration of the out-of-state placements arranged bylocal Juvenile Justice agencies finds that a large portion of the children were placed by agencies In Ada(Boise) and Bannock Counties. Both of these counties have a large Juvenile population, In addition tothe fact that Ada County includes the only SMSA In Idaho. It also should be recalled that Ada County Isone of the few counties that provides its own Juvenile probation services.
In contrast, the local education placements are reported to be from the smaller Idaho counties, suchas Franklin and Nez Perce. Both of these counties are on Idaho's borders: Franklin County on the stateline shared with Utah and Nez Perce on the Washington and Oregon border. These two counties' schooldistricts made over 81 percent of the reported education placements.
ID-4

TABLE 13-3. IDAHO: 1978 YOUTH POPULATIONS AND THE NUMBER
OF OUT-OF-STATE PLACEMENTS ARRANGED BY LOCAL
AGENCIES IN 1978, BY COUNTY AND AGENCY TYPES
REPORTING PLACEMENTS
County Name
1978Populationa(Age 8-17)
Number of CHILDRENPlaced during_1978
Taaation JuviTile Justice
Ada 23,832 0 30 est0
AdamsBannock
6379,780
00 10 est
3Bear Lake 1,215 0
0Benewah 1,294 0
Bingham 7,073 0 3 est
Blaine 1,297 0 2 est0
BoiseBonnerBonneville
3723,71912,137
01
0
--4 est
Boundary 1,243 0 00
Butte 640 00
Camas 182 00
Canyon 12,935 00
Caribou 1,829 0
Cassia 3,716 0 0
ClarkClearwater
2251,837
00
0
--0
Custer 557 00
Elmore 3,795 0
Franklin' 1,774 9 0
Fremont 2,035 0 2 est0
Gem 2,014 00
Gooding 1,758 0
Idaho 2,679 0
Jefferson 2,798 0 0
0Jerome 2,481 0
KootenaiLatah
8,0753,679
00
0--
Lemhl 1,225 0 5 est
Lewis 714 0 --0
Lincoln 619 00
Madison 2,622 00
Mlnidoka 3,800 i
Nez Perce 5,440 4 est
Oneida 534 0 00
Owyhee 1,466 00
Payette 2,582 00
Power 1,207 00
Shoshone 3,769 0
Teton 569 0 00
Twin FailsValley
8,108693
1
0 3 est0
Washington 1,370 0
ID-5

TABLE 13-3. (Continued)
County Name
1978Populationa(Age 8-17)
Number of CHILDRENPlaced during 1978
taucation Juvenile Justice
Multicounty Jurisdiction
Lewis, Idaho, Clearwater,Latah, Nez Perce
Total Number of PlacementsArranged by Local Agencies(total may includeduplicate count)
Total Number of LocalAgencies Reporting
6
16 est 65 est
115 39
-- denotes Not Applicable.
a. Estimates were developed by the National Center of Juvenile Justice usingdata from two sources: the 1970 national census and the National CancerInstitute 1975 estimated aggregate census.
B. The Out-of-State Placement Practices of Local Agencies
Table 13-4 provides detailed information on the involvement of Idaho's local public agencies inarranging out-of-state placements in 1978. All participating ag-gcles were able to respond to questionsabout their involvement in out-of-state placements. A higher percentage of Juvenile Justice agencieswere involved In out-of-state placements of children than local school districts. Seven of the 115 localeducation agencies placed outside of Idaho, while 23 percent, or nine Juvenile Justice agencies, reportedarranging such placements.
TABLE 13-4. IDAHO: THE INVOLVEMENT OF LOCAL PUBLIC AGENCIESIN ARRANGING OUT-OF-STATE PLACEMENTS IN 1978
Response CategoriesS_I_Elg_12y_AarypeNumberofAGEN
Educat on Juven le Justice
Agencies Which Reported Out-of-StatePlacements 7 9
Agencies Which Did Not Know If TheyPlaced, or Placed but Could NotReport the Number of Children 0 0
Agencies Which Did Not Place Outof State 108 30
Agencies Which Did Not Participatein the Survey 0 0
Total Local Agencies 11') 39
ID-6
92

Table 13-5 gives the responses of 108 school districts and 30 juvenile justice agencies regarding
their non-Involvement in out-of-state placement. Nearly 92 percent of the responses for Idaho school
districts were to the "Other" category, often with a specification that no children were In need of such
placements during that year. In a similar veln, six education agencies indicated that sufficient
services were available within the state for children with spscial needs. Three responses acknowledged a
lack of funds for such placements.
A difference In opinion about judicial authority in Idaho to directly place children out of state
was brIefly...discussed In section III. This disagreement is reflected In the juvenile justice agencies'
responses to this survey question. Almost 72 percent of the responses stated that no out-of-state
placements occurred because the agency lacked statutory authority. Agencies also reported that there was
no need to place a child out of state during that year ("Other" category), that there was a lack of funds
for such activity, and that sufficient services were available within Idaho for children under the
agency's jurisdiction.
TABLE 13-5. IDAHO: REASONS REPORTED BY LOCAL PUBLIC AGENCIESFOR NOT ARRANGING OUT-OF-STATE PLACEMENTS IN 3978
Reasons for Not PlacingChildren Out of Statea
Number of Local AGENCIES, by Reported Reasons(s)
Education Juvenile Justice
Lacked Statutory Authority 0 25
Restricted 0 0
Lacked Fui.ds 3 5
Sufficient ServicesAvailable In State 6 2
Otherb 103 3
Number of Agencies ReportingNo Out-of-State Placements 108 30
Total Number of AgenciesRepresented In Survey 1)5 39
a. Some agencies reported more than one reason for not arranging out-of-
state placements.
b. Generally included such reasons as out-of-state placements were against
overall agency policy, were disapproved by parents, involved too much red tape,
and were prohibitive because of distance.
The extent of interagency cooperation in the ,--angemeAt of out-of-state placements Is illustrated In
Table 13-6. It das reported that all seven placing school districts arranged the placements with the
cooperation of the Department of Education. The juvenile justice agencies that placed children out of
state also reported a high level of cooperation with a state agency, the Department of Health and
Welfare.
ID-7
93
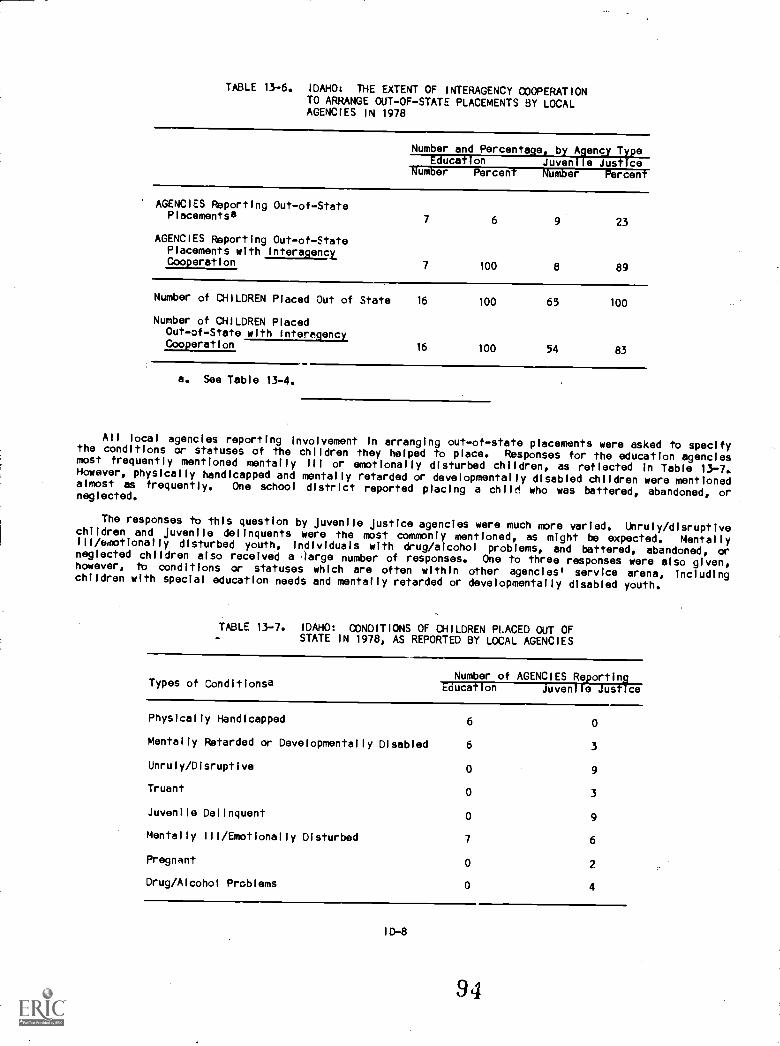
TABLE 13-6. IDAHO; THE EXTENT OF INTERAGENCY COOPERATIONTO ARRANGE OUT-OF-STATE PLACEMENTS BY LOCALAGENCIES IN 1978
Number and Percentage, by Agency TypeEducation Juvenlie Justice
Amber Percent Number Percent
AGENCIES Reporting Out-of-StatePlacementsa 7 6 9 23
AGENCIES Reporting Out-of-StatePlacements with Interagency.
7 100 8 89Cooperation
Number of CHILDREN Placed Out of State 16 100 65 100
Number of CHILDREN PlacedOut-of-State with Intermency
16 100 54 83Gooperation
a. See Table 13-4.
All local agencles reporting involvement In arranging out-of-state placements were asked to specifythe conditions or statuses of the children they helped to place. Responses for the education agenciesmost frequently mentioned mentally ill or emotionally disturbed children, as reflected In Table 13-7.However, physically handicapped and mentally retarded or developmentally disabled children were mentionedalmost as frequently. One school district reported placing a child who was battered, abandoned, orneglected.
The responses to this question by Juvenile Justice agencies were much more varied. Unruly/disruptivechildren and Juvenile delinquents were the most commonly mentioned, as might be expected. Mentallyill/edlotionally disturbed youth, individuals with drug/alcohol problems, and battered, abandoned, orneglected children also received a large number of responses. One to three responses were also given,however, to conditions or statuses which are often within other agencies service arena, includingchildren with special education needs and mentally retarded or developmentally disabled youth.
TABLE 13-7. IDAHO: CONDITIONS OF CHILDREN PLACED OUT OFSTATE IN 1978, AS REPORTED BY LOCAL AGENCIES
Types of ConditionsaNumber of AGENCIES Reporting
Education juvenile JustIce
Physlcally Handicapped 6 0
Mentally Retarded or Developmentally Disabled 6 3
Unruly/Disruptive 0 9
Truant 0 3
Juvenile Delinquent 0 9
Mentally III/Emotionally Disturbed 7 6
Pregnant 0 2
Drug/Alcohol Problems 0 4
I D-8
94

TABLE 13.7. (Continued)
Types of Conditionsa
Number of AGENCIES ReportingEducation Juvenile Justice
Battered, Abandoned, or Neglected 1 4
Adopted 0 2
Special Education Needs 0 3
Multiple Handicaps 0 1
Other 0 0
Number of Agencies Reporting 7 9
a. Some agencies reported more than one type of condition.
C. Detailed Data from Phase II Agencies
If more than four out-of-state placements were reported by a local agency, additional information was
requestsd. The agencies from which the second phase of data was requested became known as Phase II
agencies. The responses to the additional questions are reviewed in this section of Idaho's state
profile. Wherever references are made to Phase 11 agencies, they are intended to reflect those localagencies which reported arranging flve or more out-of-state placements In 1978.
The relationship between the number of local Idaho agencies surveyed and the total number of children
placed out of state, and agencies and placements in Phase 11 is illustrated In Figure 13-1. Although
only one local school district of the seven agencies reporting out-of-state placements was a Phase II
agency, it reported arranging 3' percent of tim, education placements. Local juvenile justice agencies
which reported out-of-state placement involvement had a larger proportion of Phase II agencies, 44
percent, reporting a much greater number of chTldren out of state: 51 children, or 78 percent of the
focal juvenile justice placements. Clearly, the detailed information lo ba reported on these juvenile
justice Phase II agencies is descriptive of the majority of out-of-state placements arranged by local
agencies of this service type in 1978.
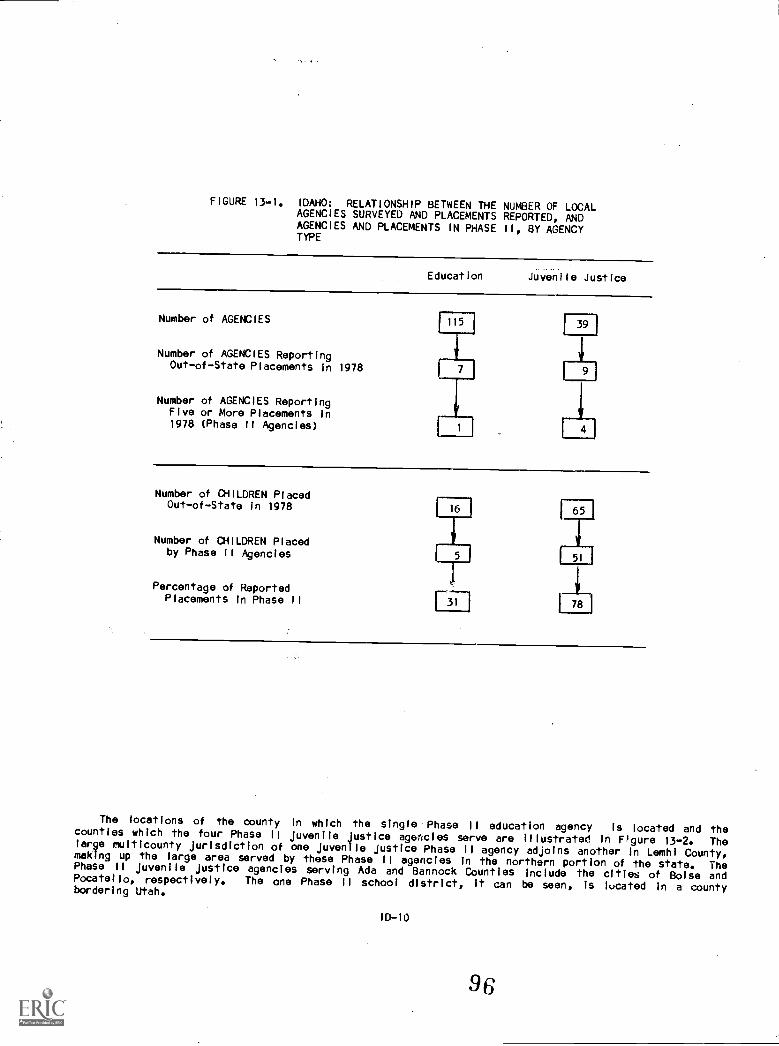
-
FIGURE 13-1. IDAHO: RELATIONSHIP BETWEEN THE NUMBER OF LOCALAGENCIES SURVEYED AND PLACEMENTS REPORTED, ANDAGENCIES AND PLACEMENTS IN PHASE II, BY AGENCYTYPE
Education Juvenile Justice
Number of AGENCIES
Number of AGENCIES ReportingOut-of-State Placements In 1978
Number of AGENCIES ReportingFive or More Placements In1978 (Phase II Agencies)
39
Number of CHILDREN PlacedOut-of-State in 1978
Number of CHILDREN Placedby Phase 11 Agencies
Percentage of ReportedPlacements In Phase II
1781
The locations of the county in which the single Phase 11 education agency is located and thecounties which the four Phase II juvenile justice agencies serve are Illustrated In F)gure 13-2. Thelarge multicounty jurisdiction of one juvenile justice Phase II agency adjoins another In Lemhi County,making up the large area served by these Phase 11 agencies In the northern portion of the state. ThePhase II juvenile justice agencies serving Ada and Bannock Counties Include the cities of Boise andPocatello, respectively. The one Phase II school district, it can be seen, Is located in a countybordering Utah.
ID-10
96
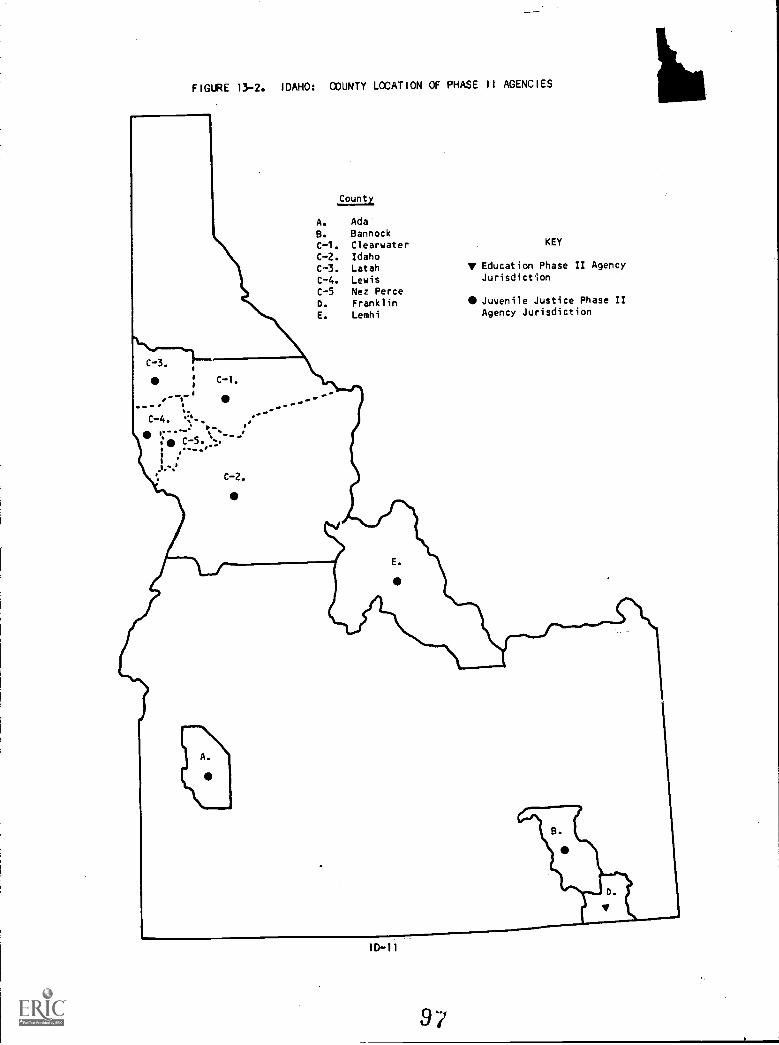
FIGURE 13-2. IDAHO: COUNTY LOCATION OF PHASE II AGENCIES
,County
A. AdaB. BannockC-1. ClearwaterC-2. IdahoC-3. Latah
C-4. LewisC-5 Nez PerceD. FranklinE. Lemhi
KEY
Education Phase II AgencyJurisdiction
Juvenile Justice Phase IIAgency Jurisdiction
ID-11
9

A further area of interest was the destinations of Yhe children placed out of state by Idaho Phase IIagencies. Table 13-8 reflects that the one responding school district placed all five children intoUtah, a border state.
The destinations of over 70 percent of the children placed by the four reporting juvenile justiceagencies were not available. However, of the 15 children whose destinations were reported, one-thirdwere also sent to Utah, four to Montana, and two each to California, Colorado, and Washington. Theprevalent use of Idaho's oontiguous states for placement purposes Is Illustrated In Figure 13-3.
TABLE 13-8. IDAHO: DESTINATIONS OF CH(LDREN PLACED BYLOCAL PHASE 11 AGENCIES IN 1978
Destinations of Children Number of CHILDREN PlacedPlaced Out of State Education Juvenile Justice
CaliforniaColoradoMontanaUtahWashington
0 20 20 45 50 2
Placements for WhichDestinations Could Not be Reportedby Phase II Agencies 0 36
Total Number of Phase II Agencies1 4
Total Number of Children Placedby Phase II Agencies 5 51
FIGURE 13-3. IDAHO: THE NUMBER OF CHILDREN REPORTED PLACEDIN STATES CONTIGUOUS TO IDAHO BY LOCAL PHASE IIAGENCIEsa
a. Local Phase 11 school districts reported destinations for five children. Local Phase II juvenilejustice agencies reported destinations for 15 children.
ID-12
98

Those local agencies which placed five or more children out of Idaho in 1978 were asked to describe
their reasons for becoming Involved In the practice. The one school district reported several reasons,
as shown in Table 13-9, which Included having previous success with an out-of-state program, the lack of
comparable services within Idaho, and the inability of children to adapt to an Idaho facility.
These three reasons were also given by the responding juvenile justice agencies, along with multiple
selections of other reasons offered. They included the decision to have the child live with an
out-of-state relative and the awareness of an out-of-state facility being closer to a child's NW* than
one In Idaho. One response was given acknowledging placement was an alternative to in-state public
Institutionalization.
TABLE 13-9. IDAHO: REASONS FOR PLACING CHILDREN OUT OF STATEIN 1978, AS REPORTED BY LOCAL PHASE II AGENCIES
Reasons for Placementa
Number of AGENICES Reporting
Education Juvenile Justice
Receiving Facility Closer to Child'sHome, Despite Being Across State Lines 0 2
Previous Success with Receiving Facility 13
Sending State Lacked Comparable Services 12
Standard Procedure to Place CertainChildren Out of State 0 0
Children Failed to Adapt to In-StateFacilities
12
Alternative to In-State PublicInstitutionalization 0
To Live with Relatives (Non-Parental) 0 2
Other0 0
Number of Phase II Agencies Reporting 14
a. Some agencies reported more than one reason for placement.
These same education and juvenile justice agencies reported the type of placement setting most fre-
quently used out of state. Residential treatment or child care facilities were most commonly used by the
education agency and three-fourths of the juvenile justice agencies. Relatives homes were identified by
the other juvenile justice agency as the most repeatedly used setting.
10-13
99

TABLE 13-10. IDAHO: MOST FREQUENT CATEGORIES OF RESIDENTIALSETTINGS REPORTED BY LOCAL PHASE 11 AGENCIESIN 1978
Categories ofResidential Settings
Number of AGENCIES ReportingIducatlon Juvenile Justice
Residential Treatment/Child Care Facility
Psychiatric Hospital
Boarding/Military School
Foster Home
Group Home
Relative's Home (Non-Parental)
Adoptive Home
Other
Number of Phase 11Agencies Reporting
3
0
0
0
0
0
0
4
Tne .-onitoring practices for out-of-statewas also sought in this survey. As shown inwritten progress report about the childrenrequested a similar progress report, but on aported conducting on-site visits, either on a
juvenile justice agencies used phone calls asoccur quarterly.
placements by local agencies placing five or more childrenTable 13-11, the local school district required an annualit had placed. Three local juvenile justice agenciesquarterly basis. Two local juvenile justice agencies re-quarterly basis or periodically. In addition, all foura method of monitoring, with one agency specifying they
TABLE 13-11. IDAHO: MONITORING PRACTICES FOR OUT-OF-5.'ATEPLACEMENTS AS REPORTED BY LOCAL PHASE 11AGENCIES IN 1978
Methods ofMonitoring
Frequency ofPractice
Number of AGENCIESaEducation Juvenile JuVFITIT
Written ProgressReports
On-Slte Visits
Calls
QuarterlySemiannuallyAnnuallyOtherP
QuarterlySemiannuallyAnnuallyOtherb
QuarterlySemiannuallyAnnuallyOtherb
30
0
0
1
00
3
ID-14
10)

TABLE 13-11. (Continued)
Methods ofMonitoring
Frequency ofPractice
Number of AGENCIESaEducation Juvenile JIMMY
Other Quarterly 0 0
Semiannually 0 0
Annually 0 0
Otherb 0 1
Total Number ofPhase II AgenciesReporting
14
a. Some agencies reported more than one method of monitoring.
b. Includes monitoring practices which did not occur at regular Intervals.
In general, bcth the local education and Juvenile Justice agencies reported not using local funds to
place children out of state. One Juvenile Justice agency did report the use of local funds but was not
able to specify the amount.
D. Use of Interstate Compacts by State and Local Agencies
An area of special Importance to an examination of out-of-state placement practices concerns the
extent to which interstate compacts are utilized to arrange the placements. Table 13-12 displays
findings about the number of agancles which did not use a compact to arrange any out-of-state placements
In 1978, In total, nine of 16 agencies which placed children out of state reported not having used a
compact to arrange any placements. Assuming that the seven school districts placed children In
facilities which were primarily educational In nature, a lack of compact use Is expected because such
placements are not under the purview of any compact. Only two local Juvenile Justice agencies reported a
lack of compact use, and one of those agencies placed five or more children out of state. Further review
of Table 13-12 shows that the ICJ was the specific type of compact utilized to arrange placements
involving two local JuvenileJustice agencies with five or more out-of-state placements.
TABLE 13-12. IDAHO: UTILIZATION OF INTERSTATE COMPACTS BY
LOCAL AGENCIES IN 1978, BY AGENCY TYPE
Local Agencies Which PlacedChildren Out of State
Number of AGENCIES
Education Juvenile Justice
NUMBER OF LOCAL AGENCIESPLACING FOUR OR LESSCHILDREN
6 5
Number UsingCompacts
04
Number NotUsing Compacts
6 1
Number with CompactUse Unknown
00
ID-15
101

TABLE 13-12. (Continued)
Local Agencies Which PlacedChildren Out of State
Number of AGENCIESEaucaTion Juvenile Justice
NUMBER Of PHASE 11AGENCIES PLACINGCHILDREN
1 4
Number UsingCompacts 0 3
Interstate Compact on thePlacement of Children
Yes0 0No1 4Don't Know 0 0
Interstate Compacton Juveniles
Yes0 2No1
1Don't Know 01
Interstate Compacton Mental Health
Yes 0 0No1 4Don't Know 0 0
Number NotUsing CompadtS'
11
Number with CompactUse Unknown
TOTALS
Number of AGENCIESPlacing ChildrenOut of State
7 9
Number of AGENCIESUsing Compacts 0 7
Number of AGENCIESNot Using Compacts 7 2
Number of AGENCIESwith CompactUse Unknown 0 0
Supplemental information regarding the utilization of interstate compacts by Idaho local agencies Isgiven In Table 13-13, which summarizes findings about the number of children who were or were not placedout of state through a compact. Similar to the preceding table, Table 13-13 allows for an examination ofdifferences in compact use between agencies reporting four or less placements, and those reporting morethan that number. Overall, 50 children were placed out of state in 1978 by local education and juvenilejustice agencies without a oompact. Of course, none of the 16 children placed out of state by schooldistricts were compact-arrangedplacements, and 34 of 65 children placed by local juvenile Justice werealso sent to placements which were not compact arranged. It can also be determined that the two localJuvenile Justice agencies which reported five or more placements placed on,ly 15 children through theICJ.
ID-16
102
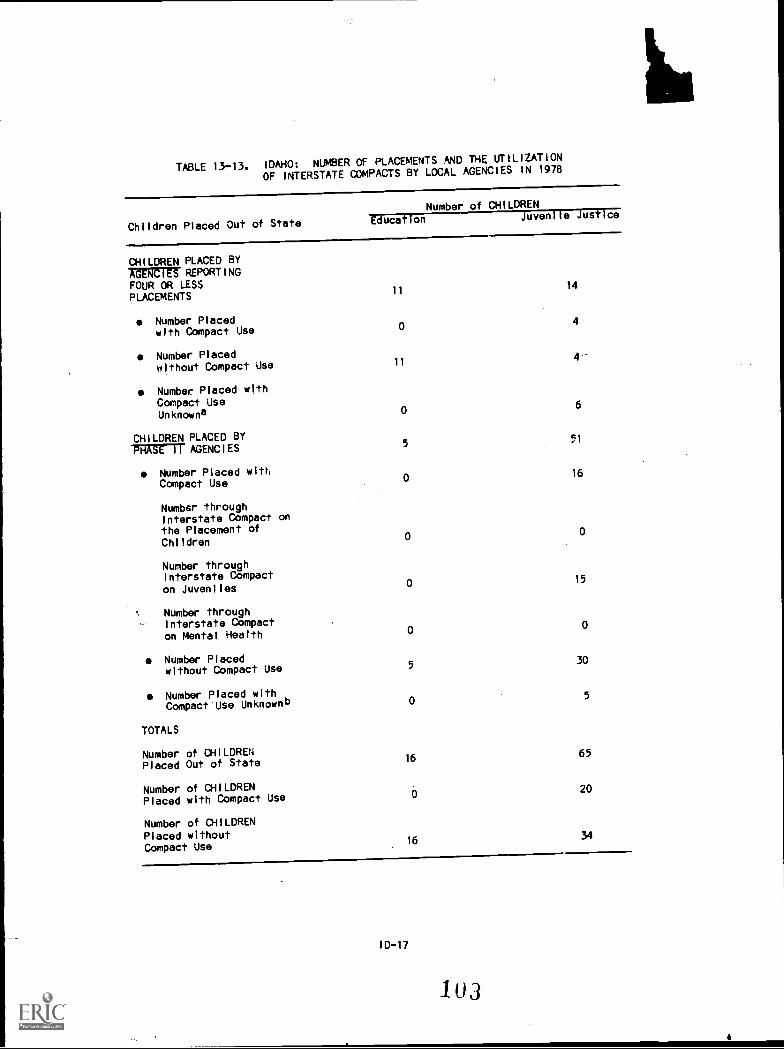
TABLE 13-13, IDAHO: NUMBER OF PLACEMENTS AND THE UTILIZATION
OF INTERSTATE COMPACTS BY LOCAL AGENCIES IN 1978
Children Placed Out of State
CHILDREN PLACED BYAGENCIES REPORTINGFOuR OR LESSPLACEMENTS
Number Placedwith Compact Use
Number Placedwithout Compact Use
Number Placed withCompact UseUnknowna
CHILDREN PLACED BYPHASE II AGENCIES
Number Placed withCompact Use
Number throughInterstate Compact onthe Placement ofChildren
Number throughInterstate Compacton Juveniles
Number throughInterstate Compacton Mental Health
Number Placedwithout Compact Use
Number Placed withCompact Use Unknownb
TOTALS
Number of CHILDRENPlaced Out of State
Number of CHILDRENPlaced with Compact Use
Number of CHILDRENPlaced withoutCompact Use
Number of CHILDREN
Education Juvenile Justice
1114
04
114--
06
551
016
00
0 15
0 0
5 30
0 5
1665
20
1634
ID-17
103
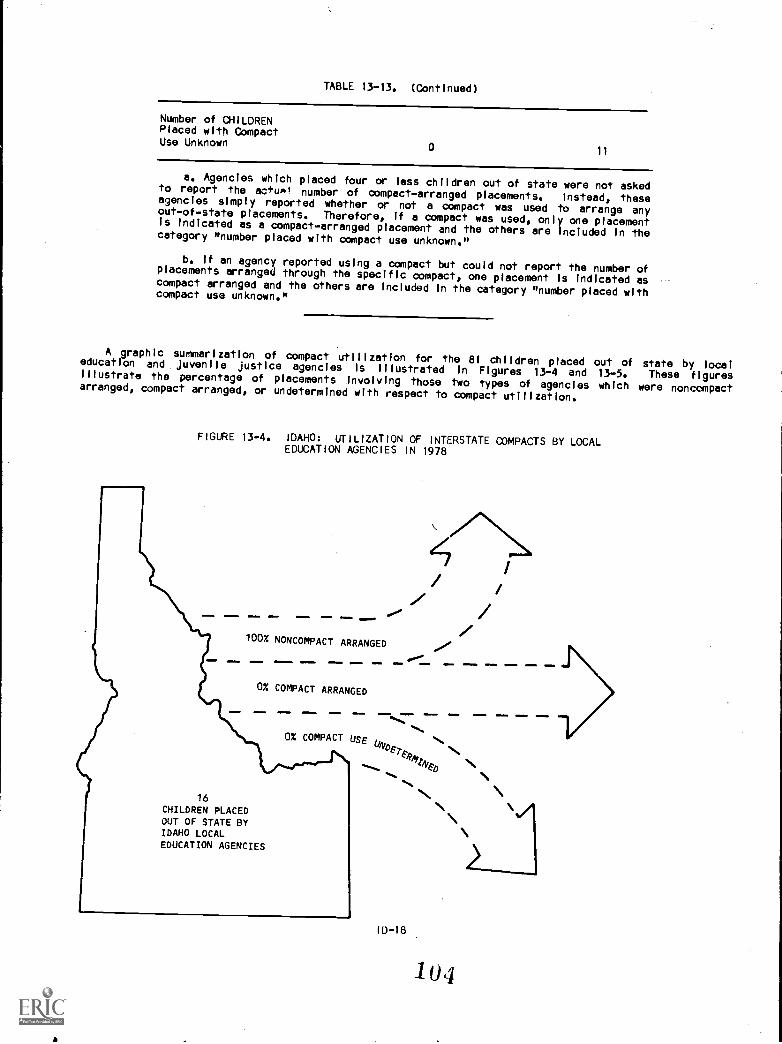
TABLE 13-13. (Continued)
Number of CHILDRENPlaced with CompactUse Unknown
011
a. Agencles which placed hour or less children out of state were not askedto report the actual number of oompact-arranged placements. Instead, theseagencies simply reported whether or not a compact was used to arrange anyout-of-state placements. Therefore, If a compact was used, only one placementis Indicated as a compact-arranged placement and the others are included in thecategory "number placed with compact use unknown."
b. If an agency reported using a compact but could not report the number ofplacements arranged through the specific oompact, one placement is indicated ascompact arranged and the others are included In the category "number placed withcompact use unknown."
A graphic summarization of compact utilization for the 81 children placed out of state by localeducation and juvenlle justice agencies Is Illustrated In Figures 13-4 and 13-5. These figuresillustrate the percentage of placements involving those two types of agencies which were noncompactarranged, compact arranged, or undetermined with respect to compact utilization.
FIGURE 13-4. IDAHO; UTILIZATION OF INTERSTATE COMPACTS BY LOCALEDUCATION AGENCIES IN 1978
1=IN.
100% NONCOMPACT ARRANGED
NNW OMM. GINEM 0111.1MI. MIMI, awn
0% COMPACT ARRANGED
USEN,
16
CHILDREN PLACEDOUT OF STATE BYIDAHO LOCAL
EDUCATION AGENCIES
ID-18
1 4

FIGURE 13-5. IDAHO: UTILIZATION OF INTERSTATE COMPACTS BY LOCAL
JUVENILE JUSTICE AGENCIES IN 1978
52% NONCOMPACT ARRANGED
Via IMMIIEW MONO. IMMIll
65
CHILDREN PLACEDOUT OF STATE BYIDAHO LOCALJUVENILE JUSTICE
AGENCIES
=NNE. MINIM 1110.1p =1.
31% COMPACT ARRANGED
41111. 01
17% COMPACT
.11 MNII
use N,
Rk14,6.0
Table 13-14 reflects the Idaho state agencies' response to a question about interstate compact
utilization among the public agencies under their supervision.Therefore, the state response by the
Department of Health and Welfare (DHW) for its own child welfare, JuvenileJustice, mental health, and
mental retardation sections, as well as responses by the local district courts Is provided. Only 55
percent of the 232 out-of-state placements reported were known to have been arranged through a compact.
The state education agency reported that no children placed out of state in 1978 by Idaho education
agencies were processed through such an Interstate agreement. This Is not surprising considering no
compact Includes facilities totally educational in character to be under its purview.
ID-19
105
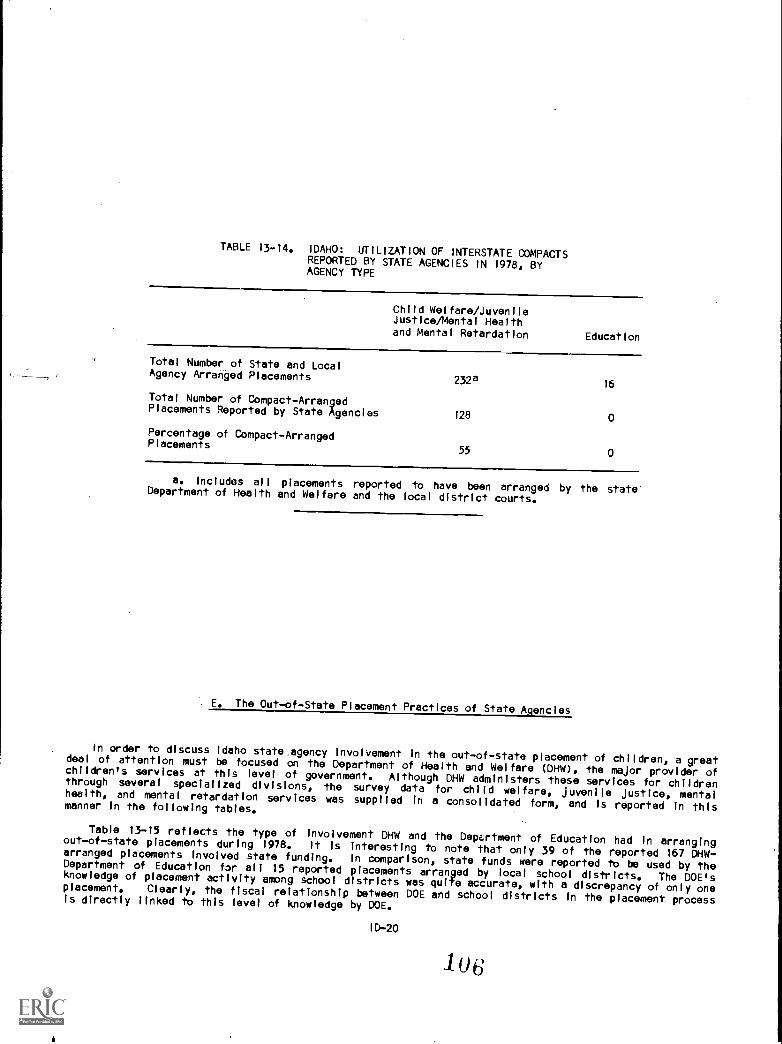
TABLE 13-14. IDAHO: UTILIZATION OF INTERSTATE COMPACTSREPORTED BY STATE AGENCIES IN 1978, BYAGENCY TYPE
Child Welfare/JuvenileJustice/Mental Healthand Mental Retardation Education
Total Number of State and LocalAgency Arranged Placements
Total Number of Compact-ArrangedPlacements Reported by State Agencies
Percentage of Compact-ArrangedPlacements
2328 16
128 0
55 0
a. Includes all placements reported to have been arranged by the stateDepartment of Health and Welfare and the local district courts.
E. The Out-of-State Placement Practices of State Agencies
In order to discuss Idaho state.agency Involvement in the out-of-state placement of children, a greatdeal of attention must be focused on the Department of Health and Welfare (DHW), the major provider ofchildren's services at this level of government. Although DHW administers these services for childrenthrough several specialized divIsions, the survey data for child welfare, juvenile justice, mentalhealth, and mental retardation services was supplied In a consolidated form, and Is reported In thismanner in the following tables.
Table 13-15 reflects the type of involvement DHW and the Dep4rtment of Education had In arrangingout-of-state placements during 1978. It Is interesting to note that only 39 of the reported 167 DRW-arranged placements involved state funding. In comparison, state funds were reported to be used by theDepartment of Education for all 15 reported placements arranged by local school districts. The DOE'sknowledge of placement activity among school districts was quite accurate, with a discrepancy of only oneplacement. Clearly, the fiscal relationship between DOE and school districts In the placement processIs directly linked to this level of knowledge by DOE.
ID-20
1 6

TABLE 13-15. IDAHO: ABILITY OF STATE AGENCIES TO REPORT
THEIR INVOLVEMENT IN ARRANGING OUT-OF-STATE
PLACEMENTS IN 1978
Types ofInvolvement
Number of CHILDREN Reported Placed
during 1978 by State Agencies
Child Welfare/JuvenileJustice/Mental Healthand Mental Retardation Education
State Arranged and Funded39 0
Locally Arranged but State Funded 0 15
Court Ordered, but State Arranged
and Funded0 0
Subtotal: Placements Involving State
Funding39 15
Locally Arranged and Funded, and Reported
to State0 0
State Helped Arrange, but Not Required by
Law or Did Not Fund the Placement 1280
Other
Total Number of CMIdren Placed Out of
State with State Assistance or
Knowledgea167 15
a. Includes all out-of-state placements known to officia:s in the particular
state agency. In some cases, this figure consists of placements which did not
directly involve affirmative action by the state agency but may simply indicate
knowledge of certain out-of-state placements through case conferences or through
various forms of informal reporting.
State agencies were also asked to identify the destinations of the children they reported to have
been placed out of state. This information Is displayed In Table 13-16, which shows that the DHW
reported the destinations of all 167 out-of-stateplacements known to the agency. DHW arranged the
majority of its placements in the Pacific and Mountain states, Including 50 percent df the placements
being sent to Idaho's six contiguous states (Washington, Oregon, Nevada, Utah, Wyoming, and Montana).
California was the receiving state for the largest number of children, followc.i by Oregon and Washington.
Nearly 22 percent of the DHW-reported placements were to staters outside of the Pacific and Mountain
regions, to stai'es as distant asMassachusetts, Pennsylvania, and South Carolina.
The Department of Education was also able to provide the destinationsfor all the placements it
reported. The neighboring state of Utah was reported to have received nine, or 60 percent, of these
school district placements.Washington, North Dakota, and Colorado were reported to have received three,
two, and one Idaho education placements, respectively.Therefore, 80 percent of DOE reported placements
were to contiguous states.
ID-21
10 7
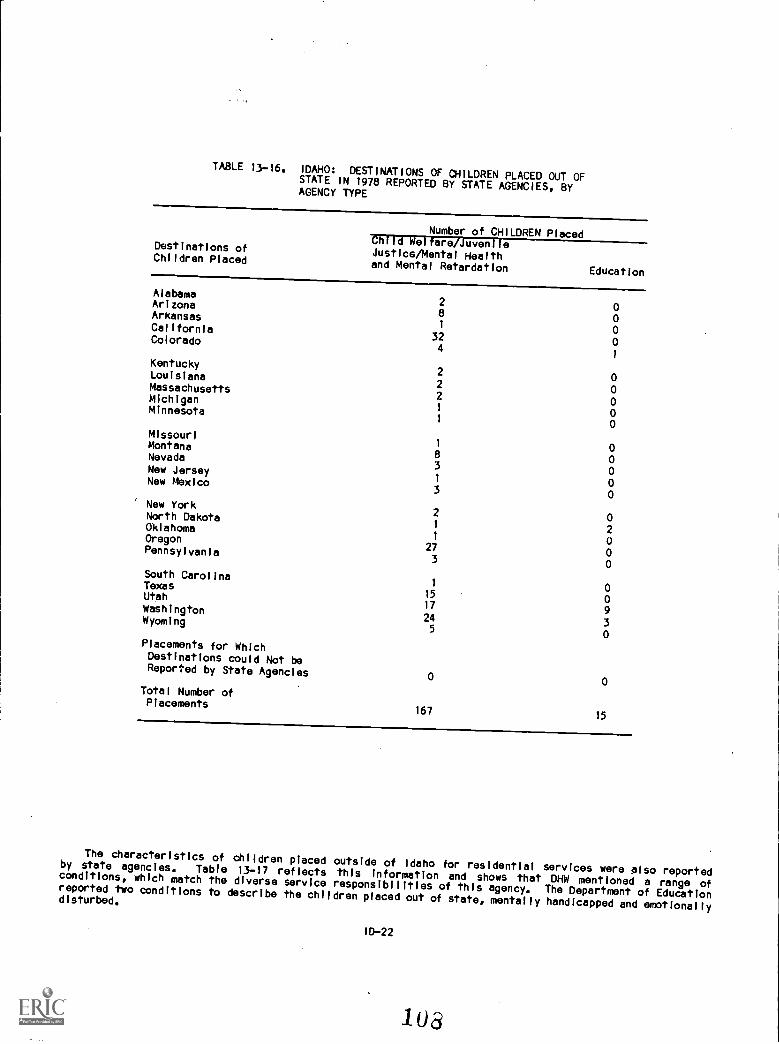
TABLE 13-16. IDAHO: DESTINATIONS OF CHILDREN PLACED OUT OFSTATE IN 1978 REPORTED BY STATE AGENCIES, BYAGENCY TYPE
Number of CHILDREN PlacedChild Welfare/JuvenileDestinations ofJustice/Mental HealthChildren Placedand Mental Retardation
Education
Alabama2 oArizona8 oArkansas1 oCalifornia
32 oColorado4
1
Kentucky2 oLouisiana2 oMassachusetts2 oMichiganI oMinnesota1 o
Missouri1 0MontanaE3 oNevada3 oNew Jersey1 oNew Mexico3 o
New York2 oNorth Dakota1
2OklahomaI oOregon
27 oPennsylvania3 o
South Carolina1 oTexas
15 oUtah17
9Washington24
3Wyoming5 o
Placements for Which
Destinations could Not beReported by State Agencies
Total Number ofPlacements
16715
The characteristics of children placed outside of Idaho for residential services were also reportedby state agencies. Table 13-17 reflects thls Information and shows that DHW mentioned a range ofconditions, which match the diverse service responsibilities of thls agency. The Department of Educationreported two conditions to describe the children placed out of state, mentallyhandicapped and emotionallydisturbed.
1D-22

TABLE 13-17. IDAHO: CONDITIONS OF CHILDREN PLACED OUT OFSTATE IN 1978, AS REPORTED BY STATE AGENCIES,
BY AGENCY TYPE
Types ofConditions
thild Welfare/A=1raJustice/Mental Healthand Mental Retardation Education
Physically Handicapped 0 0
Mentally HandlcappedX X
Developmentally DIsabled0 0
Unruly/Disruptive0 0
Truants0 0
Juvenile DelinquentsX 0
Emotionally Disturbed X X
Pregnant0 0
Drug/Alcohol Problems 0 0
Battered, Abandoned, or Neglected X ()
Adopted ChildrenX 0
Foster ChildrenX 0
Other0 0
a. X Indicates conditions reported.
Out-of-state yliativest homes Is the most frequently used residential setting for children placed out
of Idaho by D1.114., However, the agency also reported arranging placements In adoptive homes and
residential treatment facilities. The Department of Education reported that residential treatment or
child care facilities were most often used by local school districts when children were placed out of
state.
Finally, the public funds expended for making out-of-state placementsin 1978 are reported in Table
13-18. Both state agencies were able to provide the amount of state and federal dollars spent for these
placements. DHW reported total expenditures of $395,000 and the DOE expended $94,000 for such placements
In 1978.
10-23
109
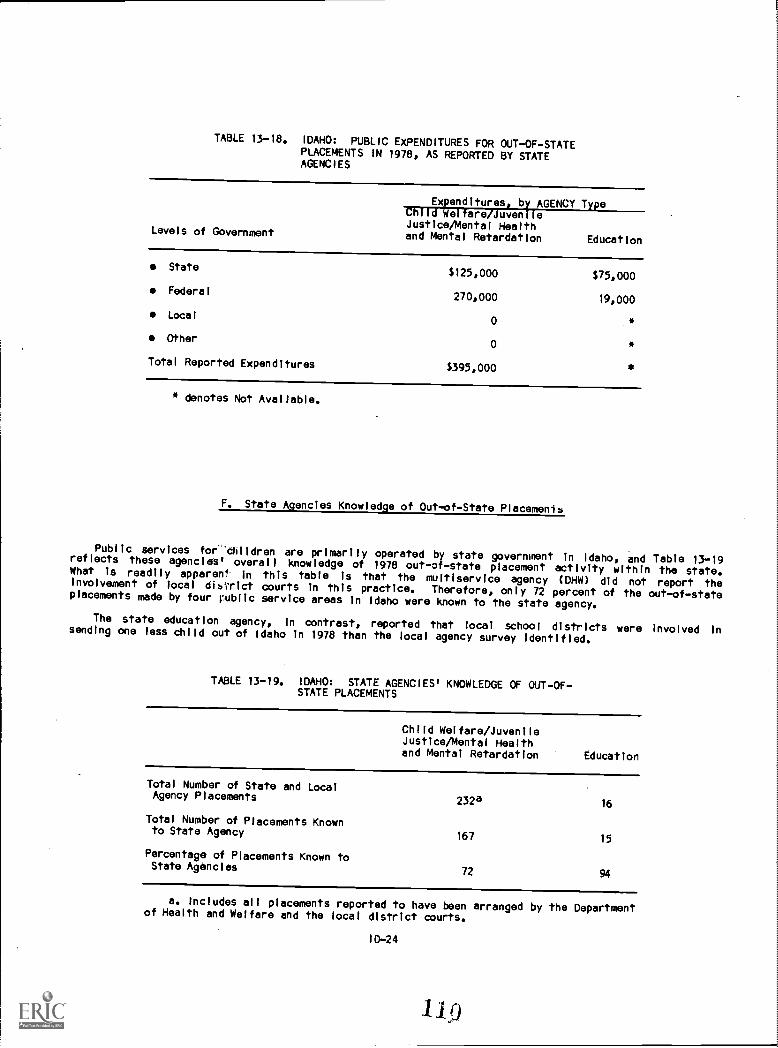
TABLE 13-18. IDAHO: PUBLIC EXPENDITURES FOR OUT-OF-STATEPLACEMENTS IN 1978, AS REPORTED BY STATEAGENCIES
Expenditures, by AGENCY TypeChTid Welfare/Juvenile
Levels of GovernmentJustice/Mental Healthand Mental Retardation Education
State
Federal
Local
Other
Total Reported Expenditures
$125,000
270,000
0
0
$395,000
$75,000
19,000
* denotes Not Available.
F. State Agencies Knowledge of Out-of-State Placemenib
Public services for-tiiildren are primarily operated by state government In Idaho, and Table 13-19reflects these agencies' overall knowledge of 1978 out-of-state placement activity within the state.What Is readily apparent In this table Is that the multiservice agency (DHW) did not report theInvolvement of local di6Vrict courts In this practice. Therefore, only 72 percent of the out-of-stateplacements made by four public service areas In Idaho were known to the state agency.
The state education agency, In contrast, reported that local school districts were involved Insending one less child out of Idaho In 1978 than the local agency survey Identified.
TABLE 13-19. IDAHO: STATE AGENCIES' KNOWLEDGE OF OUT-OF-STATE PLACEMENTS
Child Welfare/JuvenileJustice/Mental Healthand Mental Retardation Education
Total Number of State and LocalAgency Placements 232a 16
Total Number of Placements Knownto State Agency
167 15
Percentage of Placements Known toState Agencies
72 94
a. Includes all placements reported to have been arranged by the Departmentof Health and Welfare and the local district courts.
ID-24

The reporting discrepanciesIn Idaho state and local agency
Incidences of out-of-state placement are
Illustrated le Figure 13-6. Also, the state agencies' knowledge of public agency Interstate compact use
Is contrasted to the Incidence reports. When the compact use information provided by the local district
courts In Table 13-13 Is recalled (31 percent with compact use), it becomes apparent that the state
agency responsible for the administration of all three relevant compacts, DHW, received some placement
Information from the local Juvenile Justice agencies.
FIGURE 13-6. IDAHO: 11.F. TOTAL NUMBER OF STATE AND LOCAL PLACEMENTS
AND THE US'c OF COMPACTS AS REPORTED BY STATE AGENCIES,
BY AGENCY TYPE
250232a
225
200
175167
150128
125
100
75
50
25 16
Child Welfare/Juvenlle Justice/ Education
Mental Health and Mental Retardation
a. Includes all placements reported to be arranged by the Department of Health and Welfare and the
local district courts.
State and Local Placements
State and Local Placements Known to State Agencies
State and Local Compact-ArrangedPlacements Reported by State Agencies
V. CONCLUDING REMARKS
There are several conclusions which can be drawn from the survey of Idaho state and local public
agencies about their out-of-state placement practices. The ability of agencies In both state and local
government to report their involvement In this practice was excellent and certainly Indicative of
10-25
11 i
effective Information retrieval systems. Other conclusions that can be drawn from the survey resultsfollow:
Local school district placementswere primarily made by agencies In border counties to stateswhich are contiguous to Idaho.
The reported difference of opinion involving juvenile courts' authority to directly placechildren out of state was confirmed by the conflicting survey results. Sixty-four percent ofthe responses from local agencies reported lacking statutory authority to place out of state.In contrast, 23 percent of the agencies reported making placements.
The Idaho Department of Health and Welfare reported that children with a variety ofconditions or statuses were sent to settings in states throughout the country. The frequentuse of relatives' homes by this agency may account for the range of states used for placement.
Utilization of Interstate compacts as determined In the survey was not extensive In 1978. Ofthe 248 out-of-stateplacements reported, only 128 (52 percent) were compact arranged.
The reader Is encouraged to compare national trends described In Chapter 2 with the findings whichrelate to specific practices In Idaho In order to develop further conclusions about the state's involve-ment with the out-of-state placement of children.
FOOTNOTES
1. General Information about states, counties, cities, and SMSAs Is from the special 1975 populationestimates based on the 1970 national census contained In the U.S. Bureau of the Census, County and,CityData_g2okt. 1977 (A Statistical Abstract Supplement), Washington, D.C., 1978.liffaniaanTil@Sout direct giiiTiliFir-Ttate and local total per capita expenditures and expenditures foreducation and public welfare were also taken from data collected by the U.S. Bureau of the Census andthey appear In Statistical Abstract of the United States: 1979 (100th Edition), Washington, D.C.,1979.
The 1978 estimated population of persons eight to 17 years old was developed by the National Centerfor Juvenile Justice using two sources: the 1970 national census and the National Cancer Institute 1975estimated aggregate census, also prepared by the U.S. Bureau of the Census.2. Idaho Public Law 33-2004.
ID-26
112
A PROFILE OF OUT-OF-STATE PLACEMENT POLICY AND PRACTICE IN MONTANA
I. ACKNOWLEDGMENTS
The Academy gratefullyacknowledges the assistance of the many state and local public officials who
contributed their time and effort to the project, particularly Paul Spoor, Special Education, Office of
the Superintendent of Public Instruction, Department of Educe'on; Pete W. Surdock, Jr., Assistant
Chief, Social Services Bureau, Department of Social and Rehabl, teflon Services; Daniel D. Russell,
Administrator, Corrections Division, Department of Institutions; an, Bailey Molineaux, Mental Health and
Residential Services Division, Department of institutions.
II. METHODOLOGY
Information was systematically gathered about Montana from a variety of sources using a number of
data collection techniques. First, a search for relevant state statutes and case law was undertaken.
Next, telephone interviews wereconducted with state officials who were able to report on agency policies
and practices with regard to the out-of-state placement of children. A mall survey was used, as a
follow-up to the telephone interview, to solicit information specific to the out-of-state placement
practices of state agencies and those of local agencies subject to state regulatory control or
supervisory oversight.
An assessement of out-of-stateplacement policies and the adequacy of Information reported by state
agencies suggested further survey requirements to determine the Involvement of public agencies In
arranging out-of-state placements. Pursuant to this assessment, further data collection was undertaken
If it was necessary to:
verify out-of-state placement data reported by state government about local agencies; and
collect local agency data which was not available from state government.
A summary of the data collection effort in Montana appears below In Table 27-I.
MT-1
113

TABLE 27-1, MONTANA: METHODS OF OOLLECTING DATA
Levels ofGovernment
ChildWelfare
Survey Methods, by Agency Type
Juvenile Mental Hualth andEducation Justice Mental Retardation
State TelephoneAgencies Interview
Mailed Survey:DSRS
officials
LocalAgencies
TelephoneSurvey: 10
percentsample of the56 local
child welfareagencies toverify stateInformationa
TelephoneInterview
Mailed Survey:BPE officials
TelephoneSurvey: 10
percent sampleof the 575schooldistricts toverify stateinformationa
TelephoneInterview
TelephoneInterview
Mailed Survey: Mailed Survey:DSRS officials DOI officials
TelephoneSurvey: All19 localprobationdepartments
Not Applicable(State Offices)
a. Information attributed in this profile to the state's local childwelfare agencies and school districts was gathered from the state child welfareand education agencies and the ten percent samples.
111. THE ORGANIZATION OF SERVICES AND OUT-OF-STATE PLACEMENT POLICY IN 1978
A. Introductory Remarks
Montana has the fourth largest land area (145,587 square miles) and is the 43rd most populated state(746,244) In the United States, It has eight cities with populations over 20,000. Billings Is the mostpopulated city in the state, with a population over 68,000. Helena, the capital, is the fourth mostpopulated city In the state with over 26,000. It has 54 counties and two city-county consolidations,Butte-Silver Bow and Anaconda-Deer Lodge. The estimated 1978 population of persons eight to 17 years oldwas 139,117.
Montana has two Standard Metropolitan Statistical Areas (SMSAs). Its border states are Idaho,Wyoming, South Dakota, and North Dakota.
Montana was ranked 12th nationally In total state and local per capita expenditures, seventh In percapita expenditures for education, and 31st in per capita expenditures for public welfare.
B. Child Welfare
The child welfare system in Montana Is supervised by the Department of Social and RehabilitationServices (DSRS) through eightdistrict offices and administered by the 56 local departments of welfare ona coun+y and multicounty basis. The lead state agency for planning and coordinating basic services isthe MRS Comunity Services Division. Programs are funded by federal, state, and local monies.
The local welfare departments are prohibited by law from placing adopted and foster care childrenoutside of Montana without state approval. The local agencies must also comply with all Department ofSocial and Rehabilitation Services' regulations. The state pays for 50 percent of the cost of foster
MT-2
11 4

care. The DSRS maintains statewiderecords on all child welfare-related placements
and Is a member of
the interstate Compact on the Placement of Children (ICPC).Montana has been a member of the compact
since 1975.--
C. Education
Public elementary and secondary education in Montana Is supervised at the state level by a seven-
member, gubernatorlallyappointed Board of Public Education (BPE) and the Office of Public Instruction
(DPI), and is provided by Montana's 575 school districts.Additionally the school districts provide
special education to handicapped children.
Although Montana's 575 school districts may place handicapped children out of state without the
knowledge of the Board of Public Education or OPI, total or near total participation In placement costs
by the state agency makes such unreported placements highly unlikely. Only handicapped children are
placed out of state through the public school system. However, local school districts may cooperate with
local social serviceagencies, such as county welfare agencies, In placing other children out of Montana.
D. Juvenile Justice
District courts hold jurisdiction in Montana over dependent and neglected children and juvenile
delinquents. Local probation agenciesprovide services to youth placed on probation by the 19 district
courts. Some of these court districts and their probation offices Serve amulticounty area and all are
reported to be able to Place children out of state independent of state government. Some courts,
although rarely, have their own funds for placements or, more commonly, they may order the Department of
Social and RehabilitationServices to provide the funds.
Judges in the district courts are elected by_thelr local districts.Operational funds for the court,
including the salaries of the probation officers,, come from county funds. The only exception to thls
otherwise county-basedsystem is that the judges are paid by the state.
Adjudicated delinquents may be committed to the Department of Institutions, which operates two
juvenile training centers through its Corrections Division. The division has an Aftercare Services
Bureau which administers parole services. The Department ofinstitutions does not have statewide
information on the number of juveniles placed out of state. It maintains recordsonly on youth committed
to state institutions but not for juveniles on probation. State law also prohibits the placement of
status offenders In youth correctional facilities,either in or out of state (State of Montana, Section
41-5-5234CA, 1979). The Department of Institutions Is responsible foradministering the Interstate
Compact on Juveniles (ICJ). Montana has been a member of the compact since 1967.
E. Mental Health and Mental Retardation
Both mental health and mental retardation services are provided to Montana residents by the
Department of institutions (DOI), through its Mental Health and Residential Services Division (MHRSD) and
the Social Rehabilitation Services Division (5R50). The Mental Health and Residential Services Division
operates six public institutions for both the mentally retarded and mentally ill. This division also
administers the Interstate Compact on Mental Health(ICMH) for both service divisions of the department.
Montana joined the 1CMH in 1971. This Division providesfunding to private, nonprofit community mental
health boards for local mental health servicespurchase and delivery. The Social Rehabilitation Services
Division, through five regional offices, contracts with private providers for residential care of the
mentally retarded.
F. Recent Developments
Montana Is reported to have a gubernatorially mandated interagency review committee which Is required
to review and evaluate all Institutionalplacements made out of state. This excludes adopted and foster
MT-3
115
home placements.Representation on the committee crosses three state agencies Involved In out-of-state
placements: the Department of Institutions (for juvenile offenders, the emotionallydisturbed, mentallyretarded, and substance
abusers), the Office of the Superintendent of Public Instruction (for handicappedchildren), and the Department of Social and Rehabilitation Services.
IV. FINDINGS FROM A SURVEY OFOUT-OF-STATE PLACEMENT PRACTICES IN 1978
The findings from the survey of state and local agencies in Montana follow in tabular form and areaccompanied by Interpretativeremarks which highlight major trends In the data. The findings are putforth In such a way that they respond directly to the major issues In out-of-state placement of childrenidentified In Chapter 1.
A. The Number of Children Placed in Out-el-State Residential Settings
Table 27-2 gives the aggregate number of placementsmade by Montana state and local agencies and setsthe tone for the following discussions.
The Department of Social and Rehabilitation Services (DSRS) was not able to report the numter ofplacements it helped to arrange and did not fund. However, DSRS did report a placement It arranged andfunded under a court order and one It arranged and funded itself outside Montana. All state agencies andat least one local agency from each service area were involved in out-of-state placements. The localchild welfare agencies reported the highest placement
activity, amounting to over one-half of Montcoalsout-of-state placements. Further implications about the placement rates will be discussed In succeedingtables.
-It should be understood that the number of placements reported by any single agency may have involvedthe cooperation of another agency. Therefore, the number of some placements may be duplicated because ofmultiagency Involvement In single placements.
MT-4

TABLE 27-2. MONTANA: NUMBER Of OUT-OF-STATE PLACEMENTS ARRANGED
BY STATE AND LOCAL PUBLIC AGENCIES IN 1978, BY
AGENCY TYPE
Levels ofGovernment
Number of CHILDREN, by Agency Type
ChildWelfare Education
JuvenileJustice
Mental Health andMental Retardation Total
State AgancyPlacementsa
Local AgencyPlacements
Total
*b
100
100
5
19
24
18
36
54
15
15
38
155
193
* denotes Not Available.-- denotes Not Applicable.
a. May include placements which the state agency arranged and funded
independently or under a court order, arranged but did not fund, helped arrange,
and others directly Involving the state agency's assistance or knowledge. Refer
to Table 27-15 for specific information regarding state agency Involvement In
arranging out-of-state placements.
b. The state child welfare agency was not able to report the number of
placements it helped to arrange when that assistance was not required by law and
was not funded by this agency. However, it did report out-of-state placements
of two children which it arranged and funded.
Table 27-3 illustrates the number of out-of-state placements arranged by the local school districts
In their county of location, and by the local child welfare and juvenile justice agencies by county of
jurisdiction. It Is Important to bear In mind that the jurisdiction of school districts contacted Is
smeller than the counties containing them. For that reason, multiple agenclas may have reported from
each county and the incidence reports in the table are the aggregated reports of all school districts
within them. Some of the juvenile justice agencies have multicounty jurisdiction and are displayed as
such.
The local child welfare agencies serving Yellowstone (Billings) and Cascade (Great Falls) Counties,
which are the most populated counties In Montana, arranged 35 and 16 placements, respectively. The high
incidence of such placements wassignificantly greater than any other local agency In the other counties
of the state. Montana's two Standard Metropolitan Statistical Areas solely consist of these two
counties.
As can be seen in Table 27-3, a majority of Montana's counties have under 5,000 juvenile residents.
Fourteen of these fess-populated counties were Involved with 37 of the 100 child welfare placements
reported. Such counties include Valley, Custer, Fergus, and Richland, all of which placed from four to
seven children out of Montana In 1978.
Similar placement patterns to the child welfare agencies were reported by the local school districts
and local juvenile justice agencies. For instance, the local school districts serving Cascade and
Yellowstone Counties reported five and three placements,respectively, totaling over 42 percent of the
educational placements. In addition, the more populous Missoula County placed three children out of
state. Again, similar to the local child welfare placement patterns, low population counties also
reported placements out of Montana, with Rosebud County's school districts reporting four out-of-state
placements.
Although local juvenile justice agencles had mostly multicounty jurisdictions, higher numbers of
placement were still initiated in the larger counties. The one exception was the local juvenile justice
agency serving Park and Sweet Grass Counties, with a combined juvenile population of 2,379. This agency
reported the same number of placements as the Yellowstone County juvenile justice agency.
MT-5
117

TABLE 27-3. MONTANA: 1978 YOUTH POPULATIONS AND THE NUMBER OFOUT-OF-STATE PLACEMENTS ARRANGED BY LOCAL AGENCIESIN 1978, BY COUNTY AND AGENCY TYPES REPORTINGPLACEMENTS
County Name
1978
Populationa(Age 8-17)
Number of CHILDRENPlaced during 1978
ChildWelfare Education
JuvenileJustice
Beaverhead 1,402 3 0Blg Horn 2,3861 0Blaine 1,393 0 0Broadwater 525 0 0Carbon 1,265 0 0
Carter274 0 1Cascade 16,417 16 3Chouteau 1,126 0 0Custer 2,353 6 0Daniels 545 0 0
Dawson 2,118 2 1Deer Lodge 2,499 0 1Fallon 814 0 0Fergus 2,445 4 0 -Flathead 8,716 3 0 0
Gallatin 6,062 0 0 0Garfield 313 0 0Glacier 2,567 0 0Golden Valley 121 0 0Granite 510 0 0
Hill 3,146 0 0Jefferson 1,371 0 0Judith Basin 499 0 0Lake 3,155 3 0Lewis and Clark 6,742 4 1
Liberty 491 0 0Llncoln 3,343
1 0 0McCort') 470 0' 0Madison 1,102 0 0Meagher 346 0 0
Mineral 754 0 0Missoula 11,573 3 3Musselshell 543 1 0Park 1,933 0 0Petroleum 105 0 0
Phillips 1,027 0 0Pondera 1,375 1 0Powder River 462 0 0 1.00Powell 1,428 0 0Prairie 269 0 0
Ravel!! 3,527 1 0Richland 1,887 4 0Roosevelt 2,116 0 0RosebudSanders
1,9051,678
1
040 - -
MT-6
11d
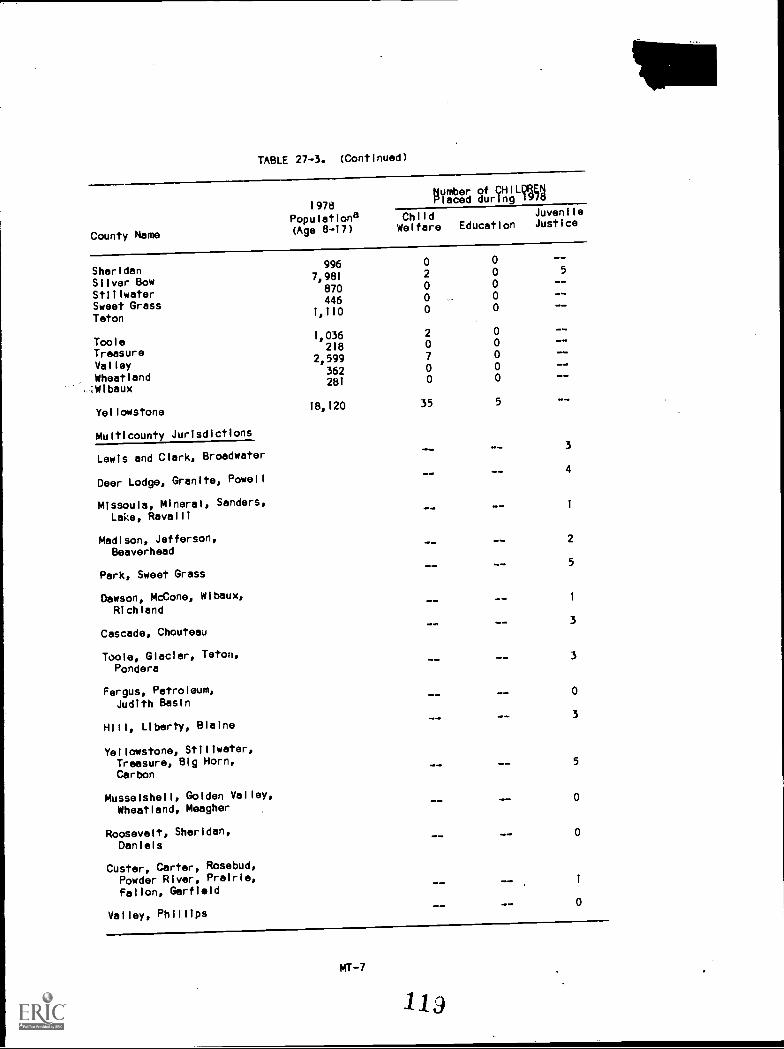
TABLE 27-3. (Continued)
County Name
1978Pooulationa(Age 8-17)
Humber of oilumriaced during 19/44
ChildWelfare Education
JuvenileJustice
Sheridan996 0 0 - -
Silver Bow7,981 2 0 5
Stillwater870 0 0
Sweet Grass446 0 0
Teton1,110 0 0 - -
Toole1,036 2 0 -
Treasure218 0 0
Valley2,599 7 0
Wheatland362 0 0
Wibaux281 0 0
Yellowstone18,120 35 5
Multicounty Jurisdictions
Lewis and Clark, Broadwater__ 3
Deer Lodge, Granite, Powell-- -- 4
Missoula, Mineral, Sanders,Lake, Ravalli
-- 1
Madison, Jefferson,Beaverhead
2
Park, Sweet Grass-- 5
Dawson, McCone, Wibaux,Richland
---- I
Cascade, Chouteau-- -- 3
Toole, Glacler, Teton,Pondera
-- 3
Fergus, Petroleum,Judith Basin
0
Hill, Liberty, Blaine3
Yellowstone, Stillwater,Treasure, Big Morn,Carbon
5
Musselshell, Golden Valley,Wheatland, Meagher
-- -- 0
Roosevelt, Sheridan,Daniels
0
Custer, Carter, Rosebud,Powder River, Prairie,Fallon, Gerflld
-- 1
Valley, Phillips0
MT-7
1 a
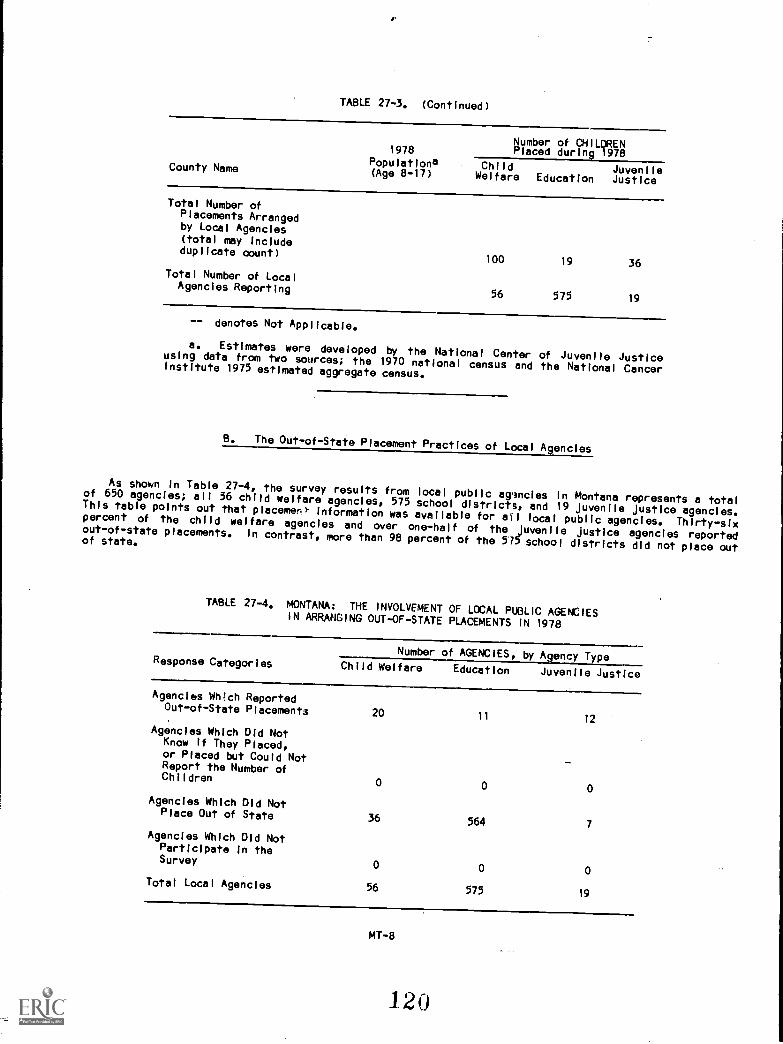
TABLE 27-3. (Continued)
County Name
1978
Populationa(Age 8-17)
Number of CHILDRENPlaced during 1978
Child JuvenileWelfare Education Justice
Total Number ofPlacements Arrangedby Local Agencies(total may includeduplicate count)
Total Number of LocalAgencies Reporting
100 19 36
56 575 19
-- denotes Not Applicable.
a. Estimates were developed by the National Center of Juvenile Justiceusing data from two sources; the 1970 national census and the National CancerInstitute 1975 estimated aggregate census.
B. The Out-of-StatePlacement Practices of Local Agencies
As shown In Table 27-4, the survey results from local public apncies In Montana represents a totalof 650 agencies; all 56 child welfare agencies, 575 school districts, and 19 Juvenile Justice agencies.This table points out that placemen information was available for all local public agencies. Thirty-sixpercent of the child welfare agencies and over one-half of the Juvenile Justice agencies reportedout-of-state placements. In contrast, more than 98 percent of the 515 school districts did not place outof state.
TABLE 27-4. MONTANA: THE INVOLVEMENT OF LOCAL PUBLIC AGENCIESIN ARRANGING OUT-OF-STATE PLACEMENTS IN 1978
Response CategoriesNumber of AGENCIES, by Agency Type
Child Welfare Education Juvenile Justice
Agencies Wh-lch ReportedOut-of-State Placements 20 11 12
Agencies Which Did NotKnow If They Placed,or Placed but Could Not -Report the Number ofChildren 0 0 0
Agencies Which Did NotPlace Out of State 36 564 7
Agencies Which Did NotParticipate in theSurvey 0 0
Total Local Agencies 56 575 19
MT-8
120
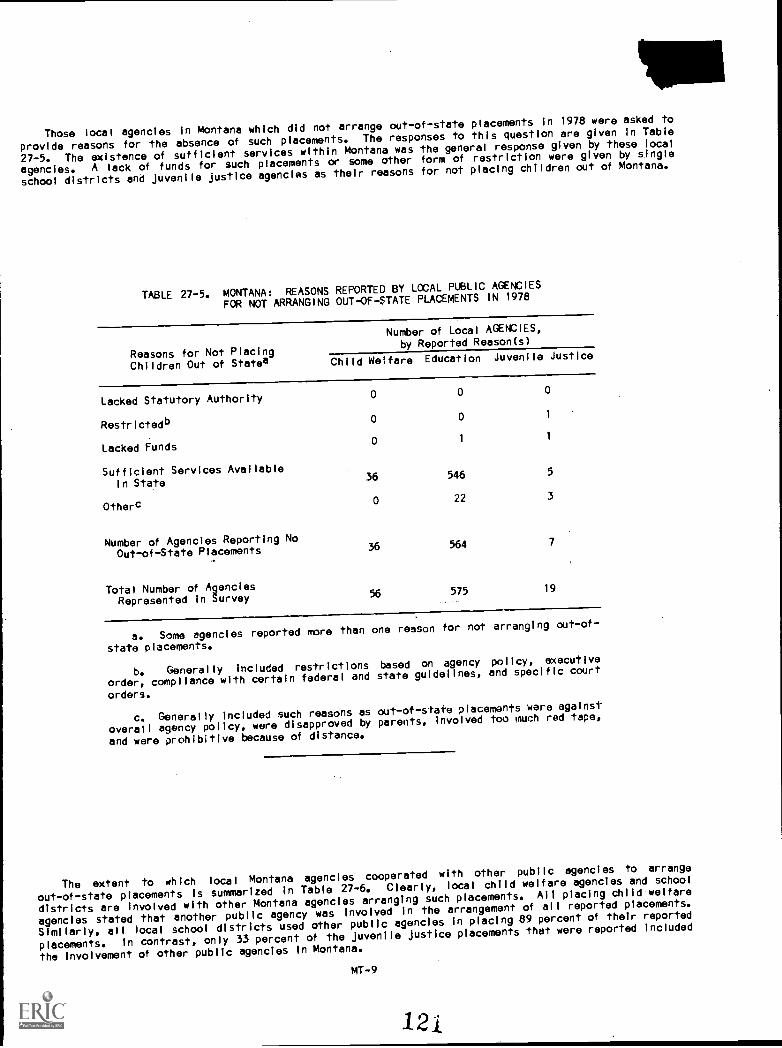
Those local agencies in Montana which dld not arrange out-of-stateplacements in 1978 were asked to
provide reasons for the absence of such placements.The responses to this question are given In Table
27-5. The existence of sufficient services within Montana was the general response given by these local
agencies. A lack of funds for such placements or some other form of restriction were given by single
school districts and Juvenile Justice agencies as their reasons for not placing children out of Montana.
TABLE 27-5. MONTANA: REASONS REPORTED BY LOCAL PUBLIC AGENCIES
FOR NOT ARRANGING OUT-OF-STATEPLACEMENTS IN 1978
Reasons for Not PlacingChildren Out of Statea
Number of Local AGENCIES,by Reported Reason(s)
Child Welfare Education Juvenile Justice
Lacked Statutory Authority0 0 0
Restrlctedb0 0 1
Lacked Funds0 1
1
Sufficient Services AvailableIn State
36 546 5
Otherc0 22 3
Number of Agencies Reporting No
Out-of-State Placements36 564 7
Total Number of AgenciesRepresented in Survey 56 575 19
a. Some agencies reported more than one reason for not arranging out-of-
state placements.
b. Generally Included restrictions based on agency policy, executive
order, compliance with certain federal and state guidelines, and specific court
orders.
c. Generally included such reasons as out-of-state placements ware against
overall agency policy, were disapproved by parents, involved too much red tape,
and were prohibitive because of distance.
The extent to which local Montana agencies cooperated with other public agencies to arrange
out-of-state placements Is summarized in Table 27-6. Clearly, local child welfare agencies and school
districts are involved with other Montana agencies arranging such placements. All placing child welfare
agencies stated that another public agency was involved in the arrangement of all reported placements.
Similarly, all local school districts used other public agencies In placing 89 percent of their reported
placements. In contrast, only 33 percent of the Juvenile Justiceplacements that were reported included
the involvement of other public agencies in Montana.
MT-9
12i
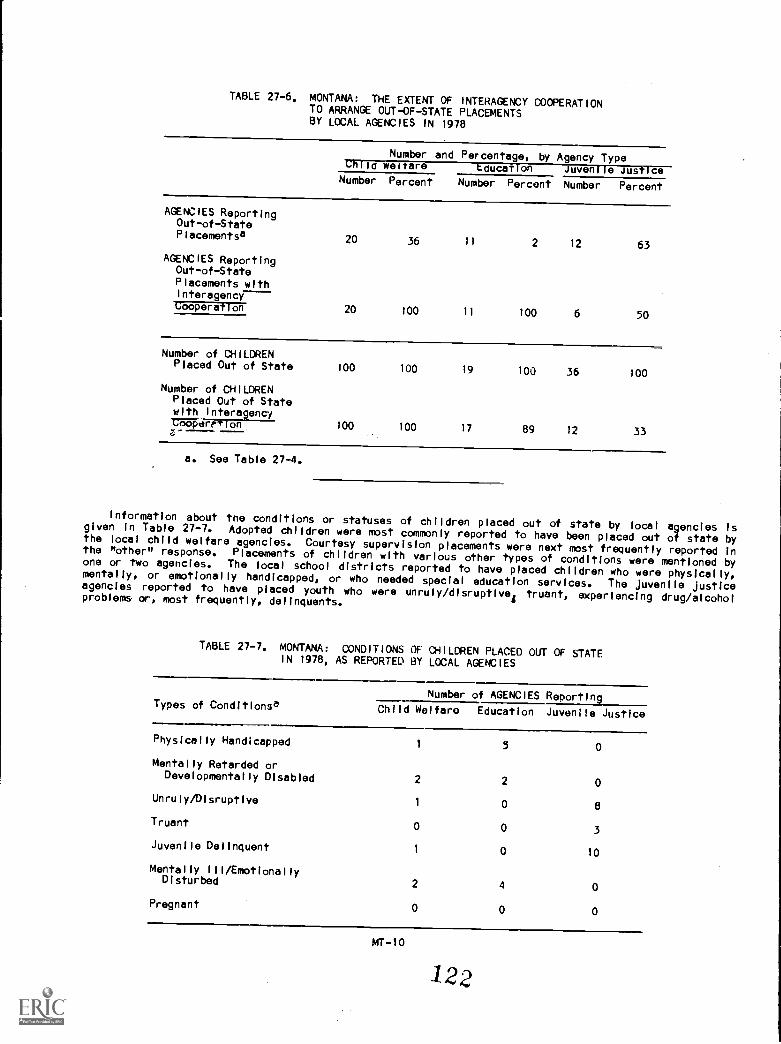
TABLE 27-6. MONTANA: THE EXTENT OF INTERAGENCY COOPERATIONTO ARRANGE OUT-OF-STATE PLACEMENTSBY LOCAL AGENCIES IN 1978
Number and Percentage, by Agency TypeUhild welfare bducation Juvenile Justice
Number Percent Number Percent Number Percent
AGENCIES ReportingOut-of-StatePlacementsa 20 36 11 2 12 63
AGENCIES ReportingOut-of-StatePlacements withInteragency
20 100 11 100 6 50rooperation
Number of CHILDRENPlaced Out of State 100 100 19 100 36 100
Number of CHILDRENPlaced Out of Statewith Interagency
100 100 17 89 12 33tWerrtion;-
a. See Table 27-4.
Information about the conditions or statuses of children placed out of state by local agencies Isgiven In Table 27-7. Adopted children were most commonly reported to have been placed out of state bythe local child welfare agencies. Courtesy supervision placements were next most frequently reported inthe //other!' response. Placements of children with various other types of conditions were mentioned byone or two agencies. The local school districts reported to have placed children who were physically,mentally, or emotionally handicapped, or who needed special education services. The Juvenile Justiceagencies reported to have placed youth who were unruly/dIsruptIves truant, experiencing drug/alcoholproblems or, most frequently, delinquents.
TABLE 27-7. MONTANA: CONDITIONS OF CHILDREN PLACED OUT OF STATEIN 1978, AS REPORTED BY LOCAL AGENCIES
Types of ConditlonsaNumber of AGENCIES Reporting
Child Welfare Education Juvenile Justice
Physically Handicapped1 5 0
Mentally Retarded orDevelopmentally Disabled 2 2 0
Unruly/DisruptIve1 0 8
Truant 0 0 3
Juvenile Delinquent1 0 10
Mentally III/EmotionallyDisturbed 2 4 0
Pregnant 0 0 0
MT-10
122
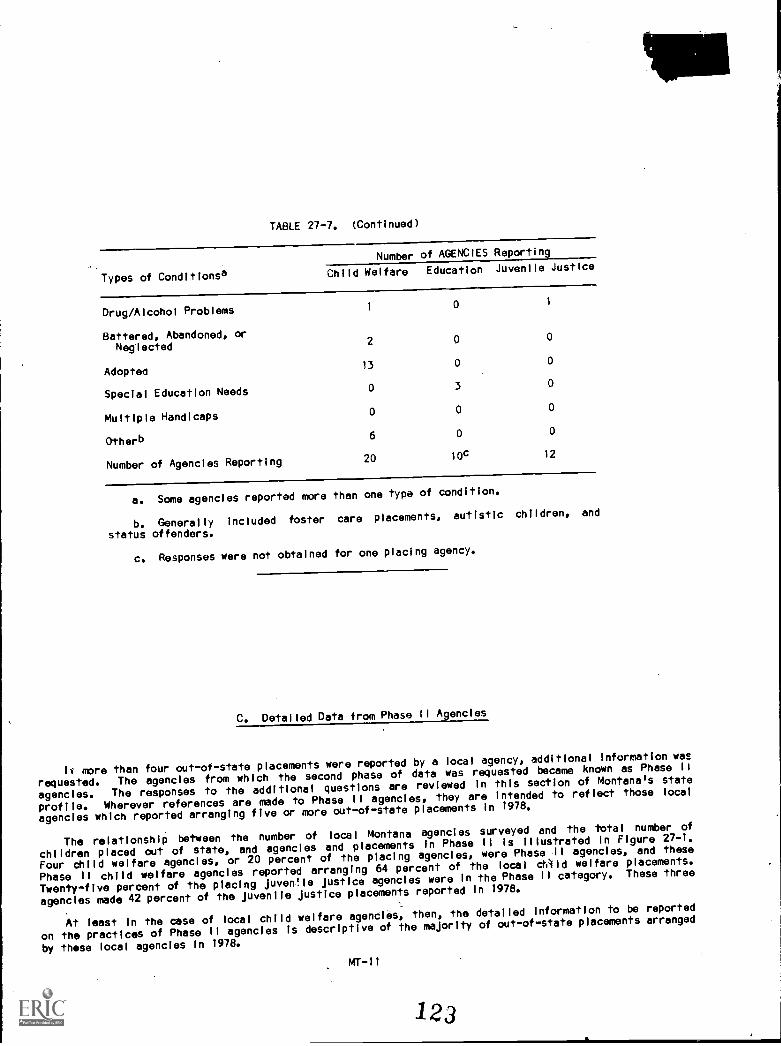
TABLE 27-7. (Continued)
Number of AGENCIES Reporting
Types of ConditIonsa Child Welfare Education Juvenile Justice
Drug/Alcohol Problems 1 0 1
Battered, Abandoned, orNeglected
2 0 0
Adopted13 0 0
Special Education Needs 0 3 0
Multiple Handicaps0 0 0
Otherb6 0 0
Number of Agencies Reporting 20 10c 12
a. Some agencies reported more than one type of condition.
b. Generally included foster care placements, autistic children, and
status offenders.
c. Responses were not obtained for one placing agency.
C. Detailed Data from Phase II Agencies
lv more than four out-of-stateplacements were reported by a local agency, additional Information was
requested. The agencies from which the second phase of data was requested became known as Phase Ii
agencies. The responses to the additional questions are reviewed In thls section of Montana's state
profile. Wherever references are made to Phase II agencies, they are intended to reflect those local
agencies which reported arranging five or more out-of-state placements in 1978.
The relationship between the number of local Montana agencies surveyed and the total number of
children placed out of state, and agencies and placements in Phase II is Illustrated In Figure 27-1,
Four child welfare agencies, or 20 percent of the placing agencies, were Phase II agencies, and these
Phase 11 child welfare agencies reported arranging 64 percent of the local ctilld welfare placements.
Twenty-flve percent of the placing Juven1le Justice agencies were In the Phase II category. These three
agencies made 42 percent of the Juvenile Justice placements reported In 1978.
At least in the case of local child welfare agencies, then, the detailed information to be reported
on the practices of Phase II agencies is descriptive of the majority of out-of-state placements arranged
by thse local agencies in 1978.
MT-11

FIGURE 27-1, MONTANA: RELATIONSHIP BETWEEN THE NUMBER OF LOCALAGENCIES SURVEYED AND PLACEMENTS REPORTED, ANDAGENCIES AND PLACEMENTS IN PHASE II, BY AGENCYTYPE
Child Welfare Juvenile Justice
Number of AGENCIES
Number of AGENCIES ReportingOut-of-State Placements In 1978
Number of AGENCIES ReportingFive or More Placements in1978 (Phase II Agencies)
Number of CHILDREN PlacedOut of State In 1978
Number of CHILDREN Placedby Phase 11 Agencies
Percentage of Reported PlacementsIn Phase 11
The geographic locale of the Montana counties served by Phase 11 agencies Is Illustrated In Figure27-2. Eleven counties are served by the seven agencles and seven of these counties are clustered aroundthe Billings SMSA (Yellowstone County), with some bordering on WYomIng. Both SMSA counties In Montana(Cascade and Yellowstone) are served by Phase II child welfare agencies, and a Phase 11 multicOuntyJuvenile Justice agency also Includes Yellowstone County.
MT-12
1 2
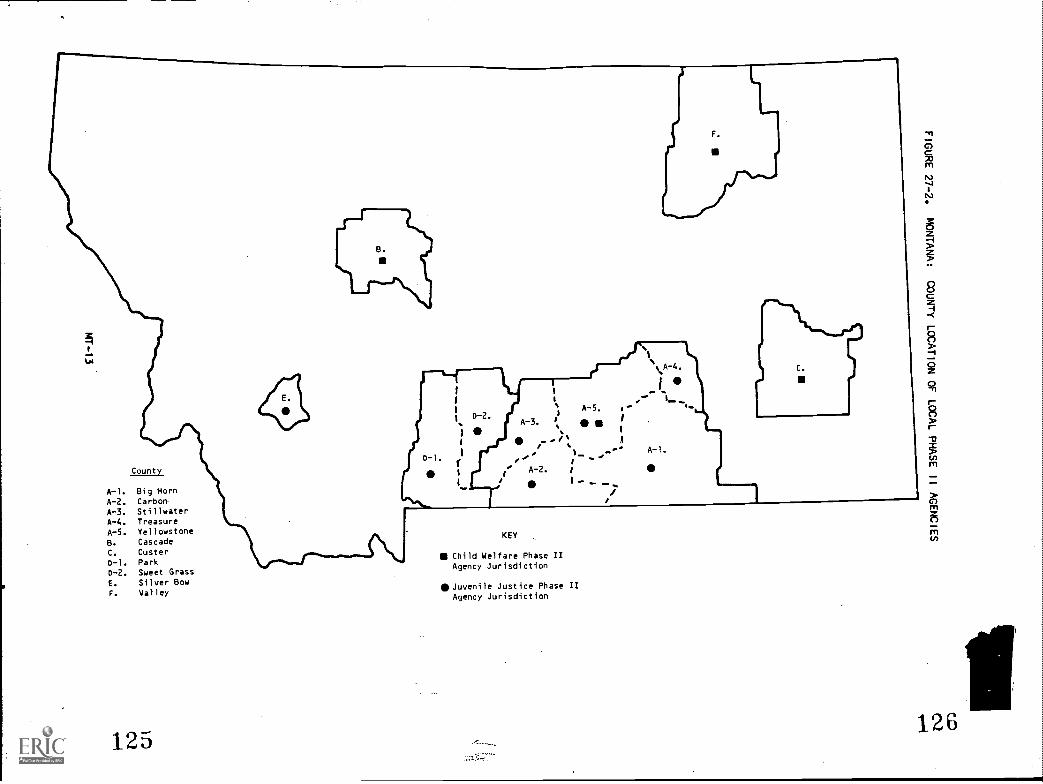
,County
A-1. Big Horn
A-2. Carbon
A-3. StillwaterA-4. Treasure
A-5. YellowstoneB. CascadeC. Custer
D-1. Park
D-2. Sweet GrassE. Silver Bow
F. Valley
125
A-3. it
A-5, I.-
\A-4.
1
A-1.1_- I "'
f' A-2. I
/
KEY
Child Welfare Phase IIAgency Jurisdiction
Juvenile Justice Phase IIAgency Jurisdiction
"13
126

Those local Phase II child welfare and Juvenile Justice agencies were asked to report the destinationof each child placed. As can be seen In Table 27-8, this information could not be provided by childwelfare agencies for most (97 percent) of their out-of-state placements. At least two children wereknown to have been placed In New Hampshire.
The local Phase II Juvenile Justice agencies were better able to report the destinations of thechildren they placed out of Montana. Ten states each received one child, and Texas received twochildren. Included In the ten states were Montana's border states of Idaho, North Dakota, and SouthDakota. (Figure 27-3 Illustrates the placements In contiguous states). Other states receiving onechlideach were California, Colorado, Florida, Nebraska, New Mexico, Oregon, and Utah.
TABLE 27-8. MONTANA: DESTINATIONS OF CHILDREN PLACED BYLOCAL PHASE II AGENCIES IN 1978
Destinations of ChildrenPlaced Out of State
Number of CHILDREN Placed
Child Welfare Juvenile Justice
California1
Colorado1
Florida1
Idaho1
Nebraska1
New Hampshire 2New Mexico
1
North Dakota1
Oregon1
South Dakota1
Texas 2Utah
1
Placements for Which DestinationsCould Not be Reported byPhase II Agencies 62 3
Total Number of Phase II Agencies 4 3
Total Number of Children Placed byPhase II Agencies 64 15
P4T -14
127

'SEFIGURE 27-3. MONTANA: THE NUMBER OF CHILDREN REPORTED PLACED
IN STATES CONTIGUOUS TO MONTANA BY LOCALPHASE II AGENCIESa
a. Local phase II Juvenile Justice agencies reported destinations for 12 children.
Information was collected from Phase II agencies about the reasons these placements were made. A
review ot Table 27-9 points out that children were placed out of state for several reasons. An
unwillingness to utilize Montana's public institutions for these particular children, a perceived lack of
comparable services In Montana, and a child's inability to adapt to a Montana facility were the most
frequently reported reesons given by the local Phase 11 child welfare agencies to explain their
out-of-state placements. The local Phase II Juvenile Justice agencies also reported similar reasons, In
addition to the desire to place children with relatives.
TABLE 27-9. MONTANA: REASONS FOR PLACING CHILDREN OUT OF STATEIN 1978, AS REPORTED BY LOCAL PHASE II AGENCIES
Number of AGENCIES Reporting
Reasons for Placementa Child Welfare Juvenile Justice
Receiving Facility Closer to Child's Home,Despite Being Across State Lines 0 0
Previous Success with Receiving Facility 1 0
Sending State Lacked Comparable Services 3 2
Standard Procedure to Place Certain ChildrenOut of State
1 0
Children Failed to Adapt to In-State Facilities 3 1
Alternative to In-State PublicInstitutionalization
4 1
To Live with Relatives (Non-Parental) 1 2
Other1 0
Number of Phase II Agencies Reporting 4 3
a. Some agencies reported more than one reason for placement.
MT-15
123
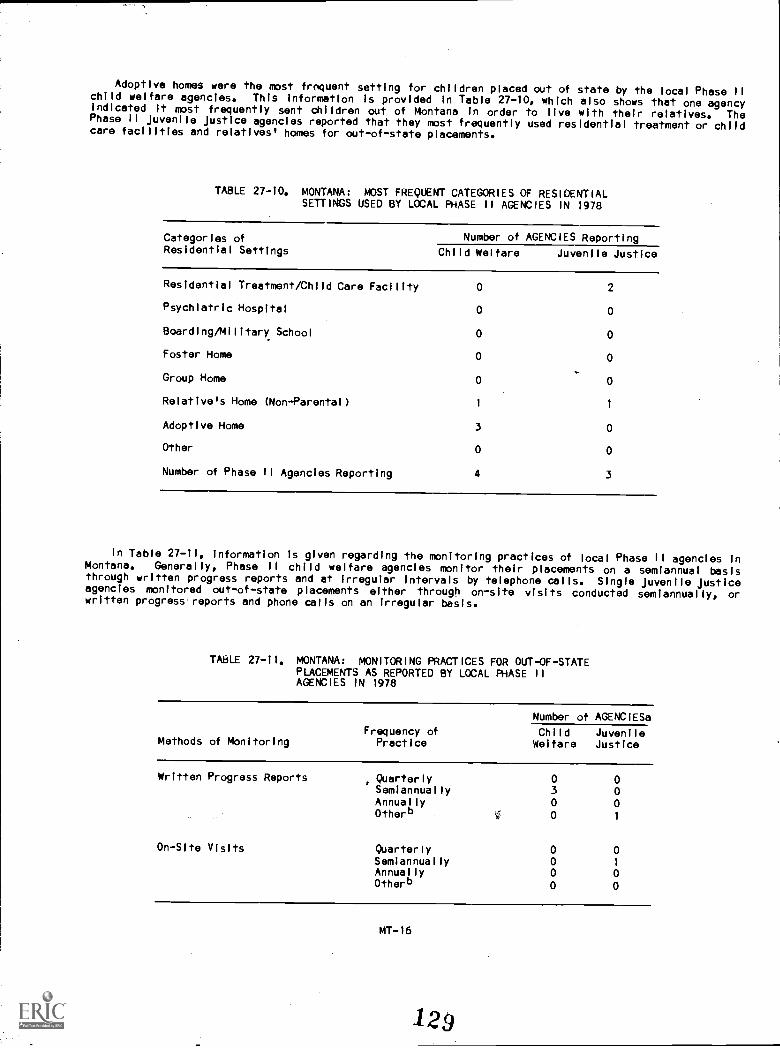
Adoptive homes were the most troquent setting for children placed out of state by the local Phase IIchild welfare agencies. Thls information Is provided In Table 27-10, which also shows that one agencyindicated it most frequently sent children out of Montana In order to live with their relatives. ThePhase II juvenile justice agencies reported that they most frequently used residential treatment or childcare facilities and relatives' homes for out-of-state placements.
TABLE 27-10. MONTANA: MOST FREQUENT CATEGORIES OF RESIDENTIALSETTINGS USED BY LOCAL PHASE II AGENCIES IN 1978
Categories ofResidential Settings
Number of AGENCIES Reporting
Child Welfare Juvenile Justice
Residential Treatment/Child Care Facility 0 2
Psychiatric Hospital 0 0
Boarding/Military School 0 0
Foster Home 0 0
Group Home 0 0
Relative's Home (Non-Parental) 1 1
Adoptive Home 3 0
Other 0 0
Number of Phase II Agencies Reporting 4 3
In Table 27-11, Information Is given regarding the monitoring practices of local Phase II agencies InMontana. Generally, Phase II child welfare agencies monitor their placements on a semiannual basisthrough written progress reports and at irregular intervals by telephone calls. Single juvenile justiceagencies monitored out-of-state placements either through on-site visits conducted semiannually, orwritten progress reports and phone calls on an irregular basis.
TABLE 27-11, MONTANA: MONITORING PRACTICES FOR OUT-OF-STATEPLACEMENTS AS REPORTED BY LOCAL PHASE IIAGENCIES IN 1978
Methods of MonitoringFrequency of
Practice
Number of AGENC1ESa
ChildWelfare
JuvenileJustice
Written Progress Reports Quarterly 0 0Semiannually 3 0Annually 0 0Otherb 1 0 1
On-Site Visits Quarterly 0 0Semiannually 0 1
Annually 0 0Otherb 0 0
MT-16
129
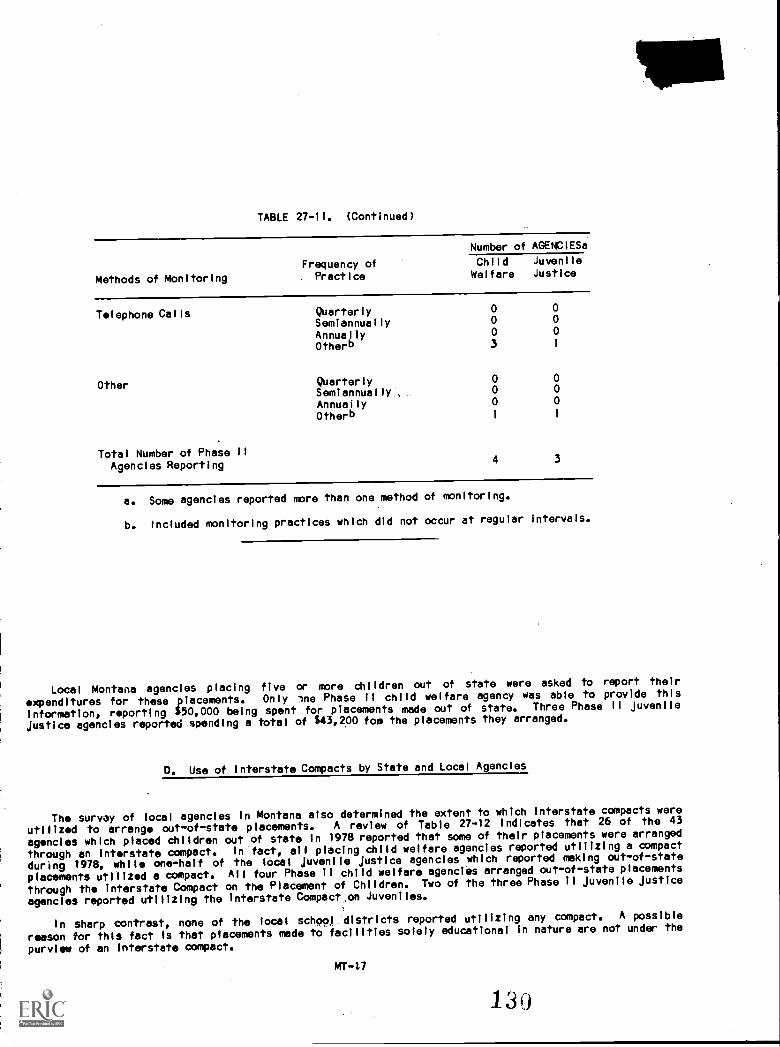
TABLE 27-11. (Continued)
Methods of Monitoring
Frequency ofPractice
Number of AGENC1ESa
ChildWelfare
JuvenileJustice
Telephone Calls Quarterly 0 0
Semiannually 0 0
Annually 0 0
Otherb 3
Other QUarterly 0 0
Semiannually , .
0 0
Annually 0 0
Otherb 1
Total Number of Phase 11Agencies Reporting
4 3
a. Some agencies reported more than one method of monitoring.
b. Included monitoring practices which did not occur at regular intervals.
Local Montana agencies placing five or more children out of state were asked to report their
expenditures for these placements. Only lne Phase 11 child welfare agency was able to provide this
information, reporting 150,000 being spent for placements made out of state. Three Phase II juvenile
justice agencies reported spending a total of $43,200 fop the placements they arranged.
D. Use of Interstate Compacts by State and Local Agencies
The survey of local agencies In Montana also determined the extent to which interstate compacts were
utilized to arrange out-of-state placements. A review of Table 27-12 indicates that 26 of the 43
agencies which placed children out of state In 1978 reported that some of their placements were arranged
through an interstate compact. In fact, all placing child welfare agencies reported utilizing a compact
during 1978, while one-half of the local juvenile justice agencies which reported making out-of-state
placements utilized a compact. All four Phase 11 child welfare agencies arranged out-of-state placements
through the interstate Compact on the Placement of Children. Two of the three Phase 11 juvenile justice
agencies reported utilizing the interstate Compact,on Juveniles.
In sharp contrast, none of the local schopl.Aistricts reported utilizing any compact. A possible
reason for thls fact Is that placements made to facilities solely educational in nature are not under the
purview of an Interstate compact.
MT-17
130

TABLE 27-12. MONTANA: UTILIZATION OF INTERSTATE COMPACTS BYLOCAL AGENCIES IN 1978, BY AGENCY TYPE
LoCai Agencies Which PlacedChildren Out of State
Number of AGENCIES
ChildWelfare
JuvenileEducation Justice
NUMBER OF LOCAL AGENCIES PLACINGFOUR OR LESS CHILUKtN 16 11 9
Number Using Compacts 16 0 4
Number Not Using Contacts 0 11 5
Number with Compact UseUnknown 0 0 0
NUMBER Of PHASE II AGENCIESPLACING CHILDREN 4 0 3
Number Using Compacts 4 2
Interstate Compact on the Placementof Children
Yes 4 0No 0 3Don't Know 0 0
Interstate Compact on Juveniles
Yes 0 2No 4 1
Don't Know 0 0
Interstate Compact on Mental Health
Yes 0 0No 4 3Don't Know 0 0
Number Not Using Compacts 0 1
I,4imber with Compact Use Unknown 0 0
TOTALS
Number of AGENCIES PlacingChildren Out of State 20 11 12
Number of AGENCIES Using Compacts 20 0 6
Number of AGENCIES Not UsingCompacts 0 11 6
Number of AGENCIES with CompactUse Unknown 0 0 0
-- denotes Not, Applicable.
Further knowledge concerning the utilization of interstate compacts Is acquired through consideration'of the information given In Table 27-13. This table indicates the number of children who were or werenot placed out of state with a compact. An examination of the overall trend shows that a total of 37children were placed out of state in 1978 without the use of a compact; 19 of which were by the elevenlocal education agencies Indicated in Table 27-12. Among the 20 placing child welfre agencies, at least
MT-18
13i
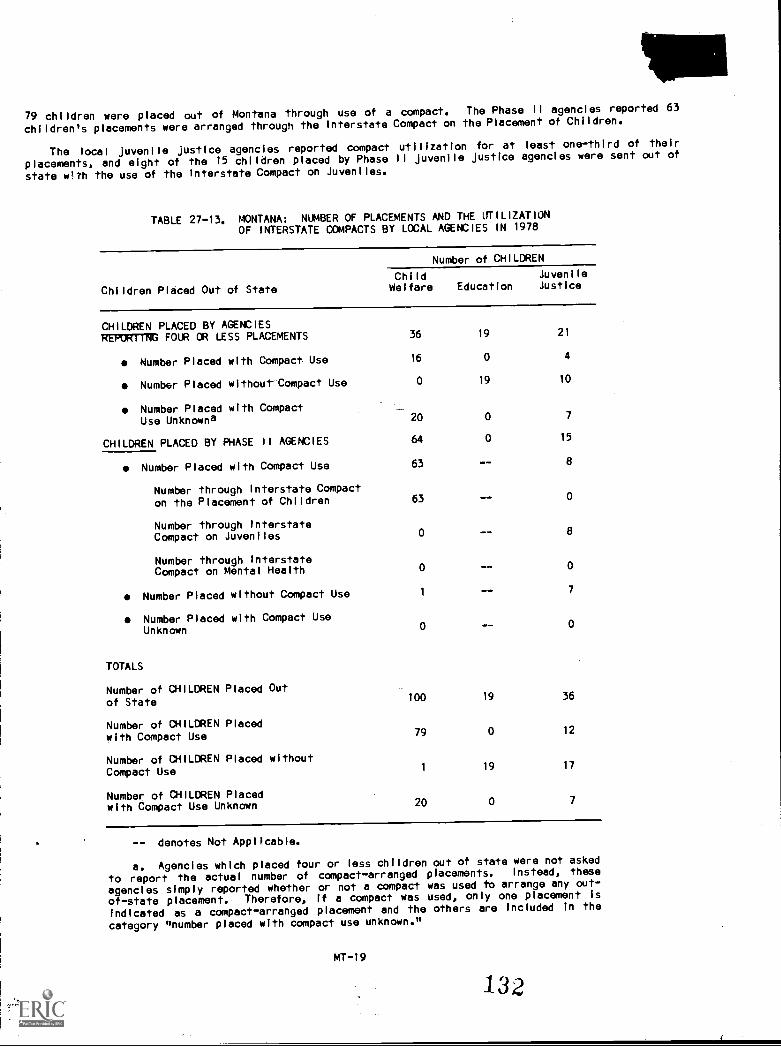
79 children were placed out of Montana through use of a compact. The Phase II agencies reported 63
children's placements were arranged through the Interstate Compact on the Placement of Children.
The local Juvenile Justice agencles reported compact utilization for at least one-third of their
placements, and eight of the 15 children placed by Phase 11 Juvenile Justice agencies were sent out of
state with the use of the Interstate Compact on Juveniles.
TABLE 27-13. MONTANA: NUMBER OF PLACEMENTS AND THE UTILIZATIONOF INTERSTATE COMPACTS BY LOCAL AGENCIES IN 1978
Children Placed Out of State
Number of CHILDREN
ChildWelfare Education
JuvenileJustice
CHILDREN PLACED BY AGENCIESREPORTTRG FOUR OR LESS PLACEMENTS 36 19 21
Number Placed with Compact. Use 16 0 4
Number Placed without-Compact Use 0 19 10
Number Placed with CompactUse Unknowna 20 0 7
CHILDREN PLACED BY PHASE II AGENCIES 64 0 15
Number Placed with Compact Use 63 8
Number through Interstate Compacton the Placement of Children 63 0
Number through InterstateCompact on Juveniles 0 8
Number through InterstateCompact on Mental Health 0 0
Number Placed without Compact Use 17
Number Placed with Compact UseUnknown
TOTALS
Number of CHILDREN Placed Outof State 100 19 36
Number of CHILDREN Placedwith Compact Use 79 0 12
Number of CHILDREN Placed withoutCompact Use 1 19 17
Number of CHILDREN Placedwith Compact Use Unknown 20 0 7
-- denotes Not Applicable.
a. Agencies which placed four or less children out of state were not asked
to report the actual number of compact-arranged placements. Instead, these
agencies simply reported whether or not a compact was used to arrange any out-
of-state placement. Therefore, if a compact was used, only one placement is
Indicated as a compact-arranged placement and the others are Included In the
category "number placed with compact use unknown."
MT-19
132

Graphic roprosentatIon of the Informatlon gathered about interstate compact utilization for childrenplaced out of state In 1978 by local agencles is Illustrated In Figures 27-4, 5, and 6. Figure 27-4shows that of the 100 children reported placed out of state by local child welfare agencies in Montana,as few as one percent were noncompact arranged placements. At least 79 percent were compact arranged,and for 20 percent of the placements compact use was undetermined. Comparative information Is-Illustrated about compact use for placements arranged by local education and Juvenile Justice agencies InFigures 27-5 and 6.
FIGURE . MONTANA: UTILIZATION OF INTERSTATE COMPACTS BYLOCAL CHILD WELFARE AGENCIES IN 1978
100
CHILDREN PLACEDOUT OF STATE BYMONTANA LOCALCHILD WEL FARE
AGENCIES
MT-20
133
=MEM. 0.110
79% COMPACT AR RANGEC
M111, .110 1.1111110

FIGURE 27-5. MONTANA: UTILIZATION OF INTERSTATE COMPACTS BYLOCAL EDUCATION AGENCIES IN 1978
19
CHILDREN PLACEDOUT OF STATE BYMONTANA LOCALEDUCATION AGENCIES
MT-21
0% COMPACT ARRANGED
gmiMk. OEM*
\-01,
134
NINIIN

FIGURE 27-6. MONTANA: UTILIZAT104 OF INTERSTATE COMPACTS BYLOCAL JUVENILE JUSTICE AGENCIES IN 1978
36CHILUREN PLACEDOUT OF STATE RTMONTANA LOCALJUVENILE JUSTICEAGENCIES
INa MEMO.
11
33% COMPACT ARRANGED
MIIMMI MEM.
.%%.
194,
r N\
The state agencies In Montana also reported Interstate compact utilization In 1978, as displayed InTable 27-14. The DSRS' Social Services Bureau dld not report the number of chlidren for whom It helpedto arrange placement without necessarily belng fiScally or legally responsible for arranging, but dldreport the 100 locally arranged placements It funded and two state agency placements, all of whlch werecompact arranged placements. The state education agency could ,not report upon the local or stateagencies' compact utillzation.
As described In section III, the state Juvenlle Justice agency does not keep records on localagencies' placement of status offenders or youth on probation. However, the same number of childrenreported to have been placed out of state with compact use by local agencies, 12 chlldren, was the samenumber of local placements reported by the state agency as being compact-arranged, in addition to 18others it had knowledge of belng compact arranged. The state mental health and mental retardation agencyreported that all 15 placements made by that agency were processed through a compact.
MT-22
1 3 5
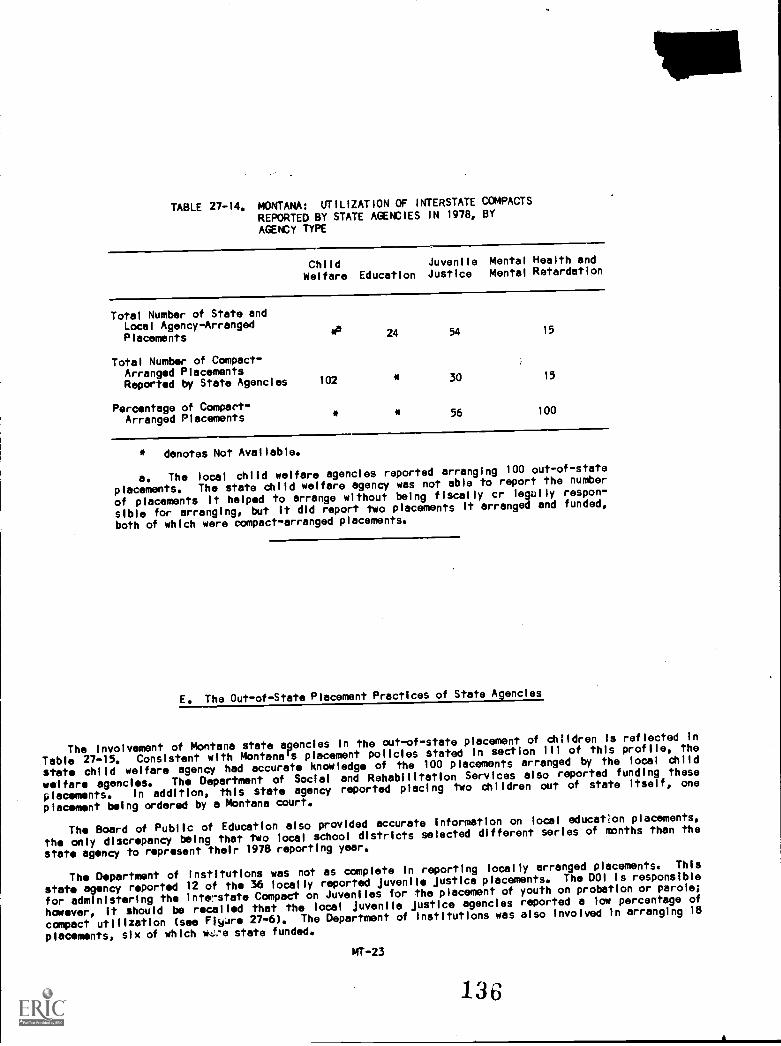
TABLE 27-14. MONTANA: UTILIZATION Of INTERSTATE COMPACTSREPORTED BY STATE AGENCIES IN 1978, BY
AGENCY TYPE
ChildWelfare Education
JuvenlleJustice
Mental Health andMental Retardation
Total Number of State andLocal Agency-ArrangedPlacements 24 54 15
Total Number of Compact-Arranged PlacementsReported by State Agencies 102 * 30 15
Percentage of Compart-Arranged Placements
* * 56 100
* denotes Not Available.
a. The local child welfare agencies reported arranging 100 out-of-state
placements. The state child welfare agency was not able to report the number
of placements it helped to arrange without being fiscally cr legally respon-
sible for arranging, but it did report two placements it arranged and funded,
both of which were compact-arranged placements.
E. The Out-of-State Placement Practices of State Agencles
The involvement of Montana state agencies in the out-of-state placement of children is reflected In
Table 27-15. Consistent with Montana's placement policies stated In section 111 of thls profile, the
state child welfare agency had accurate knowledge of the 100 placements arranged by the local child
welfare agencies. The Department of Soclai and Rehabilitation Services also reported funding these
placements. in addition, this state agency reported placing two chlldren out of state Itself, one
placement being ordered by a Montana court.
The Board of Public of Education also provided accurate information on focal educaflon placements,
the only discrepancy being that two local school districtsselected different series of months than the
state agency to represent their 1978 reporting year.
The Department of Institutions was not as complete In reporting locally arranged placements. This
state agency reported 12 of the 36 locally reported Juvenile Justice placements. The DOI Is responsible
for administering theInterstate Compact on Juveniles for the placement of youth on probation or parole;
however, it should be recalled that the local juvenile justice agencies reported a low percentage of
compact utilization (see Flgsire 27-6). The Department of Institutions was also involved in arranging 18
placements, slx of which we state funded.
MT-23
136

The state mental health and mental retardation agency reported 15 state-arranged placements out ofMontana, but did not report whether they funded such placements or were required by law to make suchplacements.
TABLE 27-15. MONTANA: ABILITY Of STATE AGENCIES TO REPORTTHEIR INVOLVEMENT IN ARRANGING OUT-OF-STATEPLACEMENTS IN 1978
rypes of Involvement
Number of 0111-OREN ReportedPlaced during i9/8 by State Agencies
ChildWelfare Educationa
JuvenileJustice
Mental Health andMental Retardation
State Arranged and Funded
Locally Arranged butState Funded
Court Ordered, but StateArranged and Funded
Subtotal: Placements
1
100
1
0
24
3
6
2
0 0
Involving StateFunding 102 27 8
Locally Arranged andFunded, and Reportedto State 0 0 10
State Helped Arrange,but Not Required byLaw or Did Not Fundthe Placement 5 12
Other 0 0 0 0
Total Number ofChildren Placed Outof State with StateAssistance or ---Knowledge 102 29 30 15
* denotes Not Available.-- denotes Not Applicable.
a. Includes all out-of-state placements known to officials In theparticular state agency. In some cases, thls figure consists of placementswhich did not directly involve affirmative action by the state agency but maysimply indicate knowledge of certain out-of-state placements through caseconferences or through various forms of Informal reporting.
Destinations of children placed out of state which were known to Montana state agencies were onlyreported by the state education and juvenile justice agencies. Table 27-16 shows that many childrenreported by the Board of Public Education were placed into Montana's contiguous states of North Dakota,South Dakota, and Idaho. Colorado received six children and Texas was reported to have received fiveMontana children. Both Arizona and Minnesota received one education placement each. The destinationsfor five education placements could not be reported.
A large portion of the placements reported by the state juvenlie justice agency were located In thesame geographic region within which Montana Is located. Receiving states located in this same regloninclude Montana's border states of Idaho, South Dakota, and Wyoming. However, California and Coloradoalso received a large number of children from Montana's juvenile justice agencies. Single placementswere also reported In states as distant as Alaska, Delaware, South Carolina, and Tennessee.
MT-24
137

TABLE 27-16, MONTANA: DESTINATIONS OF CHILDREN PLACED OUT
OF STATE IN 1978 REPORTED BY STATE AGENCIES,
BY AGENCY TYPE
Destinations ofChildren Placed
Number of CHILDREN Placed
ChildWelfare Education
JuvenileJustice
Mental Health andMental Retardation
Alaska1
Arizona1 1
California5
Colorado6 2
Delaware1
Idaho1 5
Minnesota1 0
Nevada1
North Dakota7 0
Oregon
South Carolina1
South Dakota3 1
Tennessee1
Texas5 0
Utah2
Washington6
Wyoming2
Placements for WhichDestinations Could Notbe Reported by StateAgencies All 5 0 All
Total Number of Placements 102 29 30 15
The condition of children placed out of state and reported by Montana state agencies is given In
Table 27-17. The state child welfare agency reported a wide range of conditions, including all handicaps
and those conditions or statuses typically serviced by this type of agency: battered, abandoned, or
neglected children, and foster and adopted children. The Board of Public Education reported handicapped
children as well as unruly/disruptive children; juveniledelinquents; battered, abandoned, or neglected
children; and children with substance abuse problems,beIng sent out of Montana.
The state juvenlle justice agency reported that truants, juvenlle delinquents, and emotionally
disturbed or mentally ill children were placed out of state, while the state mental health and mental
retardation agency placed physically and mentally handicapped children.
MT-25
138
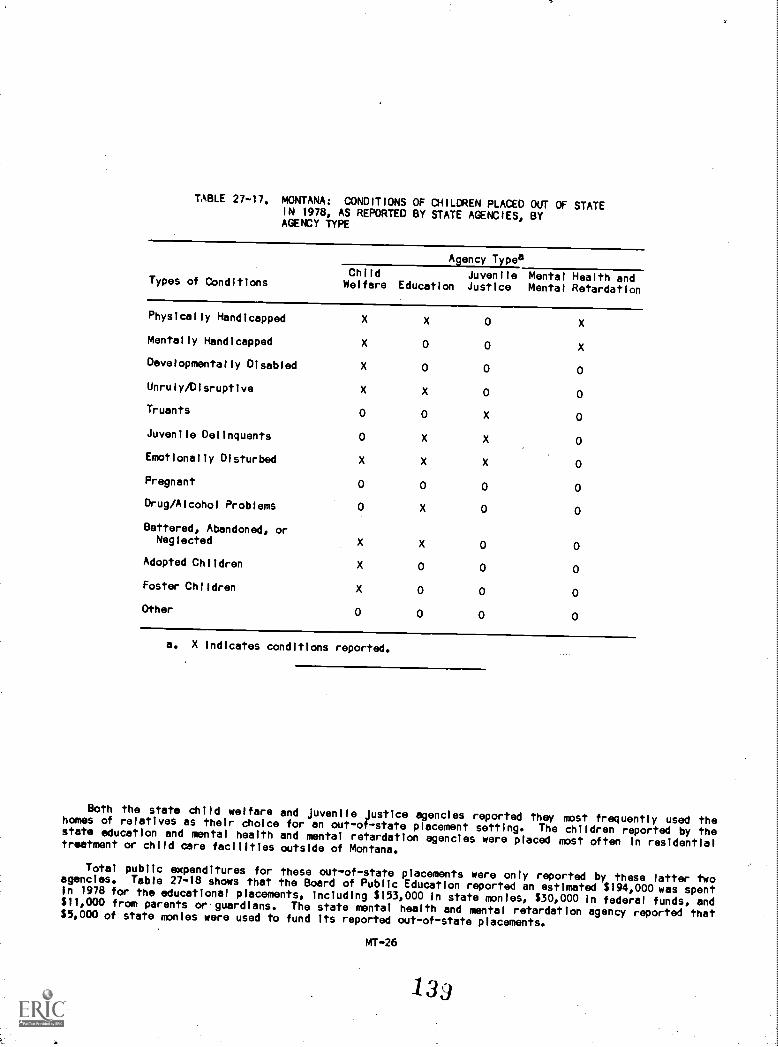
TABLE 27-17. MONTANA: CONDITIONS OF CHILDREN PLACED OUT OF STATEIN 1978, AS REPORTED BY STATE AGENCIES, BYAGENCY TYPE
Types of Conditions
Agency TypeaChild
Welfare EducationJuvenileJustice
Mental Health andMental Retardation
Physically Handicapped X X 0 X
Mentally Handicapped X 0 0 X
Developmentally Disabled X 0 0 0
Unruly/Disruptive X X 0 0
Truants 0 0 X 0
Juvenile Delinquents 0 X X 0
Emotionally Disturbed X X X 0
Pregnant 0 0 0 0
Drug/Alcohol Problems 0 X 0 0
Battered, Abandoned, orNeglected X X 0 0
Adopted Children X 0 0 0
Foster Children X 0 0 0
Other 0 0 0 0
a. X indicates conditions reported.
Both the state child welfare and Juvenile Justice agencies reported they most frequently used thehomes of relatives as their choice for an out-of-state placement setting. The children reported by thestate education and mental health and mental retardation agencies were placed most often In residentialtreatment or child care facilities outside of Montana.
Total public expenditures for these out-of-state placements were only reported by these latter twoagencies. Table 27-18 shows that the Board of Public Education reported an estimated $194,000 was spentIn 1978 for the educational placements, including $153,000 In state monles, $30,000 In federal funds, and$11,000 from parents or,guardians. The state mental health and mental retardation agency reported that$5,000 of state monies were used to fund its reported out-of-state placements.
I4T -26
139

TABLE 28-18. MONTANA: PUBLIC EXPENDITURES FOR OUT-OF-STATEPLACEMENTS IN 1978, AS REPORTED BY STATE
AGENCIES
Levels of Government
Expenditures, by AGENCY Type
Child Juvenile Mental Health and
Welfare Education Justice Mental Retardation
State* $153,000 est * $5,000 est
Federal* 30,000 est * 0
Local* * * 0
Other* 11,000 est * *
Total ReportedExpenditures * $194,000 est * 0,000 est
* denotes Not Avallable.
F. State Agencies' Knowledge of Out-of-State Placements
As a- final review, Table 27-19 offers the incidence of out-of-state placement involvement of Montana
public agencies and each state agency's knowledge of this placement activity. The state child welfare
agency accurately reported the 100 children placed out of state by local agencles (Table 27-15) but did
not report the number of children placed by the state for whom it was not fiscally or legally
responsible. The state education agency, in contrast, attributed five more out-of-state placements to
local school districts than the local agencies reported. -This may be due to the fact that two local
school districts selecteddifferent series of months than the state agency to represent their 1978
reporting year.4
Again, recalling section III, the state Juvenile Justice agency does not maintain records of local
agencies' placement activities and this is reflected In the fact that only 56 percent of the Juvenile
Justice placements identified by the survey were known to the state agency. Reporting upon its own
placement activity, the state mental health and mental retardatlon agency had knowledge of 15
out-of-state placements In 1978.
MT-27
140
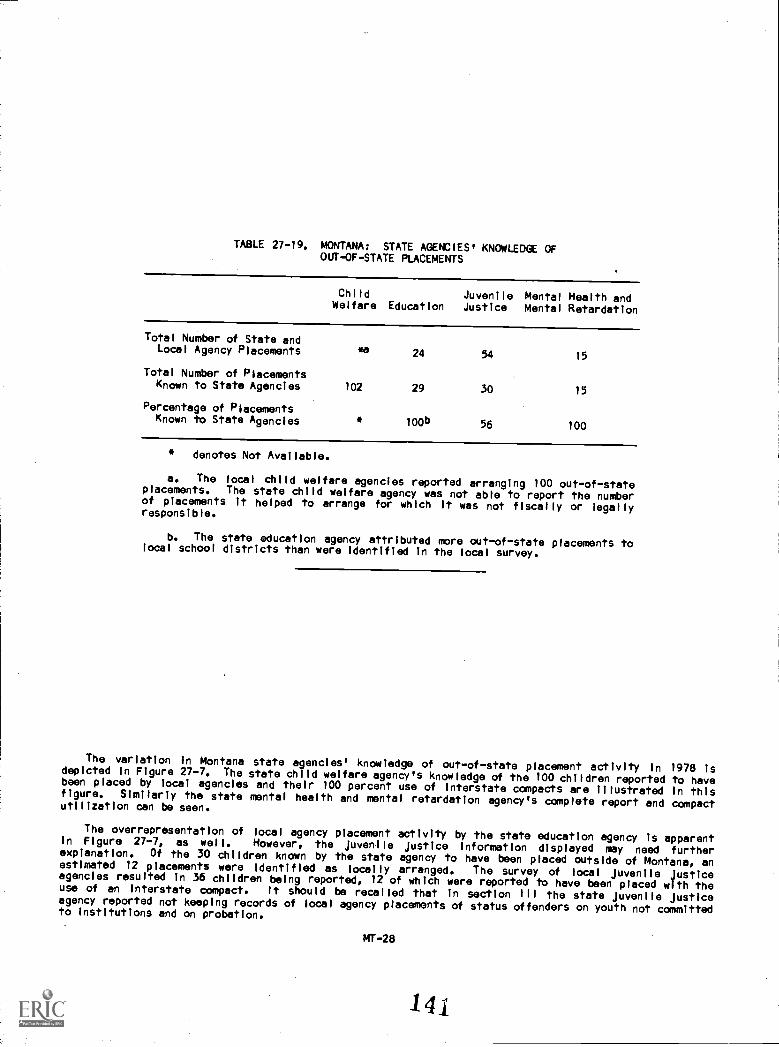
TABLE 27-19. MONTANA: STATE AGENCIES' KNOWLEDGE OFOUT-OF-STATE PLACEMENTS
ChildWelfare Education
JuvenileJustice
Mental Health andMental Retardation
Total Number of State andLocal Agency Placements ea 24 54 15
Total Number of PlacementsKnown to State Agencies 102 29 30 15
Percentage of PlacementsKnown to State Agencies * 100b 56 100
* denotes Not Available.
a. The local child welfare agencies reported arranging 100 out-of-stateplacements. The state child welfare agency was not able to report the numberof placements it helped to arrange for which It was not fiscally or legallyresponsible.
b. The state education agency attributed more out-of-state placements tolocal school districts than were Identified In the local survey.
The variation in Montana state agencies' knowledge of out-of-state placement activity In 1978 isdepicted in Figure 27-7. The state child welfare agency's knowledge of the 100 children reported to havebeen placed by local agencies and their 100 percent use of interstate compacts are illustrated In thisfigure. Similarly the state mental health and mental retardation agency's complete report and compactutilization can be seen.
The overrepresentation of local agency placement activity by the state education agency Is apparentIn Figure 27-7, as well. However, the juvemile justice Information displayed may need furtherexplanation. Of the 30 children known by the state agency to have been placed outside of Montana, anestimated 12 placements were identified as locally arranged. The survey of local juvenile justiceagencies resulted In 36 children being reported, 12 of which were reported to have been placed with theuse of an interstate compact. It should be recalled that In section III the state juvenlle justiceagency reported not keeping records of local agency placements of status offenders on youth not committedto institutions and on probation.
lkfr -28
14i
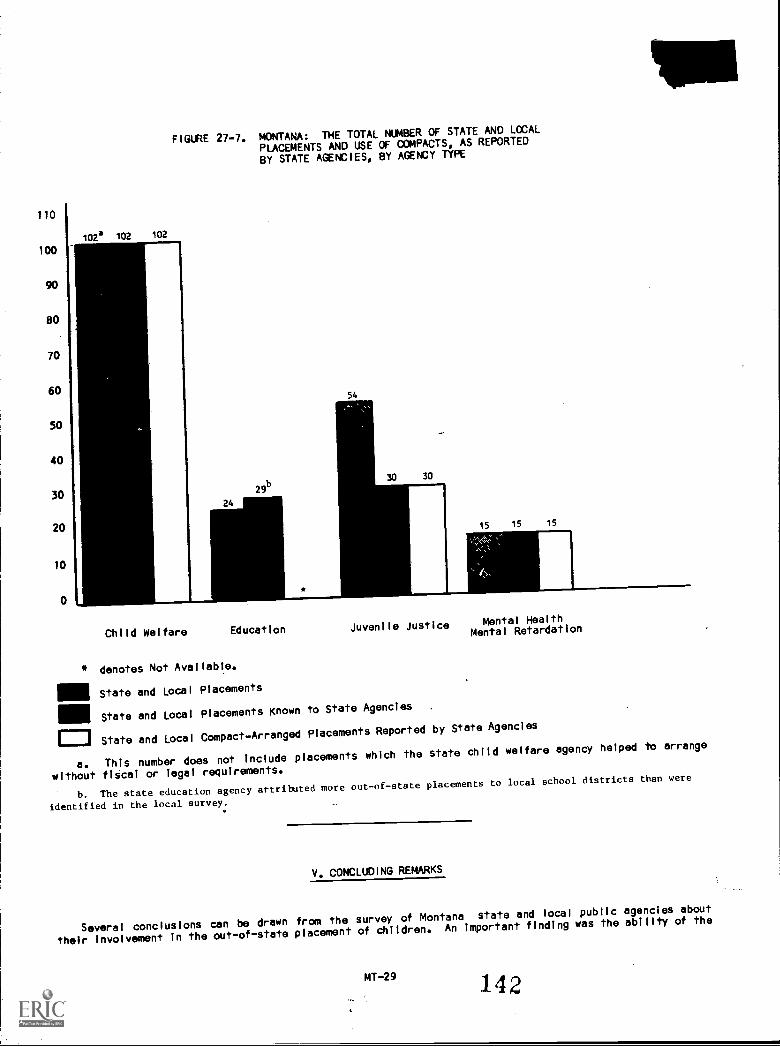
110
100
90
80
70
60
50
40
30
20
10
FIGURE 27-7. MONTANA: THE TOTAL NUMBER OF STATE AND LOCAL
PLACEMENTS AND USE Cf COMPACTS, AS REPORTED
BY STATE AGENCIES, BY AGENCY TYPE
54
30
15 15 15
Child Welfare Education
denotes Not Avallable.
State and Local Placements
State and Local Placements Known to State Agencies
State and Local Compact-Arranged PlacementsReported by State Agencies
Juvenile JusticeMental Health
Mental Retardation
a. This number does not Include placements which the state child welfare agency helped to arrange
without fiscal or legal requirements.
b. The state education agency artributed more out-of-stateplacements to local school districts than were
identified in the local survey.
V. CONCLUDING REMARKS
Several conclusions can be drawn from the survey of Montana state and local public agencies about
their involvement in the out-of-state placement of children. An Important finding was the ability of the
MT-29 142
state child welfare and education agencies to report their local agencies' involvement In out-of-stateplacements. In addition, a very close supervisoryrelationship was determined to exist between the stateand local child welfare agencies In regard to the regular use of Interstate compacts.
Other factors which emerge from the survey results follow:
A high degree of interagencycooperation exists among both local child welfare and educationagencies in Montana for arranging the out-of-state placements of children with a variety ofconditions or statuses.
The preference for placing children Into states contiguous to Montana was more prevalent amongstate agencies than among the local agencies which reported destinations.
Considering the relative low utilization of interstate compacts by local juvenile justiceagencies, the irregular Intervals of monitoring reported by some of these agencies indicate apossible lack of adequate knowledge about a child's progress In placement.
The emotionally disturbed or mentally 111 thlid In Montana receives services from every typeof public agency at the state level of government and, with the exception of juvenile justice,at the local level as well.
The reader Is encouraged to compare national trends described In Chapter 2 with the findings whichrelate to specific practices, In Montana In order to develop further conclusions about the state'sInvolvement with the out-of-state placement of children.
FOOTNOTE
I. General Information about states, counties, cities, and SMSAs Is from the special 1975 populationestimates based on the 1970 national census contained In the U.S. Bureau of the Census, County and CityData Book, 1977 (A StatisticalAbstract Supplement), Washington, D.C., 1978.-11757ffalriTri 600UT direct genera: state and local total per capita expenditures and expenditures foreducation and public welfare were also taken from data collected by the U.S. Bureau of the Census andthey appear in Statistical Abstract of the United States: 1979 (100th Edition), Washington, D.C.,1979. - -
The 1978 estimated population of persons eight to 17 years old was developed by the National Centerfor Juvenile Justice using two sources: the 1970 national census and the National Cancer Institute 1975estimated aggregate census, also prepared by the U.S. Bureau of the Census.
MT-30
143

A PROFILE OF OUT-OF-STATE PLACEMENT POLICY AND PRACTICE IN NEVADA
1. ACKNOWLEDGMENTS
The Academy gratefully acknowledges the assistance of the many state and local public officials who
contributed their time and effort to the project, particularly Gloria Dopf, Special Education Consultant,
Department of Education; Gloria Handley, Chief, Program Services, Welfare Division, Department of Human
Resources; Irene Vaughn, Compact Correspondent,Youth Services Division, Department of Human Resources;
and Andrew Meyerson, Assistant Administrator, Division of Mental Hygiene and Mental Retardation,
Department of Human Resources.
11. METHODOLOGY
Information was systematically gathered about Nevada from a variety of sources using a number of
data collection techniques. First, a search for relevant state statutes and case law was undertaken.
Next, telephone interviews were conducted with state officials who were able to report on agency policies
and practices with regard to the out-of-state placement of children. A mall survey was used, as a
follow-up to the telephone interview, to solicit information specific to the out-of-state placement
practices of state agencies and those of local agencies subject to state regulatory control or
supervisory oversight.
An assessment of out-of-state placement policies and the adequacy of Information reported by state
agencies suggested further survey requirements to determine the involvement of public agencies in
arranging out-of-state placements. Pursuant to this assessment, further data collection was undertaken
if ft was necessary to:
verify out-of-state placement data reported by state government about local agencies; and
collect local agency data which was not available from state government.
A summary of the data collection effort in Nevada appears below In Table 29-1,
TABLE 29-1, NEVADA: METHODS OF COLLECTING DATA
Levels of ChildGovernment Welfare
Survey Methods, by Agency Type
Juvenile Mental Health and
Education Justice Mental Retardation
State TelephoneAgencies Interview
LocalAgencies
Mailed Survey:DHR officials
TelephoneSurvey:All 7 localchild welfareagencies
Telephoneinterview
Mailed Survey:DOE officials
TelephoneSurvey:All 17 localschooldistricts
TelephoneInterview
Mailed Survey:DHR officials
TelephoneSurvey:All 13 localprobationoffices
TelephoneInterview
Mailed Survey:DHR officials
Not Applicable(State Offices)
NV7I
144
111. THE ORGANIZATION OF SERVICES AND OUT-OF-STATE PLACEMENTPOLICY IN 1978
A. Introductory Remarks
Nevada has the seventh largest land area (109,889 square miles) and Is the 46th most populated state(590,268) in the United States. It has six cities with populations over 10,000 and five cities withpopulations over 20,000--Carson City, Las Vegas, North Las Vegas, Reno, and Sparks. Las Vegas Is themost populated city in the state, with a population of approximately 150,000. Carson City, the capital,is the fifth most populated city In the state, with a population of nearly 25,000. It has 16 countiesand one city-county consolidation, Carson City--Ormsby. The estimated 1978 population of persons eightto 17 years old Was 106,780.
Nevada has two Standard Metropolitan Statistical Areas (SMSAs): Reno (Washoe County) and Las Vegas(Clark County). Its contiguous states are California, Arizona, Utah, Idaho, and Oregon.
Nevada was ranked 47th nationally in total state and local per capita expenditureq, 26th in percapita expenditures for education, and 44th In per capita expenditures for public welfare.'
B. Child Welfare
Child welfare services for children and youth are administered by the Nevada Department of HumanResources (DHR) through its Welfare Division's nine district offices and seven Independent localagencies: Clark, Washoe, Churchill, Elko, Lyon, and White Pine county welfare departments, and CarsonCity Welfare Department. The DHR Welfare Division services include adoption, foster care, protectiveservices, day care, institutional care, homemaker services, and family planning.
It was reported that out-of-state placements are made by virtue of a judicial order. Nevada is nota member of the Interstate Compact on the Placement of Children (ICPC). In addition, the divisionmaintains that it cannot determine the number of placements that are made out of state by local agencies.
C. Education
Nevada's Department of Education (DOE) has a major responsibility for its educational system. WithinDOE is the Division of Special Education, which is directly involved with the placement of children inother states. Nevada's 17 school districts have responsibility for providing special education curriculaIn addition to the normal curriculum for grades K-12. Nevada's 17 school districts are not restricted bylaw from placing children out of state.
D. Juvenile Justice
Juvenile jurisdiction in Nevada is vested within the nine district courts serving single or multiplecounties, depending on population density. Probation services are provided by the 17 county governmentsin 13 locations and the district judges serve as the administrators of probation services provided by thecounties contained in their respective judicial districts.
Adjudicated delinquents found to be in need of extended care or confinement may be committed to theYouth Services Division of the Department of Human Resources (DHR), which maintains two training schoolsand aftercare services In cooperation with the Welfare and Rehabilitation Divisions.
It was reported that out-of-state placements of adjudicated delinquents are processed' by the YouthServices Division, which administers the Interstate Compact on Juveniles. Nevada has been a member ofthe Compact since 1957.
NV-2
1 4 5
E. Mental Health and Mental Retardation
Mental health and mental retardation services are provided by the Division of Mental Hygiene and
Mental Retardation UOIMR) within the Department of Human Resources (DHR). MHMR Is a state-run system
responsible for the delivery of these services through branch offices. Each branch office Is reported to
have a county advisory board that makes recommendations to the state regarding out-of-state placements.
The only restriction to these placements Is the lack of funds. Also, MHMR officials report that their
office makes every attempt not to place children out of state and to provide the least restrictive
environment.
Nevada Is not a member of the Interstate Compact on Mental Health (1CMH). Also, MHMR officials
report that their branch offices cannot place children out of state without reporting the information to
their agency.
IV. FINDINGS FROM A SURVEY OF OUT-OF-STATE PLACEMENT PRACTICES IN 1978
Information that was collected from state and local Nevada agencies on out-of-state placement
practices is included in this section of the profile. The data Is presented In tables and is organized
so as to address the important Issues regarding out-of-state placement raised In Chapter 1.
A. The Number of Children Placed In Out-of-State Residential Settings
Table 29-2 provides an introductory overview of the out-of-state placement activity that occurred in
Nevada public agencies in 1978. The data reflected in this table not only gives an idea about the locus
of placement activity in the state, but also lends an indication about size of the cohort of children
leaving the state for care and treatment In that year. At the state level, the DHRIs Welfare and Youth
Services Divisions and, to a lesser extent, the Division of Mental Hygiene and Mental Retardation, are
all involved in placing children out of Nevada, as Is the state education agency. The DHRis Welfare
Division is most active among theseagencies, reporting 68 percent of all placements involving state
agencies.
At the local level, the Juvenile Justice agencies are the most active local agency type In terms of
out-of-state placement. Although local child welfare and education agencies reported involvement In
placing children into other states, the Juvenile Justice agencies account for 75 percent of those made by
local agencies.

TABLE 29-2. NEVADA: NUMBER OF OUT-OF-STATE PLACEMENTSARRANGED BY STATE AND LOCAL PUBLIC AGENCIESIN 1978, BY AGENCY TYPE
Levels of Child Juvenile Mental Health andGovernment Welfare Education Justice Mental Retardation Total
State AgencyPlacements, 79 35
*b3 117
Local AgencyPlacements 9 28 112 149
Total 88 63 112 3 266
* denotes Not Available.-- denotes Not Applicable.
a. May include placements which the state agency arranged and fundedindependently or under a court order, arranged but did not fund, helpedarrange, and others directly involving the state agency's assistance orknowledge. Refer to Table 29-15 for specific information regarding stateagency involvement in arranging out-of-state placements.
b. The state juvenile justice agency reported knowledge of 41 childrenbeing placed out of state In 1978, but did not specify the level of governmentinvolved in the placement of 15 of these children under the age of ten and unotin the juvenile justice systee; nor could it indicate the number of childrenfor whom it helped to arrange placement without fiscal or legal responsibility.
Table 29-3 further focuses on placement activity at the local level by presenting incidence figuresfor each agency type in each Nevada county. The single child welfare agency placing children out ofNevada was In Washoe County, one of the two SMSA counties In the state. It contains Reno and bordersCalifornia along the long northwest border of Nevada. Carson City was the county which did not provideplacement Information either for child welfare or education. This county borders Washoe County to thesouth, near Reno.
The school district serving Clark County reported the most education out-of-state placements amongNevada's 17 counties, with 12 children placed into other states in 1978. Clark County is the other SMSAcounty In the state, contains Las Vegas, and Is bordered by California to the west and Arizona to theeast. Remaining local education placements were made by school districts In seven other counties which,by placing from one to four children each, account for 57 percent of all local education placements.
Clark County also reported the most children placed by a juvenile probation office, with a total of44 children leaving the state from its jurisdiction. The county with the next highest juvenile justiceout-of-state placement reports was Nye, which is one of the !erg:JO counties in land area in the country,very rural in population, and located in the south central part of the state. These two counties make upover one-half of the 112 reported juvenile justice placements,
with the remaining 48 placements comingfrom 11 counties all over the state, in numbers from two to 13 children per county.
One-half of all out-of-state placements were made by agencies in the two Nevada SMSA counties and 85percent were made by counties bordering other states, which Include the SMSA counties. There are butflve counties In Nevada which are not adjacent to other states.
NV-4
14 7

TABLE 29-3. NEVADA: 1978 YOUTH POPULATIONS AND THE NUMBER OF
OUT-OF-STATE PLACEMENTS ARRANGED BY LOCAL AGENCIES
IN 1978, BY COUNTY AND AGENCY TYPES REPORTING
PLACEMENTS
County Name
1978Populationa(Age 8-17)
Number of CHILDRENPlaced during 1978
ChildWelfare Education
JuvenlleJustice
Churchill 2,239 0 3 4
Clark62,198 0 12 est 44
Douglas 1,8932 '.0
Elko 2,780 0 1 5 est
Esmeralda81
4 --
EurekaHumboldt
1791,412
,- -
01
--13 est
Lander 585OM 0
Lincoln475 0
Lyon1,930 0 0 2
Mineral1,075 -- 0 3
Nye938 -- 0 20 est
Pershing540 -- 0 6 est
Storey122
0 --
Washoe 23,704 9 est 4 5 est
White Pine2,065 0 1 0
Carson City4,564
Multicounty Jurisdictions
Eureka, Lander6
Storey, Carson City4
Total Number ofPlacements Arrangedby Local Agencies(total may includeduplicate count)
9 est 28 est 112 est
Total Number of LocalAgencles Reporting
7 17 13
a denotes Not Available.
-- denotes Not Applicable.
a. Estimates were developed by the National Center of Juvenile Justice using
data from two sources: the 1970 national census and the National Cancer Institute
1975 estimated aggregate census.
B. The Out-of-State PlacementPractices of Local Agencies
Table 29,-4 indicates the extent to which local Nevada agencies were involved in out-of-state
placements, without regard to how many children were placed. Of the 37 local agencies in the state, all
responded to the survey, but one child welfare and one education agency could not provide placement
information. Child welfare agencies were least involved in placingchildren out of Nevada, with only one
agency reporting placements. The Juvenile Justice agencies were most Involved in the practice, with two
of the 13 probation offices not placing children out of Nevada In 1978. About one-half of the 17 school
districts placed children out of state.
NV-5
148

TABLE 29-4. NEVADA: THE INVOLVEMENT OF LOCAL PUBLICAGENCIES IN ARRANGING OUT-OF-STATEPLACEMENTS IN 1978
Response Categories
Number-of AGENCIES, by Agency TypeChild
Welfare Education Juvenile Justice
Agencies Which ReportedOut-of-State Placements 1 8 11
Agencies Which Did NotKnow If They Placed,or Placed but Could NotReport the Number ofChildren
Agencies Which Did NotPlace Out of State 5 8 2
Agencies Which Did NotParticipate In theSurvey
Total Local Agencies 7 17 13
Local agencies not involved In placing children into other states in 1978 were asked to explain whythey had not occurred. The responses of these agencies to a list of reasons that were provided appear inTable 29-5. All local child welfare agencies not Involved in out-of-state placement reported that theywere statutorily prohibited from this activity. One or two of the five nonplacing agencies also saidthey were restricted, leckd funds, had access to sufficient services In Nevada, and had other reasonsfor"not placing children into othr states. The response given in the "other" reasons category by twoagencies was that it was against agency policy to send children out of Nevada.
AII eight school districtsnot placing children Into other states reported that sufficient serviceswere aveliable in Nevada to meet service needs and that there were other ressons for not makingplacements. Similarly, the two juvenile Justice agencies not involved In dat-of-state placementsreported the presence of sufficient in-state services and other reasons as explanation for not makingplacements.
NV-6
1 4

TABLE 29-5. NEVADA: REASONS REPORTED BY LOCAL PUBLIC
AGENCIES FOR NOT ARRANGING OUT-OF-STATEPLACEMENTS IN 1978
Reasons for Not PlacingChildren Out of Statea
Number of Local AGENCIES, by Reported Reason(s)
ChildWelfare Education Juvenile Justice
Lacked Statutory Authority 5 0 0
Restrictedb 2 0 0
Lacked Funds2 0 0
Sufficient Services Availablein State
18 1
Otherc2 8 1
Number of Agencies Reporting No
Out-of-State Placements5 8 2
Total Number of AgenciesRepresented In Survey 7 17 13
a. Some agencies reported more than one reason for not arranging out-of-state
placements.
b. Generally Included restrictions based on agency policy, executive order,
compliance with certain federal and state guidelines, and specific court orders.
c.Generally Included such reasons as out-of-state placements were against
overall agency policy, were disapproved by parents, Involved too much red tape, and
were prohibitive because of distance.
The extent to which local child welfare, education, and juvenile justice agencies elicited the
cooperation of other public agencies In the out-of-state placement process is reflected in Table 29-6.
The table indicates that allchildren placed by the single child welfare agency reporting involvement in
the practice were placed without the cooperation of other P ublic agencies.By contrast, seven of the
eight placing school districts cooperated with other public agencies in the course of making 79 percent
of all education placements.Probation offices occupy a middle ground between these two agency types In
terms of cooperation, with seven of the 11 placing probation offices collaborating with other agencies In
the course of making 37 percent of all local juvenile justice placements.
NV-7
.1 5

TABLE 29-6. NEVADA: THE EXTENT OF INTERAGENCY COOPERATIONTO ARRANGE OUT-OF-STATE PLACEMENTS BY LOCALAGENCIES IN 1978
Number and Percentage, by Agency TypeChild Welfare Education Juvenile Justice
Number Percent Number Percent Number Percent
AGENCIES Reporting Out-of-StatePlacementsa
I 14 a 47 11 85AGENCIES Reporting Out-of-StatePlacements with Interagency
0 0 7 88 7 64
Cooperation
Number of CHILDREN Placed Out ofState
9 100 28 100 12 100Number of CHILDREN Placed Out ofState with interagency
0 0 22 79 41 37
Cooperation
a. See Table 29-4.
Local agencies placing children out of state were asked to describe these cildren according to ailst of conditions. Table 29-7 indicates the number of agencies which reported that a particularcharacteristic described one or more of the children placed out of state by that agency. The childwelfare agency placing children Into other states reported that they were bettered, abandoned, orneglected children. Seven of the eight school
districtr placing children out of Nevada reported thatthese children had special education needs, and six of the districtsdescribed children placed asmultiply handicapped. Fewer responses were also given by school districts to the characteristicsdescribing children who were physically, mentally, or emotionally handicapped, as well as children withbehavior or drug problems and those who were bettered, abandoned, or neglected.
The most frequentdescription given to children placed out of state by the Juvenile Justice agencieswas that they were unruly/disruptive.
About one-hal of the II placing agencies also described childrenas truant, adjudicateddelinquent, zlintally disturbed, inclined toward substance abuse, and battered,abandoned, or neglected. These descriptions, as well as others included In the table, indicateinvolvement of the probation agencies in a variety of problems affecting children.
TABLE 29-7. NEVADA: CONDITIONS OF CHILDREN PLACED OUT OFSTATE IN 1978, AS REPORTED BY LOCAL AGENCIES
Types of ConditIonsa
Number of AGENCIES Reporting
ChildWelfare Education Juvenile Justice
Physically Handicapped 0 2 0
Mentally Retarded orDevelopmentally Disabled 0 4 3
Unruly/Disruptive 0 2 a
Truant 0 0 6
Juvenile Delinquent 0 0 6
NV-8
15i

TABLE 29-7. (Continued)
Types of CondltIonsa
Number of AGENCIES Reporting
ChildWelfare Education Juvenile Justice
Mentally 111/EmotionallyDisturbed 0 4 5
Pregnant 0 0 3
Drug/Alcohol Problems 0 1 6
Battered, Abandoned, orNeglected 1 2 6
Adopted 0 0 1
Special Education Needs 0 7 4
Multiple Handicaps 0 6 0
Otherb 0 1 0
Number of Agencies Reporting 1 8 11
a. Some agencies reported more than one type of condition.
b. Generally Included foster care placements, autistic children, and
status offenders.
C. Detailed Data from Phase 11 Agencies
If more than four out-of-state placements were reported by a local agency, additional Information was
requested. The agencies from which the second phase of data was requested became known as Phase 11
agencies. The responses to the additional questions are reviewed this section of Nevada's state
profile. Wherever references are made to Phase II agencies, they are intended to reflect those local
agencies which reported arranging five or more out-of-state placements In 1978.
The relationship between the number of local Nevada agencies surveyed and the total number of
children placed out of state, and agencies and placements In Phase II Is illustrated In Figure 29-1. The
single child welfare agency whichplaced children out of Nevada in 1978 was a Phase II agency arranging
all nine child welfare placements. Of the eight school districts which made out-of-state placements, one
was a Phase 11 agency which arranged the placements of 12. children (43 percent) outside of Nevada.
Sixty-fcer percent of the placing jvvenlie justice agencies were Phase 11 agencies, and they reported
arranging 88 percent of th local juvenile justice placements made In 1978.
In general, then, the detailed information to be reported on the practices of Phase 11 child welfare
and juvenile justice agencies Is descriptive of the majority of out-of-state placements arranged by those
Nevada local agency types In 1978, and to a somewhat lesser extent this Is true for local education
agencies.
NV-9
152
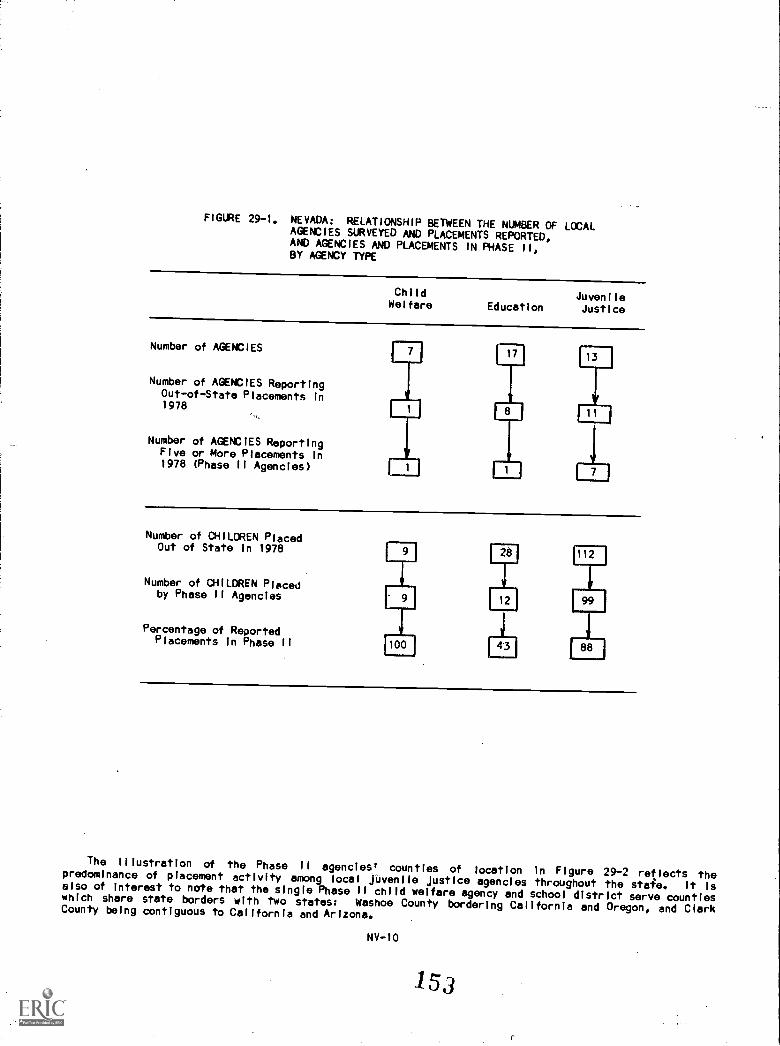
FIGURE 29-1, NEVADA: RELATIONSHIP BETWEEN THE NUMBER OF LCCALAGEKC1ES SURVEYED AND PLACEMENTS REPORTED,AND AGENCIES AND PLACEMENTS IN PHASE II,BY AGENCY TYPE
ChildWelfare
JuvenileEducation Justice
Number of AGENCIES
Number of AGENCIES Reporting
Out-of-State Placements In1978
Number of AGENCIES ReportingFive or More Placements in1978 (Phase II Agencies)
Number ot CHILDREN PlacedOut of State In 1978
Number of CHILDREN Placedby Phase II Agencies
Percentage of ReportedPlacements In Phase II
ri 1,12 1
1.4-1 99 I
1100 I 88 I
The Illustration of the Phase II agencies' counties of location In Figure 29-2 reflects thepredominance of placement activity among local juvenile justice agencies throughout the stafe. It isalso of interest to note that the single Phase II child welfare agency and school district serve countieswhich share state borders with two states: Washoe County bordering California and Oregon, and ClarkCounty being contiguous to California and Arizona.
NV-10
153

FIGURE 29-2. ICVADA: COUNTY LOCATION OF LOCAL PHASE I I AGENCIES
D.
G.
in
F.
County
A. ClarkB. ElkoCl. EurekaC-2. LanderD. HumboldtE. NyeF. PershingG. Washoe
KEY
Child Welfare Phase IIAgency Jurisdiction
Education Phase II AgencyJurisdiction
Juvenile Justice Phase IIAgency Jurisdiction
c-2.
B.
E.
A.

The number of children going to each receiving state was provided by all local Phase II agencies,except for two children which were placed by Phase II Juvenile Justice agencies. Table 29-8 indicatesthat two-thirds of the placements by the only Phase II child welfeve agency went to California. Theremaining three children went to Washington and Oregon.
One-half of the 12 children placed out of Nevada by the local Phase II education agency went to Utah.Five children went to states In the geographic region (Arizona, Washington, and California). Theremaining child was sent to Missouri.
Nevada Phase II Juvenile Justice agenc;es relied heavily upon settings In California to receive theirout-of-state placements. Fifty percent of these children went to that neighboring state. The statereceiving the next largest number of children from local Nevada Juvenile Justice agencies was Utah, whichreceived ten children. The remaining 37 children placed out of state for whom destinations were reportedby these agencies went In small numbers to 17 states located throughout the country.
TABLE 29-8. NEVADA: DESTINATIONS OF C4ILDREN PLACED BYLOCAL PHASE 11 AGENCIES IN 1978
Destinations of ChildrenPlaced Out of State
Number of CHILDREN Placed
ChildWelfare Education Juvenile Justice
Arizona 0 1
Arkansas 0 0 2California 6 2 50Colorado 0 0 6Idaho 0 0 2
Louisiana 0 0 2Massachusetts 0 0 1
Michigan 0 0 1
Missouri 0 1 3New Jersey 0 0 2
-New Mexico 0 0 2Ohio 0 0 1
Oregon 1 0 4Pennsylvania 0 0 1
South Dakota 0 0 1
Tennessee 0 0 4Texas 0 0 2Utah 0 6 10Washington 2 2Wisconsin 0 0 2
Wyoming 0 0 1
Placements for WhichDestinations Could Notbe Reported by Phase IIAgencies 0 0 2
Total Number of Phase IIAgencies
1 1 7
Total Number of Children.-Placed by Phase IIAgencies -- 9 12 99
---
NV-12
155

The Use of settings In states contiguous to Nevada by local Phase 11 agencies Is Illustrated In
Figure 29-3. The use of states contiguous to Nevada forout-of-state placement Is prevalent, with 78
percent of child welfare,.75 percent of education, and 68 percent of juvenile justice placements going to
these states. Sixty-nlne percent of all local Phase 11 agency placements from Nevada went to Its
bordering states, with California receiving 71 percent of these children.
FIGURE 29-3. NEVADA: THE NUMBER OF CHILDREN REPORTEDPLACED IN STATES CONTIGUOUS TO NEVADABY LOCAL PHASE II AGENCIES8
a. Local Phase II child welfare agencies reported destinations for nine children. Local Phase //
education agencies reported destinations for 12 children. The destinations of 97 children were reported
by local Phase II juvenile justice agencies.
Agencies placing more than four children out of state were asked to explain the reasons for these
placements. Their responses are shown in Table 29-9. The single child welfare agency responding gave
several responses, saying children were Placed out of state to live with relatives other than parents, as
a matter of course for children with certain problems, and because Nevada lacked services comparable to
the receiving states. The local education agency placing more than four children out of state also
reported that the placements were made because of a lack of services comparable to those found in the
receiving states.
Most of the juvenile justice agencies reported placing children into other states so that they could
live with relatives other than parents. A majority of responding agencies also said children were placed
because of a lack of comparable services In Nevada, as a standard procedure for some children, because of
unsuccessful placement adjustment In Nevada, and as an alternative to In-state publicly operated
institutions.
NV-13
156

TABLE 29-9. NEVADA: REASONS FOR PLACING CHILDREN OUT OF STATEIN 1978, AS REPORTED BY LOCAL PHASE II AGENCIES
Reasons for Placementa
Number of AGENCIES Reporting
ChIldWelfare Education
JuvenileJustice
Receiving Facility Closer to Child's Home,Despite Being Across State Lines 0 0 0
Previous Success with Receiving Facility 0 0 0
Sending State Lacked Comparable Services 1 1 5
Standard Procedure to Place Certain ChildrenOut of State
1 0 4
Children Failed to Adapt to In-StateFacilities 0 0 4
Alternative to In-State PublicInstitutionalization 0 0 4
To Live with Relatives (Non-Parental)1 0 6
Other 0 0 2
Number of Phase 11 Agencies Reporting 1 1 7
a. Some agencies reported more than one reason for placement.
ThOtme agencies describing the reasons for out-of-state placement also reported the type of settingmost frequently selected to receive children going to other states. The child welfare agency most oftenselected relatives' homes to receive children placed into other states. This response corresponds to thereported reasons for placement. The single responding school district reported sending children mostfrequently to residential treatment or child care facilities. The majority of juvenile justice agencies,Ilke the child welfare agency, most frequently sent children out of state to the homes of relatives otherthan parents. Three agencies, however, said that settings other than with relatives were most oftenused, including residential treatment or child care facilities, psychiatric hospitals, and foster homes.
NV-14
15

TABLE 29-10. NEVADA: MOST FREQUENT CATEGORIES OF RESIDENTIALSETTINGS USED BY LOCAL PHASE II AGENCIES IN 1978
Categories ofResidential Settings
Number of AGENCIES Reporting
ChildWelfare Education
JuvenileJustice
Residential Treatment/Child Care Facility 0 1 1
Psychiatric Hospital 0 0
Boarding/MIlltary School 0 0 0
Foster Home 0 0 1
Group Home 0 0 0
Relative's Home (Non-Parental) 1 0 4
Adoptive Home 0 0 0
Other 0 0 0
Number of Phase II Agencies Reporting 1 I 7
Another type of information provided by local Phase II agencies relates to the type of methods used
to monitor children's progress in out-of-state placement and their frequency of occurrence. The
responding child welfare agency, as shown In Table 29-11, relied upon quarterly written progress reports
and other methods to monitor the progress of children placed In other states. The responding school
district also used quarterly written reports in conjunction with semiannual on-site visits to monitor
children's progress.
The juvenile justice agencies placing more than four children out of Nevada usually relied upon
written reports to monitor these children's progress. Four of the seven agencies indicated use of this
method, three of which receive the reports on a quarterly basis. Four agencies also indicated the use of
monitoring methods at intervals other than those provided for description, Including written reports,
telephone calls, and on-site visits.
TABLE 29-11. NEVADA: MONITORING PRACTICES FOR OUT-OF-STATEPLACEMENTS AS REPORTED BY LOCAL PHASE II
AGEKCIES
Methods of MonitoringFrequency of
Practice
Number of AGENCIESa
ChildWelfare
JuvenileEducation Justice
Written Progress Reports Quarterly 1 1 3
Semiannually 0 0 0
Annually 0 0 0
Otherb 0 0 1
On-Site Visits Quarterly 0 0 0
Semiannually 0 1 0
Annually 0 0 0
Otherb 0 0 2
Telephone Calls Quarterly 0 0 2
Semiannually 0 0 0
Annually 0 0 0
Other° 0 1 1
NV-15
158

TABLE 29-11. (Continued)
Methods of MonitoringFrequency of
Practice
Number of AGENCIESa
ChildWelfare
JuvenileEducation Justice
Other Quarterly 0 0 1
Semiannually 0 0Annually 0 0 0Otherb 1 0 0
Total Number of Phase IIAgencies Reporting
1 1 7
a. Some agencies reported more than one method of monitoring.
b. Included monitoring practices which did not occur at regular Intervals.
The child welfare agency placing more than four children out of Nevada reported that no expenditureswere made for this purpose. The responding school district said that $125,000 In public funds was spenton out-of-state placements, and six Juvenile Justice agencies reported a total expenditure of $420,900for out-of-state placements.
O. Use of Interstate Compacts by State and Local Agencies
The survey of local agencies In Nevada also determined the extent to which interstate compacts wereutilized to arrange out-of-state placements. A review _of Table 29-12 indicates that 13 of the 20agencies which placed children out of state in 1978 reported that none of their placements were arrangedthrough an interstte compact. It should be noted that Nevada is not a member of the interstate Compacton the Placement of Children and the Interstate Compact on Mental Health. Therelore, it is notsurprising to see In Table 29-12 that the single local child welfare agency which placed children out ofstate did not utilize a compact. One school district placing four or less children reported utilizing anInterstate compact and slx Juvenile Justice agencies also reported such use. Of the four Phase IIJuvenile Justice agencies arflong these six, two reported utilizing the Interstate Compact on Juveniles forthe arrangement of their placements In 1978.
TABLE 29-12. NEVADA: UTILIZATION OF INTERSTATE COMPACTSBY LOCAL AGENCIES IN 1978
Local Agencies Which PlacedChildren Out of State
Number of AGENCIES
ChildWelfare Education
JuvenileJustice
NUMBER OF LOCAL AGENCIES PLACINGFOUR OR LESS CHILuHem 0 7
Number Using Compacts -- 1 2
Number Not Using Compacts -- 6 2
Number with Compact UseUnknown -- 0 0
NV-16
15d
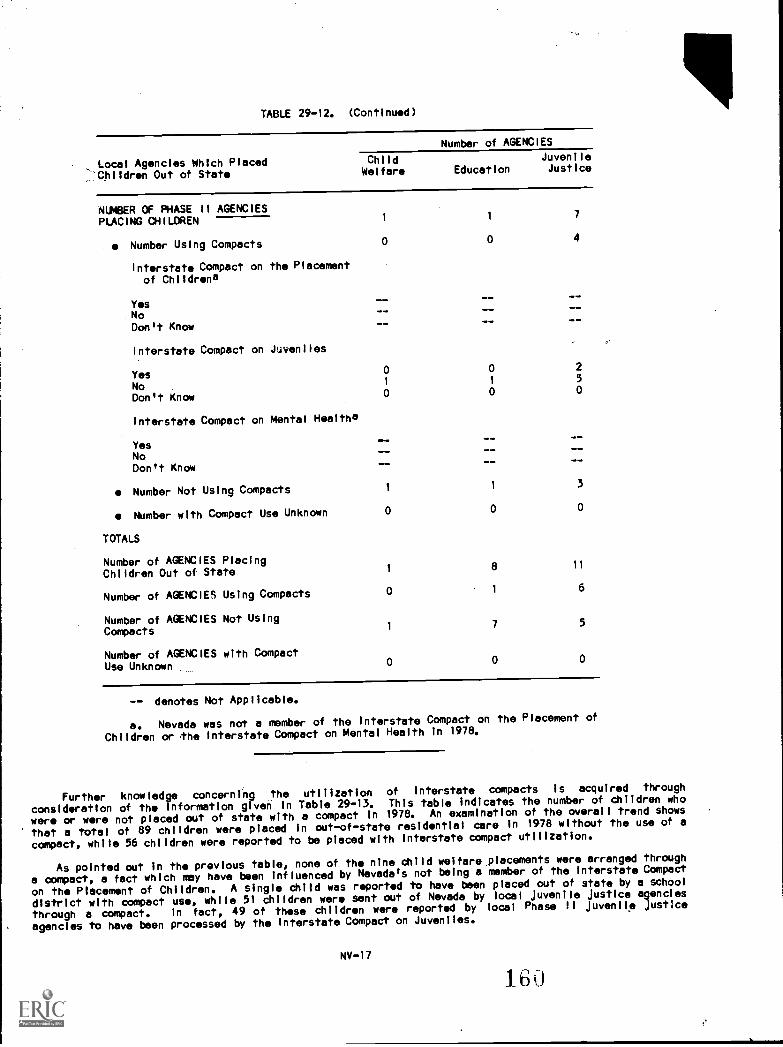
TABLE 29-12. (Continued)
Number of AGENCIES
Local Agencies Which Placed Child Juvenile
Children Out of State Welfare Education Justice
NUMBER OF PHASE 11 AGENCIESPLACING CHILDREN 1 1 7
Number Using Compacts
interstate Compact on the Placementof Childrena
0 0 4
YesNo
m alb
m alb
Don't Knowm alb
Interstate Compact on Juveniles
Yes 0 0 2
No 1 1 5
Don't Know 0 0 0
Interstate Compact on Mental Healtha
YesNo
-alb OW
Don't Know
Number Not Using Compacts 11 3
Number with Compact Use Unknown 0 0 0
TOTALS
Number of AGENCIES PlacingChildren Out of State 1 8 11
Number of AGENCIES Using Compacts 0 1 6
Number of AGENCIES Not UsingCompacts
1 7 5
Number of AGENCIES with CompactUse Unknowm 0 0 0
-- denotes Not Applicable.
a. Nevada was not a member of the Interstate Compact on the Placement of
Children or Vie Interstate Compact on Mental Health In 1978.
Further knowledge concerning the utilization of interstate compacts is acquired through
consideration of the information given In Table 29-13. This table indicates the number of children who
were or were not placed out of state with a compact In 1978. An examination of the overall trend shows
that a total of 89 children were placed in out-of-state residential care In 1478 without the use of a
compact, while 56 children were reported to be placed with Interstate compact utilization.
As pointed out In the previous table, none of the nine child welfare placements were arranged through
a compact, a fact which may have been influenced by Nevada's not being a member of the Interstate Compact
on the Placement of Children. A single child was reported to have been placed out of state by a school
district with compact use, while 5I children were sent out of Nevada by local Juvenile Justice agencies
through a compact. In fact, 49 of these children were reported by local Phase II Juvenile Just:ce
agencies to have been processed by the Interstate Compact on Juveniles.
NV-17
160

TABLE 29-13. NEVADA: NUMBER OF PLACEMENTS AND THEUTILIZATION OF INTERSTATE COMPACTS BYLOCAL AGENCIES IN 1978
Children Placed Out of State
Number of CHILDREN
ChildWelfare Education
JuvenileJustice
CHILDREN PLACED BY AGENCIESREPORTING FOUR OR LESS PLACEMENTS 0 16 13
Number Placed with Compact Use1 2
Number Placed without Compact Use 12 6
Number Placed with ^,ompactUse Unknowna
3 5
CHILDREN PLACED BY PHASE II AGENCIES 9 12 99
Number Placed with Compact Use 0 0 49
Number through Interstate Compacton the Placement of Childrenb
Number through InterstateCompact on Juveniles 0 0 49
Number through InterstateCompact on Mental Healthb
Number Placed without Compact Use 9 12 50
Number Placed with Compact UseUnknown 0
TOTALS
Number of CHILDREN Placed Outof State 9 28 112
Number of CHILDREN Placedwith Compact Use 0 1 51
Number of CHILDREN Placed withoutCoapact Use 9 24 56
Number of CHILDREN Placedwith Compact Use Unknown 0 3 5
-- denotes Not Applicable.
a. Agencies which placed four or less children out of stato report the actual number of compact-arranged placements.agencies simply reported whether or not a compact was used toof-state placement. Therefore, If a compact was used, onlyIndicated as a compact-arranged placement and the others arecategory "number placed with compact use unknown."
te were not askedInstead, these
arrange any out-one placement isIncluded in the
b. Nevada was not a member of the Interstate Compact onChildren or the Interstate Compact on Mental Health In 1978.
NV-18
1 GI
the Placement of

Graphic representations of the information gathered about interstate compact utilization for children
placed out of state In 1978 by local agencies are Illustrated In Figures 29-4, 5, /mid 6. Figure 29-6 Is
of particular interest, showing that of the 112 children reported placed out of state by local Juvenfle
Justice agencies In Nevada, 50 percent were noncompact-arranged placements, 46 percent were compact
arranged, and for 4 percent of the placements compact use was undetermined. Comparative information Is
Illustrated about compact use for Placements arranged by local child welfare and education placements In
Figures 29-4 and 5.
FIGURE 29-4. NEVADA: UTILIZATION OF INTERSTATECOMPACTS BY LOCAL CHILD WELFAREAGENCIES IN 1978
9CHILDREN PLACEDOUT OF STATE BYNEVADA LOCALCHILD WELFAREAGENCIES
04)
100X NONCOMPACT
111.1,
NV-19
1.4110. MINN.
OX COMPACT ARRANGED
dOME, OMMM WOMB=MN MOMM MIMm IMM
Q-CoMPACT N,
4/40
6"7:6.
RA, \\ \\ \\
162

FIGLRE 29-5. NEVADA: UTILIZATION OF INTERSTATECOMPACTS BY LOCAL EDUCATIONAGENCIES IN 1978
28
CHILDREN PLACEDOUT OF STATE BYNEVADA LOCALEDUCATIONAGENCIES
NV-20
.=1.
86% NONCOMPACT
IMMO OM=
4% COMPACT ARRANGED
OWN. MI =MO MOM
IMO= 1111== OWN. NM= MIM =NM
4%11% COMPACT
USEC/4,0
"..
163

FIGURE 29-6. NEVADA: UTILIZATION OF INTERSTATECOMPACTS BY LOCAL JUVENILE JUSTICEAGENCIES IN 1978
112
CHILDREN PLACEDOUT OF STATE BYNEVADA LOCAL
JUVENILE JUSTICEAGENCIES
ammo awl..
50% NONCOMPACT POP44°
ammo. =mow =Pmm..00
46% COMPACT ARRANGED
4% COMpAcruse
41,oe7.4.
N.
RAft4to
Nevada's state agencles reported thelr knowledge of compact use for placements made by their own
agencles as well as their local counterparts, where they existed. The state chlld welfare agencyreported that 58 placements were arranged In 1978 with Interqtate compact use, although Nevada was not a
member of the ICPC. Contrary to local 'school districts' responses In Table 29-13, the state education
agency reported that no out-of-state placements were arranged with the use of a compact. The state
Juvenile Justice agency reported compact utilization for 41 children placed out of Nevada. The three
children reported by the state mental health and mental retardation agency were placed out of state
without being processed by a compact, not an unexpected response considering the state Is neither a
member of the ICPC nor the ICMH.
NV-21
164
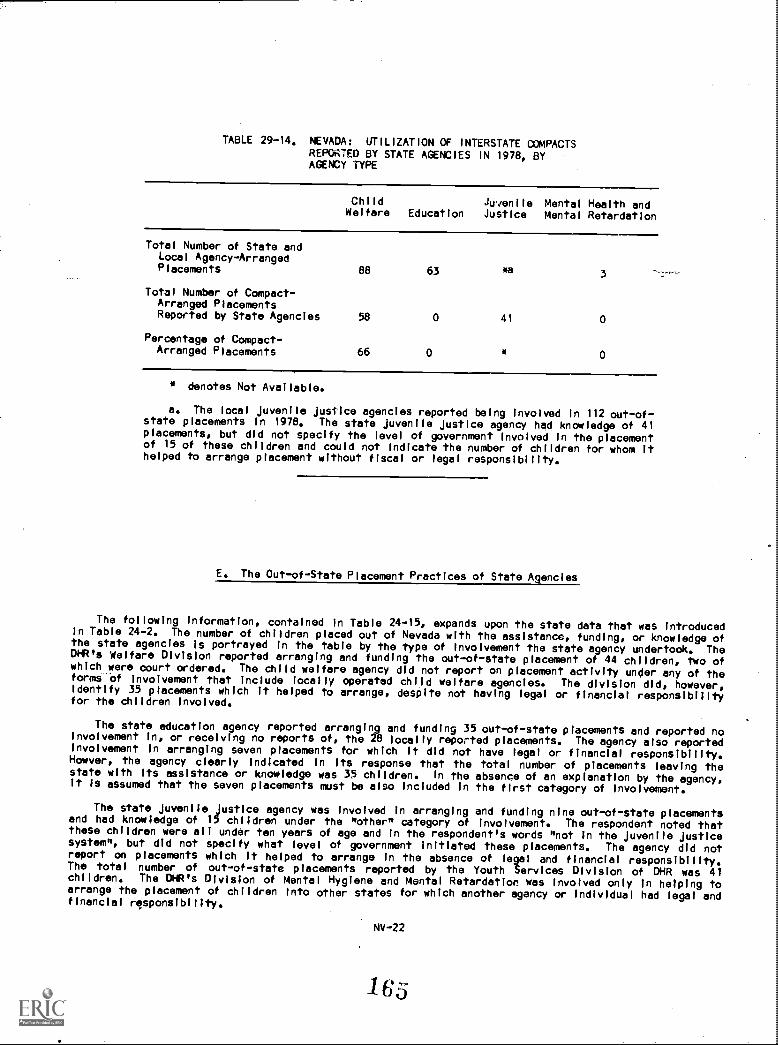
TABLE 29-14. NEVADA: UTILIZATION OF INTERSTATE COMPACTSREPORTED BY STATE AGENCIES IN 1978, BYAGENCY TYPE
ChildWelfare Education
JuvenileJustice
Mental Health andMental Retardation
Total Number of State andLocal Agency-ArrangedPlacements 88 63 *a 3
Total Number of Compact-Arranged PlacementsReported by State Agencies 58 0 41 0
Percentage of Compact-Arranged Placements 66 0 * 0
* denotes Not Available.
a. The local Juvenile Justice agencies reported being involved In 112 out-of-state placements In 1978. The state Juvenile Justice agency had knowledge of 41placements, but did not specify the level of government Involved in the placementof 15 of these children and could not Indicate the number of children for whom Ithelped to arrange placement without fiscal or legal responsibility.
E. The Out-of-State Placement Practices of State Agencies
The following information, contained In Table 24-15, expands upon the state data that was IntroducedIn Table 24-2. The number of children placed out of Nevada with the assistance, funding, or knowledge ofthe state agencies Is portrayed In the table by the type of involvement the state agency undertook. TheDHR's Welfare Division reported arranging and funding the out-of-state placement of 44 children, two ofwhich were court ordered. The child welfare agency did not report on placement activity under any of theforms-of Involvement that include locally operated child welfare agencies. The division did, however,Identify 35 placements which it helped to arrange, desplte not having legal or financial responsibilityfor the children involved.
The state education agency reported arranging and funding 35 out-of-state placements and reported noInvolvement in, or receiving no reports of, the 28 locally reported placements. The agency also reportedinvolvement in arranging seven placements for which it dld not have legal or financial responsibility.Howver, the agency clearly Indicated In its response that the total number of placements leaving thestate with its assistance or knowledge was 35 children. In the absence of an explanation by the agency,it Is assumed that the seven placements must be also included in the first category of Involvement.
The state Juvenlle justice agency was involved In arranging and funding nine out-of-state placementsand had knowledge of 15 children under the *other" category of Involvement. The respondent noted thatthese children were all under ten years of age and In the respondent's words *not In the Juvenile Justicesystem'', but did not specify what level of government Initiated these placements. The agency did notreport on placements which it helped to arrange in the absence of legal and financial responsibility.The total number of out-of-state placements reported by the Youth Services Division of DHR was 41children. The DHR's Division of Mental Hygiene and Mental Retardation was involved only In helping toarrange the placement of children into other states for which another agency or individual had legal andfinancial responsibility.
NV-22
165

TABLE 29-15. NEVADA: ABILITY OF STATE AGENCIES TOREPORT THEIR INVOLVEMENT IN ARRANGINGOUT-OF-STATE PLACEMENTS IN 1978
Types of Involvement
Number of CHILDREN Reported
Placed durIng 1978 by State Agencies
ChildWelfare Education
JuvenileJustice
Mental Health andMental Retardation
State Arranged and Funded 42 35 9 0
Locally Arranged butState Funded 0 0
Court Ordered, but StateArranged and Funded 2 0 0 0
Subtotal; PlacementsInvolving StateFunding- 35 9 0
Locally Arranged andFunded, and Reportedto State 0 0
State Helped Arrange,but Not Required byLaw or Dld Not Fundthe Placement 35 7 3
Other 0 0 15 0
Total Number ofChildren Placed Outof State with StateAssistance orKnowledgea 79 35b 41 3
* denotes Not Available.-- denotes Not Applicable.
a. Includes all out-of-state placements known.to officials In the particular
state agency. In some cases, this figure consists-of placements which did not
directly involve affirmative action by the state agency but may simply Indicate
knowledge of certain out-of-state placements through case conferences or through
various forms of Informal reporting.
b. This column does not total because of double counting of children within
the type of Involvement categories.
The number of children that went to each receiving state was also requested from state agencies
involved In out-of-state placements. The DHR Youth Services Division did not report destinations for the
41 children It reported placing in other states. The DHRIs Welfare Division reported placing 79 children
into 18 states. California was the largest receiver of these Children with 51 percent of the total.
Settings in states throughout tho country were selected to receive Nevada children, including Alaska,
Florida, and Massachusetts. Sixty-seven percent of these child welfare placements went to states
bordering on Nevada. The highest number of children placed Into any particular state, atter California,
was Illinois which received six Children.
The state education agency sent Its largest number of children to Utah, which received 19 children,
or 54 percent, of all those placed out of state by the agency. The DOE used settings in three non-
contiguous states, Kansas, Missouri, and Washington, to receive six Children, and the remaining children
were sent Into states bordering on Nevada. Therefore, over 82 percent of all children placed by the
state education agency went to states contiguous to Nevada. The DHR's Division of Mental Hygiene and
Mental Retardation sent all three of Its out-of-state placements to bordering California.
NV-23
166

TABLE 29-16. NEVADA: DESTINATIONS OF CHILDREN PLACED OUT Of STATEIN 1978 REPORTED BY STATE AGENCIES, BY AGENCYTYPE
Destinations ofChildren Placed
Number of CHILDREN Placed
ChildWelfare Education
JuvenileJustice
Mental Health andMental Retardation
Alaska 2 0 0Arizona 3 0 0Callfornla 40 6 3Florida 2 0 0Idaho 1 4 0
Illinois 6 0 0Kansas 1 1 0Massachusetts 1 0 0MIssouri 1 1 0Montana
1 0 0
Nebraska1 0 0
New Mexlco 2 0 0Oklahoma 1 0 0Oregon 4 0 0Pennsylvania 2 0 0
Texas 3 0 0Utah 5 19 0Washington 3 4 0
Placements for WhichDestinations Could Notbe Reported by StateAgencies 0 0 All 0
Total Number of Placements 79 35 41 3
State agencies, like local agencies, described the children they placed out of state according to aIlst of descriptive characteristics. Table 29-17 indicates that the DHR's Welfare Division placedchildren usually associated with the services provided by an agency of this type, including foster andadopted children and those determined to be battered, abandoned, or neglected. In addition, there werechildren among the 79 placed out of state who were developmentally disabled, emotionally disturbed, andprone to substance abuse.
Recalling the 66 percent rate of compact utilization for this agency shown In Table 29-14, somequestion now develops as to which Interstate compact would have been used. Nowhere In the responsesIllustrated In Table 29-17 Is there indication that the children placed out of Nevada by the childwelfare agency were described as holding a status that Is subject to the Interstate Compact on Juveniles(ICJ). It should also be recalled that Nevada is not a member of the Interstate Compact on the Placementof Children and the Interstate Compact on Mental Health. It Is possible that in the absence ofmembership in either of these compacts the agency places children into other states with the informalhelp of the receiving state's 1CPC office.
The Nevada state education agency selected only two characteristics to describe the 35 children Itreported placed Into other states. These.were the Presence of physical handicaps and children going tofoster homes. The DHR's Youth Services Division placed children into foster settings as well as orincluding those who were adjudicated delinquent, pregnant, or had a history of drug or alcohol problems.
The DHR's Division of Mental Hygiene and Mental Retardation Indicated that only mentally handicappedchildren were placed out of Nevada In 1978.
NV-24
167

TABLE 29-17, NEVADA: CONDITIONS OF CHILDREN PLACED OUT OF
STATE IN 1978, AS REPORTED BY STATE AGENCIES,
BY AGENCY TYPE
Types of Conditions
Agency Typea
ChildWelfare Education
JuvenileJustice
Mental Health andMental Retardation
Physically Handicapped 0 x o o
Mentally Handicapped 0 o o x
Developmentally Disabled X o o o
Unruly/Disruptive 0 o o o
Truants 0 o o o
Juvenile Delinquents 0 o x o
Emotionally Disturbed X o o o
Pregnant 0 x o
Drug/Alcohol Problems X o x o
Battered, Abandoned, orNeglected X o o o
Adopted Children X o o o
Foster Children X x x o
Other 0 o o o
a. X indicates conditions reported.
Two types of settings were most frequently selected' to.receive children placed by these state
agencies. The state child welfare and Juvenile Justice agencies most frequently placed children with
relatives. The state education agency DHRIs Division of Mental Hygiene and the Mental Retardation
Division described residential treatment or child care facilities as the setting of choice for children
they placed out of Nevada.
Expenditure Information, Included In Table 29-18, was not reported by the DHRIs Youth Services and
Mental Hygiene and Mental Retardation divisions. The state education agency reported spending $181,000
In state funds. The DHRIs Welfare Division spent a total of $330,111 for out-of-state placements, which
was shared among state, federal, and local governments in the proportions of 44, 44 and 12 percent,
respectively.
NV-25
168

TABLE 29-18. NEVADA: PUBLIC EXPENDITURES FOR OUT-OF-STATEPLACEMENTS IN 1978, AS REPORTED BY STATEAGENCIES
Expenditures, by AGENCY Type
Levels of GovernmentChildWelfare
JuvenileEducation Justice Mental Retardation
State $144,050 $187,000
Federal 144,050 0
Local 42,011 0
Other 0 0
Total Reported Expenditures $330,111 $187,000
* denotes Not Available.
F. State Agencies' Knowledge of Out-of-State Placements
Services for children are operated by both state and local governments in Nevada, with a fewIndependent local child welfare agencies, and the local Juverille Justice agencies and loNsi schooldistricts still being under state agency supervision. Table 29-19 reflects these state agenciwsl overallknowledge of out-of-state placement activity within the state. Ninety percent of the out-of-stateplacements determined to be made by child welfare agencies were known to the state-level agency. InTable 29-15 it was secn that this agency could not report the number of placements made by the localagencies. The state education agency did respond about placement activity for local school districts bysaying none occurred, and therefore If appears that the locally reported placements included in Table29-19 were not known to the state agency.
The 41 children known by theweiate Juvenile Justice agency to have been placed out of state in 1978Is a substantially smaller numbeW of placements than the 112 children reported by the local agencies.Nine of the 41 placements were state arranged and funded, as was seen In Table 29-15, but stateInvolvement in the remaining placements was not clear.
Finally, the state mental'health and mental retardation agency reported three children were known tohave been pieced outside of Nevada In 1978, not necessarlly with the use of state funds.
NV-26
1 69
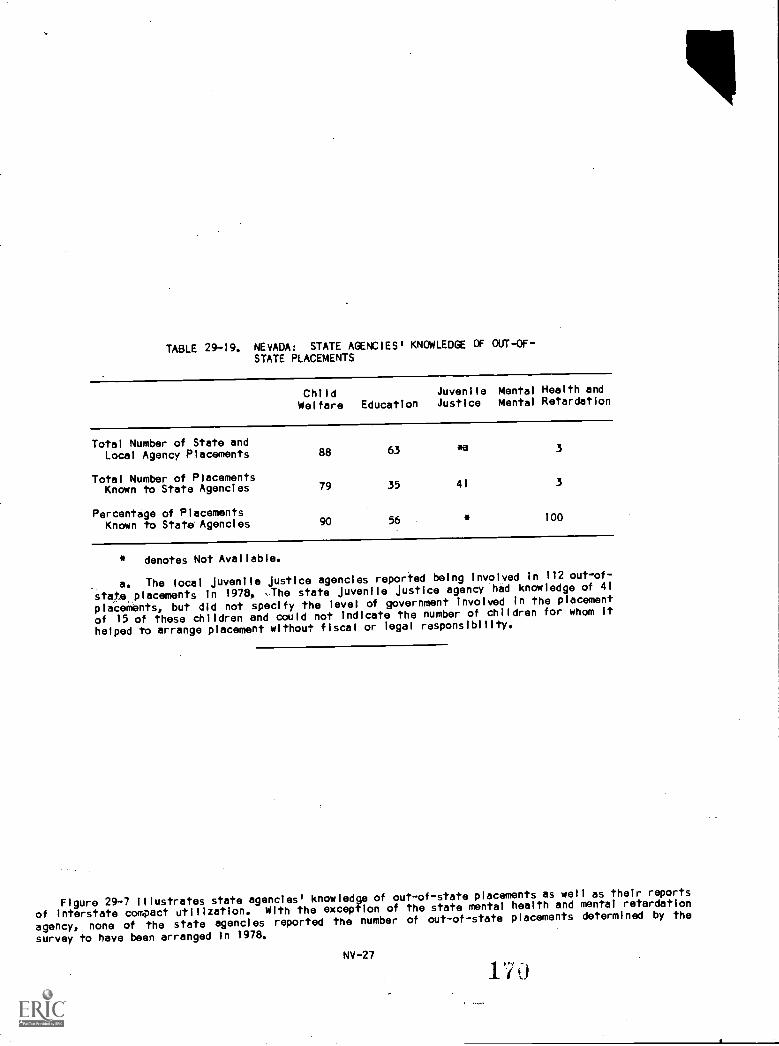
TABLE 29-19. NEVADA: STATE AGENCIES' KNOWLEDGE OF OUT -OF -
STATE PLACEMENTS
ChildWelfare Education
JuvenileJustice
Mental Health andMental Retardation
Total Number of State andLocal Agency Placements 88 63 *a 3
Total Number of PlacementsKnown to State Agencies 79 35 41 3
Percentage of PlacementsKnown to State Agencies 90 56 * 100
* denotes Not Available.
a. The local juvenile justice agencies reported being involved in 112 out-of-
state placements in 1978, ,The state juvenile justice agency had knowledge of 41,
placements, but did not specify the level of government Involved in the placement
of 15 of these children and could notIndicate the number of children for whom It
helped to arrange placement without fiscal or legal responsibility.
Flgure 29-7 illustrates state agencies' knowledge of out-of-state placements as well as their reports
of Interstate compact utilization. With the exception of the state mental health and mental retardation
agency, none of the state agencies reported the number of out-of-state placements determlned by the
survey to have been arranged In 1978.
NV-27
1 70

160
140
120
100
80
60
40
20
0
FIGURE 29-7. NEVEDA: THE TOTAL NUMBER OF STATE AND LOCALPLACEMENTS AND USE OF COMPACTS, AS REPORTEDBY STATE AGENCIES, BY AGENCY TYPE
INN
Child Welfare Education JuvenllaJustice
Mental Health andMental Retardation
State and Local Placements
State and Local Placements Known to State Agencies
State and Local Compact-Arranged Placements Reported by State Agencies
a. Only indicates the 112 children reported to be placed out of state by localagencies and nine placements arranged and funded by the state agency.
uvenlle Justice
Equally as interesting is the state child welfare agency's report of significant interstate compactuse despite Nevada not being a member state of the Interstate Compact on the Placement of Children. Thestate Juvenile Justice agency, which does administer the Interstate Compact on Juveniles, did notIdentify as many compact-arranged placements as the local agencies reported (at least 51 children),especially considering that nine of the 41 compact-processed placements were definitely state arranged.
V. CONCLUDING REMARKS
Some noteworthy themes emerge from the preceding findings from the survey of Nevada state and localagencies.
The Nevada local Juvenile Justice agencies are the most active agencies in the state Inplacing children across state lines. They usually undertook this activity alone In :978 andutilized Interstate compacts for about one-half of the children placed out of state.
These same Juvenile Justice agencies are Involved with a wide variety of children's problemsand, as a group, are somewhat more likely to place unruly/disruptive children out ofNevada.
NV-28
local public agencies placing children out of Nevada most frequently reported placing these
children because of a lack of services In Nevada comparable to those in other states.
The most active state agency In placing children out of Nevada In 1978 was the DHR's Welfare
Division, which does not have the Interstate Compact on the Placement of Children or the
interstate Compact on Mental Health at its disposal to process its placements into other
states. However, unlike the local placing child welfare agencies, this state agency reported
a high utilization of an Interstate compact for the arrangement of placements out of Nevada.
The reader Is encouraged to compare national trends described In Chapter 2 with the findings which
relate to specific practices In Nevada In order to develop further conclusions about the state's
involvement with the out-of-state placement of children.

FOOTNOTE
I. General information about states, counties, citi,l, and SMSAs Is from the special 1975 populationestimates based on the 1970 nationalcensus contained in the U.S. Bureau of the Census, County and CityData Bock, 1977 (A Statistical
Abstract Supplement), Washington, D.C., 1978.1771550113W about direct OrensT-Ttate and local total per capita expenditures and expenditures foreducation and public welfare were also taken from data collected by the U.S. Bureau of the Census andthey appear In Statistical Abs+ract of the United States: 1979 (100th Edition), Washington, D.C.,1979.
The 1978 estimated popul:tion of persons eight to 17 years old was developed by the National Centerfor Juvenile Justice using NO sources: the 1970 national census and the National Cancer Institute 1975estimated aggregate census, also prepared by the U.S. Bureau of the Census.
NV-30
173

A PROFILE OF OUT-OF-STATE PLACEMENT POLICY AND PRACTICE IN OREGON
I. ACKNOWLEDGMENTS
The Academy gratefully acknowledges the assistance of the many state and local publiC officials who
contributed their time and effort to the project, particularly Robert Klerk, Coordinator for Handicapped
Children, Division of Special Education, Department of Education; La Rive Hartford, Compact
Correspondent, Children's Services Division, Department of Human Resources; and Davis Isom,
Administrative Assistant, Mental HealthDivision, Department of Human Resources.
II. METHODOLOGY
Information was systematicallygathered about Oregon from a variety of sources using a number of data
collection techniques. First, a search hor relevantstate statutes and case law was undertaken. Next,
telephone interviews were conducted with state officials who were able to report on agency policies and
practices with regard to the out-of-state placement of children. A mall survey was used, as a follow-up
to the telephone interview, to solicit informationspecific to the out-of-state
placement practices of
state agencies and those of local agencies subject to state regulatory control or supervisory oversight.
An assessment of out-of-state placement policies and -the-adequacy ofinformation reported by state
agencies suggested further survey requirements to determine the involvement of public agencies In
arranging out-of-state placements.Pursuant to this assessment, further data collection was undertaken If
it was necessary to:
verify.out-of-state placementdata reported by state government
about local agencies; and
collect local agency data which was not available from state government.
A summary of the data collection effort In Oregon appears below In Table 38-1,
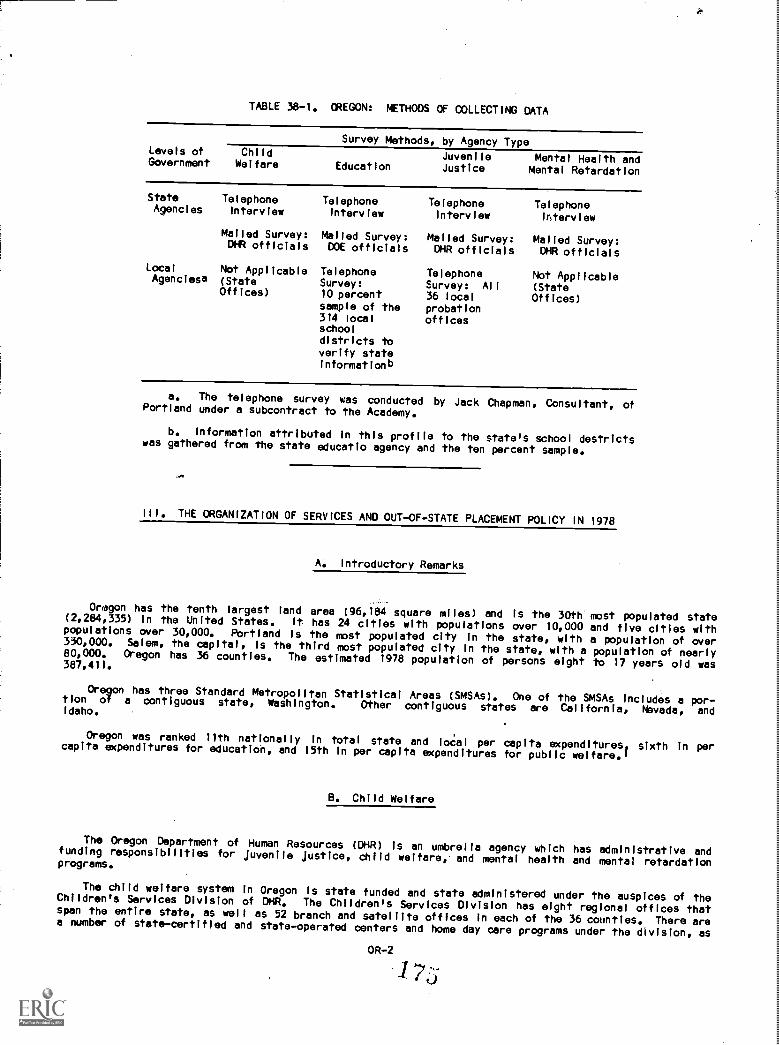
TABLE 38-1. CREGON: METHODS OF COLLECTING DATA
Levels ofGovernment
Survey Methods, by Agency Type
Juvenile Mental Health andJustice Mental Retardation
ChildWelfare Education
State TelephoneAgencies interview
LocalAgenciesa
Mailed Survey:DHR officials
Not Applicable(StateOffices)
TelephoneInterview
Mailed Survey:DOE officials
TelephoneSurvey:10 percentsample of the314 localschool
districts toverify stateinformation',
TelephoneInterview
Mailed Survey:DHR officials
TelephoneSurvey: All36 localprobationoffices
TelephoneInterview
Mailed Survey:DHR officials
Not Applicable(StateOffices)
a. The telephone survey was conducted by Jack Chapman, Consultant, ofPortland under a subcontract to the Academy.
b. Information attributed In this profile to the state's school destrictswas gathered from the state educatio agency and the ten percent sample.
III. THE ORGANIZATION OF SERVICES AND OUT-OF-STATE PLACEMENT POLICY IN 1978
A. Introductory Remarks
Oregon has the tenth largest land area (96,184 square miles)(2,284,335) in the United States. It has 24 cities with populatpopulations over 30,000. Portland Is the most populated city in330,000. Salem, the capital, is the third most populated city in80,000. Oregon has 36 counties. The estimated 1978 population387,411.
Oregon has three Standard Metropolitantion of a contiguous state, WashingtonIdaho.
Oregon was ranked 11th natjonally incapita expenditures for educatioh, and 15th
and Is the 30th most populated stateions over 10,000 and five cities withthe state, with a population of overthe state, with a population of nearlyof persons eight to 17 years old was
Statistical Areas (SMSAs). One ofOther contiguous states are
the SMSAs Includes a por-California, Nevada, and
total state and local per capita expenditures, sixth in perIn per capita expenditures for public welfare.'
B. Child Welfare
The Oregon Department of Human Resources (DHR) is an umbrella agency which has administrative andfunding responsibilities for Juvenile Justice, child welfare, and mental health and mental retardationprograms.
The child welfare system in Oregon is state funded and state administered under the auspices of theChildren's Services Division of °HR. The Children's Services Division has eight regional offices thatspan the entire state, as well as 52 branch and satellite offices In each of the 36 counties. There area number of state-certified and state-operatedcenters and home day care programs under the division, as
OR-2

aswell as approximately 3,000 certified foster faMily homes. Residential and group foster care Is
purchased from about 100 licensed providers. Both adoption and foster care services are provided through
the branch offices.
The Children's Services Division also works closely with the juvenile offices of the county courts
and the other divisions within the Department of Human Resources In arranging out-of-state placements for
children. It was reported that the Children's Services Division also participates In the arrangement of
placements for school districts as well as for the Mental Health Division within the DHR.
Oregon is a member of all three compacts affecting interstate placements,of children, two of which
are administered by the Children's Services Division of DHR: the Interstate-Compact on the Placement of
Children (ICPC) and the Interstate Compact on Juveniles (ICJ). Oregon has 1540n-a member of these compacts
since 1975 and 1959, respectively. Out-of-state placements are reported to be made pursuant to the
provisions of these two compacts.
C. Education
Oregon's 314 public school districts provide special education services and normal curriculum for
grades K-12.
The Division of Special Education within the Oregon Department of Education administers and helps
fund programs for handicapped children In the state. However, according to,state sources, no Department
of Education funds are spent on out-of-state placements. The educational component of out-of-state
placements are paid for by the placing agency, typically the Children's Services Divison of DHR.
It was also reported that neither theDepartment of Education nor the 314 public school districts
place children out of state because of the lack of state funds, the prohibitive costs of such placements,
and because of the excellent programs available In the state.
D. Juvenile Justice
Jurisdiction over dependent, neglected, and delinquent children and youth Is held by circuit courts
In Oregon, except for six counties where there are county courts. Some of the larger counties have
family or juvenile divisions of the designated court. Courts are responsible for juvenile probation
services. Juvenile probation offices are attached to each of the 36 county-administered courthouses In
Oregon, while juvenile parole Is the responsibility of theChildren's Services Division at the state
level.
Adjudicated delinquents are committed to the Juvenile Corrections Services unit within the OHR'
Children's Services Division. The unit maintains two training schools and four camps. Parole services
administered by this agency has 45 parole officers.
Out-of-state placements arranged by the local courts are often closely coordinated with the DHR's
Children's Service Division which administers both the ICJ and the ICP,
E. Mental Health and Mental Retardation
The Department of HOman Resources' Mental Health Division Is responsible for all mental health and
mental retardation services in Oregon. There are no mental health/mental retardation agencies operated
by local government In Oregon. The division provides treatment services at state or licensed facilities
for emotionally disturbed children. It also maintains programs for the mentally retarded and substance
abusers, and administers the Interstate Compact on Mental Health (ICMH). Oregon has been a member of the
compact since 1957.
The Mental Health Division reports that it does not place children out of state, referring all
placements of mentally ill or handicapped children to the Children's Services Division within the DHR.
OR-3
176

IV. FINDINGS FROM A SURVEY OF OUT-OF-STATE PLACEMENT PRACTICES IN 1978
This section of the Oregon state profile presents the results of the survey of the 1978 out-of-stateplacement practices of state and local agencies.
A. The Number of Children Placed in Out-of-State Residential Settings
Before going into the more specific findings, an overview of the out-ofsstate placement activitydiscovered among state and local agencies is given In Table 38-2. It should be mentioned again that theChildren's Services Division In DHR Is the single public provider of child welfare services within Oregonand administers both the interstate Compact on the Placement of Children and the Interstate Compact onJuveniles. This division, therefore, was approached for both information on the placement of childrenfrom the" child welfare service portion of DIHR as well as the Juvenile Justice placement activity, andTable 38-2 is constructed to represent this comb!ned survey response. However, the division could onlyreply to the survey with specific placement information stemming from its administration of theinterstate Compact on the Placement of Children. A state Juvenile Justice response was unavailable.Furthermore, the 99 reported placements were not specifically identified as being state or locallyarranged. The reported placements, therefore, have been excluded from Table 38-2, causing anunderrepresentation of the total number of placements.
The only other public agency placement activity reported in Oregon was by local Juvenile Justiceagencies. The 115 children placed out of state by the probation agencies in 1978 make up the largestportion of placements reported in Oregon. The state and local education agencies and DHR's Mental HealthDivision reported no placement activity in 1978.. This finding is consistent with the fundingrestrictions and placement policies of these agencies, as noted In section
OR-4
177

TABLE 38-2. OREGON: NUMBER OF OUT-OF-STATE PLACEMENTSARRANGED BY STATE AND LOCAL PUBLIC AGENCIESIN 1978, BY AGENCY TYPE
Number of CHILDREN, by Agency Type
Levels of Child Welfare/ Juvenile Mental Health and
Government Juvenlle Justice Education Justice Mental Retardation Total
State AgencyPlacemento
*b 0 -_c 0 0
Local AgencyPlacements
--d 0 115 115
Total* 0 115 0 115
* denotes Not Avallable.-- denotes Not Applicable.
a. May Include placements which the state agency arranged and funded independently
or under a court order, arranged but dld not fund, helped arrange, and others
directly involving the state agency's assistance or knowledge. Refer to Table 38-14
for specific information regarding state agency involvement in arranging out-of-
state placements.
b. The DHR's Children's Services Division reported 99 children placed out of atate
through the interstate Compact on the Placement of Children which were state funded, but
could not report upon the juvenile Justice placements arranged by the state.
c. The DHR's Children's Services Division was contacted for this information and
that state agency's response Is displayed in the first column of thls table.
d. There are no child welfare services operated by local government In Oregon.
Other service types with locally operated services are displayed in thelr appropriate
column.
Table 38-3 Illustrates the number of placements made by the local Oregon probation agencies In 1978,
by county of jurisdiction and county Juvenlle population. It is apparent that four of the most populated
counties, MUltnomah, Washington, Clackamas, and Douglas are those with the highest number of out-of-state
placements. The second most populated county in Oregon, Lane County, which contains the City of Eugene
and Is an SMSA, reported no out-of-state placements In 1978. The heavily populated northwest section of
Oregon consists of .12 countles, In which nine county juvenlle justice agencies reported placements and
which, in total, reported 72 percent of all the local Juvenile justice placements.
It Is also Important to reallze that the county with the largest number of out-of-state placements,
Multnomah, Is located on Oregon's Washington border and Is part of the Portland SMSA. Additionally, it
can be observed In Table 38-3 that placement activity also exists among the smaller Oregon counties. Of
particular interest Is Malheur County, which reported approximately ten children sent out of state.
Malheur County borders Idaho and Nevada.
CR-5
178

TABLE 38-3. OREGON: 1978 YOUTH POPULATIONS AND THE NUMBEROF OUT-OF-STATE PLACEMENTS ARRANGED BY LOCALAGENCIES IN 19780 BY COUNTY AND AGENCY TYPESREPORTING PLACEMENTS
County Name
1978
Populationa(Age 8-17)
Number of CHILDRENPlaced during 1978
Juvenile Justice
Baker 2,898 3Benton 8,741 3Clackamas 38,484 12Clatsop 4,550 0Columbia 6,182 2
Coos 10,592 0Crook 2,005 0Curry 2,554 0Deschutes 7,118 0Douglas 15,796 12
Gilliam 390 0Grant 1,276 0Harney 1,293 2Hood River 2,535 0JacksOn 18,939 2
Jefferson 2,157 0Josephine 7,682 3Klamath 9,949 3Lake 1,108 0Lane 41,321 0
Lincoln 4,120 5Linn 14,900
1
Malheur 4,568 10 estMarion 28,719 7 estMorrow 953 0
Multnomah 78,945 25Polk 6,560 0Sherman 310 0Tillamook 3,174 0Umatilla 8,103 2
Union 3,658 3Wallowa 1,144 0Wasco 3,330 4Washington 34,802 15Wheeler 324 0
Yamhill 8,231 1
Total Number ofPlacements Arrangedby Local Agencies(total may Includeduplicate count) 115 est
Total Number of LocalAgencles Reporting 36
ta. Estimates were developed by the National Center of Juvenile Justiceusing data from two sources: the 1970 national census and the National CancerInstitute 1975 estimated aggregate census.
OR-6
1 73

B. The Out-of-State PlacementPractices of Local Agencies
All of Oregon's local agencies participated in the survey and were able to report about their
involvement In the out-of-state placement of children. As reflected In Table 38-4, none of the 314 local
school districts placed any children out of state. Nineteen of the 36 juvenile justice agencies reported
some placement activity In 1978.
TABLE 38-4. OREGON: THE INVOLVEMENT OF LOCAL PUBLIC AGENCIES
IN ARRANGING OUT-OF-STATE PLACEMENTS IN 1978
Response Categories
Number of AGENCIES, by Agency Type
Education Juvenile Justice
Agencies Which Reported Out-of-State
Placements0 19
Agencies Which Did Not Know If They Placed,
or Placed but Could Not Report the
Number of Children0 0
Agencies Which Dld Not Place Out of State 314 17
Agencies Which Did Not Participate In the
Survey0 0
Total Local Agencies314 36
All 314 Oregon school districts and
children out of state In 1978 were asked
displayed in Table 38-5. Over 90 percent
lacked appropriate funds for such activity.
sufficient services available within the
restricted, one of which stated specificall
policy.
17 local probation offices which reported not placing any
to give reasons for this abstention. Their responses are
of the responses from the school districts stated that they
A significantly smaller eight percent stated that there were
state. Two school districts also reported that they were
y in the nother response that it was against the district's
The local juvenile justice agencies not placing children out of state in 1978 stated that they had
sufficient services In Oregon or that they lacked funds for out-of-state placements. One probation
agency stated that it was against agency policy to place a child out of Oregon.
OR-7
180

TABLE 38-5. OREGON: REASONS REPORTED BY LOCAL PUBLICAGENCIES FOR NOT ARRANGING OUT-OF-STATEPLACEMENTS IN 1978
Number of Local AGENCIES,Reasons tor Not Placingby Reported Reason(s)
Children Out of StateaEducation Juvenile Justice
Lacked Statutory Authority0 0
Restrictedb1 0
Lacked Funds286 7
Sufficient Services Available In State 24 8Otherc
11 3
Number of Agencies Reporting No Out-of-State Placements
314 17
Total Number of Agencies Represented InSurvey
314 36
a. Some agencies reported more than one reason for not arranging out-of-state placements.
b. Generally included restrictions based on agency policy, executive order,compliance with certain federal and state guidelines, and specific court orders.c. Generally Included such reasons as out-of-state placements were againstoverall agency policy, were disapproved by parents, involved too much red tape,and were prohibitive because of distance. --,
The possible Involvement of several public agencies in the placement of a child results in variousdegrees of Interagency cooperation. Over 74 percent of the Oregon local probation Agencies reportinginvolvement in out-of-state placements indicated, as seen In Table 38-6, that at least one other agencycooperated In their placement decisions. However, cooperation with another agency was only reported tohave occurred for 56 percent of the placements made by the juvenile justice agencies.
OR-8
1Si
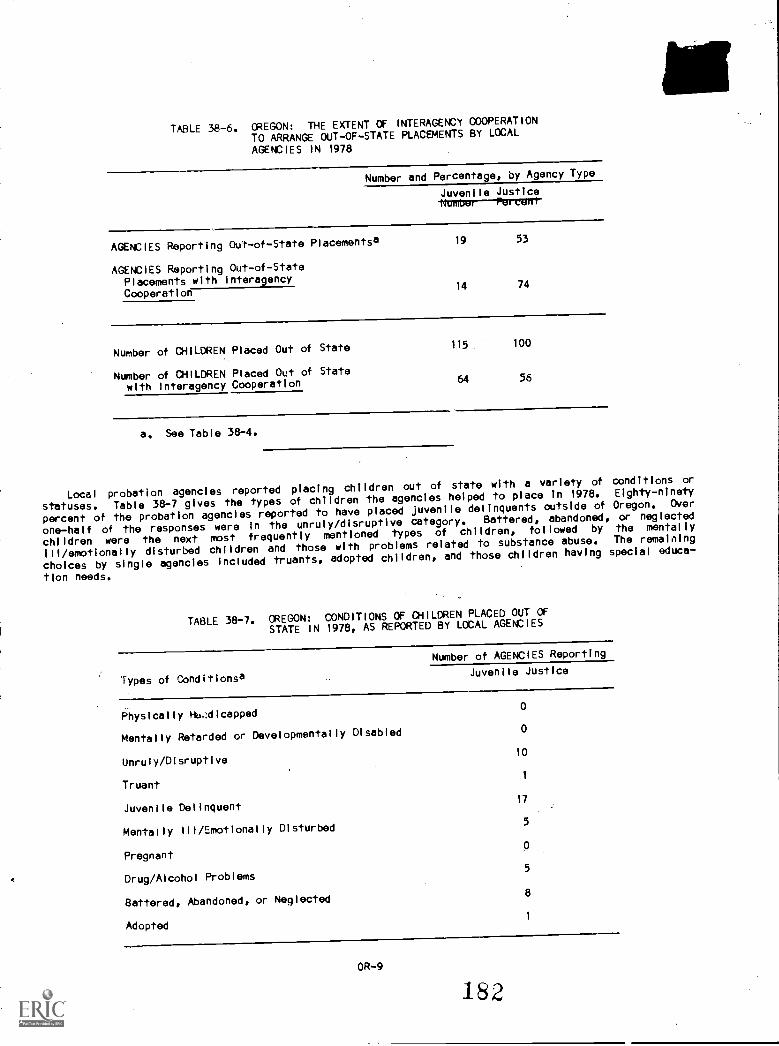
TABLE 38-6. OREGON: THE EXTENT OF INTERAGENCY COOPERATION
TO ARRANGE OUT-OF-STATE PLACEMENTS BY LOCAL
AGENCIES IN 1978
Number and Percentage, by Agency Type
Juvenile JusticeNumtrey--Portirrl-
AGENCIES Reporting Out-of-State Placementsa 19 53
AGENCIES Reporting Out-of-StatePlacements with interagencyCooperation
14 74
Number of CHILDREN Placed Out of State 115_ 100
Number of CHILDREN Placed Out of State
'with interagency Cooperation64 56
a. See Table 38-4.
Local probation agencies reported placing children out of state with a variety of conditions or
statuses. Table 38-7 gives the types of children the agencies helped to place In 1978. Eighty-ninety
percent of the probation agencies reported to have placed juvenile delinquents oUtside of Oregon. Over
one-half of the responses were In the unruly/disruptive category. Battered, abandoned, or neglected
children were the next most frequently mentioned types of children, followed by the mentally
ill/emotionally disturbed children and those with problems related to substance abuse. The remalnIng
choices by single agencies Included truants, adopted children, and those children having speclal educa-
tion needs.
TABLE 38-7. OREGON: CONDITIONS OF CHILDREN PLACED OUT OF
STATE IN 1978, AS REPORTED BY LOCAL AGENCIES
Types of Conditionsa
Number of AGENCIES Reporting
Juvenile Justice
Physically HidAlcapped0
Mentally Retarded or Developmentally Disabled 0
Unruly/Disruptive10
Truant1
Juvenile Delinquent17
Mentally III/Emotionally Dlsturbed5
Pregnant0
Drug/Alcohol Problems5
Battered, Abandoned, or Neglected8
Adopted1
OR-9
182

TABLE 33-7. (Continued)
Number of AGENCIES ReportingTypes of Cond'?tonsa
Juvenile Justice
Special Education Needs
Multiple Handicaps0
Other0
Number of Agencies Reporting19
a. Sumo agencies reported more than one type of condition.
C. Detailed Data from Phase 11 Agencies
If more than fourout-of-state placements were reported by a local agency, additional information wasrequested. The agencies from which the second phase of data was requested became known as Phase IIagencies. The responses to the additional questions are reviewed In this section of Oregon's stateprofile. Wherever references are made to Phase 11 agencies, they are intended to reflect those localjuvenile justice agencies which reported arranging five or more out-of-state placements In 1978, withthe exception of one agency which met this criterion. The Malheur County court, which reported making anestimated ten out-of-state placements, is not represented In most of the Phase II tables.
The relationship between the number, of local Oregon agencies surveyed and the total number ofchildren placed out of state, and agencies and placements In Phase 11 is illustrated In Figure 38-1.Seven of the 19 placing probation agencies were Phase II agencies, Including the Malheur County juvenilejustice agency. Therefore, 37 percent of the local placing agencies reportedarranging out-of-state pla-cements for 75 percent of the children reported sent out of Oregon in 1978 by iocal agencies. Clearly,the detailed information to be reported on the practices .of Phase 11 agencies is descriptive of themajority of out-of-state
placements arranged by Oregon local probation agencies in 1978, even withoutinformation from one of these agencies.
CR -10
183
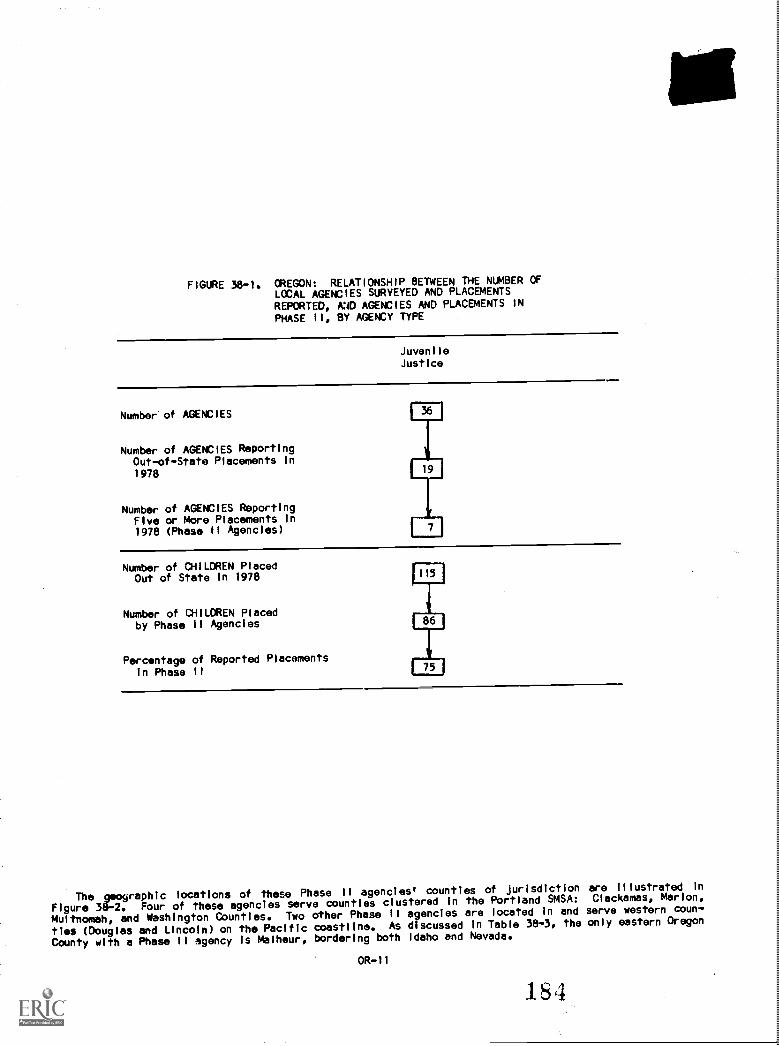
FIGURE 38-1. OREGON: RELATIONSHIP BETWEEN THE NUMBER OFLCCAL AGENCIES SURVEYED AND PLACEMENTSREPORTED, AUD AGENCIES AND PLACEMENTS INPHASE II, BY AGENCY TYPE
JuvenlleJustice
Number of AGENCIES
Number of AGENCIES ReportingOut-of-State Placements In1978
Number of AGENCIES ReportingFive or More Placements In1978 (Phase 11 Agencles)
Number of CHILDREN PlacedOut of State in 1978
Number of CHILDREN Placedby Phase II Agencies
Percentage of Reported PlacementsIn Phase 11
The geographic locations of these Phase II agencies' countles of Jurisdiction are Illustrated in
Figure 38-2. Four of these agencies serve counties clustered In the Portland SMSA: Clackamas, Marlon.
Multnomah, and Washington Countles. Two other Phase II agencles are located In and serve western coun-
ties (Douglas and Lincoln) on the Pacific coastline. As discussed In Table 38-3, the only eastern Oregon
County with a Phase II agency Is Malheur-, bordering both Idaho and Nevada.
OR-11
184

KEY
III1Juvenile Justice Phase I/Agency Jurisdiction
A. ClackamasB. DouglasC. LincolnD. MalheurE. MarionF. MultromahG. Washington
53
8

Table 38-8 identifies the destinations of the children reported by six Oregon Phase II local Juvenile
justice agencies. Forty-two of the 76 placement destinations were not available. California received
the largest'number of Oregon children into residential settings In 1978. Washington, receiving eight
children, was the next most commonly utilized state for placement In the reporting year. These two
states, along with the receiving states of Colorado, Idaho, and Utah, are In the general geographic
region surrounding Oregon. The single placements to Alaska, Minnesota, New Jersey, and Texas were at a
greater distance from Oregon. However, almost 80 percent of the agencies' placements, for which destina-
tions +mire reported, were made to contiguous states of Oregon, as shown in Figure 38-3.
TABLE 38-8. OREGON: DESTINATIONS OF CHILDREN PLACED BYLOCAL PHASE II AGENCIES IN 1978
Destinations of ChildrenPlaced Out of State
Number of CHILDREN Placed
Juvenile Justice
Alaska1
California17
Colorado1
Idaho2
Minnesota1
New Jersey1
Texas1
Utah2
Washington8
Placements for Which Destinations Could Not be
Reported by Phase 11 Agencies42
Total Number of Phase II Agencies6
Total Number of Children Placed by Phase II
Agencies76
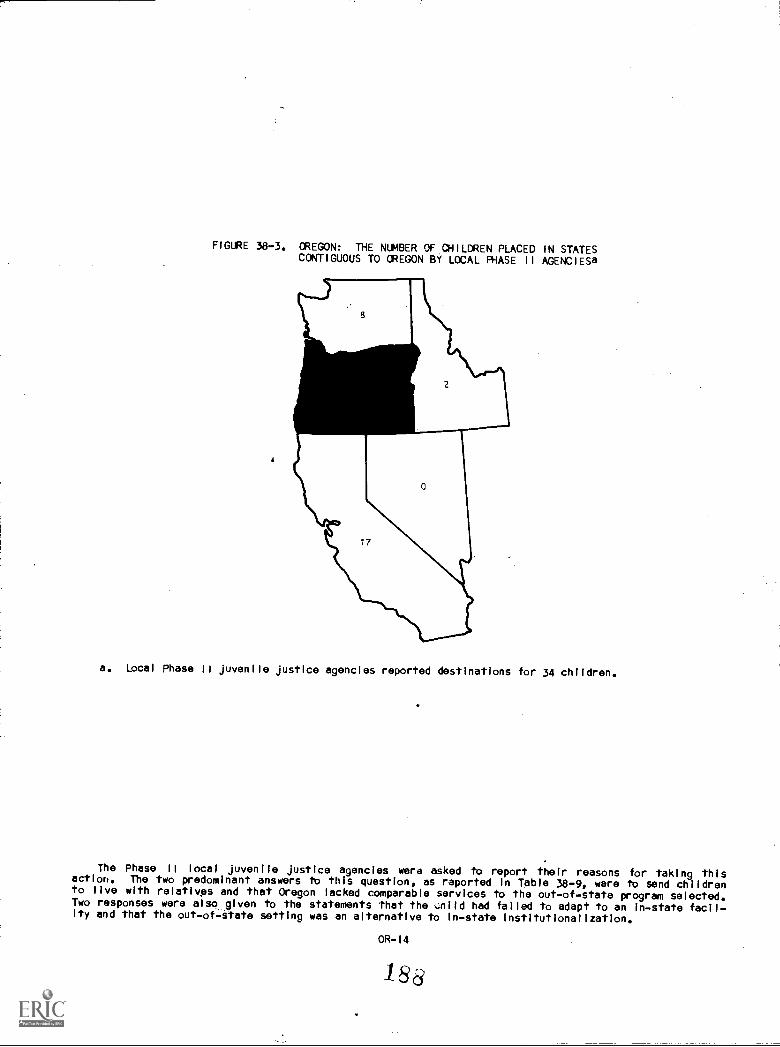
FIGURE 38-3. CREGON: THE NUMBER OF CHILDREN PLACED IN STATESCCNT1GUOUS TO CREGON BY LOCAL PHASE II AGENCIEsa
a. Local Phase 11 Juvenile Justice agencies reported destinations for 34 children.
The Phase II local Juvenile Justice agencies were asked to report their reasons for taking thisactiotl. The two predominant answers to thls question, as reported In Table 38-9, ware to send childrento live with relatives and that Oregon lacked comparable services to the out-of-state program selected.Two responses were also,given to the statements that the Alld had failed to adapt to an in-state facil-ity and that the out-of-State setting was an alternative to in-state Institutionalization.
OR-14
18d

TABLE 38-9. OREGON: REASONS FOR PLACING CHILDREN OUT OF
STATE IN 1978, AS REPORTED BY LOCAL PHASE II
AGENCIES
Number of AGENCIES Reporting
Reasons for Placementa Juvenile Justice
Receiving Facility Closer to Child's Home,Despite Being Across State Lines
0
Previous Success with Receiving Facility1
Sending State Lacked Comparable Services4
Standard Procedure to Place Certain Children Out of State 0
Children Failed to Adapt to In-StateFacilities
2
Alternative to In-State PublicInstitutionalization
2
To Live with Relatives (Non-Parental)6
Other
Number of Phase II Agencies Reporting6
a. Some agencies reported more than one reason for placement.
These same placing agencies reported their most frequently used type of out-of-state placement
setting. Table 38-10 shows that four respondingagencies reported that they most frequently used out-of-
state relatives' homes.Single agencies also reported the use of residential treatment/child care faci-
lities and foster homes most often In 1978.
TABLE 38-10. OREGON: MOST FREQUENT CATEGORIES OF RESIDENTIAL
SETTINGS USED BY LOCAL PHASE II AGENCIES IN 1978
Categories ofResidential Settings
Juvenile Justice
Number of AGENCIES Reporting
Residential Treatment/Child Care Facility
Psychiatric Hospital
Boarding/Military School
Foster Home
Group Home
Relative's Home (Non-Parental)
Adoptive Home
Other
Number of Phase II Agencies Reporting
1
0
4
0
0
6
OR-15
183

Local Phase 11 agencies* practices regarding their monitoring of a child's progress and well-being Inan out-of-state placement was also sought In this survey. Oregon local Phase II Juvenile Justice agen-cies were asked to provide the means and frequency of their monitoring of placements. Table 38-11illustrates that written progress reports and telephone calls to the residential setting on a quarterlybasis were the most frequently mentioned monitoring practices. Single agencies also reported receivingwritten progress reports on a semiannual or annual basis.
TABLE 38-11. OREGON: MONITORING PRACTICES FOR OUT-OF-STATEPLACEMENTS AS REPORTED BY LOCAL PHASE IIAGENCIES IN 1978
Methods of Monitoring
Number of AGENC1ESaFrequency of
Practice Juvenile Justice
Written Progress Reports
On-Site Visits
Telephone Calls
Other
Total Number of Phase 11Agencies Reporting
Quarterly 2Semiannually 1
Annually1
Otherb 0
Quarterly 0Semiannually 0Annually 0Otherb 0
Quarterly 2Semiannually 0Annually 0Otherb 0
Quarterly1
Semiannually 0Annually
1
Otherb1
6
a. Some agencies reported more than one method of monitoring.
b. Included monitoring practices which did not occur at regular intervals.
Five of the Oregon local Phase 11 probation agencies reported spending a total of $1,000 for out-of-state placement purposes in 1978.
D. Use of Interstate Compacts by State and Local Agencies
The survey of local agencies In Oregon also determined the extent to which Interstate compacts wereutilized to arrange out-of-state placements. A review of Table 38-12 indicates that 13 of the 19 agencieswhich placed children out of state In 1978 reported that at least some of their placements were arrangedthrough an Interstate compact. Five probf..tion agencies reported not utilizing a compact in that year.
Five of the seven Phase 11 agencies reported arranging out-of-state placements with the use of theinterstate Compact on Juveniles and one agency also arranged a placement through the Interstate Compacton.Mental Health.
CR-16

TABLE 38-12. OREGON: UTILIZATION OF INTERSTATE COMPACTS BYLOCAL AGENCIES IN 1978, BY AGENCY TYPE
Number of AGENCIES
Local Agencies Which PlacedChildren Out of State Juvenile Justice
NUMBER OF LOCAL AGENCIES PLACINGFOUR OR LESS C41LuKtN 12
Number Using Compacts 8
Number Not Using Compacts4
Number with Compact UseUnknown
0
NLMBER OF PHASE II AGENCIESPLACING CHILDREN
Nmnber Using Compacts
Interstate Compact on the Placementof Children
7
5
Yes0
No6
Don't Know
Interstate Compact on Juveniles
Yes5
NoDon't Know
Interstate Compact on Mental Health
Yes1
No5
Don't Know1
Number Not Using Compacts1
fiimber with Compact Use Unknown 1
TOTALS
Number of AGENCIES PlacingChildren Out of State
Number of AGENCIES Using Compacts
Number of AGENCIES Not UsingCompacts
Number of AGENCIES with CompactUse Unknown
19
13
5
1
Further knowledge concerning the utilization of interstate compacts is acquired through consideration
of the information given in Table', 38-13. This table indicates the number of children who were or were
not placed out of state with a 4,ompact. An examination of the overall trend shows that a total of at
least 30 children "re placed in out-of-stateresidential care in 1978 without the use of a compact. A
minimum of 48 children were sent out of Oregon Wjth th0 use of an interstate compact, 40 of them being
placed by Phase II agencies. These Phase II probation agencies reported utilizing the Interstate Compact
on Juveniles for 39 placements, while one child was processed by the Interstate Compact on Mental Health.
OR-17
191

TABLE 58-13. OREGON: NUMBER OF PLACEMENTS AND THE UTILIZATIONOF INTERSTATE COMPACTS BY LOCAL AGEKC1ES IN 1978
Number of CHILDRENChildren Placed Out of State Juvenile Justice
CHILDREN PLACED BY AGENCIESWEVITTTNG FOUR CR LESS PLACEMENTS
29
Number Placed with Compact Use8
Number Placed without Compact Use9
Number Placed with Compact Use Unknowna 12
CHILDREN PLACED BY PHASE 11 AGENCIES86
Number Placed w{th Compact Useb40
Number through Interstate Compacton the Placement of Children 0
Number through InterstateCompact on Juveniles
39
Number through InterstateCompact on Mental Health
1
Number Placed without Compact Usa21
Number Placed with Compact UseUnknown
25
TOTALS
Number of CHILDREN Placed Outof State
Number of CHILDREN Placedwith Compact Use
Number of CHILDREN Placed withoutCompact Use
Number of CHILDREN Placedwith Compact Use Unknown
115
48
30
37
a. Agencies which placed four or less children out of state were not askedto report the actual number of compact-arranged placements. Instead, theseagencies simply reported whether or not a compact was used to arrange any out-of-state placement. Therefore, if a compact was used, only one placement IsIndicated as a compact-arranged placement and the others are included in thecategory "number placed with compact use unknown."
b. If an agency reported using a compact but could not report the numberof placements arranged through the specific compact, one placement Is Indicatedas compact arranged and the others are included in the category "number placedwith compact use unknown."
Graphic representation of the information gathered about interstate compact utilization for childrenplaced out of state In 1978 by local Juvenile Justice agencies Is illustrated In Figure 38-4. Thisfigure shows that of the 115 children reported placed out of state by these local Oregon agencies, 26percent were non-compact arranged placements, 42 percent were compact arranged and for 32 percent of theplacements compact use was undetermined.
OR-18
1 9;2

FIGURE 38-4. CREGON: UTILIZATION OF INTERSTATE COMPACTS BYLOCAL JUVENILE JUSTICE AGENCIES IN 1978
115
CHILDREN PLACEDOUT Of STATE BYOREGON LOCALJUVEN'U JUST:CE
AGENCIES
.0' 09-04)9-
26% 04°11444.1
"*". .
42% COMPACT ARRANGED
OlimM MOIM 1MM. .111.MM MM.
32%
411s.
4%.
e°
The Oregon state agency responsible for the administration of both the Interstate Comapct on the
Placement of Children and the Interstate Compact on Juveniles was only able to report compact utilization
of the 1CPC in 1978. Thls agenc. the public child welfare agency In Oregon, reported that 99 children
were placed out of state with the use of this compact in the reporting year. State and local agencies'
use of the ICJ could not be reported for that year.
E. The Out-of-State Placement Practices of State Agencies,
Table 38-14 helps to Illustrate the ability of the state agencies to report the type and extent of
their involvement in out-of-state placements. It should be recalled from the earlier discussion of Table
38-2 that the DHR's Children's Services Division was contacted for information about two service arc's
because both the (ICPC) and the (ICJ) are administered in that office. This DHR office Is represented by
the child welfare/Juvenlie Justice designation In the following tables.
Despite the dual compact administration responsibilities in this division, complete information was
only available for the ICPC-arranged placements, which involved 99 children In 1978. There Is some
question as to the totally arranged description given to these placements since there are no dhild
welfare agencies operated by local governments In Oregon. Either local probation agencies, courts, or
branch offices of DHR may have been the agencies to which this designation refers.
Also of Interest Is the other state agencies' noninvolvement In out-of-state placements. Consistent
with what was stated In section III, the Department of Education does not place out of state. The Mental
Health Division of DHR reported that it does not place any children out of state, referring all place-
ments to the Children's Service Division within the same department.
OR-19
19 3
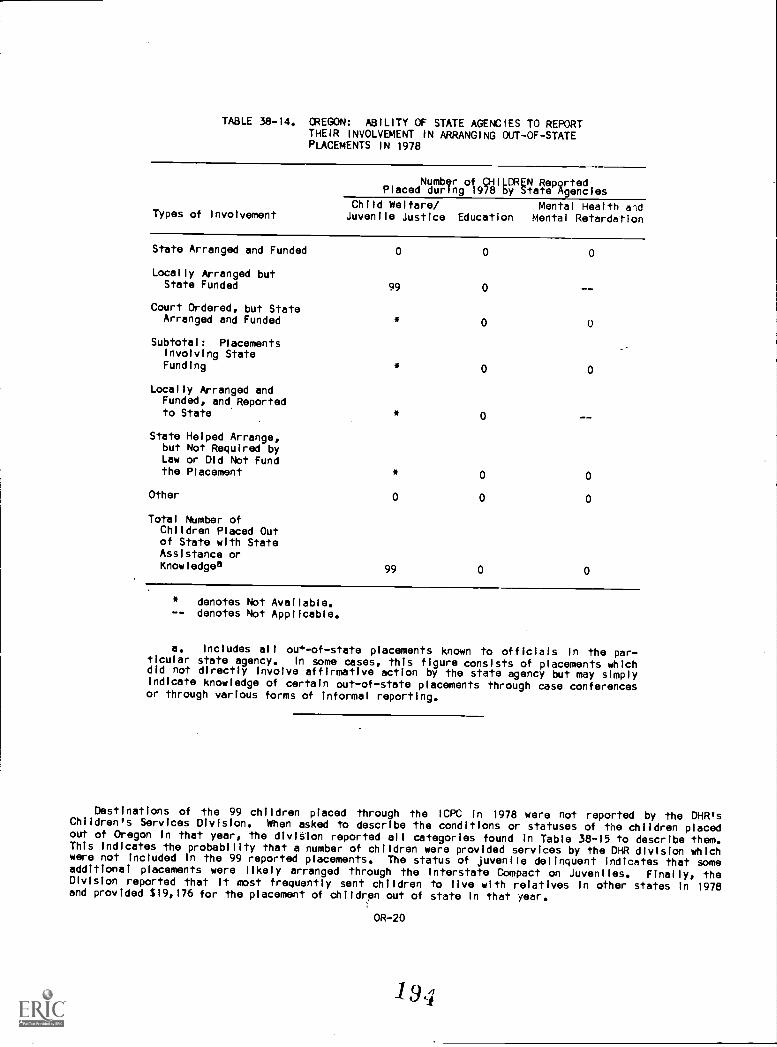
TABLE 38-14. OREGON: ABILITY OF STATE AGENCIES TO REPORTTHEIR INVOLVEMENT IN ARRANGING OUT-OF-STATEPLACEMENTS IN 1978
Number of IQHILDREN ReportedPlaced during 1978 Dy state Agencies
Types of InvolvementChild Welfare/Juvenile Justice Education
Mental Health andMental Retardation
State Arranged and Funded 0 0 0
Locally Arranged butState Funded 99 0
Court Ordered, but StateArranged and Funded 0 0
Subtotal: PlacementsInvolving StateFunding 0
Locally Arranged andFunded, and Reportedto State 0
State Helped Arrange,but Not Required byLaw or Did Not Fundthe Placement 0 0
Other 0 0 0
Total Number ofChildren Placed Outof State with StateAssistance orKnowledgea 99 0 0
* denotes Not Available.-- denotes Not Applicable.
a. Includes all oe-of-state placements known to officials In the par-ticular state agency. In some cases, this figure consists of placements whichdld not directly involve affirmative action by the state agency but may simplyindicate knowledge of certain out-of-state placements through case conferencesor through various forms of informal reporting.
Destinations of the 99 children placed through the ICPC in 1978 were not reported by the DHR'sChildren's Services Division. When asked to describe the conditions or statuses of the children placedout of Oregon In that year, the division reported all categories found in Table 38-15 to describe them.This indicates the probabillty that a number of children were provided services by the DHR division whichwere not included In the 99 reported placements. The status of Juvenile delinquent Indicates that someadditional placements were likely arranged through the Interstate Compact on Juveniles. Finally, theDivision reported that it most frequently sent children to live with relatives In other states In 1978and provided $19,176 for the placement of children out of state In that year.
OR-20
194

TABLE 58-15. OREGON: CONDITIONS OF CHILDREN PLACED OUT OFSTATE IN 1978, AS REPORTED BY STATE AGENCIES,BY AGENCY TYPE
Agency Typea
Types of Conditions Child Welfare/Juvenile Justice
Physically Handicapped
Mentally Handicapped
Developmentally Disabled
Unruly/Disruptive
Truants
Juvenile Delinquents
Emotionally Disturbed
Pregnant
Drug/Alcohol Problems
Battered, Abandoned, or Neglected
Adopted Children
Foster Children
Other
a. X indicates conditions reported.
F. State Agencies' Knowledge of Out-of-State Placements
As a final review, Table 38-16 offers the incidence of out-of-state placements reported by Oregon
Odblic agencies and the number of children placed out of state of which the state agencies had knowledge.
Again, as discussed In Table 38-14, the DHR's Children's Services Division was only able to provide
information on placements made with the use of the Interstate Compact on the Placement of Children.
These 99 children, therefore, make up only a portion of the pladements involving this state child welfare
and Juvenile Justice agency. It was not determined how many of the 115 local Juvenile justice placements
were known to this state agency.
Both the state education and the mental health and mental retardation agencies reported no out-of-
state placement activity in 1978. The education agency's report was confirmed in the local survey of
school districts.
CR-21
195

TABLE 38-16. CREGON: STATE AGENCIES' KNOWLEDGE OF OUT -OF -STATE PLACEMENTS
Child Welfare/ Mental Health andJuvenile Justice Education Mental Retardation
Total Number of State andLocal Agency Placements
Total Number of PlacementsKnown to State Agencies
Percentage of PlacementsKnown to State Agencies
*a
ggb
* denotes Not Available.
a. The local Juvenile Justice agencies reported arranging 115 out-of-stateplacements in 1978. The state agency reported 99 children had been placed outof state which were state funded, but could not report the Juvenile Justiceplacements arranged by the state agency.
b. Includes only the out-of-state placements arranged through the Inter-state Compact on the Placement of Children.
Finally, Flgure 38-5 illustrates the state child welfare and Juvenile Justice agencies' knowledge ofout-of-state placement activity and its ability to report interstate compact utilization by the stateagency and local Juvenile Justice agencies.
OR-22
1,96,

225
200
175
150
125
100
75
50
25
FIGURE 38-5. OREGON: THE TOTAL NUMBER OF STATE AND LOCALPLACEMENTS AND USE OF COMPACTS, AS REPORTEDBY STATE AGENCIES, By AGENCY TYPE
2144
99b
LI
Child Welfare/Juvenile Justice
State and Local Placements
State and Local Placements Known to State Agencies
State and Local Compact-Arranged Placements Reported by State Agencies
a. The locad juvenile justice agencies reported arranging 115 out-of-state placements in 1978. The
state child welfare and juvenile justice agency was only able to report 99 placements arranged through
the Interstate Compact on the Placement of Children.
b. The state agency reporte41-99 children to be placed out of state through the Interstate Compact on
the placement of Children which were state funded but could not report the juvenile justice placements
arranged by the state or local agencies, or the placements processed by the Interstate Compact on
Juveniles.
V. CONCLUDING REMARKS
A review of the Information obtained from Oregon state and local agencies about their Involvement In
out-of-state placement brings forward several factors of Interest. The contrasting ability of the
Children's Services Division to report the placements arranged through 1CPC and the ICJ was extremely
important, considering that the Children's Services Division Is the major point of departure for most
children crossing state fines for publicly sponsored out-of-home care. A few other conclusions about the
survey findings in Oregon follow.
CR-23
197

local courtsplacement or
The majority of children sent out of state for whom destinations were available were sent tostates In the geographic region of Oregon.
hearing juvenile matters reported an infrequent usetransfer of probation supervision of a child.
A wide rangeto the homes
of children are placed out of state by the Childrenof relatives other than parents.
of interstate compacts for the
Is Services Division, particularly
The reader is encouraged to compare national trends described in Chapter 2 with the findings whichrelate to specific practices In Oregon In order to develop further conclusions about the statels involve-ment with the out-of-state placement of children.
FOOTNOTE
1. General Information about states, counties, cities, and SMSAs Is from the special 1975 populationestimates based on the 1970 national census contained in the U.S. Bureau of the Census, County and CityData Book, 1977 (A Statistical Abstract Supplement), Washington, D.C., 1978.
rwrarnerrair about direct general State and local total per capita expenditures and expenditures foreducation and public welfare were also taken from data collected by the U.S. Bureau of the Census andthey appear in Statistical Abstract of the United States: 1979 (100th Edition), Washington, D.C.,1979. -----
The 1978 estimated population of persons eight to 17 years old was developed by the National Centerfor Juvenile Justice using two sources: the 1970 national census and the National Cancer institute 1975estimated aggregate census, also prepared by the U.S. Bureau of the Census.
OR-24
1 90,

A PROFILE OF OUT-OF-STATE PLACEMENT POLICY AND PRACTICE IN UTAH
I. ACKNOWLEDGMENTS
The Academy gratefully acknowledges the assistance of the many state and local public officials who
contributed their time and effort to the project, particularly R. Elwood Pace, Pupil Services Coordin-
ator, Department of Public Instruction; William Ward, Assistant Director, Division of Family Services,
Department of Social Services; John McNamara, Administrator, State Juvenile Court; and Marilyn Park,
.Chief of Forensic and Aftercare Services, Division of Mental Health, Department of Social Services.
II. METHODOLOGY
Information was systematically gathered about Utah from a variety of sources using a number of data
collection techniques. First, a search for relevant state statutes and case law was undertaken. Next,
telephone Interviews were conducted with state officials who were able to report on agency policies and
practices with regard to the out-of-state placement of children. A mail survey was used, as a follow-up
to the telephone interview, to solicit information specific to the out-of-state placement practices of
state agencies and those of local agencies subject to state regulatory control or supervisory oversight.
An assessment of out-of-state placement policies and the adequacy of Information reported by state
agencies suggested further survey requirements to determine the involvement of public agencies In
arranging out-of-state placements. Pursuant to this assessment, further data collection was undertaken
if it was necessary to:
verify out-of-state placement data reported by state government about local agencies; and
collect local agency data which was not available from state government.
A summary of the data collection effort In Utah appears below In Table 45-1.
TABLE 45-1. UTAH: METHODS OF COLLECTING DATA
Levels ofGovernment
Survey Methods, by Agency Type
Child Welfare/Mental
Retardation EduCation
JuvenileJustice
State Telephone Telephone Telephone
Agencies Interview Interview Interview
Mailed Survey: Mailed Survey: Mailed Survey:
DSS officials DPI officials SJC officials
Local Not Applicable Telephone Not Applicable
Agencies (State Survey: All (State
Offices) 40 localschoolcastr,Icts
Offices)
Mental Health
TelephoneInterview
Mailed Survey:DSS officials
TelephoneSurvey: All
18 localmental healthcenters
UT-1
199
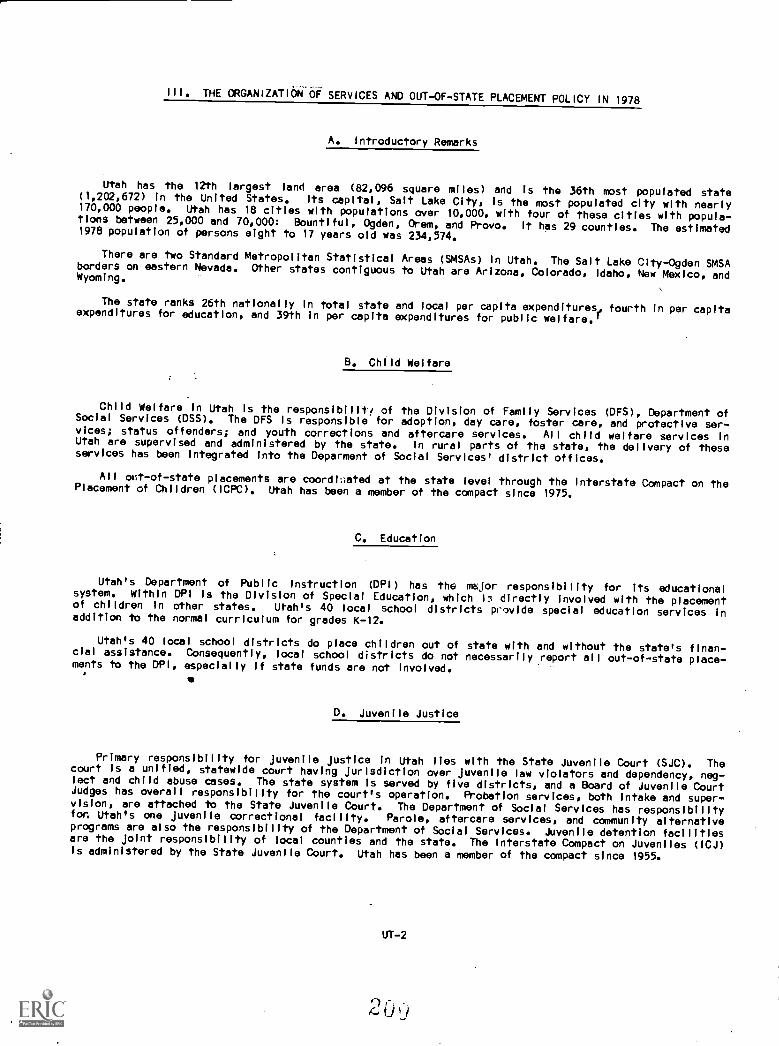
III. THE ORGANIZATIOH-OF: SERVICES AND OUT-OF-STATE PLACEMENT POLICY IN 1978
A. Introductory Remarks
Utah has the 12th largest land area (82,096 square miles) and Is the 36th most populated state(1,202,672) In the United States. Its capital, Salt Lake City, is the most populated city with nearly170,000 people. Utah has 18 cities with populations over 10,000, with four of these cities with popula-tions between 25,000 and 70,000: Bountiful, 0gden, Orem, and Provo. It has 29 counties. The estimated1978 population of persons eight to 17 years old was 234,574.
There are two Standard Metropolitan Statistical Areas (SMSAs) in Utah. The Salt Lake City-Ogden SMSAborders on eastern Nevada. Other states contiguous to Utah are Arizona, Colorado, Idaho, New Mexico, andWyoming.
The state ranks 26th nationally in total state and local per capita expenditures, fourth in per capitaexpenditures for education, and 39th in per capita expenditures for public welfare.'
B. Child Welfare
Child Welfare In Utah Is the responsibilit/ of the Division of Family Services (DFS), Department ofSocial Services (DSS). The DFS Is responsible for adoption, day care, foster care, and protective ser-vices; status offenders; and youth corrections and aftercare services. All child welfare services inUtah are supervised and administered by the state. In rural parts of the state, the delivery of theseservices has been integrated into the Deparment of Social Services district offices.
All oot-of-state placements are coordiated at the state level through the Interstate Compact on thePlacement of Children (ICPC). Utah has been a member of the compact since 1975.
C. Education
Utah's Department of Public Instruction (DPI) has thb major responsibility for Its educationalsystem. Within DPI is the Division of Special Education, which i3 directly involved with the placementof children In other states. Utah's 40 local school districts provide special education services inaddition to the normal curriculum for grades K-12.
Utah's 40 local school districts do place children out of state with and without the state's finan-cial assistance. Consequently, local school districts do not necessarily report all out-of-state place-ments to the DPI, especially If state funds are not involved.
D. Juvenile Justice
Primary responsibility for Juvenile Justice In Utah Iles with the State Juvenile Court (SJC). Thecourt Is a unified, statewide court having Jurisdiction over Juvenile law violators and dependency, neg-lect and child abuse cases. The state system Is served by five districts, and a Board of Juvenile CourtJudges has overall responsibility for the court's operation. Probation services, both intake and super-vision, are attached to the State Juvenile Court. The Department of Social Services has responsibilityfon Utah's one Juvenile correctional facility. Parole, aftercare services, and community alternativeprograms are also the responsibility of the Department of Social Services. Juvenile detention facilitiesare the Joint responsibility of local counties and the state. The Interstate Compact on Juveniles (ICJ)Is administered by the State Juvenile Court. Utah has been a member of the compact since 1955.
UT-2
2 04)

E. Mental Health
Mental health programs In Utah are administered through the Division of Mental Health (DMH), Depart-
ment of Social Services. The DMH supervises the financing and local management of Utah's 18 community
mental health centers and operates a children's unit In the Utah State Hospital. Local mental health
expenditures are supervised by the county commissioners. According to Utah State Law 24-17-1.2, the DMH
Is responsible for assisting and consulting with local mental health authorities and with local mental
health advisory councils In the establishment of cotomunity mental health programs, which may include pre-
vention, rehabilitation, case-finding, diagnosis and treatment of the mentally III, and consultation and
education for groups and individuals regarding mental health.
Local mental health centers can and do place children out of state. Utah is not a member of the
Interstate Compact on Mental Health (ICMH) and placements are not regularly reported to the state
division.
F. Mental Retardation
The Division of Family Services (DFS) within the Department of Social Services is responsible for
providing mental retardation services in Utah. The DFS Is responsible for providing specialized casework
services to mentally retarded children requiring out-of-home care.
It is reported that very few placements are being made out of state, with the exception of placements
with relatives moving to another state. Those placements which occur were reported to be made In accord-
ance with the provisions of the interstate Compact on the Placement of Children (ICPC).
IV. Findings From a Survey of Out-of-State Placement Practices In 1978
The results of the survey of Utah public agencies are presented In this section in \summary tables and
are accompanied by some interpretive remarks.
A. The Number of Children Placed In Out-of-State Residential Settings
A summary of out-of-state placement activities by state and local agencies is provided In Table 45-2
to lend some perspective to the more specific survey results which fottow. Table 45-2 establishes the
size of the group of children placed out of Utah In 1978. Local mental health agencies placed out of
state the largest number of children that were Identified in the survey. The DSS1 Division of Family
Services, providing child welfare services and services for mentally retarded children, and the State
Juvenile Court reported some Involvement in out-of-state. placements. Table 45-2 shows that sending
children to other states for residential care was both a state and local phenomenon In Utah in 1978.
UT-3
2 0.1.
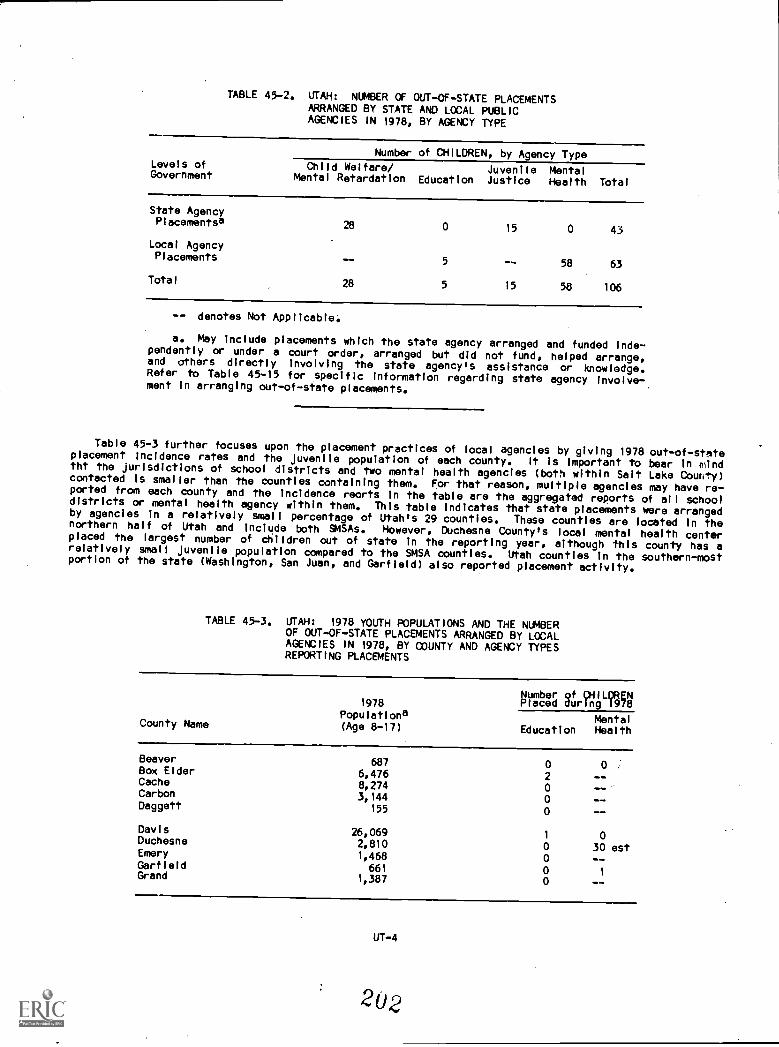
TABLE 45-2. UTAH: NUMBER OF OUT-OF-STATE PLACEMENTSARRANGED BY STATE AND LOCAL PUBLICAGENCIES IN 1978, BY AGENCY TYPE
Levels ofGovernment
Number of CHILDREN, by Agency Type
Child Welfare/ Juvenile MentalMental Retardation Education Justice Health Total
State AgencyPlacementsa 28 0 15 0 43
Local AgencyPlacements -- 5 -- 58 63
Total 28 5 15 58 106
-- denotes Not Applicable.
a. Mey Include placements which the state agency arranged and funded Inde-pendently or under a court order, arranged but did not fund, helped arrange,and others directly involving the state agency's assistance or knowledge.Refer to Table 45-15 for specific information regarding state agency Involve-ment in arranging out-of-state placements.
Table 45-3 further focuses upon the placement practices of local agencles by giving 1978 out-of-stateplacement incidence rates and the Juvenlle population of each county. It is Important to bear In mindtht the Jurisdictions of school dIstrIcts and two mental health agencles (both within Salt Lake Comity)cootacted Is smaller than the counties containing them. For that reason, multiple agencles may have re-ported from each county and the Incidence reorts In the table are the aggregated reports of all schooldistricts or mental health agency within them. This table indicates that state placements were arrangedby agencies In a relatively small percentage of Utah's 29 counties. These countles are located In thenorthern half of Utah and Include both SMSAs. However, Duchesne County's local mental health centerplaced the largest number of children out of state In the reporting year, although thls county has arelatively small Juvenlle population compared to the SMSA counties. Utah counties In the southern-mostportion of the state (Washington, San Juan, and Garfield) also reported placement activity.
TABLE 45-3. UTAH: 1978 YOUTH POPULATIONS AND THE NUMBEROF OUT-OF-STATE PLACEMENTS ARRANGED BY LOCALAGENCIES IN 1978, BY COUNTY AND AGENCY TYPESREPORTING PLACEMENTS
County Name
1978Populationa(Age 8-17)
Number of CHILDRENPlaced during i978
MentalEducation Health
Beaver 687 0Box Elder 6,476 2Cache 8,274 0Carbon 3,144 0Daggett 155 0
Davls 26,0691 0Duchesne 2,810 0 30 est
Emery 1,468 0 --Garfield 661 0 1Grand 1,387 0 --
UT-4
202

TABLE 45-3. (Continued)
County Name
1978
Populationa(Age 8-17)
Number of CHILDRENPlaced during 1978
Mental
Education Health
Iron2,431
Juab 892
Kane 714
Millard 1,610
Morgan 990
Plute 240
Rich 333
Salt Lake 99,281
San Juan 3,065
Sanpete 2,033
Sevier 2,086
Summit1,448
Tooele4,885
Uintah 3,831
Utah 30,034
Wasatch 1,289
Washington 3,390
Wayne 308
Weber 24,583
0
0
_-
2 est5
0
8 est
Muiticounty Jurisdictions
Weber, Morgan0
Juab, Summit, Utah,Wasatch
0
Salt Lake, Utah, Tooele10 est
Box Elder, Cache, Rich2 est
Carbon, Emery, Grand,San Juan
0
Uintah, Daggett0
Piute, Sevier, Wayne,Millard, Sanpete
0
Total Number ofPlacements Arrangedby Local Agencies(total may Includeduplicate count)
5 38 est
Total Number of LocalAgencies Reporting
40 18
-- denotes Not Applicable.
a. Estimates were developed by the National Center of Juvenile Justice
using data from two sources: the 1970 national census and the National Cancer
Institute 1975 estimated aggregate census.
UT-5
203

B. The Out-of-State Placement Practices of Local Agencies
The involvement of Utah local agencies In out-of-state placement is summarized in Table 45-4. Ofparticular interest is the excellent response rate the study received among these agencies. All agenciescontacted participated In the survey and were able to report their involvement in out-of-state placementin 1978. Less than eight percent of the local school districts reported some involvement in out-of-stateplacements, compared to 39 percent of the local mental health agencies.
TABLE 45-4. UTAH: THE INVOLVEMENT OF LOCAL PUBLIC AGENCIESIN ARRANGING OUT-OF-STATE PLACEMENTS IN 1978
Response CategoriesNumber of AGENCIES, by Agency Type
Education Mental Health
Agencies Which Reported Out-of-StatePlacement§ 3 7
Agencies Which Did Not Know If TheyPlaced, or Placed but Could Not Reportthe Number of Children 0 0
Agencies Which Did Not Place Out of State 37 11
Agencies Which Did Not Participate Inthe Survey 0 0
Total Local Agencies 40 18
All local agencies that did not place children out of state were asked to report why such placementsdid not occur. The majority of agencies of both agency types said they did not place children out ofstate because sufficient services were available In Utah. This finding is an interesting comparison tothe placing mental health agencies responses reported in Table 45-9, where the majority of reasons forplacing children out of Utah were also related to the state's service resources, but referring to theirnonavailability. Local agencies which did not place children out of Utah also reported that they lackedfunds and statutory authority. In addition, seven education and eight local mental health agenciesreported "other" reasons, including parental disapproval of such placements and agency policy beingagainst the placement of a child out of state.
UT-6
2 u

TABLE 45-5. UTAH: REASONS REPORTED BY LOCAL PUBLICAGENCIES FOR NOT ARRANGING OUT-OF-STATEPLACEMENTS IN 1978
Reasons for Not PlacingChildren Out of Statea
Number of Local AGENCIES,by Reported Reason(s)
Education Mental Health
Lacked Statutory Authority1 2
Restricted 0 0
Lacked Funds4 3
Sufficient Services Available In State 34 10
Otherb7 8
Number of Agencies Reporting No Out-of-State
Placements37 11
Total Number of Agencies Represented in Survey 40 18
a. Some agencies reported more thanstate placements.
b. Generally Incl-ded such reasons as
overall agency poliv were disapproved by
and were prohibitive because of distance.
one reason for not arranging out-of-
out-of-state placements were againstparents, involved too much red tape,
Public agencies often work together In decisionmaking about the arrangement of out-of-state place-
ments. The degree to which there was interagencycooperation In the placement of children out of Utah by
local agencies appears in Table 45-6. Local school districts reported a low level of Interagency cooper-
ation In 1978 for this purpose, with only one of the five children's placements being arranged with the
participation of some other public agency. Local mental health agencies reported involving other agencies
In the placement process to a greater extent, with about 86 percent of the placing agencies reporting
Interagency cooperation for 76 percent of the placements they made.
UT-7 205

TABLE 45-6. UTAH: THE EXTENT OF INTERAGENCY COOPERATIONTO ARRANGE OUT-OF-STATE PLACEMENTS BY LOCALAGENCIES IN 1978
Number and Percentage, by Agency Typetaucation mentai Health
Number Percent Number Percent
AGENCIES Reporting Out-of-StatePlacementsa 3 8 7 39
AGENCIES Reporting Out-of-StatePlacements with InteragencyCooperation
1 33 6 86
Number of CHILDREN Placed Out ofState 5 100 58 100
Number of CHILDREN Placed Out ofState with interagencyCoopeaTron 20 44 76
a. See Table 45-4.
All local agencies placing children out of Utah In 1978 were asked to respc,A to a list of conditionsand statuses to, describe.the children they placed. Table 43-7 enumerates the number of agencies that in-dicated they placed a child having one or more of the characteristics offered for description. Localschool dIstrIcts respondlng to this question described the children they placed as truants or unruly/dis-ruptive, as having special education needs, as being mentally or physically handicapped, and as havingdrug or alcohol problems.
Mental health agenciG placed children out of Utah having every characteristic that was available fordescription. Nearly all of the placlng agencles responded that they had placed mentally III or emotion-ally disturbed chillren, and unruly/disruptive children. About the same proportion of mental healthagencies reported that they placed chlldren who'had drug or alcohol problems. From the wide variety ofcharacteristics describing children placed by mental health agencies, it could be presumed that theseagencies are broadly involved in delivering services to Utah children.
TABLE 45-7. UTAH: CONDITIONS Of CHILDREN PLACED OUT OFSTATE IN 1978, AS REPORTED BY LOCAL AGENCIES
Types of COnditionsaNumber of AGENCIES Reporting
Education Mental Health
Physically Handicapped1 I
Mentally Retarded or Developmentally Disabled .0 1
Unruly/Disruptive1 5
Truant 2 3
Juvenile Delinquent 0 3
Mentally III/Emotionally Disturbed 1 6
Pregnant 0 2
UT-8
206.
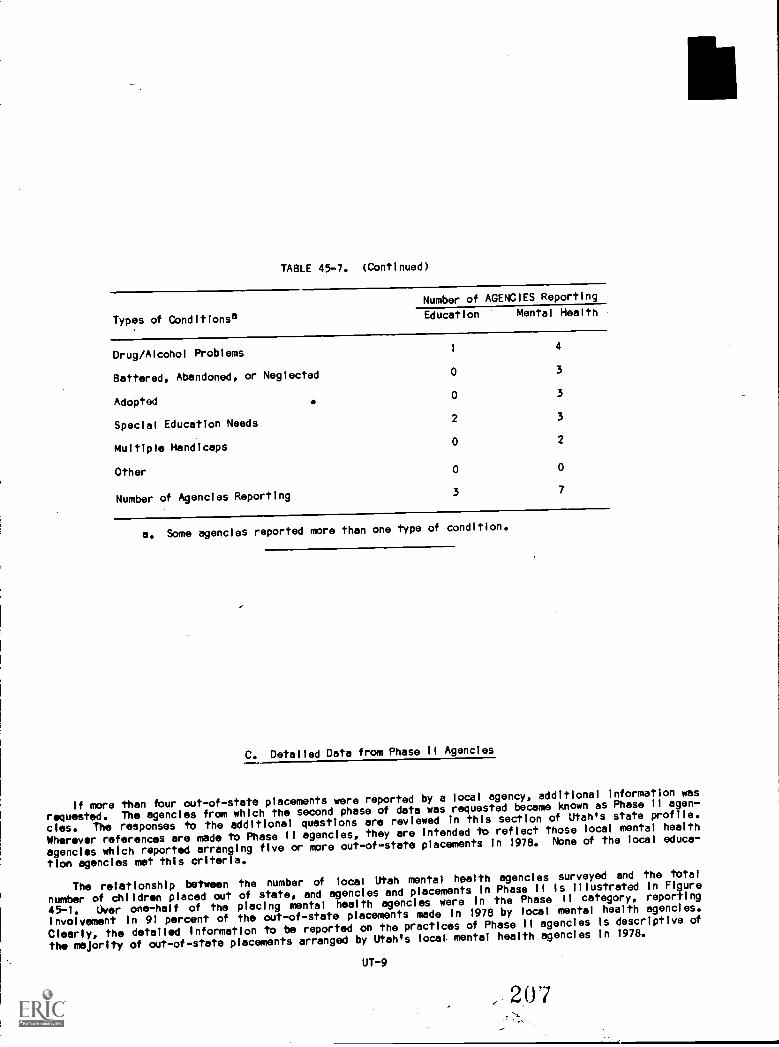
TABLE 45-7. (Continued)
Number of AGENCIES Reporting
Types of Conditionsa Education Mental Health
Drug/Alcohol Problems
Battered, Abandoned, or Neglected
Adopted
Special Education Needs
Multiple Handicaps
Other
Number of Agencies Reporting
1
0
0
2
0
0
3
4
3
3
3
2
0
7
a. Some agencies reported more than one type of condition.
C. Detailed Data from Phase II Agencies
If more than tour out-of-stateplacements were reported by a local agency, additional Information was
requested. The agencies from which the second phase of data was requested became known as Phase II agen-
cies. The responses to the additional questions are reviewed In this section of Utahls state profile.
Wherever references are made to Phase 11 agencies, they are intended to reflect those local mental health
agencies which reported arranging five or more out-of-state placements in 1978. None of the local educa-
tion agencies met this criteria.
The relationship between the number of local Utah mental health agencies surveyed and the total
number of children placed out of state, and agencies and placements In Phase II Is Illustrated in Figure
45,-1. Over one-half of the placing mental health agencies were in the Phase II category, reporting
Involvement In 91 percent of the out-of-state placements made In 1978 by local mental health agencies.
Clearly, the detailed information to be reported On the practices of Phase II agencies Is descriptive of
the majority of out-of-state placements arranged by Utahls local- mental health agencies In 1978.
LIT-9
, 207

FIGURE 45-1. UTAH; RELATIONSHIP BETWEEN THE NUMBER OF LOCALAGENCIES SURVEYED AND PLACEMENTS REPORTED, ANDAGENCIES AND PLACEMENTS IN PHASE II, BY AGENCYTYPE
Mental Health
Number of AGENCIES
Number of AGENCIES ReportingOut-of-State Placements in1978
Number of AGENCIES ReportingFive or More Placements In1978 (Phase 11 Agencies)
Number of CHILDREN PlacedOut of State In 1978
Number of CHILDREN Placedby Phase II Agencies
Percentage of Reported PlacementsIn Phase II LI
The slx Utah countles served by Phase II mental health agencies are Illustrated In Flgure 45-2. Theone agency having a multicounty jurisdiction (Salt Lake, Utah, and Toole Counties) serves an area withinUtah's two SMSAs. Adjacent Is a fourth county served by a Phase II mental health agency, Duchesne. Thesouthern-most Phase II countles of San Juan and Washington, each bordering two other states, are alsoIndicated In Figure 45-2.
UT-10
208
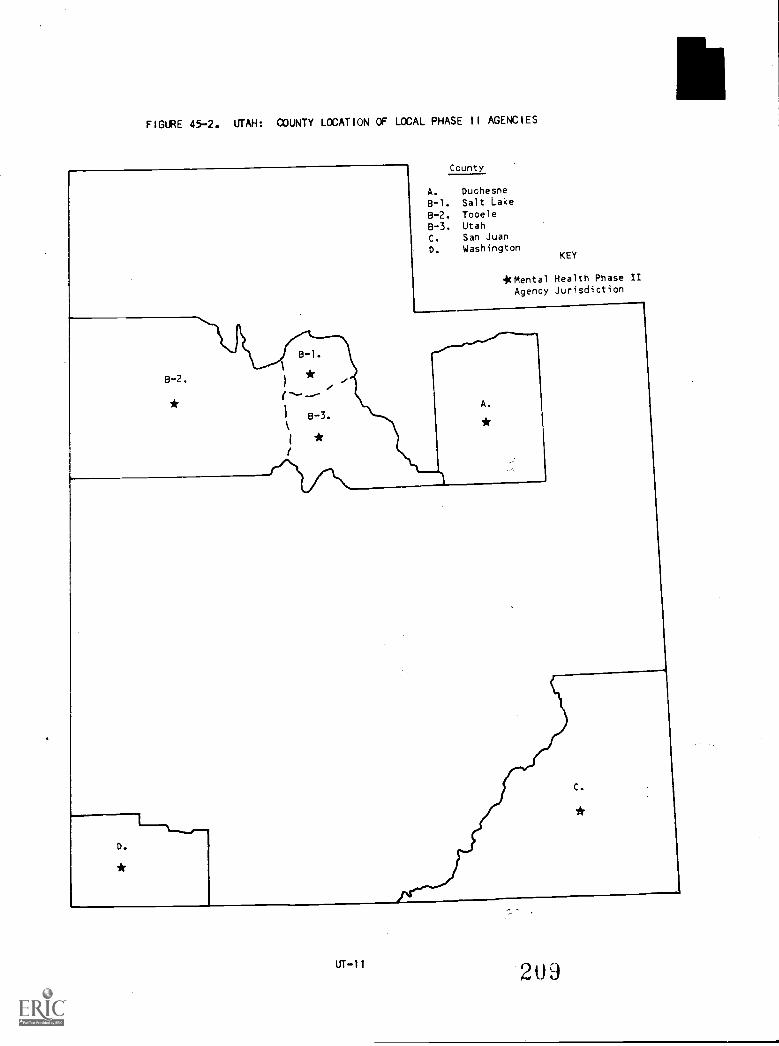
FIGURE 45-2. UTAH: COUNTY LOCATION OF LOCAL PHASE II AGENCIES
County
A. Duchesne
8-1. Salt Lake
B-2. Tooele
B-3. Utah
C. San Juan
D. WashingtonKEY
*Mental Health Phase IIAgency Jurisdiction
UT-11 203

Local Utah Phase II agencies were asked for the destinations to which these children were sent. Thelocal Phase II mental health agencies responding to this question were able to report upon 79 percent ofthe children they placed In that year, and their responses are displayed in Table 45-6. California wasby far the receiver of the largest number of children from these agencies, with 16 children or 38 percentof the placements for which destinations were reported. Arizona and Nevada, border states to Utah,received six children each Into residential settings in 1978. The remaining placements for which desti-nation Information was available were dispersed among states primarily In the same geographic region thatUtah Is located, In addition to states at further distances, Including the District of Columbia,Wisconsin, and Georgia.
TABLE 45-8. UTAH: DESTINATIONS OF CHILDREN PLACED BYLOCAL PHASE II AGENCIES IN 1978
Destinations of Children Number of CHILDREN PlacedPlaced Out of State Mental Health
Arizona 6California 16Colorado 2District of Columbia 4Georgia
1
Idaho 2Nevada 6Oregon 3Wisconsin 2
Placements for WhichDestinations Could Notbe Reported by Phase IIAgencies 11
Total Number of Phase IIAgencies 4
Total Number of ChildrenPlaced by Phase IIAgencies 53
Figure 45-3 continues to focus on the destinations of children placed out of Utah by local Phase IIagencies. It Illustrates the number of children who went to states contiguous to Utah. Approximately 38percent of the local mental health placements for which destinations were reported went to contiguousstates.
UT-12
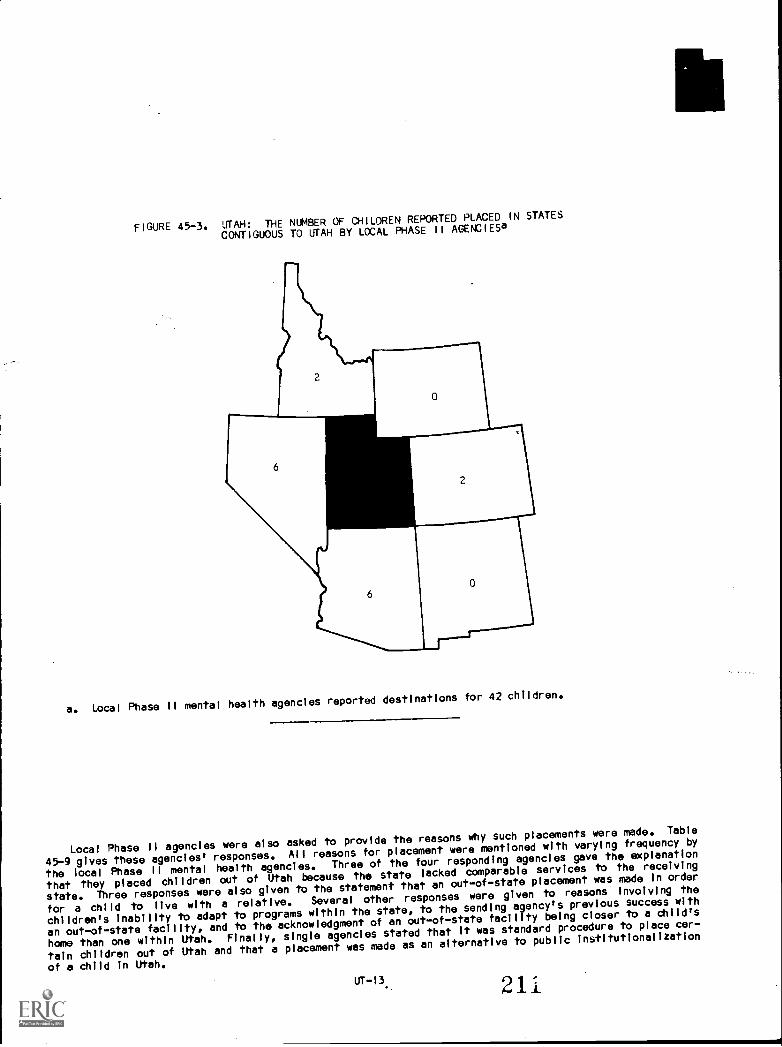
FIGURE 45-3. UTAH: THE NUMBER OF CHILDREN REPORTED PLACED IN STATES
CONTIGUOUS TO UTAH BY LOCAL PHASE II AGENC(ESa
a. Local Phase II mental health agencies reported destinations for 42 children.
Local Phase II agencies were also asked to provide the reasons why such placements were made. Table
45-9 gives these agencies responses. All reasons for placement were mentioned with varying frequency by
the local Phase II mental health agencies. Three of the four respondingagencies gave the explanation
that they placed children out of Utah because the state lacked comparable services to the receiving
state. Three responses were also given to the statement that anout-of-state placement was made in order
for a child to live with a relative. Several other responses were given to reasons involving the
children's inability to adapt to programs within the state, to the sending agency's previous success with
an out-of-state facility, and to the acknowledgment of an out-of-state facility being closer to a child's
home than one within Utah. Finally, single agenciesstated that It was standard procedure to place cer-
tain children out of Utah and that a placement was made as an alternative to public institutionalization
of a child in Utah.
211

TABLE 45-9. UTAH: REASONS FOR PLACING CHILDREN OUT OfSTATE IN 1978, AS REPORTED BY LOCALPHASE II AGENCIES
Number of AGENCIES ReportingReasons for Placementa Mental Health
Receiving Facility Closer to Child's Home,Despite Being Across State Lines 2
Previous Success with Receiving Facility 2
Sending State Lacked Comparable Services 3
Standard Procedure to Place Certain ChildrenOut of State
1
Children Failed to Adapt to In-State Facilities 2
Alternative to In-State Public Institutionalization 1
To Live with Relatives (Non-Parental)3
Other3
Number of Phase 11 Agencies Reporting4
a. Some agencies reported more than one reason for placement.
Phase II agencies were also asked to report the type of setting to which children were most frequentlysent. Table 45-10 presents the responses of the local Phase li mental health agencies. Two agencies saidthat they sent children most often to residential treatment or child care facilities In 1978 and singleagencies said foster homes and relatives' homes were most frequently utilized.
TABLE 45-10. UTAH: MOST FREQUENT CATEGORIES Cf RESIDENTIALSETTINGS USED BY LOCAL FI-IASE II AGENCIESIN 1978
Categories ofResidential Settings
Number of AGENCIES Reporting
Mental Health
Residential Treatment/Chlid Care Facility 2
Psychiatric Hospital 0
BoardIng/MIlitary School 0
Foster Home1
Group Home0
Relative's Home (Non-Parental)1
Adoptive Home0
Other0
Number of Phase II Agencies Reporting 4
UT-14
21 2
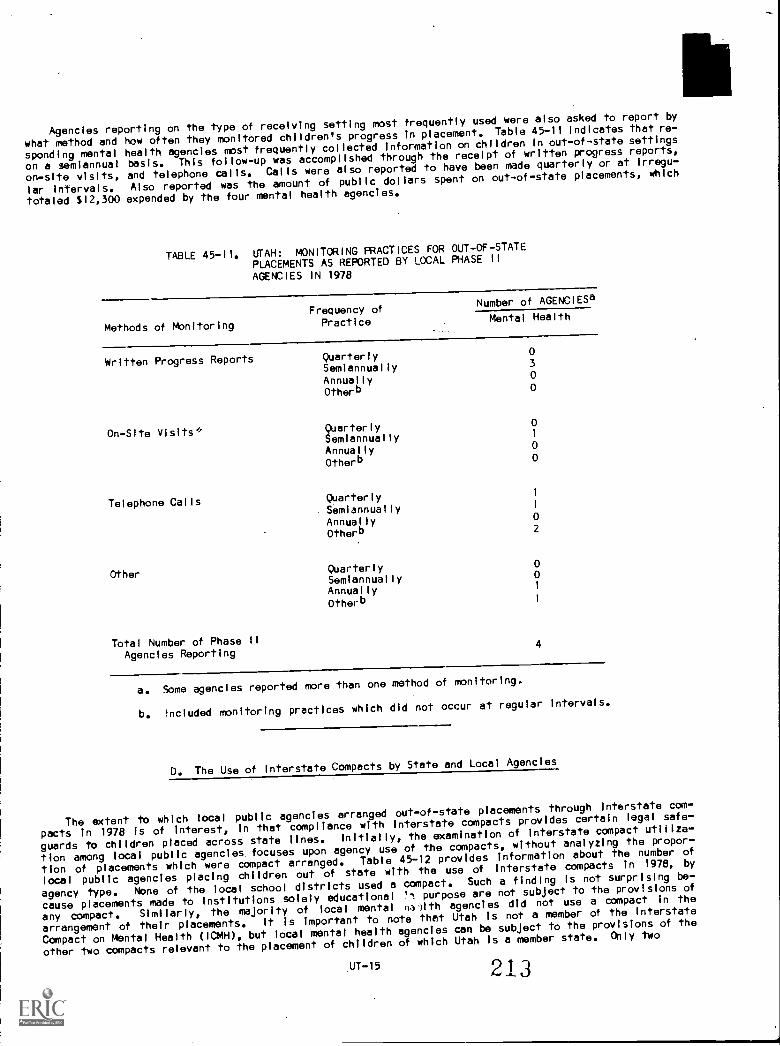
Agencies reporting on the type of receiving setting most frequently used were also asked to report by
what method and how often they monitored children's progress in placement. Table 45-11 Indicates that re-
sponding mental health agencies most frequently collectedinformation on children In out-of-state settings
on a semiannual basis. This follow-up was accomplishedthrough the recelpt of written progress reports,
on-slte visits, and telephone calls. Calls were also reported to have been made quarterly or at irregu-
lar infervals. Also reported was the amount of public dollars spent on out-of-state placements, which
totaled $12,300 expended by the four mental health agencies.
TABLE 45-11. UTAH: MONITORING PRACTICES FOR OUT-OF-STATE
PLACEMENTS AS REPORTED BY LOCAL PHASE 11
AGENCIES IN 1978
Methods of Monitoring
Frequency ofPractice
Number of AGENCIES8
Mental Health
Written Progress Reports Quarterly 0
Semiannually 3
Annually 0
Otherb 0
On-Site Visits% Quarterly 0
Semlannually1
Annually 0
Otherb 0
Telephone Calls QuarterlySemiannuallyAnnually
0
Otherb 2
Other Quarterly0
Semiannually0
Annually 1
Otherb
Total Number of Phase 11Agencies Reporting
4
a. Some agencies reported more than one method of monitoring.
b. Included monitoring practices which did not occur at regular intervals.
D. The Use of Interstate Compacts by State and Local Agencies
The extent to which local public agencies arrangedout-of-state placements through Interstate com-
pacts in 1978 is of interest, in that compliance with interstate compactsprovides certain legal safe-
guards to children placed across state lines. Initially, the examination of Interstate compact utiliza-
tion among local publicagencles focuses upon agency use of the compacts, without analyzing the propor-
tion of placements which were compact arranged. Table 45-12 provides information about the number of
local public agencies placing childrenout of state with the use of Interstate compacts In 1978, by
agency type. None of the local school districts used a compact. Such a finding Is not surprising be-
cause placements made to institutions solely educational "! purpose are not subject to the provisions of
any compact. Similarly, the majority of local mental nailth agencies dld not use a compact in the
arrangement of their placements. It Is important to note that Utah Is not a member of the Interstate
Compact on Mental Health (1CMH), but local mental healthagencles can be subject to the provisions of the
other two compacts relevant to the placement of children of which Utah Is a member state. Only two
UT-15 213

mental health agencies arranging more than four placements report to have utilized an interstate compactIn 1978. Compact use included both the Interstate ComPact on the Placement of Children and the InterstateCompact on Juveniles. One agency did not know whether ICJ was utilized.
TABLE 45-12. UTAH: UTILIZATION OF INTERSTATE COMPACTSBY LOCAL AGENCIES IN 1978
Local Agencies Which PlacedChildren Out of State
Number of AGENCIES
Education Mental Health
NUMBER OF LOCAL AGENCIES PLACINGFOUR OR LESS CHiLuHtim 3 3
Number Using Compacts 0 0
Number Not Using Compacts 3 3
Number with Compact UseUnknown 0 0
NUMBER OF PHASE 11 AGENCIESPLACING CHILDREN 0 4
Number Using Compacts 2
Interstate Compact on the Placementof Children
Yes1
No3
Don't Know 0
Interstate Compact on Juveniles
Yes1
No2
Don't Know1
Interstate Compact on Mental Healtha
YesNoDon't Know
Number Not Using Compacts2
Number with Compact Use Unknown 0
TOTALS
Number of AGENCIES PlacingChildren Out of State 3 7
Number of AGENCIES Using Compacts 0 2
Number of AGENCIES Not UsingCompacts 3 5
Number of AGENCIES with CompactUse Unknown 0 0
-- denotes Not Applicable.
a. Utah had not enacted the Interstate Compact on Mental Health In 1978.
UT-16

At this juncture, the examination of interstate compact utilization among local public agencies Is
shifted to a different focus. Table 45-13 illustrates the number of out-of-state placements which were
arranged through an interstate compact. Considering only these out-of-state placements arranged by agen-
cies reporting to have utilized an interstate compact (local school districts are therefore excluded), ft
was determined that 32 of the mental health.placements wereprocessed through a compact, 28 of which went
through the 1CPC and four of which were arranged throught the ICJ. Overall, more than one-half of the
placements arranged by the local mental health agencies were processed through an interstate agreement.
TABLE 45-13. UTAH: NUMBER OF PLACEMENTS AND THE UTILIZATIONOF INTERSTATE COMPACTS BY LOCAL AGENCIES IN 1978
Children Placed Out of State
Number of CHILDREN
Education Mental Health
CHILDREN PLACED BY AGENCIESREFOIRITNG FOUR OR UESS PLACEMENTS 5 5
Number Placed with Compact Use 0 0
Number Placed without Compact Use 5 5
Number Placed with CompactUse Unknown
0 0
CHILDREN PLACED BY PHASE II AGENCIES 0 53
Number Placed with Compact Usea 32
Number through interstate Compacton the Placement of Children 28
Number through InterstateCompact on Juveniles
4
Number through InterstateCompact on Mental Healthb
Number Placed without Compact Use19
Number Placod will, Compact UseUnknown
2
TOTALS
Number of CHILDREN Placed Out
of State5 58
Number of CHILDREN Placedwith Compact Use
0 32
Number of CHILDREN Placed withoutCompact Use
5 24
Number of CHILDREN Placedwith CoMpact Use Unknown
0 2
-- denotes Not Applicable.
a. If an agency reported using a compact but could not report the number
of placements arranged through the specific compact, one placement is indicated
as compact arranged and the others are included in the category "number placed
with compact use unknown."
b. Utah had not enacted the Interstate Compact on Mental Health in 1978.
UT-17
215

Figures 45-4 and -5 further illustrate compact utilization in terms of percentages of childrenplaced out of Utah which were processed through an interstate compact office.
FIGURE 45-4, UTAH: UTILIZATION OF INTERSTATE COMPACTSBY LOCAL EDUCATION AGENCIES IN 1978
5
CHILDREN PLACEDOUT OF STATE BY
UTAH LOCALEDUCATIONAGENCIES
UT-18
Ac,
iPP
14.01P4Ibon 14oe
Milm =MI= alliiM 0111111M .11NMEND .11/0 111
21 6
0% COMPACT ARRANGED
" COft7P4cr
4/Se Nlp
0
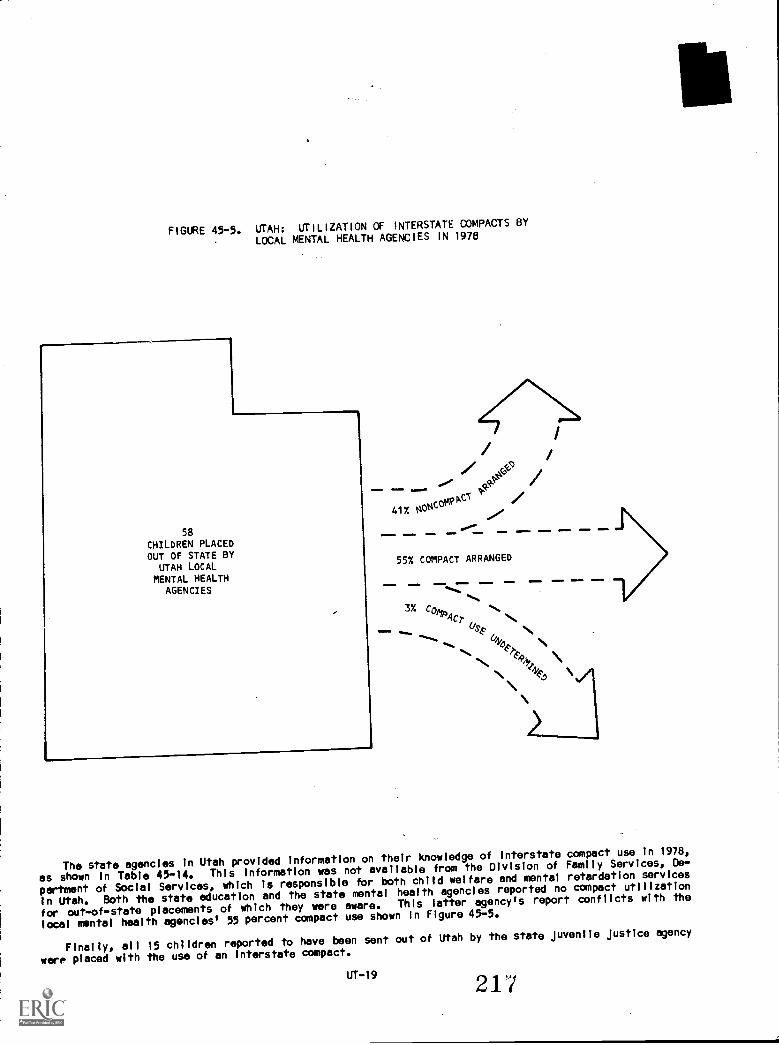
FIGURE 45-5, UTAH: UTILIZATION OF INTERSTATE COMPACTS BY
LOCAL MENTAL HEALTH AGENCIES IN 1978
58
CHILDREN PLACEDOUT OF STATE BY
UTAH LOCALMENTAL HEALTH
AGENCIES
,ee
9-e /t$.
ottcowNcl41%
11111 gmmair
=11
55% COMPACT ARRANGED
3% C0
4p4$> \...
% \
\
The state agencies In Utah provided information on their knowledge of interstate compact use in 1978,
as shown In Table 45-14. This information was not available from the Division of Family Services, De-
partment of Social Services, which Is responsible for both child welfare and mental retardation services
In Utah. Both the state education and the state mental health agencies reported no compact utilization
for out-of-state placements of which they were aware. This latter agency's report conflicts with the
local mental health agencies' 55 percent compact use shown In Figure 45-5.
Finally, all 15 children reported to have been sent out of Utah by the state Juvenile Justice agency
were placed with the use of an Interstate compact.
UT-19 217
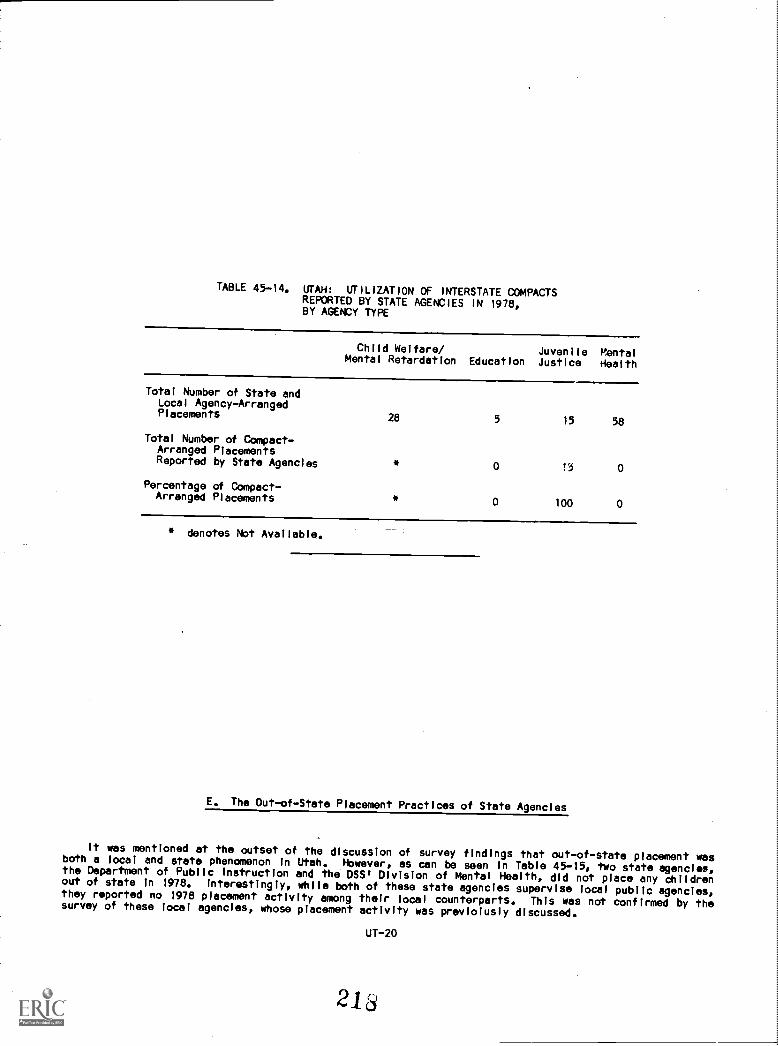
TABLE 45-14. UTAH: UTiLiZATION Of INTERSTATE COMPACTSREPORTED BY STATE AGENCIES IN 1978,BY AGENCY TYPE
Child Welfare/Mental Retardation Education
JuvenileJustice
MentalHealth
Total Number of State andLocal Agency-ArrangedPlacements 28 5 15 58
Total Number of Compact-Arranged PlacementsReported by State Agencies * 0 15 0
Percentage of Compact-Arranged Placements * 0 100 0
* denotes Not Available.
E. The Out-of-State Placement Practices of State Agencies
It was mentioned at the outset of the discussion of survey findings that out-of-state placement wasboth a local and state phenomenon In Utah. However, as can be seen In Table 45.45, two state agencies,the Department of Public Instruction and the DSS1 Division of Mental Health, did not place any childrenout of state In 1978. Interestingly, while both of these state agencies supervise local public agencies,they reported no 1978 placement activity among their local counterparts. This was not confirmed by thesurvey of these local agencies, whose placement activity was previolusly discussed.
UT-20
21d

The state agency responsible for child welfare dnd mental retardation services, the MS' Division of
Family Services, reported assisting with 28 place, ants, although specific Involvement was undetermined.
The State Juvenile Court reported 15 children placed out of Utah for which no public funding was involved
In 1978.
TABLE 45-15. UTAH: ABILITY OF STATE AGENCIES TOREPORT THEIR INVOLVEMENT IN ARRANGINGOUT-OF-STATE PLACEMENTS IN 1978
Types of involvement
Number of CHILDREN ReportedPlaced during 1978 by State Agencies
Child Welfare/Mental Retardation Education
JuvenileJustice
MentalHealth
State Arranged and Funded * 0 0 0
Locally Arranged butState Funded 0 0
Court Ordered, but StateArranged and Funded * 0 0 0
Subtotal: PlacementsInvolving StateFunding * 0 0 C
Locally Arranged andFunded, and Reportedto State 0 0
State Helped Arrange,but Not Required byLaw or Did Not Fundthe Placement 01 0 0
Other 0 0 15 0
Total Number ofChildren Placed Outof State with StateAssistance orKnowledged 28 0 15 0
* denotes Not Available.-- denotes Not Applicable.
a. Includes all out-of-state placements known to officials in the par-
ticular state agency. In some eases, this figure consists of placements which
did not directly Involve affirmative action by the state agency but may simply
Indicate knowledge of certain out-of-state placements through case conferences
or through various forms of Informal reporting.
Information about the destination e4 children who were reported by the state agencies to have been
placed out of Utah In 1978 was not available from either placing agency. The conditions and statuses of
children reported placed out of state by these agencies were reported and follows In Table 45-16. The
Division of Family Services reported the out-of-state placement of children having a wide variety of the
characteristics which were offered for description. The state Juvenile Justice agency, In contrast,
reported the out-of-state placement of only Juvenile delinquents. These children were most frequently
sent to relatives, homes in other states by both state agencies.
UT-21
213

TABLE 45-16. UTAH: CONDITIONS OF CHILDREN PLACED OUT OfSTATE IN 1978, AS REPORTED BY STATE AGENCIES,BY AGENCY TYPE
Types of Conditions
Agency TypeaChild Welfare/
Mental Retardation Juvenlle Justice
Physically Handicapped r X 0
Mentally Handicapped X 0
Developmentally Disabled X 0
Unruly/Disruptive X 0
Truants X 0
Juvenlle Delinquents X X
Emotionally Disturbed X 0
Pregnant 0 0
Drug/Alcohol Problems 0 0
Battered, Abandoned, orNeglected X 0
Adopted Children X 0
Foster Children X 0
Other 0 0
a. X indicates conditions reported.
Financial information was also sought from state agencies. They were asked to report out-of-stateplacement expenditures from federal, state, and local funds. This information was not available from theDivision of Family Services. The State Juvenile Court reported that no funds were expended for its out-of-state placements made In 1978.
F. State Agencies' Knowledge of Out-of-State Placements
An InterestIng contrast appears In out-of-state placement information collected from Utah state andlocal agencles, as shown In Table 45-17. Those state agencles which offer services directly to Utah'syouth population were able to report their incidence of out-of-state placement in 1978. However, stateagencies with local counterparts, education and mental health, Inaccurately reported that no out-of-stateplacements occurred In the reporting year.
UT-22
229
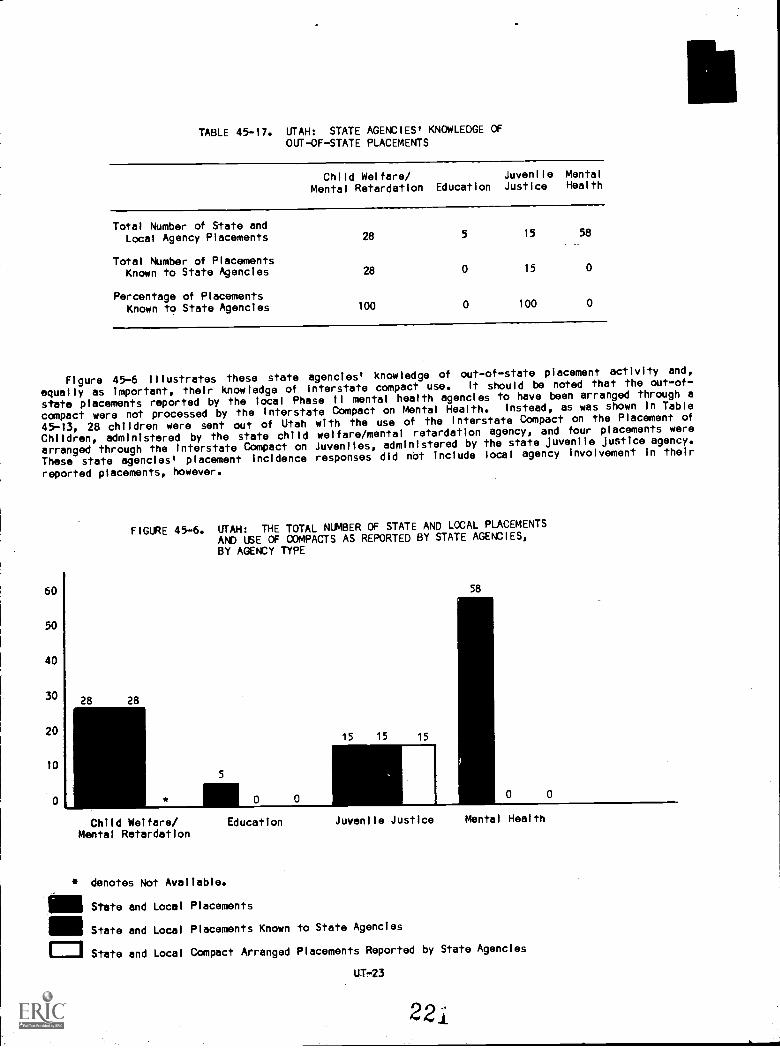
TABLE 45-17. UTAH: STATE AGENCIES' KNOWLEDGE OFOUT-OF-STATE PLACEMENTS
Child Welfare/Mental Retardation Education
JuvenileJustice
MentalHealth
Total Number of State andLocal Agency Placements 28 5 15 58
Total Number of PlacementsKnown to State Agencies 28 0 15 0
Percentage of PlacementsKnown to State Agencles 100 0 100 0
Flgure 45-6 Illustrates these state agencies' knowledge of out-of-state placement activity and,
equally as Important, thelr knowledge of interstate compact use. It should be noted that the out-of-
state placements reported by the local Phase II mental health agencies to have been arranged through a
compact were not processed by the Interstate Compact on Mental Health. Instead, as was shown In Table
45-13, 28 chlldren were sent out of Utah with the use of the Interstate Compact on the Placement of
Children, administered by the state child welfare/mental retardation agency, and four placements were
arranged through the Interstate Compact on Juveniles, administered by the state Juvenile Justice agency.
These state agencies' placement incidence responses dld not Include local agency involvement in their
reported placements, however.
60
50
40
30
20
10
FIGURE 45-6, UTAH: THE TOTAL NUMBER OF STATE AND LOCAL PLACEMENTS
AND USE OF COMPACTS AS REPORTED BY STATE AGENCIES,BY AGENCY TYPE
28 28
15 15 15
5
0 0 1111-1Child Welfare/ Education
Mental Retardation
denotes Not Available.
State and Local Placements
State and Local Placements Known to State Agencles
State and Local Compact Arranged Placements Reported by State Agencies
UTr-23
58
Juvenlle Justice Mental Health
221

V. CONCLUDING REMARKS
Upon review of the survey findings from Utah state and local public agencies, several conclusions canbe made about their out-of-state placement practices. A primary finding Is the lack of knowledge withinboth the state education agency and the state mental health agency about their local agency counterparts'involvement In out-of-state placement. The supervisory role played by these state agencies apparentlydoes not include reporting procedures for such placements. A few other trends emerge from the surveyfindings which deserve mention.
The children placed out of Utah In 1978 by local mental health agencies experienced a widevariety of conditions and statuses, not only mental Illness or emotional disturbance. Over 55percent of these children were placed with the use of an Interstate compact, 28 of themthrough the Interstate Compact on tht Placement of Children. The ICPC does not provide forplacements to private psychiatric hosifltals, therefore supporting the notion that more thanmental health services were sought for these children outside of Utah.
There appears to be some conflict as to the availability of services for children In Utah.Mental health agencies reporting their reasons for out-of-state placement stated that Utahlacked comparable services to those In the receiving state, children failed to adapt to in-state programs, and placement was arranged to avoid public institutionalization. However, 92percent of nonplacing local agencies reported they found it unnecessary to place children outof Utah because there were sufficient services within the state.
The reader Is encouraged to compare national trends described In Chapter 2 with the findings whichrelate to specific practices In Utah in order to develop further conclusions about the state's involve-ment with the out-of-state placement of children.
FOOTNOTE
1. General information about states, counties, cities, and SMSAs Is from the special 1975 populationestimates based on the 1970 national census contained in the U.S. Bureau of the Census, County and CityData Book, 1977 (A Statistical Abstract Supplement), Washington, D.C., 1978.
IrtfOrmerrerd" about direct general Stare and local total per capita expenditures and expenditures foreducation and public welfare were also taken from data collected by the U.S. Bureau of the Census andthey appear In Statistical Abstract of the United States: 1979 (100th Edition), Washington, D.C.,
The 1978 estimated population of persons eight to 17 years old was developed by the National Centerfor Juvenile Justice using two sources: the 1970 national census and the National Cancer Institute 1975estimated aggregate census, also prepared by the U.S. Bureau of the Census.
UT-24
222

A PROFILE OF OUT-OF-STATE PLACEMENT POLICY AND PRACTICE IN WASHINGTON
I. ACKNOWLEDGMENTS
The Academy gratefully ackhowledges the assistance of the many state and local public officials who
contributed their time and effort to the project, particularly Dele Moberg, Supervisor, Special and
institutional Education Section, Division of Special Services, Department of Public Instruction; Dan
Badman, Interstate Compact Program Manager, Office of Family, Children, and Adult Services, Department of
Social and Health Services; Margaret M. Feist, Compact Administrator, Division of Juvenile Rehabilitation,
Department of Social and Health Services; Pauline Toistad, Compact Administrator, Division of Developmen-
tal Disabilities, Department of Social and Health Services; Chip Barker, Director of Consultation and
Education, Pacific County Mental Health Services; and Edward Kenealy, Program Administrator, Children and
Adolescent Services, Division of Mental Health, Department of Social and Health Services.
II. METHODOLOGY
Information was systematically gathered about Washington from a variety of sources using a number of
data collection techniques. First, a search for relevant state statutes and case law was undertaken.
Next, telephone interviews were conducted with state officials who were able to report on agency policies
and practices with regard to the out-of-state placement of children. A mall survey was used, as a follow-
up to the telephone interview, to solicit information specific to the out-of-state placement practices of
state agencies and those of local agencies subject to state regulatory control or supervisory oversight.
An assessment of out-of-state placement policies and the adequacy of information reported by state
agencies suggested further survey requirements to determine the Involvement of public agencies In
arranging out-of-state placements. Pursuant to this assessment, further data collection was undertaken
if it was necessary to:
verify out-of-state placement data reported by state government about local agencies; and
collect local agency data which was not available from state government.
A summary of the data collection effort In Washington appears below In Table 48-1.
WA-1
223

TABLE 48-1. WASHINGTON: METHODS OF COLLECTING DATA
Levels ofGovernment
Survey Methods, by Agency TypeChild
Welfare EducationJuvenile MentalJustice Health
MentalRetardation
State TelephoneAgencies interview
Mailed Survey:DSHSofficials
LocalAgencies
Not Applicable(StateOffices)
Telephoneinterview
Mailed Survey:DPI officials
TelephoneSurvey: 10
percent sampleof all 301school
districts toverify stateinformatione
TelephoneInterview
Mailed Survey:DSHS officials
TelephoneSurvey: All
32 localprobationoffices
Telephoneinterview
Mailed Survey:DSHS officials
TelephoneSurvey: All13 localmental healthcenters
Telephoneinterview
Mailed Survey:DSHS officials
Not Applicable(StateOffices)
a. Information attributed in this profile to the state's school districts was gatheredfrom the state education agency and the ten percent sample.
III. THE ORGANIZATION OF SERVICES AND OUT-OF-STATE PLACEMENT POLICY IN 1978
A. Introductory Remarks
Washington has the 20th largest land area (66,570 square miles) and Is the 22nd most populated state(3,553,231) in the United States. It has 37 cities with populations over 10,000 and ten cities withpopulations over 30,000. Seattle is the most populated city In the state, with approximately 500,000people. Olympia, the capital, is the 12th most populated city in the state with a population of almost27,000. Washington has 39 counties. The estimated 1978 population of persons eight to 17 years old was621,233.
Washington has seven Standard Metropolitan Statistical Areas (SMSAs). One of the SMSAs includes aportion of a contiguous state, Oregon. The only other contiguous state is Idaho, and another border isshared with Canada.
Washington is ranked 15th nationally in total state and local per capita expenditures, 12th in percapita expenditures for education, and 19th in per capita expenditures for public welfare.1
B. Child Welfare
The Department of Social and HealthIervices (DSHS) is a state umbrella agency in Washington adminis-tering child welfare, corrections, mental health, and mental retardation serviceS: The Division of Com-munity Program Development in DSHS is the lead agency for providing child welfare services. Programsinclude protective services, adoption, family and group foster care, and day care services. The divisionoperates a system of local offices to provide services through the state, which are supervised by sixregional offices.
All out-of-state placements are reported to be made through the Interstate Compact on the Placementof Children (ICPC). Washington has been a member of the compact since 1974.
WA-2
224

C. Education
The Department of Public Instruction (DPI) administers educational programs for the State of
Washington, including those for handicapped children. The 301 local school districts provide these ser-
vices In addition to the normal curriculum for grades K-12. All out-of-state placements made by school
districts are funded totally with state funds and must be approved by the State Board of Education. DPI
personnel report that the 301 local school districts cannot place children out of state without reporting
the Information to their agency.
D. Juvenile Justice
County superior courts have jurisdiction over dependent, neglected, and delinquent children In
Washington. Adjudicated delinquents are either committed to the Division of Juvenile Rehabilitation
(0JR) In the Department of Social and Health Services or are placed on court probation and classified as
juvenile offenders. Under a 1977 state law, courts were prohibited from committing status offenders to
the DJR for institutionalization and from placing them on probation as juvenile offenders. Status offen-
ders are now served by local offices of the DSHS.
Parole and aftercare services are provided by the DJR. There are six regional parole offices within
the state. Juvenile probation services are provided at the local level by the county superior courts.
These locally operated juvenile probation offices service muiticounty areas. Washington's local juvenile
court system can place children independently of the state.
The DJR is responsible for administeringthe interstate Compact on Juveniles (ICJ). Washington has
been a member of the compact since 1955. According to state sources, the department does not provide
funding for placing children In other states and makes no placements other than those under the compact.
However, Washington's county-operated juvenile court system can place children Independently of the state
office.
E. Mental Health and Mental Retardation --
Mental retardation services In Washington are administered through the Division of Developmental
Disabilities within the Department of Social and Health Services from the central office and its six
regional offices.
Community mental health services and state hospital programs are supported by the Division of Mental
Health of DSHS. There are 33 mental health deliveryorganizations In Washington serving its 39 counties
because of the presence of some multicounty service areas. A majority of the mental health delivery
organizations deliver community services by subsidizing private agencies. It has been reported that 13
counties have their own mental health programs.
Funding tor mental health Is predominantly a state function, with county funds and client fees making
up the balance. The state issues grants-in-aid to the counties through the county commissioners who
decide whether to contract with private agencies or deliver services directly.
The State of Washington Is also a member of the Interstate Compact on Mental Health and has been a
member of the compact since 1965.
IV, FINDINGS FROM A SURVEY OF OUT-OF-STATEPLACEMENT PRACTICES IN 1978
This section of the Washington profile presents the results of the survey of state and local agencies
in summary tables, and gives some descriptive remarks about the information that they offer. The Infor-
mation has been organized In such a way that it addresses the issues and concerns that were raised in
Chapter 1 with regard to the placement of children out of their state of residence.
WA-3
225

A. The Number of Children Placed in Out-of-State Residential Settings
The presentation of survey findings begins with a summary of all out-of-state placement activity thatwas discovered among state and local agencies In Washington. This summary, contained ill Table 48-2, Isoffered at this point to provide some indication about the number of children to which the subsequentpolicy and practices information refer.
Table 48-2 Indicates that the majority of out-of-state placements made by Washington public agenciescame from the state child welfare agency. Placement by this agency accounted for almost 60 percent ofthose reflected In Table 48-2.Out-of-state placements were reported in varying degrees by the remainingpublic agencies. The local probation offices reported the next highest number of out-of-state place-ments, 94 children, and the state mental retardation agency and the local school districts reporting veryfew placements, with only two and and one children, respectively, leaving Washington in 1978. The stateeducation and mental health agencies and the local mental health agencies reported no out-of-state place-ment activity in that year.
TABLE 48-2, WASHINGTON: NUMBER OF OUT-OF-STATE PLACEMENTSARRANGED BY STATE AND LOCAL PUBLIC AGENCIES IN1978, BY AGENCY TYPE
Number of CHILDREN, by Agency TypeLevers ofGovernment
ChildWelfare Education
JuvenileJustice
MentalHealth
MentalRetardation Total
State AgencyPlacementsa 183 0 26 0 2 211
Local AgencyPlacements
1 94 0 95
Total 183 i 120 0 2 306
-- denotes Not Applicable.
a. May Include placements which the state agency arranged and funded Inde-pendently or under a court order, arranged but did not fund, helped arrange, andothers directly Involving the state agency's assistance or knowledge. Refer toTable 48-15 for specific information regarding state agency involvement Inarranging out-of-state placements.
Table 48-3 further defines out-of-state placement activity among local Washington agencies by pre-senting incidence figures for every agency and the county it serves. It Is important to bear In mindthat the jurisdiction of school districts contacted Is smaller than the counties containing them. Forthat reason, multiple agencies may have reported from each county and the incidence reports In the tableare the aggregated reports of all school districts within them. The only placement initiated In 1978 bya local education agency was made by a school district in Pierce County, also the Tacoma SMSA. No place-ments were reported by the juvenile probation offices serving that county; however, surrounding counties'juvenile justice agencies did report sending children out of state in that year. Thurston County, Inparticular, had the highest incidence report of placements made by a local probation office. Twenty-fivechildren were estimated to have been sent outside of Washington in 1978 for care or treatment from thiscounty, which Is not pert of an SMSA. Six of the eight Washington counties which are located In SMSAsdid report juvenile justice placements: Benton, Clark, Franklin, King, Spokane, and Yakima. In con-trast, only 17 percent of the reported juvenile justice placements were made by agencies serving countieswith juvenile populations under 5,000. Also of interest Is that 40 children, or 43 percent of the total,were placed out of Washington by agencies In six counties bordering another state or Canada.
WA-4
226

TABLE 48-3. WASHINGTON: 1978 YOUTH PDPULAT1ONS AND THENUMBER Cf OUT-OF-STATE PLACEMENTS ARRANGEDBY LOCAL AGENCIES IN 1978, BY COUNTY ANDAGENCY TYPES REPORTING PLACEMENTS
County Name
1978Populationa(Age 8-17)
Number of CHILDRENPlaced during 1978
EducationJuvenileJustice
Adams 2,637 0 0
Asotin 2,662 0
Benton 15,614 0
Chelan 6,725 0 0
Clallam 6,879 0
Clark 29,321 0 12
Columbla 685 0
Cowlitz 13,356 0 0
Douglas 3,460 0 1
Ferry 829 0
Franklln 5,199 0
Garfield 482 u
Grant 8,830 0 0
Grays Harbor 11,048 0 2
Island 5,496 0 0
Jefferson 1,821 0 --
King 193,695 0 4 est
Kitsap 19,257 0 0
Kittitas 3,462 0 5 est
Klickltat 2,519 0 6
Lewis 8,708 0 0
Lincoln 1,611 0 0
Mason 3,806 0 0
Okanogan 5,202 0
Pacific 2,463 0
Pend Oreille 1,310 0
Pierce 72,775 1 0
San Juan 775 0 2 est
Skaglt 8,778 0 5
Skamania 1,157 0 0
Snohomish 51,019 0 *
Spokane 52,222 0 8
Stevens 4,535 0 --
Thurston 16,861 0 25 est
Wahklakum 684 0 --
Walla Walla 6,433 0 --
Whatcom 15,114 0 4
Whitman 4,572 0 0
Yakima 29,231 0 5 est
Multicounty Jurisdictions
Clallam, Jefferson5 est
Columbia, Walla Walla0
Franklin, Benton8 est
Ferry, Okanogan0
Garfield, Asotin0
WA-5

TABLE 48-3. (Continued)
County Name
1978Populationa(Age 8-17)
Number of CHILDRENPlaced during 1978
JuvenileEducation Justice
Multicounty Jurisdictions (Continued)
Stevens, Pend Oreille
Pacific, Wahkiakum
0
Zest
Total Number ofPlacements Arrangedby Local Agencies(total may includeduplicate count)
1 94 est
Total Number of LocalAgencies Reporting 301 32
* denotes Not Available.-- denotes Not Applicable.
a. Estimates were developed by the National Center of Juvenile Justiceusing data from two sources: the 1970 national census and the National Cancerinstitute 1975 estimated aggregate census.
B. The Out-of-State Placement Practices of Local Agencies
This section on the results of the survey of agencies under local government begins with a descriptionof the extent of involvement of local agencies In out-of-state placements. Table 48-4 indicates that thestudy received an excellent response rate among local agencies In Washington. All agencies contactedparticipated in the survey and only one local probation office could not report on Its placement activityIn 1978.
'Only one local school district contacted reported placing children into other states for care andtreatment. The local probation offices were involved In out-of-state placements to a greater extent,with almost one-half of the agencies reporting children placed out.of Washington. In contrast, none ofthe mental health agencies placed any children outside Washington In 1978.
WA-6
22d

TABLE 48-4. WASHINGTON: THE INVOLVEMENT OF LOCAL PUBLIC
AGENCIES IN ARRANGING OUT-OF-STATE PLACEMENTSIN 1978
Response Categories
Number of AGENCIES, by Agency Type
Education Juvenile Justice Mental Health
Agencies Which ReportedOut-of-State Placements 1 15 . 0
Agencies Which Did NotKnow If They Placed,or Placed but Could NotReport the Number ofChildren 0 1 0
Agencies Which Did NotPlace Out of State 300 16 13
Agencies Which Did NotParticipate In theSurvey 0 0 0
_Total Local Agencies 301 32 13
All Washington local agencies whICh did not place any children out of the state in 1978 were asked to
report why no such, placements occurred. Table 48-5 shows that over 99 percent of all schobl districts
that did not place any children reported that sufficient services were available In Washington to meet
service needs. Ninety-two percent also reported that parents disapproved of such placements.(specified
in the "other" category), Three school districts reported other restrictions, including the lack of
authority or funds and agency policy restrictions.
Mostrof the local juvenile justice agencies not involved In out-of-state placements In 1978 also
cited the presence of sufficient services In Washington preventing the use of out-of-state care. The
majority of them also reported the same restrictions mentioned by the local school districts. The local
mental health agencies were divided in their respolses, although all mentioned some form of restriction.
Such responses include lack of funds, agaInst agency policy, and the lack of statutory authority.
WA-7
223
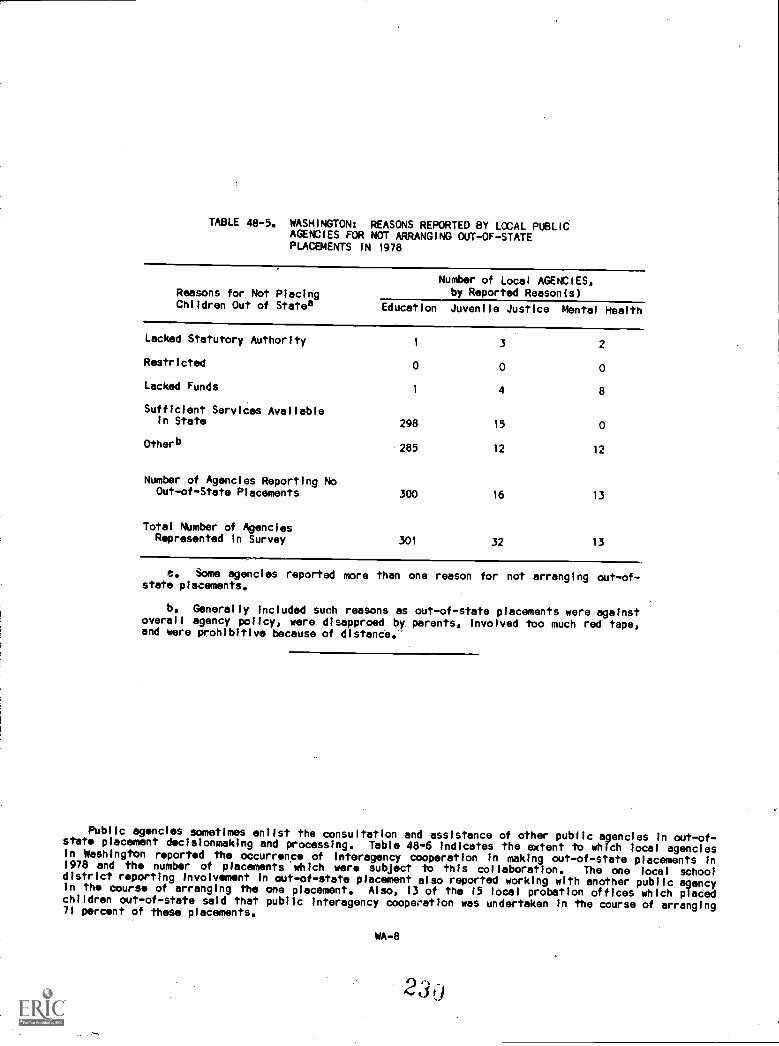
TABLE 48-5. WASHINGTON: REASONS REPORTED BY LOCAL PUBLICAGENCIES FOR NOT ARRANGING OUT-OF-STATEPLACEMENTS IN 1978
Reasons for Not PlacingChildren Out of Statea
Number of Local AGENCIES,by Reported Reason(s)
Education Juvenile Justice Mental Health
Lacked Statutory Authority1 3 2
Restricted 0 0 0
Lacked Funds1 4 8
Sufficient Services Availablein State 298 15 0
Other(' 285 12 12
Number of Agencies Reporting NoOut-of-State Placements 300 16 13
Total Number of AgenciesRepresented in Survey 301 32 13
a. Some agencies reported more than one reason for not arranging out-of-state placements.
b. Generally included such reasons as out-of-state placements were againstoverall agency policy, were disapproed by parents, involved too much red tape,and were prohibitive because of distance.'
Public agencies sometimes enlist the consultation and assistance of other public agencies in out-of-state placement decisionmaking and processing. Table 48-6 indicates the extent to which local agenciesIn Washington reported the occurrence of interagency cooperation in making out-of-state placements in1978 and the number of placements which were subject to this collaboration. The one local schooldistrict reporting involvement In out-of-state placement also reported working with another public ogencyIn the course of arranging the one placement. Also, 13 of the 15 local probation offices which placedchildren out-of-state said that public interagency cooperation was undertaken in the course of arranging71 percent of these placements.
WA-8
!_)

TABLE 48-6. WASHINGTON: THE EXTENT OF INTERAGENCYCOOPERATION TO ARRANGE OUT-OF-STATEPLACEMENTS BY LOCAL AGENCIES IN 1978
Number and Percentage, by Agency Type
Eduoqion Juvenile Justice
Number Percent Number Percent
AGENCIES Reporting Out-of-StatePlacementaa I 0.3 15 47
AGENCIES Reporting Out-of-StatePlacements with interagencyCooperation I 100 13 87
Number of CHILDREN Placed Out ofState 1 100 94 100
Number of CHILDREN Placed Out ofState with InteragencyCooperation 1 100 67 71
a. See Table 48-4.
All local agencies placing children out of Washington In 1978 were asked to describe the statuses or
conditions of the children placed, according to a variety of descriptions offered. The responses of local
placing agencies appear In Table 48-7. The one responding schooldistrict reported that the child placed
was mentally iii or emotionally disturbed and required special education. Several of the reporting pro-
bation offices also mentioned these categories of children as needing out-of-state care. However, the
highest frequency of response from these agencies was given to the conditions or statuses most generally
serviced by this agency type, including Juvenile delinquency,unruly/disruptive behavior, and truancy.
Also mentioned to a lesser degree were battered, abandoned, or neglected; adopted; and mentally retarded
or developmentally disabled children.
TABLE 48-7. WASHINGTON: CONDITIONS OF CHILDREN PLACED
OUT OF SIATE IN 1978, AS REPORTED BY
LOCAL AGENCIES
Types of Conditionsa
Number of AGENCIES Reporting
Education Juvenile Justice
Physically Handicapped0 0
Mentally Retarded or Developmentally Disabled 0 1
Unruly/Disruptive0 II
Truant0 8
Juvenile Delinquent0 15
Mentally III/Emotionally DisturbedI 2
Pregnant0 0
Drug/Alcohol Problems0 5
WA-9
23i
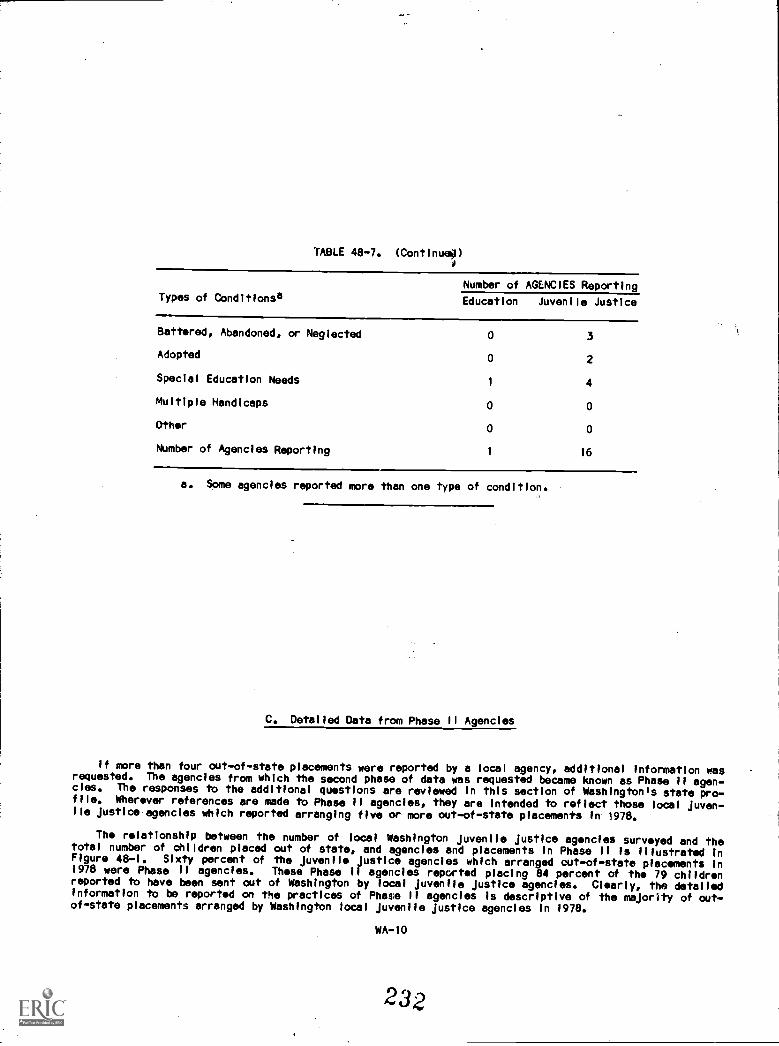
TABLE 48-7. (Continue?)
Number of AGENCIES ReportingTypes of Conditionsa Education Juvenile Justice
Battered, Abandoned, or Neglected 0 3
Adopted 0 2
Special Education Needs 1 4
Multiple Handicaps 0 0
Other 0 0
Number of Agencies Reporting1 16
a. Some agencies reported more than one type of condition.
C. Detailed Data from Phase II Agencies
If more than four out-of-state placements were reported by a local agency, additional information wasrequested. The agencies from which the second phase of data was requested became known as Phase II agen-cies. The responses to the additional questions are reviewed in this section of Washington's state pro-file. Wherever references are made to Phase II agencies, they are intended to reflect those local juven-ile justice agencies which reported arranging five or more out-of-state placements in i978.
The relationship between the number of local Washington juvenile justice agencies surveyed and thetotal number of children placed out of state, and agencies and placements in Phase II is illustrated inFigure 48-1. Sixty percent of the juvenile justice agencies which arranged cut-of-state placements in1978 were Phase II agencies. Thse Phase 11 agencies reported placing 84 percent of the 79 childrenreported to have been sent out of Washington by local juvenile justice agencies. Clearly, the detailedinformation to be reported on the practices of Phase 11 agencies Is descriptive of the majority of out-of-state placements arranged by Washington local juvenile justice agencies in 1978.
WA-10
232

FIGURE 48-1. WASHINGTON: RELATIONSHIP BETWEEN THE NUMBER
OF LOCAL AGENCIES SURVEYED AND PLACEMENTSREPORTED, AND AGENCIES AND PLACEMENTS INPHASE II, BY AGENCY TYPE
JuvenileJustice
Number of AGENCIES
Number of AGENCIES ReportingOut-of-State Placements In1978
Number of AGENCIES ReportingFive or More Placements in1978 (Phase II Agencies)
Number of CHILDREN PlacedOut of State In 1978
Number of CHILDREN Placedby Phase II Agencies
Percentage of Reported PlacementsIn Phase II
a
a
The geographic locations of the Washington counties served by Phase II Juvenile Justice agencies are
illustrated in Flgure 48-2. 01 the eleven counties (two agencles have multicounty Jurisdictions), five
are located In or comprise an SMSA: Benton and Franklin, Clark, Spokane, and Yakima. Five Phase II
counties are clustered in the south-central region of Washington, with two counties bOi*dering Oregon. The
remaining six counties ars scatteredthroughout the state, with one bordering Oregon and another Idaho.
WA-11

,County
A-1. BentonA-2. Franklin8-1. Clallam8-2. JeffersonC. ClarkD. KittitasE. KlickitatF. SkagitG. SpokaneH. ThurstonI. Yakima
a31
r<71
KEY
Juvenile Justice Phase IIAgency Jurisdiction

The local Phase II agencies were asked to report the destinations of the children. This information
follows In Table 48-8. The table indicates that although contiguous and regional states were more fre-
quently used forWashington children sant by the local probation offices, children were also sent to ten
other, and sometimes distant states, such as New York. The destinations for 23 percent of the children
reported to have left Washington In 1978 was not available.
TABLE 48-8, WASHINGTON: DESTINATIONS OF CHILDREN PLACED BYLCCAL PHASE II AGENCIES IN 1978 .
Destinations of ChildrenPlaced Out of State Juvenile Justice
Number of CHILDREN Placed
Alaska1
Arizona3
California23
Colorado2
Idaho7
Iowa1
Louisiana2
Mississippi1
Montana1
New York 1
Oregon16
Texas1
Utah2
Placements for WhichDestinations COuld Notbe Reported by Phase IIAgencies
18
Total Number of Phase IIAgencies
9
Total Number of ChildrenPlaced by Phase IIAgencies
79
The use of contiguous states by Washington Phase II probation offices is more clearly shown In Figure
48-3. Thirty-eight percent of all placements for whichdestination Information was reported went to the
two states contiguous to Washington, and no children were sent to Canada In that year.
WA-13
236
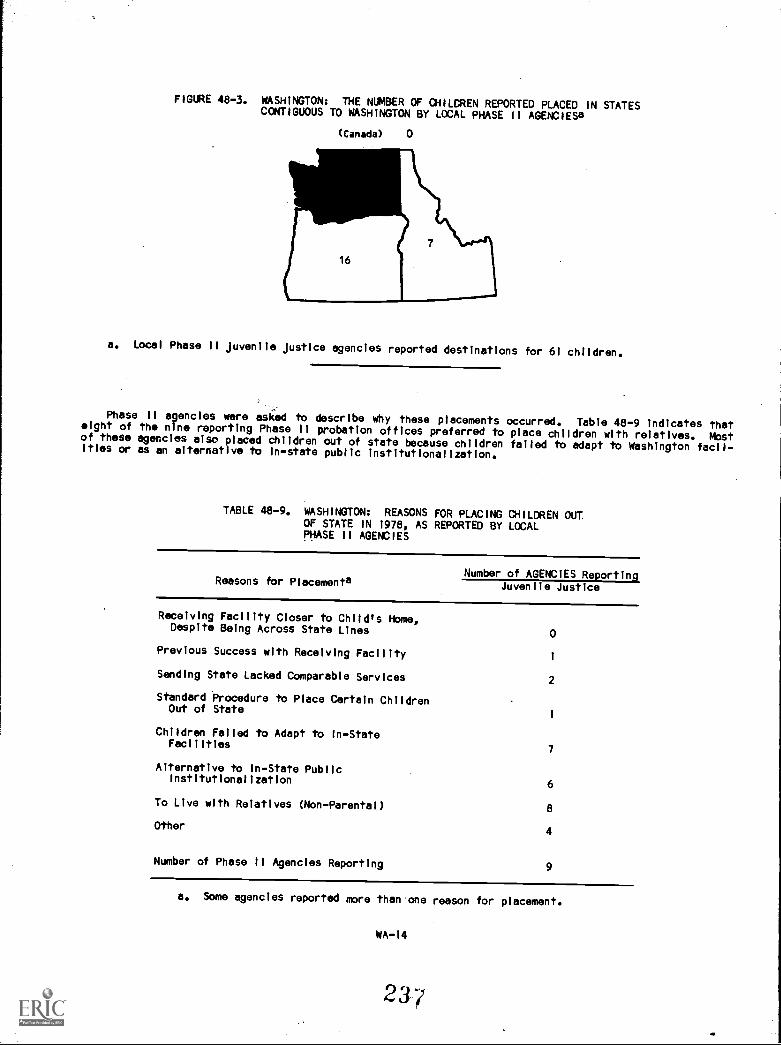
FIGURE 48-3. WASHINGTON: THE NUMBER OF CHILDREN REPORTED PLACED IN STATESCONTIGUOUS TO WASHINGTON BY LOCAL PHASE II AGENCIEsa
(Canada) 0
a. Local Phase II Juvenile Justice agencies reported destinations for 61 children.
Phase II agencies were asked to describe why these placements occurred. Table 48-9 indicates thateight of the nine reporting Phase II probation offices preferred to place children with relatives. Mostof these egencies also placed children out of state because children failed to adapt to Washington facil-ities or as an alternative to in-state public institutionalization.
TABLE 48-9. WASHINGTON: REASONS FOR PLACING CHILDREN OUTOF STATE IN 1978, AS REPORTED BY LOCALPHASE II AGENCIES
Number of AGENCIES ReportingReasons for Placementa
Juvenile Justice
Receiving Facility Closer to Child's Home,Despite Being Across State Lines 0
Previous Success with Receiving Facility1
Sending State Lacked Comparable Services 2
Standard 'Procedure to Place Certain ChildrenOut of State
1
Children Failed to Adapt to In-StateFacilities
7
Alternative to In-State PublicInstitutionalization 6
To Live with Relatives (Non-Parental)8
Other4
Number of Phase II Agencies Reporting 9
a. Some agencies reported mare than one reason for placement.
WA-14

The responses to a question about the type of residential setting to which children were most fre-
quently sent appear in Table 48-10. The results reflect only the responses of nine local Juvenile Justice
agencies, because the question was only asked of those agencies placing flve or more children out of
Washington. The most frequent response to this item was, as In the previous table, that children were
sent to relatives' homes. Single agencies said that they most frequently sent children to residential
treatment or child care facilities, or group homes.
TABLE 48-10. WASHINGTON: MOST FREQUENT CATEGORIES OFRESIDENTIAL SETTINGS USED BY LOCALPHASE 11 AGENCIES IN 1978
Categories ofResidential Settings
Number of AGENCIES Reporting
Juvenile Justice
Residential Treatment/Chlid Care Facility1
Psychiatric Hospital0
Boarding/Military School0
Foster Home0
Group Home1
Relative's Nome (Non-Parental)6
Adoptive Home0
Other0
Number of Phase 11 Agencies Reportingga
a. One Phase II agency which placed flve children out of state reported
that each child went to a different type of setting and, therefore, the
question was not applicable.
Nine Phase II probation offices reported their monitoring practices and the frequency with which they
were undertaken. Quarterly written progress reports, as can be seen In Table 48-11, are received by
seven of the agencies. Written reports were reported by an agency to be required semiannually.
Telephone calls were next most frequently used as a means of monitoring, either on a quarterly basis or
at irregular time intervals. On-site visits were done by one agency at an irregular time interval.
TABLE 48-11. WASHINGTON:MONITORING PRACTICES FOR OUT -
OF -STATE PLACEMENTS AS REPORTED BY LOCAL
PHASE II AGENCIES IN 1978
Methods of MbnitorIng
Frequency ofPractice Juvenile Justice
Number of AGENC1ESa
Written Progress Reports Quarterly 7
SemiannuallyAnnually 0
Otherb 0
WA-15
238

TABLE 48-11. (Continued)
Frequency ofMethods of Monitoring Practice
Number of AGENCIESa .
Juvenile Justice
On-Sit Visits
Telephone Calls
Other
Total Number of Phase 11Agencies Reporting
QuarterlySemiannuallyAnnuallyOtherb
QuarterlySemiannuallyAnnuallyOtherb
QuarterlySemiannuallyAnnuallyOtherb
2
00
5
2
9
a. Some agencies reported more than one method of monitoring.
b. Included monitoring practices which did not occur at regular intervals.
Local agencies placing five or more children out of Washington In 1978 were also asked to report theirexpenditures for placements made In that year. Eight of the probation offices provided this Informationand reported spending no public funds in 1978 for out-of-state placements.
D. Use of Interstate Compacts by State and Local Agencies
Compact utilization by local agencies Is displayed In the followingdifferent factors. Table 48-12 directly deals with the number of localgarding the number of children placed. As can be seen In the table, thedid not process its placement through a compact. This finding is notto a solely educational institution are not subject to any compact provi
tables and figures, each based onagencies using a compact, disre-one placing local school districtunusual because placements made
sions.
All placing local probation offices reported using a compact, primarily the Interstate Compact onJuveniles.
TABLE 48-12. WASHINGTON: UTILIZATION OF INTERSTATECOMPACTS BY LOCAL AGENCIES IN 1978
Local Agencies Which PlacedChildren Out of State
Number of AGENCIES
Education Juvenile Justice
NUMBER OF LOCAL AGENCIES PLACINGFOUR OR LESS OUTDREW
1
Number Using Compacts 0
6
6
WA-16
23d

4111
TABLE 48-12. (Continued)
Local Agencies KnIch PlacedChildren Out of State
Number of AGENCIES
Education Juvenlle Justice
NU43ER Of LOCAL AGENCIES PLACINGFOUR OR LESS CHILutitm (uontInued)
Number Not Using Compacts 1 0
Number with Compact UseUnknown 0 0
NIMBER Of PHASE II AGENCIESPLACING CH1LCREN 0 9
Number Using Compacts
interstate Compact on the Placement
of Children
9
Yes1
No7
Don't Know1
Interstate Compact on Juveniles
Yes7
No1
Don't Know1
Interstate Compact on Mental Health
Yes0
No9
Don't Know0
Number Not Using Compacts0
lemnber with Compact Use Unknown 0
TOTALS
Number of AGEKC1ES PlacingChildren Out of State 1
15
Number of AGENCIES Using Compacts 0 15
Number of AGENCIES Not UsingCompacts 1 0
Number of AGENCIES with CompactUse Unknown 0 0
-- denotes Not Applicable.
In that all of the placing probation offices used an Interstate compact, It Is useful to know what
percentage of placements actually were compact processed. Table 48-13 shows that the one local school
district placement was the only local placement Identified that was not arranged through any compact.
fteever, 33 placements arranged by the local probation offices could not be determined to be compact
processed. The remaining 61 children went through a compact office, of which 49 (80 percent) were iden-
tified as processed through the ICJ.
WA-17
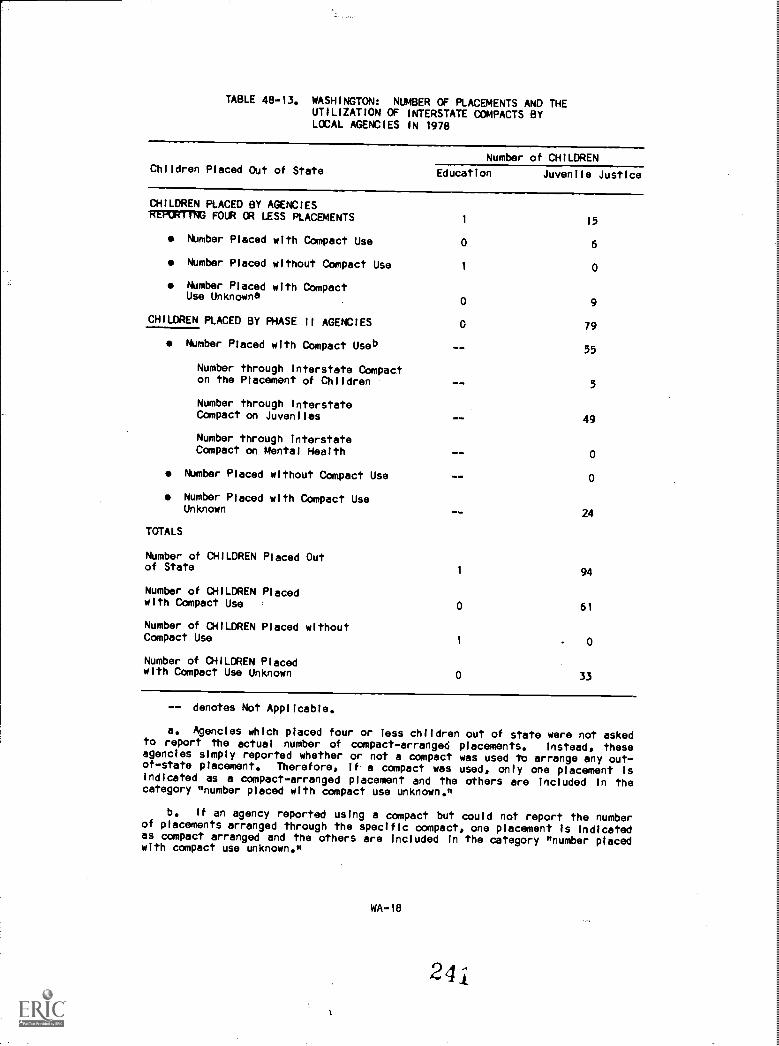
TABLE 48-13. WASHINGTON: NUMBER OF PLACEMENTS AND THEUTILIZATION OF INTERSTATE COMPACTS BYLOCAL AGENCIES IN 1978
Children Placed Out of StateNumber of CHILDREN
Education Juvenile Justice
CHILDREN PLACED BY AGENCIESRETURTING FOUR OR LESS PLACEMENTS
1 15
Number Placed with Compact Use 0 6
Number Placed without Compact Use1 0
Number Placed with CompactUse Unknowna 0 9
CHILDREN PLACED BY PHASE II AGENCIES 0 79
Number Placed with Compact Use') -- 55
Number through interstate Compacton the Placement of Children -- 5
Number through InterstateCompact on Juveniles 49
Number through InterstateCompact on Mental Health -- 0
Number Placed without Compact Use 0
Number Placed with Compact UseUnknown 24
TOTALS
Number of CHILDREN Placed Outof State
1 94
Number of CHILDREN Placedwith Compact Use 0 61
Number of CHILDREN Placed withoutCompact Use
1 0
Number of CHILDREN Placedwith Compact Use Unknown 0 33
-- denotes Not Applicable.
a. Agencies which placed four or less children out of state were not askedto report the actual number of compact-arranged placements. Instead, theseagencies simply reported whether or not a compact was used to arrange any out-of-state placement. Therefore, If a compact was used, only one placement Isindicated as a compact-arranged plaCement and the others are included in thecategory linumber placed wlth compact use unknown0
b. If an agency reported using a compact but could not report the numberof placements arranged through the specific compact, one placement is indicatedas compact arranged and the others are included In the category unumber placedwith compact use unknown.
WA-18
2 4

Figure 48-4 shows that the local probation offices used a compact for at least 65 percent of their
1978 placements made outside of Washington. The local education agency, as previously mentioned, did not
utilize a compact for Its one placement.
FIGURE 48-4. WASHINGTON: UTILIZATION OF INTERSTATE COMPACTS BY LOCALJUVENILE JUSTICE AGENCIES IN 1978
94
CHILDREN PLACEDOUT OF STATE BYWASHINGTON LOCALJUVENILE JUSTICE
AGENCIES
65% COMPACT ARRANGED
State agencies In Washington varied In their reports of interstate compact utilization. Both the
child welfare and the mental retardation agencies reported full use of compacts tor the out-of-state
placements they were involved with In 1978. The state education agency said no placements were processed
through a compact In that year, and the Juvenile justice agency knew of only 26 (22 percent) out-of-state
placements which were arranged through a compact.
WA-19

TABLE 48-14, WASHINGTON: UTILIZATION OF INTERSTATECOMPACTS REPORTED BY STATE AGENCIESIN 1978, BY AGENCY TYPE
ChildWelfare Education
JuvenlleJustice
MentalRetardation
Total Number of State andLocal Agency-ArrangedPlacements 183 1 120 2
Total Number of Compact-Arranged PlacementsReported by State Agencies 183 0 26 2
Percentage of COmpact-Arranged Placements 100 0 22 100
E. The Out-of-State Placement Practices of State Agencies
Table 48-15 describes the ability of Washington state agencles to report their Involvement in out-of-state placements. All state agencies were able to report the number of children placed out of state withtheir assistance or knowledge. In addition, only the,state child welfare agency could not report itsspecific involvement in the reported 183 placements. Seventy-four of these placements were arranged andfunded by the state agency, but court-ordered, state agency arranged but not funded, and other placementscould not be distinguished among the remaining 109 placements.
The state education agency funded the one placement arranged by the local school district. No otherplacement activity was reported, which was confirmed by the local survey. The state Juvenile Justiceagency arranged only three placements. It also reported that no placements were arranged by local agen-cies, but reported a total of 26 placements wIth ither the agency's assistance or knowledge. The statemental health agency reported no placement activity, confirmed by the local mental health agencies' sur-vey findings. The state mental retardation agency reported two placements which were arranged and fundedby the state agency.
WA-20
243

TABLE 48-15. WASHINGTON: ABILITY OF STATE AGENCIES TOREPORT THEIR INVOLVEMENT IN ARRANGING OUT -OF -STATE PLACEMENTS IN 1978
Number of CHILDREN ReportedPlaced during 1978 by State Agencies
Child Juvenile Mental Mental
Types of Involvement Welfare Education Justice Health Retardation
State Arranged and Funaed 74 0 0 0 2
Locally Arranged butState Funded 1 0 0
, Court Ordered, but StateArranged and Funded 0 0 0 0
Subtotal: PlacementsInvolving StateFunding * 1 0 0 2
Locally Arranged andFunded, and Reportedto State 0 0 0
State Helped Arrange,but Not Required byLaw or Old Not Fundthe Placement 0 0 0 0
Other 0 3 0 0
Total Number ofChildren Placed Outof State with StateAssistance orKnowledgea 183 1 26 0 2
-- denotes Not Applicable.* denotes Not Available.
a. Includes all out-of-state placements known to officials In the par-
ticular state agency. In some cases, this figure consists of placements whichdid not directly Involve affirmative action by the state agency but may simply
indicate knowledge of certain out-of-state placements through case conferences
1r through various forms of informal reporting.
Unfortunately, state data for the destinations of children placed out of state in 1978 was not avail-
able from the state child welfare and Juvenile Justice agencies, both high respondents In terms of place-
ment figures. Table 48-16, therefore, only reflects the destination states used for the small number of
placements reported by the state education and mental retardation agencies. Both agencies utilized set-
tings in Utah for the placement of one Washington child each, while the mental retardation agency also
reported California as the destination for the other child reported placed out of state in 1978.
WA-21
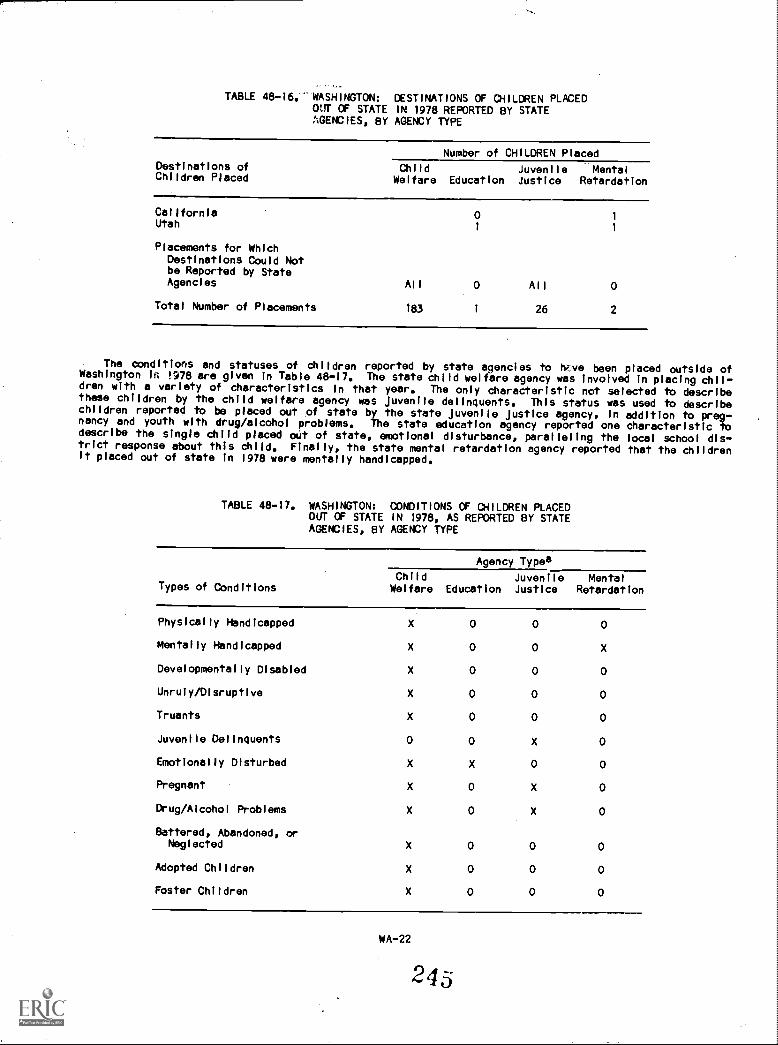
TABLE 48-16. WASHINGTON: DESTINATIONS OF CHILDREN PLACEDOVT OF STATE IN 1978 REPORTED BY STATEAGENCIES, BY AGENCY TYPE
Destinations of
Number of CHILDREN Placed
Child Juvenile MentalChildren Placed Welfare Education Justice Retardation
California 0Utah
1
Placements for WhichDestinations Could Notbe Reported by StateAgencies
Total Number of Placements
All All 0
183 1 26 2
The conditions and statuses of Children reported by state agencies to tv,ve been placed outside ofWashington in !978 are given In Table 48-17. The state child welfare agency was Involved in placing chil-dren with a variety of characteristics in that year. The only characteristic not selected to describethese children by the child welfare agency was Juvenile delinquents. This status was used to describechildren reported to be placed out of state by the state Juvenile Justice agency, in addition to preg-nancy and youth with drug/alcohol problems. The state education agency reported one characteristic todescribe the single child placed oUt of state, emotional disturbance, paralleling the local school dis-trict response about thls child. Finally, the state mental retardation agency reported that the childrenit placed out of state in 1978 were mentally handicapped.
TABLE 48-17, WASHINGTON: CONDITIONS OF CHILDREN PLACEDOUT OF STATE IN 1978, AS REPORTED BY STATEAGENCIES, BY AGENCY TYPE
Types of Conditions
Agency Types
ChIldWelfare Education
JuvenileJustice
MentalRetardation
Physically Handicapped X 0 0 0
Mentally Handicapped X 0 0 X
Developmentally Disabled X 0 0 0
Unruly/Disruptive X 0 0 0
Truants X 0 0 0
Juvenile Delinquents 0 0 X 0
Emotionally Disturbed X X 0 0
Pregnant X 0 X 0
Drug/Alcohol Problems X 0 X 0
Battered, Abandoned, orNeglected X 0 0 0
Adopted Children X 0 0 0
Foster Children X 0 0 0
WA-22
243

TABLE 48-17. (Contlnued)
Agency Typea
Chlld Juvenlle Mental
Types of Conditions Welfare Education Justice Retardation
Other
a. X indicates condltions reported.
The out-of-state residential setting reported to be most frequently used by the state child welfare
and Juvenile Justice agencies for their reported placements was relatives' homes. The state education
agency reported psychiatric hospitals to be most commonly used for Its placements. This response gives
a clearer understanding of the agency's lack of compact utilization. Placements into private psychiatric
hospitals, like those to education facilities, are not under the purview of an interstate compact. The
state mental retardation agency reported primarily sending children to residential treatment or child
care facilities In 1978.
The study attempted to collect information on the 1978 expenditure of state, local, and federal funds
related to out-of-state placements. This information was only available from the state education agency.
This agency reported that $3,000 In state funds and $3,000 In local funds were spent for the one place-
ment made out of Washington In 1978.
F. State Agencies' Knowledge of Out-of-State Placements
As a final review, Table 48-18 offers the incidence of out-of-state placement reported by Washington
public agencles and the number of children placed out of state of which the state agencies had knowledge.
The state child welfare and mental retardation agencies, with no local counterparts, were able to provide
the number children they placed out of state In 1978. The state education and mental health agencies
were able to report their own and local agencies' placement activity accurately. The state Juvenile
Justice agency, In contrast, only reported Its own Involvement In out-of-state placement (three children)
and Its knowledge of 23 other placements, without specifying thelr agency origin. However, It should be
recalld from Table 48-15 that this state agency reported no placements were initiated at the local level
of government.
TABLE 48-18. WASHINGTON: STATE AGENCIES' KNOWLEOGE OFOUT-OF-STATE PLACEMENTS
ChildWelfare Education
JuvenileJustice
MentalHealth
MentalRetardation
Total Number of State andLocal Agency Placements 183 1 120 0 2
Total Number of PlacementsKnown to State Agencies 183 1 26 0 2
Percentage of PlacementsKnown to State Agencies 100 100 22 100 100
WA-23

Figur. 48-5 IMstretos state agencies' knowledge of out-of-state placement activity and, equally asimportant, their knowledge of interstate compact use. Because state egencles are responsible for Inter-state compact administration, their report of 1978 compact utilization is of great interest to thlsstudy, not only providing a form of placement information, but also as a comparison to local agencies'compact use reports. Thls latter factor is illustrated in the state education and Juvenile Justice agen-cies responses in Figur. 48-5. Both the state and local education agencies reported no compact use forthe single out-of-state placement.
The dlfference In the state and local Juvenile Justice compact use reports Is similar to that oftheir incidence reports. Table 38-13 showed that local agencies placed at least 61 children through acompact, as compared to the 26 children reported by the state agency, and 49 of those locally placodchildren were sant out of Washington with the use of the Interstate Compact on Juveniles which is admi-nistered by the state agency.
200
180
160
140
120
100
80
60
40
20
0
FIGURE 48-5. WASHINGTON: THE TOTAL NUMBER OF STATE AND LOCAL PLACEMENTSAND USE CF COMPACTS, AS REPORTED BY STATE AGENCIES,BY AGENCY TYPE
Child Welfare Education Juvenlis Justice Mental Retardation
State and Local Placements
State and Local Placements Known to State Agencles
State and Local Compact Arranged Placements Reported by State Agencies
WA-24
247
V. CONCLUDING REMARKS
Several Important conclusions may be drawn about the foregoing survey results.
Local Washington Juvenile Justice agencies reported placing children with a variety of con-
ditions or statuses out of state In 1978, while the state child welfare agency reported an
even broader range of children. Both agency types, at two different levels of government,
most often sent these children to the homes of relatives In other states with a high level of
interstate compact utilization.
Both the state education and mental health agencies were able to accurately report their local
counterparts' out-of-state placement activity. This implies a strong regulatory capability on
the part of both state agencies.
The reader is encouraged to compare national trends described In Chapter 2 with the findings which
relate to specific practices In Washington In order to develop further conclusions about the state's
Involvement with the out-of-state placement of children.
FOOTNOTE
1. General information about states, counties, cities, and SMSAs Is from the special 1975 populationestimates based on th 1970 national census contained In the U.S. Bureau of the Census, County and CityData Book, 1977 (A Statistical Abstract Supplement), Washington, D.C., 1978.morwWITTESTr13551N-311901,119WITIferirr6T1Wel total per capita 'expenditures and expenditures foreducation and public welfare were also taken from data collected by the U.S. Bureau of the Census andthey appear in Statistical Abstract of the United States: 1979 (100th Edition), Wasfftton, D.C.,1979.The 1978 estimated population
of persons eight to 17 years old was developed by the National Centerfor Juvenlie Justice using two sources: the 1970 national census and the National Cancer institute 1975estimated aggregate census, also Prepared by the U.S. Bureau of the Census.
WA-26
249
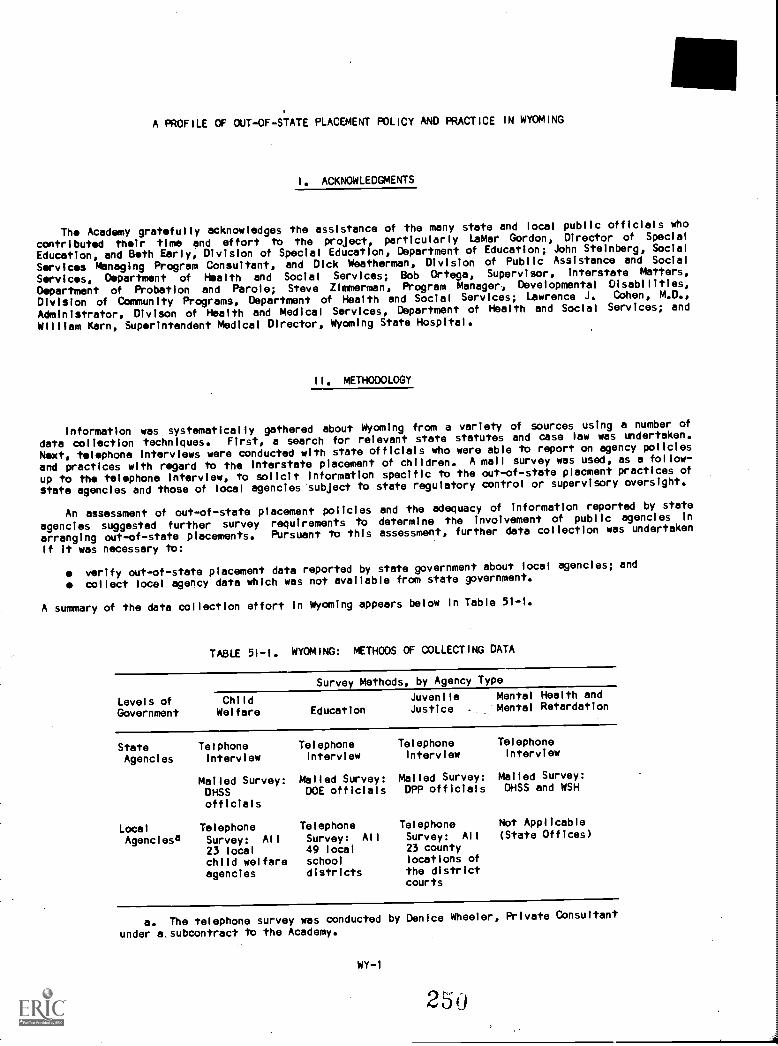
A PROFILE OF OUT-OF-STATE PLACEMENT POLICY AND PRACTICE IN WYOMING
ACKNOWLEDGMENTS
The Academy gratefully acknowledges the assistance of the many state and focal public officials who
contributed their time and effort to the project, particularly LaMar Gordon, Director of Special
Education, and Beth Early, Division of Special Education, Department of Education; John Steinberg, Social
Services Managing Program Consultant, and Dick Weatherman, Division of Public Assistance and Social
Services, Department of Health and Social Services; Bob Ortega, Supervisor, interstate Matters,
Department of Probation and Parole; Steve Zimmerman, Program Manager, Developmental Disabilities,
Division of Community Programs, Department of Health and Social Services; Lawrence J. Cohen, M.D.,
Administrator, Divison of Health and Medical Services, Department of Health and Social Services; and
William Kern, Superintendent Medical Director, Wyoming State Hospital.
METHODOLOGY
Information was systematically gathered about Wyoming from a variety of sources using a number of
data collection techniques. First, a search for relevant state statutes and case law was undertaken.
Next, telephone interviews were conducted with state officials who were able to report on agency policies
and practices with regard to the interstate placement of children. A mall survey was used, as a follow-
up to the telephone interview, to solicit information specific to the out-of-state placment practices of
state agencies and those of local agencies 'subject to state regulatory control or supervisory oversight.
An assessment of out-of-state placement policies and the adequacy of information reported by state
agencies suggested further survey requirements to determine the involvement of public agencies 'In
arranging out-of-state placements. PUrsuant to this assessment, further deta collection was undertaken
If it was necessary to:
verify out-of-state placement data reported by state government about local agencies; and
collect local agency data which was not available from state government.
A summary of the data collection effort in Wyoming appears below In Table 51-1.
TABLE 51-1. WYOMING: METHODS OF COLLECTING DATA
Levels ofGovernment
Survey Methods, by Agency Type
ChildWelfare Education
Juvenile Mental Health and
Justice Mental Retardation
State TelphoneAgencies interview
Mailed Survey:DHSSofficials
LocalAgencies°
TelephoneSurvey: All23 localchild welfareagencies
Telephoneinterview
Mailed Survey:DOE officials
TelephoneSurvey: All49 localschooldistricts
Telephoneinterview
Mailed Survey:DPP officials
TelephoneSurvey: All
23 countylocations ofthe districtcourts
TelephoneInterview
Mailed Survey:DHSS and WSH
Not Applicable(State Offices)
a. The telephone survey was conducted by Denice Wheeler, Private Consultant
under a,subcontract to the Academy.
WY-1
250

III. THE ORGANIZATION OF SERVICES AND OUT-OF-STATE PLACEMENT POLICY IN 1978
A. Introductory Remarks
Wyoming hes the ninth largest land ar)a (97,203 square miles) and Is the 49th most populated state(376,309) In the United States. It has tive cities with populations over 10,000: Casper, Cheyenne,Laramie, Rock Springs, and Sheridan. Cheyenne, the capital, Is the most populated city in the state,with a population of nearly 50,000. Wyoming has 23 counties. The 1978 estimated population of personseight to 17 years old was 68,835.
Wyoming has no Standard Metropolitan Statistical-Areas. Its border states are Idaho, Montana, SouthDakota, Utah, COlorado, and Nebraska.
Wytming was ranked fifth nationally In total state and local per capita expenditures, second In percapita expenditures for education, and 49th In per capita expenditures for public welfare.1
B. Child Welfare
Supervision of all public social and health services Is unified within the Wyoming Department ofHealth and Social Services (DHSS). Social services are supervised by the Divison of Public Assistanceand Social Services through county-operated agencies, while health services are administered by thestate. The Division of Public Assistance and Social Services, according to the survey, handles most ofWyomInpls out-of-state placements. It keeps statewide placement information, including those madethrough the Interstate Compact on the Placement of Children (ICPC). Wyoming has been a member of thecompact since 1963. However, it was reported that county departments of public assistance and socialservices can also place Independently of the state.
C. Education
Wyoming's Department of Education (DOE) has the major responsibility for its educational system. TheDOE, through its Division of Special Education, provides funds to Wyoming's 49 school districts for pro..viding special services and regional curriculum tor grades_K-A2 and for placing handicapped children inresidential and educational facilities within other states. The DOE maintains that local schooldistricts are not likely to place children out of state without first reporting this information to thestate. The DOE only maintains statewide aggregate placement information.
D. Juvenile Justice
Jurisdiction over dependent, neglected, and delinquent children Is held by the 15 district courts InWyoming. These district courts serve all 23 counties with a locally operated court In every countylocation. Adjudicated delinquents may be committed to the State Board of Charities and Reform, whichoversees both juvenile and adult corrections institutions, No juvenile facilities are operated by theboard.
Probation services In all areas of the state, exeept In the cities of Cheyenne and Casper, are prop-vided by the Department of Probation and Parole (DPP). The two cities maintain their own juvenile proba-tion offices. Parole and aftercare services tor both juveniles and adults are provided by the Departmentof Probation and Parole, as well. The DPP administers the Interstate Compact on Juveniles (ICJ) andreportedly places children out of state pursuant to the provisions of the ICJ. Wyoming has been a memberof this compact since 1957.
While the 23 county-operated courts usually make placements through either the Department ofProbation and Parole or the Department of Health and Social Services (for dependent children), they mayalso place independently of state government.
WY-2
25i

E. Mental Health and Mental Retardation
The Division of Community Programs within the Department of Health and Social Services (DHSS) Is
responsible for state-level mental health and mental retardation services In Wyoming. This office,
according to state contacts, only occassionally becomes involved in making out-of-state placements.
Wyoming is a member of the Interstate Compact on Mental Health (ICMH) for institutionalized placements.
Wyoming has been a member of the compact since 1969. All applicable out-of-state placements are
reportedly made pursuant to the provisions of the compact. Wyoming operates one state hospital for the
mentally ill. Local mental health, mental retardation, and developmental disability needs are met on a
purchase-of-service basis by private mental health centers.
IV. FINDINGS FROM A SURVEY OF OUT-OF-STATE PLACEMENT PRACTICES IN 1978
The survey of Wyoming state and local agencies results in the findings discussed and tabularly
displayed In the remalnder of this profile.
A. The Number of Children Placed in Out-of-State Residential Settings
Before going into the more specific findings, an overview of the out-of-state placement activity
discovered among Wyoming state and local agencies is given In Table 51-2. As mentioned In section III,
DHSS reportedly handles most of Wyoming's out-of-state placements. Table 51-2, however, reveals that the
number of state-arranged placements could not be identified. This office could only report about 16
state-arranged placeme,ts of which 12 involved state funds. Fifty-three additional out-of-state place-
ments were known to the department, but the participation of the local child welfare agencies was not
reported. The Department of Probation and Parole (DPP) nas similar problems in reporting 1978 state
involvement in out-of-state placements. In this case, even an aggregate number was not available.
All other state agencies surveyed gave incidence reports of placement activity which includes three
placements arranged by the state education agency. No out-of-state placement involvement was reported by
the mental health and mental retardation agency, nor were any institutional transfers reported by the
state mental health hospital.
At the local agency level, a survey of all child welfare agencies resulted in the reporting of 72
out-of-state placements and the survey of the 52 school districts revealed the placement of 24 children
into other states. The 23 local courts reported lower placement incidence, four children In total.
WY-3
252

TABLE 51-2. WYOMING: NUMBER OF OUT-OF-STATE PLACEMENTSARRANGED BY STATE AND LOCAL PUBLIC AGENCIESIN 1978, BY AGENCY TYPE
Number of CHILDREN, by Agency TypeLevels ofGovernment
ChildWelfare Education
JuvenileJustice
Mental Health andMental Retardation Total
State AgencyPlacementsa 3 0 3
Local AgencyPlacements 72 24 4 100
Total 72 27 4 0 103
denotes Not Available .
denotes Not Applicable.
a. May include placements which the state agency arranged and fundedindependently or under a court order, arranged but did not fund, helped arrange,and others directly Involving the state agency's assistance or knowledge. Referto Table 51-15 for specific Information regarding state agency involvement inarranging out-of-state placements.
Table 51-3 specifies the frequency of placements leaving Wyoming In 1978 by listing placement Inci-dence by the county each agency serves. Placement activity was reported in all but five of Wyoming's 23countles, with the 29 chlldren reported by'agencies In Sweetwater County far surpassing other countyincldence totals. In fact, 38 percent of all 1978 local child welfare placements reported In Wyomingwere made by the agency serving Sweetwater County. Three counties, Park, Campbell, and Laramie(Cheyenne), had Incidence reports from all three agency service types, while Sweetwater, Albany,Sheridan, Carbon, and Platte Counties had placement activity reported by both the local child welfareagency and the local school districts located within them. The remaining ten counties had out-of-stateplacement reported by only one agency type. Notably, Natrona County (Casper) had seven placements madeby local school districts in 1978, the highest county-aggregated report by this agency type In Wyoming,whereas no other local agency placement activity was reported in this county. It is important to bear Inmind that the Jurisdiction of school districts contacted Is smaller than the counties containing them.For that reason, multiple agencies may have reported from each county and the Incidence reports in thetable are the aggregated reports of all school districts within them.
TABLE 51-3. WYOMING: 1978 YOUTH POPULATIONS AND THE NUMBEROF OUT-OF-STATE PLACEMENTS ARRANGED BY LOCALAGENCIES IN 1978, BY COUNTY AND AGENCY TYPESREPORTING PLACEMENTS
1978Populatlona
Number of CHILDRENPlaced during 1978
Child JuvenileCounty Name (Age 8-17) Welfare Education Justice
Albany 3,745 10 2 0Big Horn 2,083 0 0 0Campbell 2,636 9 2 1
Carbon 2,956 3 est 1 0Converse 1,421 2 0 0
WY-4
253

TABLE 51-3, (Continued)
County Name
1978Populationa(Age 8-17)
Number of CHILDRENPlaced during 1978
ChildWelfare Education
11.7gerrrfi
Justice
Crook 1,034 0 0 0
Fremont 6,490 0 3 0
Goshen 2,040 2 0 0
Hot Springs..., 741 1 0 0
Johnson 879 0 0 0
Laramie 11,888 4 est 2 2 est
Lincoln 2,032 0 0 0
Natrona 10,031 0 7 est 0
Niobrara 476 1 0 0
Park 3,478 1 2 1
Platte 1,258 1 1 0
Sherldan 3,100 4 1 0
Sublette 777 3 est 0 0
Sweetwater 6,055 27 2 0
Teton 1,070 3 0 0
Ulnta 1,827 0 0 0
Washakle 1,568 1 0 0
Weston 1,250 0 1 0
Total Number ofPlacements Arrangedby Local Agencies(total may Includeduplicate count)
Total Number of LocalAgencies Reporting
72 est 24 est 4 est
23 49 23
a. Estimates 'were developed by the National Center of Juvenile Justice
using data from rwo sources: the 1970 national census and the National Cancer
Institute 1975 estimated aggregate census.
B. The Out-of-State Placement Practices of Local Agencies
The involvement of local agencies In placing children out of Wyoming Is summarized In Table 51-4. It
Is notable that among the 95 local agencieswhich were contacted In the course of the survey, only one
agency, a school district, could not provide placement information to the study. The table also
indicates moderate to sparse Involvement of local agencies In placing children out of Wyoming In 1978,
wIth 65 percent of the child welfare agencies, 27 percent of the school districts, and 13 percent of the
local courts reporting involvement In this practice In 1978.
WY-5
254

TABLE 51-4. WYOMING: THE INVOLVEMENT OF LOCAL PUBLIC AGENCIESIN ARRANGING OUT-OF-STATE PLACEMENTS IN 1978
Response CategoriesNumber of AGENCIES, by Agency Type
Child Welfare Education Juvenile Justice
Agencies Which ReportedOut-of-State Placements 15 13 3
Agencies Which Old NotKnow If They Placed,or Placed but Could NotReport the Number ofChildren 0 I 0
AgeA0es Which Old Not.Place Out of State 8 35 20
Agencies Which Old NotParticipate In theSurvey 0 0 0
Total Local Agencies 23 49 23
The reasons why out-of-state placements were not made by the remaining surveyed local agencies wereelicited, and these reasons appear with the number of agencies responding to them In Table 51-5. Most ofthe child welfare agencies stated that sufficient services existed In Wyoming. One child welfare agencyreported lacking funds for such purposes. The local school districts similarly reported that sufficientservices were available in Wyoming and a few stated they lacked the necessary funds for placement.Single school districts reported additional restrictions, including lacking statutory authority and paren-tal disapproval (In the "other" category). The majority of the local courts which did not make place,ments Into other states In 1978 reported lacking funds or were restricted by agency policy. A smallpercentage reported that Wyoming had sufficient services to meet children's needs.
WY-6

TABLE 51-5. WYOMING: REASONS REPORTED BY LOCAL PUBLICAGENCIES FOR NOT ARRANGING OUT-OF-STATEPLACEMENTS IN 1978
Reasons for Not PlacingChildren Out of Statea
Number of Local AGENCIES,
by Reported Reason(s)
Child Welfare Education Juvenile Justice
Lacked Statutory Authority 0 1 0
Restricted 0 0 0
Lacked Funds 13 14
Sufficient Services AvailableIn State 6 28 6
Other') 3 16 14
Number of Agencies Reporting NoOut-of-State Placements 8 35 20
Total Number of AgenciesRepresented in Survoy 23 49 23
a. Some agencies reported more than one reason for not arranging out-of-
state placements.
b. Generally Included such reasons as out-of-state placements were against
overall agency policy, were disapproved by parents, involved too much red tape,
and were prohibitive because of distance.
The extent to which local agencies enlisted the assistance of other public agencies In the arrange-
ment of out-of-state placements is portrayed in Table 51-6. The table indicates that this type of
interagency cooperation is more frequent for the local Wyoming child welfare agencies. Eighty-seven per-
cent of the, local child welfare agencies reported cooperating withother public agencies in the course of
placing 92 percent of the children reported placed out of Wyoming. Sixty-two percent of the school
districts reported enlisting the ald of other public agencies In making 38 percent of all 1978 education
placements. The local courts reported no interagency Involvement.
WY-7
25

TABLE 51-6. WYOMING: THE EXTENT OF INTERAGENCYCOOPERATION TO ARRANGE OUT-OF-STATEPLACEMENTS BY LOCAL AGENCIES IN 1978
Number and Percentage, by Agency Type
Child Welfare Education Juvenlle JusticeNumber
AGENCIES ReportingOut-of-StatePIncementsa 15
AGENCIES ReportingOut-of-StatePlacements withinteragencr---cooperaTion 13
Number of CHILDRENPlaced Out of State 72
Number of CHILDRENPlaced Out of Statewith Interagency600peration 66
Percent Number
65 13
87 8
100 24
92 9
Percent Number Percent
27 3 13
62 0 0
100 4 100
38 0 0
a. See Table 51-4.
All local Wyoming agencies reporting out-of-state placements In 1978 were asked to describe thecharacteristics of the children placed, according to a list of conditions and statuses. Table 51-7 indi-cates that adopted children were reported to be placed out of Wyoming by more local child welfare agen-cies than any other condition or status. All other descriptive responses, with the exception of truancy,were mentioned by at lenst one child welfare agency. The local school districts primarily reportedplacing physically handicapped and mentally ill/emotionally disturbed children. Almost as frequently,the mentally retarded or developmentally disabled and children needing special education wore reported tohave been sent outside cl Wyoming in 1978 by local school districts for residential treatment or care.One to three school districts also reported placing unruly/distruptive children, multiply handicappedchildren, and juvenile delinquents.
The local courts reported Sending juvenile delinquents as well as unruly/disruptive children, men-tally retarded or developmentally disabled children, and youth with drug or alcohol problems out ofWyoming In 1978.
TABLE 51-7. WYOMING: CONDITIONS OF CHILDREN PLACED OUT OFSTATE IN 1978, AS REPORTED BY LOCAL AGENCIES
Types of ConditlonsaNumber of AGENCIES Reporting
Child Welfare Education Juvenile Justice
Physically Handicapped
Mentally Retarded orDevelopmentally Disabled
Unruly/Disruptive
Truant.
Juvenile Delinquent
1
2
5
0
2
5 0
4 1
3 1
0 0
1 2
WY-8
... 25 7

TABLE 51-7. (Continued)
Types of Conditlonsa
Number of AGENCIES Reporting
Child Welfare Education Juvenile Justice
Mentally 111/EmotionallyDisturbed
4 5 0
PregnantI 0 0
Drug/Alcohol Problems 4 0 1
Battered, Abandoned, orNeglected
4 0 0
Adopted10 0 0
Special Education Needs 2 4 0
Multiple Handicaps 1 2 0
Othera 2 1 0
Number of Agencies Reporting 15 13 3
a. Some agencies reported more than one type of condition.
b. Generally included foster care placements, autistic children, and
status offenders.
C. Detailed Data from Phase 11 Agencies
If more than four out-of-stateplacements were reported by a local agency, additional information was
requested. The agencies from which the second phase of data was requested became known as Phase II
agencies. The responses to the additional questions are reviewed In this section of Wyoming's state
profile. Wherever references are made to Phase II agencies, they are intended to reflect those local
agencies which reported arranging five or more out-of-stite placements In 1978.
The relationship between the number of local Wyoming agencies surveyed and the total number of
children placed out of state, and agencies and placements In Phase II Is illustrated in Figure 51-1.
Phase II child welfare agencies in Wyoming comprise 20 percent of the placing agencies of that service
type. These three agencies were responsiblefor 64 percent of all the child welfare out-of-state place-
ments arranged In 1978. Only eight percent of the local education agencies involved in out-of-state
placements were Phase II agencies. This single Phase 11 school district reported making seven
placements, or 29 percent of the total local education placements reported.
WY-9
258

FIGURE 51-1. WYOMING: RELATIONSHIP BETWEEN THE NUMBER OFLOCAL AGENCIES SURVEYED AND PLACEMENTSREPORTED, AND AGENCIES AND PLACEMENTS INPHASE II, BY AGENCY TYPE
ChildWelfare Education
Number of AGENCIES
Number of AGENCIES ReportingOut-of-State Placements In 1978
Number of AGENCIES ReportingFive or Mor Placements in1978 (Phase 11 Agencles)
Number of CHILDREN PlacedOut of State In 1978
Number of CHILDREN Placedby Phase 11 Agencies
Percentage of Reported PlacementsIn Phase 11
The geographic locations of the countles served by the Wyoming Phase II agencies are Illustrated InFlgure 51-2. The three Phase II child welfare agencies serve Albany, Campbell, and Sweetwater Counties,all bordering on another state. The single Phase 11 school district Is located In Natrona County In thecentral portion of Wyoming.
WY-10

County
A. AlbanyEl. CampbellC. NatronaD. Sweetwater
B.
C.
D.
KEY
W Child Welfare Phase II Education Phase II Agency
Agency Jurisdiction Jurisdiction
260
A.
261

LoCal Wyoming Phase 11 agencies were asked to Identify the children's destinatloos. Reported desti-nations are summarized In Table 51-8. Local Phase II child welfare agencies most frequently sentchildren to states contiguous to Wyoming In 1978, or to states In the same or surrounding geographicregions. Other states utilized were located at further distances, including New York and Texas.
The local Phase II school districtsplaced children into three contiguous states of Wyoming as wellas a northeastern state, Rhode Island.
TABLE 51-8. WYOMING: DESTINATIONS OF CHILDREN PLACED BY LOCALPHASE II AGENCIES IN 1978
Destinations of ChildrenPlaced Out of State
Number of CHILDREN Placed
Child Welfare Education
California 5Colorado 10Idaho
1
Kansas1
Montana 2
NebraskaNevadaNew YorkOregonRhode Island
South DakotaTexasUtah
34
5
2
22
7
Placements for WhichDestinations Could Notbe Reported by Phase 11Agencies 2
Total Number of Phase IIAgencies 3
Total Number of ChildrenPlaced by Phase IIAgencies 46
040
0
1
7
The extent to which.states contiguous to Wyoming were selected tofrom local public agencies reporting In Table 51-8 Is illustrated in Fmajority of the local placements went to bordering states of Wyoming.most often used by these agencies, receiving 14 children from Wyoming.much lesser extent, receiving only one child from a local child welfarethe local child welfare and 86 percent of the education placements forwere made to border states of Wyoming.
VY-12 261
receive out-of-state placementsIgure 51-3. As noted earlier, aAmong these states, Colorado wasSettings In Idaho were used to aagency. In total, 57 percent ofwhich destinations were reported

FIGURE 51-3, WYOMING: THE NUMBER OF CHILDREN REPORTEDPLACED IN STATES CONTIGUOUS TO WYOMINGBY LOCAL PHASE 11 AGEhICIESa
a. Local child welfare agencies reported destinations for 44 children. Local school districts
reported destinations for seven children.
The local Phase 11 agencies In Wyoming reported the reasons they decided to do so. Table 51-9
reveals that all three child welfare agencies responding placed children for the same four reasons: the
agencies had previous success with the receiving facility, they perceived Wyoming to lack comparable ser-
vices to those In the receiving state, as an alternative to Wyoming public institutionalization, and In
order for a child to live with relatives. A single agency also mentioned that a child was unable to
adapt to an in-state program. The one reporting school district gave similar responses to those offered
by child welfare agencies, except it did not mention using relatives' homes and added the reason that
out-of-state residential care Is typically used for children with certain conditions or problems.
WY-13
263
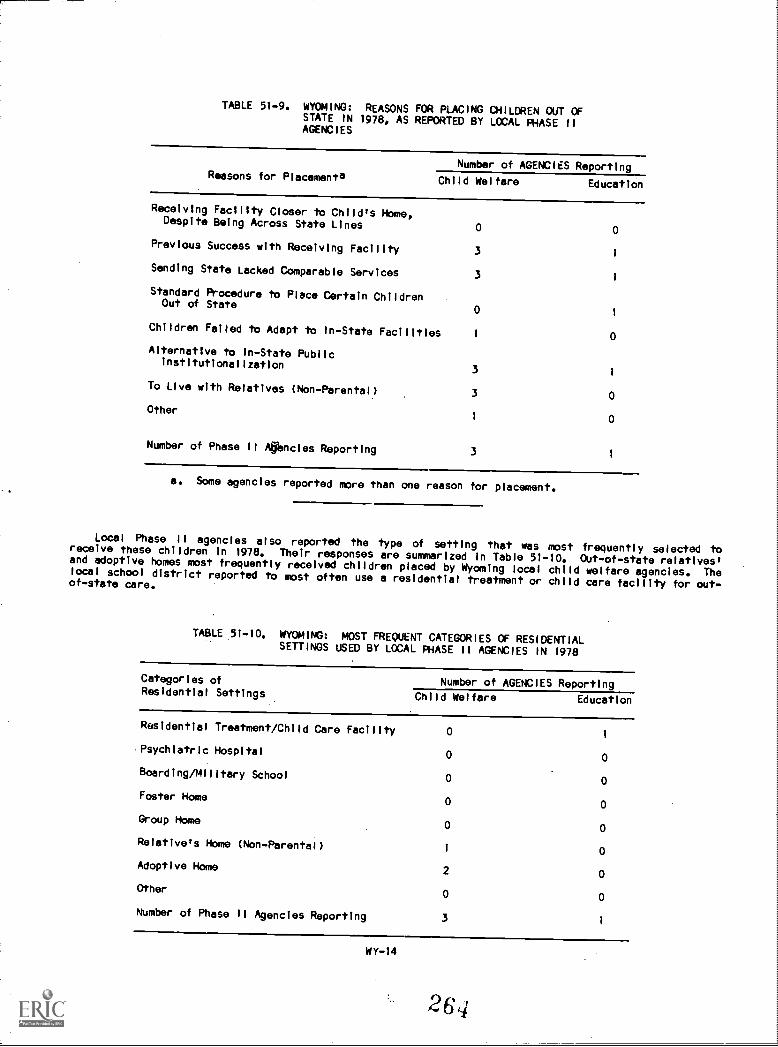
TABLE 51-9. WYOMING: REASONS FOR PLACING CHILDREN OUT OFSTATE IN 1978, AS REPORTED BY LOCAL PHASE 11AGENCIES
Number of AGENCIES ReportingReasons for Placementa Child Welfare Education
Receiving Facility Closer to Child's Home,Despite Being Across State Lines 0 0
Previous Success with Receiving Facility 31
Sending State Lacked Comparable Services 3 1
Standard Procedure to Place Certain ChildrenOut of State
01
Children Failed to Adapt to In-State Facilities 1 0
Alternative to In-State PUblicInstitutionalization
31
To live with Relatives (Non-Parental) 3 0
Other1 0
Number of Phase II Agencies Reporting 3
a. Some agencies reported more than one reason for placement.
Local Phase 11 agencies also reported the type of setting that was most frequently selected toreceive these children in 1978. Their responses are summarized In Table 51-10. Out-of-state relatives'and adoptive homes most frequently received children placed by Wyoming local child welfare agencies. Thelocal school district reported to most often use a residential treatment or child care facility for out-of-state care.
TABLE 51-10. WYOMING: MOST FREQUENT CATEGORIES OF RESIDENTIALSETTINGS USED BY LOCAL PHASE II AGENCIES IN 1978
Categories ofResidential Settings
Number of AGENCIES Reporting
Child Welfare Education
Residential Treatment/Child Care Facility 0 1
Psychiatric Hospital 0 0
Boarding/MIlltary School 0 0
Foster Home0 0
Group Home0 0
Relative's Home (Non-Parental)1 0
Adoptive Home 2 0
Other0 0
Number of Phase II Agencies Reporting 31
WY-14
264
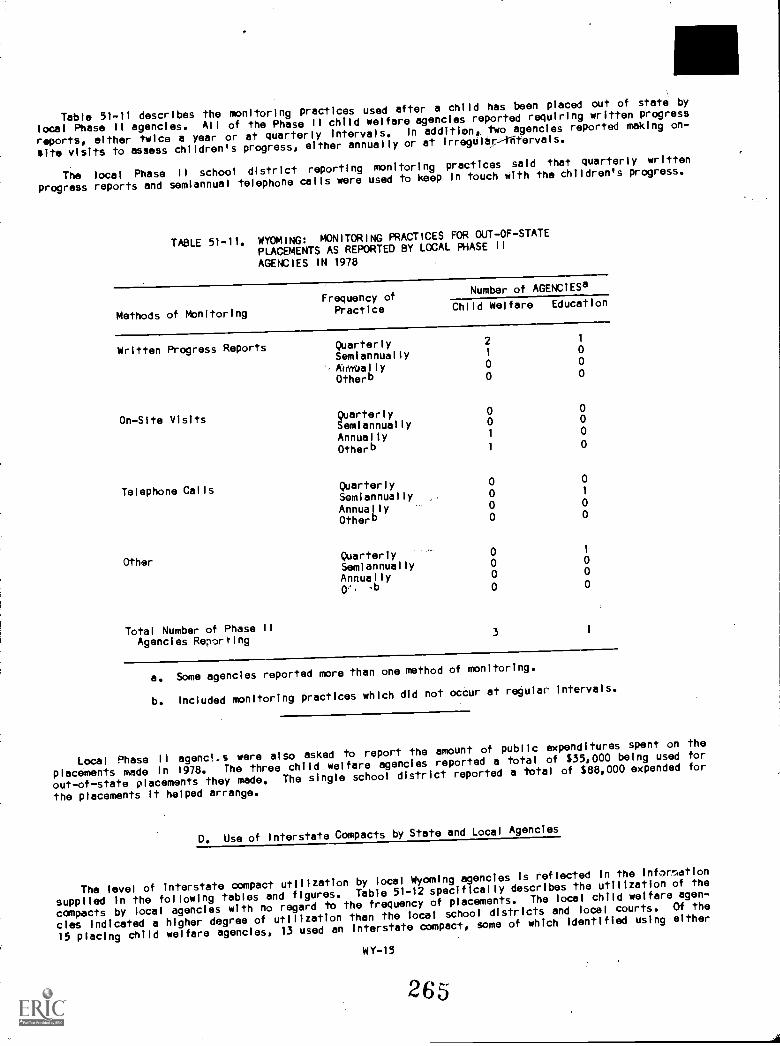
Table 51-11 describes the monitoring practices used after a child has been placed out of state by
local Phase II agencies. All of the Phase II child welfare agencies reportedrequiring written progress
reports, elther twice a year or at quarterly intervals. In additionc two agencies reported making on-
slte visits to assess children's progress, either annually or at irregtilar-Alitervals.
The local Phase 11 school district reporting monitoring practices said that quarterly written
Progress reports and semiannual telephone calls were used to keep In touch with the children's progress.
TABLE 51-11. WYOMING: MONITORING PRACTICES FOR OUT-OF-STATE
PLACEMENTS AS REPORTED BY LOCAL PHASE 11
AGENCIES IN 1978
Methods of Monitoring
Frequency ofPractice
Number of AGENCIESa
Child Welfare Education
Written Progress Reports Quarterly 2 1
Semiannually 10
Aimbally 0 0
Otherb 0 0
On-Site Visits Quarterly 0 0
Semiannually 0 0
Annually 10
Otherb 10
Telephone Calls Quarterly 0 0
Semiannually 0 1
Annually 0 0
Otherb 0 0
OtherQuarterly 0 1
Semiannually 0 0
Annually 0 0
0 0
Total Number of Phase 11Agencies Reporting
3 1
a. Some agencies reported more than one method of monitoring.
b. Included monitoring practiceswhich did not occur at regular Intervals.
Local Phase II agencl..s were also asked to report the amount of public expenditures spent on the
placements made In 1978. rhe three child welfareagencies reported a total of $35,000 being used for
out-of-state placements they made. The single school districtreported a total of $88,000 expended for
the placements it helped arrange.
D. Use of interstate Compacts by State and Local Agencies
The level of Interstate compact utilization by local Wyoming agencies is reflected in the infornation
supplied In the following tables and figures. Table 51-12 specificallydescribes the utilization of the
compacts by local agencies with no regard to the frequency of placements. The local child welfare agen-
cles indicated a higher degree of utilization than the local school districts and local courts. 01 the
15 placing child welfare agencles, 13 used an interstatecompact, some of which Identified using either
WY-15
265
4

th interstate Compact on the Placement of Children or the Interstate Compact on Juvenlles. In contrast,all but one local education agency and all local courts which placed children out of Wyoming in 1978 didnot use any compact.
TABLE 51-12. WYOMING: UTILIZATION OF INTERSTATE COMPACTSBY LOCAL AGENCIES IN 1973, BY AGENCY TYPE
Local Agencies Which PlacedChildren Out of State
Number of AGENCIES
Child Welfare EducationJuvenileJustice
NUMBER OF LOCAL AGENCIES PLACINGFOUR OR LESS CHILuRtN
12 12 3
Wmber Using Compacts10 1 0
Number Not Using Compacts 2 11 3
Number with Compact UseUnknown
0 0 0
NUMBER OF PHASE II AGENCIESPLACING CHILDREN
3 1 0
Number Using Compacts 3 0
Interstate Compact on the Placementof Children
Yes2 0No1 1Don't Know 0 0 -
Interstate Compact on Juveniles
Yes1 0No2 1Don't Know 0 0
Interstate Compact on Mental Health
Yes0 0No3 1Don't Know 0 0
Number Not Using Compacts 0 1 - -
Nwnber wIth Compact Use Unknown 0 0
TOTALS
Number of AGENCIES Placing ChildrenOut of State
15 13 3
Number of AGENCIES Using Compacts13 1 0
Number of AGENCIES Not Using Compacts 2 -12 3
Number of AGENCIES with Compact Use Unknown 0 0 0
-- denotes Not Applicable.
WY-16
266

Further evidence of local agencies' compact utilization Is given In Table 51-13, which focuses on the
number of compact-processed placements, by agency type. Again, the number of child welfare placements
processed through a compact exceeds the number of placements made by the other two local agency types.
Forty ot th 72 child welfare placements wint through compact proceedings, 20 of which were identified to
have been ICPC processed. Fourteen of the placements reported by the child welfare agencies which placed
four or less children out-of-state had unspecified compact usagebecause such agencles were not asked to
report the actual number of compact-arranged placements.
It has already been noted that one education agency reported using an Interstate compact In 1978;
however, only one placement was processed by thls agency through a compact. Such an occurrence could
have resulted frOm a placement made to a residential setting that was subject to the purview of a
compact. It should be recalled that those placements made to facIlities providing solely education
services are not subject to being processed through any compact.
TABLE 51-13. WYOMING: NUMBER OF PLACEMENTS AND THE,UTILIZATIONOF INTERSTATE COMPACTS BY LOCAL AGENCIES IN 1978
Children Placed Out of State
Number of CHILDREN
ChlldWelfare Education
JuvenileJustice
CHILDREN PLACED BY AGENCIESRtPUKIINt, FOUR OR LESS PLACEMENTS 26 17 4
Number Placed with Compact Use 10 1 0
Number Placed without Compact Use
o Number Placed with Compact
2 16 4
Use Unknowna 14 0 0
CHILDREN PLACED BY PHASE II AGENCIES 46 7 0
Number Placed with Compact Use 30 0
Number through Interstate Compacton the Placement of Children 20 0
Number through InterstateCompact on Juveniles 10
Number through InterstateCompact on Mental Health 0 0
Number Placed without Compact Use
o Number PlaCed with Compact Use
16 7
Unknown

TABLE 51-13. (Continued)
Children Placed Out of State
Number of CHILDREN
ChildWelfare
JuvenileEducation Justice
TOTALS
Number of CHILDREN Placed Out of State 72 24 4
Number of CHILDREN-Placed with Compact Use 40 1 0
Number of CHILDREN Placed withoutCompact Use 18 23 4
Number of CHILDREN Placed with CompactUse Unknown 14 0 0
-- denotes Not Applicable.
a. Agencies which placed four or less children out of state were notasked to report the actual number of compact-arranged placements. Instead,these agencies simply reported whether or not a-compact was used to arrangeany out-of-state placement.. Therefore, If a compact was used, only one place-ment Is indicated as a compact-arranged placement and the others are IncludedIn the category number placed with compact use unknown."
Figures 51-4, 5, and 6 present summary findings of Table 51-13, using percentages. In viewing eachfigure, the total percentage of interstate compact utilization In 1978 by each agency type Is that atleast 56 percent of the child welfare placements, four percent of the education placements, and none ofthe court placements were compact arranged.
268
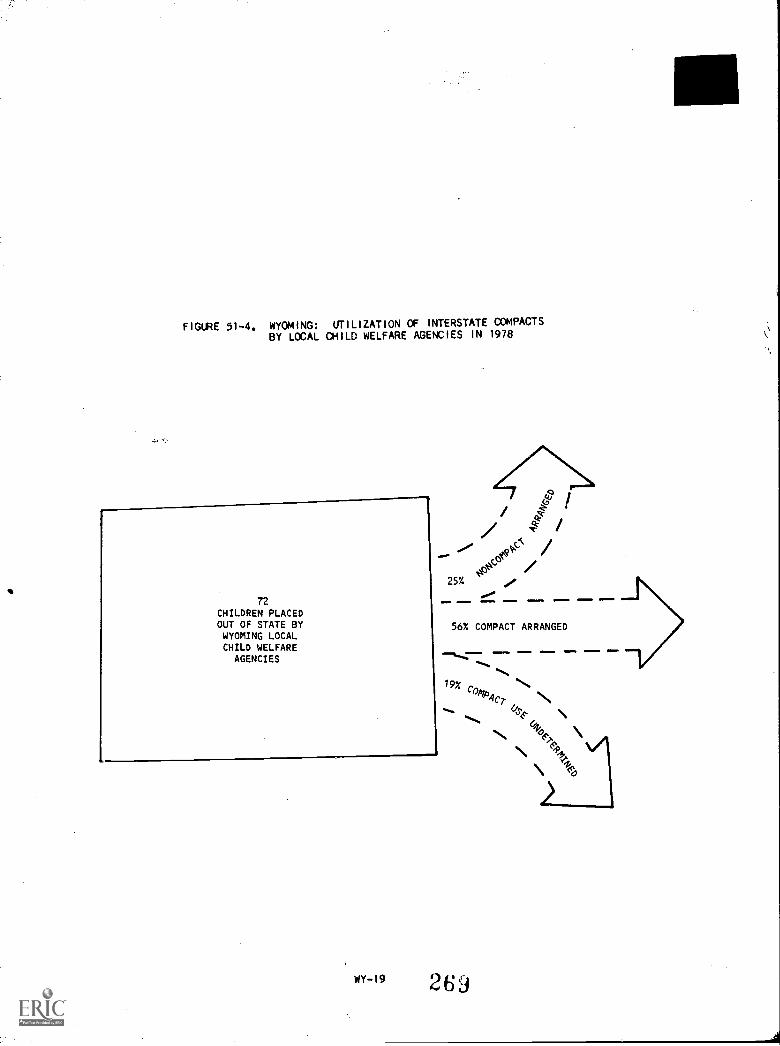
FIGURE 51-4. WYOMING: UTILIZATION OF INTERSTATE COMPACTSBY LOCAL CHILD WELFARE AGENCIES IN 1978
72CHILDREN PLACEDOUT OF STATE BYWYOMING LOCALCHILD WELFAREAGENCIES
WY-19
56% COMPACT ARRANGED
19x
269
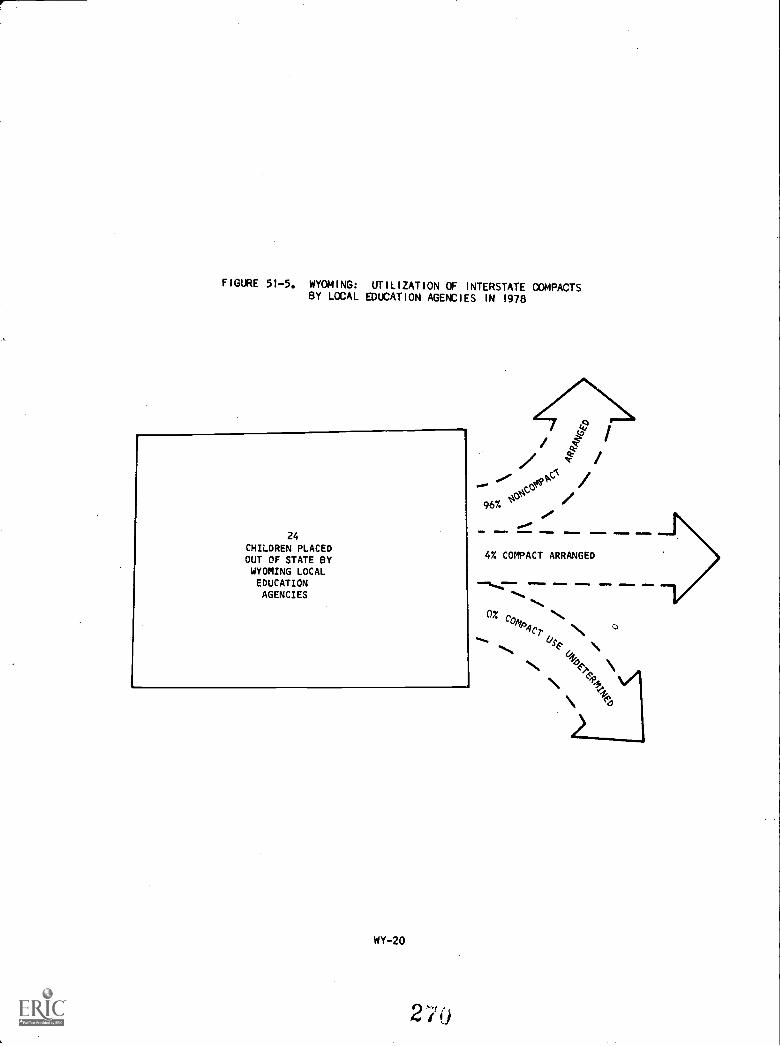
FIGURE 51-5. WYOMING: UTILIZATION OF INTERSTATE COMPACTSBY LOCAL EDUCATION AGEKCIES IN 1978
24
CHILDREN PLACEDOUT OF STATE BYWYOMING LOCALEDUCATIONAGENCIES
WY-20
4% COMPACT ARRANGED
11MOIM 1111 =M. el
ox
P4c7- N&se ,
4:04 \

FIGURE 51-6. WYOMING: UTILIZATION OF INTERSTATE COMPACTSBY LOCAL JUVENILE JUSTICE AGENCIES IN 1978
4
CHILDREN PLACEDOUT OF STATE BYWYOMING LOCALJUVENILE JUSTICE
AGENCIES
e.NOlm .mw MEM
CA COMPACT ARRANGED
_ =WM. IMIM. 01=101,
" COAfPgcr4<sse
04,6 \
Very little information was available from Wyoming state agencies about interstate compact
utilization, as can be seen In Table 51-14. Only the state child welfare agency was able to provide the
number of children it had knowledge of being placed out of state in 1978 with the use of a compact.
WY-21
2 71

TABLE 51-14. WYOMING: UTILIZATION OF INTERSTATE COMPACTSREPORTED BY STATE AGENCIES IN 1978, BYAGENCY TYPE
Child Welfare Education Juvenile Justice
Total Number of State andLocal Agency-ArrangedPlacements
Total Number of Compact-Arranged PlacementsReported by State Agencles
Percentage of Compact-Arranged Placements
*a
69
27
* denotes Not Available.
a. Theplacements.riot distingu
b. Thestate. Theinvolvement
local child welfare agencies reported arranging 72 out-of-stateThe state child welfare agency reported 69 placements but could
Ish state or local Involvement.
local Juvenile Justice agencies arranged hour placements out ofstate Juvenile Justice agency, however, could not report state
In out-of-state placement practices.
E. The Out-of-State Placement Practices of State Agencies
The following table displays In more detail the survey findings described In Table 51-2 about Wyomingstate agencies' involvement in out-of-state placement practices. As can be seen In Table 51-15, thestate child welfare agency, DHSS, and the state Juvenile Justice agency were not able to fully describetheir involvement In out-of-state placement In 1978 and the number of children placed according to cate-gories of involvement. DHSS could not report responses In hour of the seven categories of Involvement,only Indicating that It arranged 16 placements and at least had knowledge of an additional 53 childrenplaced out of Wyoming In 1978. This state agency did not specify the agency origin or funding source ofthese 53 children's placements. It Is likely that many are attributable to actions by the local childwelfare agencies In Wyoming, given that the survey of these local agencies revealed 40 placements thatwere reported to be processed through an Interstate compact (see Table 51-13), 20 of which could bedetermined to have been ICPC-processed, the compact administered by the state child welfare agency.
The Department of Probation and Parole could report that placements were arranged by the local courtsand were funded by the state or were probation or parole transf9rs (*other* category), but could notreport the number of such placements.
The remaining state agencies, the Department of Education and the DHSS' division responsible for men-tal health and mental retardation services, were able to fully report their out-of-state placementinvolvement. The only out-of-state placements made by or reported by these agencies were Identified bythe state education agency. Such placement activity included 30 locally arranged and state-fundedplacements, 45 locally arranged and funded placements, and three state-arranged placements. Recallingthe local survey finding of 24 children placed out of Wyoming by school districts, the state flgure Issomewhat higher. The additIonal locally arranged placements reported by the state agency were possiblymade prior to 1978 but continued to be funded that year.
WY-22
272
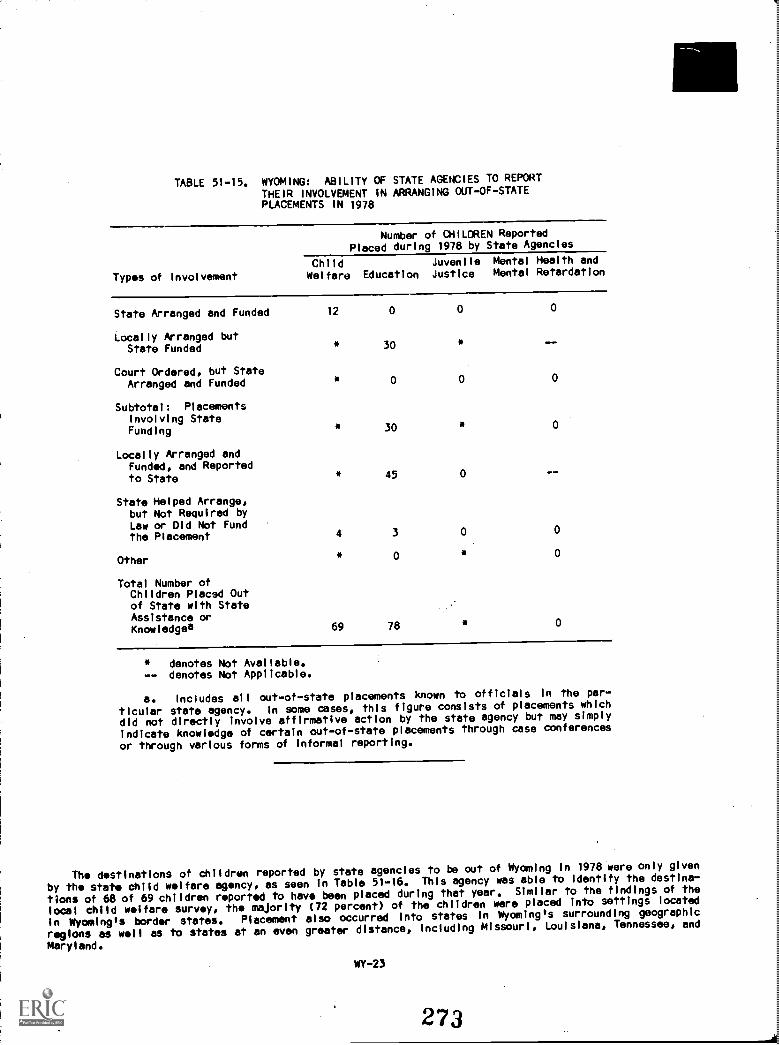
TABLE 51-15. WYOMING: ABILITY OF STATE AGENCIES TO REPORTTHEIR INVOLVEMENT IN ARRANGING OUT-OF-STATEPLACEMENTS IN 1978
Types of Involvement
Number of CHILDREN ReportedPlaced during 1978 by State Agencies
ChildWelfare Education
JuvenileJustice
Mental Health andMental Retardation
State Arranged and Funded 12 0 0 0
Locally Arranged butState Funded 30
Court Ordered, but StateArranged and Funded 0 0 0
Subtotal: PlacementsInvolving StateFunding 30
Locally Arranged andFunded, and Reportedto State 45 0
State Helped Arrange,but Not Required byLaw or Old Not Fundthe Placement 4 3 0 0
Other 0 0
Total Number ofChildren Placed Outof State with StateAssistance orKnowiedgea 69 78 0
* denotes Not Available.-- denotes Not Applicable.
a. Includes all out-of-state placements known to offlcials In the par-
ticular state agency. In some cases, this figure consists of placements which
did not directly involve affirmative action by the state agency but may simply
indicate knowledge of certain out-of-state placements through case conferences
or through various forms of informal reporting.
The destinations of children reported by state agencies to be out of Wyoming in 1978 were only given
by the state child welfare agency, as seen In Table 51-16. Thls agency was able to Identify the destina-
tions of 68 of 69 children reported to have been placed during that year. Similar to the findings of the
local child welfare survey, the majority (72 percent) of the children were placed Into settings located
In Wyoming's border states. Placement also occurred Into states in Wyoming's surrounding geographic
regions as well as to states at an even greater distance, including Missourl, Louislana, Tennessee, and
Maryland.
WY-23
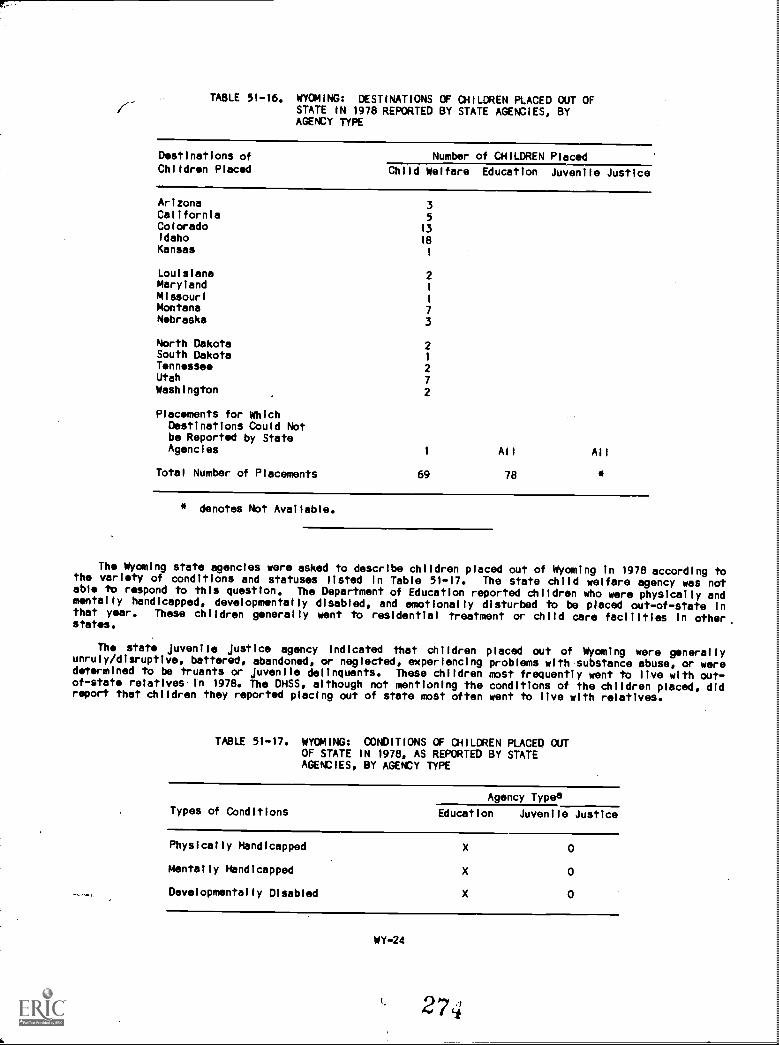
TABLE 51-16. WYOMING: DESTINATIONS Of CHILDREN PLACED OUT OFr- STATE IN 1978 REPORTED BY STATE AGENCIES, BYAGENCY TYPE
Destinations ofChlldren Placed
Number of CHILDREN Placed
Child Welfare Education Juvenile Justice
Arizona 3California 5Colorado 13Idaho 18Kansas
1
Louisiana 2Maryland 1
Missouri 1
Montana 7Nebraska 3
North Dakota 2South Dakota 1
Tennessee 2Utah 7Washington 2
Placements for WhichDestinations Could Notbe Reported by StateAgencies All All
Total Number of Placements 69 78
* denotes Not Available.
The Wyoming state agencles were asked to descrlbe children placed out of Wyoming In 1978 according tothe variety of conditions and statuses listed in Table 51-17. The state child welfare agency was notable to respond to this question. The Department of Education reported children who were physically andmentally handicapped, developmentally disabled, and emotionally disturbed to be placed out-of-state inthat year. These children generally went to residential treatment or child care facilltles in other.states.
The state Juvenile Justice agency indicated that childrenunruly/disruptive, battered, abandoned, or neglected, experlencingdetermined to:, be truants or Juvenlle delinquents. These childrenof-state relatives.in 1978. The DHSS, although not mentioning thereport that children they reported placIng out of state most often
placed out of Wyoming were generallyproblems with substance abuse, or weremost frequently went to live with out-conditions of the children placed, dldwent to live with relatives.
TABLE 51-17. WYOMING: CONDITIONS OF CHILDREN PLACED OUTOF STATE IN 1978, AS REPORTED BY STATEAGENCIES, BY AGENCY TYPE
Types of ConditionsAgency Typea
Education Juvenile Justice
Physically Handicapped
Mentally Handicapped
Developmentally Disabled
X
X
X
0
0
0
WY-24
274

TABLE 51-17. (Continued)
Types of Conditions
Agency Typea
Education Juvenlie Justice
Unruly/Disruptive 0
Trtionf4e 0
Juvenlle Delinquents 0
Emotionally Disturbed X
Pregnant 0
Drug/Alcohol Problems 0
Battered, Abandoned, or Neglected 0
Adopted Children 0
Foster Children 0
Other 0
a. X indicates conditions reported.
None of the state agencles reported their 1978 expendltures for out-of-state placements.
F. State Agencies' Knowledge of Out-of-State Placements
In each state, state and local officials were asked to report about placements made or arranged by
their respective agencies. State officials were also asked to report on the number of such placementsmade by their counterparts In local government. Table 51-18 reflects the results from thls Ilne of ana-
lysls In Wyoming. The table glves the percentage of the total number of state and locally arranged out-of-state placenients known to state officials.
A rview of Tabl 51-18 revals that the state child welfare agency had knowledge of 69 out-of-stateplacements occurring but, as mentioned In the discussion on Table 51-15, could not distinguish between
those which were state and locally arranged. The survey of local child welfare agencies had identified72 placements made out of Wyoming In 1978, ImplyIng the state agency did not have knowledge of at least a
portion of these local placements.
The state Juvenile Justice agency was not able to report the number of out-of-state placements, while
both the stat ducation and mental halth and mental retardation agencies provided complete placement
information, the latter agency having no Involvement In the activity in 1978. However, it should also be
noted that the state education agency attributed more out-of-state placements to local Wyoming school
districts than were identified In the survey.
WY-25
275
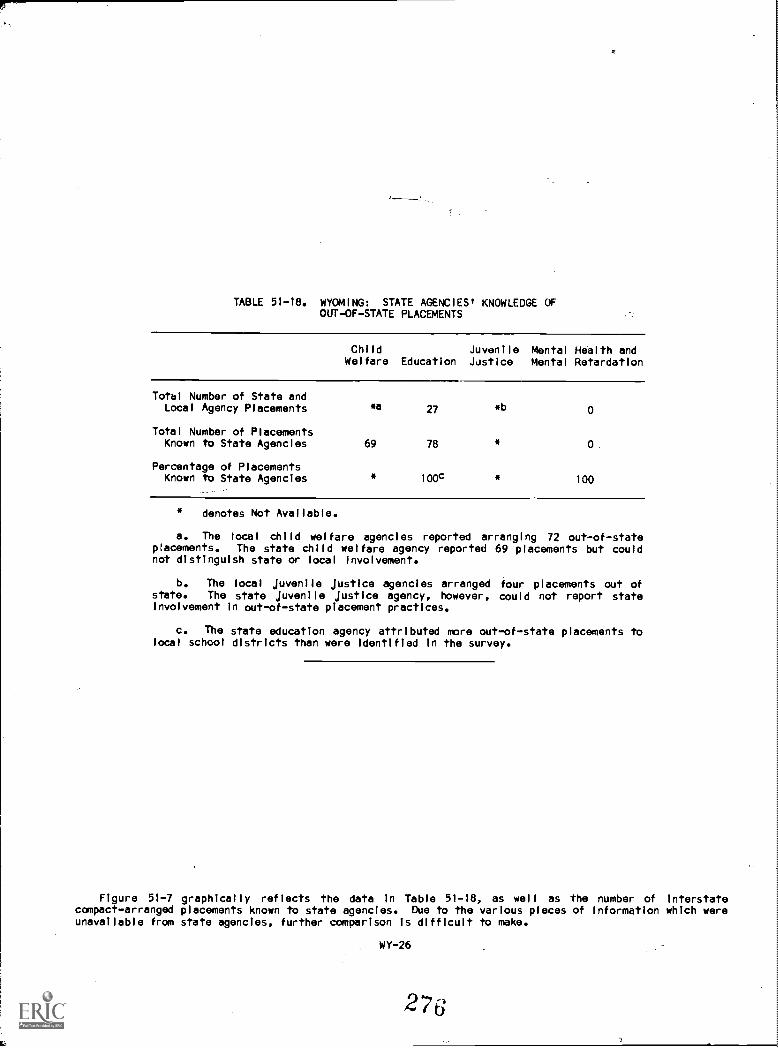
TABLE 51-18. WYOMING: STATE AGENCIES' KNOWLEDGE OFOUT-OF-STATE PLACEMENTS
Child Juvenile Mental Health andWelfare Education Justice Mental Retardatlon
Total Number of State andLocal Agency Placements
Total Number of PlacementsKnown to State Agencies
Percentage of PlacementsKnown to State Agencles
*a
69
27
78
100c
*b
100
* denotes Not Available.
a. Theplacements.not dIstIngu
b. Thestate. TheInvolvement
c. Thelocal school
local child welfare agencles reported arranging 72 out-of-stateThe state child welfare agency reported 69 placements but could
lsh state or local involvement.
local Juvenlle Justice agencies arranged four placements out ofstate Juvenile Justice agency, however, could not report state
in out-of-state placement practices.
state educatlon agency attrlbuted more out-of-state placements todIstrIcts than were identified in the survey.
Flgure 51-7 graphlcally reflects the data In Table 51-18, as well as the number of Interstatecompact-arranged placements known to state agencies. Due to the various pieces of information whlch wereunavallable from state agencles, further comparison Is difficult to make.
WY-26
276

80
70
60
50
40
30
20
10
72a
69 69
FIGURE 51-7. WYOMING: THE TOTAL NUMBER OF STATE AND LOCALPLACEMENTS AND USE OF COMPACTS, AS REPORTEDBY STATE AGENCIES, BY AGENCY TYPE
27
Child Welfare
denotes Not Available.
State and Local Placements
State and Local Placements Known to State Agencies
C=I State ard Local CompaCt-Arranged Placements Reported by State Agencies
78c
4b
Education Juvenile Justice
a. Includes only the out-of-state placements reported by local child welfare agencies. The state
agency did not distinguish between state and locally arranged placements among the 69 children it
reported placed out of state.
b. Only local Juvenile Justice agencies were able to report their involvement in out-of-state place-
ment In 1978.
c. The state education agency attributed moreoutofstate placements to local agencies than were
identified in the survey.
V. Concluding Remarks
Some of the trends evident In the foregoing results follow.
Predominant among the survey findings was the occurance of out-of-state placeoent among local
agencies In almost every county of Wyoming, regardless of any county characteristics such as
size of Juvenile population, level of urbanization, or proximity to a state border.
The destinations of children sent out of WYoming In 1978, reported by local Phase II agencies
and the state child welfare agency, were generally to the six states surrounding Wyoming,
often with the use of an interstate compact (the exception being those made by local school
districts).
WY-27
`3, 7 7

Little Interagency Interaction between the local courts and the state Juvenile Justice agencywas reflected In the survey findings. The local courts reported no interagency cooperation Inplacement and no compact utilization, while the state agency could not report local agencyincidence of placement or any interstate compact information.
The reader Is encouraged to compare national trends described in Chapter 2 with the findings whichrelate to specific practices in Wyoming In order to develop further conclusions about the state'sinvolvement with the out-of-state placement ot children.
FOOTNOTE
1. General Information about states, counties, cities, and SMSAs Is from the special 1975 populationRstImates based on the 1970 national census contained In the U.S. Bureau of the Census, County and CityData Book, 1977 (A Statistical Abstract Supplement), Washington, D.C., 1978.
17Taii&OTERr abbut direct ginFelrYterre and local total per capita expenditures and expenditures foreducation and public welfare were also taken from data collected by the U.S. Bureau of the Census andthey appear In Statistical Abstract of the United States: 1979 (100th Edition), Washington, D.C.,1979.
The 1978 estimated population of persons eight to 17 years old was developed by the National Centerfor Juvenile Justice using two sources: the 1970 national census and the National Cancer institute 1975estimated aggregate census, also prepared by the U.S. Bureau of the Census.
.111.S. COMMENT munam OPPICZI 1982-0-361-233/1901
WY-28
27(3