Embed Size (px)
Citation preview

DOCUMENT RESUME
ED 105 213 CE 003 503
AUTHOR Gerner, JenniferTITLE Wisconsin Maternity Leave and Fringe Benefits:
Policies, Practices and Problems.INSTITUTION Wisconsin State Dept. of Industry, Labor and Human
Relations, Madison. Equal Rights Div.SPONS AGENCY Manpower Administration (DOL), Washington, D.C.
Office of Research and Development.PUB DATE 74NOTE 184p.
EDRS PRICE MF-$0.76 HC-$9.51 PLUS POSTAGEDESCRIPTORS Costs; Economic Factors; *Economic Research;
Employment Problems; Equal Opportunities (Jobs);Equal Protection; Federal Legislation; Females;*Fringe Benefits; *Guidelines; Labor Force; *Leave ofAbsence; Policy Formation; Sex Discrimination;*Working Women .
IDENTIFIERS Equal Employment Opportunity Commission; Wisconsin
ABSTRACTThe study examines the economic implications in
Wisconsin of the 1972 Equal Employment Opportunity Commissionguideline which requires employers to treat maternity leave as atemporary (Usability. First, the static cost of the maternity leaveguideline to employers is estimated for the State of Wisconsin.Second, some examination of the economic response to this cost isattempted. Finally, the relationships between maternity leave andother fringe benefits, wages, and the age distribution of employedfemales are examined using hospital data. The total cost of thematernity leave guideline for Wisconsin ranges from $4.4 million to$12.8 million annually. Although this cost is not excessive, it mayadd 3-11 percent to the cost cf providing compensated temporarydisability plans. Data for hospitals in Wisconsin were examined forrealtionships between maternity leave, other fringe benefits, agedistribution of employed females, and wages. It was found that theproportion of nurses ages 17 to 39, the main childbearing years, isinversely related to maternity leave. Maternity leave is not asubstitute or complement to other fringe benefits. Maternity leavetends to be negatively related to wages. (The document concludes withfour appendixes of statistical tables and a three-page bibliography.)(Author)

U S DEPARTMENT OF HEALTH,EDUCATION t WELFARENATIONAL INSTITUTE OF
COUCATIONTI /IS DOCLAAENT mAS BEEN REPRO°um) ExActtv AS RECEIVED FROMTHE PERSON OR ORGANIZATiON ORIGIN
ATiNG I T POINTS Oi VIEW OR OPINIONSSTATED DO NOT NECESSARILY REPRESENT OFFICIAL NATIONAL IN$TITUTI OrEDUCATION POSITION OR POLICY
WISCONSIN MATERNITY LEAVE AND FRINGE BENEFITS:
POLICIES, PRACTICES AND PROBLEMS
Equal Rights DivisionDepartment of Industry, Labor and Human Relations
Prepared by Jennifer Gerner
1974
This report was prepared for the Manpower Administration, U.S.Department of Labor, under research and development grant No.
21-55-73-22. Since grantees conducting research and develop-ment projects under Government sponsorship are encouraged toexpress their own judgment freely, this report does not nec-
k)essarily represent the official opinion or policy of the De-partment of Labor. The grantee is solely responsible for the
contents of this repert.
0
2/3

BIBLIOGRAPHIC DATASHEET
I. Report No.DLMA 21-55-73-22-1
2. 3. Recipient's Accession No.
.1. 1 i.:, v..1 tiotitleWisconsin Maternity Leave and Fringe Benefits: Policies,
Practices and Problems
5 Report DateNovember 1, 1974
6.
7. iuI r
Jennifer Gerner8. Performin Oritani/ation Rcpt.
No.
9. Pcrtorn.to, Organizatron Name and AdArt.t.sDILHR-Equal Rights Division201 East Washington AvenueMadison, Wisconsin 53701
10. Pfojet : I .t:4:/%k wt. Unit No.
i t. Contr3vt/or:int No.
DL 21-55-73-22
12. N-ncr:11.. or4ansiar.or. Name and Addr...:.U.S. DepartMent of LaborManpower AdministrationOffice of Research and Development
601 D Street. N.W., Washington, D.C. 20213
11. Type of Report & PeriodCovered Final
set. 1, 1972-Nov. 1, 197
14.
15. s,o;.plementary Notes
16. as.r.mts This study examines the economic implications in Wisconsin of the 1972 Equal1 mployment Opportunity Commission guideline which requires employers to treat maternityleave as a temporary disability. First, the static cost of the maternity leave guidelineto employers is estimated for the State of Wisconsin. Second, some examination of theeconomic response to this cost is attempted. Finally, the relationships between mater -ity leave and other fringe benefits, wages, and the age distribution of employed females
are examined using hospital data. The total cost of the maternity leave guideline forisconsin ranges from $4.4 million to $12.8 million annually. Although this cost is not
excessive, it may add 3% to 11% to the cost of providing compensated temporary disabilityplans. Data for hospitals in Wisconsin were examined for relationships between maternityleave, other fringe benefits, age distribution of employed females, and wages. It wasfound that the proportion of nurses ages 17 to 39, the main childbearing years, is inver-sely related to maternity leave. Maternity leave is not a substitute or complement toether fringe benefits. Maternity leave tends to be negatively related to-wages.17. Key Words and Document Analysis. 17o. Descriptors
Economic analysisEmploymentFemalesFringe benefitsGovernment policiesLabor
17b. ideruifiers Open-1:nded Terms
17c. ( ()NATI hrehlArroup 5 C
18. ,,,t11., iht, : Sit /sat nt Distribution is unlimited.Available from Yational Technical InformationService, Springfield, Va. 22151.
19. :,( t uric) ( iass (ThisReprt)
ivi,A,:qurn
21. N..n Pat., s
1882677,,,,,ally(ta,,(11,i,
Par,I Na 1-1..-1111,0
22. hi.,
11; ro,g, 1; g , fog,. v. 1/1PORSI MAY IF REPRODI
r.
4

ti)
3
Acknowledgments
This study has been made possible only with the assistance of a great
number of people. I am most indebted to my thesis advisors at the University
of Wisconsin: Glen G. Cain, Peter Lindert, and James Sweet. Their comments
were invaluable throughout the course of the study. I am also grateful to
Gary Keynon, who provided a much needed sounding board in the early stages
of the study, and to Robert Avery, who suggested several improvements in
the analysis, and to John Stewart, who provided advice throughout the study.
Myron Kwast read portions of an early draft and provided many useful sugges-
tions. Of course, final responsibility for short comings of the research is
mine.
The data could not have been collected without the invaluable assis-
tance of the Wisconsin Hospital Association. The Wisconsin School Board
Association was instrumental in collection of the school district data. I
am indebted to the Manpower Administration of the Department of Labor for
financial support throughout the research and the Wisconsin Department of
Industry, Labor, and Human Relations for providing a variety of services.
Perhaps most important is the debt of gratitude I owe to my typists, Jan
Schneider and Kathy Holperin, who suffered through several drafts of the
study. Finally, I owe much to my husband, Jerry, who tolerated me through-
out the study.

TABLE OF CONTENTS
Acknowledgements
List of Tables
1. Introduction
2. The Economic Framework2.1 The Labor Cost Function2.2 Responses to an Increase in the Cost of Provision
i
iv
1
7
7
of Temporary Disability Leave 14
3. The Data 21
3.1 The Employer and School District Data 21
3.2 The Hospital Data 26
3.3 Supplementary Data 29
4. Estimates of the Cost of Treating Maternity Leave as aTemporary Disability 33
4.1 The Estimate for Employers in Industries Coveredby Survey 33
4.2 The Estimate for Employers not Covered by SurveyData 47
4.3 The Estimate for the Educational Services Industry 47
4.4 The Estimate for the Health Services Industry 54
4.5 The Estimate for the State of Wisconsin 61
5. Hospital Response to the Cost of Maternity Leave 63
5.1 Previous Research Concerned with RelationshipsBetween Components of Total Compensation 63
5.2 A Review of the Hospital Data 70
5.3 Examination of the Hospital Data for Employee AgeDistribution Differences 72
5.4 Examination of the Hospital Data for a Substitu-tion Effect 77
5.5 Examination of the Hospital Data for a Wage Effect 81
5.6 Summary of Results of the Examination of the Hos-pital Data 89
6. Union Behavior with Respect to Fringe Benefits 93
6.1 Union Negotiated Contracts 94
6.2 The Influence of Arbitration Decisions and CourtCases
6
100
7. Summary and Conclusions 107
7.1 Summary of Findings with Respect to Maternity Leave 107
7.2 The Implication of These Findings for the MaternityLeave Guideline 109
7.3 Maternity Leave as an Example of Fringe BenefitBehavior 109
7.4 Conclusion 110
AppendixA. Survey of Employers, School Districts, and HospitalsB. Tabulation of Responses to the Hospital SurveyC. Data Used in Calculating the Age and Education Speci-
fic Probabilities of PregnancyD. Additional Regression Results Using Hospital Data
Bibliography
7
111
135
155
169
177

'1ST OF TABLES
3-1 Number of Firms Drawn by Industry Group and SizeCategory, 100 Sample
3-1A Number of Responses by Industry Group and SizeCategory, 100 Sample
3 -2 Number of Firms Drawn by Industry Goup and SizeCategory, 200 Sample
3-2A Number of Responses by Industry Group and SizeCategory, 200 Sample
3-3 Probability of Pregnancy Given Employment by Ageand Education, 1973
4-1 Industry of Experienced Civilian Employed Personsby Sex
4-2 Number of Firms in Surveyed Industry by EmploymentSize
4-3 Percent of Employees Covered by Vart.ous Sick LeavePlans, by Industry, for Surveyed Industries
4-4 Percent of Employees Covered by Selected FringeBenefits by Industry, for Surveyed Industries
4-5 Estimated Annual Cost of Treating Maternity Leaveas a Temporary Disability by Industry for SurveyedIndustries, Assuming One Year's Earned Sick Leave
4-6 Annual Cost of the Maternity Leave Guideline Assum-ing Maximum Accumulation by Industry for SurveyedIndustries
4-7 Annual Cost of the Maternity Leave Guideline perFemale Employee by Industry fcr Surveyed Industries
4-3 Annual Cost of the Maternity Leave Guidelines as aPercent of Wages and Salaries for Those Firms Affected
4-9 Estimated Cost of the Maternity Leave Guideline forIndustries Not Covered by Survey Data, Assuming SickDays for One Year Available
-iv-
23
23
24
24
31
34
35
38
41
43
44
45
46
48

!,-I0 Estimated Cost of the Maternity Leave GuidclIne forIndustries Not Covered by Survey Data, Assuming Maxi-mum Accumulation of Sick Days Available 49
4-11 Annual Cost of the Maternity Leave Guideline per fe-male Employee by Industry for Industries Not Coveredby Survey Data 50
4-12 Estimated Annual Cost of the Maternity Leave Guidelineper Female Employee in Firms with a Sick Leave Plan inCompliance 51
4-13 Estimated Annual Dollar Cost of the Maternity LeaveGuidelines for School Districts for Educational Services 53
4-14 Estimated Annual Dollar Cost of the Maternity LeaveGuideline for Hospitals 55
4-15 Estimated Annual Cost of the Maternity Leave Guidelineper Female Employee, All Hospitals 56
4-16 Estimated Annual Cost of the Maternity Leave Guidelineas a Percent of Payrolls, All Hospitals 57
4-17 Estimated Annual Cost of Maternity Leave per Female:imployee, Affected Hospitals 58
4-18 Estimated Annual Cost of the Maternity Leave Guidelinefor Hospitals as a Percent of Payrolls for AffectedHospitals 59
4 -19 Estimated Annual Cost of the Maternity Leave Guidelinefor the Health Care Services Industry 60
4-20 Estimate of the Cost of the Maternity Leave Guidelinefor the State of Wisconsin 62
5-1 Coverage and Contributions Under Employee Benefit Plans,195n-1970 66
5-2 Contributions and Benefits, Total and Selected Benefits,1950 and 1970 67 e.
5-3 Coefficient of Variation of Wages by Occupation inHospitals 71
5-4 Fringe Benefits Offered by Hospitals, Response forHospitals in the Primary Data Set 73

5-5 Estimated Regression Coefficients, Examining Hospital
i-6
Coefficients for Age Differerences
Simple Correlation Coefficients Between Fringe Bene-
75
fit Variables 78
1-7 Estimated Coefficients Regressing Fringe Benefit Vari-ables Against Each Other 80
5 -S Estimated Regression Coefficients and Statistics, WageEffect, for Primary Hospital Data Set 84
3-9 Estimated Alternative Wage Relationships 86
5-10 Rate of Employment Growth in Hospitals, 1968-1972 88
5-11 F-Test Results 90
6-1 Agreements Examined by Union 98
6-2 Provisions of Contracts by National Female Membership 99
C-I Births by Age and Education, 1967 156
C -2 Total Births by Age and Education, 1968 157
C-3 Births by Age and Education, 1969 158
C-4 Female Employment by Age and Education, 1967 159
C-5 Female Employment by Age and Education, 1968 160
C-6 Female Employment by Age and Education, 1969 161
C-7 Number of Births to Employed Women in Sample byAge and Education, National Natality Survey, 1967 162
C-8 Number of Births to Employed Women in Sample by Ageand Education, National Natality Survey, 1968 163
C-9 Number of Bin s to Employed Women in Sample by Ageand Education, National Natality Survey, 1969 164
fr
C-10 Probability of Pregnancy Among Employed Women, 1967 165
C-Il Probability of Pregnancy Among Employed Women, 1968 166
C-12 Probability of Pregnancy Among Employed Women, 1969 167
D -1 Definition of Indepeudent Variables 170
-vi-
10

0-2 Simple Correlation Coefficients Between Wage Rates byOccupation Croup, Primary Hospital Data Set
0-1 Estimated Regression Coefficients, Wage Effect, Hos-pitals, Pr -imary Data Set
D-4 Estimated Regression Coefficients, Wage Effect, Sec-ondary Data Set
D-5 Simple Correlation Coefficients Between Fringe Bene-fits, Secondary Hospital Data Set
0-6 Estimated Regression Coefficients, Substitution Effect,Secondary Hospital Data Set
171
172
173
174
175
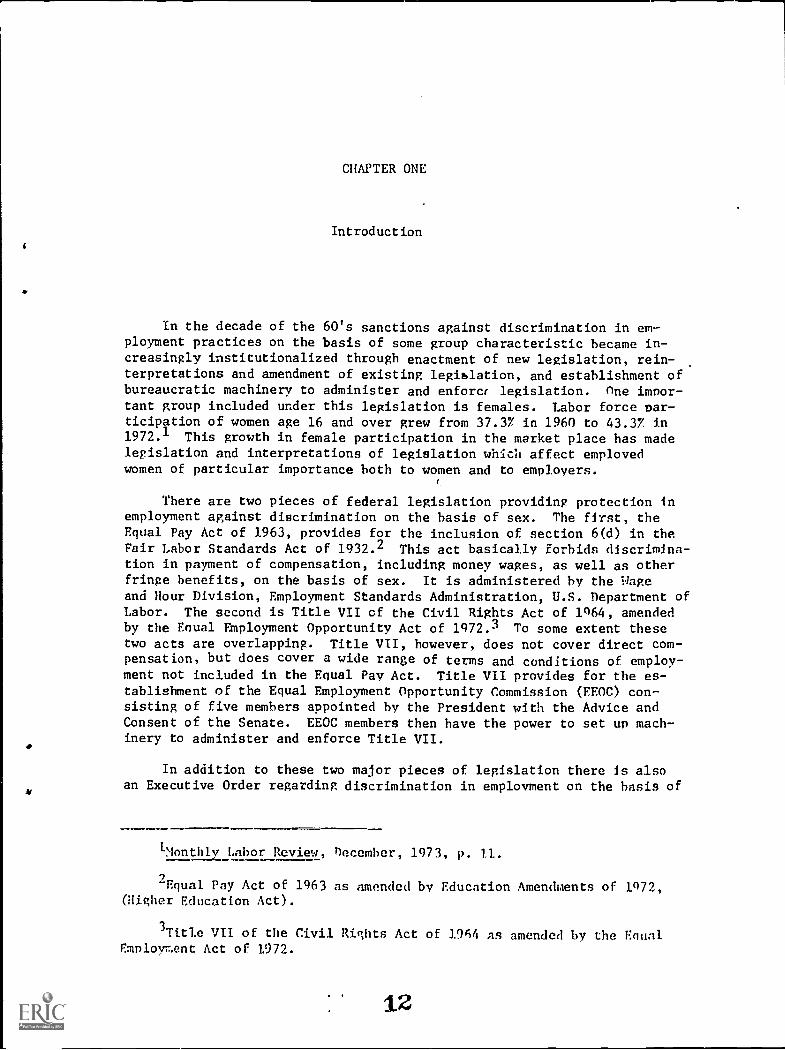
CHAPTER ONE
Introduction
In the decade of the 60's sanctions against discrimination in em-ployment practices on the basis of some group characteristic became in-creasingly institutionalized through enactment of new legislation, rein-terpretations and amendment of existing legislation, and establishment ofbureaucratic machinery to administer and enforce' legislation. One impor-tant group included under this legislation is females. Labor force par-ticipation of women age 16 and over grew from 37.37 in 1960 to 43.37 in1972.1 This growth in female participation in the market place has madelegislation and interpretations of legislation which affect employedwomen of particular importance both to women and to employers.
There are two pieces of federal legislation providing protection toemployment against discrimination on the basis of sex. The first, theEqual Pay Act of 1963, provides for the inclusion of section 6(d) in theFair Labor Standards Act of 1932.2 This act basically forbids discrimina-tion in payment of compensation, including money wages, as well as otherfringe benefits, on the basis of sex. It is administered by the Wageand Hour Division, Employment Standards Administration, U.S. Department ofLabor. The second is Title VII of the Civil Rights Act of 1964, amendedby the Equal Employment Opportunity Act of 1972.3 To some extent thesetwo acts are overlapping. Title VII, however, does not cover direct com-pensation, but does cover a wide range of terms and conditions of employ-ment not included in the Equal Pay Act. Title VII provides for the es-tablishment of the Equal Employment Opportunity Commission (EEOC) con-sisting of five members appointed by the President with the Advice andConsent of the Senate. EEOC members then have the power to set up mach-inery to administer and enforce Title VII.
In addition to these two major pieces of legislation there is alsoan Executive Order regarding discrimination in employment on the basis of
LMonthly Labor Review, December, 1973, p. 11.
-Equal Pay Act of 1963 as amended by Education Amendments of 1972,(Higher Education Act).
3Title VII of the Civil Rights Act of 1964 as amended by the EqualEmployment Act of 1972.
12

sex. Executive Order 11246 as amende0 by Executive Order 11375, alsoknown in part as Revised Order No. 4, forbids federal government agen-cies from dealing with firms or institutions which discriminate, and in-
stitutions to have an Affirmative Action plan for recruiting and main-taining a work force balanced with respect to minorities and women.This is an exceedingly powerful order since it provides that all currentcontracts be terminated and no future contracts may be awarded to anyfirm or institution found in violation. The Office of Federal ContractCompliance, (OFCC), the administrative agency for Revised Order No. 4,has initiatory power, unlike EEOC and the Wage and Hour Division, both ofwhich must wait for formal complaints before investigating alleged dis-crimination.
These are the three major indications of federal public policy ondiscrimination in employment on the basis of sex. All states have somepolicy in this regard as well. Many states provide what was once viewedas protection for women in employment by requiring higher minimum wages,longer rest breaks, and special facilities, e.g., separate lunch areasfor women and forbidding women from working more than some specifiednumber of hours per week, working certain shifts, and working during somespecified period of pregnancy. These state laws are in conflict with thefederal policy noted above and are not acceptable as a defense for vio-lation of federal law. Many states now have adopted equal rights lawsof their own. In Wisconsin the Fair Employment Practices Act,5 admin-istered by the Equal Rights Division, Department of Industry, Labor,and Human Relations, (DILHR), roughly parallels federal policy, the ma-jor difference being that all employers, regardless of size are coveredwhere federal law covers firms engaged in interstate commerce with 15or more employees.
Because all of these pieces of legislation are somewhat vague andgeneral in their language the agencies charged with administering thelegislation periodically issue guidelines and interpretations. Theseguidelines are not legal documents but are meant to indicate to employers,employees, and unions what constitutes discriminatory behavior in theviews of the agency. The Administrative agencies use these guidelineswhen issuing determinations on complaints filed with them. There islegal recourse through the court system and guidelines may be overturned.However, guidelines are generally based on lower court decisions andhave in most cases been upheld.
In March 1972 EEOC issued a guideline requiring that maternity leavebe treated as a temporary disability. This guideline, Title 29, Labor,Chapter XIV, Part 1604.10, Employment Policies Relating to Pregnancyand Childbirth, added March 31, 1972 states:
1fExecutive Order 11246 as amended by 11375.
5Wisconsin's Fair Employment Practices Law.
-2-
13

a) A written or unwritten employment policy of prac-tice which excludes from employment applicants oremployees because of pregnancy is in prima facieviolation of Title VII.
b) Disabilities caused or contributed to by pregnan-cy, miscarriage, abortion, childbir-' . recov-ery therefrom are, for all job-rei pc.-doses,
temporary disabilities and should tie created assuch under any health or temporary disability in-surance or sick leave plan available in connectionwith employment. Written and unwritten employmentpolicies and practices involving matters such asthe commencement and duration of leave, the avail-ability of extensions, the accrual of seniority andother benefits and privileges, reinstatement, andpayment under any health or temporary disability.due to pregnancy or childbirth on the same termsand conditions as they are applied to other tem-porary disabilities.
c) Where termination of an employee who is temporarilydisabled is caused by an employment policy whichin-Afficient or no leave is availhble, such a ter-mination violates the Act if it has a disparate im-pact on employees of one sex and is not justifiedby business necessity.
In September of 1972 Wisconsin's Department of Industry, Labor andHuman Relations issued an identical guideline. In January, 1974 OFCCannounced that after public hearings it, too, would issue an identicalguideline. These guidelines taken together provide virtually universalcoverage in Wisconsin. These guidelines imply that an employer may notdismiss a pregnant employee, set an arbitrary point in the pregnancyfor beginning or completing a maternity leave, nor enforce a maternityleave of an arbitrary length i. time. Rather an absence from work dueto childbearing or complications of pregnancy must be treated as anyother temporary disability, including pay of temporary disability bene-fits in accordance with the employer's established temporary disabilitypolicy.
The legal status of the guideline remains in some question. Twocases involving the guideline have recently been decided by the SupremeCourt. In Cleveland Board of Education v. LaFleur, a Cleveland Boardof Education rule requiring every pregnant teacher to take a maternityleave without pay, beginning five months before the expected birth andending at the beginning of the next regular semester after the childwas the age of three months was challanged. The Court ruled that
-3-
14

"...the Cleveland return rule, insofar as it em-bodies the three months age provision, is wholly arbi-'trary and irrational, and hence violates the Due ProcessClause of the Fourteenth Amendment. The age limitationserves no legitimate state interest, and unnecessarilypenalizes the female teacher for asserting her rightto bear children."6
Although this decision affirms the portion of the guideline whichprohibits employers from requiring an arbitrary length of absence fromwork for childbearing, a second decision, Geduldig v. AIELLO, suggeststhat temporary disability payments need not be made during an absencefrom work for childbearing. In this case the state of California, whichadministers a temporary disability insurance system for all employees inthe state, refused to provide benefits for absences from work due to nor-mal pregnancies. The policy was challenged by a woman who was deniedbenefits. In its decision the Court ruled:
"We cannot agree that the exclusion of this disa-bility from coverage amounts to invidious discrimina-tion under the Equal Protection Clause. Californiadoes not discriminate with respect to persons or groupswho are eligible for disability insurance protectionunder the program. The classification challenged inthis case related to the asserted under-inclusivenessof the set of risks that the State has selected toinsure. Although California has created a program toinsure most risks of employment disability, it has notchosen to insure all such risks, and this decision isreflected in the level of annual contribution exactedfrom participating employees."
Later in the decision the Court addresses the issue of the cost:
"It is evident that a totally comprehensive pro-gram would be substantially more costly than the pres-ent program and would inevitably require state subsidy,a higher rate of employee contribution, a lower scaleof benefits for those suffering insured disabilities,or some combination of these measures."
6Cleveland Board of Education v. LaFleur 6 FEP Cases 1253.
7Geduldig v. AIELLO 8 FEP Cases 97.
-4-
15

These two decisions were issued in the first half of 1974. Tt is tooearly to evaluate the extent to which they are generally applicable.However, while reaffirming part of the guideline, they seem to leave thequestion of compensation during maternity leaves in some doubt. None-theless the administrative agencies which have issued maternity leaveguidelines continue to accept complaints.
The maternity leave guidelines have generated a great deal ofcontroversy. Employers have historically had a variety of policies fortreating absences from work due to childbearing. These have ranged fromfiring pregnant employees to requiring some arbitrarily long leave ofabsence to treating a maternity leave as a temporary disability. Ingeneral, however, the maternity leave policy was distinct from the tem-porary disability policy. The maternity leave guideline will requiresome adjustment on the part of a large number of employers. Employershave vigorously opposed the guideline on the grounds that the adjustmentis extensive and that the guideline imposes a policy which is normallyregarded as an employer prerogative. Feminists and equal rights advocateshave equally vocally supported the guideline as a means toward insuringequal compensation.
In the debate between these groups there has been very littlereal evaluation of the impact of the guideline. The Federal Reserve Bank ,
of Boston has estimated the cost of providing temporary disability cov-erage for its approximately 950 female employees at between $10,361 and817,073. This figure is estimated using data from 1971-1972 and assumesthe number of births experienced in that year isthe average number ex-pected overtime.8 The American Civil Liberties Union has published adescriptive and anecdotal discussion of maternity leave policies existingin the United States.9 Neither of these studies provide insights intothe static cost of the guideline or behavioral economic responses to thecost.
This study is an economic analysis of the guideline. It has threegoals. First the static cost of the maternity leave guideline to em-ployers is estimated for the State of Wisconsin. The estimate suggeststhe magnitude of the cost impact of the guideline. Second, some examina-tion of the economic response to this cost is attempted. The reason forthis part of the analysis is to attempt to determine who will bear thecost of the guideline. Finally, the broader goal is to provide a modelwhich will aid in the evaluation of other fringe benefit changes and toattempt to identify some other fringe benefits which may be differentiallyadministered depending on
8Greenwald, Carol, "Maternity Leave Policy," New England EconomicReview, Federal Reserve Bank of Boston, January/February 1973, pp. 13-18.
9Hayden, Trudy, Punishing Pregnancy: Discrimination in Education,Employment, and Credit, ACLU Reports, Women's Rights Project, October,1973.
-5-
16

Chapter two sets out the economic framework to be used for the costcalculation and for he analysis of the response. Although chapter twois written specifically for the case of maternity leave, much of what issaid is applicable to other fringe benefits. Chapter three presents adiscussion of the data to be used in the cost calculation and the analysisof the response. Chapter four presents the cost calculations for theState of Wisconsin. Chapter five examines three possible responses usinghospital data. Particular attention is paid to maternity leave but otherfringe benefits are examined as well. Chapter six examines union responseto differential administration of fringe benefits on the basis of sex andsuggests some fringe benefits where this may occur. Finally, chapterseven brings the results of the analysis and draws some policy implica-tions.
-6--
17

CHAPTER TWO
The Economic Framework
The analysis will address itself to two questions. First, whatis the initial cost to the employer of treating maternity leave as atemporary disability. This can be dealt with by recognizing that amaternity leave policy and a temporary disability policy are fringebenefits which may be viewed as contributing to the total compensa-tion paid by the employer in return for labor services. Second, howand to what extent may this cost be shifted. We will assume that,given an equilibrium level of total compensation, any exogeneouslyimposed disturbance to that level will induce adjustment. This willbe discussed at a later point.
2.1 The Labor Cost Function
When the firm hires labor it does so with the realization thatwages per se are not the only cost incurred attributable to labor.Other costs include costs attributable to provision of wage supple-ments such as health, life or other insurance. pension plans, etc.In addition there are costs incurred due to absence from work, whetherthe absence is voluntary and planned, as with a vacation, or involun-tary and unplanned, as with c illness. The full labor cost functionto be developed considers in particular the costs incurred by the firmdue to wages, absences from work due to temporary disability, and allother wage supplements as a group. A temporary disability will be de-fined as any illness or accident which does not permanently impair theability of the employee to perform his job but does temporarily requirehis absence from work.
The firm faces an expected wage bill for one man-year of laborservices of E(w)y where E(w) is the expected total wage bill for oneman-day of labor and y is the number of days in one man-year. E(w) iscomposed of the expected total daily compensation paid to regular work-ers and the expucted total daily compensation paid to temporary workersreplacing regular workers during an absence:

E(w) = E(w) + E0JO (1)
E(0 ) y - E(a)SOP ,E (W + F + I S) ( ) (2)
y - E(a) y
E (a)
E() =
y
Where:
(3)
E(w) = expected total wage bill for one man-day of labor services
E(w) = expected total daily compensation paid to regular workers
E() = expected total daily compensation paid to replacement tem-porary workers
= daily money wage rate to regular workers
F = daily employer contributions to provision of all fringe bene-fits except a temporary disability policy
S = daily compensation paid to a regular worker during an absencedue to illness
E(0 ) = expected number of days of compensated absence an employerpays per worker
E(a) = expected number of days of absence due to illness a workerwill experience
y = the number of days in one year, or the relevant period
Substituting (2) & (3) into (1) we have:
y - E(a) E( ,) E(a)E(w) = (w + F) ( ) + ( S + w) ( ) (1$)
Y E(a) y
-8-
19

This is merely a statement that the expected wage rate a firm facesto provide one man-day of labor services is equal to the sum of costsattributable to the regular worker when he is not providing labor ser-vices, the costs attributable to the regular worker when he is not pro-viding labor services, and the costs attributable to the temporary work-er when he is providing labor services.
The introduction of payments to a regular worker during absencesdue to illness according to a temporary disability policy introduces anasymmetry. The firm's temporary disability policy is characterized byparameters describing the daily rate of compensation during an absence,the maximum number of days of absence for which compensation is paid,and whether or not proof of temporary disability is required. The asym-metry is introduced by the existence of a maximum number of days forwhich temporary disability compensation is paid. The firm pays compen-sation for exactly the number of days of absence as long as the numberof days of absence is less than or equal to the maximum number of com-pensated days in the temporary disability plan, however, only the max-imum number of days are paid. Thus while the firm only expects to payE(01) days of absence:
where:
yE(a) - E ipi
i=0
yE(0 ) = E ip., i = B for 2.13
I 1.0
= total number of days of absence
P.= probability of missing i total ;limber of days
B = maximum number of compensated days under the temporary dis-ability plan and assuming y is the relevant time period.
Note that the probabilities used here are the probabilities derived froma probability distribution of lengths of absences due to temporary disa-bility across all employed individuals. Although any individual may havedifferent subjective probability distribution, as long as employment in agiven firm is random with respect to these probability distributions, itis appropriate for the employer to use the average probability distribu-tion. From these expressions it can be seen that:
(6) E(01) < E(a) with the equality holding only if Buy,i.e., the maximum paid days equal thetotal number of working days in period y
-9-
20

(7) E(01) < B with the equality holding only if pi,i = B = 0 i.e., no probabilityof being absent less than the maximumdays
The implicatio.L of (6) and (7) is that a firm expects the total numberof compensated sick days taken by its employees to be less than the to-tal number of compensated sick days allowed under the temporary disabi-lity plan, even if the temporary disability plan allows fewer than E(a)days.
The formulation shown above applies to a type of temporary disabi-lity plan where a specified total number of days of absence are compen-sated, all days of absence up to the total are compensated, regardlessof the length of any single absence, proof of temporary disability isrequired, and the maximum number of days are granted at the beginningof the period with unused days cancelled at the end of the period. Cer-tain variations of this type of plan can be handled with only minor mod-ifications of the formulation. Allowing accumulation, i.e., unused daysat the end of period one may be carried over to period two by addingthem to the grant of days at the beginning of the next period, is simplyan increase in the maximum number of compensated days, B, in period two.If proof of temporary disability is not required then as long as accumu-lation is not allowed there is an incentive to workers to use all sickdays by the end of the period. Those days not used for actual illnesswill be used as "vacation" days, although the worker may wait until closeto the end of the period before taking "vacation" days. When accumula-tion is allowed there is still an incentive to take some "vacation" daysbut since unused days are not lost at the end of the period, all daysmay not be taken. Thus the number of days taken lies between E(0/) andB, with the actual days taken determined by the worker's evaluation ofhis personal probability of temporary disability and his own risk posi-tion. Temporary disability plans may incorporate an exemption periodwhere the first few days of any illness would not be compensated. Undersuch a plan the probability of total number of days of temporary disabi-lity must be supplemented with a probability distribution 6or the num-ber of incidents.
A second type of temporary disability plan is one which is typicalof insured temporary disability plans. This type of plan does not spe-cify a maximum total number of compensated days but does place a limiton the number of compensated days per incident, typically 13 or 26 weeks.The plan typically carries an exemption period of up to eight days andpays for multiple incidents, sometimes requiring thirty days between paidincidents. As will be shown maternity leave can be dealt with in thisplan without a formal specification for E(0I).
-10-
21

The above discussion has assumed that the probabilities of any ab-sence add the length of any absence are independent of the parametersof the temporary disability plan. This assumption may not hold. An in-surance type of temporary disability plan which pays some proportion ofthe wage for as long as 26 weeks may be most attractive to an individualwhose subjective probability of an absence of long duration is higherthan average while a temporary disability plan which provides for fewerdays of compensated absence but does not require proof of illness or in-corporate exempt days may be most attractive to an individual whose sub-jective probability of an absence of long duration is lower than averageor who has a low subjective probability of any absence but who placeshigh utility on one day ?vacation" days. Consequently the work force ofany given firm may be non-random with respect to the probability distri.bution of absences of given lengths. A separate possibility is that theprobabilities become functions of the parameters of the temporary disa-bility plan upon employment. As noted earlier a plan which does not al-low accumulation provides an incentive to the employee to take ?vacation"days when he has sick days left he does not expect to need. A plan withan exemption period provides an incentive to the ill employee to extendhis illness through the exemption period to the compensated period.1The remainder of the discussion assumes the probabilities are not func-tions of the parameters of the temporary disability plan.
It is now possible to consider how the maternity leave guidelineaffects E(w). In equation (1') it is assumed that the temporary disabi-lity plan pays for days of absence due to temporary disability regard-less of the nature of the temporary disability. However, prior to thematernity leave guideline most temporary disability plans distinguishedbetween a temporary disability caused by childbirth and any other tempo-rary disability, paying compensation for all temporary disabilities ex-cept for those associated with childbirth. Equation (1') can be modifiedto incorporate this distinction as follows:
y - E(a) - E(C) E(01) + E(0,) E(a) + E(C)E(w') = + F) ( ) + ( S + W) ( ) (8)
y E(a) + E(C)
where:
E(a) = expectation of the number of days of absence due to all tem-porary disabilities except childbirth
E(C) = expectation of the number of days of absence due to childbirth
1This has been noted by actuaries in preparing continuation tables.See Morton D. Miller, "Group Weekly Indemnity Continuation Table Study,"Transactions, Society of Actuaries 3, 1951, pp 31-67.

E(0I) = expectation of compensated days paid for all absences due
to temporary disability except childbirth
E(e ) = expectation of compensated days paid for all absences dueto childbirth
All other variables defined as before
If the temporary disability plan does not pay compensation for absencesdue to childbirth, E(0 ) = 0, although E(C) # 0 since females may getpregnant, whether or ngt compensation is paid. By requiring the tempo-rary disability plan to pay compensation for absences due to childbirth,and assuming E(C) is unaffected by the policy for treating maternityleave, we increase E(w) for females by CE(0p))S. The increase in the to-tal wage bill for one year for an emrloyeeis NF(E(1)))S where NF is thenumber of female employees.
Once again, this specification is specifically for a temporary dis-ability plan where a specified total number of days of absence are com-pensated, all days of absence up to the total are compensated regardlessof the length of any single absence, proof of temporary disability is re-quired, and the maximum number of days are granted at the beginning ofthe period with unused days cancelled at the end of the period. Allowingaccumulation has the effect, noted earlier of increasing B over time,thereby increasing E(On) and thus the total wage bill over time. If proofof temporary disability is not required and no accumulation is allowed,those days not used for pregnancy or illness will be taken as "vacation"days and no increase in the total wage bill will occur. If accumulationis allowed the compensated days actually taken now lie between E(OT) +E(8 ,)and B while before maternity leave was allowed as a temporary disaSilityvthe compensated days taken fell between E(0 ) and B. However, it is notpossible to determine whether there is an increase in number of days takensince that depends on the female worker's risk position. The length of anabsence due to childbirth is almost certainly longer than any exempt periodin a temporary disability plan. Further, it is very unlikely that twopregnancy leaves for any given individual could occur in a single year.Considering these two pieces of information, NF(E(E0)S remains a good esti-mate for the increase in the total wage bill, evenvunder a temporary disabi-lity plan with an exemption petiod.
Finally, the insurance type of temporary disability policy will paycompensation for all days of a maternity leave up to the specific maximumnumber of days per incident with the possible exclusion of the first fewexempt days. Prior to the ruling it would not pay for any days of a ma-ternity leave. Thus the increase in the total wage bill under the ruling is:
NFE(C)S -(NF CE / E(C) }S (9)
-12-

where:
yE(C) =E iq. , i = L for y > L
= the expected length of compensated absence due to childbirthignoring the exemption period
CE/E(C)=Ei.(11 =exempt days under the plan, given an absencei=0
S = daily compensation paid
NF = number of female workers
qi = probability of maternity leave of i days
L = maximum number of compensated days per incident which becomes,after substitution
L yNFS( E iqi + L E
qi) (9')i=e i=L41
The difference in cost between this insurance type policy and the one dis-cussed above is,'of course, that the insurance scheme guaranteed paymentfor the full maternity leave up to the maximum number of allowed days perincident while the other plan will pay only for available days in excessof those taken for other illnesses. Consequently, the expected cost in theinsurance plan exceeds that of the plan allowing a specified total numberof compensated days. Thus using Nv(E(00)S or (9') above, depending on thetype of temporary disability policy, ana summing over employers, the totalinitial cost of treating maternity leave as temporary disability may beestimated.
Again, as with the probabilities of absences, the probability of preg-nancy or of a length of absence associated with pregnancy may be a functionof the treatment of maternity leave. Specifically, where providing a leaveof absence longer than the medical disability period for child bearing in-volves a cost in foregone income, that cost becomes an entry in the calcu-lation of the cost of a child. When maternity leave is treated as a tem-porary disability, including compensation according to the temporary disa-bility scheme, the loss in income is less, thus reducing the cost of thechild, and perhaps increasing the probability of pregnancy. On the otherhand, if the length of the maternity leave when treated as a temporary dis-ability is limited to the medical disability period, the length of the absencefrom work may be shortened. Because the decrease in the cost of a child dueto a smaller foregone income during actual child bearing is small relative tothe total cost of the child, the induced increase in the probability of preg-nancy is assumed to be zero. The lengths of absttnce used hereafter are as-sumed to be the actual length of the medical disability period.
-13-
24

2.2 Economic Behavior in Response to Increase in Labor Cost
The above formulation is simply a technical specification of the laborcost function requiring no assumptions about the behavior of the firm, thestructure of the industry, or the supply of labor. Although it can, andwill, be used to estimate the initial cost of maternity leave to the firm,it does not carry any behaviorial implications. To examine adjustment pos-sibilities it is necessary to postulate firm behavior with respect to fringebenefits.
In the classic theory of the firm a cost-minimizing firm will set theratio of the marginal value product to factor cost equal across all factors.If an increase in factor cost is imposed on a firm in equilibrium we expectto see adjustment on the part of the firm. In the case of an imposed in-crease in the cost of one of the fringe benefits, a component in the totalcost of labor, adjustment may include a decrease in one of the other compo-nents of total labor cost, a decrease in employment of the affected factorwith an increase in employment of close substitutes or an increase in out-put prices. These adjustments all depend on the elasticity of demand forthe affected factor which in turn depends on the elasticity of demand foroutput, the importance of the affected factor in production, the availabi-lity of close substitutes for the affected factor, and the elasticity ofsupply of other factors of production. These factors determine whether andto what extent adjustment can occur. The remainder of this discussion willbe concerned exclusively with adjustment in money wages and fringe benefitsand charges in the composition of the employed labor force.
If the firm adjusts by maintaining a constant total labor cost we willsee either a wage effect or a substitution effect or a combination of these.If we assume the firm is minimizing the cost of provision of fringe benefits,ruling out the possibility of a firm reducing total labor cost by economizingon administrative costs of providing the same total compensation package, thesubstitution effect is seen through the substitution of the higher cost bene-fit for reductions in the provision of one other or several other benefits.The wage effect is the reduction of wages to offset the higher cost benefit.If adjustment occurs through the wage effect and substitution effect theclassic theory makes no predictions about the particular reduction in the wage-fiinge benefit mix. According to the theory it is a matter of indifferenceon the part of the firm and reduction is equally likely in any component oftotal labor cost. There is reason to believe, however, that the firm may notbe indifferent to the components of total labor cost that will be reduced. Infact, employers may be quite concerned both about the particular fringe bene-fits offered and about the mix of fringe benefits and wages that makes up thetotal compensation package.
-14-
25

Becker2 has suggested that employers who experience costs for invest-ment in specific training for employees will find it to their advantage topay some of the enhanced productivity in deferred income. Such paymentswould decrease turnover by increasing benefits as tenure increases, allow-ing the employer time to recoup investment costs. If employers behave inthis way then given a total labor cost employers would prefer to providesome fringe benefits, and, particular, those fringe benefits would bedesigned to encourage continued employment. They would embody waiting per-iods, as with insurance plans for which the employee becomes eligible onlyafter six months or a year of employment, or increase as length of employ-ment increased, as with increases in amount of vacation earned, or be col-lectible only after long service, as with pensions which are not vested orwhere vesting occurs only after a number of years of employment. Employerswho have designed such fringe benefits may prefer to adjust to an increasein the cost of a fringe benefit by lowering wages or by reducing fringebenefits which are collectible early in an employee's career rather thanredr2e benefits specifically designed to reduce turnover. Thus, we mightexpect to see these employers reduce the amount of vacation available afterone ye, of service, but not reduce the amount of vacation available afterten yeas of service or we might expect health insurance decreased butthe pension plan to remain unaffected.
Maternity leave when treated as a temporary disability may itselfcarry some desirable aspects as a fringe benefit which reduces turnover.When maternity leave is treated as a temporary disability the fecund fe-male employee is assured that she will have some continuity in her joband income if she should become pregnant. If maternity leave were treat-ed as a leave of absence, or if pregnant employees were fired, a pregnantemployee may not be assured of the same job upon return from the leave,and she may experience a loss of income for some arbitrarily long period.If maternity leave treated as a temporary disability reduces turnover offecund females, the reduction in turnover cost may partially offset theincrease in cost in the temporary disability plan. It is even possiblethat an employer will prefer to have maternity leave as a temporary dis-ability in his benefit package if fecund females are an important partof his labor force and it is important to him to reduce turnover of theseemployees.
A firm may be successful in adjustment through wage and substitutioneffects which maintain a constant total labor cost if labor is supplie4with respect to total labor cost and if labor is indifferent to the mixof various components of total labor cost. If this is true an increasein cost of one component offset by a decrease in cost of other componentswould have no effect on labor supply since total compensation would ex-actly correspond to total labor cost and would remain constant. Laborsupply may not be invariant to the composition of total labor cost, however.
2Gary S. Becker, Human Capital (New Yorki; Columbia University Press,
1964) pp. 8-29.

Mabry3 has postulated a theory of fringe benefit-wage composition whichtakes this into account. He suggests that in a would of imperfect infor-mation employees find it more difficult to evaluate fringe benefit pack-ages than to evaluate wage offers. Fringe benefit packages may carrycomplex options and requirements which are difficult to understand untilthey have been used and there is uncertainty in the evaluation of theextent to which they will be collected. Wage offers, on the other hand,are straight-forward and carry less uncertainty as to Their collection.Prospective employees have the most difficulty in evaluating fringe bene-fit packages but since information about the fringe benefit package in-creases with the employment period employees who have worked for a firmfor some time can evaluate the fringe benefit package more accurately.In this world the ratio of the expected value of the fringe benefit pack-age to the actual value of the fringe benefit package would be less thanthe ratio of the expected value of the wage offer to the actual wage. Thedifferential would be largest for prospective employees and decrease withemployment tenure. The employer who is interested in attracting laborwould prefer to offer a total compensation package more heavily weightedin favor of wages since the prospective employee would evaluate such atotal compensation offer in a way which more closely coincided with thetrue value of total compensation. The employer would still offer somefringe benefits which induce lower turnover.
Mabry, who is interested in explaining unions' role in the growthof fringe benefits over time and in the higher level of fringe benefitsamong unionized firms, introduces unions as an offsetting force. Sinceunions are interested in maintaining membership at as high a level aspossible and in minimizing competition for jobs from non-union membersand since current employees are better able to evaluate fringe benefitpackages it is in the union's interest to demand a total compensationpackage more heavily weighted in favor of fringe benefits. This wouldreduce the attractivei,ess of the total compensation package to prospec-tive employees without changing the evaluation by current employees.The opposing forces set up by the union's demand for high fringe benefitsand the employer's preference for wages results in a total compensationpackage containing more fringe benefits than the employer might prefer,although fewer fringe benefits than the union might demand.
Even without the introduction of unions this model carries some impli-cations for the fringe benefit-wage composition of total compensation.An expanding firm, aware that wages are more easily evaluated by prosspective employees, might be expected to offer a total compensationpackage with fewer fringe benefits than a contracting firm or a firm
3Bevars Mabry, "The Economics of Fringe Benefits," Ind. Relat. 12:1
February, 1973, pp. 95-96.
-16-
2,7

with a stable labor force, whose major interest is in maintaining itscurrent labor force. In addition, expanding firms may be more likelyto offer fringe benefit packages that are straight-forward in theirprovisions and therefore more easily evaluated. For example, thesefirms might offer vacation or the simplest sick leave plans. Contract-ing firms or firms with a stable labor force would include the more ela-borate fringe benefits in their package. For example, we might expectto see a variety of options in their pension plans, or they may offerlong-term disability insurance.
Since firms are not expected to offer total compensation packageswith identical components the possibilities for adjustment to an increas-ed cost in the temporary disability plan through the wage and substitutioneffect varies across firms. Firms with a high proportion of total compen-sation in wages may be expected to respond by lowering wages more frequent-ly than firms with a high proportion of total compensation in fringe bene-fits, who have a greater opportunity to lower the fringe benefit package.In general, it is not possible to predict which component of total compen-sation will be adjusted and we do not expect adjustment to occur identi-cally in all firms. It remains true that firms with high wages and mater-nity leave treated as a temporary disability ought to have lower fringebenefits packages than firms with high wages but maternity leave not treat-ed as a temporary disability. Similarly firms with low wages and materni-ty leave treated as a temporary disability ought to have lower fringe bene-fit packages than firms with low wages but maternity leave not treated asa temporary disability. Conversely firms with a given fringe benefit pack-age and maternity leave treated as a temporary disability ought to havelower wages than firms with the same fringe benefit package but maternityleave not treated as a temporary disability.
Since the increased cost in the temporary disability plan due to treat-ing maternity leave as a temporary disability is attributable to an increasein the collection of a fringe benefit, namely sick leave, by one group ofemployees, women who become pregnant, the employer may attempt to adjust thetotal compensation package for that group of employees only. In general theemployer cannot identify the actual individual employees who will becomepregnant, but he can define the group of employees who have some non-zeroprobability of becoming pregnant, using age as an indicator of the probabilityof pregnancy. Using this definition the employer may attempt to adjust thetotal compensation package for fecund females. This is the efficient behavior.However, as a practical matter the equal pay provisions of the Fair EmploymentPractices Act precludes this firm behavior if such behavior results in diffe-rent levels of wages and fringe benefits for arbitrarily defined groups ofemployees in any wage and occupation category. This institutional constraintimplies that the firm may not reduce wages or fringe benefits to fecund fe-males only. As a result if adjustment through the wage and substitution ef-fect occur, it will occur with respect to all emplpyees in the wage and oc-cupation category without regard to age or sex.
-17-
28

In addition to variation in labor supp]y which results from lack ofinformation in evaluating fringe benefit packagesy variation in laborsupply can arise if various groups of labor evaluate the probability ofcollection of fringe benefits differently. Maternity leave is a fringebenefit for which the probability of collection is non-zero for only avery specific and well-defined group, i.e., fecund females. Even if em-ployees have full information and can correctly evaluate fringe benefitpackages, the value of maternity leave will be zero to all males and tofemales not subject to the risk of pregnancy. Only females who are sub-ject to the risk of pregnancy will evaluate maternity leave treated as atemporary disability as a non-zero component of total compensation. Thisimplies that to the male and non-fecund female a firm that offers mater-nity leave as a temporary disability in its total compensation packagewould appear to offer a lower total compensation package than the firmthat offers a total compensation package of equal cost but without ma-Zernity leave treated as a temporary disabilityalthough fecund femaleswill be indifferent between a total compensation offer including mater-nity leave treated as a temporary disability and an offer of equal valuebut excluding maternity leave treated as a temporary disability. Theindifference of fecund females to the two offers depends on the coinci-dence of their subjective probability of pregnancy, which they use inevaluating the total compensation package, and the average probabilityof pregnancy, used by firms to evaluate the total compensation package.If these two probabilities diverge, as they very well might, fecund
females will prefer the package with maternity leave if they are morelikely than average to become pregnant but they will prefer the pack-age without maternity leave if they are less likely than average to-be-come pregnant. In the absence of counteracting behavior on the part ofthe firm we would expect to see firms which offer maternity leave as atemporary disability as part of their total compensation package attracta labor force which has a higher proportion of females in the child-bearing ages than firms which offer a total compensation package withthe same value but without maternity leave treated as a temporary dis-ability.
Of course neither the firm nor labor response operates in the ab:-sence of the other. Any examination of the age-sex composition of theemployed labor force must take into account the operation of both forces.If the age-sex composition of a firm with maternity leave treated as atemporary disability is weighted in favor of young females, ceteris paribus,then the labor supply effect exceeds the labor demand effect. If it isweighted in favor of males and non - fecund females then the labor demandeffect exceeds the labor supply effect. If the age-sex composition inthe firm with maternity leave treated as a temporary disability is simi-lar to that of the firm without maternity leave treated as a temporarydisability, the two effects offset each other.
-18-
29

This discussion has proviC,d two hypotheses about firm behavior whenmaterna, leave is treated as a temporary disability. The first deals withthe wage effect. Given the fringe benefit package firms offering maternityleave treated as a temporary disability ought to have lower wages than firmsnot treating maternity leave as a temporary disability. The second suggestsa substitution effect. Given wages firms offering maternity leave treatedas a temporary disability ought to have smaller fringe benefit packages thanfirms not treating maternity leave as a temporary disability. In addition,firms and labor may respond to maternity leave treated as a temporary dis-ability in a way that alters the age and sex composition of the labor force.Because the effect on the age and sex composition depends on the relativesize of the individual effects of the firm behavior and labor supply behav-ior it is not 'possible to predict the net effect on the age and sex composi-tion. The net effect can be examined in a descriptive way, however.
It is important to emphasize that the discussion above and the analysisto follow only deals with two sorts Jf partial firm adjustment. As notedearlier firm adjustment can also occur through output price changes. It isnot appropriate to assume that if adjustment is not seen in total compensa-tion or in labor demand with respect to age or sex adjustment does not occur.Rather, adjustment may be taking place in ways that do not effect either to-tal composition or labor demand with respect to age and sex. This qualifica-tion should be kept in mind throughout the analysis.
A brief caveat is appropriate here in order to set the above discussionin the context of other work done in the area of fringe benefits. This dis-cussion has dealt exclusively with the static microeconomic behavior of thefirm. luch of the limited discussion of fringe benefits in economic litera-ture has dealt with the growth of fringe benefits over time and the positivecorrelation between fringe benefits and wages across industries. Rice4 hasargued that preferential income tax treatment, economies of scale in benefitpurchase, turnover costs and unionization have all lead to increased willing-ness to supply fringe benefits by firms as wages rise. Bailey and Schwenk5
have documented the positive correlation between wages and fringe benefitsacross industries in the United States. This positive correlation does not
detract from the above discussion or hypotheses. There is nothing suggested
above which precludes the possibility that as total compensation increases,a larger proportion of total compensation will be in the form of fringe bene-
A-Robert G. Rice, "Skill Earnings, and the Growth of Wage Supplements,"
American Economic Review 56:2, May 1966, pp. 583-593.
5William R. Bailey and Albert E. Schwenk, "Employer Expenditures forPrivate Retirement and Insurance Plans," Monthly Review, 95:7, July 1972,
pp. 17-19.
-19-

fits. The discussion provides some hypothesis about fringe benefit-wagebehavior within an industry at a given time.
This discussion has provided the full labor cost function which canbe used to estimate the initial cost of maternity leave in Wisconsin aswell as some hypotheses about firm behavior with respect to maternity leave.With these set out it is now appropriate to turn to an empirical estimationof the full labor cost function, and an empirical test of the wage and sub-stitution effects and an empirical descriptive examination of the age andsex composition within an industry.

CHAPTER THREE
The Data
Since the quality of the empirical analysis rests heavily on the dataand since at the beginning of this study there was little data availablethat was suitable for use in estimating the cost of maternity leave treatedas a temporary disability or for testing the hypotheses noted above, it isappropriate at this point to discuss the data collected in some detail.Much of the data used here was collected by survey. The survey data can bedivided into two categories. First, there is a set of data pertaining toemployers in Wisconsin which together with a somewhat more detailed set ofdata for school districts in Wisconsin will be used to estimate the cost ofmaternity leave for the entire state. Second, there is a set of data per-taining to hospitals in Wisconsin which can be used to make an accurate es-timate of the cost of maternity leave for hospitals and can be used to testthe hypotheses of wage and substitution effects and for examination of theage and sex characteristics of the employed labor force in hospitals. Eachof these data sets will be discussed separately and in detail below.
3.1 The Employer And School District Data
To make the estimate of the cost of maternity leave treated as a tem-porary disability using the full labor cost function developed above it wasnecessary to know the number of female employees by age in the state, theage-specific probability of pregnancy among employed females, the wage ratesfor female employees in the state, and the fringe benefit packages offeredby employers. The first three items are available either in publishedsources or the appropriate variables can be created from data available inpublished sources. These will be discussed_ below along with other supple-mentary data. Data describing the fringe benefit packages offered bi7 em-ployers is not readily available, however. It was necessary to conduct asurvey of a sample of employers in Wisconsin to collect the required dataconcerning the prevalence of various fringe benefits, the details of tem-porary disability policies, and the treatment of maternity leave. The sur-vey, shown in Appendix A, contains questions designed to determine the maxi-mum number of compensated days granted per year under the temporary disabi-lity plan, the percent of salary paid per compensated day, the number ofdays of accumulated sick leave allowcd, the extent to which absences due to
32

pregnancy or childbirth have been covered, whether or not proof of illnessis required, a description of the leave of absence policy, and the extentto which life insurance, health insurance, and pension plans exist and aremaintained during a temporary disability or a leave of absence. Ideallythe survey would have determined premium payments or funding costs for thevariety of fringe benefits. However, in the interest of brevity and toencourage a maximum response this information was not ascertained.
The survey was administered by mail questionaire to two random samplesof employers. The two random samples, one a sample of two hundred employersand the other a sample of one hundred employers, were stratified on the basisof Standard Industrial Classification Code and employment. From employmentinformation from the 1970 Census, percentage of total employment and percent-age of female employment in each pf the sixteen major industry categorieswere calculated. Mining and entertainment were discarded because of theirsmall size, less than 1% of total employment. Agriculture was discarded be-cause of the difficulty of identifying employers and because the nature ofthe industry makes stated temporary disability policies unlikely. Construc-tion was discarded because of the small number of women employed. Finally,transportation, communications, utilities, professional and related, at.public administration were discarded because data collected in the hospitalsurvey, school district survey, and from the State of Wisconsin's Departmentof Industry, Labor, and Human Relations covers these industries. After theseexclusions there are seven groups: durable manufacturers; non-durable manu-facturers; wholesale trades; retail trades; and personal services except house-holds. These Census categories were then matched with the appropriate SICcodes. Both the 100 and 200 samples were stratified on this basis. Withinthese SIC codes the 200 sample was stratified on the basis of the percent oftotal employment in each group in firms of employment sizes 0-10, 11-25, 26-50, 51-100, 101-200, 201-500, and 500 and above. The 100 sample was strati-fied on the basis of the percent of firms within each of these employment sizes.For each of the two samples every firm in each employment size group and SICcode had an equal probability of being drawn.
The two sample design was used because temporary disability policies orresponses may vary randomly, with employment size, or with industry type (SICcode). This design is an attempt to provide one sample, the 200 sample, whichdraws most heavily from larger firms and one sample, the 100 sample, which drawsmost heavily from smaller firms. Tables 3.1 and 3.2 show the number of firmsdrawn from each industry and site category for the two samples. Out of thetotal of 300 firms surveyed only 125 responded, a response rate of 41.7%.
Although this is a low response rate, it is not surprising for severalreasons. One is that several regional associations in Wisconsin have explain-ed to me that they urge members who solicit their advice not to cooperate withsuch surveys on the grounds that responding to questionaires is time consuming,
-22-
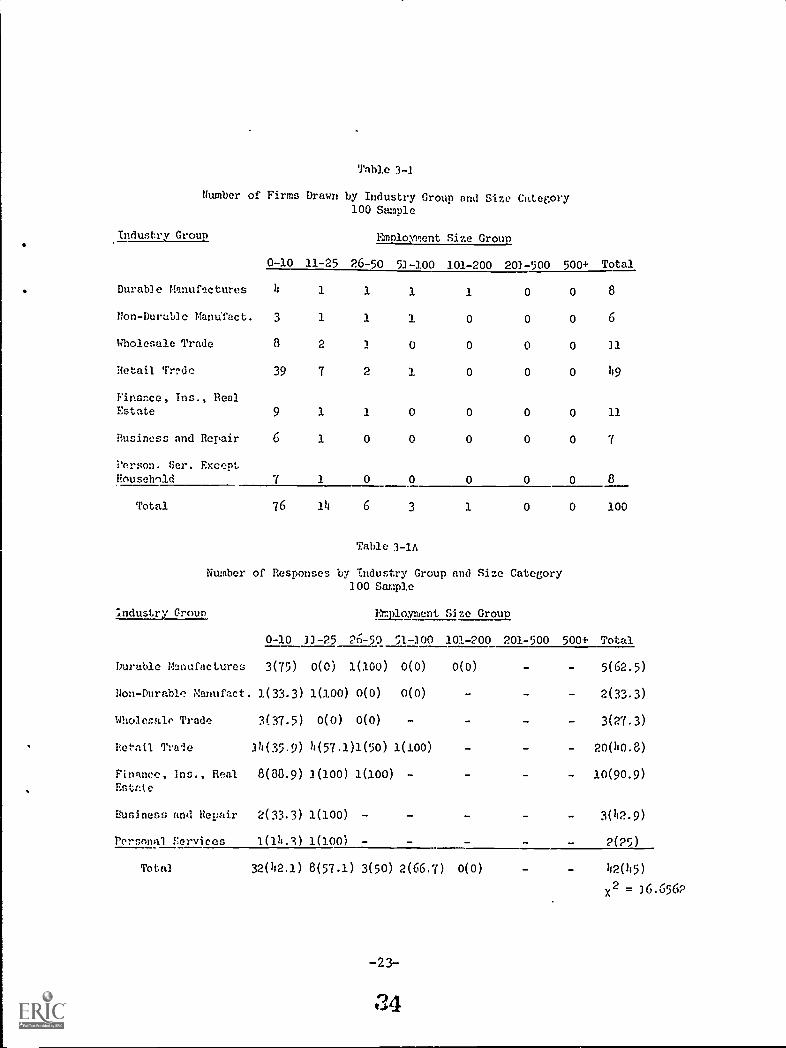
Table 3-1
Number of Firms Drawn by Industry Group and Size Category100 Sample
Industry Group Employment Size Group
0-10 11-25 26-50 51-100 101-200 201-500 500+ Total
Durable Manufactures 4 1 1 1 1 0 0 8
Non-Durable ManuTact. 3 1 1 0 0 0 6
Wholesale Trade 8 2 1 0 0 0 0 11
Retail Tr?de 39 7 2 3. 0 0 0 49
Finance, Ins., RealEstate 9 1 1 0 0 0 0 11
Business and Repair 6 1 0 0 0 0 0 7
Person. Ser. ExceptHousehnld 7 1 0 0 0 0 0 8
Total 76 lh 6 3 1 0 0 100
Table 3-1A
Number of Responses by Industry Group and Size Category100 Sample
Industry Group J.huloyment Size Group
0-10 33-25 2650 51-100 101-200 201-500 500+ Total
Durable Manufactures 3(75) 0(0) 1(100) 0(0) 0(0)
Non-Durable Manufact. 1(33.3) 1(100) 0(0) 0(0)
14holesale Trade 3(37.5) 0(0) 0(0) -
Retail Trade 34(35.9) 11(57.1)1(50) 1(100)
Finance, Ins., Real 8(88.9) 1(100) 1(100) -
Estate
Business and Repair 2(33.3) 1(100) -
Personal Services 1(14.%) 1(100) -
5(62.5)
2(33.3)
3(27.3)
- 20(40.8)
- 10(90.9)
3(112.9)
2(25)
Total 32(112.1) 8(57.1) 3(50) 2(66.7) 0(0)
-23-
34
h2(h5)
x2 = 3( rro- ).y)

Table 3-2
NemLer of Fitrls Drawn by Industry Group and Size Category200 Sample
Inc:ust,..ry Group
0-10 11-25
mpkgment Size Group
500+ Total26-50 51-100 101-200 201-500
Durable Manufactures 2 2 3 4 4 8 45 68
Non-Durable Manufact. 1 2 2 3 4 7 17 36
wholesale Trade 2 2 2 2 2 1 ... 1 12
Retail Trade 13 11 8 5 3 3 13 56
Finallee, insurance,
Reel Estate 2 2 1 2 1 1 3 12
IhrUness and repair
lersola.1 Servicespxcent Household
2
3
1
1
1
1
1
1
1
1
1
1
1
(1)
8
8 (0)
Total 25 21 18 18 16 22 80(81) 200 (201)
Table 3-2A
Number of Respanqcs by Industry Group and Size Category200 Sample
Industry Group Employment Size Group
0-10 11-25 26-50 51-100 101-200 201-500 5001 Total
Durable Manufactures 0(0) 1(50) 3(100) 1(25) 1(25) 3(37.5) 19(42.2) 28(41.2)
(Ion-Durable
Manufactures 0(0) 1 (50) 2(100) 3(100) 1(25) 4(57.1) 7(41.2) 18(50)
Wholesale Trade 1 (50) 1 (50) 1 (50) 0(0) 1(50) 0(0) 1(100) 5(41.2)
Pelail Trade 6(46.2) 2(18.2) 1(12.5) 4(80) 1(33.3) 1(33.3) 3(25.1) 18(32.1)
Finance, insuranceReal Estate 3(50) 1(50) 0(0) 2(100) 1(100) 1(100) 1(33.3) 7(58.3)
Business Repair 1(50) 1(100) 0(0) 0(0) 0(0) 0(0) 0(0) 2(25)
Personal ServicesExcept Household 1(33.3) 0(0) 1(100) 0(0) 0(0) 0(0) [1(100)] 2(25)[2(33.3)?
Total 10(40) 7(33.3) 8(44.4) 10(55.6) 5(31.3) 9(52.3) 31(38.8) 80(40)
(32(40)3 (81(40.5)3
x2 = 29.9717
-24-

provides too much information to "outsiders", and provides no direct bene-fits to the firms responding. A second reason is that the survey itselfwas clearly associated with the Equal Rights Dividion of the Wisconsin De-partment of Industry, Labor, and Human Relations which is the enforcingagency for the state guideline on maternity leave. There may be some nes-itancy about providing information which could be in violation of inter,pretations of the law. Although the response was low, it seems not tovary consistently by SIC or employment size.
Since the estimate of the cost is to be made for all employers in thestate it is necessary to provide estimates of temporary disability policiesand other fringe benefits among employers not covered by the survey, i.e.,mining, entertainment, agriculture, construction, transportation, untilities,professional and related, and public administration. Since mot*_ of theseare industries with a small employment relative to total employment and witha low proportion of female employment, a proportionate cost will be attri-buted to them. This is discussed in some detail in a later chapter. Theprofessional and related category contains the education industry and thehealth care industry which together employ approximately 28 % of allemployed females in WisconsIn. In addition nearly 80% of the health careindustry and nearly 60% of the education industry are women. Because womenare an important part of the labor force in the industries it was deemedimportant to collect more detailed data for hem. The hospital data is dis-cussed below. In order to capture mpst of the education industry, approxi-mately 75%, a survey of all school districts in Wisconsin was conducted.The Wisconsin Education Association has published data on salary schedulesby school district as well as mean and median salaries by school districtand grade level and fringe benefit offerings, including life and healthinsurance, temporary disability policies, long term disability policies,and pension plans, by school district. This data is available for 342 ofthe 440 Wisconsin public school districts. The Wisconsin Department ofPublic Instruction has data available on experience, age, and sex distribu-tions of school teachers by school district and grade level for all 440school districts. These two sources of data provide a quite complete dataset for school districts from the outset. The only important piece of datathat was missing is the maternity leave policies of school districts. TheWisconsin Association of School Boards agreed to endorse a survey conductedof all school districts to obtain data on specific maternity leave policies.The survey, shown in Appendix A, was done by mail questionaire of all 440school districts. There are 348, 80% responses to the survey.
Although this response rate is excellent there is reason to believethat the quality of the responses is less than might be desifed. Schooldistricts have been made painfully aware of the existence and provisions ofthe maternity leave guideline through a series of complaints brought againstseveral school districts in the past year. They are also aware of the roleof the Department of Industry, Labor, and Human Relations in enforcement of
-25-

the guideline. Although the Wisconsin Association of School Boards agreedto endorse the survey, they preferred not to provide a cover letter or re-ceive the returned surveys. As a consequence the cover letter for thesurvey clearly associates the survey with the enforcement agency for theguideline on maternity leave. There is the potential incentive for schooldistricts to provide responses indicating compliance with the guideline re-gardless of the actual specifics of the maternity leve policy. This in-centive would operate if school districts believed ziata would be potential-ly available 'or compliance work. Although it is impossible to say the ex-tent to which this problem biases the data, it undoubtedly operates tosome extent. Over 75% of the school districts indicate maternity leavepolicies which do not require a leave of absence for pregnancy. This mayin fact be the case but if it is this industry differs from other industriesin Wisconsin. Only 31% of employers responding to the survey of employersand 35% of hospitals responding to the hospital survey discussed below re-
ported maternity leave policies substantially similar to their temporarydisability policies. Further adding to the suspicion that school districtsmay have misreported their maternity leave policies are the written commentson a number of the returned surveys suggesting that "our policies conformto the new DILHR guidelines". This reservation about the quality of thedata obtained by survey from school districts ought to be kept in mind whenevaluating the estimate of cost for school districts.
In addition to the professional and related category the public admini-stration category deserves special attention. About 1/3 of the employeesin this category are females. Since most of the employees in this categoryare federal and state employees fringe benefit information for federal andstate employees, which is readily available from the federal and state CivilService Commissions, will be used for this category.
3.2 The Hospital Data
The hospital data which is used deserves special attention since it isused not only as an element in the cost estimate for the entire state, butalso as the data base used for testing the behavioral hypotheses describedin an earlier chapter. The hospital industry was chosen as the industry tobe used for examination of the behavioral hypotheses for several reasons.The Wisconsin Hospital Association was quite interested in the study and waswilling to provide some data they had collected and to assist in collectionof data not already in existence. This cooperation allowed easy identifica-tion and location of hospitals and assured me of at least some success indata collection. In addition, existing data suggested that hospitals have awide range of fringe benefits and particularly temporary disability policieswhich have been in force for some time. This includes some hospitals with
-26-

maternity leave policies which conform precisely to the temporary disabi-lity policies, as required by the guideline, as well as some hospitals withmaternity leave policies which differ substantially from the temporary dis-ability policies. Because most of these policies have been in force forsome time, and are not simply a response to the recent guideline, hospitalshave had time to adjust wages and fringe benefit packages, and the age andsex composition to a position of equilibrium. Finally, 80% of employees ofhospitals are women. Insofar as there is a cost associated with maternityleave, it is likely not to be trivial to hospitals.
Although some hospital data had been collected by the Wisconsin Hos-pital Association, it was fragmentary and contained some technical problemswhich preluded its use. Consequently most of the hospital data was collect-ed by survey. The survey was done of all hospitals in Wisconsin whose pri-mary function is not geriatric or psychiatric care. Geriatric and psychia-tric hospitals were excluded because of the somewhat different labor forcecomposition found in these hospitals, including more social workers and psy-chiatric aids and fewer degreed registered nurses. The definition used hasthe effect of excluding most public hospitals, which are largely psychiatricor geriatric in nature. There are 189 hospitals fitting this definition inthe state.1 Of these 189 hospitals 164 belong to the Wisconsin HospitalAssociation (WHA). WHA agreed to cooperate fully with the study, includingproviding a cover letter urging individual hospital cooperation in the sur-vey, receiving returned surveys, and providing certain existing data. Asnoted below, this excellent cooperation is largely responsible for a rea-sonable complete and accurate data set for hospitals.
In March 1973 WHA, in cooperation with the Wisconsin Society of Hos-pital Personnel Administrators (WSHPA), conducted a fringe benefit surveyof member hospitals. The survey is very complete, covering all phases offringe benefit offerings. Although WHA was anxious to provide as much dataas possible, WSHPA was reluctant to provide the full survey. WHA and WSHPAdid agree to provide a large part of the survey which was relevant to ma-ternity leave, however. There were 115 hospitals responding to this survey.These survey forms were coded and returned to WSHPA. The questions fromthis survey were reproduced exactly and hospitals not responding to the WHA-WSHPA survey were re-surveyed in August 1973.
1
This number is the number of hospitals recorded in American HospitalAssociation, Hospital Statistics, 1971, Chicago, 1972. The hospital indus-try is somewhat fluid with new hospitals entering and old hospitals goingout of business. This number may be slightly larger or smaller at the pre-sent time.
-27-

In addition to this fringe benefit data certain other data is essen-tial to the estimation of the cost of maternity leave and testing the hypo-theses stated earlier, including wage data, age and sex composition of theemployed labor force, and certain specific data on maternity leave policies.An extensive survey was designed, to be administered by mail questionaire,to collect this data. The survey included two sections, in addition to thefringe benefit section described above. The first section was a maternityleave section containing questions concerning age and sex composition of thehospital's employees, details of the maternity leave policy, and the use ofthe maternity leave policy over the past two years. The second section wasa wage survey requesting base, maximum and average monthly wage rates foreighteen occupation categories. This wage section, modeled after a similarsurvey conducted annually by WHA and WSHPA, does not collect wage rates forall possible occupations, but it does provide wages for the major categoriesexisting in these hospitals. WHA participated in the survey to the extentof approving the survey questions, writing a cover letter urging participa-tion in the survey, receiving returned survey forms, and providing mailinglabels. There are 84 hospitals who responded completely to the three sec-tions, maternity leave, wage, and fringe benefit sections, of the survey,although on any individual question a particular hospital may have providedno response. All three sections of the survey are shown in Appendix A.
After the mailed survey forms were returned in September 1973 an effortwas made to increase the response rate by contacting non-respondent hospi-tals by telephone. All non-responding hospitals were contacted and an addi-tional 79 hospitals responded to the telephone survey. The telephone sur-vey was essentially an abbreviated version of the mailed survey. Major dif-ferences include requesting wage data on three gross occupation categoriesrather than the eighteen specific categories collected in the mailed survey,and collecting the employee age distribution for only three age groups ratherthan the five age groups collected on the mailed survey. These differencesrequire that the hospital data be treated as two data sets defined on themethod of response in the analysis that follows. Much of the analysis willbe done on both data sets, although analyses involving age composition willonly be performed on the data obtained by mail survey. Hereafter the hospi-tal, data collected by mailed survey will be known as the primary data set andthe hospital data collected by telephone survey will be known as the second-ary data set.
The hospital data seems to he quite accurate. Number of hospital beds,which is collected in the survey is also reported by the American HospitalAssociation for 1970. 2
The two figures are within 10 beds of each other inevery case. Discussions with MIA officials and hospital administrators in-
2American Hospital Association, Hospital Statistics, 1971, Chicago, 1972.
-28-
:39

dicate that the values obtained in the surveys are reasonable. Missingdata in the primary data set is minimal. Appendix B shows a summary ofthe hospital data. Most of the missing wage data is the result of hos-pitals not maintaining a full time staff person in some of the occupa-tion categories. I initially had some fears that hospitals would altertheir reported maternity leave policies to be consistent with the guide-line. However, this appears not to have happened, prob,.bly because ofthe nature of the cover letter and because it came from WHA.
3.3 Supplementary Data
In addition to the data collected by survey a certain amount ofsupplementary data is necessary for the estimate of the cost of mater-nity leave treated as a temporary disability. The age and sex distri-bution of employees by SIC code in Wisconsin can be estimated from the1970 Census, the 5% Public Use Sample for Wisconsin. Average wage ratesby SIC code are available from Census data. The use of this data, andits limitations, is discussed below in more detail.
A vital piece of data for making the cost estimate of maternityleave treated as a temporary disability is the age-specific probabilityof pregnancy for employed women. Ideally this probability of pregna;ywould be opecific to Wisconsin and corrected for education. It is im-portant to have the probability of pregnancy for all women. The ferti-lity and female labor force participation are negatively correlated,that women who work have lower fertility rates than women who do notwork.3 There is not, however, a recent calculation of the fertilityrates of employed women. It is necessary to calculate this fertilityrate. The cost estimate requires the fertility rate to be expressedas the probability of pregnancy given employment. This probabilitymay be estimated by the number of births to employed females of age iin a given year divided by the number of working women of age i in thatyear. Although there is no data which allows the calculation of thisprobability directly, there is data for a random sample of women whohad births collected for 1967, 1968, and 1969 by the Bureau of VitalStatistics. This data, the National Natality Survey, had a total sam-ple of 10,500 births and includes information on employment. The con-ditional age and education specific probability of a birth given
3See, for example Stanley Lebergott, "Population Change and theSupply of Labor," in Demographic and Economic Change in Developed Coun-tries. A Conference of Universities, National Bureau of Economic Re-search, Princeton: Princeton University Press, 1960; Clyde V.
-29-
40

employment can be estimated using the following relationship:
p(b/w)
where:
p(w/b)p(b)
p(w)
p(b/w) ... conditional probability of a birth given employment
p(b) ,.. simple probability of a birth
p(w) s simple probability of employment
p(w/b) conditional probability of employment given a birth
The probabilities p(b) and p(w/b) can be estimated from the NationalNatality Survey and DM can be estimated from employment data publish-ed by the Bureau of Labor Statistics. These data allow calculationof the probability of pregnancy given employment by age and educationfor years 1967, 1968, and 1969. Appendix C shows the daid used to makethese calculations. Tables C-9 through 6-11 shows the calculated pro-babilities. Since the National Natality Survey excludes illegitimatebirths, the calculation of the probabilities is corrected for this.
These probabilities are for 1967-1969, while other data used tomake an estimate of the cost of maternity leave are for 1973. Between1968 and 1973 the fertility rate has dropped from 85.7 per 1000 to 71.1per 1000. This had been a secular decline in fertility. It was assum-ed that the effect on fertility of employed women has been affectedproportionally and the probabilities of pregnancy were adjusted accord-ingly. Table 3_3 shows the probabilities of pregnancy adjusted for1973. Since these probabilities are not specific to Wisconsin it willbe assumed that Wisconsin fertility resembles national fertility.
One other piece of data is necessary for making the cost estimate.The cost of maternity leave depends on the expected absence due to ma-ternity leave which is a combination of the probability of pregnancy andthe absence from work due to the medical disability period associatedwith pregnancy. To calculate this expected absence due to maternityleave it is necessary to have a distribution of medical disability per-iods associated with pregnancy or the mean medical disability period as-sociated with pregnancy. Although the National Natality Survey used in
4Bureau of Labor Statistics, "Educational Attainment of Workers,"
Special Labor Force Reports Nos. 92, 103, and 125, U.S. Department ofLabor, 1967, 1968, and 1970.
-30-
41

TABLE 3-3
Probability of Pregnancy Given Employment by Age and Education,Estimated for 1973
Years of Education
.....
Age 0-8 9-10 12 13-15 16-17 Total
20-24 .0897 .1850 .1308 .1359 .0814 .1275
25-34 .0741 .0743 .0555 .1298 .0810 .0836
35-44 .0295 .0154 .0335 .0178 .0218 .0205
45-54 .0003 .0001 .0012 -- .0002
Total
(20-54) .0225 .0470 .0510 .0751 .0575 .0503
Total(20&over) .0117 .0375 .0445 .0649 .0368
These probabilities are calculated by takingaverage of the probabilities for the years 1967,1969, shown in Appendix C, then correcting by forcular decline in fertility. See the text and Appfor a more detailed discussion of the calculator
-31-
42
a sLmple1968 andthe se-
endix C
technique.

calculating the probabilities of pregnancy provides some informationabout the lengths of absences from work because of childbearing, thisdata is suitable for calculating the period of medical disability asso-ciated with pregnancy. The period of absence reported in the surveydoes not correspond to the medical disability period because of the in-fluence of enforced leaves of absence longer than the medical disabilityperiod t' or the availability of such leaves. In fact, there is no e-xisting data which provides a distribution of the medical disabilityperiod associated with childbearing or which allows calculation of themean length of the medical disability period. There are suggestionsthat this meanlength may be in the neighborhood of six weeks in thetestimony at hearings preceeding the adoption of the maternity leaveguideline by both EEOC and OILER. Of course, the medical disabilityperiod may depend on the physical 1 4rements of the job. A longerperiod of absence may be required fo . physical job, while a shorterperiod may be necessary for a sedentce,' job. In the cost estimatesthree possible means are used: four weeks, six weeks, and eight weeks.
a

CHAPTER FOUR
Estil es of the Cost of Treating Maternity Leave
as a Temporary Disability
Using the data described above it is now possible to estimate thecost of treating maternity leave as a temporary disability for the stateof Wisconsin. As noted earlier policies toward maternity leave prior tothe EEOC and DILHR guidelines varied from dismissal of pregnant employeesto requiring a long leave of absence without pay to allowing maternityleave to be taken as a temporary disability including temporary disabili-ty payments. The cost to be estimated here is defined as the static costassuming no change in behavior incurred as a result of the firm's changefrom its existing policy of treating of maternity leave prior to the ma-ternity leave guidelines to a policy of treating maternity leave exactly.ke a temporary disability according to its temporary disability policy.
That is, the cost estimated is the cost attributable to the guidelines onmaternity leave. This definition implies that a firm treating maternityleave as a temporary disability prior to the maternity leave guidelineshas a zero cost imputed to it in the cost estimate. There are.four sep-arate sections to the cost estimate. The first is the estimate of thecost to employers covered by the employer survey. The second is the es-timate of costs to all employers not covered by the employer survey ex-cept the professional and related category. The third section is the es-timate for the education industry and the fourth is the estimate for thehealth care industry. These four estimates are made separately then sum-med to obtain an estimate for the entire state. Each estimate is dis-cussed separately below.
4.1 The Estimate for Employers in Industries Covered by Survey
There were 1,726,814 employed persons 14 years old and over in Wis-consin in 1970. Of these 641,185, or 37.1%, were women. Table 4-1 shows em-ployment by major industry category. These people are employed by 81,703private and public employers. The survey described earlier covers 39,101of these employers in the categories durable goods manufacturing, non-durable goods manufacturing, wholesale trade, retail trade, finance, insur-

Table 4-1
Industry of Experienced Civilian Employed Persons by Sexfor the State of Wisconsin, 1970
Industry
Total
Males
1085629
Females
641185
Total
1726814
% Female
37.1%
Agriculture, Forestry & Fisheries 94995 15101 110096 13.7%Mining 2648 202 2850 7.1%Construction 75506 4568 80074 5.7%Manufacturing 387861 124794- 512655 24.3%
Durable Goods 260249 71966 332215 21.7%Nondurable Goods 125642 51979 177621 29.3%
Transportation, Communicationsand Other Public Utilities 68713 16752 85465 19.6%
Wholesale and Retail Trade 181638 144265 325903 44.3%Wholesale Trade 44790 13056 57846 22.6%Retail Trade 136848 131209 268057 48.9%
Finance, Insurance and Real Estate 29628 32404 62032 52.2%Busines!, and Repair Service 25840 9911 35751 27.7%Personal Services 15292 41443 56735 73.0%Entertainment and Recreation Services 6098 4296 10394 41.3%Professional and Related Services 104118 194211 298329 65.1%
Health Services 22755 88532 111287 79.6%Education.1 Services 57303 85915 143218 60.0%All Other 24060 19764 43824 45.1%
Public Administration 45263 17794 63057 28.2%Industry Not Reported 48029 35444 83473 42.5%
Source, 1970 Census of Population
I

Table 4-2
Number of Firms in Surveyed Industries by Employment Size
Industry Number of Employees10-5
Durable Man-ufactures
6-10 11-25 26-50 51-100 101- 201- 500 & Total200 500 above
1197 409 562 318 242 136 111 119 3094Non-durableManufac. 835 332 407 263 175 133 103 56 2304
WholesaleTrade 2650 688 679 246 103 49 14 6 4435RetailTrade 12009 3133 2521 848 272 94 40 32 18949Finance,Ins.& Real Est. 3241 461 409 125 74 33 18 11 4372Business &Repair Serv. 984 365 246 69 34 23 7 2 2730
Pers. Serv.exceptHousehold 492 376 207 74 46 12 10 - 3217
Total '4408 5764 5031 1943 946 480 303 226 39101
Source: Wisconsin Department of Industry, Labor, and Human Relations
-35--
46

ance, and real estate, business and repair services, and personal servicesexcept household. These seven categories cover 336,647 or 52.5% of fe-male employees and 975,884 or 56.5% of all employment. The first sectionof the estimate of the cost of maternity leave attributable to the guide-line is made for these industry categories. The cost estimate for theseindustries is made using the following equation:
Costi = ami ((min(Di,A)) (wFi(14.Hill+teLiL+=piP+Vi))(Za NFiaCa))
where:
al- = proportiot of firms in industry i not treating maternity leaveas a temporary disability
Di =mean maximum accumulation of compensated sick days
A = assumed number of days necessary for maternity leave
wFi = mean wage for females in industry i
aHi= proportion of firms in industry i offering health insurance
H = mean health insurance premium as a proportion of wages amongall employers
aZi = proportion of firms in industry i offering life insurance
L = mean life insurance premium as a proportion of wages amongall employers
=pi = proportion of firms industry i offering pension plans
P = mean pension contribution as a proportion of wages amongall employers
V- = mean proportion of wages earned as vacation pay in industry i
NFia = number of female employees in industry 4 of age a
Ca probability of pregnancy among employed women of age a
In this equation wFi, the mean wage for female employees in industry i, andthe number of female employees of age a in industry i, are availableNFia
,
for wisconsin from Census data. The wage variable is adjusted, using theBureau of Labor Statistics wage index, to reflect wage increases to 1975.It is assumed that the number of female employees and their age and industrydistribution aid not changed between 1970 and 1973. Ca, the age specific-probability of pregnancy among employed women, is calculated from the National
-36--
47

Natality Survey discussed earlier. It is assumed that employer contri-butions for health insurance, life insurance, pension plans, and vaca-tions are not maintained during a leave of absence but must be maintainedduring when maternity leave is treated as a temporary disability. Thecost of maintaining these benefits, along with the wage cost, make upthe cost of providing the total compensation package and these costs areall considered in the cost estimates. The mean employer contributionsfor health insurance, life insurance, and pension plans, H, L, and P areavailable as a proportion of wages for 1970 from estimates made by WalterW. Kolodrubetz.1 These are adjusted for 1973 using the Consumer PriceIndex for Services. Vi, the mean proportion of wages earned as vacationpay, is available from the Area Wage Surveys of the Bureau of Labor Sta-tistics. Values for =rap
"Iii' mpi and Di, the proportion of firmsin industry i providing various fringe tenefits and the number of accu-mulated compensated sick days allowed, are estimated from data collectedin the employer survey. Table 4-3 shows these estimates.
Both wpi and NFi include part time as well as full time employees.The cost estimates are made assuming that part time employees receivefringe benefits, including compensated sick days, in proportion to hoursworked. In practice it is likely that part time employees are not eli-gible for fringe benefits and in particular compensated sick pay. Tothe extent this is true the cost estimates made here are over estimates.
In practice a cost estimate is made for firms in each industry hav-ing an insured temporary disability plan and a separate estimate is madefor firms having a sick leave plan which allows sick leave to be earnedat some rate. This procedure is used because Di in insured plans is sub-stantially longer than in earned sick leave plans, because Di is indepen-dent of prior usage of the plan for other temporary disabilities in insur-ed plans but not in earned sick leave plans, and because the daily com-pensation in insured plans is generally some proportion of the full wage.In the earned sick leave plan estimate it is necessary to make some as-sumption about the compensated sick leave days available for maternityleave.
The correct value to use for the number of compensated sick daysavailable for maternity leave would be the number of sick days earnedeach year minus the expected number of sick days used for reasons otherthan maternity leave each year by female employees subject to preg-nancy summed over.the average number of years of tenure for femaleemployees at the beginning of a maternity leave with the maximumallowed accumulation of sick days as an upper limit. To calculatethis requires data on expected number of work-loss days for employedfemales for all illnesses exclusive of pregnancy and the average job
1Walter W. Kolodrubetz, "Two Decades of Employee-Benefit Plans,1950-70: A Review," Soc. Sec. Bill, 34:4, April 1972, pp. 10-22.
-37-
48

Table 4-3
Percent of Employees Covered by Various SickLeave Plans, by Industry, for Surveyed Industries
Industry
No Sick
Leave
Plan
1
Earned Sick Leave Plans
23
4
Insurance
56
7
Plans
89
Having
Maternity
Leave
10
Durable
Days
Days
Manufacturers
9.82%
34.06%
10.27
18.39
54.84%
42.93%
60.62%
57.07%
$65.28
37.97%
Non-Durable
Manufacturers
18.22
56.45
12.17
33.31
25.34
33.33
70.00
66.67
27.00
16.66
Wholesale
Trade
29.59
33.31
27.50
27.50
37.10
100.00
60.00
--
Retail
Trade
57.87
32.37
14.44
18.32
9.12
100.00
70.00
--
12.23
Finance, Ins.
& Real Estate
12.20
37.80
11.99
24.55
45.45
Business &
Repair Servp
12.27
75.45
9.88
22.08
12.27
100.00
70.00
50.90
Personal Serv.
Exc. Household
79.69
20.82
6.00
6.00
100.00
Total
27.61%
41.91%
12.82
22.06
30.24%
90.50%
65.16%
9.50%
$54.09
27.03%
Note.
Columns 1, 2, and 5 sum to 100%; Columns
6 and 8 sum to 100%.
Source:
Employer Survey

tenure at the time of pregnancy for employed females. The latter isnot available from any source. The National Center for Health Statis-tics has calculated the average number of work-loss days for employedfemales for 1972 at 5.6 days. 4 However, this calculation includeswork-loss days resulting from childbirth. Because of these data limi-tations it is not possible to calculate the appropriate value for num-ber of compensated sick days available. In the absence of this valueestimates are made using two assumptions. The first assumption is thatthe average number of sick days earned in one year is available. Theassumption of maximum accumulation of sick days available implies thatthe average tenure for female employees is long enough to allow thisaccumulation. If no sick days were taken for any ether temporary dis-ability the average tenure for female employees required to accumulatethe maximum number of sick days would vary from one year in wholesaletrade and personal services except household to nearly three years innon-durable manufacturers and business and repair services. If sickdays are used for reasons other than maternity leave the tenure requir-ed would be longer. To the extent that average tenure for female em-ployees is less than that required to accumulated sick days are avail-able are over-estimates. The assumption of available sick days equalto compensated sick days earned in one year assumes an average tenurelong enough to. have earned these sick days after allowance for use ofsick days for reasons other than maternity leave. It seems reason-able to assume that on the average at least this number of sick daysare available. To the extent that female employees who get pregnanthave an average more than the compensated number of sick days earnedin one year available for maternity leave the estimates made using thisassumption are under-estimates. Together these two assumptions pro-vide a minimum and a maximum assumption with respect to the number ofcompensated sick days available.
For those firms having insured temporary disability plans no suchproblem arises since in all cases insured plans pay at least thirteenweeks of disability compensation. This is sufficient to cover the en-tire maternity leave under all assumptions of the average length of ma-ternity leaves including the maximum assumption of twelve weeks. In-sured temporary disability plans frequently do not pay the entire dailywage in disability payments. Instead they pay some flat dollar amountor some proportion of wages. In making the estimate for insured plansthe wage variable is modified appropriately.
2
Current Estimates From the Health Interview Survey, U.S. Dept. ofHealth, Education, and Welfare, Health Resources Administration, HRA 74-1512, Sept. 1973, Table 16.

Both earned sick leave plans and insured temporary disability plansoften incorporate one short period at the beginning of an illness forwhich compensation is not paid. This exempt period is designed to mini-mize the number of false sick leave claims while providing income pro-tection for legitimate illnesses. The exempt period varies from one toeight days. Since the employer survey did not collect data on the exemptperiod and since there is no other source for this data, the estimates donot consider exempt days. To the extent that exempt days are found intemporary disability plans the estimates are over estimates of the costfor the assumed lengths of maternity leaves.
As Table 4-3 shows the employer survey revealed some temporary dis-ability plans which treat maternity leave as a temporary disability. Be-cause the cost estimate is an estimate of the maternity leave guidelinea zero cost is assumed for these firms. It is assumed that treatment ofmaternity leave is independent of the type of sick leave plan and that re-ports of treatment of maternity leave as a temporary disability are notthe result of the maternity leave guideline.
The cost estimates consider the cost of maintaining four other fringebenefits during an absence due to childbearing. These are vacation, healthinsurance, life insurance, and pension contributions. It is assumed thatan average of two weeks of paid vacation3 per year is earned which impliesthat 4% of wages during temporary disability is accruing in the form of va-cation pay. The percent of employees by industry covered by health insur-ance, life insurance, and pension plans is estimated from the employer sur-vey. Table 4:-4 shows the figures used. It is assumed that the provisionof these fringe benefits is independent of the type of temporary disabilityplan offered. Some support for this assumption is provided in the examina-tion of hospital data in Chapter Five. It is also assumed that employercontributions for the provision of these benefits were not maintained dur-ing a maternity leave of absence but must be maintained during a maternityleave treated as a temporary disability. If the fringe benefit contributionscontinue during a leave of absence or if they are not continued during atemporary disability these cost estimates are over-estimates. There may beother fringe benefit contributions made which are not considered here. Tothe extent that these contributions are made during a temporary disabilitybut not during a leave of absence these estimate's are under-estimates.
To make the cost estimates it is necessary to assume some length forthe medical disability period associated with childbirth. Although theNational Natality Survey provides some data on the length of an absencefrom work during childbirth this data is contaminated with the prevailinginstitutional requirements between 1967 and 1969. Since these include
3Bureau of Labor Statistics, Area gage Surveys, Bulletin 1625-90.
-40-

Table 4-4
Percent of Employees Covered by Selected Fringe BenefitsBy Industry, for Surveyed Industrues
Benefits
Industry
HealthInsurance
LifeInsurance
PensionPlans
Durable Manufacturers 95.6% 95.6% 88.3%
Non-durable Manuf. 84.6% 84.6% 84.6%
Wholesale Trade 53.8% 26.8% 59.7%
Retail Trade 50.7% 45.0% 55.6%
Finance, Insurance andReal Estate 94.5% 92.0% 92.0%
Business and RepairService 63.2% 63.2% 63.2%
Personal Servicesexcept Household 61.8% 61.8% 61.8%
Total for theseIndustries 77.3% 73.9% 76.1%
Source: Survey Data
-41-
52

allowing or requiring a leave of absence of arbitrary length for mater-nity leave this data does not provide a good estimate of the medical dis-ability period associated with childbirth. In the hearings precedingthe adoption of both the DILHR and EEOC guidelines several doctors sug-gested that thP medical disability period may depend on the nature ofthe work done, 1.-ur assumptions about the required length are used inmaking the cost estimate. The minimum assumption of an average of fourweeks of absence undoubtedly results in an under-estimate of the costwhile the maximum assumption of an average twelve weeks of absence isprobably an over-estimate. The two intermediate assumptions, an averageof six weeks of absence and an average of eight weeks of absence, may re-flect more realistic costa. It will be noted that the cost estimates donot increase proportionately with the length of absence assumed. Thisis because of the assymetry of the earned sick leave plans which will notpay compensation for an entire twelve week absence although it may payfor four weeks of absence.
Tables 4-5 and 4-6 show the estimated cost of the maternity leaveguideline by industry assuming the maximum accumulation of sick leavedays are available and assuming sick days earned in one year are avail-able. These estimates are shown both as dollar costs and as a percentof wages and salaries. Table 4-7 shows the estimated cost per femaleemployee in these industries. It is important to recall that the esti-mated dollar cost is attributable only to those firms having a tempor-ary disability plan which pays some compensation. The percent of wagesand salaries figures are calculated using all wages and salaries, how-ever. If it is assumed that wages and salaries are independent of tem-porary disability policies and maternity leave policies it is possibleto calculate the cost of the maternity leave guideline as a percent ofwages and salaries in firms with a temporary disability that does nottreat maternity leave as a temporary disability. These calculations areshown in Table 4-8 . In an earlier chapter it was argued that fringebenefits should have lower wages. If this is the case firms offering atemporary disability policy which pays compensation should have lowerwages than those firms not offering a temporary disability policy, re-sulting in an under-statement in these calculations. Although this maybe partially offset by the tendency for firms offering a temporary dis-ability policy which does not cover maternity leave to have lower wagesthan firms offering temporary disability policy which includes maternityleave, these calculations remain somewhat understated. Table 4-7 showsthe cost per female employee for firms offering a temporary disabilitypolicy which does not include maternity leave.
Although the cost of the maternity leave guideline for these sevenindustry categories under the maximum assumptions of maximum accumulationof sick leave available and a twelve week average absence exceeds $5 mil-lion, relative to total wages and salaries or female employees this costis quite small. This is in part due to the proportion of employees not
-42-
53

Estimated Annual Cost of
by Industry for Surveyed
Table 4-5
Treating Maternity Leave as a Tempoary Disability
Industries, Assuming One Year's Earned Sick Leavel
Durable
Four Week
Average Absence
Dollar
% of
Cost
Wages
Six Week
Average Absence
Dollar
% of
Cost
Wages
Eight Week
Avevage Absence
Dollar
% of
Cost
Wages
Twelve Week
Average Absence
Dollar
% of
Cost
Wages
Manufacturers
$941,236
.036%
$1,394,136
.053%
$1,752,041
.067%
$2,824,836
.108%
Non-Durable
Manufacturers
600,079
.035
711,681
.041
823,284
.048
1,046,487
.061
Wholesale
Trade
196,956
.029
281,869
.041
326,084
.048
414,513
.061
Retail
Trade
608,153
.041
693,788
.047
797,424
.054
986,695
.067
Finance, Ins.
& Real Estate
605,421
.011
650,462
.012
695,505
.013
785,586
.015
Business and
Repair Serv.
91,846
.029
109,372
.035
126,898
.040
163,551
.052
Personal Serv.
Exc. Household
36,108
.019
40,024
.021
43,941
.023
51,773
.027
Total
$2,532,461
.019
$3,295,916
.025%
$4,565,177
.034%
$5,385,441
.040%
1For employees covered by earned day-type temporary disability
plan it is assumed that one
year's earned sick days
are available.

Table 4-6
Annual Cost of the Maternity Leave Guideline Assuming Maximum Accumulation,
By Industry for Surveyed Industries
Four Week
Six Week
Eight Week
Twelve Week
Industry
Average Absence
Average Absence
Average Absence
Average Absence
Dollar % of Wages
Dollar % of Wages
Dollar % of Wages
Dollar % of Wages
Cost
& Salaries
Cost
& Salaries
Cost
& Salaries
Cost
& Salaries
Durable
Manufactures
$181201
.030%
$999762
.038%
$1218323
.047%
$1655446
.0647
Non-Durable
Manufactures
738563
.043%
1107844
.064%
1290303
.075%
1470359
.085%
Wholesale
Trade
196957
.029%
281829
.041%
326084
.048%
414513
.061%
Retail
Trade
661929
.045%
736443
.050%
828957
.056%
995985
.067%
Finance, Ins.
&Real Est.
518060
.010%
649308
.012%
673879
.012%
723020
.014%
Business &
Repair Serv.
95332
.030%
112179
.036%
120933
.038%
140040
.0447
Personal Serv.
Exc. Household
00
00
Total
$2992042, .022%
$3887365!
.029%
$4458479
.03370
$5399333
.040%
My employees covered by earne&.day type temporary
disability plans it is assumed that
the maximum average accumulation is available.

Industry
Table 4-7
Annual Cost of the Maternity Leave Guideline per
Female Employee
By Industry for Surveyed Industries
Four Week
Average Absence
Six Week
Average Absence
Eight
Average Ah.ence
,Ilve Week
.erage Absence
1 4:-
Ln
Durable
Manufactures
Non-Durable
Max.
One
year
Accum. Earned Sick
Leave
$10.86
$8.74
Max.
One year
Accum. Earned Sick
Leave
f13.89
S11.78
Max.
Ohc, year
Accum. Earned Sick
Leave
$16.93
514.32
Max.
One year
Accum. Earned Sick
Leave
523.000
$20.89
Manufactures
$14.21
$10.00
$21.31
511.73
824.82
$13.47
$28.29
$16.93
Wholesale
Trade
515.09
$15.09
$21.59
S21.59
$24.98
$24.98
$31.75
$31.75
Retail
Trade
$3.04
$4.25
$5.61
S4.81
$6.32
$5.52
S7.59
$6.79
Finance, Ins.
& Rual Est.
515.99
$10.19
$20.04
$10.95
$20.80
$11.71
522.31
S13.22
Business .S
Repair Serv.
$9.62
$5.65
$11.32
S6.53
$12.20
$7.41
514.13
$9.34
Personal Serv.
Exc. Household
00
00
00
00i
Total
$8.48
$6.49
$11.021
$7.91
$12.63
$9.27
515.31
$11.94
,s-t
amm
omm
mili
mm
ilmom
milm
mm
umm
illam
mom
milm

Table 4-8
Annual Cost of the Maternity Leave Guideline as a Percent of Wages and
Salaries for Those Firms Affected
Industry
Durable
Four Week
Average Absence
Max
One Year
Accum. Earned Sick
Leave
Six Week
Average Absence
Max
One Year
Accum. Earned Sick
Leave
Eight ...;cek
Average Absence
Max
One Year
Accum. Earned Sick
Leave
Twelve Week
Average Absence
Max
One Year
Accum. Earned Sick
Leave
cir
i .p. T
Manufactures
Non-Durable
.054%
.043%
.069%
.058%
.084%
.073%
.114%
.103%
...1
Manufactures
..063%
.044%
.094%
.052%
.110%
.060%
.125%
.075%
Wholesale
Trade
.041%
.041%
.059%
.059%
.068%
.068%
.0867
.086%
'ail Trade
.121%
.102%
.135%
.116%
.152%
.132%
.182%
.163%
Finance, Ina.
&
Real Estate
.020%
.013%.
.025%
.014%
.026%
.015%
.028%
.017%
Business &
Repair. Serv.
.070X
.041%
.083%
.048%
.089%
.054%
.103%
.068%
Personal Serv.
Exc. Household
--
--
--
-
Total
.042%
.032%
.055%
.039%
.063%
.046%
.076%
.059%

covered by a temporary disability plan or covered by a plan which in-cludes maternity leave. Even after correction for these plans, how-ever, the cost remains small. This is largely because of the low pro-portion of female employees in most of these industries and because ofthe low fertility rates and relatively old age distribution. If all birthsin these industries are single births, only 5.4% of women in these indus-tries will experience a birth in any year. Of course, if the fertili-ty rate increases among employed women, or if more young women enteremployment in these industries, the cost will increase.
4.2 The Estimate for Employers , Covered by Survey Data
There are 58,713 female employees in the industry categories agri-culture, forestry, and fisheries, mining, construction, transportation,communications, and other public utilities, entertains And recreationservices, and public administration. This is 16.8% of ht. ,51,936 total
employment in these industry categories and 9.2% of total female employ-ment in Wisconsin. The estimating equation shown above is used to esti-mate the cost for these industries. Since data on temporary disabilitypolicies and other fringe benefits are not available for these industriesfrom survey data or other sources the values for the fringe benefit var-iables in these industries are assumed to be similar on average to theaverage values obtained on the surveyed industries. Although the costestimates shown in the following tables are shown by industry, the assump-tion that the average values for the fringe benefit variables obtained forsurveyed industries apply to these unsurveyed industries need not applyto each industry individually but only on average across all these indus-tries for the estimate of the total cost for these industries to be rea-sonable. The age distribution for female employees and mean wage ratesfor these industries were used in the calculation. Tables 4-9 through4-11 show the estimates of the cost of the maternity leave guideline for
these industries.
4.3 The Estimate for the Educational Services Industry
There are 85,915 female employees in the category educational ser-vices. This is 60.0% of the total 143,218 employees in this categoryand 13.4% of all female employees in Wisconsin. Of the female employeesin this category 70.5% are employed by elementary and secondary schools.The estimate of the cost of the maternity leave guideline for this in-dustry is made using the data on public school systems described earlier.
-47-

Table 4-9
Estimated Cost of the Maternity Leave Guideline for Industries Not Covered by Survey Data,
Assuming Sick Days for One Year Available
Four Week
Six Week
Eight Week
Twelve Week
Industry
Average Absence
Average Absence
Average Absence
Average Absence
Dollar %of Wages
Dollar %of Wages
Dollar %of Wages
Dollar /of Wages
Cost
& Salaries
Cost
& Salaries
Cost
& Salaries
Cost
& Salaries
Agric, Forestry,
& Fisheries
$68685
.008%
$85727
.010%
$95335
.011%
$136854
.016%
Mining
00
00
Construction
$32593
.002%
$40630
.003%
$48668
.004%
864743
.0057
Trans., Commu-
nication,and
Other Pub. Util.
$133243
.002%
$168938
.003%
$206633
.004%
$280024
.005%
Entertainment &
Recreation Ser.
$24263
.049%
$30290
.061%
$36317
.073%
$48371
.097%
Public Ad-
ministration
$136312
.020%
S170957
.025%
$205603
.030%
$274894
.040%
Total
$395096
.014%
$496542
.017%
S592556
.021%
$804886
.0297

1
Table 4-10
Estimated Cost of the MaternityLeave Guideline for Industries Not Covered by Survey Data,
Maximum Accumulation of Sick Days Available
Six Week
Eight Week
Twelve Week
Assuming
Four Week
Industry
Average Absence
Average Absence
Average Absence
Average Absence
Dollar %of Wages
Dollar %of Wages
Dollar %of Wages
Dollar %of Wages
Cost
& Salaries
Cost
& Salaries
Cost
& Salaries
Cost
& Salaries
Agric, Forestry
& Fisheries
$88063
.010%
$110665
.013%
$120273
.014%
$161792
.018%
Mining
00
00
Construction
$41843
.003%
$52535
.004%
$60573
.005%
$76648
.006%
Trans, Common,
& Other Pub. Ut.
$166763
.003%
$212076
.004%
5249772
.004%
$323162
.006%
Entertainment &
Recreation Ser.
$31100}
.063%
$39089
.079%
$45116
.091%
$57170
.115%
Public Ad-
ministration
$173847'
.025%
$219262
.032%
$253908
.037%
$323199
.047%
Total
$501616
.017%
$633627
.022%
$729642
.025%
$941971
.033%

Industry
Table 4-11
Annual Cost of the Maternity Leave Guideline per Female Employee by Industry
For Industries NNt Covered by Survey Data
Four Week
Six Week
Average Absence
Average Absence
Eight Week
Twelve Week
Average Absence
Average Absence
Max
One Year
Max
One Year
Max
One Year
Max
One Iear
Accum. Earned Sick Accum. Earned Sick Accum. Earned Sick
Accum. Earned Sick
Leave
Leave
Leave
Leave
1Agric, Forestry
c)
t..n
& Fisheries
$5.83
$4.55
$7.33
$5.68
$7.96
$6.31
S10.71
$8.45
Mining
-
CI)
Construction
$9.16
$7.14
$11.51
$8.89
$13.26
$10.65
$16.78
$14.17
ira*
Trans, Com, &
Other Pub. Ut.
$9.95
$7.95
$12.66
$10.08
$14.91
S12,33
$19.29
$16.72
Entertainment &
Recreation Ser.
$7.24
$5.65
$9.10
$7.05
$10.50
$8.45
$13.31
S11.26
Public Ad-
ministration
$9.77
$7.66
$12.32
$9.61
$14.27
$11.55
$18.16
$15.45
Total
$8.54
$6.73
$10.79
$8.45
$12.43
$10.09
$16.04
S13.71

Industry
Table 4-12
Estimated Annual Cost of the Maternity Leave Guideline per Female Employee in Firms
With a Sick Leave Plan Not in Compliance
Four Week
Average Absence
Sim Week
Average Absence
Eight Week
Average Absence
Twelve Week
Average Absence
Agriculture,
Forestry, &
Max
Accum.
One Year
Earned
Leave
Max
Accum.
One Year
Earned
Leave
Max
Accum.
One Year
Earned
Leave
Max
Accum.
One Year
Earned
Leave
Fisheries
$11.04
S8.61
$13.87
$10.75
$15.08
$11.95
$20.28
$17.16
Mining
Construction
$17.34
$13.51
$21.77
$16.84
$25.10
$20.17
$31.76
$26.83
Durable Manta.*
$19.41
$15.63
$28.83
$21.06
$30.26
$26.49
$41.12
$37.35
Non-Dur.Manuf.
$20.85
$14.68
$31.27
$17.22
$36.42
$19.76
$41.50
$24.84
Trans., Commun
& Other Pub. Ut.
$18.85
$15.06
$23.97
$19.09
$28.23
$23,35
$36.52
$31.65
Wholesale
Trade*
$21.43
$21.43
$30.66
$30.66
$35.47
$35.47
$45.09
$45.09
Retail Trade*
$13.64
$11.48
$15.18
$13.02
$17.09
S14.93
$20.53
S18.37
Finance, Ins.
& Real Est.
$33.38
$21.28
$41.84
$22.86
$43.42
$24.45
$46.59
$27.51
Personal Serv.
Exc. Household*
--
--
-
Entertainment &
Recreation Serv.
S13.70
$10.69
$17.23
$13.35
$19.88
$16.00
$25.19
S21.32
Public Admin.
$18.50
$14.50
$23.33
$18.19
S27.01
S21.87
S34.39
S29.25
Total
$16.07
$12.35
$20.80
$15.00
$23.87
S17.77
$29.17
$23.07
*Surveyed Industries

First, the cost is calculated for each school district reporting a tem-porary disability plan which pays compensation but does not cover mater-nity leave using the estimating equation shown in 4.1 with the appropri-ate wage and fringe benefit variables for each school district. It isassumed that school districts having no temporary disability plan or re-porting a temporary disability plan which covers maternity leave exper-ience no cost as a result of the maternity leave guideline. These costsare summed across all school districts. This provides a cost estimatefor public school districts. To obtain an estimate for private schooldistricts it is assumed that the distribution of wages, fringe benefits,and female employees by age is identical to that in public schools anda proportional cost is calculated. Finally, to obtain the cost for othereducational services the cost per female employee subject to the risk ofpregnancy in public and private school districts is calculated and appliedto female employees subject to the risk of pregnancy in other educationalservices. This procedure implicitly assumes that the values for fringebenefits and wages in other educational services are identical to thosein school districts. Since employment in other educational services in-cludes a large number of clericals, this assumption may result in an over-estimate of the cost for this group. As can be seen from Table 4-13, thecost for this group is large relative to that for school districts. Thisis a result of the much younger age distribution of females employed inother educational services relative to that in school districts.
The costs per female employee for female employees in school dis-tricts affected by the guideline may be taken as reasonably accurate.These estimated costs substantially exceed the estimated cost per femaleemployee in affected firms in other industries for two reasons. First,the average wage for female employees in these school districts is twicethat in the other industries. Second, the temporary disability plans inall the affected school districts are of the earned-day type, pay thefull wage, and nearly all school districts allow a maximum accumulationsufficient to cover a twelve week absence. There is data available onthe experience of school teachers in the school district for the affect-ed school district. Since sick days are accumulated with experience inthe school district, this data should suggest the number of sick days a-vailable for maternity leave if sick days are taken for no other reason.The average number of years of experience in these school districts isless than one year, indicating that it most the sick days earned in oneyear are available. Consequently the cost estimate which considers onlythe sick days earned in one year are available may most accurately re-flect the realized cost.
Caution should be used when considering the cost estimates for theentire educational services industry. The previous chapter contains adiscussion of the possible reflection of the maternity leave guidelinein reports of maternity leave practices collected by survey from schooldistricts. To the extent that maternity leave practices prior to thematernity leave guidelines are not reported accurately, these cost esti-mates are under-estimates for the entire industry.
-52-
63

Table 4-13
Estimated Annual Cost of the Maternity Leave Guidelines forSchool Districts and for Educational Services
Maximum Accumulation c.f. .,ick Leave
Dollar Cost,Pub. School
Otie Year
EarnedSick Leave
Hour WeekAverageAbsence
Six WeekAverageAbsence
Eight Week.AverageAbsence
Twelve WeekAverageAbsence
Districts $96322 $217983 $280197 $378704 $566060
%of Wages,Public SchoolDistricts .018% .041% .052% .071% .106%
Cost Per FemaleEmp., PublicSchool Dist. $1.59 $3.60 $4.63 $6.26 $9.35
%of Wages,Affected PublicSchool Dist. .153% .347% .446% .603% .9027
Cost Per FemaleEmp., AffectedPub. School.Dis. $27.17 $61.49 $79.04 $106.83 $159.68
Dollar Cost, AllOther EducationalServices $137918 $312118 $401198 $542245 $810440
Total Dollar CostAll EducationalServices $234240 $530101 $681395 $920949 $1376500
%of Wages, AllEducationalServices .029% .066% .084% .114% .170%
Cost per FemaleEmp., All Ed.Services %2.73 %6.17 %7.93 %10.72 %16.02

4.4 The Estimate for the Health Services Industry
There are a total of 111,287 employees in the health services indus-try. Of these 83,532, 79.6%, are female and 13.8% of all employed femalesare employed in this category. Hospitals employ 66.4% of those employedin this category and 68.7% of the females employed in this category. Near-ly 80% of employment in hospitals is in hospitals covered by the surveydiscussed earlier. The procedure for making the estimate of the cost ofthe maternity leave guideline for the health services industry is similarto that used for the educational services industry. First the cost for in-dividual hospitals responding to the survey is calculated. These costsare summed across hospitals. Table 4 -14 shows these estimates summed foreach data set and across all hospitals. It is then assumed that non-respond-ing hospitals and hospitals not falling under the survey definition of non-geriatric non-psychiatric hospitals experience proportional costs. Finallyit is assumed that the values for fringe benefit variables and wages inother health care services are similar on average to those in hospitals.This allows the cost per female employee subject to the risk of pregnancyin hospitals to be applied to female employees subject to the risk of preg-nancy in other health care services. Table 4-19 shows the estimated costfor the health care services industry.
The estimate made for the primary data set of the survey hospitalsis made from the most detailed and complete data and is consequently themost accurate. For this primary data set data is available for base andmaximum wages as well as average wages. Estimates were made using allthree wage variables for primary data set hospitals. These estimates,shown in-Tables 4-14 through 4-19, provide some bounds for the estimates.The estimate for the secondary data set hospitals is made with somelfhatless detailed data for employment and wages and may be somewhat less ac-curate than the estimate for primary data set hospitals, although it isstill reliable.
The estimate for all other health care services is the least reli-able component of the cost estimate for this category. In this groupare 18,230 female employees of convalescent institutions. Because theseinstitutions employ lower skilled labor than hospitals, mean wages maybe lower in these institutions. There are also 8,745 female employeesin offices of physicians, dentists,-and chiropractors. These may also
hos-pitals. In addition the employers of these women are likely to be smallemployers who are less likely to have structured temporary disabilitypolicies. To the extent these characterizations of the all other healthcare services group hold the cost estimate for this group is an over-estimate.
be lower skilled and have lower mean wages than female employees of hos-
-54-
65

Table 4-14
Estimated Annual Cost of the Maternity Leave
Guideline for Hospitals)
Maximum Estimate2
Middle Estimate3
Minimum Estimate4
Primary
Dollar
Cost
% of
Wages
Dollar Cost
Per Employed' Dollar
Female
Cost
% of
Wages
Dollar Cost
Per Employed Dollar
Female
Cost
% of
Wages
Dollar Cost
Per Employed
Female
Data Set?
$742,794
.285%
$25.60
$414,199
.159%
$14.27
$307,759
.118%
$10.60
Secondary
Data Set8
$540,132
.333%
$24.00
$278,764
.172%
$12.43
$108,470
.067%
$ 4.84
Total, Both
Data Sets
$1,289,292
.303%
$24.94
$692,963
.164%
$13.47
$416,229
.099%
$ 8.09
1Assuming an eight week average absence is required for childbearing
!Assuming that the maximum accumulationof sick days is available in earned sick day plans
3Assuming that sick days for one year are available in earned sick day plans
4Assuming that sick days for one year minus four days
are available in earned sick day plans
5Calculated using all wages
,Calculated using
all female employment
'Calculated using average wages
8Corrected for
non-responses

Tcble 4-15
Estimated Annual Cost of the Maternity Leave Guideline PerFemale Employee, All Hospitals
Base WageOne Year Max.
Earned Accum.Leave
PRIMARY DATA SETFour Week
Maximum WageOtte Year Max.
Earned Accum.Leave
Average WageOne Year Max.Earned Accum.Leave
Average Abs. $11.02 $12.50 $12.46 $14.99 $12.20 $13.71Six WeekAverage Abser $12.03 $18.27 $13.66 $21.73 $13.98 $19.95Eight WeekAverage Abs. $12.99 $23.49 $14.82 $27.98 $14.27 $25.AnTwelve WeekAverage Abs. $14.70 $40.45 $16.88 $48.60 $16.19 $47.33
SECONDARY DATA SETFour WeekAverage Abs.4x WeekAverage Abs.Eight WeekAverage Abs.
Twelve WeekAverage Abs.
- -
- -
TOTAL, BOTH DATA SETSFour WeekAverage Abs.Six WeekAverage Abs.Eight WeekAverage Abs.Twelve WeekAverage Abs.
-56-
67
$ 9.25 $12.92
$11.19 $19.35
$12.43 $24.09
$16.77 $32.41
$10.91 $13.37
$12.32 $19.69
$13.47 $24.94
$16.44 $40.83

Tnblu 4-16
Estimated Annual Cost of the Maternity Leave Guidelineas a Percent of Payrolls, All Hospitals
Base WagesOne Year Max.Earned Accum.
Sick Lv.
PRIMARY DATA SETFour Week
Maximum Wages Average WagesOne Year Max. One Year Max.Earned Accum. Earned Accum.Sick Lv. Sick Lv.
Average Abs. .123% .139% .139% .167% .136% .152%Six WeekAverage Abs. .134% .203% .152% .242% .147% .222%
Eight WeekAverage Abs. .145% .261% .165% .311% .159% .285%Twelve WeekAverage Abs. .164% .450% .188% .541% .180% .526%
SECONDARY DATA SETFour WeekAverage Abs. .128% .178%
Six WeekAverage Abs. .155% .267%
Eight WeekAverage Abs. .172% .333%
Twelve WeekAverage Abs. .232% .448%
TOTAL, BOTH DATA SETSFour WeekAverage Abs. .133% .162%
Six WeekAverage Abs. .150% .239%
Eight WeekAverage Abs. .164% .303%
Twelve WeekAverage Abs. .200% .496%
-57-

Table 4-17
Estimated Annual Cost of Maternity Leave Per Female Employee,Affected Hospitals
Base Wage
One Year Max.Maximum Wage
One Year Max.Average WageOne Year Max.
Earned
Leave
PRIMARY DATA SET
Accum. EarnedLeave
Accum. EarnedLeave
Accum.
Four WeekAverage Abs. $15.64 $17.73 $17.68 $21.27 $17.30 $19.45Six WeekAverage Abs. $17.06 $25.92 $19.38 $30.82 S18.72 $28.31Eight WeekAverage Abs. $18.43 $33.32 $21.03 $39.69 $20.25 $36.32Twelve WeekAverage Abs. $20.86 $57.39 $23.95 $68.95 $22.97 $67.15
SECONDARY DATA SETFour WeekAverage Abs. $18.58 $25.96Six WeekAverage Abs. mi $22.48 $38.86Eight WeekAverage Abs. -- $24.97 $48.38Twelve WeekAverage Abs. $33.68 $65.09
TOTAL, BOTH DATA SETSFour WeekAverage Aba. -- $17.69 $21.0Six WeekAverage Abs. $19.85 $31.47Eight WeekAverage Abs. $21.67 $39.93Twelve WeekAverage Abse $26.18 S66.53
-58-
69

Table 4-18
Estimated Annual Cost of the Maternity Leave Guideline for Hospitalsas a Percent of Payrolls for Affected Hospitals
Babe Wage Maximum wage Average WageOne Year Max. One Year Max. One Year Max.EarnedLeave
PRIMARY DATA SET
Accum. Earned
LeaveAccum. Earned
LeaveAccum.
Four WeekAverage Abs. .236% .268% .267% .321% .261% .2947Six WeekAverage Abs. .258% .391% .293% .466% .283% .4287Eight WeekAverage Abs. .278% .503% .318% .599% .306% .548%Tlve WeekAverage Abs. .315% .867% .362% 1.041% .347% 1.014%
SECONDARY DATA SETFour WeekAverage Abs. .266% .371%Six WeekAverage Abs. .321% .5557Eight WeekAverage Abs. .357% .691%Twelve WeekAverage Abs. .481% .930%
TOTAL, BOTH DATA SETSour Week
Average Abs. .2627 .318%Six WeekAverage Abs. .295% .467%Eight WeekAverage Abs. .321% .5927Twelve WeekAverage Abs. .388% .987%

Table 4-19
Estimated Annual Cost of the Maternity LeaveGuideline for the Health Care Services Industryl
Maximum2Estimate
Middle3Estimate
Minimum4Estimate.
Surveyed Hospitals $1,282,926 $ 692,963 $ 416,229
Other Hospitals 332,925 179,827 108,013
Other HealthCare Services 755,930 408,310 245,252
Total, HealthCare Services $2,371,781 $1,281,100 $ 769,484
Total asPercept ofWages .578% .312% .187%
Total, perEmployedFemale() $30.18 $16.30 $ 9.79
1Assuming an eight week absence is necessary for childbearing2Assuming that the Trocimum accumulation of sick days is avail-able in earned sick day plans
3Assuming that sick days for one year are available in earnedsick day planstAssuming that sick days for one year minus four days are avail-able in earned sick day plans"Calculated using all wages6Calculated all female employment

4.5 The Estimate for the State of Wisconsin
It is now possible to sum the estimates discussed above to obl.ain anestimate of the cost of the maternity leave guideline to all employers inthe state of Wisconsin. Table 4-20 shows the estimates. The other cate-
gory contains 47,351 employees, 23,291 of these female, in the professionaland related services Category not covered by the health care services oreducational services estimates and 83,473 employees, 35,444 of them female,whose industry o' employment is not ascertained. The cost for this cate-gory is estimat,td under the assumption that the cost is proportional tothat in all other industries.
As can be seen from Table 4-20, the estimate of the cost of the mater-nity leave guideline ranges from $4.4 million under the minimum assumptionsabout the length of compensat,d lease available and needed to $12.8 millionunder the maximum assumptions about length of compensated leave availableand necessary. This is .028% to .082% of wages. To help put this in per-
spective consider that in 1970 employer and employee contributions for pro-vision of temporary disability and long term disability benefits were .69%of wages and salaries in private industry. The cost of maternity leave
will bring this to .72% to .77% of wages and salaries or raise it 3% to 11%.
The discussion of the compOnents of these estimates makes clear thatthe cost for specific industries, or firms, depends heavily on the propor-tion of young females employed by that industry, or firm. Consequently,hospitals where employment is 82% female, the cost is 72% of that forsurveyed industries, where employment is 36Z female. With this in mind weturn now to a discussion of employer response to this cost using hospitaldata.
-Kolodrubetz, p. 17.
-61-
72

Table 4-20
Estimated Annual Cost of the Maternity LeaveGuideline for the State of Wisconsin)
Maximum2Estimate
Middle3
EstimateMinimum4Estimate
Surveyed Industries5 $4,458,479 $3,269,440 $2,843,786
Unsurveyed Industries6 743,307 611,221 551,808
Educational Services 370,434 179,946 124,172
Health Care Services 2,371,781 1,281,100 769,484
Other? 346,996 196,709 153,285
Total $8,290,997 $4,538,416 $4,442,535
Total, asPercent ofWages .053% .029% .028%
1Assuming eight weeks absence is required for childbearing
2Assuming maximum accumulation is available in earned sickday plans3Assuming sick days earned in one year are available in earn-ed sick day plans
4Assuming sick days earned in one year minus four days areavailable in earned sick day plans5available
durable manufacturers, non-durable manufacturers,wholesale trade, retail trade, finance, insurance, and realestate, business and repair services and personal services
6Includes agriculture forestry, and fisheries, mining, con-struction, transportation, communications and other publicutilities, entertainment and recreation services, and pub-lic administration.
7Includes professional and related services other than healthor education, and industry not reported.
-62-
73

CHAPTER FIVE
Hospital Response to the Cost Maternity Leave
In Chapter Two three hypotheses about employer response to an addi-tional cost of a fringe benefit like maternity leave were suggested. Itwas suggested that, given the fringe benefit package, firms offering ma-ternity leave treated as a temporary disability ought to have lower wagesthan firms not treating maternity leave as a temporary disability, ceterisparibus. In addition or alternatively, given wages, firms offering mater-nity leave treated as a temporary disability ought to have smaller non-maternity fringe benefit packages than firms not treating maternity leaveas a temporary disability. Finally, the age and sex composition of employ-ees may differ between firms treating maternity leaves as a temporary dis-ability and other firms. These hypotheses, although specifically dealingwith maternity leave treated as a temporary disability, are generally con-cerned with relationships between components of total compensation. Becausethat is the case, and because as a by-product of the examination of the hos-pital data all the fringe benefits offered may be discussed, it is helpfulto place these hypotheses in the context of other research concerned withfringe benefits.
5.1 Previous Research Concerned With Relationships Between Components ofTotal Compensation
Payment of compensation as wage supplements is a phenomena of thesecond third of this century. Although pension plans, paid vacations,and occassionally other benefits were known in the nineteenth century,their coverage was limited generally to upper and middle management,and they were viewed as rewards for long and loyal service. In the mid-
, 1930's, however, the concept of fringe benefits changed. This was inpart the result of the economic upheaval of that period and the result-ing federally legislated insurance programs, e.g. social security andunemployment compensation, which provided some economic protection a-gainst income loss. Employees began to consider fringe benefits as onemeans to providing economic security. This was enhanced by passage ofthe National Labor Relations Act of 1935 which guaranteed the right tocollectively bargain, and by subsequent count interpretations of that
74

act which required employers to bargain over pension plans 1 and healthand insurance plans.2
While employees began to think of wage supplements as providingprotection against economic haxards, employers began to view them as amethod for achieving certain goals: pay for time not worked, bonuses,provision of recreational facilities, and a vanity of other benefitswere viewed as a way to increase productivity. During World War II em-ployers provided increased wage supplement, as a method of circumventingthe War Labor Board's limitations on money wage increases.3
The change in attitude toward fringe benefits by both employersand employees has led to a high growth in their importance. In 1929supplements to wages and salaries, including legally required socialinsurance and privately financed health and welfare programs,4 wasthought to be 1.4% of total compensation. By 1969 this had grown to9.5% of total compensation. This tremendous growth has been accom-panied by increased interest in the nature of fringe benefits and theircomponent parts. The literature and research dealing with fringe bene-fits can be divided generally into three strands. The first strand
'deals with the size of the total wage supplement component of total com-pensation and the various benefits which make up wage supplements. Thesecond, a literature dealing with individual benefits, is largely tech-nical in nature aimed at suggesting how various provisions of specificfringe benefits may be implemented or may effect the nature of the bene-fit. The third is analytic research designed to suggest how economicfirm or labor behavior may be effected by the presence of fringe bene-fits. The first and third strands provide some insights into the re-search presented here. The second strand is of little interest for thiswork and will not be discussed.
There are several sources of estimates of total compensation. TheNational Income Accounts, Office of Business Economics, U.S. Departmentof Commerce, has estimated employer payments for social insurance, pri-vate pension, health and welfare plans, using aggregate national data,
lInland Steel v. NLRB, 1948.
2W.W. Cross & Co. v. NLRB, 1949
3See Donna Allen, Fringe Benefits: Wages or Social Obligation
Ithaca, New York: New York State School of Industrial and Labor Rela-tions, Cornell, University, 1969, Chapter 1, 2 and 10 and Alvin Bauman,"Measuring Employee Compensation in U.S. Industry" Monthly Labor Review,Vol. 93, Oct. 1970, pp. 17-19 for a more comprehensive historical review.
4 Bauman, p. 19. Excludes pay roll items such as paid leave, bonuses,and overtime pay.
-64-

since 1929. The American Iron and Steel Institute has collected dataon hourly employment costs for total and by component for the iron and
steel industry. the United States Chamber of Commerce has conductedand published surveys of employer expenditures for time worked beyondpay since 1947. The Bureau of Labor Statistics has surveyed and pub-lished data on employer expenditures for a variety of wage supple-
ments for several industries since 1951 and for the entire private non-farm economy since 1966. Finally, the Social Security Administrationhas collected and published data on employer contributions for selectedwage supplement contributions for years since 1946.
Table 5-1 shows the percent of wage and salary workers covered byvarious benefits and the employer and employee contributions as a per-cent of wages and salaries. Although the source for this table is theSocial Security Administration, it is compiled using data from all the
sources mentioned above. As can be seen all the fringe benefits shownhave grown substantially both in coverage and as a percent of wages.It is interesting to compare the coverage figures shown in this tablewith the ones obtained in the employer survey for Wisconsin shown inTable 4-4. Coverage for life insurance seems slightly higher in Wiscon-
sin. Health insurance coverage seems slightly lower in Wisconsin and
for retirement plans coverage seems substantially better.5 It should
be remembered that these figures are not strictly comparable. However,
the comparison does suggest that coverage in Wisconsin- is similar to
that in the nation as a whole.
Employer and employee contributions to employee benefit plans haveincreased from $3,937 million in 1950 to $34,676 million in 1970. Bene-
fits paid under these plans increased from $1,813 million in 1950 to$25,797 million in 1970. In 1950 the major fringe benefits offered werelife insurance, hospitalization insurance, temporary disability, and re-tirement plans. By 1970 these benefits were joined by supplemental un-employment insurance, long term disability insurance, and a major expan-sion of health insurance to include surgical insurance, major medical in-surance, dental insurance, and a variety of special medical services in-cluding out-of-hospital drugs, physicians visits, and X-ray and laboratoryexaminations. The figures noted above do not include pay for time notworked which in 1970 was as much as 5.5% of compensation. Although vaca-tion has one of the longest histories of all fringe benefits, in the lasttwo decades it has been expanded to include personal raves, civic leaves,and a large number of holidays. All of these benefits taken together makethe wage supplement portion of employee compensation nearly 20% of compen-sation.6 This is a significant amount and the relationships between dif-
5Coverage in Wisconsin estimated from the employer survey: health
insurance, 77.3%, life insurance, 73.9%, pension plans, 76.1%.
6Employee Compensation in the Private Non-farm Economy, 1968, BLS
Bulletin 1722, 1971.
-65-
76

Life
Insurance
and
Year
Death
Table 5-1
Coverage and Contributions under Selected Employee Benefit Plans,1 1950-70
Accidental
Death &
Dismember-
Hospital-
ment
izatior.
Temp-
Long-
Supple-
orary
Term
mental
Regular
Major
Disa-
Disa-
Unemploy-
Surgical
Medical
Medical
bility
bility
ment
Retire-
ment
.1k,1
1950
'NI
i1955
cr,
(3.
1960
1965
1970
Covered employees as percent of all wage and salary workers
Covered employees as percent of wage and
salary workers in private industry
38.9
16.2
48.7
35.5
16.4
46.2
22.5
50.7
28.3
60.0
54.7
37.0
4.0
49.2
2.1
32.2
58.2
35.5
68.9
65.5
50.2
16.5
49.0
3.4
42.4
64.2
43.5
74.3
72.0
60.3
26.8
50.4
3.8
46.2
69.4
52.1
80.2
79.2
71.1
35.8
50.7
11.7
4.0
48.3
Employer and employee contributions as percent of all wages
Employer and employee contributions as
and salaries
percent of wages and salaries in private
industry
1950
.34
.01
.04
.21
.40
--
1.67
1955
.44
.02
.69
.38
.02
.49
.02
2.19
1960
.54
.03
.96
.49
.18
.53
.05
2.47
1965
.64
.03
1.25
.61
.31
.54
.04
2.89
1970
.67
.04
1.45
.77
.44
.69
.03
3.28
Source:
Walter W. Koiodrubetz, "Two Decades of Employee Benefit Plans, 1950-70; A Review," Social SeCurity
Bulletin 35:4, April 1972 p. 17.
1Excludes employer and employee contributions for social security, unemployment compensation andworkman's
compensation, as well as vacation, personal leaves, and other pay for time not worked.

Table 5-2
Contributions and Benefits, 1950 and 1970, Total andSelected Benefits
Type of Benefit
(in millions of dollars)
1950 1970Contributions Benefits Contributions Benefits
Total $3937 $1813 $34676 $25797
Life InsurancesDeath Benefits 480 310 3224 2435
Total Health 856 709 13878 13323
TemporaryDisability 502 408 2923 2403
Retirement 2080 307 1400 7360
Source: Social Security Bulletin 35:4, April 1972.
-67-
78

ferent fringe benefits and between all fringe benefits and wages maycarry important implications. That elements of compensation may beinterchangeable was explicitly recognized by the Bureau of Labor Sta-tistics in 1964 when they began reporting wage supplements as a pro-portion of gross payro11.7 There is, however, surprisingly littleeconomic research dealing with these relationships.
Walter 00 noted that total labor cost contains both a variablewage component and a fixed cost component incurred by the firm whenit hires a specific stock of labor. Oi divided these fixed costs in-to training costs and hiring costs. Hiring costs include costs incur-red for recruiting, processing payroll records, and for providing wagesupplements. The periodic vent, which represents the amortization ofthese fixed costs, drives a wedge between marginal value product andwage. It forms a buffer absorbing short run variations in marginalvalue product causing firms to shift factor demands differentially,depending on relative fixity. Oi does not specify what sort of wagesupplements he has in mind to be included in the fixed cast componentexcept to say that they must not affect productivity. In his empiricalwork, he includes only unemployment compensation contributions. Othernon-hour related supplements may enter as fixed costs however, includ-ing most insurance contributions. The importance of this model isthat it suggests a range of indeterminancy in wages and a sluggishfactor demand response to marginal falue product changes when fixedlabor costs are large relative to total labor cost. This suggeststhat the wage effect hypothesized in Chapter Two, may not be strongin the short run when the cost of providing a non-hour-related fringebenefit is increased. Oi's work has formd the basis for further re-search into the employment-hours decision but implications for fringebenefit mix determination or size of the fringe benefit package havenot been examined in this context.
Robert Rice10 has suggested that there are four reasons wage sup-plements should be expected to increase as a proportion of total com-pensation. The progressive income tax structure has created specialmarkets for insurance and annuity benefits such that above some compen-sation level effective prices vary negatively with money income. This
7Employee Compensation and Payroll Hours, 1968, BLS Reports 335-1to 335-11.
8Walter Oi, "Labor as a Quasi-Fixed Factor", Journal of Political
Economy, 70: December 1972, pp. 538-555.
9See, for example, Sherwin Rosen, "Short-Run Employment Variations
on Class I Railroads in the U.S. 1947-63, Economica 37, December 1963and Ronal Ehrenberg, Fringe Benefits and Overtime Behavior, Lexington,Mass.: D. C. Heath and Company, 1971.
10Rice, Robert "Skill, Earnings, and the Growth of Wage Supplements."
-68-
79

results in earnings elasticities which exceed income elasticities ofdemand for these benefits. Income growth, then, leads to an increaseovertime in expenditures for these insurance benefits. Special marketshave also been created for these insurance benefits through the abilityof firms to group purchase them. Rice points out that differences bet-ween group and individual prices does not explain why the benefits wouldtake the form of wage supplements rather than payroll deductions. Hedoes suggest that this effect together with the preferential tax treat-ment may be reflected in combination in increased employer contributions.A third factor leading to increases in wage supplements, suggested byRice, is the incentive for reduced turnover provided by fringe benefits.If fringe benefits in general, and specific fringe benefits in particu-lar, are more effective in reducing turnover than wages, we would expectfringe benefits, and particular fringe benefits, to be higher where turn-over costs are higher. Chapter Two discusses this point in more detail.Finally, Rice suggests that unions have exerted pressure for increasedfringe benefits.
Rice examined these four possible effects in cross section using1959 data for nineteen manufacturing industries. Simple correlationsshowed positive variations between wage supplements and earnings rate,firm size. and unionization, and negative correlations between wage sup-plements and the turnover rate. In regressions of each of four wagesupplement measures, pension and retirement plans, health, accident andlife insurance, pension and insurance expenditures, and all wage supple-ments vary positively with money earnings independently of other factors,variations in wage supplement expenditure variations can be explainedlargely in terms of variations in money earnings, and the relationshipbetween wage supplements and earnings supports the preferential tax treat-ment hypothesis. The importance of these results for the research donehere will be pointed out at a later point.
William Bailey and Albert Schwenkll have examined the relationshipbetween employer expenditures for retirement or insurance ratios and em-ployer expenditures for labor services and various firm characteristicsusing 1968 cross-section data for eight industries. Unlike Rice theypostulate no causal relationships, but rather are looking only for des-criptive relationships. In regressions of the ratio of employer retire-ment expenditures on employer insurance expenditures to employer expendi-tures for total compensation on establishment size, union status, earn-ings, and region they found that both ratios varied positively with earn-ings, unionization, and establishment size. Similar regressions usingthe incidence of insurance or retirement plans instead of the expenditureratios tended to show that the existence of the plan was more closely re-lated than expenditure levels to the independent variables. This lendssome legitimacy to the binary variables to be used for the fringe benefitofferings discussed below.
llwilliam R. Bailey and Albert E. Schwenk, "Employer Expenditures for
Private Retirement anti Insurance Plans."
-69-
80

The literature discussed above together with the discussion containedin Chapter Two suggest that there are relationships between wages and fringebenefits and between various fringe benefits. In the absence of any well-developed theory of these relationships we will examine the hospital datain a descriptive way for the wage and substitution effects discussed in de-tail in Chapter Two. This is done with the recognition that no causal re-lationships are implied.
5.2 A Review of the Hospital Data
As noted earlier the hospital data is divided into two data sets onthe basis of whether the hospital response was to the mailed survey or thetelephoned survey. The primary data set contains 84 hospitals and in-cludes data on base starting monthly wages, maximum monthly wages, andaverage monthly wages for eighteen occupation categories, and data on fe-male employment by age, occupation, and number of hours worked for sixdifferent occupation categories, five different age categories, and fullor part time employment. The secondary data set contains 79 hospitalswith data on average hourly wages for three occupation categories, anddata on average hourly wages for three occupation categories, and data onfemale employment by age and occupation for three age categories and fiveoccupation categories. Where possible the analysis discussed in thischapter is done for both data set separately although the majority of thediscussion deals with analysis of the primary data set. Differences inthe results of the analysis for the two sets are noted.
Although wages for eighteen occupation categories were collectedfor the primary data set not all 84 hospitals provided all eighteen wages.Small hospitals often do not have personnel in some of the eighteen cate-gories and some hospitals simply did not respond to some of the wagequestions. The analyses discussed below use only six of the occupationcategories where responses were most complete and where most employeesare found. These are degree nurse (four years of college resulting ina bachelor's degree), diploma nurse (two years of nursing training), Li-censed Practical Nurse (LPN, nine months to one year of nursing training),clerk-typist, and maid.
4.
The data for fringe benefit variables allow formation of descrip-tive paramett-.s of fringe benefit offerings, often binary variables,rather than actual premium costs. The cost of two of the fringe bene-fits, vacation, and number of days of sick leave, is the product of thedaily wage and the number of days allowed or expected to be taken forthese benefits. For these variables data allows insertion of the appro-priate labor cost values into the multiple regressions used in the analy-ses. For the other fringe benefit variables, i.e., hospitalization,surgical, and major medical insurances, life insurance, long term dis-
-70-

Table 5-3
Coefficient of Variation of Wages by Occupation in Hospitals,Responses for Primary Data Set
Occupation
Nurse, degreeBaseMax.Ave.
Coefficientof Variation
.076
.072
.076
Nurse, diplomaBase .079Max. .087Ave. .070
Nurse, LPNBase .110Max. .098Ave. .088
Nursing Asst.Base .159Max. .124Ave. .156
Clerk-TypistBase .148Max. .134Ave. .132
Maid
Base .136Max. .125Ave. .139
-71-
82

ability insurance, and retirement plans, the theoretically appropriatevariables would be premium payments or employer contributions. However,the data does not allow use of these variables. Instead these fringebenefits are represented by binary variables taking on the value 1 ifthe fringe benefit is offered by the hospital, 0 otherwise. The use ofthese binary variables taking on the value 1 if the fringq benefitsrather than benefit levels as indicated by expenditures."
There is considerably more variation in the wage variables than inthe fringe benefit variables. Table 5-4 shows the number of hospitalsreporting various fringe benefits. For vacation and number of days ofsick leave it is possible to calculate the cost of the benefit as a per-cent of wages. For vacation the cost ranges from 2% of wages for hospi-tals offering one week of vacation to 8% of wages for hospitals offeringfour weeks of vacation. The cost of sick leave, assuming all sick daysare taken, ranges from 0 for hospitals with no compensated sick leaveplan to 22% for the hospital allowing 45 days. The range of the cost ofsick leave is something less than this, however, since not all employeesare expected to take all compensated sick days. Thirteen hospitals indi-cated the percent of wages contributed by the hospital to retirement plans.These reports ranged from 1.5% of wages to 6% of wages with the mean at3% of vages. Although the cost of the other benefits cannot be calculated,it may not be unrealistic, and it would be consistent with other estimatesof the size of wage supplements, to suggest that the cost of fringe benefitofferings for hospitals range from around 10% of wages to as much as 20%of wages.
5.3 Examination of the Hospital Data for Employee AgeDistribution Differences
We turn first to the third hypothesis suggested in Chapter Two, thatthere may be differences in the age distribution of female employees bet-
ween hospitals offering maternity leave treated as a temporary disabilityand those not offering maternity leave treated as a temporary disability.Young females may prefer to supply labor to hospitals offering maternityleave treated as a temporary disability, tending to result in a youngerlabor force employed by these hospitals. At the same time hospitals whooffer maternity leave treated as a temporary disability may attempt tominimize the cost of providing this fringe benefit by adjusting its laborforce to include a lower proportion of female employees subject to preg-nancy. A priori it is not possible LI determine which of these forcespredominate.
12It will be recalled that Bailey and Schwenk found relationships bet-
ween the incidence of benefits and wages to be stronger than those betweenexpenditures on benefits and wages.
-72-

Table 5-4
Vacation and Sick Leave Offered by Hospitals, Responsesfor Hospitals in the Pimary Data Set
No Re- Range of Median Mean Cost of % of Wagessponse Responses for Mean Value
Weeks ofVacation 9 1-4 wk. 2 wk. 2 wk. 4%
Days of SickLeave Per Yr. 11 0-45 da. 12 da. 12.17 da. 4.9%*
*Assuming all days are ta%en
Table 5-4A
Other Fringe Benefits Offered by Hospitals, Responses foritospitais in the Primary Data Set
No Re-sponse
Hospitals Of-fering Benefit
N,..:. %
Hospitals Not Of-fering Benefit
No. %
ILife Ins. 1 56 67% 27 33%
Health Ins.Hospitalization 0 81 96% 3 4%Surgical 0 81 96% 3 4%Maj. Medical 0 66 79% 18 217
Pension 0 55 77% 19 237
Lonh-termDisability 1 46 55% 37 45%
L-73.-
84

To examine the hospital data for the effect of these two forceson the age distribution of female employees a variable defined as thenursing personnel ages 17 to 39 as a proportion of all nursing person-nel has been created. Since this age range captures the main child-bearing years, the influence of maternity leave treated as a temporarydisability ought to be observed on t_is proportion. The mean value ofthis proportion across hospitals in the primary data set is .604 andit ranges from .800 to .250. This dis' ibution variable was regressedagainst the fringe benefit variables, including number of weeks of va-cation, number of days of sick leave, and the binary variables repre-senting the presence or absence of long term disability, hospitaliza-tion insurance, major medical insurance, pension, and maternity leave,and a wage variable. This regression estimates the relationships bet-ween the distribution variable and each of the components of total com-pensation. Because it is not possible to determine which of the forcesnoted above predominates the estimated coefficient on the maternityleave variable when nurses ages 17 to 39 as a proportion of all nursesis regressed against the fringe benefit variables may be of either sign,or may be insignificant. If it is positive it is an indication that thelabor supply effect predominates. If it is negative it suggests the labordemand effect predominates. If it is not significantly different fromzero the two effects may be offsetting.
Table 5-5 shows the estimated regression coefficients when the agevariable is regressed on the fringe benefit variables, and when eitherdegree nurse, average wage or diploma nurse, average wage is added to theequation. As can be seen' from the table the maternity leave variable issignificant and negative in two of the three cases. This suggests the;the hospital labor demand effect tends to outweigh the labor supply ef-fect. The size of the estimated coefficient suggests that when maternityleave is treated as a temporary disability the proportion of nursingpersonnel ages 17 to 39 is .063 smaller than when maternity leave is nottreated as a temporary disability. Since the mean number of nursing per-sonnel across these hospitals is 188, a hospital with the mean number ofnursing personnel and offering maternity leave as a temporary disabilityis expected to have twelve fewer female nursing personnel between ages17 and 39. This implies that such a hospital may expect up to one birthless per year than a hospital not offering maternity leave treated as atemporary disability. This result may not be too surprising. Hospitaladministrators have indicated that they are quite aware that maternityleave treated as a temporary disability increases the cost o;: temporarydisability plans and the increase in cost is a function of the age oftheir feciale employees. The Wisconsin Hospital Association is among theopponents to the maternity leave guideline.
The estimated coefficients on the other fringe benefit variablesbear some discussion. Although we had no a priori expectations for anyof these coefficients, the supply and demand effects postulated for thecase of maternity leave would be present for other fringe benefits aswell, particularly when collection of the benefits may be affected by
-74-

Dependent
Variable
Nurses Age
17-39 as
Proportion
of All
Nurses
Table 5-5
Estimated Regression Coefficients, Examining Hospital Coefficients for Age Differences
e>..,
..,4i.6
e.,
n.c
oc"
,1411;.,Y
44
'Y-4
4.c.,
49 q
r4,
44
4-.
Iv4
c./
0IN,
c./
IVcp
.,..
sP A
z)co
Wage
Variables
0Ao
40e40
40V
V441v
cA
-"k4
-4q
'Yai
,,t`i
0 40
17
4'4- ,,,,
e0
0 qy
ivA
t4
^V 4
I'Y4
0 A
et)
Zi
4. 0
4o
44et
,o
..,41
,0>
AP4'
;#;#
vR2
41*.
-T.-
*I
*i
**
*.260
(1.94
.009
(.53)
.055
(1.63)
-.001
(-.56)
.044
(.99)
.247
(1.93)
.100
(2.37)
-.063
(-1.86)
.32
1.50
*.496
(1.56)
.004
.066
-.0003
-.116
.045
-.058
.0003
.28
1.64
(.07)
(1.46)
(-.28)
(-1.67
(.73)
(-1.38)
(.69)
***
-.113
(-.38)
.020
(.34)
.032
(.72)
.0002
(.16)
-.025
(-.43)
.251
(1.89)
.037
(.57)
-.096
(-2.40)
.001
(1.49)
.38
2.50
Numbers in parenthesis are
t-statistics
*Significant at 10% level
**Significant at
5% level

the age of the employee. The age distribution variable used in the re-gressions was defined specifically to be appropriate for the effect ofmaternity leave. However, it does provide a gross measure for other ef-fects. Hospitalization and major medical insurances carry positive coef-ficients. Younger employees may be less likely to use both of these in-surances. Employers would then prefer to hire young employees when of-fering these insurances while older employees would prefer to work wherethese insurances are offered. The positive coefficients on these vari-ables indicate that hospitals offering hospitalization and major medicalinsurance have a higher proportion of nursing personnel ages 17 to 39,again suggesting that the demand effect dominates.
Pension, the other variable in these regressions which has a coef-ficient significantly different from zero, has a negative coefficient.This suggests that hospitals offering a pension plan have a lower pro-portion of nursing personnel ages 17 to 39. Hospitals offering pensionplans may prefer to hire young employees who may have a lower probabi-lity of continuing employment long enough to collect pension benefitswhile older employees who may have a higher probability of colle;tingpensions benefits may prefer to work for hospitals having pension plans.If the supply and demand effect alone is at work, the negative cucffi-cient with the pension variable suggests that the supply effect domi-nates. These effects, however, may be moderated by the presence ofvesting provisions in pension plans which would mitigate the age-relateddifference in the probability of collecting pension benefits. In addi-tion pension plans may carry provisions which require some length ofemployment before collection of benefits is possible. To the extentthat such provisions are found in pension plans in hospitals, hospitalsmay prefer to hire workers who are old enough to preclude their eligi-bility for pension benefits. Finally, pension plans are thought of asa means of reducing turnover. The negative coefficient estimated withthe pension variable may indicate that they have been successful in re-ducing turnover, if the age distribution variable is associated wi.hjob tenure. Although it is not possible to investigate this relation-ship further with the hospital data available here, the relationshipis suggestive.
None of the other fringe benefit variables have estimated coeffi-cients which are significantly different from zero. This does not nec-essarily imply that supply and demand effects are not operating withrespect to these variables. It may indicate that the effects are off-setting. Both the number of sick days and the presence of long termdisability insurance may be benefits where the probability of collec-tion increases with age. To the extent that supply and demand effectsare operating, however, they appear to be offsetting.
The discussion presented here is based on regressions using theprimary data set. A similar examination of the secondary data set wasnot possible due to the limited age distribution available for it.
-76-

5.4 Examination of the Hospital Data for a Substitution Effect
We turn now to an examination of the hospital data for the substi-tution effect discussed in Chapter Two. There it was hypothesized thatan additional cost in a fringe benefit, specifically in the temporarydisability policy resulting from treating maternity leave as a temporarydisability, may result in a decrease in other fringe benefits. Theexamination of the data reported here is descriptive in nature, designedto suggest some of the relationships existing between the fringe bene-fit offerings. As noted earlier, the preferred data is data on the costof provision of benefits. In the absence of cost data, however, it isat least possible to identify relationships with respect to the gross pro-vision cf fringe benefits.
We begin this discussion with an examination of the simple corre-lation coefficients. Table 5-6 shows these coefficients. Making use ofthe fact that a variable Z defined as
1+TZ = 1/2 loge
1-r
where r = calculated correlation coefficient is distributed approx-imately normally with mean and standard deviation:
l+puZ = 1/2 loge
1
ti"="3.'r
p
where p = true correlation coefficientn = number of observation
It is possible to construct a test under the null hypothesis that the truecorrelation coefficients, p, is equal to zero opposed to the alternate hy-pothesis that it is not equal to zero.13 This was done for each calculatedcorrelation coefficient and the results are indicated in Table 5-6. It ispossible to reject the null hypothesis only for the correlation coefficientsbetween pension and sick days, pension and hospitalization, pension and long-term disability insurance, hospitalization and life insurances, surgical in-surance and life insurance, and long term disability and life insurance; ex-cept for pension and sick days these calculated correlation coefficients areall positive. Although it is a substitution effect we have postulated here,these results indicate that some of the fringe benefits may be complements.Only pension and sick leave appear to be substitutes.
13Paul Hoel, Introduction to Mathematical Statistics, New York: John
Wiley and Sons, 1962, p. 166.
-77-
88
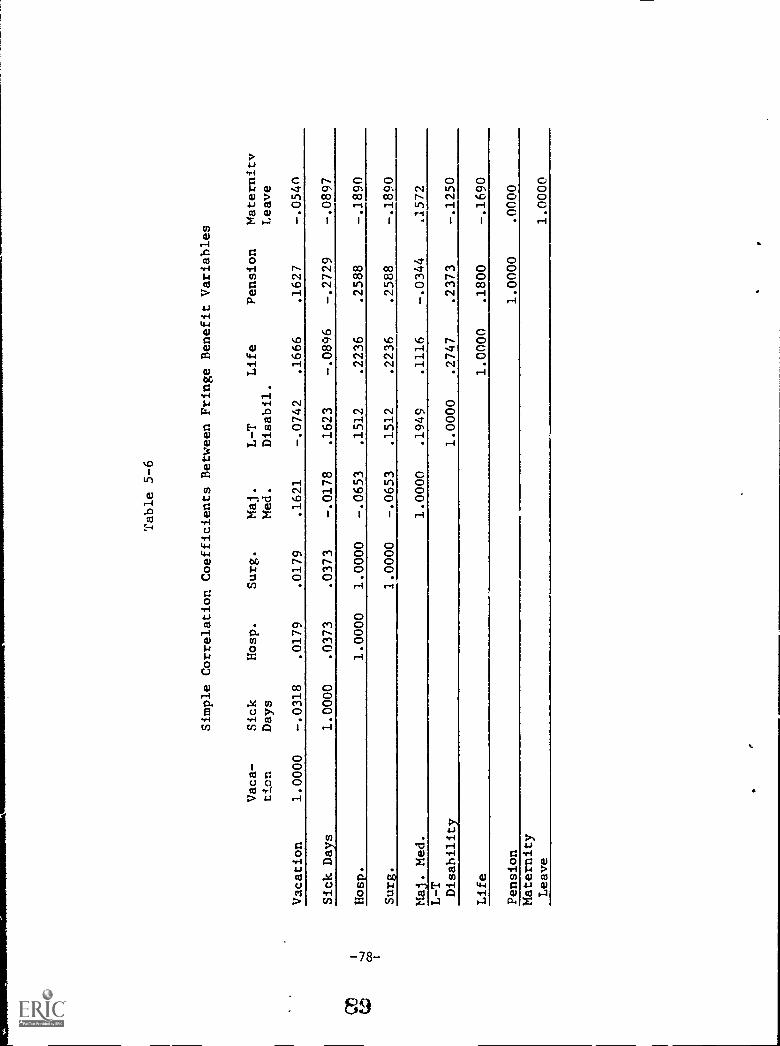
Table 5-6
Simple Correlation Coefficients Between Fringe Benefit Variables
Vaca-
t4^r.
Vacation
1.0000
Sick
Days
-.0318
Hosp.
.0179
Surg.
.0179
Maj.
Med.
.1621
L-T
Life
Disabil.
-.0742
.1666
Pension
.1627
Maternity
Leave
-.0540
Sick Days
1.0000
.0373
.0373
-.0178
.1623
-.0896
-.2729
-.0897
Hosp.
1.0000
1.0000
-.0653
.1512
.2236
.2588
-.1890
Surg.
1.0000
-.0653
.1512
.2236
.2588
-.1890
Maj. Med.
1.0000
.1949
.1116
-.0344
.1572
L-T
Disability
1.0000
.2747
.2373
-.1250
Life
1.0000
.1800
-.1690
Pension
1.0000
.0000
Maternity
Leave
1.0000

Fringe benefits may be related to each other in ways which are notcaptured in these simple correlation coefficients. This could occur ifgroups of fringe benefits tend to be substituted for other groups offringe benefits. To examine this more directly each of the fringe bene-fits were regressed on all of the others. Table 5-7 shows the resultsof these regressions. For maternity leave, the fringe benefit of inter-est, no fringe benefit carries an estimated coe_ficient significantlydifferent from zero, suggesting that maternity leave treated as a tem-porary disability is not offset by any other benefit and no other bene-fit is offset by maternity leave. Of the other fringe benefits vaca-tion and life insurance also seem not to be related to provision of otherfringe benefits.
The number of sick days is negatively related to pension and hospi-talization and long-term disability insurances are positively related topension plan. These relationships are the same direction as those indi-cated by the simple correlation coefficients. The hospitalization insur-ance-pension plan relationship appears to be the strongest of the three,indicating a strong tendency for these two benefits to be offered together.The size of the other two coefficients indicates a less strong relationship.In addition to being positively related to retirement benefits, long termdisability insurance is positively related to provision of major medicalinsurance. Again, this relationship is similar to that noted by the simplecorrelation coefficient. These results suggest that in general fringebenefits do not substitute for one another nor do they have a complemen-tary relationship. It does appear, however, that retirement benefits, hos-pitalization insurance, and long term disability insurance tend to be offer-ed as a package. Long term disability insurance tends to be offered as apackage with major medical insurance.
The relationships seen in these regressions confirms the complemen-tary relationships indicated by the simple correlation coefficients. Thesecomplementary relationships may be the consequence of providing differentfringe benefits to insure against different phases of the same economichazard. This may be the case with the complementary relationship betweenmajor medical insurance and long-term disability insurance. The major medi-cal insurance provides protection against medical pr)blems generally of asevere and serious nature sufficient to cause extensive medical expense.Long-term disability insurance provides income protection in the event ofillness or injury which requires an extensive absence from work. These twoinsurances taken together provide relatively complete protection in the caseof serious and debilitating illness or injury. The provision of other fringebenefits may be viewed as a social obligation. Donna Allen has suggestedthat the growth in health and pension plans has been partly the result of agrowing belief that the employer incurs a social obligation for the welfareof his employees.14 To the extent such a belief exists svbstitution possi-
14Allen, o.26.
-79--
90

Table 5-7
Estimated Coefficients From a Multiple Regression in which Fringe Benefit Variables are Regressed Against All Others
'NP
No
4b.
rA,
A
141.
43Dependent
S.
"i
Variable NP,
4b,
vINC
\ e
/ l'I041
0
0'N*
to
f(;!'
**if
'iti
qit.,1..t9
h4b
04v
oc
Vacation
.004
(.6657)
-.145
(.5747)
.303
(.2859)
-.328
(.7358)
.447
(.1525)
-.329
(.1925)
.470
(.1506)
1.649
(.0930)
R" = .1018
Sign
of F u .5210
R2 = .1567
Sign
of F = .2005
Sick Days
.863
(.6657)
-1.565
(.6753)
-3.798
(.6385)
10.750
(.5457)
-2.333
(.6202)
6.719
(.0643)
-12.06
*(.0101)
14.17
(.6673)
Maternity
Leave
-.041
-.002
-.209
-.516
.228
-.051
.097
.879
*
R-',
= .1047
Sign
(.5747)
(.6753)
(.1628)
(.3202)
(.1718)
(.7093)
(.5908)
(.0933)
of
= .5003
Life Ins.
1.068
-.004
-.165
.533
.100
.173
.043
-.023
Pu .1678
Sign
(.2859)
(.6385)
(.1628)
(.2455)
(.5136)
(.1487)
(.7812)
(.9609)
of F
.1591
Hasp. Ins.
-.006
.001
-.035
.046
-.017
.008
.083*
.902*
-----ii7 . .1370
Sign
(.7358)
(.5457)
(.3202)
(.2455)
(.7097)
(.8133)
(.0639)
(.0001)
of F = .2931
Maj. Med.
.081
-.002
.145
.080
-.155
.184*
-.116
.716*
R2 = .121
Sign
(.1525)
(.6202)
(.1718)
(.5136)
(.7097)
(.0836)
(.5825)
(.0865)
of r = .3900
L-T Disabil.
-.092
.009
-.050
.214
.118
.284
.363
-.155
R= .2031
**
Sign
(.1975)
(.0641)
(.7093)
(.1487)
(.8133)
(.0836)
(.0333)
(.7671
of F = .0708*
Pension
.078
-.009*
44,
.056
.012
.715*
-.106
.215*
.007
----K2 = .2491
Sign
(.1506)
(.0101)
(.5908)
(.7812)
(.0639)
(.5825)
(.0333)
(.9844)
of F = .0211*
Values in parentheses
are significance of t-statistics
Nu63

bilities between these fringe benefits are limited, and the positivecorrelation is spurious.
In addition to these regressions which simply estimate the rela-tionships among fringe benefit offerings with no controls for outsideinfluences, a series of regressions using each of the fringe benefitvariables as the dependent variable and the other fringe benefits, wages,and the control variables discussed earlier as independent variables.The results of these regressions are identical to the results of thefringe benefit regressions discussed above. Provision of retirementbenefits appear to be complementary to provision hospitalization insur-ance and long-term disability insurance and substitutes for the numberof sick days. Provision of long-term disability insurance tends to beoffered as a package with major medical insurance as well. Other fringebenefits appear to be unrelated to each other.
These regressions were duplicated with the secondary data set.Results are shown in Appendix D. They do not differ from results ofregressions using the primary data set.
5.5 Examination of the Hospital Data for a Wage Effect
We turn finally to an examination of the hospital data for a wageeffect. The hypothesis is that, given fringe benefit offerings, hos-pitals offering maternity leave treated as a temporary disability oughtto offer lower wages than hospitals not treating maternity leave as atemporary disability. Earlier the annual cost of maternity leave peremployed female for hospitals having a compensated temporary disabilityplan not treating maternity leave as a temporary disability was calcul-ated at between $17 and $67 for an eight week average absence from workdue to childbearing, and depending on the assumption about the length ofcompensated absence available. If the full cost is offset in wages, thenthe average difference in monthly wages between hospitals treating mater-nity leave as a temporary disability and hospitals not treating maternityler.ve as a temporary disability ought to be between $1.42 and $2.08.
Multiple regression analysis is used to examine the hospital datafor a wage effect. The hypothesized relationship i-:
w= Bo BF +yC+
where:
w = wage variable
F = vector cf fringe benefit variables
C = vector of control variables
-81-
92

As in the previous sections there is no causal relationships implied bythis specificaiton. It simply estimates descriptive relationships. Lifeinsurance, surgical insurance, major medical insurance, long-term disabi-lity, and retirement plan enter as binary variables taking on the value 1if the benefit is offered and the value 0 if the benefit is not offered.Because in the primary data set hospitalization insurance is perfectlycorrelated with surgical insurance it is not entered in the equation. Thevacation variable enters as the number of weeks offered after one year ofservice. Employees exempt from overtime payments, including all nursesand clerk-typists, often receive more vacation than employees eligible forovertime payments, including nursing assistants and maids. The appropriatenumber of weeks of vacation is defined as the number of days of paid sickleave granted per year. The maternity leave variable, the variable of in-terest, enters as a binary variable taking on the value 1 if maternityleave is treated as a temporary disability and the value 0 if it is nottreated as a temporary disability.
There are four control variables used. The natural population ofthe city in which the hospital is located is used to control four condi-tions such as transportation costs, disamenities (or amenities) of largecities, and cost of living differences. The median housing rent is usedto control differences arising from cost of living differences. A unionvariable entering as a binary variable taking on the value 1 if a unionis present in the hospital and the value 0 if a union is not presentin the hospital is used to control for the possible effect of unionson wages. Finally, a variable defined as the proportion of full time nur-sing personnel who are between the ages of 17 and 39, the main childbearingyears, is used. This variable is entered by itself and interacted with thematernity leave. Entered by itself this age distribution variable shouldcontrol for wage differences resulting from productivity differences whichvary with age in hospitals. In the discussion of the firm reaction tomaternity leave in Chapter Two it was suggested that firms with a low pro-portion of female amployees subject to the risk of pregnancy can offer ma-ternity leave treated as a temporary disability while experiencing a verysmall increase in the cost of the temporary disability policy. The inter-action between maternity leave and the age distribution variable is anattempt to capture this effect.
If the cost of maternity leave is reflected in wages the sign on thecoefficient estimated with the maternity leave variable ought to be nega-tive. Because the cost of maternity leave increases as the proportion offemales of childbearing age increases the interaction term for maternityleave and the age distribution variable ought to have an estimated coef-ficient that has a negative sign. However, since the nomthly cost of ma-ternity leave is small the estimated coefficients should be small.
These are the variables of interest for an examination of hospitalwage relationships to maternity leave, but it is also possible and of in-terest to examine signs of the other fringe benefit variables. If thecost of the other fringe benefits is reflected in wages the signs on theestimated coefficients on all the fringe benefit variables ought to benegative. To be consistent with the Rice conclusions, however, we might
-82-
93

expect a positive relationship between wages and fringe benefits whichare subject to preferential tax treatment, i.e., health, life and long-term disability insurances, and pension or retirement plans. The turn-over effect noted by Rice is not explicitly controlled for here. However,to the extent that turnover is related to skill levell5 we implicitlycontrol for skill level by estimating the regression equations separatelyfor each occupation.
Regression equations were estimated separately for each of the sixoccupations using the base, maximum, and average monthly wages as the de-pendent variables. All the estimated equations are reported in AppendixD. Here the discussion of the results will be limited to two of the esti-mated regression equations, one using degree nurses average monthly wagesas the dependent variable and one using diploma nurses average monthly wagesas the dependent variable. The results using these two variables as thedependent variable are typical of all the regression results.
Table 5-8 shows the estimated coefficients and statistics for theseequations. As can be seen from the table none of the fringe benefit vari-ables have estimated coefficients significantly different from zero exceptthe binary maternity leave vaLiable and the maternity leave-age distributioninteraction variable. The sign on the estimated coefficient with the binarymaternity leave variable is negative which implies that in the presence ofmaternity leave the wage is lower. This is in accordance with expectations.However, the sign on the estimated coefficient with the maternity leave-ageinteraction term is positive. The estimated coefficient with the maternityleave-age distribution interaction variable and the estimated coefficient forthe age variable should be summed to obtain the age distribution coefficientin the presence of maternity leave treated as a temporary disability whilethe age distribution coefficient alone is appropriate in the absence of ma-ternity leave treated as a temporary disability. The estimate of the agedistribution coefficient alone is negative but the estimate of the materni-ty leave-age interaction coefficient is sufficiently positive to make theage coefficient positive in the presence of maternity leave. This suggeststhat although wages decline as the proportion of young female employees in-creases when maternity leave is-not treated as a temporary disability. Thisrelationship is the reverse of that expected.
The size of the coefficients on the maternity leave variable and thematernity leave-age distribution interaction variable imply that when ma-ternity leave is treated as e temporary disability, a hospital with the pro-portion of nurses ages 17 to 1:9 equal to the mean proportion pays an averageof $16.01 per month more to degree nurses and $5.04 per month to diplomanurses. Although these are not large differences, they are opposite ofthe expected relationship.
15See Jacob Mincer, "On the Joh Training: Costs, Returns and Implica-
tion," Journal of Political Economy, Oct. 1962, Supp
-83-
94
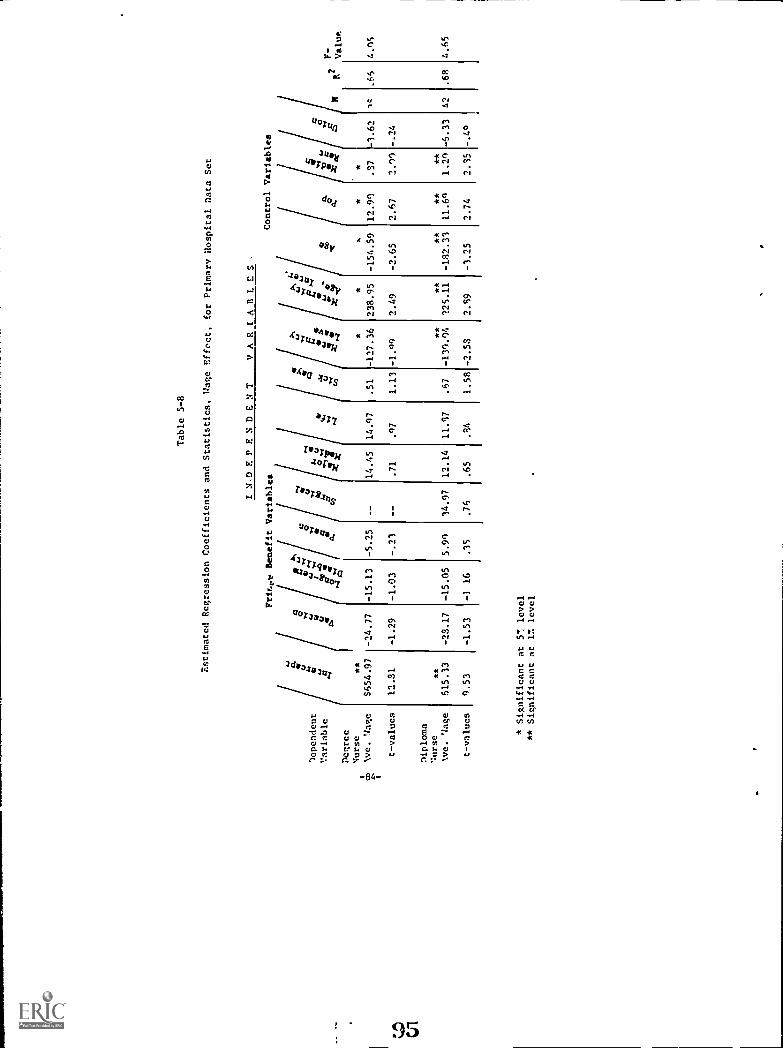
Table 5-8
Estimated Regression Coefficients and Statistics, Wage Effect, for Primary Hospital Data Set
'le pendent
Variable
Degree
gurse
\ve. Wage
t-values
0iploma
s:urse
We. Wage
t-values
a.
4 a **
$654.97
12.31
**
615.33
9.53
Prftrr
a
-24.77
-1.29
-23.17
-1.53
benefit
4:1
1
-15.13
-1.03
-15.05
-1 16
Variables
C 0 st
41'
4
-5.25
-.21
5.99
.15
I N.DEPENDENT
VARIARLES
Variables
*
12.90
2.67 **
11.69
2.74
24' *
.S7
2.Y)
1r*
1.2n
2.35
-1.62
-.24
-6.33
-.49
^I f 0 st e0 4
CC
'14.97
.76
14.45
.71
12.14
.65
14.97
.q7
11.17
.14
.51
1.13
.67
1.58
*
-127.36
-1.'
**
-139.04
-2.53
"
*
238.95
2.49
**
125.11
2.19
Control
-154.59
-2.65
**
-132.31
-1.25
* Significant at 5 level
** Significant at 1% level
Because the results with respect to the maternity leave-age dis-tribution action variable are contrary to expectations further exami-
nation of the relationship between wages and maternity leave and age oEemployees seems warranted. The values for the age distribution and ma-ternity leave variables can be thought of as defining four categories ofhospitals: 1) hospitals treating maternity leave as a temporary disa-bility and with the proportion of nurses ages 17-39 less than the meanproportion of nurses ages 17-39 for all hospitals; 2) hospitals treat-ing maternity leave as a temporary disability and with the proportionof nurses ages 17-39 greater than the mean proportion: 3) hospitalsnot treating maternity leave as a temporary disability and with the pro-portion of nurses ages 17-39 less than the mean proportion; 4) hospi-tals not treating maternity leave as a temporary disability and vAtilthe proportion of nurses ages 17-39 greater than the mean proportion.An alternative specification which is simply the formation of three bi-nary variables, one for each age category in the presence of maternityleave and one for hospitals not treating maternity leave as a temporarydisability and with the proportion of nurses ages 17-39 greater thanthe mean proportion. Coefficients estimated with these binary variablesare deviations from the estimated constant term, which represents thefourth category estimated on this data. This specification allows separ-ate estimation of mean wage relationships for each of the four categor-ies. In this specification we expect wages to be higher among hos-pitals not treating maternity leave as a. temporary disability. Amonghospitals who do offer maternity leave as a temporary disability we ex-pect wages to be higher when the proportion of nurses ages 17 to 39 isless than the mean.
Table 5-9 shows the estimated coeificients for this specificationusing degree nurse, average wage, and diploma nurse, average wage. For
comparison purposes the original specification estimates are shown aswell. As can be seen the only estimated coefficient that is significant,i.e., a significant deviation from the estimated constant, is the one es-timated for the binary variable representing the case when maternity leaveis not treated as a temporary disability for hospitals have a proportionof nurses ages 17 to 39 greater than the mean proportion. The relativemagnitudes of the effects are not as expected. Wages appear to be highestin hospitals having a relatively young labor force and also offering ma-ternity leave treated as a temporary disability and lowest among hospi-tals having a relatively young labor force but not offering maternityleave treated as a temporary disability. This is the reverse of expectedrelationships.
Several possible explanations can be offered here for this anomolousresult. The wage differentials between hospitals may be in the process ofnarrowing but equilibrium has not yet been achieved. This explanation re-quires time series data to be thoroughly examined. It is possible that theobserved relationship is the result of productivity differences betweenyoung nurses and older nurses. Young nurses may have higher productivity,thus commanding higher wages and fringe benefits, including maternity leavetreated as a temporary disability. To accept this explanation it is neces-
-35-
96

Degree
Nurse, Average
Wage
Four
Intercepts
654.97
-154.59*
238.95*
-127.36*
624.39
-33.48**
10.23
-8.54
Original
Specification
Table
5-9
Estimated
Alternative
Wage
Relationships
""t'f\P
1')\.T
.4
2'
00
00
0)
00
4-
,...,
A)
00
.0
.
4,
,.
,,
N7
..?
,,
4,
4-
t,
0,4
.4)
'A)
'>
4,
4.,
0.,0
,..:
4,
-s-
....,
.,..,
,
4,
I0\
4-
co
40
C.,
S'-'
/44
..t.el
41,',0
At,
A,
/,..
A,
Jil
Diploma
Nurse,Average
Wage
Original
Specification
Four
Intercepts
615.33
-182.33**
225.11**
-182.33
549.29
-52.38*
-17.49
-20.77
*Significant
at
10%
level
**Significant
at
5%
level
Significance
levels
are
for
deviations
lEstimated
Constant
2For
degree
nurses
=580.91,
for
diploma
nurses
=496.91
3For
degree
nurses
=615.85,
for
diploma
nurses
=528.32
4For
degree
nurses
=634.62,
for
diploma
nurses
=531.80
sary to assume that the greater productivity normally thought to hethe result of experience and therefore more likely to be present inolder nurses is more than offset by improved training and thereforehigher productivity of young nurses.
One final possible explanation is that high wages, offering ma-ternity leave treated as a temporary disability, and a young laborforce could all be indications of an expanding labor force. If thisis the case some indication of expansion may be given by employmentgrowth rates in hospitals. We would expect hospitals offering ma-ternity leave and having a relatively young labor force to have thehighest employment growth rate over the five year period 1968-1972.Table 5-10 shows the rate of growth in employment in hospitals fall-ing into each of the four cases noted above. As can be seen, thelowest growth rate is seen among hospitals offering maternity leavetreated as a temporary disability and having a relatively young la-bor force. Tais suggests that if the expansion effect is working,it is not seen in the employment growth rates.
In fact, all of the explanations offered here may be workingtogether. The available data do not allow further investigation ofthis relationship. It remains a puzzle.
In this section the discussion has dealt exclusively with therelationships between maternity leave treated as a temporary disabi-lity. The regressions also estimated the relationships between otherfringe benefits and wages. None of the other fringe benefits have sig-nificant estimated coefficients. This is surprising since maternityleave is not the most costly of the fringe benefits. Rice and Baileyand Schwenk found significant positive relationships between wages andfringe benefits. These results are immediately suspect because of thepossibility of multicollinearity between the fringe benefit variables.If multicollinearity exists the significance levels of the fringe bene-fit coefficients would be low but taken as a whole the fringe benefitvariables would be significant.
The discussion of the relationships between fringe benefits pre-sented earlier indicates that most of the fringe benefits are not re-lated to each other. In these wage regressions it is possible to ex-amine this possibility by constructing a statistic:
SSRu - SSRc n Um = { } {
SSEu
U c
where SSRfl is the sum of the squared residuals in the original regres-ion, which includes all the fringe benefit variables; SSR is the sumof the squared residuals in a regression which excludes all the fringebenefit variables; SSEu is the total sum of squares in the original re-gression; n is the number of observations; U is the number of fringebenefits in the original regression; and C is the number of fringe bene-
-87-
98

Table 5-10
Rate of Employment Growth in Hospitals, 1968-1973
Type of Hospital Employment Growth, 1968-1973
Absence Proportion of Nursesof 17-39 Less Than Mean 20.76%
MaternityLeave Proportion of Nurses
17-39 Greater Than Mean 29.43%
Presence Proportion of Nursesof 17-39 Less Than Mean 25.82%
MaternityLeave Proportion of Nurses
17-39 Greater Than Mean 14.23%
-88-
99
fits excluded in pe constrained regression. This statistic is distri-buted Fu -c n-u. u Using this statistic, under the null hypothesis thatthe coefficients on the fringe benefits are jointly equal to zero and thealternative hypothesis that they are not jointly equal to zero, it is notpossible to reject the null hypothesis at the 20% level. Table 5-11 showsthis test for the two regressions with degree nurse, average wage, anddiploma nurse, average wage. A similar test was conducted also excludingunion variable with similar results.
Data in the secondary data set is less detailed for age distributionsand wages. This lack of detail requires that the regressions be specifiedslightly differently and precludes the examination of the age-maternity'eave relationship to wages. The fringe benefit variables used in regres-sions on this data are specified as before. The control variables are spe-cified as before except that the age variable is not used. A new controlvariable is specified as the number of beds per nurse. No interaction termbetween age and maternity leave is used. There are two different wage ratesused as dependent variables. They are average hourly wage for nursing per-sonnel, and average hourly wage for clerical personnel. None of the esti-mated coefficients for the fringe benefit variables are statistically dif-ferent from zero. Both the median rent variable and the beds per nursesvariable have positive coefficients which are significant. F-tests simi-lar to those described above were performed. The F-statistics do not allowrejection of the hypothesis that the excluded fringe benefits have zero co-efficients. The regression results and F-statistics for this data set areshown in Appendix D.
5.6 Summary of Results of the Examination of Hospital Data
Three hypotheses about relationships between maternity leave treatedas a temporary disability, other fringe benefits, and wages have been ex-amined in this chapter using hospital data. It was suggested in ChapterTwo that the age distribution of female employees in hospitals offeringmaternity leave treated as a temporary disability may differ from that inhospitals not offering maternity leave treated as a temporary disability.The way the age distributions differ depends on whether the labor supplyeffect or the labor demand effect predominate. The analysis of the hospi-tal data suggests that when maternity leave is treated as a temporary dis-ability the proportion of nurses who are ages 17 to 39 is lower than whenmaternity leave is not treated as a temporary disability. This resultsuggests that among these hospitals the labor demand effect overwhelms thelabor supply effect.
16Jan Kmenta, Elements of Econometrics, New York: MacMillan Company,
1971, p. 370.
-89-
100

Table 5-11
F-Test Results1
R2 with R2 with- R2 without F-value F-value with-fringes out fringes fringes without out fringes
and union fringes and unionDegree NurseAverage Wage .617 .383 .370 1.037 1.01
Diploma NurseAverage Wage .629 .390 .383 1.24 1.15
1Under null hypothesis bl = 1),) = b3 = b4 = b5 = b6 = b7 = b8 = 0
F6,46 at the 57 level = 2.29
-90-
101

Finally, the hospital data was examined for a wage effect. It was
found that wages vary directly with the age distribution when maternity
leave is treated as a temporary disability. Wages vary inversely with
the age distribution among hospitals who do not treat maternity leave as
a temporary disability, although this relationship is at least in part
the result of extreme values on the age and wage variables among a few
hospitals. This estimated behavior is contrary to expectations and re-
mains a puzzle.
This chapter also looked at relationships between other fringe bene-
fits and wages. Generally, fringe benefits tend not to be complements or
substitutes with each other, although there are some expectations. In addi-
tion, wages and fringe benefits do not seem to be related.
-91--
102

CHAPTER SIX
Union Behavior With Respect To Fringe Benefits
The examination of union behavior with respect to fringe benefitsand women is undertaken for three reasons. First, labor organizationsare specifically covered by both the Equal Pay Act and VII of theCivil Rights Act of 1964. Where a union acts as an employer it mustnot violate any of the prohibitions imposed on employers generally.Beyond that, in its capacity as a union it may not exclude or expel frommembership or otherwise discriminate on the basis of sex. It must notlimit, segregate or classify membership or applicants for memberhsip, orclassify or refuse to refer any individual for employment so as to jeo-pardize an individual's employment opportunities, employer status or jobapplicant status on the basis of sex.' It must not influence or put pres-sure on an employer to discriminate unlawfully. Pressure has been inter-preted to include strike or picketing activities aimed at inducing an em-ployer to institute or maintain a prohibited wage differential or otherterms and conditions of employment, demanding terms or interpretations ofterms of a union contract with an employer which would require the employ-er to discriminate in payment of wages or other terms and conditions ofemployment contrary to legal requirements and negotiating with a wage dif-ferential or terms and conditions of employment with an emvloyer that areunlawful.2 It may not influence or attempt to influence to discriminateon the basis of sex in admission to, or employment ill any program esta-blished to provide apprenticeship or other training. In addition to thisspecific coverage in the legislation Revised Order No. 44 requires a unionmust cooperate with the employer in revising its collective bargaining a-greement if the employer must do so to comply. Because of this coverageit is useful to examine the extent to which unions are behaving in waysconsistent with equal rights legislation. Beyond this where there areunions their presence as the collective representatives of employees in
1Civil Rights Act of 1964, Title VII U.S.C. 200e-2(b) P3053.
2..-Wages & Hour Division Interpretive Bulletin on Equal Pay For Equal
Work" 29 CFR 800.106 P4750.106.
3Civil Rights Act of 1964 Ind Equal Pay A,..t of 1963, 29 U.S.C. 206(d)(2), P3213 (d) (2).
4Federal Register, Vol. 36, No. 234, Saturday, December 4, 1974.
103

matters concerning terms and conditions of employment can be a potentforce both in determining those terms and conditions through the col-lective bargaining process and in the day to day administration of thecontract through the grievance procedure. Since in 1970 women made up20.7% of union membership it is useful to examine the extent to whichthis has been a positive force in the area of equal rights for women.Finally union contracts and policies can provide some further indica-tions of the status of maternity leave in practice, and can help identi-fy other fringe benefits which may embody differential treatment on thebasis of sex.
6.1 Union Negotiated Contracts
The first point where unions may exert an influence is in union ne-gotiated contracts. Theoretically discrimination can occur in virtuallyany sort of contract clause. However, the Wage and Hour Division andEEOC have pointed out several areas frequently covered by union contractswhere discrimination on the basis of sex often occurs. Seniority systemsseparated explicitly by sex or by "light" and "heavy" jobs where "light"jobs are normally women's jobs are forbidden. Provision of health insur-ance where females are not permitted to avail themselves of the insuranceplan or some portion of it or are only allowed single coverage is viewedas discrimination. In addition any health insurance plan available com-pletely or in part only to "heads of households" or "principal wage-earner"is viewed as having the effect of discrimination on the basis of sex.Similar restrictions in the availability of other fringe benefits are for-bidden. Restrictions on the availability of training opportunities basedon sex are outlawed. This is not an exhaustive list but it does providesome guidelines in the examination of union contracts discussed below.
A number of factors affect whether or not a contract contains clausesthat discriminate on the basis of sex. Unions which contain few or nowomen may have contracts with no evidence of discrimination simply becausethis distinction is irrelevant. As women begin to enter non-traditionaloccupations and consequently become employees and members of some of theseunions circumstances may arise where the distinction on the basis of sexbecomes relevant. In the absence of the civil rights legislation and aslong as women are a minority of the membership this is a cheap thing fora union to bargain away in return for a gain in an area affecting all itsmembers. The presence of the legislation should inhibit this tendency,since it takes only a single female employee who feels discriminated againstto bring suit against both the union and the employer. Where women make upa larger portion of employees and union membership discriminatory clausesmay be more likely to have been embodied in contracts historically.
-9is-
104
Separate seniority clauses reflected state protective legislation for-bidding women from lifting certain weights and working excessive over-time, thus limiting women's eligibility for certain jobs.
They also reflected traditional view of men's and women's work andmale union members' desires to protect their jobs. Access to overtimebased on sex reflected similar considerations as well as the view thatwomen "needed" less income. Discriminatory provision of fringe benefitsreflected cost differences to the employer as well as the notion thatsince women were generally married fringe benefits were somehow less im-portant to them. Health insurance need only be made available to singlewomen, or, at best, only single coverage should be made available to fe-male members. Retired female employees have a husband's pension, so asmaller pension could be given to women. Wage differentials could bejustified on the same grounds. All of these represent some reduction inthe total cost of the compensation package as well. From a bargainingstrategy point of view the union might be willing to concede these dis-criminatory clauses if it meant the employer would be willing to improvethe benefits. As long as there was no legal sanction against discrimi-natory provisions and as long as female union membership either agreedwith the union rationalizations noted above or had little power in theunion one or more of these discriminatory clauses would likely appearin a contract. As legislation which outlawed these discriminatory clausesbegan to appear, and as women began to become more sensitive to the dis-criminatory nature of these clauses, they should begin to disappear. Insome cases employers would request elimination of the discriminatory por-tions of clauses. Elimination of separate seniority systems was in gen-eral costless to the employer but experience with racial discriminationshowed that if legal means were required to eliminate the separate sys-tem it could be expensive to the employer. In other cases a complaintbrought against the employer caused the contract to be amended. Unionswhere females make up close to a majority of membership may attempt tochange discriminatory clauses through bargaining. However, if removinga discriminatory clause implies the loss of a benefit or failure to gainan improvement the union is unlikely to make this demand, since it haslegal means available to it to insure that the discriminatory clause isremoved. Unions are unlikely to expend much bargaining capital to makegains which should legally exist. All of this suggests that discrimina-tory clauses are removed from contracts very slowly and we should seesome such clauses even ten years after the passage of legislation.
A separate but important development in contracts is the insertionof an anti-discrimination clause that includes sex. Clauses forbiddingdiscrimination on the basis of race, religion, or national origin beganto appear in the early 1960's. Occassionally other characteristics, in-cluding sex, were included, usually because union membership includedsome members of these groups. These clauses required anti-discriminationin administration of the contract and sometimes included anti-discrimina-tion in hiring practices of the firm. They were included prior to civil
-95-
105
rights legislation to emphasize anti-discrimination to both union andfirm and to encourage union members to more actively pursue their rightsunder the contract. After civil rights legislation was enacted theseclauses became more pervasive. Under legislation they not only serveto emphasize the rights of minority group employees, they also serve toindicate the intent of the union and firm and protect the anti-discrimi-natory sections of contract in case of litigation. Groups which had notbeen included before but were covered by legislation were added to theclauses. This includes sex. I discussed this possibility with Leon E.Lunden, Division of Industrial Relations, Bureau of Labor Statistics.Be pointed out that it was virtually costless to both union and firm toinclude the anti-discrimination clause and was not a controversial area.Administration of the clause was often a more difficult problem, but sincethe clauses were general and vague, they were often included. In my exam-ination of union contracts below I found a number of these clauses.
The provision of a separate maternity leave clause, distinct from thetemporary disability plan, bears separate discussion. Pregnancy occursonly in females and has traditionally not been viewed as a temporary disa-bility by employers. Where employers have female employees a policy forpregnancy and childbirth, generally separate from the temporary disabilitypolicy, has been developed. If that policy was dismissal, unions oftennegotiated the right to return to work for their female members. But ifthe policy was a leave without pay of specified length unions often agreedor even participated in the development of the policy. Because of the cur-rent nature of the guideline, because of the differences in nature betweenchildbirth and illnesses or injuries, and because provision of temporarydisability benefits involve a cost, I found a number of separate maternityleave policies specified in contracts.
There is some evidence bearing on contract clauses which distinguishon the basis of sex in a published examination of union contracts by Bureauof Labor Statistics (BLS). A 1972 BLS study of the administration of seni-ority in major collective bargaining agreements covering 1000 workers or moreshowed that in the 349 agreements in the sample only two were found to haveseparate seniority provision.5 This indicates that by 1972 seniority listsseparated by sex were not numerous. In a 1970 BLS study of characteristicsof agreements covering 5000 workers or more in a sample of 252 contracts 74provided for a leave of ai ence with out pay for maternity. The same study
5Bureau of Labor Statistics, Administration of Seniority, Bulletin
1425-14, 1972, p. 9.
-96-
106

showed 82 contracts with provision for paid sick leave.6
In a similarstudy of agreements covering 2000 workers or more done in 1972 an exam-ination of 620 agreements showed 198 with an unpaid leave of absencefor maternity and 195 with a paid sick leave provision.7 These studiesdo not indicate how many contracts provide for both an unpaid maternityleave and a paid sick leave, but surely some do.
in 1961 BLS examined 1717 major collective bargaining agreementscovering 1000 or more workers for anti-discrimination clauses. It foundthat 307 (18% of all contracts) contracts had anti-discrimination clauses
mentioning race, creed, or national origin and of these, 179 (10% of allcontracts) included sex.8 Since the study was aimed specifically atclauses including race, creed, and national origin, it did not includeclauses not mentioning one of these three. There may have been a fewclauses including sex that were missed. In 1972 BLS in its examinationof 620 agreements covering 2000 or more workers 528 (85%) had some sortof anti-discrimination clause and 331 (53%) included sex.9 These samplesare not strictly comparable, but they do indicate a growth in anti-discrim-ination clauses in general, and anti-discrimination clauses covering sexin particular.
These sources provide some hints about how union contracts reflectequal rights legislation. To get a better picture, however, I examined100 agreements covering private sector employment in Wisconsin. These con-tracts were obtained by request to a random selection of 1486 locals listedin the Register of Reporting Labor Organizations." Table 6-1 shows theunions whos,: agreements I examined. In many cases I received only the mainagreement, not including the detailed benefit descriptions so some of thebenefit plans may include discriminatory provisions not noted in my exami-nation. I examined these agreements in their entirety noting specific re-ferences to distinctions made on the basis of sex. Of course, a distinctionoccurring in the administration of the provisions but not specifically men-tioned in the provision will not be noted. I found 43 of the 100 contracts
6Bureau of Labor Statistics, Characteristics of Agreements Covering
5000 Workers or More, Bulletin 1686, 1970, pp. 44,48.
7Bureau of Labor Statistics, Characteristics of Agreements Covering
2000 Workers or More, Bulletin 1729, 1972, pp. 45,51.
8Bureau of Labor Statistics, k.zi-discrimination Provisions in Major
Contracts, Bulletin 1336, 1961, p. 5.
9Bureau of Labor Statistics, Characteristics of Agreements Covering
2000 Workers or More, Bulletin 1729, pp. 17-18.
10Register of Reporting Labor Organizations, 1971, U.S. Department ofLabor, Office of Labor Management and Welfare-Pension Reports, 1971.
-97-
107

TitV.1 1. i, -I
NO, ."..." ":( 1...r:) I 14.1, I_
3 ".1: 3 lg--;, i '{.1 2 3I il.cry I.T. 1. ; ; 2 60, (..,0
3 22 3 "0 0 1
. Is, ; . T. r.. 3 31 240 32.re.....; y l'.;.-T.t. r:. I 4 , 7'i9 1(IL', 1 231, fig) I 3I I"T 2 10,, of-;fi I. 1Opt.r.,i IN,' i =l,cers 1 IVA 11:41,Z Go; i ;":, 7 353, 0 1 2IT.ii e3 ; 1T(- i ciri.i.i. $ 1://.3 010/14;.. t 1,. (T; c_;i; 1 1,130 1All: 1 :30,800
1J E ) t ;.;,...- 1'; on; 1 1://. 0Li: I, .- ., 1: r: C.
ri:.T.., .c.,/,:.....r., 2 30LT 2
1". (1..1 t...i's 2 61,79 10 1 1 1 ce £. i't-of . 9 57,790 4 8011 (T:i 1. ,1 ("T.
I.Att. it, o ,-..--r::1 7,010 0
ViiicT . ;r 3 11/A 0l'ul I; :. L. . c :To dc r;;
Yri 1://V1 32Pulp, St:1I it r; /, Plicr
11111
i 6.3erl-s 110,0:4' 01 (1 CT 2 /1://" 0 2c or? 3 0
1.i c.1;..A r'. 1 120,00 115 25; Ocri 5
T I S.-,,
73 , 200 0'P' r. 0
11p1 71,/.5 0i L., I -,;1. y 6 352,250 3 3; , 1 11/4 1
"I I i 1 01(.1(4;1-del, r. 1 32,650 0 1
t I ;r4. ;Ilan PrrIlipS of I .1. t !p. tir..",1 titly*1 .;#111 )24,1 V((is$1, 071;it I I.L. t.:Ct 1(1 ii. 17:)(1
-98-
108

contained an anti-discrimination clause and 42 of these included sex.Two of the contracts had a second clause pledging adherences to the EqualPay Act and Title VII in addition to an anti-discrimination clause. Thisis important since, as discussed below, the simple existence of an anti-discrimination clause may not be enough to allow an arbitrator to strikediscriminatory contract clauses. Four had special provisions aimed at,assuring equal opportunity. Two of these noted that where the male pro-noun was used it was to be construed to mean both genders. Oiie pledgedthe company to examine promotional lines in an effort to assure equal op-portunity. One pledged the company to study contract provisions to assure
that no distinction-was made on the basis of sex, particularly in job class-if ication.
Despite these assurances of anti-discrimination there are some dis-criminatory clauses. In the 100 contracts, three provided some sex ormarriage qualification on the availability of family coverage health insur-ance for wives of employees only, and one made a distinction on the basisof sex in pension provision. There were 33 contracts which specificallymentioned maternity leave. Of these 28 provided for an unpaid leave of ab-sence of a specified length and also had a paid temporary disability plan.Five maternity leave policies were identical to the temporary disabilityplan. Of those agreements not specifically mentioning maternity leave itis impossible to know now maternity is treated.
I could not obtain any information about the number of women coveredby these agreements. Table 6-1 indicates the approximate national femalemembership by union. While this does not give the relative number of femalesby unionli it does provide some hint about distribution of anti-discrimina-tion clauses and separate maternity leave clauses. Table 6-2 shows the num-ber of anti-discrimination clauses and maternity leave clauses by size of fe-male membership nationally in unions. The unions with more female membersare more likely to have anti-discrimination clauses including sex and a sep-arate maternity leave clause.
TABLE 6-2
Provisions of Contracts by National Female Membership
No. of Females No. of Unions No. of Contracts Anti-disc. Maternity
100,000 8 31 14 11
10,000-100,000 8 18 8 11
10,000 5 7 5 0
11I was unsuccessful in locating total membership by union.
-99-
109

While this examination of Wisconsin agreements is not definitive,it does provide some indications of how agreements reflect a bias ofsex. Provisions which make a distinction on the basis of sex are notunknown, but they are rare except in the area of maternity leave. Spe-cial provision for maternity leave appear frequently where female unionmembership nationally is highest.
6.2 The Influence of Arbitration Decisions and Court Cases
The examination of union contracts provides some evidence for oc-casions when unions have been party to negotiated and therefore stateddiscriminatory practices. But the existence of an anti- discriminatorycontract does not guarantee that discrimination on the basis of sex isnot taking place. The day to day administration of a contract can em-body the range of discriminatory practices. These may be in direct con-travention of the contract or, more frequently, they may be practicesnot directly dealt with in the contract. If informal discriminationoccurs the affected employee has two courses open to her. She may filea grievance through her union and/or she may file a complaint with EEOCand/or the relevant sta..: equal rights agency. Easy correction of in-formal discriminatory practices through the union grievance procedurepresupposes that the union processes the grievance. A local may choosenot to do so for several reasons. Females may be a politically unimpor-tant group in the local so that other grievances are viewed as more sub-stantive from the point of view of the local as a whole. Thus grievancesaffecting females only may be viewed as a nuisance and pushed to the endof the grievance list. This may occur frequently where local union lead-ership is male and relatively insensitive to employment problems of fe-males. Female union members have legal recourse, if the local refuses toprocess the grievance, either under the civil rights legislation or underthe Labor Management Relations Act, a- a union breach of contract, fail-ure to represent fairly, although thi,, may be a difficult step for a "good"union member since it implies bringing a suit against the union as wellas the employer. It has happened, however, and remains qn option. InDorothy Peterson et al. v. Rath Packing Company et al., la
two women em-ployees filed a suit against both the company and the union. The case
12In Wisconsin, the Equal Rights Division, Department of Industry,
Labor and Human Relations.
13Dorothy Peterson et al., Appellees v. Rath Packing Company et al.,
Appellants. No. 71-1364. U.S. Court of Appeals, Eighth Circuit, June 7,1972.
-100-
110

against the union arose out of the union's refusal to carry a grievanceover reclassification of "men's" jobs into jobs available to both sexesbeyond the second step. The court found that the union had indeed fail-ed to represent these women fairly in the grievance and the union sharedresponsibility for damages under the Labor Management Relations Act.
Unions may also choose not to push a grievance if it feels that theissue is a major one and involves questions of law that should be resol-ved in court. Arbitrators have at times been reluctant to deal with ques-tions of law when it can be avoided in the context of the contract, apoint which will be discussed in more detail below. At the same time thecourts have at times held that emplwees must choose whether to pursueaction in court or in arbitration. This is by no means a settled issuel5but a union or individual union member may prefer the court procedure aloneto settle a major issue. These considerations suggest that an examinationof arbitration and court decisions will not prove :, a perfect catalog ofdiscrimination occurring beyond the written contract and the way such dis-crimination has been handled by third parties.
Prior to the Civil Rights Act of 1964 arbitrators had a few cases in-volving problems of discrimination on the basis of sex. In cases wherethere was a conflict between the contract and the mandate of legislationarbitrators most frequently adhered to the principle that an arbitratorshould not require conduct contrary to law even though sanctioned by con-tract.16 Since most state legislation was protective legislation whichrequired special treatment for female employees17 this principle most often
1
--See, for example, Dewey v. Reynolds Metal Co., 6th Cir. 1970, 2FEPCases 687 or Corey v. AVCO Corp., No. 137-318, May 28, 1970. ConnecticutSuperior Court, Fairfield County. 2FEP Cases 738. In both cases the com-plaintant had lost in arbitration. Upon bringing suit in court the courtruled that to overturn the arbitrator would destroy the arbitration process.
15See Bowe v. Colgate-Palmolive Company, 416 F. 2d 711 (7th Cir. 1969),
reversing 272 F. Supp. 332 (S.D. Inc. 1967) and Hutchings v. U.S. Industries2 FEP Cases 725 (5th Cir., 1970), rev. U.S. D. Ct. E. Dist. of Tenn., 309 F.Supp. 691 2 FEP Cases 599 for two examples of zourts ruling that both arbi-tration and court procedure ought to be available for remedy.
16See Ford Motor Co., 1 LA 462 (1945), Harry Shulman or Pittsburgh
Corning Corp., 3 LA 364 (1964), C.W. Lillibridge.
17For example, state legislation often forbade female employees from
lifting over 40 pounds. Any job requiring lifting of over 40 pounds wasthus not available to women.
-101-

denied women access to certain jobs, regardless of contract provisions.The passage of the Civil Rights Act of 1964 made arbitration decisionsin this area more difficult. State legislation often was in conflictwith the Civil Rights Act. Initially EEOC accepted adherence to protec-tive state legislation as a bonafide occupational qualification (BFOQ)for discrimination on the basis of sex. Consequently arbitrators con-tinued making awards in favor of state law. However, in 1969, aftersome vacilation, EEOC issued a statement of policy that state laws regu-lating hours and weight lifting would no longer be accepted as a BFOQ.The response in arbitration awards has been mixed. Some arbitratorshave taken this into accountl° while others have maintained that it isnot within the scope of the arbitration process to repeal state laws19 ,20
A related issue among arbitrators is to what extent arbitratorsshould take into account the civil rights legislation, whether or not aBFOQ is involved. This is a particularly thorny problem when the con-tract contains a standard anti-discriminatory clause or the administra-tion of the contract has been done in a discriminatory way not specifi-cally covered by the contract. Alfred W. Blumrosen, in an article exam-ining arbitration on equal rights issues particularly after 1970, sug-gests that arbitrators have handled routine cases, i.e., discharge casesor cases of senior employees not being promoted, relatively responsibly.But in cases not specifically covered by the contract or where the con-tract embodies discriminatory clauses, the arbitrator will feel bound bythe contract. The staadard anti-discrimination clause is not sufficientto allow the arbitrator to interpret the contract to avoid discrimination,determine whether the contract as applied violates Title VII, advise par-ties of their duty to renegotiate the contract to eliminate discrimination,
21or reform the contract if parties fail to do so to eliminate discrimination.On this issue the Fifth Circuit Court has stated:
We hold that the federal district court in the exerciseof its power as the final arbiter under Title VII may followa like procedure of deferral under the following limitations.
18Braniff Airways, Inc., 48 LA 769 (1965) Weyer Haeuser Co. 54 LA857 (1970).
19Dayton Tire and Rubber Co., 55 LA 357 (1970).
20See Jean T. McKelvey, "Sex and the Single Arbitrator," Ind. and Lab.
Rel. Rev. 24:30, April 1971, pp. 335-353 for an excellent review of arbi-tration cases, particularly those dealing with the BFOQ issue, from 1950to 1970.
21Alfred W. Blumrosen, "Labor Arbitration and Discrimination" Arbitra-
tion Journal, 28:3 Sept. 1973, pp. 145-158.
-102-
112

First, there may be no deference to the decision of thearbitrator unless the contractual right coincides withrights under Title VII. Second, it must be plain thatthe arbitrator's decision is no way violative of the pri-vate rights guaranteed by Title VII, nor of the publicpolicy which inheres in Title VII. In addition, beforedeferring, the district court must be satisfied that (1)the factual.issues before it are identical to those de-cided by the arbitrator; (2) the arbitrator had powerunder the collective agreement to decide the ultimateissue of discrimination; (3) the evidence presented atthe arbitral hearing dealt adequately with all factualissues; (4) the arbitrator actually decided the factualissues presented to the court; (5) the arbitration pro-ceding was fair and regular and free of procedural infir-mities. The burden of proof in establishing these condi-tions of limitation will be upon the respondent as dis-tinguished from the claimant.
In essence, this procedure will amount to a reviewof the arbitrati6n proceeding in cases involving Title VIIrights. It is not as broad as the procedure followed ingeneral grievance-arbitration cases where the court looksonly to the question whether under the terms of tne col-lective bargaining agreement the arbitrator had lower todecide the issues he decided. United Steelworkers, supera363 U.S. at 596. Neither is it as broad as the policy ofdeferral under res judicata principles which we have ap-plied in cases where facts previously determined iv theLabor Board are
Zpresented in collateral proceedings in
federal court.2
The main conclusion from this arbitration history is that the arbitra-tor's award is most likely to reflect his view of his role unless he isspecifically mandated by the anti-discrimination clause to consider ques-tions of law. Meanwhile, the courts have reserved a role for themselvesin equal right contract disputes which is greater than that normally re-served for the courts in cases involving arbitration.
The role of the courts has included examination of union behavioras well as employer behavior. Under certain conditions, then, unions canbe held jointly responsible with employers for discriminatory behavior.In addition, given the restrictions on internal behavior of the union it-self, the union may be held solely responsible for discriminatory behavior.In fact a number of sex discrimination cases have arisen under federal leg-islation where a labor union was a co-respondent. In Department of Labor
22Rios v. Reynolds Metals Co. 5 FEP 1 (5th Cir. 1972).
-103-
113
v. Sapner, Inc. and Local 604, Clothing Worker,23 the union noticedthat between 1966 and 1968 the company paid female cutters and markers.40/hr. less than male cutters and markers, in violation of the EqualPay Act. With this knowledge the union demanded in collective bar-gaining negotiations that the company pay the back pay due 22 femaleemployees to 100 employees in the shop in the form of a .18/hr. wageincrease. The union adhered to this position and finally the companyagreed. The female employees involved then brought a complaint againstthe firm. The court ruled that the union must be included as a respon-dent and the company and union were jointly liable for back pay to theseemployees--the company because it had agreed to the demand; the unionbecause it had made the demand.
The test of union responsibility is the extent to which it has ne-gotiated, or otherwise acted in violation. In the above case it wasclear -hat the union, with full knowledge of the company's discrimina-tory behavior, had itself negotiated in a discriminatory way. In otherinstances responsibity is not so clear. In Josephine Juninko v. EdwinWiegan Co., et al., two women had been fired by the company in 1953:a accord with a company policy of firing married women in order to makejobs available for returning veterans. After passage of the Civil RightsAct of 1963 they had reapplied for jobs, but were not rehired althoughthe company was hiring. The complaint was brought against Local 1020,UAW, as well as the company but the court dismissed the case againstthe union on the grounds that the union did not participate with thecompany in formulating hiring decisions. In Joanne Glus et al. v. G.C.Murphy Co., et al.25 a labor union entered in a collective bargainingagreement prior to 1964 establishing seniority and compensation planswhich limited promotions and pay because of sex. This arrangement wasperpetuated to 1971. The union was found solely responsible on thegrounds that it had not attempted to bargain for equal rights. Thesecases are too few and too tentative to make any real generalization a-bout the extent to which and the precise circumstances under which la-bor unions bear responsibility foi Discriminatory employment practices.
23James D. Hodgson, Secretary of Labor, United States Department of
Labor, Plaintiff v. Sagner, Inc. et al., Defendents, United States DistrictCourt, District of Maryland. Civil No. 19906. April 8, 1971. 3 EDP P. 8214.
24Josephine Jurinko et al., Plaintiffs v. Edwin L. Weigand Company et
al., Defendents, United States District Court, Western District of Pennsyl-vania. Civil No. 69-225. Aug. 18, 1971. 4 EPD P. 7516.
25Joanne Glus et al., Plaintiffs v. G.C. Murphy Company et al., Defend-
ents United States District Court, Western District of Pennsylvania. CivilNo. 71-264. July 29, 1971, 4 EDP P. 7548.
-104-
114

However, it is clear that where discriminatory practices are embodied ina collectively bargained labor agreement unions at least run the risk ofbeing found jointly responsible for the practice. A much more systematicand complete study must be done to draw firm conclusions about union be-havior with respect to equal rights for women. However, the discussionhere indicates that union contracts do contain some discriminatory clauses,with the most prevalent one being a maternity leave policy differing fromthe temporary disability policy. There have been a number of grievance!,and court cases involving discrimination on the basis of sex. The unionhas participated both as a respondent and a claimant. The informationpresented here does not allow classification of unions as either a strongforce in favor of equal rights for women or a major obstacle to equalrights for women, but as an institution which has behaved as both.
-105-
115

CHAPTER SEVEN
Summary and Conclusions
The specific goal of this study has been to examine the economicimplications of the Equal Employment Opportunity Commission and Wiscon-sin Department of Industry, Labor, and Human Relations guidelines re-quiring employers to treat maternity leave as a temporary disability.More generally this study has attempted to evaluate a policy which im-poses an increase in the cost of providing fringe benefits. While ma-ternity leave treated as a temporary disability has been an example ofsuch a policy, much of the framework developed here could be used, per-haps in modified forms, for examination of other fringe benefits. Fin-ally, some attempt has been made to identify other fringe benefits, atleast among unionized industries, which may be offered differentiallydepending on the sex of the employee.
7.1 Summary of Findings with respect to Maternity Leave
In chapter two a general economic framework was set out for theexamination of the economic implications of maternity leave treated asa temporary disability. First a labor cost function which specificallytakes into account the cost of provision of fringe benefits as part oftotal compensation was developed. The cost of providing compensationfor absences from work due to temporary disabilities and the cost of*resting maternity leave as a temporary disability were specificallyrecognized as part of the labor cost function. The size of the costof treating maternity leave as a temporary disability to the firm wasshown to depend on the number of female employees and their age distri-bution, the age specific probability of pregnancy among employed femalesand the parameters of the t-mporary disability plan. This function forthe cost of treating maternity leave as a temporary disability was usedin chapter four to estimate the static cost of the maternity leave guide-line for all employers in Wisconsin. it should be emphasized that thecost estimates presented in chapter four are estimates of the maternityleave guideline, not estimates of the cost of treating maternity leaveas a temporary disability. The difference between the two concepts iHcrucial. There were approximately 27% of all employees covered by atemporary disability plan which paid some compensation who were coveredby a temporary disability plan which treated maternity leave as a tem-porary disability before the guidelines were adopted. For these
116

employees the estimates in chapter three attribute a zero cost to thematernity leave guideline. The provision of maternity leave treated asa temporary disability is not costless for these employees, but none ofthe cost should be attributed to the maternity leave guideline.
The estimates of the cost of the maternity leave guideline rangesfrom $4.4 million to $12.8 million annually in Wisconsin, depending onthe assumptions about the amount of compensated temporary disabilityleave which is available and required for maternity leaves. Perhaps thecost estimate assuming an eight week absence from work which is requiredand available can be taken as representative. This estimate, $9.3 millionis .06% of wages and salaries and may increase the cost of providingcompensated temporary disability leaves by as much as 9%. It shouldbe remembered that these are aggregate estimates for the entire stateof Wisconsin. Any individual firm nay experience a larger or smallercost depending on the age and sex composition of its labor force andthe actual fertility rate experienced. Although this is a rather smallpercent of wages and salaries, it represents an increase in the eostof the provision of a fringe benefit by enough to be noticed by firms.This together with the knowledge that the benefit provided is of prac-tical value only to female employees who are subject to the risk ofpregnancy may be sufficient to explain vocal employer opposition tothe maternity leave guideline.
The second part of the analysis of maternity leave treated as atemporary disability dealt with three possible responses to the in-crease in the cost of the temporary disability policy. Two of the re-sponses are adjustments in the total compensation function. A wageeffect may be seen if employers, in equilibrium, pay lower wages whenthey offer maternity leave as a temporary disability and higher wageswhen maternity leave is not treated as a temporary disability. Thiseffect may be mitigated among employers offering maternity leave treat-ed as a temporary disability but who employ few young females. A sub-stitution effect can occur if employers treating maternity leave as atemporary disability offer fewer other fringe benefits, or lower lev-els of fringe benefits, than employers not treating maternity leave asa temporary disability. These two propositions were tested using hos-pital data. In the hospital data there is an inverse relationshipbetween wages and age when maternity leave is not treated as a tem-porary disability which seems to be the result of a few hospitals withextreme values for wages and age. Hospitals display consistent directrelationship between wages and age when maternity leave is treated asa temporary disability. This surpiising result remains a puzzle. Thethird and final possible response combines labor supply and demand be-havior. Employers, in an effort to minimize the cost of maternity leave,may be expected to attempt to adjust their labor force to minimizethe number of employees subject to pregnancy. Simultaneously, youngfemales may be expected to supply their labor to firms offering mater-nity leave treated as a temporary disability. The net result of thisbehavior is estimated using a reduced form of the labor supply and
-108-
117
demand system. It is found that employer labor demand behavior over-whelms labor supply behavior.
7.2 The Implication of These Findings for the Maternity Leave Guideline
The controversy that arose when the EEOC and DILHR guidelines wereissued has remained alive over the past two years. In the recent de-cision Cleveland Board of Education v. LeFleur the Supreme Court affirmedthe section of the guideline forbidding employers to set arbitrary lengthsof time which female employees must be absent from work for childbearing.But in a second decision, Geduldig v. AIELLO the Supreme Court ruledthat compensation need not be paid during an absence from work due tochildbearing. These two cases taken together leave the legal status ofthe guideline in a state of confusion.
At least part of the controversy generated by the guideline, as wellas the second Supreme Court decision noted above, center on the issue ofthe cost of the guideline. Although employers may have calculated a costfigure for their individual firms, the estimates provided here are thefirst aggregate estimates. There is a cost to the maternity leave guide-line which is small on average across all employers in Wisconsin, butwhich may be of some consequence for specific individual employers.
Because there is a cost involved in the maternity leave guideline itis not unreasonable to expect adjustments to the cost. Although analysisof hospital data in search of some possible adjustments has yielded puz-zling results with respect to the wage effect and shown no adjustment withrespect to the substitution effect, other industries may adjust in the ex-pected way. The hospital data did show that when maternity leave istreated as a temporary disability there are fewer young women employed.If this result is displayed in other industries as well, the maternityleave guideline may be a deterent to employment for women of childbearingages. These implications of the maternity leave guideline are importantto understand when the guideline is being evaluated as a vehicle for pro-ducing equal rights for women.
7.3 Maternity Leave as an Example of Fringe Benefit Behavior
Most of the discussion of maternity leave in chapter two can he gen-eralized to fringe benefits. There is very little literature dealing witheconomic behavior with respect to fringe benefits. In chapter five theanalysis of hospital data for wage and substitution effects indicates that
-109-
118

in general these effects do not occur with respect to fringe benefits.Furthermore, fringe benefits do not appear to be multicollinear. Thissuggests that the classical microeconomic theory which assumes fringebenefits to be part of wages needs to be reexamined and empiricallytested. Empirical work on fringe benefits should be done with datawhich allows use of employer costs or contributions for fringe benefits.It should be done on a variety of industries. Theoretical considera-tion needs to be given to the relationship between wages and fringe bene-fits and the labor supply response to fringe benefits. The method usedin this study for the examination of maternity leave may be helpful inexamination of other fringe benefits.
Chapter seven deals specifically with a discussion of union behav-ior with respect to fringe benefit administration depending on sex, asevidenced in court cases and arbitration procedures as well as writtencontracts in Wisconsin. This chapter does not in any way represent a com-plete analysis of union behavior in this area. It does, however, suggestthat while written union contracts do not generally provide fringe bene-fits differentially on the basis of sex, unions may administer contractprovisions differentially depending on sex. Actual contract administra-tion is a difficult area to study since it often depends on personalitiesrather than stated policy. It should be examined more thoroughly, however,particularly with respect to administration of health insurance benefits.
7.4 Conclusion
It is hoped that this study will provide some insights into the im-plications of the maternity leave guideline which will be useful to boththe proponents and opponents. The maternity leave guideline is but oneof a number of EEOC guidelines. All the guidelines carry economic impli-cations, many of which have not been determined. This study may he help-ful in suggesting what some of those implications are and in providingan impetus for examination of them. Beyond that, this study suggests thatfurther inquiry into fringe benefit behavior is merited.

APPENDIX A
Surveys of Employers, School D1stricts, and Hospitals
The employer survey was administered by mail questionaire to 300employers with 125 responses. A description of the sampling procedureis contained in chapter two. The school district survey was adminis-tered by sail questionaire to the 440 Wisconsin school districts with342 responses. The maternity leave and fringe benefit portions of thehospital survey were administered by mail questionaire to 189 non-psychiatric, non-geriatric hospitals in Wisconsin. There were 84 re-sponses. The fringe benefit portion was initially administered aspart of a fringe benefit survey conducted by Wisconsin Society of Hos-pital Personnel Administrators and the Wisconsin Hospital Association.There were 109 responses to this survey. Hospitals not responding tothis survey were resurveyed with 18 responses. Pospitals not respond-ing to the three parts of the mailed survey were contacted in a tele-phone survey. There are 79 responses to the telephone survey. Allsurvey forms are shown here along with cover letters.
1.20

Sig%te of Wisconsin \ DEPARTMENT OF INDUSTRY, LABOR and HUMAN RELATIONS
Dear Sir:
. 0 so.
M015(1.4 Wo5CON 51101
t.g.( 01(01r 10
Bureau of Community Services
A year ago the Equal Employment Opportunity Commission and the State of Wisconsinissued a guideline requiring employers to treat maternity leave as any other temporarydisability. This guideline is likely to impose a cost on employers. I am currentlyengaged in a study which will try to estimate the cost to employers of complying tothis guideline. The study, entitled "Wisconsin Maternity Leave and Fringe Benefits:Policies, Practices, and Problems", is funded by the United States Department ofLabor, Manpower and Administration.
The enclosed survey, when completed, will allow me to estimate the costs of the newpolicy to Wisconsin employers. The information you provide will be strictly con-fidential. My report will not identify any firm, nor will the information I gatherbe released to or used by any other individual or group or agency.
Your firm has been selected as one of a random sample of 200 employers, Using theresults of this sample I will estimate tie extent to which different sick leaveprograms are followed in Wisconsin and thereby estimate the costs to employers ofconforming to the guideline. May I emphasize that there shall be absolutely noattempt to estimate the costs to any employer participating in the survey. Thesurvey results shall be used only to project the practices of Wisconsin employerscm a state wide level. Neither you nor your firm will be identified in my finalreport. Nor will I release to anyone the names of the firms participating in thesurvey.
ILHRAOM 070
112
121

-2-
I would appreciate your cooperation in completing the enclosed survey. Thecompleted form may be returned in the envelope provided. Please try to completethe survey by July 30. Should,you have any questions, I shall be happy to provideadditional information. My telephone number is 608-266-3636.
Thank you for your cooperation.
Sincerely,
ql.1A4;AYgA'Jennifer GernerPrinciple Investigator
JG/jck
Enc. - 2
-113-
122

EMPLOYER FRINGE BENEFIT SURVEY
NAME OF EMPLOYER
ADDRESS
NO. EMPLOYEES
NO. OF FEMALE EMPLOYEES
-114-
123.

I. Sick Pay
1. At what rate do employees earn sick leave?
2. If sick days are granted, what is the maximum accumulation allowed?
3. What percentage of the wage is paid during sick leave? (If a flatdollar amount is paid, note that)
4. Is a doctor's certification of illness required to collect sick pay?
Yes No
5. What is your policy for illness lasting longer than the sick leaveaccumulated by the employee?
6. Do you grant sick pay for illness lost due to pregnancy?
Yes No
7. If yes, what are the limits of coverage?
8. In addition to your sick leave plan do you have an insured temporarydisability or income continuation?
Yes No
9. If so what percent of the premium do you pay for each employee?
II. Leave of Absence
1. Does your firm grant leaves of absence? Yes No
2. What is the maximum time an employee may be on a leave of absence?

-2-
3. Is the right to return to your job guaranteed?
Yes, unconditionally to same job
No, but attempt to find same or similar job
No, but if nothing available, 1st on waiting list
No.
4. What are reasons an employee may request a leave of absence?
extended illness
_______pregnancy
vacation
other, please specify
5. Does the employee retain seniority during a leave of absence?
6. Does the employee retain health insurance, life insurance, and pensionbenefits during a leave of absence? (If you do not provide all the benefitsmentioned, please circle the ones offered.)
Yes, the firm maintains the premiums
Not applicable, we do not offer any of the above benefits
-116-
125

-3-
III. Maternity Leave
1. Do you have a special policy for maternity leave? Yes
No
2. If yes, please describe it.
IV. Miscellaneous
1. If you have any special provisions with regard to sick leave, leave ofabsence, or maternity leave, please describe them below.
-117-
126

Wisconsin Hospital
Association
MEMORANDUM
GENERAL 41-73
TO: Institutional Members
FROM: Warren R. Von EhrenPresident
P.O Box 438/5721 Odana Roan
MADISON, WISCONSIN 53711Phone: Area Code 608 274.18'20
SUBJECT: Wisconsin Maternity Leave and Fringe Benefit Policies,Practices and Problems
July 6, 1973
The attached survey form has been prepared by Mrs. Jennifer Gerner, Director ofthe captioned project. Her group has received a federal grant to perform thisstudy which includes the cost impact of the maternity leave rulings which wereproposed in 1972.
We urge your cooperation in this survey and have been assured that the informationyou provide will be held in strict confidence and used only for completion of thisproject. Copies of the study will be made available to the membership as well asa special report containing an analysis of the information provided by the hospitalsplus an equation which will allow an individual hospital to calculate its own costif the rulings are reinstated.
Thank you in advance for your cooperation and assistance. Please return the surveyforms to the Association office no later than July 23. If you have any questionsconcerning any portion of the survey, Mrs. Gerner can be reached at 608-266-3636.
WRVE/ahEnclosure
4

Hospital Maternity Leave Survey'
1. Total number of employee
2. Total number of female employees
3. Number of full time and part time female employees in each of the following
job categories and age groups:
(The specific jobs for each category are listed on the next page of this
questionnaire)
Lqf 15-19 20-24 25-29 30-39 40 & Over
a.
Full Part 'Full Part
time time time time
Full Parttime time
Full Parttime time
(Full Part
time time
Nursing Personnel
b. Office Personnel
c. Technical Personnel
d. Service Personnel
e. Professional Personnel
f. Miscellaneous Personnel
4. If the hospital pays fringe benefits (premiums on policies or payments to funds)
during sick leaves and leaves of absence, please check the appropriate box. If
no payments are made, leave the box blank:
Sick Leave
Leave of Absence
Pension Life Ins. Health Ins.
119

Exact Job Classifications:
a. Nursing Personnel includes:
Registered Nurse DegreeRegistered Nurse DiplomaLicensed Practical NurseNursing AssistantOperating Room Technician - ScrubOperating Room SupervisorDirector of Nursing Service
b. Office Personnel includes:
ControllerFinance DirectorOffice Manager
Clerk-Typist-GeneralPersonnel Director
c. Technical Personnel includes:
Medical Technologist ASCPX-Ray Technician RegisteredOccupational Therapist OTRInhalation Therapist AAITCertified Inhalation TherapistNon-certified 0.T. AssistantCertified Lab AssistantChief Lab TechnologistChief Med. Rec. TechnicianChief Radiologic Technician
d. Service Personnel includes:
JanitorMaid
e. Professional Personnel includes:
DieticianPharmacistPhysical TherapistDirector of PharmacyDirector of Physical TherapyDirector of O.T.Director of DieteticsDirector of Social Services
f. Miscellaneous Personnel
Director of PurchasingChief Engineer
Executive Housekeeping & LaundryDirector of Volunteer Services
120
1::.:9

-/
*
-2-
D. Does seniority continue to accrue during
Sick Leave
Yes
No
Leave of Absence
Yes
No
6. When an employee takes sick leave or leave of absence do you hire replacementworkers for the absent employee? The information needed is whether thatposition stays vacant or whether someone fills it regardless of whether thereplacement is another employee or a new worker hired for the purpose. Pleasecheck the appropriate box. If the hiring of a replacement depends upon theexpected length of absence, please provide the number of weeks where appropriate.(If there is no exact policy, please provide whatever "rule of thumb" policy youuse.)
Nursing Personnel
Office Personnel
Technical Personnel
Service Personnel
Professional Personnel
Miscellaneous Personnel
Yes No
if absent at least weeks
if absent at least weeks
if absent at least weeks
if absent at least weeks
if absent at least weeks
if absent at least weeks
7. How many quits have you had in the past two years (June 1971-June 1973) when
the reason given was pregnancy?
8. How many maternity leaves have you had in the two year period June 1971-June 1973?
1971-1972 1972-1973
a) How many said they would return to work but actually did not?
1971-1972 1972-1973 Leave not over
b) Average length of the leave for those returning?
c) How many workers returned only temporarily? (Worked one month or less)
121 -
130

-3-
9. If a health insurance plan is available through your hospital, does it providematernity coverage?
Yes
Yes, but optinnal
No
Health insurance not available through the hospital
10. If a temporary disability policy, is available through your hospital does itcover absence due to pregnancy?
Yes
No
Temporary disability not available through the hospital
-122-
131

Fringe Benefit Information
Please complete the following fringe benefit information. This information is vitalto provide you with accurate and complete information about the cost of maternity leave.
A. Vacation
I. How many weeks vacation do the following classes of employees receive afterone year of service?
Non-exempt weeks
Exempt weeks
Department Heads weeks
Administrators weeks
2. How much can he take at one time?
3. How long must the following classes of employees work before they areeligible for an increase in vacation benefits?
a
One week
Two weeks
Three weeks
Four weeks
Over five weeks
Non-exempt Exempt Dept. Heads Administrators
4. Do part time employees receive vacation benefits?
Full Pro-rated None
If yes, how many hours per week must they work to receive benefits?
5. Are employees allowed to accumulate their vacation benefits?
Yes No
If yes, what is the maximum accumulation allowed?
-123 -
132

-2-
6. Are employees allowed to receive pay in lieu of taking vacation time?
For all accumulated vacation time for part None
7. May an employee take vacation benefits during an extended illness or leaveof absence?
Yes
No
B. Life Insurance
1. Is your life insurance coverage for employees
paid in full by the hospital
paid in full by the employee
cost shared by the hospital and the employee
no program
2. If cost is shared, what percent of the cost does the hospital pay?
Non exempt
Exempt
Department Heads
Administrators
3. How long must an employee work before he is eligible for life insurance
coverage?
4. Are part time employees eligible for life insurance?
$
I
IS
Yes No
If yes, how many hours per week must they work to be eligible?
-124-
133

-3-
C. Health Insurance
1. Check the health insurance coverage carried:
_
Surgical
Major Medical
2. How long must an employee be employed before he is eligible for
health insurance coverage?
3. Are part time employees eligible for health insurance coverage?
.Yes No
If yes, what is the miniwum number of hours worked required to receive
health insurance coverage?
4. What percent contribution does the hospital make toward employee coverage?
% toward single coverage
% toward family coverage
5. Please check insurance carrier:
Hospitalization
Surgical
Major Medical
Blue Cross Blue Shield WPS Other
125
1 ,34

-4-
D. Disability Insurance Coverage
1. Do you provide disability insurance coverage? Yes No
2. What percentage of cost is paid?
by hospital
by employee
3. How long must an employee be employed before he is eligible for disability
insurance coverage?
4. Are part time employees eligible insurance coverage?
Yes No
If yes, how many hours per week must they work to be eligible?
5. What percent of employee salary does the plan provide?
Non-exempt
Exempt
Department Heads
Administrators
%
6. How long may an employee collect disability benefits per incident?
Non-exempt
Exempt
Department Heads
Administrators
-126-

-5-
7. On what day of her injury or illness does disability insurance take effect?
First day Third day
Second day Fourth day
Other, please state when
E. Sick Pay
1. Please describe briefly your sick plan:
2 If sick days are granted, what is the maximum accumulation allowed?
Non-exempt
Exempt
Department Heads
Administrators
3. Do part time employees receive paid sick days? Yes No
If yes, what is the minimum number of hours worked required to receive
paid sick days?
4. Can employees receive pay for any accumulated sick days not used? Yes
No
If yes, please explain system:
5. Does the hospital grant sick pay for days lost due to pregnancy?
Yes No
If yes, what are the limits of coverage?
F. Leave of Absence
1. How long must an employee be employed before he can request a leave
of absence?
2. What is the maximum time an employee may be on leave of absence?
Non-exempt
127

Exempt
Department Heads
Administrators
-6-
3. Is the right to return to your job guaranteed upon return to work?
Yes No
If no, what is your procedure?
4. Please list any special leave of absence allowed and the maximumtime off allowed:
G. Pension
1. Do you have an employee pension plan? Yes No
2. What percent of employees wage does the hospital contribute? i;
-128-
1%7

Wage Information
Please complete the following table using monthly wages for each group, rounded tothe nearest dollar. If there is a salary range for the position, please provide thebase and maxiJium salary. If there is no range enter the monthly salary in the basecolumn and omit the maximum. Finally,Tor positions with a salary range, pleaseenter an "average" salary for the position. An exact average is desirable but areasonable estimate is sufficient.
1
1
1
1
1
Base Monthly S,laryMaximum Average
1. Registered Nurse - Degree
2. Registered Nurse - Diploma
3. Licensed Practical Nurse
4. Medical Technologist (ASCP)
5. Dietician (ADA)
6. X-Ray Technician-Registered
7. Pharmacist
8. Physical Therapist
9. Nursing Assistant
0. Operatinq_Room Technician - Scrub
1. Occupational Therapist (OTR)
2. Respiratory Therapist (ARRT)
3. Respiratory Therapist Asst. (Trainee)
4. Certified Occupational Therapy Assistant
5. Certified Laboratory Assistant (CLA)
6. Clerk-Typist-General
7. Janitor
8. Maid
9. Minimum (Hourly) Hire Rate
-129-
1,..8

State of Wisconsin \ DEPARTMENT OF INDUSTRY, LABOR and HUMAN RELATIONS
P.O box 2200
MADISON. WISCONSIN r3701
999999 RCPLY TO
Bureau of Community Services
A project entitled "Wisconsin Maternity Leave and Fringe Benefits: Policies, Practicesand Problems" has been funded by the United States Department of Labor, ManpowerAdministration. A part of the project is the estimation of costs to Wisconsinemployers of conforming to recent guidelines requiring the treatment of maternityleave to be no different from any other temporary disability.
To increase the accuracy of the cost estimate, special attention is being given toschool districts within the state. The enclosed survey form is intended to providethe necessary information concerning existing maternity leave policies in order thatthe extent of policy change, and cost, required by the guideline may be known. Thedata collected on this survey will be held in strict confidence and will be used onlyto construct the aggregate cost estimate for school districts. No individual districtwill be identified in the final report of the project, nor will the project attempt toestimate the costs by individual school district.
The Directors of the Wisconsin Association of School Boards are cooperating with thestudy and urge your paticipation. The results of the study will be supplied to theAssociation of School Boards for distribution to you. This special report will includean analysis of the data from the survey plus an equation, with necessary explanationof appropriate procedure, which will allow each school district to calculate individuallythe costs of the guideline.
Please complete the questionnaire and return it by August 6 in the envelope provided.
Should you have any questions please feel free to contact me at 608-266-3636.
Thahk you for your cooperation.
cerely,
kJ, 04'14-4/Jennifer GernerPrincipal Investigator
130

MATERNITY LEAVE SURVEY
To complete the study of the costs of maternity leave, informa-tion concerning the school districts' policy with respect to maternity
leaves is needed. Please complete the following questions to describe
the policy of your district. Describe the policy currently in effect.Should you be in the process of changing that policy and unable tostate completely the new policy, describe the old policy and answer
question # 13.
NAME OF SCHOOL
1. Pregnancy leave is treated:
according to sick leave policy
according to sick leave policy for the periodof medical disability only
as a leave of absence
2. Does the school district require that a pregnant teachertake a leave of absence?
Yes
No
3. Must the leave of absence begin at a specified timeduring the pregnancy?
Yes, during month of pregnancy
No
4. Alternately, does the school district require that ateacher not begin any semester if she is pregnant?
Yes, may not begin a semester if months
pregnant
No
5. Does the district require the teacher to wait a givenperiod following delivery before resuming her duties?
Yes, must wait at least weeks afterdelivery to resume duties
-131-
140

-2-
5. (continued)
No, but medical certification of fitness is needed.
No requirement
6. Does the district require the teacher to wait until thebeginning of the semester following delivery to resumeduties?
Yes
No
7. Is there a maximum period for which a leave of absencematernity ;s. granted?
Yes, months
Yes, a maximum of semesters may be taken
No
8. Is there a maximum period following delivery (or follow-
ing certification of physical fitness) for a leave ofabsence to terminate?
Y:s, must return no later than monthsafter delivery
Yes, must return no later than the start ofthe semester following delivery
No upper limit
9. During a leave of absence does the school district:(Check appropriate answers)
allow accumulation of seniority
pay % of premium for group health insurance
-132-
141

-3-
10. Must the teacher be employed a stated length oftime to qualify for maternity leave?
Yes, the requirement is previousemployment
No
11. Does your temporary disability insurance policy, ifyou have one, cover extended absences due to pregnancy?
Yes
No
Do not have temporary disability insuraoce coverage
12. Please describe any additional significant aspectsof maternity leave policy not treated in the above questions.
13. If you are in the process of changing your policy, pleasedescribe the changes you expect.
-133-
142

APPENDIX )3
Tabulation of Responses to the Hospital Surveys
This appendix contains the tabulation of responses to the hospitalsurveys. All hospitals responding to the mailed fringe benefit surveyare tabulated together. Responses to telephoned surveys are shown sep-arately from responses to mailed surveys.
143

June
Maternity Leave Survey
Hospital Name: No. Beds:
Survey Completed by:
Address:
City: State: Zip:

I. Tabulation of Fringe Benefit Survey: Responses to Mailed Questionaire
Note: This survey was done at two different times. The first wasin March, 1973 and was a fringe benefit survey conducted byWHA and WSHPD. There were 84 responses to this questionaire.A second mailing of selected sections of the same questionairewas made only to the non-respondents from the initial survey.An additional 43 hospitals responded to the second mailing.This tabulation presents responses to both surveys. Thereare a total of 127 responses.
A. Vacation
1. How many weeks of vacation do the following classes of employeesreceive after one year of service?
No. of weeks 0 1 2 3 4 No Response
Non-exempt 1 12 108 2 - 4
Exempt - 11 91 11 1 13Department Heads 1 12 80 28 4 2
Administrators - 9 57 33 23 5
2. How much can he take at one time?
No. of weeks 0 1 2 3 4 All No Response
Non-exempt 1 2 28 1 6 80 9
Exempt - 3 25 2 6 79 12
Department Heads 3 27 3 5 80 9
Administrators - 3 26 3 7 79 9
3. How long must an employee work to earn an additional week of vacation?more earns No
No. of years 2 3 4 5 6 7 8 10 than10
nomore
Response
Non-exempt 11 5 3 69 4 6 5 14 1 3 6
Exempt 11 9 4 63 2 3 5 14 2 3 11Department Headsl0 10 3 63 4 3 4 14 5 5 6
Administrators 9 8 2 47 1 3 4 11 5 24 13
4. Do part time employees receive vacation benefits?
None 7
Pro-rated 120
5. If yes, how many hours per week must they work to receive benefits?more no minimum No
Hours/week 1-10 16 18-20 21-25 than or no benefits Response25
No. of Hosp. 8 6 56 18 1 33 5
-137
145

6. Are employees allowed to accumulate vacation benefits? If so,what is the maximum accumulation allowed?No Accumulation 4-6 Unlimited or at No
Allowed Weeks Accumulation Supervisor's Discretion Response
106 10 7 3
7. Are employees allowed to receive pay in lieu of taking vacation time?No Full Pay Partial Pay No Response
104 10
B. Life Insurance
11 2
1. Is there life insurance coverage for employees?No Program or Paid Paid in Full Shared by Hospital Noin Full by Employee by Hospital and Employee Response
38 76
2. If cost is shared,
12 1
what percent of the cost does the hospital pay?No Program or No
% of Cost 20-40 50 60-90 100 Paid by Employee Response
Non-exempt 5 3 3 65 50 1Exempt 5 3 3 65 50 1Department Heads 4Administrators 4
3
3
3
4
7171
44
44
2
1
3. How long must an employee work before he is eligible for life insurance?
No No12 18-26 52 52+ Program ResponseNo. of weeks 2-10
No. of hospitals 16 32 18 10 5 44 2
4. Are part time employees eligible for life insurance, and if so, whatis the minimum number of hours per week they must work to be eligible?
Not Eligible or NoHours/week 8-10 20 23-36 No Minimum Response
No. of Hosp. 3 28 12
C. Health Insurance
1. Is there health insurance coverage available? Yes No
82 2
Hospitalization 124 3
Surgical 124 3
Major Medical 104 23
I2. How long must an employee be employed to be eligible for coverage?
-138-
146

No. of weeks
No. of Hosp.
4-10 12 18-24
60 33 7
3. Are part-time employees eligible, and ifweek must they work to be eligible?
30 andHours/week 6-10 20 21-25 over
No. of Hosp. 9 58 30 8
Immediate52 Eligibility
1 26
so how many hours per
Immediately or NoNot Eligible Response
19 3
4. What percent contribution does the hospital make toward employeecoverage?
No% Toward Single 0 3-45 50 55-70 75 79-90 100 Response
No. of Hospitals 8 11 26 16 8 11 45 2
% Toward Family 0 3-45 50 55-72 75 80-90 100
No. of Hospitals 23 26 22 18 4 6 7 5$ Amount toward Family coverage$ Amount toward Single coverage16 Hospitals responded.
D. Disability Insurance Coverage
1. Does the hospital provide disability coverage? No Yes No Response
52 74 1
2. What percentage of the cost is paid by the hospital?0 or
% of Cost Not Available 50 66-70 100 No Response
No. of Hosp. 65 2 4 51 5
3. How long must an employee be employed before he is eligible?No Requirement More No
No. of Weeks or Not Available 4-12 18-24 26-36 52 Than Response52
No. of Hosp. 66 36 11 2 7 2 3
4. Are part time employees eligible and if so, how many hours per weekmust they work?
Not Eligible orNo. of Hours/Week No Minimum 1-16 20 21-32
No, of Hospitals 97 3 19 8
5. What percent of salary does the plan provide?Less Not Based 0, or No% of Salary Than 50 60 65-90 100 on Salary No Plan Response50
Non-exempt 1 7 16 11 2 11Exempt 1 5 22 11 3 9Department Heads 1 8 23 21 7 7Administrators 1 6 21 23 8 6
5
6
6
6
74
70
54
56

6. How long may an employee collect benefits per incident?No 20 or more rest No
No. of Weeks Plan less 24-26 52 than52
of
life
Response
Non-exempt 75 9 8 9 4 13 9
Exempt 71 9 6 9 5 20 7
Department Heads54 7 7 9 6 39 5
Administrators 56 7 4 7 7 41 5
7. On what day of injury or illness does disability take effect?No 90 or No
Day Plan 1 2 3 4 5-23 30-61 more Response
Illness 56 3 2 5 15 9 13 22 2
Injury 54 17 5 7 6 13 23 2
E. Sick Pay
1. What day of illness does sick pay begin?0, or
Day No Plan 1 2 3 4 No Response
No. of Hospitals 11 79 20 2 7 8
2. What percent of salary is provided?0, or
% of Salary No Plan 60 75 100 No Response
No. of Hospitals 12 3 2 98 12
3. How many sick days per year are earned ?
NoDays/Year 0 2-7 9-10 12-13 14-15 18-20 20+ Response
No. of Hosp. 11 8 8 81 2 2 5 10
4. If sick days are granted what is the maximum accumulation allowed?No Accumulation No No
No. of Days or No Minimum 4-10 15-20 21-30 31-40 40+ Max. Resp.
Non-exempt 16 3 3 28 12 44 15 4
Exempt 18 3 2 25 29 25 18 6
Department Heads 18 3 3 26 11 42 19 5
Administrators 19 3 3 25 11 38 20 8
5. Do part time employees receive paid sick days, and if so, what is theminimum number of hours they must work to be eligible?
Not Eligible No Weekly NoNo. of Hours or No Minimum 1-8 15-16 20-30 Minimum Response
No. of Hosp. 59 6 4 40 2 6
-140-
148

6. Can employees receive pay for any accumulated sick days not used?
No 106Yes, all 2
Yes, part 6
Yes, upon re *rement 12No Response 1
7. Does the hospital grant sick pay for days lost due to pregnancy?
No 83
Accumulated SickLeave Only 37
Medical DisabilityOnly 2
Specified No. of DaysNo LimitNo Response 1
F. Leave of Absence
1. How long must an employee be employed before he can request aleave of absence?
No No Supervisor's NoNo. of Months Min. 1-3 6 12 12+ Policy Discretion Response
No. of Hosp. 19 30 27 36 4 3 7 1
2. What is the maximum time an employee may be on a leave of absence?No No No
No. of Months Policy 1-3 4-6 10-12 12+ Limit Discretion Resp.
Non - exempt 1 23 33 27 7 4 30 2Exempt 1 19 30 30 7 5 30 5
3. Is the right to return to your job guaranteed? No Yes
9 118G. Pension
1. Is there an employee pension plan? No Yes
24 103
-141-
149

II. Tabulation of Fringe Benefit Survey: Responses to Telephone Follow-Up
Note: Those hospitals not responding to the mailed questionaire werecontacted by telephone. The telephone follow-up was somewhat ab-breviated. There are 36 responses to this survey, tabulated below.
A. Vacation
1. How many weeks of vacation are granted to the average employee afterone year of service?
No. of Weeks 1 2 No Response
No. of Hospitals 9 21 6
2. Do part time employees receive vacation, and if so, how many hoursper week must they work to be eligible?
Not Eligible orHours/ Week No Minimum 4 20-26 No Response
No. of Hospitals 25 1 4 6
3. Is pay in lieu of vacation granted?
Yes, full Yes, part No No Response
No. of Hospitals 4 3 19 10
4. May vacation time be used for an extended illness?
Yes No No Response
No. of Hospitals 24 5 7
B. Life Insurance
1. Is life insurance available?Full Cost Shared No
No Paid by Hospital Cost Response
No. of Hospitals 17 7 6 6
2. How long must an employee work to be eligible?No Plan or
No. of Months No Minimum 2-6 12 24 No Response
No. of Hospitals 22 2 4 2 6
3. Are part time employees eligible for life insurance, and if so, howmany hours per week must they work to be eligible?
No Minimum, or Not Eligible 29
20 Hours/Week 1
No Response 6
-142-
150
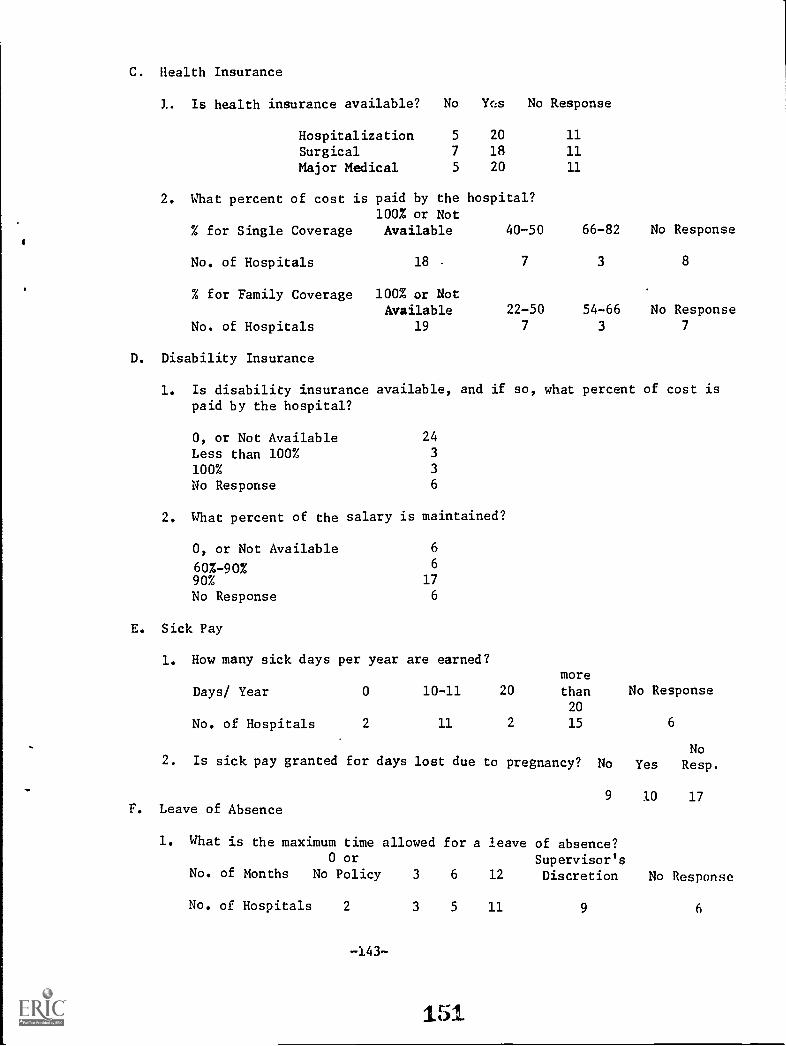
C. Health Insurance
1. Is health insurance available? No Yc,s No Response
Hospitalization 5 20 11
Surgical 7 18 11
Major Medical 5 20 11
2. What percent of cost is paid by the hospital?100% or Not
% for Single Coverage Available 40-50 66-82 No Response
No. of Hospitals 18 7 3 8
% for Family Coverage 100% or NotAvailable 22-50 54-66 No Response
No. of Hospitals 19 7 3 7
D. Disability Insurance
1. Is disability insurance available, and if so, what percent of cost ispaid by the hospital?
0, or Not Available 24
Less than 100% 3
100% 3
No Response 6
2. What percent of the salary is maintained?
0, or Not Available 6
60%-90% 6
90% 17
No Response 6
E. Sick Pay
1. How many sick days per year are earned?more
Days/ Year 0 10-11 20 than No Response20
No. of Hospitals 2 11 2 15 6
No2. Is sick pay granted for days lost due to pregnancy? No Yes Resp.
9 10 17F. Leave of Absence
1. What is the maximum time allowed for a leave of absence?0 or Supervisor's
No. of Months No Policy 3 6 12 Discretion No Response
No. of Hospitals 2 3 5 11 9 6
-143-
151
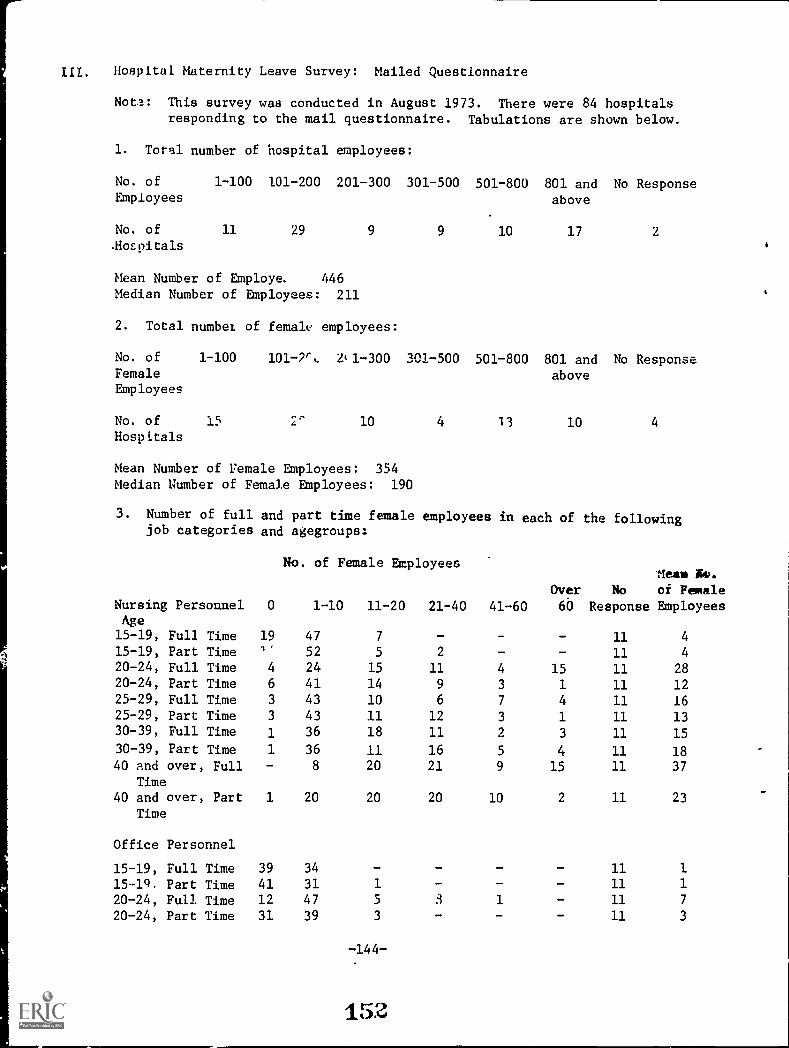
Hospital Maternity Leave Survey: Mailed Questionnaire
Note: This survey was conducted in August 1973. There were 84 hospitalsresponding to the mail questionnaire.
1. Total number of hospital employees:
Tabulations are shown below.
No. of 1-100 101-200 201-300Employees
301-500 501-800 801 andabove
No Response
No. of 11 29 9 9 10 17 2
.Hospitals
Mean Number of Employe. 446Median Number of Employees: 211
2. Total number of femalt' employees:
No. of 1-100 101-2fL li1-300Female
301-500 501-800 801 andabove
No Response
Employees
No. of 15 10 4 13 10 4
Hospitals
Mean Number of Female Employees: 354Median Number of Female Employees: 190
3. Number of full and part time female employees in each of the followingjob categories and agegroups:
Nursing PersonnelAge
0
No. of Female Employees
1-10 11-20 21-40 41-60Over60
Meals M.No of Female
Response Employees
15-19, Full Time 19 47 7 11 4
15-19, Part Time 1 52 5 2 11 4
20-24, Full Time 4 24 15 11 4 15 11 2820-24, Part Time 6 41 14 9 3 1 11 1225-29, Full Time 3 43 10 6 7 4 11 1625-29, Part Time 3 43 11 12 3 1 11 1330-39, Full Time 1 36 18 11 2 3 11 15
30-39, Part Time 1 36 11 16 5 4 11 1840 and over, Full 8 20 21 9 15 11 37
Time40 and over, Part 1 20 20 20 10 2 11 23
Time
Office Personnel
15-19, Full Time 39 34 - 11 1
15 19. Part Time 41 31 1 - - 11 1
20-24, Full Time 12 47 5 3 1 11 7
20-24, Part Time 31 39 3 - - - 11 3
-144-
152

0
Office Personnel ;cont.)
1-10 ?1-20 21-40 41-60Over60
Mean No.No of Female
Response Employees
25-29, Full Time 25 36 5 2 - 11 525-29, Part Time 33 38 2 - 11 230-39, Full Time 17 49 7 - 11 430-39, Part Time 28 40 5 11 440 and over, Full 4 44 11 11 4 11 12
Time
40 and over, Part 22 41 9 1 11 5Time
Technical Personnel
15-19, Full Time 55 17 12 115-19, Part Time 62 10 - 12 020-24, Full Time 17 42 8 3 2 - 12 620-24, Part Time 43 28 1 12 125-29, Full Time 1' 40 10 3 - 12 425-29, Part Time 2L 43 1 12 130-39, Full Time 21 48 2 1 12 3
30-39, Part Time 28 44 - - - - 12 240 and over, Full 14 11 4 3 - 12 4
Time
40 and over, Part 39 33 - - 12 2Time
Service Personnel
15-19, Full Time 37 34 1 - 12 115-19, Part Time 21 39 7 4 1 12 6
20-24, Full Time 25 43 4 12 3
20-24, Part Time 36 31 5 - 12 2
25-29, Full Time 38 31 3 - - - 12 2
25-29, Part Time 50 22' - - - 12 130-39, Full Time 20 48 4 12 3
30-39, Part Time 35 37 - - 12 140 and over, Full 1 29 19 12 60 5 12 ,20
Time40 a,Ad over, Part 15 42 11 4 - - 12 7
Time
Professional Personnel
15-19, Fur. Time 71 2 - 11 015-19, Part Time 71 2 - - - 11 020-24, Full Time 50 23 - 11 120-24, Part Time 67 6 - - 11 025-29, Full Time 50 23 11 125-29, Part Time 61 12 - - 11 030-29, Full Time 49 I
4.4 - 11 130-29, Part Time 52 21 - - 11 140 and over, Full 30 42 - - 11 2
Time
40 and over, Part 41 31 - - - 12 1Time
-145-
153

0
Miscellaneous Personnel
1-10 11-20Over
21-40 41-60 60
Mean No.
No of FemaleResponse Employees
15-19, Full Time 66 6 12 015-19, Part Time 61 10 - 1 - 12 120-24, Full Time 59 12 1 - 12 120-24, Part Time 6C 4 2 - - 12 125-29, Full Time 58 13 1 - - 12 125-29, Part Time 63 9 12 130-39, Full Time 52 19 1 12 130-39, Part Time 58 13 1 - - 12 140 and over, Full 24 43 4 2 - - 11 4
Time
40 and over, Part 55 18 11 1Time
4. Does the hospital maintain the folloWing benefits
Yes No
during a sick leave?No
Response
Pension 45 37 2Life Insurance 46 36 2Health Insurance 49 33 2
...during a leave of absence?
Pension 18 64 2Life Insurance 25 57 2Health Insurance 1-3
..., 69 2
5. Does seniority continue to accrue during a sick leave or leave of absence?No
Yes No Response
Sick Leave 72 11 1Leave of Absence 28 55 1
6.' How many quits have you had in the past two years (June 1971-June 1973)when the reason given was pregnancy?
Over NoNo. of Quits 0 1-5 6-10 11-15 16-25 25 Response
No. of Hospitals 16 24 17 10 5 5 7
Mean Number of Quits = 7Median Number of Quits = 6
-146-
154

7. How many maternity leaves have you had in the two year period June 1971June 1973?
No. of Leaves
June 1971-June1972
June 1972-June1973
0 1-5 6-10
7 33 10
6 20 11
Mean, 1971-1972 = 12
Mean, 1972-1973 = 12
8. How many said they
11-15 16-20 21-30
6 6 8
6 9 8
Median, 1971-1972 = 6Median, 1972-1973 = 7
would return but actually did not?Over No
6-10 11-15 15 ResponseNo. 0 1-5
June 1971-June 34 28 16
1972
June 1972-June1973
Mean, 1971-1972 = 2Mean, 1972-1973 = 2
9. What is the
No. of Weeks
29 43
3 1 8
4 1 1 6
Median, 1971-1972 = 1Median, 1972-1973 = 1
Over No
30 Response
6
5
average length of the leave for those returning?No Over No
Leaves 3-6 8-12 14-18 19-24 24 Response
No. of Hospitals 7
Mean No. of weeks = 12Median No. of weeks = 12
11 25 28 14 2 7
10. How many returned only temporarily (one month or less)?
No. 0 1 2
No. of Hospitals 51 8 9
8
8
No
3 4 6 9 Response
3. 3 1 1 10
11. If a health insurance plan is available through your hospital, does itcover maternity?
No plan
No
Yes
OptionalNo Response
1
1
63
15
4
There may be some confusionin this response. Hospitalsmay have responded positivelyif maternity coverage is a-vailable at an additional costto the employer.
-147-
r"r".1X.0

12. If a temporary disability insurance policy is available throughyour hospital does it cover absences due to pregnancy?
No 38Yes 4
Not Available 36No Response 6
-148-
156

IV. Maternity Leave Survey Tabulation: Telephone Follow-up
Note: Hospitals not responding to the mail questionnaire were contactedby telephone. There were 79 hospitals responding to the abbreviatedtelephone follow-up survey. Tabulations are shorm below.
1. Total number of hospital employees:
Over NoTotal number 1-100 101-200 201-300 301-500 501-800 800 Response
No. of 19 19 8 6 6 10 11Hospitals
Mean = 337Median = 231
2. Total number of female employees
No. of Over NoFemale 1-100 101-200 201-300 301-500 501-800 800 ResponseEmployees
No. of 20 19 8 5 8 3 16Hospitals
Mean number of female employees = 267Median number of female employees = 204
Number of full and part time employees in the following age and occupationgroups.
No. of Mean No.Female Over No of FemaleEmployees 0 1-10 11-20 21-40 41-60 60 Response Employees
Nursing PersonnelUnder 25 1 9 7 7 4 7 44 4325-40 - 7 6 2 6 14 44 6340 and over 2 8 6 6 6 7 44 35
Office PersonnelUnder 25 25 6 4 - - 44 225-40 24 7 2 1 - 1 44 440 and over 25 2 7 2 1 - 44 3
-149-
1 57

No. ofFemale Over No
Mean No.of Female
Employees 0 1-10 11-12 21-40 41-60 60 Response Employees
Technical PersonnelUnder 25 33 2 - - 44 025-40 31 3 1 - - 44 140 and over 31 4 - - 44 0
Service PersonnelUnder 25 30 44 1 - 44 125-40 17 2 1 59 240 and over 29 4 2 - - 44 2
Professional PersonnelUnder 25 30 4 - 45 025-40 30 3 1 45 140 and over 31 2 1 - - 45 1
4. Does the hospital maintain the following benefits
Yes No
during a sick leave?No
Response
Pension 31 36 12Life Insurance 29 38 12Health Insurance 47 20 12
...during a leave of absence?
Pension 11 56 12Life Insurance 18 49 12Health Insurance 28 38 13
5. Does seniority conLiuue to accrue during a sick leave or leave of absence?No
Yes No Response
Sick Leave 55 10 14Leave of Absence 33 30 16
6. How many quits have you had in the past two years (June 1971-June 1973)when the reason given was pregnancy?
Over NoNo. of Quits 0 1-5 6-10 11-15 16-25 25 Response
No. of Hospitals 17 25 7 1 2 3 23
Mean No. of Quits = 5Median No. of Quits = 2

V. Wage Coefficient of Variation by Occupation
Available from mailed survey, returned by 84 hospitals, as of August, 1973.
Occupation
Nurse, degree
Coefficient ofVariation
Base .076Max. .072Ave. .076
Nurse, DiplomaBase .079Max. .087Ave. .070
Nurse, LPNBase .110
Max. .098Ave. .088
Med. TechnicianBase .126
Max. .118
Ave. .098
DieticianBase .166
Max. .087Ave. .119
X-Ray TechnicianBase .153Max. .108
Ave. .129
PharmacistBase .112Max. .099
Ave. .068
Physical TherapistBase 117Max. .128Ave. .117
Nursing AssistantBase .159
Max. .124Ave. .156
Operating Rm. Tech.Base .140Max. .134Ave. .142
-151-
159

Occupation Coefficient of
Variation
Occuaptional TherapistBase .170
Max. .146
Ave. .148
Respiration TherapistBase .214
Max. .199
Ave. .179
Respiration Therapist AssistantBase .167
Max. .162
Ave. .146
Cert. Occupational Therapi Assistant
Base .208
Max. .180
Ave. .170
Cert. Lab. AssistantBase .178
Max. .129
Ave. .138
ClerkTypistBase .148
Max. .134
Ave. .132
JanitorBase .207
Max. .194
Ave. .194
MaidBase .136
Max. .125
Ave. .139
152
160

VI. Wage Coefficient of Variation by Occupation
Available from phoned survey, 79 hospitals.
Coefficient of
Occupation Variation
Nurses .114
Technicians .186
Office .175
-153-
161

APPENDIX C
Data Used in Calculating the Age and Education SpecificProbabilities of Pregnancy
Tables C-1 through C-3 show the number of births by age and educationfor 1967, 1968, an 1969 estimated from the National Natality Survey.These estimates were calculated by weighting each cell by the proportionof all births in that cell sampled in the survey. These estimates werecorrected for illegitimate births using the correction factors shown inthe tables. Tables C-4 through C-6 show the number of employed women byage and education for 1967, 1968, and 1969 as reported by the Bureau ofLabor Statistics. Tables C-7 through C-9 show the number of births toemployed women by age and education in the samples collected in the Na-tional Natality Survey for the years 1967, 1968, and 1969. Tables c-in
through C-12 show the estimated probability of pregnancy among employedwomen by age and education for the years 1967, 1968, and 1969.These probabilities were calculated as follows:
Bij
p(B/W)ij = (BWSij
) C )
Fij
)
BSij FijWij
Where:
p(B/W)ij = Probability of a birth given employed for age i, education j
BWSij = Number of births to employed women of age i and education jin the sample
BSij = Number of births to women of age i, education i in the
sample
Bij = Number of births to women of age i, education j in thepopulation
Fij
Wij
= Number of women of age i, education j in the population
= Number of employed women of age i, education j in thepopulation
The probabilities shown in chapter two are connected for the seculardecline in fertility between 1968 and 1973.
-41
162

Table C-1
Births by Age and Education, 1967*
Education
Age 0-8 9-11 12 13-15 16-17 Total
14-19 57320 244980 163199 99206 - 494706
20-24 103333 290271 665761 215144 53056 1327566
25-29 70272 140516 420477 152530. 1323R8 16183
30-34 61762 106528 190835 63799 45438 468361
35-39 42900 45351 106863 19618 20672 235401
40-44 17007 15218 30762 6511 3582. 73080
45 + 2441 - 1221 1953 - 5615
Total 355035 842864 15791:7 488761 255136 1520959
*These are estiraates from the National Natality Survey, correctedfor illegitimate births as follows:
Actual Births 1967 - Estimated Births 1967Estimated Births 1967
1035
-156-
163

Table C-2
Total Births by &ge and Education, 1968*
Education
Age 0-8 9-11 12 13-15 16-17 Total
14-19 57321 236726 178972 24694 00 503131
20-24 93913 973056 671942 216045 60451 1315426
95-29 67955 144318 442697 146856 157172 959918
10-14 50939 93473 170343 66715 60521 441992
35 -39 99021 35361 84553 23597 20888 193428
40-44 17426 14471 31028 14853 7098 84878
45 + 1233 1125 1233 - 3500
Total 116914 799431 1580678 497771 196759 3591564
*These are estimates from the National Natality Survey correctedfor illegitimate births, using a correction factor, of .1025.
-157-
164
---11,1

Table C-3
Births by Age and Education, 1969*
Education
Age 0-8 9-11 12 13-15 16-17 Total
14-19 62194 220859 180173 11416 - 474721
20-24 94817 291734 670381 240912 72588 1372412
2529 62102 142519 429724 192393 186613 1014055
30-34 56993 78591 189159 58641 66191 450276
35-31 33942 44287 77723 22215 25795 201961
40-44 14309 9126 17051 3964 , 5551 50003
45 + 258n 900 1912 - 5552
Total 327636 789116 1565201 531603 157444 1571000
*Estimated from the National Natality Survey, correcting for ille-gitimate births using a factor of .1015.
-158-
165

Table C-4
Female Employment by Age and Education, 1967
Education
Age 0-8 9-11 12 13-15 16 +Total
18 & over
18-19 57575 396960 1013220 179305 - 1645000
20-24 299364 487126 1972732 817494 410666 3833000
25-34 427230 868701 2254858 569640 631351 4747000
3544 873000 1187280 263060 570360 209520 5820000
45-54 1287880 1106406 2376724 544422 544422 5854000
55-64 1270490 71630 1006590 373230 403390 3770000
65 + 422282 166383 191681 94381 96227 973000
Total18 1 4476696 4929695 1143156, 3144346 266470) 26647000
Source: Special Labor Force Report No. 92, "Educational Attainmentof Workers," Monthly Labor Review, March 1967.
-159-
166

Table C-5
Female Employment by Age and EdLzation, 1Q68
Education
Age 0-8 9-11 12 13-15 16 +Total
18 & over
18-19 78430 368280 1074150 177320 1705 1705000
20-24 160563 415817 21037 87 955144 485806 4117000
25-34 415002 926163 2358426 647808 713601 5061000
35-44 843843 1197903 2661351 584199 613704 5901000
45-54 1295956 1094227 2598025 556282 568509 6113000
55-64 1212372 740894 1160866 392238 451668 3962000
65 + 432306 143115 217140 106596 86856 987000
Total18 + 4455360 4900896 12168702 3425058 2923830 278460nn
Source: Special Labor Force Report No. 103, "Educational Attainmentof Workers, March 1968," Monthly Labor Review, February 1969.
-160-
167
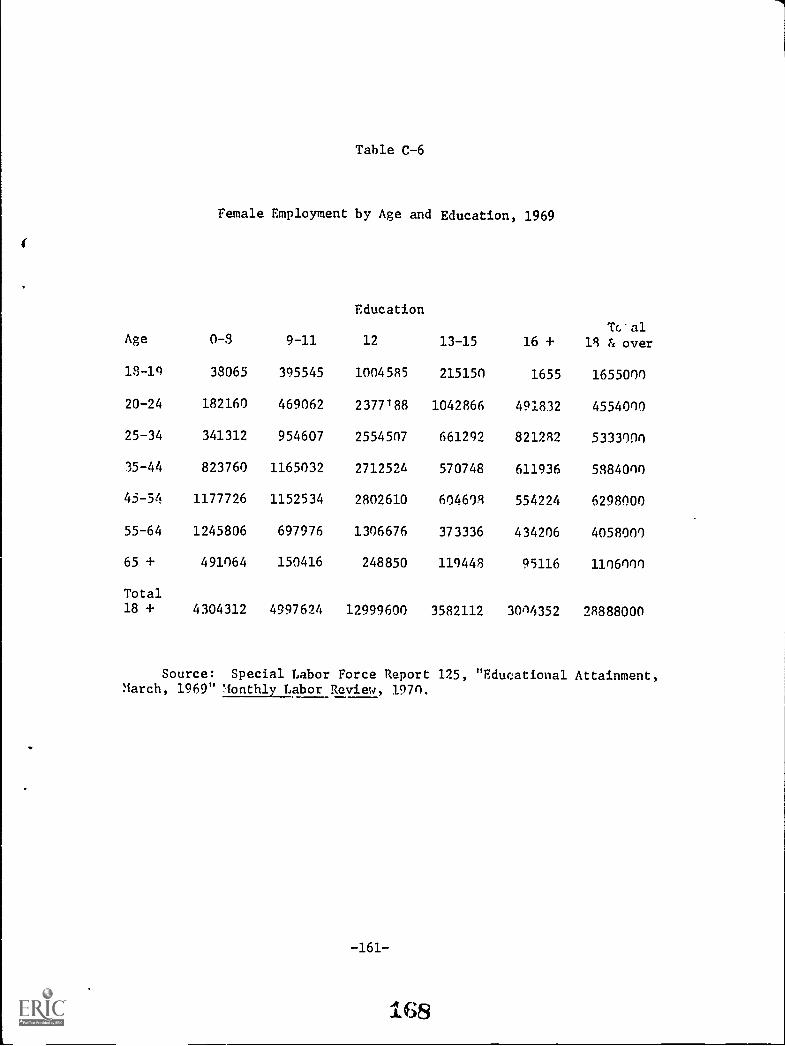
i
Table C-6
Female Employment by Age and Education, 1969
Education
Age 0-3 9-11 12 13-15 16 +Tc'al
1R & over
18-19 38065 395545 1004585 215150 1655 1655000
20-24 182160 469062 2377188 1042866 491832 4554000
25-34 341312 954607 2554507 661292 821282 5333000
35-44 823760 1165032 2712524 570748 611936 5884000
45 -54 1177726 1152534 2802610 604608 554224 6298000
55-64 1245806 697976 1306676 373336 434206 4058000
65 + 491064 150416 248850 119448 95116 1106000
Total18 + 4304312 4997624 12999600 3582112 3014352 28888000
Source: Special Labor Force Report 125, "Educational Attainment,March, 1969" Monthly Labor Review, 1970.
-161-
168
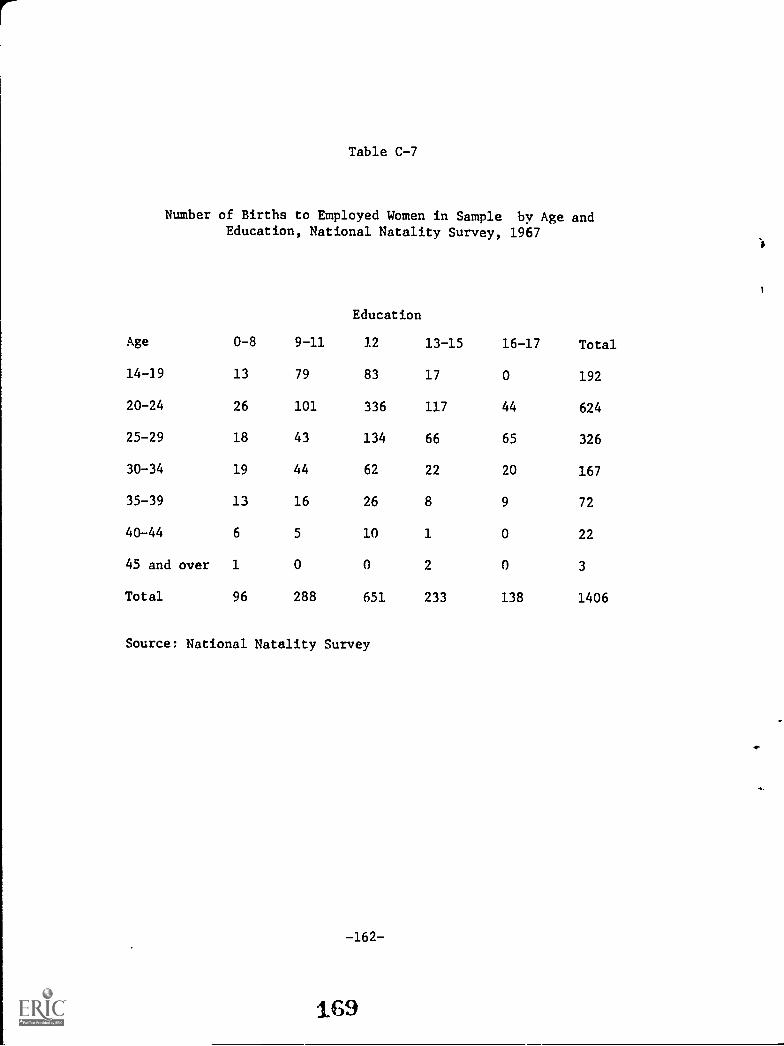
Table C-7
Number of Births to Employed Women in Sample by Age andEducation, National Natality Survey, 1967
Education
Age 0-8 9-11 12 13-15 16-17 Total
14-19 13 79 83 17 0 192
20-24 26 101 336 117 44 624
25-29 18 43 134 66 65 326
30-34 19 44 62 22 20 167
35-39 13 16 26 8 9 72
40-44 6 5 10 1 0 22
45 and over 1 0 0 2 0 3
Total 96 288 651 233 138 1406
Source: National Natality Survey
"P
-162-
169

Table C-8
Number of Births to Employed Women in Sample by Age andEducation, National Natality Survey, 1968
Education
Age 0-8 9-11 12 13-15 16-17 Total
14-19 9 87 103 18 1 218
20-24 26 98 320 121 40 605
25-29 29 58 175 88 100 450
30-34 17 42 62 24 23 168
35-39 11 17 27 10 6 71
40-44 4 8 11 3 5 31
45 and over 0 0 1 0 0 1
Total 96 310 699 264 175 1544

Table C-9
Number of Births to Employed Women in Sample by Age andEducation, National Natality Survey, 1969
Education
Age 0-8 9-11 12 13-15 16-17 Total
14-19 8 68 88 6 0 170
20-24 33 121 343 148 43 688
25-29 15 56 174 77 89 411
30-34 18 34 62 15 22 151
35-39 15 22 23 14 12 86
40-44 10 5 9 1 1 26
45 and over 0 0 0 1 0 1
Total 99 306 699 262 167 1533
Source: National Natality Survey
-164-
191

Table C-10
Probability of Pregnancy Among Employed Women, 1967
Education
Age 0-8 n-11 12 13-15 16-17 Total
20-24 .0787 .1028 .1705 .1405 .1115 .1601
25-34 .0789 .0906 .0108 .1622 .14')R ,0827
35-44 .021n .0166 .0141 ,0153 .0417 .0159
45-54 .0009 - - .0036 - .0006
Total
(20-54) .0261 .n527 .0627 .nonl .(1661 .0504
Total.
(20 +) .0034 .0425 .0555 .0759 .0537 .0482
-165-
172

Table C-11
Probability of Pregnancy Among Employed Women, 1968
Education
Age 0-3 9-11 12 13-15 16-17 Total
20-24 .0607 .2219 .1582 .2008 .oqns .15011
25 -34 .1030 .0962 .0188 .1661 .')1.25 .1177.
35-44 .0176 .0193 .0151 .0244 .0171 .11411
45-54 .0005 - .0002
Total
(20-54) .0304 .0587 .0615 .0024 .n721 .0620
Total(20 4.) .0190 .0452 .0548 .0828 .o.590 .0156
-166-
193
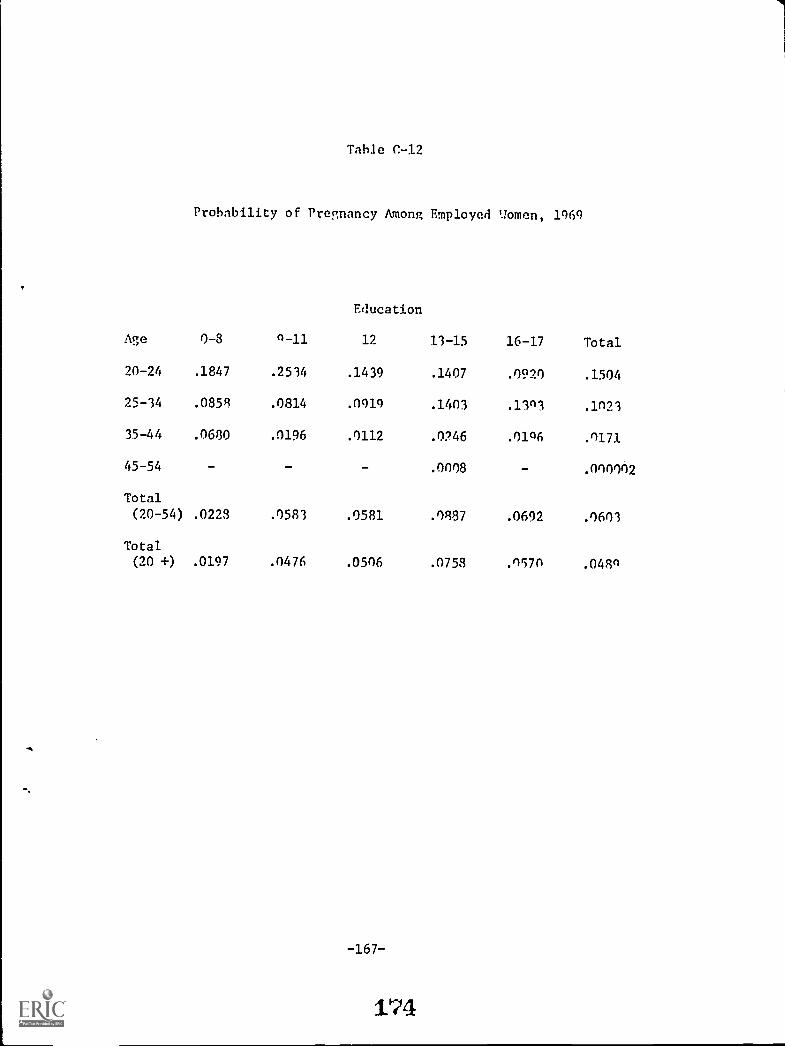
Table C-12
Probability of Pregnancy Among Employed Uomen, 1969
Education
Age 0-3 n-11 12 11-15 16-17 Total
20 -24 .1847 .2514 .1439 .1407 .0920 .1504
25-34 .0851 .0814 .0919 .1403 .1101 .1021
35-44 .0680 .0196 .0112 .0246 .0106 .0171
45-54 - - .0008 .000062
Total(20-54) .0223 .0583 .0581 .0187 .0692 .0601
Total(20 +) .0197 .0476 .0506 .0758 .0570 .048n
-167-
174

APPENDIX D
Additional Regression Results Using Hospital Data
The discussion in Chapter Five uses the regression results in-volving degree nurse, average monthly wage, and diploma nurse, aver-age monthly wage, from the imary data set of hospital data as itsfocal point. All of the analyses discussed there was also performedon four other wage rates available in the primary data set. They are:1) LPN, average monthly wage; 2) nursing assistant, average monthlywage; 3) clerk-typist, average monthly wage; 4) maid, average monthlywage. In general, the discussion in Chapter Five is applicable tothese regressions as well.
In addition to the average monthly wages, starting monthly wagesand maximum monthly wages are also available for the primary data set.The wage-effect analysis was also performed for these wages. Resultsare similar to those using average monthly wages. Results are notshown here, but simple correlation coefficients between wages withinoccupations are shown.
Finally, the results of the analysis using the secondary dataset are shown in this appendix. There are two wage rates used:1) average hourly wages for clerical personnel and 2) average hourlywages for nursing assistants. Results of the wage effect and substi-tution effect analysis are shown.

Table D-1
Definition of Independent Variables
I = Intercept
Fringe Benefit Variables (F)
VAC = Number of weeks of vacation
SD = Number of days of compensated sick days
HOS = Hospitalization insurance: 1 if provided, 0 otherwise
>11 = Major medical insurance: 1 if provided, 0 otherwise
LIFE = Life insurance: 1 if provided, 0 otherwise
LTD = Long-term disability insurance.: 1 if provided, 0 otherwise
PEN = Pension plan: 1 if provided, 0 otherwise
Maternity Leave Variables
MAT = Maternity leave treated as a temporary disability: 1 if provided,0 otherwise
MATP = Maternity leave -ag distribution interaction term: MAT * P
P = Age distribution term: proportion of nurses ages 17 to 39
Control Variables (C)
POP = Natural logarithm of population of city in which hospital is located
RENT = Median rental value of housing in city in which hospital is locate4
U = Union variable: 1 if present, 0 otherwise
BEDS = Beds per nursing perz,onnel (used in secondary data set only)
-170-
1.7 6

Table D-2
Simple Correlation Coefficients Between Wage Rates by OccupationGroup, Primary Hospital Data Set
DegreeNurse
BaseMax.Ave.
Base
BaseMonthly Wage
1.000
1.000
MaximumMonthly Wage
.238
1.000
.586
AverageMonthly Wage
.532
.8611.000
.777Diploma Max. 1.000 .863Nurse Ave. 1.000
Base 1.000 .759 .915LPN Max. 1.000 .895Nurse Ave. 1.000
Base 1.000 .842 .937Nursing Max. 1.000 .921Asst. Ave. 1.000
Base 1.000 .705 .910Clerk- Max. 1.000 .807Typist Ave. 1.000
Base 1.000 .897 .949Maid Max. 1.000 .945
Ave. 1.000
_171-
177

Table D -3
:srimated nelression Coefficients, Hage Effect, Hospitals,
Primary Data Set'
10.4
4\1
Dependent
Variable`
LPN
1 ::ursine.
..,Asst.
Clerk-
Typist
!aid
I
438.90
257.94
281.71
227.55
NAC
-22.03
(-3.93)*4
-9-54
(1.40)
-2.69
(.36)
-7.56
(.94)
.16
(.14)
.50
(1.00)
-.06
(.18)
.11
'.13)
loc
7.37
(.17)
-21.15
(.39)
31.70
(.44)
10.43
(.14)
'CI
14.56
(.79)
-3.33
(.15)
-7.87
(.32)
-.62
(.02)
Lire
15.67
(1.15)*
17.36
(1.03)
-14.92
(.78)
23.44
(1.13)
LTD
-9.70
(.73)
-2.14
(.:4)
29.15
(1.59)
-16.31
(.81)
PEN
-5.63
(.35)
-17.21
(.37)
-4.65
(.18)
8.22
(.29)
MAT
-142.84
(-2.89)',*
-84.32
(1.41)
-42.58
(.53)
-57.02
(.66)
'111P
237.39
(3.10)**
153.99
(1.71)*
81.45
(.67)
125.93
(.97)
P17_39
-134.19
(3.33)**
-59.13
(.88)
-130.16
(1.76)*
-74.06
(.39)
POP
7.30
(1.79)*
6.23
(1.26)
5.56
(1.02)
7.58
(1.30)
RENT
1.16
(2.94)**
1.34
(2.79)**
1.19
(2.23","
.31
(2.'9) **
11.1'''
:.83)
2.23
(.14)
22.14
'1.29)
,.72)
,a
43 43
41
8-
.68
.62
.46
.3:
F-
Valle
4.97
3.5n
1.37
2.3n
.
..Tdation Lsttlated:
: =
+ 3F r YC +
I - works
lonthly ':aces

Table D -4
Estimated Regression Coefficients, Wa:;e Effect,
Secondary Data Set
Nursing
?ersonnel
Office
Personnel
1
3.05
1.13
VAC
.09
(1.30)
.13
(2.37)**
k:,
-.01
(.21)
-.01
(.95)
nos
-.14
(.49)
.37
(.27)
SOR
.29
(1.06)
-.01
(.06)
MI .06
(.37)
.03
(.53)
LIFE:
.16
(.91)
.03
(.22)
pr.
-.07
(.49)
.13
(1.13)
9AT
.06
(.42)
(.61)
POP
.01
(.13)
-6'1.'1 19)
RENT
.01
(1.52)
.01
(2.67)A*
U
-.03
(.42)
-.19
(1.2I.
3ED
..23
(3.45)**
2-
(4.1')
':
55 55
R2
.45
.51
F
2.9')
3.60
....,
L.,
1
**Significant ac 5,7: level

Table D-5
Simple Correlation Coefficients Between Fringe Benefits SecondaryHospital Data Set
VAC
SD
HOS
SUR
MM
LIFE
PEN
MAT
VAC
1.000
SD
.026
1.000
HOS
.006
.172
1.000
SUR
.008
.201*
.633*
1 000
MM
.064
-.074
.040
.152
1.000
LIFE
-.165
.097
-.052
.208*
-.021
1.000
DEN
.21Q
.304*
.012
-.234*
-.001
.106
1.000
MAT
-.137
-.919*
-.207*
-.075
.081
.135*
-.005
1.000
*Significantly different from zero at 5% level
-174-
180

Table D-6
Estimated Regression Coefficients,
Substitution Effect,
Secondary Hospital Data Set
Independent Variables
Dependent
Variable
IVAC
SD
HOS
SUR
MM
LIFE
PEN
MAT
R2
VAC
2.027
-.002
.182
-.343
.212
-.386
.505
-.156
.10
.78
(.82)
S.76)
(.54)
(.57)
(1.16)
(1.79)*
(.53)
SD
-2.143
-.459
--.339
9.29
-3.17
6.54
7.64
-7.59
.201
.69
1
1-.
....,
(.83)
(.04)
(1.15)
(.58)
(1.34)
(1.83)*
(1.80)*
i e
`i J1
1HOS
.402
.010
-.000
.593
-.031
.130
-.071
-.124
.47
6.03
CC
(.30)
(.04)
(6,01)**
(.35)
(1.,66)*
(1.04)
(1.83)*
SUR
.186
-.024
.003
.728
.110
-.219
.103
.108
.5-
7.35
(.62)
(1.15)
(6.01)**
(1.14)
(2.65)**
(1.37)
(1.43)
.641
.033
-.002
-.084
.246
.028
-.025
.046
.05
.35
(.58)
(.58)
(.35)
(1.14)
(.21)
(.22)
(.40)
LIFE
.687
-.073
.006
.429
-.595
.034
.137
.335
.27
2.52
(1.16)
(1.34)
(1.66)*
(2.65)**
(.21)
(1.10)
(2.84)**
PEN
.150
.127
.009
-.314
.373
-.040
.183
.010
.19
1.53
(1.79)*
(1.83)*
(1.04)
(1.37)
(.22)
(1.10)
(.07)
`!AT
.385
-.021
-.009
-.540
.385
.073
.438
.010
.24
2.15
(.53)
(1.80)*
(1.84)*
(1.43)
(.40)
(2.84)**
(.06)
*Significant at 10% level
**Significant at
5% level

BIBLIOGRAPHY
Allen, Donna, Fringe Benefits: Wages or Social Obligation, Ithaca,New York, New York School of Industrial and Labor Relations, 1969.
American Hospital Association, Guide to Hospitals, various issues.
Hospital Statistics, 1971, Chicago (1972).
Baens, Maria, "Women Workers & Home Responsibilities", InternationalLabor Review, 69: 338-355 (1954).
Bailley, William R. any Schwenk, Albert E., "Employer Expenditures forPrivate Retirement and Insurance Plans", Monthly Labor Review, 95:17-19 (July, 1972).
Bauman, Alvin, "Measuring Employee Compensation in U.S. Industry", MonthlyLabor Review, 93: 17-19 (October, 1970).
Becker, Gary S., Human Capital, New York, Columbia University Press, 1964.
Belloc, N. B., "Labor Force Participation & Employment Opportunities forWomen", Journal of the American Statistical Associations 45 (September,1950) .
Bresenden, P.F., "Labor Mobility and Employee Benefits", Labor Law Journal,6: 726-768 (November, 1955).
*Brittain, John A., "The Incidence of Social Security Payroll Taxes", Ameri-can Economic Review (March, 1971).
Bowen, William G. and Finegan, T. A., The Economics of Labor Force Partici-Ration, Princeton, Princeton University Press, 1969, Chapters 5-7.
Bureau of Labor Statistics, Area Wage Surveys, various issues.
"Educational At::ainment of Workers", SpecialLabor Force Reports, Nos. 92, 103, 125.
Employee Compensation and Payroll Hours, 1968,Reports 335-1 to 335-11.
Employee Compensation in the Private Non-farmEconomy, Ball .1722, 1971.

Cohen, Malcolm S., "Married Women in the Labor Force: An Analysis ofParticipation. Rates", Monthly Labor Review, (October, 1969).
Current Estimates From the health Interview Survey, Health ResourcesAdministration, HRA 74-1512, September, 1973.
Ehrenberg, Ronald, Fringe Benefits and Overtime Behavior, Lexington,Mass., D.C. Heath and Co., 1971.
Greenwald, Carol, "Maternity Leave Policy," New England Economic Re-view, Federal Reserve Bank of Boston, (January/February, 1973).
Gutwillig, Jacqueline G., Address before the Conference of InterstateAssociation of Commissions on the Status of Women, St. Louis,June 19, 1971.
Hayden, Trudy, Punishing Pregnancy: Discrimination in Education, Em-ployment and Credit, ACLU Reports, Women's Rights Project, Octo-ber, 1973.
Hoel, Paul, Introduction to Mathematical Statistics, New York, JohnMiley and Sons, 1962.
Kiser, Clyde V., Grabell, Wilson H. and Campbell, Arthur A., Trends andVariations in Fertility in the United States, C....mbridge, HarvardUniversity.
Kmenta, Jan, Elements of Econometrics, New York, MacMillan Co., 1971.
Kolodrubetz, Walter W., "Two Decades of Employee-Benefit Plans, 1950-70: A Review," Social Security Bulletin 35: 10-22, (April, 1972).
Kurzyrowski, Adam, Continuity of Employment and Maternity, PanstwoweWydawncito Ekonomimme, Central School of Planning and Statisticsin Warsaw, Warsaw, Poland, 1967.
Lebergott, Stanley, "Population Change and the Supply of Labor," inDemographic and Economic Change, National Bureau of Economic Re-search, Princeton: Princeton University Press, 1960.
Mabry, Bevars, "The Economics of Fringe Benefits", Industrial Relations12:1. February, 1973, pp. 95-106.
Mincer, Jacob, "The Labor Force Participation of Married Women", inAspects of Labor Economics, a conference of the universities-National Bureau Committel for Economic Research Princeton:Princeton University Press, 1962.
"On the Job Training: Costs, Returns and Implications,"Journal of Political Economy, Supp. (October, 1962).
-178-
183

ir
National Manpower Council, Womenpower, New York, 1957.
Oi, Walter, "Labor as a Quasi-Fixed Factor," Journal of PoliticalEconomy, 70: 538-555 (December, 1972).
Piotrowski, Jerzy, Family Needs Resulting from an Increased Employ-ment of Married Women; Adequacy of Existing Resource to MeetThese Needs, Katedra Socjologic Pracy Instytutu GospodarstwaSpolecznego, Institute of Social Economy, Warsaw, Poland, Jan-uary 1969.
Rees, Albert, "On Equilibrium in Labor Markets", JournalEconomy., 78: 306-310, (March/April, 1970).
Rice, Robert C., "Skill, Earnings and the Growth of WageAmerican Economic Review, 56: 583-593 (May, 1966).
Ridley, Jeanne Clare, "Number of Children Expected in Relation to Non-Failial Activities of the Wife," Milbank Memorial Fund Quarterly,July 1959, Vol. 37, pp. 227-296.
of Political
Supplements,"
Rosen, Sherwin, "Short-Run Employment Variations on Class I Railroadsin the U.S. 1947-63," Economica 37 (December, 1963).
Shister, J., "Labor Mobility, Some Institutional Aspects," IndustrialRelations Research Association, Proceedings of the Third AnnualMeetiag., Chicago 1950, 42-59.
Sweet, James A., "Labor Force Reentry by Mothers of Young Children",Social Science Research, 1:2 (June, 1972).
Talbot, Joseph E., "An Analysis of 1968 Changes in Wages and Benefits,"Monthly Labor Review, 92: 43-48 (July, 1969).
Westoff, Charles F., Potter, Robert G, Sagi, Phillip C., and Mishler,Elliot G., Family Growth in Metropolitan America, Princeton:Princeton University press, 1961.
Willis, E. S., and Kaimer, F. R., "Employee Benefit Optior:s," IndustrialRelations Research Associations Procedures, 1968.
-179-
181