Embed Size (px)
Citation preview
DOCUMENT RESUME
ED 477 542 UD 035 721
AUTHOR Egemba, Maria Olivia; Crawford, James R.
TITLE An Analysis of Hispanic Students' Drop Out Rates.
PUB DATE 2003-04-00NOTE 58p.; Paper presented at the Annual Meeting of the American
Educational Research Association (Chicago, IL, April 21-25,2003).
PUB TYPE Reports Research (143) Speeches/Meeting Papers (150)EDRS PRICE EDRS Price MF01/PC03 Plus Postage.
DESCRIPTORS Citizenship; *Dropout Rate; *Dropouts; Early Parenthood;Employment Level; Gender Issues; Graduation; *HispanicAmerican Students; Language Proficiency; Low Achievement ;
Peer Influence; *Predictor Variables; Pregnancy; SecondaryEducation; Socioeconomic Status; Substance Abuse; UrbanEducation
IDENTIFIERS High School and Beyond (NCES)
ABSTRACT
This study examined factors associated with Hispanicstudents' high dropout rates, considering not only demographic factors butalso the role of family background, early school experiences, and socialinfluences in the high Hispanic student dropout rate. Data came from studentsin the High School and Beyond (HS&B) longitudinal study of the 1980 seniorand sophomore student cohort. The 1980 sophomore cohort dataset was takenfrom a highly stratified national sample of this group of students, 10 yearsafter high school. The HS&B survey included the 1980 senior class andsophomore class. Both cohorts were surveyed every 2 years through 1986, andthe sophomore class was surveyed again in 1992. Of the 3,251 Hispanicstudents in the study population, 2,341 graduated from high school, and 910dropped out. Analysis of data on those 910 students indicated that severalfactors significantly predicted Hispanic high school students' dropout rate:grade point average, socioeconomic status, employment, repeating a grade,citizenship, English proficiency, truancy, and urbanicity. Other contributingfactors included gender, friends' and siblings' academid status, substanceuse, and pregnancy/fatherhood. (Contains 77 references.) (SM)
Reproductions supplied by EDRS are the best that can be madefrom the original document.
An Analysis of Hispanic Students' Drop Out Rates
Paper Presented at the 84th Annual Meeting of theAmerican Educational Research Association
Chicago
April 21 - 25, 2003
Maria Olivia Egemba, Ed.D.
Clark County School District
James R. Crawford Ph.D.
University of Nevada, Las Vegas
BEST COPY AVAILABLE
U.S. DEPARTMENT OF EDUCATIONOffice of Educational Research and Improvement
EDUCATIONAL RESOURCES INFORMATIONCENTER (ERIC)
ViThis document has been reproduced asreceived from the person or organizationoriginating it.
Minor changes have been made toimprove reproduction quality.
Points of view or opinions stated in thisdocument do not necessarily representofficial OERI position or policy.
PERMISSION TO REPRODUCE ANDDISSEMINATE THIS MATERIAL HAS
BEEN GRANTED BY
CfradDrk_
TO THE EDUCATIONAL RESOURCESINFORMATION CENTER (ERIC)
1
f
ABSTRACT
The dropout crisis in the United States and particularly among the Hispanic students is amatter of serious concern for parents, educators, politicians, and the general public. Due to therapid technological advances, staying in school and graduating is crucial for preparing a skilled,knowledgeable, and flexible work force needed by America to compete in the global economy.Hispanic students are the largest-growing sector of the population and have the highest dropoutrate of any major segment of the U.S. population (Hispanic Dropout Project, 1996).
While the nation's high school dropout rates have improved among White and AfricanAmerican students, Hispanic students' dropout rates are still at alarming levels. Hispanic studentsare dropping out of school at a rate that does not show signs of diminishing - -with ultimateperilous costs to society. In 1994, the number of Hispanic students aged 16-24, who had notcompleted high school and were not enrolled, was 30 percent as compared to 8 percent forWhite students and 13 percent for African American students (Hispanic Dropout Project, 1996).
In order to devise genuine strategies that will reduce the Hispanic students' high dropoutrates, educational policy-makers and educational analysts must first abandon the prevalentpopular conceptions that place blame on the individual, indicting the student or family forlaziness, lack of willingness to be assimilated into American culture, and reluctance to learnEnglish. A common and pernicious belief condemns Hispanic students for their alienation fromschool without taking into account the power of contextual factors that influence their schoolexperiences.
This study offers a broad investigation into the factors that may be associated withHispanic students' high dropout rates. It considers not only the demographic factors but alsoinvestigates the roles of family background, early school experiences, and social influences inthe high Hispanic students' dropout rates.
The analysis was based on demographic factors, academic ability, family background,school experiences, and social influence factors taken from a national sample of high schoolsophomores twelve years after high school. Results suggest that factors related to citizenship,retention and SES are the primary determinants in Hispanic dropout rates.
INTRODUCTION
Today high school dropout rates are often quoted as an indication of the success
or failure of American schools. As the American economy demands a more educated and
highly trained work force, it has become increasingly important for American youth to
continue their education through high school and beyond. Much of the interest in
measuring dropouts stems primarily from the following:
First, there is concern about how well prepared our young adults are for entry into
the work force. Without a high school diploma, and increasingly, a college degree or
skilled training, chances for obtaining high quality, well-paid jobs are limited. The bulk
of the interest in measuring high school dropout rates stems from the concern over how
well prepared our young adults are for entry into the work force. As the emphasis on
skilled labor and technology increases in the workplace, a high school education serves
more and more as a minimum requirement for entry into the labor force (Markey, 1988).
This, then, leads to interest in a measure of the number of young adults who have
completed a high school program (Markey, 1988).
Second, research studies have highlighted that dropouts have a profound impact on our
society as nearly half the heads of household on welfare did not graduate from high
school and more than half of the U.S. prison population is composed of high school
dropouts. In essence, students who do not receive adequate education will be more
vulnerable to poverty, homelessness, crime, substance abuse, and other negative factors
(IDRA, 1986).
George Bush, in his First State of the Union Address, January 1990, set some
goals to strengthen American education. One of the goals was to reduce the national high
4
school dropout rate to 10 percent by the year 2000. According to president Bush at the
time, the rate was 25 percent. This high rate, it is said, saddles the United States with an
undereducated work force that, in turn, retards economic and social development.
Dropouts also cost the nation billions of dollars in lost tax revenues and in welfare,
unemployment, and crime prevention programs (Hahn and Danzberger, 1987).
The latest figures from the US government have been recently released, covering
the academic year 1994-95 (McMillan, Kaufman, and Klein, 1997). Defining the dropout
rate as the proportion of young adults (ages 16 to 24) who are not enrolled in a high
school program and who have not completed high school, the Hispanic students recorded
the highest dropout rates in the nation: 30 percent of Hispanic young adults were
classified as dropouts, compared to 8.6% for non-Hispanic whites and 12.1% for non-
Hispanic blacks.
According to the Hispanic Dropout Project (HDP, 1996), a student who drops out
of high school is more likely to be unemployed, more likely to earn less when employed,
and more likely to raise a family in poverty therefore putting the next generation at risk of
dropping out, and repeating this cycle (U.S. Department of Education, 1998a). High
dropout rates lead to increased unemployment, increased demands on social services, and
a less skilled work force (Rumberger, 1987). The employment possibilities for a high
school dropout are greatly restricted (U.S. Department of Education, 1998a, p. 6). For
example, dropouts in 1982 were twice as likely to be unemployed (42%) compared to
1982 high school graduates (23%) (Rumberger, 1987). The effects on an individual's
lifetime earnings are even more dramatic: for Hispanic students, the projected loss in
5
2
lifetime earnings for dropouts is $47.9 billion for the class of 1998 (U.S. Department of
Education, 1998a).
But education should not be seen strictly in its relation to the economy; the
capability of education to advance the social well-being of the United States and promote
democratic values are also essential. Social peace in the United States is predicated on the
possibility that all citizens, regardless of their economic and social status, can improve
their lives. The dropout problem also threatens the future of American political
institutions. The demands of democratic governance require an educated and well-
informed citizenry to make knowledgeable decisions about the increasingly complex
social and political problems faced by contemporary society.
Past studies on student dropout rates centered primarily on demographic factors
such as sex, ethnicity, and family socioeconomic status. These factors may not be the
key causes of students dropout but an over rationalization or simplification of a more
complex problem. This study considers not only the demographic factors but also
investigates the roles of family background, school experiences, and social influences in
the high Hispanic students' dropout rate. The data for this study was taken from a
national sample of high school sophomores 10 years after high school.
There is little systematic, longitudinal, large-scale research aimed specifically at
the high Hispanic students' dropout rates even though studies have shown that Hispanics
are the fastest growing ethnic segment in America. In 1996, the total school enrollment in
K-12 was 51.5 million and this is projected to increase to over 54.3 million by 2004
(Gerald and Hussar, 1997). The number of Hispanic children aged 5-17 years is expected
to grow by a third in the next decade and to more than double by 2025, whereas the
6 3

number of African-American children aged 5-17 years is expected to grow by a quarter
by 2025 (U.S. Bureau of the Census, 1997; National Research Council, 1997).
Consequently, the projected change in the racial/ethnic composition of school-aged
children implies a substantial increase in the size of the educationally disadvantaged
population. According to Natriello, McDill, and Pallas (1990), report that, "Failure to
educate the educationally disadvantaged adequately may have catastrophic consequences
for the social and economic well-being of this country."
However, the decision to dropout of school is a complex and diverse affair. It is a
process, not an event because it is uncommon for a student to make an overnight decision
to leave school. Students from minority backgrounds particularly the Hispanic students
face both structural and individual obstacles during the school year that place them at risk
of educational failure (Berends and Koretz, 1996; Natriello, McDill, and Pallas, 1990;
and Wilson, 1991).
To adequately understand the dynamic process that determines whether or not a
student stays in school or drops out requires consideration of the student and the demands
in the student's life, the school experiences, the local policies and practices, the state and
federal policies that shape and reflect the social and educational views of the nation, and
much more. Most of the past research studies on student dropout centered primarily on
demographic factors such as sex, ethnicity, and family socioeconomic status. For
instance, prior research has shown that poverty tends to be highly correlated with lower
student achievement (Berends and Koretz, 1996; Grissmer, Kirby, Berends, and
Williamson, 1994; Hill and O'Neill, 1994). These factors may not be the key causes of
student dropout but an over rationalization or simplification of a more complex problem.
74
Therefore, this study offers a broad investigation into the factors that may be
associated with the high Hispanic students' dropout rate. It considers not only the
demographic factors but also investigates the roles of family background, school
experiences, and social influences in Hispanic students' dropout.
Research Questions
The study addressed itself to the following specific research questions:
1. Are there differences in SES between the Hispanic students who complete
high school diploma and those who dropout?
2. Are there differences in Test Scores between the Hispanic students who
complete high school diploma and those who dropout?
3. Are there differences in Sex between the Hispanic students who complete
high school diploma and those who dropout?
4. Are there differences in Employment Status (ES) between the Hispanic
students who complete high school diploma and those who dropout?
5. Are there differences in Sibling Academic Status (SAS) between the Hispanic
students who complete high school diploma and those who dropout?
6. Are there differences in Repeating a Grade (Held Back /Retained) between the
Hispanic students who complete high school diploma and those who dropout?
7. Are there differences in Citizenship Status/English Proficiency between the
Hispanic students who complete high school diploma and those who dropout?
8. Are there differences in Pregnancy/Fatherhood between the Hispanic students
who complete high school diploma and those who dropout?
85
9. Are there differences in Alcohol and Drug Use between the Hispanic students
who complete high school diploma and those who dropout?
10. Are there differences in Friends Interest in School between the Hispanic
students who complete high school diploma and those who dropout?
11. Are there differences in Truancy between the Hispanic students who complete
high school diploma and those who dropout?
12. Are there differences in Location of School (Urbanicity) between the Hispanic
students who complete high school diploma and those who dropout?
REVIEW OF RELATED LITERATURE
Dropping out is a complex social problem for which there is no simple solution.
Focusing attention on fixing one part of the problem calls attention to the need for
solutions to many other parts as well. Thus, many educators and others concerned with
the dropout problem are advocating policies involving a broad range of institutions and
agencies (e.g., Hargroves 1987).
The school dropout rate for Hispanic students has remained a consistent problem
over the past 40 years and, as recently as 1993, about 30 percent of the United States'
Hispanic population ages 16 to 24 had dropped out of school. This is in comparison to an
overall rate of 11 percent, an 8 percent rate for white non-Hispanics, and a 13 percent rate
for African-Americans. This is causing increasing concern among many educators as the
Hispanic population grows dramatically, and it will be a disaster for a large percentage of
the labor force to lack a high school education. According to Dr. Walter Secada, director
of the Hispanic Dropout Project (HDP), "An undereducated and under-skilled Hispanic
96
workforce is harmful not only to Hispanics who drop out, but to the American economy
and larger non-Hispanic population as well." (HDP, 1996)
In order to prepare American students for today's high tech jobs and subsequentlythe types of jobs that will be available in the future, educators, policy-makers, parents,and educational analysts need to work together to ensure that all students stay in school
and acquire the academic skills necessary to compete (National Education Goals Panel,
The National Education Goals Report: Building a Nation of Learners, Washington, DC,
1996). As the Hispanic population grows, the reduction of the Hispanic students' dropout
rates, the successful transition of Hispanic youth from school to work, and their active
engagement in American society become more important for the Nation.
Out of a total 9.9 million young adults aged 15-24 enrolled in high school in
October 1996, some 454,000 had quit school by October 1997, without successfully
completing a high school program, according to a new government report to Congress
(NCES, 1997). Notwithstanding the short-term downtrend in dropout rates, the high
school completion rate has shown only a slight change over the past decade, moving up
to 85.9 percent in 1997 from 85.5 percent in 1987 (NCES, 1997). In 1997, just over
three-quarters (76.7 percent) of the 18- to 24-year-olds not still in high school were
reported as being high school graduates. Another 9.1 percent completed an alternative
route, such as the GED (NCES, 1997).
In their report, Dropout Rates in the United States: 1997, released in 1997 by the
U.S. Department of Education's National Center for Education Statistics, Phillip
Kaufman, Steve Klein, and Mary Frase warn that, "The economic consequences of
leaving high school without a diploma are severe." The report is the tenth in the series
and presents data for 1997 on high school dropout rates, high school completion rates,
and graduation rates.
i07
According to Kaufman, Klein, and Frase (NCES,1997), compared to high school
graduates, dropouts are:
More likely to be unemployed;
More likely to earn less money;
More likely to receive public assistance; and
If female, more likely to have children at younger ages and more likely to be asingle parent.
The authors add that, "The individual stresses and frustrations associated withdropping out have social implications as well because dropouts comprise adisproportionate percentage of the nation's prison and death row inmates."
The Hispanic Dropout Project (HDP,1996) has published a Data Book, which
shows the scope of the Hispanic dropout problem, its causes, and its consequences.
According to the Data Book, social and economic costs are escalating for many reasons:
The Hispanic population is rapidly growing, in both absolute numbers and as a
proportion of US students
Fewer dropouts will find employment in future workplaces
Upgraded workforce skills are critical for an individual's and the nation's
successes in the global economy
People need increasingly more advanced knowledge and skills to participate in
this society, to vote intelligently, and to make intelligent consumer decisions
Labor force productivity and income must expand to help meet the needs of
senior citizens as they continue to make up a larger segment of our population
Children of the future will be strongly affected by their parents' income and
education levels.
118
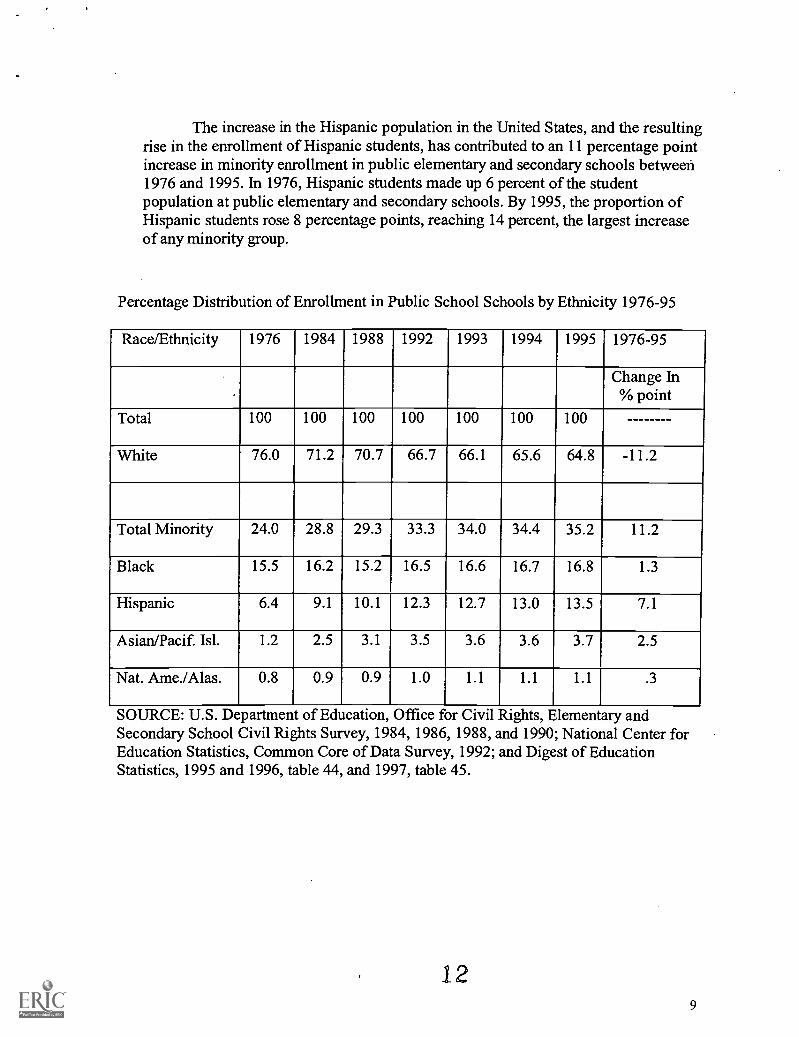
The increase in the Hispanic population in the United States, and the resultingrise in the enrollment of Hispanic students, has contributed to an 11 percentage pointincrease in minority enrollment in public elementary and secondary schools between1976 and 1995. In 1976, Hispanic students made up 6 percent of the studentpopulation at public elementary and secondary schools. By 1995, the proportion ofHispanic students rose 8 percentage points, reaching 14 percent, the largest increaseof any minority group.
Percentage Distribution of Enrollment in Public School Schools by Ethnicity 1976-95
Race/Ethnicity 1976 1984 1988 1992 1993 1994 1995 1976-95
Change In% point
Total 100 100 100 100 100 100 100
White 76.0 71.2 70.7 66.7 66.1 65.6 64.8 -11.2
Total Minority 24.0 28.8 29.3 33.3 34.0 34.4 35.2 11.2
Black 15.5 16.2 15.2 16.5 16.6 16.7 16.8 1.3
Hispanic 6.4 9.1 10.1 12.3 12.7 13.0 13.5 7.1
Asian/Pacif. Isl. 1.2 2.5 3.1 3.5 3.6 3.6 3.7 2.5
Nat. Ame./Alas. 0.8 0.9 0.9 1.0 1.1 1.1 1.1 .3
SOURCE: U.S. Department of Education, Office for Civil Rights, Elementary andSecondary School Civil Rights Survey, 1984, 1986, 1988, and 1990; National Center forEducation Statistics, Common Core of Data Survey, 1992; and Digest of EducationStatistics, 1995 and 1996, table 44, and 1997, table 45.
129
The Social and Individual Costs of Dropping Out
Studies have shown that withdrawal from school has adverse social and individual
implications and, consequently, should not be overlooked. The most apparent of the two
is, the societal implications, which researchers outlined to include greater unemployment,
added social service costs, as well as increases in crime. However, the less publicized or
less understood factor is the individual costs associated with leaving school without
graduating.
Costs to Individuals
The requirement of today's American work force has changed dramatically as the
emphasis on skilled labor and technologies have increased in the work place.
Consequently, young adults who leave school before graduating and acquiring needed
skills will suffer greater penalties both in unemployment and underemployment rates than
their counterparts who do complete high school (Bickel & Papagiannis, 1988).
Besides the higher unemployment and underemployment rates that relegate most
school dropouts to lower social status and lower standards of living, associated with
residing at the bottom of the social economic ladder, researcher studies points out that
leaving school early without graduating creates a host of problems and negative effects
(Catterall, 1987).
Although the connection between dropping out and criminal behavior has not yet
been unequivocally established, the high representation of dropouts among those in
prison suggests that dropouts are individuals who may have seen too few options
available to them and so have found themselves in circumstances which promote criminal
behavior (IDRA, 1989).
1310
Rumberger (1987) reports that dropouts often suffer from more health and dental
problems, increases in total mortality and suicides, and are admitted in greater numbers to
mental hospitals than those in the general population. For too many dropouts, school is
seen as a place where they have encountered failure after failure (for a variety of reasons)
resulting in lower self-esteem (Bickel & Papagiannis, 1988; Catterall, 1987).
Costs to Society
The society in general pays a price for student dropouts. As a consequence of the
high dropout rates and subsequent unemployment or underemployment, the decreased
earning power and loss of tax revenue from those who leave early is substantial. Its
impact on social welfare services is equally tremendous. The state of Texas is probably
the only state in America that has made a genuine effort as well as conducted a fairly
comprehensive study over a decade ago to assess the dropout costs to its state (Markey,
1988).
In a fairly comprehensive study commissioned by the state of Texas over a decade
ago and conducted by the Intercultural Development Research Association (IDRA), that
analyzed the cost of students leaving school early in Texas, the Intercultural
Development Research Association (IDRA) projected that the total earnings and tax
losses to the state of Texas due to projected attrition rates among 1982-1983 ninth graders
dropouts alone was nearly $16.9 billion (IDRA, 1986). They estimated that "45,344
males and 40,656 females ninth graders would drop out of school, that their lifetime
earnings (adjusted for differences between expected income for graduates and those for
dropouts) would be $241,630 for males and $146,072 for females, and that this would
result in a loss of earnings of nearly $17 billion (including $5.068 billion in lost tax
1411
revenues)" (IDRA, 1986, p. 29). If that is the case, imagine the cost when the tenth,
eleventh, and twelfth graders dropouts are included. Consequently, the issue of school
dropout becomes significant because society cannot afford to undermine it.
The Importance of Dropout Intervention and Prevention ProgramsResearch studies have highlighted that dropouts have a profound impact on
society as nearly one-half of the heads of household on welfare did not graduate from
high school and half of the U.S. prison population constitute high school dropouts. In the
IDRA study the costs to the state of Texas for social welfare services, unemployment,
crime and incarceration, and educating those dropouts who had left school earlywere
also calculated. The burden to the state of Texas for only two social welfare programs
alone (Aid to Families with Dependent Children and Food Stamps) was estimated at
$253.7 million a year. The cost associated with increased unemployment (job placement
services, unemployment compensation) was estimated at $17.6 million annually. With
regard to costs associated with crime and incarceration, IDRA estimated that the state of
Texas increased expenditures approximately $367.77 million. Finally, the cost of training
and adult education was set at $12.9 million per annum. The total possible savings
associated with keeping students in school was calculated to be approximately $652
million per year in Texas alone!
To demonstrate the difference between the cost of keeping children in school and
the costs associated with their dropout, IDRA figured that in order to educate those
potential dropouts and provide programs which would prevent them from doing so, it
would cost the state of Texas nearly $2 billion per cadre (one class as it moves through
grade levels). When compared to just the lost wages and tax revenues of nearly $17
1512
billion, the result is an almost 9 to 1 ratio. That is, for every dollar spent on education and
the prevention of dropouts, the return would be nine dollars.
These fairly comprehensive figures from IDRA study represent a cost-benefit
analysis for only one state. If those calculations can be generalized to the rest of the
country, (Texas dropouts represent nearly 10% of the national dropout figure) then the
cost to the nation (in terms of the social services mentioned above) would exceed $6.5
billion dollars a year. The loss of earnings and tax revenues over the lifetime of a single
cadre would be over $170 billion. Given the findings of the study, society can not afford
to take the dropout problem lightly.
Highlighted the Impacts of Student Tracking:
Tracking is the most commonly used term for ability grouping. Traditionally,
schools have responded to student diversity and poor academic performance with
approaches such as ability grouping, grade retention, special education, and pull-out
programs -- in which students are removed from their regular classrooms and offered
remedial instruction in particular subjects (Letgers, McDill, & McPartland, 1993). As
harmless as it seems, research has dramatically demonstrated that, this practice has done
more harm than good. The tracks covered distinctly different curricula. This study calls
the attention of educators and the educational policy-makers to the consequences of
student tracking. It also highlights how they, the educational policy-maker, can set a
policy context for high expectations and success, how important the investment in school
dropout prevention and intervention program are in order to reduce school failure, as well
as, how these strategies can be sustained through ongoing support for school
improvement.
1613
At the present, no researcher has performed a comprehensive study to identify
different factors between Hispanic graduates and Hispanic dropouts. This study validated
past studies done on Hispanic students' dropout rates that used only demographic
variables sex, ethnicity, and SES. It also examined the roles of the contextual factors
such as: family background, school experiences, and social influences in Hispanic
students' dropout as well as investigated the differences between the Hispanic students
who completed their high school diploma and those who dropped out.
Method
This study validates past studies done on Hispanic students' dropout rates that
used demographic variables sex, ethnicity, and SES. It also investigates the roles of the
contextual factors such as: family background, school experiences, and social influences
in the high Hispanic students' dropout rates; as well as examines the differences between
the Hispanic students who completed their high school diploma and those who dropped
out.
In particular, the study offers a broad investigation into the factors that may be
associated with the high Hispanic students' dropout rate. It considers not only the
demographic factors but also investigates the roles of family background, school
experiences, and social influences in the Hispanic students' dropout.
The analysis was based on the demographic, academic ability, family background,
school experiences, and social influence factors taken from a national sample of high
school sophomores twelve years after high school. The variable Dropout was the
dependent variable; while the independent variables were:
i. Family Socioeconomic Status (SES),
1714
ii. Academic Ability (Test Score),
iii. Student Gender (Sex),
iv. Employment Status (ES),
v. Sibling Academic Status (SAS),
vi. Repeated a Grade (Retained),
vii. Citizenship Status (CS)/English Proficiency,
viii. Pregnancy/Fatherhood (PF),
ix. Alcohol and Drug Use (ADU),
x. Friends Academic Status /Interest in School (Friends),
xi. Cut Classes (Truancy/Absenteeism), and
xii. High School Location (Urbanicity).
In order to develop a predictable model, Family Socioeconomic Status (SES),
Academic Ability (Test Score), Sex, Ethnicity, Employment Status (ES), Sibling
Academic Status (SAS), Repeated a Grade (Retained), Citizenship Status (CS)/English
Proficiency, Pregnancy/Fatherhood (PF), Alcohol and Drug Use (ADU), Friends Interest
in School (Friends), Cut Classes (Truancy), and High School Location (Urbanicity) are
used as the independent variable while Dropout is used as the dependent variable.
Design
The HS&B database captured the periodic changes and progress in students'
educational and non-educational activities due to its longitudinal nature. Students were
classified by the following independent variables: academic ability (test score), race
(ethnicity), family socioeconomic status (SES), gender (sex), employment status (ES),
sibling academic status (SAS), repeated a grade (retained), citizenship status
1815
(CS)/English Proficiency, pregnancy/fatherhood (PF), alcohol and drug use (ADU),
friends interest in school (friends), cut classes (truancy), and high school location
(urbanicity).
Beginning with the first follow-up year, 1982, and through the subsequent follow-
ups, those students whose race/ethnicity were classified as Hispanic were identified.
Students who were not classified as Hispanic were eliminated from the sample. This
process reduced the number of students from 14,825 to 3,251.
Of all the independent variables, the following variables: gender (sex), citizenship
status (CS)/English Proficiency, alcohol and drug use, employment status (ES),
pregnancy/fatherhood (PF), repeated a grade (retained), friends dropped out, sibling
dropped out (SAS), and interested in school are naturally dichotomized. Academic
ability (GPA), family socioeconomic status (SES), ethnicity (race), cut classes (truancy),
and high school location (urbanicity) have many different classes. For instance, ethnicity
was comprised of Black, White, Asian, Hispanic, or Native American; SES consisted of
Upper, Upper-Middle, Middle, and Lower quartiles; and GPA embraced eight different
levels.
1916
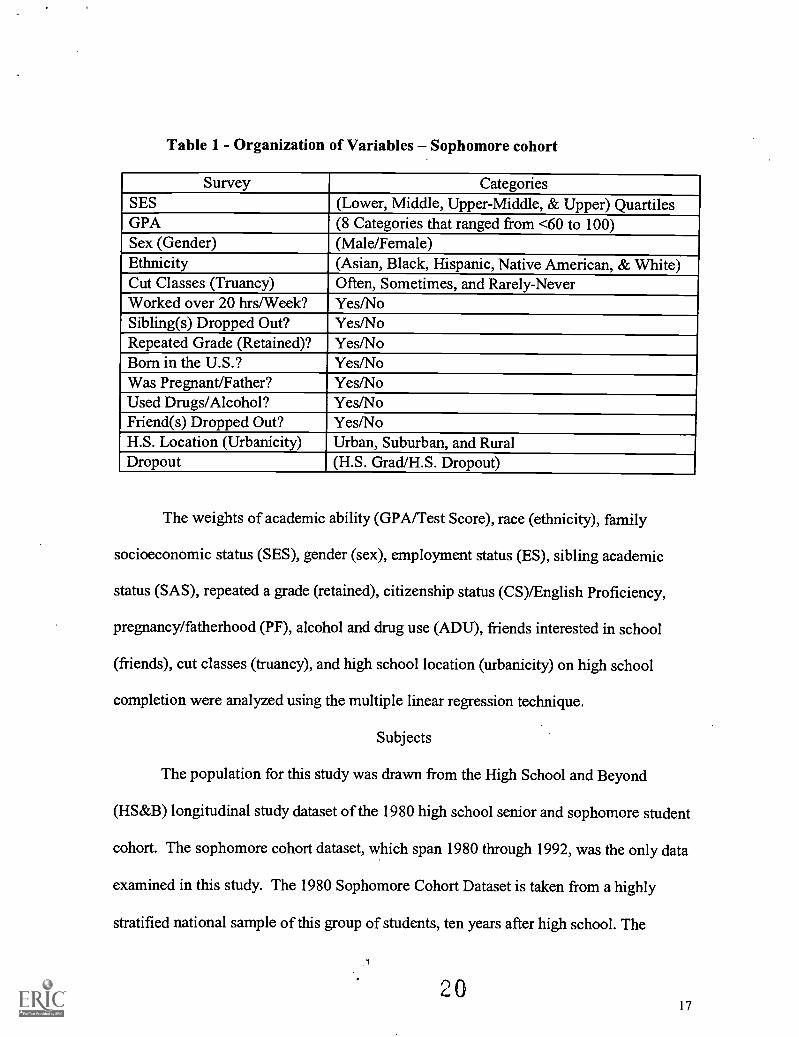
Table 1- Organization of Variables Sophomore cohort
Survey CategoriesSES (Lower, Middle, Upper-Middle, & Upper) QuartilesGPA (8 Categories that ranged from <60 to 100)Sex (Gender) (Male/Female)Ethnicity (Asian, Black, Hispanic, Native American, & White)Cut Classes (Truancy) Often, Sometimes, and Rarely-NeverWorked over 20 hrs/Week? Yes/NoSibling(s) Dropped Out? Yes/NoRepeated Grade (Retained)? Yes/NoBorn in the U.S.? Yes/NoWas Pregnant/Father? Yes/NoUsed Drugs/Alcohol? Yes/NoFriend(s) Dropped Out? Yes/NoH.S. Location (Urbanicity) Urban, Suburban, and RuralDropout (H.S. Grad/H.S. Dropout)
The weights of academic ability (GPA/Test Score), race (ethnicity), family
socioeconomic status (SES), gender (sex), employment status (ES), sibling academic
status (SAS), repeated a grade (retained), citizenship status (CS)/English Proficiency,
pregnancy/fatherhood (PF), alcohol and drug use (ADU), friends interested in school
(friends), cut classes (truancy), and high school location (urbanicity) on high school
completion were analyzed using the multiple linear regression technique.
Subjects
The population for this study was drawn from the High School and Beyond
(HS&B) longitudinal study dataset of the 1980 high school senior and sophomore student
cohort. The sophomore cohort dataset, which span 1980 through 1992, was the only data
examined in this study. The 1980 Sophomore Cohort Dataset is taken from a highly
stratified national sample of this group of students, ten years after high school. The
17
HS&B data were not only highly stratified, but also involved over 1,100 secondary
schools that were randomly selected to participate in the study. From the 1,100
secondary schools, 36 seniors and 36 sophomores were selected in each school. The base
year of this survey, which was conducted early in 1980, collected data from over 28,000
seniors and 30,000 sophomores. However, the senior files were discarded for this study
because they were followed for only six-years, while the sophomores were followed for
12-years. Only those sophomores whose ethnicity was identified as Hispanicwere
included in the research cohort.
The HS&B survey included two cohorts: the 1980 senior class, and the 1980
sophomore class. Both cohorts were surveyed every two years through 1986, and the
1980 sophomore class was surveyed again in 1992.
Consequently, a base year and three follow-up surveys were conducted at 2-year
intervals for the sophomores and seniors. Base year data were collected in the spring of
1980 from nationally representative samples of over 30,000 sophomores and 28,000
seniors. A subset (14,825) of the 30,000 sophomores was surveyed.
The first follow-up data were collected in the spring of 1982 and included 29,737
of the 1980 sophomores and a subset of 11,995 of the 1980 seniors. But only a subset of
the sophomores (14,825) was surveyed.
The second follow-up data files include subsets of 14,825 of the 1980 sophomores
(92% of whom participated in 1984) and 11,995 of the 1980 seniors (91% of whom
participated in 1984).
21
18
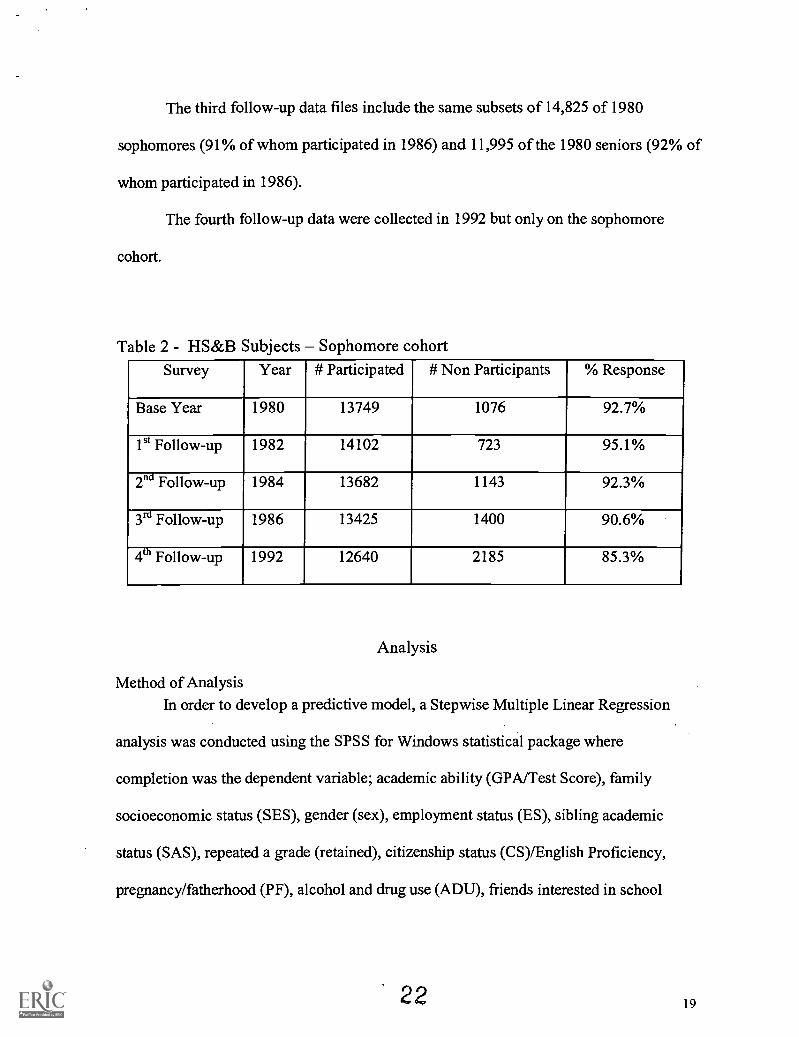
The third follow-up data files include the same subsets of 14,825 of 1980
sophomores (91% of whom participated in 1986) and 11,995 of the 1980 seniors (92% of
whom participated in 1986).
The fourth follow-up data were collected in 1992 but only on the sophomore
cohort.
Table 2 - HS&B Subjects Sophomore cohort
Survey Year # Participated # Non Participants % Response
Base Year 1980 13749 1076 92.7%
1St Follow-up 1982 14102 723 95.1%
2nd Follow-up 1984 13682 1143 92.3%
3rd Follow-up 1986 13425 1400 90.6%
4th Follow-up 1992 12640 2185 85.3%
Analysis
Method of AnalysisIn order to develop a predictive model, a Stepwise Multiple Linear Regression
analysis was conducted using the SPSS for Windows statistical package where
completion was the dependent variable; academic ability (GPA/Test Score), family
socioeconomic status (SES), gender (sex), employment status (ES), sibling academic
status (SAS), repeated a grade (retained), citizenship status (CS)/English Proficiency,
pregnancy/fatherhood (PF), alcohol and drug use (ADU), friends interested in school
22 19
(friends), cut classes (truancy), and high school location (urbanicity) were the
independent variables.
The Stepwise model was chosen because it enabled the evaluation of each
independent variable's contribution in explaining the dependent variable Dropout. At
each step, the weight of each variable was calculated to determine the contribution of
each variable to the prediction.
The multiple linear regression technique requires that the independent and
dependent variables be measured on an interval scale. Binary variables satisfy this
requirement; consequently, nominal variables such as gender (sex), employment status
(ES), sibling academic status (SAS), repeated a grade (retained), citizenship status (CS)
/English Proficiency, pregnancy/fatherhood (PF), alcohol and drug use (ADU), friends
interested in school (friends), cut classes (truancy), and Completion were coded in binary
(dummy) variables.
This study determined the degree of linear dependence of Completion on the
twelve independent variables (academic ability (GPA/Test Score), family socioeconomic
status (SES), gender (sex), employment status (ES), sibling academic status (SAS),
repeated a grade (retained), citizenship status (CS)/English Proficiency,
pregnancy/fatherhood (PF), alcohol and drug use (ADU), friends interested in school
(friends), cut classes (truancy), and high school location (urbanicity).
Findings
The purpose of the study was to offer a broad investigation into the factors that
may be associated with high Hispanic students' school dropout rates. The analysis is
2320
based on demographic factors, academic ability, family background, school experiences,
and social influence factors taken from a national sample of high school sophomores
twelve years after high school. The variable Dropout is the dependent variable while the
independent variables are:
i. Academic Ability (Test Score),
ii. Family Socioeconomic Status (SES),
iii. Student Gender (Sex),
iv. Employment Status (ES),
v. Sibling Academic Status (SAS),
vi. Repeated a Grade (Retained),
vii. Citizenship Status (CS)/English Proficiency,
viii. Pregnancy/Fatherhood (PF),
ix. Alcohol and Drug Use (ADU)/Substance Abuse,
x. Friends Interest in School (Friends),
xi. Cut Classes (Truancy), and
xii. High School Location (Urbanicity).
Univariate Frequency Distribution of Cases
The study on the sophomore cohort was composed of a base year and four follow-
up surveys. Base year data were collected in the spring of 1980 from nationally
representative samples of over 30,000 sophomores. But, only a subset (14,825) of the
30,000 sophomores were followed at each of the four follow-up studies. However, at
each follow-up study, the deceased and non-respondent students were replaced by
students who were randomly selected from the pool of 30,000 students. This study,
2421
extracted the 14,825 students who participated in the First Follow-up and tracked them
through the Fourth Follow-up for analysis. In other words, the replacement students were
not included in the analysis. This was done to preserve the consistency of the independent
variables, GPA, SES, Gender, Employment Status (ES), Sibling Academic Status (SAS),
Repeating a Grade (Retained), Citizenship Status (CS)/English Proficiency,
Pregnancy/Fatherhood (PF), Substance Abuse, Friends Interest in School, Cutting Classes
(Truancy), and High School Location (Urbanicity). The independent variables for the
14,825 study population were distributed as shown below:
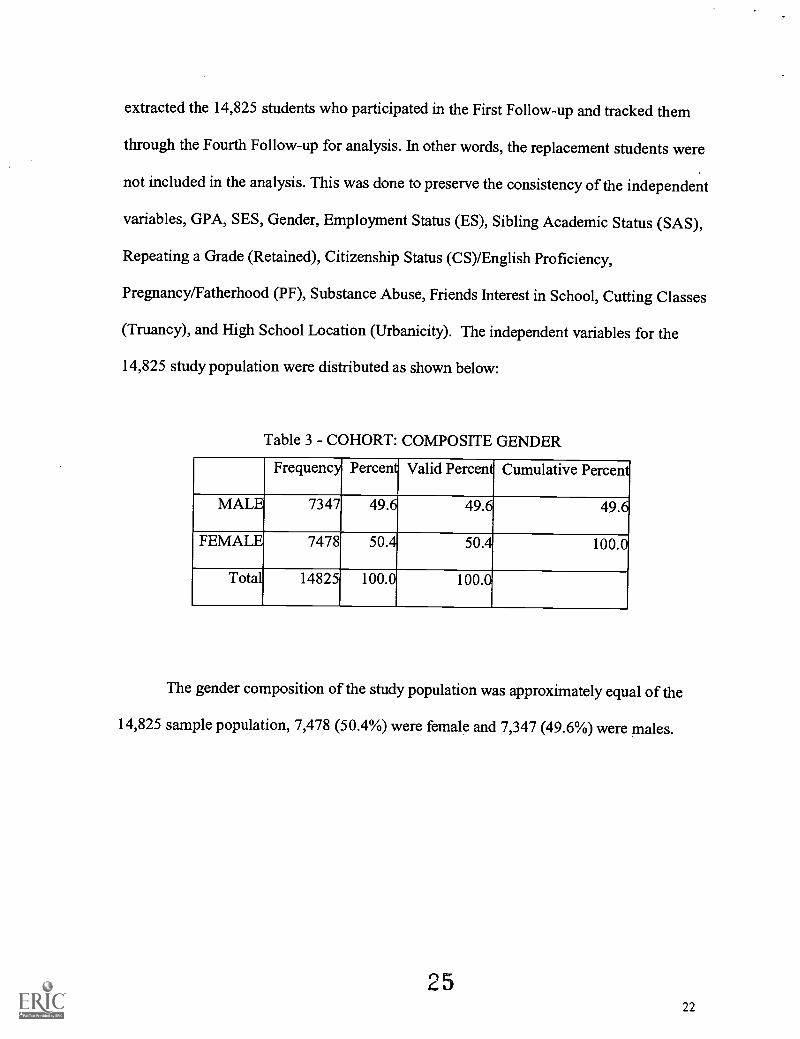
Table 3 - COHORT: COMPOSITE GENDER
Frequency Percent Valid Percent Cumulative Percent
MALE 7347 49.6 49.6 49.6
FEMALE 7478 50.4 50.4 100.0
Total 14825 100.0 100.0
The gender composition of the study population was approximately equal of the
14,825 sample population, 7,478 (50.4%) were female and 7,347 (49.6%) were males.
2522
Table 4 - COHORT: ETHNIC COMPOSITE
Frequency Percent Valid Percent Cumulative Percent
HISPANIC OR SPANISH 3251 21.9 21.9 21.9
AMERINDIAN 292 2.0 2.0 23.9
ASIAN, PCFC ISLNDR 430 2.9 2.9 26.8
BLACK 2036 13.7 13.7 40.5
WHITE 8624 58.2 58.2 98.7
OTHER 192 1.3 1.3 100.0
Total 14825 100.0 100.0
The ethnic composition of the 14,825 study population was as follows: 3,251
(21.9%) were Hispanic or Spanish Americans, 292 (2%) were Native Americans, 430
(2.9%) were Asian/Pacific Islanders, 2,036 (13.75%) were African Americans, 8,624
(58.2%) were Caucasian Americans, and 192 (1.3%) were from some other ethnic group
not listed above.
2623
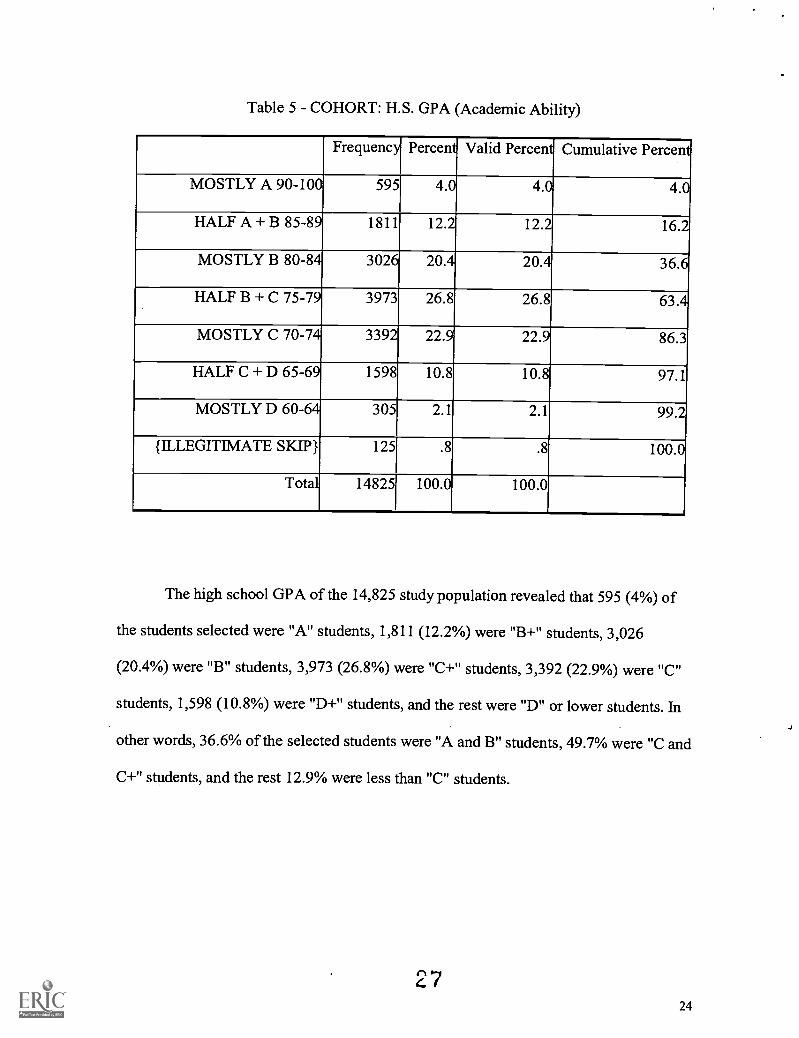
Table 5 - COHORT: H.S. GPA (Academic Ability)
Frequency Percent Valid Percent Cumulative Percent
MOSTLY A 90-100 595 4.0 4.0 4.0
HALF A + B 85-89 1811 12.2 12.2 16.2
MOSTLY B 80-84 3026 20.4 20.4 36.6
HALF B + C 75-79 3973 26.8 26.8 63.4
MOSTLY C 70-74 3392 22.9 22.9 86.3
HALF C + D 65-69 1598 10.8 10.8 97.1
MOSTLY D 60-64 305 2.1 2.1 99.2
{ILLEGITIMATE SKIP} 125 .8 .8 100.0
Total 14825 100.0 100.0
The high school GPA of the 14,825 study population revealed that 595 (4%) of
the students selected were "A" students, 1,811 (12.2%) were "B+" students, 3,026
(20.4%) were "B" students, 3,973 (26.8%) were "C+" students, 3,392 (22.9%) were "C"
students, 1,598 (10.8%) were "D+" students, and the rest were "D" or lower students. In
other words, 36.6% of the selected students were "A and B" students, 49.7% were "C and
C+" students, and the rest 12.9% were less than "C" students.
2724
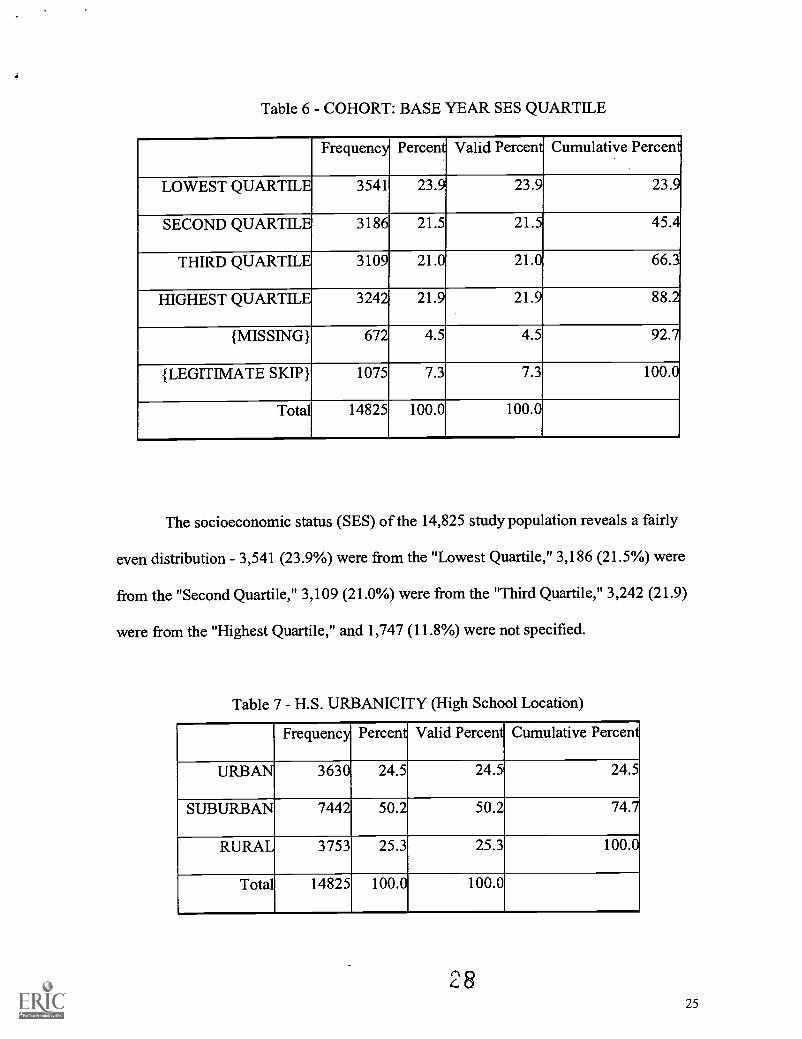
Table 6 COHORT: BASE YEAR SES QUARTILE
Frequency Percent Valid Percent Cumulative Percent
LOWEST QUARTILE 3541 23.9 23.9 23.9
SECOND QUARTILE 3186 21.5 21.5 45.4
THIRD QUARTILE 3109 21.0 21.0 66.3
HIGHEST QUARTILE 3242 21.9 21.9 88.2
{MISSING} 672 4.5 4.5 92.7
{LEGITIMATE SKIP} 1075 7.3 7.3 100.0
Total 14825 100.0 100.0
The socioeconomic status (SES) of the 14,825 study population reveals a fairly
even distribution - 3,541 (23.9%) were from the "Lowest Quartile," 3,186 (21.5%) were
from the "Second Quartile," 3,109 (21.0%) were from the "Third Quartile," 3,242 (21.9)
were from the "Highest Quartile," and 1,747 (11.8%) were not specified.
Table 7 - H.S. URBANICITY (High School Location)
Frequency Percent Valid Percent Cumulative Percent
URBAN 3630 24.5 24.5 24.5
SUBURBAN 7442 50.2 50.2 74.7
RURAL 3753 25.3 25.3 100.0
Total 14825 100.0 100.0
2825
The High School Location (Urbanization) of the 14,825 study population reveals
a fairly reasonable distribution. The composition was as follows: 3,630 (24.5%) were
from the "Urban Schools," 7,442 (50.2%) were from the "Suburban Schools," and 3,753
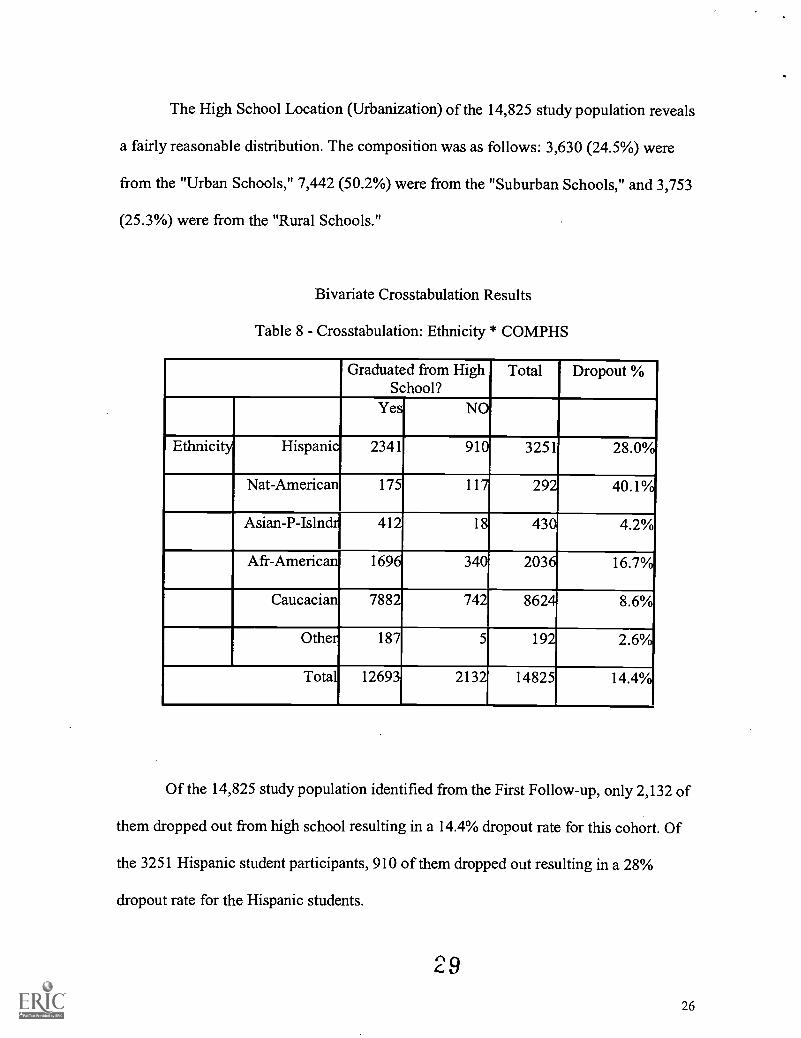
(25.3%) were from the "Rural Schools."
Bivariate Crosstabulation Results
Table 8 - Crosstabulation: Ethnicity * COMPHS
Graduated from HighSchool?
Total Dropout %
Yes NO
Ethnicity Hispanic 2341 910 3251 28.0%
Nat-American 175 117 292 40.1%
Asian- P- Islndr 412 18 430 4.2%
Afr-American 1696 340 2036 16.7%
Caucacian 7882 742 8624 8.6%
Other 187 5 192 2.6%
Total 12693 2132 14825 14.4%
Of the 14,825 study population identified from the First Follow-up, only 2,132 of
them dropped out from high school resulting in a 14.4% dropout rate for this cohort. Of
the 3251 Hispanic student participants, 910 of them dropped out resulting in a 28%
dropout rate for the Hispanic students.
29
26
Table 9 - Hispanic Students Participants: By Gender
Frequency Percent Valid Percent Cumulative Percent
Male 1672 51.4 51.4 51.4
Female 1579 48.6 48.6 100.0
Total 3251 100.0 100.0
The gender composition of the 3,251 Hispanic students in the study was as
follows: 1672 (51.4%) males, and 1579 (48.6%) females.
Subproblem #1: Are there differences in Test Scores (GPA) between the Hispanic
students who graduate and those who drop out?
Table 10 - Crosstabulation :HS Grad / HS Dropout * Test Score Quartile
Test Score Quartile Total
HS Grad /
HS Dropout
Quartile 1 Low Quartile 2 Quartile 3 Quartile 4
-- High
HS Grad
HS Dropout
375 743 764 459 2341
582 237 69 22 910
Total 957 980 833 481 3,251
The Test Scores (GPA) of the 3251 Hispanic students participants in the study
population revealed that only 375 of the 2341 (16%) graduates were in the "Quartile
3027
1/Low Quartile" while 582 of the 910 (64%) of the dropouts students were in the
"Quartile 1/Low Quartile". In other words, most of the dropouts (64%) were not
academically able students; therefore, there are differences in Test Scores (GPA) between
the Hispanic students who graduate and those who drop out.
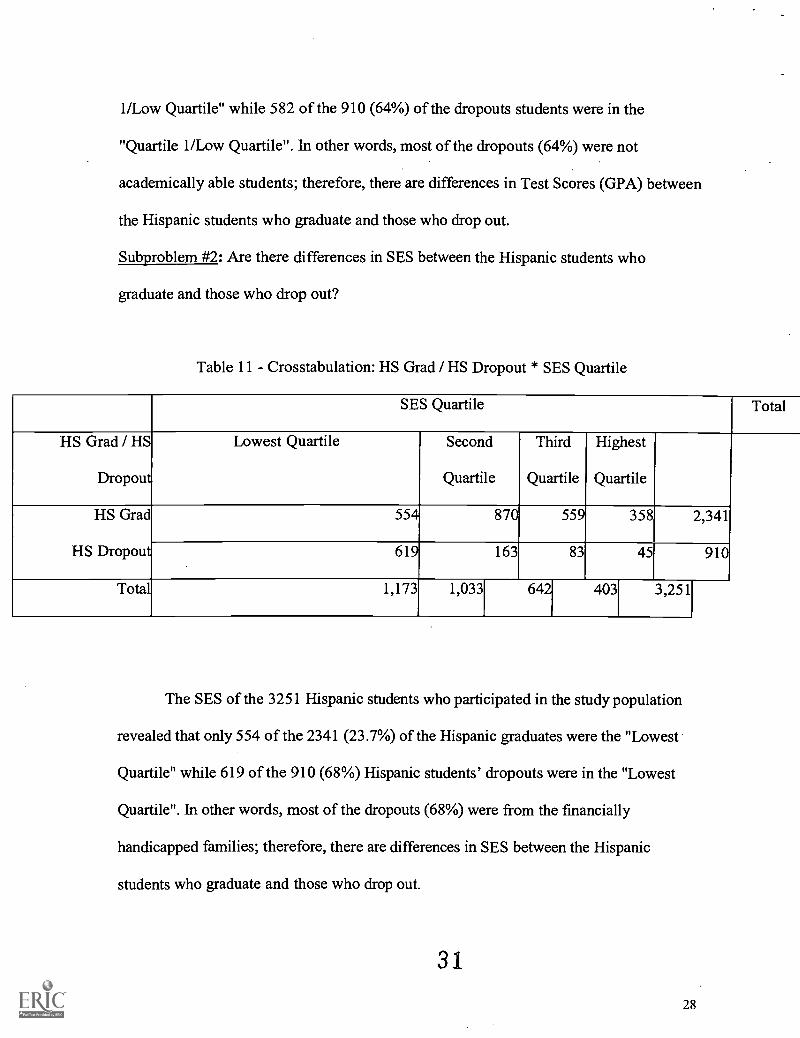
Subproblem #2: Are there differences in SES between the Hispanic students who
graduate and those who drop out?
Table 11 - Crosstabulation: HS Grad / HS Dropout * SES Quartile
SES Quartile Total
HS Grad / HS
Dropout
Lowest Quartile Second
Quartile
Third
Quartile
Highest
Quartile
HS Grad
HS Dropout
554 870 559 358 2,341
619 163 83 45 910
Total 1,173 1,033 642 403 3,251
The SES of the 3251 Hispanic students who participated in the study population
revealed that only 554 of the 2341 (23.7%) of the Hispanic graduates were the "Lowest
Quartile" while 619 of the 910 (68%) Hispanic students' dropouts were in the "Lowest
Quartile". In other words, most of the dropouts (68%) were from the financially
handicapped families; therefore, there are differences in SES between the Hispanic
students who graduate and those who drop out.
31
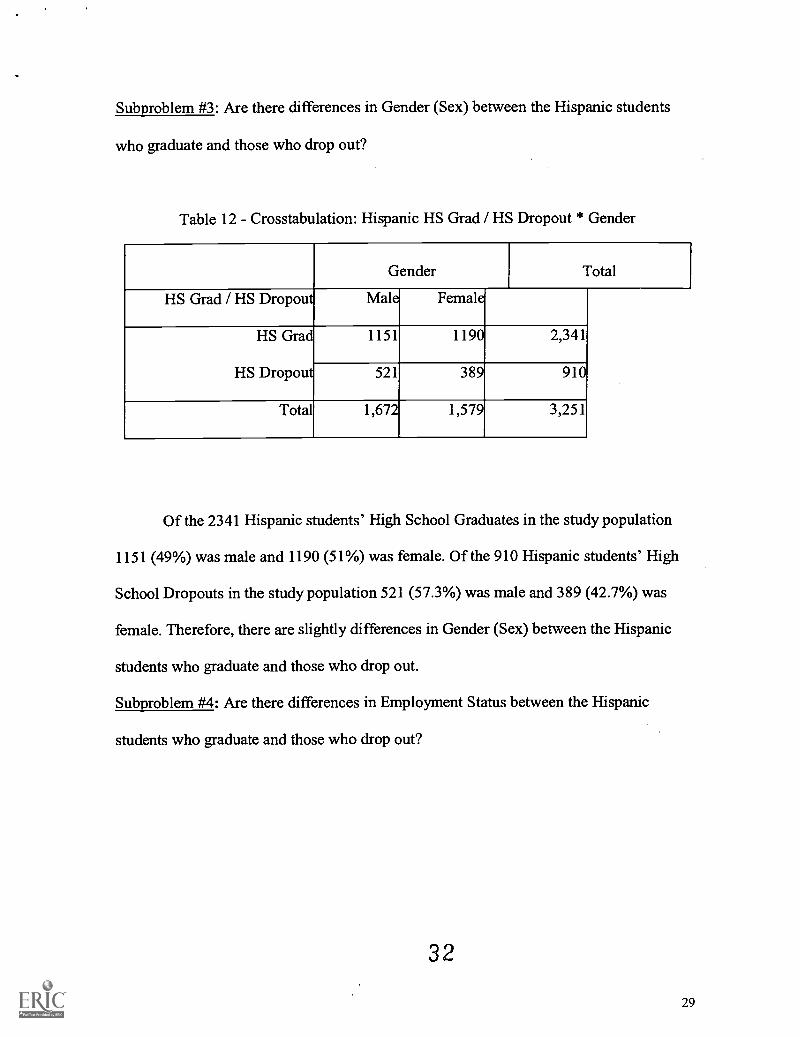
Subproblem #3: Are there differences in Gender (Sex) between the Hispanic students
who graduate and those who drop out?
Table 12 Crosstabulation: Hispanic HS Grad / HS Dropout * Gender
Gender
HS Grad / HS Dropout Male Female
HS Grad
HS Dropout
1151 1190 2,341
521 389 910
Total 1,672 1,579 3,251
Total
Of the 2341 Hispanic students' High School Graduates in the study population
1151 (49%) was male and 1190 (51%) was female. Of the 910 Hispanic students' High
School Dropouts in the study population 521 (57.3%) was male and 389 (42.7%) was
female. Therefore, there are slightly differences in Gender (Sex) between the Hispanic
students who graduate and those who drop out.
Subproblem #4: Are there differences in Employment Status between the Hispanic
students who graduate and those who drop out?
32
29
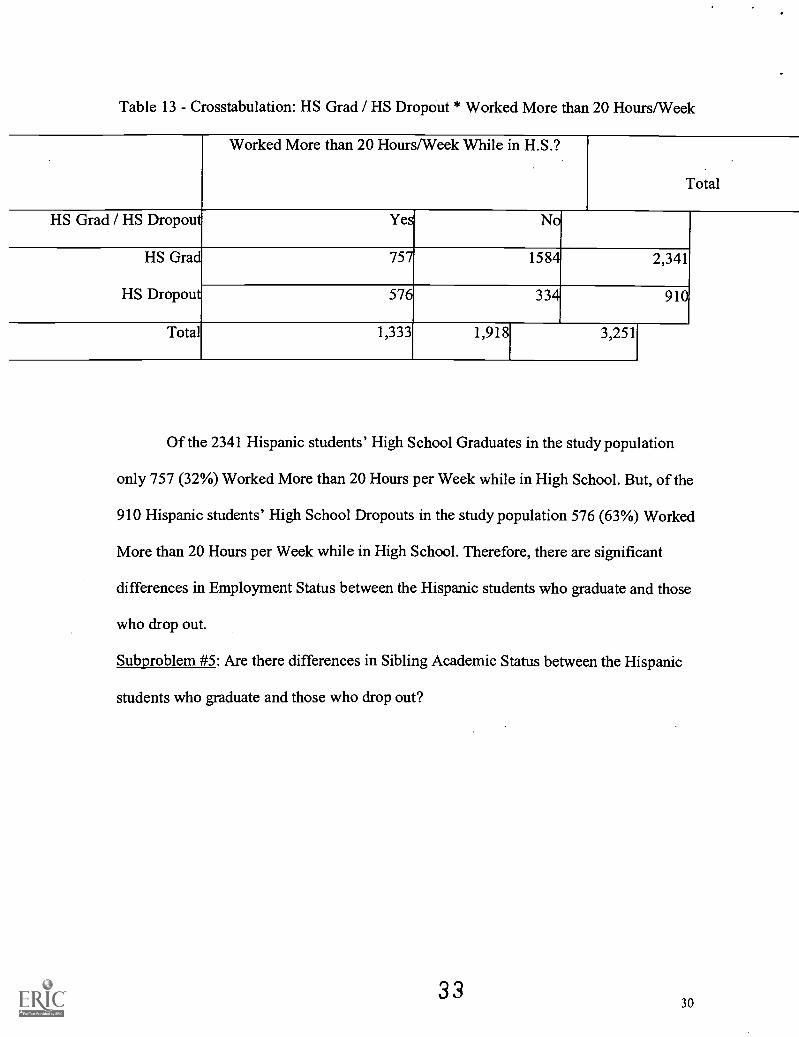
Table 13 - Crosstabulation: HS Grad / HS Dropout * Worked More than 20 Hours/Week
Worked More than 20 Hours/Week While in H.S.?
Total
HS Grad / HS Dropout Yes No
HS Grad 757 1584 2,341
HS Dropout 576 334 910
Total 1,333 1,918 3,251
Of the 2341 Hispanic students' High School Graduates in the study population
only 757 (32%) Worked More than 20 Hours per Week while in High School. But, of the
910 Hispanic students' High School Dropouts in the study population 576 (63%) Worked
More than 20 Hours per Week while in High School. Therefore, there are significant
differences in Employment Status between the Hispanic students who graduate and those
who drop out.
Subproblem #5: Are there differences in Sibling Academic Status between the Hispanic
students who graduate and those who drop out?
3330
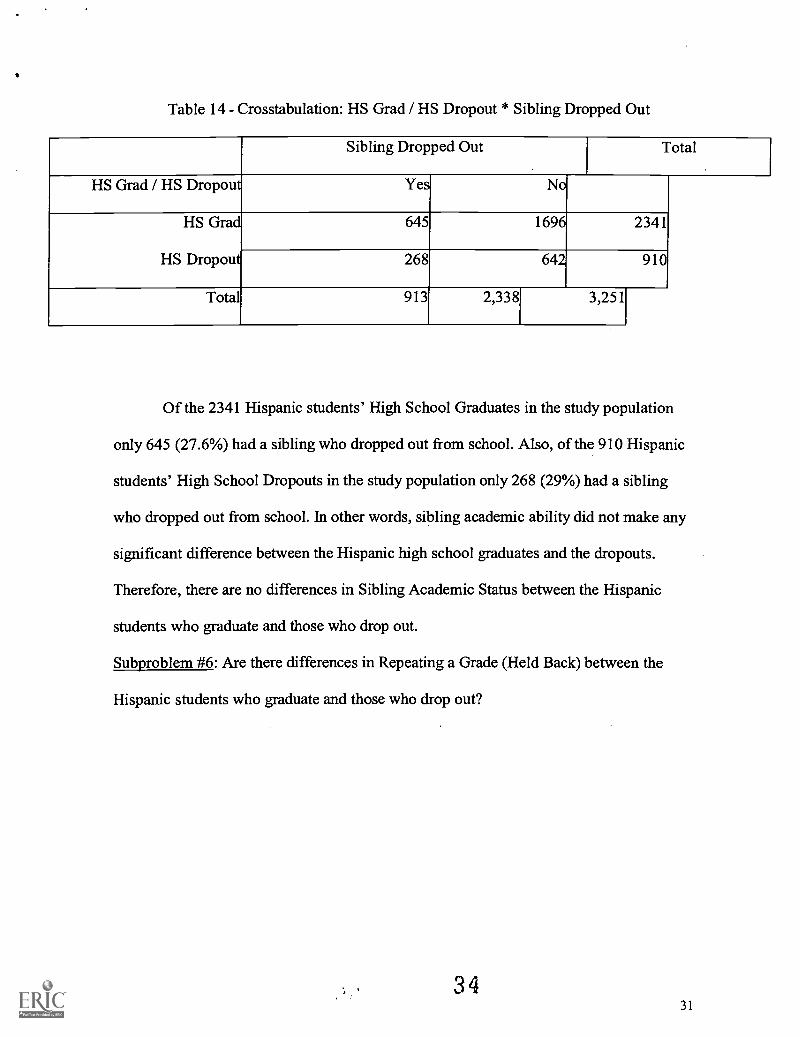
Table 14 - Crosstabulation: HS Grad / HS Dropout * Sibling Dropped Out
Sibling Dropped Out Total
HS Grad / HS Dropout Yes No
HS Grad
HS Dropout
645 1696 2341
268 642 910
Total 913 2,338 3,251
Of the 2341 Hispanic students' High School Graduates in the study population
only 645 (27.6%) had a sibling who dropped out from school. Also, of the 910 Hispanic
students' High School Dropouts in the study population only 268 (29%) had a sibling
who dropped out from school. In other words, sibling academic ability did not make any
significant difference between the Hispanic high school graduates and the dropouts.
Therefore, there are no differences in Sibling Academic Status between the Hispanic
students who graduate and those who drop out.
Subproblem #6: Are there differences in Repeating a Grade (Held Back) between the
Hispanic students who graduate and those who drop out?
3431
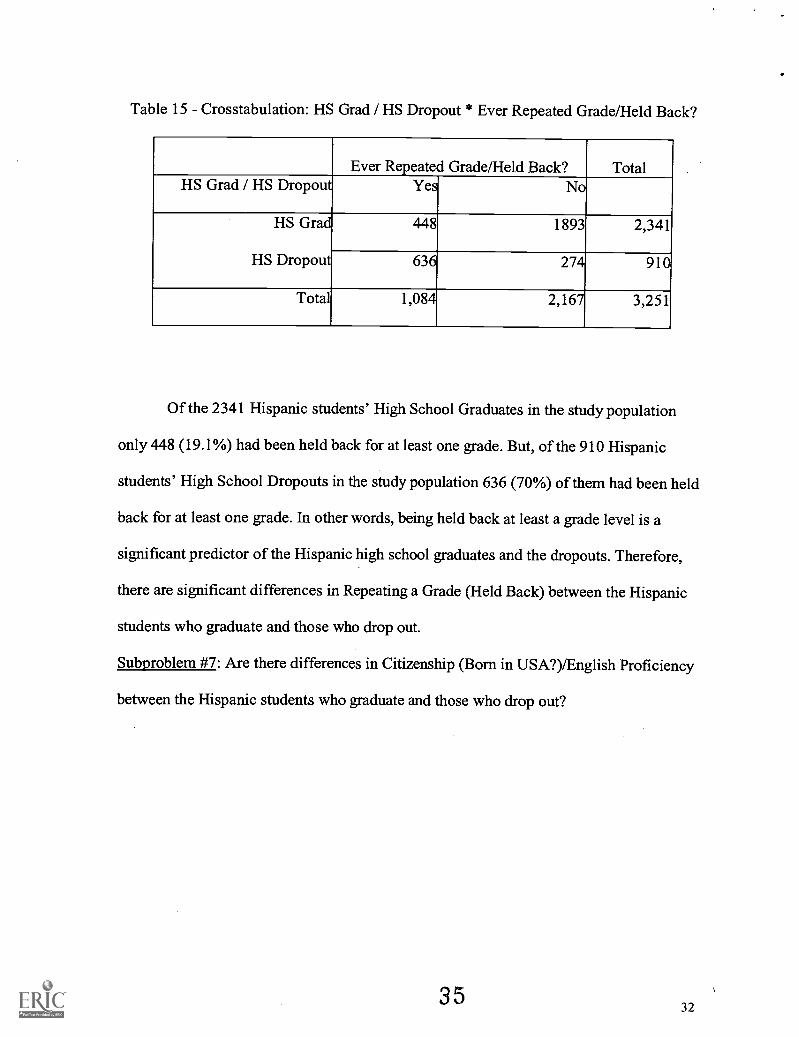
Table 15 - Crosstabulation: HS Grad / HS Dropout * Ever Repeated Grade/Held Back?
Ever Repeated Grade/Held Back? TotalHS Grad / HS Dropout Yes No
HS Grad
HS Dropout
448 1893 2,341
636 274 910
Total 1,084 2,167 3,251
Of the 2341 Hispanic students' High School Graduates in the study population
only 448 (19.1%) had been held back for at least one grade. But, of the 910 Hispanic
students' High School Dropouts in the study population 636 (70%) of them had been held
back for at least one grade. In other words, being held back at least a grade level is a
significant predictor of the Hispanic high school graduates and the dropouts. Therefore,
there are significant differences in Repeating a Grade (Held Back) between the Hispanic
students who graduate and those who drop out.
Subproblem #7: Are there differences in Citizenship (Born in USA?)/English Proficiency
between the Hispanic students who graduate and those who drop out?
3532
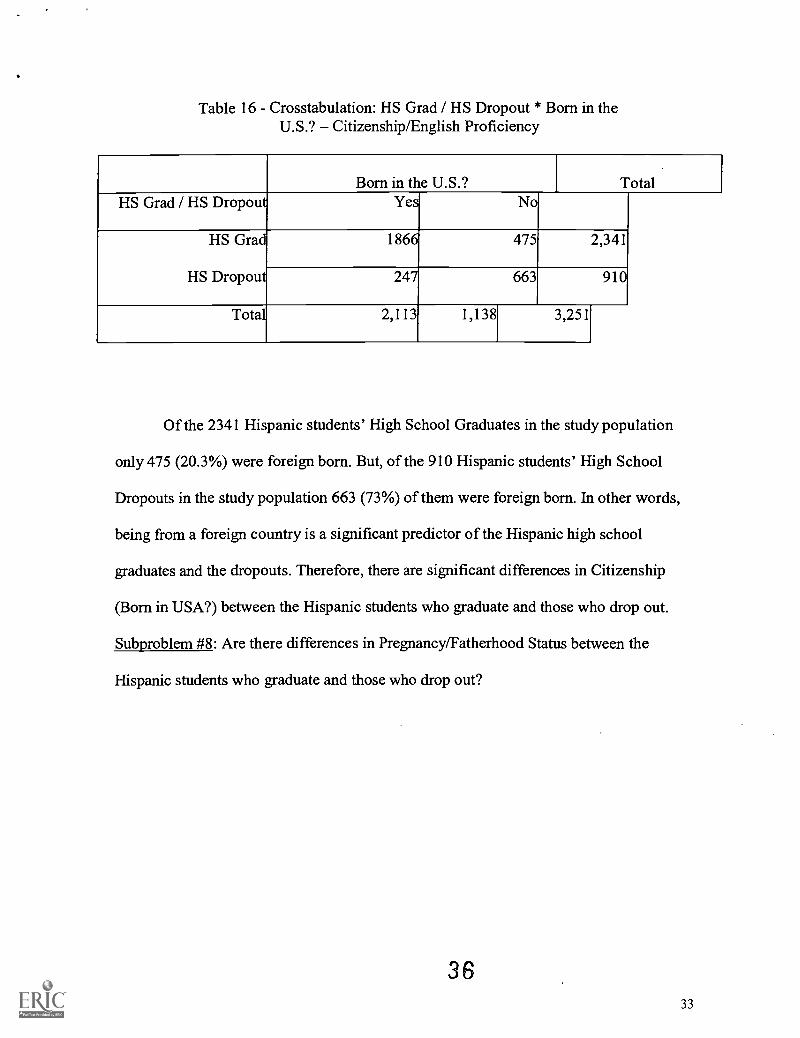
Table 16 - Crosstabulation: HS Grad / HS Dropout * Born in theU.S.? Citizenship/English Proficiency
Born in the U.S.? TotalHS Grad / HS Dropout Yes No
HS Grad
HS Dropout
1866 475 2,341
247 663 910
Total 2,113 1,138 3,251
Of the 2341 Hispanic students' High School Graduates in the study population
only 475 (20.3%) were foreign born. But, of the 910 Hispanic students' High School
Dropouts in the study population 663 (73%) of them were foreign born. In other words,
being from a foreign country is a significant predictor of the Hispanic high school
graduates and the dropouts. Therefore, there are significant differences in Citizenship
(Born in USA?) between the Hispanic students who graduate and those who drop out.
Subproblem #8: Are there differences in Pregnancy/Fatherhood Status between the
Hispanic students who graduate and those who drop out?
3633
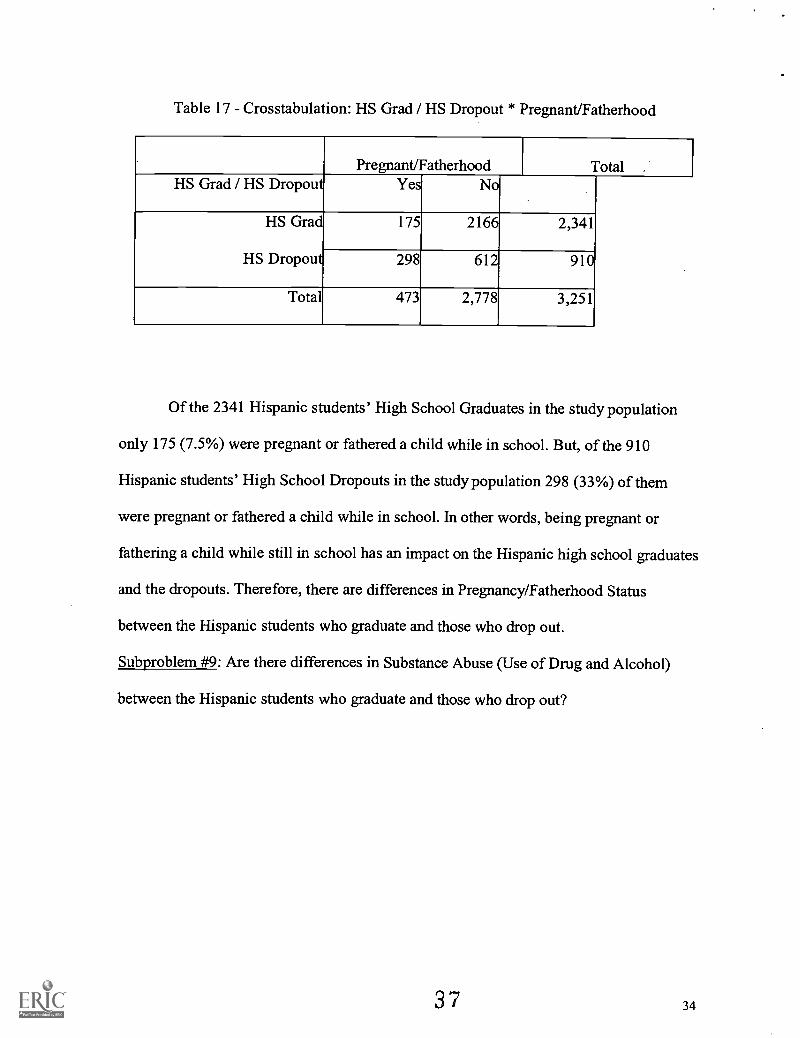
Table 17 - Crosstabulation: HS Grad / HS Dropout * Pregnant/Fatherhood
Pregnant/FatherhoodHS Grad / HS Dropout Yes No
HS Grad
HS Dropout
175 2166 2,341
298 612 910
Total 473 2,778 3,251
Total .
Of the 2341 Hispanic students' High School Graduates in the study population
only 175 (7.5%) were pregnant or fathered a child while in school. But, of the 910
Hispanic students' High School Dropouts in the study population 298 (33%) of them
were pregnant or fathered a child while in school. In other words, being pregnant or
fathering a child while still in school has an impact on the Hispanic high school graduates
and the dropouts. Therefore, there are differences in Pregnancy/Fatherhood Status
between the Hispanic students who graduate and those who drop out.
Subproblem #9: Are there differences in Substance Abuse (Use of Drug and Alcohol)
between the Hispanic students who graduate and those who drop out?
37 34
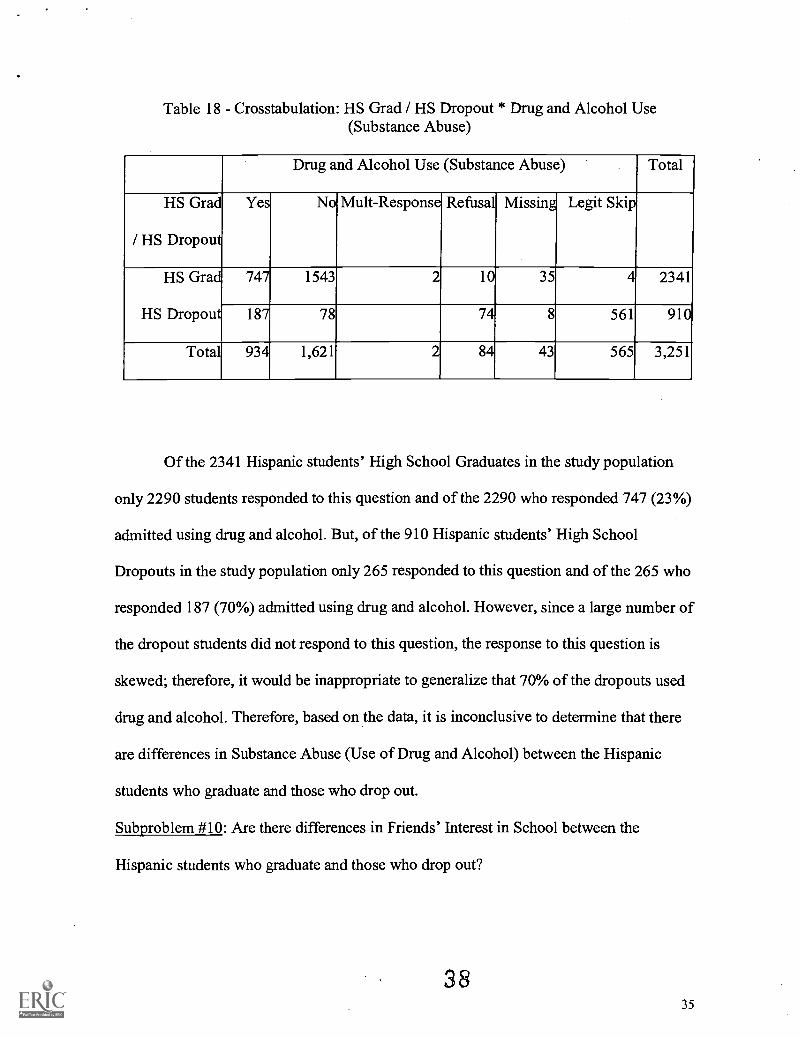
Table 18 - Crosstabulation: HS Grad / HS Dropout * Drug and Alcohol Use(Substance Abuse)
Drug and Alcohol Use (Substance Abuse) Total
HS Grad
/ HS Dropout
Yes No Mu lt-Response Refusal Missing Legit Skip
HS Grad
HS Dropout
747 1543 2 10 35 4 2341
187 78 74 8 561 910
Total 934 1,621 2 84 43 565 3,251
Of the 2341 Hispanic students' High School Graduates in the study population
only 2290 students responded to this question and of the 2290 who responded 747 (23%)
admitted using drug and alcohol. But, of the 910 Hispanic students' High School
Dropouts in the study population only 265 responded to this question and of the 265 who
responded 187 (70%) admitted using drug and alcohol. However, since a large number of
the dropout students did not respond to this question, the response to this question is
skewed; therefore, it would be inappropriate to generalize that 70% of the dropouts used
drug and alcohol. Therefore, based on the data, it is inconclusive to determine that there
are differences in Substance Abuse (Use of Drug and Alcohol) between the Hispanic
students who graduate and those who drop out.
Subproblem #10: Are there differences in Friends' Interest in School between the
Hispanic students who graduate and those who drop out?
3835
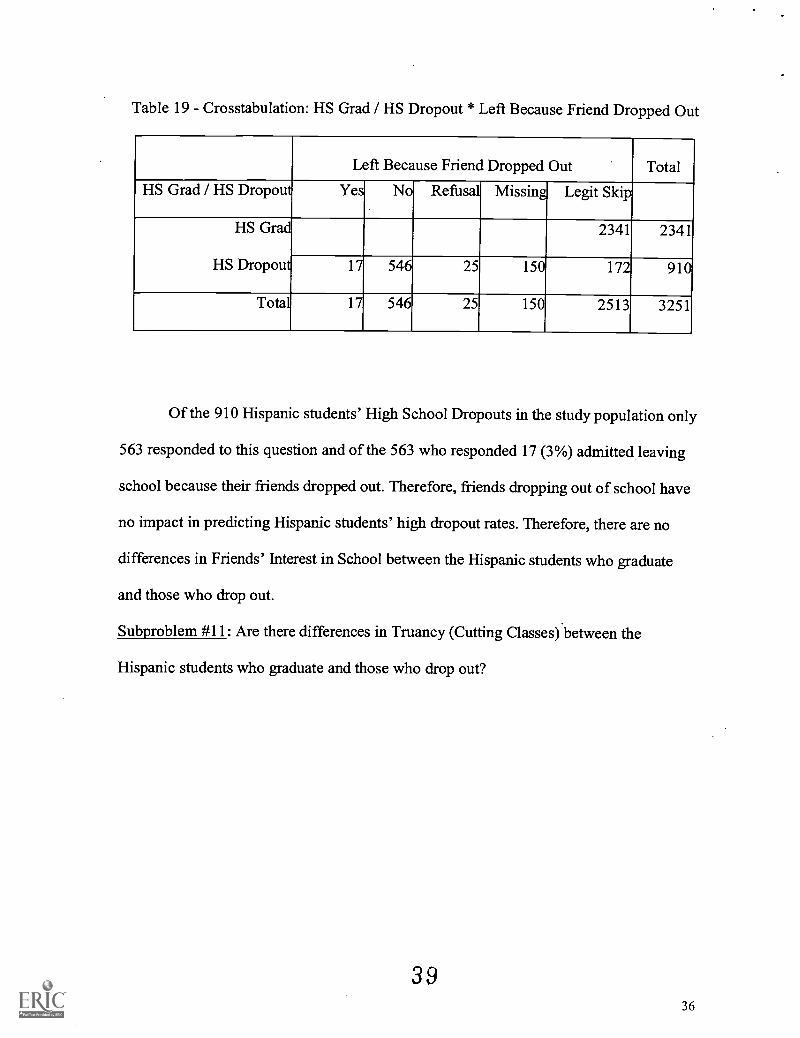
Table 19 Crosstabulation: HS Grad / HS Dropout * Left Because Friend Dropped Out
Left Because Friend Dropped Out TotalHS Grad / HS Dropout Yes No Refusal Missing Legit Skip
2341HS Grad
HS Dropout
2341
17 546 25 150 172 910
Total 17 546 25 150 2513 3251
Of the 910 Hispanic students' High School Dropouts in the study population only
563 responded to this question and of the 563 who responded 17 (3%) admitted leaving
school because their friends dropped out. Therefore, friends dropping out of school have
no impact in predicting Hispanic students' high dropout rates. Therefore, there are no
differences in Friends' Interest in School between the Hispanic students who graduate
and those who drop out.
Subproblem #11: Are there differences in Truancy (Cutting Classes) between the
Hispanic students who graduate and those who drop out?
3936
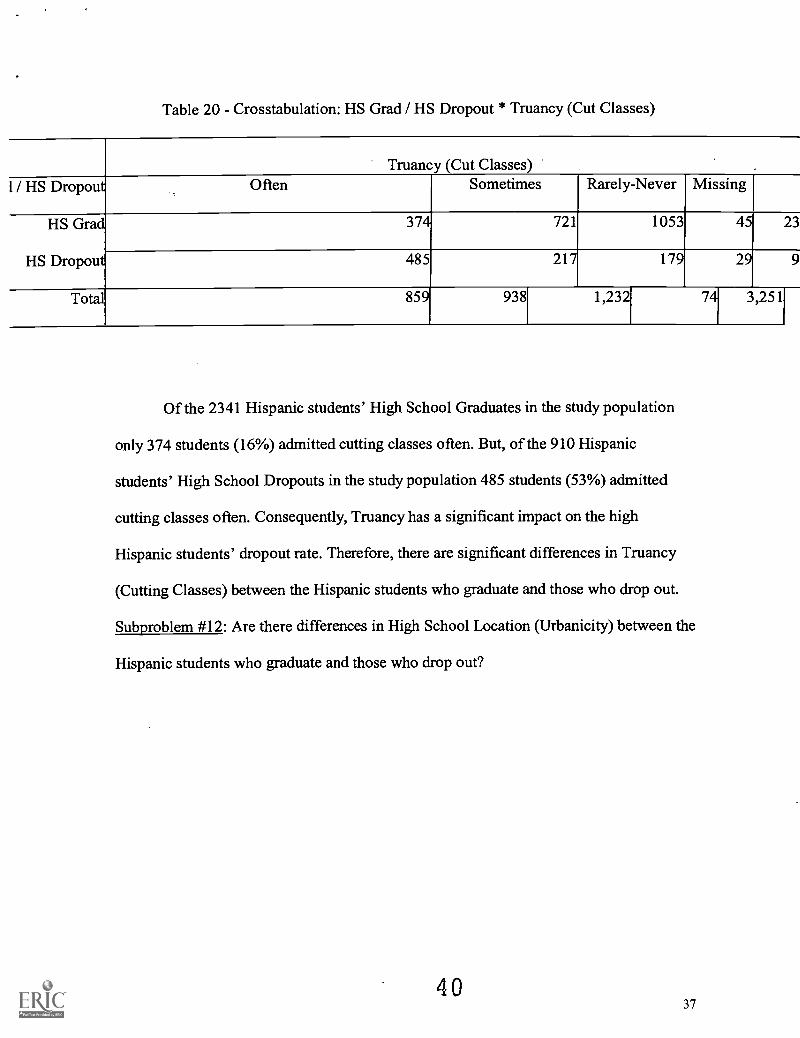
Table 20 - Crosstabulation: HS Grad / HS Dropout * Truancy (Cut Classes)
Truancy (Cut ClassesI / HS Dropout Often Sometimes Rarely-Never Missing
HS Grad
HS Dropout
374 721 1053 45 23
485 217 179 29
Total 859 938 1,232 74 3,251
Of the 2341 Hispanic students' High School Graduates in the study population
only 374 students (16%) admitted cutting classes often. But, of the 910 Hispanic
students' High School Dropouts in the study population 485 students (53%) admitted
cutting classes often. Consequently, Truancy has a significant impact on the high
Hispanic students' dropout rate. Therefore, there are significant differences in Truancy
(Cutting Classes) between the Hispanic students who graduate and those who drop out.
Subproblem #12: Are there differences in High School Location (Urbanicity) between the
Hispanic students who graduate and those who drop out?
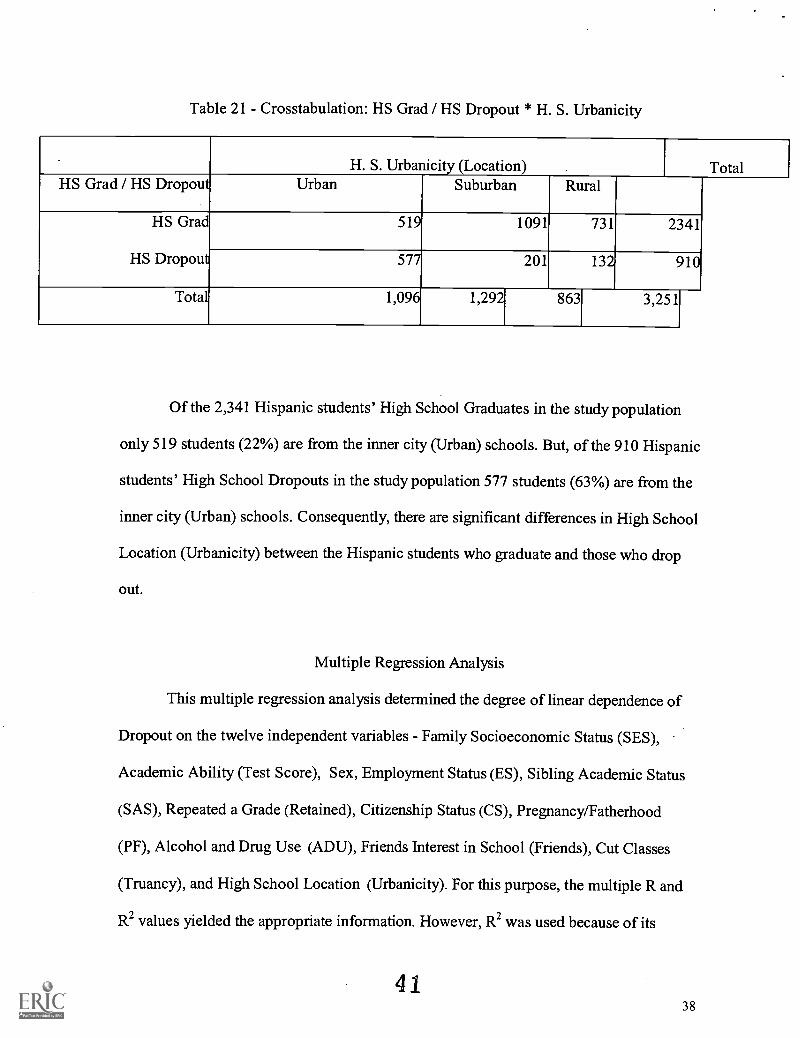
Table 21 - Crosstabulation: HS Grad / HS Dropout * H. S. Urbanicity
H. S. Urbanicity (Location)HS Grad / HS Dropout Urban Suburban Rural
HS Grad
HS Dropout
519 1091 731 2341
577 201 132 910
Total 1,096 1,292 863 3,251
Total
Of the 2,341 Hispanic students' High School Graduates in the study population
only 519 students (22%) are from the inner city (Urban) schools. But, of the 910 Hispanic
students' High School Dropouts in the study population 577 students (63%) are from the
inner city (Urban) schools. Consequently, there are significant differences in High School
Location (Urbanicity) between the Hispanic students who graduate and those who drop
out.
Multiple Regression Analysis
This multiple regression analysis determined the degree of linear dependence of
Dropout on the twelve independent variables Family Socioeconomic Status (SES),
Academic Ability (Test Score), Sex, Employment Status (ES), Sibling Academic Status
(SAS), Repeated a Grade (Retained), Citizenship Status (CS), Pregnancy/Fatherhood
(PF), Alcohol and Drug Use (ADU), Friends Interest in School (Friends), Cut Classes
(Truancy), and High School Location (Urbanicity). For this purpose, the multiple R and
R2 values yielded the appropriate information. However, R2 was used because of its
4138
straightforward interpretation. For instance, if R2 = .2822, then one can say that 28
percent of the variation in the dependent variable (in this case Dropout) is explained by
the independent variable (in this case Family Socioeconomic Status (SES), Academic
Ability (Test Score), Sex, Ethnicity, Employment Status (ES), Sibling Academic Status
(SAS), Repeated a Grade (Retained), Citizenship Status (CS), Pregnancy/Fatherhood
(PF), Alcohol and Drug Use (ADU), Friends Interest in School (Friends), Cut Classes
(Truancy), and High School Location (Urbanicity)).
The result of the stepwise multiple regression analysis of the independent
variables on the 910 Hispanic students who dropped out of high school:
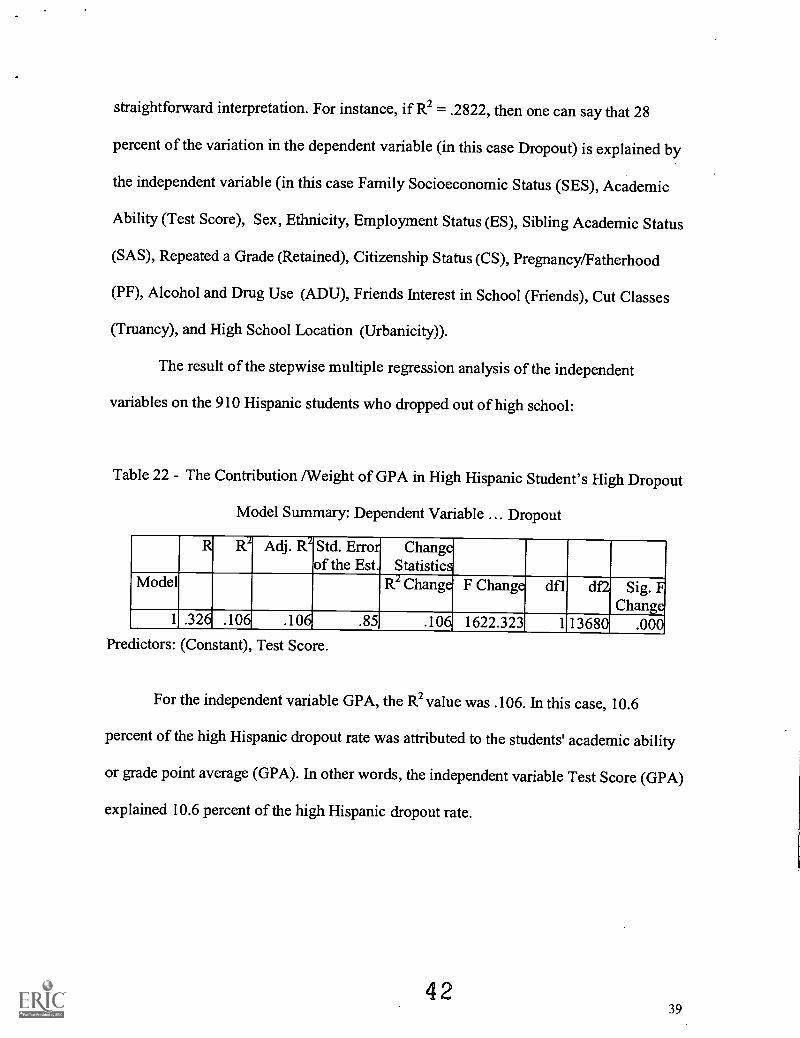
Table 22 - The Contribution /Weight of GPA in High Hispanic Student's High Dropout
Model Summary: Dependent Variable ... Dropout
R R Adj. R2 Std. Errorof the Est.
ChangeStatistics
Model R2 Change F Change dfl df2 Sig. FChange
1 .326 .106 .106 .85 .106 1622.323 1 13680 .000Predictors: (Constant), Test Score.
For the independent variable GPA, the R2 value was .106. In this case, 10.6
percent of the high Hispanic dropout rate was attributed to the students' academic ability
or grade point average (GPA). In other words, the independent variable Test Score (GPA)
explained 10.6 percent of the high Hispanic dropout rate.
4239
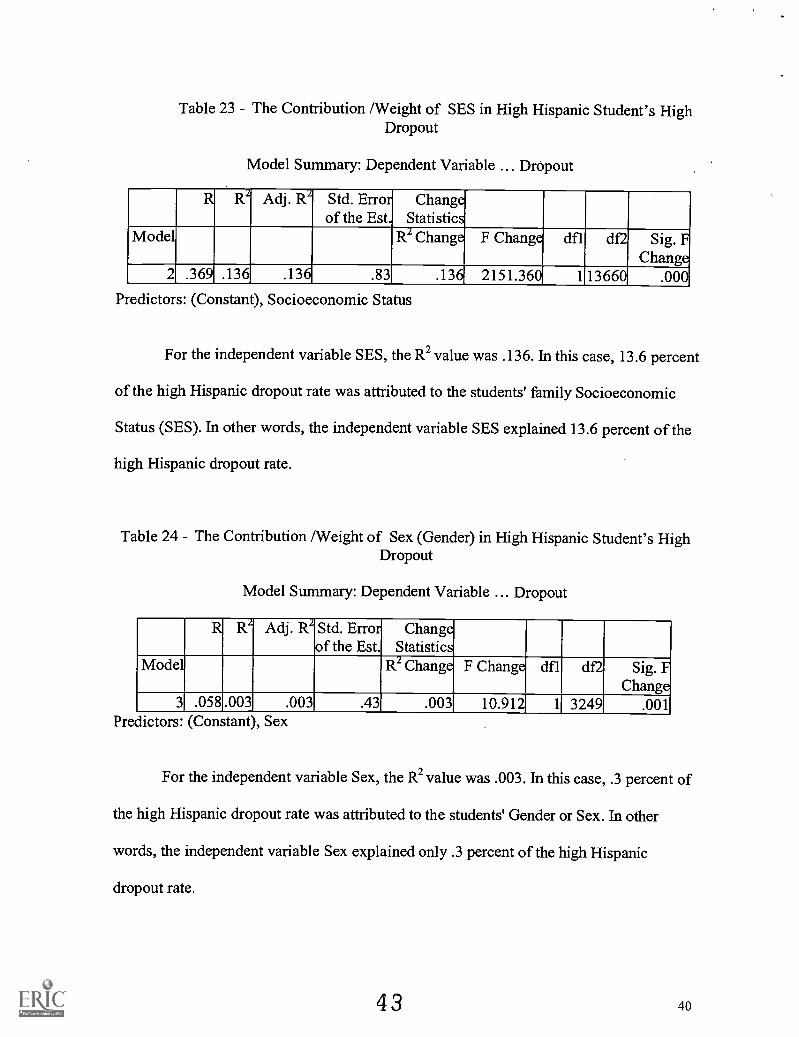
Table 23 - The Contribution /Weight of SES in High Hispanic Student's HighDropout
Model Summary: Dependent Variable ... Dropout
R R2 Adj. R2 Std. Errorof the Est.
ChangeStatistics
Model R2 Change F Change dfl df2 Sig. FChange
2 .369 .136 .136 .83 .136 2151.360 1 13660 .000
Predictors: (Constant), Socioeconomic Status
For the independent variable SES, the R2 value was .136. In this case, 13.6 percent
of the high Hispanic dropout rate was attributed to the students' family Socioeconomic
Status (SES). In other words, the independent variable SES explained 13.6 percent of the
high Hispanic dropout rate.
Table 24 - The Contribution /Weight of Sex (Gender) in High Hispanic Student's HighDropout
Model Summary: Dependent Variable ... Dropout
R RI Adj. R Std. Errorof the Est.
ChangeStatistics
Model R2 Change F Change dfl df2 Sig. FChange
.0013 .058 .003 .003 .43 .003 10.912 1 3249Predictors: (Constant), Sex
For the independent variable Sex, the R2 value was .003. In this case, .3 percent of
the high Hispanic dropout rate was attributed to the students' Gender or Sex. In other
words, the independent variable Sex explained only .3 percent of the high Hispanic
dropout rate.
43 40
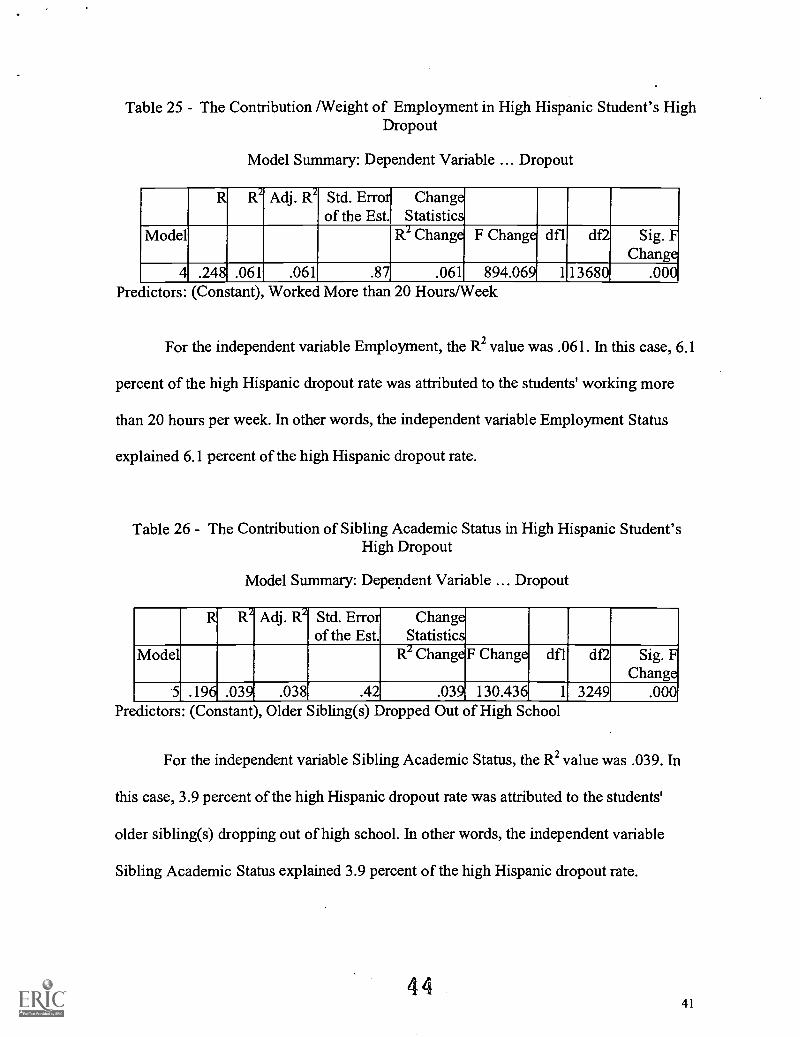
Table 25 - The Contribution /Weight of Employment in High Hispanic Student's HighDropout
Model Summary: Dependent Variable ... Dropout
R R Adj. R1 Std. Errorof the Est.
ChangeStatistics
Model R2 Change F Change dfl df2 Sig. FChange
4 .248 .061 .061 .87 .061 894.069 113680 .000Predictors: (Constant) Worked More than 20 Hours/Week
For the independent variable Employment, the R2 value was .061. In this case, 6.1
percent of the high Hispanic dropout rate was attributed to the students' working more
than 20 hours per week. In other words, the independent variable Employment Status
explained 6.1 percent of the high Hispanic dropout rate.
Table 26 - The Contribution of Sibling Academic Status in High Hispanic Student'sHigh Dropout
Model Summary: Dependent Variable ... Dropout
R R Adj. R Std. Errorof the Est.
ChangeStatistics
Model R2ChangeF Change dfl df2 Sig. FChange
5 .196 .039 .038 .42 .039 130.436 1 3249 .000Predictors: (Constant), Older Sibling(s) Dropped Out of High School
For the independent variable Sibling Academic Status, the R2 value was .039. In
this case, 3.9 percent of the high Hispanic dropout rate was attributed to the students'
older sibling(s) dropping out of high school. In other words, the independent variable
Sibling Academic Status explained 3.9 percent of the high Hispanic dropout rate.
44441
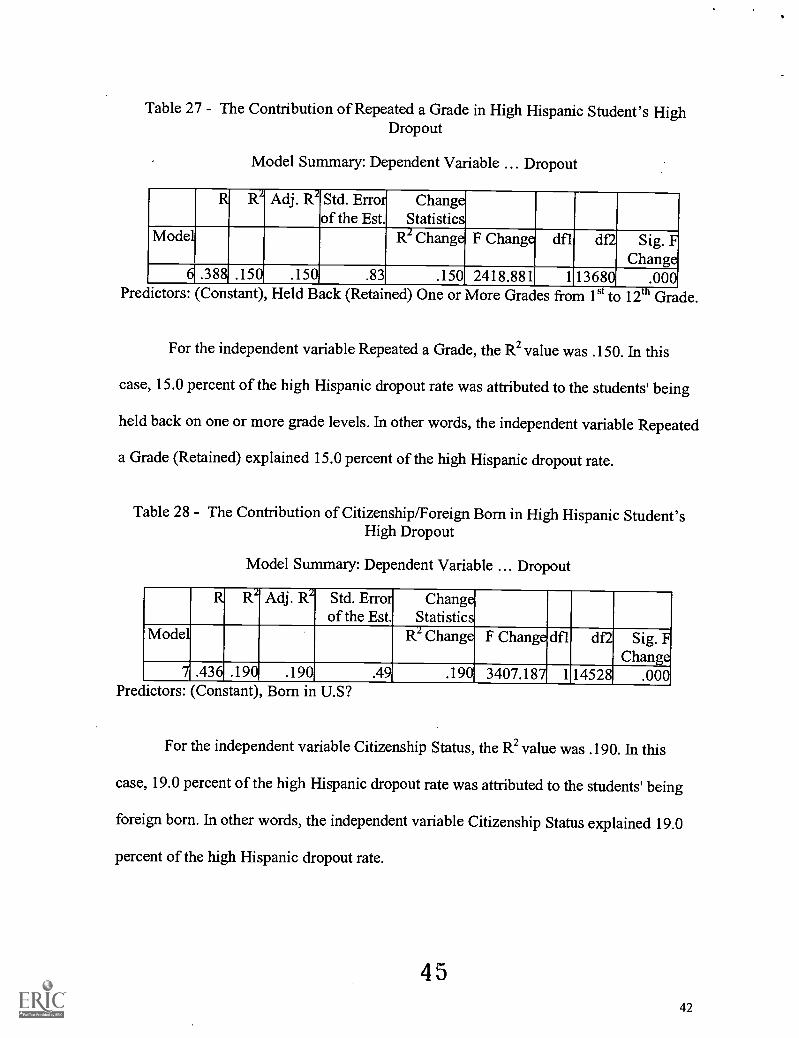
Table 27 - The Contribution of Repeated a Grade in High Hispanic Student's HighDropout
Model Summary: Dependent Variable ... Dropout
R R2 Adj. R2 Std. Errorof the Est.
ChangeStatistics
Model R2 Change F Change dfl df2 Sig. FChange
6 .388 .150 .150 .83 .150 2418.881 1 13680 .000Predictors: (Constant), Held Back (Retained) One or More Grades from 1 to 12 Grade.
For the independent variable Repeated a Grade, the R2 value was .150. In this
case, 15.0 percent of the high Hispanic dropout rate was attributed to the students' being
held back on one or more grade levels. In other words, the independent variable Repeated
a Grade (Retained) explained 15.0 percent of the high Hispanic dropout rate.
Table 28 - The Contribution of Citizenship/Foreign Born in High Hispanic Student'sHigh Dropout
Model Summary: Dependent Variable ... Dropout
R R Adj. R Std. Errorof the Est.
ChangeStatistics
Model R2 Change F Change dfl df2 Sig. FChange
7 .436 .190 .190 .49 .190 3407.187 1 14528 .000Predictors: (Constant), Born in U.S?
For the independent variable Citizenship Status, the R2 value was .190. In this
case, 19.0 percent of the high Hispanic dropout rate was attributed to the students' being
foreign born. In other words, the independent variable Citizenship Status explained 19.0
percent of the high Hispanic dropout rate.
4542
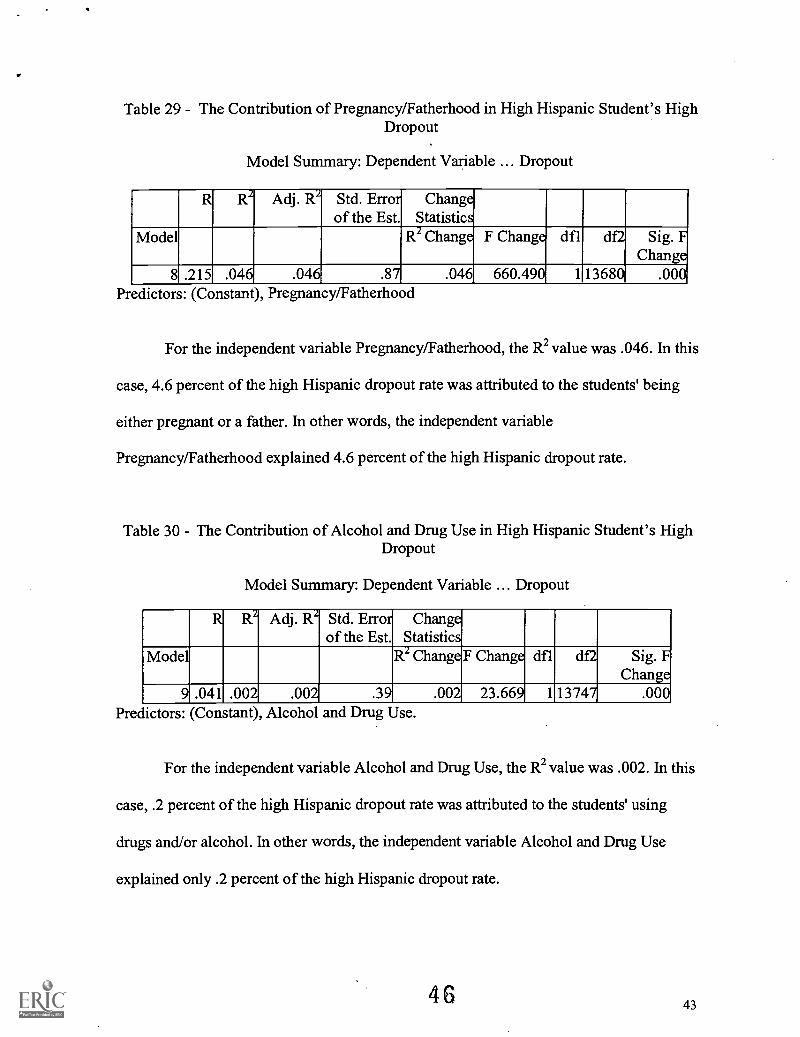
Table 29 - The Contribution of Pregnancy/Fatherhood in High Hispanic Student's HighDropout
Model Summary: Dependent Variable ... Dropout
R R2 Adj. R Std. Errorof the Est.
ChangeStatistics
Model R2 Change F Change dfl df2 Sig. FChange
.0008 .215 .046 .046 .87 .046 660.490 1 13680Predictors: (Constant), Pregnancy/Fatherhood
For the independent variable Pregnancy/Fatherhood, the R2 value was .046. In this
case, 4.6 percent of the high Hispanic dropout rate was attributed to the students' being
either pregnant or a father. In other words, the independent variable
Pregnancy/Fatherhood explained 4.6 percent of the high Hispanic dropout rate.
Table 30 - The Contribution of Alcohol and Drug Use in High Hispanic Student's HighDropout
Model Summary: Dependent Variable ... Dropout
R R Adj. R Std. Errorof the Est.
ChangeStatistics
Model R2ChangeF Change dfl df2 Sig. FChange
9 .041 .002 .00 .39 .002 23.669 113747 .000Predictors: (Constant), Alcohol and Drug Use.
For the independent variable Alcohol and Drug Use, the R2 value was .002. In this
case, .2 percent of the high Hispanic dropout rate was attributed to the students' using
drugs and/or alcohol. In other words, the independent variable Alcohol and Drug Use
explained only .2 percent of the high Hispanic dropout rate.
46 43
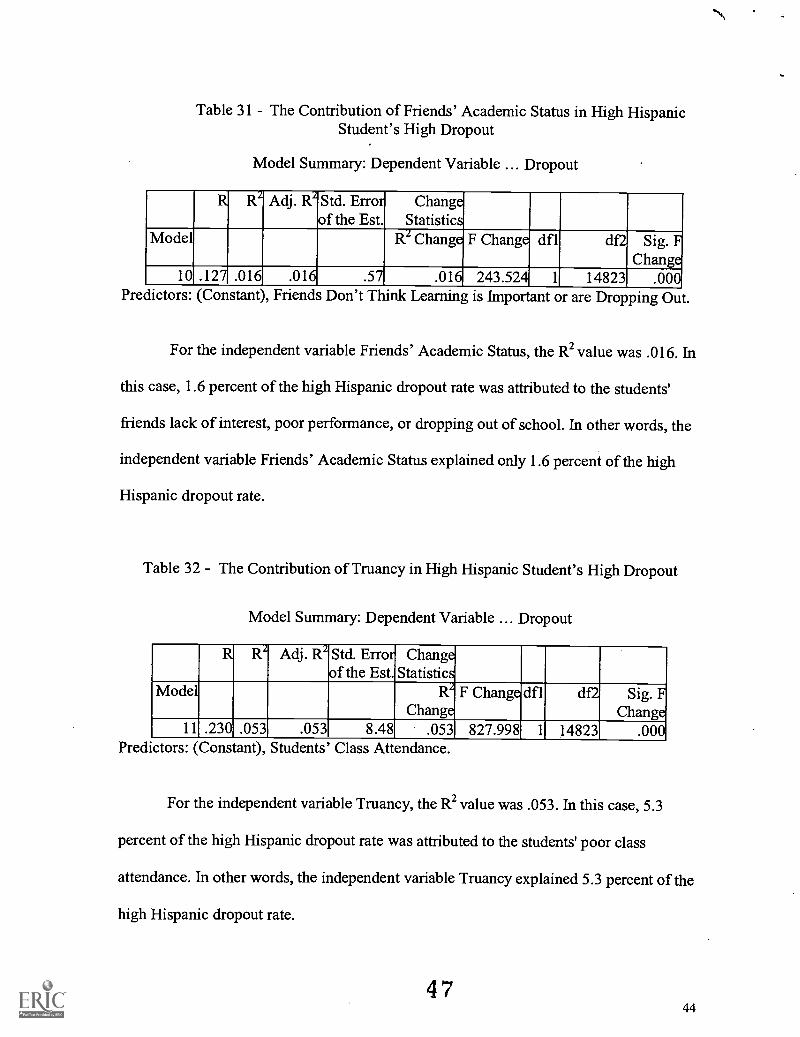
Table 31 - The Contribution of Friends' Academic Status in High HispanicStudent's High Dropout
Model Summary: Dependent Variable ... Dropout
R R2 Adj. R Std. Errorof the Est.
ChangeStatistics
Model R2 Change F Change dfl df2 Sig. FChange
10 .127 .016 .016 .57 .016 243.524_ 1 14823 .000Predictors: (Constant), Friends Don't Think Learning is Important or are Dropping Out.
For the independent variable Friends' Academic Status, the R2 value was .016. In
this case, 1.6 percent of the high Hispanic dropout rate was attributed to the students'
friends lack of interest, poor performance, or dropping out of school. In other words, the
independent variable Friends' Academic Status explained only 1.6 percent of the high
Hispanic dropout rate.
Table 32 - The Contribution of Truancy in High Hispanic Student's High Dropout
Model Summary: Dependent Variable ... Dropout
R R Adj. R Std. Errorof the Est.
ChangeStatistics
Model RIFChange
Change dfl df2 Sig. FChange
.00011 .230 .053 .053 8.48 .053 827.998 1 14823Predictors: (Constant), Students Class Attendance.
For the independent variable Truancy, the R2 value was .053. In this case, 5.3
percent of the high Hispanic dropout rate was attributed to the students' poor class
attendance. In other words, the independent variable Truancy explained 5.3 percent of the
high Hispanic dropout rate.
4744
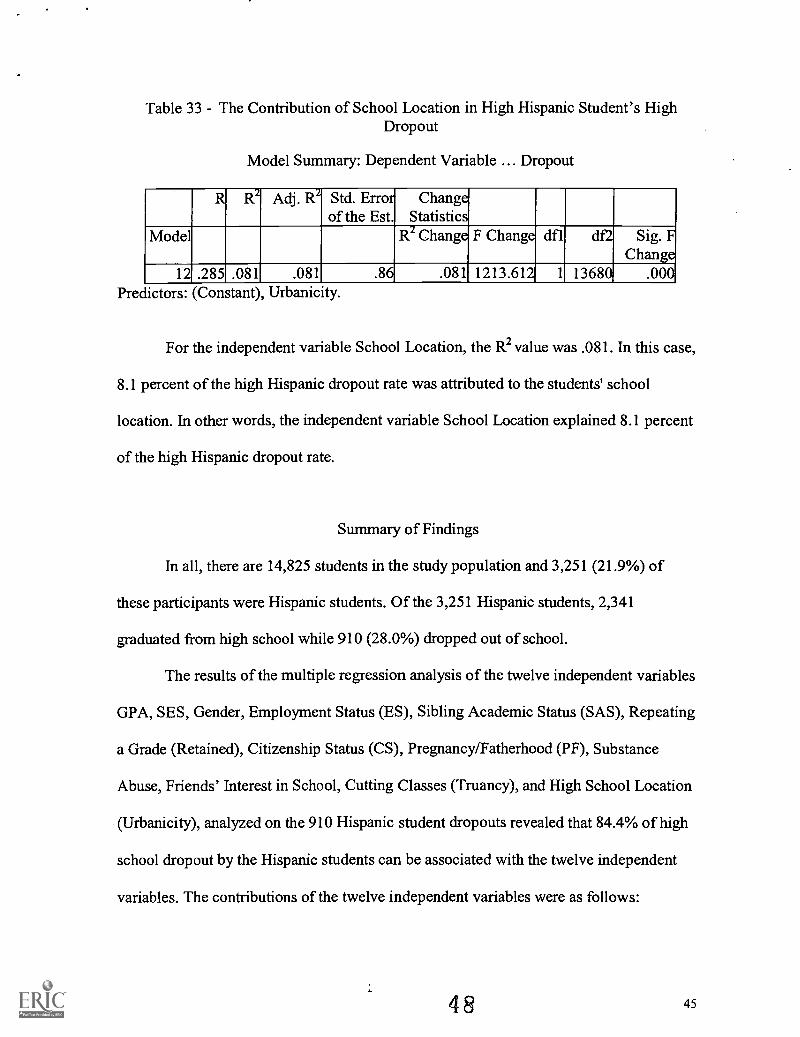
Table 33 The Contribution of School Location in High Hispanic Student's HighDropout
Model Summary: Dependent Variable ... Dropout
R R2 Adj. R Std. Errorof the Est.
ChangeStatistics
Model R2 Change F Change dfl df2 Sig. FChange
12 .285 .081 .081 .86 .081 1213.612 1 13680 .000Predictors: (Constant), Urbanicity.
For the independent variable School Location, the R2 value was .081. In this case,
8.1 percent of the high Hispanic dropout rate was attributed to the students' school
location. In other words, the independent variable School Location explained 8.1 percent
of the high Hispanic dropout rate.
Summary of Findings
In all, there are 14,825 students in the study population and 3,251 (21.9%) of
these participants were Hispanic students. Of the 3,251 Hispanic students, 2,341
graduated from high school while 910 (28.0%) dropped out of school.
The results of the multiple regression analysis of the twelve independent variables
GPA, SES, Gender, Employment Status (ES), Sibling Academic Status (SAS), Repeating
a Grade (Retained), Citizenship Status (CS), Pregnancy/Fatherhood (PF), Substance
Abuse, Friends' Interest in School, Cutting Classes (Truancy), and High School Location
(Urbanicity), analyzed on the 910 Hispanic student dropouts revealed that 84.4% of high
school dropout by the Hispanic students can be associated with the twelve independent
variables. The contributions of the twelve independent variables were as follows:
48 45
GPA accounted for 10.6%, SES accounted for 13.6%, Sex
(Gender) accounted for .3%, Employment (working 20 or more
hours per week while attending high school) accounted for only
6.1%, Sibling Academic Status accounted for 3.9%, Repeated a
Grade accounted for 15.0%, Citizenship (Foreign Born)/English
Proficiency accounted for 19%, Pregnancy/Fatherhood accounted
for 4.6, Alcohol and Drug Use (Substance Abuse) accounted for
.2%, Friends' Academic Status accounted for 1.6%, Truancy
(Cutting Class) accounted for 5.3%, and Urbanicity (School
Location) accounted for 8.1%.
In essence, other variables not considered in the analysis accounted for 15.6% of
the high Hispanic students' dropout rate. However, it should be noted that the following
independent variables Citizenship/English Proficiency (19%), Repeated Grade (15%),
SES (13.6%), and Student academic ability/GPA (10.6%) had the most impact; School
Location/Urbanicity (8.1%), Employment/working 20 hours or more per week (6.1%)
and Truancy (5.3%) had a moderate impact; while Pregnancy/Fatherhood (4.6%), Sibling
Academic Status (3.9%), Friends' Academic Status (1.6%), Sex/Gender (.3%), and
Alcohol and Drug Use (.2%) had the least or negligible impact.
In other words, Pregnancy/Fatherhood (4.6%), Sibling Academic Status (3.9%),
Friends Academic Status (1.6%), Sex/Gender (.3%), and Alcohol and Drug Use (.2%)
were not factors in the prediction of the high Hispanic students' dropout rates.
4946
Conclusions
As a result of the quantitative analysis and findings generated by this study, the
following conclusions were drawn regarding the factors that contribute to the high
Hispanic dropout rate:
1. Citizenship/ English Proficiency (19%), Repeated Grade (15%), SES (13.6%), and
Student academic ability/GPA (10.6%) had the most impact.
2. School Location/Urbanicity (8.1%), Employment/working 20 hours or more per
week (6.1%) and Truancy (5.3%) had a moderate impact.
3. Pregnancy/Fatherhood (4.6%), Sibling Academic Status (3.9%), Friends Academic
Status (1.6%), Sex/Gender (.3%), and Alcohol and Drug Use (.2%) had the least or
negligible impact. In other words, Pregnancy/Fatherhood (4.6%), Sibling Academic
Status (3.9%), Friends' Academic Status (1.6%), Sex/Gender (.3%), and Alcohol and
Drug Use (.2%) were not factors in the prediction of the high Hispanic students'
dropout rates.
4. The overall contributions of the independent variables - Family Socioeconomic Status
(13.6%), Academic Ability (10.6%), Sex (.3%), Employment Status (6.1%), Sibling
Academic Status (3.9%), Repeated a Grade (15.0%), Citizenship Status/ English
Proficiency (19.0%), Pregnancy/Fatherhood (4.6%), Alcohol and Drug Use (.2%),
Friends' Interest in School (1.6%), Cut Classes (5.3%), and High School Location
(8.1%) in explaining the high Hispanic dropout rate was 84.4%. In other words,
84.4% of the high Hispanic dropout rate can be attributed to those twelve factors,
15.6% of the high Hispanic dropout rate can be attributed to other independent
variables that were not considered in this study.
50 47
5. The dropout rate of the Hispanic students in this study was found to be 28.0%;
because, of the 3251 Hispanic student participants, 910 of them dropped out resulting
in a 28% dropout rate for the Hispanic students.
51
48
References
Abraham, J. (1989). Testing Hargreaves' and Lacey's Differentiation-PolarizationTheory in a Setted Comprehensive. British Journal of Sociology, 40, 46-81.
Asche, J. A. (1993). Finish for the Future: America's Communities Respond. Alexandria,VA: National Association of Partners in Education, Inc.
Berends, M. (1991). High School Tracking and Students' School Orientations.Madison, Wis.: National Center on Effective Secondary Schools.
Bickel, W. E.; Bond, L.; and LeMahieu, P. (1986, August). Students at Risk of NotCompleting High School. A Background Report to the Pittsburgh Foundation.Pittsburgh, PA: Pittsburgh Foundation.
Bickel, R. & Papagiannis, G. (1988). Post-high school prospects and district-leveldropout rates. Youth & Society, 20,123-147.
Cardenas, J. A., Montecel, M.R., Supik, J.D., & Harris, R.J. (1992). The Coca-ColaValued Youth Program. Dropout prevention strategies for at-risk students. TexasResearcher, 3, 111-130.
Center for Applied Linguistics. (1994). Project Adelante: Moving onward to a bettereducation. Washington, DC: Author.
Catterall, J.S. (1987, November). On the social costs of dropping out of school. The HighSchool Journal, 71,19-30.
Catterall, James S. (1989). Standards and school dropouts: A national study of testsrequired for high school graduation. American Journal of Education, 98, 1-34.
Claiborne, W. (1994, October 12). Fighting school failure among Hispanics. WashingtonPost.
Clark, R. L. (1992, December). Neighborhood effects on dropping out of school amongteenage boys. Discussion paper. Washington, D.C.: The Urban Institute.
Coladarci, T. (1983). High School dropout Among Native Americans, Journal ofAmerican Indian Education, 23, no. 1, 15-22.
Conrath, J.(1986). Effective Schools Must Focus on Potential Dropouts. NASSP Bulletin,70/487, 46-50.
5249
Dayton, C., & Stern, D. (1990). Graduate follow-up survey of the June 1988 graduates ofthe California Partnership Academies (Policy Paper No. PP90-1-1). Berkeley:University of California, School of Education Policy Analysis for CaliforniaEducation. (ED 327 603)
Dryfoos, J. G.(1990). Adolescents at Risk: Prevalence and Prevention. New York:Oxford University Press.
Ekstrom, R.B., Goertz, M.E., Pollack, J.M., & Rock, D.A. (1986). Who drops out of highschool and why? Findings from a national study. Teachers College Record, 87,356-373.
Fine, Michelle. (1986). Why urban adolescents drop into and out of public high school. InGary Natriello (Ed.), School Dropouts: Patterns and Policies (pp. 89-105). NewYork: Teachers College Press.
Finley, M. K. (1984). Teachers and Tracking in a Comprehensive High School.Sociology of Education, 57, 233-243.
Gamoran, A. (1986). Instructional and Institutional Effects of Ability Grouping.Sociology of Education, 59, 185-198.
Gamoran, A. (1987). The Stratification of High School Learning Opportunities.Sociology of Education, 60, 135-155.
Gamoran, A., and M. Nystrand. (1990). Tracking, Instruction, and Achievement.Paper presented at the World Congress of Sociology, Madrid.
Gaustad, Joan. (1991). Identifying Potential Dropouts. ERIC Digest. ERIC Clearinghouseon Educational Management, University of Oregon, Eugene, Oregon.
General Accounting Office. (1994). Hispanics' schooling. Risk factors for dropping outand barriers to resuming education. Washington DC: Author.
Gerald D. E., & Hussar, W. J. (1997). Projections of Education Statistics to 2007.Washington DC: U. S. Department of Education, National Center for EducationStatistics.
Grissmer, D. W., Kirby, S. N., Berends, M., & Williamson, S.(1994). StudentAchievement and the Changing American Family. Santa Monica, CA: RAND
Hahn, A.; Danzberger, J.; with Lefkowitz, B. (1987). "Dropouts in America: Enough IsKnown for Action." Washington, DC: Institute for Educational Leadership.
Hargroves, J. S. (1987). The Boston Compact: Facing the Challenge of School Dropouts.Education and Urban Society, 19/3, 303-310.
53 50
Hispanic Dropout Project [HDP] (1996). The study of Issues Related to the HispanicDropout Problem, A 1995 non federal commission project initiated by the U.S.Secretary of Education Richard Riley.
Hispanic Dropout Project [HDP] (1998, February). No More Excuses: The Final Reportof the Hispanic Dropout Project. U.S. Department of Education's HispanicDropout Project.
Hess, G. A., Jr.; Well, E.; Prindle, C.; Liftman, P.; and Kaplan, B. (1987). Where's Room185? How Schools Can Reduce Their Dropout Problem. Education and UrbanSociety, 19/3, 330-355.
Hill, M. A., & O'Neil, J. (1994). Family endowment and the achievement of youngchildren with special reference to the underclass. Journal of Human Resources,29(4), 1065-1100.
Kaufman, P., Klein, S., and Mary Frase, M., (1997). Dropout Rates in the United States:1997. U.S. Department of Education's National Center for Education Statistics.
Kulik, J. A. (1992). An Analysis of the Research On Ability Grouping: Historical andContemporary Perspectives (RBDM 9204), Storrs, CT: The national ResearchCenter on the Gifted and Talented, University of Connecticut.
International Development and Research Association [IDRA] (1986). Attrition andDropout Rates in Texas. IDRA's Division of Evaluation Research. IDRA anindependent, non-profit organization that advocates the right of every child to aquality education.
Lacey, C. (1970). Hightown Grammar. Manchester: Manchester University Press.
LeCompte, M.D. & Dworkin, A.G. (1987). Giving Up on School: Student Dropouts andTeacher Burnouts. Newbury Park, CA: Corwin Press.
Mann, D. (1986). Can We Help Dropouts? Thinking About the Undoable, In SchoolDropouts: Patterns and Policies (Ed.) by G. Natriello. New York: TeachersCollege Press, 15.
McDill, Edward L., Natriello, Gary, and Pallas, Aaron M. (1987). A population at risk:Potential consequences of tougher school standards for student dropouts. In GaryNatriello (Ed.), School Dropouts: Patterns and Policies (pp.106-147). New York:Teachers College Press.
McMillen, M. M.; Kaufman, P.; Hausken, E. G.; and Bradby, D. (1993, September).Dropout Rates in the United States: 1992. Washington, DC: National Center for
54 51
Education Statistics, Office of Educational Research and Improvement, U.S.Department of Education.
McMillen, Marilyn M.; Kaufman, Phillip; Whitener, Summer D. (1994). Drop-out Ratesin the United States: 1993. US.Department of Education, National Center forEducation Statistics, 1994.
National Diffusion Network. (1993). Educational Programs That Work: The Catalogueof the National Diffusion Network (NDN) Linking the Nation With Excellence.19th Edition. Longmont, CO: Sopris West.
National Research Council. (1997). The new Americans: Economic, demographic, andFiscal effects of immigration. Washington, DC: National Academy Press.
Natriello, G. (1986). School Dropouts: Patterns and Policies. New York: Teachers.College Press.
Natriello, G., McDill, E. L., & Pallas, A. M., (1990). Schooling disadvantaged children:Racing against catastrophe. New York: Teacher College Press.
Oakes, J. (1985). Keeping Track: How Schools Structure Inequality. New Haven,Conn.: Yale University Press.
Oakes, J. (1991). Multiplying Inequalities: The Effects of Race, Social Class, andTracking on Opportunities to Learn Mathematics and Science. Santa Monica,Calif.: RAND.
Office of Educational Research and Improvement. (1993). Reaching the goals. Goal 2:High school completion. Washington, DC: Author. (ED 365 471)
Office of Educational Research and Improvement Goal 2 Work Group. (1993, October).Reaching the Goals: Goal 2, High School Completion. Washington, DC: U.S.Department of Education.
Office of Educational Research and Improvement Urban Superintendents Network.(1987, November). Dealing with Dropouts: The Urban Superintendents' Call toAction. Washington, DC: Office of Educational Research and Improvement.
Ogbu, J. U. (1989). The individual in collective adaptation: A framework for focusing onacademic under-performance and dropping out among involuntary minorities. InL.Weis, E. Farrar, & H. G. Petrie (Eds.), Dropouts from school: Issues, dilemmas,and solutions, (pp.181-204). Albany, NY: State University of New York Press.
5552
On, M. T. (1987, July). What to Do About Youth Dropouts? A Summary of Solutions.New York: Structured Employment/Economic Development Corporation, July1987.
Page, R. N. (1992). Lower Track Classrooms: A Curricular and Cultural Perspective.New York: Teachers College Press.
Pallas, A. M.; Natriello, G.; and Mc Dill, E. L. (1988, April). Who Falls Behind: Definingthe 'At-Risk' Population -- Current Dimensions and Future Trends. Paperpresented at the Annual Meeting of the American Educational ResearchAssociation, New Orleans, LA, (ED 312 330).
Peck, N.; Law, A.; and Mills, R. C. (1987). Dropout Prevention: What We Have Learned.Educational Resources Information Center/Counseling and Personnel ServicesClearinghouse, (ED 279 989).
Peng, S. S. and Takai, R. T. (1983). High School Dropout: Descriptive Information fromHigh School and Beyond. Bulletin, Washington, DC: National Center forEducational Statistics.
Pirog, M.A. and Magee, C. (1997). High school completion: The influence of schools,families, and adolescent parenting. Social science quarterly, 78 710-724.
Presson, A., and Bottoms, G. (1992). A Reason to Stay in School: What Educators CanDo to Reduce Dropout Rates. Atlanta, GA: Southern Regional Education Board.
Raby, M. (1990). The California Partnership Academies. Redwood City, CA: SequoiaUnion High School District.
Robledo, M.R., & Rivera, C. (1990). Partners for Valued Youth: Dropout preventionstrategies for at-risk language minority students. San Antonio, TX: InterculturalDevelopment Research Association.
Rosenbaum, J. E. (1976). Making Inequality: The Hidden Curriculum of High SchoolTracking. New York: Wiley.
Rumberger, R.W. (1983). Dropping out of high school: The influence of race, sex, andfamily background. American Educational Research Journal, 20, 199-220.
Rumberger, R.W. (1987). High school dropouts: A review of issues and evidence. Reviewof Educational Research, 57, 101-121.
Rumberger, R.W. (1995). Dropping out of middle school: A multilevel analysis ofstudents and schools. American Educational Research Journal, 32 583-625.
5653
Secada, W. (1992). Race, ethnicity, social class, language, and achievement inmathematics. In D. Grouws (Ed.), Handbook of research on mathematics teachingand learning. Reston, VA: National Council of Teachers of Mathematics, Inc.
Slavin, R. E. (1987). Ability Grouping and Achievement in Elementary Schools: ABest-Evidence Synthesis. Review of Educational Research, 57, 293-336.
Slavin, R. E. (1990). Achievement Effects of Ability Grouping in SecondarySchools: A Best-Evidence Synthesis. Review of Educational Research, 60,471-499.
Smink, J. (1990). What Really Works? National Dropout Prevention Newsletter 3/2.
Stanford Mid-Peninsula Urban Coalition. (1990). California Partnership Academieshandbook: A guide to success. Palo Alto, CA: Author. (ED 327 621)
Texas Education Agency [TEA]. (1998). 1996-97 Report on Grade Level Retention.Austin: Texas Education Agency.
The Dropout Information Clearinghouse. (1989). Effective Schools Research andDropout Reduction. Austin: The Texas Education Agency.
The National Education Goals Report: Building a Nation of Learners. (1993). TheNational Report. Washington, DC: The National Education Goals Panel: VolumeOne.
U. S. Bureau of the Census, (1997). Statistical abstract of the United States: 1997 (117thed.). Washington, DC: Author.
U.S. Department of Education, National Center for Education Statistics. (1993). TheConditio of Education. Washington, DC: USDOE.
Wehlage, Gary G., Rutter, Robert A. (1986). Dropping out: How much do schoolscontribute to the problem? Teachers College Record, 87, 374-392.
Wehlage, G. (1991). School Reform for At-Risk Students. Equity and Excellence, 25/1,15-24.
Wheelock, A.(1992). Crossing The Tracks: How Untracking Can Save America'sSchools. New York: Teachers College Press.
Williams, S. B. (1987). A Comparative Study of Black Dropouts and Black High SchoolGraduates in an Urban Public School System. Education and Urban Society, 19/3,311-319.
57
54
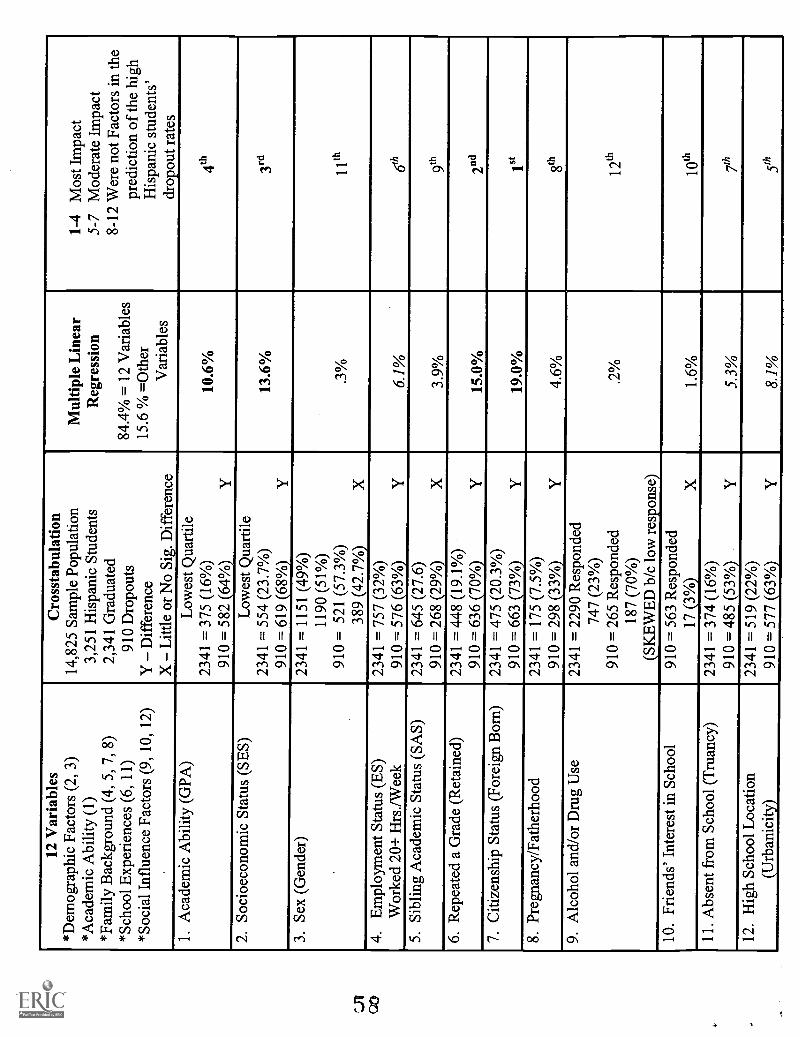
12 V
aria
bles
*Dem
ogra
phic
Fac
tors
(2,
3)
*Aca
dem
ic A
bilit
y (1
)*F
amily
Bac
kgro
und
(4, 5
, 7, 8
)*S
choo
l Exp
erie
nces
(6,
11)
*Soc
ial I
nflu
ence
Fac
tors
(9,
10,
12)
Cro
ssta
bula
tion
14,8
25 S
ampl
e Po
pula
tion
3,25
1 H
ispa
nic
Stud
ents
2,34
1 G
radu
ated
910
Dro
pout
sY
Dif
fere
nce
X L
ittle
or
No
Sig.
Dif
fere
nce
Mul
tiple
Lin
ear
Reg
ress
ion
84.4
% =
12
Var
iabl
es15
.6 %
=O
ther
Var
iabl
es
1-4
Mos
t Im
pact
5-7
Mod
erat
e Im
pact
8-12
Wer
e no
t Fac
tors
in th
epr
edic
tion
of th
e hi
ghH
ispa
nic
stud
ents
'dr
opou
t rat
es1.
Aca
dem
ic A
bilit
y (G
PA)
Low
est Q
uart
ile23
41 =
375
(16
%)
10.6
%4t
h91
0 =
582
(64
%)
Y2.
Soc
ioec
onom
ic S
tatu
s (S
ES)
Low
est Q
uart
ile23
41 =
554
(23
.7%
)13
.6%
3rd
910
= 6
19 (
68%
)Y
3. S
ex (
Gen
der)
2341
= 1
151
(49%
)11
90 (
51%
)91
0 =
521
(57
.3%
).3
%11
th38
9 (4
2.7%
)X
4.E
mpl
oym
ent S
tatu
s (E
S)23
41 =
757
(32
%)
Wor
ked
20+
Hrs
./Wee
k91
0 =
576
(63
%)
Y6.
1%6t
h5.
Sib
ling
Aca
dem
ic S
tatu
s (S
AS)
2341
= 6
45 (
27.6
)_
910
= 2
68 (
29%
)X
3.9%
6. R
epea
ted
a G
rade
(R
etai
ned)
2341
= 4
48 (
19.1
%)
910
= 6
36 (
70%
)Y
15.0
%2n
d
7. C
itize
nshi
p St
atus
(Fo
reig
n B
orn)
2341
= 4
75 (
20.3
%)
910
= 6
63 (
73%
)Y
19.0
%1"
8. P
regn
ancy
/Fat
herh
ood
2341
= 1
75 (
7.5%
)91
0 =
298
(33
%)
Y4.
6%8t
h
9. A
lcoh
ol a
nd/o
r D
rug
Use
2341
= 2
290
Res
pond
ed74
7 (2
3%)
910
= 2
65 R
espo
nded
.2%
12th
187
(70%
)(S
KE
WE
D b
/c lo
w r
espo
nse)
10. F
rien
ds' I
nter
est i
n Sc
hool
910
= 5
63 R
espo
nded
17 (
3%)
X1.
6%10
th11
. Abs
ent f
rom
Sch
ool (
Tru
ancy
)23
41 =
374
(16
%)
910
= 4
85 (
53%
)Y
5.3%
12. H
igh
Scho
ol L
ocat
ion
2341
= 5
19 (
22%
)(U
rban
icity
)91
0 =
577
(63
%)
Y8.
1%5t
h
U.S. Department of EducationOffice of Educational Research and Improvement (OERI)
National Library of Education (NLE)Educational Resources Information Center (ERIC)
REPRODUCTION RELEASE(Specific Document)
I. DOCUMENT IDENTIFICATION:
Walloon! Re ources Inlormolion Centel
0 00a1124
Title:
efq60/ 2-seAuthor(s): 4 Kik 0A/14 E---ei,g4 ,E4, Thn'-iesCorporate Source:
(-) rt;velSiPublication Date:
pr/ /2-06-3II. REPRODUCTION RELEASE:
In order to disseminate as widely as possible timely and significant materials of interest to the educational community, documents announced in themonthly abstract journal of the ERIC system, Resources in Education (RIE), are usually made available to users in microfiche, reproduced paper copy, andelectronic media, and sold through the ERIC Document Reproduction Service (EDRS). Credit is given to the source of each document, and, if reproductionrelease is granted, one of the following notices is affixed to the document.
If permission is granted to reproduce and disseminate the identified document, please CHECK ONE of the following three options and sign at the bottomof the page.
The sample sticker shown below will beaffixed to all Level 1 documents
PERMISSION TO REPRODUCE ANDDISSEMINATE THIS MATERIAL HAS
BEEN GRANTED BY
TO THE EDUCATIONAL RESOURCESINFORMATION CENTER (ERIC)
Check here for Level 1 release, permitting reproductionand dissemination in microfiche or other ERIC archival
media (e.g., electronic) end paper copy.
Sign
here,please
The sample sticker shown below will beaffixed to all Level 2A documents
PERMISSION TO REPRODUCE ANDDISSEMINATE THIS MATERIAL IN
MICROFICHE, AND IN ELECTRONIC MEDIAFOR ERIC COLLECTION SUBSCRIBERS ONLY,
HAS BEEN GRANTED BY
2A
n"
TO THE EDUCATIONAL RESOURCESINFORMATION CENTER (ERIC)
Level 2A
1
Check here for Level ZA release, permitting reproductionand dissemination in microfiche and in electronic media for
ERIC archival collection subscribers only
The sample, sticker shown below will beaffixed to all Level 28 documents
PERMISSION TO REPRODUCE ANDDISSEMINATE THIS MATERIAL IN
MICROFICHE ONLY HAS BEEN GRANTED BY
2B
TO THE EDUCATIONAL RESOURCESINFORMATION CENTER (ERIC)
Level 2B
Check here for Level 2B release, permitting reproductionand dissemination in microfiche only
Documents will be processed as indicated provided reproduction quality permits.If permission to reproduce is granted, but no box is checked, documents will be processed at Level 1.
I hereby grant to the Educational Resources Information Center (ERIC) nonexclusive permission to reproduce and disseminate thydocument as indicated above. Reproduction from the ERIC microfiche or electronic media by persons other than ERIC employees
m /desystem contractors requires permission from the copyright holder. Exception i m de for non-profit by libraries anservice ncies to satisfy information needs of educators in nse to nqiiities.
Sig k,'().Organization/ ddress: A/ta jl'/ 444 617-
ku)417
8OX. 300 2
14A14-Ve 4
Printed Name/PositionfTips;) c..)wesra
FAIO (If 41--
L-tc s Vert 3 11)
Telephonte
E-Mail_Address:4J vfrte-SCOO//k fe /zoo 3(Over)
UZ
III. DOCUMENT AVAILABILITY INFORMATION (FROM NON-ERIC SOURCE):
If permission to reproduce is not granted to ERIC, or, if you wish ERIC to cite the availability of the document from another source, pleaseprovide the following information regarding the availability of the document. (ERIC will not announce a document unless it is publiclyavailable, and a dependable source can be specified. Contributors should also be aware that ERIC selection criteria are significantly morestringent for documents that cannot be made available through EDRS.)
Publisher/Distributor:
Address:
Price:
IV. REFERRAL OF ERIC TO COPYRIGHT/REPRODUCTION RIGHTS HOLDER:
If the right to grant this reproduction release is held by someone other than the addressee, please provide the appropriate name andaddress:
Name:
Address:
V.WHERE TO SEND THIS FORM:
Send this form to the following ERIC Clearinghouse: University of MarylandERIC Clearinghouse on Assessment and Evaluation
1129 Shriver Lab, Bldg 075College Park, MD 20742
Attn: Acquisitions
However, if solicited by the ERIC Facility, or if making an unsolicited contribution to ERIC, return this form (and the document beingcontributed) to:
University of MarylandERIC Clearinghouse on Assessment and Evaluation
1129 Shriver Lab, Bldg 075College Park, MD 20742
Attn: Acquisitions
EFF-088 (Rev. 2/2001)