Embed Size (px)
Citation preview

Document of The World Bank
Report No: 27538
PROJECT PERFORMANCE ASSESSMENT REPORT
UGANDA
Primary Education and Teacher Development Project (Credit 2493), and
Education Sector Adjustment Credit
(Credit 3049)
January 8, 2004
Sector and Thematic Evaluation Group Operations Evaluation Department

Currency Equivalents (annual averages) Currency Unit = Ugandan Shilling (U Sh)
2001 US$1.00 1720 U Sh 2002 US$1.00 1710 U Sh
Abbreviations and Acronyms
DfID Department for International Development (UK) EFAG Education Funding Agencies Group EMIS Education Management Information System ESAC Education Sector Adjustment Credit ESIP Education Sector Investment Plan HIPC Heavily Indebted Poor Countries Initiative ICR Implementation Completion Report IDA International Development Association IMU Instructional Materials Unit M&E Monitoring and evaluation MOES Ministry of Education and Sports NAPE National Assessment of Progress in Education OED Operations Evaluation Department PETDP Primary Education and Teacher Development Project PIU Project Implementation Unit PPAR Project Performance Assessment Report PRSP Poverty Reduction Strategy Paper PTA Parent-teacher association PTC Primary Teachers’ College SWAp Sector-wide approach TDMS Teacher Development And Management System UNEB Uganda National Examinations Board UPE Universal primary education USAID United States Agency for International Development
Fiscal Year
Government: July 1—June 30
Director-General, Operations Evaluation : Mr. Gregory K. Ingram Director, Operations Evaluation Department : Mr. Ajay Chhibber Manager, Sector and Thematic Evaluation Group : Mr. Alain Barbu Task Manager: : Ms. Martha Ainsworth
i
OED Mission: Enhancing development effectiveness through excellence and independence in evaluation.
About this Report
The Operations Evaluation Department assesses the programs and activities of the World Bank for two purposes: first, to ensure the integrity of the Bank’s self-evaluation process and to verify that the Bank’s work is producing the expected results, and second, to help develop improved directions, policies, and procedures through the dissemination of lessons drawn from experience. As part of this work, OED annually assesses about 25 percent of the Bank’s lending operations. In selecting operations for assessment, preference is given to those that are innovative, large, or complex; those that are relevant to upcoming studies or country evaluations; those for which Executive Directors or Bank management have requested assessments; and those that are likely to generate important lessons. The projects, topics, and analytical approaches selected for assessment support larger evaluation studies.
A Project Performance Assessment Report (PPAR) is based on a review of the Implementation Completion Report (a self-evaluation by the responsible Bank department) and fieldwork conducted by OED. To prepare PPARs, OED staff examine project files and other documents, interview operational staff, and in most cases visit the borrowing country for onsite discussions with project staff and beneficiaries. The PPAR thereby seeks to validate and augment the information provided in the ICR, as well as examine issues of special interest to broader OED studies.
Each PPAR is subject to a peer review process and OED management approval. Once cleared internally, the PPAR is reviewed by the responsible Bank department and amended as necessary. The completed PPAR is then sent to the borrower for review; the borrowers' comments are attached to the document that is sent to the Bank's Board of Executive Directors. After an assessment report has been sent to the Board, it is disclosed to the public.
About the OED Rating System
The time-tested evaluation methods used by OED are suited to the broad range of the World Bank’s work. The methods offer both rigor and a necessary level of flexibility to adapt to lending instrument, project design, or sectoral approach. OED evaluators all apply the same basic method to arrive at their project ratings. Following is the definition and rating scale used for each evaluation criterion (more information is available on the OED website: http://worldbank.org/oed/eta-mainpage.html).
Relevance of Objectives: The extent to which the project’s objectives are consistent with the country’s current development priorities and with current Bank country and sectoral assistance strategies and corporate goals (expressed in Poverty Reduction Strategy Papers, Country Assistance Strategies, Sector Strategy Papers, Operational Policies). Possible ratings: High, Substantial, Modest, Negligible.
Efficacy: The extent to which the project’s objectives were achieved, or expected to be achieved, taking into account their relative importance. Possible ratings: High, Substantial, Modest, Negligible.
Efficiency: The extent to which the project achieved, or is expected to achieve, a return higher than the opportunity cost of capital and benefits at least cost compared to alternatives. Possible ratings: High, Substantial, Modest, Negligible. This rating is not generally applied to adjustment operations.
Sustainability: The resilience to risk of net benefits flows over time. Possible ratings: Highly Likely, Likely, Unlikely, Highly Unlikely, Not Evaluable.
Institutional Development Impact: The extent to which a project improves the ability of a country or region to make more efficient, equitable and sustainable use of its human, financial, and natural resources through: (a) better definition, stability, transparency, enforceability, and predictability of institutional arrangements and/or (b) better alignment of the mission and capacity of an organization with its mandate, which derives from these institutional arrangements. Institutional Development Impact includes both intended and unintended effects of a project. Possible ratings: High, Substantial, Modest, Negligible.
Outcome: The extent to which the project’s major relevant objectives were achieved, or are expected to be achieved, efficiently. Possible ratings: Highly Satisfactory, Satisfactory, Moderately Satisfactory, Moderately Unsatisfactory, Unsatisfactory, Highly Unsatisfactory.
Bank Performance: The extent to which services provided by the Bank ensured quality at entry and supported implementation through appropriate supervision (including ensuring adequate transition arrangements for regular operation of the project). Possible ratings: Highly Satisfactory, Satisfactory, Unsatisfactory, Highly Unsatisfactory.
Borrower Performance: The extent to which the borrower assumed ownership and responsibility to ensure quality of preparation and implementation, and complied with covenants and agreements, towards the achievement of development objectives and sustainability. Possible ratings: Highly Satisfactory, Satisfactory, Unsatisfactory, Highly Unsatisfactory.

iii
Contents
Principal Ratings................................................................................................................v
Key Staff Responsible ........................................................................................................v
Preface.............................................................................................................................. vii
Summary........................................................................................................................... ix
1. Background ..................................................................................................................1
Post-Conflict Recovery ............................................................................................1
Primary Education...................................................................................................1
Project Objectives and Components........................................................................3 Primary Education and Teacher Development Project................................3 Education Sector Adjustment Credit ...........................................................3
2. Implementation ............................................................................................................4
PETDP .....................................................................................................................4
ESAC........................................................................................................................6
3. Contribution to Sector Outcomes...............................................................................7
Primary Enrollments................................................................................................8
Level and Efficiency in Use of Resources ................................................................9
Quality of Teaching and Learning.........................................................................12
Sector Governance and Management....................................................................16
4. Ratings ........................................................................................................................18
Outcome .................................................................................................................18
Relevance...................................................................................................18 Efficacy ......................................................................................................18 Efficiency...................................................................................................19 Overall Outcome........................................................................................19
Institutional Development Impact..........................................................................19
Sustainability..........................................................................................................20
Bank Performance .................................................................................................20
Borrower Performance ..........................................................................................22
This report was prepared by Gillian Perkins, Consultant, who assessed the project in February 2003. The report was edited by William B. Hurlbut, and Pilar Barquero provided administrative support.
iv
5. Adjustment Lending and Sector-wide Approach ...................................................22
Role of the Bank .....................................................................................................23
Emerging Issues .....................................................................................................24
6. Lessons ........................................................................................................................26
Lessons for Supporting Expansion of Primary Education.....................................27
Lessons for Using Budget Support in a SWAp for Education................................28
References.........................................................................................................................29
Annex A. Basic Data Sheet..............................................................................................31
Annex B. Comments from the Borrower.......................................................................35
Tables
Table 1. Average Number of Pupils Per Teacher, Classroom, and Textbook .................. 13 Figures
Figure 1. Estimated Net Primary Enrollment Rates, 1992 and 1999/2000......................... 9 Figure 2. Budget Allocations to Education, 1995-2003 ................................................... 10

v
Principal Ratings
Primary Education and Teacher Development Project (Credit 2493) ICR* PPAR Outcome Satisfactory Moderately satisfactory Sustainability Likely Likely Institutional Development Impact
Modest Substantial
Bank Performance Satisfactory Satisfactory Borrower Performance
Satisfactory Satisfactory
Education Sector Adjustment Operation (Credit 3049)
ICR* PPAR Outcome Highly satisfactory Satisfactory Sustainability Highly likely Likely Institutional Development Impact
Substantial Substantial
Bank Performance Highly satisfactory Satisfactory Borrower Performance
Satisfactory Satisfactory
* The Implementation Completion Report (ICR) is a self-evaluation by the responsible operational division of the Bank. Key Staff Responsible Primary Education and Teacher Development Project (Credit 2493) Project Task Manager/Leader Division Chief/
Sector Director Country Director
Appraisal Nat Colletta Jacob van Lutsenburg Maas
Francis Colaco
Completion Patrick D. Murphy Dzingai Mutumbuka James W. Adams
Education Sector Adjustment Operation (Credit 3049) Project Task Manager/Leader Division Chief/
Sector Director Country Director
Appraisal Eduardo Velez Bustillo Ruth Kagia James W. Adams Completion Patrick D. Murphy Dzingai Mutumbuka James W. Adams

vii
Preface
This is a Project Performance Assessment Report (PPAR) on two education projects in Uganda:
• The Primary Education and Teacher Development Project (PETDP; Credit No. 2493) for which an International Development Agency (IDA) credit in the amount of US$52.6 million was approved on May 13, 1993, and which became effective on November 10, 1993. The project closed on June 30, 2001, one year behind schedule, having disbursed US$51.6 million of the IDA credit.
• The Education Sector Adjustment Credit (ESAC; Credit No. 3049) for which an IDA credit in the amount of US$80 million and a grant through the Highly Indebted Poor Countries (HIPC) initiative in the amount of US$75 million were approved on March 24, 1998, and which became effective on June 12, 1998. The funds were disbursed in three tranches, the third of which was delayed from its scheduled time of May 2000 to August 2000. The operation closed as scheduled on December 31, 2000.
These operations were selected for assessment because of Uganda’s particular experience in pioneering new approaches, both for achieving universal primary education (UPE) and for management of external aid to the sector, and because the approach taken by the Bank in Uganda has been cited as a potential model for its support to Education For All. The assessment contributes to background work for an ongoing Operations Evaluation Department (OED) study of the Bank’s assistance to basic education.
This report, prepared by OED, draws on the knowledge and insights of those involved in preparing and implementing the projects — in the Bank and in Uganda — as conveyed through written documents and interviews. It is based on the Bank’s project documents and draws on relevant studies carried out by the Bank, the borrower, and other agencies. It draws on interviews with Bank staff and on discussions in Uganda during the PPAR mission in February, 2003, with government officials, education sector professionals, staff of district offices, primary teacher colleges and primary schools, beneficiaries, and representatives of other funding agencies. Their generosity in giving time and sharing information and perspectives is greatly appreciated.
In addition to assessing the projects using OED’s standard ratings methodology, the mission sought to identify potential lessons of wider applicability, from the experience in Uganda, relating to:
• do’s and don’ts in supporting a “big bang” approach to universal primary education in low-income countries;
• pros, cons, or synergies of investment versus adjustment operations in financing education development;
• rapid establishment of a Sector-wide approach (SWAp) for education.
Following standard OED procedure, copies of the draft PPAR were sent to the relevant government officials and agencies for their review and comments. A number of observations were made, which have been incorporated into the PPAR as Annex B.

ix
Summary
The Primary Education and Teacher Development Project (PETDP) was approved in 1993, to support the government’s long-term objectives of access, quality, and relevance in the education sector, by monitoring resource mobilization and allocation in the sector, and by financing specific investments. Through an IDA credit of US$52.6 million and parallel financing by the U.S. Agency for International Development (USAID), it aimed to (i) improve teaching and learning in primary schools by establishing a primary Teacher Development and Management System (TDMS) and by providing textbooks and teachers’ guides to primary schools, and (ii) enhance strategic functions of the Ministry of Education and Sports, including information management, planning and policy analysis, and reform of curriculum and examinations.
Midway through implementation of the PETDP, President Museveni fulfilled an election promise to eliminate primary school fees, in a “big bang” approach to achieving universal primary education (UPE). The result was an almost doubling of enrollments in early 1997, overwhelming schools and threatening collapse of the system unless additional resources could be made available. The Education Sector Adjustment Credit (ESAC) was prepared quickly and approved in 1998, to ensure that resources existed to sustain the growth in enrollment, with improved allocation of public resources, efficient use of resources, availability of quality education inputs, and strengthened sector management. ESAC funds, combining an IDA credit of US$80 million and a HIPC grant of US$75 million, were to be disbursed annually in three tranches. The ESAC and the PETDP were thus implemented concurrently, with overlapping objectives, from mid-1998 until they closed in December 2000 and June 2001, respectively.
The ESAC acted as a catalyst for other funding agencies to channel support to primary education through the budget and helped to establish a framework quickly through which Uganda’s first Sector-wide approach (SWAp) could be developed. The project design underestimated some of the institutional challenges, including management of the teachers’ payroll. Disbursement of the third tranche was delayed from May until August 2000, when the Board waived the condition that all primary teachers active in government-aided primary schools would be on the payroll. The new decentralization framework also presented more difficulties than had been anticipated. ESAC targets for reducing pupil-teacher and pupil-textbook ratios were not met, due largely to the unanticipated continuing growth in enrollments. From the evidence available, the rapid expansion of enrollments led to a deterioration in learning outcomes.
This assessment rates overall outcome of the PETDP as moderately satisfactory. The project had significant achievements, in particular the development of the systems for teacher training and outreach, supply of instructional materials, and decentralized classroom construction; however, it was inefficient in its early years and was much less successful in its objectives to improve strategic central functions. Overall outcome of the ESAC is rated satisfactory. The operation was highly successful in its overall objective of assuring the availability of resources to sustain the growth in enrollments and it contributed to a major improvement in the country’s management of external resources to the sector, but its quality and efficiency objectives were only partially achieved. Institutional development impact of both projects is rated substantial. Together, the two projects
x
substantially strengthened the institutional basis for future sector development, the ESAC through facilitating a fundamental change in the way resources were channeled to and within the sector, and the PETDP through building systems and capacity for implementation. The PETDP failed on some of its ambitious institutional objectives, but its impact in this respect was still substantial. Sustainability of both operations is rated likely. For the PETDP, management of the systems for teacher training, textbook procurement, and school construction has been integrated in the Ministry of Education and Sports; the TDMS in particular has strong national and local ownership. Sustainability of the ESAC is supported by the strength of government commitment, but involves high risks and will depend on a continuing high level of external support to the recurrent budget. Bank and borrower performance are rated satisfactory for both operations.
The experience in Uganda illustrates what can be achieved, given government commitment and national ownership of the reform strategy together with responsiveness on the part of the Bank to government priorities. The Bank’s rapid and bold response in 1997 enabled the government to avert a crisis in the education system and to sustain a more than doubling in primary enrollments, greatly reducing the poverty and gender barriers to primary schooling. Its subsequent support to donor collaboration through a Sector-wide approach (SWAp) enabled the Ministry of Education and Sports to develop and take charge of consultative processes for ongoing policymaking, planning, and budgeting in the sector. The experience also reveals (i) dangers in giving priority to rapid expansion of enrollments when institutional capacity is weak and issues for education quality and efficiency have not been adequately addressed, and (ii) constraints to how far and how rapidly the SWAp/budget-support model can be applied to support education when implementing capacity and fiduciary assurance are major concerns.
Lessons concerning Bank support to expansion of primary education:
• Very rapid expansion of enrollments, even with appropriate increase in funding, is liable to disrupt efforts to improve the efficiency and effectiveness of systems for delivering inputs to schools and for monitoring the quality of learning processes and outputs. Thorough diagnosis is needed of the weaknesses in these systems and of the time needed to rectify them, to determine absorptive capacity. Attention should be given to prioritization and sequencing, to avoid overloading the reform agenda. Attempting in Uganda to more than double enrollments at the same time as decentralizing management to district councils and reforming the curriculum increased the risks for quality and efficiency.
• To protect the quality of education while expanding the capacity of the system, project design should be based on analysis of existing strengths and weaknesses at the school and classroom levels, providing a baseline for monitoring relevant indicators. In Uganda, as elsewhere, it is proving difficult to shift the focus of monitoring and evaluation to classroom processes and learning outcomes once input ratios have been established as the main indicators and targets for education quality.
• “Big bang” expansion of primary enrollments has long-term downstream fiscal implications beyond just the primary subsector. Uganda is confronting the need to increase capital and recurrent funding to post-primary education, now that pupils
xi
in the universal primary education (UPE) bulge are completing the primary cycle. Impacts beyond the education sector are also being felt and questions raised as to whether education is over-funded in relation to other sectors. Growth in the number of teachers has become a major issue for the public service payroll as a whole and is inhibiting pay reform.
Lessons concerning use of adjustment lending through a SWAp for education:
• The combination of budget support and investment lending can be an effective form of Bank support to expansion of primary education in countries with commitment to good policies but weak capacity to implement them. The PETDP and the ESAC were mutually supportive. Rapid expansion of inputs, financed though ESAC, depended on development over time through PETDP of systems for teacher development, textbook procurement, classroom construction, and some capacity to further develop and manage these systems. It has not yet been demonstrated in Uganda that capacity- and institution-building needs in the sector can be sufficiently addressed through budget support alone.
• Given strong ministry leadership, a SWAp can be quickly established, with benefits for the coherence of sector strategy, the quality and national ownership of sector policies, and transparency of sector planning and budget processes, but it presents new issues for aid management. Despite harmonization of many donor requirements in the Ugandan education sector, the demands of the SWAp reporting and consultative processes have overstretched ministry capacity. The focus of dialogue on policies and budgets has tended to sideline implementation issues, and to marginalize nongovernmental organizations – which have become the main source of piloting and innovation in the sector. Monitoring has been focused on regulations and procedures rather than results, while the demand for evaluation comes largely from funding agencies. And the high stakes in maintaining consensus can be a positive incentive to compromise but can also encourage glossing over issues that should be addressed.
• Maintaining donor and public confidence depends on special measures for fiduciary assurance which can be difficult to sustain. Channeling external funds to the sector through budget support adds to the onus on weak accountability systems. In the absence of adequate accounting, monitoring, and reporting systems at the district level, innovative techniques were pioneered in Uganda to improve accountability. These measures had some impact but it is proving difficult to sustain the necessary level of effort. The elimination of school fees had the unintended effect of weakening the role of parent-teacher associations and reducing the interest of parents in monitoring school finance.
Gregory K. Ingram Director-General Operations Evaluation
1
1. Background
POST-CONFLICT RECOVERY
1.1 Since Uganda emerged in 1986 from 15 years of traumatic civil conflict and economic decline, it has been among the top economic performers in Africa and a pioneer in participatory coordination of development assistance. From 1986, under President Museveni’s government, an extensive and consistent economic reform program has led to a remarkable recovery. From an extremely low base, the economy grew by an average of some 6 percent annually and poverty has been substantially reduced. At the same time, Uganda has led the way in adopting new approaches to managing development assistance, focusing on strategies for poverty reduction and broadening stakeholder involvement in aid coordination. A Country Economic Memorandum by the Bank in 1995 supported development of Uganda’s Poverty Eradication Action Plan (PEAP), which anticipated the Poverty Reduction Strategy Paper (PRSP) process; and the Bank’s participatory approach in preparing its 1997 Country Assistance Strategy also helped to lay the foundation for the country’s Comprehensive Development Framework. Uganda was the first country to qualify for and receive debt relief under the Highly Indebted Poor Countries (HIPC) initiative. Starting in the late 1990s, Sector-wide approaches (SWAps) have been developed, first in education and subsequently in other sectors, bringing together government, funding agencies, and other stakeholders in dialogue on sector policies, and coordinating external assistance within agreed sector plans.
1.2 Still, significant problems have persisted. Poverty disparities between regions have widened and rural development has been relatively neglected. Social indicators are still poor: female adult literacy was below 60 percent in 2000, and only 34 percent in the northern region; infant mortality was above 8 percent, and more than one in four children malnourished. Governance remains weak and capacity building outside core government has lagged. Corruption is a serious constraint. Decentralization, embarked on in 1993, produced new problems as well as benefits and the framework is still not fully viable. Stability of the country has continued to be threatened by hostilities in the north and involvement in neighboring conflicts. 1
PRIMARY EDUCATION
1.3 Uganda was one of the first countries to borrow from the Bank for education — in 1967. At that time, primary education coverage was low but standards were relatively high for the region. By 1986, after 15 years of government mismanagement and civil war, infrastructure had been depleted, administrative and management systems were inoperative, and schools functioned only through the efforts of parents and communities. The majority of teachers were untrained, instructional materials scarce, and absenteeism high. Still, new schools were established by communities and, by 1985, gross primary
1. OED Country Assistance Evaluation, “Uganda: Policy, Participation, People,” The World Bank, 2001.
2
enrollment was estimated at 73 percent.2 At this stage, IDA’s Third Education Project was funding some restoration of infrastructure and development of institutional capacity.
1.4 In 1987, the new government set up an Education Policy Review Commission to draw up recommendations for the sector. The subsequent report called for universal access to primary education (UPE), with measures to improve the quality and relevance of primary schooling. Based on the commission’s recommendations, a 1992 White Paper defined the government’s policies for the sector, including phasing in UPE by 2003 through progressive reduction in tuition fees, upgrading teacher qualifications, improving the supply of instructional materials, and reforming the curriculum. The Primary Education and Teacher Development Project (PETDP) was approved in 1993 specifically to support implementation of these policies. It overlapped with the end of two earlier projects supporting the sector: the Fourth Education Project, which funded rehabilitation, textbooks, and ministry capacity building, and was rated marginally satisfactory on completion; and the Program for Alleviation of Poverty and Social Costs of Adjustment (PAPSCA), which included a largely unsuccessful component for renovation of primary schools.
1.5 Despite the stated policy for UPE, little attention was given during the early 1990s to a strategy for increasing access to primary schooling, and official statistics recorded little change in enrollments. Parents were still funding on average at least 70 percent of the costs, including teachers’ salaries, through tuition fees and parent-teacher association (PTA) levies.3 When President Museveni made a pre-election commitment in 1996 that all primary school fees would be eliminated for up to four children in each family as of the new school year, this resonated with the electorate and resulted in an almost-doubling of enrollments in 1997. Schools were overwhelmed, the teachers’ payroll system collapsed, and the government appealed to the Bank to help avert crisis. The government’s priority for IDA borrowing shifted from infrastructure to education. The Education Sector Adjustment Credit (ESAC), combined with a HIPC grant, was approved in 1998, to help meet the gap in recurrent funding for UPE. The PETDP and the ESAC ran concurrently until 2001. Since then, the Bank has continued budget support to the sector through a series of Poverty Reduction Support Credits, the first of which was approved in 2001.
1.6 Following the approval of the ESAC, and production by the Ministry of Education and Sports (MOES) of its Education Sector Investment Plan (ESIP) also in 1998, some donors already active in the sector shifted their assistance to budget support for UPE, and others added support through budgetary channels. The ESIP provided the framework for Uganda’s first SWAp, managed by the MOES through twice-yearly joint government/donor sector reviews and sector working groups, for ongoing policy development and coordination of external funding. The participation of other stakeholders – including district officials, members of parliament, NGOs, and academics – has been increasingly significant.
2. Official MOES statistics.
3. Reinikka, 2001
3
PROJECT OBJECTIVES AND COMPONENTS
Primary Education and Teacher Development Project
1.7 The objectives of the PETDP at appraisal were to support the government’s long-term objectives of access, quality, and relevance in the education sector by monitoring resource mobilization and allocation in the sector, and by financing specific investments in primary education and primary teacher training (taking into account activities to be financed by the U.S. Agency for International Development, USAID), and in strengthening strategic functions of the MOES.
1.8 These objectives, while clearly consistent with national and sector priorities, were stated vaguely, in terms of processes rather than specific outcomes and ultimate objectives. More specific objectives are implied in the project components:
• Improving Primary School Teaching and Management (US$38.2 million). The aim of the first component, in conjunction with USAID, was to improve teaching and learning in primary schools through (a) development of a Teacher Development and Management System (TDMS), consisting of a network of Primary Teachers’ Colleges (PTCs), coordinating centers, and outreach schools, to provide pre- and in-service training; Bank funds would meet the costs of constructing and rehabilitating PTCs and school classrooms, while USAID would fund curriculum development, staffing, and training; and (b) improved provision of instructional materials, through provision of textbooks and supplementary reading materials and revitalization of private sector publishing.
• Enhancing Strategic Ministry Functions (US$14.4 million). This component aimed to strengthen capacity in (a) information management, planning, and policy analysis in the Education Planning Unit of the MOES; (b) management and information systems at the local level; (c) curriculum reform, through the National Curriculum Development Centre; and (d) examination reform through the Uganda National Examinations Board (UNEB).
Education Sector Adjustment Credit
1.9 The broad objective of the Education Sector Adjustment Credit (ESAC) was to ensure adequate resources to sustain enrollment growth and achieve universal primary education with improved allocation of public resources, efficient use of resources, availability of quality education inputs, and strengthened sector management. Prepared quickly as an adjustment operation, ESAC combined an IDA grant of US$75 million in the context of HIPC, and an IDA credit of $80 million, to be disbursed annually in three tranches against an agreed action program.
1.10 The specific objectives of ESAC, as defined in the agreed policy measures were:
4
• Clarify UPE policy, the targeted outcome being wide understanding of respective roles by parents, schools, communities, districts, central government and the donor community.
• Increase resources available to UPE, the target being 19.5 percent of total recurrent government expenditures allocated to primary education in FY1998/99 and 17.5 percent in 1999/2000, while sustaining parents’ understanding of their role in supporting primary education.
• Increase efficiency in the use of resources, through the introduction of double shifts in schools and piloting and piloting/demonstration of multi-grade teaching, to achieve a target pupil-teacher ratio of 1:55; prevention of excess supply of teachers, through an action plan based on study of supply and demand; and effective and sustainable classroom construction through innovative financing methods involving government, communities, parents, and donors.
• Protecting quality of teaching and learning through provision of instructional materials, the targeted pupil-textbook ratio being 1:3, and reducing the percentage of untrained teachers to below pre-UPE4 levels by extending the TDMS to cover all districts.
• Strengthening sector management, though improved inter-ministerial coordination in managing the teachers’ payroll, eliminating “ghost” teachers and having all active teachers on the payroll with timely payment of salaries, and reducing the hiring of untrained teachers; implementation of a monitoring system for accountability of public funds allocated to districts and schools to achieve transparency in use of resources; completion of school mapping and putting in place an Education Management Information System (EMIS).
2. Implementation
PETDP
2.1 Progress was slow before 1997, due in large part to weak project management. Performance was rated unsatisfactory in the Project Status Report at that stage, with problems centered on procurement and construction activities. The method used initially for classroom construction was based on central procurement of materials for the basic structure, then depending on communities to finish the building. Neither aspect worked well. Poorly managed central procurement led to delays and allegations of misprocurement. Materials were damaged and wasted due to lack of storage facilities. And the capacity of communities was insufficient to meet their contribution. The procedures evolved gradually to overcome these problems, first shifting to 100 percent funding of school construction by the project, and using more locally-based builders, then decentralizing procurement through the PTC principals, and finally to districts and school management committees. Some PETDP activities, including capacity building of the MOES planning unit and staffing of PTCs, came into conflict with policies, supported by 4. The terms “pre-UPE” and “post-UPE” are commonly used in Uganda to refer to the point at which the new UPE policy was introduced, i.e., the beginning of 1997, when enrollments almost doubled. Uganda has not yet achieved universal primary education — some 10 to 15 percent of children are still out of school.
5
the Bank, to freeze public sector hiring. Long-term technical assistance in the MOES was found to be ineffective in transferring skills because work pressure on MOES staff was such that consultants were used to help do the work rather than train counterparts. Development of the TDMS went relatively smoothly, aside from early delays in construction, in good coordination with USAID, which supported the “software” aspects.
2.2 The UPE challenge and ESAC preparation in 1997 changed the whole picture for the PETDP, as the education sector suddenly became a top priority for the government and the Bank. The Bank team considered closing PETDP early and folding it into the ESAC, but the decision was made to maintain it alongside the adjustment operation. The project was not formally restructured but, with the expansion of budget support to UPE in 1998–2000, many of the PETDP activities and outputs that had been project-specific were supported on a much larger scale by the national budget. In effect, the PETDP provided the implementing framework and procurement arm for expansion of these activities through ESAC and other funding, which in turn spurred efforts to pick up performance under the PETDP. New leadership was installed in the Project Implementation Unit (PIU) and performance was greatly improved for the remaining three years of project implementation. With hindsight, Bank and government staff consider that the decision to continue implementing the PETDP alongside the ESAC was the right one.
2.3 After a one-year extension, the project had met most of its targets under the first component. A nationwide teacher education system was established with physical and management infrastructure and trained staff. Additional funding from 1998, from the national budget and other donors, enabled the PETDP’s construction unit to almost double the number of PTCs (18 in total) and coordinating centers (539) that were provided, and to oversee the construction of some 25,000 additional primary classrooms from 1997 to 2000. The project itself funded 2,782 new classrooms. Training carried out through the TDMS, for headteachers, untrained teachers, trained teachers and outreach staff, was substantial, although below targets in some cases. The PETDP’s Instructional Materials Unit (IMU) procured and distributed more than 6 million textbooks funded by the national budget and other sources. The targeted pupil-textbook ratio was not met (estimates range from 7:1 to 10:1 for 2000), due mainly to the sudden UPE expansion of enrollments and delays from the curriculum reform process, but the project was highly successful in introducing a viable and competitive education materials market, leading subsequently to huge reductions in unit costs.
2.4 The PETDP was less successful in implementation of its second component to enhance strategic functions of the MOES, although the ESAC helped to stimulate progress during the last two years in building the capacity of the Education Planning Unit: staff were recruited, training and technical assistance were provided through PETDP, and the status of the unit was advanced to that of a department of the ministry. The EMIS was still not fully operational when the PETDP closed. Plans for improving the capacity, facilities, and equipment of UNEB were not fully implemented, and introduction of its National Assessment of Progress in Education did not meet full expectations. Reforms of curriculum and examinations were long delayed and the results less than fully satisfactory.

6
2.5 By the time the project closed in mid-2001, very substantial capacity had been built in the PIU. Although no plans for this had been anticipated in project design, key functions and experienced technical staff of the PIU have in fact been integrated in the MOES. With the support of USAID conditionalities, the TDMS staff and management have been fully integrated in the MOES and relevant university departments, and recurrent costs of the program are incorporated in the budget. The IMU has also been integrated, although the salaries of some key staff have been externally funded, as for the construction unit. With the help of externally funded periodic technical assistance, good progress has been sustained on textbook development and procurement (aside from delays for introduction of the new curriculum, beyond the control of the IMU), and the procurement process has weathered major challenges from vested interests in publishing. Progress on construction has slowed somewhat since the project closed. Staff say that supervision of the program has been affected by bureaucratic constraints, that quality control has suffered, and it has proved difficult to hold district authorities accountable for violations in the tendering process or misuse of funds.5
ESAC
2.6 The disbursement plan called for tranches to be released annually in fiscal years 97/98, 98/99, and 99/00. The first two tranches were released with only slight delay, while the third was not released until August 2000, three months behind schedule, and required the Board to waive one of the nine release conditions — that all primary teachers active in government-aided primary schools should be on the payroll.
2.7 Implementation was constrained by three factors in particular that had been underestimated in preparation:
• The continuing growth in primary enrollments, which exceeded projections by some 20 percent.
• Weaknesses in the system for managing the teachers’ payroll: the problems in payroll management — arrears in teachers’ salaries, and cumbersome teacher recruitment procedures involving four ministries — had not been resolved or even fully appreciated and had to be addressed at the same time as massively expanding recruitment.
• Management and fiduciary challenges presented by decentralization. Uganda was in the process of decentralizing responsibility for delivery of basic services, including primary and secondary schools, to district governments.
2.8 New funding mechanisms were introduced to channel central funding to primary schools: earmarked capitation grants, known as UPE grants, transferred to the districts according to the reported number of pupils, to be transferred directly on to each school for non-wage expenditures, to be managed by School Management Committees according to
5 See Annex B: in the Borrower’s comments on this report (January, 2004), it is noted that the IMU and CMSU have now been integrated into the Ministry mainstream and all key posts advertised. In addition, Engineering Assistants have been recruited in all the districts, significantly helping to improve the quality of construction. Substantial funding is available to the Unit for monitoring of classroom construction. Sanctions are now being ratified to ensure that district officers can be held accountable.
7
strict central guidelines; conditional School Facilities Grants, for the construction of classrooms, the allocation between schools to be determined by the district authorities; and teachers’ salaries, to be transferred on from districts to schools according to the number of teachers on the payroll. Local governments were given little leeway themselves to reallocate resources according to local priorities (beyond what they raised locally), because of their lack of experience and capacity at this stage. But at the same time, the new legal status of local governments, as defined in the 1997 Local Government Act, limited the role of the MOES in ensuring local compliance with accounting, reporting, and other procedures.
2.9 Resulting performance in each of the policy areas was variable:
• Community support for and understanding of the UPE policy was improved, through a strong campaign of public information dissemination, although with limited effect in more remote communities.
• The operation was highly successful in increasing the level of resources for UPE, through the IDA credit, the HIPC grant, the increased share of government resources (exceeding targets), and as a catalyst and framework for support from other funding agencies. Parents’ participation was confined to voluntary contributions, which were significant only in relatively wealthy communities, and the obligation to provide lunch for their children: the government was opposed to any obligatory parental contributions that might deter the poorest from enrolling.
• Proposed efficiencies in the deployment of teachers were not achieved: the proposed policies of double-shifting and multi-grade teaching were not implemented at the time, and teacher deployment remained highly inequitable between locations. More efficient, decentralized methods for classroom construction were successfully introduced, based on methods proposed in a technical paper commissioned for ESAC preparation and implemented through the PETDP’s construction unit.
• Declines in education quality, as measured by input ratios, were stemmed, but the continuing expansion of enrollments and other unanticipated constraints prevented the relatively modest targets from being reached.
• Measures to strengthen sector management were partly successful. Payroll management was substantially improved, measures succeeded in removing many, though not all, “ghost” teachers from the payroll, and salaries were paid on time. Getting all active teachers on the payroll proved more difficult: in May 2000, some 14 percent of primary teaching staff were still not on the payroll. Strong measures were taken to improve transparency and accountability of funds released to districts and schools, but progress in improving reliability and management of data at central and district levels remained weak, and the EMIS was not made operational.
3. Contribution to Sector Outcomes
3.1 The PETDP and the ESAC overlapped with each other, in objectives as well as timing, and with the programs and activities of many agencies. In looking at the
8
outcomes, the approach taken here is to assess the strengths and weaknesses of developments in the sector as a whole over the relevant time period and to identify where possible the contributions of each of the Bank-funded operations.
PRIMARY ENROLLMENTS
3.2 The huge jump in primary enrollments that occurred in 1997 was independent of both Bank-funded operations. UPE was not phased in gradually, as proposed in the 1992 government white paper. Instead, political pressures were a key factor behind the “big bang” approach taken by the President at the beginning of 1997, reportedly without prior consultation with the Ministry of Education and Sports, much less preparation or planning. The Bank operations were oriented to meet the needs of and help sustain the expansion of enrollments once this had occurred. The PETDP, in its design, did not directly address the strategy or timetable for increasing enrollments; with hindsight, it missed the opportunity to contribute to planning of phased expansion, which might have pre-empted the drastic measures taken in 1997. At the same time, without the delivery systems that were developed through PETDP, it is doubtful that UPE could have been considered, and even more doubtful that the jump in enrollments could have been sustained. Systems developed under PETDP for training teachers, building classrooms and delivering instructional materials provided the basis for efforts to expand the provision of inputs to meet the new needs, while the ESAC provided essential funding and supported the policy framework.
3.3 When ESAC was prepared, projections were based on the assumption that a share of the new enrollments, and especially of the overage pupils, would drop out of school and that total enrollments would level off. In fact, primary enrollments were not only sustained but continued to grow. MOES official statistics on enrollments, and especially on enrollment rates, are not reliable and may somewhat overstate the level from 1997.6 The trend shown is of very slow growth over the early 1990s to just over 3 million in 1996, jumping to 5.3 million with UPE in 1997, and continuing to climb annually to 7.3 million in 2002 (including some 700,000 pupils in private schools).
3.4 Household surveys indicate lower enrollment than MOES statistics but endorse the broad trend. From household surveys carried out during the 1990s, net enrollment rates range from 62 percent to 68 percent before UPE, and from 82 percent to 89 percent since 1997, despite high population growth. Data from the 1992 Integrated Household Survey and 1999/2000 Uganda National Household Survey point to a dramatic impact in reducing the gender and poverty barriers to primary school access (Figure 1). These surveys also reveal the diminished importance of costs in the reasons cited for dropping out or never attending — from 71 percent in 1992 to 37 percent in 1999. But a recent study suggests that gender and poverty level still heavily influence attendance and drop 6. Net enrollment rates of well above 100 percent from official statistics make clear that enrollments have been overstated and/or population underestimated. Schools have had an incentive to inflate enrollment figures since the capitation grants (known as UPE grants) were introduced, while in the early 1990s, when tuition fees were more significant, the balance of incentives may have been in the reverse direction. A further factor could be improvement over time in the coverage of schools in Ministry statistics. Another indication that official statistics understate the growth in enrollments in the first half of the 1990s — when public funding to primary schools was already increasing — comes from a 1996 school survey that found a 60 percent growth in enrollments in the sample schools from 1991 to 1995.
9
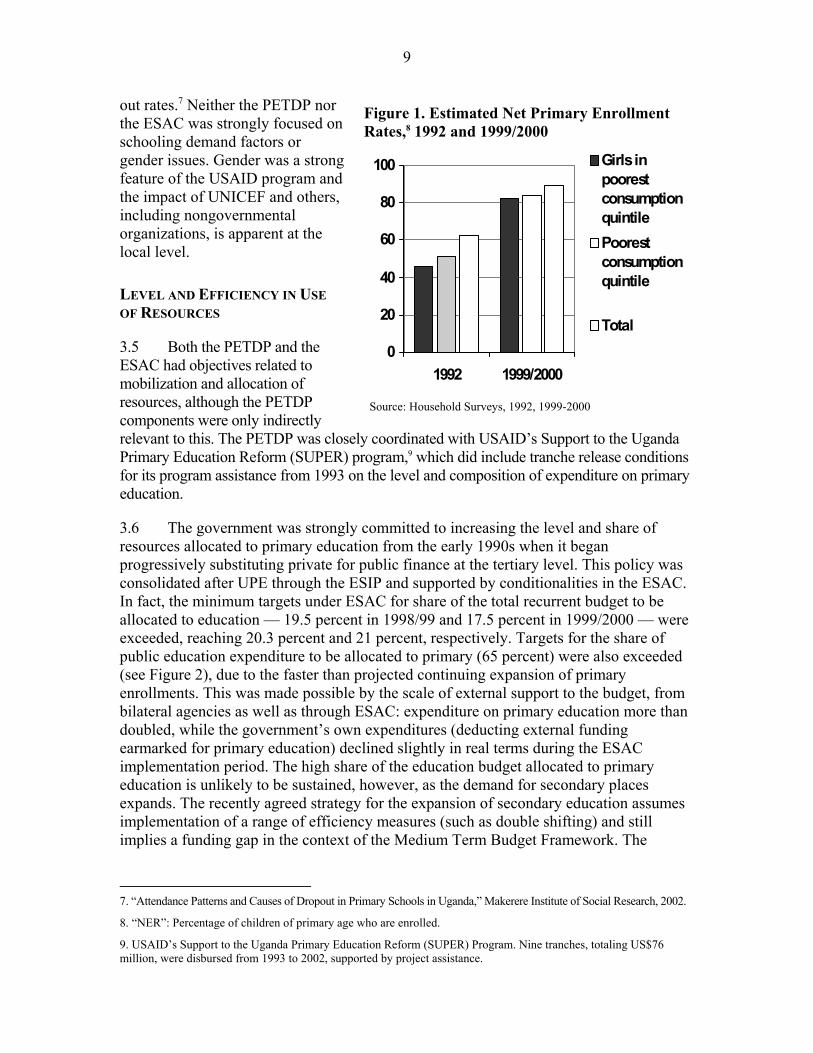
out rates.7 Neither the PETDP nor the ESAC was strongly focused on schooling demand factors or gender issues. Gender was a strong feature of the USAID program and the impact of UNICEF and others, including nongovernmental organizations, is apparent at the local level.
Figure 1. Estimated Net Primary Enrollment Rates,8 1992 and 1999/2000
LEVEL AND EFFICIENCY IN USE OF RESOURCES
3.5 Both the PETDP and the ESAC had objectives related to mobilization and allocation of resources, although the PETDP components were only indirectly relevant to this. The PETDP was closely coordinated with USAID’s Support to the Uganda Primary Education Reform (SUPER) program,9 which did include tranche release conditions for its program assistance from 1993 on the level and composition of expenditure on primary education.
0
20
40
60
80
1992 1999/2000
poorestconsumptionquintile
Total
Poorestconsumptionquintile
100 Girls in
Source: Household Surveys, 1992, 1999-2000
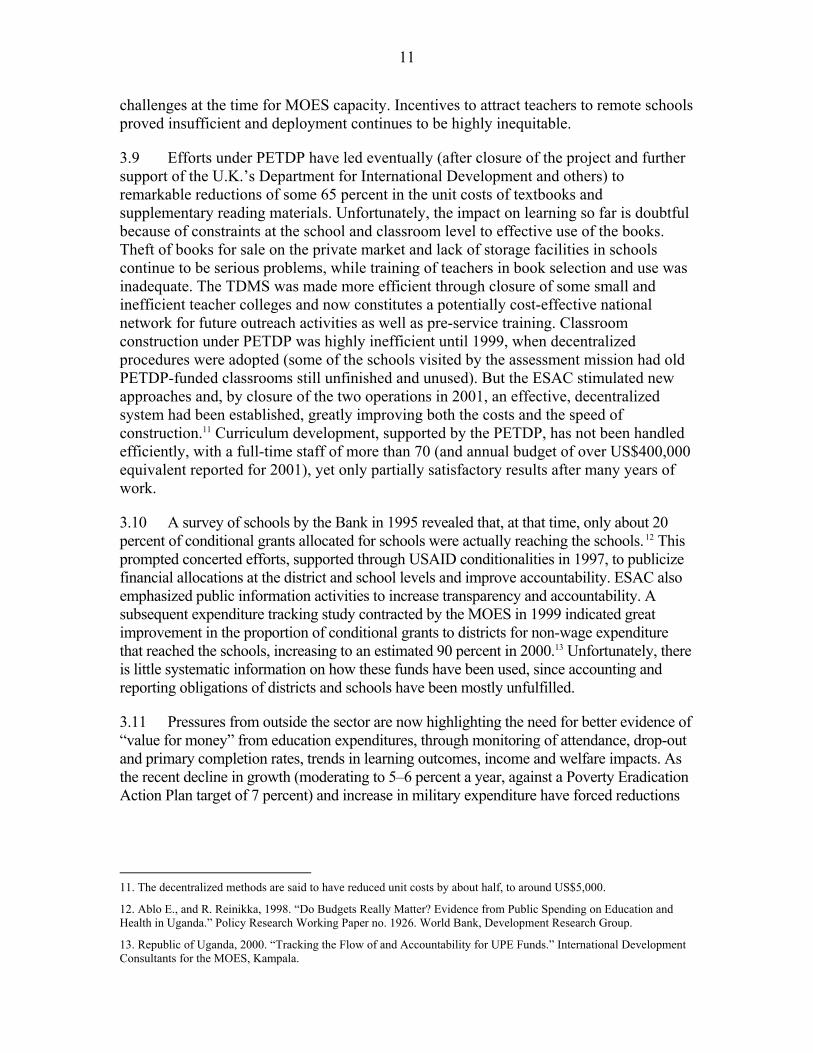
3.6 The government was strongly committed to increasing the level and share of resources allocated to primary education from the early 1990s when it began progressively substituting private for public finance at the tertiary level. This policy was consolidated after UPE through the ESIP and supported by conditionalities in the ESAC. In fact, the minimum targets under ESAC for share of the total recurrent budget to be allocated to education — 19.5 percent in 1998/99 and 17.5 percent in 1999/2000 — were exceeded, reaching 20.3 percent and 21 percent, respectively. Targets for the share of public education expenditure to be allocated to primary (65 percent) were also exceeded (see Figure 2), due to the faster than projected continuing expansion of primary enrollments. This was made possible by the scale of external support to the budget, from bilateral agencies as well as through ESAC: expenditure on primary education more than doubled, while the government’s own expenditures (deducting external funding earmarked for primary education) declined slightly in real terms during the ESAC implementation period. The high share of the education budget allocated to primary education is unlikely to be sustained, however, as the demand for secondary places expands. The recently agreed strategy for the expansion of secondary education assumes implementation of a range of efficiency measures (such as double shifting) and still implies a funding gap in the context of the Medium Term Budget Framework. The
7. “Attendance Patterns and Causes of Dropout in Primary Schools in Uganda,” Makerere Institute of Social Research, 2002.
8. “NER”: Percentage of children of primary age who are enrolled.
9. USAID’s Support to the Uganda Primary Education Reform (SUPER) Program. Nine tranches, totaling US$76 million, were disbursed from 1993 to 2002, supported by project assistance.

10
education sector has been dependent on external support for well over half its annual budget and there is no early prospect of this declining.
Figure 2. Budget Allocations to Education, 1995-2003
0
10
20
30
40
50
60
70
80
95/96 96/97 97/98 98/99 99/00 00/01 01/02 02/03* 03/04*
Education's share of total budget
Primary's share of education recurrent budget
*projected
Source: Uganda, Public Expenditure Review, World Bank 2002
3.7 The efficiency of expenditure on primary education is difficult to assess in the absence of reliable data on outcomes, but internal efficiency does not appear to be high. Public expenditure per pupil has grown faster (by a multiple of about four in U.S. dollar terms in the decade from 1992) than improvement in per-pupil provision of trained teachers, classrooms, and books, and it is doubtful that the expenditure has produced an acceptable level of school quality, as discussed below. Data are unreliable but reports suggest high drop-out and low rates of primary completion. A policy of automatic promotion between grades was designed to improve efficiency but could be expected to have contributed to drop-out and a fall in standards, in so far as it has been enforced. The composition of expenditure on primary education was a focus of USAID conditionalities and is relatively strong, in that allocations for non-wage items, including instructional materials, have been protected, while teachers’ pay has been increased to viable levels.
3.8 Measures proposed under ESAC for more efficient employment of teachers and avoidance of over-supply were intended also to ensure fiscal sustainability but were not successfully implemented. Payroll management was substantially improved but the double-shifting in primary schools — official policy from 1992 and agreed under ESAC — has not been implemented, or even vigorously promoted. The lack of pay incentives permitted by the Ministry of Public Service for double-shift work made the policy unattractive to teachers, and the proposal met with some political resistance. Plans to introduce multi-grade teaching in small, remote schools were also abandoned, or at least postponed.10 These measures proved too demanding to introduce, given all the other
10 See Annex B: in the Borrower’s comments on this report (January, 2004), it is noted that both double-shifting and multi-grade teaching are now being piloted in some districts.
11
challenges at the time for MOES capacity. Incentives to attract teachers to remote schools proved insufficient and deployment continues to be highly inequitable.
3.9 Efforts under PETDP have led eventually (after closure of the project and further support of the U.K.’s Department for International Development and others) to remarkable reductions of some 65 percent in the unit costs of textbooks and supplementary reading materials. Unfortunately, the impact on learning so far is doubtful because of constraints at the school and classroom level to effective use of the books. Theft of books for sale on the private market and lack of storage facilities in schools continue to be serious problems, while training of teachers in book selection and use was inadequate. The TDMS was made more efficient through closure of some small and inefficient teacher colleges and now constitutes a potentially cost-effective national network for future outreach activities as well as pre-service training. Classroom construction under PETDP was highly inefficient until 1999, when decentralized procedures were adopted (some of the schools visited by the assessment mission had old PETDP-funded classrooms still unfinished and unused). But the ESAC stimulated new approaches and, by closure of the two operations in 2001, an effective, decentralized system had been established, greatly improving both the costs and the speed of construction.11 Curriculum development, supported by the PETDP, has not been handled efficiently, with a full-time staff of more than 70 (and annual budget of over US$400,000 equivalent reported for 2001), yet only partially satisfactory results after many years of work.
3.10 A survey of schools by the Bank in 1995 revealed that, at that time, only about 20 percent of conditional grants allocated for schools were actually reaching the schools. 12 This prompted concerted efforts, supported through USAID conditionalities in 1997, to publicize financial allocations at the district and school levels and improve accountability. ESAC also emphasized public information activities to increase transparency and accountability. A subsequent expenditure tracking study contracted by the MOES in 1999 indicated great improvement in the proportion of conditional grants to districts for non-wage expenditure that reached the schools, increasing to an estimated 90 percent in 2000.13 Unfortunately, there is little systematic information on how these funds have been used, since accounting and reporting obligations of districts and schools have been mostly unfulfilled.
3.11 Pressures from outside the sector are now highlighting the need for better evidence of “value for money” from education expenditures, through monitoring of attendance, drop-out and primary completion rates, trends in learning outcomes, income and welfare impacts. As the recent decline in growth (moderating to 5–6 percent a year, against a Poverty Eradication Action Plan target of 7 percent) and increase in military expenditure have forced reductions
11. The decentralized methods are said to have reduced unit costs by about half, to around US$5,000.
12. Ablo E., and R. Reinikka, 1998. “Do Budgets Really Matter? Evidence from Public Spending on Education and Health in Uganda.” Policy Research Working Paper no. 1926. World Bank, Development Research Group.
13. Republic of Uganda, 2000. “Tracking the Flow of and Accountability for UPE Funds.” International Development Consultants for the MOES, Kampala.
12
in other sectors, the justification for protecting education expenditures14 is being challenged by some macro-economists and by the sectors hardest hit.
QUALITY OF TEACHING AND LEARNING
3.12 Although trends in learning outcomes have not been well monitored in Uganda, there are enough indications to make clear that they have deteriorated since 1996. Indeed, it would be surprising if they had not. Even if school inputs had kept perfect pace with the huge expansion in enrollments, a decline in average learning outcomes would be expected, when the majority of the additional pupils are from poorer households, less likely to have educated parents, good health and nutrition, or regular attendance. Some “peer effect” might also be expected on the achievements of those who would have been in school without the change in policy. These factors appear not to have been well planned for and neither of the Bank-funded projects focused much on particular measures for disadvantaged pupils or districts.
3.13 The National Assessment of Progress in Education (NAPE), carried out by UNEB in 1996 and 1999 for English and Mathematics among Grades 3 and 6 pupils, found very poor performance results in 1999, especially in rural schools in the poorer districts. Although comparability was limited by some differences in methodology, these assessments indicated a decline after UPE, especially in English. For example, the share of Grade 3 pupils meeting the minimum standard declined in English from 92 percent to 56 percent (and to only 18 percent in reading/writing) and in math from 48 percent to 31 percent. A follow-up assessment due to have been carried out in 2001 was postponed, and there is no other source of information to indicate whether recent efforts and relative stabilization of enrollments have helped to restore standards.15 There have been further indications that many pupils, especially in rural areas, may be gaining little from their time in school. An assessment in 199916 found that 36 percent of Grade 4 pupils in the sample schools failed to reach minimum levels of mastery in English, and 58 percent in mathematics. Gender differences were small but performance in rural schools was notably poorer than in urban ones, especially in Life Skills. A more recent study17 looking at competencies in Grade 2 found that minimum or better levels of mastery were achieved overall by only 20 percent of pupils in literacy and 22 percent in numeracy, with sharp differences in these rates between schools and districts.
3.14 Deficiencies in quality did not prevent total enrollments from continuing to increase, but repetition, drop-out, and primary completion rates have not been documented well enough to be useful indicators. A new study on repetition and drop out in a small
14. Core poverty-related expenditures, including education and health expenditures, are protected in the budget through the Poverty Action Fund. As a result, when revenues are below target, the impact falls disproportionately on unprotected sectors.
15. The Primary Leaving Exam is norm-based and hence not useful in indicating year-on-year changes.
16. Monitoring Learning Achievement (MLA) project in 1999, funded by UNESCO/UNICEF.
17. R. B. Hicks. Report on the outcome of the baseline study for non-textbook materials in primary classes one and two, 2002.

13
sample of schools points to extreme inaccuracy of the ministry’s EMIS data.18 It finds unacceptably high absenteeism and drop out, with the quality of teaching and of school facilities cited by pupils and parents as two of the many factors.
3.15 “Quality enhancement” targets under ESAC were confined to increasing the quantity of key inputs — teachers, classrooms, and textbooks — per pupil enrolled. By this measure, progress was strong but fell short of targets, primarily because of the unanticipated continuing growth of enrollments. (If actual pupil numbers were lower than reported, the real ratios may have been somewhat better than estimated.) Efforts to reduce the pupil-teacher ratio were hampered by unexpectedly cumbersome recruitment procedures and failure to implement the double-shift policy, as well as the continuing growth in enrollments. Still, almost 28,000 teachers were added to the payroll from 1997 to 2000 — an increase of some 28 percent — producing an average of 65 pupils per teacher by 2000 (Table 1). The PETDP’s Instructional Materials Unit managed the procurement of over 6 million textbooks altogether, but the estimated pupil-book ratio was still at least 7:1 in 2000. The construction program, managed by PETDP and supported through ESAC and other funding, completed 8,000 classrooms in FY99-00 alone, but there were still, on average, some 100 pupils per classroom in 2001. It is important to note that the averages obscure big differences between districts: for example, in 2000, the pupil-teacher ratio in Arua was 90:1, while pupils averaged 209 per classroom in Bundibugyo.
Table 1. Average Number of Pupils Per Teacher, Classroom, and Textbook
Pre-UPE* 1997* 2000 target 2000 actual 2001 Pupils per teacher 40 72 55 65 58 Pupils per classroom 85 184 -- 106 98 Pupils per textbook 3 9 3 7 n/a Source: MOES * These estimates are not fully comparable with later years, which count only teachers who are on the payroll and define classroom more strictly.
3.16 Activities of the PETDP might have had more impact on education quality if they had been better coordinated and better grounded in information from the classroom level. The full expectations of the project for the UNEB’s NAPE have not been realized. It was conceived as a central pillar in efforts to focus on and improve performance, with extensive information dissemination and feedback to teachers, but in fact it has had a low profile and seems to have stimulated little interest. Examination reform was intended to introduce continuous assessment and testing of higher-order thinking skills but coordination with curriculum reform proved difficult, and these measures are still not fully integrated. The large size of classes from 1997 would in any case have made this difficult. PETDP included plans for extensive training and technical assistance for UNEB, as well as upgrading facilities and equipment, but these plans were delayed and only partially implemented.
18. Makerere Institute of Social Research, “Attendance Patterns and Causes of Dropout in Primary Schools in Uganda,” 2002.
14
Box 1. Constraints at the School Level
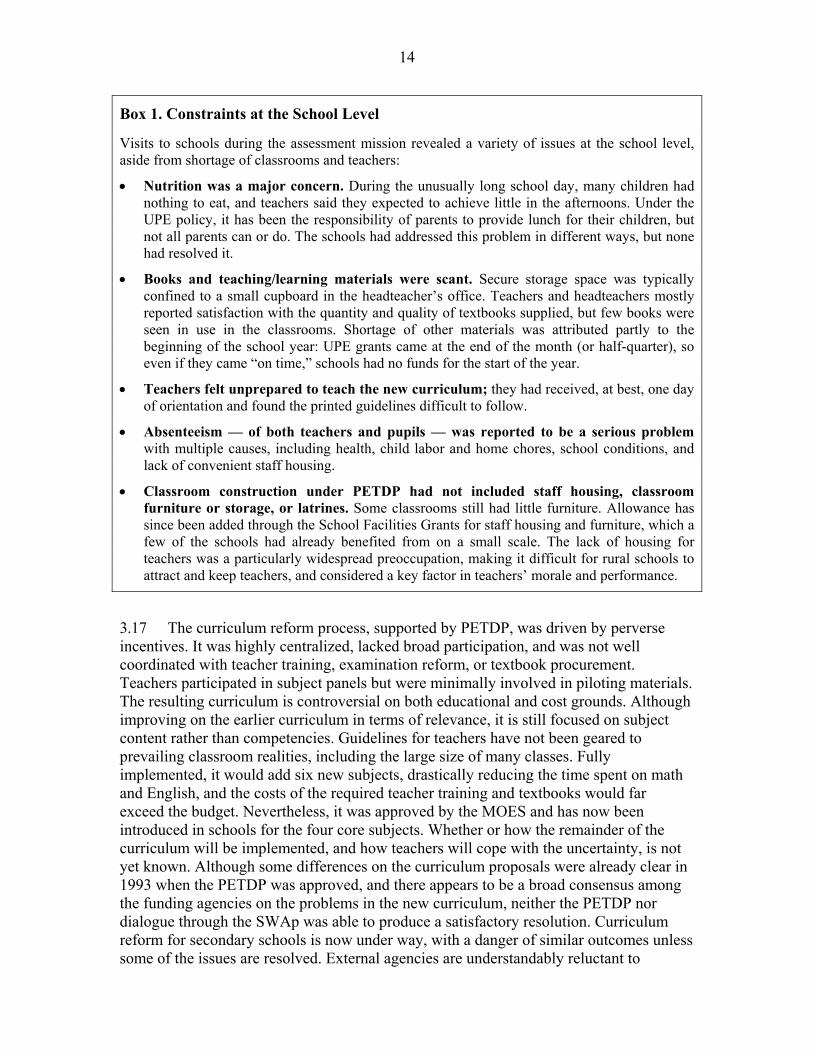
Visits to schools during the assessment mission revealed a variety of issues at the school level, aside from shortage of classrooms and teachers:
• Nutrition was a major concern. During the unusually long school day, many children had nothing to eat, and teachers said they expected to achieve little in the afternoons. Under the UPE policy, it has been the responsibility of parents to provide lunch for their children, but not all parents can or do. The schools had addressed this problem in different ways, but none had resolved it.
• Books and teaching/learning materials were scant. Secure storage space was typically confined to a small cupboard in the headteacher’s office. Teachers and headteachers mostly reported satisfaction with the quantity and quality of textbooks supplied, but few books were seen in use in the classrooms. Shortage of other materials was attributed partly to the beginning of the school year: UPE grants came at the end of the month (or half-quarter), so even if they came “on time,” schools had no funds for the start of the year.
• Teachers felt unprepared to teach the new curriculum; they had received, at best, one day of orientation and found the printed guidelines difficult to follow.
• Absenteeism — of both teachers and pupils — was reported to be a serious problem with multiple causes, including health, child labor and home chores, school conditions, and lack of convenient staff housing.
• Classroom construction under PETDP had not included staff housing, classroom furniture or storage, or latrines. Some classrooms still had little furniture. Allowance has since been added through the School Facilities Grants for staff housing and furniture, which a few of the schools had already benefited from on a small scale. The lack of housing for teachers was a particularly widespread preoccupation, making it difficult for rural schools to attract and keep teachers, and considered a key factor in teachers’ morale and performance.
3.17 The curriculum reform process, supported by PETDP, was driven by perverse incentives. It was highly centralized, lacked broad participation, and was not well coordinated with teacher training, examination reform, or textbook procurement. Teachers participated in subject panels but were minimally involved in piloting materials. The resulting curriculum is controversial on both educational and cost grounds. Although improving on the earlier curriculum in terms of relevance, it is still focused on subject content rather than competencies. Guidelines for teachers have not been geared to prevailing classroom realities, including the large size of many classes. Fully implemented, it would add six new subjects, drastically reducing the time spent on math and English, and the costs of the required teacher training and textbooks would far exceed the budget. Nevertheless, it was approved by the MOES and has now been introduced in schools for the four core subjects. Whether or how the remainder of the curriculum will be implemented, and how teachers will cope with the uncertainty, is not yet known. Although some differences on the curriculum proposals were already clear in 1993 when the PETDP was approved, and there appears to be a broad consensus among the funding agencies on the problems in the new curriculum, neither the PETDP nor dialogue through the SWAp was able to produce a satisfactory resolution. Curriculum reform for secondary schools is now under way, with a danger of similar outcomes unless some of the issues are resolved. External agencies are understandably reluctant to
15
interfere in the sovereign area of curriculum content, but their influence was needed in establishing cost parameters, avoiding conflicts of interest, and ensuring that processes included the necessary consultation, participation, coordination, and piloting.
3.18 The TDMS has been much more successful, although unfortunately no formal assessment is available of changes in classroom practices or the impact of the teacher training under PETDP. The network was established nationwide, with physical infrastructure and trained staff and has produced a 50 percent increase in the number of trained teachers. The proportion of certified teachers in the total grew from an estimated 73 percent in 1995 to 83 percent in 2000.19 On the negative side, drop outs were quite high from pre- and in-service programs, and the pass rate of PTC students was only around 60 percent in the certifying examination. With the increase in demand, PTCs have been operating at twice their design capacity but with less than half their agreed staff establishment. Rapid nationwide expansion of the system has meant that coordinating center tutors are stretched to cover a wider catchment area than was originally planned. Private “community” schools, often serving the poorest communities, were not covered in the system.
3.19 Anecdotal evidence suggests that teachers’ skills (particularly the use of lesson plans) and morale (especially with respect to professional development opportunities) were improved through the TDMS, which is highly regarded throughout the sector. Coordinating Centre Tutors reported greater sensitivity of teachers to girls’ needs, more attention to HIV/AIDS, life skills, health and sanitation, less corporal punishment, and more involvement of parents. The recent elimination of fees for PTCs has increased competition for entry and the quality of selected candidates. The teaching force has historically been male-dominated, but at least 50 percent of new teacher trainees are now women. Teachers reported that prestige of the profession had been enhanced, due to the new opportunities for professional development (as well as better pay). It is difficult to know what impact the program has had on school and teacher performance through the UPE period, but it is clear that Uganda now has a popular and viable system for training and outreach with the potential to play a role in quality improvement in the future.
3.20 Through the PETDP, and through provision by the government of regular book budgets (strongly supported by USAID, DfID, and others), Uganda now has a strong system for ordering, procuring, and distributing textbooks, and experienced staff to manage this system. A significant textbook market has been created and the number and capacity of private Ugandan publishing companies has increased substantially. (The opportunity to promote development of local book retailing has only been taken up since the project closed.) A range of competing alternative textbooks with local authorship was made available for primary grades, with decisions on book selection made at the school level. The PETDP supported a fundamental review of instructional materials policy in 1999–2000, resulting in MOES approval of a program of reforms initiated in 2000 with the full support of the Education Funding Agencies Group (EFAG). The main weaknesses have been the failure to upgrade school storage and improve classroom usage of instructional materials, the abandonment of PETDP plans for the provision of
19. Since the ESAC and PETDP closed, progress in teacher recruitment has been sustained, reaching the 55:1 target two years later in 2002, but the share of certified teachers in the total is reported to have fallen from 83 percent in 2000 to only 62 percent in 2002 — below its 1995 level.
16
supplementary reading materials, and weak coordination with curriculum reform. The impact on teaching and learning performance was also greatly impeded by the growth in enrollments. Nevertheless, as with the TDMS, the system is well placed to support future initiatives for improvement in the quality of primary education.
SECTOR GOVERNANCE AND MANAGEMENT
3.21 Weak governance and management capacity continue to be serious constraints. On the positive side, sector strategy is government-owned, central budget institutions are strong, and commitment to consultation and information dissemination is clear. In other respects — fiduciary assurance, data management, monitoring and evaluation, local government and MOES capacity — progress in the sector has been slow and difficult and depends in part on broader public sector reform, which has also been slow. From discussions with central and local government staff and donor representatives, and from press and NGO publications, concerns about corruption at all levels appear to be widespread, especially in relation to textbooks and management of School Facilities Grants.
3.22 At the central level, capacity has improved substantially since the mid-1990s. Little progress was made under PETDP up to 1997, due in part to lack of interest in the MOES — when the project was implemented through a separate project unit — and the freeze on creating additional posts, which delayed staffing of the planning unit. From 1997, when the UPE crisis made the sector a top priority for the government, and the ministry was committed to preparing the ESIP, the PETDP was able to make headway in supporting capacity of the education planning unit, which was upgraded to a full department of the ministry. It still fell short of plans, especially with respect to the EMIS, which was not fully operational when the project closed.
3.23 The ESAC had an important impact at the central level. Directly and indirectly, the ESAC facilitated a transformation in mobilizing and managing external aid to the sector: transparency, coordination, and consultation in central education budget preparation have been greatly improved, based on agreed sector plans, within the Medium Term Budget Framework and the Poverty Eradication Action Plan. Improved inter-ministerial coordination in managing the teachers payroll made it possible to reduce the number of “ghost” teachers on the payroll, streamline recruitment procedures to get active teachers on the payroll more quickly, and pay teachers on time. These were significant achievements in the circumstances, although they fell short of targets. Teacher deployment remained highly inequitable and proposed efficiency measures were not implemented.
3.24 Although decentralization was a clear policy from 1993, and the Local Government Act was passed in 1997, neither the PETDP nor the ESAC included concerted measures for building sector capacity at the district level. The PETDP included a component for management and information systems at the local level, which had not been fully implemented when the project closed. The ESAC, as an emergency operation, did not address long-term capacity building in local government as such, but focused on a concerted strategy for information dissemination to ensure that local stakeholders understood the respective roles and responsibilities of parents, schools, and local governments. Other relevant measures, including USAID conditionalities for public

17
posting of district and school financial data, had already been initiated, prompted in part by results of the Bank’s 1995 expenditure tracking survey. These measures together were found to have been responsible for a large share of the gains made by 1999 in preventing leakage of the funds allocated to schools.20 Nevertheless, staff charged with monitoring construction through the Schools Facilities (SFG) Grants found that the measures were effective as an accountability mechanism only in communities that were literate and assertive enough to act when abuse was revealed; it was not clear to them that communities were actually empowered to take action and it was easy to “buy off” a few people in very poor communities. There are indications that diligence and public interest in public posting of the information on UPE and SFG grants has diminished recently.
3.25 Huge disparities exist between districts in management and organizational capacity. Incentives for them to devote this capacity to the competition for central funds have been effective in some respects but possibly counterproductive for equity and for local resource mobilization: UPE inspired tremendous motivation and enthusiasm at the local level but has been seen very much as a central government commitment to “free” primary education. District politicians have tended to be judged by their ability to hold the government to this promise, rather than to take on responsibility themselves. This tendency has been underlined by the strict earmarking of grants to districts for primary education. A number of multi-sectoral interventions are under way to build capacity at the district level and the MOES is piloting non-conditional grants to a few districts. Some districts may be able to rise to this quite quickly (and the Local Government Development Program has demonstrated that districts give priority to education in the use of unconditional grants) but, nationally, this is a long-term challenge that was not accounted for by either of the Bank sector operations.
3.26 The strength of organization and management at the school level also varies greatly between schools. The crucial role of headteachers has been recognized in the salary structure, which not only pays the headteacher a multiple of the salary his/her teachers receive but also pays substantially more than for tutors in PTCs and coordinating centre schools (contributing to the difficulty in staffing PTCs). School Management Committees, which are now responsible for the school budget, have relatively small parent representation and are often dominated by the headteacher. PTAs, which used to be the dominant organization, are still important in some schools but have lost their clout, now that they cannot levy fees and depend on voluntary efforts. The PETDP included training of headteachers and, through tutors in coordinating centers, training of members of School Management Committees or “community mobilizers.” No formal evaluation of the training is available. From interviews on the assessment mission, the training has been appreciated at the school level. However, the level of community participation has been disappointing in the majority of schools, despite the training under PETDP and the publicity measures under ESAC to promote participation. Community members have often been unwilling or unable to devote their time without compensation.
3.27 Neither project had an important impact on capacity for monitoring and evaluation in the sector. There was relatively little national interest in the NAPE reports supported by PETDP. Under the ESAC, activities were focused on monitoring 20. Reinikka and Svensson, “Explaining Leakage of Public Funds,” 2001.

18
expenditure and school inputs rather than producing information on outcomes and cost effectiveness to support decision making. District and school authorities have lacked the human capacity, financial resources, and incentives to fulfill their respective roles. The division of responsibilities between PTC-based outreach staff, under the MOES/PETDP, and district education staff was not clarified: both have been charged with supervision, monitoring and inspection functions with insufficient staff and resources to accomplish these effectively. The ministry’s EMIS, supported by PETDP and ESAC, is finally operational, after closure of the projects, and used for the ministry’s annual statistical reports; but verification of data continues to be a serious problem and nothing is yet included on outcomes. Recent studies drawing a sample of schools from the EMIS database have shown that ghost teachers, and even ghost schools have not been eliminated, and that the EMIS data are unreliable in other respects as well.21
4. Ratings
OUTCOME
Relevance
4.1 The objectives of both operations were consistent with the Bank’s country strategy, with country and sector priorities, and with the government’s poverty reduction efforts. The PETDP was consistent with the broad strategy outlined in the Bank’s Country Brief of 1992. The ESAC supported the national UPE policy and was fully in line with the country’s Poverty Eradication Action Plan.
Efficacy
4.2 Efficacy in achieving objectives was mixed for the PETDP, and less than substantial overall. The project was largely successful in implementing planned activities under its first component (see para. 2.3) for improvement of teaching and learning, but no formal evaluations are available of the impact of the TDMS on classroom practices or learning outcomes, while the impact of textbook provision was hindered by constraints to effective use of the books in schools. The PETDP was less successful in its objectives under the second component of enhancing strategic central functions. Efficacy of the ESAC in meeting its objectives, as defined in the policy matrix, was substantial overall (see para. 2.9): although efficacy was only modest on the important efficiency and quality objectives, it was high in increasing the resources available to sustain the growth in enrollments, and substantial in clarifying UPE policy and in strengthening sector management.
21. For example, in a sample of 16 schools drawn recently from the EMIS database to investigate drop-out and attendance rates, 3 schools were mis-represented in the EMIS: one did not exist, and the other two were private, not government-aided, schools teaching only to grade 4 or 5. The EMIS data on drop-outs in the sample schools bore no relation to the rates found by the study team. Also see Annex B: efforts are being made to address issues for the quality of EMIS data, as indicated in the Borrower’s comments on this report (January, 2004).
19
Efficiency
4.3 Efficiency of the PETDP improved greatly from 1998 but was modest overall. Until decentralized procedures were introduced in the last two years of the project, cost effectiveness of civil works was low. The extensive technical assistance funded by the project did not result in the expected transfer of skills. The curriculum review process supported by the project was highly inefficient, taking several years longer than planned without producing satisfactory results.
4.4 Efficiency of the ESAC is rated substantial, although difficult to assess in the absence of data on learning or welfare benefits.22 Indications on internal efficiency are mixed, but some improvements were achieved through the projects, as noted above. An expenditure tracking survey found that as much as 90 percent of funding allocated for “UPE grants” to schools did actually reach the schools, although usually with delay, but there is no systematic information on how this was spent by the schools and to what effect. With no reliable information on learning outcomes, or even primary completion rates, the efficiency of expenditure in the subsector, and hence of the ESAC, is difficult to estimate.
Overall Outcome
4.5 This assessment rates overall outcome of the PETDP as moderately satisfactory and of the ESAC as satisfactory. Although the PETDP had some significant achievements, its shortcomings — in particular, inefficiencies and delays during the first four years of implementation and limited impact in improving strategic central functions of curriculum development, assessment and information systems — preclude a fully satisfactory rating. In the ESAC, efficacy was modest in the critical policy areas of protecting quality and improving efficiency, and was high in only one of the five policy areas (increasing resources available for UPE), precluding a highly satisfactory rating.
INSTITUTIONAL DEVELOPMENT IMPACT
4.6 Institutional development impact of both the PETDP and the ESAC is rated substantial. Each project depended to an extent on the other for its institutional impact. The ESAC helped to build capacity in policy development and sector management through learning-by-doing, and facilitated a fundamental change in the way resources are channeled to and within the sector, providing a much stronger institutional basis for ongoing sector development. It depended for this in part on the systems and implementation capacity that had been developed through PETDP — systems that took time to build and could be refined and expanded to meet the new demand. The most significant contributions of the PETDP were (together with assistance through USAID) the establishment of a nationwide system for teacher development with a network of teacher educators and outreach schools, and an efficient and competitive system for
22. The economic rationale for the ESAC was based on pre-UPE estimates of the effects of schooling on productivity (social returns to primary education of about 16 percent, and 13 percent higher productivity of farmers with primary education), but this is not entirely valid. First, most of the expansion of enrollments occurred prior to the ESAC and cannot be attributed to the project. Second, there is every reason to expect a change in the earnings differential related to primary education post-UPE, when enrollments have almost tripled and learning outcomes have deteriorated.
20
textbook procurement with substantially increased private sector publishing capacity. After some evolution, and through the stimulus of the ESAC, the project also developed an efficient decentralized system for classroom construction and strengthened the planning capacity of the Ministry. Although the PETDP succeeded only partially, or failed to achieve some of its ambitious institutional objectives, its overall impact in this respect was nevertheless substantial.
SUSTAINABILITY
4.7 Sustainability of both operations is rated likely. The most significant achievements of the PETDP were its contributions to establishing the TDMS, and the new systems for textbook procurement and classroom construction. Benefits of the investment in TDMS are highly likely to be sustained. In addition to the medium-term benefits of improved skills and morale of existing tutors, teachers, and headteachers, the system itself enjoys strong national and local ownership. It is highly valued at all levels in the sector and its central management and budget have been fully integrated in the MOES and the University of Kyambogo. The full benefits of the work on textbook publishing and procurement have been realized after closure of the PETDP. Management of the system for provision of instructional materials has been integrated in the MOES, but sustainability is somewhat less assured than for the TDMS: it is inherently more vulnerable to vested interests and still depends at least in the short term on continuing external support to salaries and technical assistance. There is no formal provision for maintenance of the classrooms constructed under PETDP.
4.8 Sustainability of the benefits of ESAC will depend on a continuing high level of external support to the recurrent budget over at least the medium term. Positive indications justifying the likely rating are national ownership and the strength of government and MOES commitment to the sector strategy and budget priority, and maintenance so far of the level of donor commitments to the sector and to the Sector-wide Approach. But the risks are substantial. The recent budget squeeze is raising the question of the justification for protecting education expenditures, increasing the urgency of demonstrating value for money in the sector. Donors have concerns on fiduciary assurance and different views on appropriate conditionality for assistance. Maintaining confidence and momentum will depend on progress in addressing the institutional constraints to program delivery, monitoring and evaluation, and also on broader public sector reform.23
BANK PERFORMANCE
4.9 Overall, Bank performance is rated satisfactory for both the PETDP and the ESAC. Quality at entry of the PETDP, however, was unsatisfactory. The project was ambitious, considering sector capacity, and it should have addressed prioritization and feasible sequencing of the government’s proposed reforms. It also neglected some important issues that should have been incorporated: in particular, it did not explicitly address the strategy for achieving UPE (although the government’s stated policies for
23. OED country studies in Uganda for evaluations of Comprehensive Development Framework, HIPC, and PRSP have also raised concerns in relation to sustainability.
21
UPE included a proposed implementation timetable within the life of the PETDP), missing the opportunity to contribute to planned expansion. Factors affecting the demand for schooling were largely ignored and no targets were established for the expansion of enrolments or for protection/improvement of learning outcomes. Issues in the proposed curriculum reform were identified but neglected in project appraisal. Design did not respond to the impact of the HIV/AIDS crisis at the time, or to the gender gap in primary education. Some lessons from earlier operations were not incorporated: the proposed methods for classroom construction were based on the unsuccessful approach used under the Program for Alleviation of Poverty and Social Costs of Adjustment (PAPSCA); evaluations of preceding education projects had emphasized the need to ensure that schools had storage facilities for textbooks and training in selection and use of the books.
4.10 Supervision of the PETDP was relatively strong, especially during the latter part of the project, responding to implementation issues and to the new demands presented by decentralization and the UPE declaration in 1996. Responsiveness to implementation issues was substantially increased during the course of the project by strengthening capacity in the Country Office. Effective coordination was maintained with USAID in development of the TDMS. Despite several changes of task manager and insufficient focus by the team throughout implementation on classroom-level issues, supervision was satisfactory overall.
4.11 Identification and preparation of the ESAC were exemplary in some important respects. The Bank acted very quickly, perceiving an opportunity to enable the government to handle the pressure of new enrollments, while promoting coordination between the MOES and the Ministry of Finance and supporting them in development of a country-owned strategic plan for the sector. Particular strengths in preparation were the emphasis on borrower ownership, and the involvement of inter-ministerial working groups in producing technical papers. A particular strength in design was the emphasis on channeling funds to schools and on public information to support accountability and parent participation. The choice of a sector adjustment instrument combined with the first HIPC release was innovative and appropriate. Collaboration with other funding agencies was initially weak but this was arguably justified by the urgency of the situation. Other agencies were invited to participate as observers in negotiations. Responsiveness of the Bank team to client needs in rapidly changing circumstances, and its openness to innovation, enabled the Bank to play a critical role in avoiding crisis and developing new opportunities in the country. Had there been a failure of courage on the part of the Bank team to act as quickly and decisively as it did, the outcome cannot be known but would surely have been much less positive.
4.12 Significant shortcomings in the design of the ESAC are also evident and were due in part to insufficient institutional and school-level analysis. Implementation constraints (such as complexities of the payroll system, lack of district-level financial management capacity) were anticipated but underestimated. Design did not draw on analysis of quality and other issues at the classroom level. No baseline was established for monitoring the quality of teaching/learning processes or outcomes. In the circumstances, it was reasonable to focus on the immediate challenge of increasing the supply of key inputs, but the omission of any quality targets beyond input ratios was a serious shortcoming. Risks were understated and the question of sustainability was not adequately addressed.
22
Project documents should have highlighted explicitly the long-term implications of the operation for Bank commitments to the sector in Uganda.
4.13 Supervision of the ESAC was satisfactory, through strong continuous support from the Country Office, and the six-monthly sector reviews which ensured coordination with the PETDP, and with the activities of other funding agencies within the ESIP, as well as with ongoing policy development and the Poverty Eradication Action Plan. But earlier attention should have been given during supervision to the quality, efficiency, and monitoring issues that had been passed over in preparation.
BORROWER PERFORMANCE
4.14 Borrower performance for both operations is rated satisfactory. Government commitment to primary education remained strong throughout the period and was demonstrated through progressive increases in the share of the budget allocated to the primary subsector. For the PETDP, borrower performance was stronger in the second half of the project. In the early years, progress was slowed by the government’s lack of interest in technical assistance and by weak management of the project unit. Performance of the implementing agency was unsatisfactory until the last three years of the project, when new management was installed. The sudden decision in 1996 to accelerate UPE through immediate elimination of fees for all primary grades, instead of through planned phasing of expansion, put excessive stress on the whole system and inhibited the potential of the PETDP to improve the quality of teaching and learning.
4.15 Government ownership of the ESAC agenda was exemplary and processes for preparation and implementation were open and collaborative. The government maintained constructive dialogue and was proactive in addressing most issues as they arose, including allocation of resources above the agreed target levels when enrollments exceeded projections. Some issues in particular should have been addressed more vigorously: averting problems from the curriculum reform process; the introduction of double-shifting; and making the EMIS operational. Progress was slowed by procurement issues and by weaknesses in payroll management. And the government shares some responsibility with the Bank for the lack of earlier attention to the risks for quality and sustainability, and to the need for baseline data to monitor impacts.
5. Adjustment Lending and Sector-wide Approach
5.1 Since 1998, when the ESAC was approved, Uganda has developed significant new approaches to managing external aid for education – approaches that have been cited as a potential model for external assistance to Education For All. Beyond assessment of the two Bank-funded projects, this report also offers some comments on the experience over the last five years in development of a SWAp and pooling budget support for the sector in Uganda.
5.2 Interest in developing an education Sector-wide approach (SWAp) in Uganda dates back to 1996–97, and it came into full effect in 1999. Its purpose has been to

23
involve donors and local stakeholders in dialogue on sector plans and to harmonize external assistance within a clear strategy and budget for the sector. The partnership between the MOES, the Education Funding Agency Group (EFAG), and other stakeholders is managed through a highly structured process based on six-monthly sector reviews, with the ESIP providing the strategic framework, and on-going coordination achieved through sector working groups and regular meetings of the Ministry’s Education Sector Consultative Committee and of EFAG. Almost all external agencies supporting education are now members of EFAG and working within the ESIP framework, whether through budget support or projects. The core members of EFAG, for whom the SWAp arrangements have been critically important, are those using budget support mechanisms to channel assistance. Tranche release has been triggered by conditionalities, or “undertakings,” harmonized and reduced in number, and agreed at each joint government/donor sector review.
ROLE OF THE BANK
5.3 From discussions with those involved, strong leadership of the MOES is widely cited as the key condition that made it possible to implement and sustain the education SWAp in Uganda. The ESAC played a role in supporting it, since preparation was coordinated with development of the MOES’s sector plan (the ESIP), which in turn provided the framework for the SWAp. The ESAC also provided a catalyst for other donors to come in with budget support to the sector. It seems that the initial drive for a SWAp came from the then-Minister of Education, with the support of some donors, in particular DfID. The Bank, which was criticized by other funding agencies for not collaborating more in the early stages of ESAC preparation, became more proactive in supporting the SWAp and DfID leadership of the EFAG from 1999–2000 onwards. Ironically, it may have been the Bank’s rather unilateral approach to initial dialogue with the government on ESAC that helped to cement government ownership and establish a framework quickly within which the SWAp could then develop.
5.4 Relations now among education funding agencies in Kampala and between the MOES and these agencies, appear to be exceptionally good. Dialogue is remarkably frank and constructive. The approach taken by the Bank team is “to support other agencies while ensuring that the technical work is done.” Among the agencies and in the MOES, the Bank is generally perceived as having played a valuable role in the EFAG/MOES partnership, providing strong day-to-day support and continuity through a senior officer posted in the World Bank Country Office, and high-quality technical inputs. Trust-funded sector studies and Bank sector work were instrumental in informing the strategies for post-primary and tertiary education. Other areas of focus and impact by the Bank on policy dialogue included research on teacher supply and demand, recruitment, deployment, and payroll access, and classroom construction. Some representatives of other agencies would have welcomed a stronger stand by the Bank on curriculum development issues.
24
EMERGING ISSUES
5.5 The SWAp/sector review process is widely agreed to have improved the quality of sector policies, and helped to ensure that external assistance is channeled to priorities within a coherent strategy for the sector and a Medium Term Budget Framework. Increasingly, it has also included local-government and nongovernment stakeholders (NGOs, members of parliament, academia) in discussion of policies and budget priorities. Some participants noted that, with hindsight, the ownership and role on the part of NGOs could have been stronger had they been included from the outset. The SWAp has proved strong enough to handle a number of contentious issues. Recently, for example, agreement was reached on a costed strategy for post-primary education, after several years of debating differences among funding agencies, and competing views and interests of national stakeholder groups.24 Threats to the textbook procurement policy were also dealt with successfully. Difficulties in curriculum reform have proved more stubborn.
5.6 At the same time, drawbacks of the approach are increasingly apparent and some of the inherent tensions and risks are not being addressed squarely. Among the funding agencies, there are different views on how far and fast the SWAp model should be extended to common pooling of resources through general budget support and through MOES-managed funds for technical assistance and studies: some agencies are working at least partly through nongovernmental organizations in order to ensure additionality in their priority area; some continue with project assistance but within the ESIP framework; some are mixing project and program support; and some use only budget support channels, whether earmarked, sector-specific, or multi-sectoral. The latter approach has obvious advantages, but the further one moves along this continuum, the higher are the stakes for all involved, and hence the incentives to maintain goodwill and consensus, through compromise when necessary. A number of relevant concerns were expressed or implied in interviews for this report:
• Some agencies are maintaining, or shifting back to, a project approach, for a variety of reasons: prevalence of corruption and weak fiduciary assurance; concern that budget support keeps the focus on policies and budgets, which are now in relatively good shape, while implementation capacity is lagging; lack of confidence in the government’s management of security threats and military expenditure; unwillingness to depend, in effect, on World Bank/IMF management of conditionalities.
• Following good principles of promoting “learning-by-doing” and national ownership, funding agencies have shifted part of the burden of aid management to the MOES. Although compensated to some extent by harmonization of donor requirements, this burden has proved very heavy. The capacity of the MOES, and especially its planning department, is severely stretched to meet the demands of the SWAp processes in data management, analysis, evaluation, selection and supervision of consultants, production of reports, and so on, as well as administration of sector reviews and routine demands of EFAG members relating to their own process requirements (including, of course, this assessment by OED).
24. MOES, “Draft Policy and Costed Framework for the Expansion of Post Primary Education and Training,” 2003.
25
An analysis is needed of how much of this work is helping to build core ministry capacity, and how much is diverting it from higher priorities.
• Aware of this burden on the Ministry, and on the principle also that donors should not be micro-managing aid, the response of EFAG members has tended to be to step back and lighten their demands rather than take on more themselves. Some have consolidated their field representation and it has been proposed that annual rather than six-monthly sector reviews may now be sufficient. However, not everyone in EFAG and the MOES is comfortable with what they see as a trend toward disengagement of donors. Some think it may be premature, given the lack still of adequate checks and balances in the sector, and they are concerned that the value of external advice will diminish if fewer agencies have education staff with thorough knowledge of grassroots realities in the country.
• A basic principle of the SWAp is that the government/MOES be “in the driver’s seat,” but there is considerable tension and ambivalence about what this really means, or should mean, for the role of funding agencies. Donors rightly want to avoid insisting on policies or reforms that are not nationally “owned” and to depend as far as possible on national processes to resolve differences, but the reality is more complex. In practice, funding agency representatives find themselves called upon frequently to intervene and influence decisions in the context of competing views and interests within the country, the government, and within the MOES itself. And MOES officials hardly feel themselves to be in the driver’s seat, when they are driven by EFAG conditionalities on the one hand and Ministry of Finance management of multi-sectoral budget support operations on the other.
5.7 The danger is that these issues, and the institutional constraints they reflect, are glossed over because of the stakes in maintaining commitment to the process. At the same time, questions have been raised as to whether the SWAp/Poverty Reduction Support Credit (PRSC) model, as currently adopted in Uganda, can be sufficiently effective in promoting institutional capacity. The Bank’s PRSC team perceives a gap here and is giving thought to a new supplementary instrument directed to capacity building. The particular institution- and capacity-building issues for delivery, monitoring and evaluation (M&E) of education need specific attention.
5.8 The use of budget support channels for external funding to the sector has strengthened the focus on M&E, which is a priority for donors: it is important to funding agencies for fiduciary assurance and their own accountability, as well as for the development of Uganda’s education system. Sector monitoring activities have been focused primarily on compliance with procedures and regulations, while evaluation activities have been largely instigated by donors. 25 So far, these activities have fallen short of meeting fiduciary requirements, much less informing sector policy through monitoring cost effectiveness and relating inputs to results.
25. Arild Hauge, “Effective implementation of Uganda’s Poverty Eradication Action Plan: The role of monitoring and evaluation in the Health, Education and Water sectors,” 2002.

26
5.9 Although the focus of dialogue in sector reviews is now on improving education quality, the use of budget support may have encouraged the recent focus on procedures and management of expenditure on inputs, at the expense of knowledge on what is actually happening in schools. Substantial resources have been devoted to M&E activity geared to the extensive requirements under the Poverty Action Fund, but activities are often duplicative and few produce useful products. More attention has been given since the projects closed to introducing results-based management in the Poverty Eradication Action Plan as a whole (under the direction of the Ministry of Finance, whose capacity is relatively strong), but M&E capacity in the education sector appears far from being able to support this. The new Education Standards Agency is planned to coordinate and improve information on education processes and outcomes and it is hoped that this will help to eliminate some existing inefficiencies rather than add another layer.
5.10 It appears that the expectations of funding agencies have exceeded the capacity of the sector to deliver on M&E, as well as the demand among education decision makers in Uganda for M&E outputs. A first step would be to understand and address the constraints to getting reasonably reliable basic school-level data.26 Until this is achieved, there is little to be gained from entering the data in computers, and policymakers are unlikely to be pressing for the results of the analysis. Introducing incentives for schools and districts to identify and monitor their own outcome indicators and targets might be useful, although it would require intensive facilitation. Trying to short-cut what probably has to be a long-term process toward results-based management could risk breeding cynicism on the part of those charged with M&E tasks. The difficulties being experienced in the education sector even in wealthy countries provide some perspective.
6. Lessons
6.1 The experience in Uganda illustrates what can be achieved, given government commitment and national ownership of the reform strategy together with responsiveness on the part of the Bank to government priorities. The Bank’s rapid and bold response in 1997 enabled the government to avert a crisis in the education system and to sustain a more than doubling in primary enrollments, greatly reducing the poverty and gender barriers to primary schooling. Its subsequent support to donor collaboration through a Sector-wide approach (SWAp) was critical to enabling the MOES to develop and take charge of consultative processes for ongoing policymaking, planning, and budgeting in the sector.
6.2 The experience also reveals:
• dangers in giving priority to rapid expansion of enrollments when institutional capacity is weak and issues for education quality and efficiency have not been adequately addressed, and
26. The constraints to accuracy of basic sector data in Uganda include a range of perverse incentives (e.g., for schools to overstate enrollments, understate retention and drop-outs; payment of allowances to staff for monitoring activities unrelated to the quality or accuracy of the output), lack of information or training (suppliers of information are unaware of what exactly is needed and for what purpose), and practical constraints (e.g., teachers’ registers are badly designed).
27
• constraints to how far and how rapidly the SWAp/budget-support model can be applied to support education expansion when implementing capacity and fiduciary assurance are major concerns.
6.3 Uganda has met the conditions usually cited as necessary for common pooling of external funding to education through budget support: government commitment and ownership, macroeconomic stability, transparent and disciplined central budget processes, and good sector policies. The experience makes clear that more systematic attention should also be given to institutional constraints, and to matching the level of funding to absorptive capacity in the sector.
6.4 Uganda has also pioneered a range of “good practice” models for low income countries committed to Education For All:
• for coordination and consultation in sector policy development and budgeting within a PRSP and MTEF framework;
• for financing mechanisms that channel funds to schools, combined with measures to strengthen information and accountability (expenditure tracking surveys, use of press and radio, public posting of financial data by schools and districts);
• for pre- and in-service teacher training, through a national network of training colleges, coordinating center schools, and outreach schools;
• for provision of low-cost instructional materials, through competitive procurement, private sector development, and book choice at the school level.
LESSONS FOR SUPPORTING EXPANSION OF PRIMARY EDUCATION
6.5 Very rapid expansion of enrollments, even with appropriate increase in funding, is liable to disrupt efforts to improve the effectiveness of systems for delivering inputs to schools and for monitoring the quality of learning processes and outputs. Thorough diagnosis is needed of the weaknesses in these systems and the time needed to rectify them, to determine absorptive capacity. Attention is needed to prioritization and sequencing, to avoid overloading the reform agenda. Attempting in Uganda to more than double enrollments at the same time as decentralizing management to district councils and reforming the curriculum increased the risks for quality and efficiency.
6.6 To protect the quality of education while expanding the capacity of the system, project design should be based on analysis of existing strengths and weaknesses at the school and classroom levels, providing a baseline for monitoring relevant indicators. In Uganda, as elsewhere, it is proving difficult to shift the focus of M&E to classroom processes and learning outcomes once input ratios have been established as the main indicators and targets for education quality.
6.7 “Big bang” expansion of primary enrollments has long-term downstream fiscal implications beyond just the primary subsector. Uganda is confronting the need to increase capital and recurrent funding to post-primary education, now that pupils in the UPE bulge are completing the primary cycle. These implications should be taken into account up front but they lie outside the typical medium-term framework for fiscal projections and beyond a
28
plausible time frame for commitments by funding agencies. Impacts beyond the education sector are also being felt and questions raised as to whether education is over-funded in relation to other sectors. Growth in the number of teachers has become a major issue for the public service payroll as a whole and is inhibiting pay reform.
LESSONS FOR USING BUDGET SUPPORT IN A SWAP FOR EDUCATION
6.8 The combination of budget support and investment lending can be an effective form of Bank support to Education for All in countries with commitment to good policies but weak capacity to implement them. The PETDP and the ESAC were mutually supportive. The ESAC has been rightly acclaimed for its role in improving sector planning and budgeting functions, while the role of the PETDP (in conjunction with USAID) in piloting and developing systems for implementation has tended to be understated. Rapid expansion of inputs, financed though ESAC, depended on development over time through PETDP of systems for teacher development, textbook procurement, classroom construction, and some capacity to further develop and manage these systems. It has not yet been demonstrated in Uganda that capacity- and institution-building needs in the sector can be sufficiently addressed through budget support alone.
6.9 Given strong ministry leadership, a SWAp can be quickly established, with benefits for the coherence of sector strategy, the quality and national ownership of sector policies, and transparency of sector planning and budget processes, but it presents new issues for aid management. Despite harmonization of many donor requirements in the Ugandan education sector, the demands of the SWAp reporting and consultative processes have overstretched ministry capacity. The focus of dialogue on policies and budgets has tended to sideline implementation issues, and to marginalize nongovernmental organizations — which have become the main source of piloting and innovation in the sector. Monitoring has been focused on regulations and procedures rather than results, while the demand for evaluation comes largely from funding agencies. And the high stakes in maintaining consensus can be a positive incentive to compromise but can also encourage glossing over issues that should be addressed.
6.10 Maintaining donor and public confidence depends on special measures for fiduciary assurance which can be difficult to sustain. Channeling external funds to the sector through budget support adds to the onus on weak accountability systems. Uganda has been making strenuous efforts to strengthen these but the results are still insufficient: cynicism concerning management of public expenditure at all levels continues to be widespread; the national auditing body is competent but constrained by the unreliability of basic data. In the absence of adequate accounting, monitoring, and reporting systems at the district level, innovative techniques were pioneered in Uganda to improve accountability at the local level. These measures had a positive impact, but it is proving difficult to sustain the necessary level of effort. The elimination of school fees had the unintended effect of weakening the role of PTAs and reducing the interest of parents in monitoring school finance.

29
References Ablo, E. and R. Reinikka, 1998, “Do Budgets Really Matter? Evidence from Public Spending on
Education and Health in Uganda, The World Bank, Policy Research Working Paper No. 1926.
AUCC Consortium, 2003, “Joint Evaluation of External Support to Basic Education in
Developing Countries,” Country Study Report, Uganda. Hauge, A., 2001, “Strengthening Capacity for Monitoring and Evaluation in Uganda: A Results
Based Management Perspective,” OED Working Paper 8, World Bank. Hauge, A. 2002, “Effective implementation of Uganda’s Poverty Eradication Action Plan: The
role of monitoring and evaluation in the health, education and water sectors,” for DfID. Hicks, R.B.,2002, Report on the Outcome of the Baseline Study for Non-Textbook Materials, for
DfID. Ministry of Education and Sports (MOES), 1992, “Education for National Integration and
Development,” Government White Paper. MOES, 1998, “Education Strategic Investment Plan 1998-2003.” MOES, “Education Sector Reviews,” six-monthly, from April 1999. MOES, 2000, “Uganda: EFA [Education for All] 2000 Assessment, Country Report.” MOES, 2001, “Study to Track Use of and Accountability of UPE Capitation Grants.” Ministry of Finance, Planning and Economic Development, 1998, “Poverty Eradication Action
Plan.” Ministry of Finance, Planning and Economic Development, 2002 and 2003, “Background to the
Budget,” 2001/2002 and 2002/2003. Musisi, N. B., D. Kasente and A. M. Balihuta, 2003, “Attendance Patterns and Dropout in
Primary Schools in Uganda,” for the MOES. Reinikka, R. and P.Collier eds., 2001, “Uganda’s Recovery: The Role of Farms, Firms, and
Government,” World Bank. Uganda National Examinations Board, 1999, “National Assessment of Progress in Education:
Report on the Results of Mathematics and English Assessments in 1999.” World Bank, 2001, “Uganda: Policy, Participation, People,” OED Country Assistance Evaluation. World Bank, 2002, “The Republic of Uganda Public Expenditure Review, Report on the Progress
and Challenges of Budget Reforms,” Africa Region.

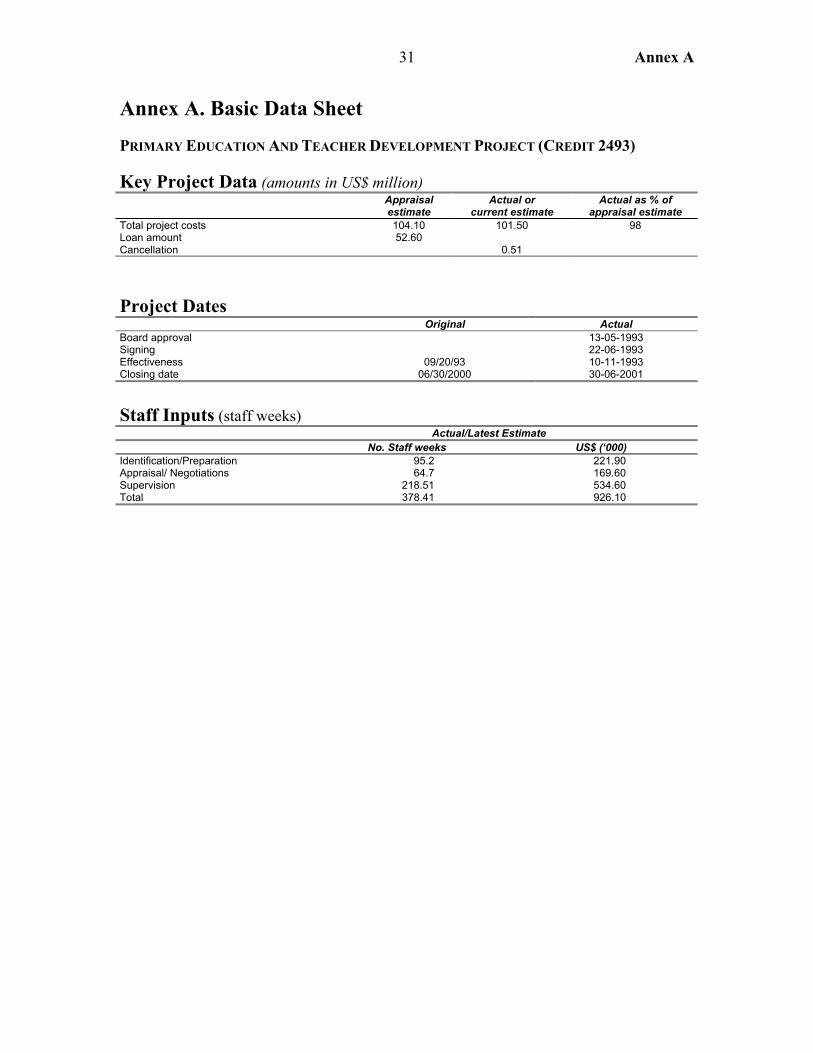
31 Annex A
Annex A. Basic Data Sheet
PRIMARY EDUCATION AND TEACHER DEVELOPMENT PROJECT (CREDIT 2493)
Key Project Data (amounts in US$ million) Appraisal
estimate Actual or
current estimate Actual as % of
appraisal estimate Total project costs 104.10 101.50 98 Loan amount 52.60 Cancellation 0.51
Project Dates Original Actual Board approval 13-05-1993 Signing 22-06-1993 Effectiveness 09/20/93 10-11-1993 Closing date 06/30/2000 30-06-2001
Staff Inputs (staff weeks) Actual/Latest Estimate
No. Staff weeks US$ (‘000) Identification/Preparation 95.2 221.90 Appraisal/ Negotiations 64.7 169.60 Supervision 218.51 534.60 Total 378.41 926.10
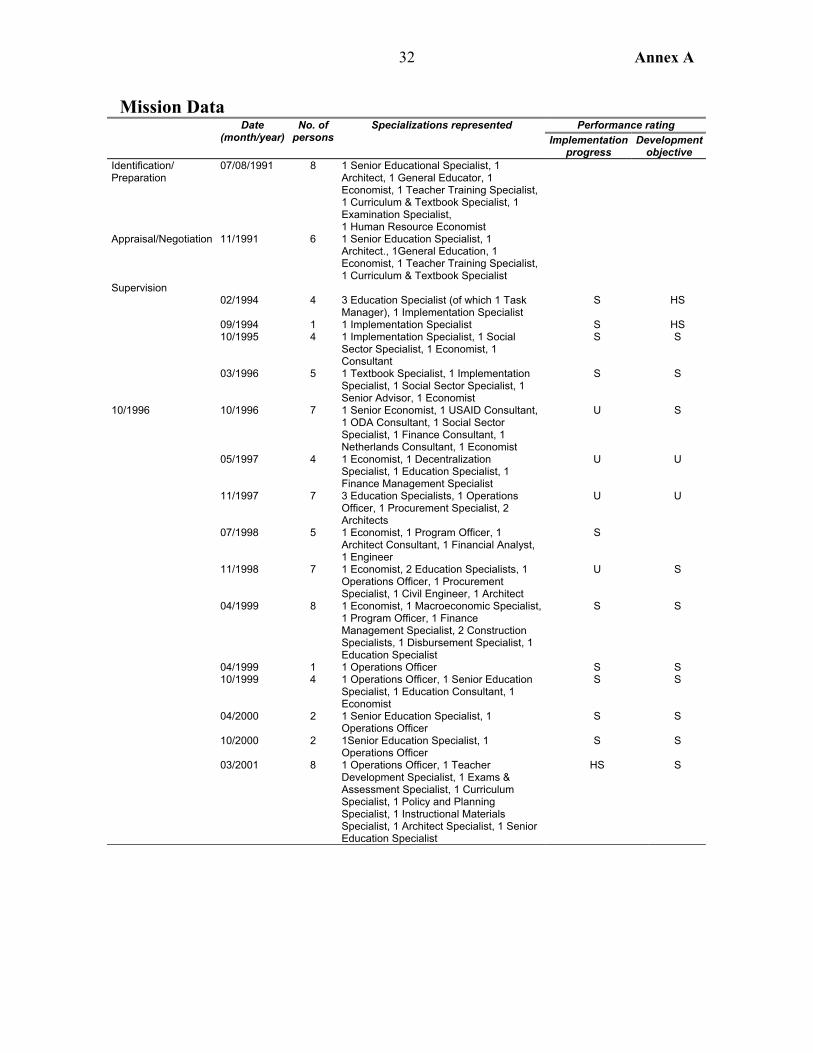
Annex A 32
Mission Data Performance rating Date
(month/year) No. of
persons Specializations represented
Implementation progress
Development objective
Identification/ Preparation
07/08/1991 8 1 Senior Educational Specialist, 1 Architect, 1 General Educator, 1 Economist, 1 Teacher Training Specialist, 1 Curriculum & Textbook Specialist, 1 Examination Specialist, 1 Human Resource Economist
Appraisal/Negotiation 11/1991 6 1 Senior Education Specialist, 1 Architect., 1General Education, 1 Economist, 1 Teacher Training Specialist, 1 Curriculum & Textbook Specialist
Supervision 02/1994 4 3 Education Specialist (of which 1 Task
Manager), 1 Implementation Specialist S HS
09/1994 1 1 Implementation Specialist S HS 10/1995 4 1 Implementation Specialist, 1 Social
Sector Specialist, 1 Economist, 1 Consultant
S S
03/1996 5 1 Textbook Specialist, 1 Implementation Specialist, 1 Social Sector Specialist, 1 Senior Advisor, 1 Economist
S S
10/1996 10/1996 7 1 Senior Economist, 1 USAID Consultant, 1 ODA Consultant, 1 Social Sector Specialist, 1 Finance Consultant, 1 Netherlands Consultant, 1 Economist
U S
05/1997 4 1 Economist, 1 Decentralization Specialist, 1 Education Specialist, 1 Finance Management Specialist
U U
11/1997 7 3 Education Specialists, 1 Operations Officer, 1 Procurement Specialist, 2 Architects
U U
07/1998 5 1 Economist, 1 Program Officer, 1 Architect Consultant, 1 Financial Analyst, 1 Engineer
S
11/1998 7 1 Economist, 2 Education Specialists, 1 Operations Officer, 1 Procurement Specialist, 1 Civil Engineer, 1 Architect
U S
04/1999 8 1 Economist, 1 Macroeconomic Specialist, 1 Program Officer, 1 Finance Management Specialist, 2 Construction Specialists, 1 Disbursement Specialist, 1 Education Specialist
S S
04/1999 1 1 Operations Officer S S 10/1999 4 1 Operations Officer, 1 Senior Education
Specialist, 1 Education Consultant, 1 Economist
S S
04/2000 2 1 Senior Education Specialist, 1 Operations Officer
S S
10/2000 2 1Senior Education Specialist, 1 Operations Officer
S S
03/2001 8 1 Operations Officer, 1 Teacher Development Specialist, 1 Exams & Assessment Specialist, 1 Curriculum Specialist, 1 Policy and Planning Specialist, 1 Instructional Materials Specialist, 1 Architect Specialist, 1 Senior Education Specialist
HS S
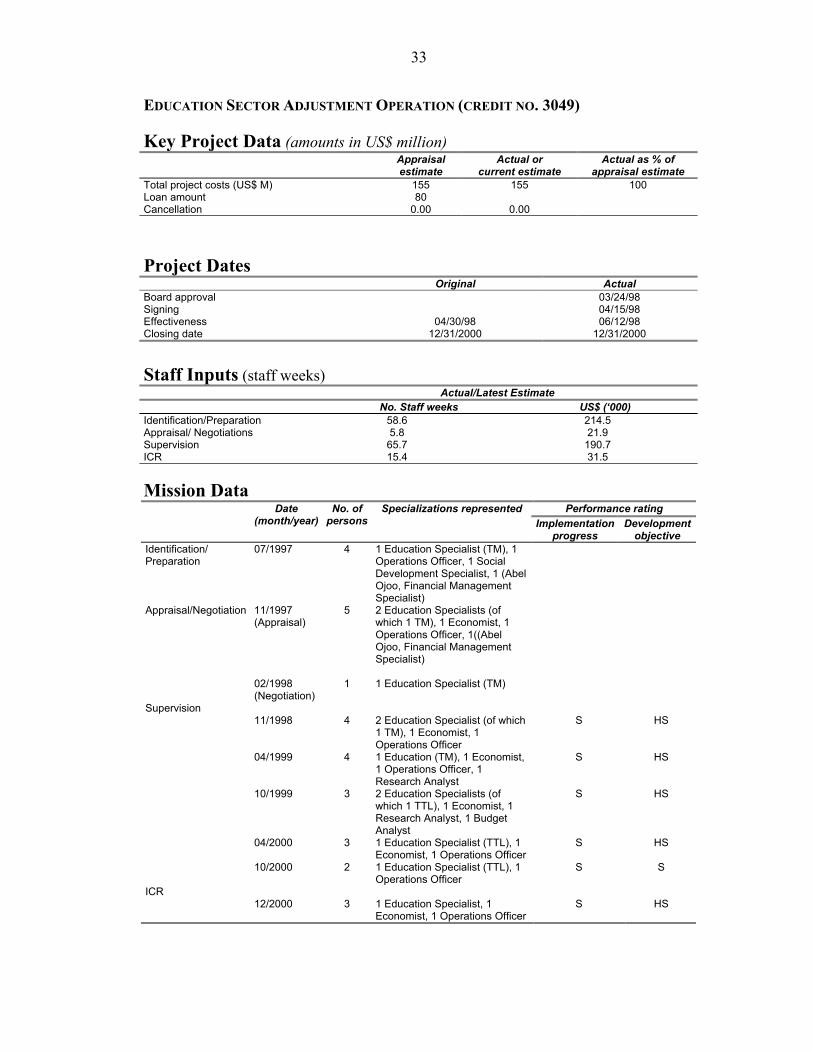
33
EDUCATION SECTOR ADJUSTMENT OPERATION (CREDIT NO. 3049)
Key Project Data (amounts in US$ million) Appraisal
estimate Actual or
current estimate Actual as % of
appraisal estimate Total project costs (US$ M) 155 155 100 Loan amount 80 Cancellation 0.00 0.00
Project Dates Original Actual Board approval 03/24/98 Signing 04/15/98 Effectiveness 04/30/98 06/12/98 Closing date 12/31/2000 12/31/2000
Staff Inputs (staff weeks) Actual/Latest Estimate
No. Staff weeks US$ (‘000) Identification/Preparation 58.6 214.5 Appraisal/ Negotiations 5.8 21.9 Supervision 65.7 190.7 ICR 15.4 31.5 Mission Data
Performance rating Date (month/year)
No. of persons
Specializations represented Implementation
progress Development
objective Identification/ Preparation
07/1997 4 1 Education Specialist (TM), 1 Operations Officer, 1 Social Development Specialist, 1 (Abel Ojoo, Financial Management Specialist)
Appraisal/Negotiation 11/1997 (Appraisal) 02/1998 (Negotiation)
5
1
2 Education Specialists (of which 1 TM), 1 Economist, 1 Operations Officer, 1((Abel Ojoo, Financial Management Specialist) 1 Education Specialist (TM)
Supervision 11/1998 4 2 Education Specialist (of which
1 TM), 1 Economist, 1 Operations Officer
S HS
04/1999 4 1 Education (TM), 1 Economist, 1 Operations Officer, 1 Research Analyst
S HS
10/1999 3 2 Education Specialists (of which 1 TTL), 1 Economist, 1 Research Analyst, 1 Budget Analyst
S HS
04/2000 3 1 Education Specialist (TTL), 1 Economist, 1 Operations Officer
S HS
10/2000 2 1 Education Specialist (TTL), 1 Operations Officer
S S
ICR 12/2000 3 1 Education Specialist, 1
Economist, 1 Operations OfficerS HS


35 Annex B
Annex B. Comments from the Borrower

36 Annex B

37 Annex B

38 Annex B

39 Annex B