Embed Size (px)
Citation preview

Document of
The World Bank
Report No: ICR00003724
IMPLEMENTATION COMPLETION AND RESULTS REPORT (IBRD- 76120)
ON A
LOAN
IN THE AMOUNT OF EURO 40 MILLION
(US$59 MILLION EQUIVALENT)
TO THE
REPUBLIC OF BULGARIA
FOR A
SOCIAL INCLUSION PROJECT
June 22, 2016
Education Global Practice Europe and Central Asia Region
Pub
lic D
iscl
osur
e A
utho
rized
Pub
lic D
iscl
osur
e A
utho
rized
Pub
lic D
iscl
osur
e A
utho
rized
Pub
lic D
iscl
osur
e A
utho
rized

CURRENCY EQUIVALENTS
(Exchange Rate Effective June 22, 2016)
Currency Unit = EURO
1.00 EURO = US$ 1.13 0.89 EURO = US$ 1.00
1.00 BGN = US$ 0.57 1.74 BGN = US$1.00
1.00 BGN = EURO 0.51 1.96 BGN = EURO 1.00
FISCAL YEAR
January 1 – December 31
ABBREVIATIONS AND ACRONYMS
BALMI Bulgarian Active Labor Market Initiative
BGN Bulgarian Lev
CBOs Community-Based Organizations
CCT Conditional Cash Transfer
CIDI Community Infrastructure for Development Initiative
CPS Country Partnership Strategy
CWP Child Welfare Reform Project
EA Employment Agency
EAA European Accession Agreement
EC European Commission
ECD Early Childhood Development
EEC Ecological Expert Council
EIA Environmental Impact Assessment
EPA Environmental Protection Act
ERDF European Regional Development Fund
ESF European Social Fund
ETA Evaluation Tools and Approaches
EU European Union
EU8 EU New Member States
GDP Gross Domestic Product
GMI Guaranteed Minimum Income
GOB Government of Bulgaria
GP General Practitioner
ICB International Competitive Bidding
ICM Implementation Completion Memorandum
ICR Implementation Completion Report
IFRs Interim Unaudited Financial Reports

IRR Internal Rate of Return
ISDS Integrated Safeguards Data Sheet
JSDF Japanese Social Development Fund
MAF Ministry of Agriculture and Forest
MES Ministry of Education and Science
MEW Ministry of Environment and Water
MIC Middle Income Countries
MLSP Ministry of Labor and Social Policy
MOF Ministry of Finance
MOH Ministry of Health
MRDPW Ministry of Regional Development and Public Works
MTHS Multi-topic Household Survey
NCEDI National Council on Ethnic and Demographic Issues
NCEDS National Catalogue on Environmental Data Sources
NGO Non-Governmental Organization
NPAA National Program for Adoption of the Acquis
NSI National Statistics Institute
NSRF National Strategic Reference Framework
OMC Open Method of Communication
OSI Open Society Institute
PAD Project Appraisal Document
PDO Project Development Objective
PIRLS Progress in International Reading Literacy Status
RAMO Intercultural Roma Education Program
REEC Regional Expert Environmental Council
REWI Regional Environment and Water Inspectorates
SAA Social Assistance Agency
SACP State Agency for Child Protection
SBD Standard Bidding Documents
SEED Supreme Expert Environmental Council
SEN Special Education Needs
SIEP Social Investment and Employment Promotion Project
SIF Social Investment Fund
SIP Social Inclusion Project, the Project
SIR DPL Social Sectors Institutions Reform Development Policy Lending
Senior Global Practice Director: Claudia Maria Costin
Practice Manager: Cristian Aedo
Project Team Leader: Plamen Nikolov Danchev
ICR Team Leader: Plamen Nikolov Danchev

BULGARIA
Social Inclusion Project
CONTENTS
Data Sheet
A. Basic Information
B. Key Dates
C. Ratings Summary
D. Sector and Theme Codes
E. Bank Staff
F. Results Framework Analysis
G. Ratings of Project Performance in ISRs
H. Restructuring
I. Disbursement Graph
B. Key Dates .................................................................................................................... i C. Ratings Summary ........................................................................................................ i D. Sector and Theme Codes ........................................................................................... ii E. Bank Staff ................................................................................................................... ii F. Results Framework Analysis ...................................................................................... ii G. Ratings of Project Performance in ISRs .................................................................... v
H. Restructuring (if any) ................................................................................................ vi I. Disbursement Profile ................................................................................................ vii 1. Project Context, Development Objectives and Design ............................................... 1
2. Key Factors Affecting Implementation and Outcomes .............................................. 8
3. Assessment of Outcomes .......................................................................................... 16
4. Assessment of Risk to Development Outcome ......................................................... 23
5. Assessment of Bank and Borrower Performance ..................................................... 24
6. Lessons Learned ....................................................................................................... 26
7. Comments on Issues Raised by Borrower/Implementing Agencies/Partners .......... 27
Annex 1. Project Costs and Financing .......................................................................... 28
Annex 2. Outputs by Component ................................................................................. 29
Annex 3. Economic and Financial Analysis ................................................................. 31
Annex 4. Bank Lending and Implementation Support/Supervision Processes ............ 35
Annex 5. Targeting ....................................................................................................... 36
Annex 6. Summary of Borrower's ICR and/or Comments on Draft ICR ..................... 39
Annex 7. List of Supporting Documents ...................................................................... 41
MAP
i
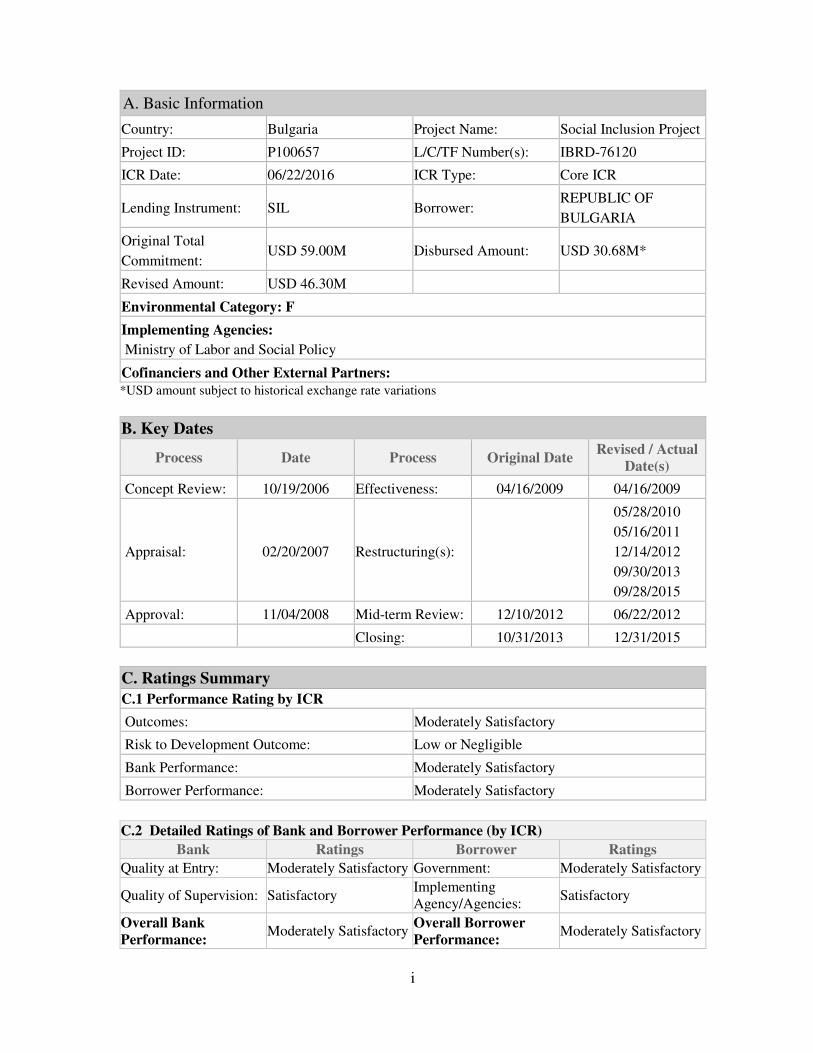
A. Basic Information
Country: Bulgaria Project Name: Social Inclusion Project
Project ID: P100657 L/C/TF Number(s): IBRD-76120
ICR Date: 06/22/2016 ICR Type: Core ICR
Lending Instrument: SIL Borrower: REPUBLIC OF
BULGARIA
Original Total
Commitment: USD 59.00M Disbursed Amount: USD 30.68M*
Revised Amount: USD 46.30M
Environmental Category: F
Implementing Agencies:
Ministry of Labor and Social Policy
Cofinanciers and Other External Partners: *USD amount subject to historical exchange rate variations
B. Key Dates
Process Date Process Original Date Revised / Actual
Date(s)
Concept Review: 10/19/2006 Effectiveness: 04/16/2009 04/16/2009
Appraisal: 02/20/2007 Restructuring(s):
05/28/2010
05/16/2011
12/14/2012
09/30/2013
09/28/2015
Approval: 11/04/2008 Mid-term Review: 12/10/2012 06/22/2012
Closing: 10/31/2013 12/31/2015
C. Ratings Summary
C.1 Performance Rating by ICR
Outcomes: Moderately Satisfactory
Risk to Development Outcome: Low or Negligible
Bank Performance: Moderately Satisfactory
Borrower Performance: Moderately Satisfactory
C.2 Detailed Ratings of Bank and Borrower Performance (by ICR)
Bank Ratings Borrower Ratings
Quality at Entry: Moderately Satisfactory Government: Moderately Satisfactory
Quality of Supervision: Satisfactory Implementing Agency/Agencies:
Satisfactory
Overall Bank
Performance: Moderately Satisfactory
Overall Borrower
Performance: Moderately Satisfactory

ii
C.3 Quality at Entry and Implementation Performance Indicators
Implementation
Performance Indicators
QAG Assessments (if
any) Rating
Potential Problem Project
at any time (Yes/No): No
Quality at Entry
(QEA): None
Problem Project at any
time (Yes/No): Yes
Quality of
Supervision (QSA): None
DO rating before
Closing/Inactive status:
Moderately
Satisfactory
D. Sector and Theme Codes
Original Actual
Sector Code (as % of total Bank financing)
Health 6 6
Other social services 62 62
Pre-primary education 25 25
Public administration- Other social services 7 7
Theme Code (as % of total Bank financing)
Child health 6 6
Education for all 25 25
Social Safety Nets/Social Assistance & Social Care
Services 69 69
E. Bank Staff
Positions At ICR At Approval
Vice President: Cyril E Muller Shigeo Katsu
Country Director: Arup Banerji Orsalia Kalantzopoulos
Practice
Manager/Manager: Mario Cristian Aedo Inostroza Arup Banerji
Project Team Leader: Plamen Nikolov Danchev Christian Bodewig
ICR Team Leader: Plamen Nikolov Danchev
ICR Primary Author: Suzana Nagele de Campos Abbott
F. Results Framework Analysis Project Development Objectives (from Project Appraisal Document) The project development objective for the Social Inclusion Project is to promote social inclusion through increasing the school readiness of children below the age of 7, targeting low-income and marginalized families (including children with a disability and other special needs).

iii
Revised Project Development Objectives (as approved by original approving authority)
(a) PDO Indicator(s)1
Indicator Baseline Value
Original Target
Values (from
approval
documents)
Formally
Revised
Target Values
Actual Value
Achieved at
Completion or
Target Years
Indicator 1 : Share of vulnerable children aged 6 who pass the school readiness diagnostic test
Value quantitative or Qualitative)
36% NA 40% 80%
Date achieved 06/22/2012 12/19/2009 09/19/2013 12/31/2015
Comments (incl. % achievement)
Exceeded. New indicator introduced in the December 2012 restructuring.
Indicator 2 : Number of children aged 3-7 newly enrolled in kindergartens and preschool groups through the Project
Value quantitative or Qualitative)
0 NA 3000 4420
Date achieved 06/22/2012 12/19/2009 09/19/2013 12/31/2015
Comments (incl. % achievement)
Exceeded. New indicator introduced in the December 2012 restructuring.
Indicator 3 : Number of children with disabilities and other special needs enrolled in mainstream kindergartens and preschool groups through the Project
Value quantitative or Qualitative)
0 NA 150 471
Date achieved 06/22/2012 12/19/2009 09/19/2013 12/31/2015
Comments (incl. % achievement)
Exceeded. Indicator revised (replacing "rate of enrolment" with "number") in the December 2012 restructuring.
Indicator 4 : Number of beneficiaries of the "Early Intervention of Disabilities" service
Value quantitative or Qualitative)
0 NA 1500 4311
Date achieved 06/22/2012 12/19/2009 09/19/2013 12/31/2015
Comments (incl. % achievement)
Exceeded. New indicator introduced in the December 2012 restructuring.
1 The PDO and Intermediate Outcome Indicators presented in this Section are those following the December 2012
restructuring, as further adjusted in the September 2013 restructuring to reflect the revised timing of target values, the extension of the project completion and loan closing dates. The September 2013 restructuring also eliminated the following indicator that had been introduced in September 2012: Baseline and final project impact evaluation surveys conducted. The original indicators as presented in the Results Framework in the Project Appraisal Document (PAD) have not been presented here, as the Results Framework contained neither baseline data nor targets for the indicators, nor was progress towards those indicators monitored.

iv
(b) Intermediate Outcome Indicator(s)
Indicator Baseline Value
Original Target
Values (from
approval
documents)
Formally
Revised
Target Values
Actual Value
Achieved at
Completion or
Target Years
Indicator 1 : Number of newly created places in kindergarten and preschool groups through the Project
Value (quantitative or Qualitative)
0 NA 1600 2357
Date achieved 06/22/2012 06/30/2009 09/19/2013 12/31/2015
Comments (incl. % achievement)
Exceeded. Indicator revised in the December 2012 restructuring. Original indicator: "Number of new child care places created through the project"
Indicator 2 : Number of newly created facilities for delivery of integrated social inclusion services through the Project
Value (quantitative or Qualitative)
0 NA 68 113
Date achieved 06/22/2012 09/19/2009 09/19/2013 12/31/2015
Comments (incl. % achievement)
Exceeded. New indicator introduced in the December 2012 restructuring.
Indicator 3 : Number of parents of children aged 0-3 who received parenting skills counseling
Value (quantitative or Qualitative)
0 NA 10000 12964
Date achieved 06/22/2012 12/19/2009 09/19/2013 12/31/2015
Comments (incl. % achievement)
Exceeded. Indicator revised in the December 2012 and restructuring.
Indicator 4 : Number of children aged 0-7who benefitted from the "Health Consultation" services
Value (quantitative or Qualitative)
0 NA 10000 39993
Date achieved 06/22/2012 12/19/2009 09/19/2013 12/31/2015
Comments (incl. % achievement)
Exceeded. New indicator introduced in the December 2012 restructuring.
Indicator 5 : Number of municipal staff trained in public procurement rules and procedures under the Project
Value (quantitative or Qualitative)
0 NA 120 120
Date achieved 06/22/2012 12/19/2009 09/19/2013 12/31/2015
Comments (incl. % achievement)
Achieved. New indicator introduced in the December 2012 restructuring.

v
Indicator 6 : SIP Project Management Information System (PMIS) developed and operationalized
Value (quantitative or Qualitative)
not due NA PMIS not available
PMIS in use
Date achieved 11/04/2008 12/19/2009 09/19/2013 12/31/2015
Comments (incl. % achievement)
Achieved. New indicator introduced in the December 2012 restructuring.
Indicator 7 : Number of municipal staff trained in project reporting and monitoring and evaluation
Value (quantitative or Qualitative)
0 NA 120 144
Date achieved 06/22/2012 12/19/2009 09/19/2013 12/31/2015
Comments (incl. % achievement)
Exceeded. New indicator introduced in the December 2012 restructuring.
Indicator 8 : Number of kindergartens and crèches' staff trained under the Project
Value (quantitative or Qualitative)
0 NA 700 1100
Date achieved 06/22/2012 12/19/2009 09/19/2013 12/31/2015
Comments (incl. % achievement)
Exceeded. Indicator revised in the December 2012 restructuring. This activity was financed under the EU-funded Operational Program "Education and Science for Smart Growth".
G. Ratings of Project Performance in ISRs
No. Date ISR
Archived DO IP
Actual
Disbursements
(USD millions)*
1 03/20/2009 Satisfactory Moderately Satisfactory 0.00
2 12/16/2009 Satisfactory Moderately Satisfactory 0.00
3 04/30/2010 Satisfactory Moderately Unsatisfactory 0.00
4 10/18/2010 Satisfactory Moderately Satisfactory 0.00
5 06/08/2011 Satisfactory Moderately Satisfactory 0.06
6 01/02/2012 Moderately Satisfactory Satisfactory 4.12
7 11/21/2012 Moderately Unsatisfactory Moderately Unsatisfactory 13.05
8 05/17/2013 Moderately Unsatisfactory Moderately Unsatisfactory 16.60
9 12/08/2013 Moderately Unsatisfactory Moderately Satisfactory 22.44
10 05/24/2014 Moderately Satisfactory Satisfactory 22.44
11 12/18/2014 Moderately Satisfactory Moderately Satisfactory 29.19
12 04/23/2015 Moderately Unsatisfactory Moderately Unsatisfactory 31.36
13 09/13/2015 Moderately Satisfactory Moderately Satisfactory 31.36
14 12/29/2015 Moderately Satisfactory Moderately Satisfactory 31.36** * USD amounts subject to historical exchange rate variations.
** Total disbursement after reconciliation of expenditures at the end of the four month grace period was
USD 30.68 million equivalent.

vi
H. Restructuring (if any)
Restructuring
Date(s)
Board
Approved
PDO Change
ISR Ratings at
Restructuring
Amount
Disbursed at
Restructuring
in USD
millions*
Reason for Restructuring & Key
Changes Made DO IP
05/28/2010 S MU 0.00
Level 2: To amend the legal agreement to reflect a change in implementation moving responsibility from one unit under the auspices of the Ministry of Labor and Social Policy to another under the same ministry. This was needed to reflect the closure of the originally planned implementing agency, the Social Investment Fund, on March 2010.
05/16/2011 N S MS 0.06
Level 2: To reflect modification of the Project Appraisal Document (PAD) and the Project Operational Manual (POM)as follows: (i) to change the requirement in the POM, obligating municipalities to preserve the services under the project from 10 years to 5 years after completion for infrastructure improvements and from 5 years to 3 years after completion for projects that include services only, and (ii) to modify the Accounting of Subprojects section of the POM, to allow advance payments to municipalities for the payment of small service providers only (advances were not previously allowed). This restructuring did not require an amendment to the Loan Agreement.
12/14/2012 N MU MU 13.05
Level 2: To revise the Project’s Results Framework (RF) and reflect the updated RF in a Supplemental Letter and to reallocate a portion of loan proceeds under the category Consultancy Services and Training, Audit of Part II to the category Grants of Part I. The World Bank processed this restructuring without the requested extension of the closing date, which was conditioned on the Government’s provision of sufficient resources for implementation of the outstanding project activities. This condition was not met, and the Government did not countersign the amendment letter.

vii
Restructuring
Date(s)
Board
Approved
PDO Change
ISR Ratings at
Restructuring
Amount
Disbursed at
Restructuring
in USD
millions*
Reason for Restructuring & Key
Changes Made DO IP
09/30/2013 N MU MU 20.62
Level 2: To reflect the: (i) shortening of the implementation period of the services under the Project from the original 18-24 months to about 12 months; (ii) reduction and/or elimination of selected activities not directly related to the achievement of the PDO; (iii) partial cancellation of the loan amount to reflect reduction/elimination of activities, (iv) revision of the Project’s RF and finalization of Supplemental Letter No. 2, and (v) extension of the loan closing date by 23 months, from October 31, 2013 to September 30, 2015.
09/28/2015 MS MS 31.36** Level 2: To extend the loan Closing Date by three months from September 30, 2015 to December 31.2015.
* USD amounts subject to historical exchange rate variations.
** Total disbursement after reconciliation of expenditures at the end of the four month grace period was
USD 30.68 million equivalent.
I. Disbursement Profile
USD amount subject to historical exchange rate variations.

1
1. Project Context, Development Objectives and Design
1.1 Context at Appraisal
1. At the time of Appraisal of the Social Inclusion Project (SIP, the Project), Bulgaria
had made impressive progress towards long-term stability and sustained growth. Stabilization policies and structural reforms had resulted in five to six percent growth from 2000 onwards, inflation had declined from hyperinflation levels, and unemployment had been more than halved. Still, despite rising living standards, Bulgaria labor market participation was low, and the country continued to face deep pockets of poverty and social exclusion. 2. Poverty and exclusion were associated with low levels of education, large household
size and were heavily concentrated among ethnic minorities, in particular Roma. Children from poor households and ethnic minorities received fewer years of schooling, not benefitting from education as a way out of exclusion. The poverty headcount for households where the head had not finished initial education was estimated at 59.2 percent in 2007, compared to 19.3 percent for those with basic education, 3.4 for those with secondary education, and 0.9 percent for those with tertiary education. Yet, children from poor households and ethnic minorities had low educational attainment and high-dropout rates, often linked to insufficient preparation at the time of entering primary school. Investments in early childhood development (ECD) were seen as a means of providing opportunities for social mobility to the excluded by counterbalancing disadvantages created by family background. Starting in the early years, from 0-6, these investments could ensure access to health and education, permitting the most effective leverage to policies aimed at social exclusion, and impacting subsequent educational outcomes in primary and secondary schooling. 3. The Government of Bulgaria (GOB) had approved several strategic documents
acknowledging the key role of pre-primary education in social exclusion and human capital
development, calling for measures to expand preschool education.2 Bulgaria had introduced a compulsory year of preschool in 2003/2004 that had led to an increase in enrollment for children aged 6 to above 85 percent. Nevertheless, 2003 data indicated that there could be substantial underutilization of preschool and kindergarten education among children from poor households, national minorities, in particular Roma, and the population in rural areas, possibly due to economic constraints (kindergartens required co-financing by the parents with rates decided by the municipal councils), geographical distances, insufficient kindergarten places and low parental understanding or motivation. Available data suggested that almost all municipalities (except the highly urbanized ones) had some under-utilized capacity in municipal kindergartens that could be made available to some of the children that were currently not in kindergarten. But, only about two-thirds of all municipalities had sufficient capacity to absorb children aged 3-6 years that were then currently enrolled plus children of parents that received the Guaranteed Minimum Income
2 The then recently approved National Program for the Development of School Education and Preschool Education
and Preparation 2006-2015.

2
(GMI)3. About 80 municipalities (out of 265) were not considered to be able to accommodate additional low income children, and about 30 had deficits of up to 30 places. Activities to promote coordination in kindergarten places at the municipal and sub-municipal levels, together with alternative provision of kindergarten and child care services and the expansion of supply through new kindergartens and child care infrastructure were needed to meet demand, and the SIP was designed to address these. 4. The Project was consistent with the GOB strategic social inclusion agenda, tying together its various elements into an effective, comprehensive and long-term effort to tackle persistent and intergenerational poverty and exclusion. It built upon the GOB’s agenda set forth in: (i) the Joint Inclusion Memorandum 2005; (ii) the National Report on the Strategies for Social Protection and Social Inclusion of the Republic of Bulgaria 2006-2008; (iii) the National Program for the Development of School Education and Preschool Education and Preparation 2006-2015, and (iv) Decade of Roma Inclusion Action Plans. 5. The Rationale for World Bank involvement was strong. Social inclusion of marginalized groups, in particular Roma, and support in absorbing European Social Fund financing were areas where the GOB desired strategic World Bank involvement. The World Bank had partnered with the GOB in addressing social exclusion of Roma through a range of lending and grant facilities, as well as through the Decade of Roma Inclusion Initiative, and the Project would complement several ongoing World Bank-financed operations.4 Further, the Bulgaria Country Partnership Strategy (CPS), considered by the World Bank’s Board of Directors on June 13, 2006, identified three strategic priorities, and the SIP addressed all of these: (i) productivity and employment; (ii) fiscal sustainability and absorption of European Union (EU) funds, and (iii) social inclusion. Bulgaria had acceded to the EU on January 1, 2007, and the Project was considered a strategic instrument for the World Bank to provide initial financing to support the GOB in absorbing European Social Fund financing for social inclusion purposes. At the same time, social inclusion policies were considered a key tool in poverty reduction in Middle Income Countries like Bulgaria, where multiple forms of exclusion explained persistent pockets of poverty. 6. The Project was also fully consistent with, and would support initial financing of, the
Operational Program “Human Resources Development 2007-2013” (the Program), the programming document for the European Social Fund (ESF) for Bulgaria agreed between the
3 Guaranteed Minimum Income (GMI) is the minimum income considered sufficient to satisfy basic needs (i.e. for
staying above the poverty line).For 2016, the guaranteed minimum income (GMI) is BGN 65 per month (approximately USD 40). Targeted or monthly social benefits are paid to people whose income is under or around the minimum. Based on the GMI, differentiated minimum income (DMI) is determined on the basis of the number of family members and the number of people living in one residence. DMI is also linked to the age, family status, health and property of the people concerned.
4 These included the then recently closed Child Welfare Reform Project (CWP) and a Japan Social Development
Fund (JSDF) Grant on Preschool Education for Children in Disadvantaged Communities, for which the SIP would scale up pilot-tested child welfare and social service approaches. The SIP also complemented the following ongoing World Bank-financed operations: (i) the Social Sectors Institutional Reform (SIR) Development Policy Loan series (SIR DPL 1) approved on March 21, 2007; (ii) SIR Development Policy Loan 2, that would be presented to the Board on November 4, 2008, and (iii) the Social Investment and Employment Promotion Project (SIEP) that promoted poverty targeting of community initiatives and social infrastructure.

3
GOB and the European Commission. The SIP aimed to support the design and national rollout of a school readiness program with the strategic use of European Social Fund financing. Within the framework of the Program, the school readiness program would be rolled out across the country in different stages, to ensure fiscal sustainability, facilitate ESF financing and allow for evaluating impact. The school readiness program would be rolled out in three phases: (i) in the first phase the SIP would finance the pilot phase of the program in a number of municipalities that would be selected according to a methodology which would be detailed in the Project’s Operational Manual (POM); (ii) non-selected municipalities would form the control group for testing the impact of interventions and would be able to opt in during the Program’s second stage; and (iii) the full transition to a national-level program would take place in the third stage. The SIP was designed to support the: (i) design of a school readiness program consisting of ESF-eligible municipal projects, and (ii) financing of ESF-eligible projects as well as start-up costs in the first phase of implementation.
1.2 Original Project Development Objectives (PDO) and Key Indicators (as approved)
7. The Project Development Objective (PDO) was to promote social inclusion through increasing the school readiness of children below the age of 7, targeting low-income and marginalized families (including children with a disability and other special needs). 8. Progress towards the Project’s PDO would be measured by the following Outcome Indicators:
• Improvements in school readiness of children from low-income backgrounds and with a disability below the age of 7, measured through improvements in cognitive skills, including: (i) memory, verbal and visual-motor skills development; copying scores (age 3-5); (ii) fluency in Bulgarian (age 5-6); and (iii) achievement test results, including reading tests (age 6-8), and child nutrition in target population (as proxied by anthropometric measures).
9. In addition, the Results Framework in Annex 3 of the Project Appraisal Document (PAD) presented the following indicators to measure progress towards Intermediate Outcomes:
• Improvements in child welfare, measured by improvement in: (i) enrollment of children under age 7 from low income and marginalized households (including children with a disability) in mainstream preschool, kindergarten and child care centers in participating municipalities; (ii) parenting skills (as proxied by frequency and quality of parent-child interaction); and (iii) the number of children having received full set of immunizations; and
• Expansion of coverage of child care services to low income children and children with a disability below the age of 7, measured by increases in: (i) the number of parents having completed parenting skills sessions; (ii) the number of children newly placed into kindergarten or child care facilities through the project interventions (including children with disabilities); (iii) the rate of inflow of children from poor and marginalized families into institutional care; (iv) the number of new child care places created through the Project; and (v) the number of kindergarten and child care facilities staff having received training.
1.3 Revised PDO (as approved by original approving authority) and Key Indicators, and
reasons/justification

4
10. The Project’s Development Objective was not revised. The Project’s Results Framework was revised twice, first in a Level 2 restructuring on December 14, 2012, and later in a subsequent Level 2 restructuring on September 19, 2013 that also removed the impact evaluation to align the Project costs with the Government expenditure ceiling. The removal of the impact evaluation costs meant that most original PDO level indicators depending on impact evaluation surveys would become immeasurable. Therefore, the revision to the Results Framework in the first restructuring was required to: (i) include outcome and intermediate indicators to better capture the outputs and outcomes produced under the interventions supported under Part I and Part II of the Project (Section 1.5); (ii) revise the outcome indicator related to cognitive development and school readiness scores by replacing the original sub-indicators with a single measure of school readiness reflecting the share of vulnerable children under the Project aged 6 passing the school readiness diagnostic test; (iii) drop the outcome indicator related to child nutrition because of methodological constraints, attribution issues (the Project did not finance nutrition interventions), and overly ambitious assumptions for behavioral changes related to nutrition and parenting practices among certain vulnerable communities taking hold during the Project’s lifetime; (iv) replace all intermediate outcome indicators measured through impact evaluation survey-based composite indices with indicators directly measuring project outputs and outcomes; (v) drop intermediate outcome indicators on both children inflow into institutional care and immunizations due to attribution issues, especially since the Project was not to finance vaccines; (vi) drop the intermediate result indicator on national enrollment rate of children from low income and marginalized households due to problems in measurement (lack of routinely collected data on children’s background characteristics that were required for this indicator); and (vii) drop the intermediate outcome indicator measuring the implementation of the Project Impact Evaluation, as it would be replaced by a simplified evaluation of SIP services and measurement of school readiness through the tool used in the baseline impact evaluation. In the December 2012 restructuring the Bank conditioned an extension of the closing date on setting spending ceilings that would allow for project implementation. The Borrower never countersigned the amendment that provided for this restructuring since this condition was only met by late 2013 with the adoption of the State Budget law for 2014. 11. Because of this, on September 19, 2013, the World Bank processed a subsequent
restructuring with revisions to the Results Framework that included those introduced in the December 2012 restructuring (since the amendment letter was never countersigned) and further: (i) extended the target date for achievement of outcomes, intermediate outcomes and outputs to September 30, 2015 to reflect the project extension, and (ii) introduced minor modifications to the targets for one Outcome Indicator and three Intermediate Outcome Indicators to reflect the reduction of the implementation period of the social inclusion services (from the original 18-24 months to 12 months), and the slightly lower cumulative targets that could be achieved in the shorter implementation period.
1.4 Main Beneficiaries
12. At approval, the potential beneficiaries targeted under the Project were defined
broadly as among two main groups. The first group included families who received Guaranteed Minimum Income (GMI). At the end of 2006, the GMI had about 150,000 beneficiaries with about 38,000 children between the ages of zero and six across Bulgaria. The second included

5
families receiving Child Allowance (CA)5. The threshold for CA was more generous and thus included a significant share of population who could not be qualified as vulnerable. This category applied to about 670,000 families, including about 280,000 children under 7 of which 23,000 had a disability. The Project was to target children aged 0-3 and their parents who were CA recipients through the parenting program, and children aged 3-6 and their parents who were GMI recipients through a menu of options for municipalities to enhance access to formal kindergarten or childcare services (Section 1.5). As designed at approval, the Project was to rely on self-targeting by those parents that were in need of the program and its associated benefits. The shortcomings related to the generosity of CA and problems in its use for identifying project beneficiaries and the reliance on self-targeting by vulnerable groups were addressed during project implementation. This was done by introducing detailed criteria for establishing the project beneficiaries based on indicators capturing different types of vulnerabilities (low income, long term unemployment, belonging to underprivileged ethnic minorities, different forms of disabilities, etc.). Details on targeting criteria are presented in Annex 5.
13. Financing for parenting and formal kindergarten and childcare services under the
Project’s Component I would be made available to municipalities, conditional upon their agreement to implement the proposed programs. The exact number or location of municipalities that would participate in each of three planned groups was not determined in advance, although it was expected that about 30 percent of all 265 Bulgarian municipalities would participate in the Group I. Municipalities would: (i) apply for participation in SIP-financed activities; (ii) implement these activities with SIP financing; (iii) apply for European Social Fund (ESF) financing, and (iv) use ESF to finance the activities in a second stage, once SIP financing for their activities came to an end. Project beneficiaries would also include service providers and kindergarten staff who would be provided with training under the Project’s Subcomponent I.4, and staff and social workers at the municipal level who would be provided with training and capacity building under the Project’s Subcomponent II.1.
1.5 Original Components
14. The Project supported the design of the school readiness program and would
integrate municipal, social, education and health service interventions eligible for ESF
financing and contribute towards the start-up financing of activities in a select group of pilot
municipalities. This would be achieved through activities under two main components, as follows: Component I: Integrated social and childcare services (EUR 37.39 million). This component would finance a menu of community subprojects, including services and infrastructure investments from which municipalities could choose according to needs. It included provision of a set of integrated social and childcare services for parents and children from marginalized groups and children with disability. Municipalities would subcontract third sector agencies with contracts involving performance targets and per-capita based remuneration. Component I comprised four Subcomponents, as follows: Subcomponent I.1, Programs for children aged 0-3 and their parents was designed to target parents from the moment of conception, and included parent and family-focused social services
5 The Child Allowance (CA) is a monthly child benefit the eligibility for which depends on family income compared to the GMI and DMI. The child allowance is paid until the child finishes secondary education (maximum age 20).
6
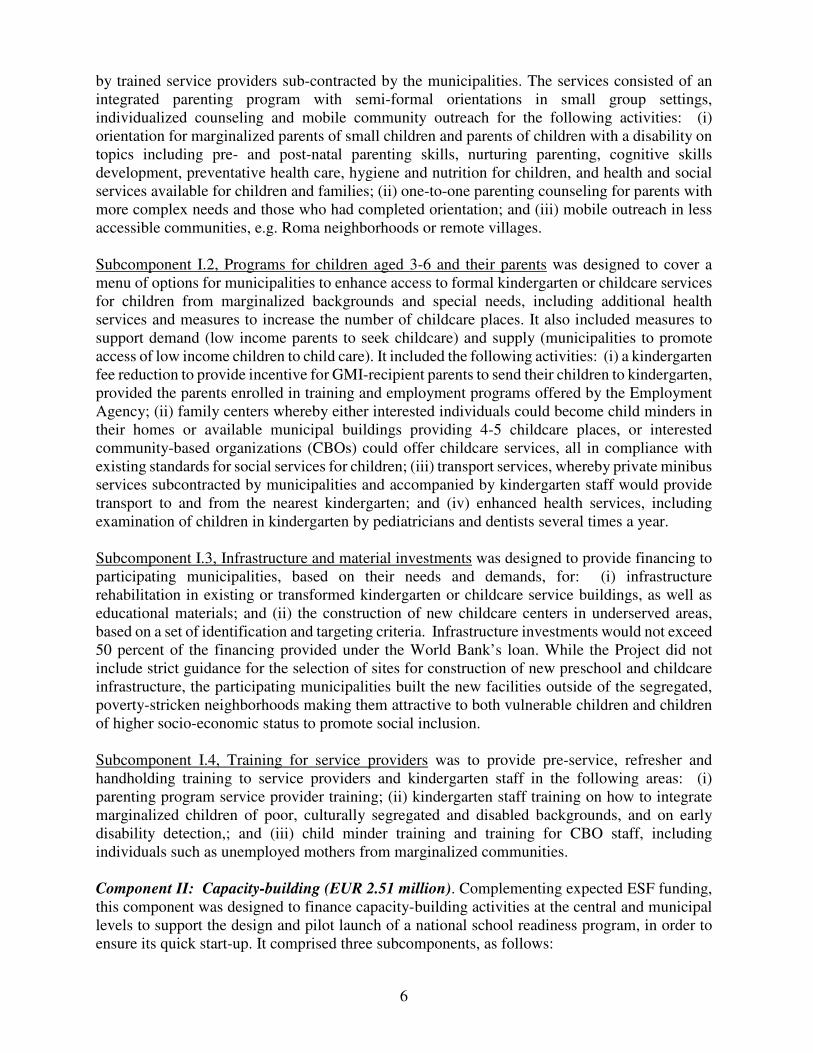
by trained service providers sub-contracted by the municipalities. The services consisted of an integrated parenting program with semi-formal orientations in small group settings, individualized counseling and mobile community outreach for the following activities: (i) orientation for marginalized parents of small children and parents of children with a disability on topics including pre- and post-natal parenting skills, nurturing parenting, cognitive skills development, preventative health care, hygiene and nutrition for children, and health and social services available for children and families; (ii) one-to-one parenting counseling for parents with more complex needs and those who had completed orientation; and (iii) mobile outreach in less accessible communities, e.g. Roma neighborhoods or remote villages. Subcomponent I.2, Programs for children aged 3-6 and their parents was designed to cover a menu of options for municipalities to enhance access to formal kindergarten or childcare services for children from marginalized backgrounds and special needs, including additional health services and measures to increase the number of childcare places. It also included measures to support demand (low income parents to seek childcare) and supply (municipalities to promote access of low income children to child care). It included the following activities: (i) a kindergarten fee reduction to provide incentive for GMI-recipient parents to send their children to kindergarten, provided the parents enrolled in training and employment programs offered by the Employment Agency; (ii) family centers whereby either interested individuals could become child minders in their homes or available municipal buildings providing 4-5 childcare places, or interested community-based organizations (CBOs) could offer childcare services, all in compliance with existing standards for social services for children; (iii) transport services, whereby private minibus services subcontracted by municipalities and accompanied by kindergarten staff would provide transport to and from the nearest kindergarten; and (iv) enhanced health services, including examination of children in kindergarten by pediatricians and dentists several times a year. Subcomponent I.3, Infrastructure and material investments was designed to provide financing to participating municipalities, based on their needs and demands, for: (i) infrastructure rehabilitation in existing or transformed kindergarten or childcare service buildings, as well as educational materials; and (ii) the construction of new childcare centers in underserved areas, based on a set of identification and targeting criteria. Infrastructure investments would not exceed 50 percent of the financing provided under the World Bank’s loan. While the Project did not include strict guidance for the selection of sites for construction of new preschool and childcare infrastructure, the participating municipalities built the new facilities outside of the segregated, poverty-stricken neighborhoods making them attractive to both vulnerable children and children of higher socio-economic status to promote social inclusion. Subcomponent I.4, Training for service providers was to provide pre-service, refresher and handholding training to service providers and kindergarten staff in the following areas: (i) parenting program service provider training; (ii) kindergarten staff training on how to integrate marginalized children of poor, culturally segregated and disabled backgrounds, and on early disability detection,; and (iii) child minder training and training for CBO staff, including individuals such as unemployed mothers from marginalized communities. Component II: Capacity-building (EUR 2.51 million). Complementing expected ESF funding, this component was designed to finance capacity-building activities at the central and municipal levels to support the design and pilot launch of a national school readiness program, in order to ensure its quick start-up. It comprised three subcomponents, as follows:

7
Subcomponent II.1, Local project management capacity building was designed to provide training and capacity building to municipal staff and social workers at the municipal level in the following three major areas: (i) inter-agency work involving cross-sectoral cooperation (education, health, social services and social assistance, including the setting-up of cross-sectoral forums, also with the third sector, and joint agreement of referral maps and responsibilities; (ii) sub-contracting of services to and cooperation with non-governmental organizations (NGOs); and (iii) accessing European Structural and Cohesion Funds to capitalize on opportunities for financing social, employment, health and education service programs complementary to the SIP agenda through ESF and social infrastructure investments through the European Regional Development Fund (ERDF). Subcomponent II.2, Impact evaluation was designed to support the development of a rigorous impact evaluation mechanism to inform program design and report on program effectiveness. The Project would monitor specific outcomes such as parental behavior and identify the impact of the Project’s interventions on a wide range of child well-being measures such as children’s motor, cognitive and language skills, test scores, health services utilization and nutrition, and child nutritional status. The impact evaluation was dropped shortly after completion of the baseline impact evaluation study as part of restructuring (see 1.6, paragraph 15) that aimed and optimizing costs and ensuring the resources for delivery of the core project activity – the delivery of the integrated social and childcare services – could be matched with the significantly reduced spending ceiling imposed by the Government in the wake of the financial and economic crisis. Subcomponent II.3, Audit and implementation support was designed to finance Project and municipal subproject auditing and construction works inspection for municipal subprojects.
1.6 Revised Components
15. The Level 2 project restructuring of September 19, 2013 was intended to match the
project costs with the Government imposed spending ceilings of all externally financed
projects, including the SIP, and adjusted the Project’s components by: (i) shortening the implementation period of SIP services under the Project from the original 18-24 months to about 12 months; (ii) reducing and/or eliminating selected activities not directly related to the achievement of the PDO (as described below); and (iii) partially cancelling EUR 8,608,356 of loan proceeds to reflect the reduction/elimination of activities. The shortening of the implementation period resulted in a reduction in project costs under Category 1 of the Project, “Grants under Part I of the Project”. The following activities were reduced or eliminated, resulting in a further reduction in project costs of both components: (i) under Subcomponent I.4, national information and awareness campaigns, one training and optimized costs for other trainings, resulting in cost savings; (ii) under Subcomponent II.1, cancellation of all envisioned trainings, except a training on the sustainable development of the Project; (iii) under Subcomponent II.2, cancellation of the intermediate and final impact evaluation surveys and the impact evaluation reports; and (iv) under Subcomponent II.3, reduction to reflect the optimized costs for regional coordinators and individual consultants. This restructuring also extended the loan’s Closing Date to September 30, 2015 and introduced changes to the Project’s Results Framework as described in Section 1.3.
1.7 Other significant changes
16. In addition to the changes in the Project’s Results Framework, its scope,
implementation period and funding arrangements described in Sections 1.3 and 1.6, several
other aspects of the Project were reflected in restructurings. The first of these, dated June 10, 2010, was processed to reflect a change in the implementing agency. The Project was originally

8
to be implemented by the Social Investment Fund (SIF), an agency under the Ministry of Labor and Social Policy (MLSP). However, as part of its crisis response and planned cuts in overhead and administration, the GOB closed the SIF in March 2010. The restructuring reflected the Project’s new implementation arrangements, entrusted to the Social Inclusion Directorate of the MLSP. On May 19, 2011 the Project was again restructured to amend the Project Operational Manual (POM) to: (i) reduce the municipal obligation to preserve services under the Project from 10 years to 5 years for subprojects including infrastructure investments and from 5 years to 3 years for subprojects including services only (in response to municipal concerns regarding long commitment periods in their dynamically changing socio-economic and demographic situation), and (ii) allow municipalities to receive advances and pay small suppliers of services (in order to ensure continued, uninterrupted service provision). The December 2012 restructuring (Section 1.3) also reallocated a portion of loan proceeds under the category “Consultancy Services, Training, Audit” of Part II (Capacity Building) to the category “Grants” under Part I (Integrated Social and Childcare Services) of the Project. A final restructuring on September 18, 2015 extended the loan’s Closing Date one final time, from September 30, 2015 to December 31, 2015, resulting in a cumulative extension of 26 months.
2. Key Factors Affecting Implementation and Outcomes
2.1 Project Preparation, Design and Quality at Entry
17. Project preparation and its design responded directly to the Government’s strategic
agenda and incorporated lessons of earlier, related projects. The preparation process was highly participatory, and very long-two and one half years from Project Concept Note to Approval, resulting in a cohesive project. Yet, the preparation process resulted in an overly complex and ambitious monitoring framework, and the assessment of risks during preparation failed to identify the main issues that affected its implementation through completion. 18. The Project responded to the Government’s strategic priorities. The Project was seen to tie together various elements of Bulgaria’s strategic social inclusion agenda into an effective, comprehensive and long-term effort to tackle persistent and intergenerational poverty and exclusion. Designed to ensure equal access to services aiming at prevention of social exclusion and overcoming its consequences, the Project’s activities supported policies set forth in several government strategies, including: (i) the National Report on the Strategies for Social Protection and Social Inclusion of the Republic of Bulgaria 2006-2008; (ii) the National Program for the Development of School Education and Preschool Education and Preparation 2006-2015; and (iii) the Decade of Roma Inclusion Action Plans. The Project was linked to the Human Resources Development Operational Program 2007-2013, the programming framework for the European Social Fund (ESF) for Bulgaria. Experience from the EU8 showed that absorption of EU funds during the first 24 months of membership was slow. As Bulgaria had acceded to the EU on January 1, 2007, the Project would help Bulgaria avoid this type of delay by supporting the development of and providing initial financing for social inclusion programs eligible for subsequent ESF financing. 19. Preparation incorporated lessons of earlier operations, including the then recently closed Child Welfare Reform Project (CWP, P064536) and the two Japan Social Development Fund (JSDF) grants attached to it (Grant TF24743 and Grant TF-54221) that piloted preschool programs for children from marginalized backgrounds. The parenting program approach that was to be supported under the SIP had been successfully piloted under the CWP in a number of sites, providing evidence of the value of sustained engagement of marginalized parents with small

9
children to raise parenting capacities. The JSDF Grants that supported innovative approaches to promoting access to kindergartens and preschools for marginalized groups, confirmed that learning outcomes for children at pre-primary level were most pronounced when parents were also involved in the activities. It also confirmed that pre-primary education for children from marginalized backgrounds involved a long-term process that required a long-term strategy and involvement. Hence, triggering ESF financing was seen as an important element for ensuring sustained focus on activities developed under the Project. 20. The preparation process was highly participatory. At the policy level, the SIP was linked to Bulgaria’s Operational Program Human Resources Development for the European Social Fund financing and agreed with the Government and the European Commission. The Project’s agenda was reflected in the Operational Program “Human Resources Development” 2007-203 that guides the programming of ESF for Bulgaria. The MLSP was (is) the Managing Authority for ESF in Bulgaria, ensuring complementarity of activities and funding sources. At the stakeholder level several rounds of consultations were carried out during preparation among the Project’s potential beneficiaries, including low-income parents from both Roma and non-Roma backgrounds. The preparation team also conducted informal discussions with community-based organizations and childcare service providers under the CWP to obtain feedback. Six separate focus group discussions in three locations across Bulgaria, and interviews held with municipal officials, NGO representatives and kindergarten directors and staff, revealed widespread agreement on the need for priority investments in preschool education and upbringing. Stakeholder consultations also revealed that tackling low enrollment of children from marginalized backgrounds required a multi-pronged approach, since their decision to send their children to school were often impacted negatively by several considerations, including: (i) the availability of someone to provide child care at home; (ii) the rigid routine of six hours in kindergarten; (iii) the cost of attendance; (iv) the fear of their child contracting illnesses; (v) actual and perceived discrimination and; in Sofia, (vi) physical distance and lack of available places. To address these, the Project’s design opted to provide a broad policy mix providing positive incentives for parents’ decision to send their children to kindergarten. 21. The Project’s focus on inclusion was innovative and path-breaking at the time it was
prepared. Addressing issues related to inclusion was at the center of the agendas of the governments in Eastern Europe at the time. But at that point, none of the countries had implemented large-scale projects that tackled the issue front and center by addressing social exclusion through innovative, one-stop-shop early childhood interventions for vulnerable children and their parents. Moreover, well-documented lessons of experience were few, if any. The prospects of EU funding for early childhood, and for inclusion especially, was seen to provide an opportunity for the Project to serve as leverage for Bulgaria to eventually tap EU structural funds for inclusion. Because of this, the focus on impact evaluation of results was considered important not only to substantiate the Project’s investments in Bulgaria, but also to provide evidence of impact for other countries in the Region. 22. In part because of the above, the Project’s monitoring framework was tied almost
entirely to the Project’s impact evaluation, thus making it too complex and ambitious, given
the implementation timeframe and the time required for the project interventions to result
in behavioral changes. Most of the indicators were designed to capture childhood development outcomes resulting from mindset change and significant shifts in parenting practices and perceptions about the role of early childhood education, especially among the vulnerable communities targeted by the Project. Related, the measurement of these indicators depended on

10
data collection from household surveys, and covered mainly PDO level results at the expense of intermediate results that were insufficiently represented. The baseline data was not available at approval (Section 2.3) and World Bank funding for collection of baseline data was not available either. Hence, the baseline data had to be collected with project resources after loan effectiveness. 23. The Project’s risk assessment failed to identify the main risk that surfaced
practically throughout implementation. The assessment considered the risk of the Government not sustaining ownership of and commitment to the school readiness and social inclusion agenda, but failed to identify the possibility that despite its declared commitment, fiscal constraints could come to affect implementation. In hindsight, the preparation team could well have considered this issue, as it had already impacted the preparation schedule--after Appraisal in February 2007, loan negotiations were delayed until September, 2008 at the request of the Government due to issues with fiscal programming of the Project that may have been due to the Government’s desire for a larger than planned share of expenditures for infrastructure, since ESF funding could not cover such investments. In any event, the risk of funding constraints, along with corresponding mitigation measures should have been identified during preparation.
2.2 Implementation
24. The EUR 40 million loan for the Project was approved by the World Bank’s Board of Directors on November 4, 2008 and declared effective on April 16, 2009. This was a particularly difficult period for Bulgaria, and several inter-related factors affected the Project’s implementation, especially in its early years, as described below. 25. The global financial crisis of 2008-2009 had a negative impact on Bulgaria that
directly affected the Project in several ways. After a decade of sustained growth, Bulgaria entered into deep recession with GDP declining by 4.9 percent in 2009. The fiscal tightening that was put in place to contain the budget deficit involved cuts in central government and municipal spending, a freeze on pension and wages, and a continued optimization of public administration. As a result of these, project start-up activities proceeded very slowly and implementation had to adjust with the significantly lower spending ceilings set for the Project. The Government proposed to Parliament in December 2009 to close the Social Investment Fund (SIF), the Project’s Implementing Agency, as part of its crisis response and planned cuts in overhead and administration. The SIF was officially closed in March 2010, and in June 2010 the World Bank approved a restructuring that transferred project administration to the Social Inclusion Directorate (SID) at the Ministry of Labor and Social Protection (MLSP). The SIF had been an autonomous unit reporting to the MLSP, and key staff responsible for project management was transferred to the SID. Nevertheless, this modification, together with issues that were addressed in the May 2011 restructuring (Section 1.7) resulted in an initial implementation delay of about two years, which shortened by about half the time available for implementation of core project activities, including the integrated social and childcare services. 26. By mid-2011, two years after approval, the MLSP had applied a transparent
consultative process to design eligibility criteria for subprojects, carried out an information campaign with municipalities, invited them to submit subproject proposals, worked with them to finalize their subproject proposals, and provided training for preparation of their procurement plans. As of May 2011, 63 subproject proposals had been approved (out of 106 initially submitted by municipalities), amounting to about EUR 33 million, or about 82 percent of the total loan commitment. In carrying out this process, the MLSP and the World Bank identified issues with respect to the number of years that a municipality would be required to maintain the services

11
under the Project that resulted in a second project restructuring in May 2011 (Section 1.7). Nevertheless, subproject agreements were signed, tender procedures for construction/rehabilitation works had begun or been completed, and the MLSP had begun selecting trainers for service providers. Likewise, the contract for the project Management Information System (MIS) had been awarded, and the system was completed in November 2011; other project activities were well underway, albeit all with a delay. 27. With a compressed implementation schedule, the Project required increased
spending levels over the remaining implementation period to implement the same activities
in a shorter time frame. However, adhering to a tight fiscal stance, the Government began to limit the externally financed projects’ spending ceilings, including the SIP, in part to promote greater efficiency of spending across the government sectors6. For 2012, the Ministry of Finance (MOF) had approved only one-third of the Project’s expenditure estimates. By mid-year, the Project had already reached its yearly spending limit, and as a result, project activities were put on hold. The MOF was unable at the time to align the Project’s increased spending requirements with corresponding increases its annual budget expenditure limits, despite formal requests made by the MLSP. 28. The Project’s Mid-term Review (MTR) was carried out from June 16-22, 2012. At the time, infrastructure investments that were to precede the actual provision of integrated social services were either under way or completed, but the actual delivery of services had yet to start. The Project had contemplated delivery of services for 12 to 18 months in order for them to be effective and their outcomes adequately measured. Given implementation delays, however, the MTR used the opportunity to review implementation and agree upon a comprehensive project restructuring strategy. It concluded that, despite delays, it was still possible for the Project to achieve its PDO, but that would depend upon the provision of sufficient financing for the activities within a timeline that allowed a full implementation cycle of the integrated social inclusion services. Although the Project was implementing well, both Implementation Progress and PDO ratings were downgraded to Moderately Unsatisfactory, mostly due to budget limits that curtailed the activities that could be implemented with available funding and within the remaining implementation period. Still, based on the discussions and findings of the MTR, it proposed a project restructuring that would: (i) extend the Closing Date by 20 months; (ii) revise the indicators in the Results Framework; and (iii) reallocate loan proceeds among categories. The World Bank approved this restructuring, with the exception of the Closing Date extension, in December 2012 (Sections 1.3 and 1.7) and agreed to consider the Closing Date extension once an adequate expenditure limit for the Project was allocated in the 2013 State Budget Act, as approved by the National Assembly. 29. Funding constraints continued to impact the Project throughout implementation. By early 2013, the Government had been unable to ensure the resources required for project implementation over the requested extension period by increasing the spending limits for 2012 and 2013. In the first quarter of 2013 the MLSP was making impressive progress in front-loading project implementation within the allocated expenditure limits (spending almost 40 percent of its annual spending limit by end-March). But, it was becoming increasingly clear that without guaranteed funding and a Closing Date extension, only the construction works could be completed
6 The Government of Bulgaria provides a “limit” for external and counterpart financing to each ministry.

12
by the October 31, 2013 Closing Date—delivery of integrated social inclusion services could not begin before then. The accomplishment of the PDO was only considered possible through provision of adequate financing within a time frame that would allow: (i) implementation of the SIP’s integrated social inclusion services, and (ii) its transition to EU-funded financing through the Operational Program “Development of Human Resources” (OPDHR) that would become available in the 2014-2020 programming period. Amid continuous changes in government administrations (Bulgaria had five governments over 2013-2014), the World Bank team encouraged the MLSP to consider the possibility of re-planning SIP activities with a possible Closing Date extension of up to 23 months while reducing the Project’s spending needs and carrying out a careful review of project activities to identify room for optimizing these needs. The outcome of this exercise was reflected in the September 2013 project restructuring (Sections 1.3 and 1.6) that involved a further revision to the Project’s Results Framework (mainly extending the dates by which targets would be achieved and replacing the planned Impact Evaluation with a well-designed evaluation of SIP services), a revision of the scope of activities under both parts of the Project, and a 23 month Closing Date extension that would accommodate a 12 month implementation period of the social inclusion services and their monitoring and evaluation. The restructuring aligned the Project’s spending needs with the expenditure limits in the Government’s mid-term budget framework and the officially adopted 2013 State Budget Act. 30. By April 2014, implementation was on track, based on the agreements in the latest
restructuring. The Government had approved a spending limit consistent with the reprogramming of project activities, construction and civil works had been completed in all but one municipality, furniture and technical equipment for the kindergartens had been procured and delivered, more than 1,800 new kindergarten places had been created (greatly exceeding targets), and about 1,100 children were enrolled in project kindergartens and crèches at the beginning of the 2013/2014 school year. It was clear that the Project was likely to achieve its PDO, and its PDO rating was upgraded to Moderately Satisfactory. Further upgrading to Satisfactory would be considered when: (i) the monitoring of local compliance with the 30 percent enrollment quota for vulnerable children 7 proved that Roma children were adequately represented in project facilities, and (ii) the EU-funded operational programs were finalized and ensured the sustainability of the SIP services. 31. While lingering concerns remained about the Project’s budget spending limit, the
Project confronted yet another problem as municipalities began more than 1,200 tender
procedures for the selection of specialists to deliver SIP services. Project municipalities were experiencing major difficulties in hiring qualified personnel for implementation of SIP services, due to a severe shortage of specialists (medical doctors, speech therapists, legal counselors, social workers, etc.) in the labor market, especially since most of the qualified professionals were already employed as public servants by the major public service delivery units. The World Bank team helped identify a solution that required amendment of the Project’s OM to allow for contracting of specialists by considering incremental operating costs as an eligible expenditure
7 The enrollment quota of 30 percent was established through a consultative process involving all concerned ministries, agencies and local governments that sought to reflect the experience and lessons learned from past projects and interventions for integrating vulnerable children into mainstream kindergartens and schools. In order to ensure social inclusion (as opposed to establishing segregated kindergartens with only vulnerable children enrolled) and to provide sufficient exposure of vulnerable children to peer effects from children with better socio-economic background, the quota of 30 percent of vulnerable children per kindergarten group and across kindergartens was established.

13
category under grants to SIP municipalities, and communicated it formally to the Government in a letter dated February 13, 2015. Unfortunately, the delays in contracting staff for SIP services occurred in 2014, just when the Project had been allocated a budget ceiling that would allow full implementation of service delivery. The significant un-utilized resources that accrued at end-2014 were transferred to project municipalities as advance payments for implementation in calendar 2015. 32. The Project’s PDO rating was again downgraded to Moderately Unsatisfactory as on January 16, 2015 the Government approved a budget decree not allowing any spending under the Project, potentially jeopardizing the carrying out of the Project’s evaluation and service delivery. With a zero spending ceiling for 2015, the advance payments that had been made to municipalities in 2014 became the sole source of funding for service delivery and provided for sustaining only about six months’ delivery of SIP services. In the end, to free up additional resources for service delivery, the World Bank supported the Government’s evaluation efforts by hiring a polling agency to process the children’s school readiness scores, conduct the required data analysis, and carry out random spot check to observe the test administration process. As the transfer of SIP project financing to the EU-funded Operational Program “Development of the Human Resources” (OPDHR) was expected to become available in the beginning of 2016, the World Bank agreed to a final three month Closing Date extension to December 31, 2015 in order to allow additional time for utilization of loan funding (including the amounts advanced to municipalities) and minimize the Project’s funding gap. 33. There were fifteen World Bank review and implementation support visits, including a Project Launch Workshop, the MTR and a final visit for preparation of this Implementation Completion Report. The World Bank’s Task Management changed twice during implementation. All Task Managers were Country-Office based, and provided continuous on-the-ground implementation support to the SID.
2.3 Monitoring and Evaluation (M&E) Design, Implementation and Utilization.
34. M&E Design. Monitoring and Evaluation was to be an integral part of the Project’s design and management. This was especially important since the Project would support interventions in pilot municipalities before a complete rollout to the entire country, financed by the EU-funded Operational Program “Development of the Human Resources” (OPDHR). An impact evaluation, that was to be financed under the Project’s Component II (together with required capacity building for monitoring and evaluation) was to provide a rigorous assessment of the casual impact of the Project’s different interventions on specific short-term and intermediate outcomes, as set out in the Results Framework that contained a small set of output, intermediate outcome and outcome indicators for the Project. The results of the impact evaluation could then be used effectively as a managing-by-results tool to modify the SIP’s design and improve its effectiveness over time, as the rollout progressed. The Project Appraisal Document described this impact evaluation as being one of the first exercises of its kind to be conducted in the new EU Member States and in transition countries, highlighting that it would be beneficial not only to project-related policymakers, but to others that might be considering this approach in different contexts. As the impact evaluation was to be financed by the Project, baseline data (that relied heavily on surveys) could only be carried out after loan effectiveness. As a result, during loan negotiations an agreement was reached that the Supplemental Letter containing the Project’s Result Framework would be delayed until baseline data became available. Follow-up surveys were to be conducted during years two and four of implementation.

14
35. M&E Implementation and Utilization. Due to delays in implementation (Section 2.2), the Baseline Impact Evaluation Study was only completed in May 2012. With this, and based on the findings of the MTR (Section 2.2) the World Bank approved the December 2012 project restructuring that introduced revisions to the Results Framework (Section 1.3), and included the baseline data that had by then been collected. The restructuring did not include a Closing Date extension, however, but included as a condition that the Government commit to allocate sufficient funds for the Project by end-2012, as well as for the years to follow until closing. The Borrower never countersigned the amendment to the Loan Agreement required as a result of the December 2012 restructuring and therefore the September 2013 project restructuring included again the revisions to the Results Framework approved in December 2012, and introduced a few additional, minor adjustments to the indicators (Section 1.3).
36. As mentioned in Section 1.3, the Project’s original Results Framework presented
several issues. Most of the indicators depended on data from impact evaluation surveys, and covered mainly PDO level results at the expense of intermediate results that were insufficiently represented. It included indicators that: (i) relied extensively on survey-based composite indices (e.g., indicator related to parenting skills); (ii) presented methodological problems to measure (e.g., the indicator related to multiple cognitive development and school readiness assessments); (iii) required data that was not routinely collected (e.g., the indicator on national enrollment rate of children from low income and marginalized households); (iv) presented issues of attribution to the Project (e.g., indicators related to children’s inflow into institutional care, nutrition and immunizations); and (v) involved methodological constraints, low reliability of measurement and limited country relevance (e.g., indicator related to child nutrition). As a result, the Project’s Implementation Status and Results Reports only began providing routinely updated monitoring data on the Project’s progress, utilizing the Project-financed MIS, after the December 2012 project restructuring that revised its Results Framework to one that included more reasonable and reliable indicators. The Project’s results as reflected in the monitoring data (especially the impact of some of the services on early childhood education outcomes as measured by the school readiness diagnostic test—see below), have allowed the MLSP to make the case for and develop and launch an operation under the EU-funded 2014-2020 Human Resources Development Operational Program, aimed at continuing the provision of services for early childhood development created by the SIP.
37. The full-fledged impact evaluation was not implemented due to budget ceiling
constraints (it was eliminated from the Project in the September 2013 restructuring). Instead, the MLSP organized the administration of school readiness diagnostic tests administered by project municipalities from mid-June to mid-July 20158. The World Bank contracted consultants to: (i) validate the process of conducting the tests by observing it in up to 10 percent of testing
8 The test for 6-8 year olds was designed to measure whether a child met criteria for school readiness, on a three
point scale, including the ability to: (i) ask questions and maintain conversation; (ii) make a story based on a picture; (iii) use compound and complex sentences; (iv) identify practically present, past and future tenses; (v) use words and phrases, taking into account the context; (vi) recognize and form singular and plural nouns; (vii) determine the sound at the beginning of a word; (viii) count form 1 to 10 in ascending and descending order; (ix) establish equality and inequality of multitudes/sets; (x) recognize and name the signs for quantitative relations and mathematical operations addition and subtraction; (xi) understand relationships more, less and equal; (xii) group, compare and arrange objects according to a certain sign; (xiii) reproduce curved line or elements according to a given pattern; (xiv) fulfill thematic expression for drawing, appliquéing and molding; and (xv) know the basic expressions for drawing molding and appliquéing: composition, color, shape and spatial location.

15
sites, selected randomly; (ii) conduct logical and cross-check initial reviews of all conducted tests; and (iii) process and analyze the data from the tests. Although the consultants identified some issues in their review (and eliminated tests presenting identified issues from the final sample), the testing met the compliance criteria in most of the locations that were analyzed and 757 tests were considered eligible for purposes of comparing data “before” and “after” SIP implementation.
2.4 Safeguard and Fiduciary Compliance
38. Environment and Social Safeguards. The activities supported by the Project were expected to have minimal or no environmental risks. Hence, the Project was categorized as “Financial Intermediary - FI” with potential Category C and B subprojects. Local environmental requirements were considered adequate, and where required by local legislation, local experts licensed by the Ministry of Environment and Waters (MEW) would carry out environmental assessments of activities involving construction that would later be reviewed by the Supreme Expert Environmental Council. Guidelines for environmental analysis of subprojects were developed and included in the Project’s Operational Manual, and included, inter alia, a questionnaire for environmental screening of activities under subprojects. The Project’s compliance was rated satisfactory throughout implementation. At the time of the MTR, the World Bank hired two consultants specialized in construction standards to check the quality of works and compliance with environmental, safety-at-work and other applicable standards at ten selected sites where construction had started from the ground up. Overall, the quality of works was found to be good, and local construction and safety standards had been observed. However, some procedural issues were noted at several of the sites with regard to environmental prescreening. According to local legislation, municipalities need to request a “review of the need for an environmental impact assessment” from the regional environmental authorities before works commence. The consultants found that for at least four of the ten sites this review had not been requested, and that for another two sites the review had been requested after works were initiated. To address this issue, the World Bank requested the MLSP to: (i) conduct a review of the documentation related to environmental assessments/reviews and clearances at all sites where new buildings were constructed and provide evidence that these were in order; (ii) hire environmental consultants to oversee the construction sites and provide bi-monthly supervision reports; and (iii) address the concerns identified in the sites visited during the MTR, liaising as needed with relevant national institutions (e.g., MEW) to seek assistance in reviewing the situation and setting a procedure for the future. The procedural issues related to the four sites that were identified in the MTR were addressed satisfactorily, and the review of all other subprojects involving new construction were found to be in full compliance with local environmental legislation.
39. Financial Management. Financial management (FM) remained satisfactory throughout the life of the Project. The Project maintained high fiduciary standards—the FM arrangements were satisfactory and adequate control and procedures were in place throughout. All interim financial reports and annual project audits were received on time, with clean opinions and no internal control issues. The MTR carried out a detailed review of FM arrangements reviewing: project accounting and reporting arrangements, staffing, internal control procedures, planning and budgeting, counterpart funding, financial manual and audits. It concluded that the Project’s FM arrangements were satisfactory, and that adequate controls were in place. However, the Project’s counterpart funding ratings were generally unsatisfactory starting in 2012, reflecting the continuous underfunding of its expenditure ceilings that plagued the Project after this time.
16
40. Procurement. Procurement remained either satisfactory or moderately satisfactory throughout the life of the Project. On the occasions that procurement was rated moderately satisfactory, it reflected slow implementation of the procurement plans and modest progress resulting from the spending limits imposed on the project in 2012 and 2013, especially. Throughout, the project team in MLSP provided efficient assistance to municipalities to conduct civil works and equipment procurement. Further, to streamline and promote efficiency in procurement of vehicles, furniture and equipment, the SID packaged items and procured centrally large packages under International Competitive Bidding procedures. The MTR carried out a procurement post review and determined that the procurement process had been followed properly, with procurement documents filed properly and retained. It noted, however, that the limited budget allocation had resulted in the postponement of some selection procedures, and worked with the MLSP to prepare a revised and updated procurement plan, taking into account the eventual extension agreed as part of the project restructuring.
2.5 Post-completion Operation/Next Phase
41. Continuity to services supported by the Project will be financed under the EU-
funded “Early Childhood Development Services” that will provide resources for SIP
services in Project-financed municipalities. The EU project, in the amount of EUR 15,338,756 was approved in 2015, and will provide funding through December 31, 2018. In addition, as provided in the Operational Manual and reflected in financing agreements, municipalities have committed to preserve services under the Project for 5 years for subprojects including infrastructure investments and for 3 years for subprojects including services only.
3. Assessment of Outcomes
3.1 Relevance of Objectives, Design and Implementation
42. Objectives. The Project’s objectives were relevant when it was approved, and remain highly relevant to this day. After witnessing historically high growth rates and significant gains in poverty reduction between 2000 and 2008, Bulgaria’s growth since 2008 has remained sluggish, poverty has been on the rise and income gains of the bottom 40 have been weak. Progress in increasing the income of the bottom 40 percent has been limited by their lack of human capital, employability and financial assets. The human capital of the bottom 40 percent of the Bulgarian population suffers because their education attainment is less than that of the bottom 40 percent in any of the regional comparators. The Roma are much more likely to be unemployed than ethnic Bulgarians, in part due to lower average educational attainment. Inequality of education in Bulgaria starts early, with too few children from poor families enrolled in early childhood programs. Despite recent reforms that made preschool education compulsory for all children aged 5 and 6, the most vulnerable groups are still largely excluded. PISA 2012 results for Bulgaria show promising results for children attending at least a 2-year preprimary education program: PISA Math scores increased by an average of 7 points relative to children attending a 1-year program or none at all. The effects were greatest for children of low socioeconomic status (10 points on average) and students like Roma who speak a different language at home (19 points). The Project’s objective, therefore, is fully consistent with the second policy area identified in the Systemic Country Diagnostic (SCD) Bulgaria’s Potential for Sustainable Growth and Shared Prosperity: boosting skills and employability of all Bulgarians. Specifically the SCD recommends under this policy area the need to support policies that will “expand early childhood development programs to improve schooling outcomes, which is especially critical for the poor.” 43. The Project’s objectives are also embedded in Bulgaria’s national strategies that

17
promote ECD with a focus on vulnerable groups. The National Strategy for Reducing the Share of Early Drop Outs 2013-2020 includes actions addressing linguistic and ethnic minorities and children of poor households and includes actions to increase exposure to mainstream ECD for vulnerable children of preschool age. The National Strategy for Promotion of Literacy 2014-2020 includes actions targeting specifically children aged 3-7, with supporting interventions to incentivize early literacy among linguistic minorities. The National Strategy for Educational Integration of Children and Students from Ethnic Minorities 2015-2020 provides detailed account of specific educational interventions aimed at increasing attendance rates and learning outcomes of children and students belonging to linguistic and ethnic minorities, with special focus on Roma. Finally, the National Child Development Strategy 2008-2018 provides the strategic framework for child development in Bulgaria including nutrition, maternal health, child health and development, parenting, deinstitutionalization, and combating child poverty.
44. Based on the above, financing for the implementation of the interventions and
policies envisaged in the Government’s strategies is planned for the period 2014-2020
through the EU funded operational programs, including: (i) Operational Program Human Resource Development – includes the operation that continues SIP services through December 2018, as well as inclusive ECD interventions included in the National Child Development Strategy; (ii) Operational Program Science and Education for Smart Growth that includes operations with interventions envisaged in the first three government strategies listed above; and (iii) Operational Program Regional Development that supports investments in ECD infrastructure. All of the above EU-funded operational programs were developed and enforced in line with the Europe 2020 targets and the specific recommendations of the European Commission for Bulgaria. 45. Design and Implementation. The relevance of the Project’s design was also high, and appropriate for accomplishing its objective within the Bulgarian context and institutional framework. The PDO was appropriate in its focus on social inclusion, inter alia, by targeting low-income and marginalized families (but not excluding others). The Government ensured enrollments of vulnerable children, including Roma, in adherence to the 30 percent enrollment quota for children from these groups. The early restructurings (i.e., change in implementing agency, modifications to the municipal responsibilities for maintaining project investments) ensured continued relevance of the Project’s design. Although the original Results Framework was overly ambitious, the later restructurings modified it to better align the indicators so that its progress would be measurable, routinely monitorable and limited to outputs, intermediate outcomes, and outcomes that could be attributable directly to the Project. 46. The relevance of the Project’s implementation was high, despite continuous budget
ceiling constraints that were due to exogenous factors precipitated by the 2008 global
financial crisis and its impact on Bulgaria’s macroeconomic reality. While facing repeated challenges with budget constraints, especially starting in 2012 onwards, the MLSP, municipalities and the World Bank’s implementation support team worked together to find constructive approaches, including through the project restructurings, to streamline activities and implementation to ensure that those activities needed to achieve the Project’s PDO would be funded in amounts needed for their completion. The adjustments to the Project’s scope and scale ensured that the Project matched the Government’s fiscal projections and projected annual budget ceilings. Continuity in funding to the SIP program in project municipalities by the EU (Section 2.5) provides a further indication of the relevance of the Project’s design and implementation.
3.2 Achievement of Project Development Objectives

18
47. The Project Development Objective was to promote social inclusion through
increasing the school readiness of children below the age of 7, targeting low-income and
marginalized families (including children with a disability and other special needs). This section evaluates the Project’s outcomes and intermediate outcomes against the Results Framework that was adjusted in December 20129 and again in September 2013. (Monitoring data is not available to evaluate performance against the Results Framework in the PAD.) Progress towards the PDO was to be measured against four outcome indicators, all of which were overachieved. Based on the achievements described below in this Section, efficacy is rated Substantial. The Project was successful in developing a model for the delivery of integrated services targeting vulnerable children at the earliest age, and also, successfully leveraged World Bank financing to improve absorption of EU funds. Detailed information on project outputs is presented in Annex 2. 48. Increasing the school readiness of children below the age of 6 was to be measured by
the share of vulnerable children aged 6 who pass the school readiness diagnostic test. (A description of the methodology used to measure progress on the School Readiness Test (SRT) is provided in Annex 5.) Although the project impact evaluation was dropped through the partial cancellation included in the September 2013 restructuring, the 2012 baseline measurement of the main PDO indicator (the school readiness passing rate among vulnerable children in project municipalities) was used as a baseline for the indicator. The same SRT was administered in 2015 to the 897 vulnerable children aged 6 who benefited from two years of mainstream, non-segregated kindergarten programs under the SIP. These children were enrolled in kindergartens or in preschool preparatory groups attached to primary schools, and most of them benefitted from the SIP supported remedial education groups established as “summer preschools”. This measurement allowed for a comparison between the passing rates before and after project implementation. During the two measurements (2012 and 2015), the vulnerable children were also mapped according to the size of the municipality in which they live (small or large), allowing for further nuancing of the test results. Out of the 897 tests, 757 were found to be compliant with the testing procedures, while the remaining 140 tests were eliminated from the analysis of the results due to issues with the testing procedure. The results from the SRT concluded that there was a noticeable improvement in performance: 80 percent of the vulnerable children supported by the SIP passed the SRT in 2015, against 47 percent before the project interventions in 2012. There was a statistically significant difference in the scores for overall performance of children from large municipalities (i.e., regional and municipal centers, towns with greater than 35,000 inhabitants), compared to those from small ones: 84 percent of the vulnerable children from large municipalities passed the SRT against 74 percent from small municipalities. The analysis found a statistically significant increase in the score of aggregated indicators of performance, including: (i) use of compound and complex compound sentences; (ii) understanding the meaning of words; (iii) practically distinguishing present, past and future tenses; (iv) reproducing by memory words and sentences; and (v) logical and associative thinking, making interrelations. Most notably, there was a statistically significant improvement in the ability to speak the Bulgarian language—an important indicator for the level of school readiness of children from vulnerable groups. In 2012, 86 percent of children answered tests in Bulgarian, while 15 percent could speak only either Romani or Turkish. In 2015, 99.8 percent of all vulnerable children were able to speak Bulgarian
9 Although the amendment to the Loan Agreement to reflect the December 2012 project restructuring was never
countersigned by the Government, the restructuring was approved by the World Bank on December 14, 2012 and this date therefore is used for purposes of evaluating the Project’s outcomes as a restructured project.
19
during the testing. This is an important indicator of the Project’s progress towards promoting social inclusion. 49. Promoting social inclusion (together with the improvements in school readiness) was
achieved (as defined by key indicators) through the implementation of subprojects in 66
municipalities. The Project helped address early childhood education infrastructure shortages and the need to strengthen the quality, scope and inclusiveness of these services by building new kindergartens and community centers to support the implementation of the Project’s concept—combining existing kindergarten and early childhood education services with a set of cross-sectoral child care and social inclusion services (such as health and nutrition interventions, improving parenting skills, early intervention of children with disabilities, remedial programs and cognitive stimulation for children from linguistic minority groups and from households living in poverty and deprivation, such as Roma children). Municipalities prepared and submitted subproject proposals by selecting services from a broader menu, thereby providing a mix of services that responded to their local context. The key services elected by most municipalities were included in the Project’s Results Framework. Through implementation of these subprojects, 2,357 new places were opened in kindergartens and preschool education groups (against an end target of 1,600), 4,420 children aged 3-7 were enrolled in kindergartens and preschool groups (against an end target of 3,000), 471 children with disabilities and other special needs enrolled in mainstream kindergartens and preschool groups (against an end target of 150), and 4,311 children benefitted from the “Early Intervention of Disabilities” service (against an end target of 1,500). The effective community mediators’ work and the “one-stop-shop” design of the integrated social and child care services generated spillover effects and stimulated the demand for all services, resulting in overachievement of the intermediate outcome indicators measuring the number of the individual service beneficiaries. A description of the targeting mechanism applied under the Project to ensure it reached intended beneficiaries is included in Annex 5. 50. A total of 113 facilities were newly created for the delivery of integrated social
inclusion services (against an end target of 68), and 12,964 parents of children aged 0-3
received parenting skills counseling (against an end target of 10,000). A total of 39,993 children aged 0-7 benefitted from “Health Consultation” services (against an end target of 10,000). Training of kindergarten and crèches staff was not carried out under the Project to avoid duplication with an EU-funded project for ECD disability and developmental screening of children implemented by the Ministry of Education and Science. Under that EU-funded project, 1,100 staff was trained, including pre-school educators, resource teachers, psychologists and speech therapists for 25 pilot kindergartens and 85 primary schools (against the Project’s end target of 700 educators). This training program is continuing through the new EU-funded Operational Program, Education and Science for Smart Growth 2014-2020. 51. The above results were achieved in a relatively short time period10, in which the
newly opened kindergartens under the Project began providing education services to
children, of which 30 percent came from vulnerable families. This allowed those children to be exposed to mainstream ECD for about two years before the supplemental SIP services were introduced. The results obtained based solely on the provision of kindergarten services were impressive. Had the social inclusion services also been operating for the same period, so that more
10 Two years of early childhood education services to vulnerable children and between 6 and 8 months of complementary social inclusion services

20
children aged one to three had been able to benefit from SIP services thereby improving their development potential by the time they entered kindergarten, no doubt outcomes would have been even more impressive. 52. Another objective of the Project, mentioned in the PAD but not incorporated in the
Project’s original results framework was that of strengthening of prospects for absorption
of EU financing. This was achieved through several activities implemented under the Project’s Component II. A total of 120 municipal staff (against an end target of 120), from the 66 municipalities, were trained in public procurement rules and procedures, an MIS was developed and operationalized for the Project, and 144 municipal staff received training in project reporting and monitoring and evaluation (against an end target of 120). The skills acquired by these staff will strengthen their capacity to continue to deliver SIP services under the follow-on EU-funded project. As of January 29, 2016 (the deadline for submission of proposals), 63 of 66 SIP-supported municipalities had submitted to the MLSP proposals for continued funding under the Operational Program Services for Early Childhood Development. Two additional municipalities requested an extension of the deadline and have since submitted their proposals.
3.3 Efficiency
53. The Project’s economic analysis presented in the Project Appraisal Document was
based largely on the assumptions of a nationwide program and impacts to GMI and CA
beneficiaries. Information on the Project’s beneficiaries, categorized as GMI and CA beneficiaries is not available since actual targeting was made on a much broader set of criteria capturing different forms of vulnerabilities; therefore, an ex-post economic analysis following the model in the PAD has not been prepared. Rather, efficiency is evaluated based on the high overall returns to ECD, and especially to ECD programs targeted at minorities, the added value of vulnerable children’s exposure to the peer effects from children of higher socio-economic status, the positive impact of ECD on the performance of vulnerable students in Bulgaria in primary and secondary education (as evidenced from the latest PISA 2012 analysis for Bulgaria), the prospects for higher earnings linked to the improved educational attainment, the unit costs of construction of kindergartens and centers for SIP services, and the efficiency in implementation.
54. Returns to ECD. Investments in ECD yield higher economic returns as a preventive measure as compared to remedial services later. Long-term cost/benefit ratios can be as high as 1 to 17 and returns to investment are greatest for the poorest and more vulnerable children. Returns on investment to ECD can be as high as 16 percent—much higher than rates of return from other levels of education. Early interventions promote better school outcomes in later stages, reduce crime and increase productivity in the workforce. Further, return to early investments are higher to the vulnerable where parenting resources are often poor (Heckman, 2008). The Project targeted specifically vulnerable children, and therefore, it can be assumed safely that the returns are high. Further, PISA 2012 analysis showing that for linguistic minorities such as Turks and Roma one extra year of ECD/kindergarten attendance results in secondary education knowledge/performance gains equivalent to half a year of additional schooling. As the kindergartens were opened earlier in project implementation than the services, the impact on the children enrolled is expected to be significant. Based on the assumptions presented in Annex 3, the final individual life discounted benefits for a vulnerable child that was ready for school because of the Project are in the amount of BGN 1,597 per child. Aggregating the benefits to 20 years’ life of the SIP investments for the 717 vulnerable children that passed the school readiness test, the total gains reach BGN 23 million, and total costs stand at BGN 10.6 million. Thus, the benefit-to-cost ratio for the Project is 2.15.
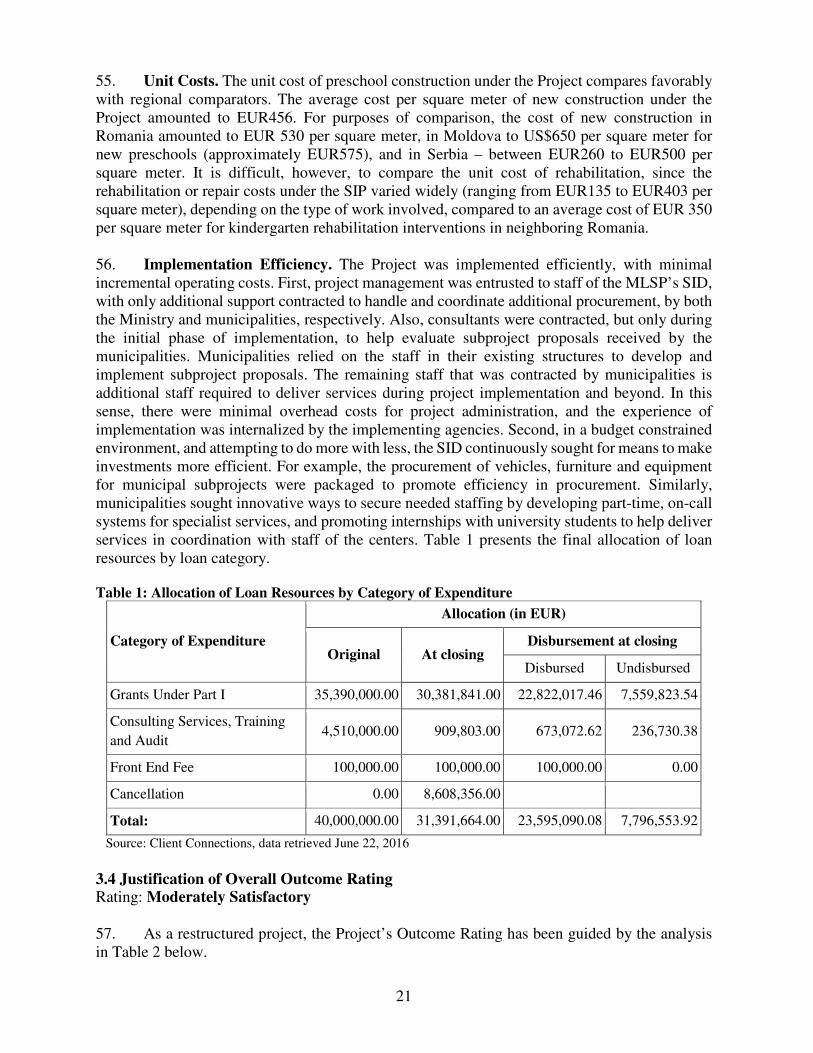
21
55. Unit Costs. The unit cost of preschool construction under the Project compares favorably with regional comparators. The average cost per square meter of new construction under the Project amounted to EUR456. For purposes of comparison, the cost of new construction in Romania amounted to EUR 530 per square meter, in Moldova to US$650 per square meter for new preschools (approximately EUR575), and in Serbia – between EUR260 to EUR500 per square meter. It is difficult, however, to compare the unit cost of rehabilitation, since the rehabilitation or repair costs under the SIP varied widely (ranging from EUR135 to EUR403 per square meter), depending on the type of work involved, compared to an average cost of EUR 350 per square meter for kindergarten rehabilitation interventions in neighboring Romania.
56. Implementation Efficiency. The Project was implemented efficiently, with minimal incremental operating costs. First, project management was entrusted to staff of the MLSP’s SID, with only additional support contracted to handle and coordinate additional procurement, by both the Ministry and municipalities, respectively. Also, consultants were contracted, but only during the initial phase of implementation, to help evaluate subproject proposals received by the municipalities. Municipalities relied on the staff in their existing structures to develop and implement subproject proposals. The remaining staff that was contracted by municipalities is additional staff required to deliver services during project implementation and beyond. In this sense, there were minimal overhead costs for project administration, and the experience of implementation was internalized by the implementing agencies. Second, in a budget constrained environment, and attempting to do more with less, the SID continuously sought for means to make investments more efficient. For example, the procurement of vehicles, furniture and equipment for municipal subprojects were packaged to promote efficiency in procurement. Similarly, municipalities sought innovative ways to secure needed staffing by developing part-time, on-call systems for specialist services, and promoting internships with university students to help deliver services in coordination with staff of the centers. Table 1 presents the final allocation of loan resources by loan category. Table 1: Allocation of Loan Resources by Category of Expenditure
Category of Expenditure
Allocation (in EUR)
Original At closing Disbursement at closing
Disbursed Undisbursed
Grants Under Part I 35,390,000.00 30,381,841.00 22,822,017.46 7,559,823.54
Consulting Services, Training
and Audit 4,510,000.00 909,803.00 673,072.62 236,730.38
Front End Fee 100,000.00 100,000.00 100,000.00 0.00
Cancellation 0.00 8,608,356.00
Total: 40,000,000.00 31,391,664.00 23,595,090.08 7,796,553.92
Source: Client Connections, data retrieved June 22, 2016
3.4 Justification of Overall Outcome Rating Rating: Moderately Satisfactory 57. As a restructured project, the Project’s Outcome Rating has been guided by the analysis in Table 2 below.

22
Table 2: Project Rating
Project Relevance Achievement of PDO
(Efficacy) Efficiency Overall Rating
Original Project – April 2009 – December 2012 Disbursements: EUR 10,182,101.26
Substantial Modest Modest Moderately
Unsatisfactory
Restructured Project January 2013 – September 2013 Disbursements: EUR 6,338,963.86
High Substantial High Satisfactory
Restructured Project October 2013 – December 2015 Disbursements: EUR 7,800,731.30
High Substantial High Satisfactory
Overall Project Rating
High Substantial High Moderately Satisfactory
(0.42 x 4) + (0.26 x 5) + (0.32 x 5) = 4.58
58. Overall Outcome is rated Moderately Satisfactory based on the Project’s High relevance, especially after the restructuring, its Substantial efficacy based on the Key Indicators defined for the restructured project, and its High efficiency based on the positive cost to benefit ratio as described above and in Annex 4, the reasonable unit costs of construction based of comparators, and the efficiency with which it was implemented, especially given the funding constraints and the implementing agencies’ constant pursuit of efficiency-seeking measures that permitted them to complete project investments with constrained resources.
3.5 Overarching Themes, Other Outcomes and Impacts
(a) Poverty Impacts, Gender Aspects, and Social Development 59. The Project had a poverty focus in view of its target beneficiaries. However, it would be premature and unrealistic to attribute any impact on poverty to the Project, especially since the complete package of services were delivered only for about six to eight months11. However, the project experiences together with other analytical work is expected to inform ECD, education and training policy. An explicit focus will be how to make Bulgaria’s education and training system more inclusive to opportunities for children and youth from poor and disfavored socio-economic background, including Roma. 60. The project’s monitoring system did not provide gender-disaggregated data. Nor has there been a survey of SIP beneficiaries focusing on gender dimensions. The Project supported the improvement of parenting practices within vulnerable groups, but since project monitoring tabulated the number of parents (as opposed to mothers and fathers/female or male primary care givers), beneficiary data were collected without gender differentiation. A total of 11,580 caregivers received parenting counseling designed to improve parents’ interaction with their
11 The September 2013 Project restructuring allowed for 12 months of implementation of the full package of services.
The prolonged process of securing service specialists, however, reduced that period to between 6 to 8 months (the range reflects the most common implementation periods among Project municipalities).

23
children during the critically important first years of development. The primary care givers, by social norms, and especially among the Roma and Turkish ethnic minority groups, are almost exclusively female. 61. Although the monitoring data reports on vulnerable children that benefitted from the Project, the Government’s legislation does not permit monitoring on the basis of ethnicity. Therefore, there is no disaggregated data on Roma, Turkish, etc. minorities that benefitted from the Project. (b) Institutional Change/Strengthening 62. ECD programs are institutionally complex in that they are multi-sectoral, and implemented at different levels of government (central, municipal). To address these complexities the Project’s design had envisaged the establishment of a Steering Committee to coordinate activities, but, reflecting in part this complexity, the Steering Committee only met twice during implementation. The Project’s institutional impact was mostly on the 66 project municipalities that implemented subprojects. It strengthened their ability to provide integrated services, provided targeted training in professional areas and project management and also in procedures to prepare and implement funding proposals for EU OP program financing. (c) Other Unintended Outcomes and Impacts (positive or negative) N/A
3.6 Summary of Findings of Beneficiary Survey and/or Stakeholder Workshops
63. A Beneficiary Survey or Stakeholder Workshops have not been carried out thus far. A World Bank-sponsored ECD conference is scheduled for June 15, 2016 in Sofia. The conference will focus on lessons learned from the implementation of the SIP, and will share preliminary findings from an impact evaluation of kindergarten enrollment and attendance incentives for vulnerable children, mostly Roma, covering 200 kindergartens (a project funded by America for Bulgaria Foundation, for which the World Bank provided design for the impact evaluation). Participants will include the municipal teams that implemented the SIP (and will now provide for continuation of services with EU financing), providers/specialists of SIP services, international and local organizations engaged in similar projects, representatives of responsible ministries, including MLSP, the Ministry of Education and Ministry of Health.
4. Assessment of Risk to Development Outcome
Rating: Negligible
64. Overall, the Risk to Development Outcome is considered Negligible. Risk to Development Outcome is evaluated according to the risk that investments financed by the Project will not be maintained. Municipalities have bought in to the model supported by the Project and have enthusiastically supported it, despite funding constraints. They have sought innovative methods for financing staff during the interim period until EU funding becomes available, such as offering higher-level students the opportunity for internships working alongside municipal staff. The beneficiary response has been most positive, and will undoubtedly put pressure on municipal authorities to continue to provide and possibly expand available services. The EU-funded project will provide continued funding, until December 2018, for the 66 municipalities (covering slightly

24
more than 50 percent of the national population) that received funding under the Project. Finally, municipalities have committed to maintain project services for five years for subprojects including infrastructure investments and for three years for subprojects including services only. The Government is intent on moving forward with ECD, and is in the process of preparing a new ECD Strategy that will likely incorporate experience with the delivery model supported by the SIP. This may have positive impact on a possible rollout of project-supported services to Bulgaria’s remaining 199 municipalities. The forthcoming ECD conference will present a good opportunity to continue to pursue opportunities to support the Government in its efforts.
5. Assessment of Bank and Borrower Performance
5.1 Bank Performance
(a) Bank Performance in Ensuring Quality at Entry Rating: Moderately Satisfactory
65. The Bank’s Performance in Ensuring Quality at Entry is considered Moderately
Satisfactory. The team prepared an innovative project that was responsive to the Borrower’s needs and priorities, that incorporated lessons of previous experience, that incorporated recommendations and finding from extensive stakeholder consultations. The Project’s design was relatively simple, its institutional arrangements streamlined, and it was, in general terms, ready for implementation. However, the Project’s original Results Framework was overly ambitious and complex, difficult to monitor given the reliance on surveys, and not entirely corresponding to the activities supported by the Project. More importantly, the preparation team failed to identify the risk of funding constraints—even though it would have been difficult to define mitigating factors to address these in advance. (b) Quality of Supervision Rating: Satisfactory
66. Quality of Supervision is rated Satisfactory. The World Bank’s Country Office-based implementation support team provided hands-on, high quality support that was acknowledged by both representative of the MLSP/SID and of municipalities visited during the ICR mission. There was remarkable continuity in task management, with three task managers throughout preparation and implementation, one of which had worked also on project preparation. The team was driven, consistently working with the SID in helping identify proactive, somewhat innovative, ways of addressing budget constraints while keeping implementation moving forward. Support was results driven, which helped to identify issues with the Project’s Results Framework. The Project restructurings were timely, well focused on amending Key Indicators and scaling down project activities to what could reasonably be accomplished during the remaining period while at the same time producing results towards achievement of the PDO. Implementation Status Reports were timely, informative and results-focused, and project ratings therein appropriate to reflect issues incurred throughout implementation. (c) Justification of Rating for Overall Bank Performance Rating: Moderately Satisfactory 67. Overall Bank Performance is rated Moderately Satisfactory, accounting for some shortcomings during preparation, but recognizing supervision as highly proactive, hands-on and

25
determined to work continuously with implementing agencies to help address funding constraints, and adjust the Project and its Results Framework to allow it to make significant progress towards its PDO, and to monitor that progress through realistic indicators.
5.2 Borrower Performance
(a) Government Performance Rating: Moderately Satisfactory
68. Government Performance is rated Moderately Satisfactory, based on the performance of both the MLSP (with respect to overall policy and enabling environment for implementation) and the Ministry of Finance. The MLSP ensured continuous commitment to the program, assigning staff of its SID to coordinate and implement project activities. It also continued to pursue the ECD policy agenda, with the preparation of a draft ECD strategy, in coordination with other Government ministries. Further, the MLSP has been proactive in securing ESF funding for continuation of the SIP. The OP for Human Resource Development was the first OP program approved for the new funding period, and the operation that provides for continuation of the SIP was approved in October 2015. Although it never lacked commitment to the Project and its objectives, given a difficult fiscal situation the Government curtailed its budgetary allocations to push consistently for greater efficiency at the municipal level. The main shortcoming to Government performance relates to the continuous issues with the Project’s budget ceiling that impacted the Project throughout implementation.
(b) Implementing Agency or Agencies Performance Rating: Satisfactory 69. Implementing Agencies’ Performance is rated Satisfactory. The Project’s Implementing Agencies are the SID of MLSP and the 66 municipalities that implemented project-funded subprojects. The SID implemented the Project within its existing structure, contracting only one additional staff to work with project procurement. It used its existing systems and procedures, supported by a management information system put in place with project financing. They sought innovative mechanisms for doing more with less—packaging equipment and vehicle purchases to obtain greater efficiency, and working with municipalities to adjust subprojects to funding availability, including out-of-the-box proposals (e.g., allowing municipalities to retain unutilized amounts advanced in 2014 to cover expenses in 2015 when no funding was allocated). Towards the end of implementation, the SID worked closely with municipalities to ensure they submit proposals for continued funding under OP—a call for proposals from municipalities was launched in December 2015, and by April 2016 all 66 had submitted applications that are now being reviewed by MLSP. Municipalities also performed very well, selecting carefully the construction sites for the new kindergartens and childcare centers to ensure non-segregated, mainstream delivery of early childhood education, maintaining construction and other project activities on schedule, and adjusting what they could implement to available funding, often complemented by municipal funding. Finally, municipalities have also found innovative ways of providing continuation to SIP services, despite funding shortfalls, by, for example, hiring university students under apprenticeship programs, maintaining staff on call, etc. They have also explored different modalities of fees and enrollment, e.g., discounted fees for enrollment of multiple children, sibling priorities, etc. (c) Justification of Rating for Overall Borrower Performance

26
Rating: Moderately Satisfactory 70. Overall Borrower Performance is rated Moderately Satisfactory, in view of shortcomings in allocating continuously the needed budget ceilings for the Project, but which was compensated by exceptional efforts by the Implementing Agencies to continuously adjust to funding shortfalls as described above, that in the end allowed the Project to produce important outcomes.
6. Lessons Learned
71. The Project offered several lessons as follows:
• Results frameworks need to be defined carefully, to keep design simple and
commensurate with the nature of the Project and data availability and systems capacity
for monitoring. The Project’s original Results Framework was unduly ambitious given the time frame of the Project, difficult to monitor, costly to measure and it is not clear that all of the outcomes defined could or would be attributable to the Project. There were issues of eventual attribution and data measurement. Realism in defining indicators is important. Finally, if costly collection of baseline data for impact evaluations is required, it should be adequately funded through trust funds during project preparation.
• Risk analysis during preparation should be comprehensive, and not assume that some risks are inherent and implicit. Obviously the risk of funding constraints is one that applies to all projects, financed by the World Bank and otherwise. Nevertheless, this risk should still always be carefully analyzed in view of existing realities and rated realistically in order to weigh risks and, if possible, define mitigating measures.
• Projects working with vulnerable and minority groups should have mediators from those groups to help promote services. Under the Project, mediators—that the communities recognized and trusted because they were from among their members—intervened to promote the Project’s services among community families. This was very effective in ensuring the Project could reach the targeted population.
• The SIP model of a “one stop shop” successfully leveraged kindergartens as platforms to provide cross-sectoral child care and social inclusion services. The “one stop shop” design of SIP services attached to a kindergarten is a key design feature that stimulated demand for services beyond what the client had initially chosen. There was a clear spillover effect, which would not have happened if these services were dispersed around the town or village.
• The location of subprojects that aim to achieve social integration of vulnerable groups should be selected carefully. In this manner, social integration of the minority groups is promoted. If new centers had been established in areas where exclusively vulnerable groups were located, service provision may have been increased for these beneficiaries, but chances of achieving the goal of inclusion and integration would have been questionable. Localities selected for ECD and service centers were appropriate, given the Project’s goal of achieving integration of vulnerable people.
• Inclusive education for children from vulnerable families and children with special needs yields improved school readiness. The kindergarten spaces created with SIP support were not exclusively for vulnerable children; approximately 30 percent of the places were

27
reserved for children of disfavored backgrounds. This was by design, to ensure that there were children from a mix of backgrounds to allow for positive peer effects and reduce social isolation and exclusion of marginalized children. Mainstreaming vulnerable children in inclusive school settings resulted in increased school readiness.
• The need for multi-sectoral coordination (education, health, social protection) makes
ECD projects complex, but projects can still make progress in the absence of a formal
framework for coordination. If investments are delayed in the absence of a formal framework at the central level, the risk is that little progress can be made. The Project attempted to achieve multi-sectoral coordination through the establishment of a Steering Committee, but this did not function as expected, and only met twice. Nevertheless, this was compensated by very strong inter-sectoral coordination at the municipal level. The model developed by the Project, the activities and services it financed, put in place a very promising model for delivering multi-sectoral service, albeit in the absence of a formal inter-sectoral coordination at the central level. Nevertheless, it represents a first important step towards hopefully developing full coordination in the future.
• Leaving the decisions with respect to subproject design to municipalities (or other local level implementing agencies) makes sense. Not only do municipalities know their realities, needs, staffing issues, financing, etc. more than other levels or agencies, their involvement in the process of defining, designing and implementing investments and services results in projects responsive to their particular needs and realities. More importantly, it helps build ownership of the investments and their implementation.
• Projects that involve multiple subprojects implemented in different localities should have a mechanism for periodically sharing best practices. In the last eight months of the
Project, when the implementation of the integrated childcare services gained a momentum, several municipalities under the Project adopted interesting, innovative and very relevant practices towards service delivery, staffing, etc. However, there was no common information exchange platform for dissemination of good practices. Going forward, the positive results municipalities achieve during the period of EU financing of the services, a mechanism for sharing of best practices (and issues) should be established and promoted.
7. Comments on Issues Raised by Borrower/Implementing Agencies/Partners
(a) Borrower/implementing agencies (b) Co-financiers (c) Other partners and stakeholders (e.g. NGOs/private sector/civil society)

28
Annex 1. Project Costs and Financing
(a) Project Cost by Component (in EUR Million)
Components Appraisal Estimate
(EUR millions)
Actual/Latest
Estimate (EUR
millions)
Percentage of
Appraisal
Total Baseline Cost
Component I: Integrated social and childcare services
37.39
22.82 61%
Component II: Capacity-building
2.51
0.67 27%
Total Project Costs 39.90 23.49 59%
Front-end fee PPF 0.00 0.00
Front-end fee IBRD 0.10 0.10 100%
Total Financing Required 40.00 23.59 59% Source: Client Connections, data retrieved June 22, 2016
(b) Financing
Source of Funds Type of Co-
financing
Appraisal
Estimate
(EUR
millions)
Actual/Latest
Estimate
(EUR
millions)
Percentage of
Appraisal
Borrower 96.73 2.47 2.55%
International Bank for Reconstruction and Development
40.00 23.59 58.97%
Source: Client Connections, data retrieved June 22, 2016

29
Annex 2. Outputs by Component
The Project’s Outputs, by Component, are presented below: 1. Component I: Integrated social and childcare services (EUR 37.39m). This component
would finance a menu of community subprojects, including services and infrastructure investments from which municipalities could choose according to needs. It included provision of a set of integrated social and childcare services for parents and children from marginalized groups and children with disability. Municipalities would subcontract third sector agencies with contracts involving performance targets and per-capita based remuneration. The activities financed under Component I are described below.
2. Financing Agreements – A total of 66 municipalities signed Financing Agreements for
community subprojects, for a total value of BGN 66,733,925.74, of which BGN 59,421,715.87 was loan financed and the respective municipalities financed BGN 7,312,209.87. Under these Financing Agreements, the following was financed:
• Information campaign to promote the SIP (initial);
• Construction and/or rehabilitation of centers in 31 municipalities that have resulted in a total of 1,867 new places in crèches and kindergartens (184 in crèches and 1,683 in kindergartens);
• Furniture and technical equipment for centers;
• Specialized buses (44) with wheel-chair platforms, specially equipped for transporting children and people with disabilities;
• Specialized equipment for the Early Intervention of Disabilities Services, including specialized sensory therapy equipment, specialized medical and sports equipment;
• Training of specialist teams (36 trainings for medical specialists working in maternity wards directly with children with disabilities) and 46 trainings for suppliers of services) for services: “Early Intervention of Disabilities” and “Individual Pedagogical Support to Children with Disabilities”’
• Development of Methodological Guidelines for the supply of Early Intervention of Disabilities;
• Training of specialist teams (66 trainings) for the provision of services “Formation and Development of Parenting Skills” and “Family Counseling and Support”;
• Development of Methodological Guidelines for the supply of “Formation and Development of Parenting Skills” and “Family Counseling and Support”;
• Contracting 1,400 specialists for the supply of SIP services, as follows: o Health Counseling for Children:
� Pediatricians (77) � Nurses (82) � Mediators (97) � Dentists (33)
o Equal Start in School service (summer schools): � Pedagogues (126) � Mediators (114)
o Early Intervention of Disabilities: � Pediatricians (40) � Physiatrists/rehabilitation specialists (40) � Psychologists (44) � Speech therapists (37)

30
� Social workers (42) � Mediators (34)
o Individual pedagogical support to children with disabilities: � Special pedagogues (47)
o Formation and development of parenting skills and Family counseling and support services:
� Pediatricians (50) � Gynecologists (44) � Midwives (52) � Nurses (60) � Psychologists (54) � Legal experts (51) � Mediators (106) � Social workers, 0-3 years (53) � Social workers, 3-7 years (55)
o Integration of Children in Kindergartens: � Social workers/social pedagogues (12) � Mediators (17)
o Social worker-coordinators (42) 3. Component II: Capacity-building (EUR 2.51m). Complementing expected ESF funding,
this component was designed to finance capacity-building activities at the central and municipal level to support the design and pilot launch of a national school readiness program, in order to ensure its quick start-up. Component II financed:
• Training of 144 municipal employees on monitoring and evaluation, and reporting of SIP projects;
• Development of criteria for a continuation of financing under 2014-2020 Human Resources Development Operational Program (2014-2020 HRDOP);
• Preparation of guidelines for application of funding under 2014-2020 HRDOP;
• Consultant for public procurement;
• Consultants for evaluating municipal subproject proposals (6);
• Consultant, Early Childhood Development;
• External Auditor for Project Auditing;
• Consultant, to organize one-day workshop to train municipal representatives on submission of subproject proposals (delivered April, 2011);
• Consultant, to develop management information system for SIP (system is installed and in routine use);
• Consultant, to organize training on “Strengthening the Capacity of the SIP Staff” (delivered, August 31-September 2, 2011);
• Inspection Companies to Supervise construction/rehabilitation in subproject municipalities (6, grouped by region);
• Consultant, Baseline Data (collected);
• Consultants, to organize one-day trainings on Selection of Consultants, as per WB Guidelines (5 contracts, trained 133 representatives of 67 municipalities);

31
Annex 3. Economic and Financial Analysis
Background: 1. The social and childcare services supported by the SIP commenced 8 - 6 months before the
Project’s closing date, therefore, assessing their impact on the early childhood development outcomes as a result of changes in behavior, parenting practices and perceptions in the vulnerable communities is premature. The SIP services complemented the mainstream kindergarten programs offered by the Government and were packaged together as integrated social and childcare services, using a “one-stop-shop” approach that tackled simultaneously multiple barriers to participation in early childhood education while offering early childhood education to children from vulnerable households. However, the SIP supported the construction of kindergartens, the enrollment of vulnerable children in them through community mediators and offered remedial education programs in summer preschools (without the additional benefit of the social services) for 2 years before the Project was closed. The cost-benefit analysis is therefore based solely on the project contributions to non-segregated delivery of early childhood education to vulnerable children.
2. The Project invested significant resources (approximately 50 percent of the project budget,
totaling BGN 35,463,440.25, of which BGN 31,267,062.91 financed through SIP loan proceeds) into kindergarten infrastructure and premises (attached to these kindergartens, or as standalone centers) for delivery of the supplemental social and childcare services. The construction of the kindergartens was completed in late 2013 and in the 2013/2014 academic year children from SIP municipalities were able to enroll in kindergarten programs, of which 30 percent were vulnerable children.
3. The SIP offered two years of early childhood education to 897 vulnerable children, including
Roma, by the closing date. Eighty percent of them passed the school readiness tests administered at the end of the Project.
4. While returns to investments in ECD is a heavily researched topic internationally, with long-
term returns on investment estimated as high as 16 percent, the economic and financial analysis for the SIP takes advantage of recently completed studies on Bulgaria that allow for more precise monetizing of the benefits, taking into account Bulgaria specific circumstances.
5. The estimated benefits are based mostly on the PISA 2012 research on Bulgaria and Program
for the International Assessment of Adult Competencies (PIAAC). PISA 2012 data for Bulgaria allows to assess the impact of early cognitive stimulation of vulnerable children through ECD programs on their academic performance in subsequent educational stages. Results from the PISA 2012 data for Bulgaria show that having attended at least a two year pre-primary education program increases PISA math scores by an average of 7 points relative to having attended one year or none at all. The effect of ECD is greatest for low achievers (10 points on average) and students who speak a different language at home (19 points on average), while its effect on high achievers is not significant.
6. The PISA 2012 study also provides an assessment of the peer effects in secondary education,
which allows factoring in the positive peer effects from provision of ECD services in a non-segregated setting. The PISA 2012 data for Bulgaria reveals that peer effects (concentration of similarly advantaged or vulnerable students within a same school) could explain a
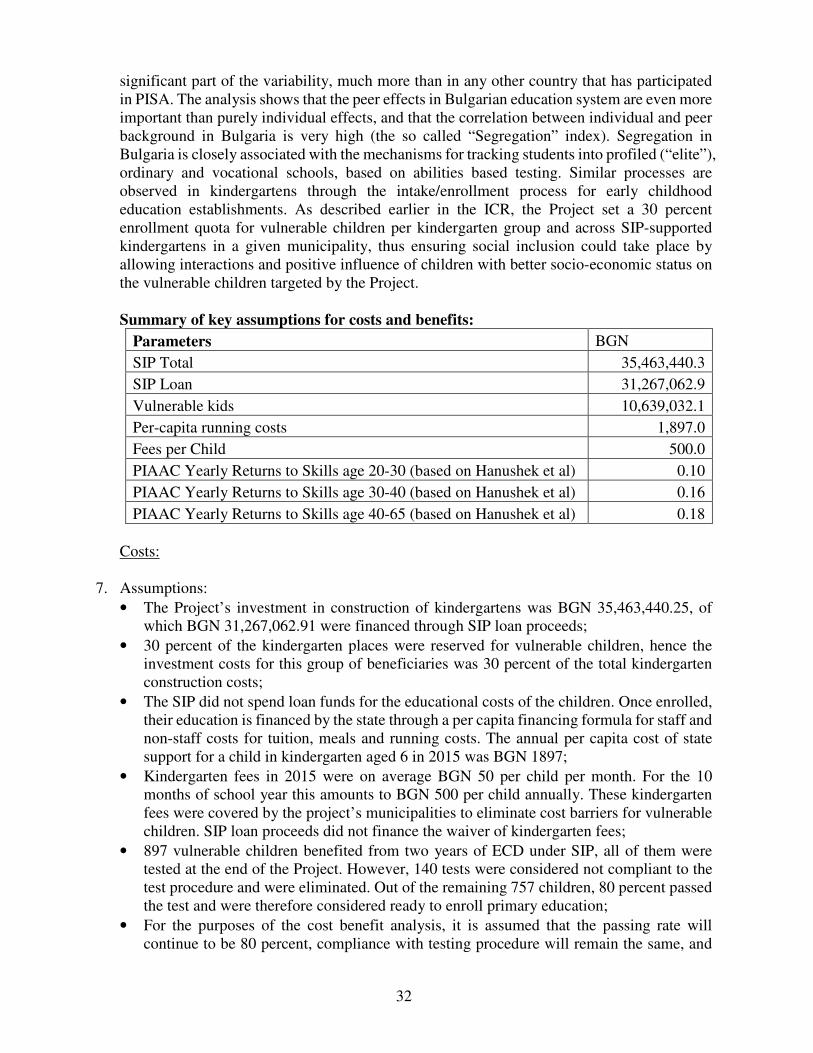
32
significant part of the variability, much more than in any other country that has participated in PISA. The analysis shows that the peer effects in Bulgarian education system are even more important than purely individual effects, and that the correlation between individual and peer background in Bulgaria is very high (the so called “Segregation” index). Segregation in Bulgaria is closely associated with the mechanisms for tracking students into profiled (“elite”), ordinary and vocational schools, based on abilities based testing. Similar processes are observed in kindergartens through the intake/enrollment process for early childhood education establishments. As described earlier in the ICR, the Project set a 30 percent enrollment quota for vulnerable children per kindergarten group and across SIP-supported kindergartens in a given municipality, thus ensuring social inclusion could take place by allowing interactions and positive influence of children with better socio-economic status on the vulnerable children targeted by the Project.
Summary of key assumptions for costs and benefits:
Parameters BGN
SIP Total 35,463,440.3
SIP Loan 31,267,062.9
Vulnerable kids 10,639,032.1
Per-capita running costs 1,897.0
Fees per Child 500.0
PIAAC Yearly Returns to Skills age 20-30 (based on Hanushek et al) 0.10
PIAAC Yearly Returns to Skills age 30-40 (based on Hanushek et al) 0.16
PIAAC Yearly Returns to Skills age 40-65 (based on Hanushek et al) 0.18
Costs:
7. Assumptions:
• The Project’s investment in construction of kindergartens was BGN 35,463,440.25, of which BGN 31,267,062.91 were financed through SIP loan proceeds;
• 30 percent of the kindergarten places were reserved for vulnerable children, hence the investment costs for this group of beneficiaries was 30 percent of the total kindergarten construction costs;
• The SIP did not spend loan funds for the educational costs of the children. Once enrolled, their education is financed by the state through a per capita financing formula for staff and non-staff costs for tuition, meals and running costs. The annual per capita cost of state support for a child in kindergarten aged 6 in 2015 was BGN 1897;
• Kindergarten fees in 2015 were on average BGN 50 per child per month. For the 10 months of school year this amounts to BGN 500 per child annually. These kindergarten fees were covered by the project’s municipalities to eliminate cost barriers for vulnerable children. SIP loan proceeds did not finance the waiver of kindergarten fees;
• 897 vulnerable children benefited from two years of ECD under SIP, all of them were tested at the end of the Project. However, 140 tests were considered not compliant to the test procedure and were eliminated. Out of the remaining 757 children, 80 percent passed the test and were therefore considered ready to enroll primary education;
• For the purposes of the cost benefit analysis, it is assumed that the passing rate will continue to be 80 percent, compliance with testing procedure will remain the same, and

33
that the affected future cohorts of 897 children will produce a total of 717 children passing the tests every year;
• Life expectation (in years) of the investment is assumed to be 20 years lifespan of the kindergarten; and
• This results into fixed investment per student of around 742 BGN.
Summary of costs assumptions:
Costs Costs per Pupil
Number of children affected yearly that pass the school readiness test 717.00
Years of life of investment 20.0
Children benefiting in a 20 year period 14,340
Fixed-cost expenditure per child 741.91 BGN
Running costs (2 years) 1,000.00 BGN
Total expenditure per child (from Project + Municipalities) 1,741.91 BGN
Benefits
8. Assumptions:
• The expected math skill gains at the end of compulsory education based on PISA 2012 analysis for Bulgaria ranges from 10 points (low-performing students) to 19 points (linguistic/ethnic minorities). The effect for all students with low socio economic status (SES) in Bulgaria is similar to the one observed for minorities but the SES model is better as it captures ethnic/linguistic minorities (51% of minorities are in the bottom 20% SES group), but this is only a third (51% of 12.5%) of the lowest quintile, which includes other vulnerable students. Thus, 20 points gain in performance is used as the baseline;
• This is subsequently transformed into Standard Deviations in PISA and then, under the assumption that PISA and PIAAC measure the same skills for comparable populations, that translated standard deviation is taken into PIAAC equivalent-standard deviations;
• While Bulgaria did not participate into PIAAC data, neighboring countries did (Czech Republic, Poland, Russia and Slovak Republic), so their estimates of returns to skills are averaged;
• Returns to skills are not constant over the life cycle, they increase with age and remain stagnant after age 40 (with a very small decline at the end);
• Thus, 10% wage gains per standard deviation are assumed for ages 20-30, 16% in ages 30-40 and 18% in ages 40-65%;
• The expected yearly monetary gains are 2.2% wage increase in ages 20-30, 3.5% in ages 30-40, and 3.9% in ages 40-65; and
• The annual average earnings of individuals aged 18-64 belonging to bottom 30% was approximately BGN 4000
Summary of benefits assumptions:
Benefits Benefits per Pupil
PISA Effect (bottom 20% ESCS) in Math Points 20.0
PISA Std Dev (Math) 92
PISA Effect in Std Deviations 0.217391304
Increase probability of going to General Stream

34
PIAAC Std Dev. 0.217391304
PIAAC Yearly Returns to Skills age 20-30 2.17%
PIAAC Yearly Returns to Skills age 30-40 3.48%
PIAAC Yearly Returns to Skills age 40-65 3.91%
9. Based on the assumptions above, the final individual life discounted benefits are 1,597 BGN per vulnerable child. Aggregating the benefits to 20 years for the 717 vulnerable children that passed the school readiness test under SIP, the total gains are nearly BGN 23 million, and total costs stand at BGN 10, 6 million. Thus, the benefit-to-cost ratio for the Project is 2.15.
Cost-Benefit Analysis:
Expected Earnings 4,000.00 BGN
Life Benefits 1,597.27 BGN
Total Gains 22,904,814.00 BGN
Total Costs 10,639,032.00 BGN
Benefit-to-Cost Ratio 2.153

35
Annex 4. Bank Lending and Implementation Support/Supervision Processes
(a) Task Team members
Names Title Unit Responsibility/
Specialty
Lending
Christian Bodewig Program Leader ECCU5 Task Team Leader
Blaga Djourdjin Procurement Specialist GGO03 Procurement Specialist
Lire Ersado Senior Economist GSP05 Senior Economist
Roberta V. Gatti Lead Economist GSPDR Senior Economist
Rebekka E. Grun Asst. to the President EXC Senior Economist
Kari L. Hurt Senior Operations Officer GHN02 Senior Operations Officer
Mirela Mart Financial Management Specialist ECADE Financial Management Specialist
Peter Ivanov Pojarski Consultant GSP03 Operations Officer
Svetlana Georgieva Raykova Associate Operations Officer CASPM Operations Officer
Albena Alexandrova Samsonova Program Assistant ECCBG Program Assistant
Supervision/ICR
Bogdan Constantin Constantinescu Sr Financial Management Specialist GGO21 Sr Financial Management Specialist
Anneliese Viorela Voinea Financial Management Specialist GGO21 Financial Management Specialist
Blaga Djourdjin Procurement Specialist GGO03 Procurement Specialist
Valeria Nikolaeva Procurement Specialist GGO03 Procurement Specialist
Peter Ivanov Pojarski Consultant GSP03 Task Team Leader
Plamen Nikolov Danchev Senior Education Specialist GED02 Task Team Leader
Albena Alexandrova Samsonova Program Assistant ECCBG Program Assistant
Adela Delcheva Program Assistant ECCBG Program Assistant
(b) Staff Time and Cost
Stage of Project Cycle
Staff Time and Cost (Bank Budget Only)
No. of staff weeks USD Thousands (including travel and
consultant costs)
Lending
FY06 2.30 10.85
FY07 50.95 252.81
FY08 11.77 60.35
Total: 65.02 324.01
Supervision/ICR
FY09 9.57 71.72
FY10 18.81 54.88
FY11 20.18 58.75
FY12 12.55 38.30
FY13 16.58 31.61
FY14 13.53 35.05
FY15 15.48 20.27
FY16 12.77 29.32
Total: 119.47 339.90

36
Annex 5. Targeting 1. Targeting was driven by the information on GMI benefits recipients as well as other aspects
of the socio-economic status of the population in the participating municipalities (see Table 1). The collection of this information was required from municipalities at the stage of the needs assessment and situation analysis, which preceded the final selection of project municipalities. Table 1 summarizes the estimated size of SIP target groups.
Table 1: Estimated size of the SIP target groups in participating municipalities12
SIP Target Groups:
Estimated size of the
target group (overlaps
among categories
exist)
Children from vulnerable or potentially-vulnerable groups, including Roma ethnic group; 30,000
Children of unemployed parents 28,000
Children whose parents are social assistance recipients 37,000
Children without a General Practitioner or whose General Practitioner is not a pediatrician 21,000
Children from families without health insurance 22,000
Children not enrolled in kindergarten and not attending other child care facilities 23,000
Children from families of poor child-care record 11,000
Children with disabilities 5,000
Children with health problems 5,000
Parents from vulnerable groups – vulnerable ethnic groups, in particular Roma 44,000
Parents who are GMI recipients 33,000
Unemployed parents 27,000
Parents of 3 or more children 10,000
Single parents 14,000
First time parents from vulnerable groups 12,000
Parents (mostly mothers) in risk age; 6,000
Parents with poor educational level 37,000
Parents living in poor housing conditions 15,000
Parents of poor child-care record 4,000
Parents of children with disabilities 5,500
Parents of children with health problems 7,000
Parents without health insurance 24,000
Parents of children assessed as high-risk 3,000
Establishing the SIP RF indicators’ targets
2. Based on the municipal needs assessment and situation analysis information, municipalities were required to estimate the potential beneficiaries for all services defined in the Project’s Operational Manual. A summary of the results is presented in Table 2.
12 Data is provided by municipalities within the needs assessment and situation analysis completed before submission of the
preliminary application forms.

37
Table 2: Number of potential beneficiaries in participating municipalities, by type of SIP
services, based on needs assessment and situational analysis
SIP services by project subcomponents Potential
beneficiaries
Subcomponent 1.1 Services for children aged 0-3 and their parents
1.1.1 Formation and development of parenting skills 22,000
1.1.2 Early intervention center 6,000
1.1.3 Family Counseling and Support 14,500
1.1.4 Health consultation for children 16,000
1.1.5 Child Minders 200
1.1.6 Family centers 500
1.1.7 Crèche fee reduction (full or partial) 1800
Subcomponent 1.2 Services for children aged 3-6 and their parents
1.2.1 Integration of children in kindergartens and preschool groups 60,000
1.2.2 Screening of school readiness 28,500
1.2.3 Family counseling and support 19,000
1.2.4 Health consultation for children 24,000
1.2.5 Family Centers 1,000
1.2.6 Preparedness for equal start at school 7,000
1.2.7 Individual pedagogical support for children with disabilities 2,500
3. Municipalities were requested to submit preliminary project proposals, taking into account
the notional allocation of SIP resources across municipalities, based on a 50:50 percent distribution of requested funding between construction of ECD infrastructure and provision of services. The information on the estimated beneficiaries (by main services and age groups) in the final project proposals is presented in Table 3. It contains a shorter list of services to reflect the following: i. Municipalities developed their projects selecting only those services from the full menu
described in the POM, which best reflect the local circumstances and needs. ii. The short list of services includes those selected by the majority of the participating
municipalities, also having highest share in the overall SIP budget. iii. This shortlist was used as a basis of identifying outcome and outputs indicators in the SIP
results framework.
Table 3. Number of estimated beneficiaries in participating municipalities, by type of SIP
services, based on approved municipal projects, 2012
SIP services by project subcomponents Potential
beneficiaries
Subcomponent 1.1 Services for children aged 0-3 and their parents
1.1.1 Formation and development of parenting skills 6,000
1.1.2 Early intervention of disabilities 1,500
1.1.3 Health consultation for children 7,000
1.1.4 Crèche fee reduction (full or partial) 1800
Subcomponent 1.2 Services for children aged 3-6 and their parents
1.2.1 Integration of vulnerable children in kindergartens and preschool groups (with disabilities) 900 (150)
1.2.2 Kindergarten fee reduction (full or partial) 800
1.2.3 Formation and development of parenting skills 9,000
1.2.4 Health consultation for children 8,000

38
Table 4. Targets in the SIP Results Framework
Original Targets 2009
Revised targets 2012 MTR
Revised Targets
2013 Supplemental
letter 2
PDO Indicator One: Share of vulnerable children aged 6 who pass the school readiness diagnostic test
0 40% 40%
PDO Indicator Two: Number of children aged 3-7 newly enrolled in kindergartens and preschool groups through the Project
0 3 000 3 000
PDO Indicator Three: Number of children with disabilities and other special needs enrolled in mainstream kindergartens and preschool groups through the Project
0 150 150
PDO Indicator Four: Number of beneficiaries of the “Early Intervention of Disabilities” service
0 1 500 1 500
Intermediate Result indicator One: Number of newly created places in kindergarten and preschool groups through the Project
0 1 600 1 600
Intermediate Result indicator Two: Number of newly created facilities for delivery of integrated social inclusion services through the Project
0 68 68
Intermediate Result indicator Three: Number of parents of children aged 0-3 who received parenting skills counseling
0 15 000 10 000
Intermediate Result indicator Four: Number of children aged 0-7who benefitted from the “Health Consultation” services
0 15 000 10 000
Intermediate Result indicator One: Number of municipal staff trained in public procurement rules and procedures under the Project
0 120 120
Intermediate Result indicator Two: SIP Project Management Information System (PMIS) developed and operationalized
0 PMIS in use
PMIS in use
Intermediate Result indicator Three: Number of municipal staff trained in project reporting and monitoring and evaluation
0 120 120
Intermediate Result indicator Four: Number of kindergartens and crèches’ staff trained under the Project
0 1400 700
4. Project restructurings and partial cancellations required revisions to the financing agreements
with municipalities, including changes to the scope and coverage of the services. As a result, the end targets for the services with highest estimated beneficiaries were reduced to reflect lower budget and shorter implementation period for the services. The original target of the last indicator reflected the number of staff in project municipalities to receive the training, while the revised target was established based on the target envisioned in the EU funded project of the Ministry of Education and Science that supported the same capacity building activity.
5. Exceeding the service related targets reflects (i) the outreach work of the community mediators recruited as part of the service delivery teams, (ii) the “one stop shop” design of the services (resulting in beneficiaries taking advantage of more services then initially intended to be used), (iii) the extent of the unmet demand for these services, delivered free of charge under the Project, with paid alternatives outside it (especially health consultations, dental checkups, counseling on labor market re-entry of young mothers, etc.).

39
Annex 6. Summary of Borrower's ICR and/or Comments on Draft ICR The summary below was taken verbatim from the Borrower’s Completion Report dated June 2016. Summary
The Social Inclusion Project (SIP) is funded with a loan from the International Bank for Reconstruction and Development (The World Bank) in the amount of EUR 31 391 644 (BGN
61 396 719). The loan agreement with the World Bank was signed in November 2008 but the implementation of the Project effectively started in August 2010. The deadline for disbursement
of the proceeds from the loan is December 31, 2015.
The Project consists of 2 components: Component 1. Integrated social services and child care services, in the amount of EUR 30.74
million, under which municipalities are funded for the supply of services for children 0-7 and their parents. In addition to services, the component is also for financing of investment in infrastructure, as well as training of service suppliers and kindergarten/crèche staff.
Component 2. Capacity building amounting to EUR 0.55 million, for funding of activities for improvement of the capacity of local authorities for implementing integrated project for early childhood development through the provision of technical consultations, including for access to European Union Structural and Cohesion Funds, incl. guaranteeing of sustainability of services. Activities related to impact evaluation, audit, and support of implementation are also funded. 66 municipalities are beneficiaries under the SIP. Between the start of the project and 31.12.2015 a total of BGN 50 981 974.02 have been absorbed, of which BGN 46 147 985.04 in borrowing (75.16 % of the loan), BGN 506 659.65 state co-financing, and BGN 4 327 329.33 municipal co-financing. 44 specialized busses with wheel-chair platforms, as provided under the project, specially equipped for transporting children and people with disabilities, as well as specialized medical equipment and sensory therapy equipment for the Early Intervention of Disabilities services were supplied to beneficiary municipalities. Equipment/technical equipment required for the supply of the services under the project was also provided. Construction works under the SIP are completed. In all SIP-beneficiary municipalities excellent conditions for the supply of the early childhood development services, constituting the essence of the SIP, are provided. In 30 municipalities a total of 1889 new places in crèches and kindergartens are opened (184 places in crèche groups and 1705 in kindergarten groups). The numbers of opened places are on the basis of the capacity as per the project, and in practice many municipalities have exceeded the capacity as per the project. Over 1400 specialists were hired for the supply of the services under the SIP (incl. pediatricians, psychologists, speech therapists, social workers, special pedagogues, gynecologists, nurses,

40
midwives, pedagogues, legal experts, and mediators), as well as 20 contracts with 13 social services suppliers licensed to provide social services for children. Based on reported data of beneficiary municipalities, the total number of users of services under the SIP exceeds 30 000, including children and their parents. In the summer of 2015 beneficiary municipalities conducted tests for assessing the level of readiness for school of children from vulnerable groups enrolled in kindergartens, thanks to the Social Inclusion Project. Test results are very good – success rate is 80%. Methodological guidelines for the supply of the service “Early intervention of disabilities through the establishment of an Early Intervention of Disabilities Center”, as well as for the services “Formation and development of parenting skills” and “Family counseling and support” were prepared and made available to beneficiaries. The following events took place:
• 36 trainings of medical specialists working in maternity wards and working directly with babies and small children with disabilities, for the adoption of new approaches to informing parents about the disability of the child and encouraging raising the child in a family environment;
• 46 trainings of suppliers of the services “Early intervention of disabilities through the establishment of an Early Intervention of Disabilities Center” and “Individual pedagogical support to children with disabilities”;
• 66 trainings of specialist teams for the provision of the services “Formation and development of parenting skills” and “Family counseling and support”.
Training of 144 municipal employees took place in connection with the monitoring and reporting of projects under the SIP implemented by them. Ensuring sustainability of services opened under the SIP was of extreme importance. To this end, in 2015 the Loan Agreement for the SIP was amended to extend the deadline for the implementation of the projects of all the 66 beneficiary municipalities until 31.12.2015. Thus, a smooth transition to funding of early childhood development services introduced under the SIP with proceeds from the 2014-2020 Human Resources Development Operational Program (2014-2020 HRDOP) from the beginning of 2016 was conditioned. Criteria for an operation under the 2014-2020 HRDOP were elaborated aiming at continuation of supply of early childhood development services created under the SIP, from the beginning of 2016. Guidelines for application for funding under the Early Childhood Development Services operation under the 2014-2020 HRDOP were prepared. The operation was announced on 04.12.2015, and thus the commitment to secure funding of the early childhood development services opened under the SIP after 31.12.2015 undertaken on the part of the MLSP was effectively fulfilled. The operation under the 2014-2020 HRDOP allows all the 66 beneficiary municipalities under the SIP to obtain financing for continuation of the operation of the services opened under the SIP until 31.12.2018, the budget of the operation amounting to BGN 30 000 000.
The financing of the early childhood development services opened under the SIP with borrowed funds ended on 31.12.2015.

41
Annex 7. List of Supporting Documents World Bank, Project Appraisal Document for a Social Inclusion Project, Report No. 38604-BG dated October 8, 2008. World Bank, Social Inclusion Project, Implementation Status Reports Nos. 1-15, preparation and implementation support mission Aide Memoires. World Bank, Systemic Country Diagnostic (SCD) Bulgaria’s Potential for Sustainable Growth and Shared Prosperity dated July 29, 2015. Ministry of Labor and Social Policy, Report on the Implementation of the Social Inclusion Project, May 2016. World Bank, Social Inclusion Project in Bulgaria, School Readiness Test-Comparison 2012/2015, prepared by Market Links Research and Consulting.

43
MAP