Embed Size (px)
Citation preview

Document of the World Bank
Report No: ICR00003351
IMPLEMENTATION COMPLETION AND RESULTS REPORT
(COFN-C1160 IDA-43860)
ON A CREDIT
IN THE AMOUNT OF SDR 39.4 MILLION (US$ 62.60 MILLION EQUIVALENT)
TO THE
PEOPLE’S REPUBLIC OF BANGLADESH
FOR A
NATIONAL AGRICULTURAL TECHNOLOGY PROJECT
IN SUPPORT OF THE FIRST PHASE OF THE
NATIONAL AGRICULTURAL TECHNOLOGY PROGRAM
June 29, 2015
Agriculture Global Practice Bangladesh Country Management Unit
South Asia
Pub
lic D
iscl
osur
e A
utho
rized
Pub
lic D
iscl
osur
e A
utho
rized
Pub
lic D
iscl
osur
e A
utho
rized
Pub
lic D
iscl
osur
e A
utho
rized

CURRENCY EQUIVALENTS
(Exchange Rate Effective June 29, 2015)
Currency Unit = Bangladeshi Taka BDT 77.85 = US$ 1 US$ 1.403 = SDR 1
FISCAL YEAR July 1 – June 30
ABBREVIATIONS AND ACRONYMS
ADP Annual Development Program AGDP Agriculture GDP APL Adaptable Program Loan ARI Agricultural Research Institute ARMP Agricultural Research Management Project ASIRP Agricultural Services Innovation and Reform
Project ASSP Agricultural Support Service project BARC Bangladesh Agricultural Research Council BARI Bangladesh Agricultural Research Institute BFRI Bangladesh Fisheries Research Institute BINA Bangladesh Institute for Nuclear Agriculture BJRI Bangladesh Jute Research Institute BLRI Bangladesh Livestock Research Institute BRAC Bangladesh Rural Advancement Committee BRRI Bangladesh Rice Research Institute BSRI Bangladesh Sugarcane Research Institute BTRI Bangladesh Tea Research Institute CAS Country Assistance Strategy CCMC Commodity Collection and Marketing Center CGIAR Consultative Group on International
Agricultural Research CGP Competitive Grants Program CIG Common Interest Group DAE Department of Agriculture Extension DANIDA Danish International Development Agency DECC District Extension Coordination Committee DFID Department for International Development
(UK) DG Director General DLS Department of Livestock Services (MOFL)
DO Development Objective DOF Department of Fisheries (MOFL) DP Direct Procurement EIAT Expert Impact Assessment Team EMF Environmental Management Framework EOI Evaluation of Expression of Interest EOP End of Project ERR Economic Rate of Return ESP Extension Service Provider EUROGAP Europe GAP FFP Fourth Fisheries Project FIAC Farmers’ Information and Advice Center FMS Financial Management System FRI (Bangladesh) Forest Research Institute GAP Good Agricultural Practices GB Governing Board GDP Gross Domestic Product GMO Genetically Modified Organism GOB Government of Bangladesh Hortex Horticulture Export Development
Foundation HVA High Value Agriculture IA Implementing Agency IARC International Agricultural Research Center ICB International Competitive Bidding ICM Integrated Crop Management ICRR Implementation Completion and Results
Report ICT Information and Communication Technology IDA International Development Association (WB
Group)

IEC Information, Education and Communication IFAD International Fund for Agricultural
Development IFB Invitation for Bids IFI International Financial Institution IFT Invitation for Tenders INM Integrated Nutrient Management IP Implementation Progress IPM Integrated Pest Management IPR Intellectual Property Rights IT Information Technology KGF Krishi Gobeshona (Agricultural Research)
Foundation LCS Least Cost Selection M&E Monitoring and Evaluation MDG Millennium Development Goal MIS Management Information System MOA Ministry of Agriculture MOC Ministry of Commerce MOEF Ministry of Environment and Forest MOFL Ministry of Fisheries and Livestock MOU Memorandum of Understanding MTR Mid-Term Review NAEP New Agricultural Extension Policy NAP National Agricultural Policy NARS National Agricultural Research System NATP National Agricultural Technology Project NATS National Agricultural Technology System NECC National Extension Coordination Committee NGO Non-governmental Organization NPV Net Present Value OED Operations Evaluations Department of WB
Group (renamed as Independent Evaluation Group)
PCT Procurement Core Team PCU Project Coordination Unit
PD Project Director PI Principal Investigator PIP Project Implementation Plan PIU Project Implementation Unit PMU Project Management Unit PO Producers’ Organization PPF Project Preparation Facility PRSP Poverty Reduction Strategy Paper PSC Project Steering Committee R&D Research and Development REOI Request for Expression of Interest RFP Request for Proposals RFQ Request for Quotations SA Special Account SBD Standard Bidding Document SDPP Silk Development Pilot Project SFB Selection under Fixed Budget SIC Selection of Individual Consultants SIL Sector Investment Loan SMF Social Management Framework SPGR Sponsored Public Goods Research SPS Sanitary and Photo-sanitary Standards SRDI Soil Resources Development Institute SRFP Standard Request for Proposals SSS Single Source Selection SWOT Strengths, Weaknesses, Opportunities and
Threat TOR Terms of Reference UECC Upazila Extension Coordination Committee UEF Upazila Extension Fund UFT Union Facilitation Team USAID U.S. Agency for International Development
Vice President : Annette Dixon
Country Director : Johannes C.M. Zutt
Practice Manager : Martien Van Nieuwkoop
Project Team Leader : Pushina Kunda Ng'andwe
ICRR Team Leader : Bayarsaikhan Tumurdavaa

Contents
1. Project Context, Development Objectives and Design ................................................... 1 1.1 Context at Appraisal ............................................................................................................ 1 1.2 Original Project Development Objectives (PDO) and Key Indicators ................................ 1 1.3 Revised PDO and Key Indicators, and reasons/justification ............................................... 2 1.4 Main Beneficiaries............................................................................................................... 2 1.5 Original Components ........................................................................................................... 2 1.6 Revised Components ........................................................................................................... 3 1.7 Other significant changes .................................................................................................... 3 2. Key Factors Affecting Implementation and Outcomes .................................................. 4 2.1 Project Preparation, Design, and Quality at Entry ............................................................... 4 2.2 Implementation .................................................................................................................... 6 2.3 Monitoring and Evaluation (M&E) Design, Implementation and Utilization ..................... 6 2.4 Safeguard and Fiduciary Compliance.................................................................................. 7 2.5 Post-completion Operation/Next Phase ............................................................................... 9 3. Assessment of Outcomes ................................................................................................. 10 3.1 Relevance of Objectives, Design, and Implementation ..................................................... 10 3.2 Achievement of Project Development Objectives ............................................................. 10 3.3 Efficiency .......................................................................................................................... 16 3.4 Justification of Overall Outcome Rating ........................................................................... 17 3.5 Overarching Themes, Other Outcomes and Impacts ......................................................... 17 4. Assessment of Risk to Development Outcome .............................................................. 19 5. Assessment of Bank and Borrower Performance ......................................................... 20 5.1 Bank Performance ............................................................................................................. 20 5.2 Borrower Performance ...................................................................................................... 21 6. Lessons Learned .............................................................................................................. 22 Annex 1. Project Costs and Financing ...................................................................................... 25
Annex 2. Outputs by Component .............................................................................................. 26
Annex 3. Economic and Financial Analysis ............................................................................. 37
Annex 4. Bank Lending and Implementation Support/Supervision Processes ......................... 48
Annex 5. Summary of Borrower's ICRR .................................................................................. 50
Annex 6. Government Comments on the draft ICRR (unedited form) ..................................... 53
Annex 7. List of Supporting Documents .................................................................................. 54
Map of Bangladesh ................................................................................................................... 55

i
A. Basic Information
Country: Bangladesh Project Name: National Agricultural Technology Project
Project ID: P084078 L/C/TF Number(s): COFN-C1160,IDA-43860
ICR Date: 06/21/2015 ICR Type: Core ICR
Lending Instrument: APL Borrower: GOVERNMENT OF BANGLADESH
Original Total Commitment:
XDR 39.40M Disbursed Amount: XDR 36.04M
Revised Amount: XDR 37.26M
Environmental Category: B
Implementing Agencies: Ministry of Fisheries and Livestock (MOFL) and MINISTRY OF AGRICULTURE Cofinanciers and Other External Partners: International Fund for Agricultural Development B. Key Dates
Process Date Process Original Date Revised / Actual
Date(s)
Concept Review: 06/21/2005 Effectiveness: 03/25/2008 03/25/2008
Appraisal: 03/11/2007 Restructuring(s):
03/31/2008 12/17/2012 12/02/2013 02/06/2014 03/04/2014 10/21/2014 12/30/2014
Approval: 02/07/2008 Mid-term Review: 09/15/2011 02/13/2012
Closing: 12/31/2013 12/31/2014 C. Ratings Summary C.1 Performance Rating by ICR
Outcomes: Satisfactory
Risk to Development Outcome: Moderate
Bank Performance: Moderately Satisfactory
Borrower Performance: Moderately Satisfactory

ii
C.2 Detailed Ratings of Bank and Borrower Performance (by ICR) Bank Ratings Borrower Ratings
Quality at Entry: Moderately Satisfactory Government: Moderately Satisfactory
Quality of Supervision: Moderately SatisfactoryImplementing Agency/Agencies:
Moderately Satisfactory
Overall Bank Performance:
Moderately SatisfactoryOverall Borrower Performance:
Moderately Satisfactory
C.3 Quality at Entry and Implementation Performance Indicators
Implementation Performance
Indicators QAG Assessments
(if any) Rating
Potential Problem Project at any time (Yes/No):
No Quality at Entry (QEA):
None
Problem Project at any time (Yes/No):
Yes Quality of Supervision (QSA):
None
DO rating before Closing/Inactive status:
Satisfactory
D. Sector and Theme Codes
Original Actual
Sector Code (as % of total Bank financing)
Agricultural extension and research 50 50
Animal production 15 15
Central government administration 5 5
Crops 20 20
Sub-national government administration 10 10
Theme Code (as % of total Bank financing)
Participation and civic engagement 20 20
Rural policies and institutions 40 40
Rural services and infrastructure 40 40 E. Bank Staff
Positions At ICR At Approval
Vice President: Annette Dixon Praful C. Patel
Country Director: Johannes C.M. Zutt Xian Zhu
Practice Manager/Manager:
Martien Van Nieuwkoop Adolfo Brizzi
Project Team Leader: Pushina Kunda Ng'andwe Paul Singh Sidhu

iii
ICR Team Leader: Bayarsaihan Tumurdavaa
ICR Primary Author: Bayarsaihan Tumurdavaa F. Results Framework Analysis
Project Development Objectives (from Project Appraisal Document) The Project Development Objective (PDO) is to support Government of Bangladesh's program to improve the effectiveness of the National Agricultural Technology System (NATS) and to improve agricultural productivity and farm income. Revised Project Development Objectives (as approved by original approving authority) The revised PDO is to improve the effectiveness of NATS as measured by increases in agricultural productivity and farm income in selected districts. [Split rating was not used for assessment of project development outcome for reasons explained in Footnote 7, Section 3 of main text). (a) PDO Indicator(s)
Indicator Baseline Value
Original Target Values (from
approval documents)
Formally Revised Target Values
Actual Value Achieved at
Completion or Target Years
Indicator 1 : Increase in agricultural productivity
Value quantitative or Qualitative)
0 8%
Crops - 33%; Livestock - 68%; and Fisheries - 75%
Crops - 29% to 99%; Livestock - 6% to 71%; and Fisheries - 107% to 193%
Date achieved 03/31/2008 03/31/2008 06/30/2014 10/31/2014
Comments (incl. % achievement)
Substantially achieved: The target was revised in June 2014 to disaggregate target values by individual sub-sectors. Achievements reported as range values because each sub-sector has multiple crops or livestock or fisheries products. Details in Annex 2
Indicator 2 : Increase in household incomes - (i) Marginal Farmers; (ii) Small Farmers; and (iii) Medium Farmers
Value quantitative or Qualitative)
0 10% (i) 133%; (ii) 41%; and (iii) 33%
(i) 47% to 135%; (ii) 31% to 92%; and (iii) 23% to 77%
Date achieved 03/31/2008 03/31/2008 06/30/2014 10/31/2014 Comments (incl. % achievement)
Achieved: The indicator was revised from 'Increase in household net income by farm size and type of farms' to 'Increase in household incomes by farm size'. Achievements reported as range values because of different types of farming.

iv
(b) Intermediate Outcome Indicator(s)
Indicator Baseline Value
Original Target Values (from
approval documents)
Formally Revised
Target Values
Actual Value Achieved at
Completion or Target Years
Indicator 1 : Scientists trained in identified skill gaps Value (quantitative or Qualitative)
0 109 109 108
Date achieved 03/31/2008 03/31/2008 06/30/2014 10/31/2014 Comments (incl. % achievement)
Achieved: This indicator refers to number of scientists participated in international and national trainings. A total of 108 scientists participated in international trainings achieving 99% of the target.
Indicator 2 : Collaborative research sub-projects (Competitive Grants Program - CGP) under implementation or completion
Value (quantitative or Qualitative)
0 100 100 84
Date achieved 03/31/2008 03/31/2008 06/30/2014 10/31/2014 Comments (incl. % achievement)
Substantially achieved: A total of 84 CGPs were completed, achieving 84% of the target.
Indicator 3 : Collaborative research sub-projects (Sponsored Public Goods Research) under implementation or completion
Value (quantitative or Qualitative)
0 45 45 108
Date achieved 03/31/2008 03/31/2008 06/30/2014 10/31/2014 Comments (incl. % achievement)
Achieved: A total of 108 SPGRs were completed against the target of 45.
Indicator 4 : Non-NARS partners participated in CGP and share of CGP funds allocated to them
Value (quantitative or Qualitative)
0 20 and 30% 68 and 30% 47 and 59%
Date achieved 03/31/2008 03/31/2008 06/30/2014 10/31/2014 Comments (incl. % achievement)
Substantially achieved: 47 Non-NARS partners participated CGPs, which represents 69% of the target. However, in terms of budgets utilized by Non-NARS partners, the target was exceeded by 99%.
Indicator 5 : Collaborative extension sub-projects under implementation or completed (validation trials)
Value (quantitative or Qualitative)
0 50 50 50
Date achieved 03/31/2008 03/31/2008 06/30/2014 10/31/2014 Comments Achieved: The target was fully achieved.
v
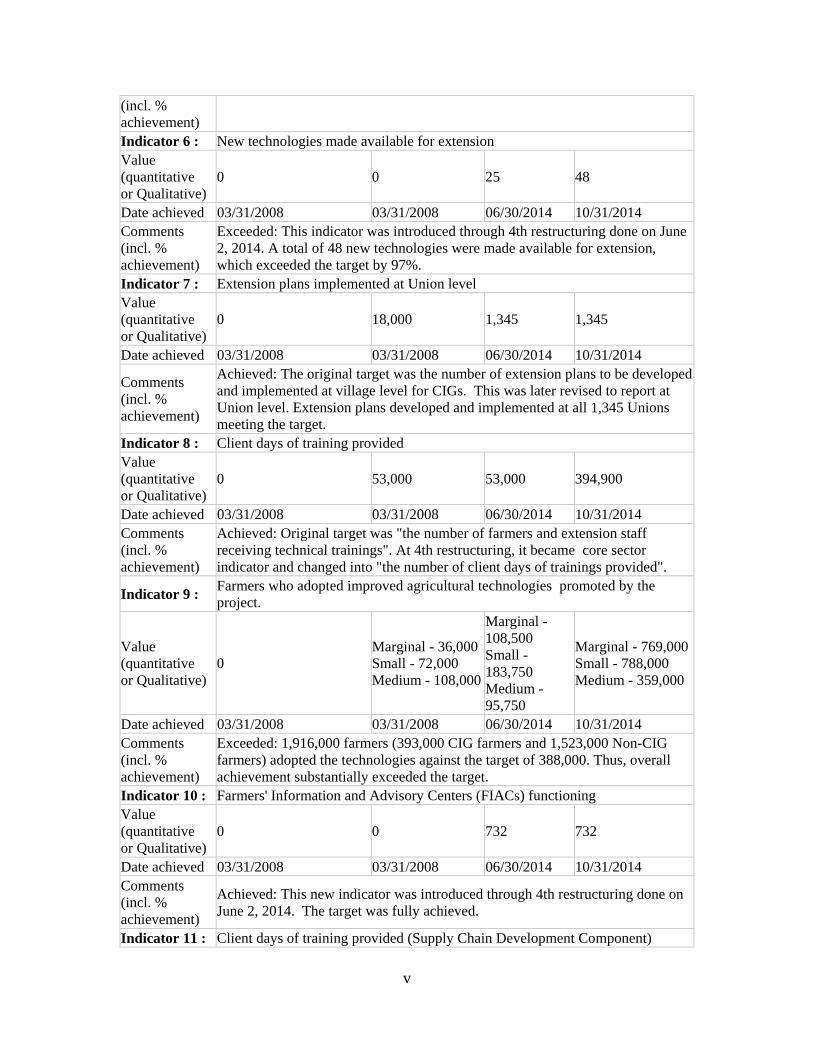
(incl. % achievement) Indicator 6 : New technologies made available for extension Value (quantitative or Qualitative)
0 0 25 48
Date achieved 03/31/2008 03/31/2008 06/30/2014 10/31/2014 Comments (incl. % achievement)
Exceeded: This indicator was introduced through 4th restructuring done on June 2, 2014. A total of 48 new technologies were made available for extension, which exceeded the target by 97%.
Indicator 7 : Extension plans implemented at Union level Value (quantitative or Qualitative)
0 18,000 1,345 1,345
Date achieved 03/31/2008 03/31/2008 06/30/2014 10/31/2014
Comments (incl. % achievement)
Achieved: The original target was the number of extension plans to be developed and implemented at village level for CIGs. This was later revised to report at Union level. Extension plans developed and implemented at all 1,345 Unions meeting the target.
Indicator 8 : Client days of training provided Value (quantitative or Qualitative)
0 53,000 53,000 394,900
Date achieved 03/31/2008 03/31/2008 06/30/2014 10/31/2014 Comments (incl. % achievement)
Achieved: Original target was "the number of farmers and extension staff receiving technical trainings". At 4th restructuring, it became core sector indicator and changed into "the number of client days of trainings provided".
Indicator 9 : Farmers who adopted improved agricultural technologies promoted by the project.
Value (quantitative or Qualitative)
0 Marginal - 36,000Small - 72,000 Medium - 108,000
Marginal - 108,500 Small - 183,750 Medium - 95,750
Marginal - 769,000Small - 788,000 Medium - 359,000
Date achieved 03/31/2008 03/31/2008 06/30/2014 10/31/2014 Comments (incl. % achievement)
Exceeded: 1,916,000 farmers (393,000 CIG farmers and 1,523,000 Non-CIG farmers) adopted the technologies against the target of 388,000. Thus, overall achievement substantially exceeded the target.
Indicator 10 : Farmers' Information and Advisory Centers (FIACs) functioning Value (quantitative or Qualitative)
0 0 732 732
Date achieved 03/31/2008 03/31/2008 06/30/2014 10/31/2014 Comments (incl. % achievement)
Achieved: This new indicator was introduced through 4th restructuring done on June 2, 2014. The target was fully achieved.
Indicator 11 : Client days of training provided (Supply Chain Development Component)

vi
Value (quantitative or Qualitative)
0 100 10,000 16,700
Date achieved 03/31/2008 03/31/2008 06/30/2014 10/31/2014
Comments (incl. % achievement)
Exceeded: Original target was "number of public and private staff, traders and farmers trained in commercial agricultural practices" but later changed to "number of client-days of training provided". The achievement exceeded the target by 67%.
Indicator 12 : Improved post-harvest technologies and management practices demonstrated and adopted
Value (quantitative or Qualitative)
0 20 20 32
Date achieved 03/31/2008 03/31/2008 06/30/2014 10/31/2014 Comments (incl. % achievement)
Exceeded: The achievement exceeded the target values by 60%.
Indicator 13 : Commodity Collection and Marketing Centers functioning Value (quantitative or Qualitative)
0 0 10 25
Date achieved 03/31/2008 03/31/2008 06/30/2014 10/31/2014 Comments (incl. % achievement)
Exceeded: This new indicator was introduced through 4th restructuring done on February 6, 2014. The achievement exceeded the target by 150%.
G. Ratings of Project Performance in ISRs
No. Date ISR Archived
DO IP Actual
Disbursements (USD millions)
1 08/01/2008 Satisfactory Satisfactory 0.30 2 02/09/2009 Satisfactory Moderately Satisfactory 4.55
3 08/17/2009 Moderately SatisfactoryModerately
Unsatisfactory 6.38
4 02/13/2010 Moderately SatisfactoryModerately
Unsatisfactory 9.51
5 05/21/2010 Moderately Satisfactory Moderately Satisfactory 12.22 6 12/17/2010 Moderately Satisfactory Moderately Satisfactory 18.47 7 06/13/2011 Moderately Satisfactory Moderately Satisfactory 21.91 8 12/04/2011 Moderately Satisfactory Moderately Satisfactory 25.39 9 06/03/2012 Satisfactory Moderately Satisfactory 30.65
10 12/12/2012 Satisfactory Moderately Satisfactory 35.91 11 06/20/2013 Moderately Satisfactory Moderately Satisfactory 42.86 12 12/21/2013 Satisfactory Moderately Satisfactory 48.57 13 06/06/2014 Satisfactory Moderately Satisfactory 51.92 14 12/04/2014 Satisfactory Moderately Satisfactory 55.54

vii
H. Restructuring (if any)
Restructuring Date(s)
Board Approved
PDO Change
ISR Ratings at Restructuring
Amount Disbursed at
Restructuring in USD millions
Reason for Restructuring & Key Changes Made
DO IP
03/31/2008 N 0.00 GoB’s contribution in project financing was set to 3% of total project cost.
12/17/2012 N S MS 35.91
Inconsistencies between the DPP and FA were resolved. Also, FA was amended to reflect establishment of PCT, reallocation/change in financing percentages’ definition of CIGs, and Operating Costs (Level II).
12/02/2013 N MS MS 46.72
IDA Credit Closing Date was extended by one year from December 31, 2013 to December 31, 2014.
02/06/2014 N S MS 51.13
An AF in the amount of US$7.1 million to support the scale-up of NATP, and a reallocation of Credit proceeds were approved by the Regional Vice President (combined AF and level I). Also, three new indicators to capture the quantitative achievements related to new technologies adopted, newly established CCMCs, and FIACs. .
03/04/2014 Y S MS 51.13
The following changes were introduced: (a) the PDO was revised; (b) safeguard policies on environmental assessment, pest management, and indigenous peoples were triggered; and (c) the environmental category of the project was

viii
Restructuring Date(s)
Board Approved
PDO Change
ISR Ratings at Restructuring
Amount Disbursed at
Restructuring in USD millions
Reason for Restructuring & Key Changes Made
DO IP
re-classified from C to B (combined AF and level I).
10/21/2014 N S MS 54.33
PDO level targets and intermediate outcome indicators were scaled back to “without AF” situation when it was decided not to proceed with AF.
12/30/2014 N S MS 55.54
IDA savings in the amount of SDR 2.12 million of the Credit (US$2.98 million equivalent) were cancelled as they could not be used within the project period.
If PDO and/or Key Outcome Targets were formally revised (approved by the original approving body) enter ratings below: Outcome Ratings Against Original PDO/Targets Satisfactory Against Formally Revised PDO/Targets Moderately Satisfactory Overall (weighted) rating Satisfactory
I. Disbursement Profile

ix

1
1.
Project Context, Development Objectives and Design
1.1 Context at Appraisal
1. At appraisal, the agriculture sector in Bangladesh accounted for 23% of the gross domestic product (GDP) and the rural non-farm economy, which is directly connected to agriculture contributed another 33% of GDP. Despite substantial progress in overall poverty reduction, about half of the population still lived below the poverty line. Around 85% of the total poor lived in rural areas. Therefore, improved economic performance of agriculture and rural non-farm sectors was considered critical to reducing poverty.
2. The agriculture sector was, and continues to be, characterized by small farm size and rice-dominated farming systems. The productivities of rice, wheat, maize and those for other commodities in fisheries and livestock were largely stagnant. Acceleration of agricultural growth was deemed to be constrained by: (i) weak technology generation and transfer; (ii) deteriorating and declining natural resource base, especially cultivable land; (iii) poor functioning of input and output markets and delivery of other support services; (iv) low private sector investment in agro-processing; and (v) weak local institutions to influence performance of the delivery of agricultural services by government agencies, including the large agricultural technology system (i.e. research and extension).
3. The Government of Bangladesh (GoB) requested assistance from the World Bank (the Bank) to increase public investment in agricultural research and to reform the technology system to help achieve the Poverty Reduction Strategy Paper (PRSP) objectives. In the Bank’s FY06-10 Country Assistance Strategy (CAS), strengthening of agricultural research and extension systems was identified as a key area to diversify traditional crops into high value crops, develop non-crop agriculture (fisheries and livestock) and intensify rice-based cropping systems. Also, the Bank’s earlier study on the National Agricultural Technology System (NATS) identified key areas for reform to enhance the efficiency and effectiveness of the technology system.
1.2 Original Project Development Objectives (PDO) and Key Indicators
4. The original PDO was to support Government of Bangladesh’s program to improve the effectiveness of NATS and to improve agricultural productivity and farm income.
5. Achievement of the PDO was to be measured by the following outcome indicators: (i) number of farmers adopting new agricultural technologies or management practices by size of landholding and type of farming system; (ii) increase in agricultural productivity; and (iii) increase in household net incomes by farm size and type of farm.1
1 There is an inconsistency between the key outcome indicators provided in the main text (page 8) and the Results Framework and Monitoring (Annex 3) of PAD. Since the Results Framework was used as the primary monitoring tool throughout the implementation, the outcome indicators provided in the Results Framework were used here.

2
1.3 Revised PDO and Key Indicators, and reasons/justification
6. The revised PDO was “to improve the effectiveness of NATS as measured by increases in agricultural productivity and farm income in selected districts”.
7. The PDO was revised to articulate it more specifically in terms of increased agricultural productivity and farm income in the project target areas. The key indicators to measure the achievement of the revised PDO were modified as: (i) increases in agricultural productivity; and (ii) increases in household income by farm size. Also, there was a refinement in the Intermediate Outcome Indicators, along with an increase in the target values associated with program scale-up resulting from the approval of Additional Financing (AF) funded by USAID Trust Fund (USAID TF). However, as lengthy Government AF approval procedures reduced the implementation period for the scaled up AF activities significantly, it was decided not to sign and activate the AF. Consequently, the refined indictors were retained but the targets were formally scaled back to the “without AF” situation.
1.4 Main Beneficiaries
8. Overall, at appraisal, the total number of households to benefit directly from the project was estimated to be 330,000 and the total number of beneficiaries 1.65 million. Key beneficiaries were divided into different groups as follows:
Marginal, small and medium farmers2. These were small and medium-size farmers, who would participate in the project through memberships in CIGs and non-CIG farmers, who would adopt the new technologies as part of knowledge and technology transfer activities;
Private entrepreneurs. These were private entrepreneurs, who were to participate in value chain improvement interventions under the project including local traders and processors in Upazillas;
National research and extension staff. A large number of researchers and extension staff of the national research and extension systems were also expected to benefit directly from the project through long-term (PhD and Masters level) studies, short-term on-the-job training programs and other capacity building activities.
1.5 Original Components
9. The project had four components: (i) Agricultural Research Support; (ii) Agricultural Extension Support; (iii) Development of Supply Chains; and (iv) Project Management and Coordination and was co-financed by IDA, IFAD, and GoB. 3 The individual components are summarized as follows:
2 An average marginal farmer has 0.2 ha of land, small farmer 0.5 ha of land and medium farmer 2.1 ha of land.
3 Around 74% of total project cost was financed by IDA, 23% by IFAD, and 3% by GoB respectively.

3
(i) Component 1: Agricultural Research Support (US$27.3 million). This component aimed to enhance the efficiency and effectiveness of the National Agricultural Research System (NARS). The component had a national coverage and financed: (a) competitive grants program (CGP); (b) Sponsored Public Goods Research (SPGR); and (c) activities for enhancing institutional efficiencies of NARS.
(ii) Component 2: Agricultural Extension Support (US$38.2 million). This component aimed to establish a decentralized, knowledge-based, demand-led extension service with greater accountability and responsiveness to farmers, with a focus on small and marginal farmers. The project was to cover about 25% of all districts/upazillas during first phase and finance the following activities: (a) mobilization of CIGs; (b) decentralization of extension service; and (c) enhancing the institutional efficiency of national institutions involved in agricultural extension.
(iii) Component 3: Development of Supply Chains (US$4.0 million). For increasing and
diversifying sources of income for small and marginal farmers, the development of supply chains of selected commodities was to be supported on a pilot basis. The project financed activities related to: (a) strengthening farmer-market linkages; and (b) enhancing institutional efficiencies of supply chain organizations.
(iv) Component 4: Project Management and Coordination (US$4.4 million). The Ministry of Agriculture (MOA - lead agency) and the Ministry of Fisheries and Livestock (MOFL) were the lead project implementing agencies. The Project Coordination Unit (PCU) at the MOA coordinated and facilitated the project implementation in collaboration with Project Implementation Units (PIUs) based at individual agencies.4
1.6 Revised Components
10. During implementation, there was no change in the four components of the project. An Additional Financing was approved on February 6, 2014 involving a scale up of key activities (SPGR sub-projects, CGP sub-projects, establishment of additional CIGs, additional Farmers’ Information and Advice Centers (FIACs), and additional Commodity Collection and Marketing Centers (CCMCs)) as well as expansion of the project area (additional six districts and 30 Upazilas). However, as lengthy Government AF approval procedures significantly reduced the period available for implementation of the scaled up AF activities, the Government and Bank management decided not to sign and activate the AF, but to shift these resources to the proposed follow-on operation. Subsequently, the component targets were rolled back to the without-AF situation through another project restructuring on October 21, 2014. As a result, eventually there was no change in the scope of the original project components.
1.7 Other significant changes
4 Project Implementation Units were located at: Department of Agriculture Extension (DAE), Department of Fisheries (DOF), Department of Livestock Services (DLS), Bangladesh Agricultural Research Council (BARC), Krishi Gobeshona Foundation (KGF), and the Horticulture Export Development Foundation (Hortex).

4
11. During project implementation seven restructurings (one level- I and five level-II) were approved and implemented. The following specific changes were introduced under the respective restructurings:
(i) On March 31, 2008, GoB’s contribution to total project costs was changed from 5% to 3% in Financing Agreement to reflect the accurate amount of GoB’s contribution as shown in the project cost table (Level II).
(ii) On December 23, 2012 some inconsistencies between the Development Project Proposal and the Financing Agreement were resolved. Also, the Financing Agreement was amended to reflect the following: establishment of a Procurement Core Team (PCT), reallocation/change in financing percentages, definition of CIGs, and Operating Costs (level II).
(iii) On December 2, 2013 the IDA Credit closing date was extended by one year from December 31, 2013 to December 31, 2014 to allow the project to finish uncompleted activities caused by delays in project implementation (level II).
(iv) On February 6, 2014, (a) an AF in the amount of US$7.1 million to support the scale-up of NATP, and (b) a reallocation of Credit proceeds were approved by the Regional Vice President and (c) three new indicators to capture the quantitative achievements related to new technologies adopted, newly established CCMCs, and FIACs.. (combined AF and level I).
(v) On March 4, 2014, (a) the PDO was revised; (b) safeguard policies on environmental assessment, pest management, and indigenous peoples were triggered; and (c) the environmental category of the project was re-classified from C to B (combined AF and level I).
(vi) On October 21, 2014, PDO level targets and intermediate outcome indicators were rolled back to the without-AF situation because, due to insufficient time for implementation, it was decided not to proceed with the AF (level II).
(vii) On December 30, 2014, IDA savings in the amount of SDR 2.12 million of the Credit (US$2.98 million equivalent) were cancelled. The cancellation was caused by implementation delays in project activities resulting from the protracted approval process of revisions to the Development Project Proposal (DPP) related to the February 2014 reallocation of Credit proceeds. Until RDPP approval, the project could not finance expenditures exceeding prior component/activity allocation ceilings. The cancelled IDA savings were used for other Bank activities in Bangladesh (level II).
2. Key Factors Affecting Implementation and Outcomes 2.1 Project Preparation, Design, and Quality at Entry
12. GoB’s Poverty Reduction Strategy Paper (PRSP) gave high priority to accelerating agricultural growth to increase rural income, reduce poverty, and improve food security. The PRSP identified increased productivity, diversification into High-Value Agriculture (HVA) and post-harvest value addition as the key drivers of future growth. The project preparation benefited from Bank’s study on Bangladesh’s NATS and Operations Evaluation Department’s (OED) project performance assessment, which highlighted the

5
importance of addressing the unfinished institutional reform agenda, including governance and autonomy issues of NARS as well as decentralization of extension service at district and lower levels.
13. The project design focused on intensification of rice-based cropping systems, diversification to high value crops and development of non-crop agriculture (fisheries and livestock), which were identified as key agriculture priorities in Bank's FY06-09 CAS. The project design paid particular attention to agriculture commercialization. It carefully designed pilot activities focusing on selected commodities identified through the Bank study on promotion of HVA commodities. The project also promoted a decentralized participatory planning and market-led integration in the supply chains. The pilot approach was chosen to ensure that small and marginal farmers, already resource-poor, were not exposed to undesirable risks which would affect them adversely. The project design took into account the lack of in-country capacity in promoting market-led HVA specifically involving small and marginal farmers and provided for international technical assistance.
14. The project was designed as the first phase of a three-phase Adaptable Program Loan (APL) based on the recognition that there is a need for long-term engagement in the sector to complete the institutional reforms in research and agricultural extension systems. This approach was consistent with GoB’s policy to avoid the 'stop and go' development pattern experienced in the past and linked to cycles of the externally-funded projects.
15. The reforms and institutional changes proposed under the project such as reorganizing BARC; developing new models for research funding to attract private sector, civil society, NGO stakeholders in implementing farmers-needs driven agriculture research, and decentralizing agriculture extension agencies with bottom-up and participatory approach were critically important design features for bringing a greater efficiency to NATSs.
16. However, the project design underestimated the complexity of the tasks involved and the time required for enacting the BARC Act and later on in developing the rules for its smooth implementation. The enactment of BARC Act was the disbursement condition of the Agriculture Research Component. Failure to obtain its timely approval led to delays in the implementation of the component.
17. The project was designed to bring together research, extension and value chain development aspects involving multiple agencies for implementation and requiring a more robust coordination mechanism, better role clarity and more explicit accountability arrangements for the agencies involved than the design of the project might have originally anticipated.
18. The Results Framework had some deficiencies including some lack of clarity in the definition of the PDO and outcome monitoring indicators. In some cases quantitative targets were ambiguous; for instance, the target increase in agricultural productivity provided in the Results Framework was given a combined percentage increase for all three types of farmers without providing a clear methodology how they were combined5. This
5 See Table 2, page 43, Annex 3 of PAD.

6
created confusion during implementation and consequently the PDO, monitoring indicators and some of the target values needed revisions at MTR. Even though a comprehensive risk assessment was conducted, the risk associated with delay in amendments to BARC Act was not foreseen at design stage.
2.2 Implementation
19. Overcoming the initial delays in implementation, the project was eventually able to deliver all key outputs. The implementation was flexible and responded effectively to various challenges encountered during the project period. The highlights of specific challenges and issues that the project faced during implementation, how they were addressed and key timelines are discussed below.
20. The project suffered from some serious delays in the beginning due to: (i) slow recruitment of PMU staff; (ii) weak implementation capacities of participating agencies; and (iii) difficulties associated with enactment of BARC Act and establishment of new institutions. The project was approved in February, 2008 but it took 11 months to appoint a full-time Project Director (PD) for the PCU, and several more months to recruit PCU technical experts. Also, the implementation of the Research Support Component could not start until December 2009 due to delays in the amendment of the BARC Act, which was a disbursement condition of this component. Owing to weak capacities of implementing agencies and teething problems of new and/or revitalized institutions such as the Krishi Gobeshona Foundation (KGF) and Horticulture Export Development Foundation (Hortex), the implementation of the agriculture research and supply chain components also experienced delays. This resulted in downgrading of project implementation progress to ‘Moderately Unsatisfactory’ in June 2009.
21. In response to this, the GoB renewed its commitment for reforms in agriculture research, extension, and the project management team stepped up its efforts to resolve the issues hindering the implementation progress. By the end of 2009, GoB approved the BARC Act amendment, filled key staffing positions, developed a comprehensive CIG mobilization strategy and revitalized the implementation process. As a result, in March 2010, project performance was upgraded to ‘Moderately Satisfactory’ status.
22. The project MTR conducted in March 2012 assessed that all performance triggers required to move from Phase I to Phase II of the 15 year APL were satisfactorily fulfilled: (i) Amendment of BARC Act; (ii) Establishment of KGF; and (iii) Decentralization of planning and funding responsibilities for demand-led extension micro plans to the Upazilla level organization.
23. Overall, despite the delays experienced during the initial period, most of the activities of the Project were completed by the closing date when disbursement reached around 92% of the target and US$2.98 million was cancelled mainly because some activities related to SPGR grants, training and consulting services could not be completed as planned. The savings resulted from cancellation were recommitted to the Country program.
2.3 Monitoring and Evaluation (M&E) Design, Implementation and Utilization
24. The Results Framework provided an adequate basis for assessing results, after some deficiencies were corrected through restructuring. Performance of the M&E system was

7
satisfactory, and during implementation, key physical outputs and outcomes were regularly monitored through Management Information System (MIS) and these were reported during regular Bank missions. At the outset of project implementation, a comprehensive M&E strategy was developed and roles and responsibilities of each Project Implementation Unit (PIU) (e.g. BARC, KGF, Department of Agriculture Extension (DAE), Department of Fisheries (DOF), Department of Livestock Services (DLS), and Hortex) for data collection, analysis and reporting were defined. The overall responsibility of the project M&E and reporting rested with the Project Coordination Unit (PCU) and each PIU had its own M&E Cell, which was tasked to design specific M&E plans to monitor and evaluate the project activities and report progress on key performance indicators.
25. During implementation, two independent assessments were carried out to review the implementation progress and assess project impacts. As part of these independent assessments, a series of stakeholder workshops (organized at strategically important locations of project area) and surveys were carried out to obtain feedback from key beneficiaries including farmers.
26. Also, a five-member independent Experts Impact Assessment Team (EIAT), composed of experienced specialists in economics, rural development and rural institutions, representatives from farmers’ associations and the private sector was established, which reviewed the implementation progress of M&E and commissioned independent impact assessment studies. Findings of EIAT were reported to the Project Steering Committee (PSC).
27. However, some shortcomings related to M&E were observed during implementation, which were subsequently rectified: (i) PIUs of implementing agencies (except at BARC) could not develop their own MISs as were originally designed; (ii) lack of coordination between the M&E at PCU and M&E Cells of PIUs; and (iii) M&E Cells did not document project achievements and results more systematically; and (iv) Capacities of M&E staff at PIUs were weak.
28. At the end of project implementation, the reports of M&E system, along with the independent impact assessment reports, served as the key source of data and information for assessing the project outcomes.
2.4 Safeguard and Fiduciary Compliance
29. Social safeguards. Safeguard Management Notes were mandatory for all sub-project proposals and those requiring private land, or requiring the displacement of people from either private or public lands were automatically rejected. Under the supply chain development component, CCMCs were constructed on public land which required no displacement or resettlement activities.
30. The safeguard policy on Indigenous Peoples (O.P 4.10) was triggered because the project area had some pockets with Indigenous People. However, specific plans were not developed because project specific activities were not implemented in areas of concentration of Indigenous Peoples. The research component of the project covered the whole country and some demonstrations were carried out to show higher value agricultural alternatives and livelihood improvement processes in areas with presence of Indigenous

8
Peoples, but these activities were undertaken on a consultative and voluntary basis and have been documented. The compliance with Indigenous Peoples policy is rated as Satisfactory.
31. Environmental Safeguards and Management. Envisaging no negative environmental impacts in the design phase, the project was originally classified as Category C and consequently, no safeguard policies were triggered. An Environmental Management Framework (EMF) was developed as a proactive measure to minimize any likely adverse impact of legally allowed pesticides that may occur during storage, handling and use. In addition, certain items, which are likely to have adverse environmental implications were excluded from implementation and listed in the EMF. However, realizing the risk of increased use of pesticides and chemical fertilizer and trial of new crops in the technology demonstrations involving crop, livestock, and fisheries, the Bank Task Team changed the safeguard classification of the project during restructuring in February 2014 from Category C to Category B and recommended that the project should adopt an adequate mechanism for environmental screening and monitoring. Adoption of green technologies was also recommended for environmental enhancement. The process triggered safeguard policies on Environmental Assessment (OP/BP 4.01) and Pest Management (OP 4.09). Compliance with these policies is rated as satisfactory.
32. The project adopted a process of environmental data collection and monitoring and also introduced a system for environmental screening of newly-constructed CCMCs, but the process of environmental screening was not introduced for other eligible micro-plans. The environmental monitoring system established by DAE, DLS, and DOF also recorded the positive impacts of the environmental management activities carried out under the project in terms of increased usage of organic manure, and biogas thus saving a sizeable amount of urea, pesticides. Also, under the project trainings were organized for farmers on poultry litter and carcass management.6 The project regularly disclosed its environmental monitoring data on the website for the general public.
33. Financial Management. The overall accounting and reporting system was reasonably functional at district/Upazilla, and Union levels. The Financial Management Systems (FMS) at PCU and PIU levels functioned adequately and regular quarterly and annual audit reports were compiled and consolidated on timely basis. There is no pending audit issue for the project. However, because of the project management structure involving multiple PIUs and PCU and different requirements of participating funding agencies (IDA, IFAD, and GOB), the FMS was complex in nature and sometimes ran into difficulties when it came to timely reporting and consolidation of financial reports from different accounting centers across the country, and incomplete fund reconciliation between PCU and PIUs.
34. Procurement. The procurement process and contract management experienced some initial delays. At the PMU level there was a team of two procurement consultants
6 Under the project, farmers used 85,000 tons of organic manure in the crop field, thus reducing the usage of urea by 11,000 tons and pesticides by 3,800 tons. Through the implementation of biogas plan farmers also reduced the fuel usage by 2,000 tons. Around 82,000 farmers received trainings on poultry litter and carcass management.
9
and each PIU had a procurement consultant. At the PIU level, there was high turnover among the procurement specialists. Project procurement plans were implemented largely successfully. Overall, more than 50 procurement plans were prepared during the project implementation period, the consolidation of these into fewer numbers of packages would probably have resulted in more efficient execution. This lesson learnt will be used in NATP-2, where common procurement items will be consolidated into larger packages. The meetings of PCTs placed more emphasis on implementation of procurement plans and documenting site visits, rather than focusing on improving capacity development, sustainability and process performance. During project implementation there was a strong presence of technical experts in the PCU along with reasonable in-house procurement capacity at DAE. However, procurement management capacities at other IAs were weak. Overall, the management setup and coordination mechanism for procurement between PCU and PIUs turned out to be challenging, requiring frequent attention and follow-up.
2.5 Post-completion Operation/Next Phase
35. The project was the first phase of a three-phase APL with the overall objective to improve the effectiveness of NATS in Bangladesh. Based on the achievements and lessons learned from the current project (see Section 6.1: Lessons Learned), the second phase, National Agricultural Technology Project-2 (NATP-2) has been designed.7 NATP-2 will continue promoting demand-driven, decentralized, agricultural technology system and will focus on sub-sectors such as crop, fisheries, and livestock anchored in a cross-sector research interventions. NATP-2 will also continue supporting BARC in implementing its reform agenda on agriculture research by promoting strategic partnerships with international research organizations on research management at BARC and develop technical and strategic skills at Bangladesh Fisheries Research Institute (BFRI) and Bangladesh Livestock Research Institute (BLRI).
36. NATP-2 will scale-up the project activities to 56 districts.8 It significantly expands on pilot activities for supply chain development carried out under the NATP and gives greater focus on enhancing access to market opportunities. Based on lessons learned under the project, NATP-2 will also adopt more consolidated implementation arrangement especially on fiduciary management aspects.
37. The project supported the establishment of new rural institutions such as KGF and CCMCs and also helped revitalize existing organizations such as Hortex. The Government has expressed its intention to continue supporting these institutions. BARC now has an expanded mandate in which it will directly receive funding from the Government to distribute to all agricultural research institutes.
3. Assessment of Outcomes9
7 NATP-2 was approved by the Board on June 5, 2015. 8 Horizontal expansions are expected in 31 new districts and vertical expansions are expected in the remaining 25
districts. 9 There was a formal revision of PDO through Level-I restructuring. However, the split rating was not used to evaluate
the project outcome. Instead, a single rating was used against the original project targets because: i) PDO revision was related to articulation rather than change in substance; ii) Level I restructuring was done only six months before project closing date when 93% of project expenditure was already disbursed.

10
3.1 Relevance of Objectives, Design, and Implementation
38. The PDO remained highly relevant throughout the entire implementation period. The project supported a broader GoB program aimed at increasing food security and agricultural production through a revitalization of the NATS. In the 2011 Bangladesh Country Investment Plan, a sustainable and diversified agriculture through integrated research and extension has been identified as a priority area for support. Further, the National Agricultural Extension Policy and the BARC Act approved/enacted in 2012 promote the development of decentralized, integrated, demand-driven agricultural research and extension services.
39. The project objective and scope are in line with the Bank’s current corporate strategic goals of eradicating extreme poverty while promoting shared prosperity at the global level and its strategic involvement in Bangladesh. In the Bank’s Country Partnership Strategy (CPS) for Bangladesh for FY11-14 (extended to FY15), agriculture is highlighted under Pillar 3: Vulnerability, Adaptation and Inclusion and Pillar 2: Economic Growth.
40. Also, project objectives and scope are fully aligned with IFAD’s current Country Strategic Opportunities Program for Bangladesh (2012-18) and its support for the NATS, which specifically defines improved value chains and greater market access for small producers and entrepreneurs as its strategic objective. IFAD’s strategic objective is to be achieved through promoting innovative technology and enabling producers to acquire the knowledge and skills needed to access input and output markets. At the time of Level 1 restructuring (PDO refinement to enhance measurability), the objective, design, and implementation arrangements remained relevant. The PDO, design and implementation features of the project at closure continued to remain relevant and have been incorporated into a new phase project- NATP-2, approved by the Board on June 5, 2015.
41. The project design remained highly relevant to the current development agenda of agricultural research and extension systems in the country as it promoted high priority, pluralistic, participatory and demand-led agricultural research including institutional reforms of NARS and supported decentralized, participatory, demand-led and knowledge-based agricultural extension service delivery. The development of market-driven supply chain remains to be a highly relevant approach in resolving the key constraints of the sector, as also reflected in the design of NATP-2.
42. Project implementation was highly relevant by effectively responding to changing needs and circumstances. It focused on performance improvements of government agencies and NGOs working at Union and village levels and promoted decentralized and demand driven extension service delivery.
3.2 Achievement of Project Development Objectives
43. The PDO was fully achieved. The outcome indicators for productivity and farm income achieved their targets. The outcomes achieved under the project are summarized

11
below (detailed project outputs by components are in the project datasheet and in Annex 2). The productivity and household income increases could not be immediately compared with their target values because the actual achievements could not be presented in the form of combined growth targets as were reported at appraisal. However, the actual productivity and income increases reported in range values clearly indicate that they were either substantially achieved or achieved their target values. Also the actual achievements in crop yields and household income increases were significantly higher than their baseline values as discussed in para 45 below.
44. Further, out of 13 agreed intermediate outcome indicators as detailed in the datasheet, five indicators exceeded stipulated targets, six indictors were fully achieved, and two indicators were substantially achieved.
45. Over the past five years, in the project area, per ha yield of crops increased between 29-99%; and the productivity of livestock increased by 6-71%, and that of fisheries by 107-193% against their baseline values. During the same period, household income increased for marginal farmers between 47-135%, for small farmers between 31-92%, and for medium-farmers between 23-77% against their baseline values. 10 Compared with the control group, average farm household income in the project area increased between 6-43% for various commodities.
46. The key outcomes achieved under the project are summarized below (detailed project outputs by components are in Annex 2).
A. Agricultural Research Support
47. Competitive Grants Program (CGP) and the Establishment of KGF: The project successfully established KGF - a new non-profit organization, which served as a pluralistic entity, where public and private sector entities and NGOs could participate in the implementation of agricultural research. The competitive grants mechanism promoted through KGF was demonstrated as an effective and efficient11 vehicle of collaboration and inclusion of non-conventional actors in agricultural research. CGPs contributed to enhancing responsiveness of research to the immediate needs and challenges of small and marginal famers through on-farm research and adaptation. They facilitated the implementation of site-specific and demand-driven research activities. Under the project, 84 CGPs were implemented substantially achieving their target of 100 CGPs.12 A total of 47 non-NARS partners participated in CGP against the target of 69. However, the fund
10 Detailed productivity and household income increases are provided in Annex 2 (para 1).
11 The presence of the GB and BoD gave the required flexibility (in terms of quick decision making regarding resource allocation and priority areas of research) to be responsive and adjust to emerging challenges of research which was
lacking in the public sector research system.
12 Intermediate Outcome Indicator 2, Results Framework.

12
allocated to non-NARS partners reached 59% of total CGP budget significantly exceeding the targeted 30%.13
48. Sponsored Public Goods Research (SPGR): The project also supported a significant amount of high-priority strategic and cross-cutting research works the national Agricultural Research Institutes (ARIs) coordinated by BARC. Under this scheme a total of 108 high priority sub-projects were completed exceeding their target of 45 SPRGs14 covering 12 eco-systems. About 24% of all SPRGs were focused on resolving agricultural technology issues related to vulnerable and climate stressed agro-ecological zones of the country (salinity/coastal, climate change affected, Hills, Hoar, Drought, Char and flood affected zones). Under the project, BARC prepared a Vision Document on Agriculture for 2030 and beyond, 15 an important strategic document on national agricultural research.
49. Improved Legal Framework for the National Agricultural Research System (NARS). An important outcome of the project was that it successfully supported the amendment of the 1996 BARC Act. The amendment improved the governance, institutional responsibilities and management system of NARS. The amendment also gave BARC an enhanced role in leading research coordination, prioritization and allocation of resources at the national level and strengthened its role in monitoring and evaluation of research. The amendment was approved by the Cabinet in December 2009 and passed by Parliament on March 4, 2012. Initial critical steps required for operationalizing the amendment to BARC started. To support the operationalization of amended BARC Act, the project developed two strategically important documents - Financial Codes Study and Institutional Development Manual – with key recommendations on enhancing transparency, financial autonomy and institutional effectiveness of NARS.16
50. The project also successfully funded 108 PhD scholarships both at national and international research and academic institutions fully achieving their target of 10917 in critically important agricultural research areas, which were identified through a comprehensive skills gap analysis at the national level.18 The project also supported the
13 Intermediate Outcome Indicator 4, Results Framework.
14 Intermediate Outcome Indicator 3, Results Framework.
15 Research Priorities in Bangladesh Agriculture – Bangladesh Agriculture Research Council Publication
16 The Financial Code Study was to help implement transparent and well monitored financial autonomy of the NARS institutes, segregating the capital investment fund for research infrastructure and project based operational funds based on merits, robustness and matching with research agenda. The Institutional Development Manual was to enhance the institutional effectiveness of the NARS system and build an internationally competent research service cadre to achieve national research priorities.
17 Intermediate Outcome Indicator 1, Results Framework.
18 Skills gaps identified were mainly in the area of molecular biology, biotechnology, agronomy, entomology amongst others (Source: Human Resources Development Plan for National Agricultural Research System in Bangladesh 2009 -2025); Key sub-sectors identified for priority setting included crops, livestock, fisheries, natural resources (soil),

13
establishment of an integrated Agricultural Research Management Information System (ARMIS) at BARC that linked 7 national agricultural research institutes. ARMIS developed, tested, and rolled out 9 key modules in important areas such as financial management, human resources management, inventory, library management, procurement, research, training, vehicle and data bank. The project also established M&E Cells at all networked institutions and trained all relevant personnel in data entry and management.
51. In summary, by promoting greater competition in agricultural research through pluralistic, demand-driven agricultural research and strengthening national research capacities in strategic skills areas and by enhancing the legal and institutional frameworks of the country’s agricultural research systems, this component directly contributes to the overall project development objective of improving the effectiveness of the national agricultural technology system.
B. Agricultural Extension Support
52. Farmer Institutions Established. The project established more than 20,000 Common Interest Groups (CIG) in crop, livestock, and fisheries sub-sectors.19 Being a village-level producer organization, CIGs acted as key focal points for technology demonstration, dissemination, field days, training as well as input supply (provision of small equipment and machinery and seeds). A majority of CIG members were marginal and small farmers: out of total 398,700 CIG member farmers, 81% were marginal and small farmers. Despite substantial CIG achievements at village levels, efforts to aggregate them into higher-level Producer Organizations to better facilitate farmers’ access to technical, financial and marketing services were largely not achieved.
53. Participatory extension service plans were prepared, implemented and the process regularized and trainings organized. With direct project support, each year around 18,000 of village-level extension plans were prepared and implemented with direct participation of CIG farmers. This amounts to 1,345 Union-level extension service plans fully achieving their target of 1,345 plans.20 The participatory approach made the village-level extension plans more demand- responsive and helped selecting most appropriate technologies for farmers. The Union level then aggregated at Upazilla level and the process was regularized. The project organized in total 394,900 client-days of training significantly exceeding its target of 53,000 client-days of training.21 The project also supported the establishment of 732 Farmers’ Information and Advice Centers (FIACs) to provide farm advisory services
human nutrition, agricultural economics, agricultural mechanization, ICT. PhD scholarships were awarded in areas of agronomy, molecular biology, biotechnology, entomology, soil science, biometric genetics, aquaculture and GIS.
19 Of total CIGs, 67% were in crop, 19% in livestock, and 14% in fisheries subsectors.
20 Intermediate Outcome Indicator 7, Results Framework.
21 Intermediate Outcome Indicator 8, Results Framework.

14
to farmers at the union level achieving its target at 100%.22 Though the project was able to achieve some convergence in the participatory program planning by the three line extension agencies, actual implementation was done mostly by the three agencies separately, thereby potentially missing out on opportunities for better synergy and complementarity.
54. Improved and new technology packages are developed and disseminated. Under the project, a total of 48 location-specific improved and new technology packages (16 for crops, 11 for livestock and 20 for fisheries) were developed and made available to farmers for adoption exceeding their target of 25 technology packages.23 The technology packages focused on: (i) resource use efficiency and yield gap minimization for rice-based cropping system; (ii) diversification of the cropping system into high value crops; and (iii) livestock and fishery productivity enhancement. For technology dissemination, demonstration plots, farmer field days and formal farmer trainings were organized. An estimated 1.9 million farmers adopted improved agricultural technologies significantly exceeding their target of 0.39 million farmers.24 This include 0.4 million adopters,25 who are CIG members and 1.5 million farmers outside the CIGs. Marginal farmers constituted 39% and small farmers 42% of total adopters. Though the project was able to improve the research–extension-farmer linkage to some extent through strengthening of extension planning mechanism, further improvements are needed to achieve lasting impacts. In addition, 50 collaborative extension sub-projects were implemented achieving their target at 100%.26
55. Improved National Agricultural Extension Policy. The project provided support to the DAE in revising and improving the National Agricultural Extension Policy. The updated policy promotes the adoption of demand-driven decentralized extension approach in all programs of DAE; promoting low-cost high-impact, demand-responsive technology packages for accelerated agricultural growth; and differentiated targeting to address the challenges and opportunities from main agro-ecological and economically constrained areas. The policy is in draft form pending approval by the Government.
56. In summary, by establishing and supporting grass-root level farmers’ organizations (CIGs) as the key platform for promoting more efficient extension services, and by developing and disseminating improved and new technologies, this component directly
22 Intermediate Outcome Indicator 10, Results Framework.
23 Intermediate Outcome Indicator 6, Results Framework.
24 Intermediate Outcome Indicator 9, Results Framework.
25 Technology adoption is counted only once irrespective of number of technologies adopted by each farmer. These are sustained adopters of the technology as they are adopting technology packages for more than one year/season after getting exposed to the technology.
26 Intermediate Outcome Indicator 5, Results Framework.

15
contributed to enhancing the overall effectiveness of the national agricultural technology system.
C. Development of Supply Chains
57. Producer Organizations established. The project established 20 Producer Organizations (PO) vertically integrating small and marginal farmers with agri-business enterprises along the supply chains. This involved 402 village-level CIGs (against the original target of 20 POs and 200 CIGs). The POs provided farmers with a new model to reduce their post-harvest losses and realize their produce at better prices and provided market information, trainings on post-harvest and marketing aspects.
58. Post–harvest technologies demonstrated and disseminated for adoption. The project successfully demonstrated and disseminated 32 new and improved post-harvest technologies significantly exceeding the target of 20 new and improved post-harvest technologies.27 As a result 21,810 farmers adopted these new and improved technologies in improved sorting and grading, poly cap use in banana, use of gerbera cup, perforated rose cap, pulsing treatment, ice packaging of rose, use of trolley, harvesting tools, zero energy cooler, steeping technology in lemon, solar drier and modified atmospheric packaging in vegetables and fruits, milk. These technologies helped reduce post-harvest loss of high value commodities by 5 to 18%. In floriculture sector alone adoption of recommended technologies helped farmers receive 60% higher price than non-adopters.
59. A new model for CCMCs was developed and pilot tested. The project established 25 CCMCs at rural markets accessible by farmer groups, traders, and assemblers against the targeted 25 CCMCs.28 The CCMCs improved the marketing channels and links between traders and farmers through mobilizing them from farm gate to rural and urban/city markets for selling of their high value agricultural produces comparatively at higher profit. The CCMCs were provided with facilities for washing, grading and in some cases storing produces. Initial report suggests that CCMCs gained 10 to 15% more price for their produce compared with local markets.
60. Enhanced capacities. The capacities of about 1,500 farmers, traders, and line agency officials were strengthened through a series of training programs, workshops, domestic and international exposure visits and dissemination materials in areas such as agri-business development, processing of flowers, herbals and honey products, contract farming systems, post-harvest handling, storage, packaging, and fish marketing. In total 16,700 client-days of training were organized among beneficiaries of supply chain component significantly exceeding their target of 10,000 client days of training.29
27 Intermediate Outcome Indicator 12, Results Framework.
28 Intermediate Outcome Indicator 13, Results Framework.
29 Intermediate Outcome Indicator 11, Results Framework.
16
61. In summary, by supporting new forms of vertical integration of farmers and agribusiness enterprises, disseminating modern post-harvest technologies, and linking farmers and market, this component directly contributes to enhancing the NATSs.
3.3 Efficiency
62. Overall, the economic efficiency of the project was found to be substantial. Cost-benefit analysis of the project was conducted over a 20-year period (see Annex 3 for details) and costs and benefits were estimated at 2014 prices with a 12-percent opportunity cost of capital. In the PAD, the project was expected to yield an Economic Internal Rate of Return (EIRR) of about 35%. At ICR stage the mission conservatively assessed the project’s EIRR at 30%. Overhead costs for appropriate project service delivery were reduced during implementation from 12% to 6%.
63. The Financial analysis was conducted comparing impacts of new technologies on farm income. Results show that adoption of new and improved varieties and management practices enabled farmers to generate substantial financial benefits. CIG farm household income as compared to the control group ranged between 6-43% for various commodities. The project focused on improving the income situation of marginal and small farmers constituting over 80% of benefitting households, and results show those poorer farmers often generated proportionally higher incomes over the respective control groups than medium farmers.
64. Economic analysis was conducted to show the long-term economic viability of the project. After adjusting financial prices with parameters such as shadow wage rate and parity prices, the analysis prepared farm models to estimate the ‘on-site’ incremental net benefits. These models represent the project objectives, namely for crops to intensify mainly rice production and diversify cultivation at farm level by introducing high value vegetables and generate additional income through marketing activities to minimize post-harvest losses. Livestock and fisheries activities showed noticeable yield increases due to the adoption of technology packages for dairy cow rearing and carp polyculture. Assuming that farmers realized 75-100% of the benefits, aggregated economic returns to the project show that benefits were substantial. The EIRR over the analysis period is estimated at 30% and the Net Present Value of BDT6272.8 million. It is important to note that the NATP would have achieved a higher EIRR, more in line with the PAD estimate, if the one-year extension had been avoided, as the longer implementation period increased project management costs and shifted benefit inflows further into the future. Benefits accruing to non-CIG farmers were not counted in the economic analysis, but if done so, would enhance substantially the overall benefits of the project.
65. In addition, non-quantifiable benefits accrued under NATP were: (i) improved nutrition at household level; (ii) improved advisory service provision for all farmers at union level; (iii) improved capacity of local private sector actors; (iv) medium- and long-term impacts from outputs of the improved national research system; (v) knowledge generation by research staff; (vi) capacity development of research and extension staff; and (vii) empowerment of farmers through participatory planning and group registration as well as during field testing for research purposes.
66. A basic sensitivity analysis was conducted against key variables (prices, yields) affecting the project showing that returns remained robust and above the opportunity cost

17
of capital. The combined 20% reduction in output prices for rice and vegetable would result in an EIRR of 26%. A 10% decrease in yields of rice, vegetable, carp and milk yields results would result in EIRR between 13-28%, which are still greater than the opportunity cost of capital.
3.4 Justification of Overall Outcome Rating
Rating: Satisfactory
67. Overall, the project outcome is rated as Satisfactory. As discussed in Sections 3.1 and 3.2 above, the project objectives, design, and implementation remained highly relevant throughout the implementation period. The project achieved significant outcomes in terms of improving national agricultural technology systems as it successfully promoted new and innovative approaches and institutions for agriculture research, extension, farmers’ group organizations and also pilot-tested new rural service organizations such as CCMC and FIAC. The project also made significant contributions to capacity building of national agriculture research organizations and introduced substantial legal and institutional reforms.
68. Further, the economic and financial analyses results in Section 3.3 confirm that the project achieved its development objectives efficiently. The project met most of its targets and even exceeded some by significantly increasing crop yields, livestock and fisheries productivities, and household incomes.
3.5 Overarching Themes, Other Outcomes and Impacts
(a) Poverty Impacts, Gender Aspects, and Social Development
69. Poverty impacts. In a country with 47 million people still living in poverty of which 70% in rural areas, activities to strengthen farmers’ livelihoods were an appropriate focus of the project. Given that marginal and small farmers account for over 90 percent of the country’s rural population and make up for the vast majority of the country’s poor, significant attention was paid to enhance farm productivity and improve living conditions of marginal, including landless and small farmers, in the project area.
70. Through adoption of improved farming technologies, the farmers supported by the project increased their income by the end of project implementation as compared to control groups. For instance, the annual income of marginal CIG farmers was 42% higher than farmers in control group. Comparing gross margin increases across farmer groups, marginal farmers achieved on many occasions higher gross margin increases than small or medium farmers. Through facilitation of income increases, the project contributed to building resilience among poorer CIG farm households who were able to decrease annual expenditures on food to 43.7% as compared to the control group (50.5%). Other respective expenditures shares for education were 8.6% for CIG and 7.8% for control respondents. For house construction and repair this difference was even more pronounced with 7.9% compared to 4.2%.
71. Gender. The project required that under the extension component, CIGs must comprise of at least 20% female members, but under the DAE, the CIGs now comprise 30% female members. The CIGs under the DLS comprises of 26% female members, whereas the target was 20%. The CIGs under the DOF comprises of 18% female members,
18
although the target was 20%. Traditionally and professionally fishing is not a sector where there are a lot of women involved; hence the relatively lower participation rate in these CIGs vis-à-vis other CIGs. According to field missions carried out, women members in the CIGs are found to be better informed and more engaged in the group’s activities. Their participation in the decision making process is also robust and female members are often found in leadership positions in the CIGs (president, secretary or treasurer).
72. The project interventions for women focused on vegetable and fruit production in the homestead areas, compost preparation, seed preservation, beef fattening and aquaculture. Involvement in production activities offered women the opportunities to get actively involved in CIG activities and also take up gainful employment related to CIG activities. Under the supply chain activities, pulsing and capping of flower generated a good amount of income for the livelihood support of marginal farmers, and these practices also generated employment for marginal farm women.
73. Social Development/Inclusion. The project implementation strategy of promoting decentralized extension services and bottom-up planning processes was a powerful tool for marginal and small farmers’ empowerment and fostering leadership capabilities of CIG/community leaders. A key element of social inclusion and targeting was also the focus on women and the application of mechanisms to facilitate their involvement in project interventions.
(b) Institutional Change/Strengthening
74. The project made significant contributions to institutional development of NATSs.
75. Establishment of an innovative agriculture research organization: KGF contributed to development of a pluralistic agricultural system. It broadened approaches to research funding and governance systems which facilitated involvement of NGOs, public sector institutions as well as public and private universities. It proved to be an innovative approach to advancing agricultural research and development.
76. ‘One stop’ extension services to farmers: Establishment of FIACs facilitated a more holistic approach to information and technology dissemination of extension services. FIACs served as integrated platforms where extension support services could be delivered. As a one-stop shop, they contributed to the reduction of transaction costs (time saving) for farmers who did not have to visit multiple locations and forged strong links with local government, which fostered ownership and ensured sustainability and quality service delivery.
77. Institutions of the small and marginal farmers: The project established new grassroots organization with focus on marginal farmers and small farmers – CIGs - and brought in as partners in the decentralized, farmer-led and knowledge-based approach for agricultural extension. These gender sensitive primary institutions were assessed and graded for performance and federated into Producer Organizations.
78. Moving farmers closer to consumers: CCMCs were established on a pilot basis to improve marketing channels between small and marginal farmers and traders. This assisted participating CIG farmers in achieving higher profits from sale of high value produce. Inclusive management structures allowed farmers to have greater control over price setting, facilitating a shift away from the characteristic of price taking normally associated with

19
small and marginal farmers. Since it was a pilot, the CCMC model was in the process of review to assess potential for scale up in the follow on operation.
(c) Other Unintended Outcomes and Impacts
79. Technology generation coming out of research was largely geared towards strengthening research-extension-farmer linkage. However, some SPGR sub-projects30 were also able to demonstrate potential benefits of strengthening research-private-sector linkages not considered under public research.
80. Local government institutions forged strong ties with FIACs which created strong ownership that ensured quality and sustainable service delivery.
4. Assessment of Risk to Development Outcome
Rating: Moderate 81. Most project outcomes are sustainable in medium to long-term period. A large number of scientists, researchers and extension specialists trained under the project continue to provide a solid basis for the sustainability of research and extension organizations. Reforms and improved legal framework for national agriculture research implemented under the project further reduces the risks to project development outcome. The Government has indicated its longer term commitment to new institutions such as KGF by agreeing to channel research fund through it.
82. At the same time, the following specific areas need continued attention of the Government and other stakeholders to minimize residual risks to development outcomes:
i. The recommendations from the institutional and financial reforms studies completed under the project need to be implemented to further strengthen specific aspects of the governance of the technology system. The project laid out the groundwork to further deepen institutional reform in the next operation.
ii. KGF fiduciary capacity requires strengthening especially as it moves towards the use of its Endowment Fund with an allocation significantly higher than what was allocated under the project.
iii. Hortex Foundation’s current resource generation capacity is largely dependent on external funding. Its collaborative partnerships with line agencies require further strengthening.
30 BARI had developed a production package for high value horticulture crops through hydroponics, an alternative vegetable production technique that increased year round vegetable production. BARI signed a MoU with BRAC for further development and distribution to farmers. BRAC has country-wide coverage and the potential for mass-upscaling and uptake is significant.

20
5. Assessment of Bank and Borrower Performance 5.1 Bank Performance (a) Bank Performance in Ensuring Quality at Entry Rating: Moderately Satisfactory.
83. The Bank team ensured that the project design incorporated key lessons from relevant projects of the Bank and other donors in the country and globally. The diagnosis work and technical solutions identified were relevant and the rationale for Bank’s intervention was firmly established. The project was designed to accelerate diversification of agricultural production systems to high value commodities along with piloting of post-harvest value addition, which were identified in Bank’s CPS as key priority.
84. The project approach for strengthening pluralistic institutional structure of the research and extension service providers through partnerships among public research and extension agencies with universities, NGOs and private sector proved to be highly relevant. The project design also incorporated formation and strengthening of grass roots, farmer institutions of CIGs and federating them at a higher level to provide more farmer-focused and demand responsive plans and programs for implementation.
85. The project design promoted major reforms in agriculture research. However, it underestimated the time required for first, getting the Act amended through the legislative process which are prone to protracted delays and secondly to frame and implement institutional and financial reform rules to operationalize the amended Act. Also, there were certain ambiguities in the definition of the PDO, outcome indicators, and quantitative targets, which created some confusion needing corrective revisions during implementation. This led to the rating of the Bank performance in ensuring quality at entry as moderately satisfactory.
(b) Quality of Supervision
Rating: Moderately Satisfactory.
86. The Bank team carried out 12 review missions to support project implementation. All the task team leaders were Dhaka-based, who maintained effective working relationships with the implementing agencies. The supervision missions delved into key emerging implementation issues providing practical recommendations and sound technical solutions as documented in the aide-memoires which were shared with the project teams well before the wrap up meetings. The implementing agencies were provided adequate opportunity to clarify issues raised in the aide-memoire.
87. Considering the complexity of having different line departments and institutions implementing the project, the Bank team balanced their support to ensure that all components and institutions were adequately covered and supported for. The mission composition also benefited from different skill mixes to cater to the demands of the project team. The Bank team helped revising the Results Framework to adequately re-define PDO and performance indicators so that monitoring of the project was robust and realistic. The overall Bank supervision and support, particularly during the post-MTR phase, consisted

21
of strong technical, managerial and fiduciary elements which made significant positive contribution towards achievement of project results and enhancing its impact.
88. The project was originally designed to provide demonstration and related training to CIG farmers with the main focus on increasing adoption. The Bank supervision missions stressed the need for focusing also on the non-CIG farmers for adoption of improved technologies promoted by the project. It was also revealed that the main constraining factors for adoption were non-availability of seeds and minor agriculture equipment. The MTR mission recommended support to establish seed banks in villages, fish nursery, breeds and insemination arrangements, minor equipment like pellet machines for fish feed making, fishing nets, seed and fertilizer placement machines.
89. At the same time, certain shortcomings were observed in Bank’s support. For instance, the MTR mission was fielded one year later than originally planned (March, 2012). Timely fielding of MTR would have reduced project implementation delays. Also, it took a considerable time for the Bank team (and Government) to prepare the AF of $25 million (USAID-financed Trust Fund) to scale up project activities. Its preparation started in the second half of 2012 but because of changes in the processing modality during preparation (initially started as a stand-alone project, then changed to AF) and various Government approval procedures, AF approval was delayed until February 2014 (Bank) and August 2014 (Government). The AF was eventually dropped because insufficient time remained to implement the planned activities. The quality of Bank’s supervision has been rated as Moderately Satisfactory.
(c) Justification of Rating for Overall Bank Performance
Rating: Moderately Satisfactory.
90. Overall, the Bank team did solid work at the entry level and the project design is found to be sound despite some shortcomings such as under-estimation of challenges related to reforms at research organizations and less clearly articulated PDO and quantitative targets set in the initial Results Framework. During implementation, the Bank team was proactive, identified issues on timely basis and facilitated appropriate solutions including those that occurred during design stage. However, Bank team’s implementation support suffered from shortcomings such as late fielding of MTR mission and slow processing of the AF, which was never signed. Given Bank’s performance in ensuring Quality at Entry is rated as Moderately Satisfactory and Bank’s performance for implementation support is rated as Moderately Satisfactory, the ICRR team rates the Bank’s overall performance as Moderately Satisfactory.
5.2 Borrower Performance (a) Government Performance Rating: Moderately Satisfactory 91. The Government of Bangladesh was fully committed to and had a strong ownership of the project, which was evident both during preparation and implementation. While the Government ensured that BARC Act was eventually enacted, considerable delay in that

22
process affected project implementation. There were also delays in approving DPPs and RDPPs (and later on in its amendment in connection with the processing of AF) by the Planning Commission, as well as in appointing PCU Director and key project staff. In view of these, Government’s performance is rated as Moderately Satisfactory.
(b) Implementing Agencies’ Performance
Rating: Moderately Satisfactory
92. There were two Implementing Agencies (IAs) - MOA and MOFL - which together had six PIUs.31 The MOA acted as Lead Implementing Agency and housed the PCU that performed the challenging task of coordinating implementation through the PIUs and the dedicated team of staff members established within each of the IAs. The PCU was also supported by national level Project Steering Committee (PSC) chaired by Secretary of MOA and Secretary of MOFL on alternate basis. All heads of the departments were members in the Steering Committee. While the PSC focused on higher level policy and enabling issues, there was a Project Management Committee to resolve coordination and other inter-agency operational issues. The PCU coordinated project implementation among the PIUs, while maintaining the critical upward strategic communication with national level policy makers. The mission reports prepared by the PCU consolidating progress, lessons learned and implementation issues, in preparation for the different Bank missions were of good quality, both in its contents and facts presented. Delays in project implementation due to weak capacities and slow appointments of PIU staff, as also delays in taking actions to process AF affected the project performance. Also, there were issues related to timely submission of information, communication delays among the PIUs and between PIUs and PCU occasionally. The performance of the MOA was Moderately Satisfactory.
93. MOFL implemented the livestock and fisheries related activities of the project through DLS and DOF. MOFL performed efficiently and delivered its key outputs as envisaged under the project, closely coordinated its activities with MOA, in particular with PCU. The performance of MOFL was Satisfactory. The combined overall performance of the IAs was assessed as Moderately Satisfactory.
(c) Justification of Rating for Overall Borrower Performance
Rating: Given the performance ratings of the Government and IAs, the overall Borrower’s performance is rated as Moderately Satisfactory.
6. Lessons Learned
The following key lessons were learned from the project:
94. Ensuring effective linkages between research-extension-farmers is not easy and continues to be in need of new and innovative solutions: Despite tangible progress being made to improve the linkages between researchers, extension agents, and farmers through innovative approaches such as CGP, decentralized extension service, and CIGs, there is
31 The Bangladesh Agricultural Research Council (BARC), Krishi Gobeshona (Agricultural Research) Foundation (KGF), Department of Agricultural Extension (DAE), Department of Livestock Services (DLS), Department of Fisheries (DOF) and Horticulture Export Development Foundation (Hortex).

23
still significant room to further enhance their linkages through better coordination and incentives. Under the project there were a number of cases, where researchers developed new productivity enhancing technologies, but because of organizational silos, inertia, lack of incentive systems in individual agencies, they could not always be quickly transferred to extension and onwards to farmers. There clearly continue to be opportunities to develop more effective and innovative approaches to strengthen the research-extension-farmers linkages.
95. The need to expand the focus of the research and extension service agendas towards more agriculture commercialization, value chain, and agribusiness related areas are fast emerging as a priority: A majority of research activities currently being carried out under the project is focused on enhancing farm-level productivity, and on narrowing the yield gaps between progressive and average farmers. However, with ongoing transformation of farming towards greater commercialization, there is a fast emerging need to expand the research and extension agendas to also effectively cover post-harvest management and value-addition. .
96. To maximize long-term impacts and effectiveness of major investments currently being made into NARS, there is a need for continued support of ongoing institutional reforms at BARC and ARIs: The 2012 BARC Act, amended with project support, provides a significant scope to further improve the efficiency and effectiveness of the NARS through improved research coordination, prioritization, and allocation of resources to agreed priorities, and enhanced monitoring and evaluation of research. The implementation of 2012 BARC Act is crucial in sustaining and augmenting the positive impacts of ongoing major investment in research.
97. The implementation arrangement of a complex project such as this one needs streamlining to achieve greater coordination, efficiency, and accountability: The project implementation experience shows that proper coordination of activities involving a large number of IAs is a major challenge often resulting in inefficiencies, duplications, weak accountability, and difficulties in Monitoring and Evaluation. Based on the lessons learned from NATP, the follow-up project has been designed with sub sector components led by the corresponding specialized agency (e.g. livestock component with a PIU at DLS, Fisheries component with a PIU at DOF etc.). That way, under the recently approved NATP-2 it was possible to limit the number of PIUs to four. Moreover, to take advantage of economies of scale, increase procurement efficiency and achieve savings, same items will be pooled and procured through a process initiated by NATP-2 (not by the respective agencies).
98. Before deciding on AF to scale-up an ongoing project, Bank teams and Government counterparts should make thorough and realistic assessment on time and bureaucratic procedural requirements needed for obtaining Government approval, and also anticipate potential delays and distractions that the processing of the AF itself could cause to the implementation of an on-going project. Likewise, additional reform of Trust Fund procedures to streamline processing requirements would reduce the administrative burden on task teams and allow greater time to focus on implementation and results.
7. Comments on Issues Raised by Borrower/IAs/Partners
(a) Borrower/IAs

24
99. Comments on the draft ICR were received from the Government of Bangladesh (reproduced unedited in Annex 6) and were largely incorporated in the final ICRR.
100. In summary, the Government noted that the ICRR had covered all aspects comprehensively and lessons learned from NATP were incorporated into the design of the recently approved NATP-2. The Government requested that several data references be updated (which was done). The Government further noted that despite overall project outcome being assessed as Satisfactory, the performance rating of the Borrower was assessed as Moderately Satisfactory and requested that the Bank consider upgrading this rating.
101. The ICRR preparation team’s assessment of Borrower’s performance rating of Moderately Satisfactory is based on several facts including significant delays in appointing key project staff at project start, delays in amending the BARC ACT, and also prolonged Government process of approving the revised DPP needed for credit reallocations and AF approval. On the other hand, the rating of overall project outcome as Satisfactory is based on assessment of PDO as measured by productivity and income increases for marginal-, small-, and medium-size farmers and also based on efficiency levels achieved for the project intervention. Based on these rationales, the ICRR preparation team retained the current rating of Borrower’s performance as Moderately Satisfactory. Further details on the rationale of performance assessment are provided in paras 20, 91, and 92 above.
(b) Co-financier- IFAD
102. IFAD commented that the performance evaluation of IAs (Section 5.2(b)) is not complete and should also present the evaluation of such agencies as DAE, DLS, DOF, and Hortex Foundation.
103. The ICRR preparation team’s assessment of IAs are focused primarily on MOA and MFL, which are formally defined in the Legal Agreement as the IAs. The performance of PCU was also discussed, which had six individual PIUs located at agencies such as BARC, KGF, DAE, DLS, DOF, and Hortex. The performances of individual PIUs or their host agencies are evaluated in different sections of ICRR (paras 20, 24, 37, 82(iii), 97 and Annex 2) in various contexts of project implementation, final deliverables, capacities and sustainability.
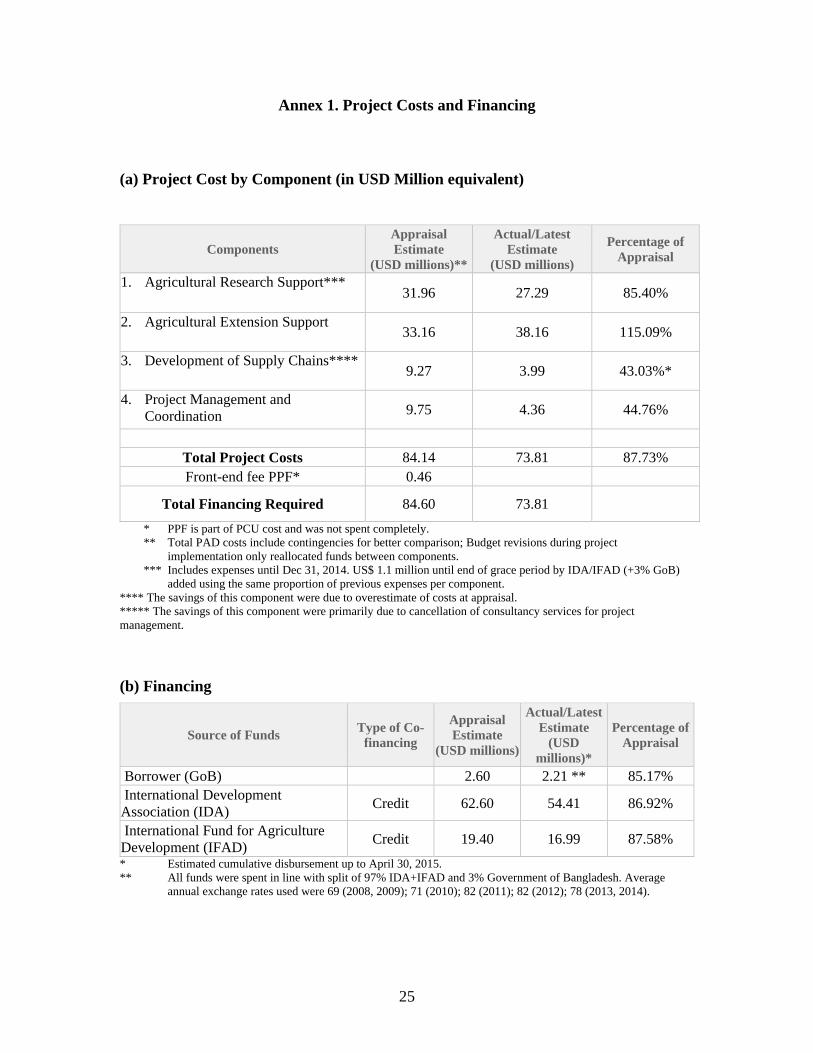
25
Annex 1. Project Costs and Financing
(a) Project Cost by Component (in USD Million equivalent)
Components Appraisal Estimate
(USD millions)**
Actual/Latest Estimate
(USD millions)
Percentage of Appraisal
1. Agricultural Research Support*** 31.96 27.29 85.40%
2. Agricultural Extension Support 33.16 38.16 115.09%
3. Development of Supply Chains****9.27 3.99 43.03%*
4. Project Management and Coordination 9.75 4.36 44.76%
Total Project Costs 84.14 73.81 87.73% Front-end fee PPF* 0.46
Total Financing Required 84.60 73.81
* PPF is part of PCU cost and was not spent completely. ** Total PAD costs include contingencies for better comparison; Budget revisions during project
implementation only reallocated funds between components. *** Includes expenses until Dec 31, 2014. US$ 1.1 million until end of grace period by IDA/IFAD (+3% GoB)
added using the same proportion of previous expenses per component. **** The savings of this component were due to overestimate of costs at appraisal. ***** The savings of this component were primarily due to cancellation of consultancy services for project management.
(b) Financing
Source of Funds Type of Co-
financing
Appraisal Estimate
(USD millions)
Actual/Latest Estimate
(USD millions)*
Percentage of Appraisal
Borrower (GoB) 2.60 2.21 ** 85.17% International Development Association (IDA)
Credit 62.60 54.41 86.92%
International Fund for Agriculture Development (IFAD)
Credit 19.40 16.99 87.58%
* Estimated cumulative disbursement up to April 30, 2015. ** All funds were spent in line with split of 97% IDA+IFAD and 3% Government of Bangladesh. Average
annual exchange rates used were 69 (2008, 2009); 71 (2010); 82 (2011); 82 (2012); 78 (2013, 2014).

26
Annex 2. Outputs by Component
1. The key project achievements on productivity and household income increases against the baseline values are provided below:
(a) Crops: Clean rice – 3.8 t/ha (39.7%); Wheat – 3.5 t/ha (36%); Maize – 8.5 t/ha (38.8%); Mustard – 1.5 t/ha (58.8%); Mungbean – 1.4 t/ha (39.8%); Tomato – 43.1 t/ha (87.2%); Brinjal – 43.6 t/ha (99.1%); Jujube – 12.7 t/ha(54.8%); Cabbage – 58.2 t/ha (48.2%); Potato – 22.1 t/ha (29.2%); Lentil – 1.4 t/ha (55.4%); and Tomato (summer) – 28.9 t/ha (36.9%).
(b) Livestock: Egg (No/hen/yr): Local hen – 65 (16%); Layer – 309 (6.2%); and Duck
– 152 (11.9%); Meat (Body weight gain-gm/animal/day): Local cattle – 348 (71%); Crossbreed cattle – 543 (70%); Goat – 47 (30.6%); Broiler – 52 (30%); Milk (liter/day/cow): local cow – 1.7 (38%); Crossbreed – 6.5 (26%).
(c) Fisheries: Carp-Galda mixed culture – 3.9 t/ha (126%); Mono-sex tilapia – 7.2 t/ha (193%); Thai Koi – 5.1 t/ha (154%); Carp polyculture – 4.3 t/ha (107%).
2. An impact assessment carried out by independent consultants team in 2013 shows the following increases in farm household income by five main farming systems (and by ranges in different farm sizes as shown in brackets): rice based farming (23 to 47%), crop diversification based (rice with pulses/oilseeds/vegetables) (58 to 78%), mixed farming based (crop diversification with livestock) (54 to 135%), livestock based (cow rearing/beef fattening) (51 to 159%), and fish farming based (carp/tilapia) (66 to 69%).
3. The detailed project outputs are discussed below by individual components:
A. Component 1: Agricultural Research Support
4. The agricultural research component of NATP achieved most targets set and even exceeded some as indicated below.
5. Collaborative Research sub-projects (SPGR) under implementation or completed: BARC implemented SPGR countrywide. A total of 108 basic and strategic research sub-projects were financed, implemented and completed (exceeded the target of 45) by involving 12 NARS institutes and 6 public universities. The sub-projects covered 12 ecosystems representing the most vulnerable and climate stressed agro-ecological zones in the country. The selection of sub-projects reflected priority needs identified through a rigorous bottom-up process involving all key stakeholders. Involvement of farmers through adaptive/validation and participatory processes not only led to the generation of new technologies but also supported the transformation of the agricultural research system into becoming participatory and demand-driven.
6. The planned collaborations of Agricultural Research Institutes with the International Agricultural Research Centers (IARCs) of the CGIAR and capacity building of young scientists did not fully materialize. Only one SPGR sub-project involving an international research institute brought in a small number of international experts to provide technical support and guidance to scientists.

27
7. Non-NARS partners participating in KGF were established to manage the Competitive Grants Program (CGP) and contributed towards the development of a pluralistic agricultural research system involving public sector, private sector and NGOs in agricultural research. The CGP mechanism was a new approach to collaborative agricultural research and was first introduced in Bangladesh through NATP. Following a rigorous evaluation and selection procedure that responded to micro-level priorities, 92 sub-projects were awarded which addressed problems related to commodities, specific geographical regions with technological constraints and policy issues. However, after rigorous quality assurance and close monitoring of performance, 9 sub-projects were dropped during implementation. The remaining 83 sub-projects were successfully implemented and final completion reports submitted to KGF. The project facilitated collaborative partnerships between NGOs and public sector institutions (27 sub-projects were implemented through NGO/public sector partnerships), involved 6 public and private universities and awarded grants to 14 NGOs that participated independently. This created space for non-conventional partners to participate in areas of agricultural research traditionally assigned to public sector NARSs led by BARC. By its nature as on-farm applied and adaptive research, there was a quicker turnaround of technology generation for immediate uptake by farmers (more information provided in the paragraph below). Furthermore, the challenges and rigidity faced in the public sector research system required institutional innovative approaches to research funding and governance that the competitive grants mechanism was able to provide through CGP. A total of 47 Non-NARS partners participated in CGP and 65% of the total CGP fund was allocated to finance their activities (exceeded the target of 20 Non-NARS partnerships with 30% share of CGP fund allocation).
8. Validation Trials) and New Technologies made available for Extension: While a few (37%) 32 SPGR sub-projects were implemented in collaboration with extension agencies, CGP sub-projects were primarily focused on on-farm applied and adaptive research, which often involved extension agencies as well as direct participation of farmers. In total 50 collaborative extension sub-projects were implemented during project implementation achieving their target at 100% (Intermediate Outcome Indicator 5). As a result of on-farm and on-station trials of CGP sub-projects implemented, technologies developed from 11 sub-projects were scaled up as an intermediate step between technology generation and mass scale adoption by farmers. For example, some CGP sub-projects demonstrated the benefits of growing high yielding varieties of mustard (BARI Sharisha 9, 14, 15 and BINA Sharisha) after harvesting T-Aman rice that were disseminated through on-farm trials. Over 7000 farmers adopted the newly released mustard varieties in 11 districts. In a different case, the introduction of a new cropping system that replaced Boro with mungbean followed by short duration Aus (cv Parija) and thereafter T-Aman was developed and adopted by large number of farmers in northern district. This led to savings in electric energy (5,112 KJ) and fertilizers (190 kg TSP and 125 kg MoP) and resulted in
32 BARC reported that 40 sub-projects out of 108 were implemented in collaboration with extension agencies; 55 sub-projects were implemented in collaboration with farmers; 45 sub-projects were in collaboration with NARS and Universities; and 67 sub-projects were conducted on station/at research station. It is important to note that the collaborations are not mutually exclusive.

28
substantial increases in system productivity. At project end, 28 technologies were developed from CGP sub-projects and KGF was able to transfer 15 proven technologies to BARC for scaling up and wider dissemination to farmers outside project area across the country.
9. SPGR generated 42 mature technologies and an additional 14 technologies were at an advanced stage. 37 technologies were disseminated and in use at farm level as many of their associated sub-projects were executed through participatory approaches involving farmers from project inception. Notable among them were the development of a salt tolerant rice variety for the vulnerable coastal zone (BINA dhan-10) that led to a seed multiplication program. A heat tolerant summer tomato variety (BARI Hybrid Tomato 8) was developed and released with yield potential of 35-40 t/ha. 150 on-station and on-farm demonstrations were carried out in 19 districts of the country. A limited amount of breeder seed was produced and distributed to Bangladesh Agricultural Development Corporation and agribusinesses such as GETCO, ACI and Lal Teer for seed multiplication and distribution. Collaborations with farmer involvement and partnerships with the private sector created opportunities for quick dissemination of technologies as well as uptake for rapid commercialization and diffusion of technologies. In total 25 technologies were made available for extension services from CGP and SPGR (met target of 25) but an even larger number of technologies were disseminated to extension agents through training and indirect participation in on-farm sub-project activities.
10. Scientists trained in identified skill gaps: NATP facilitated the preparation of Human Resources Development (HRD) Plan 2009-2025 to develop the required level of scientific manpower through training and higher study programs at home and abroad. The project implemented the plan in which a total of 30 foreign and 79 local PhD fellowships were awarded (met target of 109)33. The HRD plan also elaborated on the measures to ensure return, utilization and retention of scientists in the profession and such measures were applied to scientists selected for doctoral and MS studies (10 scientists were selected for MS studies and completed). By project end, 65 scholars were already in country after completing their studies and were reported to be working in various research institutes.
11. In addition, capacity enhancement for scientists was also provided through overseas training/study visits (371 participants), short term local training (5,070 participants) and local seminars and workshops (9,508 participants). To enhance productivity, scientists were also trained in the areas of monitoring and evaluation, financial management, procurement and project management, bridging the critical skill gaps. This strengthened their capacity to compete for research funding, implement and complete research projects.
12. To further support efficiencies, an MIS was created within BARC and 7 ARIs linked to the system. 9 MIS modules (financial management, human resources, inventory, library management, procurement, research, training, vehicle and data bank) were developed, tested and rolled out. M&E Cells were established at all networked institutions
33 End figure of scientists who obtained PhDs was 108 because 1 student died while pursuing studies abroad. All students were expected to complete their studies by December 2014.

29
and relevant personnel trained in data management and entry. By project end, over 12,500 entries were made into the ARMIS database. This promoted knowledge exchange amongst different research institutes and was eventually expected to minimize duplication of research efforts. Additional measures of awareness building and information dissemination of research were undertaken. 70 (60 SPGR, 10 CGP) journal articles were published by researchers both in local and foreign journals; 167 technical bulletins were developed for SPGR and CGP; and 93 electronic and 62 print media were also covered.
13. While the establishment of an integrated MIS at BARC was a major achievement of NATP, it requires further strengthening. M&E Cells were established and personnel trained, but those assigned were scientists who were given these additional responsibilities apart from their regular functions. Thus accountability was weak as turnover was quite high from regular transfers. For the MIS to be fully functional and effective, it will require dedicated personnel to primarily focus on this responsibility.
B. Component 2. Agricultural Extension Support
14. All activities designed under the Agricultural Extension Support Component (earmarking 51% of the total disbursement under the project) were successfully completed and good results have been achieved. The project implemented activities for intensification of rice based cropping system, diversification to high value crops, and development of non-crop agriculture, (fisheries and livestock). The project has achieved, in many cases surpassed, the targets set for the components; main outputs are summarized below.
15. The three agencies responsible for implementing the extension component were DAE for crops and horticulture, DLS for livestock, and DOF for fisheries. The PAD set a target of covering 25 % of the districts / Upazillas in the country for the component under the current phase of the project. The component activities are implemented in all the 1345 Unions of the selected 120 Upazillas34 of the 25 project districts.
16. The project newly established 20,012 CIGs comprising 398,700 farmer members. In addition, there are 1,514,500 farmers outside the CIGs who became sustained adopters of the technologies promoted by the project. Therefore the total number of farmers that benefitted under the component at the closure of the project is 1.91 Million (39 % marginal farmers, 44% small farmers and 17% other farmers). This is 46.5% of the total farm household (4.11 Million35) in the project Upazillas.
17. Farmer Institutions Established. The CIGs established by the project empowered farmers to take increasing responsibilities for planning implementation and monitoring of extension activities. The new grassroots farmers’ organizations of producers emerged as the village level focal point for technology transfer through demonstrations, field days, trainings and provision of small equipment and machinery and seeds. 13,450 of them are crop CIGs, 3,892 livestock CIGs and 2,670 fisheries CIGs. Out of the total
34 There are 222 Upazillas and 2,241Unions in the 25 project districts and a total of 4527 Unions, 488 Upazillas and 64 Districts in the country
35 Bangladesh Agriculture Census 2008

30
membership of 398,700 farmers, 163,000 (41%) are marginal and 160,800 (40%) are small farmers36 against the targeted 70% of marginal and small farmers. 28% of the CIG members are women against the targeted 12% and they actively participated in the trainings, played significant roles in technology adoption as well as in mobilizing savings within the CIGs.
18. Nearly 43 % of the CIGs were registered under the Cooperative Act and the rest are in advanced stages of registration. The CIG members have together mobilized an amount of 261.91 Million BDT (equivalent to 3.36 Million USD) as savings/contribution from members and are used for investments from own resources. The project organized various capacity building measures including training, field days exposure visits to build the capacity of CIG farmers covering not only the most appropriate technologies and practices but also on entrepreneurship, leadership and institution development aspects. It was estimated that 1.62 million person days of training was provided.
19. Though 83% of the CIGs are classified as A or B grade, based on criteria based Balanced Score Card assessment done by the project, the higher level Producer Organizations established by federating them at Union, Upazilla and district level are yet to be strengthened. The POs did not so far roll out their mandated activities of facilitating access to technical, financial and marketing services to member producers, except the ones involved in Supply Chain Development Component37.
20. Extension Support Services Decentralized and Strengthened. The project brought about far-reaching transformations in the planning, management and funding responsibilities of the extension system. A new model of participatory and farmer-led decentralization in planning and implementing extension related investments evolved and institutionalized under the project. The bottom up and decentralized preparation, appraisal, funding, implementation and monitoring of Micro Extension plans have become a regular annual exercise in all CIGs. The 20,012 CIG Micro Plans prepared each year with the participation of the farmers are first aggregated at the project Unions and then compiled at Upazilla level. The plans included activities to reflect the prioritized needs of CIG members and helped selection of most appropriate technologies suited for the locations. The review and assessment of the quality of the plans by higher level Upazilla Extension Coordination Committee (UECC) enhanced its technical feasibility and location specificity. The funds for the implementation of the plans were also decentralized and transferred to Upazilla level. The District level Extension Coordination Committee (DECC) with representation from local Research Stations, ensured backstopping with technical support, and helped avoid overlaps and duplications in addition to monitoring the implementation of the plans.
21. In spite of the involvement of scientists in the DECCs, the research–extension- farmer linkage requires further strengthening. While the DAE staff got trained in the research centers, providing some opportunities for learning and information sharing with
36 Marginal Farms (including near landless who depend on livestock or fisheries) with 0.01 to 0.49 acres; small farms with 0.50 to 2.49 acres and medium farms (including large farms) with above 2.50 acres of land area
37 Refer to the SCDC component description for details

31
scientists, DLS and DOF staff got lesser/little opportunities for trainings within the research centers.
22. Though the project could achieve some convergence in the participatory program planning by the three line extension agencies, their budgets continued to be prepared separately. This has resulted in implementation of three programs independent of each other, leaving limited scope for coordination and convergence at the farm level.
23. Farmers’ Information and Advisory Centres (FIACs) established and operationalized: The project helped establish and put to operation 732 new FIACs as permanent outfits for providing one-stop extension services to the farmers covering crops, livestock and fisheries sub-sectors. The FIACs housed within Union Parishad Complexes located closer to the farmers have emerged as important local hubs for technology dissemination and technical support to farmers. The number of farmers that accessed services from the FIACs reached 62 farmers per month per FIAC for crop related services, 41 per month for livestock related services and 12 per month for fisheries. There are strong affiliations, convergence and ownership achieved in these centers with the local government (Union Parishads) activities thereby ensuring continued service to farmers beyond the project period. Some Union Parishads have purchased agriculture equipment from own funds and made them available to FIACs. The FIACs are equipped with Computers (100 FIACs with computers and printers and modems for internet connectivity meant to provide e-agriculture services to small and marginal farmers) some small equipment like sprayers, foot pumps, water testing mini kits, sprayers for tree crops, learning tools and extension materials like posters, pamphlets, samples of crop varieties, displays of common pest and disease (mini museums).
24. The extension personnel within the FIACs include Union level staff of DAE available on all working days. Community Extension Agents for Livestock (CEAL) and Local Extension Agent for Fisheries (LEAF), community workers trained in Livestock and Fisheries, are available on pre-announced days of the week. The project successfully scaled up the homegrown model of CEAL and LEAF. Though brought in as a strategy to overcome the staffing gaps at the union level for fisheries and livestock, both CEAL and LEAF (1,300 each) developed into a critical link between the farmers and the Upazilla level technical personnel of both the departments. With the training and support by way of limited equipment and a nominal monthly conveyance allowance, these agents evolved themselves into local entrepreneurs charging for the services they offer, especially when farm visits are involved. However, the business model for the CEAL appears more sustainable and additional measures need to be thought about for the sustainability of LEAF.
25. Improved technologies successfully disseminated: The project has been able to offer to the farmers 40 location-specific technology packages (Crops 16, Livestock 11 and Fisheries 13) consisting of improved technology elements. The technology basket offered was fully catering to the national priorities of: (i) improving the resource use efficiency and yield gap minimization of rice based cropping system which constitute the core of the sector; (ii) diversification of the cropping system by promoting pulses, oil seeds and high value vegetable crops; and (iii) livestock and fish productivity enhancement with a focus on raising people’s nutritional standards.

32
26. A total of 81,375 demonstrations supplemented by field days and formal farmer trainings have been implemented for disseminating technology packages. About 63,918 crop demonstrations with 16 technologies; 20,919 livestock demonstrations covering 11 technologies and 5,336 fisheries demonstrations covering 12 technologies have been conducted. Farmers Adopted Improved Technologies: Though the demonstrations and other knowledge management activities were originally planned to focus on adoption within the CIG farmers, post MTR the focus shifted also on to adoption by non CIG farmers within the villages. This led to increased adoption of the promoted technologies. The number of farmers adopting demonstrated technologies over the life of the project rose to 1.89 million, comprising 0.38 million adopters 38 who are 96% of total CIG farmers and 1.51 million farmers outside the CIGs. The end of project target for adoption in the PAD was conservatively estimated at a total of 0.39 million farmers.. Marginal farmers constituted 39% among the adopters and 44% are small farmers. There are many instances of ‘village wide’ adoption where almost every farmer in large contiguous farming landscapes adopted many demonstrated technologies like changing cropping patterns by including high value crops and varieties, integrated pest management including pheromone traps, judicious use of water resources through Alternate Wetting and Drying (AWD), animal healthcare, better livestock management practices, and water quality monitoring for sustained fish production. The emergence of many “seed villages” producing seeds of high yielding varieties, “clean villages” practicing compost in all households, “green villages” adopting integrated pest management, “resource efficient villages” practicing AWD, “healthy animals villages” vaccinating and deworming all livestock in the villages, are good outputs achieved. The total number of farmers adopting crop related technologies stood at 1,221,960; livestock related technologies were 515,957 and fisheries technologies were 233,653 farmers.
27. Productivity of crops, livestock and fisheries enhanced: The project helped good productivity improvements resulting mainly from the adoption of improved technologies. Compared to baseline yields (2.73 t/ha) the yield of clean rice increased by 39.72%. The body weight gain for most popular beef fattening rose by 71% for local cattle and 70% for cross-bred cattle. The most popularly adopted Monosex Thilapia culture productivity improved by 193%. While the focus commodities among crops were 13 in number, livestock focused on egg, meat and milk production and fisheries focused on pure and mixed culture of fish. One of the popular technologies demonstrated, which had 1.39 million adopters was Rice Yield Gap Minimization which combined a set of farmer friendly technology elements to bridge the gaps in yield obtained by small and marginal farmers against potential yield. The project tracked the yield gaps minimized by farmers
38 Technology adoption is counted only once irrespective of number of technologies adopted by each farmer. These are sustained adopters of the technology as they are adopting technology packages for more than one year/season after getting exposed to the technology.

33
over the project period comparing farmer’s field and demonstration fields. Overall, for the three crops of paddy the yield gap was minimized from 1.30 t/ ha to 0.76 t/ha.39
28. New National Agricultural Extension Policy Formulated: The project helped DAE in revising the National Agricultural Extension Policy, in close consultation with project field staff and farmers with technical assistance from the Bank. The models and approaches successfully implemented under the project are reflected in the policy and would be scaled up throughout the country. These include the adoption of demand driven decentralized extension approach in all programs of DAE; promoting low-cost high- impact demand-responsive technology packages for accelerated agricultural growth; and differentiated targeting to address the challenges and opportunities from main agro-ecological and economically constrained areas. The policy is in its final stage of approval and release. The DLS also advanced in drafting a similar policy for the Livestock Sector.
C. Component 3. Development of Supply Chain
29. The project implemented activities to integrate small and marginal farmers and agri-business enterprises into modern supply chains and brought about pilot models for commercialization of agriculture. The component was implemented by the Hortex Foundation, a ‘not for profit’ company under the MOA and chaired by Secretary, MOA. The main output of the component, considering the Bangladesh context, is a relatively simple but replicable and potentially scalable business model of ‘extension support using market based methodologies.
30. The component was originally meant to cover 200 CIGs in 10 project Upazillas. Increased demand from farmers led to doubling the coverage to 402 CIGs in 20 Upazillas. The total number of benefiting farmers is 21,810. This includes farmers who have benefited from the adoption of 39 post-harvest technologies relating to high value agricultural commodities demonstrated under the component as well as marketing their produce through the 25 CCMCs established under the project.
31. Vertically Integrated Farmer Institutions Established. The main output of the component is 20 Producer Organizations (PO) vertically integrating 402 Village Level CIGs against the originally planned 10 POs with 200 CIGs. The POs provided a platform at higher level for the small and marginal CIG farmers and helped them reduce post-harvest losses as well as realize better prices for their produce. The POs successfully negotiated better prices and established linkages with local and up-country markets. In addition the POs played a significant role in the management committee of the CCMCs established under the project. The POs also disseminated market information among CIGs in addition to coordinating various training programs and workshops for farmers covering post-harvest and marketing aspects.
32. Post–harvest Technologies Demonstrated and Adopted. The project successfully demonstrated 39 improved Post-harvest Technologies against the targeted 20. A total of 8,560 CIG farmers and 13,250 non-CIG farmers adopted these technologies
39 The T. Aman rice yield gap minimized from 1.5 to 0.76 t/ha, the Boro rice from 1.70 to 1.04 t/ha and T.Aus rice from 0.70 to 0.47 t/ha.
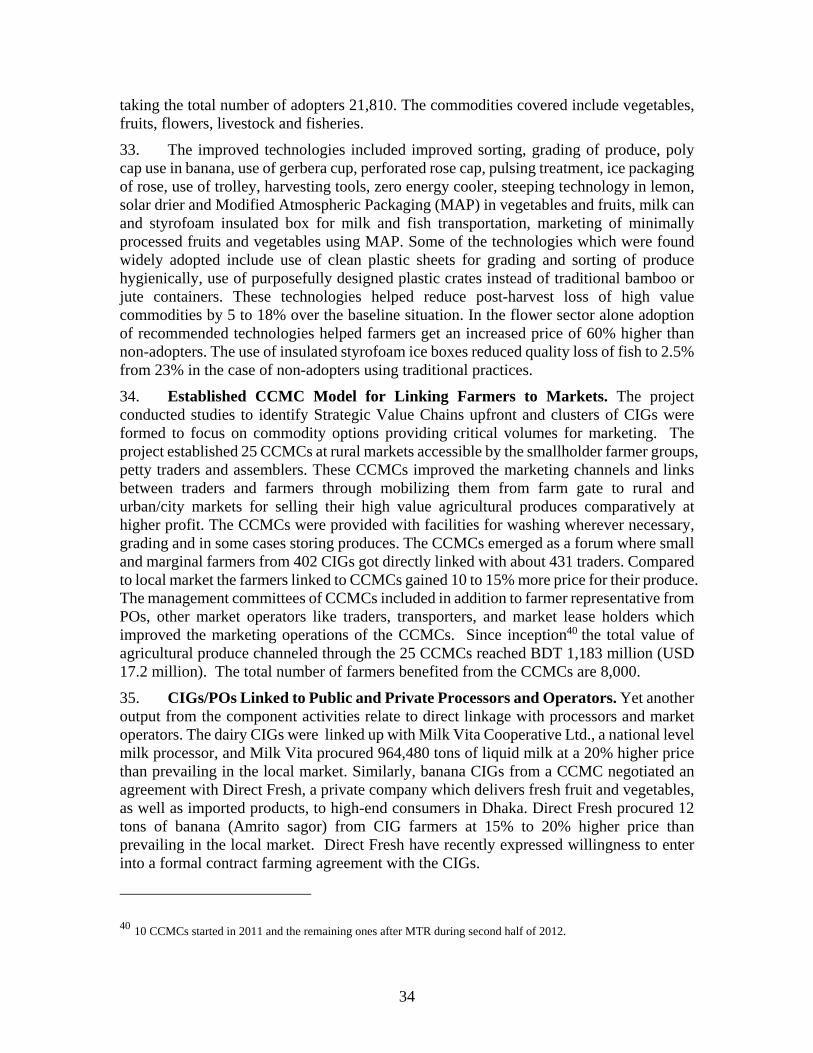
34
taking the total number of adopters 21,810. The commodities covered include vegetables, fruits, flowers, livestock and fisheries.
33. The improved technologies included improved sorting, grading of produce, poly cap use in banana, use of gerbera cup, perforated rose cap, pulsing treatment, ice packaging of rose, use of trolley, harvesting tools, zero energy cooler, steeping technology in lemon, solar drier and Modified Atmospheric Packaging (MAP) in vegetables and fruits, milk can and styrofoam insulated box for milk and fish transportation, marketing of minimally processed fruits and vegetables using MAP. Some of the technologies which were found widely adopted include use of clean plastic sheets for grading and sorting of produce hygienically, use of purposefully designed plastic crates instead of traditional bamboo or jute containers. These technologies helped reduce post-harvest loss of high value commodities by 5 to 18% over the baseline situation. In the flower sector alone adoption of recommended technologies helped farmers get an increased price of 60% higher than non-adopters. The use of insulated styrofoam ice boxes reduced quality loss of fish to 2.5% from 23% in the case of non-adopters using traditional practices.
34. Established CCMC Model for Linking Farmers to Markets. The project conducted studies to identify Strategic Value Chains upfront and clusters of CIGs were formed to focus on commodity options providing critical volumes for marketing. The project established 25 CCMCs at rural markets accessible by the smallholder farmer groups, petty traders and assemblers. These CCMCs improved the marketing channels and links between traders and farmers through mobilizing them from farm gate to rural and urban/city markets for selling their high value agricultural produces comparatively at higher profit. The CCMCs were provided with facilities for washing wherever necessary, grading and in some cases storing produces. The CCMCs emerged as a forum where small and marginal farmers from 402 CIGs got directly linked with about 431 traders. Compared to local market the farmers linked to CCMCs gained 10 to 15% more price for their produce. The management committees of CCMCs included in addition to farmer representative from POs, other market operators like traders, transporters, and market lease holders which improved the marketing operations of the CCMCs. Since inception40 the total value of agricultural produce channeled through the 25 CCMCs reached BDT 1,183 million (USD 17.2 million). The total number of farmers benefited from the CCMCs are 8,000.
35. CIGs/POs Linked to Public and Private Processors and Operators. Yet another output from the component activities relate to direct linkage with processors and market operators. The dairy CIGs were linked up with Milk Vita Cooperative Ltd., a national level milk processor, and Milk Vita procured 964,480 tons of liquid milk at a 20% higher price than prevailing in the local market. Similarly, banana CIGs from a CCMC negotiated an agreement with Direct Fresh, a private company which delivers fresh fruit and vegetables, as well as imported products, to high-end consumers in Dhaka. Direct Fresh procured 12 tons of banana (Amrito sagor) from CIG farmers at 15% to 20% higher price than prevailing in the local market. Direct Fresh have recently expressed willingness to enter into a formal contract farming agreement with the CIGs.
40 10 CCMCs started in 2011 and the remaining ones after MTR during second half of 2012.

35
36. Key Stakeholders’ Capacities Built. The project organized various capacity building events like training programs, workshops, domestic and international exposure visits in addition to bringing out booklets, leaflets and other dissemination materials. About 1,800 farmers, traders and line agency officials were trained in 15 events covering supply chain management, dairy product development and post-harvest technology, business development and the like. The exposure visits focused on small scale agri-business development, processing of flowers, herbals and honey products, contract farming systems, post-harvest handling, storage, packaging, marketing of fish etc. About 27 CIG farmers and 22 non-CIG farmers were given opportunities to participate in overseas exposure visits. In addition, about 3,600 and 2,400 non-CIG farmers were trained in 16 workshops organized on various themes of post-harvest including marketing aspects. On the information dissemination front, about 2,000 booklets on low cost preservation of fruit and vegetables, 2,000 on shelf life, packaging and transportation of flowers, 2,000 on post-harvest technologies, 1,000 booklets on safe production technology, and another 1,000 information booklets on solar drying methodologies were produced and distributed.
37. Market Based Extension Support Business Model Initiated. Shortened value chain model: With the introduction of CCMCs individual producing farmers are linked with consumers bypassing the normally existing intermediaries consisting of local market, collectors and farias (local agents), commission agents and wholesalers. The producers are linked to consumers through traders, marketing companies and exporters. The traders establish the link with consumers through retailers and supermarkets. The marketing companies help farmers reach out to consumers through their outlets. The business model shortened the chain and accumulated better margins at the producer level. One of the key deficiencies of the model was lack of integration with the extension services. Hortex was left to do all supply chain development activities.
38. Integrated, Market Based Extension Model: Moving forward a collaborative model was initiated for testing. The alternative model aimed at Hortex training the line agency field officers so they could deliver extension services using market-based methodologies. In fact, by 2012, the Supply Chain Development Component rolled out a new model in 10 new Upazillas with an additional 200 CIGs, where the line agencies - DAE, DOF and DLS - were better integrated and trained in supply chain methodologies. This implies a long term commitment from line agents to promote SCD and thus free limited Hortex resources to continue training elsewhere, whilst ensuring regular monitoring.
39. Integrated Market Based Extension Model. This comprehensive but simple model consists of five elements: (i) mobilization and strengthening of two tier farmer institutions (CIGs and POs); (ii) dissemination of improved agricultural technique; (iii) aggregation, grading, packaging and transporting; (iv) local and national market linkages; and (v) value chain specific interventions. The attractiveness of the model emerged out of reduction in the marketing costs, enhanced quality of produce and realization of better prices of high value crops, livestock produce and fisheries. A memorandum of understanding was signed among Hortex and the line extension agencies. The role of Hortex became that of an ‘enabler’ and the line agencies assumed the role of ‘technical facilitators’. The role of ‘doers’ was progressively transferred to farmer institutions and

36
other market operators. The model also promoted entrepreneurial ideas for farmers giving them an opportunity to diversify their income.

37
Annex 3. Economic and Financial Analysis
1 Overview of the Project
1. This annex presents the ex-post economic and financial analysis (EFA) of the WB/IFAD/Government of Bangladesh (GoB)-funded National Agriculture Technology Project (NATP). NATP’s development objective was to “improve the effectiveness of the national agricultural technology system, as measured by increase in agricultural productivity and farm income in selected districts”. The project was implemented over six instead of five foreseen years and comprised four components: (1) support to research through implementation of collaborative research sub-projects as well as institutional strengthening; (2) support to extension by introducing bottom-up, demand-led and participatory planning as well as provision of decentralized information and advice; (3) supply chain development through demonstration of improved post-harvest technologies and management practices as well as piloting of Commodity Collection and Marketing Centers; and (4) project management.
2. Total project costs, including contingencies, were US$73.81 million. Not all projects funds were spent due to under-utilized funds as well as noticeable exchange rate fluctuations. In budget revisions during project implementation the fund allocation available for extension activities under component 2 increased by about 15%, which has given further importance to NATP activities at farm level. At the same time, overhead costs for project service delivery in the form of Project Coordination Unit cost decreasing from originally estimated 12% (US$9.8 million) to 6% (US$4.4 million).
3. In order to measure the efficiency of the project and assess the achievement of the Project Development Objective (PDO), the analysis includes calculations of financial gross margins for individual farm activities and an Economic Internal Rate of Return (EIRR) as well as a Net Present Value (NPV) for the entire project. The analysis uses farm models to estimate “on-site” incremental benefits. It is based on data that was sourced during a field visit to one district, updated information provided by the Departments of Agriculture Extension (DAE), Livestock Services (DLS) and Fisheries (DOF), the World Bank and a study (contracted by the Project Coordination Unit to an external company) prepared to evaluate the impacts of NATP. The EFA focuses mainly on returns to investments under component 2 (“Support to Extension”) and component 3 (“Supply Chain Development”).
4. Taking into consideration the nature of NATP technologies it is assumed that initial farm-level benefits from research that were generated under the project are captured by the analysis of benefits from activities under component 241.
5. NATP created a number of important externalities under components 1 and 2, which have not been quantified because of the difficulty to assess in monetary terms the increased efficiency and sustainability of the research system through human capacity
41 Approximately 48 technologies were handed over from research to extension including improved and location-specific varieties and various management practices.

38
development and policy/legislative interventions. As a consequence, the present analysis is conservative and under-estimates partially the efficiency of the project42.
Pre Investment EFA
6. The EFA for NATP in the Project Appraisal Document (PAD) took account of the framework nature of the project and did not carry out a detailed ex-ante analysis. It opted for an economic analysis for the overall project considering the additional net value added from increased agricultural production on farms that would be directly assisted through the decentralized activities of components 2 and 3. For this purpose typical farm activity models in main agricultural, livestock and fisheries activities were combined with the number of farmers directly benefitting from project support under the extension support and supply chain components. The incremental net value added as a result of the extension activities alone was compared to the incremental investment and recurrent costs of NATP.
7. While the original analysis did not calculate a financial rate of return for the entire project, it did compare net income impacts of new technologies on farming households (hh). The financial farm activity analysis indicated that NATP would generate substantial financial benefits for farmers adopting higher productivity and more profitable technologies and management practices. It further qualified that financial benefits would be realized upstream in the agricultural commodity supply chains. The analysis assessed project impact on marginal, small and medium households which were, based on the activity budgets, grouped into the following farming systems: rice-based, rice plus vegetables, rice plus freshwater shrimp, fish production and dairy production. The economic analysis was also based on those farm activity budgets. No account was taken of the medium to longer-term indirect benefits that would arise, neither from new research funded through the project which was expected to generate new technologies in 5-10 years’ time nor from the increased capacity of researchers and extension agents.
8. Initial project costs were US$84.6 million and economic costs of the total project were computed by applying a Standard Conversion Factor (SCF) of 0.9 to the financial base cost estimates. The PAD’s analysis estimated the likely EIRR to be 34.78% and the NPV (at a discount rate of 12%) as US$74.08 million. Based on assumptions that farmers would realize on average 50% of estimated gains in net income, the EFA tested sensitivity of results mainly versus different levels of expansion and uptake of directly benefitting farmers over the five year period.
Post investment EFA/ICRR estimation methodology
9. A pragmatic approach based on available data and following the PAD methodology was applied in the Implementation Completion and Results Report (ICRR). The Economic Analysis estimates NATP’s contribution to Bangladesh’s economy as a result of technology induced productivity enhancements and increases in net value addition on farms. The Financial Analysis looks at net income increases for particular commodities and improved returns per family day of labor. The EFA is able to be more specific about
42 Performing the financial and economic analysis of projects’ subcomponents is a common practice in the ex-post evaluation of projects.

39
costs and benefits than was the case at appraisal because investments and activities have been identified and implemented throughout the (extended) project period.
10. Farm budgets. Based on data collected during the ICRR mission, provided by the Government and taken from the project’s impact evaluation, typical farm models were developed. They specify quantities and costs of outputs (e.g. rice, vegetables, carp, milk) and inputs (e.g. fertilizer, seeds, fodder) including labor for the “with” and “without project” situations. Selected farm activities for the analysis were representative of the technologies developed by NATP. Demonstrations on Rice Yield Gap Minimization (RYGM) (rice-only), High Value Vegetables (HVV) (e.g. tomato) and other High Yielding (HY) varieties (e.g. mustard) (rice plus vegetables) constituted 61% of all DAE demonstrations43. For the purpose of this analysis farmers in respective DLS and DOF CIGs were grouped around representative commodities, namely cow rearing and carp polyculture. Supply chain activities were carried out by a much smaller subgroup of CIG members than anticipated in the PAD.
11. Data. Regular recording and reporting of progress as part of the M&E system left the project with comprehensive data on activities, outcomes and impacts. In addition, the project collected information on productivity of a control group, which allowed the EFA to compute incremental benefits with data from current project beneficiaries and respective control group members.
12. Price/cost information. The Financial Analysis is conducted in constant 2014 prices (Bangladesh Taka/BDT), which allows assessing the real impact of NATP on its target group, namely net increases in their incomes. The Economic Analysis aims to show the contribution to the sector and national income generated by the project and uses economic prices for this. Economic project costs, in the absence of necessary details to remove specific levies from each item, were calculated by applying a conversion factor of 0.9 to financial prices of non-traded goods and services. This was also assumed by the PAD, which removed this proxy to account for distortions between market and real prices. Parity prices for relevant tradable goods have been calculated using World Bank Commodity Price Projections and FAO data. A labor shadow exchange rate factor of 0.75 was applied. For comparability purposes, cost and benefit flows have been calculated over a period of 20 years using an opportunity cost of capital of 12%. For the overall project analysis all project costs were considered for estimating the EIRR except those excluded in the PAD, namely 50% of component 1.3, 2.3 (institutional strengthening) and 4 (project management). As per PAD, the analysis included partial costs of the extension service support at upazilla level. The percentage wise inclusion of respective salaries was estimated according to their involvement in NATP activities. Recurrent cost items going beyond project implementation period were mainly confined to maintenance of capital goods, i.e. research and IT equipment. All incremental benefits under component 2 and 3 were considered.
43 DAE 13th ISM-Final Mission, NATP, p.3

40
13. Beneficiaries. The EFA considered benefits accruing to those farmers who directly received project support, namely members of the 20,012 CIGs established by NATP (see Table 1: NATP beneficiaries for details). The total number of 398,735 farm households was gradually included in project activities during the first three years of project implementation. Broader benefits accruing to the 1.51 million non-CIG farmers in the project area were not included in this analysis. According to the numbers reported by the PCU, 269,000 (70%) farmers carried out crops-related activities, including supply chain development, 76,335 (20%) livestock-related activities and 53,400 (10%) fisheries-related activities.
Table 1: NATP beneficiaries
Number Percentage CIGs formed (approximately 20 members each) 20,012 CIG members = benefitting farm households / technology adopters
398,735 96%
CIG – crops 13,450 70% CIG – livestock 3,892 20% CIG – fisheries 2,670 10% Non-CIG members = indirectly benefitting and technology adopting households
1.51 million
14. Adoption rates. Based on the findings of the project team, the impact evaluation and direct observations during the mission’s field visit, the analysis considered a progressive realization of project benefits. The project reports revealed that up to Year 3 (Y3 - 2010) of project implementation only 30% of all potential beneficiaries had adopted at least one technology. Adoption is defined as cultivating a crop or else using a new technology for at least one season, excluding the demonstration season. In Y4 70% of CIG members were adopters and close to 100% in Y5. The assumed pace at which benefits accrued once a farmer was considered an “adopter” was: 10 percent in Y1; 50 percent in Y2; and 100 percent in Y3. Since technologies were often not fundamentally new to farmers or very high in demand as in the case of winter tomato, the benefit adoption cycle was assumed to be completed in three years. NATP rolled out its extension activities by forming CIGs, conducting on-farm demonstrations and providing continuous support. In an attempt to correctly reflect reality, no benefits were included for Y1 and only few in Y2.
2 Financial benefits of extension support
15. Incremental benefits from extension and supply chain development support accrued to farmers from productivity improvements due to improved varieties and better management of inputs and new technologies; diversification (off-season high value vegetables; replacing area previously under rice cultivation); and by generating additional income through marketing activities (e.g. post-harvest loss minimization). Results of the supply chain development pilot showed that substantial price increases could be achieved

41
through improving quality of production, improved post–harvest management and group marketing of products.
16. Increased yields. Improved, location-specific and higher yielding varieties of rice, beans, mustard and wheat as well as better management44 of inputs and new technologies were key parameters for the increase in crop yields. In case of livestock and fisheries noticeable yield increases were observed under proper adoption of technology packages (e.g. improved rearing practices for higher daily milk production per cow and good pond and feed management practices for fish cultures).
17. In light of Bangladesh’s land shortage and small land plot sizes, the cropping intensity remained constant during the implementation period (approximately 200%). Net productivity as shown in Table 2: Yields and net income comparing existing and new technologies by farm activity increased for individual commodities in the range of 6-43%.
Table 2: Yields and net income comparing existing and new technologies by farm activity
High yielding varieties
CIG Control group
% increase CIG Control group
% increase
Yield (ton/hectare) Net income (BDT) under full adoption
Boro-paddy 6.0 5.3 13% 28,184 23,826 18%
T-Aman-paddy 4.8 3.9 21% 36,184 30,607 18% T-Aus-paddy 4.0 3.1 29% 30,570 19,245 59% Wheat 3.5 3.1 16% 43,423 36,408 19% Maize 7.7 7.0 9% 44,816 31,413 43% Mustard 1.4 1.2 22% 30,146 22,181 36% Lentil 1.4 1.1 26% 34,269 24,003 43% Mung Bean 1.4 1.1 25% 28,830 16,845 71% Tomato (winter) 52.0 37.1 40% 357,335 225,882 58% Cabbage 53.9 44.5 21% 201,364 151,905 33% Cauliflower 24.9 20.8 20% 56,573 33,681 68% Potato 21.7 20.5 6% 78,583 65,727 20% Banana 29.9 24.3 23% 185,250 152,201 22% Dairy cross breed (L/cow/day)
6.5 5.1 26% 75,121 59,523 26%
Carp (t/ha) 4.3 3.0 43% 35,690 17,979 99% Gerbera flower* 673,269 617,724 9% 17,519,663 11,150,405 57% *Non-CIG; flowers/ha
18. Since one of the objectives of NATP was to address the yield gap particularly in rice, the analysis assessed the differences in yield achievements from research (“Potential Yield in Research Trials”) through the extension system to farmers. The difference between the “Potential Yield in Farmers’ Field” and the actual yield farmers get is commonly referred to as “Yield Gap”. This gap, which stood at 60% at the beginning of NATP has been reduced but could further be closed in the future. The PCU Annual Report 2014 and
44 E.g. improvement of soil fertility (through compost activities), reduced use of pesticides/insecticides (by introducing a pheromone trap etc.), and establishment of biogas plants in livestock areas leading to fuel wood savings. The newly introduced AWD technology further saved irrigation cost.

42
Annual Report 2012/13 state: “The main reason for yield gap was identified as the knowledge and skill gap of farmers. NATP designed to minimize yield gap by adopting properly aged healthy seedlings and balanced fertilization. Using quality seeds and other improved practices would further minimize the yield gap.”45
19. Increased revenues. The project helped to reduce poverty by improving welfare at household level as measured by increased revenues and food security. Information of income increases in the impact evaluation (23-135% as recorded in the Results Framework) is in line with the findings of the Financial Analysis (see Table 2: Yields and net income comparing existing and new technologies by farm activity). The analysis compared net income impacts of new technologies on farming hh, which all indicate that technology adopters can generate substantial financial benefits. Data collected during the mission to test for sustainability of income increases show that necessary inputs are available locally and while prices may be higher in regional centers, the current production levels are still absorbed by the local market. Individual commodity interventions are therefore found to be financially sustainable. Another proxy indicator for improved household income is the return per family labor. As summarized in Table 3: Returns per Family Day of Labor comparing existing technologies and new technologies by farm activity, the analysis could only observe improvements for CIG farmers as compared to the control group.
Table 3: Returns per Family Day of Labor comparing existing technologies and new technologies by farm activity
Existing technology New technology -
full adoption Unit BDT per person day BDT per person day
Boro-paddy ha 438 634 T-Aman-paddy ha 496 586 T-Aus-paddy ha 354 563 Wheat ha 1.474 1.953 Maize ha 1.590 2.268 Mustard ha 748 1.221 Lentil ha 1.215 1.982 Mung Bean ha 974 1.459 Tomato (winter) ha 4.573 7.234 Cabbage ha 2.929 4.076 Cauliflower ha 758 1.145 Potato ha 1.663 2.121 Banana ha 2.679 3.000 Carp (36 decimal pond) 36 dec 307 560 Dairy unit (3 local breed vs. 2 local + 2 cross breed) (L/cow/day)
cows 220 223
Teasle gourd supply chain ha 108 211
45 The major cropping pattern in Bangladesh is essentially rice based and dominated by a Boro-Fallow-T. Aman cropping pattern. This situation was exploited for intensification and diversification of cropping, namely accommodating a short duration crop in the cropping pattern by adjusting varieties, planting times and manipulating the turnaround time, etc. in the existing cropping pattern.

43
20. Poverty impact. Under NATP particular attention was put on improving income of marginal46 and small farmers, constituting over 80% (150,000 marginal and 168,000 small) of all benefitting households. In line with the impact evaluation, the EFA assessed the impact of improvements in agricultural productivity by type of household and type of farming on household incomes and found that marginal and small farmers often harvested proportionally higher incomes over the control group than medium farmers (see Table 4: Income effects by farm size and type of activity for details). Benefits generated by project interventions were thus effectively harvested by poorer groups of CIG farmers.
Table 4: Income effects by farm size and type of activity47
Marginal farmers Small farmers Medium farmers
Control group
CIG / Control
Control group
CIG / Control
Control group
CIG / Control
T. Aman paddy
17,359 62% 24,650 25% 21,647 48%
Boro paddy 26,025 49% 25,259 47% 24,297 44%
Mustard 16,872 108% 17,106 63% 29,664 14%
Tomato (summer)
437,170 67% 491,884 38% 480,015 39%
Dairy cow – cross breed
37,174 40% 31,336 50% 28,333 55%
Carp 32,8712 37% 284,649 57% 266,832 62%
Source: Impact evaluation-1.
21. Positive social externalities/non-quantifiable benefits. Direct and indirect non-quantifiable benefits accrued under NATP were: (i) improved nutrition at household level by increasing availability and consumption of proteins and vegetables at household level48; (ii) improved advisory service provision for all farmers at union level by strengthening FIACs, which is expected to continue and progressively improve impacts on farm productivity; (iii) improved capacity of local private sector actors engaged in supply chain activities; (iv) medium and long-term impacts from outputs of the improved national research system and dissemination of research outputs through the extension system; (v) knowledge generation by research staff along with scientific documentation of accomplishments; (vi) capacity development of research and extension staff through implementation of sub-projects; and (vii) empowerment of farmers through participatory planning and group registration as well as during field testing for research purposes.
46 Defined by size of land plot. Average size according to impact evaluation study was 0.2.; 0.7 and 2.1 ha for marginal, small and medium farmers respectively.
47 Constant 2013 prices; BDT per hectare / head / kg. 48 In one of DLS reports: “Irrespective of farmers’ group, milk consumption per household increased from
0.200 litre/day to 0.300 litre/day.”

44
22. As mentioned above, benefits accruing to non-CIG farmers were not counted but would contribute substantially to the overall benefits of NATP. There was no attempt to measure employment generation or value addition from processing beyond farm-gate. Additional returns from further expansion in area have also not been included in this analysis. The same applies to benefits generated from the adoption of multiple technologies by farmers.
4 Cost-effectiveness and economic analysis results
23. A cost-effectiveness statement was prepared to compare service delivery to farmers through FIACs, a complementary extension advice modality49 with the current practice, in case of livestock and fisheries, of operating exclusively from upazilla level50. Cost comparisons between officers residing in FIACs attending approximately 630 farmers per month51 and upazilla-based livestock and fisheries officers attending similar numbers of approximately 730 farmers per month52 showed that current amounts paid for FIAC operations are much lower compared to the solution at upazilla level53. Estimated cost per farmer using the more decentralized FIAC approach is approximately US$1.5 and US$2.1 for the current centralized approach54. In addition, farmers save transaction costs by opting for union-based basic advice rather than travelling to upazilla level. Another advantage of decentralized advisory services is the high ratio of extension staff to farmer (see Table 5 below for details).
Table 5: Comparison between FIAC and upazilla-based extension service
FIACs at union level FIACs at
upazilla level Number of farmers reached per year
22% of upazilla farmers
26% of upazilla farmers
Cost incurred in 2 years
US$ 20,121 (Year 1 incl. set-up of FIAC)
US$ 3,241 (Year 2 +) = US$ 23,362
US$ 18,708 * 2 = US$ 37,415
Ratio of farmers per extension staff per year
424 1460
Source: own calculations.
49 Focus is on DLS and DOF officers only as DAE already has extension officers at union level. 50 In total, NATP supported the set-up of 732 FIACs at union level. 51 In FIAC and during farm visits, not counting telephone calls; based on 9 unions as average/upazilla, 2
officers/FIAC. 52 Considering 2 fisheries+ 4 livestock officers (not veterinary but extension officers with direct farm
contact). 53 Specialized service delivery at upazilla level will remain necessary; salaries of FIAC officer would have
to be adjusted in the future. 54 Own calculations which consider set-up and personnel costs of first two years of FIAC establishment
and personnel costs including travel allowances for upazilla operations.

45
24. After adjusting financial prices, the Economic Analysis uses farm models in line with the PAD to compute the EIRR.55 Selected farm systems are agriculture without supply chain activities (rice-based56 and rice with vegetables), agriculture with supply chain activities, livestock in the form of dairy cattle rearing and fisheries in the form of carp cultures57. Average farm size used is 0.4 ha. Depending on the commodity the analysis further assumes that farmers reap 75-100% of the possible benefits from improved technologies58. An EIRR was computed at 30%, which is slightly lower than the original estimate but still an excellent economic rate of return. The analysis shows that the main types of farm activities and farm systems are financially viable and economically sustainable. Under the presented assumptions, the project NPV is BDT 6,225 million [US$79.8 million @ 2014 exchange rate 78; US$90.2 million @ 2008 exchange rate 69].
Table 6: Phasing and main results of the economic analysis Y1 Y2 Y3 Y4 Y5 Y6 Y7-
Beneficiaries (cumulative) CIG members mobilized 285,72 378,760 398,735 Total adopting beneficiary hh 14,486 105,779 277,973 398,735 Total beneficiaries59 72,865 532,067 1,398,20 2,005,63 Benefits and Costs [BDTm]
Agriculture without supply chain /1 /2 (1 to /5 see footnote on assumptions]
5 [87%] 60 297 802 1,333 [81%]
1,589
Agriculture with supply chain /3
0.003 [0.1%]
0.04 0.2 0.7 1.4
[0.1%] 1.9
Livestock /4 0.02 1 6 34 99 [6%] 167 Fisheries /5 1 9 45 124 213 261
Total benefit s (adjusted for past inflation) 60 [BDTm]
0 6 70 348 961 1,647 2,019
55 Past benefits were adjusted for inflation and future benefits are based on 2014 values.
56 In case of the rice-only model farmers it was further assumed that 50% of benefitting hh introduced homestead gardening activities as a means of improving household food security and family nutrition. On average 154 kg of fresh vegetables were produced each year of which 95 kg were consumed in the family and the additional income from selling the remainder on local markets contributed to family welfare and women empowerment as the income was earned by women. (DAE-Additional write up for ICRR mission, p. 3).
57 Assumptions with (WP) and without (WOP) project: 1/ high yielding varieties T.Aman and Boro; 100% of land planted with rice; 2 crops/year; WP includes 1 decimal homestead garden (50% of farmers); 2/ 2 crops of rice/year, WOP 90% under rice + 10% under high value vegetables (HVV); WP 80% under rice + 20% under HVV; 3/ teasle gourd with sorting/grading activities assumes same yield as control group but 12.5% less post-harvest loss; 4/ WOP 3 local breeds; WP 2 cross+2 local breed cattle; 5/ av. pond size 36 decimals = 0,15 ha; carps have 1 season/year.
58 This also compensates for those few CIG members who have not been registered as adopters so far. 59 Average household size of 5.03. 60 In the absence of the original Costab files an average inflation rate for the period 2008-13 was
calculated (7.8%). http://data.worldbank.org/indicator/FP.CPI.TOTL.ZG/countries/BD?page=1&display=default

46
Economic investment costs [BDTm]
317 792 907 986 1,260 1,350
Economic recurrent costs [BDTm]
36
Net incremental benefits [BDTm]
-317 -786 -837 -638 -299 297 1,983
EIRR@12% 30% NPV [BDTm]61 6,225
5 Sensitivity Analysis
25. A basic sensitivity analysis was performed using two key variables affecting the project until the end of the analysis period: (i) falling output prices and (ii) reduced yields. Table 7 presents an overview of selected scenarios. While the overall project design is fairly robust, the project’s returns are sensitive to selected scenarios.
Table 7: Overview of sensitivity analysis results
Scenario/ changes in the main variables EIRR [%] Baseline / PAD EIRR 34.78 Current / ICRR EIRR 30 Prices Combined 20% reduction of output prices (rice + vegetables)
26
20% carp price decrease 30 20% milk price decrease (at 19% decrease EIRR of 12%) 11 Yield (for CIG only) 10% decrease in carp yields 28 10% decrease in milk yields 20 10% decrease in rice yields 13 10% decrease in vegetable yields 26
6 Conclusions
26. The Economic Analysis finds that NATP has generated very acceptable returns to investment by the Government and people of Bangladesh. The conservative analysis estimates the EIRR at 30%, which is considerably higher than the opportunity cost of capital and cost of funds to the Government of Bangladesh. The real return would be higher if long-term effects from research, capacity development as well as improved nutrition would be taken into consideration. At the same time it is expected that returns to technology development and dissemination could be substantially raised through even closer links between research and extension, and strengthening of partnerships between farmer groups and private sector providers for the supply of farm inputs as well as processing and marketing of farm produce.
61 Not directly comparable to PAD NPV as it is not discounted.

47
27. It is assumed that CIG farmers are able to maintain the level of benefits accrued under the project beyond the investment period. Further formalization in the form of increasing registration numbers of CIGs under the Department of Cooperatives is indicative of enhanced Government attention paid to these farmers and opens a possibility for farmers to get continuous/additional support. Savings at CIG level can also be taken as an indicator for the sustained interest in maintaining and expanding the benefits initiated by NATP’s support. Until the end of 2014 farmers had collected approximately US$3.36 million. According to the impact evaluation study, CIG and non-CIG members used 50% of the savings for reinvestment in agriculture. Selected groups know they need to access regional markets where they would get higher prices for their goods. Government commitment to strengthen extension advisory services in the form of FIACs at union-level shows through DLS and DOF efforts in working out sustainable business models for decentralized extension officers. This reflects the importance these Departments give to extension support for farmers.
28. Possible alternatives to project implementation in the form of private extension actors, e.g. NGOs and independent support to research would probably not have yielded similar results. With various implementing partners at union level as opposed to the Government’s decentralized staff, the extension support would have been more fragmented and service delivery may not have been comparable. Also, similar benefits especially for marginal and small farmers may not have been achieved as through NATP. Research could have been supported independently but with even weaker linkages to the extension system results may not have been even remotely comparable as achieved by NATP.
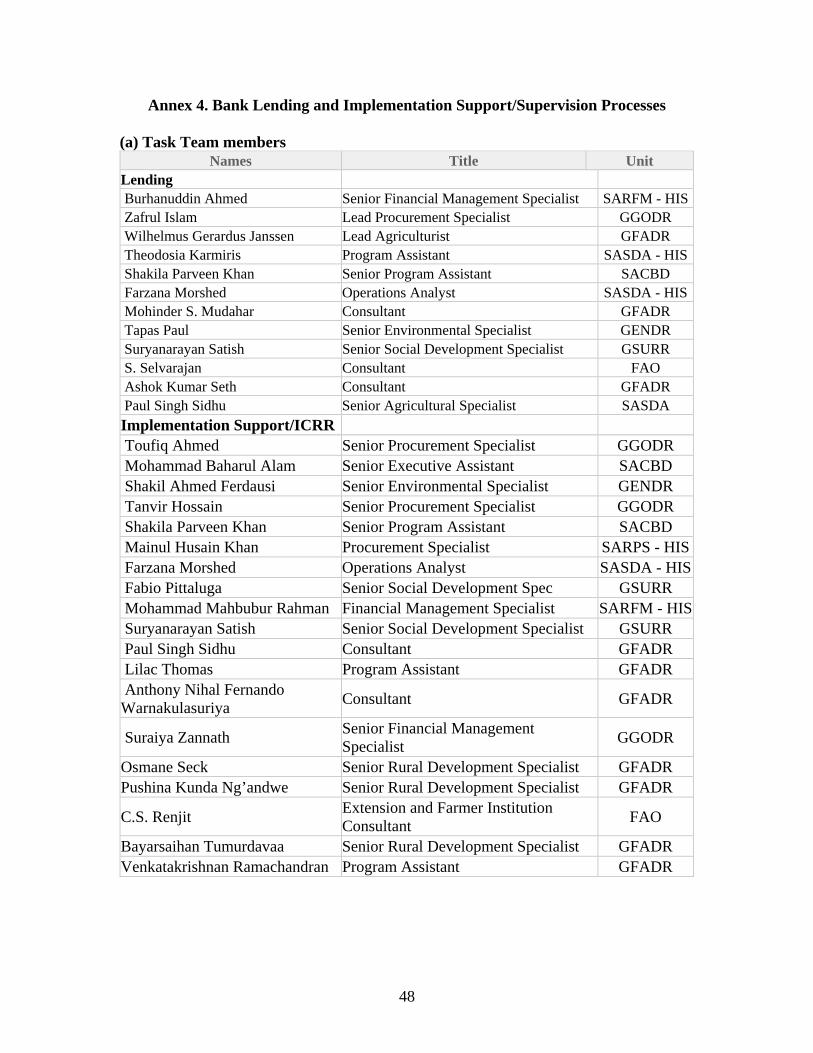
48
Annex 4. Bank Lending and Implementation Support/Supervision Processes
(a) Task Team members Names Title Unit
Lending Burhanuddin Ahmed Senior Financial Management Specialist SARFM - HIS Zafrul Islam Lead Procurement Specialist GGODR Wilhelmus Gerardus Janssen Lead Agriculturist GFADR Theodosia Karmiris Program Assistant SASDA - HIS Shakila Parveen Khan Senior Program Assistant SACBD Farzana Morshed Operations Analyst SASDA - HIS Mohinder S. Mudahar Consultant GFADR Tapas Paul Senior Environmental Specialist GENDR Suryanarayan Satish Senior Social Development Specialist GSURR S. Selvarajan Consultant FAO Ashok Kumar Seth Consultant GFADR Paul Singh Sidhu Senior Agricultural Specialist SASDA Implementation Support/ICRR Toufiq Ahmed Senior Procurement Specialist GGODR Mohammad Baharul Alam Senior Executive Assistant SACBD Shakil Ahmed Ferdausi Senior Environmental Specialist GENDR Tanvir Hossain Senior Procurement Specialist GGODR Shakila Parveen Khan Senior Program Assistant SACBD Mainul Husain Khan Procurement Specialist SARPS - HIS Farzana Morshed Operations Analyst SASDA - HIS Fabio Pittaluga Senior Social Development Spec GSURR Mohammad Mahbubur Rahman Financial Management Specialist SARFM - HIS Suryanarayan Satish Senior Social Development Specialist GSURR Paul Singh Sidhu Consultant GFADR Lilac Thomas Program Assistant GFADR Anthony Nihal Fernando Warnakulasuriya
Consultant GFADR
Suraiya Zannath Senior Financial Management Specialist
GGODR
Osmane Seck Senior Rural Development Specialist GFADR Pushina Kunda Ng’andwe Senior Rural Development Specialist GFADR
C.S. Renjit Extension and Farmer Institution Consultant
FAO
Bayarsaihan Tumurdavaa Senior Rural Development Specialist GFADR Venkatakrishnan Ramachandran Program Assistant GFADR

49
(b) Staff Time and Cost
Stage of Project Cycle
Staff Time and Cost (Bank Budget Only)
No. of staff weeks USD Thousands
(including travel and consultant costs)
Lending FY04 27.75 FY05 72.33 FY06 239.64 FY07 156.95 FY08 58.26
Total: 554.93
Supervision/ICRR FY04 0.00 FY05 0.00 FY06 0.00 FY07 0.00 FY08 81.15
Total: 81.15
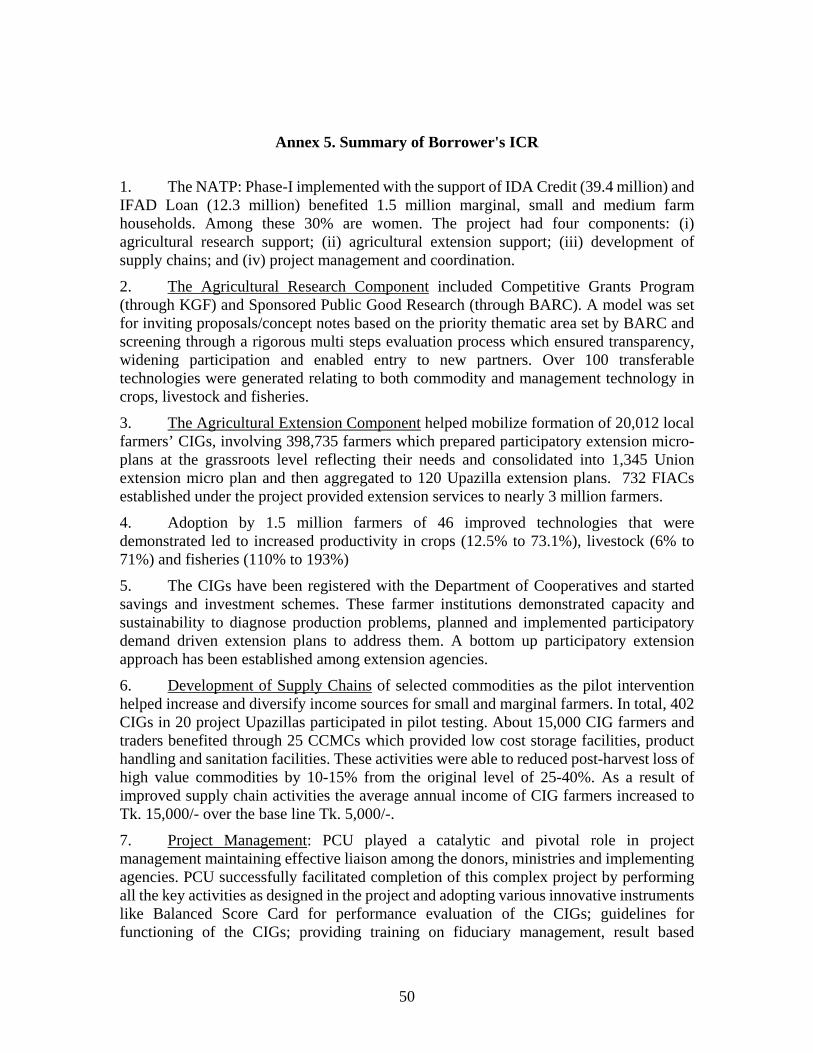
50
Annex 5. Summary of Borrower's ICR
1. The NATP: Phase-I implemented with the support of IDA Credit (39.4 million) and IFAD Loan (12.3 million) benefited 1.5 million marginal, small and medium farm households. Among these 30% are women. The project had four components: (i) agricultural research support; (ii) agricultural extension support; (iii) development of supply chains; and (iv) project management and coordination.
2. The Agricultural Research Component included Competitive Grants Program (through KGF) and Sponsored Public Good Research (through BARC). A model was set for inviting proposals/concept notes based on the priority thematic area set by BARC and screening through a rigorous multi steps evaluation process which ensured transparency, widening participation and enabled entry to new partners. Over 100 transferable technologies were generated relating to both commodity and management technology in crops, livestock and fisheries.
3. The Agricultural Extension Component helped mobilize formation of 20,012 local farmers’ CIGs, involving 398,735 farmers which prepared participatory extension micro-plans at the grassroots level reflecting their needs and consolidated into 1,345 Union extension micro plan and then aggregated to 120 Upazilla extension plans. 732 FIACs established under the project provided extension services to nearly 3 million farmers.
4. Adoption by 1.5 million farmers of 46 improved technologies that were demonstrated led to increased productivity in crops (12.5% to 73.1%), livestock (6% to 71%) and fisheries (110% to 193%)
5. The CIGs have been registered with the Department of Cooperatives and started savings and investment schemes. These farmer institutions demonstrated capacity and sustainability to diagnose production problems, planned and implemented participatory demand driven extension plans to address them. A bottom up participatory extension approach has been established among extension agencies.
6. Development of Supply Chains of selected commodities as the pilot intervention helped increase and diversify income sources for small and marginal farmers. In total, 402 CIGs in 20 project Upazillas participated in pilot testing. About 15,000 CIG farmers and traders benefited through 25 CCMCs which provided low cost storage facilities, product handling and sanitation facilities. These activities were able to reduced post-harvest loss of high value commodities by 10-15% from the original level of 25-40%. As a result of improved supply chain activities the average annual income of CIG farmers increased to Tk. 15,000/- over the base line Tk. 5,000/-.
7. Project Management: PCU played a catalytic and pivotal role in project management maintaining effective liaison among the donors, ministries and implementing agencies. PCU successfully facilitated completion of this complex project by performing all the key activities as designed in the project and adopting various innovative instruments like Balanced Score Card for performance evaluation of the CIGs; guidelines for functioning of the CIGs; providing training on fiduciary management, result based

51
monitoring & evaluation (RBME), communication and media, ICT and website development, and public procurement system and Governance and Accountability Action Plan (GAAP).
8. Monitoring and Evaluation: The project monitoring and evaluation systems conducted internal monitoring and evaluation. A concurrent quarterly monitoring and evaluation of the project output, outcome and impacts was conducted by an external independent monitoring and evaluation farm. A comprehensive Impact Assessment Study was conducted by independent consulting firm. In addition, an independent Expert Impact Assessment Team (EIAT) reviewed the implementation progress of the project.
9. Environment and Social Safeguards: The NATP Phase-I complied with the environmental and social safeguard guidelines as identified in the EMF. Many project interventions facilitated environmental safeguard through the use of green technology namely, Alternate Wetting and Drying (AWD), application of increased quantity of organic compost and cow dung and reducing quantity of chemical fertilizers, adopting integrated judicious pest management practices with IPM focus, use of sex-pheromone, use of botanical (herbal) pest control measures in storage.
10. Fiduciary Compliance: The NATP Phase-I maintained fiduciary compliance including measures for improving financial management and procurement aspects thereby ensuring efficiency and transparency.
11. Lessons Learned: The lessons learned from NATP Phase-I include: (i) competitive research awarding system with newly evolved competitive and transparent research proposal processing; (ii) linkage established between research-extension-farmer; (iii) effective group approach and decentralized extension system using CIGs with participatory bottom up extension micro planning; (iv) farmers’ access to integrated extension services through the institutional arrangement of FIACs at the union level; (v) transformation of farming category from subsistence to commercial farming as evidenced by successful cultivation of different fruits (e.g. lemon, guava), vegetables (e.g. summer tomato, gourds), milk and dairy products, meat (e.g. cattle fattening), integrated fish culture; (vi) establishment of farmer-market linkage through CCMCs facilitating quality processing, sorting, washing, packing, carrying and transporting of product to urban markets; and (vii) coordinated team work in the project management - all leading to successful implementation in achieving the project objectives.
12. Achievement of Project Development Objectives: The two specified Project Development Objectives (PDOs) have been achieved: the target of productivity increase was by 10% and household income increase by 10%. Productivity in crops increased by 12.5% to 73.10 % (Potato - 12.5% and Brinjal - 73.1%), productivity increase in livestock ranged from 6% to 71% (Poultry Layers - 6%, Cattle - 71%). Fisheries productivity increased by 110% to 193%. The household income increased for marginal farmers by 42%, small farmers by 31% and medium farmers by 17%.
13. Efficiency: The economic and financial analysis conducted for the project revealed the level of efficiency in terms of tangible outcomes of forming 20,012 CIGs comprising 398,735 farmer members (30% are female) and 1,043,120 Non-CIG farmers, established 732 FIACs providing extension services to about 3 million farmers demonstrating 46 technologies through 81,375 demonstrations and 382,137 CIG farmers adopted new

52
technologies. The technology diffusion from CIG to non-CIG farmers was at the ratio of 1:4. In addition, 402 CIGs have been linked with the market and above 10,000 CIGs registered with the Co-operative Department of the Government. In NATP: Phase-I technology adoption rate was 40%, production and net income increased was by 34% and 23% respectively.
14. Overall Rating and Justification: The overall rating of the project is “Satisfactory” for most of the project components. However, with the level of achievement of the PDOs and overwhelming success, a number of innovative approaches have been rated as “Highly Satisfactory” recognizing that all project components have achieved the set targets even many have exceeded the respective targets, and the project was able to contribute: (i) to systems development in the form of coordination among the research institutes and research and extension organizations, (ii) in establishing decentralized and integrated extension services with bottom-up approach, participatory extension micro-level planning, (iii) in bringing extension services to the farmers’ doorstep through FIACs and market linkage development centering CCMCs.

53
Annex 6. Government Comments on the draft ICRR (reproduced in unedited form)
1. The Economic Relations Division, Ministry of Finance of the Government of Bangladesh through its letter dated June 18, 2015 provided the following comments on the draft ICRR: 2. The ICR report prepared by the World Bank covered all aspects of project activities-research, extension and supply chain. ICR report reveals that the project was able to deliver all key outputs (para 2), all performance triggers required to move from Phase-l to Phase-2 of the 15 year APL were satisfactorily fulfilled (para-23), the performance of M&E system was satisfactory (para 25), the compliance with social and environmental safeguard are satisfactory (para 31, 32), the overall accounting and reporting system was reasonably functional (para 34), the PDO was fully achieved (para 45), a total of 1.9 million farmers adopted various technology packages against the target of 0.3 million farmers (para 54), overall economic efficiency of the project was found to be substantial (para 62), the project outcomes rated as satisfactory (para 67), the woman participation in the decision making process is robust and are often found in leadership position in CIGs (para 71). In-spite of all these achievements, borrower's rating has been given as "moderately satisfactory". This rating can be revisited.
3. The Government agreed with USAID AF fund and accordingly NATP Phase-l. DPP was revised for accommodating the USAID fund amounting to USD 7.05 million. Finally, the World Bank did not take the initiative to sign the financing agreement and ultimately fund was not available to NATP Phase-I. However the amount has been committed for NATP-2. Therefore para 12 and para 90 could be rephrased according to the fact.
4. In para 24 3rd line, the disbursement reached USD 72.11 million (around 92% of the target) instead of USD 65.7 million (around 90% of the target).
5. In para 2l, 2nd line PMU could be deleted; in para 36, 2nd line, PCMU should be replaced with PCU; in para 90 Ministry of Agriculture should be written as MOA instead of MA; in para 91 Ministry of Fisheries and Livestock should be written as MOFL instead of MFL.
6. NATP-2 is built on the comprehensive learning of NATP. Overall the report appears to be comprehensive.
54
Annex 7. List of Supporting Documents 1. Project Appraisal Document (PAD)
2. Aide Memoires and ISRs following implementation support missions
3. Management Letters following implementation support missions
4. Bangladesh Country Assistance Strategy (CAS)
5. Bangladesh Country Partnership Strategy (CPS) FY2011-2014 (extended to FY2015)
6. Bangladesh Country Investment Plan, 2011
7. IFAD’s Country Strategic Opportunities Program for Bangladesh (2012-18)
8. Operation Manual
9. Financial Management Manual
10. Environmental and Social Management Framework (ESMF)
11. Government Project completion report (PCR)
12. Annual Reports of M&E Consultant
13. Impact Assessment Report of M&E Consultant

55
Map of Bangladesh
IBRD 33368R


![[MS-RPL]: Report Page Layout (RPL) Binary Stream Format€¦ · MS-RPL] —. stream report. report page. report report report](https://img.pdfslide.us/doc/110x75/5fd9f7a7a90b7c34145fa364/ms-rpl-report-page-layout-rpl-binary-stream-format-ms-rpl-a-stream-report.jpg)