Embed Size (px)
Citation preview

1
Document of Reference
2001 Financial Period
This is an English translation of the original French Document of Reference which was filed with the French securities and exchange commission (COB - Commission des Opérations de Bourse) on July 5, 2002, in compliance with article 95-01 of COB regulations. It may be used in support of a financial operation if accompanied by a prospectus certified by the COB. The original Document of Reference was prepared by the issuer and is binding on its signatories.

2
Contents
Chapter 1: Responsibility for the Document and Declarations 1.1 Document Authority 1.2 Declaration of Document Authority 1.3 Financial Auditors 1.4 Auditors' Declaration 1.5 Authority for Financial Information
Chapter 2: General Information Concerning the Company and its Capital 2.1 General Information Concerning Issuer 2.2 General Information Concerning Share Capital 2.3 Recent Dividends 2.4 The Market for Issuer's Shares
Chapter 3: General Information Concerning the Business, Recent Developments and Outlook of the Issuer 3.1 The Business 3.2 Risk Factors 3.3 Investment Strategy 3.4 Recent Developments 3.5 Strategy and Outlook 3.6 Extraordinary Items and Litigation GLOSSARY

3
Chapter 4: Financial Data
4.1 Consolidated Financial Statements 4.2 Condensed Parent Company Financial Statement 4.3 Management Report for period ending Dec. 31, 2001 4,4 Subsidiaries’ and Equity Interests 4.5 Special Report concerning Options – shareholders meeting of June 26, 2002
(financial period ending December 31, 2001) 4.6 Auditors’ Report on the Parent Company Financial Statements of ESKER SA.
Chapter 5: Directors and Management 5.1 Directors and Management 5.2 Compensation of Directors and Officers 5.3 Policy Regarding the Allotment of Options for the Subscription and Purchase of
Shares
4
Chapter 1: Responsibility for the Document and Declarations 1.1. Document Authority Jean-Michel BERARD - Chairman of the Board of Directors
1.2. Declaration of Document Authority To the best of my knowledge, the data contained in this document is correct and includes all information necessary to enable investors to formulate an opinion concerning the assets and liabilities, business, financial situation, earnings and prospects of the company and the rights attached to the shares offered. It contains no omission, which could affect the meaning of this document. Lyon, July 4, 2002 Jean-Michel BERARD Chairman of the Executive Board
1.3. External Auditors • Statutory auditors: S.A. Deloitte Touche Tohmatsu represented by Dominique VALETTE
185 Avenue Charles de Gaulle - 92200 NEUILLY-SUR-SEINE - France Date of appointment: June 19, 2000 Expiration of appointment: Shareholders' meeting called to approve the financial statements for the period ending December 31, 2005
Yves FOURNAND
55 avenue Galline - 69100 VILLEURBANNE - France Date of appointment: May 30, 1997 Expiration of appointment: Shareholders' meeting called to approve the financial statements for the
period ending December 31, 2002. • Substitute auditors: SARL B.E.A.S. 7/9 Villa Houssaye -92200 NEUILLY SUR SEINE - France Date of appointment: June 19,2000 Expiration of appointment: Shareholders' meeting called to approve the financial statements for the
period ending December 31, 2005. Jacques TAFFIGNON
Parc d'affaires Crecy-Telebase 18 avenue du Général de Gaulle - 69370 St DIDIER AU MONT D'OR - France Date of appointment: May 30, 1997 Expiration of appointment: Shareholders' meeting called to approve the financial statements for the
period ending December 31, 2002

5
1.4. Auditors' Statement As auditors of the Company (ESKER), in accordance with COB regulation 95-01, we have audited the financial and accounting information contained in this document according to generally accepted accounting principles in France. This document was established under the responsibility of the Chairman of the Executive Board. It is our duty to express an opinion based on the fair presentation of the information contained herein concerning the financial situation and financial statements. Our review has consisted of verifying, according to generally accepted accounting principles in France, the conformity of the data with the financial statements as reported, based on the nature of the accounting and financial data presented. It has also consisted of reviewing all other information contained in this document, with the aim of identifying any inconsistencies or errors should they exist (with reference to our knowledge of the Company as gained throughout the course of our engagement). This review has taken into account the assumptions adopted by management and the resulting forecasted figures, in respect of the isolated use of forecasted data developed through the application of a systematic approach. The corporate and consolidated annual financial statements for the periods ending December 31 of 1999, 2000 and 2001, established by the Executive Board, have been audited by us and certified without qualification or comments, in accordance with generally accepted accounting standards. On the basis of this review, we do not have any observations regarding the sincerity and fairness of the financial and accounting information presented herein. Villeurbanne, July 3, 2002
The Auditors
Yves FOURNAND DELOITTE TOUCHE TOHMATSU
Dominique VALETTE
1.5. Authority for Financial Information Emmanuel OLIVIER - Chief Financial Officer 10 Rue des Emeraudes - 69006 LYON - France Tel: 04.72.83.46.46

6
Chapter 2: General Information Concerning the Company and its Capital
2.1. General Information Concerning Issuer 2.1.1. Company Name ESKER 2.1.2. Registered Office 10 rue des Emeraudes Immeuble “GEO CHAVEZ” 69006 LYON - France
2.1.3. Legal Form Public Limited Company (Société Anonyme) established under French law with an Executive Board and Supervisory Board, governed by the French Commercial Code. 2.1.4. Duration Fifty years from the date of its registration with the Companies Register (February 7, 1985), except in the case of extension or early liquidation as provided by law. 2.1.5. Corporate Purpose Under article 2 of its bylaws, the purpose of the company is as follows:
• the design, development and operation of information technology products and all industrial, commercial and financial, securities and real estate transactions directly or indirectly related to the corporate purpose, or any similar or related activities;
• the participation, by any means, in all companies created or to be created, which may be related to the corporate purpose, notably through the creation of new companies, providers, limited partnerships, subscription to or purchase of shares or ownership interests, mergers, alliances or joint ventures, or hired businesses.
2.1.6. RCS No. & APE code
RCS: LYON B 331 518 498 - Code APE: 722 Z
2.1.7. Fiscal Year
The company's fiscal year begins on January 1st and ends on December 31st of each calendar year.
2.1.8. Distribution of Profits Under Bylaws
From the profits of the period, less prior period losses when applicable, are first deducted:
• upwards of five percent, to fund the legal reserve. This deduction ceases to be mandatory when this amount corresponds to ten percent of the value of authorized capital. When the legal reserve falls below ten percent, for whatever reason, it again becomes mandatory,
• any amounts appropriated in reserve, as required by law.

7
The balance, increased by retained earnings, constitutes the distributable profit which may be allocated to shareholders as a dividend, appropriated to all reserves or retained earnings, as deemed appropriate in a Shareholders’ Meeting. The Shareholders’ Meeting General may in addition, result in a decision to distribute amounts from reserves at its disposal. In this case, the decision must expressly indicate the accounts from which the deductions are made.
The annual Shareholders’ Meeting , by ratifying the financial statements of the period, may give each shareholder the option of receiving a payment in cash or in stock dividends, for all or part of the dividends to be distributed. 2.1.9. Shareholders' Meetings
• Shareholders' meetings are called and proceedings are conducted according to conditions provided under law.
• Meetings are held at the registered office or any other location specified in the summons .
• Meetings are open to all shareholders, regardless of the number of shares they possess, subject to the provisions of the law.
• Double voting rights are not provided for under the bylaws. 2.1.10. Special Provisions of Bylaws Disclosure of information concerning holders of bearer shares
• According to the provisions of article L228-2 of the French Commercial Code, the company may request at any time that the clearing organization disclose information regarding the identity of shareholders and the number of shares they hold, as well as other information authorized under current legislation.
Share ownership thresholds
• In addition to the legal obligation to inform the company and the Conseil des Marchés Financiers of the holding of certain fractions of the capital, any individual or legal entity, acting individually or jointly, which acquires a percentage of the capital or voting rights equal to 3%, or increases or decreases its holdings in the capital or voting rights by more than 3 %, must inform the Company of the total number of shares it holds, within 15 days of this change, by registered letter with acknowledgement of receipt.
• Failure to notify the company within 15 days will result in the loss of voting rights for a period of two years following the date of the regularization of this notification, when a request is formulated and placed on the record in the minutes of the Meeting by one or more shareholders with a share of the capital or voting rights equal to 3%.
2.1.11. Company Repurchase of its Own Shares Under the authorization granted by the Shareholders’ Meeting of June 18, 2001, The company thereby acquired a total of 24,233 ESKER shares during 2001 for a total of EUR 118,048 (i.e. an average price per share of EUR 4.87), as summarized in the table below. As these shares were not destined for a specific use, they were recorded as fixed assets. In addition, the company canceled no shares during the period under review. The number of treasury shares held directly by the company on December 31, 2001 was 127,514 at an average unit cost price of EUR 13.63.

8
The company also acquired and sold ESKER shares within the context of a market making agreement concluded with the Fideuram Wargny company on July 1, 1998. The number of treasury shares held indirectly by the company on December 31, 2001 was 2,413. The company therefore held, on a direct or indirect basis, a total of 129,927 ESKER shares on December 31, 2001, i.e. 3.82% of the share capital on this date.
Summary of ESKER share acquisitions by month (2001) Month Number Average price Total
Jan-01 0 - € - € Feb-01 0 - € - € Mar-01 0 - € - € Apr-01 3 065 5.40 € 16,566 € May-01 7 200 6.03 € 43,406 € Jun-01 4 908 5.89 € 28,914 € Jul-01 100 5.52 € 552 € Aug-01 0 - € - € Sep-01 5 350 2.54 € 13,592 € Oct-01 3 610 4.16 € 15,019 € Nov-01 0 - € - € Dec-01 0 - € - € TOTAL 24,233 4.87 € 118,048 €
This authorization to purchase treasury shares will be renewed. At the Shareholders’ Meeting on June 26, 2002, it was proposed to authorize the company, for a period lasting until the next meeting called to approve the financial statements for 2002 (and in any event, for a maximum of 18 months, i.e. until December 25, 2003), and in accordance with article 225-209 of the French commercial law, to trade its own shares on the stock exchangef, with the following goals:
• Share price stabilization of the Company's shares by buying company shares on price rises and selling on declines within the framework of a market making agreement,
• Purchasing and selling company shares according to market conditions, • Allotting shares to company employees, • Facilitating the company’s financial operations, by enabling the shares acquired to be,
either in part or in their entirety, sold, retained, lent, transferred or exchanged, • Possibly canceling the repurchased shares, up to a maximum amount of 10% of the
share capital and according to conditions to be determined by an exceptional Shareholders' Meeting called specifically for this purpose.
Under this authorization, the maximum purchase price will be 20 € per share and the minimum sale price is 0.50 € per share. The maximum number of shares able to be acquired under this authorization is 10% of the share capital.
The aforementioned program will be implemented by the Executive Board, which will meet following the Shareholders’ Meeting on June 26, 2002. The prospectus concerning this share repurchase program will then be submitted to the French securities and exchange commission (COB) for certification, following which the program will be put into practice. The certified prospectus will be sent to all shareholders on request. The maximum percentage of capital authorized by the Shareholders' Meeting after the implementation of this program decided by the Board of Directors' meeting of June 26, 2002, is 10% of the company's existing capital, i.e. 341,416 shares (on the basis of 3,414,161 shares after the capital increases carried out following the exercise of stock options in 2001 and approved at the Shareholders’ Meeting of June 26,2002 ). Given the number of shares already held (on a direct or indirect basis) on May 31, 2002 (149,996, i.e. 4.39% of the capital), 191,420 shares may be purchased (i.e. 5.61% of the capital).

9
Therefore, the maximum amount that ESKER would be in a position to pay, according to the hypothesis of purchasing at maximum price, would be EUR 19,142,000, (the unit purchase price will be set by the combined meeting of shareholders on June 26, 2002 - hypothesis of a maximum purchase per share of EUR 100). However, on the basis of the average market price for May 2002, i.e. EUR 4.14, this amount could total EUR 792,749. In the case of a change in capital, the authorization would apply to 10% of the new capital. ESKER undertakes to remain, at all times, within the limit of 10% of its capital (on a direct or indirect basis), in compliance with the provisions of the French Commercial Code (Art. L225-209 and f.). It also undertakes, in compliance with the provisions applicable to companies listed on the Nouveau Marché of the Paris stock exchange, to maintain a minimum float of 20%.
2.2. General Information Concerning Share Capital 2.2.1. Share capital The capital of the company on December 31, 2001 was EUR 6,800,592, corresponding to 3,400,296 shares with a nominal value per share of EUR 2, fully paid up and all of the same category. Pursuant to the capital increase carried out following the exercise of stock options in the year duly noted by the Shareholders’ Meeting of June 26, 2002, the capital of the company will total EUR 6,828,322 divided into 3,414,161 shares with a nominal value of EUR 2 per share. 2.2.2. Other shares available for issuance: options to subscribe for shares Within the framework of authorization granted by the Extraordinary Shareholders' Meetings referred to in the following summary table, the Board of Directors, followed by the Executive Board, granted certain members of personnel of the ESKER group options to subscribe for shares. The special report drawn up by the Executive Board in accordance with article L.225-184 of French commercial law, and presented at the combined meeting of shareholders on June 26, 2002, describes all operations connected with options to purchase and subscribe to shares. More detailed information related to options to subscribe to shares is provided in the abovementioned report, included in this document (cf. Chapter 4 - section 4.5).
Plan No.
SM Implementation Expiry date of
plan
Number of allottable options
Number of subscribed
options
Number of exercisable
options
Balance of
allottable options
Notes
BOD / EB
Date
2 19.07.96 BOD 29.07.96 28.07.01 155,000 95,770 57,043 0 (1) 5 19.03.99 BOD 09.04.99 08.04.04 100,000 12,581 80,503 6,916 - 6 30.08.99 EB 31.08.99 30.08.04 200,000 0 189,034 10,966 - 7 05.01.00 EB 10.01.00 09.01.05 170,000 0 11,724 0 (2) 8 10.10.00 EB 13.10.00 12.10.05 200,000 0 197,689 158,276 -
8 bis 10.10.00 - - 12.10.05 198,677 2,475 196,202 0 (3)
TOTAL 1,023,677 110,826 732,195 176,158
(1) Allotment deadline for Plan No. 2: July 28, 2001. No allottable options remaining on December 31, 2001. (2) Plan No. 7 corresponds to the New Business Creators' Share of Stock Warrants (BSPCE) allocated to employees of the French parent company in January 2001. Options made available again through the departure of some employees or the start of repricing operations for other employees cannot be reallocated pursuant to the applicable legal requirements (allotment waiting period). (3) Options held by employees of V.S.I. Inc. When V.S.I. Inc was acquired on October 10, 2000, the stock option plan then in operation within V.S.I. was converted to the ESKER S.A. stock option plan (198,677 ESKER

10
S.A options for 5,056,572 V.S.I. options) in accordance with the acquisition agreement. The terms and conditions for the exercise of stock options remain the same as those in the initial plan (variable duration, exercise price between EUR 0.29 and EUR 23.45). 2.2.3. Other Securities Conferring Rights to Capital None. 2.2.4. Stock option plans - options to purchase shares
Within the framework of the authorization granted by the Extraordinary Shareholders' Meetings referred to in the following summary table, the Board of Directors and Executive Board granted certain personnel of the ESKER group stock purchase options. The special report drawn up by the Executive Board in accordance with article L.225-184 of French commercial law, and presented to the combined meeting of shareholders on June 26, 2002, describes all operations connected with options to purchase and subscribe for shares. More detailed information related to share purchase options is provided in the abovementioned report, included in this document (cf. Chapter 4 - section 4.5).
Plan no.
SM Implementation Expiry date
Number of allottable options
Number of subscribed
options
Number of exercisable
options
Balance of
allottable options
BOD / EB
Date
3 18.04.97 BOD 21.04.97 20.04.02 63,750 34,517 26,653 2,5804 09.04.98 BOD 30.04.98 - 85,007 1,824 81,326 1,857
TOTAL 148,757 36,341 107,979 4,437

11
2.2.5. Changes in Share Capital Since January 1, 1990
DATE NATURE OF OPERATION SHARE CAPITAL
VARIATIONS (FRF/EUROS) SUCCESSIVE
SHARE CAPITAL
AMOUNTS FRF/EUROS
TOTAL NUMBER OF
SHARES
NOMINAL VALUE (FRF)
NOMINAL VALUE
PREMIUM
1-Jan-1990 411,000 F 1,096 375
22-Dec-1995 Issuance for cash of 148 new shares at a price per share of FRF 36,000
55,500 F 5,272,500 F 466,500 F 1,244 375
2-Apr-1996 Capitalization of the share premium and increasing the nominal value of shares
5,131,500 F - 5,598,000 F 1,244 4,500
250 -for-one stock split - - 5,598,000 F 311,000 18
27-Jan-1997 Exercise of 2,500 options to subscribe at FRF 18.40 per share
45,000 F 1,000 F 5,643,000 F 313,500 18
23-May-1997 Exercise of 6,750 options to subscribe at FRF 18.40 per share
121,500 F 2,700 F 5,764,500 F 320,250 18
30-May-1997 Capitalization of reserves and increasing the nominal value of shares
11,849,250 F - 17,613,750 F 320,250 55
Five-for-one stock split - - 17,613,750 F 1,601,250 11
2-Jul-1997 Issuance of shares for cash within the framework of listing on the Nouveau Marché of the Paris Stock Exchange
4,347,970 F 54,151,990 F 21,961,720 F 1,996,520 11
1997 Exercises of 10,000 options to subscribe at FRF 3.68 per share
110,000 F -73,200 F 22,071,720 F 2,006,520 11
17-Jul-1998 Capital increase of 336,000 shares reserved for Mr. Russell Teubner (1)
3,696,000 F 59,737,440 F 25,767,720 F 2,342,520 11
1998 Exercises of options to subscribe for shares 500,159 F 835,771 F 26,267,879 F 2,387,989 11
19-Mar-1999 Capital increase in connection with the acquisition of Alcom (1)
659,989 F 8,104,762 F 26,927,868 F 2,447,988 11 FRF
31-Aug-1999 Capital increase in connection with the acquisition of Persoft (1)
7,245,337 F 84,048,350 F 34,173,205 F 3,106,655 11 FRF
1999 Exercises of options to subscribe for shares 300,036 F 900,516 F 34,473,241 F 3,133,931 11 FRF
10-Oct-2000 Capital increase in connection with the acquisition of V.S.I. (1)
2,663,639 F 38,445,568 F 37,136,880 F 3,376,080 11 FRF
2000 Exercises of options to subscribe for shares 266,376 F 1,517,061 F 37,403,256 F 3,400,296 11 FRF
2001 Conversion of the share capital into Euro (through the capitalization of reserves)
1,098,502 € - 6,800,592 € 3,400,296 2 €
2001 Exercises of options to subscribe for shares 27,730 € 31,733 € 6,828,322 € 3,414,161 2 €

12
2.2.6. Analysis of Capital and Voting Rights
• Changes in the breakdown of capital: (since the end of 1995)
In December 1995: Two private investors became shareholders:
• GALILEO S.A. (Groupe WORMS et Cie) • THOMPSON CLIVE INVESTMENTS plc and THOMPSON CLIVE INTERNATIONAL Ltd • with 148 shares with a nominal value per share of FRF 375 for each group (i.e. 185,000
current shares after the stock-splits), through the: • sale of 148 shares by four prior shareholders, • capital increase through the issuance of 148 new shares.
This sale and this subscription were carried out at a price per share of FRF 36,000 (i.e. FRF 28.80 after the stock split).
In January 1997:
The Company ESKER S.A. acquired from two shareholders (individuals) 12,750 shares with a nominal value of FRF 18 per share (i.e. 63,750 shares after the stock-splits), at FRF 144 per share action (i.e. FRF 28.80 after the stock-splits), in order to implement stock option plans in favor of management of certain subsidiaries.
In 2000, the company purchased 24,925 of its own shares as follows:
• May 2000: 5,000 shares (average price: EUR 39.75) • December 2000: 19,925 shares (average price: EUR 9.39).
In the 2001 financial period, the company directly acquired 24,233 ESKER shares for a total of EUR
118,048 (i.e. an average price per share of EUR 4.87). It also acquired and sold ESKER shares within the framework of a market making agreement concluded with the Fideuram Wargny company dated July 1, 1998. More detailed information is provided in section 2.1.11 of this document ("Company Repurchase of its Own Shares").
As the shares purchased on a direct basis in 2000 and 2001 are not currently destined for a specific purpose (allotment of shares to employees within the framework of stock option plans and/or share price stabilization), they have been recorded under the securities in the financial statements of ESKER S.A, in accordance with the applicable accounting rules. On December 31, 2001, the breakdown of capital and voting rights was as follows:
On December,
31 2001
Shareholders Number of shares
% of capital % of voting rights
Jean-Michel Bérard 301,820 8.88% 9.22%
Thomas Wolfe 279,095 8.21% 8.53%
Russell Teubner 233,000 6.85% 7.12%
David Droman 195,647 5.75% 5.98%
Benoît Borrits 92,788 2.73% 2.84%
Direct self-holding (registered & bearer) 127,514 3.75% 0.00%
Other registered 136,699 4.02% 4.18%
Public 2,033,733 59.81% 62.14%
Total 3,400,296 100.00% 100.00%

13
2.2.7. Shareholders' Agreements / Pledging of ESKER Shares
• Shares pledged: none • Shareholders' agreements: Existing shareholders' agreements were dissolved
pursuant to the listing of the company's shares. 2.2.8. Lockup Agreements with Management Shareholders
- Following the public listing of the Company's shares on the Nouveau Marché, Mr Benoît Borrits and Mr Jean-Michel Bérard undertook to retain 80 % of their holding of shares for three years (i.e. until July 2, 2000). - Mr Russ Teubner had also undertaken to retain 80 % of his shares until this same date. These commitments lapsed on July 2, 2000. 2.2.9. Other Lockup Agreements Some shareholders had undertaken to retain possession of 100% of their ESKER shares for a period of nine months following the listing of the Company on the Nouveau Marché, as a token of their support for the project. These commitments lapsed on April 2, 1998. The following shareholders were involved:
• Anne-Marie BORRITS • Didier RABIER • Pierre RABIER • Nicole RABIER • GALILEO S.A. • THOMPSON CLIVE INVESTMENTS (UK) • THOMPSON CLIVE INTERNATIONAL (Jersey)
2.3. Recent Dividends No dividends have been paid for the last three financial periods.

14
2.4. The Market for Issuer's Shares The company’s shares have been listed on the Nouveau Marché of the Paris stock exchange since July 2, 1997, date of the ESKER's IPO (Code SICOVAM / EUROCLEAR: 3581). The following table presents monthly stock prices and trading volume during the last 24 months:
Month Price (EUR) Trading Volume
+ high + low No. of shares traded
Capital '000€
January 2000 50.90 38.25 311,678 13.33 February 2000 71.00 42.20 357,259 18.84 March 2000 85.00 45.00 480,064 30.95 April 2000 58.00 32.00 193,177 8.08 May 2000 38.10 23.30 182,647 5.76 June 2000 33.83 24.10 122,368 3.40 July 2000 25.40 16.00 136,136 2.62 August 2000 26.89 11.98 356,580 6.54 September 2000 24.90 16.50 96,894 1.99 October 2000 17.00 10.50 159,159 2.06 November 2000 14.40 10.11 148,279 1.85 December 2000 10.94 6.80 333,859 3.01 January 2001 9.70 6.50 145,698 0.10 February 2001 7.55 5.16 83,821 0.19 March 2001 6.30 4.40 91,050 1.12 April 2001 6.30 4.55 81,846 0.18 May 2001 6.30 5.70 67,011 0.40 June 2001 6.10 4.15 78,222 0.39 July 2001 5.99 4.10 107,010 0.57 August 2001 6.25 3.61 73,709 0.38 September 2001 4.79 1.95 207,808 0.63 October 2001 5.94 3.71 203,815 1.01 November 2001 5.50 4.65 138,303 0.71 December 2001 5.83 4.40 118,430 0.61 January 2002 5.55 4.27 55,659 0.27 February 2002 4.65 3.81 46,633 0.19 March 2002 5.05 3.95 252,837 1.12 April 2002 4.85 4.21 40,229 0.18 May 2002 4.48 3.66 47,593 0.19 June 2002 3.99 2.27 112,671 0.34
15
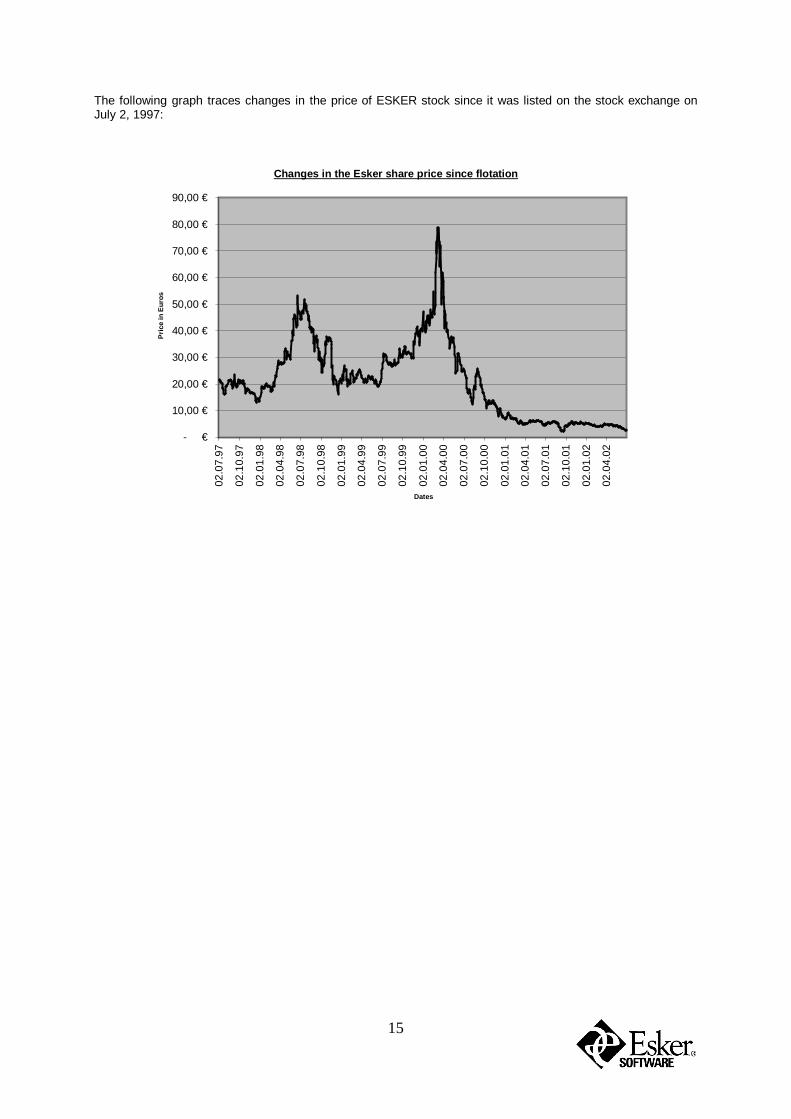
The following graph traces changes in the price of ESKER stock since it was listed on the stock exchange on July 2, 1997:
Changes in the Esker share price since flotation
- €
10,00 €
20,00 €
30,00 €
40,00 €
50,00 €
60,00 €
70,00 €
80,00 €
90,00 €
02.0
7.97
02.1
0.97
02.0
1.98
02.0
4.98
02.0
7.98
02.1
0.98
02.0
1.99
02.0
4.99
02.0
7.99
02.1
0.99
02.0
1.00
02.0
4.00
02.0
7.00
02.1
0.00
02.0
1.01
02.0
4.01
02.0
7.01
02.1
0.01
02.0
1.02
02.0
4.02
Dates
Pri
ce in
Eur
os

16
Chapter 3: General Information Concerning the Business, Recent Developments and Outlook of the Issuer The terms followed by an asterisk are included in a Glossary (end of Chapter 3 of this document).
3.1. The Business ESKER designs and delivers product software* for businesses. Business computing platforms are generally comprised of heterogeneous* components (servers, databases, applications, PCs…), acquired over several years and frequently not compatible with each other. ESKER provides solutions for connectivity* between a company's existing technology and emerging technologies as was the case for PC under Windows and now Internet*, Intranet* or mobile phone applications. The objective of these solutions is to optimize existing software* and resources (applications, databases, peripherals…) by rapidly integrating the new technologies. ESKER develops and markets two principal product families:
• “Intelligent Information Delivery” (IID) products which ensure the distribution of documents or
information generated by the information system to customers, partners or employees of the company, regardless of its nature, and in all electronic formats which currently exist in business environments. The delivery capabilities provided include notably e-mail (e.g. with PDF, HTML or text attachments, secured or not), web content, fax, short messages for mobile phones, hybrid mail*, etc.
• “Host Access*” applications which enable PC platforms to communicate with host computers.
The Host Access applications developed by ESKER may include modules for terminal emulation*, peripheral sharing (printers, hard disks…) and access to databases. Host Access products use several different technologies which can be divided into two main groups: traditional products (PC-to-Host) and new products taking advantage of Internet technologies (Web-to-Host).
3.1.1 Historical Overview of the Company ESKER was founded in 1985 by two computer engineers with the objective of designing software applications for businesses. The Company's development can be divided into several phases:
• The Start-Up Phase (1985-1988) The founders created ESKER with limited means after completing their studies. Because the cost of entry in the software development sector was relatively high, ESKER devoted this period to an activity generating immediate income: systems integration services. In parallel to this activity, the company developed the basis of its current software products. This initial period also enabled the managers to develop experience in the market of open systems*. For the 1998 financial period, the Company recorded sales of EUR 0.25 million.
• The Transition (1989-1991) In March 1989, ESKER marketed its first Host Access* software products, notably the TUN product which provided the basis for the company's development over the following years. Management decided to position the Company as a developer of software products and opened up its capital to outside investors. The first contracts were signed with European distributors. During this period, ESKER progressively abandoned the service activity, with the exception of services related to software sales. In July 1991, ESKER established a

17
subsidiary devoted to technology watch in the U.S. In the 1991 financial period, the company recorded sales of EUR 0.9 million.
• The Development Phase (1992-2000) ESKER launched a strategy to become a world player, initially focusing on European development. While marketing its products primarily through a network of distributors and retailers, ESKER created subsidiaries in the key industrialized countries to strengthen ties with the end-user and reinforce sales:
1992 • Creation of a branch in Germany
1994 • Creation of subsidiaries in the UK and Canada
• Transformation of the German branch into a subsidiary
1995 • Creation of Italian and Spanish subsidiaries
•
1997 • Creation of a subsidiary in Singapore
• Creation of a subsidiary in Australia and acquisition of the business of its Australian distributor, Unitract Pty Ltd. Closure of the Singapore and Canadian subsidiaries and redeployment of their activities to the Australian and U.S. subsidiaries respectively.
1998 • Acquisition of Teubner & Associates in the U.S.
• Merger of this company with the San Francisco subsidiary
1999 • Acquisition of Alcom in the U.S. Merger of this company with the Stillwater subsidiary.
• Acquisition of Persoft (Madison, Wisconsin) in the U.S. which became the U.S. center for Host Access expertise.
• Merger of this company with the Stillwater subsidiary which became the U.S. center of expertise for fax servers.
2000 • Acquisition of the Californian company VSI, expert in fax servers under UNIX* environments.
• Announcement of the strategy concerning the development of the line of fax servers in the form of intelligent electronic document servers called PULSE.
In December 1995, ESKER opened up its capital to two investment companies: Galiléo (Groupe Worms) and Thompson-Clive (UK). The funds raised by the company contributed notably to strengthening the San Francisco subsidiary, which became the company's marketing division. On July 2, 1997, ESKER listed its shares on the Nouveau Marché of the Paris stock exchange. Raising EUR 15.6 million, this operation strengthened the company's equity capital by EUR 7,9 million through the issuance of new shares (after deduction of listing costs). In June 1998, ESKER acquired Teubner & Associates, a U.S. company based in Stillwater, Oklahoma. This acquisition provided ESKER complementary technology in the Web-to-Host* area (e-business for host-based applications), a diversification in the fax server market and a client base of large North American accounts. In April 1999, ESKER acquired Alcom, based in Mountain View, California. This acquisition was financed by the issue of 59,999 new shares and completed the line of ESKER fax servers by contributing an entry-level product and midrange line and provided access to a network of international distributors and resellers in the fax area. In 1998, Alcom had recorded sales of USD 1.8 million and an operating loss of USD 100,000. In September 1999, ESKER acquired Persoft, a U.S. company based in Madison, Wisconsin. This acquisition was financed in part through the issue of 658,667 new shares and a cash payment of USD 4.4 million. Persoft contributed complimentary technology to ESKER in the Web-to-Host area, critical market share in the PC-to-Host and Web-to-Host arenas and, finally, access to major North American distributors. In 1998, Persoft reported sales of USD 16.8 million and a net income of USD 1,89 million.

18
In October 2000, ESKER acquired the U.S. company VSI based in Lake Forest, California. VSI completes ESKER's line of fax servers under UNIX*. This acquisition was financed by the issue of 242,149 new shares and a cash payment of USD 235,000. In 1999, VSI recorded sales of USD 7.2 million and a net income of USD 0.6 million (this result does not take into account the bonuses paid to the principal manager of the company in the form of a distribution of dividends). Between 1989 and 2001, ESKER sales increased from EUR 0.33 million to EUR 32.3 million, for an average annual growth rate of 48%. Since marketing its first product in 1989, ESKER has shown a profit every year, with the exception of 2000 and 2001 for reasons explained in section 4.4 of the management report contained in this document. • Sales and Net Income of the Company – 1989 to 2001 (EUR '000)
-10 000 €
-5 000 €
0 €
5 000 €
10 000 €
15 000 €
20 000 €
25 000 €
30 000 €
35 000 €
19891991
19931995
19971999
2001
Sales (€ '000)Net income (€ '000)

19
On December 31, 2001 the organization of the ESKER Group was as follows:
ESKER SA (headquarters) based in Lyon, France Activity: General management and administration, R&D, sales for France, Africa and Middle East, Marketing Europe
ESKER USA Inc. Stillwater, Oklahoma, USA:
Fax server expertise center, sales for the U.S., Canada and Latin America; Madison, Wisconsin, USA: Host Access equity center, R&D Host Access, sales for the U.S., Canada and Latin America, Marketing Corporate
ESKER Ltd. based in Shardlow Activity: Sales for the UK, Ireland, Benelux and Scandinavia
ESKER GmbH based in Essen, Germany Activity: Sales for Germany and Eastern Europe
ESKER Italia Srl based in Milan, Italy Activity: Sales for Italy
ESKER Iberica Sl based in Madrid, Spain Activity: Spanish and Portuguese sales
ESKER Australia Pty Ltd. based in Sydney, Australia Activity: Sales for Australia, New Zealand and Asia
Research and development (R&D) is based in Lyon (France) for IID (Intelligent Information Delivery), Madison, Wisconsin for Host Access and Lake Forest, California for Unix* and Lotus Notes Fax Servers, while marketing is primarily based in Madison, Wisconsin. All the subsidiaries are wholly-owned and fully controlled (with the exception of the Spanish subsidiary held at 99.80%) by ESKER SA.
3.1.2 Presentation of the Company's activity ESKER designs and develops applications for businesses and professionals marketed as software products (software packages), i.e. user licenses generally materialized in the form of a CD-ROM and user documentation. All ESKER products are sold without complementary third party products, with the exception of the fax server product, which includes document format conversion modules and which is frequently sold by ESKER jointly with an intelligent fax board. Software products represent 84.5% of ESKER sales, with the balance corresponding to services (re-invoicing of transport, training and installation assistance, etc.), or the sale of maintenance and product upgrade contracts, and finally hardware (fax boards) related to these products. In this respect, ESKER defines itself as a software company and not as a service company or product distributor.
VSI Inc. Lake Forest, California Business unit dedicated to VSI products - Unix, Linux, Notes: R&D, Marketing, U.S. sales

20
3.1.3. The Products The company has three major product groups:
• Electronic document server applications (Pulse) • Fax server applications (Faxgate, VSI-Fax, VSI-Fax for Notes) • Host Access* applications covering all technologies (Tun PLUS, SmarTerm, Persona,
and A-Net)
• Electronic document servers
• Overview The electronic document server market originated from the fax server applications marketed by ESKER following its acquisition in 1998 of the U.S. company, Teubner & Associates. In the early '90s, the company developed a software product enabling a mainframe*-based application to automatically dispatch documents by fax without manual intervention. During the '90s, the fax server market developed at the worldwide level, generating significant growth until reaching overall maturity in 2000. The growth of new electronic media and new forms of digital commerce (e-business, m-business, c-business, etc.) has led to the development of three major priorities for existing applications to be able to communicate with each other:
• Management of multi-channel distribution (use of different media) through a single platform;
• Ease of integration with legacy systems, regardless of their nature; • Traceability of documents sent and tracking of the completion of transmissions.
Given the significant functionalities and level of sophistication offered by these new products, ESKER and the technological analysts of this sector have identified a new market which goes beyond the simple fax server segment. The market analyst IDC calls this market "DeliveryWare" whereas the Gartner Group uses the expression "Document Ouput Management" (DOM).
• Electronic document servers To respond to the need of companies for intelligent electronic document delivery, on February 1, 2001, ESKER launched its new product, PULSE.
Ø Presentation of the product
ESKER's PULSE is the first intelligent multi-channel company information delivery solution. Benefiting from ESKER's expertise in information system connections, PULSE collects documents and information produced by company applications which it formats and dispatches through various electronic channels (e-mail, fax, SMS, hybrid mail*, …).
Ø The applications of PULSE
• Back-office applications: ESKER noticed that the process for delivering key business documents (orders, factures, customer reminders, purchase requests, account statements, transaction receipts, etc.) does not currently benefit from the same level of sophistication and automation available for front office processes. For many companies, they are the result of internal applications (ERP, sales management, accounting, purchasing management, etc.) and frequently distributed in hard copy format. Yet, the potential savings generated by transferring all or part of the documents to electronic format are considerable. However, the absence of a universal platform for the automation of the distribution of documents, regardless of their origin, format or delivery channel, represents an obstacle to achieving these savings. ESKER considers that PULSE provides a response to this need, enabling all companies to optimize the costs of their document delivery process.

21
• Front-office applications: By digitizing documents transmitted and consequently reducing the cost of delivering information included in company information systems, PULSE increases the efficiency of information exchange processes. As a result, critical information can be shared more frequently, even in real time, at acceptable costs. PULSE, in this way, contributes to improved client relations. Moreover, gains in time are significant. Advantages in terms of satisfaction, while difficult to quantify, are certainly greater within the context of the development of customer relations management.
• Multi-channel mailing applications
As a result of its universal character, designed to manage diverse electronic media used by consumers and companies, PULSE can ensure that information is actually transmitted to its recipient, or that the sender is notified in the event of non-delivery. PULSE permits the use of the most appropriate channel to communicate with each recipient and ensures the traceability of documents sent. In this respect, management warning notifications (notifications to health authorities, withdrawal of contaminated products, etc.) and the area of enterprise marketing and communications applications (EMA: Enterprise Marketing Automation) can fully benefite from the extensive capabilities and flexibility of the PULSE server.
Ø Delivery channels covered by PULSE Currently, the following document delivery channels are available through the PULSE product:
• E-mail: at present PULSE accommodates as many as 10 different e-mail formats, among which may be cited: Ø text-based e-mail (can be secured S/MIME): universal format, limited formatting capability; Ø HTML* (can be secured S/MIME): universal format allowing better formal presentation; Ø PDF* (can be secured S/MIME): guaranteeing reception of documents that look exactly as they
were created; Ø e-mail with Web page links (can be secured): the document is not delivered through Internet and
the user is provided with acknowledgement of receipt; • Messages for SMS mobile phone: able to access more than 300 million mobile phones in Europe. • Fax • Fax Service Provider (service for decentralized fax transmission), including a partnership with France
Télécom • Web-content publishing. • XML: standard worldwide format for data presentation in a B-to-B environment. • A hybrid mail format based on the Mailev@ of the French postal service. Hybrid mail allows delivery
through PULSE of an electronic message to the French Postal Service via Internet. The Postal Service then converts this message to a traditional mail format, or even registered mail.
• Traditional printing
Ø Connectivity to company applications PULSE offers three means to connect to company applications:
• Dedicated connectors (examples: SAP, Mainframe*, UNIX*, Web, etc.). • A specific Application Programming Interface (API): included in the product, this functionality facilitates
integration of PULSE with other applications to offer a global electronic document management solution.
• GDR (see above): PULSE benefits from the latest version of GDR (General Document Recognition) guaranteeing connectivity with all applications capable of generating print flows.

22
• Fax servers
• Needs covered by this type of product
Ø The fax server:
At the end of the 1980s, fax had become a key means of communicating, as much with the outside world as within a company between subsidiaries and distant offices. Since then, the volume of pages transmitted by fax by companies has not ceased to increase. With the development of the PC, word processing tools and local networks, users wanted to be able to avoid printing documents before being able to fax them and to send faxes directly from their workstations. The concept of the fax server was born. Software products today (such as ESKER's Faxgate) enable users to send faxes without interrupting their work, by standing in line at the fax machine or other actions related to manual faxing. A fax server enables the transmission of faxes directly from the “Print” command in word-processing applications, thus offering significant productivity gains for companies. Fax server applications can be divided into two major categories, each with clearly distinct functions, user advantages, technologies, etc…
♦ The production fax server:
Fax documents are particularly effective for transmitting information from information systems outside the company (orders, delivery slips, proposals, estimates, contracts, reminders, etc.). The fax offers many clear advantages over other means of communications. Among the most important are:
â Instantaneous transmission; â Universal application of the media (able to be used in virtually all situations
internationally); â Confirmation of document delivery (transmission receipt); â Faithful presentation of the documents transmitted (page formatting is in no way
modified by fax transmission); â Integrity of the document contents through a semi-open proprietary network (the
telecommunications network) and not through Internet; â Integrity of the document content because a fax is not easily modified; â Less expensive than mail.
All these advantages continue to apply today and represent important factors for selecting fax to transmit important company documents and information. Many companies request fax server solutions providing a direct connection to the company's main information system (ERP, IBM major systems, CRM applications…) to improve the response time of the company vis-à-vis customers and reduce total expenses.
u The fax server integrated in messaging applications:
With the growing use of internal messaging systems (Lotus Notes, Microsoft Exchange, Novell Groupwise), there is an increasing demand to move away from multiple messaging sources (faxes, email) to a single messaging tool. Users want to be able to send faxes as email, directly from their messaging application. In the same way, users want to be able to receive and read faxes through their messaging applications. This function provides enhanced user-friendly features and improved personnel productivity.
• Intelligent electronic document delivery systems: From the point of view of their functionalities, production fax servers were historically the first B-to-B* e-business tools largely deployed by companies. In effect, they represent the first software tools able to extract data from company information systems, format the data and deliver it to external partners in a dematerialized form. In the early 2000s, with the massive expansion of electronic commerce, demand by companies in respect to the automatic production and delivery of documents within the context of these new types of commerce (invoices, order forms, delivery slips, account statements, etc) had developed significantly. Production fax servers respond well to this need, though their application is limited by the use of a single media, poorly adapted to a world
23
characterized by the heterogeneous preferences of information recipients. In addition, the fax is penalized by a negative image which conflicts with the notion of modernity and innovation of these new types of commerce. For this reason, ESKER has significantly expanded the technical capabilities of its fax server products to respond to the needs of a new market: intelligent multi-channel distribution of electronic documents (IID), described above.
• The ESKER fax server product line
The ESKER fax server product line includes two major product families: Faxgate and VSI-Fax.
Ø The Faxgate line
♦ The platforms
Faxgate operates on a Microsoft NT/2000 or XP server and includes the following products:
• “Faxgate Production” for companies wishing to connect a fax server to the corporate
information system. • “Faxgate for Enterprise” for large companies using several messaging systems. • “Faxgate for Workgroup” for small organizations or small and medium-sized
subsidiaries of major groups, complementing large servers. In terms of user interfaces, all the versions described above are available in versions compatible with Exchange (a Microsoft email application) or Lotus Notes (an IBM business communications application). For companies which do not benefit from these infrastructures, Faxgate also offers compatibility with most other messaging applications (Novell GroupWise, SMTP/POP3, etc.), and a dedicated user interface. The Faxgate product is primarily marketed to large companies.
♦ Information system integration
In a production environment, Faxgate provides several specific connection solutions (SAP, LPD, LPR, APPC, RJE, etc.) for most existing company information systems providing optimal performances. When a specific connector for an environment or application does not exist, Faxgate uses GDR technology (General Document Recognition) specifically developed by ESKER. GDR acts as a universal connector for Faxgate as it is capable of receiving, analyzing and formatting printer flows from any application and dispatch the resulting document in the form of a fax. GDR is based on the application of a number of analysis rules specific to a predefined document type. According to the contents of the document, GDR determines the name and fax number of the document recipient or automatically consults the LDAP* directory or external ODBC database LDAP* to extract this data. GDR contributes significantly to simplifying the automation of the flow of faxes from host systems. Until now, fax automation solutions required a specific parameterization of the source application through proprietary codes. These codes provided the fax server with the information needed to transmit the document (for example, the fax number). This required the company to modify its host system. Henceforth, the ESKER GDR technology enables the recognition, conversion and faxing of documents originating from other traditional applications or software packages solely on the basis of other content. In simplified terms, GDR enables the fax server to adapt to the company's information system and not the reverse. ESKER considers that with GDR it offers a unique technology in the fax server market. A request for patent for GDR was filed with the American patent authorities. This request was accepted. Until the decision of this organization, GDR is protected by the reference “Patent Pending”. The ESKER GDR technology has enabled Faxgate to win several professional awards in 2000, the most significant of which include:
â The Davidson Consulting “Analyst's Choice Award” for the most innovative electronic multimedia document solution of the year. This award was granted in connection with the annual conference concerning the unification of messaging systems, MailVerge FaxDirections 2000, held in San Diego, California, in August.

24
â The award for the Best Fax Software Package of 2000. This award, granted for the most practical and user-friendly fax communications solution of the market, was announced in the January 2001 issue of the U.S. magazine Teleconnect, the industry reference for communications software applications.
♦ Advanced functions:
Faxgate is specially designed to handle large volumes of faxes and has several mechanisms for optimization or load balancing. Faxgate supports intelligent multi-channel fax boards (Brooktrout and Dialogic) enabling it to manage up to 60 lines per server. ESKER believes that Faxgate is one of the best products of its category for handling large volumes of faxes. The development of the Internet has offered a means of transmitting faxes, at virtually no cost, directly to the final recipient for the price of a local phone call. To take advantage of this opportunity, last year the Faxgate product added the Least Cost Routing function (LCR: Least Cost Routing) which enables the transmission of a fax to another Faxgate server which will handle the transmission of the fax to the final recipient. Finally, the Faxgate functions handle the administration of the fax server via the most recent Microsoft interface (MMC or Microsoft Management Console), to permit comprehensive reporting on incoming and outgoing faxes to determine the actual use of the server and further optimize fax communication costs.
Ø The VSI-Fax line
This line of fax servers was developed and marketed by California-based VSI. Following ESKER's acquisition of VSI in October 2000, VSI's products were added to the range of ESKER fax products. The VSI-Fax line includes two major product groups:
♦ VSI-Fax for Unix: this product is a production fax server operating under Unix* and Linux* and offering approximately the same features as the Faxgate product for these environments. VSI-Fax is typically a production fax server, frequently integrated in vertical applications (i.e. dedicated to a specific division or economic sector). The majority of VSI-Fax for Unix product customers are companies creating application software for small- and medium-sized firms.
♦ VSI-Fax for Notes: this product benefits from the fax technology of the traditional VSI product,
but it includes a specific interface for Lotus Notes platforms. At present, and following the withdrawal in December 2000 of Lotus' fax server application, VSI-fax for Notes is the only fax solution in the world which offers a user and administrator interface fully integrated in Lotus Notes. Moreover, VSI-Fax for Notes is one of the two products recommended by Lotus to take the place of its server and service Lotus' installed base.

25
• Host Access* Products
• Needs covered by this type of product
Ø Terminal emulation:
ESKER considers that a significant share of business management applications (accounting, inventory management, sales management, sales follow-up, etc.) are centralized in servers: they operate on multi-user computers (IBM, HP, DEC or UNIX) with dumb terminals* (keyboard + screen) providing dialog with the user. With the development of PCs in companies, dumb terminals were progressively replaced by workstations*, personal computers (PCs) operating in a Windows environment. In response to this new type of PC-Host architecture, companies seek to develop applications able to communicate with these new types of workstations. However, the previous alphanumeric applications*, frequently numerous in the company, must be able to be accessed from these workstations. Host Access products respond to this need, enabling the user to activate alphanumeric applications from a Windows-based workstation. In this respect, these products may be described as “terminal emulators”: they enable a user to open a window on the Windows screen (with PC-to-Host) or Web browser (with Web-to-Host) in which an alphanumeric host application will run. Dumb terminals are generally designed by server manufacturers: IBM, DEC, HP, WYSE, BULL… With more than 20 terminal emulations available, ESKER considers that it has the most complete line in this market segment today, which enables it to meet the needs of virtually any configuration. Accustomed to the graphic interfaces of workstations (Windows in particular), users wish to update the look of their older applications. This operation is called “revamping”: Host Access products also provide a graphic interface for alphanumeric applications. With this technology, the older management applications are able to be integrated in new working environments. This enables companies to use these applications for a longer period and in this way protect their investment.
Ø Resource Sharing:
In addition to providing workstation access to host-based applications, Host Access products also permit:
• File Exchange with host systems (FTP client and host protocol); • Sharing of disks or portions of disks with host systems (NFS client and host protocol) • Use of the host system printers (LPR protocol) • Host system access to workstation printers (LPD protocol) • Inclusion of workstation hard disks in scheduled host server backups (TAR) • Remote execution of commands on the host system (RSH/REXEC)
Ø Database Access: Most applications today use a relational database. For various reasons (existence of legacy systems, multiple IT solutions, heterogeneity of equipment…), businesses are frequently faced with the existence of a multitude of Relational Data Base Management Systems (RDBMSs)*: Oracle, Informix, Sybase, Progress, DB/2, etc. To respond to growing user demand for improved client-host integration, ESKER's Host Access solutions provide a software access to databases (middleware*) enabling the individual workstation to access host application data through the Microsoft ODBC (Open Data Base Connectivity) programming interface. This functionality allows access to a wide range of RDBMS (Oracle, Informix, Sybase, Progress, DB/2 etc) from a client-based program identical to that used by the RDBMS (ODBC driver* under Windows) regardless of the RDBMS used. Host components are available for a large range of UNIX* equipment. The exchanges are carried out through the network protocol* TCP/IP*. In addition, to facilitate consultation of various host databases which are frequently characterized by complicated structures, ESKER's Host Access solutions integrate a “datamart”* tool which provides every user, activity or department, with a simple overview of the database. This overview is presented in a few tables, of clearly defined fields for the user. The “datamart” tool provides each overview of the database in the form of ODBC data, which can be used by standard office software applications. ESKER believes that this solution in

26
conjunction with office automation tools responds to most user needs. As a result, businesses are not required to equip workstations with business intelligence* applications.
• Host Access technologies
Ø PC-to-Host technologies
Initially, the functions described above were developed under a “PC-to-Host” technology, meaning that software access to host systems (terminal emulation, resource sharing, database access) was written in PC specific languages such as C or C++ and had to be installed on the hard disk of the PC. This traditional technology nevertheless has certain disadvantages:
• Only PC type workstations can be equipped; • It is necessary to install the software on all the company's PCs, which can be
a long and cumbersome process especially if all the workstations are not located in the same location.
Ø Web-to-Host technologies
To resolve these two problems, ESKER decided to develop a web version of its software. This software is no longer developed exclusively with the language of PC for Windows, but also with the assistance of Java, able to be executed on any type of workstation (PC, Macintosh, Linux, Network Computer, etc.). In addition, it is no longer necessary to manually install the software on every workstation. It suffices to copy the application just once on the Web server for all users to be able to benefit from immediate access from their Web browser (Netscape Navigator or Internet Explorer). In this context, the product line integrates a resource manager based on the LDAP* standard, enabling each user or group of users, to define the resources or applications for which access is authorized. With this module, it is possible to provide each user with an environment limited to the resources required. ESKER considers that many companies will want to converge their workstations to a single Web interface (intranet). This technology represents a perfect response to this demand.
Ø The “Thin client” technology of Citrix and Microsoft In parallel with the advance in business Web (intranet) development, another technology referred to as “thin client” computing was developed by the U.S. based company, Citrix. This technology consists in adapting Windows NT servers (starting with the 3.51 version) so they can be exploited by several users simultaneously. These users may be equipped with PC, specific terminals (less-expensive) terminals or even a Web browser to access all the functions of the NT server. This technology was integrated by Microsoft in its company servers (NT/2000). The key advantage of this technology is the elimination of the requirement to install software on each workstation. ESKER has adapted its host access product line to this “thin client” technology.
• The Host Access product line Since the acquisition of Persoft (1999), ESKER proposes three product lines offering access to host systems:
Ø Tun PLUS (PC-to-Host & Web-to-Host) and Tun PLUS for Citrix (thin client),
which are the original company products, enjoying a true leadership in the SCO Unix (Caldera), Linux and IBM AIX environments.
Ø SmarTerm (PC-to-Host), SmarTerm for Terminal Services (Citrix) and Persona (Web-to-Host), which were developed by Persoft and enjoy true leadership in American administrations and the health service and industrial sectors.
Ø A-Net, which is the original product of Teubner & Associates
27
Ø The Tun PLUS line The Tun PLUS product can be purchased as a single package covering all available Host Access technologies or in the form of separate functional components:
n Tun EMUL for host access n Tun NET for resource sharing with host systems n Tun SQL for access to host data
The Tun PLUS product line is marketed primarily for Caldera (SCO Unix and Linux), IBM (Unix AIX), IBM (390 and AS/400), and HP (Unix HP-UX) host platforms. Traditional customers of this product line include large accounts equipped with IBM systems and value added retailers which provide solutions for Unix* or Linux environments. The attractiveness of this product line is its flexibility and ability to integrate global solutions developed by integrators, value added retailers, other software companies, etc.
Ø The SmarTerm line The product can be acquired as a complete package (SmarTerm Enterprise Suite) or as individual functional components:
n SmarTerm Office for access to applications located on several types of hosts;
n SmarTerm Essential for access to applications located on a single type of host;
n SmarTerm 3270/5250 for access to large IBM hosts; The line of SmarTerm products is sold primarily in the segment of Digital (VAX/Open VMS), Data General, and IBM servers. Users of this product line include companies and administrations of all size equipped with these servers. The advantage of this product line is its ability to provide solutions adapted to large accounts and integration VT environments.
Ø The A-Net line A-Net is an IBM mainframe-based product, which enables mainframe terminals (IBM 3270) to access applications based on “non-IBM” systems such as UNIX*, Compaq/Digital or HP. A-Net emulates a session of an asynchronous terminal on a 3270 terminal. The product optimizes information technology investments for companies with SNA networks, while at the same time permitting the deployment of new technologies in this environment. A-Net provides the company with a significant volume of business and a strong margin. Approximately, 75% of A-Net sales in 2000 represent the renewal of annual user licenses, with the balance provided by new sales and updates.

28
3.1.4. Analysis of sales • Sales mix by product
• Analysis of sales among the various products:
Number of licenses Number of updates Generated sales ('000 Euros)
2001 2000 2001 2000 2001 2000
Tun 65,724 77,699 57,481 30,546 9,384 9,916Smarterm 40,251 52,659 70,558 29,186 7,917 8,915Persona 6,794 4,986 6,070 2,371 630 532Corridor 356 470 -11 389 79 179A-Net 1,675 167 1,996 3,833 834 715Faxgate 1,961 3,518 3,244 4,889 3,346 5,333Pulse * 280 1,043V.S.I. 28,859 4,528 11,579 346 6,582 1,236Services 420 447Others 2,079 105
TOTAL 145,900 144,027 150,917 71,560 32,314 27,378
Pulse*: for Pulse, the number of licenses sold corresponds to the number of servers
Analysis of sales by product (2001)
Others6%
Corridor0%
A-Net3%
Persona2%
Smarterm25%
Faxgate10%
Services1%
V.S.I.20%
Pulse *3%
Tun30%
• Analysis of sales by region (2001)
Country/ Percentage of sales Region 2001 2000 France 11.44% 11.62% Germany 5.77% 9.45% UK 11.38% 14.90% Italy 2.45% 2.96% Spain 2.37% 3.36% Other Europe 3.66% 3.44% Americas 58.96% 51.04% Asia/Pacific 3.98% 3.23% 100.00% 100.00%

29
Analysis of sales by region (2001)
Americas60%
France11%
Germany6%
Benelux4%
UK11%
Spain2%Asia/Pacific
4%
Italy2%
Sales outside France account for 88% of ESKER's business according to a mix which reflects the worldwide trend in breakdown of IT markets. For example, according to various market studies, the U.S. alone accounts for more than 50 percent of the world market for business applications. The U.S. is also the market of reference in which the major players operate and the principal alliances are made and unmade. In 2001, this market accounted for approx. 60% of ESKER sales through a commercial base which is equally balanced between the U.S. and Europe. 3.1.5. The markets Because of the diversity of the technologies covered by ESKER, the company considers it is useful to provide information on the following markets:
• Electronic document servers • Fax servers • Host access
• The electronic document server market
The market for electronic document servers represents an emerging market for which few technology research firms have carried out studies. Electronic document delivery is still largely based on non-integrated processes which accommodate only a single channel (for example, fax or traditional printing). However, certain information obtained from various market research studies is beginning to reveal a rough outline of this market and make it possible for the first time to determine its size. The market analyst Gartner Group uses the acronym DOM (Document Ouput Management) to designate the electronic document server market. According to Gartner, this market accounted for approximately 560 millions dollars in 2000, with an average annual growth rate in the region of 35% for the next few years (i.e. 2.5 billion dollars in 2005). In addition, the Gartner Group believes that DOM servers will be as widely used as network printers by the year 2004 (0.7 probability). In 2001, ESKER made its debut in Gartner's Magic Quadrant for the DOM market under the heading of "Visionaries". According to Killen & Associates, the market for the conversion and presentation of electronic documents should reach USD 3.3 billion in 2005.

30
• The fax server market According to a recent IDC study, this market is expected to expand significantly in 2001 and stabilize over the following years.
Evolution of the worldwide fax server market (Source: IDC 2001) (in millions US Dollars)
These figures, nevertheless, do not reflect the diverse performance for the different fax server segments. In effect, according to IDC, production fax servers (see above) in 1998 represented only 15% of worldwide sales compared to an estimated 45% for 2003. The stable outlook forecasted for the fax server market accordingly conceals contrasting trends: the strong decline in fax servers destined exclusively for messaging and a significant increase for production servers, exceeding 30% until 2004. This change in the market focus in favor of production fax servers points to the use of fax servers as e-business tools to distribute documents and information generated from critical company information systems to external recipients. In this context, fax servers which operate under UNIX* seemed to be well-positioned to respond to these types of needs. IDC furthermore emphasizes the growth opportunities for software companies offer by fax applications in the form of incoming fax processing, an application until now neglected in favor of outgoing fax applications. Finally, IDC noted, though without providing figures, the opportunities represented by multi-channel information delivery, primarily for production fax software companies, which may apply their expertise in the area of the integration of document delivery to information systems. In summary, the IDC study highlights the considerable growth potential of this sector for players positioned to take advantage of market trends.
• The Host Access market The company has drawn upon the study by the research firm IDC published in September 2000. The total market of Host Access applications in 2001 including PC-to-Host and Web-to-Host, applications is estimated by this study at USD 1.4 billion (based on the end-user sale price and not on sales by software companies to distributors). It should nevertheless be noted that approximately 50% of this market is dominated by hardware manufacturers (IBM) which market their own emulation solutions for their installed hardware base, and benefit from virtually captive markets. ESKER accordingly considers that the real size of the world Host Access market is 50% of the figure proposed by IDC.
IDC growth forecasts for the Host Access market
Fax Server Sales (US$ ‘000)
350
400
450
500
1999 2000 2001 2002 2003 2004
Year
Sal
es
(US
$ ‘0
00)
Host Access Sales (US$ ’000)
0 500
1,000 1,500 2,000
1999 2000 2001 2002 2003 2004
Year
Sal
es
(US
$ ‘0
00)

31
IDC forecasts an average annual growth rate of 4% for these markets over the 1999-2004 period. Key factors on which the IDC forecasts are based include:
• an average annual decline in the PC-to-Host product market of 32% • an average annual growth for Web-to-Host solutions of 44%
ESKER furthermore considers that:
• a significant portion of the growth forecasted by IDC will be in favor of hardware manufacturers like IBM, notably in the Web-to-Host area;
• the adoption of Web-to-Host technologies, even if the underlying factors behind this trend remain, will be slowed by the absence of sufficient motivation by companies to carry out the migration;
• conversely and in consequence, the decline in traditional technologies will be less significant than initially foreseen, especially since Windows multi-user thin computing solutions (Citrix, NT Terminal Server, Windows 2000) represent an important growth opportunity for these products.
Overall, ESKER forecasts an average annual decline in the Host Access markets of 10% to 20% per year. This is a conservative estimate concerning the outlook for these markets. These forecasts would be significantly improved if Web-to-Host technologies are adopted more quickly than expected. 3.1.6 Competition
• Competition in the market of multi-channel electronic document servers At present, the company is not aware of any players in this market which offer connectivity solutions as extensive and diversified as those offered by PULSE. In its Magic Quadrant, the Gartner Group identifies the following companies as DOM (Document Output Managemet) market leaders.
Companies Sales 2001 (1) Products or product families HP/Dazel N/S Document Router, Document Ouput Server Streamserve EUR 30 million
(estimated) Business Communication Platform
Macro4 47.1 million £ (31.06.01)
Columbus
(1) These sales figures are those of the company and not the competing product line. ESKER considers itself to be the only player in this category to offer such a wide range of delivery media.
• Competition in the fax server market The fax server market is extremely fragmented. With the exception of the world leader Captaris (AVT), with a market share of 24.3%, no other player holds more than 8% of this market. ESKER considers the following to be significant competitors:
Companies Sales 2001 (1) Products or product families Captaris 91.9 million $ RightFax, Commerce Path TopCall EUR 30.4 million Vienna, Communication One Omtool EUR 15.4 million Fax Sr. Equisys Non listed
company Zetafax
(1) These sales figures are those of the company and not the competing product line.
According to the ranking established in February 2001 by IDC, ESKER is number three in the fax market worldwide behind AVT and TopCall.

32
ESKER believes that one of the key distinctions of Faxgate is its production fax capability which enables it to connect to all IT environments including mainframes* compatible with IBM S/390, AS/400, Unix* systems, Windows, and all servers equipped with TCP/IP*. The company believes that another decisive advantage is its ability to handle significant fax transmission and reception volumes. The acquisition of VSI, in October 2001, provided ESKER with extensive expertise and a significant installed base in the segment of production fax servers operating under UNIX* and Linux*. Having focused efforts in developing a coherent and effective range of production fax servers able to process data flows regardless of their volume and origin, ESKER believes that it is among the companies best positioned in the fax server market today to take advantage of the trends forecasted by market analysts.
• Competition in the Host Access market
The significant competitors identified by ESKER in this market include: Companies Products or product families IBM Websphere Attachmate (estimated sales: 200 million USD) Irma 3270, 5250, Extra!, e-Vantage NetManage (sales: 80 million USD) View/Now, Rumba, Salvo WRQ (estimated sales: 100 million USD) Reflexion Century Software (estimated sales: 5–10 million USD) Term, Tiny Term J. River (estimated sales: 5–10 million USD) Ice TEN, Ice TCP The sales figures are those of the company and not the product line. With the exception of NetManage (listed on the NASDAQ), the companies mentioned above are not listed and consequently do not publish their figures. In consequence, the figures mentioned above represent estimates. According to figures published in September 2000 by IDC, ESKER is number five worldwide in the Host Access market. However, if one excludes IBM, which benefits from a particular status due to its installed hardware base, ESKER ranks number four for pure software companies in the sector behind the three U.S. software companies, Attachmate, NetManage and WRQ. ESKER considers that it has leadership positions in certain platforms, notably SCO UNIX with Tun PLUS. The company also believes that the integration in a single product, Tun PLUS, of more than 20 different emulations compatible with PC-to-Host, Web-to-Host and Windows multi-user configurations represents a decisive factor for its success in this market. Tun PLUS today represents one of the most open Host Access solutions available on the market, whether in terms of technology, emulation or environments supported. Furthermore, ESKER considers that its product SmarTerm occupies a dominant position in the Digital and Data General server segment, and the sectors of health and public administrations in the U.S. Concerning the function of revamping applications, ESKER believes it benefits from an original technology able to offer a Windows-type graphic user interface (GUI) for traditional alphanumeric applications without additional programming. The company believes this is a major advantage for companies as it enables them to extend the lifespan of their installed software base without significant additional development investments. In conclusion, ESKER believes it has a comprehensive line of Host Access products which can effectively cover virtually all user needs in this area, from traditional PC-to-Host needs to intranet-type architectures and even the extension of information systems of the company in the form of extranet or Internet sites. Given its extensive functionalities, the wide range of environments supported and its worldwide position, ESKER believes that it is well-positioned to significantly benefit from the development of the Host Access market. 3.1.7. The sale strategy and organization The potential market size of final customers is particularly large, ranging from small companies of 50 employees to major private or public organizations. To cover this market, ESKER has favored the development of distribution while nevertheless maintaining a significant direct sales force. The distribution strategy is pursued through different types of players:
• Distributors of software products: These distributors purchase, store and sell software products. Their clientele consists of resellers and, occasionally, final customers. They are

33
distinguished from each other by the level of technical and sale support they provide, their sales conditions, storage and logistics capacities.
• Vertical market software developers and OEM. These entities integrate the technologies of
third parties in their applications before resale.
• Systems integrators. These companies work primarily on the basis of information technology projects invoiced according to a flat fee. The projects frequently integrate a variety of software products.
• Value added resellers. Their vocation is to provide global solutions (frequently equipment + software) for companies through the integration of different components. Their added-value is primarily at the level of the service they provide to the products.
ESKER approaches this market primarily through distributors and value-added resellers. The programs of “authorized retailers” further contribute to the performance of ESKER indirect sales. ESKER Distributors Systems integrators VAR* OEM/Vertical market* Major accounts END USERS Small and Medium Businesses ESKER distribution for the 2001 financial period. ESKER has pursued a systematic strategy of creating subsidiaries in industrialized nations. With the exception of the USA, these subsidiaries are generally organized as follows:
• Subsidiary manager or Country Manager: responsible for overall subsidiary management and directs all sales-related activities.
• Operational marketing: in cooperation with management, defines and coordinates marketing actions to be carried out in his region to develop business opportunities.
• Indirect sales administration: responsible for the coordination of the distribution network (retailers, software companies and distributors).
• Sales engineer: representing the ESKER contact with the final client and coordinating activity with distribution.
• Technical consultant: assists the sales engineer with the marketing operation and oversees after-sales services (audit, installation, configuration).
• After-sales technical support provides technical expertise before sale, as well as a regular phone assistance for ESKER distributors, retailers and final customers.
• Administration.

34
This organization permits the optimization of the company's distribution network through commercial presence in the field, both vis-à-vis distributors and retailers and final clients, reinforced by local service assured in the languages of the different markets. The American customer base of Teubner & Associates consists primarily of major accounts which the company approaches directly and not through a network of distributors. ESKER considers that this expertise in sales to major accounts is critical to further develop this segment and support its distribution network. The clientele of Persoft consists of major companies which the Company approaches directly even if it sometimes shifts the sales figures in the distribution networks. ESKER considers that this expertise in semi-direct sales for large companies is critical for the marketing of products such as Faxgate and Pulse. The clientele of VSI is, in many respects, very similar to ESKER's historical customer base for its TUN product. It is comprised primarily of value-added resellers (VARs*) and integrators of vertical solutions which have incorporated the ESKER product in their own software product. 3.1.8 The customers ESKER's main customers include distributors and large accounts to which it sells on a direct basis.
• Key distributors (in alphabetical order):
DISTRIBUTORS SUBSIDIARIES
AVNET Germany
CDW COMPUTERS USA
COMPAQ DEC USA
FRAME France
INGRAM MICRO USA
LOGIX France
OPEN COMPUTING UK
SOFTWARE CLEARING HOUSE UK
SPECTRUM SYSTEM USA
TECH DATA USA
The profiles of the distributors are varied. Their total sales for 2001 varies from USD 15 million to more than USD 300 million. The contribution of major distributors to total ESKER sales is as follows:
• the largest distributor accounts for 4.87% of the group's total sales, • the top five distributors account for 18.94% of the group's total sales, • and the top ten distributors account for 29.50% of the group's total sales.
Concerning the principal European markets (UK, Germany, France), ESKER software products are distributed by companies representing the leading value-added resellers for UNIX* software products. The most important distributor accounts for approximately 5% of Group sales. No single final customer (through the distribution network) in 2001 accounted for more than 2% of ESKER's total sales. The products of the company have been installed for a large number of major public and private accounts in France, Europe, and the Americas. The key direct customers in 2001 include (alphabetical order):

35
DIRECT CUSTOMERS SUBSIDIARIES
ARSYS FRANCE
BARLOW LYDE UK
BUNNINGS BUILDING AUSTRALIA
CCMX FRANCE
CEGI FRANCE
CITROEN UK
CIVICA SERVICES UK
COMAREG FRANCE
CONNECTICUT GENERAL LIFE USA
CYBERPLUS AUSTRALIA
FUJITSU SIEMENS GERMANY
GE CAPITAL FINANCE AUSTRALIA
GE POWER SYSTEMS USA
INTERNET SOFTWARE UK
KALAMAZOO UK
MEDICAL MANAGER PCN USA
NISSAN MOTOR AUSTRALIA
PARTNERS HEALTH USA
PROPHET 21 USA
RENAL CARE GROUP USA
SCHNEIDER TECHNOLOGY USA
TELECON SPAIN
TETRA PAK SWEDEN
TIP SERVICES NETHERLANDS
WESTVACO USA
WILLAMETTE INDUSTRIES USA
To guarantee rapid delivery to customers, ESKER ensures that distributors benefit from a permanent stock of one week's inventory to respond to the most common orders. In this type of sales environment, the notion of 'order book' is of particularly limited significance. This characteristic is offset by level of repeat business. 3.1.9. Production The production of software products is divided into three activities: R&D
Market
Duplication /Delivery
Edition

36
• Research and development
Decisions concerning R&D are made on the basis of needs expressed by users and in coordination with the technology watch. The company considers that it has initiated several innovations in this way, among which may be cited the following:
Ø In 1988, ESKER decided to develop a UNIX* terminal under DOS. This decision was motivated by the need expressed by ESKER customers, which indicated that they were unable to find satisfactory products on the market.
Ø In 1990, IBM launched the RS/6000 with a specific type of screen: the 3151. Foreseeing the
commercial success of this hardware, ESKER immediately developed the emulation corresponding to this terminal, thus gaining an advance on the competition.
Ø In 1991, ESKER anticipated the development of the TCP/IP* communications protocol and
adapted its software to this new means of communication.
Ø In 1996, ESKER diversified into the Web-to-Host market by adapting its PC-to-Host technology to intranet.
Ø In 1998, ESKER decided to invest in the growth market of fax servers through the acquisition
of Teubner & Associates. Ø In 2000, ESKER accelerated the development of the functionalities of its future multi-channel
information delivery product, PULSE, which includes GDR, a universal connector for business applications.
Ø In 2001, ESKER integrated new means of transport such as SMS or hybrid mail into its
PULSE product. Within the framework of ESKER's expansion in the U.S., the participation of the company's marketing product team (based in the U.S.) was increasingly solicited in the determination of technical choices. On December 31, 2001, in the Lyon offices, a team of 25 computer engineers developed the software products of tomorrow. ESKER's own computing platforms included the main servers on the market: Sun Sparc, IBM AS/400, RS/6000, Mainframe* MVS, DEC OSF/1, SCO UNIX, HP-9000, etc. This team is further strengthened by 15 computer engineers based in Madison, Wisconsin and Lake Forest, California. In 2001, R&D expenses represented EUR 6.8 million, corresponding to 21% of consolidated sales, an increase in absolute value terms in relation to 1999 and 2000. This increase is primarily due to R&D expenses incurred by companies acquired in the 1999 and 2000 financial periods.
• Quality Assurance Two teams based in Lyon and Madison, totaling a staff of 25, are responsible for this phase which consists in the following operations:
Ø Quality control, Ø The development of installation procedures, Ø The development of user manuals and online technical support, Ø Localization (adaptation and translation).
ESKER has the ability to internationalize its products. Starting in 1989, the first product of the company was able to store messages in different languages. A significant portion of ESKER's products is today available simultaneously in five different languages: English, French, German, Spanish and Italian.

37
• Production and delivery
ESKER manages two production centers, one in Lyon for European sales, the other in Madison, Wisconsin for sales in the Americas. These centers are responsible for filling orders of the different customers and assuring the assembly of different components including:
Ø User manuals, Ø CD-ROM, Ø The product box, Ø The license number, Ø The user license agreement, Ø ….
The company generally fills orders within 24 hours.

38
3.1.10 Suppliers The cost of components for production (CD-ROM, user manuals, etc.) has always represented less than 10% of company's sales. This percentage has tended to decline in the past due to the replacement of diskettes by CD-ROM and greater economies of scale. However, fax server activity has tended to increase this ratio as customers demand that the software company provide an intelligent fax board, or even a complete system. 3.1.11 Human resources
• The management team The ESKER management team has been progressively developed around one of the founders, Jean-Michel Bérard. To date, it includes:
Ø Jean-Michel Bérard (40) is President of the Board of Directors and European Chief Executive Officer. He is also ESKER spokesperson to potential partners, the European technological community, IT analysts, and trade press. He received a degree in Computer Engineering in 1984 from the renowned French National Institute of Applied Science (INSA) in Lyon. In 2000, Jean-Michel Bérard was awarded the Grand Prix de l’Entrepreneur (Entrepreneur of the Year award) for France and the Rhône Alpes region.
Ø Dan Speer (44) is the US Chief Executive Officer and permanent member of the Board of
Directors. He joined Teubner & Associates (now ESKER) in 1997. Dan is a graduate of Washburn University with a Bachelor of Business Administration and has undertaken postgraduate studies at The Netherlands School of International Business in Amsterdam.
Ø Jean-Jacques Bérard (36) is the Director of Research Development and guest Board Member.
He joined ESKER in 1995, first as project leader for the SQL team and then advancing to R&D manager in 1997. Jean-Jacques gained a degree in Engineering in 1988 from INSA Lyon.
Ø Emmanuel Olivier (34) joined ESKER in 1999 as Chief Financial Officer and oversees all of
ESKER's financial communications. Emmanuel is a guest member to the Board of Directors. In 1991, he gained an MBA from the Nice – Sophia Antipolis Ecole Supérieure de Commerce. He then worked as audit manager for Ernst & Young for seven years, including two years in Philadelphia (USA). He also holds a CPA degree both in France and the US.
Ø Lynn Weatherby (49) is Vice President of Marketing and guest member to the Board of
Directors. Lynn graduated in 1986 with a doctorate from the University of Wisconsin. She joined Persoft, Inc. (now ESKER) in 1997.
Ø Mitch Baxter, 40, Director of Strategic Partnerships. Guest board member. Prior to joining VSI
in 1997, he followed a career in sales and marketing in the Telecommunications domain.
• ESKER personnel Average number personnel in 2000 (1999) R&D Sales Marketing Administ. Duplication Total France 38 (40) 16 (17.75) 7 (8) 19 (20) 2 (2) 82 (88) Germany 0 (0) 7 (7) 2 (1) 1 (1) 0 (0) 10 (9) UK 0 (0) 15 (19) 3 (2.5) 2 (2.5) 0 (0) 20 (24) Italy 0 (0) 4 (3) 1 (0) 0 (0) 0 (0) 5 (3) Spain 0 (0) 3 (3) 1 (0) 1 (1) 0 (0) 5 (4) Australia/Asia 0 (0) 6 (5) 1 (1) 1 (1) 0 (0) 8 (7) USA 39 (44) 63 (66) 25 (28) 25 (33) 5 (6) 157 (177) Total 77 (84) 114 (120.75) 40 (40.5) 49 (58.5) 7 (8) 287 (312) R&D staff includes production and international technical support. Sales staff includes local technical support.
39
• Compensation policy
ESKER sales staff benefits from a variable compensation based on results in accordance with the current practice in the different countries. The variable portion can represent up to 50% of their total compensation. R&D engineers also benefit from a variable compensation (20%) based on the quality of the development and compliance with deadlines. An employee profit-sharing plan has been implemented for French employees. A 401(k) funded pension scheme was created in the U.S. to enhance the performance bonuses. Similar measures have been implemented in the major subsidiaries. Various stock option and warrant plans (cf. 2.2.2 and 2.2.4) have been implemented to motivate company management and employees. They are allotted on the basis of the seniority of employees and their advancement in the company. 3.2. Risk Factors
3.2.1 Technology risks
• Launching of the software products or models ESKER plans to launch new modules and software products on the market . It is not possible to guarantee that the new technologies deployed in these applications will be successful. They may even contain errors not detected at the time of their launching despite the implementation of internal controls. Similarly, a development which is technically successful does not guarantee that the applications will be accepted by the market. This may adversely impact the achievement of sales forecasts.
• Access to technical information from IT market players In the development of its computer programs, the Company may require technical information (source licenses, protocol specifications, etc.) which are not in the public domain but rather the property of an equipment or computer software designer. In this case, it is necessary to obtain access to this information, which frequently requires the authorization of the owner. In the past, ESKER has succeeded in obtaining the information necessary for its development. However, there is no guarantee that the company will be able to obtain this information in the future under acceptable conditions.
• Modification of market conditions The information technology market is subject to constant changes. ESKER is not able to guarantee at a given moment that a major IT player does not significantly alter the situation of the market. In particular, ESKER has based a significant part of its success on the electronic document delivery markets. The commercial success will only be achieved if this market grows according to the forecasts of the Company as indicated in paragraph 3.1.5. The arrival in one of these markets of a major software player could adversely affect the business plans of ESKER.
• Risk of software bugs Most software applications on the market include bugs which may adversely impact their performance, or even result in damage to third parties. Even though ESKER has taken measures to ensure quality control, the company is not exempt from this possibility. In consequence, it is not possible to guarantee that dissatisfied customers do not file suits for damages. However, the licenses of use are in general delivered without guarantee and with the risks at the responsibility of the user. In consequence, the risk of damages related to the use of ESKER products by third parties is not covered by insurance, except in the U.S. and the UK where the subsidiaries are covered by a product liability insurance for USD 2 million and GDP 2 million, respectively.

40
• Integration of OEM components in the company's products
Products of ESKER origin include only components developed by ESKER or in the public domain. The products of Teubner & Associates origin (A-Net, Corridor et Faxgate) as well as PULSE include components acquired from OEMs (Original Equipment Manufacturers). However, the purchase of these components has only a limited effect on its margins and ESKER's strategy is to move away from the dependence on these components to the extent possible. 3.2.2 Financial and commercial risks
• Seasonal fluctuations in sales
Historically, ESKER has always achieved a significant share of its sales in the last quarter of the year, and in particular, December. A variation or delay in sales expected during this period could consequently have a significant and unforeseen impact on the annual commercial performance. In the same way, quarterly sales are in turn heavily weighted towards the last days of the quarter. Any internal or external events could eventually disrupt this period and, consequently, have a significant impact on the performance of the company.
• Cost Structure
As with all software companies, ESKER's cost structure consists primarily of fixed costs (personnel expenses, premises, amortization of investments, etc.). This cost structure, through the effect of a positive leverage, enables ESKER to generate significant profits which has characterized its past performance. In a less favorable context however, this same leverage effect would have an adverse impact on the company's profitability.
• Delayed Growth in Acquired Companies ESKER's future growth is based in part on a strategy of mergers and acquisitions. Even though the Company carries out an in-depth study of every company acquired and its business plan, there is no guarantee that the development of the company will adhere to the initial plan. It is, in consequence, possible that an acquisition adversely affects the company in terms of growth and profitability.
• New market entrants Certain potential competitors have financial and other resources much more important than those of ESKER. As a consequence, these companies are able to devote more resources to the development, promotion and sales of their products and respond more quickly to new or emerging technologies and changing client requirements. It cannot be guaranteed that pressures related to this competition do not adversely affect the company's business, operating results and financial situation.
• Price declines Past trends have demonstrated that software prices tend to decline. This risk is inherent in the business of software companies. However, ESKER has always sought to maintain its prices by adding new functions to its products. ESKER will pursue this strategy in the future, though it is not possible to guarantee that this will always be the case. The primary competition of the company today is in North America. A decline in the U.S. dollar in relation to European currencies could give an additional competitive advantage to these companies. Such an advantage could result in downward pressures on the prices applied by the company in the market. However, in light of the growth objectives of the company's business in the U.S., the exposure to this risk should decline.

41
• Computer software piracy Software is marketed in the form of user licenses. The illicit copying or piracy of software constitutes a copyright infringement and an operating loss for all software companies. Even though the market has implemented stricter standards in recent years in the principal industrialized countries, there is no indication that this situation will not further deteriorate in the future. However, the company individualizes every license by the issuance of a serial No. and activation key. In addition, the company is able to identify any license holder with its registration system via the Web. The Company believes that these measures reduce the risks of piracy of its own products.
• Customer risks As all commercial companies, ESKER is subject to collection risks on customer receivables. ESKER has nevertheless obtained a classic coverage from the SFAC and COFACE for most of its customers. It should be noted that at any moment the COFACE or the SFAC may withdraw their guarantee for a given client, and that the risk is never fully covered. The method of commercialization, in large part through indirect sales, results in a concentration of invoicing with a small number of accounts (cf. 3.1.8). In consequence, a termination of relations between the company and one of its distributors or the failure of one of them could adversely affect ESKER's sales and earnings. The company is unaware of the existence of significant risks concerning its relations with its current distributors or their solvency.
• Foreign exchange risks The share of the consolidated sales of the company invoiced in currencies included in the Euro is 40%. The balance is invoiced in USD, GBP or AUD. Concerning inter-company billings, the parent company has chosen to bear the foreign exchange risk itself. These invoices are always issued in the currency of the subsidiary. In 2000, the company pursued its hedging policy vis-à-vis the British pound and when possible the U.S. dollar. ESKER has developed a strategy of self-hedging vis-à-vis the U.S. dollar to the extent that the greater part of sales invoiced in this currency is done so directly by the U.S. subsidiary. This practice may moreover be applied to all invoicing in currencies issued directly by the subsidiaries. Products fees are invoiced by ESKER S.A. to its U.S. subsidiary in U.S. dollars. The foreign exchange risk related to these amounts is largely covered by the inter-company invoicing issued in dollars by the subsidiary, notably for its contribution to total Group marketing activities. Overall, the foreign exchange risk borne by the group is reduced by its international cost structure. However, this risk still exists and has the potential to deplete or increase the group's profit. 3.2.3 Legal risks
• Risks related to mergers and acquisition ESKER's future growth is based in part on a strategy of mergers and acquisition. Even though the company carries out an in-depth study of the company acquired and the associated legal risks, and even though the company negotiates with the sellers a reasonable liabilities and asset warranty, ESKER cannot fully guarantee that the acquisition of a company is not subject to legal, tax or other risks for the company.
• Protection and enforcement of intellectual property rights The ESKER trademarks are filed in the U.S., Europe and Asia and in the principal industrialized countries. Under current French and U.S. law, the computer programs developed today by ESKER do not qualify for patent protection. The protection of the company is consequently based on:
• its knowledge, and • compliance with copyrights and licenses concerning its software. However, there does
not exist an effective copyright protection in every country and legal action may be found necessary and have an impact on the performance of the company.
The company has never been the object of litigation nor initiated proceedings concerning the infringement of copyrights, trademarks, secrets of fabrication or other intellectual property rights, based on an eventual infringement of the copyrights of third parties.

42
• Tax risks The company may be subject to an audit in France and abroad in respect to compliance with labor and tax regulations. ESKER S.A. was subject to a tax audit, for the period from January 1, 1997 to November 30, 1999, which ended in April 2000 and did not result in significant additional tax assessments. No other audits have been carried out in any other country.
• Litigation The company may be involved in France and abroad in various legal actions. To the company's best knowledge, there do not exist other extraordinary items or litigation which may have a material adverse effect on the business, assets, financial situation or earnings of ESKER or its subsidiaries other than those mentioned in section 3.6 of this document. 3.2.4 Industrial environmental risks
• Security The Research and Development activity is located at the ESKER headquarters and is protected by security measures customarily applied in the profession. In particular, the company systematically makes two backup copies weekly of source codes of its software which are stored at two distinct geographical sites.
• Insurance ESKER has insurance coverage for the following risks:
- Industrial risks: fire, explosion, sundry risks, climactic incidents, natural catastrophes, water damage, riots, loss of records, glass breakage, theft, vandalism, electrical damage,
- All computer risks: property coverage only, as computer equipment is insured only for its balance
sheet and lease value. The coverage is extended to physical damage resulting from transport or handling in France or the occasional utilization in bordering countries.
- Civil liability: for loss which may result from the use by personnel of computer equipment, with the
exception of the design, development and sale of software. - Business interruption: resulting from damage. The period of coverage is limited to 12 months and
concerns of the gross margin of ESKER France. - Product liability: the U.S. subsidiary has taken out product liability insurance for ESKER products
vis-à-vis third parties up to USD 2 million. A policy extending coverage to Europe and Australia is in the process of being taken out.
However, it is not certain that losses that may be caused to the company will be fully covered. 3.2.5. Other risks
• Dependence on key personnel The company's success depends on the continued services of its key senior management and its research and development and sales personnel and their departure could have a material adverse effect on the performance of the Group. Most of this personnel are not bound by clauses of non-competition. ESKER considers that the implementation of stock option plans for key personnel should contribute to the stability in the management of the company.

43
• Potential volatility of the company's stock price
The market price of the stock of high-tech companies like ESKER is particularly volatile and subject to fluctuations which may be unrelated to the financial performance of the companies themselves. Several factors may have a significant impact on the stock prices, notably: fluctuations in financial results, the behavior of shareholders, announcements of new products or product improvements by the Company or its competitors, and market conditions.
• Dividends It is not the vocation of a strong growth company to apply an aggressive dividend distribution strategy. Even though ESKER distributed dividends for the 1995 and previous financial periods, the company does not plan to distribute dividends in the coming years.
• Dilution In light of ESKER's business, the company does not exclude the eventuality of new contributions of equity. Such operations could result in a dilution of the existing shareholders.
3.3. Investment Strategy
3.3.1. Principal investments in progress The investments of the company consist primarily of expenses related to the development of existing software products and marketing efforts. 3.3.2. Future investments Future investments of the company will focus principally on the launching of new versions of document server software (PULSE).
3.4. Recent Developments During the first quarter of 2002, ESKER recorded a 0.5% increase in sales to reach EUR 7.46 million compared to EUR 7.43 million in 2001. Sales for the "fax server" and "electronic document server" product lines increased by 20.8% to EUR 3.31 million, whereas the "Host Access" product line recorded a decrease of 11.5%.
3.5. Strategy and Outlook ESKER pursues a strategy consisting of optimizing the complementarity of its expertise in different technologies in the area of software interfaces between existing and new computer technologies. The achievement of this objective is based on the following actions:
3.5.1 Maintaining the company's technological position The company must maintain its R&D efforts, notably for IID markets. This will be assured through the recruitment of new staff or other operations such as the acquisition of new technologies.

44
3.5.2 Diversification of product sales The company intends to pursue the diversification of its sales, notably in the fax server and electronic document segments.
3.5.3 Alliances with partners ESKER is strongly committed to developing partnerships with other software companies, telephone operators and hardware manufacturers to promote its solutions to companies.
3.5.4 Diversification of distribution channels While maintaining its current distribution network, the company intends to extend it to other distributors who are not competitors of its current distributors or servicing countries not currently covered (in particular in Asia and Latin America). In addition to this diversification, ESKER wishes to develop partnerships with indirect retailers in respect to joint marketing programs, technical assistance and business referral opportunities, in order to further contribute to the performance of the existing distribution network. The company will develop in priority these programs with service companies and value-added resellers.
3.5.5 Increased investments in Europe ESKER intends to pursue the development of its sales in Europe and increase its presence, notably through recent acquisitions in the fax server segment and the launching of Pulse.
3.5.6. Development in the Asia-Pacific region Through its subsidiary created in Australia in 1997, the Company should continue to develop sales in this region, notably in the countries of the region speaking a Western language. This subsidiary also serves as the commercial base for ESKER's development in Asia. New technical investments may become necessary to provide the support for DBCS (Double Byte Character Set, mandatory for Asian languages) if significant new commercial opportunities in Asia are identified.
3.6 Extraordinary Items and Litigation * The Company has initiated proceedings to liquidate the subsidiary in Singapore. Within the framework of this liquidation, a creditor was granted damages. On the basis of information provided by his attorney based in Singapore, a provision for this risk was recorded on December 31, 2001. No significant developments were noted for the 2001 financial period. * Two suits are in progress with former ESKER distributors. They have initiated proceedings against the company for payment of FRF 9.6 million (EUR 1,464,000) in damages for wrongful breach of a distribution agreement. For these suits, the evidence submitted to the court contradicts this claim. In 2000, the first distributor lodged an appeal of a decision in first instance which resulted in a dismissal of his claims. ESKER has maintained a provision of EUR 30,000 for this case to cover potential legal costs. With regard to the second suit, a provision of EUR 76,000 has been posted, representing a prudent assessment of the costs and risks incurred by ESKER based on the figures available on the company's closing date. In April 2002, the distributor's overseas parent company declared bankruptcy. The possibility of recovering this distributor's outstanding debts to ESKER, amounting to EUR 421,000, will therefore be reexamined in the light of recent events at the end of the fiscal year on June 30, 2002. With the exception of these suits, to ESKER's best knowledge, there exist no extraordinary items, litigation or arbitration proceedings which may have a material impact on the financial situation, assets, business and performance of the Company or its subsidiaries.

45
GLOSSARY 3270 A keyboard+screen type terminal used by IBM hosts 5250 A keyboard+screen type terminal used by IBM AS/400 machines Alphanumeric applications Application running in character mode only, without graphic interface,
customary in legacy computer systems. B to B / B to C
Business to Business / Business to Consumer: commercial relations between businesses (B to B) or between a business and a final consumer (B to C).
Business Intelligence Computer applications for extracting, analyzing and reporting data. Client/Server Architectural model in which the processing of data can be distributed
between workstations of a network (client) and one or more hosts. Previously, the processing of data was carried out by a host system.
Connectivity Technical solutions (hardware and/or software) that enable
communications between different applications. Hybrid mail
Mail initiated by electronic file transmission via the Internet to the local Postal Service (e.g. La Poste, in France) and then printed, inserted in an envelope, automatically stamped and received by its recipient as a traditional letter.
Datamart Software enabling presentation of information contained in databases according to a schema which is simple, accessible and adapted to the needs of a given user group.
Terminal emulation Software that allows a workstation to imitate the behavior of a keyboard +
screen type terminal (dumb terminal). A software emulation terminal thus enables the activation of one computer's applications from another.
Heterogeneous In computing, refers to hardware and software that is not compatible
except in the case where specific mechanisms have been put in place to achieve compatibility.
Host access
Describes a category of software applications enabling PC communication with hosts (IBM Mainframe* or AS/400, Unix* hosts, etc.), shared peripherals or access associated databases.
HTML A document format, primarily used by Internet. Internet Worldwide network of computers communicating with each other through
the TCP/IP* protocol. Intranet An information network utilizing internet technologies (HTTP servers,
messaging, etc.) confined to private access within an organization.
Asianization Because of the relative technical complexity of Asian written language
(several alphabets, many thousands of characters) the adaptation of a software product for Asian markets is not limited to a simple translation. It is necessary to integrate, the different alphabets in the software before the translation of the interface of messages.

46
Java A programming language developed by SUN destined to develop applications functioning on different platforms and operating systems.
LDAP Acronym standing for "Lightweight Directory Access Protocol". A recent Internet protocol permitting the consultation or update of electronic directories located on a host system. The information included in such a directory concerns primarily the names and references (electronic address) of company employees. But also all information pertaining to the resources of an organization (hosts, printers, fax, etc.) can be included.
Linux A duty-free operating system designed in the 1980s by a student: Linus
Tordwal. Closely related to the Unix* operating system, Linux has become very popular because it is robust and free of charge.
Software application A package of programs, processes and rules that enable a computing system to process data for specific user needs.
Mainframe A large computer (frequently an IBM) with significant calculation and
backup capacity able to serve many users. Middleware Software component that links two environments (for example: database /
user interface) Web Browser An application used to search and consult information and execute Applets
with Internet hosts. Host computer Multi-user computer including computer applications and in most cases,
databases. Original Equipment Manufacturer (OEM)
Supplier of computer products including components produced by other suppliers.
PC-to-Host All technologies enabling a PC to communicate with host computers. PDF Portable format for representing documents (Portable Document Format)
developed by ADOBE. Driver An interchangeable software layer enabling access between a program and
equipment or specific software peripherals. Drivers enable the accessory to execute the various demands of the program.
Product software Software program packaged for licensed use usually comprising a CD-
ROM and a user manual. Network protocol Format for transporting data via a network. One may compare the network
protocol to a language: two people cannot understand each other unless they decide to speak a common language. In the same way, computer equipment cannot communicate with other equipment through the network unless they use the same protocol.
Fax server Equipment destined to receive or transmit facsimile documents (or faxes). Workstation Individual multifunction computer. In this document, PCs are considered
workstations. Software suite A group of software applications produced by the same company,
responding to related user needs. Database Management Software (DBMS)
Software designed for the purpose of optimizing information storage.

47
Relational Database Management Software (RDBMS)
A particular type of DBMS allowing information to be stored in Management System table format following the entity-relationship model. Oracle, Informix, Sybase, and IBM are the principal providers of this type of DBMS.
Open system An adaptive operating system able to function on different computers. The
most typical example is the UNIX* system which can to function on PCs, RISC processors (IBM, HP, DEC, etc. ) and IBM Mainframes*.
TCP/IP A communications protocol used between different machines (micro, mini
or PC) regardless of the software environment (DOS, Windows, Netware, Unix*). This protocol is the internet standard.
Dumb terminal A keyboard+screen configuration without local processing capacity which
only provides communication between the user and a computer system. 3270 Terminal A keyboard+screen type terminal used by IBM hosts. 5250 Terminal A keyboard+screen type terminal used by IBM AS/400 machines. UNIX An operating system developed in the '70s and able to be deployed on
many different equipment platforms. The first open system, it was adopted by virtually all computer manufacturers in the area of departmental hosts and has become an industry reference.
VAR A computer company proposing solutions through the assembly of (Value
Added Retailers) components. Vertical market A software company servicing a specific business segment or category
software developers of users (example: software for pharmacies, management of a firm of solicitors, etc.)
Web-to-Host Technologies enabling communication between an intranet system and
host computers. In this context, the intranet system consists of an HTTP host and workstations equipped with a Web browser.
Windows Initially, a graphic interface (Windows 3.x) proposed by Microsoft. This
product has become a full-fledged operating system with the products Windows 95, Windows 98, Windows NT and Windows 2000.

48
Chapter 4: Financial Data
4-1 Consolidated Financial Statements
AUDITORS' REPORT
Consolidated Financial Statements
ESKER
Public Limited Company (Société Anonyme)
Immeuble “GEO CHAVEZ” 10 rue des Emeraudes 69006 LYON - France
AUDITORS' REPORT
Consolidated Financial Statements
Period ended 31.12.01
In accordance with the terms of our appointment by your shareholders' meeting, we have audited the consolidated financial statements of the ESKER company concerning the period ended December 31, 2001 established in Euros as included with this report.
These consolidated financial statements are the responsibility of the company’s management board.It is our duty to express an opinion on these financial statements on the basis of our audit. We have conducted our audit in accordance with generally accepted auditing standards. These standards call for the implementation of procedures to obtain reasonable assurance that the consolidated financial statements do not include any important discrepancies. An audit includes examining, on a test basis, evidence supporting the amounts and disclosures in the consolidated financial statements. An audit also includes assessing the accounting principles used and significant estimates made by management, as well as evaluating the overall presentation of the consolidated financial statements. We believe that our audit provides a reasonable basis for our opinion expressed thereafter. In our opinion, these consolidated financial statements, established according to generally accepted French accounting Standards, provide a true and fair picture of the assets, liabilities, net worth as well as the earnings of the group formed by the companies included in consolidation. We have also reviewed the information concerning the group provided in the management report. We have no comment to make regarding the sincerity and conformity with the annual financial statements of the information contained in this report.
Villeurbanne, June 10, 2002
The Auditors
Yves FOURNAND DELOITTE TOUCHE TOHMATSU
Dominique VALETTE

49
Consolidated balance sheet - assets ('000s €) Note 2001 2000 1999
Net intangible assets (3) 2,457 2,984 3,801 Net tangible assets (4) 1,152 1,369 1,404 Long-term investments (5) 60 71 44 Fixed assets 3,669 4,424 5,249
Inventory and work in progress (6) 308 280 387 Advances and prepaids Trade account receivable (7) 6,669 6,727 8,538 Other receivables (8) 1,192 1,742 1,228 Deferred tax assets 308 646 857 Cash and cash equivalents (9) 8,214 8,116 15,710 Current assets 16,691 17,511 26,719
Prepaid expenses (10) 496 694 787
TOTAL ASSETS 20,856 22,629 32,755
Share capital (12) 6,828 5,702 5,255 Paid-in capital 15,078 9,496 9,042 Consolidated reserves 1,634 5,166 3,721 Currency translation adjustment 1,205 519 292 Retained earnings -9,224 Net income-Group share -2,194 -5,154 2,270 Group shareholders' equity (11) 13,327 15,729 20,580 Minority interests 1 1 1 Reserves for risks and charges (13) 177 175 518
Advances on conditions 38
Long-term debt (15) 8 204 4,494
Downpayments from customers 2 108 133 Trade notes and accounts payable 1,650 1,500 2,232 Tax and employee-related liabilities 2,594 2,365 3,361 Other payables 105 173 118 Differed tax liabilities 38 Current liabilities (16) 4,351 4,146 5,882
Deferred revenue (17) 2,992 2,374 1,241
TOTAL LIABILITIES & SHAREHOLDERS EQUITY
20,856 22,629 32,755

50
Consolidated income statement 2001 2000 1999 Note '000s € '000s € '000s € Product sales 27,294 23,898 24,216 Product updates and prof. services 5,020 3,480 3,501 Other income 219 99 Sales & other income 32,533 27,477 27,717
Cost of goods sold -2,919 -2,524 -1,915 Research and development costs -6,797 -6,370 -4,256 Selling expenses -11,794 -11,013 -9,227 Marketing expenses -6,577 -5,711 -5,818 General & admin expenses -5,704 -5,590 -3,382 Operating profit (loss) -1,258 -3,732 3,119
Financial profit (22) 292 289 681
PRETAX INCOME BEFORE EXTRAORDINARY ITEMS
-966 -3,443 3,800
Extraordinary items (23) -772 -1,065 -6
Corporate income tax (24) -182 -400 -1,283 INCOME OF CONSOLIDATED COMPANIES -1,920 -4,908 2,511
BEFORE AMORTIZATION OF GOODWILL
Amortization of good will -274 -246 -240 Minority interests - - - TOTAL CONSOLIDATED NET INCOME
-2,194 -5,154 2,271
Earnings per share (in €) -0.65 -1.61 0.86
Fully diluted earnings per share (in €) -0.65 -1.61 0.82

51
Statement of consolidated cash flows
2001 2000 1999 Note '000s € '000s € '000s €
CASH FLOWS FROM OPERATING ACTIVITIES Cash flow -594 -2,578 3,468 Net income - Group share -2,194 -5,154 2,271 Net income - minority interests 0 Allowances for depreciation on fixed assets & goodwill 1,611 2,420 1,279 Deferred tax -11 156 -82 Change in working capital requirement -1,865 -534 587 Inventories 28 -196 -34 Operating receivables and suspense accounts -988 -2,338 504 Increase in trade payables 905 -2,000 -117 NET CASH FLOWS PROVIDED BY OPERATIONS 1,271 -2,044 2,881
CASH FLOWS FROM INVESTING ACTIVITIES Acquisition of intangible assets 703 581 1,178 Changes in goodwill (c) -46 Cash flows allocated to acquisitions during the period -67 -952 Other variations -3 Increase in expenses to carry 38 0 Net change in treasury stock -22 -76 -264 Net change in other long-term investments -12 27 2 NET CASH USED BY INVESTING ACTIVITIES 666 457 -37
CASH FLOWS FROM FINANCING ACTIVITIES Increases in capital 55 387 183 Dividends paid by the parent company during the period 0 Other changes in shareholders' equity 0 0 Treasury stock -118 -807 Increase in long-term debt and other medium and long-term liabilities (a) 0 -1,342 -115 NET CASH FLOWS PROVIDED BY FINANCING ACTIVITIES -63 -1,763 68
NET CASH FLOW 542 -4,264 2,986
Cash at the beginning of the period 7,342 11,606 8,620 Change in the period 542 -4,264 2,986 Impact of foreign exchange fluctuations 72 212 198 CASH AT THE END OF THE PERIOD (b) 7,956 7,342 11,606
Cash items correspond to assets and liabilities with maximum maturities of three months as of the closing date of the period under review. (a) All financial debt has been considered negative cash, as corresponding to periodic overdrafts and an advance on conditions payable at less than one year. (b) Cash holdings for the last three financial periods have been restated for treasury stock which is presented separately under cash flows from investing activities. (c) The change in goodwill reflects the provision for reorganization expenses recorded in 1999 under goodwill for Alcom and Persoft.

52
NOTES TO THE CONSOLIDATED FINANCIAL STATEMENTS
Note 1: Significant accounting policies • Authoritative accounting pronouncements The consolidated financial statements have been prepared in accordance with French accounting principles and the provisions of regulation 99-02 of the Comité de la Réglementation Comptable concerning consolidated financial statements, approved on June 22, 1999. These new provisions concern primarily the application of a special consolidation method for the acquisition of VSI Inc in 2000. Pursuant to the application of section 5 of this regulation 99-02 concerning the first year of application, acquisitions carried out before the beginning of the period have not been restated. In consequence, pro forma financial statements have not been presented. • Consolidation policies The consolidated financial statements have been presented according to the principle of full consolidation, as each company included in the scope of consolidation is a wholly-owned subsidiary of the parent company ESKER SA. Assets and liabilities of foreign subsidiaries are converted at the year-end exchange rate and income statement items at the average exchange rate for the six-month period. Translation differences resulting from exchange rate variations are recorded under consolidated shareholders' equity. To improve the quality of the financial information, and to coincide with the publication dates of results, since 2000, ESKER converts the income statements of its subsidiaries at the six-month average exchange rates instead of the average exchange rate for the full year period. The impact of this change on the last three financial periods is not significant. All significant transactions between consolidated companies as well as internal results not recognized, included under fixed assets and inventories of the consolidated companies, are eliminated. • Sales Sales are recognized as income according to the completed sales basis, i.e. on the date of product's delivery. ESKER sells upgrade contracts associated with the products. These contracts grant the right to receive all main versions of software packages which may be published during the period covered by the contract. Sales related to this category of service is amortized on a straight-line basis over the lifespan of the contract. • Intangible assets ü Goodwill on acquisition
Upon acquisition of controlling interests of a new company, the identifiable assets and liabilities of the acquired subsidiary are recorded in the consolidated balance sheet for their value as re-estimated on this date. The residual value between the acquisition cost of the shares and the share in the reestimated net assets is recorded under “Goodwill” and amortized over a period of 10 years, which is deemed reasonable and prudent, in light of the Group's business.

53
ü Business goodwill
It follows, in economic terms, that the goodwill acquired by the Australian subsidiary, which was fully amortized during 2001, should have been amortized over a period of ten years, as explained in Note 3 of this document relating to intangible assets. ü Other intangible assets
Other intangible assets consist primarily of trademarks and software recorded in the balance sheet at acquisition cost. Software is depreciated on a straight-line basis over 1 to 5 years. Trademarks are not depreciated. Technology assets are recorded under intangible assets and depreciated over five years. • Tangible assets Tangible assets are recorded in the balance sheet at the Group's acquisition cost. Depreciations are recorded on a straight-line or accelerated basis applied over the following estimated periods of use: - General installations Straight-line/5-8 years - Transport equipment Straight-line/3-5 years - Office and computer equipment Straight line or Accelerated/2.5-8 years - Equipment Furniture Straight-line/5-10 years Most acquisitions of equipment and software are recorded under fixed assets of the Group. The parent company has only marginal recourse to lease financing. Past and current finance leases have not been restated in consolidation as this item is non-significant.
• Long-term investments The gross value of non-consolidated equity interests includes the acquisition cost of these shareholdings. When the market value is less than the gross value, a provision for charges is recorded. The market value is calculated on the basis of the net worth of the investment at the end of each period, eventually weighted to take into account the sales and earnings prospects. • Inventory and work in progress This item includes: - consumables (CD ROM and packaging), - intelligent fax boards, - marketing material (brochures, etc.).
They are recorded at acquisition cost.
Provisions are recorded when the sale value is less than the acquisition cost.
• Trade notes and account receivable Trade notes and accounts receivable are recorded at face value. They are depreciated on an individual basis according to the age of the debt and the assessment of the risk incurred by the group.

54
• Marketable investment securities The gross value of this item consists of the acquisition cost excluding charges. When the fair value is less than the gross value, a reserve is recorded for the difference. • Treasury stock Treasury shares destined specifically for share price stabilization or employee stock purchase plans are recorded under short-term investment securities. Treasury shares not destined for these two purposes are deducted from consolidated shareholders' equity at their acquisition cost. Capital gains or losses on these shares are not included under consolidated income.
• Deferred tax Deferred tax is calculated for all timing differences between the tax base and the book income. Deferred tax debits relating to timing differences and losses brought forward are only recorded to the extent that their collectibility does not depend on future results, or if it is likely that the company concerned may be able to recover them in future financial periods. Deferred tax debits and credits are netted in the balance sheet. • Translation of foreign currency items Payables and receivables stated in foreign currency are converted on the basis of the exchange rate in force on December 31. Starting January 1, 1999, the Group records unrealized foreign exchange gains and losses on payables and receivables stated in foreign currency under income. This applies with the exception of unrealized foreign exchange gains and losses on payables and receivables considered to represent an integral part of company investments. • Calculation of earnings per share:
• Earnings per share: Earnings per share are calculated on the basis of net income for the consolidated entity and the average number of shares of the consolidating entity outstanding for the period under review.
• Fully diluted earnings per share: Fully diluted earnings per share are calculated on the basis of: net income of the consolidated entity, the forecasted yield on the Group cash assets on the basis of the average annual rate recorded, the amount of funds which could be raised on the basis of the total number of shares available for issuance shares, the average number of shares of the consolidating company taking into account the impact of potentially diluted securities (stock option plans destined exclusively for employees). In the two cases treasury shares deducted from shareholders' capital were not taken into account to determine the average number of shares used for this calculation.

55
Note 2: Consolidation scope
Company Registered
Office % Control % Interest
2001 2000 1999 2001 2000 1999 ESKER S.A. Lyon Consolidating Company France ESKER Gmbh Essen 100% 100% 100% 100% 100% 100% Germany ESKER Ltd Derbyshire 100% 100% 100% 100% 100% 100% UK ESKER Srl Milan 100% 100% 100% 100% 100% 100% Italy ESKER Iberica Sl Madrid 99.80% 99.80% 99.80% 99.80% 99.80% 99.80% Spain ESKER Inc Madison 100% 100% 100% 100% 100% 100% (U.S.A.) INTERDOC, Oy Espoo 100% 100% 100% 100% 100% 100% Finland ESKER Australia Pty Ltd Sidney 100% 100% 100% 100% 100% 100% Australia VSI Inc Lake Forrest 100% 100% 100% 100% (U.S.A.)
One subsidiary, ESKER Asia Pte Ltd, located in Singapore and wholly-owned by ESKER S.A., has not been included in the scope of consolidation since 1997. This company has ceased activity since December 1997. A provision was recorded by ESKER S.A. to cover all risks related to the liquidation of this subsidiary. • Changes in the scope of consolidation
The ESKER group did not carry out any acquisitions during the 2001 financial year. In October 2000, ESKER acquired the U.S. company VSI Inc, based in Lake Forest, California. For this acquisition, ESKER applied the special accounting method provided under regulation 99-02 concerning the new consolidation standards (pooling of interests) We also note that during the 1999 financial periods, the companies Persoft Inc and Alcom Inc were included in the scope of consolidation. These two companies were acquired by ESKER Inc in the 2000 financial period.

56
Note 3: Intangible assets 2001 2000 1999
Gross Allowances for depreciations
Net Net Net
& reserves Goodwill on acquisition 2,730 919 1,811 2,087 2,720 Start-up costs 8 6 2 2 - Trademarks (a) 279 80 199 163 171 Business goodwill (b) 274 274 - 186 232 Software (c) 2,367 1,922 445 546 678 Total in '000s € 5,658 3,201 2,457 2,984 3,801
• Goodwill on acquisition: Goodwill on acquisitions in the balance sheet breaks down as follows: 2001 2000 1999 Annual
Gross Allowances for depreciations
Net Net Net Depreciations
& reserves Repurchase of minority interests ESKER Inc
126 101 24 38 50 13
Teubner & Associates 1,668 598 1,070 1,238 1,406 167 Alcom 80 24 56 64 438 8 Persoft 858 196 662 747 826 86 Total in '000s € 2,730 919 1,811 2,087 2,720 274
It is noted that in 1998, goodwill generated by the acquisition of Teubner & Associates was deducted from paid-in capital following the capital increase resulting from this operation for EUR 9.1 million. Similarly, in 1999, according to generally accepted accounting principles in France and the terms of the prospectus (Note d'opération) issued within the framework of the Persoft operation, ESKER exercised the option of allocating to paid-in capital the goodwill resulting from the acquisitions of the companies, Alcom and Persoft. This decision was based primarily on the method of financing these acquisitions (issuance of new ESKER shares). All goodwill on acquisition is amortized over a period of 10 years. These operations break down as follows:
'000s € Goodwill Before
Amortization
Percentage of equity
financing
Allocation to paid-in capital
Amortizable goodwill
Annual amortization expense
Annual amortization exp. without allocation
Teubner 10,776 84.50% 9,107 1,669 167
1,077
Alcom 1,316 100% 1,236 80 8 132
Persoft 12,252 93% 11,394 858 86
1,225
Total in '000s € 24,344 21,737 2,607 261
2,434

57
(a) The trademarks include the trademarks and logos exploited by ESKER and filed with the INPI (the
French national Institute for industrial property) for the regions of France, EU, U.S.A., Canada and Asia; They are not amortized.
(b) On 1/8/97, ESKER Australia was incorporated. This latter entity acquired the business assets of our
distributor Unitract for AUD 450,000. In 2001, ESKER deemed the value in balance sheet of this asset to no longer correspond to its economic value and therefore decided to amortize this goodwill in full. The impact of this decision on the period represents an extraordinary charge of EUR 153,000.
(c) Software acquisitions concern primarily user licenses. They are depreciated over a period of 1 to 5
years.
Note 4: Tangible assets 2001 2000 1999
Gross Allowances for depreciations and
reserves
Net Net Net
Fixtures and improvements 106 38 68 243 24
Transport equipment 90 41 49 27 1
Office and computer equipment 4,942 4,238 704 831 1,276
Equipment Furniture 1,071 928 143 106 96
Others 380 192 188 162 7
Total in '000s € 6,589 5,437 1,152 1,369 1,404

58
Note 5: Long-term investments
2001 2000 1999
Gross Allowances for depreciations
Net Net Net
& reserves
Other equity interests (a) 68 68 - - 0 6
Others (b) 60 60 71 38
Total in '000s € 128 68 60 71 44
(a) Other equity interests concern, primarily, a stake of 14.5% in the company SCREENER Sarl, in official
receivership since 1998, and the subsidiary ESKER Asia, no longer included in the scope of consolidation (cf. section 2). These assets have been fully provisioned for since 12/31/97.
(b) This item primarily concerns deposits and guarantees.
Note 6: Inventory and work in progress 2001 2000 1999
Gross Reserves Net Net Net
CD-Roms, packaging, marketing brochures…
167 24 142 253 184
Goods held for resale 165 165 27 203
Total in '000s € 332 24 308 280 387
The inventory of goods held for resale corresponds to intelligent fax boards sold with certain of our fax servers.
Note 7: Trade notes and accounts receivable
2001 2000 1999
Gross Reserves Net Net Net
Trade notes and account receivable in '000s €
6,995 326 6,669 6,727 8,538
The amount of outstanding trade receivables which exceed one year is not significant.

59
Note 8: Other receivables
2001 2000 1999
Gross Reserves Net Net Net
Personnel 46 46 42 44
Tax receivables (a) 1,040 1,040 1,614 854
Other receivables 143 38 105 85 329
Total in '000s € 1,230 38 1,192 1,742 1,228
Tax receivables on December 31, 2001 concerned principally corporate income tax receivables for EUR 679,000 and EUR 613,000 for VAT. The amount of other receivables with maturities exceeding one year is non-significant.
Note 9: Cash and cash equivalents - short-term investment securities
2001 2000 1999
Gross Reserves Net Net Net
Treasury stock (a) 812 561 251 571 910
Marketable investment securities (b) 5,607 5,607 5,979 12,227
Cash 2,356 2,356 1,566 2,573
Total in '000s € 8,775 561 8,214 8,116 15,710
(a) Treasury stock: Treasury stock destined specifically for share price stabilization or employee stock option plans. A provision was recorded which was determined by comparing the book value with the average stock price for the last month of the financial period. Changes in the 2001 financial period break down as follows:
Number Value
'000s €
On January 1, 2001 66,118 834
Exercise of options - 5,000 - 22
Sale on the market On December 31, 2001 61,118 812
Unrealized capital loss 519
(b) Short-term investment securities consist primarily of Negotiable Certificates of Deposit and money market funds. On December 31, 2001, the closing value of these mutual funds was closed to the balance sheet value.

60
Note 10: Prepaid expenses 2001 2000 1999
expenses to be carried forward to future periods
10 49 67
Prepaid expenses 486 646 695
Unrealized losses on foreign exchange 25
Total in '000s € 496 694 787
The prepaid expenses primarily concern marketing costs, other payroll expenses and rental costs mainly in the United States and France. Charges to be carried forward concerned: - the acquisition expenses of the Teubner company: The gross amount was transferred under expenses to be brought forward: EUR 143,000 amortized over three years (2001 allowance: EUR 20,000).These costs were fully amortized at the end of 2001. - training costs for a CRM (Customer Relations Management) application acquired by the parent company (EUR 38,000 depreciated over two years). Since 1999, the acquisition expenses of new companies included in the scope of consolidation were taken into account to determine their acquisition cost.
Note 11: Group shareholders' equity 2001 2000 1999
BEGINNING OF THE PERIOD 15,729 20,580 14,849
Capital increase
Nominal 1,126 447 1,251
Paid-in capital 32 6,092 14,186
Goodwill allocated
to paid capital -401 -5,630 -12,542
Change in translation adjustment 251 227 548
Other changes in reserves -1,214 -832 17
Profit for the period (Group share) -2,194 -5,154 2,270
CLOSE OF THE PERIOD
Total in '000s € 13,327 15,729 20,580

61
2001: - Capital increases: EUR 1,098,500: brought about by the conversion into euros of capital by withdrawal from consolidated reserves. The residual capital increase results from the exercise of options. - Other changes in reserves include EUR 118,000 for treasury shares recorded under fixed assets of the parent company and adapted from shareholders' equity. - The amount appearing as goodwill on acquisition allocated to paid-in capital applies to an adjustment of goodwill in connection with the company VSI, acquired in 2000. 2000: The principal capital increase concerned the issuance of shares in connection with the acquisition of VSI (EUR 6,267,000 before amortization of goodwill). EUR 272,000 result from the exercise of options in the period. Other changes in reserves include EUR 807,000 for treasury shares recorded under fixed assets of the parent company and adapted from shareholders' equity. 1999: This concerns, on the one hand, the paid-in capital from the capital increases resulting from the exercising of options and, on the other hand, the premium issued on the capital increases carried out upon the acquisitions of Alcom and Persoft, after the allocation of goodwill.
Note 12: Authorized capital 2001 2000 1999
Authorized Capital ('000s €) 6,828 5,702 5,255
On December 31, 2001, the capital of the parent company consisted of 3,414,161 shares conferring simple voting rights of a nominal value of EUR 2 per share, i.e. an authorized capital of EUR 6,828,000. During the 2001 financial period, the following capital transactions were carried out, corresponding to a capital increase of EUR 1,126,000. Capital increase resulting from the conversion of capital into euros by withdrawal from reserves: EUR 1,098,000. Capital increase pursuant to the exercise of stock options: EUR 28,000: Issue of 13,865 shares with a nominal value of EUR 2.
Note 13: Reserves for risks and charges 2001 2000 1999
Provision for foreign exchange losses - - 25
Provision for risks on ESKER Asia 38 38 38
Accrued losses on foreign exchange options
Lawsuit contingency provisions 30 30 107
Other provisions for risks 109 99
Provisions for reorganization 7 348
Total in '000s € 177 175 518

62
This provision corresponds to the reorganization of the newly acquired companies included in the scope of consolidation during the year under review. A suit is in progress with a former ESKER distributor who has unpaid debts of EUR 421,000 on the balance sheet as of December 31, 2001. ESKER terminated the distribution agreement early in 2001. The distributor has initiated proceedings against ESKER for payment of EUR 861,000 for wrongful breach of a distribution agreement. The evidence submitted to the court contradicts this claim. A partial provision of EUR 76,000 has been made.
Note 14: Long-term debt 2001 2000 1999
Short-term credits and bank overdrafts 8 16 19
Bank borrowings (a) 4,232
Miscellaneous borrowings (b) 188 243
Total in '000s € 8 204 4,494
(a) This concerns a loan of EUR 3.4 million contracted by ESKER SA within the framework of the acquisition of Persoft, and bank borrowings by the U.S. subsidiary. This law was fully paid back in 2000. (b) Primarily, an advance on conditions contracted with COFACE (EUR 187,000). In accordance with the provisions of the contract, this advance was definitively acquired by the company in May 2001.
Note 15: Analysis of long-term debt On December 31, 2001 Less than
one year From 1 to 5
years More than 5
years
Short-term credits and bank overdrafts 8
Bank borrowings
Miscellaneous borrowings
Total in '000s € 8 - -
Note 16: Analysis of trade payables The portion of trade payables exceeding one year has not been significant.

63
Note 17: –Deferred income 2001 2000 1999
Deferred income (a) 2,992 2,374 1,241
Total in '000s € 2,992 2,374 1,241
(a) This relates primarily to product upgrade contracts marketed by the company in 2001 and for 2002 (cf. Note 1: Sales).
Note 18: Analysis of sales by region and sector The ESKER Group participates in the Host Access and lID markets (cf. Chapter 3). These two markets concern the same sector of activity: the development of software products, for which the company is organized. For this reason, the presentation of detailed information by sector of activities has been limited to the break down of sales by product line. The presentation of information by region is based on the analysis of operating activity provided by the company's internal reporting. Each region represents a profit center to which only costs related directly to this region are allocated (example: marketing cost, sales costs, etc.). Corporate expenses concern expenses relating to the entire Group and not managed directly by the profit centers (example: R&D expenses, strategic marketing, corporate financing, etc.). The two U.S. entities were grouped together as were European entities accounting for less than 5% of Group sales. France UK
Benelux Germany Other
European countries
Australia USA Corporate expenses
ESKER Total
‘000s €
Sales 3,721 4,862 1,871 1,574 1,287 18,999 32,314
% of total sales 12% 15% 6% 5% 4% 59% 100%
including:
Host access 2,960 3,678 1,783 1,094 514 9,013 19,041
I.I.D 760 1,184 89 481 774 9,986 13,273
Other income 214 3 2 219
Operating expenses -2,267 -2,622 -1,256 -1,111 -1,243 -15,001 -10,290 -33,791
Operating profit (loss) 1,668 2,240 615 463 47 4,000 -10,290 -1,258
Net fixed assets 523 73 35 51 43 1,074 1,799
(excluding goodwill and long-term investments)

64
Note 19: Income statement data on a like-for-like basis In light of the acquisition of VSI during the second half of 2000, and in order to ensure the comparability of financial data, we have incorporated VSI into the following pro forma income statement for the period ending December 31, 2000. In preparing these pro forma financial statements, the following items have been restated: expenses incurred by the sellers to prepare for the sale and not related to the activity of the company were eliminated (USD 153,000).
2001 ESKER VSI 2000
‘000s € W/o VSI Proforma Sales 32,314 26,208 5,100 31,308 Other income 219 99 99 Cost of sales -2,919 -2,414 -581 -2,995R&D expenses -6,797 -6,042 -1,298 -7,340Commercial charges -11,794 -10,803 -1,816 -12,619Marketing expenses -6,577 -5,602 -1,017 -6,618Administrative expenses -5,704 -5,205 -1,408 -6,613 Operating profit (loss) -1,258 -3,757 -1,019 -4,777 Financial profit 292 287 17 304
PRETAX INCOME BEFORE EXTRAORDINARY ITEMS
-966 -3,470 -1,002 -4,473
Extraordinary items -772 -1,064 -1,064 Amortization of goodwill -274 -246 -246Corporate income tax -182 -355 490 134 NET INCOME -2,194 -5,136 -513 -5,648
Note 20: Personnel The number of personnel at the close of the last three financial periods was as follows: 2001 2000 1999
Management and supervisory staff 64 62 65
Employees 21 22 24
FRENCH COMPANIES 85 84 89
Management and supervisory staff 22 24 33
Employees 181 169 195
FOREIGN COMPANIES 203 193 228
Management and supervisory staff 86 86 98
Employees 202 191 219
TOTAL GROUP 288 277 317

65
Note 21: Allowances for depreciation and reserves 2001 2000 1999
Depreciation allowances for fixed assets 1,088 1,171 793
Depreciation allowances for current assets 122 633 200
Total in '000s € 1,210 1,804 993
Note 22: Financial profit 2001 2000 1999
FINANCIAL INCOME 658 619 1,028
Other interest and similar income 0 210
Net proceeds from the sale of securities 316 403 211
Reserves written back to income and internal transfers 119
Currency gains 142 216 290
Unrealized foreign exchange gains 81 317
FINANCIAL CHARGES -366 -330 -347
Allowances for amortization that reserves
Interest and similar expenses -28 -44 -183
Currency losses -338 -285 -164
Total in '000s € 292 289 681

66
Note 23: Extraordinary items 2001 2000 1999
On management operations (a) -341 -443 11
From capital transactions -278 14 -10
Extraordinary appropriations/reinstatements (b) -153 -636 -7
Total in '000s € -772 -1,065 -6
The extraordinary items for management operations include EUR 343,000 to cover redundancy payments and related costs, resulting from the reorganization carried out in the group's subsidiaries in the United States. The extraordinary items for capital transactions correspond to EUR 256,000 for depreciation of treasury shares recorded under short-term investment securities. The depreciation allowance and extraordinary provision correspond to the amortization of the Australian subsidiary's goodwill.
Note 24: Corporate income tax • Analysis of the tax on profit 2001 2000 1999
Current tax expense -278 -262 1,365
Deferred tax expense/income:
Loss carryforwards 653 -8
Timing differences & misc. 96 9 -73
Total in '000s € -182 400 1,283
For the 1998 financial period, a deferred tax debit was recorded to take into account tax losses brought forward for the U.S. subsidiary. In light of the taxable income of this subsidiary and the procedures for recovering the tax, this deferred tax debit was canceled in the 2000 financial statements. For this same reason, no deferred tax debit was recorded on the timing differences and the tax losses brought forward for the period for the U.S. and Australian subsidiaries.

67
• Analysis of the tax expense '000s € 2001
Pretax income -2,011
Amortization of goodwill 273
Income before tax -1,738
Tax rate of the parent company 0
Theoretical tax -614
Impact of:
- Regularization of corporate tax for the prior period (b) 309
- Different tax rates of foreign countries 52
- Tax losses not used (a) 499
- Consolidation reclassifications and related items -64
Group tax expense 182
The profit tax expense may be analyzed as follows: (a) This concerns tax loss carryforwards of U.S. and Australian subsidiaries not applied to losses of the period. (b) This adjustment applies to the 2000 financial period.
Note 25: Off-balance sheet commitments • Pension liabilities
In light of the age and seniority of the personnel, the amount of retirement indemnities is not deemed significant. • Management of foreign exchange risks: To cover the foreign exchange risk on the British pound, the company carried out forward sales on 31.12.01 of GBP 413,000.

68
4.2 Condensed Parent Company Financial Statements
Notes The information presented as follows includes only the key financial data of the balance sheet and income statement. The complete annual financial statements can be obtained from the company's headquarters. The balance sheet and income statement of ESKER S.A. have been prepared in accordance with French law and regulations and generally accepted accounting principles, applied uniformly from one period to another. In the corporate financial statements, equity interests of foreign subsidiaries are recorded in the balance sheet under assets at acquisition cost. In most cases corresponding to start-ups, the acquisition cost corresponds to the share capital of the company. At the end of the financial year, the stock-taking value of subsidiaries' equity interests corresponds to an estimated value assessed according to the market and their usefulness to the company.

69
Assets statement
('000s €) 31-Dec-2001 31-Dec-2000 31-Dec-1999
Intangible assets 302 299 349
Tangible assets 221 182 107
Long-term investments 26,836 26,840 28,203
FIXED ASSETS 27,359 27,321 28,659
Inventory and work in progress 180 61 56
Trade notes and account receivable
7,925 6,495 5,289
Other receivables 1,994 2,422 1,912
Cash and short-term investment securities
5,025 4,701 9,843
CURRENT ASSETS 15,124 13,679 17,099
Suspense accounts 574 739 574
TOTAL ASSETS 43,058 41,739 46,332
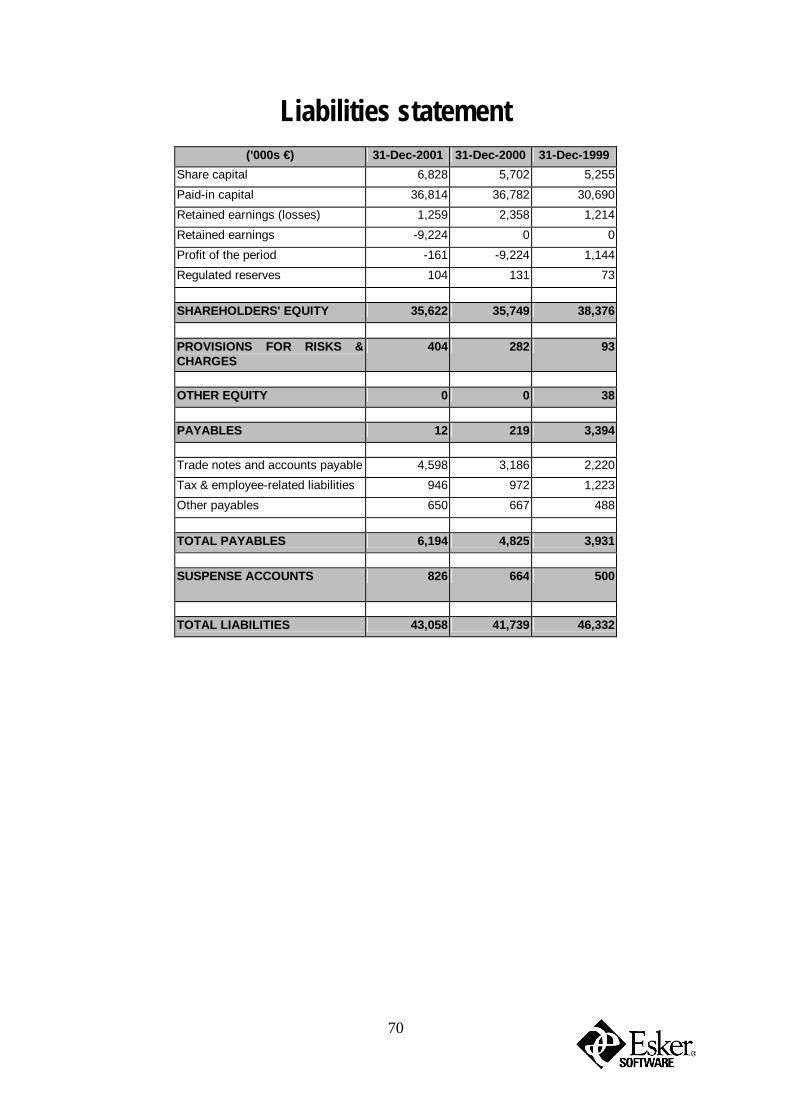
70
Liabilities statement
('000s €) 31-Dec-2001 31-Dec-2000 31-Dec-1999
Share capital 6,828 5,702 5,255
Paid-in capital 36,814 36,782 30,690
Retained earnings (losses) 1,259 2,358 1,214
Retained earnings -9,224 0 0
Profit of the period -161 -9,224 1,144
Regulated reserves 104 131 73
SHAREHOLDERS' EQUITY 35,622 35,749 38,376
PROVISIONS FOR RISKS & CHARGES
404 282 93
OTHER EQUITY 0 0 38
PAYABLES 12 219 3,394
Trade notes and accounts payable 4,598 3,186 2,220
Tax & employee-related liabilities 946 972 1,223
Other payables 650 667 488
TOTAL PAYABLES 6,194 4,825 3,931
SUSPENSE ACCOUNTS 826 664 500
TOTAL LIABILITIES 43,058 41,739 46,332

71
Income statement
('000s €) 2 001 2 000 1 999
Sales 9,867 9,422 10,932 Other operating income 2,158 1,062 920 OPERATING INCOME 12,026 10,484 11,852
SUPPLIES 5,066 5,788 5,095 GROSS MARGIN 6,960 4,696 6,757 Taxes 283 303 222 Personnel expenses 4,638 4,577 4,479 Allowances for depreciation and reserves 604 368 223 Other expenses 2,533 692 161 OTHER OPERATING EXPENSES 8,058 5,939 5,084
OPERATING PROFIT (LOSS) -1,098 -1,243 1,672 NET FINANCIAL EXPENSE 1,410 -7,438 889 PRETAX INCOME BEFORE EXTRAORDINARY ITEMS
312 -8,681 2,561
EXTRAORDINARY PROFIT (LOSS) -389 -1,039 -856 NET INCOME BEFORE TAX -77 -9,720 1,706 Corporate income tax 84 -497 562 NET INCOME -161 -9,224 1,144
Net income appropriation of the period
('000s €) 2001 Financial
Period (1) 2000 Financial
Period (2)
Profit of the period -160.74 -9,223.58
Allocation to the legal reserve n/a n/a
Special long-term capital gains reserve n/a n/a
Dividends n/a n/a
Retained earnings -160.74 -9,223.58
Total appropriation -160.74 -9,223.58
(1) Pursuant to the decision of the shareholders meeting of June 26, 2002 (2) Pursuant to the decision of the shareholder's meeting of June 18, 2001.

72
4.3 MANAGEMENT REPORT FOR PERIOD ENDING DEC. 31, 2001 Dear Shareholders, We have called this Annual Shareholders' Meeting to report to you on the activity of our company and the operational results for the period ending December 31, 2001. These results are submitted as the period's annual financial statements for your approval. We also submit the following items to your vote:
• a capital increase rendered necessary by the exercise of stock options during the period, • authorization to trade in the company's shares when deemed necessary, • a reserved capital increase in favor of the company employee savings plan (Plan d'Épargne Entreprise)
in compliance with the provisions of Article L 225-129 VII of the French Commercial Code, • implementation of a new stock option plan.
In their reports, the auditors provide you with all of the information concerning the fair presentation of the accounts presented to you. In turn, we will provide you with any details and additional information which you may deem useful. Included with this report, in accordance with Article 233-15 of the French Commercial Code, is a five-year financial summary of the company. Summarized as follows is various information as legally required. 1. CAPITAL INCREASE RENDERED NECESSARY BY THE EXERCISE OF STOCK OPTIONS The following stock option plans resulted in the exercise of options: • Plan implemented by the extraordinary shareholders' meetings of April 18, 1997 and July 19, 1996 (Plan
No. 2 and its extension) 11,390 options were exercised in 2001 at the following price: EUR 4.39 (FRF 28.80).
• Stock Option Plan resulting from the acquisition of V.S.I. Inc.
2,475 options were exercised in 2001 at the following price: EUR 3.82. When ESKER S.A. acquired V.S.I. Inc. on October 10, 2000, the stock option plan then in operation within this company was transformed into the ESKER S.A. stock option plan in accordance with the acquisition agreement (198,677 ESKER S.A options for 5,056,572 V.S.I. options)
In consequence, we propose that capital be increased from EUR 6,800,592 to EUR 6,828,322, which represents a capital increase through shares issued for cash of EUR 27,730, i.e. 13,865 fully paid up shares with a nominal value of EUR 2 per share, and share premium of EUR 31,732.66. Within the framework of this authorization, we request that you confer upon the Executive Board all powers to take any appropriate measures and decisions, to carry out the formalities that will ensure the capital increase, enter it on the record, and proceed with the corresponding modification of bylaws.

73
2. AUTHORIZATION TO TRADE IN THE COMPANY'S OWN SHARES It is proposed that you authorize the Executive Board to repurchase shares of the Company according to articles 225-209 of the French Commercial Code. The purpose of this authorization is as follows:
- Share price stabilization of the Company's shares, - Facilitation of financial operations or acquisitions of the company, with the thus acquired shares being
able, in part or their entirety, sold, retained, lent, transferred or exchanged, - Allotting shares to company employees, - Their cancellation within the maximum amount of 10% of the authorized capital.
The acquisition, sale, transfer or exchange of shares may be carried out by any means, and in particular the eventual use of derivatives. The maximum purchase price shall be EUR 100 per share, and the minimum sale price EUR 2. The maximum number of shares able to be acquired is limited to 10% of the authorized capital. This authorization will be granted until the Annual Shareholders' Meeting called to approve the financial statements for the period ending December 31, 2001. Your Meeting will grant to the Executive Board, all powers, with the ability to delegate this authority, to place market orders, conclude all agreements, carry out all formalities and filings with the appropriate entities. The Executive Board will inform the Annual Shareholders' Meeting of the transactions carried out in accordance to this authorization. Under the authorization granted by the Shareholders’ Meeting of June 18, 2001, It thereby acquired a total of 24,233 ESKER shares during 2001 for a total of EUR 118,048 (i.e. an average price per share of EUR 4.87), as summarized in the table below. As these shares were not destined for a specific use, they were recorded as fixed securities. In addition, the company canceled no shares during the period under review. The number of treasury shares held directly by the company on December 31, 2001 was 127,514 for an average unit cost price of 13.63 Euros. The company also acquired and sold ESKER shares within the context of a market making agreement concluded with the Fideuram Wargny company on July 1, 1998. The number of treasury shares held indirectly by the company on December 31, 2001 was 2,413. The company therefore held, on a direct or indirect basis, a total of 129,927 ESKER shares on December 31, 2001, i.e. 3.82% of the share capital on this date.
Summary of ESKER share acquisitions by month (2001)
Month Number Average price Total
Jan-01 0 - € - € Feb-01 0 - € - € Mar-01 0 - € - € Apr-01 3,065 5.40 € 16,566 € May-01 7,200 6.03 € 43,406 € Jun-01 4,908 5.89 € 28,914 € Jul-01 100 5.52 € 552 € Aug-01 0 - € - € Sep-01 5,350 2.54 € 13,592 € Oct-01 3,610 4.16 € 15,019 € Nov-01 0 - € - € Dec-01 0 - € - € TOTAL 24,233 4.87 € 118,048 €

74
3. CAPITAL INCREASE IN FAVOR OF THE COMPANY EMPLOYEES SAVINGS PLAN The Executive Board, in accordance with the provisions of law No. 2001-152 of February 19, 2001 concerning employee savings schemes modifying article L.225-129 of the French Commercial Code notes that any extraordinary Shareholders' Meeting which votes in favor of a capital increase must at the same time vote on a capital increase reserved to employees participating in the employee savings plan as provided for by article L.443-5 of the French Labor Law. In consequence, the Executive Board proposes that the shareholders' meeting increase the capital by an amount which may not exceed 1% of the share capital of the company on this day, by issuing, through one or several transactions, new shares for cash subscription; with the cancellation of the preferential subscription right of existing shareholders in favor of company employees participating in the ESKER employee savings plan (Plan d'Epargne Entreprise FCPE). 4. EMPLOYEE STOCK OWNERSHIP In accordance with the provisions of article L 225-102 of the French Commercial Code, we inform you that employee stock ownership, under the ESKER employee savings plan (Plan d'Epargne Entreprise) represented a total of EUR 26,265 as at 31.12.01 (i.e. 5,100 shares of ESKER S.A at EUR 5.15). On December 31, 2001, the ESKER employee savings plan included 2,890.81 shares of the ESKER FCPE fund with a nominal value per share of EUR 9.27, representing a total amount invested of EUR 26,801.44. This amount corresponds to:
• ESKER S.A shares: 5,100 shares with a total value of EUR 26,265, • Deposit & misc. funds: 458.04 Euros, • Accounts payable and receivable: 78.40 Euros.
The proportion of capital represented by shares held by employees of the company and affiliated companies as understood by article 225-180 of the French Commercial Code, within the framework of a collective investment scheme (employee savings plan, FCPE fund) on December 31, 2001 was 0.15%. 5. PRESENTATION OF CONSOLIDATED FINANCIAL STATEMENTS AND SUBSIDIARY OVERVIEW
5.1 GROUP STRUCTURE On December 31, 2001 the Group structure was as follows: NAME COUNTRY % control
ESKER SA France Parent Company ESKER Gmbh Germany 100% ESKER Ltd UK 100% ESKER Srl Italy 100% ESKER Iberica Sl Spain 99.80% ESKER Inc. USA 100% VSI Inc USA 100% ESKER Australia Pty Ltd Australia 100% INTERDOC, oy Finland 100%

75
5.2 CONSOLIDATED SALES Consolidated sales by activity breaks down as follows:
Activity 2001 ('000s €)
2000 ('000s €)
Product sales 27,294 23,898
Product upgrades and services 5,020 3,480
Total sales 32,314 27,378
Consolidated sales by region breaks down as follows:
COUNTRY/ 2001 2000 Change
REGION ('000s €) ('000s €) %
France 3,721 3,180 17%
Other European countries 8,307 9,416 -12%
USA / Canada / Latin America 18,999 13,904 37%
Australia / Asia 1,287 878 47%
Total sales 32,314 27,378 18%
The 2001 financial period was characterized by an 18% increase in consolidated book sales as follows:
- USA / Canada: + 37% - Europe: - 5% - Asia / Pacific: + 47%
Analysis of Group growth on a like-for-like basis In light of the acquisition carried out by the Group in 2000, and in order to ensure the comparability of Group financial data, we present below the key income statement figures restated on a like-for-like consolidation basis. Because information concerning balance sheet variations related to acquisitions has been presented in the different notes related to the specific items concerned, it has not been considered necessary to present a complete pro forma balance sheet, as this would not provide significant additional information.

76
In the following table, the financial data of VSI as from January 1st, 2000 have been added back.
2001 2000
('000s €)
Pro forma
Sales 32,314 31,308 Other income 219 99 Cost of sales -2,919 -2,995R&D expenses -6,797 -7,340Commercial charges -11,794 -12,619Marketing expenses -6,577 -6,618Administrative expenses -5,704 -6,613 Operating profit (loss) -1,258 -4,777 Financial profit 292 304 PRETAX INCOME BEFORE EXTRAORDINARY ITEMS
-966 -4,473
Extraordinary items -772 -1,064 Amortization of goodwill -274 -246Corporate income tax -182 134 NET INCOME -2,194 -5,648
Sales by product line
'000s € 2001 2000 (1) 2000
Amount % sales Amount % sales Amount % sales
Host access 19,041 59% 20,595 66% 20,595 75%
I.I.D. 13,273 41% 10,715 34% 6,783 25%
Total sales 32,314 100% 31,310 100% 27,378 100%
(1) Like-for-like basis: including total sales of V.S.I. for 2000
In 2001: • Host Access Product Sales Declined by 7.6% over the prior period. This line continues to represent the
major portion of Group sales (59%) • I.I.D. (Intelligent Information Delivery) products integrating fax servers registered a 23.9% increase in
sales, on a like-for-like basis. This product line now accounts for 41% of Group sales.

77
5.3 CONSOLIDATED RESULTS The key figures for this period are summarized below:
'000s € 2001 2000 1999 Sales 32,314 27,378 27,717Gross margin rate 91.0% 90.8% 93.1%Pretax income before extraordinary items
-966 -3,443 3,800
Net income -2,194 -5,154 2,271Self-financing -594 -2,578 3,468
5.4 REVIEW OF GROUP OPERATIONS 2001 saw the successful launch of the company's new product: Pulse (electronic document server). Sales generated by Pulse reached EUR 1,017,000 (not including hardware and related services), thereby helping to increase the I.I.D. product line's share of the company's sales (+ 30.5% compared to 2000) and representing 8% of the I.I.D. product line sales. Several versions of Pulse were developed during 2001 in order to increase its functions and adapt it to other types of clientele (major accounts using Lotus Notes, etc.). Strong investment was required to ensure the product's successful launch, generating an increase in the following: Research and Development expenses (+7% compared to 2000), Marketing expenses (+7%) and Commercial charges (+15%). An active search for partners was also begun in order to optimize the new product's marketing and performance. In terms of accounting, the period was marked by a rise of almost 72% in ESKERs pretax income before extraordinary items compared to the previous period, from –EUR 3,443,000 to –EUR 966,000. This was mainly due to the following: • the increase in sales (+18% compared with 2000), which made it possible to absorb a portion of the fixed
costs, • excellent management of fixed costs during the 2001 financial year, leading to a smaller increase than in
2000: - R&D department: +7% (compared with +50% in 2000), - Administrative department: +2% (compared with + 65% in 2000).
This was primarily due to the implementation of restructuring measures in the American facilities during 2001 (centralization of the numerous administrative, production and R&D facilities),
• the absence of costs connected with the group's external growth in 2001, The group's extraordinary items (-EUR 772,000 in 2001) rose by around 28%, and were comprised primarily of the following:
- EUR 280,000 for depreciation of self-held shares during the first quarter of 2001, - an extraordinary item of EUR 340,000, posted in 2001, to cover the costs generated by the
reorganization of the group's American operations. The group's net income also rose, from –EUR 5,154,000 to –EUR 2,194,000.

78
5.5 SUBSIDIARIES
The performance of subsidiaries in 2001 may be summarized as follows: • ESKER GmbH (Germany): Sales of the German subsidiary fell 21% in 2001, from EUR 2,293,000 to EUR 1,809,000. Despite a net reduction in extraordinary items, the subsidiary's profitability was again close to zero as the level of sales was insufficient to absorb fixed costs. • ESKER Ltd (UK): The U.K. subsidiary's sales remained steady compared with the previous period (EUR 4,519,000 compared to EUR 4,433,000 in 2000, i.e. +2%). However, profitability showed a threefold increase due to good management of fixed costs in 2001 and the fact that considerable expenses connected with the subsidiary in Abingdon, which was closed in 2000, were borne by the year 2000. As a result, net income was EUR 445,000 compared with EUR 161,000 in 2000. • ESKER Srl (Italy): Sales rose slightly in 2001, from EUR 806,000 compared with EUR 780,000 in 2000 (+3 %). The IID product line increased by 35% while the Host Access line fell 10%. A rise in hardware-related purchasing costs connected with the IID product line led to a decrease in the profit margin (57% instead of 68%). Despite better management of fixed costs, the subsidiary's profitability worsened, notably because of increased salary costs (appointment of the new director in 2001). As a result, net income was EUR –163,000 compared to EUR –45,000 in 2000. • ESKER Iberica Sl (Spain): Despite increased sales generated by the IID product line (+24%), the subsidiary's total sales fell (-15% compared with 2000) due to a sharp decline in the Host Access product line (-35%). The profit margin also decreased for the same reasons as those given for the Italian subsidiary. Consequently, and despite good management of fixed costs, profitability has suffered: net income was EUR –17,000 compared to EUR –7,000 in 2000. • ESKER Inc & VSI Inc (USA): The combined sales for the two entities reached EUR 20,835,000. On a like-for-like basis (i.e. including the VSI company in all of 2000), sales remained steady compared with the previous year (EUR 20,636,000). ESKER Inc. profit showed a strong improvement in 2001 with a loss of USD 551,000 (i.e. EUR 615,000 compared to -EUR 3,286,000 in 2000). For this reason, we should mention that considerable restructuring had been carried out in the United States during 2000. For the 2001 financial period, VSI registered a net loss of EUR 596,000. The American subsidiaries have been undergoing a new restructuring operation since the end of 2001. Costs pertaining to this restructuring, and posted in 2001 in the ESKER Inc and VSI Inc corporate financial statements, account for EUR 343,000. • ESKER Australia Pty Ltd (Australia): The 2001 financial period was marked by a sharp rise in sales (+48%): the IID product line accounted for 60% of the subsidiary's sales (an increase of 145%). The profit margin remained steady in 2001 (64% in 2001 compared to 67% in 2000). Despite increased sales, profitability fell due to increased salary costs (sales commission) and the amortization of the balance of goodwill acquired when the company was created (-EUR 180,000). Net income was EUR –479,000 compared with EUR –378,000 in 2000.

79
5.6 GROUP TRENDS AND OUTLOOK
2002 will provide an opportunity for ESKER to capitalize on the technical and commercial investments carried out in 2001. New products will benefit in particular from the implementation of a new marketing strategy developed and tested in 2001. This strategy uses a sales presentation which targets a company's decision-making managers by developing the theme of a link between a return on investment and the use of ESKER products. A rapid and sustained transition from the older Host Access product range to the new electronic document server products should ensure a continued and substantial increase in sales. Efforts to reduce the group's fixed cost structure in 2001 should also contribute to the adjustment of consolidated accounts. However, the state of the world economy and, in particular, the American economy, which accounts for more than half the Group sales, may delay the worldwide implementation of this strategy. ESKER is nevertheless prepared to deal with the situation and confident in its ability to do so. A near return to the black for accounts and the net creation of cash through operations in 2001 are indications of a return to financial stability. Moreover, the Group shareholders' equity, its freedom from debt and a healthy cash surplus are additional guarantees of ESKER's ability to absorb the effect of unfavorable economic conditions.
5.7 SIGNIFICANT EVENTS AFTER YEAR-END No significant events have occurred between the year-end and the writing of this report. 6 PRESENTATION OF THE CORPORATE FINANCIAL STATEMENTS OF ESKER S.A. The financial statements presented below are based on the same methods of valuation as those used for the prior financial period. The accounting methods have not been modified.
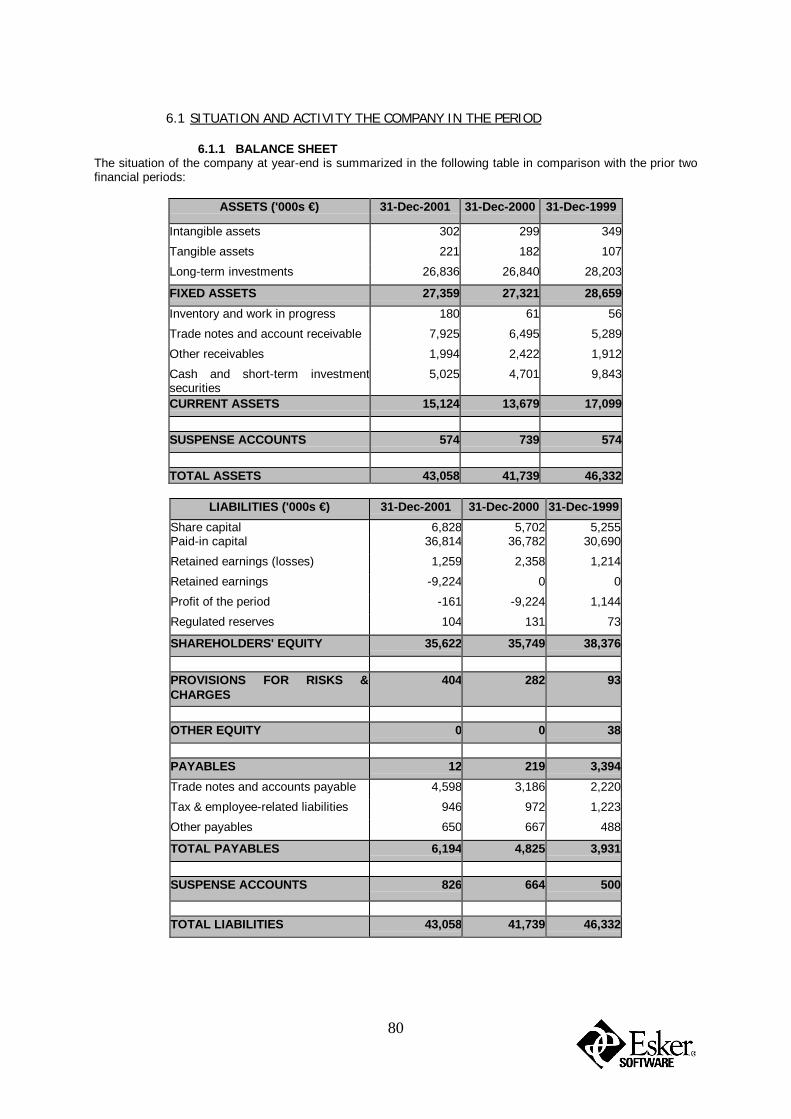
80
6.1 SITUATION AND ACTIVITY THE COMPANY IN THE PERIOD
6.1.1 BALANCE SHEET
The situation of the company at year-end is summarized in the following table in comparison with the prior two financial periods:
ASSETS ('000s €) 31-Dec-2001 31-Dec-2000 31-Dec-1999
Intangible assets 302 299 349
Tangible assets 221 182 107
Long-term investments 26,836 26,840 28,203
FIXED ASSETS 27,359 27,321 28,659
Inventory and work in progress 180 61 56
Trade notes and account receivable 7,925 6,495 5,289
Other receivables 1,994 2,422 1,912
Cash and short-term investment securities
5,025 4,701 9,843
CURRENT ASSETS 15,124 13,679 17,099
SUSPENSE ACCOUNTS 574 739 574
TOTAL ASSETS 43,058 41,739 46,332
LIABILITIES ('000s €) 31-Dec-2001 31-Dec-2000 31-Dec-1999
Share capital 6,828 5,702 5,255Paid-in capital 36,814 36,782 30,690
Retained earnings (losses) 1,259 2,358 1,214
Retained earnings -9,224 0 0
Profit of the period -161 -9,224 1,144
Regulated reserves 104 131 73
SHAREHOLDERS' EQUITY 35,622 35,749 38,376
PROVISIONS FOR RISKS & CHARGES
404 282 93
OTHER EQUITY 0 0 38
PAYABLES 12 219 3,394
Trade notes and accounts payable 4,598 3,186 2,220
Tax & employee-related liabilities 946 972 1,223
Other payables 650 667 488
TOTAL PAYABLES 6,194 4,825 3,931
SUSPENSE ACCOUNTS 826 664 500
TOTAL LIABILITIES 43,058 41,739 46,332

81
CHANGES IN SHAREHOLDERS' EQUITY They originate from the capital increase pursuant to the exercise of options in 2001 (cf. section 1 above) Changes in the shareholders' equity of the parent company have been as follows:
('000s €) 2001
AT THE BEGINNING OF THE PERIOD 35,749CAPITAL INCREASE 1,127 Conversion of the capital into Euro 1,099 Exercise of stock options 28INCREASE IN PAID CAPITAL 32 Exercise of stock options 32RESERVES -1,099 Withdrawal from reserves for capital
increases -1,099
INCOME OF THE PERIOD -161CHANGES IN REGULATED PROVISIONS -26 SHAREHOLDERS' EQUITY AT CLOSE OF PERIOD 35,622
COFACE grants COFACE (the French Export Credits Guarantee Department) had granted an interim award of EUR 182,000 to help finance prospecting expenses in the "China / Korea / Japan / Taiwan" region. This aid was to be repaid over a period of four years from May 1, 1997, according to revenue generated by the region. As no sales were turned over in this region during the abovementioned period, and in view of the statements drawn up by ourselves, COFACE decided to release us from the obligation to repay the said interim award. In consequence, EUR 182,000 was recorded under income in the 2001 financial period.
6.1.2 INCOME STATEMENT
Key items of the income statement, compared with the prior two financial periods, are summarized below.
('000s €) 2 001 2 000 1 999
Sales 9,867 9,422 10,932
Other operating income 2,158 1,062 920
OPERATING INCOME 12,026 10,484 11,852
SUPPLIES 5,066 5,788 5,095
GROSS MARGIN 6,960 4,696 6,757
Taxes 283 303 222
Personnel expenses 4,638 4,577 4,479
Allowances for depreciation and reserves 604 368 223
Other expenses 2,533 692 161
OTHER OPERATING EXPENSES 8,058 5,939 5,084 OPERATING PROFIT (LOSS) -1,098 -1,243 1,672
NET FINANCIAL EXPENSE 1,410 -7,438 889
PRETAX INCOME BEFORE EXTRAORDINARY ITEMS
312 -8,681 2,561
EXTRAORDINARY PROFIT (LOSS) -389 -1,039 -856
NET INCOME BEFORE TAX -77 -9,720 1,706
Corporate income tax 84 -497 562
NET INCOME -161 -9,224 1,144

82
Sales for the year under review totaled EUR 9,867,000 compared to EUR 9,422,000 for the prior period, representing an increase of 4.73%. Sales break down as follows:
Product
sales
Services Total
France 3,316,866 192,481 3,509,347
Abroad 4,944,779 1,413,134 6,357,913
TOTAL 8,261,645 1,605,615 9,867,260
The gross margin increased by 48% to EUR 6,960,000 compared to EUR 4,696,000 in 2000. This was due to:
• good management of fixed costs, • increased sales linked to the Group subsidiaries' cross-charging policy (products, marketing
fees, etc.), with transfer prices adjusted upwards in 2001 to take account of the economic reality of inter-subsidiary operations.
Personnel costs, including social security contributions, remained relatively stable (EUR 4,638,000 in 2001 compared with EUR 4,577,000 in 2000), with an increase in the average workforce from 88 employees in 2000 to 85 employees in 2001. Allowances for depreciations and provisions totaled EUR 604,000 compared to EUR 368,000 in 2000. This increase was explained by a provision for depreciation of part of the ESKER Australia accounts receivable made during the period up for an amount of up to EUR 250,000. Despite a considerable increase in royalties connected with fax sales and invoiced to our American subsidiaries, the overall operating costs generated an operating deficit of EUR 1,098,000, which was slightly lower than for the prior financial period (-EUR 1,243,000 in 2000). The financial profit was EUR 1,410,000 compared to a financial profit of EUR –7,438,000 in 2000. ESKER S.A received a total of EUR 1,186,000 in dividends from its U.K. and German subsidiaries. In addition, it should be noted that the 2000 financial period was considerably affected by the allocation of EUR 7,927,000 to a provision for depreciation of ESKER Inc. shares (American subsidiary). All the abovementioned factors brought about a marked turnaround in pre-tax income before extraordinary items: EUR 312,000 for the 2001 financial period compared to –EUR 8,681,000 in 2000. Extraordinary profit also improved (-EUR 389,000 compared to –EUR 1,039,000 in 2000) and included, notably, a provision for depreciation of treasury shares of EUR 410 ,000. Corporate income tax for the period totaled EUR 84,000, broken down as follows:
• Research tax credit 2001: EUR 225,000 • Carry-back adjustment
wrongly recorded in 2000: EUR –309,000 Total: EUR -84,000
On the basis of total income and expenses, the period under review recorded a net loss after tax of EUR 161,000 compared to a loss of EUR 9,224,000 for the 2000 financial period.
6.2 RESEARCH AND DEVELOPMENT The company continued to pursue its R&D efforts, with investments totaling EUR 6.8 million (compared with EUR 6.4 million in 2000), representing 21% of consolidated sales in 2001. R&D costs are recorded under operating expenses.

83
6.3 ALLOTMENT OF OPTIONS FOR THE SUBSCRIPTION AND PURCHASE OF SHARES In accordance with article L.225-184 of French commercial law, the Executive Board drew up a special report on stock options and purchase options issued and exercised during the 2001 financial period, as well as the balance of options still to be exercised on December 31, 2001. The table below provides a summary of all stock options and purchase options issued by the company during the 2001 financial period:
Allotment date
Purchase options
Stock options Number Duration Price (in Euros)
25/01/2001 - 201,612 201,612 5 years 7.77
17/04/2001 69,600 119,912 189,512 5 years 5.02
16/07/2001 - 33,916 33,916 5 years 4.91
12/09/2001 - 10,000 10,000 5 years 4.33
28/12/2001 13,500 54,408 67,908 5 years 5.16
Total 83,100 419,848 502,948
6.4 ANALYSIS OF SHARE CAPITAL
In accordance with the provisions of the French law No. 85-705 of July 12, 1985, the record of attendance, for both this meeting and the meeting which approved the financial statements of the prior year, were filed with the committee of the meeting, it being specified that these documents, presenting the authorized capital, enable you to note the change from one period to another. On December 31, 2001, the record of registered shareholders with Crédit Lyonnais indicated shareholdings:
• Shareholdings exceeding two-thirds of the authorized capital: none • Shareholdings exceeding half the authorized capital: none • Shareholdings exceeding one-third the authorized capital: none • Shareholdings exceeding one-fifth of the authorized capital: none • Shareholdings exceeding one-tenth the authorized capital: none • Shareholdings exceeding one twentieth of the authorized capital: cf. table below
Shareholders
Number of shares
% of capital % of voting rights
Jean-Michel Bérard 301,820 8.88% 9.22%
Thomas Wolfe 279,095 8.21% 8.53%
Russell Teubner 233,000 6.85% 7.12%
David Droman 195,647 5.75% 5.98%
Total 1,009,562 29.69% 30.85%
On December 31, 2001, the company held 127,514 treasury shares, (77,856 shares of which were registered shares), representing 3.75% of the share capital. On December 31, 2001, the share capital of the company was EUR 6,800,592, i.e. 3,400,296 shares with a nominal value of EUR 2 per share.

84
6.5 CORPORATE APPOINTMENTS HELD BY ESKER S.A. MANAGEMENT PERSONNEL In accordance with article L 225-102-1 al. 3 of French commercial law, we present the following list of corporate appointments or responsibilities undertaken by each of the ESKER S.A. management personnel during the period under review
Name Appointment or responsibilities
within ESKER S.A.
OTHER CORPORATE APPOINTMENTS
Company name Nationality Appointment/Post Date of appointme
nt
Term of appointmen
t
Marie-Claude Bernal
Chairman of the Supervisory Board
ILOG S.A. French Board member 2000 2002
ESKER SA French Chairman of the Supervisory Board
2002 2006
K. Beauvillain Vice-president of the Supervisory Board
ALPHA MOS SA French CEO 1998 2009
ARES GROUPE SA French CEO 1999 2005
ESKER SA French Vice-president of the Supervisory Board
1998 2004
MALAAH SA French Chairman of the Supervisory Board
2002 2006
LAFAYETTE FUND INT SA French CEO 1997 2003
INFOFLASH SA French CEO 1997 2002
PICIS US CEO 1998 2002
KB CONSEILS SARL French Manager 1997
Vice-president President R.Teubner Member of the
Supervisory Board ESKER SA French Member of the
Supervisory Board 2000 2005
Southwest Bancorp USA Member of the management team
TMSSequoia USA Member of the management team
Federal Reserve Bank of Oklahoma City
USA Member of the management team
T. Wolfe Member of the Supervisory Board
ESKER SA French Member of the Supervisory Board
1999 2005
JM BERARD Chairman of the Executive Board
ESKER SA French Chairman of the Executive Board
2000 2002
D. SPEER Board member ESKER SA French Board member 2000 2001

85
6.6 SALARIES & BENEFITS IN KIND PAID TO CORPORATE APPOINTEES
Corporate appointee
Appointment/Responsibilities within
ESKER S.A.
Remuneration for 2001
Company paying remuneration
Nature of remuneration
Salary Director's fees
M.C. BERNAL Chairman of the Supervisory Board
45,000 € ESKER S.A 39,000 € 6,000 €
K. BEAUVILLAIN Vice-president of the Supervisory Board
4,573 € ESKER S.A 4,573 € 3,000 €
T. WOLFE Member of the Supervisory Board
- €
- - €
- €
R. TEUBNER Member of the Supervisory Board
- €
- - €
- €
JM BERARD Chairman of the Executive Board
79,578 € ESKER S.A 79,578 € - €
D. SPEER Board member 271,813 € ESKER INC (USA) 271,813 € - €
In accordance with article L 225-102-1 al. 1 of French commercial law, we present the following table of salaries paid to each ESKER S.A. corporate appointee.
6.7 PROPOSITION FOR THE IMPLEMENTATION OF A NEW STOCK OPTION PLAN The Executive Board proposes to set up a new stock option plan to be submitted to a vote at the next General Meeting. This plan is intended for ESKER group employees and will give them the right to subscribe for 160.000 new ESKER shares. The Executive Board justifies the implementation of the new plan on the grounds that a large number of options can no longer be allotted on the basis of the plan adopted by the special shareholders' meeting on January 5, 2000, which made possible the allocation of 170,000 warrant plans (BSPCE) for the benefit of French employees. As a result of the departure of some of these employees and the start of repricing operations for others, there are 158,276 allottable options. However, the legal framework governing the allotment of warrant shares does not allow the company to allocate the balance of these options (waiting time). The Executive Board therefore deems it appropriate to submit a new stock option plan to the General Meeting according to the following terms and conditions:
• Number of options: 160,000 • Share subscription price: to be set by the Executive Board at a price higher than or equal to the
minimum price during the period as determined by article 225-179 of French commercial law, • The options must be exercised within a maximum of five years from the date on which they are
granted, • The General Meeting shall decide to relinquish shareholders' stock rights for the new shares and
to reserve this subscription for optionees designated by the Executive Board, • The Executive Board shall be empowered, within the legal limits and for a period of 38 months
from this General Meeting, to: - lay down the conditions to be fulfilled by optionees in order to exercise options; - determine all the terms and conditions of the operation, and in particular the choice of
optionees; - fix the prices and conditions for granting the options; - stipulate the period of implementation; - decide the conditions in which the price or the number of options to be bought can be
adjusted in accordance with the conditions provided for in article 225-181 of French commercial law.

86
• The Executive Board must report to the Ordinary General Meeting on the operations carried out within the framework of this authorization.
6.8 NET INCOME APPROPRIATION PROPOSAL As can be noted, after deduction of all expenses and allowances for depreciation, the financial statements here presented show a loss of EUR 160,738.56. We propose that this amount be ascribed as follows:
2001 Financial Period (in
Euros) Profit of the period -160,738.56 Allocation to the legal reserve - Special long-term capital gains reserve - Dividends - Retained earnings -160,738.56 Total appropriation -160,738.56
6.9 DIVIDENDS DISTRIBUTED IN PRIOR PERIODS In accordance with the provisions of article 243 bis of the French general tax code, we inform you that dividends distributed for the previous three financial periods were as follows: NONE

87
6.10 NON-DEDUCTIBLE EXPENSES In accordance with the provisions of article 223 of the French general tax code, we inform you that for the period under review the financial statements of the period include expenses not deductible from the tax income under article 39-4 of this code totaling: EUR 3,498. CONCLUSION We inform you that no Supervisory Board member’s appointment have expired. We hope that you will approve these propositions and the management of the Executive Board for the financial period ending DECEMBER 31, 2001. THE EXECUTIVE BOARD

88
FIVE-YEAR FINANCIAL SUMMARY (Notes to the management report)
Nature of indications (Euros) 31/12/97 31/12/98 31/12/99 31/12/00 31/12/01
1/ SHARE CAPITAL BY YEAR-END a/ Share capital 3,364,812 4,004,512 5,255,412 5,661,481 6,800,592 b/ Number of common shares 2,006,520 2,387,989 3,133,931 3,376,080 3,400,296 c/ Number of existing preferred shares (without voting rights) d/ Maximum number of future shares to be issued - by conversion of bonds - by exercise of warrants 153,460 102,741 351,299 525,937 732,195 2/ OPERATIONS AND INCOME FOR THE YEAR a/ Sales ex-VAT 7,467,420 9,167,585 10,931,962 9,421,799 9,867,260 b/ Income pre-tax, employee profit-sharing, depreciation and provisions 478,729 337,255 1,929,964 -416,315 1,052,033 c/ Corporate income tax -133,168 29,552 561,586 -496,798 83,603 d/ Profit-sharing for the period 0 0 0 0 e/ Income after tax, employee profit-sharing, depreciation and provisions 535,564 285,098 1,143,976 -9,223,584 -160,738 f/ Dividends paid out (proposal for period N) 0 0 0 0 0 3/ EARNINGS PER SHARE a/ Earnings after-tax, employee profit-sharing but before depreciation and provisions
0.30 0.13 0.44 0.02 0.28 e/ Income after tax, employee profit-sharing, depreciation and provisions 0.27 0.12 0.37 -2.73 -0.05 c/ Net payout (or proposal) 0 0 0 0 4/ PERSONNEL a/ Average number of employees for the period 58 74 81 88 82 b/ Payroll 2,152,459 2,844,290 3,158,758 3,152,958 3,255,279 c/ Amount paid out in benefits 889,970 1,189,873 1,320,012 1,423,548 1,382,773

89
4.4 Subsidiaries and Equity Interests
Shareholders Ownership Book value
Book value Loans
Guarantees and
sureties Sales Net income Dividends received
equity % of shares of shares granted granted for last for last by
company
SUBSIDIARIES AND EQUITY INTERESTS owned owned by parent by parent financial financial
during financial
year (Gross) (Net) company company year year EUROS EUROS EUROS EUROS EUROS EUROS EUROS EUROS EUROS A. DETAILED INFORMATION CONCERNING SUBSIDIARIES AND EQUITY INTERESTS 1. Subsidiaries (more than 50% of the capital owned) ESKER Inc 330,533 100% 26,838,141 18,910,792 535,534 - 15,492,081 -614,961 - VSI 537,943 100% 6,550,914 6,550,914 - - 5,342,855 -596,289 ESKER Gmbh 37,129 100% 25,899 25,899 - - 1,809,755 8,713 ESKER Ltd 1,352,201 100% 135 135 - - 4,518,844 445,196 - ESKER SRL -37,277 100% 9,995 9,995 - - 806,725 -162,595 - ESKER IBERICA 239,734 99.80% 3,087 3,087 - - 731,782 -17,557 - ESKER Australia Pty Ltd (1) -842,226 100% 711,784 462,659 - - 1,293,955 -479,489 - ESKER Asia Pte Ltd (2) 100% 62,656 0 - - - (2) - B. INFORMATION RELATING TO OTHER SUBSIDIARIES AND EQUITY INTERESTS 1. French interests (0 to 50% of the capital owned) (3) 14.50% 5,526 0
Approx. 163 K€ (2)
SCREENER SARL (1) The capital of the Australian subsidiary includes the portion of capital not paid up (EUR 462,660). (2) The ESKER ASIA Pty Ltd subsidiary has been inactive since December 31, 1997. (3) The SCREENER SARL company has been in official receivership since June 22, 1998.

90
4.4 SPECIAL REPORT CONCERNING OPTIONS – SHAREHOLDERS MEETING OF JUNE 26, 2002 (FINANCIAL PERIOD ENDING DECEMBER 31, 2001)
Dear Shareholders, In accordance with article L.225-184 of French commercial law, we are writing to give you an account of the operations carried out pursuant to the terms of articles L.225-177 to L.225-186 of the aforementioned laws relating to options for purchase or subscription.
1. OPTIONS ISSUED BY THE COMPANY: GENERAL INFORMATION
1.1. OPTIONS ISSUED DURING THE PERIOD UNDER REVIEW IN COMPLIANCE WITH
ARTICLES L.225-177 TO L.225-186 OF FRENCH COMMERCIAL LAW
Allotment date Purchase options
Stock options Number Duration Price
25/01/01 - 201,662 201,662 5 years 7.77 € 17/04/01 69,600 119,912 189,512 5 years 5.02 € 16/07/01 - 33,916 33,916 5 years 4.91 € 12/09/01 - 10,000 10,000 5 years 4.33 € 28/12/01 13,500 54,408 67,908 5 years 5.16 €
Total 83,100 419,898 502,998
1.2. OPTIONS EXERCISED DURING THE PERIOD UNDER REVIEW
Allotment date Number of options
exercised Options for purchase or subscription
Exercise date
Price
01/03/1996 5,000 S 08/11/2001 4.39 € 01/02/1997 6,390 S 19/01/2001 4.39 €
10/10/2000 (1) 2,475 S 27/06/2001 3.82 € 23/04/1997 5,000 P 31/05/2001 4.39 €
Total 18,865
1.3. OPTIONS ISSUED BEFORE YEAR-END AND NOT YET EXERCISED
Allotment date Purchase options
Stock options
Number Duration Price
03/01/1997 - 4,160 4,160 5 years 4.39 € 05/03/1997 - 1,250 1,250 5 years 4.39 € 21/04/1997 3,063 225 3,288 5 years 4.39 € 19/12/1997 11,270 - 11,270 5 years 14.04 € 01/09/1997 320 2,500 2,820 5 years 36.59 € 10/02/1999 2,226 - 2,226 5 years 20.35 € 09/04/1999 1,100 1,500 2,600 5 years 20.98 € 18/06/1999 500 4,028 4,528 5 years 19.10 € 31/08/1999 - 30,850 30,850 5 years 25.62 € 15/11/1999 - 2,800 2,800 5 years 30.00 € 10/01/2000 - 11,724 11,724 5 years 40.06 € 16/06/2000 - 2,250 2,250 5 years 27.25 € 10/10/2000 - 196,202 196,202 (1) (1) 13/10/2000 6,400 1,200 7,600 5 years 12.56 € 13/10/2000 - 61,300 61,300 5 years 17.93 € 25/01/2001 - 196,934 196,934 5 years 7.77 € 17/04/2001 69,600 119,412 189,012 5 years 5.02 €

91
Allotment date Purchase
options Stock options
Number Duration Price
16/07/2001 - 31,452 31,452 5 years 4.91 € 12/09/2001 - 10,000 10,000 5 years 4.33 € 28/12/2001 13,500 54,408 67,908 5 years 5.16 €
Total 107,979 732,195 840,174
(1) Options held by V.S.I. Inc. employees. When V.S.I. Inc was acquired on October 10, 2000, the stock option plan then in operation was converted to the ESKER S.A. stock option plan (198,677 ESKER S.A options for 5,056,572 V.S.I. options) in accordance with the acquisition agreement. The terms and conditions for the exercise of stock options remain the same as those in the initial plan (variable duration, exercise price between EUR 0.29 and EUR 23.45).
2. OPTIONS GRANTED TO THE COMPANY'S CORPORATE APPOINTEES DURING
THE PERIOD UNDER REVIEW Listed below are the number, expiry date and price of options for purchase or subscription which were granted to each company appointee during the period, commensurate with their appointments and responsibilities within the company, by the company itself, companies affiliated with it as defined by article L225-180 of French commercial law, and companies in which it has a controlling stake as defined by article L.233-16 of French commercial law.
2.1. OPTIONS GRANTED TO THE COMPANY'S CORPORATE APPOINTEES DURING THE PERIOD UNDER REVIEW
Allotment date
Appointee's name
Appointment and responsibilities within the company
No. of options granted
Options for purchase or subscription
Expiry date
Price
25/01/2001 D. SPEER Board member 43,000 S 24/01/2006 EUR 7.77
Jean-Michel BERARD, Chairman of the Board of Directors, is not the beneficiary of any stock option plan.
2.2. OPTIONS GRANTED TO THE COMPANY'S CORPORATE APPOINTEES DURING THE PERIOD UNDER REVIEW BY ANY ONE OF THE AFFILIATED COMPANIES AS DEFINED BY ARTICLE L. 225-180
NONE
2.3. OPTIONS GRANTED TO THE COMPANY'S CORPORATE APPOINTEES DURING THE PERIOD UNDER REVIEW BY OTHER COMPANIES IN WHICH IT HAS A CONTROLLING STAKE AS DEFINED BY ARTICLE L. 233-16 OF FRENCH COMMERCIAL LAW
NONE
3. OPTIONS EXERCISED BY THE COMPANY'S CORPORATE APPOINTEES DURING THE PERIOD UNDER REVIEW
Listed below are the number, price of shares subscribed to or purchased during the period by the company's corporate appointees by exercising one or more options held within the company, affiliated companies as defined by article L225-180, and controlled companies as defined by article L.225-16 of French commercial law.

92
3.1. OPTIONS GRANTED BY THE COMPANY AND EXERCISED DURING THE PERIOD UNDER REVIEW
NONE
3.2. OPTIONS GRANTED BY AN AFFILIATED COMPANY AS DEFINED BY ARTICLE L. 225-180 OF FRENCH COMMERCIAL LAW, AND EXERCISED DURING THE PERIOD UNDER REVIEW
NONE
3.3. OPTIONS GRANTED BY AN AFFILIATED COMPANY AS DEFINED BY ARTICLE L. 233-16 OF FRENCH COMMERCIAL LAW, AND EXERCISED DURING THE PERIOD UNDER REVIEW
NONE
4. OPTIONS GRANTED BY THE COMPANY, AND OPTIONS GRANTED BY
COMPANIES OR GROUPS AFFILIATED TO THE COMPANY AS DEFINED BY ARTICLE L. 225-180, TO THE TEN NON-MANAGEMENT EMPLOYEES OF THE COMPANY WHO THEREBY RECEIVED THE HIGHEST NUMBER OF OPTIONS DURING THE PERIOD UNDER REVIEW
The table below lists the options granted during the period, by the company or by the companies and groups affiliated with it in accordance with the terms and conditions laid down by article L.225-180 of French commercial LAW, to each of the company's ten non-management employees with the highest number of options granted and of shares purchased in this manner. The company issuing the options is always ESKER S.A.
è ALLOCATION TO ESKER S.A. EMPLOYEES (France)
Employee's name Allotment date
No. of options granted
Options for purchase or subscription
Expiry date
Price
BERARD J.J. 17/04/2001 35,500 P 16/04/2006 5.02 €
OLIVIER E. 17/04/2001 25,500 P 16/04/2006 5.02 €
THOMAS E. 17/04/2001 10,500 S 16/04/2006 5.02 €
GUIGNABAUDET F. 17/04/2001 7,500 S 16/04/2006 5.02 €
CHALLANCIN A. 17/04/2001 7,000 S 16/04/2006 5.02 €
MASCHER L. 17/04/2001 5,260 S 16/04/2006 5.02 €
GUYENOT M. 17/04/2001 2,512 S 16/04/2006 5.02 €
GACHES O. 17/04/2001 2,500 S 16/04/2006 5.02 €
REPETTI J.Y. 17/04/2001 2,436 S 16/04/2006 5.02 €
GRAND CLEMENT A. 17/04/2001 2,378 S 16/04/2006 5.02 €
TOTAL 101,086

93
è ALLOCATION TO GROUP EMPLOYEES (EXCLUDING ESKER S.A.)
Employee's name
Name of employing company
Allotment date
No. of options granted
Total allocated per
employee
Options for purchase or subscription
Expiry date
Price (€)
DIN B. ESKER U.K. 17/04/2001 17,500 S 16/04/2006 5.02 € 16/07/2001 5,000 S 15/07/2006 4.91 € 28/12/2001 5,000 27,500 S 27/12/2006 5.16 € WEATHERBY L. ESKER Inc. 25/01/2001 25,000 25,000 S 24/01/2006 7.77 € BAXTER M. V.S.I. Inc. 25/01/2001 15,000 S 24/01/2006 7.77 € 16/07/2001 10,000 25,000 S 15/07/2006 4.91 € RIEMAN P. ESKER Inc. 17/04/2001 10,000 S 16/04/2006 5.02 € 12/09/2001 10,000 20,000 S 11/09/2006 4.33 € WINGER L. ESKER Inc. 25/01/2001 7,500 S 24/01/2006 7.77 € 17/04/2001 5,000 12,500 S 16/04/2006 5.02 € ISHMAEL M. ESKER Inc. 28/12/2001 10,000 10,000 S 27/12/2006 5.16 € WENZEL M. ESKER Inc. 25/01/2001 10,000 10,000 S 24/01/2006 7.77 € CASTLE B. V.S.I. Inc. 28/12/2001 6,000 S 27/12/2006 5.16 € 25/01/2001 4,000 10,000 S 24/01/2006 7.77 € BROADWAY S. ESKER Inc. 25/01/2001 9,325 9,325 S 24/01/2006 7.77 € VICKERY S. ESKER UK 28/12/2001 7,500 7,500 S 27/12/2006 7.77 €
TOTAL 156,825 156,825
5. OPTIONS GRANTED TO COMPANY EMPLOYEES BY THE COMPANY AND BY AFFILIATED COMPANIES AS DEFINED BY ARTICLE L. 225-180 OF FRENCH COMMERCIAL LAW, AND EXERCISED BY THE TEN NON-MANAGEMENT EMPLOYEES WITH THE HIGHEST NUMBER OF SHARES PURCHASED AND SUBSCRIBED TO IN THIS MANNER
The table below lists the options granted by the company, or by the companies or groups affiliated with it in accordance with the terms and conditions laid down by article L.225-180 of French commercial LAW, to each the company's ten non-management employees with the greatest number of options granted and shares purchased in this way and exercised during the period.
Employee's name
Issuing company or group
Number of options exercised
Options for purchase or subscription
Allotment date
Price
Bayle P. ESKER S.A 6,390 S 01/02/1997 4.39 € Hawksley L. ESKER S.A 5,000 P 23/04/1997 4.39 € Berard J.J. ESKER S.A 4,000 S 01/03/1996 4.39 € Himmelright R. ESKER S.A 2,475 S 10/10/2000 3.82 € Mascher L. ESKER S.A 1,000 S 01/03/1996 4.39 € TOTAL 18,865
No other options were exercised during 2001.
The Executive Board

94
4.5 REPORT OF THE AUDITORS ON THE PARENT COMPANY FINANCIAL STATEMENTS OF ESKER SA
GENERAL REPORT
AUDITORS' REPORT
Annual Financial Statements
Period ended December 31, 2001
In accordance with the terms of our appointment by your shareholders' meeting, we hereby present our report concerning the period ended December 31, 2001, concerning:
- the audit of the accompanying annual financial statements of ESKER prepared in Euros,
- specific verifications and information as required by law.
The financial statements have been approved by the Executive Board. It is our duty to express an opinion on these financial statements on the basis of our audit.
1. OPINION ON THE FINANCIAL STATEMENTS
We have conducted our audit in accordance with generally accepted auditing standards. These standards call for the implementation of due diligence to obtain reasonable assurance that the annual financial statements do not include any important discrepancies. An audit includes examining, on a test basis, evidence supporting the amounts and disclosures in the consolidated financial statements. An audit also includes assessing the accounting principles used and significant estimates made by management, as well as evaluating the overall presentation of the consolidated financial statements. We believe that our audit provides a reasonable basis for our opinion.
In our opinion, the annual financial statements, prepared according to accounting practices generally accepted in France, present fairly the results of the operations of the period under review as well as the net worth, assets and liabilities of the company at the end of this period.
2. SPECIFIC VERIFICATIONS AND INFORMATION
In accordance with the standards of our profession, we have also carried out specific verifications provided for by law.
We have no comment to make regarding the sincerity and conformity with the annual financial statements of the information contained in the report of the Executive Board and the documents sent to shareholders concerning the financial situation and annual financial statements.
As required by law, we have assured that the information concerning the identity of the holders of capital and voting rights have been communicated to you in the management report.
Villeurbanne, June 10, 2002
The Auditors
Yves FOURNAND DELOITTE TOUCHE TOHMATSU
Dominique VALETTE

95
SPECIAL REPORT OF THE AUDITORS
SPECIAL REPORT OF THE AUDITORS
ON REGULATED AGREEMENTS
Period ended December 31, 2001
As the Auditors of your company, we hereby report to you on regulated agreements.
It is not our responsibility to identify the existence of agreements, but to inform you, on the basis of the information you have provided us, of the main characteristics and terms of the agreements brought to our attention, without being required to provide an opinion concerning their utility or justification. It is your responsibility, according to the terms of article 117 of the decree of March 23, 1967, to evaluate the interest in concluding these agreements in view of their approval.
Agreements authorized during the period
We hereby inform you that we have not been given notice of any agreement concluded during the period and to which article L.225-86 of the French commercial applies.
Agreements approved during prior periods and which remained in force during the period under review
In addition, in accordance with the decree of March 23, 1967, we were informed that the following agreements, concluded in prior financial periods, remained in force in the period under review.
1. With ESKER Inc.
1.1. Nature and purpose: Guarantee of ESKER Inc. financial commitments.
Procedures: Guarantee granted by your company in favor of Home National Bank for a credit line of USD 750,078 granted by this financial institution to ESKER Inc.
This credit line was repaid and the guarantee was withdrawn in 2001.
1.2. Nature and purpose: Advance to ESKER Inc.
Procedures: Advance on December 31, 2001 of EUR 1,687,710 (USD 1,487,378).
Subject to interest of 6.26% corresponding to total financial income of EUR 104.535 for the financial period.
2. With INTERDOC.OY
Nature and purpose: Advance to INTERDOC.OY.
Procedures: Advance on December 31, 2001 for EUR 3,896 (FIM 160,773).
Subject to interest of 6.26% corresponding to total financial income of EUR 1,692 for the financial period.
We have conducted our audit in accordance with generally accepted accounting standards. These standards call for the implementation of due diligence to obtain reasonable assurance that there do not exist discrepancies between the information you provided to us and the documents on which they are based.
Villeurbanne, June 10, 2002
The Auditors
Yves FOURNAND DELOITTE TOUCHE TOHMATSU
Dominique VALETTE
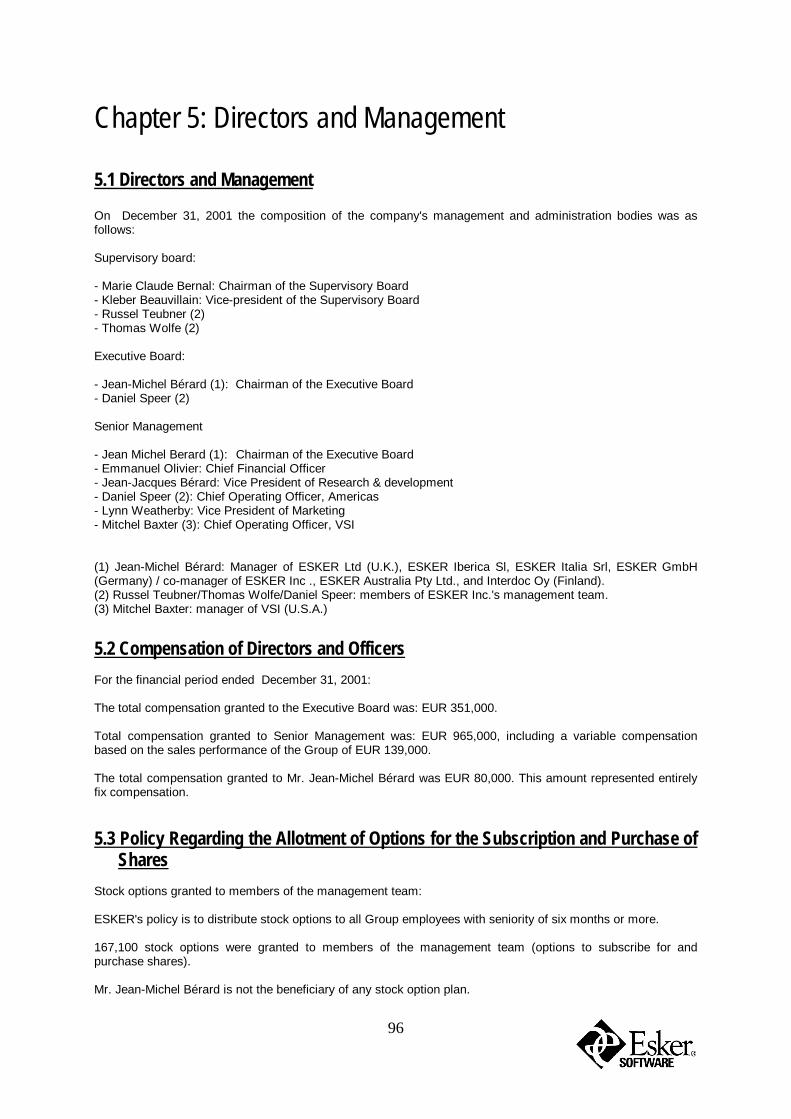
96
Chapter 5: Directors and Management 5.1 Directors and Management On December 31, 2001 the composition of the company's management and administration bodies was as follows: Supervisory board: - Marie Claude Bernal: Chairman of the Supervisory Board - Kleber Beauvillain: Vice-president of the Supervisory Board - Russel Teubner (2) - Thomas Wolfe (2) Executive Board: - Jean-Michel Bérard (1): Chairman of the Executive Board - Daniel Speer (2) Senior Management - Jean Michel Berard (1): Chairman of the Executive Board - Emmanuel Olivier: Chief Financial Officer - Jean-Jacques Bérard: Vice President of Research & development - Daniel Speer (2): Chief Operating Officer, Americas - Lynn Weatherby: Vice President of Marketing - Mitchel Baxter (3): Chief Operating Officer, VSI (1) Jean-Michel Bérard: Manager of ESKER Ltd (U.K.), ESKER Iberica Sl, ESKER Italia Srl, ESKER GmbH (Germany) / co-manager of ESKER Inc ., ESKER Australia Pty Ltd., and Interdoc Oy (Finland). (2) Russel Teubner/Thomas Wolfe/Daniel Speer: members of ESKER Inc.'s management team. (3) Mitchel Baxter: manager of VSI (U.S.A.)
5.2 Compensation of Directors and Officers For the financial period ended December 31, 2001: The total compensation granted to the Executive Board was: EUR 351,000. Total compensation granted to Senior Management was: EUR 965,000, including a variable compensation based on the sales performance of the Group of EUR 139,000. The total compensation granted to Mr. Jean-Michel Bérard was EUR 80,000. This amount represented entirely fix compensation.
5.3 Policy Regarding the Allotment of Options for the Subscription and Purchase of Shares
Stock options granted to members of the management team: ESKER's policy is to distribute stock options to all Group employees with seniority of six months or more. 167,100 stock options were granted to members of the management team (options to subscribe for and purchase shares). Mr. Jean-Michel Bérard is not the beneficiary of any stock option plan.