Embed Size (px)
Citation preview

Network Reliability Assessment
Document No. UE PL 2304 December 2015
Network Reliability Assessment
Explains UE’s holistic approach to meeting its obligations to maintain reliability.

Network Reliability Assessment
RRP 5-4 - Network Reliability Assessment.docx Page 2 of 66
REPEX Road Map
1. Asset Replacement – Modelled
a. 6 modelled asset categories
2. Asset Replacement – Modelled & Unmodelled
a. Pole top structures + SCADA/protection
3. Other Repex - Unmodelled
a. ZSS Primary Asset Replacement
(i) CEES - Capacitor Banks + Earth Grid + Neutral Earthing Resistors
(ii) CEES - Buildings
b. Non VBRC Safety Projects
(i) Intelligent Secure Substation Asset Management (ISSAM) – UE PL 2401 e.g.CCTV
c. Operational Technology
(i) OT Safety
Service Mains Deterioration Field Works – PJ1385 In Meter Capabilities IMC) – PJ1386 Light Detection and Ranging (LiDAR) Asset Management – PJ1400 OT Security – PJ1500 DNSP Intelligent Network Device – PJ5002
(ii) OT Reliability
Distribution Fault Anticipation Data Collection and Analytics (DFADCAA) – PJ1599 Fault Location Identification and Application Development – PJ1600
(iii) OT Other
Dynamic Rating Monitoring Control Communication (DRMCC) – PJ1413 Test Harness – PJ1398 Pilot New and Innovative Technologies – PJ1407
d. Network Reliability Assessment UE PL 2304 – Projects
(i) Automatic Circuit Re-closers (ACRs) and Remote Control Gas Switches (RCGSs)
(ii) Fuse Savers
(iii) Rogue Feeders
(iv) Clashing
(v) Animal Proofing
(vi) Communications Upgrade
e. CEES – Environment
f. CEES – Power Quality Maintained
g. Terminal Station Redevelopment HTS and RTS - UE-DOA-S-17-002 & UEDO-14-003
4. VBRC Projects
a. HV Aerial Bundled Cable Strategic Analysis Plan - UE PL 2053
b. DMA and MTN Zone Substation Rapid Earth Fault Current Limiter (REFCL) Installation
c. Other VBRC projects

Network Reliability Assessment
RRP 5-4 - Network Reliability Assessment.docx Page 3 of 66
Table of Contents
1. Executive Summary ................................................................................................................................. 8
2. Purpose ................................................................................................................................................. 10
3. Background ............................................................................................................................................ 11
3.1 Historical Reliability Performance ............................................................................................. 11
3.1.1. SAIDI ............................................................................................................................ 11
3.1.2. SAIFI ............................................................................................................................ 11
3.1.3. MAIFIe .......................................................................................................................... 12
3.1.4. CAIDI ............................................................................................................................ 12
3.2 Network Reliability Benchmarking ............................................................................................ 13
4. Approach to Maintaining Reliability ....................................................................................................... 15
5. Impact of Investment to Maintain Reliability .......................................................................................... 19
5.1 Summary .................................................................................................................................. 19
5.2 Asset Replacement Capex and Opex ...................................................................................... 21
5.2.1. Effect of Replacement Program on Asset lives. ........................................................... 22
5.3 Weather Vegetation and 3rd Party Faults. ................................................................................ 23
5.3.1. Vegetation .................................................................................................................... 23
5.3.2. Weather ........................................................................................................................ 23
5.3.3. Animals ......................................................................................................................... 24
5.3.4. 3rd Party Related Faults................................................................................................ 24
5.4 Reliability Performance, OT and IT Projects ............................................................................ 24
5.5 Forecast Overall Network Reliability Indices ............................................................................ 25
6. Impact of Asset Replacement by Asset Class ....................................................................................... 27
6.1 Pole Top Structures .................................................................................................................. 27
6.1.1. Background: ................................................................................................................. 27
6.1.2. Effect of Various Programs; ......................................................................................... 29
6.2 Poles ......................................................................................................................................... 30
6.2.1. Background .................................................................................................................. 30
6.2.2. Effect of Various Programs .......................................................................................... 31
6.3 Overhead Conductors and Connectors .................................................................................... 32
6.3.1. Background .................................................................................................................. 32
6.3.2. Effect of Various Programs .......................................................................................... 34
6.4 Underground Cable .................................................................................................................. 34
6.4.1. Background .................................................................................................................. 34
6.4.2. Effect of Various Programs .......................................................................................... 36
6.5 Distribution Switchgear ............................................................................................................. 36
6.5.1. Background .................................................................................................................. 37
6.5.2. Effect of Various Programs .......................................................................................... 38
6.6 Distribution Transformer ........................................................................................................... 39
6.6.1. Background .................................................................................................................. 39
6.6.2. Effect of Various Programs .......................................................................................... 40
6.7 Zone Substation Transformers ................................................................................................. 41
6.7.1. Background: ................................................................................................................. 41
6.7.2. Effect of Various Programs .......................................................................................... 43
6.8 Zone Substation Switchgear ..................................................................................................... 43

Network Reliability Assessment
RRP 5-4 - Network Reliability Assessment.docx Page 4 of 66
6.8.1. Background .................................................................................................................. 43
6.8.2. Effect of Various Program ............................................................................................ 44
6.9 Protection and Control Equipment............................................................................................ 45
6.9.1. Background .................................................................................................................. 45
6.9.2. Effect of Various Program ............................................................................................ 46
7. Reliability Performance, OT and IT Programs ....................................................................................... 47
7.1 Program / Project Assessments – Summary ............................................................................ 47
7.2 Program Assessments – Reliability Maintained Capex ............................................................ 48
7.2.1. Automatic Circuit Reclosers (ACRs) and Remote Control Gas Switches (RCGSs) .... 49
7.2.2. Fuse Savers ................................................................................................................. 50
7.2.3. Clashing ....................................................................................................................... 51
7.2.4. Animal Proofing ............................................................................................................ 52
7.2.5. Communications Upgrades .......................................................................................... 53
7.2.6. Rogue Feeders............................................................................................................. 54
7.3 Program Assessments – Operational Technology Projects ..................................................... 55
7.3.1. Fault Location Identification and Application Development ......................................... 55
7.3.2. DFADCAA .................................................................................................................... 55
7.4 Program Assessments – Information Technology Projects...................................................... 56
7.4.1. OMS Smart Grid Gateway Extension .......................................................................... 56
7.4.2. DMS LV Management .................................................................................................. 56
7.4.3. FLISR ........................................................................................................................... 57
7.5 Opex Assessments ................................................................................................................... 57
8. CAIDI Drivers and Trends ..................................................................................................................... 58
8.1 CAIDI over time ........................................................................................................................ 58
8.2 CAIDI Drivers Analysis and Observations ................................................................................ 58
8.2.1. Reductions in Traffic Flow Speeds. ............................................................................. 58
8.2.2. Increasing Number of HV Events and Increasing Prevalence of HV Simultaneous Events. ......................................................................................................................... 61
8.2.3. Increasing Percentage of Equipment Failures. ............................................................ 62
8.3 Programs to Address Trends in CAIDI. .................................................................................... 62
9. Conclusion ............................................................................................................................................. 64
10. Definitions .............................................................................................................................................. 65
11. References ............................................................................................................................................ 66

Network Reliability Assessment
RRP 5-4 - Network Reliability Assessment.docx Page 5 of 66
List of Tables
Table 1: Forecast SAIDI and SAIFI due to Equipment Failures ........................................................................... 9
Table 2: Replacement Capex and Opex ............................................................................................................ 20
Table 3: Forecast Reliability Indices ................................................................................................................... 25
Table 4: Contribution to SAIDI of Equipment Failure (2014). ............................................................................. 27
Table 5: Summary of Reliability related programs/projects ................................................................................ 47
Table 6: Capex Projects Not Included ................................................................................................................ 48
Table 7: Opex Projects Not Included. ................................................................................................................. 48
Table 8: ACRs and RCGSs Cost-Benefit Summary ........................................................................................... 49
Table 9: Fuse Savers Cost Benefit Summary .................................................................................................... 50
Table 10: Conductor Clashing Cost-benefit summary ........................................................................................ 51
Table 11: Animal Proofing Cost-benefit summary .............................................................................................. 52
Table 12: Communication Upgrade Cost-benefit summary ............................................................................... 53
Table 13: Rogue Feeder Cost-benefit summary ................................................................................................ 54
Table 14: Fault Location Cost Benefit Summary ................................................................................................ 55
Table 15: DFADCAA Cost Benefit Summary ..................................................................................................... 55
Table 16: OSM Smart Gate Way Cost Benefit Summary ................................................................................... 56
Table 17: DSM LV Management Cost Benefit Summary ................................................................................... 56
Table of Figures
Figure 1: Actual unplanned SAIDI ...................................................................................................................... 11
Figure 2: Actual SAIFI ......................................................................................................................................... 12
Figure 3: Actual MAIFIe ...................................................................................................................................... 12
Figure 4: Actual CAIDI ........................................................................................................................................ 13
Figure 5: Comparison of Historical SAIDI with State and National Averages .................................................... 13
Figure 6: Comparison of Historical SAIFI with State and National Averages ..................................................... 14
Figure 7: Comparison of Historical CAIDI with State and National Averages .................................................... 14
Figure 8: Unplanned Regulatory SAIDI .............................................................................................................. 15
Figure 9: Historical SAIDI Performance by Cause ............................................................................................. 16
Figure 10: Proportion of Network Assets at High Risk of Failure ....................................................................... 16
Figure 11: Reliability Analysis (Excluding Equipment Failure) ........................................................................... 23
Figure 12: Total Network SAIDI Actual and Forecast ......................................................................................... 26
Figure 13: Total Network SAIFI Actual and Forecast ......................................................................................... 26
Figure 14: Total Network CAIDI Actual and Forecast ........................................................................................ 26
Figure 15: Pole Tops Historical Reliability Performance - SAIDI........................................................................ 28
Figure 16: Pole Top Historical Reliability Performance - SAIFI .......................................................................... 28
Figure 17: Pole Tops: Assets at High Risk of Failure ......................................................................................... 29
Figure 18: Pole Historical Reliability Performance – SAIDI ................................................................................ 30
Figure 19: Pole Historical Reliability Performance – SAIFI ................................................................................ 31

Network Reliability Assessment
RRP 5-4 - Network Reliability Assessment.docx Page 6 of 66
Figure 20: Poles Assets at High Risk of Failure ................................................................................................. 31
Figure 21: Conductor Historical Reliability Performance – SAIDI. ..................................................................... 32
Figure 22: Conductor Historical Reliability Performance – SAIFI. ...................................................................... 33
Figure 23: Conductors: Assets at High Risk of Failure ....................................................................................... 33
Figure 24: Underground Historical Cable Asset Performance: SAIDI ................................................................ 35
Figure 25: Underground Historical Cable Asset Performance: SAIFI ................................................................ 35
Figure 26: Underground Cables: Assets at High Risk of Failure ........................................................................ 36
Figure 27: Distribution Switchgear Historical Asset Performance: SAIDI .......................................................... 37
Figure 28: Distribution Switchgear Historical Asset Performance: SAIFI ........................................................... 38
Figure 29: Distribution Switchgear: Assets at High Risk of Failure .................................................................... 38
Figure 30: Distribution Transformer Historical Reliability Performance: SAIDI .................................................. 39
Figure 31: Distribution Transformer Historical Reliability Performance: SAIFI ................................................... 40
Figure 32: Distribution Transformers: Assets at High Risk of Failure ................................................................ 40
Figure 33: SAIDI Zone Substation Transformers ............................................................................................... 41
Figure 34: SAIFI Zone Substation Transformer ................................................................................................. 42
Figure 35: Zone Substation Transformers: Assets at High Risk of Failure ........................................................ 42
Figure 36: SAIDI Zone Substation Circuit Breakers ........................................................................................... 43
Figure 37: SAIFI Zone Substation Circuit Breakers ........................................................................................... 44
Figure 38: Zone Substation Switchgear: Assets at High Risk of Failure ............................................................ 44
Figure 39: SAIDI SCADA Protection and Control ............................................................................................... 45
Figure 40: SAIFI SCADA, Protection and Control .............................................................................................. 46
Figure 41: Protection and SCADA: Transformers at High Risk of Failure .......................................................... 46
Figure 42 : UE Actual CAIDI and CAIDI Trend ................................................................................................... 58
Figure 43: VicRoads Monitored Traffic Speeds .................................................................................................. 59
Figure 44: VicRoads Monitored Average Traffic Speeds ................................................................................... 59
Figure 45: VicRoads Monitored Average Traffic Speeds – Inner Divided Roads .............................................. 60
Figure 46: VicRoads Monitored Average Traffic Speeds – Outer Divided Roads.............................................. 60
Figure 47: HV Event Trend ................................................................................................................................. 61
Figure 48: Simultaneous Events and CAIDI ....................................................................................................... 61
Figure 49: CAIDI for Equipment Failure against CAIDI average ........................................................................ 62
Figure 50: Equipment Failure ............................................................................................................................. 62

Network Reliability Assessment
RRP 5-4 - Network Reliability Assessment.docx Page 7 of 66
Liability Disclaimer
Some of the information and statements contained in this Network Performance Strategy are comprised of, or are based on, assumptions, estimates, forecasts, predictions and projections made by United Energy (UE). In addition, some of the information and statements are based on actions that UE currently intends to take in the future. Circumstances will change, assumptions and estimates may prove to be wrong, events may not occur as forecasted, predicted or projected, and UE may at a later date decide to take different actions to those it currently intends to take.
Except for any statutory liability which cannot be excluded, UE will not be liable, whether in contract, tort (including negligence), equity or otherwise, to compensate or indemnify any person for any loss, injury or damage arising directly or indirectly from any person using, or relying on any content of, this strategy.
When considering the content of this strategy, persons should take appropriate expert advice in relation to their own circumstances and must rely solely on their own judgement and expert advice obtained.

Network Reliability Assessment
RRP 5-4 - Network Reliability Assessment.docx Page 8 of 66
1. Executive Summary
UE’s network reliability performance has been deteriorating and performance targets have not been met in recent years. Unplanned SAIDI has been increasing by approximately 2.7 minutes per year for the last decade. At the same time SAIFI has increased by approximately 11%.
Our customer feedback is that affordability of electricity is a key issue. Customers tells us they do not want to pay for better reliability, but conversely, they do not want to accept lower reliability for lower prices. Thus, UE’s key network performance objective is to maintain reliability, and hit our reliability targets, at least cost.
UE’s reliability targets for the next regulatory period will be based on our historical average performance over the past five years, and is estimated to average about 69 minutes of unplanned SAIDI and 1.00 interruption per customer for SAIFI. Our average performance for the last three years is well above these targets, with an average SAIDI of 76.7 minutes and average SAIFI of 1.03 interruptions. Thus, to maintain reliability for the next regulatory period, we must return performance to our historic five year average, and close the gap from our current performance.
A key factor to be managed in maintaining reliability is the increasing proportion of network assets in the last 15% of their life, where asset failure rates accelerate significantly and assets are at a high risk of failure. Even accounting for asset replacement during the current regulatory period, this proportion has increased from 17% in 2009 to 19% in 20151, correlating strongly with a rise in equipment failures and our deteriorating reliability. The proportion would increase significantly to 28% in 2020 (without accounting for proposed asset replacement during the next period), since many network assets were installed in the 1960’s and 70’s and have life expectancy of 50-60 years. UE’s broad strategy is to develop a program of capital and operational expenditure to efficiently meet our network performance obligations to maintain reliability, safety and quality. To this end, UE has adopted a prudent, holistic approach to ‘maintaining reliability’ to ensure that this objective is achieved at least cost. This holistic approach recognises the contributions made by various capex categories including augmentation, asset replacement, network performance, and operational technology (OT) and information technology (IT) projects. It also considers opex initiatives.
In addition to SAIDI and SAIFI deteriorating, CAIDI has also deteriorated significantly. This has occurred across the industry in Australia, Victoria and at UE, and is due to a range of factors including increasing traffic / travel time, an increasing number of HV events, more HV events occurring simultaneously and an increase in the number of equipment failures which take longer to restore. Our approach to maintain reliability considers SAIDI and SAIFI and hence CAIDI, to achieve our targets for each aspect of reliability (resulting in a zero STPIS outcome). SAIDI is used as the primary reliability metric, as it a measure of fault frequency, the number of customers impacted and restoration times.
Augmentation capex contributes to maintaining reliability by increasing network capacity to meet peak demand, thus avoiding interruption of supply to customers due to load shedding and equipment failure (due to overloading). Augmentation capex is forecast based on the forecast peak demand and the value of customer reliability, and is the first step in our approach as it can be set relatively independently. The contribution of augmentation capex to maintaining reliability for the forthcoming regulatory period is the same as for the current period, resulting in no net change.
Replacing assets at end-of-life provides the greatest contribution to maintaining both reliability and network safety. Asset replacement volumes are set for each asset category based on what may be reasonably achieved for reasonable cost considering the specific circumstance for each asset class, including historic performance, historic replacement capex and opex, and the proportion of assets in the last 15% of their life (at both the beginning and end of the next regulatory period).
When considered in isolation, the asset replacement program would result in further deterioration in network reliability. The primary reason for this is the proportion of assets nearing the end of life and at higher risk of failure will increase from 19% in 2015 to 23% by 2020 resulting in a continuing increase in equipment failures. The forecast deterioration in reliability due to our older assets has been estimated and is shown in Table 1.
1 Data is for 2014 but was submitted in 2015 RIN.

Network Reliability Assessment
RRP 5-4 - Network Reliability Assessment.docx Page 9 of 66
Table 1: Forecast SAIDI and SAIFI due to Equipment Failures
Impact of Asset Replacement 2016-2020
2014
2016-2020
Average
Equipment Failure SAIFI (interruptions per customer)
0.41 0.55
Equipment Failure SAIDI (minutes)
39 48
In order to meet reliability targets for the next regulatory period, a range of network performance, OT and IT projects and opex initiatives have been considered. These categories of projects and the benefits they deliver can be described as follows:
Network reliability performance capex includes programs like additional remote switches and fuse savers to reduce the frequency of faults, minimise the impact of faults and restore supply quickly.
OT projects use smart technology applications to locate faults and facilitate faster restoration of supply.
IT projects include tools that allow better and faster decisions to be made during major network events like storms, and applications that provide more accurate data on customers impacted by faults and thus facilitate faster restoration.
Opex initiatives consisting of significant additional resources to improve fault and emergency field response have been considered as they offer the potential for faster supply restoration times under certain conditions.
The programs, projects and initiatives described above have been ranked on their ability to close the gap in reliability performance to meet targets at least cost. The highest ranking projects have been progressively selected until the gap is closed and the targets achieved.
United Energy is proposing the following expenditure to meet our reliability targets at least costs for the 2016-2020 period, addressing deteriorating reliability and network health, and closing the gap between current performance and our revised targets:
Asset replacement expenditure of $408M (compared to the current period of $375M)
Other Unmodelled Repex reliability projects, consisting of
o $35.8M of network reliability projects (compared to the current period of $24.1M)
o $6.8M of OT reliability projects (compared to current period < $4.4M)
IT projects totaling $6.0M
This assessment is consistent with our overall top down assessment, concluding that a significant increase in expenditure will be required to address deteriorating reliability return our performance to our revised target, and to address the ongoing increasing proportion of assets at high risk of failure.
Network Reliability Assessment
RRP 5-4 - Network Reliability Assessment.docx Page 10 of 66
2. Purpose
This document presents the network reliability assessment for UE for the 2016-2020 regulatory period. It is complementary to the Network Performance Strategy, which focuses on strategy rather than presenting assessment details.
This Assessment explains how UE’s entire capex and opex programs will impact on reliability. It also explains how United Energy is required under the Rules to maintain reliability and how it uses SAIDI, SAIFI and CAIDI to measure its reliability performance. It identifies specific projects that are required to close the gap between current performance and the targets for the 2016-2020 regulatory period.
The purpose of this Assessment is to demonstrate how United Energy intends to meet its obligations to maintain reliability at least cost though a holistic approach of using replacement expenditure, augmentation expenditure plus programs that specifically target reliability.

Network Reliability Assessment
RRP 5-4 - Network Reliability Assessment.docx Page 11 of 66
3. Background
3.1 Historical Reliability Performance
The United Energy network performance, as measured by SAIDI, SAIFI and CAIDI, has shown a gradual deterioration since 2004. UE has a number of current programs that contribute to maintaining reliability and our deteriorating trend is occurring in spite of these programs.
In this section we discuss those deteriorating trends and how UE benchmarks against other distribution businesses in Victoria and Australia.
3.1.1. SAIDI
SAIDI is a measure of the average time a customer is off supply each year. In 2004 and 2005 SAIDI was 52 and 53 minutes. This level of performance has not been maintained as the average network assets age and fault response times both increase. The last three years have averaged a SAIDI in excess of 77 minutes, on a regulatory basis. SAIDI has therefore increased by 48% over ten years.
Figure 1: Actual unplanned SAIDI2
As Figure 1 shows, SAIDI is deteriorating at a rate of approximately 2.7 minutes per year over the last ten years. By contrast, our targets for SAIDI have been reducing.
3.1.2. SAIFI
SAIFI is a measure of the average number of times each customer has a sustained interruption each year. SAIFI is determined both by the number of faults that occur and the number of customers affected by each fault. Although SAIFI may be thought of as a measure of the number of faults on the network, a comparison is only valid if the number of customers affected by each fault is constant. In United Energy’s case, there have been on-going programs to add Automatic Circuit Re-closers (ARC’s) and Remote Control Gas Switches (RCGS’s) to feeders in each regulatory period. These programs result in fewer customers being affected by each fault and, if the number of faults on the network were not increasing, should cause SAIFI to reduce.
The United Energy SAIFI was 0.93 and 0.97 interruptions in 2004 and 2005 respectively. Again, this level of performance has not been maintained and SAIFI gradually increased to an average of in excess of 1.03 sustained interruptions over the last three years. The number of interruptions per customer has increased by approximately 11% over ten years. The performance has deteriorated even though feeders have more sections, corresponding to an increase in the number of sustained faults. It is no coincidence that the number of equipment failures are also increasing as equipment failures almost always cause sustained faults.
2 Prior to 2010, different a major event exemption criteria was in place resulting in higher SAIDI numbers in some years

Network Reliability Assessment
RRP 5-4 - Network Reliability Assessment.docx Page 12 of 66
Figure 2: Actual SAIFI3
3.1.3. MAIFIe
MAIFIe is a measure of the average number of momentary interruption each customer experiences each year. Because a certain percentage of faults are transient in nature, UE can use auto reclose to restore customers once the faults have been cleared. Then the customers only experience a momentary interruption. UE’s MIAFIe in 2004 and 2005 were 1.34 and 1.56 respectively and MAIFI has improved over the period due to more feeder sectionalisation and because, with an increase in the proportion of equipment failures, there are relatively fewer transient faults.
Figure 3: Actual MAIFIe
3.1.4. CAIDI
CAIDI is a measure of the average duration of a customer outage. The United Energy CAIDI performance has been deteriorating from 56 minutes in 2004 and 2005 to 78 minutes in 2014. Whilst this increase has been broadly consistent over the period there is a clear outlier in 2009 and a step increase in 2012. Figure 4 highlights this trend against the implied regulatory target. The reasons for the increase in average outage times are further discussed in Section 7.
3 Prior to 2010, different a major event exemption criteria was in place resulting in higher SAIFI and MAIFI numbers in some years

Network Reliability Assessment
RRP 5-4 - Network Reliability Assessment.docx Page 13 of 66
Figure 4: Actual CAIDI
As demonstrated by figures 1 to 4, network performance is currently worse than the regulatory target and, except for MAIFI, is deteriorating.
3.2 Network Reliability Benchmarking
Figure 5, Figure 6 and Figure 7 compare the SAIDI, SAIFI and CAIDI of United Energy with the average performance of the Victorian utilities and Australian utilities4.
United Energy’s performance has been compared against the arithmetic mean of the Victorian DNSP’s performance and against the arithmetic mean of all the DNSPs analysed, considered the national average in this report.
Figure 5: Comparison of Historical SAIDI with State and National Averages
SAIDI has been decreasing at a state and national level (exclusions and MEDs excluded) and is at best flat for Victoria. However United Energy is one of only three utilities to experience an increasing SAIDI trend.
4 Huegin, Conduit: Benchmarking and independent research, Available from http://conduit.huegin.com.au/Account/Login?ReturnUrl=%2f, accessed 29th July 2015 4 Australian Energy Regulator, RIN Responses, Available from https://www.aer.gov.au/taxonomy/term/1495, accessed 29th July 2015
0.0
20.0
40.0
60.0
80.0
100.0
120.0
140.0
160.0
2006 2007 2008 2009 2010 2011 2012 2013 2014
Annual SAIDI(excluding exclusions & MEDs)
Average AUS
Average VIC
United Energy

Network Reliability Assessment
RRP 5-4 - Network Reliability Assessment.docx Page 14 of 66
Figure 6: Comparison of Historical SAIFI with State and National Averages
SAIFI has been improving at a significant rate across Australia, and at a lesser rate in Victoria. However, SAIFI for United Energy is deteriorating (refer also Figure 2).
Figure 7: Comparison of Historical CAIDI with State and National Averages
Figure 7 demonstrates that CAIDI is deteriorating for United Energy and on average for Victorian and Australian utilities. The reasons for the deterioration in CAID at United Energy are discussed in section 7.
Figure 5 shows trends in SAIDI which are a combination of SAIFI and CAIDI measures. Across Australia, levels of SAIDI are showing a slight improvement due to the large improvements in SAIFI which has more than offset the deterioration in CAIDI. In Victoria, where the improvement in SAIFI is not as large, SAIDI is generally being maintained at a constant level.
However for United Energy, SAIFI, CAIDI and SAIDI are all deteriorating. The key reasons for this are discussed in this document.

Network Reliability Assessment
RRP 5-4 - Network Reliability Assessment.docx Page 15 of 66
4. Approach to Maintaining Reliability
UE has developed a prudent holistic approach to maintaining reliability at minimum cost. This approach is described in some detail in the following documents:
United Energy 2016 to 2020 Regulatory Proposal5: particularly in Sections 10.2.2 and 10.2.3
Network Performance Strategy: Document Number UE PL 2300 particularly Sections 8, 9 and 10
AER Category Expenditure Explanation Statement: Other Programs6 Document Number NET457, particularly Section 4.1.
Our approach to maintaining reliability is summarised below.
United Energy has obligations under the Rules to maintain reliability. Consistent with the AER’s approach to setting reliability targets under the STPIS, Figure 8 presents the SAIDI target to maintain reliability in the next regulatory period in the context of current network performance. Our target is based on our historical average performance over the past five years, and is estimated to average 69 minutes unplanned SAIDI for the period. Our performance for the last three years is well above this average, and was 78 minutes in 2014. In order to maintain reliability in the next regulatory period, we must return our performance to our historical five year average by firstly providing programs to close the gap between our 2014 performance and the target by around 10 minutes and then by providing programs to deal with the deteriorating trend.
Figure 8: Unplanned Regulatory SAIDI
UE uses SAIDI as the primary metric for maintaining reliability. SAIDI has been selected as it caters for changes in fault frequency, the number of customers impacted and restoration times. Using SAIDI in a first pass assessment, we can comparatively assess the effect of a variety of capex projects and Opex initiatives on reliability. We consider all metrics in our final pass assessment, including SAIFI and CAIDI.
Our current performance and trends informs our approach to maintaining reliability. As presented in Section 3, we have a deteriorating trend in network reliability across all metrics except MAIFIe.
Reliability performance is caused by a variety of reasons such as equipment failure and faults caused by birds and animals, vegetation, weather and third parties. Figure 9 below shows that the deterioration in performance is largely driven by two factors - an increase in equipment failure and increases in faults caused by weather and vegetation.
5 United Energy, 2016 to 2020 Regulatory Proposal, 30 April 2015, pages 45 to 48.
6 United Energy, AER Category Expenditure Explanation Statement: Other Programs, section 3.1.1, pages 10 and 11.

Network Reliability Assessment
RRP 5-4 - Network Reliability Assessment.docx Page 16 of 66
Figure 9: Historical SAIDI Performance by Cause
For equipment failures, our analysis reveals that there is a strong relationship between the percentage of assets at or older than 85 per cent of their asset life and the contribution to SAIDI from equipment failure. This is illustrated in the Figure 10, noting the forecast includes the impact of asset replacement in the 2016-2020 period. This information is a key factor in our approach. It explains why the performance of the network is deteriorating even though “end of life” assets are being replaced.
Figure 10: Proportion of Network Assets at High Risk of Failure
UE has used a figure of 85% of life to measure the trend in the number of assets in the “wear out” stage and approaching the end of life. For assets whose failure is predicted by a normal distribution, it is good indicator of when the number of failures is expected to increase and is supported by Weibull theory. This approach is supported by other independent end of life assessment techniques such as CBRM7 methodology.
Our broad reliability strategy is to develop a program of capital and operational expenditure to address these trends so that our reliability targets for the next regulatory period are met in the most efficient manner. Our approach recognises the contributions made by each capex category (in addition to Opex) so that our total expenditure is properly calibrated to the task and is at least cost.
The effect of augmentation capex on reliability can be assessed relatively independently. It involves increasing network capacity to meet peak demand and avoid interruption of supply to customers due to load shedding or equipment failure due to overloading. UE has accepted the AER’s preliminary decision on the combination of
7 See Document No UE PL 2044 Asset High Risk of Failure Assessment.
0
10
20
30
40
50
60
2004 2005 2006 2007 2008 2009 2010 2011 2012 2013 2014
Min
Trends of SAIDI Causes
Equipment Failure Adverse Weather & Vegetation
Animal Third Party
NCF
Network Reliability Assessment
RRP 5-4 - Network Reliability Assessment.docx Page 17 of 66
demand forecast, VCR and augmentation capex, and have assessed this as having no material change on reliability in the forthcoming period.
Our replacement capex program is based on Asset Life Cycle Strategies (LCS) prepared for each asset class, which select a strategy for managing the assets to achieve desired outcomes (primarily reliability and safety) at least life cycle cost. In forecasting the asset class reliability for the forthcoming regulatory period, we initially consider the following factors to inform us on their “current state”:
Recent reliability performance.
Recent trend in reliability.
Historic replacement capex.
Historic Opex.
Historic inspection and maintenance practices.
The proportion of assets in the last 15% of their lives (where failure rate increases)
Other detailed information on asset condition etc.
The following are then set based on what may be reasonably achieved for reasonable cost considering the specific circumstance for the asset class.
Forecast replacement capex in the forthcoming regulatory period.
Forecast Opex in the forthcoming regulatory period.
Proposed changes to inspection and maintenance practices.
Our Repex for the forecast period is sufficient to replace assets that will reach the end of their life. However, it is not sufficient to prevent our assets becoming older, with a larger proportion of the assets reaching the wear out stage of life as shown in Figure 10. Intuitively, one would expect that older assets to fail more often than newer ones as they age and deteriorate. This is borne out in the Weibull probability density function modelling which we have used to forecast the replacement timing of many of our assets. It indicates that approximately 75% of assets will remain in service with 15% of life remaining, but the rate of failure begins to increase markedly, exposing customers to an increased risk of deteriorating reliability through equipment failure.
For a few asset classes such as underground cables we have, in fact, forecast deterioration in their contribution to network performance, as it would not be efficient to address their deterioration through additional replacement of assets. Instead, we have proposed more efficient ways of maintaining reliability, as outlined below.
Instead of increasing our replacement expenditure, we are proposing to increase network reliability performance capex. It will contribute to achieving reliability targets by reducing the frequency of some outages, minimising the number of customers affected by outages and by restoring supply to customers as quickly as possible. A number of network performance capex programs have been proposed and they have been ranked and selected based on their ability to maintain network reliability at least cost.
Another alternative to increasing replacement expenditure is our Information and Communication Technology (ICT) and Operational Technology (OT) projects. They are characterised by smart technology that delivers a range of benefits including a contribution to maintaining network reliability. They have been ranked in a similar way to reliability performance projects, noting the complexity introduced in the ranking process as these projects deliver a variety of other benefits including safety.
Our stepwise approach to developing an optimal investment program to meet our obligation to maintain reliability is summarised below:
Augmentation capex is set relatively independently.
The current performance of each of the 10 asset classes and their effect on historic reliability performance is assessed.
Replacement expenditure is proposed as per condition or historical trends and is explained in our Life Cycle Strategies.

Network Reliability Assessment
RRP 5-4 - Network Reliability Assessment.docx Page 18 of 66
The effect of the proposed asset replacement expenditure for the 2016 - 2020 period on performance has been estimated for each asset class, in terms of both the total change and the change in the trend.
The forecast performance for each asset class is summed. A shortfall in performance compared to the forthcoming period has been identified.
The shortfall has been addressed by carefully identifying a mix of reliability performance, ICT and OT projects to close the reliability performance gap at least cost.
The performance improvement of each proposed project has been summed until the required level is reached to maintain reliability and achieve reliability targets.
Some iteration is required in the above process, particularly with regard to the level of replacement capex for each asset class, and the number of reliability performance, ICT and OT projects. Some iteration is also needed to accommodate our safety assessment process, as asset replacement is the primary lever to address reliability and network safety.
In summary, we have not sought to address the deterioration in reliability performance through replacement capex initiatives alone. Instead, we have assessed and proposed a range of capex and opex initiatives to maintain reliability at minimum cost.
UE have planned to spend larger proportions of the reliability performance capex budget in the first years of the forecast period in order to get the most value from this program.

Network Reliability Assessment
RRP 5-4 - Network Reliability Assessment.docx Page 19 of 66
5. Impact of Investment to Maintain Reliability
5.1 Summary
UE has developed and implemented a prudent holistic approach to maintaining reliability at minimum cost, as outlined in Section 4. In summary:-
UE has performed a detailed assessment of the performance and condition of each asset category
and this is set out in individual Life Cycle Strategies and Expenditure Explanatory Statements. The assessments include consideration of the age of the asset (particularly the proportion of
equipment beyond the last 15% of asset life), its recent network performance and the condition of the
overall asset category. Replacement capex forecasts have been established for each category,
considering a range of factors including industry benchmarks, safety, the specific circumstances for
each asset class, and what can be achieved at reasonable cost. Replacement capex and specific opex initiatives have been planned to address the range of
objectives at lowest life cycle cost. Where reliability performance will not be met by replacements
alone, other programs have been identified to close the gap between required and forecast
performance.
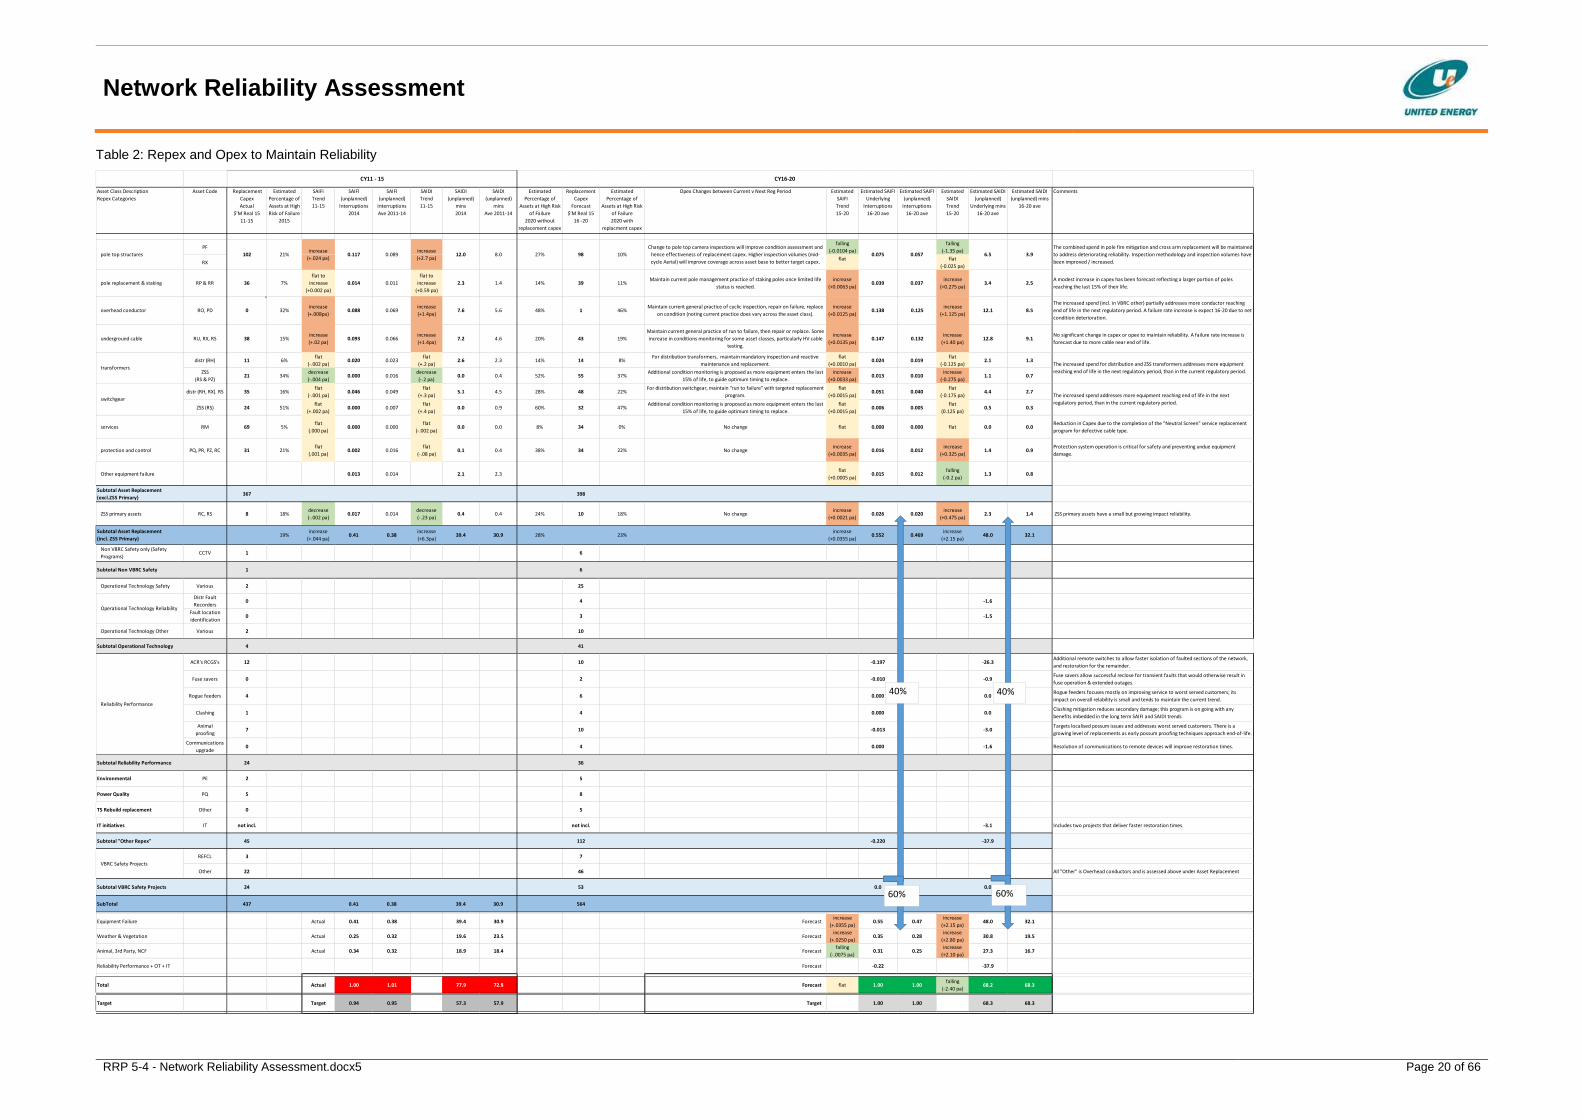
United Energy’s holistic assessment of its capital and operational expenditure program to maintain reliability is set out in Table 2.
The rows presented in Table 2 can be grouped into three blocks:-
The first block of information is in the rows in the top half of the table and provides information by assets class. It provides information on the replacement expenditure in the current and forecast periods, the current performance trends and effect of Repex on forecast performance in terms of both SAIFI and SAIDI.
The block of information presented in the middle rows of the table lists our Reliability Performance, Operational Technology and Information Technology projects for the current and forecast periods and provides estimates how they will affect reliability performance in the forecast period.
The block of information in the rows at the bottom of the table provides information on reliability by fault type. Fault types have been grouped into three broad categories: Equipment Failure, Weather and Vegetation and Other. “Other” includes faults caused by animals, third parties or where no cause is found.
The information presented in the columns of Table 2 is divided into the periods 2011 - 2015 and 2016 – 2020, providing both historical data for the current EDPR period and forecasts for the next.
In the current period the table presents the following historic considerations and present status for each asset class:
Replacement capex 2011-2015 (in $2015)
Estimated percentage of the Asset Class in wear out stage of its life (in 2014) with an elevated risk of failure
SAIFI trend (2010 – 2014)
SAIFI (2014)
SAIDI trend (2010 - 2014)
SAIDI minutes (2014)
Network Reliability Assessment
RRP 5-4 - Network Reliability Assessment.docx5 Page 20 of 66
Table 2: Repex and Opex to Maintain Reliability
Asset Class Description
Repex Categories
Asset Code Replacement
Capex
Actual
$'M Real 15
11-15
Estimated
Percentage of
Assets at High
Risk of Failure
2015
SAIFI
Trend
11-15
SAIFI
(unplanned)
Interruptions
2014
SAIFI
(unplanned)
Interruptions
Ave 2011-14
SAIDI
Trend
11-15
SAIDI
(unplanned)
mins
2014
SAIDI
(unplanned)
mins
Ave 2011-14
Estimated
Percentage of
Assets at High Risk
of Failure
2020 without
replacement capex
Replacement
Capex
Forecast
$'M Real 15
16 -20
Estimated
Percentage of
Assets at High Risk
of Failure
2020 with
replacment capex
Opex Changes between Current v Next Reg Period Estimated
SAIFI
Trend
15-20
Estimated SAIFI
Underlying
Interruptions
16-20 ave
Estimated SAIFI
(unplanned)
Interruptions
16-20 ave
Estimated
SAIDI
Trend
15-20
Estimated SAIDI
(unplanned)
Underlying mins
16-20 ave
Estimated SAIDI
(unplanned) mins
16-20 ave
Comments
PFfalling
(-0.0104 pa)
falling
(-1.35 pa)
RXflat flat
(-0.025 pa)
overhead conductor RO, PD 0 32%increase
(+.008pa)0.088 0.069
increase
(+1.4pa)7.6 5.6 48% 1 46%
Maintain current general practice of cyclic inspection, repair on failure, replace
on condition (noting current practice does vary across the asset class).
increase
(+0.0125 pa)0.138 0.125
increase
(+1.125 pa)12.1 8.5
The increased spend (incl. in VBRC other) partially addresses more conductor reaching
end of life in the next regulatory period. A failure rate increase is expect 16-20 due to net
condition deterioration.
underground cable RU, RX, RS 38 15%increase
(+.02 pa)0.093 0.066
increase
(+1.4pa)7.2 4.6 20% 43 19%
Maintain current general practice of run to failure, then repair or replace. Some
increase in conditions monitoring for some asset classes, particularly HV cable
testing.
increase
(+0.0135 pa)0.147 0.132
increase
(+1.40 pa)12.8 9.1
No significant change in capex or opex to maintain reliability. A failure rate increase is
forecast due to more cable near end of life.
distr (RH) 11 6%flat
(-.002 pa)0.020 0.023
flat
(+.2 pa)2.6 2.3 14% 14 8%
For distribution transformers, maintain mandatory inspection and reactive
maintenance and replacement.
flat
(+0.0010 pa)0.024 0.019
flat
(-0.125 pa)2.1 1.3
ZSS
(RS & PZ)21 34%
decrease
(-.004 pa)0.000 0.016
decrease
(-.2 pa)0.0 0.4 52% 55 37%
Additional condition monitoring is proposed as more equipment enters the last
15% of life, to guide optimum timing to replace.
increase
(+0.0033 pa)0.013 0.010
increase
(-0.275 pa)1.1 0.7
distr (RH, RX). RS 35 16%flat
(-.001 pa)0.046 0.049
flat
(+.3 pa)5.1 4.5 28% 48 22%
For distribution switchgear, maintain "run to failure" with targeted replacement
program.
flat
(+0.0015 pa)0.051 0.040
flat
(-0.175 pa)4.4 2.7
ZSS (RS) 24 51%flat
(+.002 pa)0.000 0.007
flat
(+.4 pa)0.0 0.9 60% 32 47%
Additional condition monitoring is proposed as more equipment enters the last
15% of life, to guide optimum timing to replace.
flat
(+0.0015 pa)0.006 0.005
flat
(0.125 pa)0.5 0.3
services RM 69 5%flat
(.000 pa)0.000 0.000
flat
(-.002 pa)0.0 0.0 8% 34 0% No change flat 0.000 0.000 flat 0.0 0.0
Reduction in Capex due to the completion of the "Neutral Screen" service replacement
program for defective cable type.
protection and control PQ, PR, PZ, RC 31 21%flat
(.001 pa)0.002 0.016
flat
(-.08 pa)0.1 0.4 38% 34 22% No change
increase
(+0.0035 pa)0.016 0.012
increase
(+0.325 pa)1.4 0.9
Protection system operation is critical for safety and preventing undue equipment
damage.
Other equipment failure 0.013 0.014 2.1 2.3flat
(+0.0005 pa)0.015 0.012
falling
(-0.2 pa)1.3 0.8
Subtotal Asset Replacement
(excl.ZSS Primary)367 398
ZSS primary assets RC, RS 8 18%decrease
(-.002 pa)0.017 0.014
decrease
(-.23 pa)0.4 0.4 24% 10 18% No change
increase
(+0.0021 pa)0.026 0.020
increase
(+0.475 pa)2.3 1.4 ZSS primary assets have a small but growing impact reliability.
Subtotal Asset Replacement
(incl. ZSS Primary)19%
increase
(+.044 pa)0.41 0.38
increase
(+6.3pa)39.4 30.9 28% 23%
increase
(+0.0355 pa)0.552 0.469
increase
(+2.15 pa)48.0 32.1
Non VBRC Safety only (Safety
Programs)CCTV 1 6
Subtotal Non VBRC Safety 1 6
Operational Technology Safety Various 2 25
Distr Fault
Recorders0 4 -1.6
Fault location
identification0 3 -1.5
Operational Technology Other Various 2 10
Subtotal Operational Technology 4 41
ACR's RCGS's 12 10 -0.197 -26.3Additional remote switches to allow faster isolation of faulted sections of the network,
and restoration for the remainder.
Fuse savers 0 2 -0.010 -0.9Fuse savers allow successful reclose for transient faults that would otherwise result in
fuse operation & extended outages.
Rogue feeders 4 6 0.000 0.0Rogue feeders focuses mostly on improving service to worst served customers; its
impact on overall relability is small and tends to maintain the current trend.
Clashing 1 4 0.000 0.0Clashing mitigation reduces secondary damage; this program is on going with any
benefits imbedded in the long term SAIFI and SAIDI trends
Animal
proofing7 10 -0.013 -3.0
Targets localised possum issues and addresses worst served customers. There is a
growing level of replacements as early possum proofing techniques approach end-of-life.
Communications
upgrade0 4 0.000 -1.6 Resolution of communications to remote devices will improve restoration times.
Subtotal Reliability Performance 24 36
Environmental PE 2 5
Power Quality PQ 5 8
TS Rebuild replacement Other 0 5
IT initiatives IT not incl. -3.1 Includes two projects that deliver faster restoration times.
Subtotal "Other Repex" 45 112 -0.220 -37.9
REFCL 3 7
Other 22 46 All "Other" is Overhead conductors and is assessed above under Asset Replacement
Subtotal VBRC Safety Projects 24 53 0.0 0.0
SubTotal 437 0.41 0.38 39.4 30.9 564
Equipment Failure Actual 0.41 0.38 39.4 30.9 Forecastincrease
(+.0355 pa)0.55 0.47
increase
(+2.15 pa)48.0 32.1
Weather & Vegetation Actual 0.25 0.32 19.6 23.5 Forecastincrease
(+.0250 pa)0.35 0.28
increase
(+2.80 pa)30.8 19.5
Animal, 3rd Party, NCF Actual 0.34 0.32 18.9 18.4 Forecastfalling
(-.0075 pa)0.31 0.25
increase
(+2.10 pa)27.3 16.7
Reliability Performance + OT + IT Forecast -0.22 -37.9
Total Actual 1.00 1.01 77.9 72.8 Forecast flat 1.00 1.00falling
(-2.40 pa)68.2 68.3
Target Target 0.94 0.95 57.3 57.9 Target 1.00 1.00 68.3 68.3
CY11 - 15 CY16-20
pole top structures 102 21%increase
(+.024 pa)0.117 0.089
increase
(+2.7 pa)12.0 8.0
The combined spend in pole fire mitigation and cross arm replacement will be maintained
to address deteriorating reliability. Inspection methodology and inspection volumes have
been improved / increased.
27% 98 10%
Change to pole top camera inspections will improve condition assessment and
hence effectiveness of replacement capex. Higher inspection volumes (mid-
cycle Aerial) will improve coverage across asset base to better target capex.
0.075 0.057 6.5 3.9
0.011pole replacement & staking RP & RR 36 7%
flat to
increase
(+0.002 pa)
0.014 39 11%Maintain current pole management practice of staking poles once limited life
status is reached.
increase
(+0.0063 pa)
The increased spend for distribution and ZSS transformers addresses more equipment
reaching end of life in the next regulatory period, than in the current regulatory period.
switchgearThe increased spend addresses more equipment reaching end of life in the next
regulatory period, than in the current regulatory period.
0.037increase
(+0.275 pa)3.4 2.5
A modest increase in capex has been forecast reflecting a larger portion of poles
reaching the last 15% of their life. 0.039
flat to
increase
(+0.59 pa)
2.3 1.4 14%
Reliability Performance
not incl.
VBRC Safety Projects
transformers
Operational Technology Reliability
40%
60%
40%
60%

Network Reliability Assessment
RRP 5-4 - Network Reliability Assessment.docx Page 21 of 66
Table 2 also presents similar information for the 2016-2020 period.
Estimated percentage of the Asset Class in the wear out stage of its Life (in 2020) without the effect of replacement capex for 2016-2020
Replacement capex 2016-2020 (in $2015)
Estimated percentage of the Asset Class in the wear out stage of its Life (in 2020) with the effect of replacement capex in 2016-2020
Opex changes between the current and next regulatory period
The estimated SAIFI trend (2016-2020) and underlying average SAIFI if asset replacement alone occurs.
The estimated average SAIFI if replacement and reliability performance, OT and IT programs are implemented.
The estimated SAIDI trend (2016-2020) and underlying average SAIDI minutes if asset replacement alone occurs.
The estimated average SAIDI if replacement and reliability performance, OT and IT programs are implemented.
Comparing the estimated percentage of assets in the wear out stage of asset life in 2015 with that in 2020 both without replacement capex and with replacement capex identifies the proportion will increase from 19% to 28% without replacement capex, and from 19% to 23% with the proposed replacement capex. For all asset classes except pole top structures and zone substation switchgear and services the proportion of aged assets will increase even after the proposed expenditure.
The underlying reliability has been forecast assuming only the proposed replacement expenditure occurs and it demonstrates that the Repex alone will result in a considerable shortfall in reliability performance over the period 2016 – 2020.
The effect of our reliability programs (operational technology and performance) has been forecast and is presented in the table to demonstrate that with our Repex spend and these programs we will meet our obligations under the Rules to maintain reliability.
The blue bars in the table demonstrate that 40% of the improvement due to the reliability programs has been apportioned to equipment failures and 60% to all other causes. Most of the reliability programs provide improvement for all types of fault, however some programs, such as our bird and animal proofing programs, are targeted at particular network issues and do not affect all assets and will not, for example, provide benefits for those faults caused by equipment failures. The effect of each program on each asset has been considered when allocating the improvement in reliability across asset classes and fault causes.
5.2 Asset Replacement Capex and Opex
A summary of the effect of our Asset Replacement Capex and Opex programs on the performance of each asset class is provided below. More detailed information is provided in Section 6.
Pole Top Structures: Although the reliability of pole top structures has been deteriorating over 2011 - 2014 an increase in expenditure on the pole fire mitigation and cross arm replacement programs in 2014 and 2015 is expected to have reversed this trend. Expenditure will be maintained at similar levels in the forecast period and result in a reduction in the number of “aged” assets by 2020. A change to the pole top camera inspection will improve condition assessment and is expected to improve the effectiveness of replacement capex and ultimately result in an improvement in the performance of this asset class by 2020.
Pole Replacement and Staking: In period 2016 - 2020, the total number of poles that will be replaced or staked will increase but UE is proposing to increase the proportion of poles that are staked over those replaced. Expenditure on pole replacements will be maintained but there will be an increase expenditure on pole staking. The proportion of aged assets is forecast to increase from 7% to 11% of assets and deterioration in the reliability performance of this asset class is expected over the period to 2020 due the larger number of those “aged” assets.

Network Reliability Assessment
RRP 5-4 - Network Reliability Assessment.docx Page 22 of 66
Overhead Conductors: There will be no change in the current conductor management practice in the forecast period and conductors are usually run to failure. The exception is the replacement of the HV ABC which is failing prematurely and its replacement should reverse the deteriorating trends in recent years for that asset type.
Without the proposed replacement expenditure, the proportion of the overall asset class in the wear out stage will increase from 31% in 2015 to 48% by 2020. With the forecast expenditure, the percentage of assets will be at 46%. Some deterioration in the reliability performance of this asset class is expected over the period to 2020 due the larger number of “aged” assets.
Underground Cables: In the period 2016 – 2020, there is no change proposed to the current general practice of run to failure and then repair or replace. There is also no significant change in replacement or Opex expenditure on cables aimed at maintaining reliability. As a result a larger proportion of this asset will be approaching the end of its life by 2020 and its reliability performance is expected to deteriorate.
Zone Substation Assets – Transformers, Switchgear and Primary Plant: Zone substation assets are not affected by the day to day faults on the network that occur almost exclusively on poles and wires assets. Zone substation assets are notionally very reliable. Their failures, although infrequent, have a large impact on reliability because they restrict the ability of the network to supply power to large areas, potentially for long periods of time. Typically because of the enormous consequences of a failure and the relatively few numbers of these assets, their condition is individually assessed and assets are ideally replaced just before they fail. Expenditure levels in 2016 - 2020 are set to maintain the number of “aged” assets at current levels and maintain a similar reliability risk.
Distribution Transformers and Switchgear: There are no plans to change the current asset management practice for distribution switchgear and transformers. Unless problems are identified with particular types of equipment, the practice is to run to failure. If there are problems, particularly if the equipment poses a safety risk, it may be programed for replacement before it fails. With the levels of expenditure proposed the proportion of “aged” assets will increase by 2020 which is forecast to result in a small decrease in reliability of these assets.
Protection and Control: Protection and control systems are critical for the safe operation of the network and to prevent undue equipment damage when faults occur. With the levels of expenditure proposed, a larger proportion of this asset class will be approaching the end of life at the end of the period than at the start, increasing from 21% to 22%. The management of this asset class is complex as older electromechanical relays are replaced by ones with microprocessor technology. The electromechanical relays are high maintenance and, if maintained, can have a relatively long life. The microprocessor relays have a shorter life but have many other advantages such as zero maintenance and self-monitoring. Overall performance is expected to improve by 2020.
5.2.1. Effect of Replacement Program on Asset lives.
The proportion of older assets in the network is directly related to when the network was developed. Much of the network was first established in the 1960’s and 70’s and, with a typical 50-60 year life expectancy, is reaching the last stages of its life.
Our replacement forecast, using methodologies such as Weibull modelling or failure trends, are based on the average end of life under the current Asset Management practices. Our practices for most assets classes do not attempt to replace all assets before the end of life. Some assets will last longer than their replacement age and some not reach the average age and those with shorter lives will fail before they are replaced.
As the network ages, our models predict a larger number of assets at the end of life, but there will also be a larger number of assets which fail before they are replaced. This will cause deterioration in reliability. There is evidence of this deterioration in the current period where there has been a decrease in reliability as measured by SAIDI and SAIFI in spite of an increase in replacement expenditure. The deterioration trend is expected to continue in the forecast period in line with the larger number of assets approaching and reaching end of life.
As indicated in Table 2, Repex expenditure alone has been forecast to result in reliability deterioration during 2016-2020 compared to 2011-2015. UE propose programs that specifically target reliability as the most cost effective way of maintaining reliability.
Network Reliability Assessment
RRP 5-4 - Network Reliability Assessment.docx Page 23 of 66
5.3 Weather Vegetation and 3rd Party Faults.
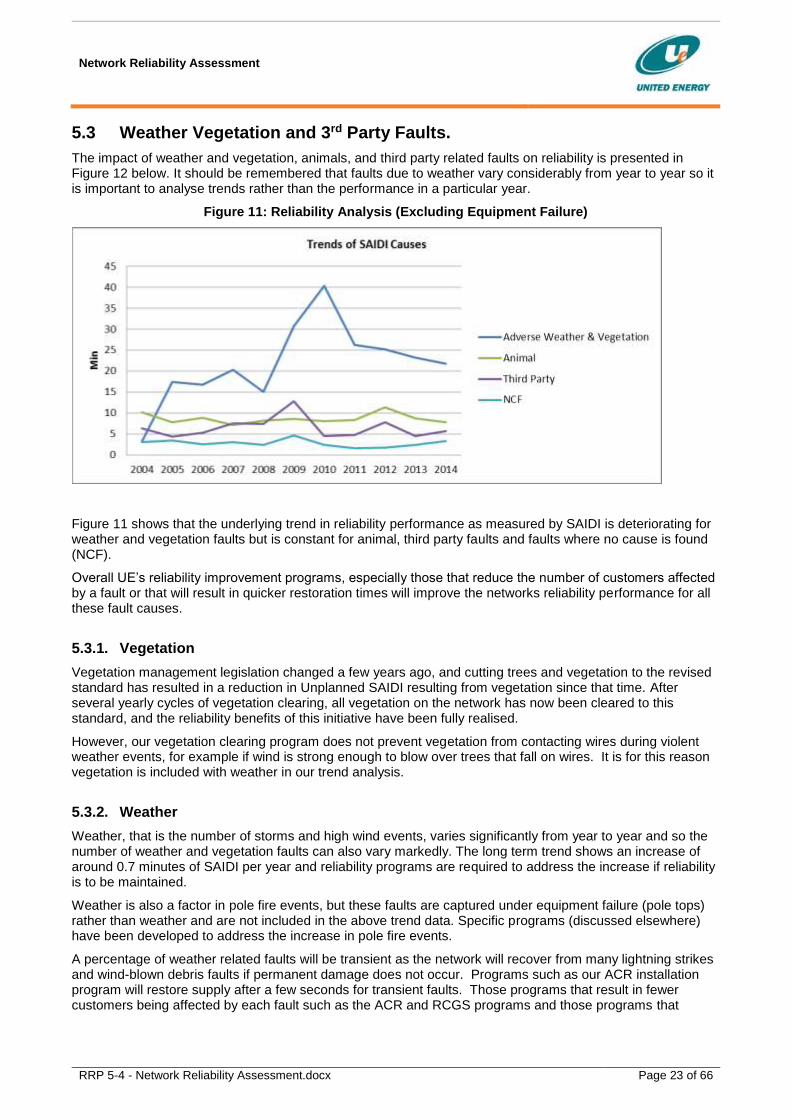
The impact of weather and vegetation, animals, and third party related faults on reliability is presented in Figure 12 below. It should be remembered that faults due to weather vary considerably from year to year so it is important to analyse trends rather than the performance in a particular year.
Figure 11: Reliability Analysis (Excluding Equipment Failure)
Figure 11 shows that the underlying trend in reliability performance as measured by SAIDI is deteriorating for weather and vegetation faults but is constant for animal, third party faults and faults where no cause is found (NCF).
Overall UE’s reliability improvement programs, especially those that reduce the number of customers affected by a fault or that will result in quicker restoration times will improve the networks reliability performance for all these fault causes.
5.3.1. Vegetation
Vegetation management legislation changed a few years ago, and cutting trees and vegetation to the revised standard has resulted in a reduction in Unplanned SAIDI resulting from vegetation since that time. After several yearly cycles of vegetation clearing, all vegetation on the network has now been cleared to this standard, and the reliability benefits of this initiative have been fully realised.
However, our vegetation clearing program does not prevent vegetation from contacting wires during violent weather events, for example if wind is strong enough to blow over trees that fall on wires. It is for this reason vegetation is included with weather in our trend analysis.
5.3.2. Weather
Weather, that is the number of storms and high wind events, varies significantly from year to year and so the number of weather and vegetation faults can also vary markedly. The long term trend shows an increase of around 0.7 minutes of SAIDI per year and reliability programs are required to address the increase if reliability is to be maintained.
Weather is also a factor in pole fire events, but these faults are captured under equipment failure (pole tops) rather than weather and are not included in the above trend data. Specific programs (discussed elsewhere) have been developed to address the increase in pole fire events.
A percentage of weather related faults will be transient as the network will recover from many lightning strikes and wind-blown debris faults if permanent damage does not occur. Programs such as our ACR installation program will restore supply after a few seconds for transient faults. Those programs that result in fewer customers being affected by each fault such as the ACR and RCGS programs and those programs that
Network Reliability Assessment
RRP 5-4 - Network Reliability Assessment.docx Page 24 of 66
restore supply more quickly such as our distribution automation project and our project to improve communications to field devices will also improve reliability.
The overall effect of these programs is expected to see an improvement in the reliability over the 2016-2020 period with the average number of customers affected by each weather and vegetation event and the average outage time for each event reducing. Without the programs, the underlying forecast increase in SAIFI is from an average of 0.32 to 0.35 interruptions and an increase in average SAIDI from 23.5 to 30.8 minutes. The reliability programs are forecast to improve SAIFI to 0.28 interruptions and SAIDI to 19.5 minutes respectively for weather related faults.
5.3.3. Animals
United Energy currently carries out bird and animal proofing programs, with projects that target specifically this category of faults. The program has been running for a number of years and has resulted in a constant reliability performance from this cause. The level of funding for the programs will continue at current levels.
Once again, our programs that address the number of customers that are affected by a fault or allow supply to be restored more quickly will also improve the reliability outcomes for these types of faults. Therefore unreliability caused by birds and animals is expected to improve slightly.
5.3.4. 3rd Party Related Faults
Third party related faults and faults where no cause is found each contribute to a small proportion of the reliability indices. They have had a constant trend over the last 10 years, neither increasing nor decreasing, and this underlying trend is expected to continue. However, it will be offset by our reliability programs as described in the previous sections, resulting in an overall improvement in performance.
The overall effect of the reliability programs is an improvement in the reliability over the 2016-2020 period with the average number of customers affected by each event and the average outage time for each event reducing. Without the programs, we are forecasting a slight decrease in SAIFI from an average of 0.32 to 0.31 interruptions and an increase in average SAIDI from 18.4 to 27.3 minutes. The programs are forecast to improve SAIFI to 0.25 interruptions and SAIDI to 16.7 minutes.
5.4 Reliability Performance, OT and IT Projects
As already discussed in Section 5.2, with UE’s investment in replacing assets over the next five years, there will be more older assets and more asset failures which will result in deteriorating reliability. Instead, UE is proposing to expend $35.8M on network reliability projects, $6.8M on operational technology projects and about $6.0M in IT projects that directly bridge the estimated shortfall in reliability both for equipment failures and other causes.
The effect of these reliability projects should be assessed in the context that some of them are on-going projects. Arguably, the current number of projects, at the historic levels of expenditure, has not been sufficient because they have resulted in deteriorating trends in reliability. Therefore an increase in expenditure in some programs is warranted. As shown in Table 2, UE is forecasting an increase from $24.1M to $35.8M8 in reliability projects.
Our Repex also includes Operational Technology (OT) projects which are characterised by smart technology that can deliver a range of benefits including a contribution to maintaining network reliability. They are ranked in a similar way to reliability performance projects.
Detail on the reliability performance, IT and OT projects are presented in detail in Section 8.
8 Of the $77M of expenditure proposed, $42M is for projects that provide a reliability benefit. The remained provide a range of benefits including safety and better network management.

Network Reliability Assessment
RRP 5-4 - Network Reliability Assessment.docx Page 25 of 66
5.5 Forecast Overall Network Reliability Indices
The forecast reliability performance for the 2015 to 2020 period is presented in Table 3. This considers the both the effects of the deteriorating network performance due to the aging of our assets, and the impact and timing of our investment proposals. These programs aim to maintain reliability in 2016-2020 at the same average level as achieved in the 2011-2015 period.
United Energy will implement its performance plans mainly in 2015 and 2016. In particular, ACR and RCGS installations including communications upgrades have commenced and stage one will be completed in the current period, by 2015. These projects will provide a step improvement in reliability which will be seen in the calendar year 2016. Additional similar projects will be completed in 2016 and provide further improvements in 2017.
Table 3: Forecast Reliability Indices
Year
Index 2015 2016 2017 2018 2019 2020 Average 2016-20
SAIDI 84.8 68.9 60.1 65.6 71.3 77.2 68.6
SAIFI 1.06 0.98 0.93 0.98 1.04 1.09 1.00
CAIDI 80.1 70.3 64.4 66.6 68.8 71.0 68.3
Table 3 demonstrates that most benefit will therefore occur by 2017, with an improvement in all indices (SAIFI, SAIDI and CAIDI). This is shown in the following three charts which show actual and forecast performance from 2004 – 2020.
After the completion of the ACR and RCGS programs, reliability expenditure will reduce and will not be sufficient to prevent deterioration network in reliability performance toward the end of period because the equipment failure rates will continue to increase as more equipment reaches the wear out stage of its life and because the drivers for the increase in CAIDI remain (as discussed in Section 8). However, the average performance for the period 2016 - 20 will be the same as the current period.

Network Reliability Assessment
RRP 5-4 - Network Reliability Assessment.docx Page 26 of 66
Figure 12: Total Network SAIDI Actual and Forecast
Figure 13: Total Network SAIFI Actual and Forecast
Figure 14: Total Network CAIDI Actual and Forecast

Network Reliability Assessment
RRP 5-4 - Network Reliability Assessment.docx Page 27 of 66
6. Impact of Asset Replacement by Asset Class
Capital works programs for asset replacement, augmentation, information technology and reliability as well as our Opex initiatives will all contribute to maintaining reliability but will affect different assets to a lesser or greater degree depending on the program and the asset type.
Section 5 has summarised the impact of all investments to maintain reliability, describing the current trends in the performance of each asset class together with the forecast impact of the various programs on their reliability. This section provides some detail for each asset replacement and opex program and the benefits each will provide. Section 7 provides details of reliability performance, IT and OT programs.
In this section we provide further comment on each asset class, its current performance and how the asset class is affected by the various programs. These comments should be read in conjunction with the appropriate asset Life Cycle Strategies (LCS) and Category Expenditure Explanatory Statements (CEES).
In 2014, equipment failure contributed to 51.9% of SAIDI, weather and vegetation 26.2% and other causes 21.9%. This section focuses on outages caused by equipment failure. The following table provides the proportion of SAIDI caused by equipment failure by asset class and identifies 6 asset classes that contribute 99% of outages. Other classes of assets currently have little effect on reliability.
Table 4: Contribution to SAIDI of Equipment Failure (2014).
Equipment Contribution to SAIDI %
Pole Top Structures 27%
Poles 6%
Conductors 20%
Underground cables 25%
Distribution Switchgear 13%
Distribution transformers 7%
Total 99%
This section focuses on each of these six classes of equipment and how the expenditure program affects their forecast reliability. Some comment is also provided on zone substation assets, which currently do not significantly contribute to reliability. However, if these assets fail can affect a very large number of customers so some comment on their reliability is warranted.
6.1 Pole Top Structures
Please refer to the following documents for more information on this asset class.
References:
Pole Top Structures Life Cycle Strategy: UE PL 2006
Category Expenditure Explanatory Statement Pole Top Structures: NET 448
6.1.1. Background:
Pole Top Structures consist of HV and LV cross arms and cross arm hardware. They have contributed significantly to deteriorating reliability in the current period. In particular the trend has deteriorated since 2010 demonstrated by the SAIDI and SAIFI charts below.

Network Reliability Assessment
RRP 5-4 - Network Reliability Assessment.docx Page 28 of 66
Figure 15: Pole Tops Historical Reliability Performance - SAIDI
Figure 17 and Figure 18 show the SAIDI and SAIFI 10 year historical trend for pole top faults and the projected trends for the period 2016 – 2020 with and without mitigation9. Historical trends show deterioration to SAIFI, indicating that an increasing number of customers are being affected by pole top faults.
Figure 16: Pole Top Historical Reliability Performance - SAIFI
Pole top structures are found on both LV and HV feeders but HV pole tops faults have a much greater effect on reliability because many more customers are affected by each fault.
Failure modes can be divided into mechanical failure and electrical failure. In mechanical failure, when the cross arms deteriorate, the cross arms break or the pole top hardware, such as insulators, become loose or even fall off the pole.
Electrical failure is failure of the insulation which may cause a flashover or leakage currents. Leakage currents, in turn, can cause pole fires. Electrical failure may be caused by a cracked insulator or by dust and
9 “Before Mitigation” represents the effect of repex alone. “After Mitigation” includes both repex, reliability performance, OT and IT projects.
y = 0.0022x - 4.4201
0.000
0.020
0.040
0.060
0.080
0.100
0.120
0.140
0.160
2004 2006 2008 2010 2012 2014 2016 2018 2020
SAIFI contribution from Pole Top Failures
HistoricalForecast - Before MitigationForecast - After Mitigation

Network Reliability Assessment
RRP 5-4 - Network Reliability Assessment.docx Page 29 of 66
pollution building up on the insulator. Alternately, animals and birds could bridge an insulator causing a flashover.
Failures are classified broadly into two groups:-
those that are caused a cross arm fire and are weather dependant and
those that are due to all other causes and are usually associated with equipment failure.
Pole fires have increased significantly over the period 2011 – 2014. Although pole fires are weather related, fires can be prevented by tightening hardware (Opex) and by replacing insulators or replacing wooden cross arms with steel ones. UE has already initiated programs to address the increase in the number of pole fires which includes a cross arm replacement program and a new camera inspection technique.
Cross-arm failures due to causes other than pole fires increased significantly over the period 2011-2013 but decreased in 2014 due to a new replacement program.
The regulatory proposal involves
Replacement capex of approximately $98M (in $2015) over the forecast period, which is about 5% less than the current period.
An Opex initiative using camera technology to provide better inspections and better target replacement.
A significant increase in replacements in 2014 and 2015 coupled with the forecast replacement capex and the Opex initiative for the forthcoming regulatory period are forecast to abate the recent upward trend in faults and return asset performance to historic levels. As a result of the current period programs, the number of assets in the wear out stage of their life has decreased since 2013. With the proposed expenditure for the forecast period the number of “aged” pole tops will continue to fall throughout the forecast period.
Figure 17: Pole Tops: Assets at High Risk of Failure
6.1.2. Effect of Various Programs;
For this asset class, the combined spend in pole fire mitigation and cross arm replacement will be maintained close to historical level to improve reliability. Without the proposed replacement expenditure, the proportion of these assets in the wear out stage of life will increase from 18% in 2014 to 27% in 2020. With the forecast expenditure, the percentage of assets will reduce to 10%.
With respect to unreliability due to pole fires in particular, the change to pole top camera inspections is expected to result in better targeted capex and a reduction in the number of faults.
The new camera initiative to inspect pole tops will allow better targeted replacements and together with forecast capex expenditure will improve the reliability of this asset. Improvement is expected in spite of a modest reduction in capital expenditure.

Network Reliability Assessment
RRP 5-4 - Network Reliability Assessment.docx Page 30 of 66
In addition, those reliability projects that provide improvement by reducing the number of customers affected by a fault (e.g. ACR and RCGS projects) or by reducing the time to restore (e.g. remote communications and distribution automation) will provide some additional modest improvement in reliability for this asset class.
SAIDI for this asset class is expected to reduce from 8.0 (average 2011 to 2014) to 3.9 minutes (average 2016 to 2020).
For SAIFI, a reduction from 0.089 (average 2011 to 2014) to 0.057 interruptions (average 2016 to 2020) is forecast for this asset class.
6.2 Poles
Please refer to the following documents for more information on this asset class.
References:
Pole Inspection and Replacement Regime Life Cycle Strategy: UE PL 2005
Category Expenditure Explanatory Statement Poles Structures: NET 447
6.2.1. Background
The pole asset class applies to subtransmission, HV and LV poles and includes wooden and staked wooden poles, concrete poles and steel poles. When they fail, poles have a large impact on network reliability, public safety and fire and bushfire start risk. The long-term failure rate is an average of four poles per year.
The trends in reliability performance of poles are provided in the following two charts. The ten year reliability trend shows a decrease in SAIDI. The trend in SAIFI for the current period also shows a decrease in how often customers affected by a failure.
When compared with pole top structures, this asset class has a much smaller contribution to reliability.
Figure 18: Pole Historical Reliability Performance – SAIDI

Network Reliability Assessment
RRP 5-4 - Network Reliability Assessment.docx Page 31 of 66
Figure 19: Pole Historical Reliability Performance – SAIFI
Wooden poles are replaced following inspection by drilling into the pole and establishing how much “good wood” remains. A decision is then taken either to replace the pole or to extend its life by staking. Presently about 60% of poles that are at end of life are staked.
Expenditure for the forecast period for pole replacement and staking programs is predicted to be $38.5M and shows a modest (7%) increase over the current period. This is due to an increase in both the number of poles replaced and the number to be staked.
In spite of this increase in expenditure the age profile of the poles shows an increasing number of poles which will exceed 85% of their life in 2020 when compared with 2014. Taken at face value this means that there will be more pole failures in the forecast period.
Figure 20: Poles Assets at High Risk of Failure
6.2.2. Effect of Various Programs
There has been no change in the current pole management practice of inspection and then staking poles once limited life status is reached. A modest increase in capex has been forecast reflecting a larger proportion of poles reaching the end of their life. It is expected that there will be a modest deterioration in the reliability of this asset class associated with the higher number of older assets.
Without the proposed replacement expenditure, the proportion of these assets in the wear out stage of life will increase from 7% in 2014 to 14% in 2020. With the forecast expenditure, the percentage of assets will be at 11%.
y = -0.0023x + 4.6872
0.000
0.010
0.020
0.030
0.040
0.050
0.060
2004 2006 2008 2010 2012 2014 2016 2018 2020
SAIFI contribution from Pole Failures

Network Reliability Assessment
RRP 5-4 - Network Reliability Assessment.docx Page 32 of 66
Since 2004 the performance of this asset class has been improving as the proportion of aged assets has reduced. However, it is expected that this trend will not continue in the forecast period and some deterioration in performance of this asset may be expected because there are more aged assets. Their performance will be slightly improved by some of our reliability programs, particularly those such as the ACR and RCGS programs which will result in fewer customers being affected by each fault.
SAIDI for this asset class is expected to increase from 1.4 minutes (average 2010 to 2014) to 2.5 minutes (average 2016 to 2020) during the regulatory period.
For SAIFI, an increase from 0.011 (average 2011 to 2014) to 0.037 interruptions (average 2016 to 2020) is forecast for this asset class.
6.3 Overhead Conductors and Connectors
Please refer to the following documents for more information on this asset class.
References:
Connectors and Conductors Life Cycle Strategy: UE PL 2007
Category Expenditure Explanatory Statement Connectors and Conductors: NET 449
Single Wire earth Return (SWER): UE PL 2052.
High Voltage Aerial Bundled Cable Replacement: UE PJ-0131-0
6.3.1. Background
This asset class includes overhead conductors, including covered conductors, for low voltage, high voltage distribution and subtransmission networks as well as the connectors, spreaders and dampers for each asset. The reliability performance shows a deteriorating trend over a ten year period. This is demonstrated in the following two charts:-
Figure 21: Conductor Historical Reliability Performance – SAIDI.
The reliability performance as measured by SAIDI shows a deteriorating trend.

Network Reliability Assessment
RRP 5-4 - Network Reliability Assessment.docx Page 33 of 66
Figure 22: Conductor Historical Reliability Performance – SAIFI.
Reliability as measured by SAIFI is also showing a deteriorating trend, albeit at a lower rate of increase than SAIDI.
The performance of this asset class has been deteriorating and it has a significant effect on reliability because off the large number of customers affected by the outage of HV feeders. Current levels of performance are not being maintained. In particular, the performance of HV ABC has deteriorated quickly over the past few years due to a fault in the design of the cables installed.
The regulatory proposal involves:-
For the bulk of the assets, no change in the current general practice of run to failure, then repair or replacement.
For HV ABC, a program to replace the cable both for reliability and for safety to address bush fire risk.
For safety reasons the installation of armour rods and vibration dampers and LV spreaders will occur as required by ESV issued directives.
A large portion of the capital expenditure will be on the programs to replace the HV ABC. However, little replacement expenditure is proposed on the remainder of the conductor assets.
Figure 23: Conductors: Assets at High Risk of Failure
The result of the proposed expenditure levels is that there will be an increasing amount of assets that exceed 85% of their life. An increase in failure rate is expected due to net condition deterioration due to there being more, older assets.
y = 0.0016x - 3.1599
0.000
0.050
0.100
0.150
0.200
2004 2006 2008 2010 2012 2014 2016 2018 2020
SAIFI contribution from Overhead Conductor Failures
Historical

Network Reliability Assessment
RRP 5-4 - Network Reliability Assessment.docx Page 34 of 66
6.3.2. Effect of Various Programs
As discussed, there has been no change in the current conductor management practice and conductors are usually run to failure. With a few exceptions, the conductor is in good condition. Failures occur in localities where damage or corrosion has occurred and a replacement of a small section of cable is carried out to make repair. Wholesale replacement is not usually warranted. An exception is HV ABC and its replacement should reverse the deteriorating trends of that asset type in the recent years.
Without the proposed replacement expenditure, the proportion of these assets in the wear out stage of life will increase from 32% in 2014 to 48% in 2020. The forecast expenditure addresses only one type conductor so the percentage of aged assets remains at a similar level and will be at 46%.
Those reliability programs that provide benefits for all asset types, particularly those such as the ACR and RCGS programs which result in fewer customers being affected by each fault, will provide some modest improvement in reliability performance for this asset class and will partially offset the increasing trends in reliability.
SAIDI for this asset class is forecast to increase from 5.6 minutes (average 2010 to 2014) to 8.5 minutes (average 2016 to 2020).
For SAIFI, an increase from 0.069 (average 2011 to 2014) to 0.125 interruptions (average 2016 to 2020) is forecast for this asset class.
6.4 Underground Cable
Please refer to the following documents for more information on this asset class.
References:
Underground Cable Systems Life Cycle Strategy: UE PL 2017
Category Expenditure Explanatory Statement Underground Cable Systems: NET 450
6.4.1. Background
This asset class includes a variety of assets - LV and HV underground cables, LV pits and pillars and lightning and surge diverters. A program to replace LV pillars in the Doncaster area has been occurring during the current period, and will extend into the forecast period. These pillars are being replaced as part of a public safety program.
In 2014 underground cable faults contributed to about 25% of SAIDI and SAIFI due to equipment failures. The historical trends show a moderate increase in SAIDI over a ten year timeframe with a sharper increase over the last four years. SAIFI has also increased significantly over the last four years. This is consistent with the step increase after 2009 in the proportion of assets in the wear out stage of life. These trends are illustrated in the following charts.
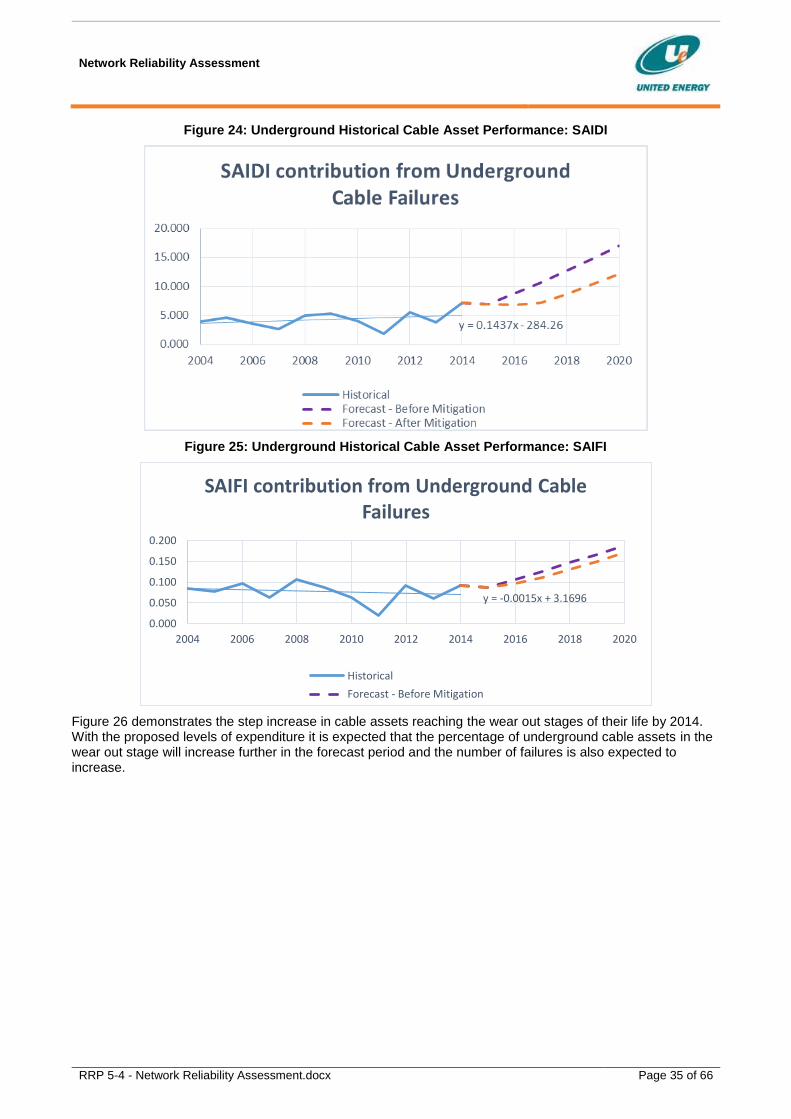
Network Reliability Assessment
RRP 5-4 - Network Reliability Assessment.docx Page 35 of 66
Figure 24: Underground Historical Cable Asset Performance: SAIDI
Figure 25: Underground Historical Cable Asset Performance: SAIFI
Figure 26 demonstrates the step increase in cable assets reaching the wear out stages of their life by 2014. With the proposed levels of expenditure it is expected that the percentage of underground cable assets in the wear out stage will increase further in the forecast period and the number of failures is also expected to increase.
y = -0.0015x + 3.1696
0.000
0.050
0.100
0.150
0.200
2004 2006 2008 2010 2012 2014 2016 2018 2020
SAIFI contribution from Underground Cable Failures
Historical
Forecast - Before Mitigation

Network Reliability Assessment
RRP 5-4 - Network Reliability Assessment.docx Page 36 of 66
Figure 26: Underground Cables: Assets at High Risk of Failure
There is no change proposed to the current general practice of run to failure and then repair or replace. There is also no significant change proposed in replacement or Opex expenditure on cables. As a result a larger proportion of this asset will be approaching the end of its life by 2020. The forecast is thus for an increasing trend in SAIDI and SAIFI given that we are not proposing to change our asset management practices and a larger proportion of assets will be “aged”.
6.4.2. Effect of Various Programs
As discussed, there has been no change in the current underground cable management practice and cables are usually run to failure.
With the proposed replacement expenditure, the proportion of these assets at higher risk of failure because of age will increase from 15% in 2014 to 19% in 2020.
UE’s reliability programs for ACR’s and RCGS address the overhead network only and will not provide improvement for underground cable failures. There are no plans to further sectionalise underground feeders. As a result the trends in failure rates are expected to continue in accordance with those which currently occur.
SAIDI for this asset class is forecast to increase from 4.6 minutes (average 2010 to 2014) to 9.1 minutes (average 2016 to 2020).
For SAIFI, an increase from 0.066 (average 2011 to 2014) to 0.132 interruptions (average 2016 to 2020) is forecast for this asset class.
6.5 Distribution Switchgear
Please refer to the following documents for more information on this asset class.
References:
Overhead line Switchgear Life Cycle Strategy: UE PL 2008
Non Pole Substation Life Cycle Strategy: UE PL 2015
HV Out door Fuses Life Cycle Strategy UE PL 2012
Overhead Line Capacitor Life Cycle Strategy UE PL 2009
ACR Life Cycle Strategy UE PL 2010
Category Expenditure Explanatory Statement Distribution Switchgear: NET 453

Network Reliability Assessment
RRP 5-4 - Network Reliability Assessment.docx Page 37 of 66
Distribution switchgear asset category includes quite a variety of equipment such as:-
HV and LV Fuses
Ring Main Units
HV and LV Air-break Switches
HV isolators
Automatic Circuit Re-Closers (ACR)
HV Gas (SF6) Insulated Switches (MGS and RCGS)
Line capacitors, controllers and vacuum switches.
6.5.1. Background
The replacement strategies vary across these asset types. Some are being replaced because of safety issues; some are being run to failure. Please refer to the relevant life cycle management strategy for further information.
Figure 27: Distribution Switchgear Historical Asset Performance: SAIDI
The reliability trend in switchgear has shown a deteriorating trend over the last 10 year period as demonstrated from the SAIDI and SAIFI performances both of which are both showing a deteriorating trend.
y = 0.3768x - 753.45
0.000
2.000
4.000
6.000
8.000
2004 2006 2008 2010 2012 2014 2016 2018 2020
SAIDI contribution from Distribution Switchgear & Fuse Failures
HistoricalForecast - Before MitigationForecast - After Mitigation

Network Reliability Assessment
RRP 5-4 - Network Reliability Assessment.docx Page 38 of 66
Figure 28: Distribution Switchgear Historical Asset Performance: SAIFI
The asset management and replacement practice for switchgear is not changing. Replacement expenditure is forecast to increase in line with an increased number of assets reaching the end of their life. At the same time an increasing number of these assets will reach the wear out stage of life by 2020.
Figure 29: Distribution Switchgear: Assets at High Risk of Failure
Figure 31 demonstrates that with the proposed levels of expenditure there will be an increase in distribution switchgear assets reaching the wear out stage of their life by 2020. It is expected that the underlying failure rate will increase as the number of aged assets increases.
6.5.2. Effect of Various Programs
As discussed, there has been no change in the current asset management practice and switchgear is usually run to failure. There are some types of HV switchgear which have known problems and these have been targeted for replacement prior to end of life, often because they are unsafe to operate.
Without the proposed replacement expenditure, the proportion of these assets which reach the wear out stage of their life will increase from 16% in 2015 to 28% in 2020. With the forecast expenditure, the percentage of assets will be at 23%. A number of the aged assets are low voltage switchgear assets whose failure does not affect reliability to a great degree and which are run to failure.

Network Reliability Assessment
RRP 5-4 - Network Reliability Assessment.docx Page 39 of 66
Those reliability programs that provide benefits for all asset types on the overhead HV network, particularly those such as the ACR and RCGS programs which result in fewer customers being affected by each fault, will provide improvement in this asset class and will more than address the deteriorating trends in reliability due to age.
SAIDI for this asset class is forecast to decrease from 4.5 minutes (average 2010 to 2014) to 2.7 minutes (average 2016 to 2020).
For SAIFI, a decrease from 0.049 (average 2011 to 2014) to 0.040 interruptions (average 2016 to 2020) is forecast for this asset class.
6.6 Distribution Transformer
Please refer to the following documents for more information on this asset class.
References:
Pole Top Transformer Life Cycle Strategy: UE PL 2014
Non Pole Substation Life Cycle Strategy: UE PL 2015
Category Expenditure Explanatory Statement Distribution Pole Top Transformers
Category Expenditure Explanatory Statement Distribution Non-Pole Distribution Substations
6.6.1. Background
This asset class includes pole mounted single phase and multiphase transformers, pad mounted transformers and kiosk transformers. They are installed on UE’s overhead and underground HV networks and transform the voltages from high to low voltage.
In 2014, distribution transformers contributed to 7.2% of SAIDI caused by equipment failure. Trends in SAIDI and SAIFI for transformers are shown in the following two charts:-
Figure 30: Distribution Transformer Historical Reliability Performance: SAIDI
y = 0.0059x - 9.3796
0.000
1.000
2.000
3.000
4.000
5.000
2004 2006 2008 2010 2012 2014 2016 2018 2020
SAIDI contribution from Distribution Transformer Failures
HistoricalForecast - Before MitigationForecast - After Mitigation
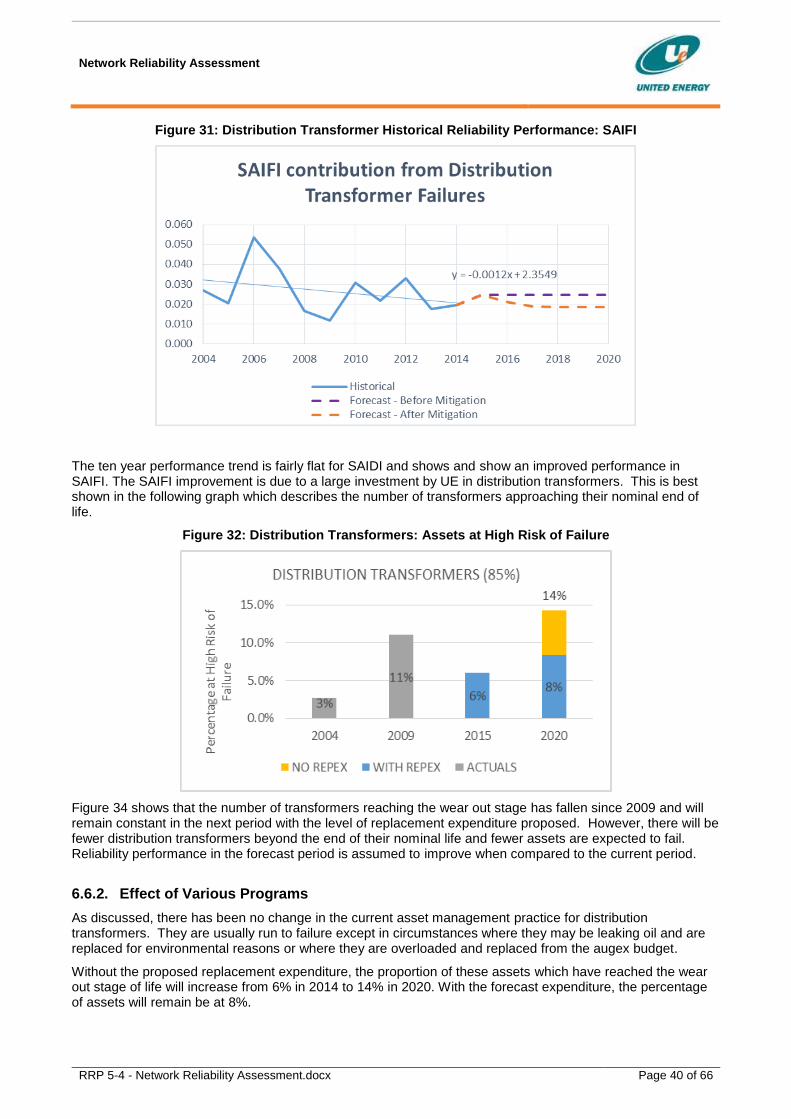
Network Reliability Assessment
RRP 5-4 - Network Reliability Assessment.docx Page 40 of 66
Figure 31: Distribution Transformer Historical Reliability Performance: SAIFI
The ten year performance trend is fairly flat for SAIDI and shows and show an improved performance in SAIFI. The SAIFI improvement is due to a large investment by UE in distribution transformers. This is best shown in the following graph which describes the number of transformers approaching their nominal end of life.
Figure 32: Distribution Transformers: Assets at High Risk of Failure
Figure 34 shows that the number of transformers reaching the wear out stage has fallen since 2009 and will remain constant in the next period with the level of replacement expenditure proposed. However, there will be fewer distribution transformers beyond the end of their nominal life and fewer assets are expected to fail. Reliability performance in the forecast period is assumed to improve when compared to the current period.
6.6.2. Effect of Various Programs
As discussed, there has been no change in the current asset management practice for distribution transformers. They are usually run to failure except in circumstances where they may be leaking oil and are replaced for environmental reasons or where they are overloaded and replaced from the augex budget.
Without the proposed replacement expenditure, the proportion of these assets which have reached the wear out stage of life will increase from 6% in 2014 to 14% in 2020. With the forecast expenditure, the percentage of assets will remain be at 8%.
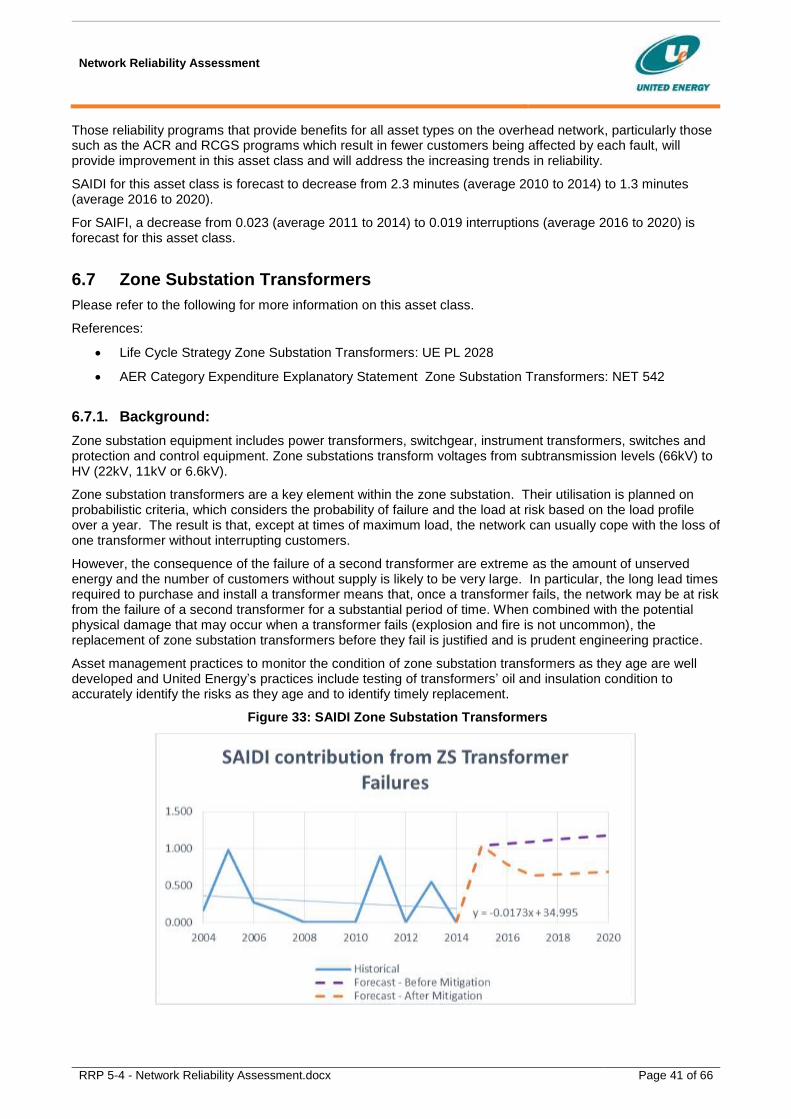
Network Reliability Assessment
RRP 5-4 - Network Reliability Assessment.docx Page 41 of 66
Those reliability programs that provide benefits for all asset types on the overhead network, particularly those such as the ACR and RCGS programs which result in fewer customers being affected by each fault, will provide improvement in this asset class and will address the increasing trends in reliability.
SAIDI for this asset class is forecast to decrease from 2.3 minutes (average 2010 to 2014) to 1.3 minutes (average 2016 to 2020).
For SAIFI, a decrease from 0.023 (average 2011 to 2014) to 0.019 interruptions (average 2016 to 2020) is forecast for this asset class.
6.7 Zone Substation Transformers
Please refer to the following for more information on this asset class.
References:
Life Cycle Strategy Zone Substation Transformers: UE PL 2028
AER Category Expenditure Explanatory Statement Zone Substation Transformers: NET 542
6.7.1. Background:
Zone substation equipment includes power transformers, switchgear, instrument transformers, switches and protection and control equipment. Zone substations transform voltages from subtransmission levels (66kV) to HV (22kV, 11kV or 6.6kV).
Zone substation transformers are a key element within the zone substation. Their utilisation is planned on probabilistic criteria, which considers the probability of failure and the load at risk based on the load profile over a year. The result is that, except at times of maximum load, the network can usually cope with the loss of one transformer without interrupting customers.
However, the consequence of the failure of a second transformer are extreme as the amount of unserved energy and the number of customers without supply is likely to be very large. In particular, the long lead times required to purchase and install a transformer means that, once a transformer fails, the network may be at risk from the failure of a second transformer for a substantial period of time. When combined with the potential physical damage that may occur when a transformer fails (explosion and fire is not uncommon), the replacement of zone substation transformers before they fail is justified and is prudent engineering practice.
Asset management practices to monitor the condition of zone substation transformers as they age are well developed and United Energy’s practices include testing of transformers’ oil and insulation condition to accurately identify the risks as they age and to identify timely replacement.
Figure 33: SAIDI Zone Substation Transformers
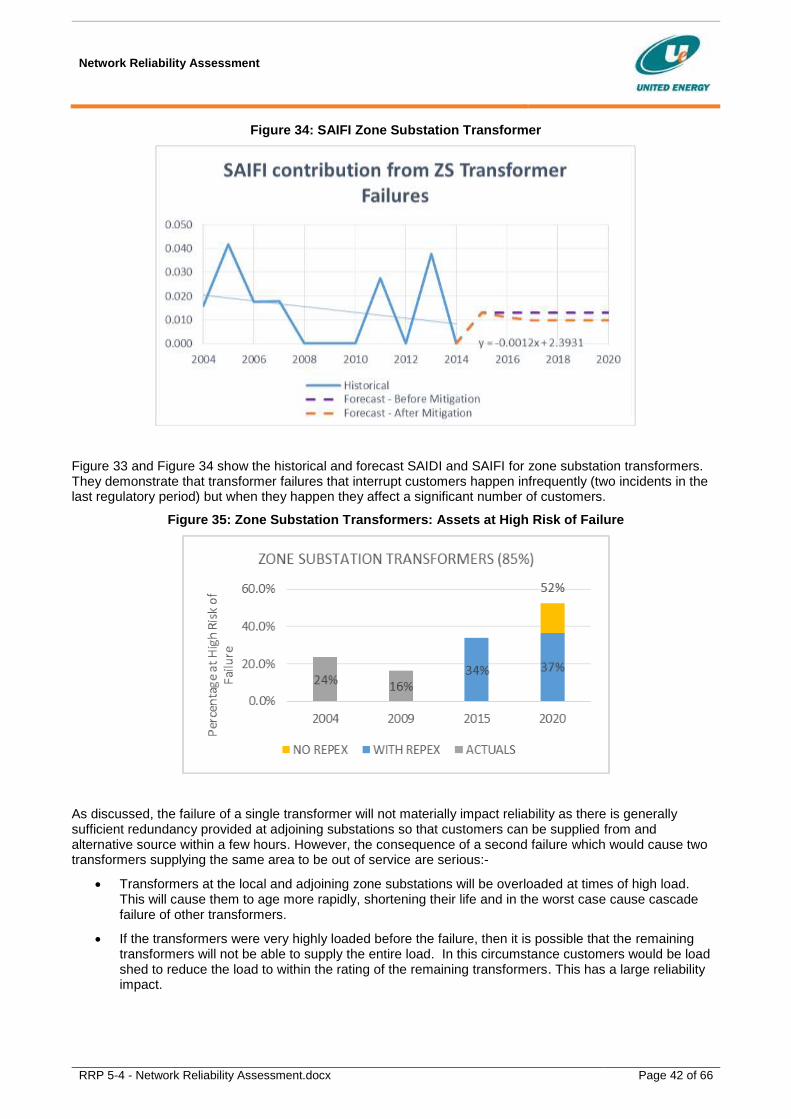
Network Reliability Assessment
RRP 5-4 - Network Reliability Assessment.docx Page 42 of 66
Figure 34: SAIFI Zone Substation Transformer
Figure 33 and Figure 34 show the historical and forecast SAIDI and SAIFI for zone substation transformers. They demonstrate that transformer failures that interrupt customers happen infrequently (two incidents in the last regulatory period) but when they happen they affect a significant number of customers.
Figure 35: Zone Substation Transformers: Assets at High Risk of Failure
As discussed, the failure of a single transformer will not materially impact reliability as there is generally sufficient redundancy provided at adjoining substations so that customers can be supplied from and alternative source within a few hours. However, the consequence of a second failure which would cause two transformers supplying the same area to be out of service are serious:-
Transformers at the local and adjoining zone substations will be overloaded at times of high load. This will cause them to age more rapidly, shortening their life and in the worst case cause cascade failure of other transformers.
If the transformers were very highly loaded before the failure, then it is possible that the remaining transformers will not be able to supply the entire load. In this circumstance customers would be load shed to reduce the load to within the rating of the remaining transformers. This has a large reliability impact.

Network Reliability Assessment
RRP 5-4 - Network Reliability Assessment.docx Page 43 of 66
Load will be at risk for several months as transformers typically take several months to be ordered and constructed and weeks to be installed.
United Energy has developed its transformer replacement program based on business cases that consider the
likely failure and consequence of more than one transformer, considering the load and number of customers
supplied by each transformer and the load on the transformers at adjoining zone substations.
6.7.2. Effect of Various Programs
Most reliability and performance programs are focussed on the distribution assets where most faults occur and have little impact on the reliability within zone substations. Within zone substations, condition monitoring is generally used to identify equipment in poor condition and to replace or repair it before it fails. Our proposed OT programs included more advance transformer monitoring and will allow us better target the replacement timing of transformers. The programs are not expected to have a significant impact of reliability.
6.8 Zone Substation Switchgear
Please refer to the following for more information on this asset class.
References:
Life Cycle Strategy Zone Substation Circuit Breakers: UE PL 2023
AER Category Expenditure Explanatory Statement Zone Substation Switchgear: NET 453
6.8.1. Background
As with transformers, zone substation switchgear is critical infrastructure and required to safety operate the high voltage distribution network.
Failure of other zone substation switchgear, such as a single circuit breaker will have an immediate effect by tripping of a feeder or a busbar. This happens infrequently but, when it does, it often affects a significant number of customers. For example the failure of a circuit breaker can cause the outage of a feeder which may cause loss of supply to a few thousand customers or tripping of a busbar will generally affect three or four time that many customers.
Figure 37 and Figure 38 show the historical SAIDI and SAIFI for circuit breakers and demonstrate that circuit breaker failure happens infrequently but can affect a significant number of customers when it occurs.
Figure 36: SAIDI Zone Substation Circuit Breakers

Network Reliability Assessment
RRP 5-4 - Network Reliability Assessment.docx Page 44 of 66
Figure 37: SAIFI Zone Substation Circuit Breakers
When a piece of zones substation switchgear fails, customers can generally be re-supplied, but network operation will be constrained until the equipment is replaced or repaired. United Energy has developed its switch gear replacement program based on business cases that consider the likely failure and its consequence of individual switchgear, considering the load and number of customers likely to be affected by the outages.
Figure 38: Zone Substation Switchgear: Assets at High Risk of Failure
6.8.2. Effect of Various Program
Most reliability and performance programs are focussed on the distribution assets where most faults occur and have little impact on the reliability within zone substations.
As the failure of a circuit breaker often will cause the outage of one or more feeders, it significantly will affect reliability. Within zone substations, condition monitoring is generally used to identify equipment in poor condition and to replace or repair it before it fails. Our proposed OT programs included more advance switchgear monitoring and will allow us better target the replacement timing. The programs are not expected to have a significant impact of reliability.

Network Reliability Assessment
RRP 5-4 - Network Reliability Assessment.docx Page 45 of 66
6.9 Protection and Control Equipment.
Please refer to the following for more information on this asset class.
References:
AER Category Expenditure Explanatory Statement Zone Substation Protection and Control Relays: NET 455
Life Cycle Strategy Zone Substation Protection and Control Relays: UE PL 2027
6.9.1. Background
The purpose of protection and control systems is to monitor operating conditions on an electrical circuit and to trip circuit breakers when a fault is detected. The protection and control systems consist of multiple types of schemes depending on the configuration of the zone substation. The schemes are designed to isolate only the components that are under fault, whilst leaving as much of the network as possible still in operation, so as to minimise the number of customers affect by a fault. Protection and control schemes are key to the safe operation of the electricity network. The schemes prevent damage to primary equipment, maintain quality and reliability of supply to customers and ensure the safe operation of the distribution and subtransmission networks.
Because of protection equipment provides a critical safety function, back up protection is provided to cater for its failure. In most cases, if a protection scheme fails to operate during a network fault, the fault will be cleared by this back up protection isolating more network components and in a slower tripping time. Thus more customers will be affected and equipment is likely to sustain more damage as the fault currents will flow for a longer period.
Figure 39: SAIDI SCADA Protection and Control
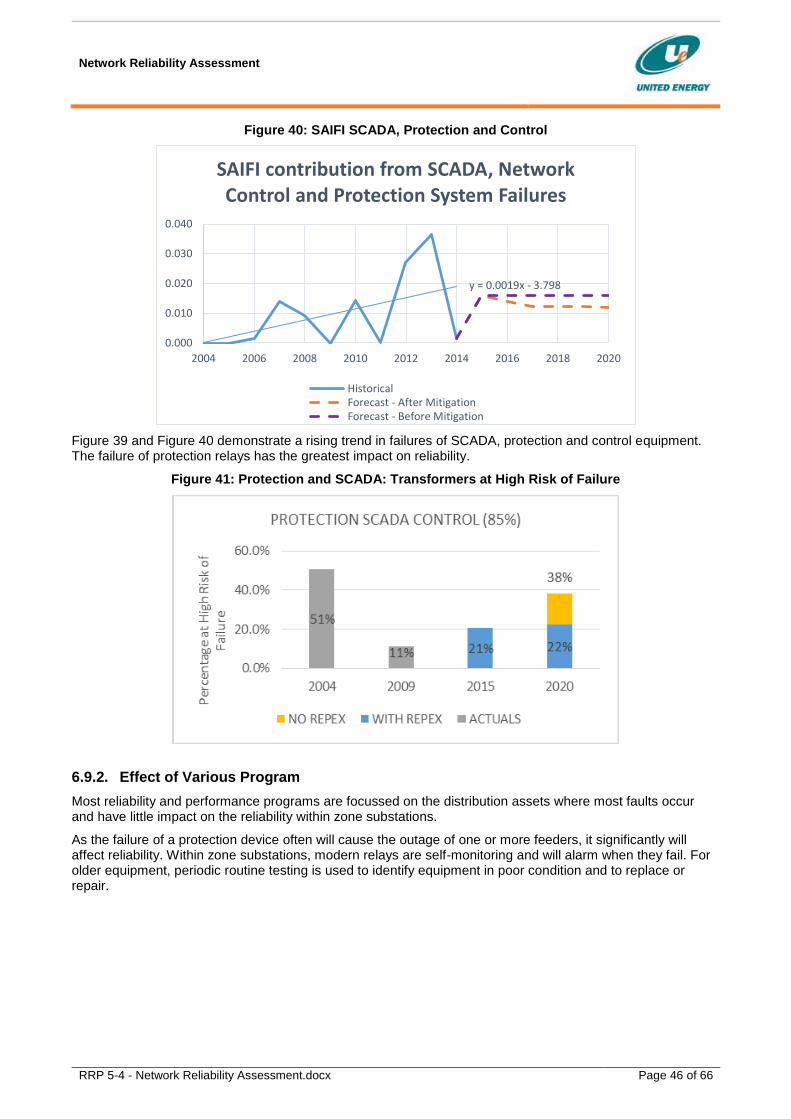
Network Reliability Assessment
RRP 5-4 - Network Reliability Assessment.docx Page 46 of 66
Figure 40: SAIFI SCADA, Protection and Control
Figure 39 and Figure 40 demonstrate a rising trend in failures of SCADA, protection and control equipment. The failure of protection relays has the greatest impact on reliability.
Figure 41: Protection and SCADA: Transformers at High Risk of Failure
6.9.2. Effect of Various Program
Most reliability and performance programs are focussed on the distribution assets where most faults occur and have little impact on the reliability within zone substations.
As the failure of a protection device often will cause the outage of one or more feeders, it significantly will affect reliability. Within zone substations, modern relays are self-monitoring and will alarm when they fail. For older equipment, periodic routine testing is used to identify equipment in poor condition and to replace or repair.
y = 0.0019x - 3.798
0.000
0.010
0.020
0.030
0.040
2004 2006 2008 2010 2012 2014 2016 2018 2020
SAIFI contribution from SCADA, Network Control and Protection System Failures
HistoricalForecast - After MitigationForecast - Before Mitigation

Network Reliability Assessment
RRP 5-4 - Network Reliability Assessment.docx Page 47 of 66
7. Reliability Performance, OT and IT Programs
7.1 Program / Project Assessments – Summary
As discussed in section 5.4, even with the earlier described asset replacement programs, reliability will not be maintained. This section presents a summary of the Maintain Reliability Programs, Operational Technology Projects, and Information Technology Projects that contribute to maintaining reliability, to close the gap between current performance and the targets for the next regulatory period at least cost. The programs and projects are ordered according to their Present Value Ratio (PVR).
PVR is calculated as the Present Value of Benefits / Present Value of Costs. The benefits include reliability and other benefits over the next 7 years.
Projects presented in Table 5 are included in UE’s revised regulatory proposal for capex. In accordance with the methodology presented in Section 4, this group of projects was selected as they ranked the highest in terms of cost benefit, and were assessed part of the least cost solution to maintain reliability.
Table 5: Summary of Reliability related programs/projects
Categories Capex
Real$2015 PV 2016-20
Capex PV Benefits PVR
ACRs & RCGSs $9,548k $8,957k $69,777k 7.79
Fuse Saver $1,681k $1,577k $4,094k 2.60
Rogue Feeder $5,602k $5,255k $11,629k 2.21
Animal Proof $10,444k $9,797k $20,594k 2.10
Clashing $4,026k $3,777k $7,693k 2.04
Communication Improvement $4,457k $4,181k $7,894k 1.89
Operational Technology
• Fault Location Identification and Application Development $2,830k $2,337k $4,570k 1.96
• Distribution Fault Anticipation, Data Collection & Analytics $3,939k $3,197k $6,153k 1.92
Information Technology
• DMS LV Management $3,000k $2,814k $5,472k 1.94
• OMS Smart Grid Gateway Extension $3,000k $2,814k $5,384k 1.91
Total $42,527k $39,077k $132,405k 3.39
Table 6 presents projects that are not included in UE’s current regulatory proposal. These projects ranked lower than the programs and projects presented in Table 5 and were in excess of that which was needed to maintain reliability. (These projects may be reconsidered for 2021-2025 period.)

Network Reliability Assessment
RRP 5-4 - Network Reliability Assessment.docx Page 48 of 66
Table 6: Capex Projects Not Included
Categories Capex
Real$2015 PV 2021-25 Capex
PV Benefits PVR
Additional Rogue Feeder $3,289k $2,241k $4,125k 1.84
Additional ACRs & RCGSs $21,120k $14,391k $25,852k 1.80
Additional Fuse Saver $987k $673k $1,027k 1.53
Additional Clashing $4,000k $2,726k $3,725k 1.37
Additional Animal Proof $10,089k $6,875k $9,312k 1.35
Additional Communication Improvement $800k $545k $607k 1.11
Total $40,285k $27,451k $44,649k 1.63
UE also examined a number of operational initiatives and ranked them in a similar manner. These initiatives were also rejected as they ranked lower to the capital programs listed in Table 5.
Table 7: Opex Projects Not Included.
Categories PV Opex
initiated in 2016-20
PV Benefits PVR
ZNX - 2 ZSS Operators $3,728K $3,883K 1.04
ZNX - 2 more DS and 2 ZSS Operators $6,915K $6,990K 1.01
ZNX - 3 more DS and 4 ZSS Operators $12,237K $11,650K 0.95
Tenix - Reliability Engineer $5,104K $4,721K 0.93
Tenix - Add AA Operators primarily for D/T Faults $7,868K $5,632K 0.72
Tenix - Communications Engineer $1,988K $1,408K 0.71
Total $37,841K $34,284K 0.91
7.2 Program Assessments – Reliability Maintained Capex
Each of the programs included in the United Energy Regulatory Proposal under the category “Maintain Reliability” is described in this Section. This includes:
ACRs and RCGSs
Fuse Savers
Conductor Clashing
Animal proofing
Communications upgrade
Rogue Feeders

Network Reliability Assessment
RRP 5-4 - Network Reliability Assessment.docx Page 49 of 66
Each of these programs is also described in detail in the Network Performance Strategy, document number UE PL 2300.
7.2.1. Automatic Circuit Reclosers (ACRs) and Remote Control Gas Switches (RCGSs)
Description
ARCs are devices that are installed part way along feeders and will detect faults, automatically open and reclose. Where faults are transient, supply will be restored and sustained outages will be replaced by momentary outages. Where faults are permanent fewer customers will be affected by the outage.
RCGS are switches installed on the network to divide feeders into smaller sections. When a fault occurs, unaffected parts of a feeder can be reconnected to supply by remote control.
Additional ACRs and RCGSs will be installed in selected locations in the forecast period based on fault history to address both reliability and worst served customers.
Costs and Benefits
The installation of ACRs and RCGSs will help to minimise the impact of outages experienced by customers by reducing the number of customers affected by an outage and allowing the network control centre to restore power to customers in shorter time frames.
Ultimately, these devices will become part of the Fault Location Isolation and Supply Restoration (FLISR) automation scheme. We will seek to uses them in conjunction with FLISR automatically reconnect most customers thereby converting sustained outages to momentary outages. Automatic restoration following a fault has been trailed with the current control systems and found to be very difficult to achieve; the implementation of FLISR is likely to be gradual and occur over a number of years.
ACR’s and RCGS’s have built-in fault indication capabilities which will also reduce fault response time by indicating the location of the fault so that the network can be manually switched or repaired more quickly. A summary of the cost benefits analysis is found in Table 8
Table 8: ACRs and RCGSs Cost-Benefit Summary
Benefits Assessment
ACRs and RCGSs work in tandem to reduce the impact of faults on our customers but each type of device has different functionality.
ACRs
The benefit of installing ACRs is to sectionalise the network in to smaller segments thereby reducing the impact of a fault by reducing the average number of customers impacted by each fault. The operation of the device is independent of the root cause of the fault and therefore, provides mitigation for all faults.
RCGSs
The benefits of installing RCGSs are to enable a faulted section to be more easily identified by network control so that customers that can be isolated from the faulted part of the network and quickly restored. The operation of the device is independent of the root cause of the fault and therefore, provides mitigation for all faults.
Overall the projects are forecast to, on average, reduce SAIDI by 18.4 minutes and SAIFI by 0.138 interruptions over the 2016-20 regulatory period
Ave SAIFI Improvement
Over Regulatory
Period
MAIFI Improvement
over regulatory
period
Ave SAIDI Improvement
Over Regulatory
Period
Capex Real$2015
PV Costs PV Benefits PVR
0.138 -0.138 18.39 $9,548k $8,957k $69,777k 7.79

Network Reliability Assessment
RRP 5-4 - Network Reliability Assessment.docx Page 50 of 66
7.2.2. Fuse Savers
Description
The Fuse Savers program seeks to;
reduce the number of customers that experience a sustained faults as a result of a transient fault, and
reduce the restoration time for transient faults that are beyond a fuse by preventing the fuse blowing.
Fuse Savers will be installed in selected locations based on fault history and to address reliability generally and also worst served customers.
Costs and Benefits
Fuser savers will be installed in selected locations, usually on feeder spurs, to allow successful reclose for transient faults that would otherwise result in fuse operation and avoid extended outages for affected customers.
Fuse saver technology acts as a re-closer in series with the fuse and will operate to isolate supply before the fuse operates. This allows time for transient faults to self-clear and supply to be restored to customers when the fuse saver recloses. In this circumstance, customers will only experience a momentary interruption for transient faults. In cases where the fault is permanent the fuse saver will reclose and then remain closed to allow the fuse to isolate the fault. Fuse Savers prevent fuse elements from melting unnecessarily for transient faults and therefore, will improve reliability and reduce operational expenditure associated with replacement of the fuse. A summary of the cost benefits analysis is found in Table 9
Table 9: Fuse Savers Cost Benefit Summary
Benefits Assessment
The benefit of installing fuse savers is to prevent transient faults, such as are caused by weather, birds and animals or vegetation on spur fuses, from interruption customers. However, they will not be effective for non-transient faults such as those caused by equipment failure. Overall the projects are forecast to on average reduce SAIDI by 0.9 minutes and SAIFI by 0.010 interruptions over the 2016-20 regulatory period.
Ave SAIFI Improvement
Over Regulatory
Period
MAIFI Improvement
over regulatory
period
Ave SAIDI Improvement
Over Regulatory
Period
Capex Real$2015
PV Costs PV Benefits PVR
0.010 0.0 0.9 $1,681k $1,577k $4,094k 2.60
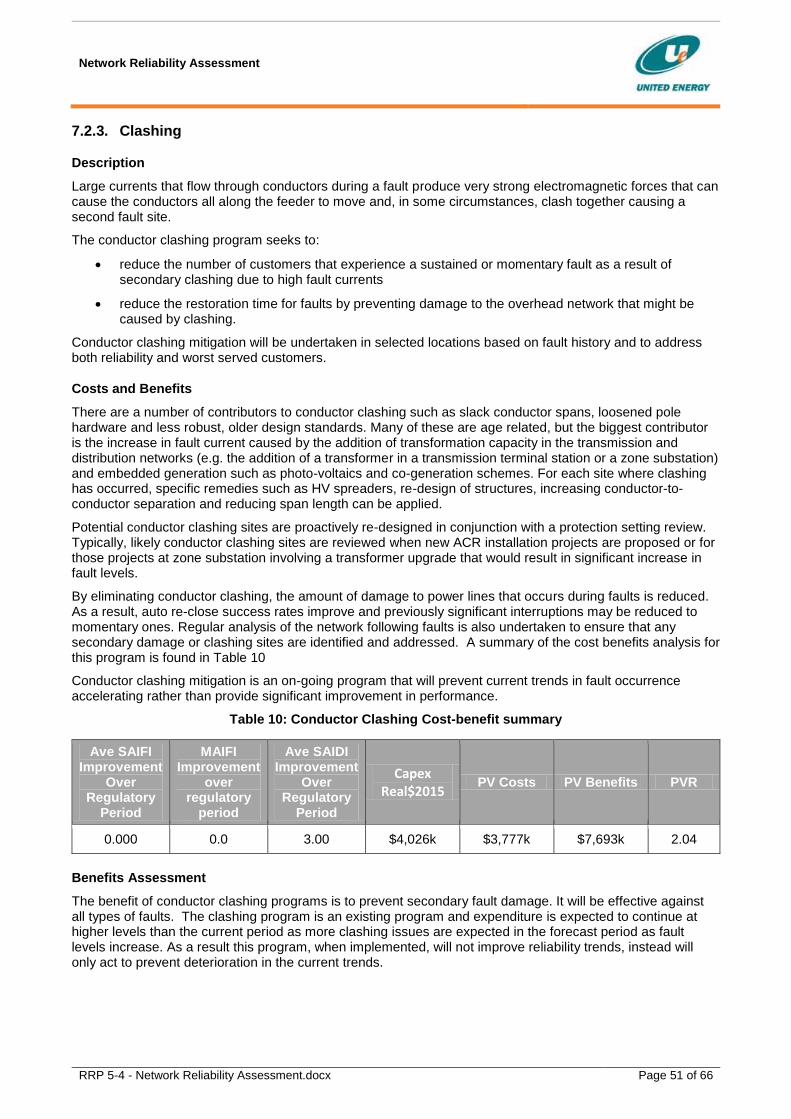
Network Reliability Assessment
RRP 5-4 - Network Reliability Assessment.docx Page 51 of 66
7.2.3. Clashing
Description
Large currents that flow through conductors during a fault produce very strong electromagnetic forces that can cause the conductors all along the feeder to move and, in some circumstances, clash together causing a second fault site.
The conductor clashing program seeks to:
reduce the number of customers that experience a sustained or momentary fault as a result of secondary clashing due to high fault currents
reduce the restoration time for faults by preventing damage to the overhead network that might be caused by clashing.
Conductor clashing mitigation will be undertaken in selected locations based on fault history and to address both reliability and worst served customers.
Costs and Benefits
There are a number of contributors to conductor clashing such as slack conductor spans, loosened pole hardware and less robust, older design standards. Many of these are age related, but the biggest contributor is the increase in fault current caused by the addition of transformation capacity in the transmission and distribution networks (e.g. the addition of a transformer in a transmission terminal station or a zone substation) and embedded generation such as photo-voltaics and co-generation schemes. For each site where clashing has occurred, specific remedies such as HV spreaders, re-design of structures, increasing conductor-to-conductor separation and reducing span length can be applied.
Potential conductor clashing sites are proactively re-designed in conjunction with a protection setting review. Typically, likely conductor clashing sites are reviewed when new ACR installation projects are proposed or for those projects at zone substation involving a transformer upgrade that would result in significant increase in fault levels.
By eliminating conductor clashing, the amount of damage to power lines that occurs during faults is reduced. As a result, auto re-close success rates improve and previously significant interruptions may be reduced to momentary ones. Regular analysis of the network following faults is also undertaken to ensure that any secondary damage or clashing sites are identified and addressed. A summary of the cost benefits analysis for this program is found in Table 10
Conductor clashing mitigation is an on-going program that will prevent current trends in fault occurrence accelerating rather than provide significant improvement in performance.
Table 10: Conductor Clashing Cost-benefit summary
Benefits Assessment
The benefit of conductor clashing programs is to prevent secondary fault damage. It will be effective against all types of faults. The clashing program is an existing program and expenditure is expected to continue at higher levels than the current period as more clashing issues are expected in the forecast period as fault levels increase. As a result this program, when implemented, will not improve reliability trends, instead will only act to prevent deterioration in the current trends.
Ave SAIFI Improvement
Over Regulatory
Period
MAIFI Improvement
over regulatory
period
Ave SAIDI Improvement
Over Regulatory
Period
Capex Real$2015
PV Costs PV Benefits PVR
0.000 0.0 3.00 $4,026k $3,777k $7,693k 2.04
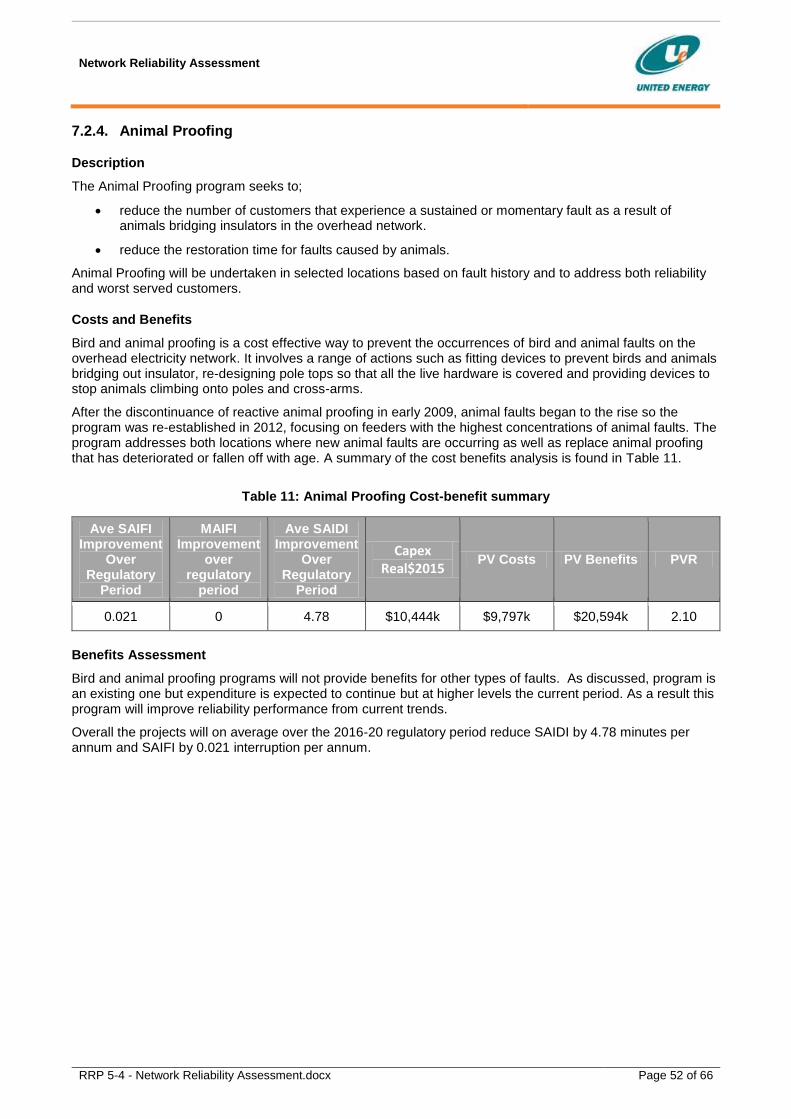
Network Reliability Assessment
RRP 5-4 - Network Reliability Assessment.docx Page 52 of 66
7.2.4. Animal Proofing
Description
The Animal Proofing program seeks to;
reduce the number of customers that experience a sustained or momentary fault as a result of animals bridging insulators in the overhead network.
reduce the restoration time for faults caused by animals.
Animal Proofing will be undertaken in selected locations based on fault history and to address both reliability and worst served customers.
Costs and Benefits
Bird and animal proofing is a cost effective way to prevent the occurrences of bird and animal faults on the overhead electricity network. It involves a range of actions such as fitting devices to prevent birds and animals bridging out insulator, re-designing pole tops so that all the live hardware is covered and providing devices to stop animals climbing onto poles and cross-arms.
After the discontinuance of reactive animal proofing in early 2009, animal faults began to the rise so the program was re-established in 2012, focusing on feeders with the highest concentrations of animal faults. The program addresses both locations where new animal faults are occurring as well as replace animal proofing that has deteriorated or fallen off with age. A summary of the cost benefits analysis is found in Table 11.
Table 11: Animal Proofing Cost-benefit summary
Benefits Assessment
Bird and animal proofing programs will not provide benefits for other types of faults. As discussed, program is an existing one but expenditure is expected to continue but at higher levels the current period. As a result this program will improve reliability performance from current trends.
Overall the projects will on average over the 2016-20 regulatory period reduce SAIDI by 4.78 minutes per annum and SAIFI by 0.021 interruption per annum.
Ave SAIFI Improvement
Over Regulatory
Period
MAIFI Improvement
over regulatory
period
Ave SAIDI Improvement
Over Regulatory
Period
Capex Real$2015
PV Costs PV Benefits PVR
0.021 0 4.78 $10,444k $9,797k $20,594k 2.10

Network Reliability Assessment
RRP 5-4 - Network Reliability Assessment.docx Page 53 of 66
7.2.5. Communications Upgrades
Description
The Communication Upgrade program seeks to reduce the restoration time for faults by providing better communications to field devices. In some cases this will allow us to better monitor the equipment, and in others to allow remote switching of the network to reconnect supply more quickly following faults.
Communication Upgrades will be undertaken in at a range of locations across the network to address both reliability and worst served customers.
Costs and Benefits
This project will provide improved communications to existing RCGSs and ACRs to increase the effectiveness of these existing schemes. Currently, many pole top devices use the Trio network whose performance has proved to be inadequate due to poor signal strength. This project proposes a 3G communication solution for existing and for new ACR and RCGS installations. A summary of the cost benefits analysis is found in Table 12.
Table 12: Communication Upgrade Cost-benefit summary
Benefits Assessment
The communications upgrades will allow the network controllers to accurately monitor the devices on the network. This will help will fault location, will allow the network operators to monitor the status of the devices in “real time” and provide them with the ability to operate the switches from the control room. Presently operators often have to travel to the sites to operate switches. As a result of this program, switching time will be reduced and supply to customers can be switched back on more quickly following outage. The main benefit is expected to be in reducing outage duration (CAIDI).
Overall the projects will on average over the 2016-20 regulatory period reduce SAIDI by 1.8 minutes per annum and CAIDI by 1.35 minutes.
Ave SAIFI Improvement
Over Regulatory
Period
MAIFI Improvement
over regulatory
period
Ave SAIDI Improvement
Over Regulatory
Period
Capex Real$2015
PV Costs PV Benefits PVR
0.000 0.000 1.8 $4,457k $4,181k $7,894k 1.89
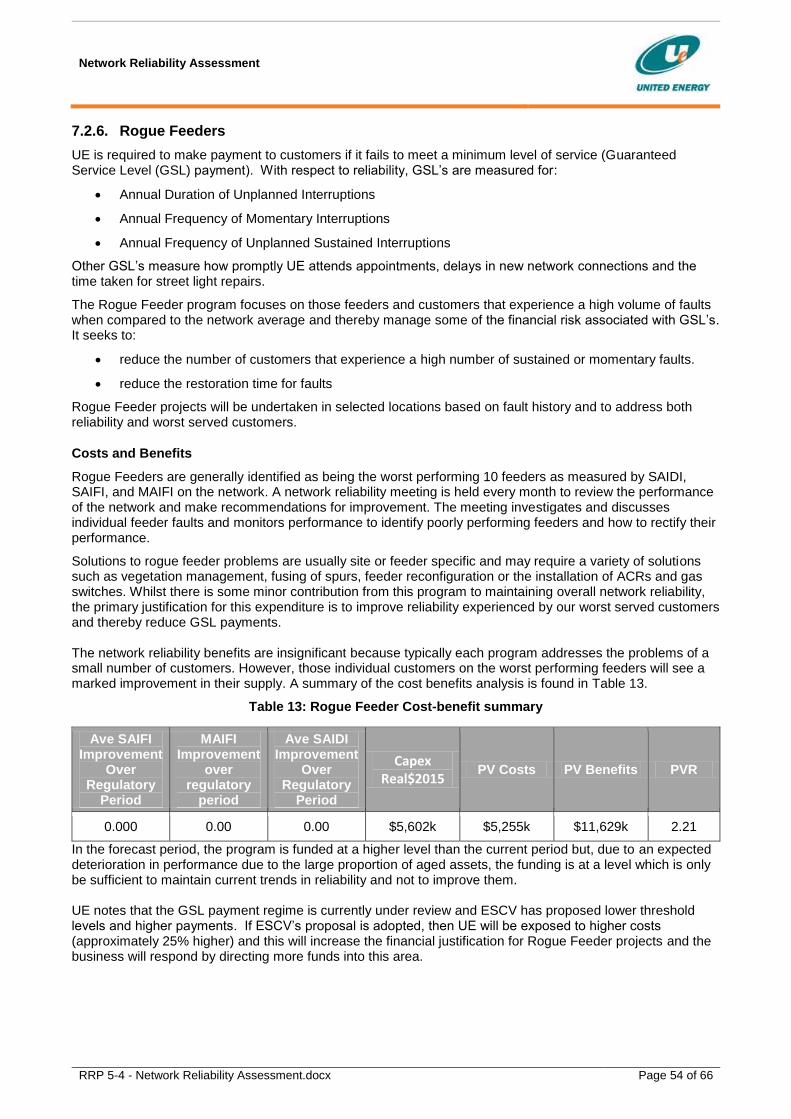
Network Reliability Assessment
RRP 5-4 - Network Reliability Assessment.docx Page 54 of 66
7.2.6. Rogue Feeders
UE is required to make payment to customers if it fails to meet a minimum level of service (Guaranteed Service Level (GSL) payment). With respect to reliability, GSL’s are measured for:
Annual Duration of Unplanned Interruptions
Annual Frequency of Momentary Interruptions
Annual Frequency of Unplanned Sustained Interruptions
Other GSL’s measure how promptly UE attends appointments, delays in new network connections and the time taken for street light repairs.
The Rogue Feeder program focuses on those feeders and customers that experience a high volume of faults when compared to the network average and thereby manage some of the financial risk associated with GSL’s. It seeks to:
reduce the number of customers that experience a high number of sustained or momentary faults.
reduce the restoration time for faults
Rogue Feeder projects will be undertaken in selected locations based on fault history and to address both reliability and worst served customers.
Costs and Benefits
Rogue Feeders are generally identified as being the worst performing 10 feeders as measured by SAIDI, SAIFI, and MAIFI on the network. A network reliability meeting is held every month to review the performance of the network and make recommendations for improvement. The meeting investigates and discusses individual feeder faults and monitors performance to identify poorly performing feeders and how to rectify their performance.
Solutions to rogue feeder problems are usually site or feeder specific and may require a variety of solutions such as vegetation management, fusing of spurs, feeder reconfiguration or the installation of ACRs and gas switches. Whilst there is some minor contribution from this program to maintaining overall network reliability, the primary justification for this expenditure is to improve reliability experienced by our worst served customers and thereby reduce GSL payments. The network reliability benefits are insignificant because typically each program addresses the problems of a small number of customers. However, those individual customers on the worst performing feeders will see a marked improvement in their supply. A summary of the cost benefits analysis is found in Table 13.
Table 13: Rogue Feeder Cost-benefit summary
In the forecast period, the program is funded at a higher level than the current period but, due to an expected deterioration in performance due to the large proportion of aged assets, the funding is at a level which is only be sufficient to maintain current trends in reliability and not to improve them. UE notes that the GSL payment regime is currently under review and ESCV has proposed lower threshold levels and higher payments. If ESCV’s proposal is adopted, then UE will be exposed to higher costs (approximately 25% higher) and this will increase the financial justification for Rogue Feeder projects and the business will respond by directing more funds into this area.
Ave SAIFI Improvement
Over Regulatory
Period
MAIFI Improvement
over regulatory
period
Ave SAIDI Improvement
Over Regulatory
Period
Capex Real$2015
PV Costs PV Benefits PVR
0.000 0.00 0.00 $5,602k $5,255k $11,629k 2.21

Network Reliability Assessment
RRP 5-4 - Network Reliability Assessment.docx Page 55 of 66
7.3 Program Assessments – Operational Technology Projects
Each of the Operational Technology projects / programs included in UEs Regulatory Proposal which provide a material contribution to maintaining reliability is summarised in this Section, with detailed descriptions provided in individual project justifications. This includes:
Fault Location Identification and Application Development – PJ 1600
Distribution Fault Anticipation, Data Collection & Analytics (DFADCAA) – PJ 1599
7.3.1. Fault Location Identification and Application Development
Description
This program is to install 1500 Power Line Monitors that will allow 500 three phase points of monitoring on the distribution system. It will allow monitoring of ambient temperature, current and voltages and provide analytical systems to provide analysis of faults.
Cost and Benefits
The program will provide a variety of benefits including fault location and identification that will drive faster restoration of supply following faults. With the information provided by the power line monitors, network controllers and operators will be able to locate and isolate faults and restore non-faulted parts of the network to supply more quickly. The program will provide reductions in CAIDI and SAIDI but provide little impact on SAIFI.
Table 14: Fault Location Cost Benefit Summary
7.3.2. DFADCAA
Description
Distribution Fault Anticipation, Data Collection & Analytics (DFADCAA) is a project to provide monitoring devices at zone substations that collect data. Disturbance recorders fault data allows faults to be analysed so that further faults can be anticipate and avoided. Analysis of faults can, for example, identify incidents of conductor clashing that may occur during a fault.
Cost and Benefits
Once analysed the data is used to detect and alarm on fault and network issues. One benefit is that the data can be used to predict failures and problems so that they can be addressed before they occur which will improve network reliability. Another is that the location of faults will be made more accurately and will result in field crews finding and repairing faults more quickly and faster restoration times.
Table 15: DFADCAA Cost Benefit Summary
Ave SAIFI Improvement
Over Regulatory
Period
MAIFI Improvement
over regulatory
period
Ave SAIDI Improvement
Over Regulatory
Period
Capex Real$2015
PV Costs PV Benefits PVR
0.0 0.0 1.5 $2,830k $2,337k $4,570k 1.96
Ave SAIFI Improvement
Over Regulatory
Period
MAIFI Improvement
over regulatory
period
Ave SAIDI Improvement
Over Regulatory
Period
Capex Real$2015
PV Costs PV Benefits PVR
0.00 0.0 1.6 $3,939k $3,197k $6,153k 1.92

Network Reliability Assessment
RRP 5-4 - Network Reliability Assessment.docx Page 56 of 66
7.4 Program Assessments – Information Technology Projects
Each of the Information Technology projects included in the United Energy Regulatory Proposal which provides a material contribution to maintaining reliability is described briefly in this Section. This includes:
OMS Smart Grid Gateway Extension
DMS LV Management
(FLISR) Fault Location, Isolation, Sectionalisation and Restoration
7.4.1. OMS Smart Grid Gateway Extension
Description
The project is to upgrade the OMS Smart Grid gateway so that it interfaces the meter management system. The project is to develop logic that will prevent flooding of “last gasp” messages from meters into the OUNMS (Oracle Utilities Network Management System) during a planned network outage.
Cost and Benefits
The project will help filter nuisance information so that more accurate customer messaging of outages occurs which will allow a better, faster response to outages and improve reliability.
Table 16: OSM Smart Gate Way Cost Benefit Summary
7.4.2. DMS LV Management
Description
DMS LV Management project will extend the dynamic modelling of the electrical network in the DMS systems to include the Low Voltage network from the Distribution Substations to the customer premises. It allows a more dynamic representation of the LV network in DMS, to provide better information for planned and unplanned outages, facilitating better management of the LV system, fewer customers per outage and faster restoration times.
Cost and Benefits
By modelling the LV network with additional granularity we can accurately identify who is impacted by planned and unplanned outages. This enables improved customer service through the provision of more accurate information on outage status and the awareness of, and more proactive management of, sensitive and life support customers.
This project should have some impact on constraining reliability from further deterioration.
Table 17: DSM LV Management Cost Benefit Summary
Ave SAIFI Improvement
Over Regulatory
Period
MAIFI Improvement
over regulatory
period
Ave SAIDI Improvement
Over Regulatory
Period
Capex Real$2015
PV Costs PV Benefits PVR
0.000 1.3 1.5 $3,000k $2,814k $5,384k 1.91
Ave SAIFI Improvement
Over Reg Period
MAIFI Improvement
over Reg period
Ave SAIDI Improvement
Over Reg Period
Capex Real$2015
PV Costs PV Benefits PVR
0.000 0.00 1.6 $3,000k $2,814k $5,472k 1.94

Network Reliability Assessment
RRP 5-4 - Network Reliability Assessment.docx Page 57 of 66
7.4.3. FLISR
UE will increase the level of automation on its network by the rollout of remotely controllable and smart devices as well as the implementation of an automatic fault isolation and supply restoration scheme.
FLISR (Fault Location Isolation and Supply Restoration) is a module of the DMS Upgrade currently being implemented and scheduled for practical completion in early 2016. Thus, the project costs are not included in UE’s Regulatory Proposal. The benefits of FLISR will however be realised over subsequent years, and are included as they form part of the reliability assessment.
The goal of FLISR is to achieve restoration of supply following a fault in less than 60 seconds so that faults are classified as “momentary” rather than “sustained”. The achievement of the 60-second timeframe has proved to be challenging due to unpredictable delays in the remote communication response between pole mounted devices and the control room. A number of improvements including the reduction of communication time delays to remote devices are planned to improve performance. At the same time UE has proposed to the AER that a more achievable 3-minute timeframe should be adopted for the definition of “momentary Interruption” to encourage greater use of distribution automation. The proposal however has not yet been accepted by the AER.
An extended period of system testing and progressive implementation across the network is planned to ensure the system operates correctly (and therefore safely), facilitating operator acceptance of the revised system. The system will be rolled out gradually over the period 2015-2020. It has been estimated that FLISR has the potential to significantly improve both SAIDI and SAIFI but will cause deterioration in MAIFIe. SAIDI will improve because supply will be restored more quickly following faults. SAIFI will only improve if the restoration can occur in less than one minute. Presently faults that are restored in less than one minute are classified as momentary, so if the one minute restoration can be achieved, the SAIFI will decrease and MAIFIe, a measure of momentary interruptions, will increase. Much of the benefits of the FLISR program are recognised in other programs. Our ACR and RCGS program and our communication upgrade program are an integral part of FLISR and the improvement in reliability is claimed under those programs.
7.5 Opex Assessments
Opex Initiatives have been assessed to determine whether they offer a cost effective contribution to maintaining reliability.
Opex initiatives such as condition monitoring and enhanced inspection have been considered for various asset categories and, where adopted, incorporated in our Life Cycle Strategies for the particular asset category. The rationale for adoption has generally been for range of reasons which usually include maintaining reliability and maintain safety. For example, enhanced inspection of pole top structures using pole mounted cameras will be introduced following our successful trial in 2014. This is documented in the Pole Top Structures Life Cycle Strategy.
Other Opex Initiatives such as fault and emergency field response initiatives have been considered as they offer the possibility of reducing supply restoration times. In general, these initiatives involve additional field resources that enable faster supply restoration times under certain circumstances.
Consistent with our holistic approach, these initiates have been compared to the various capex related initiatives listed above, and found to rank below capex projects in their contribution to maintaining reliability at least cost. As such, no Opex solutions involving additional field resources to maintain reliability have been included the United Energy investment proposal.
Specific Opex Initiatives considered and subsequently rejected are listed in Table 7 and include
Additional reliability staff to predict faults and reduce faults and prioritise maintenance delivery to poorly performing parts of the network.
Additional operators to improve fault response times.
Additional communications staff to improve communications between the control centre and field devices.

Network Reliability Assessment
RRP 5-4 - Network Reliability Assessment.docx Page 58 of 66
8. CAIDI Drivers and Trends
CAIDI is a measure of the average time to restore supply after a fault. UE’s CAIDI has deteriorated over the last ten years, as discussed in section 3.1.4. It has had an increasing impact on overall network performance and our STPIS performance because it directly affects SAIDI. Our trend however, is consistent with trends in both the Victorian and Australian average CAIDI performance discussed in Section 3.2.
8.1 CAIDI over time
The deterioration in CAIDI has been occurring over the last ten years. Figure 42 highlights that whilst actual performance shows some year-on-year variations; the underlying trend is a gradual increase.
Figure 42 : UE Actual CAIDI and CAIDI Trend
CAIDI has increased at 2.2 minutes per year over the last ten years; this is predominately driven by:-
reductions in traffic flow speeds which means our response crews take longer to reach site.
increasing number of HV events, which typically take longer to repair than faults on the LV network
increasing number of HV simultaneous events, and a shortage of resources and
increasing percentage of faults caused by equipment failure which take longer to repair.
Over the ten year period there has been roughly a 40% increase in average restoration times. The reasons for this increase are explored in more detail in the following section.
8.2 CAIDI Drivers Analysis and Observations
8.2.1. Reductions in Traffic Flow Speeds.
There is little doubt that the volume of traffic on the roads in UE’s area is increasing year-in, year-out. Its impact on CAIDI is not obvious between one year and the next. Over a longer term, the impact of higher traffic volumes becomes more evident in the increased time it takes for a field crew to travel to the faulted section of the network and to then identify the actual fault location so that restoration can commence.
This observation is supported by VicRoads data represented in Figure 43 to Figure 46.
0
10
20
30
40
50
60
70
80
2004 2005 2006 2007 2008 2009 2010 2011 2012 2013 2014 2015
CAIDI TREND vs ACTUAL
Trend Actual

Network Reliability Assessment
RRP 5-4 - Network Reliability Assessment.docx Page 59 of 66
Figure 43: VicRoads Monitored Traffic Speeds
Source: VicRoads Traffic Monitor Report 2012-13
VicRoads monitors traffic speeds across Melbourne and categorises areas as inner or outer urban areas. Their observations on the changes in traffic flows over time are represented in Figure 44 to Figure 46. The average travels speed has been decreasing consistently across all time segments; AM peak, PM peak and Off-peak. This reduction in speed is highlighted in Figure 44 and reflects an average decrease of one percent per annum between 2003 and 2013.
Figure 44: VicRoads Monitored Average Traffic Speeds
Source: VicRoads Traffic Monitor Report 2012-13
VicRoads traffic data thus shows a ten percent reduction in travel speeds across Melbourne and across all travel periods since 2003.

Network Reliability Assessment
RRP 5-4 - Network Reliability Assessment.docx Page 60 of 66
This trend is greater in the inner urban area where travel speeds have reduced at closer to three percent per annum. This reduction in speed is highlighted in Figure 45 and is again consistent across all three time segments. This reflects a larger increase in travel times over the ten years corresponding to a 30% in decrease in travel speeds. The outer urban areas are also showing a reduction in traffic speeds across both the PM peak and the Off-peak period as shown in Figure 46.
The North Western section of UE’s network is considered an inner urban area. However, it is clear that reductions in traffic speeds are migrating through the network from north-west to south-east as increased housing density occurs along the Monash freeway development corridor and increased commercial/industrial activity occurs along the Eastlink corridor.
Figure 45: VicRoads Monitored Average Traffic Speeds – Inner Divided Roads
Source: VicRoads Traffic Monitor Report 2012-13
Figure 46: VicRoads Monitored Average Traffic Speeds – Outer Divided Roads
Source: VicRoads Traffic Monitor Report 2012-13
Whilst the bulk of UE’s area is within the outer urban areas, a small and growing portion of our area is within the inner urban area where reductions in traffic speeds are roughly 30%. Average travel times in these areas will lead to the overall average increase in travel times being greater than10%. UE estimates that across its
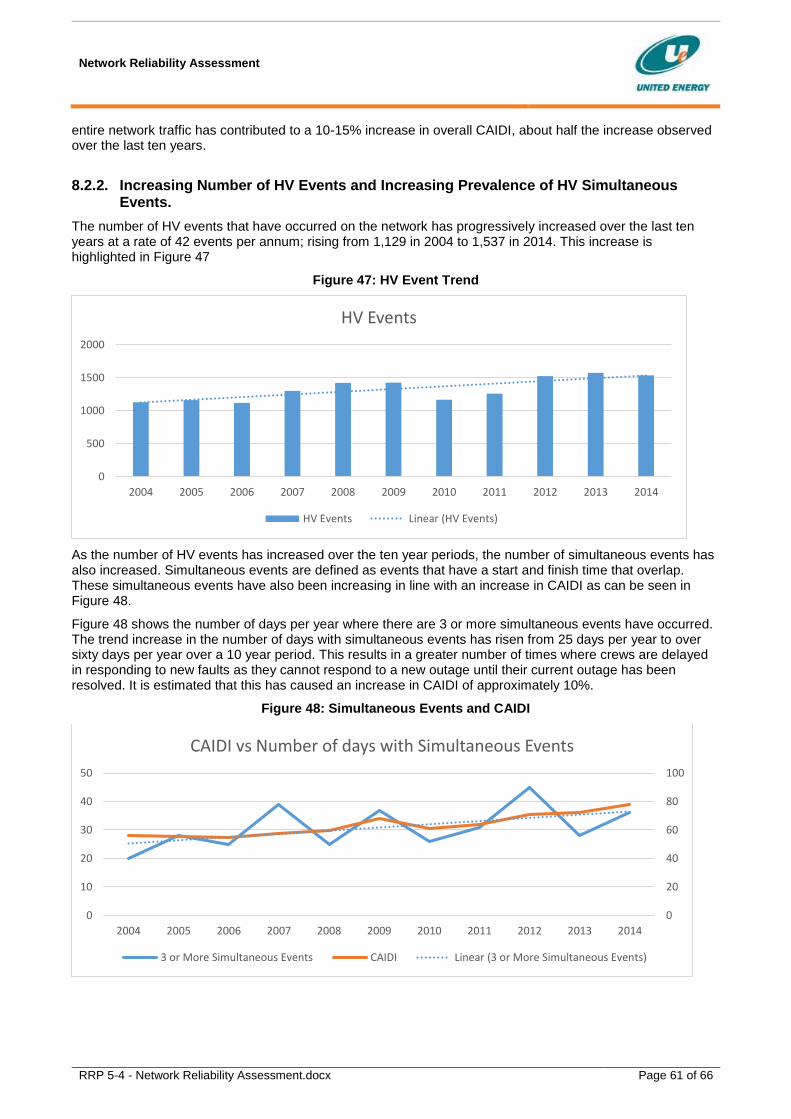
Network Reliability Assessment
RRP 5-4 - Network Reliability Assessment.docx Page 61 of 66
entire network traffic has contributed to a 10-15% increase in overall CAIDI, about half the increase observed over the last ten years.
8.2.2. Increasing Number of HV Events and Increasing Prevalence of HV Simultaneous Events.
The number of HV events that have occurred on the network has progressively increased over the last ten years at a rate of 42 events per annum; rising from 1,129 in 2004 to 1,537 in 2014. This increase is highlighted in Figure 47
Figure 47: HV Event Trend
As the number of HV events has increased over the ten year periods, the number of simultaneous events has also increased. Simultaneous events are defined as events that have a start and finish time that overlap. These simultaneous events have also been increasing in line with an increase in CAIDI as can be seen in Figure 48.
Figure 48 shows the number of days per year where there are 3 or more simultaneous events have occurred. The trend increase in the number of days with simultaneous events has risen from 25 days per year to over sixty days per year over a 10 year period. This results in a greater number of times where crews are delayed in responding to new faults as they cannot respond to a new outage until their current outage has been resolved. It is estimated that this has caused an increase in CAIDI of approximately 10%.
Figure 48: Simultaneous Events and CAIDI
0
500
1000
1500
2000
2004 2005 2006 2007 2008 2009 2010 2011 2012 2013 2014
HV Events
HV Events Linear (HV Events)
0
20
40
60
80
100
0
10
20
30
40
50
2004 2005 2006 2007 2008 2009 2010 2011 2012 2013 2014
CAIDI vs Number of days with Simultaneous Events
3 or More Simultaneous Events CAIDI Linear (3 or More Simultaneous Events)

Network Reliability Assessment
RRP 5-4 - Network Reliability Assessment.docx Page 62 of 66
8.2.3. Increasing Percentage of Equipment Failures.
Because equipment failures take longer to repair than other typed of faults, an increase the proportion of faults due to equipment failures will result in a longer average restoration time. As discussed in section 3, the proportion of assets on the network whose age exceeds 85 % of their life is increasing and will increase further in the forecast period. This drives an increase in CAIDI (unless measures are taken to address the trend). Figure 49 demonstrates that the average CAIDI for an equipment fault is greater than for the average outage time.
Figure 49: CAIDI for Equipment Failure against CAIDI average
On average CAIDI due to equipment failure is 6 minutes greater than the average CAIDI on the network due to the increased time it take to repair or replace failed equipment. Figure 50 highlights the increasing rate of equipment failure which is growing at a rate of 20 events per annum.
Figure 50: Equipment Failure
The increasing number of asset failures on the network has also driven up overall CAIDI by between 3-5% over the ten years.
8.3 Programs to Address Trends in CAIDI.
There are several approaches to reducing the length of time customers are affected by outages. One approach is to increase operational expenditure so that more resources are available and faults will be isolated or repaired more quickly. Another is to increase Repex expenditure so that there are fewer assets in the “End of Life stage and at a high risk of failure.
0
20
40
60
80
100
2004 2005 2006 2007 2008 2009 2010 2011 2012 2013 2014
CAIDI
CAIDI Asset Failure CAIDI all
0
100
200
300
400
500
600
2004 2005 2006 2007 2008 2009 2010 2011 2012 2013 2014
HV Equipment Failure Events

Network Reliability Assessment
RRP 5-4 - Network Reliability Assessment.docx Page 63 of 66
An alternate approach is to invest in the network through reliability programs, which break the network into smaller sections through installing RCGS’s and thus being able to return supply to much of the network more quickly. UE has adopted this approach as
It is more cost effective as discussed in section 7.
Is not affected by traffic flows and will provide benefits even as traffic problems increase.
It continues to provide benefits even when simultaneous faults occur.
It is consistent with UE’s long term strategy as it supports plans for future distribution automation.
Network Reliability Assessment
RRP 5-4 - Network Reliability Assessment.docx Page 64 of 66
9. Conclusion
UE’s reliability targets for the next regulatory period will be based on our historical average performance over the past five years, and is estimated to average about 69 minutes of unplanned SAIDI for the period and a SAIFI of 1.0 interruption per customer. However, our performance for the last three years is well above this average. Average SAIFI was 1.03 interruptions over that period and SAIDI was 76.7 minutes. Thus, to maintain reliability for the next regulatory period, we must return performance to our historic 5 year average, and close the gap from our current SAIDI performance by approximately 10 minutes.
UE’s broad reliability strategy is to develop a program of capital and operational expenditure to meet our reliability targets. To this end, UE has adopted a prudent, holistic approach to ‘maintaining reliability’ to ensure that our objective is achieved efficiently. This holistic approach recognises the contributions made by each capex category (in addition to Opex) so that our total expenditure is properly aligned to the task and at least cost.
In our proposal for replacement capex we are proposing to spend at total of $408M in the forecast period to replace assets. This level of expenditure is sufficient to replace assets at the end of their lives but not sufficient to prevent the proportion of assets which have a high risk of failure from increasing. It maintains a trend in replacement expenditure where, since 2004 UE has not been spending sufficiently to maintain the overall risk of asset failure on the network. The proportion of assets whose age exceeds 85% of life will increase from 12% in 2004 to 19% by 2014 and 23% by 2020 and has consequently seen a worsening reliability performance.
In order to manage this increasing risk and maintain reliability, in addition to replacing assets, UE has assessed and selected a program of projects and initiatives to achieve the objective at least cost. This includes $35.8M of Network Reliability Projects, $6.8M of OT Reliability Projects and about $6.0M of IT Projects.
The effect of reducing our Repex would be that network safety and reliability could not be maintained and our obligations under the Rules would not be met.
Network Reliability Assessment
RRP 5-4 - Network Reliability Assessment.docx Page 65 of 66
10. Definitions
Term Definition
ACR Automatic Circuit Re-closer
AER Australian Energy Regulator
Augex Augmentation Expenditure
CAIDI Customer Average Interruption Duration Index
Capex Capital Expenditure
DMS Distribution Management System
DNSP Distribution Network Service Provider
FLISR Fault Location, Isolation, Sectionalisation and Restoration
ITC Information Technology and Communications
MAIFIe Momentary Average Interruption Frequency Index event
Opex Operational Expenditure
RCGS Remote Control Gas Switch
Repex Replacement Expenditure
Rules National Electricity Rules
SAIDI System Average Interruption Duration Index
SAIFI System Average Interruption Frequency Index

Network Reliability Assessment
RRP 5-4 - Network Reliability Assessment.docx Page 66 of 66
11. References
Document No. Document Name
NET 447 AER Category Expenditure Explanatory Statement Pole Structures
NET 448 AER Category Expenditure Explanatory Statement Pole Top Structures
NET 449 AER Category Expenditure Explanatory Statement Connectors and Conductors
NET 450 AER Category Expenditure Explanatory Statement Cable Systems
NET 452 AER Category Expenditure Explanatory Statement Transformers
NET 453 AER Category Expenditure Explanatory Statement Switchgear
NET 455 AER Category Expenditure Explanatory Statement Zone Substation Protection and Control Relays
NET 457 AER Category Expenditure Explanatory Statement Other Programs
UE PJ - 0131 - 0 High Voltage Aerial Bundled Cable Replacement
UE PL 2005 Life Cycle Strategy Pole Inspection and Replacement
UE PL 2006 Life Cycle Strategy Pole Top Structures
UE PL 2007 Life Cycle Strategy Connectors and Conductors
UE PL 2008 Life Cycle Strategy Overhead Line Switchgear
UE PL 2009 Life Cycle Strategy Overhead Line Capacitors
UE PL 2010 Life Cycle Strategy ACR
UE PL 2012 Life Cycle Strategy HV Outdoor Fuses
UE PL 2014 Life Cycle Strategy Pole Top Transformers
UE PL 2015 Life Cycle Strategy Non – Pole Substations
UE PL 2015 Life Cycle Strategy Non – Pole Substations
UE PL 2017 Life Cycle Strategy Underground Cable Systems
UE PL 2023 Life Cycle Strategy Zone Substation Circuit breakers Life Cycle Strategy
UE PL 2027 Life Cycle Strategy Zone Substation Protection and Control Relays
UE PL 2028 Life Cycle Strategy Zone Substation Transformers
UE PL 2052 Single Wire Earth Return (SWER)
UE PL 2300 Network Performance Strategy
United Energy Regulatory Proposal
VicRoads Traffic monitor Report 2012-13
Huegin: Conduit: Benchmarking and Independent Research
Australian Energy Regulator: RIN Responses