Embed Size (px)
Citation preview
DOCUMENT ENSURE
ED 174 416 SE 027 985
TITLE Biomedical Science, Unit IV: The Nervous System in.Health and Medicine. .The Nervous System; Disorders ofthe Brain and Nervous System; Application of ComputerScience to Diagnosis; Drugs and Pharmacology; TheHuman Senses; Electricity. Laboratory Manual. RevisedVersion, 1976.
INSTITUTION Biomedical Interdisciplinary Curriculum Project,Berkeley, Calif.
SPONS AGENCY National Science Foundation, iiashington, D.C.PUB DATE 76NOTE 151p.; For related documents, see SE 027 978-999 and
SE 028 510-516; Not available in hard copy due tocopyright restrictions; Contains occasional lighttype
EDRS PRICEDESCRIPTORS
MF01 Plus Postage. PC Not Available from EDRE.Anatomy; Biology; *Computer Science; Electricity;Health; *Health Education; Higher Education;*Laboratory Techniques; *Laboratory Training;Mathematics Education; Pathology; *Physiology;*Science Education; Secondary Education
ABSTRACTDesigned to accompany the student text on the nervous
system, this manual presents laboratory activities dealing withconcepts presented in the text. Thirty-seven activities aredescribed. Four supplementary activities dealing with concepts inelectricity are also included. Laboratory activities are divided intcseveral parts, each part covering a specific experiment dealing withthe concept covered by the activity. Each part includes discripticnsof materials, procedures, and discussion questions. (RE)
***********************************************************************Reproductions supplied by EDITS are the best that can be made
from the original document.***********************************************************************

BIOMEDICAL SCIENCE
UNIT IV
THE NERVOUS SYSTEM IN HEALTH
AND MEDICINE
THE NERVOUS SYSTEM; DISORDERS OF THE
BRAIN AND NERVOUS SYSTEM; APPLICATION
OF COMPUTER SCIENCE TO DIAGNOSIS; DRUGS
AND PHARMACOLOGY; THE HUMAN SENSES;
ELECTRICITY
LABORATORY MANUAL
REVISED VERSION, 1976
THE ICMEDICAL INTERDISCIPLINARY CURRICULUM PROJECT
SUPPORTED BY THE NATIONAL SCIENCE FOUNDATION
Any opinions, findings, conclusions or recommendations expressed
herein are those of the author and do not necessarily reflect
the views of the National Science Foundation.
Copyright rj Health Systems Management Corporation, 1976

LABORATORY ACTIVITY 1:
LABORATORY ACTIVITY 2:
LABORATORY ACTIVITY 3:
LABORATORY ACTIVITY 4:
LABORATORY ACTIVITY 5:
LABORATORY ACTIVITY 6:
TABLE OF CONTENTS
Page
Observing the Brain 1
Observing Electrical Inpulses in Nitella . . . 5
Monitoring Brain Waves--Electroencephalography 11
Biofeedback 15
Exploring Reflexes 19
Analysis of Cerebrospinal Fluid 23
26
of Brain Disease. . 28
Logic Gates 31
LABORATORY ACTIVITY 8: Discovering Visual Gaps
ACTIVITY 9: An Introduction to Computer Diagnosis
LABORATORY ACTIVITY 10:
LABORATORY ACTIVITY 11: A Computer Circuit for TwoDiseases and Three Findings 40
ACTIVITY 12A: Simplifying the Brain-Disease Truth Table . . ..... 46
IABORATORY ACTIVITY 12B: More on Logic Gates 47
ACTIVITY 13A: Circuitry for the Diagnostic Compute- 53
LABORATORY ACTIVITY 13B: Constructing the Brain-Disease Computer. 55
LABORATORY ACTIVITY 14: Preparing Drugs From Plant Sources 59
LABORATORY ACTIVITY 16: Microorganisms From the Soil 65
LABORATORY ACTIVITY 18: Testing Antibacterial Agents 73
LABORATORY ACTIVITY 19: Testing the Antibiotic Activity of Penicillium 81
LABORATORY ACTIVITY 20: Testing the Effectiveness of Antibacterial Agents 83
LABORATORY ACTIVITY 21: Making Waves and Pure-Tone Audiometry 87
LABORATORY ACTIVITY 22: Looking Into the Ear, andPerforming the Rinne Test 94
LABORATORY ACTIVITY 23: Speed of Sound--Resonant Method 101
LABORATORY ACTIVITY 24: Standing Waves in Strings 104
LABORATORY ACTIVITY 26: The Wavelengths of Different Colors 110
LABORATORY ACTIVITY 27: Working With Color 114
LABORATORY ACTIVITY 28: Index of Refraction 117
LABORATORY ACTIVITY 29: Making Lenses 120
LABORATORY ACTIVITY 30: Determining the Focal Length of Lenses 122
LABORATORY ACTIVITY 31: Dissection of the Eye 125
LABORATORY ACTIVITY 34: Testing Visual Acuity 126
LABORATORY ACTIVITY 36: Two-Point Touch Thresholds 129
LABORATORY ACTIVITY 37: Taste Thresholds 132
SUPPLEMENTARY LESSONS ON ELECTRICITY
LABORATORY ACTIVITY A: Voltage Sources and Electric Circuits S-1
LABORATORY ACTIVITY C: The Effect of Resistance on Current S-5
LABORATORY ACTIVITY D: Voltage and Batteries S-7
LABORATORY ACTIVITY E: Measuring the Skin Resistance 5 -10
LABORATORY ACTIVITY 1: OBSERVING THE BRAIN
INTRODUCTION:
While there are major differences between them, the human brain resembles the
brains of other animals in many ways. Therefore, by studying the brains of other
animals, one can obtain information about the structure of the human brain. The
study of the brain's blood vessels is particularly important in medicine because
atherosclerosis of the arteries that supply the brain with blood is one of the lead-
ing causes of death in the United States.
In Part I of this activity, you will familiarize yourself with the structure of
the brain of an animal and the functions of some of its parts. In'Part II, you will
make a microscopic observation of nervous tissue.
PART I: THE SURFACE OF THE BRAIN
MATERIALS:
brain for dissection
dissecting probe
pan or aluminum foil
scalpel or single-edged razor blade
PROCEDURE:
1. Familiarize yourself with the two surfaces of the brain: the top surface
and the base. The top surface of a human brain is shown in Section 1, Figure 1, of
the Student Text. This is the surface that is protected by the dome of the skull.
The base is the other side of the brain.
2. Observe the top surface. Note the thin membrane closely covering the surface
of the brain. Also note the numerous blood vessels on the surface. Is the color of
the blood lifelike? (1) Are the blood vessels above or beneath the membrane? (2)
3. The largest, round part of the brain is the cerebrum. In back of the cere-
brum find a smaller ball called the "cerebellum." The underside of the cerebellum
is attached to the brain stem, a thick stalk. Find the brain stem.
4. The front of the brain stem merges into the base of the cerebrum. The back
of the brain stem merges into the base of the cerebellum. As it leaves the rest of
the brain, the brain stem merges into the narrower spinal cord. The spinal cord is
generally cut off in preparation, leaving a stump. In some specimens, even the stump
may be absent. Is the brain stem covered by a membrane? (3) Look for small white
string-like structures on the sides of the brain stem. These are nerves.
*5. Use your dissecting probe to determine whether or not the cerebellum merges
directly with the cerebrum. Do this by cutting through the membrane between the
two. Are the cerebrum and cerebellum directly connected? (4) If not, what struc-
ture connects them? (5)
6. Notice that the surface of the cerebrum is covered with long twisting "hills"
separated by "valleys." Compare and contrast the surface of the cerebellum to the
surface of the cerebrum. (6)
7. Notice that the cerebrum consists of two hemispheres, the right and the left.
They are separated by a large valley called a fissure. In general, the right hemi-
1
sphere controls the movements of the left side of the body, while the left hemi-
sphere controls the movements of the right side of the body. This means that nerve
cells from one hemisphere must go over to the opposite side of the body. The place
where they cross over to the opposite side is in the brain stem and also in a stru-
ture in the cerebrum we will look at later.
The rear surface of the cerebrum,near the cerebellum, is devoted to vision in
humans as well as in other animals. The middle surface of the cerebrum controls
movements, and receives information on body movement and touch.
8. Look into the gap between the cerebellum and cerebrum for the round "bumps"
on the brainstem. They are where nerve cells from the eyes and ears connect to
other nerve cells that go to the cerebrum.
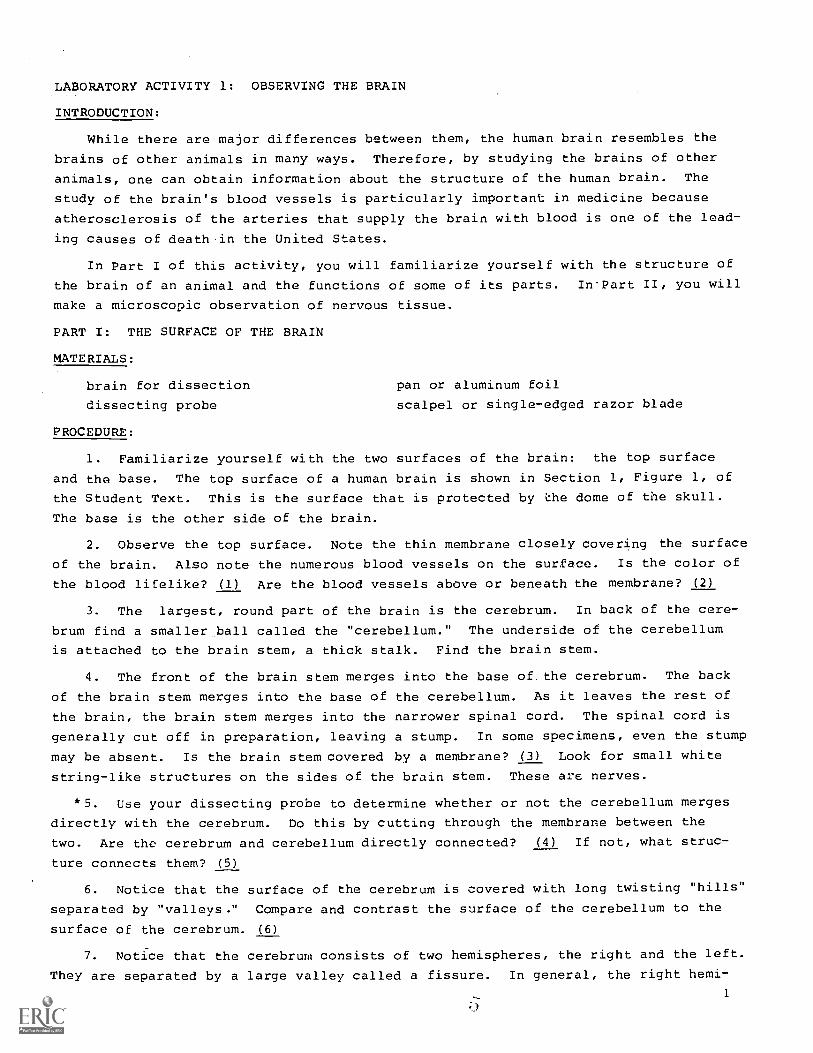
* 9. Cut a deep groove down the middle of the cerebellum from front to back.
(Figure 1). Gently fold the cut surfaces apart to examine them. The white branches
on the cut surfaces were called the "tree of life" by medieval scientists. These
branches are made of thousands of axons (long parts of nerve cells)running parallel
to each other. These nerve cells go from the cerebellum to the brain stem and then
to other parts of the brain, helping to coordinate control over movements.
12l6Frr of er..42Q5KuNl
1446 nage. un- (04cootos 6401J r*VolloW
of 6V-r)
c.C.Fer..661-1.411A
P 41NA
FIGURE 1: Making the cut in the cerebellum.
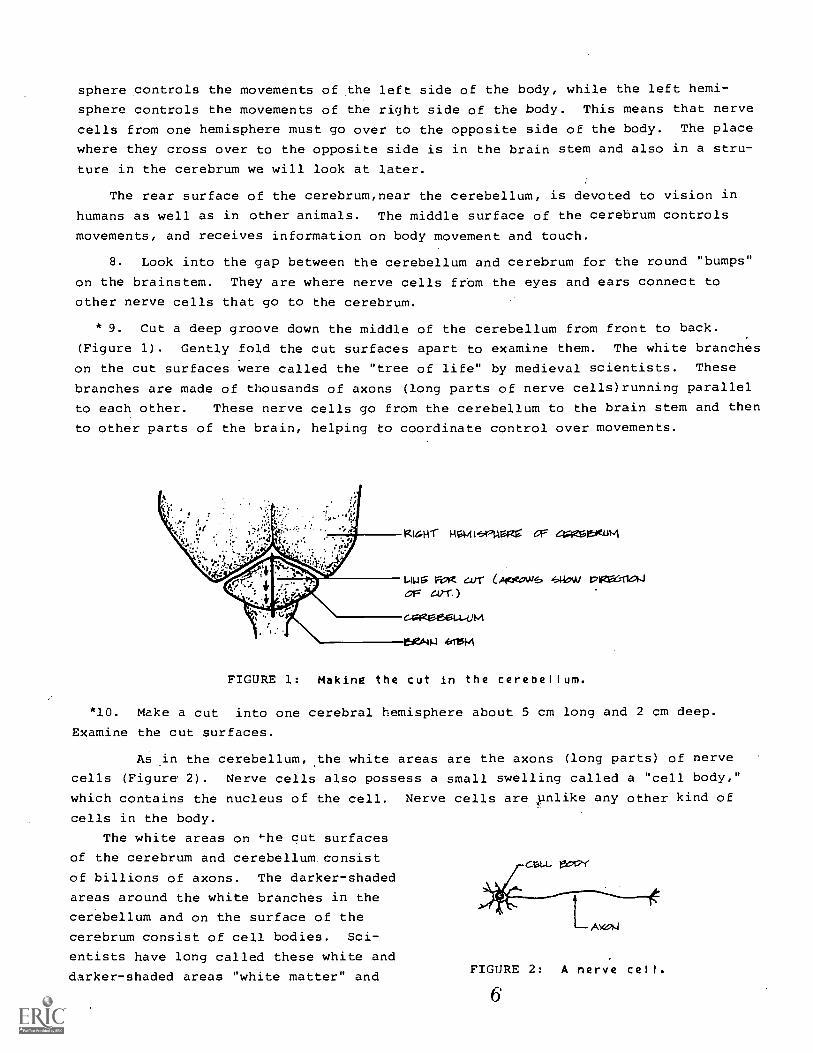
*10. Make a cut into one cerebral hemisphere about 5 cm long and 2 cm deep.
Examine the cut surfaces.
As in the cerebellum, the white areas are the axons (long parts) of nerve
cells (Figur 2). Nerve cells also possess a small swelling called a "cell body,"
which contains the nucleus of the cell. Nerve cells are unlike any other kind of
cells in the body.
The white areas on 4-he cut surfaces
of the cerebrum and cerebellum consist goENof billions of axons. The darker-shaded
areas around the white branches in the
cerebellum and on the surface of the
cerebrum consist of cell bodies. Sci-
entists have long called these white and
darker-shaded areas "white matter" and
2
FIGURE 2: A nerve cell.
6
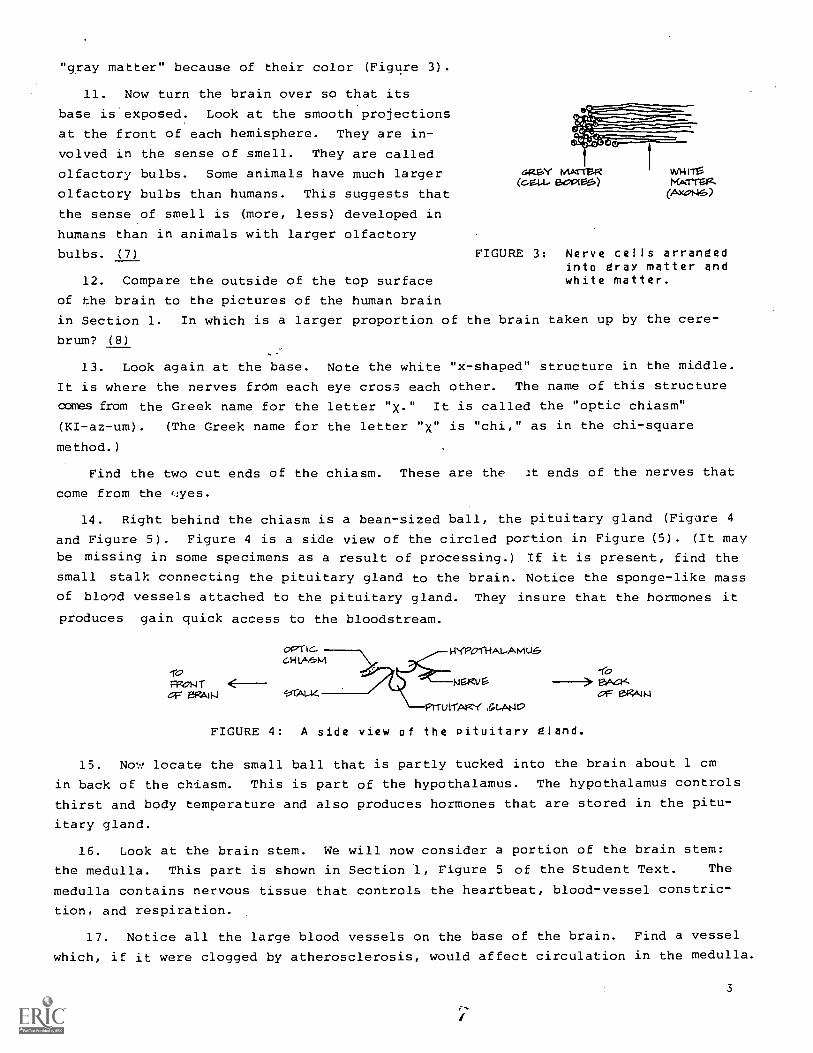
"gray matter" because of their color (Figure 3).
11. Now turn the brain over so that its
base is exposed. Look at the smooth projections
at the front of each hemisphere. They are in-
volved in the sense of smell. They are called
olfactory bulbs. Some animals have much larger
olfactory bulbs than humans. This suggests that
the sense of smell is (more, less) developed in
humans than in animals with larger olfactory
bulbs. (7)
12. Compare the outside of the top surface
of the brain to the pictures of the human brain
in Section 1. In which is a larger proportion of the brain taken up by the cere-
brum? (8)
FIGURE 3: Nerve cells arrangedinto gray matter andwhite matter.
13. Look again at the base. Note the white "x-shaped" structure in the middle.
It is where the nerves from each eye cross each other. The name of this structure
comes from the Greek name for the letter "x." It is called the "optic chiasm"
(KI-az-um). (The Greek name for the letter "x" is "chi," as in the chi-square
method.)
Find the two cut ends of the chiasm These are the it ends of the nerves that
come from the eyes.
14. Right behind the chiasm is a bean-sized ball, the pituitary gland (Figure 4
and Figure 5). Figure 4 is a side view of the circled portion in Figure (5). (It may
be missing in some specimens as a result of processing.) If it is present, find the
small stalk connecting the pituitary gland to the brain. Notice the sponge-like mass
of blood vessels attached to the pituitary gland. They insure that the hormones it
produces gain quick access to the bloodstream.
OPTIGCIAVYA
-1Z2
FRONT 1,1e4g1 e A JA4;5 eg6.10 E317,641.1
rirurrAg-( e6t..,64413
HYP011-1AL.Amu
FIGURE 4: A side view of the pituitary gland.
15. Now locate the small ball that is partly tucked into the brain about 1 cm
in back of the chiasm. This is part of the hypothalamus. The hypothalamus controls
thirst and body temperature and also produces hormones that are stored in the pitu-
itary gland.
16. Look at the brain stem. We will now consider a portion of the brain stem:
the medulla. This part is shown in Section 1, Figure 5 of the Student Text. The
medulla contains nervous tissue that controls the heartbeat, blood-vessel constric-
tion, and respiration.
17. Notice all the large blood vessels on the base of the brain. Find a vessel
which, if it were clogged by atherosclerosis, would affect circulation in the medulla.
3
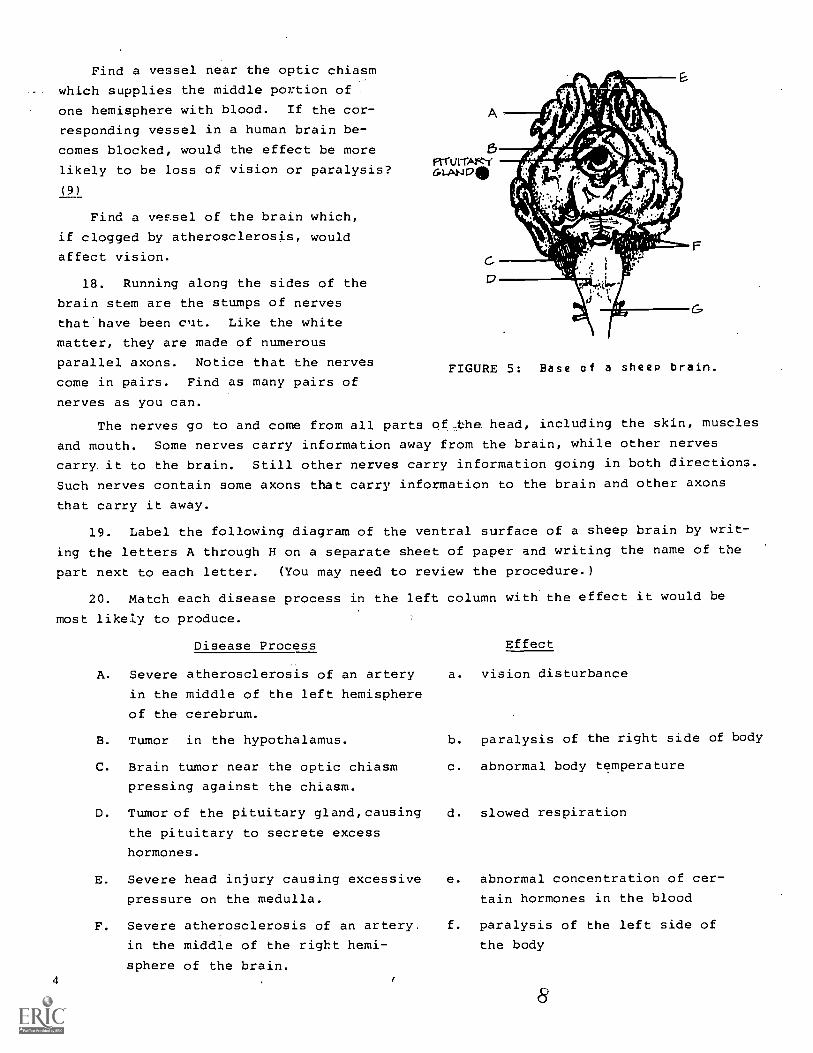
Find a vessel near the optic chiasm
which supplies the middle portion of
one hemisphere with blood. If the cor-
responding vessel in a human brain be-
comes blocked, would the effect be more
likely to be loss of vision or paralysis?
(9)
Find a vessel of the brain which,
if clogged by atherosclerosis, would
affect vision.
18. Running along the sides of the
brain stem are the stumps of nerves
that'have been c'it. Like the white
matter, they are made of numerous
parallel axons. Notice that the nerves
come in pairs. Find as many pairs of
nerves as you can.
The nerves go to and come from all parts of _the head, including the skin, muscles
and mouth. Some nerves carry information away from the brain, while other nerves
carry it to the brain. Still other nerves carry information going in both directions.
Such nerves contain some axons that carry information to the brain and other axons
that carry it away.
19. Label the following diagram of the ventral surface of a sheep brain by writ-
ing the letters A through H on a separate sheet of paper and writing the name of the
part next to each letter. (You may need to review the procedure.)
20. Match each disease process in the left column with the effect it would be
most likely to produce.
FIGURE 5: Base of a sheen brain.
Disease Process
A. Severe atherosclerosis of an artery
in the middle of the left hemisphere
of the cerebrum.
B. Tumor in the hypothalamus.
C. Brain tumor near the optic chiasm
pressing against the chiasm.
D. Tumor of the pituitary gland, causing
the pituitary to secrete excess
hormones.
E. Severe head injury causing excessive
pressure on the medulla.
F. Severe atherosclerosis of an artery.
in the middle of the right hemi-
sphere of the brain.4
Effect
a. vision disturbance
b. paralysis of the right side of body
c. abnormal body temperature
d. slowed respiration
e. abnormal concentration of cer-
tain hormones in the blood
f. paralysis of the left side of
the body

PART II: MICROSCOPIC OBSERVATION OF THE BRAIN
MATERIALS:
microscope
scalpel or single-edged razor blade
2 glass slides with cover slips
medicine dropper
PROCEDURE:
1. Cut as thin a cross-sectional slice of the spinal cord as possible. (If
the cord is missing, cut a slice of brain stem.) Place it on a slide, add a clx'01,
of water and add a cover slip. Using the 10X objective of the microscope, lopRG/1
long strands near the edge of the specimen. These are the axons of nerve cells.
2. Make a scraping of the end of the spinal cord (or the end of the brain 5.6
if the spinal cord is missing). Place the tissue on a slide, add a drop of water
and a cover slip. Using the 10X objective, look for long strands and for small
round masses. The former are axons; the latter are blood cells and cell bodies ()
nerve cells (See Figure 2). In nerve cells, the cell bodies are connected to trio
axons. When you make a scraping, the cell bodies break off from the axons.
DISCUSSION QUESTIONS:
em
1. Consider the number of axons in a small clump of nerve tissue. Assume tri
the tissue you observed is typical of the entrie nervous system. Based on your "-jted
observations, would you estimate the number of nerve cells in the brain to be a
hundred, a thousand, many thousands, or still more?
2. What advantage might there be to the peculiar shape of nerve cells?
LABORATORY ACTIVITY 2: OBSERVING ELECTRICAL IMPULSES IN NITELLA
INTRODUCTION:
In this activity you will observe the movement of electrical impulses in a
plant called Nitella. Nitella, like all other plants, lacks neurons. But the
pulses in a Nitella cell are similar to the nerve impulses in the neurons of animal`'.
The set-up you will use (Figure 1) is similar to the one used in electrocardioy1aPIIY.
NITELLA I._
IIVIPUSETRAVELS
5-rimul_AnNCTmumc_Tmooss'
1
I> 15 rt...k..1, ei-Ec-r-RopEz
osc-ILL05ccr.m
c_tiRcul-rDISPLAY OFPLA 1.-SES
OSC. I i_LOS C1=>DISPLAY 0 P-
INA PUL5E5
FIGURE 1: Schematic diagram of experimental set-up. 5
there is a positive charge at both points
and Y (Figure 2A).
Impulses could be demonstrated in neurons, but Nitella is better for this pur-
Pose because impulses move hundreds of times slower in the plant than in animal neu-
rons. Thus what you will observe is like a slow-motion version of what happens in a
tu.rvu roll.. Nitella is thus a useful model for studying nerve action.
It is Possible to produce an electrical impulse in a Nitella cell by stimulating
one end of the cell with a brief electrical current. The impulse that results from
the stimulation travels down to the other end of the cell, where the display elec-
trodes pick it up. The impulse may then be amplified and converted to a visual dis-
play on the oscilloscope or on the BIP diode lights (Figure 1).
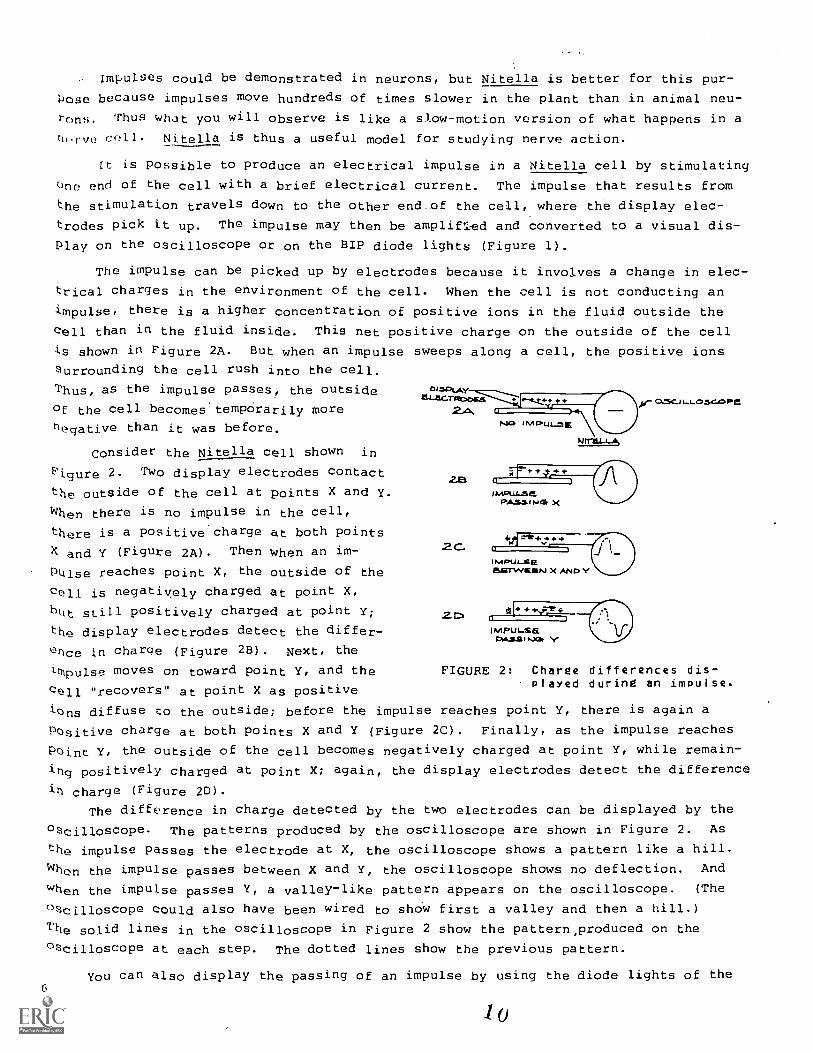
The impulse can be picked up by electrodes because it involves a change in elec-
trical charges in the environment of the cell. When the cell is not conducting an
impulse, there is a higher concentration of positive ions in the fluid outside thecell than in the fluid inside. This net positive charge on the outside of the cell
is shown in Fig ure 2A. But when an imp ulse sweeps along a cell, the positive ions
surrounding the cell rush into the cell.
Thus, as the impulse passes, the outsideE-Lecrmomes o.sc_,L..Lo3e..c>peM
tastztAy
°f the cell becomes'tempOrarily more 2.41,
negative than it was before.
Consider the Nitella cell shown in
Figure 2 Two display electrodes contact28
the outside of the cell at points X and Y.
When there is no impulse in the cell,
Then when an im-
Plalse reaches point X, the outside of the
coil is negatively charged at point X,
htit still positively charged at point y; 41 4+
the display electrodes detect the differ- ImpuLsePAasaskxl.
°Alce in charge (Figure 2B). Next, the
Ittpulse moves on toward point y, and the
cell "recovers" at point X as positive
ions diffuse to the outside; before the impulse reaches point Y, there is again a
Positive charge at both points X and Y (Figure 2C). Finally, as the impulse reaches
Point Y, the outside of the cell becomes negatively charged at point Y, while remain-
ing positively charged at point X; again, the display electrodes detect the difference
in charge (Figure 2D).
The difference in charge detected by the two electrodes can be displayed by the
°scilloscope. The patterns produced by the oscilloscope are shown in Figure 2. As
the impulse passes the electrode at X, the oscilloscope shows a pattern like a hill.
When the impulse passes between X and Y, the oscilloscope shows no deflection. And
when the impulse passes Y, a valley-like pattern appears on the oscilloscope. (The
°scilloscope could also have been wired to shoW first a valley and then a hill.)
The solid lines in the oscilloscope in Figure 2 show the pattern,produced on the
°scilloscope at each step. The dotted lines show the previous pattern.
NO IM AUUL
M111:41-L.As
I .suePAS3INIL X
te- ti"I M1.1.1BSITYVILIILN X AND Y
FIGURE 2: Charge differences dis-Played during an impulse.
fi
You can also display the passing of an impulse by using the diode lights of the
lo
SIP. However, the diode light will blink on only when the "hill" occurs on the
oscilloscope; the "valley" will not be shown by the diode light.
MATERIALS:
Nitella
Petri dish
Petri dish bottom, lid, or watch glass
cardboard strip
2 toothpicks
medicine dropper
cellophane tape
masking tape
thumbtack
ruler
scissors, scalpel or single-edgedrazor blade
nichrome wire, 22 gauge
2 electrodes with shielded cables(thick wires with plugs)
1 BIP wire, 60 cm in length
4 BIP wires, 30 cm in length
4 alligator clips
18,000-ohm resistor with two leads
BIP
small screwdriver
wire cutter-strippers
PROCEDURE:
An efficient way to proceed is to distribute the tasks as follows. While one
student makes the electrode stand (Steps 1 to 7), another may set up the BIP (Steps
8 to 10) and a third student may prepare the Nitella (Steps 11 and 12).
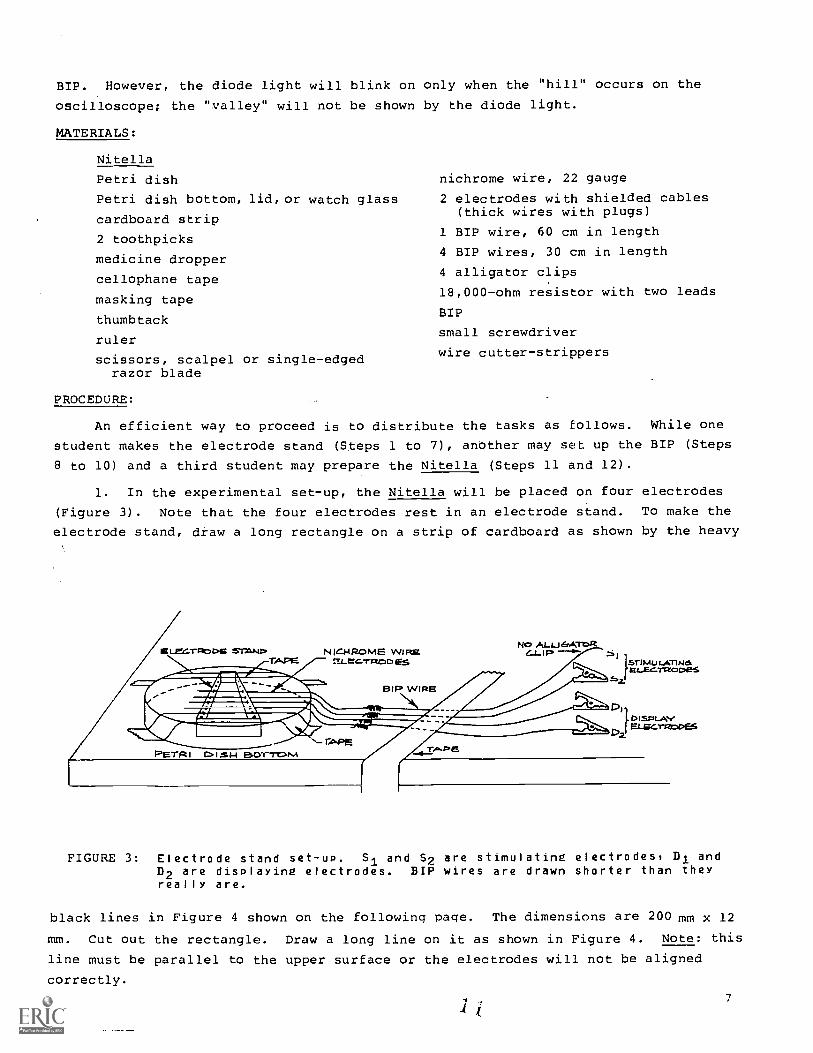
1. In the experimental set-up, the Nitella will be placed on four electrodes
(Figure 3). Note that the four electrodes rest in an electrode stand. To make the
electrode stand, draw a long rectangle on a strip of cardboard as shown by the heavy
FIGURE 3: Electrode stand set-up. Si and S2 are stimulating electrodes, Di andD2 are displaying electrodes. BIP wires are drawn shorter than theyreally are.
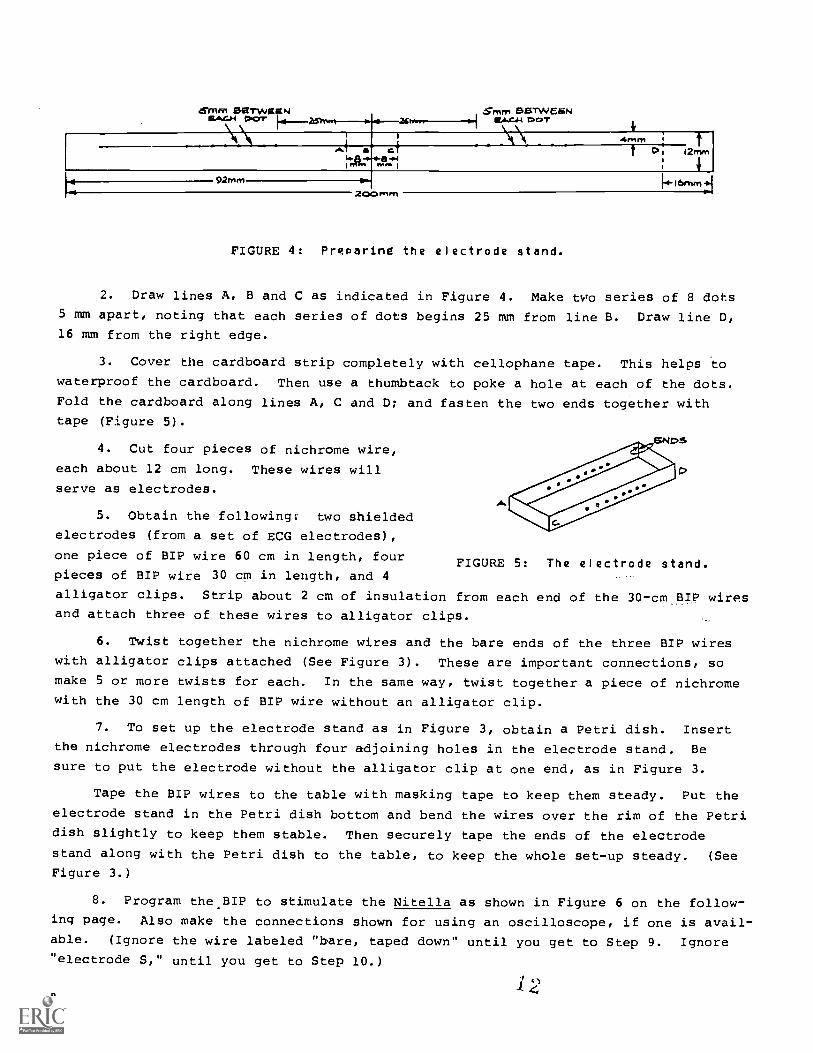
black lines in Figure 4 shown on the following cage. The dimensions are 200 mm x 12
mm. Cut out the rectangle. Draw a long line on it as shown in Figure 4. Note: this
line must be parallel to the upper surface or the electrodes will not be aligned
correctly.
7
anuflomrweaNKA4N POT
Srnm DISTWe6t412.6.4/4 DoT
4retrnt1
92mm200 mm
FIGURE 4: PreParing the electrode stand.
2. Draw lines A, B and C as indicated in Figure 4. Make two series of 8 dots
5 mm apart, noting that each series of dots begins 25 mm from line B. Draw line D,
16 mm from the right edge.
3. Cover the cardboard strip completely with cellophane tape. This helps to
waterproof the cardboard. Then use a thumbtack to poke a hole at each of the dots.
Fold the cardboard along lines A, C and D; and fasten the two ends together with
tape (Figure 5).
4. Cut four pieces of nichrome wire,
each about 12 cm long. These wires will
serve as electrodes.
5. Obtain the following: two shielded
electrodes (from a set of ECG electrodes),
one piece of BIP wire 60 cm in length, four
pieces of BIP wire 30 cm in length, and 4
alligator clips. Strip about 2 cm of insulation from each end of the 30-cm SIP wires
and attach three of these wires to alligator clips.
FIGURE 5: The electrode stand.
6. Twist together the nichrome wires and the bare ends of the three BIP wires
with alligator clips attached (See Figure 3). These are important connections, somake 5 or more twists for each. In the same way, twist together a piece of nichrome
with the 30 cm length of BIP wire without an alligator clip.
7. To set up the electrode stand as in Figure 3, obtain a Petri dish. Insert
the nichrome electrodes through four adjoining holes in the electrode stand. Be
sure to put the electrode without the alligator clip at one end, as in Figure 3.
Tape the BIP wires to the table with masking tape to keep them steady. Put the
electrode stand in the Petri dish bottom and bend the wires over the rim of the Petri
dish slightly to keep them stable. Then securely tape the ends of the electrode
stand along with the Petri dish to the table, to keep the whole set-up steady. (See
Figure 3.)
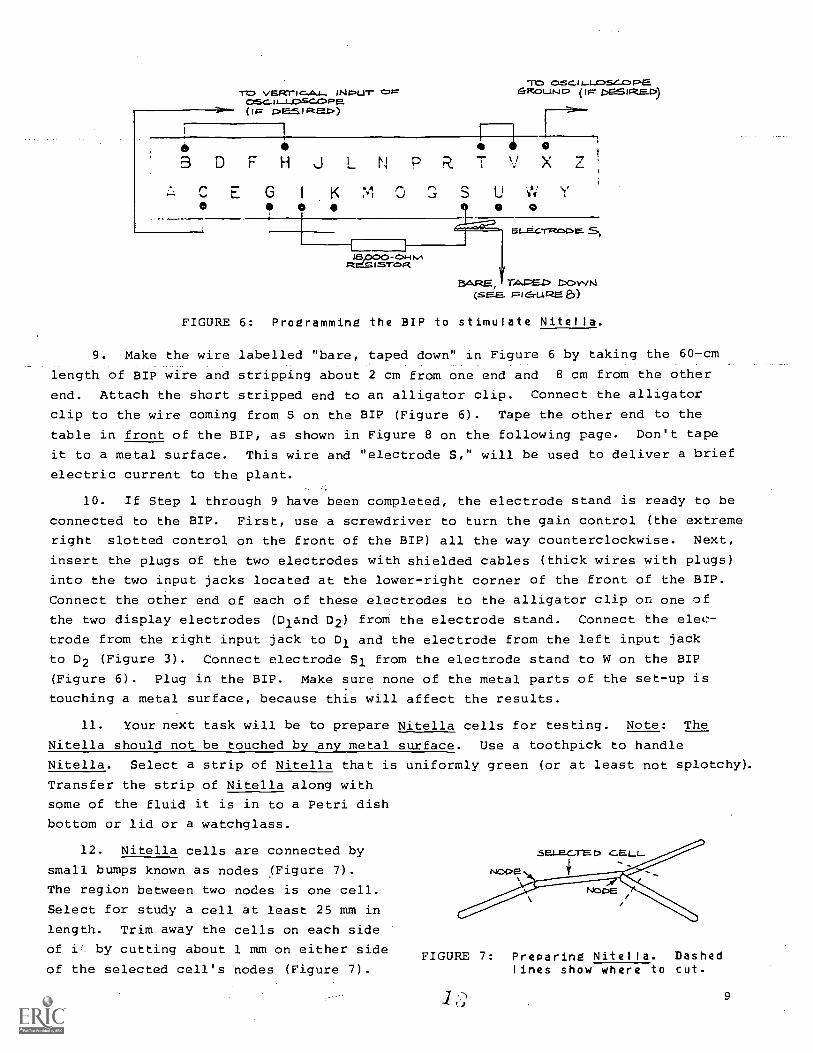
8. Program the.BIP to stimulate the Nitella as shown in Figure 6 on the follow-ing page. Also make the connections shown for using an oscilloscope, if one is avail-able. (Ignore the wire labeled "bare, taped down" until you get to Step 9. Ignore
"electrode S," until you get to Step 10.)
8
'TD as a s LL c)sc-o F.alc vsFrric& In=ur"== GPtot_iN r ( I pE51:°(!c's==:r
!I
1 i 0 i6 a eB D F H J N p R 1- V X Z '
G K 0 .1'41
0 0
la,oc)o- c*-innRESISTOR
ELECTSZJZ,C)E.S,,,
BARE, bovvni(SEE. Fs s-utze 6)
FIGURE 6: Programming the BIP to stimulate Nitella.
9. Make the wire labelled "bare, taped down" in Figure 6 by taking the 60-cm
length of BIP wire and stripping about 2 cm from one end and 8 cm from the other
end. Attach the short stripped end to an alligator clip. Connect the alligator
clip to the wire coming from S on the BIP (Figure 6). Tape the other end to the
table in front of the BIP, as shown in Figure 8 on the following page. Don't tape
it to a metal surface. This wire and "electrode S," will be used to deliver a brief
electric current to the plant.
10. If Step 1 through 9 have been completed, the electrode stand is ready to be
connected to the BIP. First, use a screwdriver to turn the gain control (the extreme
right slotted control on the front of the BIP) all the way counterclockwise. Next,
insert the plugs of the two electrodes with shielded cables (thick wires with plugs)
into the two input jacks located at the lower-right corner of the front of the BIP.
Connect the other end of each of these electrodes to the alligator clip on one of
the two display electrodes (D1and D2) from the electrode stand. Connect the elec-
trode from the right input jack to D1 and the electrode from the left input jack
to D2 (Figure 3). Connect electrode Sl from the electrode stand to W on the BIP
(Figure 6). Plug in the BIP. Make sure none of the metal parts of the set-up is
touching a metal surface, because this will affect the results.
11. Your next task will be to prepare Nitella cells for testing. Note: The
Nitella should not be touched by any metal surface. Use a toothpick to handle
Nitella. Select a strip of Nitella that is uniformly green (or at least not splotchy).
Transfer the strip of Nitella along with
some of the fluid it is in to a Petri dish
bottom or lid or a watchglass.
12. Nitella cells are connected by
small bumps known as nodes (Figure 7).
The region between two nodes is one cell.
Select for study a cell at least 25 mm in
length. Trim away the cells on each side
of i by cutting about 1 mm on either side
of the selected cell's nodes (Figure 7).FIGURE 7: Preoaring Nitella. Dashed
lines show where to cut.
9
Use scissors to cut. It is all right to use metal scissors to do this, as long as
you avoid touching the selected cell itself with the scissors. Do the cutting with
the cell submerged in its solution to avoid damaging the cell. Also do not bend the
cell, for this too can cause damage.
Prepare three or four specimens in this manner and keep them immersed in their
solution in the Petri dish or watch glass until use.
13. Place a prepared Nitella cell onto the four nichrome electrodes so that it
lies across them within the electrode stand. Make sure the cell touches all four
electrodes; move it around if necessary. (For very large cells you may have to
place the two sets of electrodes farther apart: move the pair of stimulating elec-
trodes farther from the pair of recording electrodes.)
14. Keep the cell wet by adding a few drops of water from the solution every
5 minutes or so. This maintains good electrical contact between the cell and the
electrodes and keeps the cell healthy. Without pressing down on the wires, place
the Petri dish top over the set-up.
15. Adjust the mA dial to the null point, then move the dial 20 mA units higher.
The left diode light should remain on.
16. To proceed, it will be necessary to deliver a very brief burst of current- -
ideally about .005 second long--to the cell. Read the rest of this step through
before proceeding. (The Nitella cell should have two minutes to rest in the elec-
trode stand before you deliver the burst of current.)
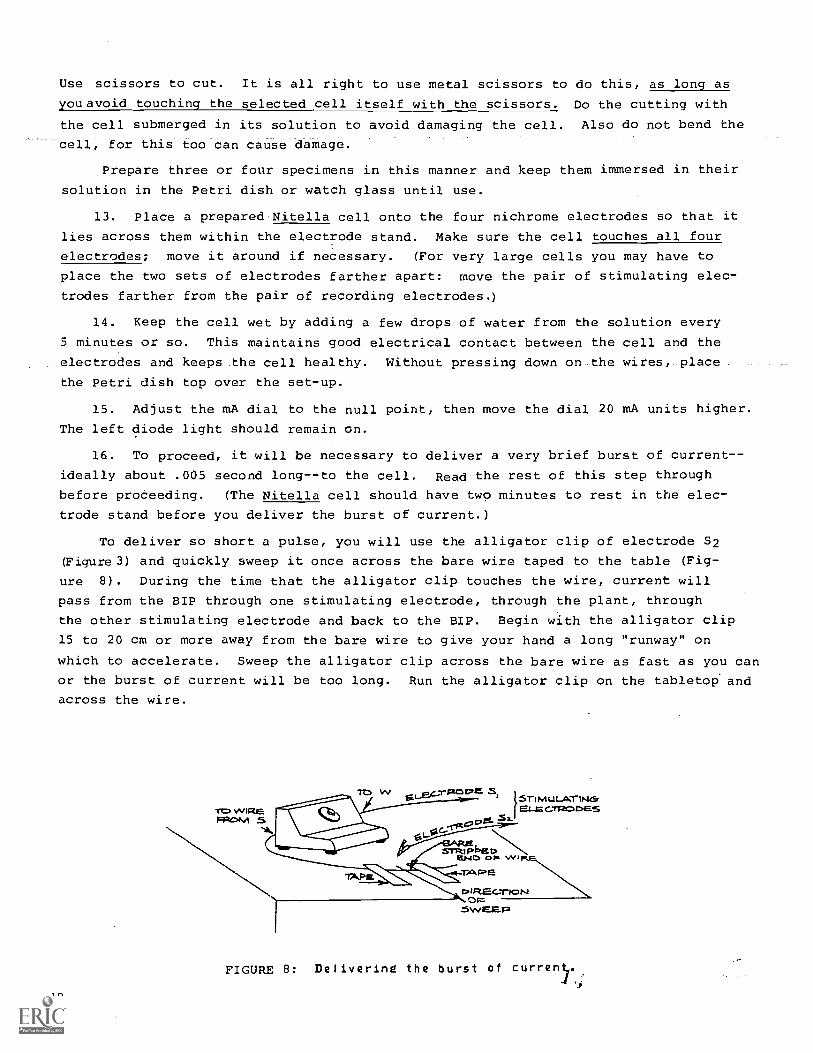
To deliver so short a pulse, you will use the alligator clip of electrode S2
(Figure3) and quickly sweep it once across the bare wire taped to the table (Fig-
ure 8). During the time that the alligator clip touches the wire, current will
pass from the BIP through one stimulating electrode, through the plant, through
the other stimulating electrode and back to the BIP. Begin with the alligator clip
15 to 20 cm or more away from the bare wire to give your hand a long "runway" on
which to accelerate. Sweep the alligator clip across the bare wire as fast as you can
or the burst of current will be too long. Run the alligator clip on the tabletop' and
across the wire.
To WIREmacwvi S
TO W c.&STIMULATINErELMCOMS
-.sx
13.1.4b FL WI
TAPECot REC-1-10N
.SWEEP
FIGURE 8: Delivering the burst of curren
10
17. Now one person delivers the pulse while one or more others watch the diode
lights. Deliver the short pulse. The right diode light will blink briefly during
the pulse. If the plant responds, then a few seconds later the right diode light
will go on as the impulse passes the first display electrode. This corresponds to
Figure 2B. With this set-up, you can't use the left diode light to tell when the
impulse passes the second electrode, for this light goes on not only when the im-
pulse passes the second electrode but also when the impulse is passing anywhere on
the plant other than the first electrode. It is even on when there is no impulse."
Wait two minutes to let the cell recover, then stimulate it again. If the
plant does not respond to the first and second stimulations, check all connections
and the programming. If there is no error, try a different specimen. Always wait
at least two minutes between tests. Also wait for two minutes after first putting
a specimen on the electrode stand.
18. Once you get the set-up to work, you may run some of the following tests.
a. Does Nitella fire an impulse in response to other stimuli such as
touch, light or a puff of air?
b. If you set the two display electrodes (D1 and D2) farther from each
other , what is the effect on the display of the response? What is the effect if
you set the display electrodes farther from the stimulating electrodes?
c. To display the impulse passing the second electrode using the BIP, re-
verse the input jacks at the BIP. Then a diode light will blink when the impulse
passes the second electrode. What is the pattern of the diode display in this case?
d. What happens to the display of the impulse if you cut the Nitella be-
tween the two display electrodes while it is in the electrode stand set-up? Repeat
this test (after two minutes) with the input jacks reversed.
DISCUSSION QUESTIONS:
1. Why does the right diode light go on after the plant is stimulated?
2. What is the main advantage of studying impulses in Nitella rather than in
a neuron?
3. In this activity a burst of electric current is used to stimulate the plant.
What are some of the things that normally stimulate the neurons in the human body
to respond with nerve impulses?
LABORATORY ACTIVITY 3: MONITORING BRAIN WAVES--ELECTROENCEPHALOGRAPHY
INTRODUCTION:
An electroencephalogram (EEG) is a tracing of the varying electrical voltages
that are continuously moving through the cortex of the brain. This activity starts
with a demonstration during which you will have a chance to observe brain waves.
Brain waves are picked up from the scalp of a subject, amplified by the BIP and
viewed on an oscilloscope screen.
J
11
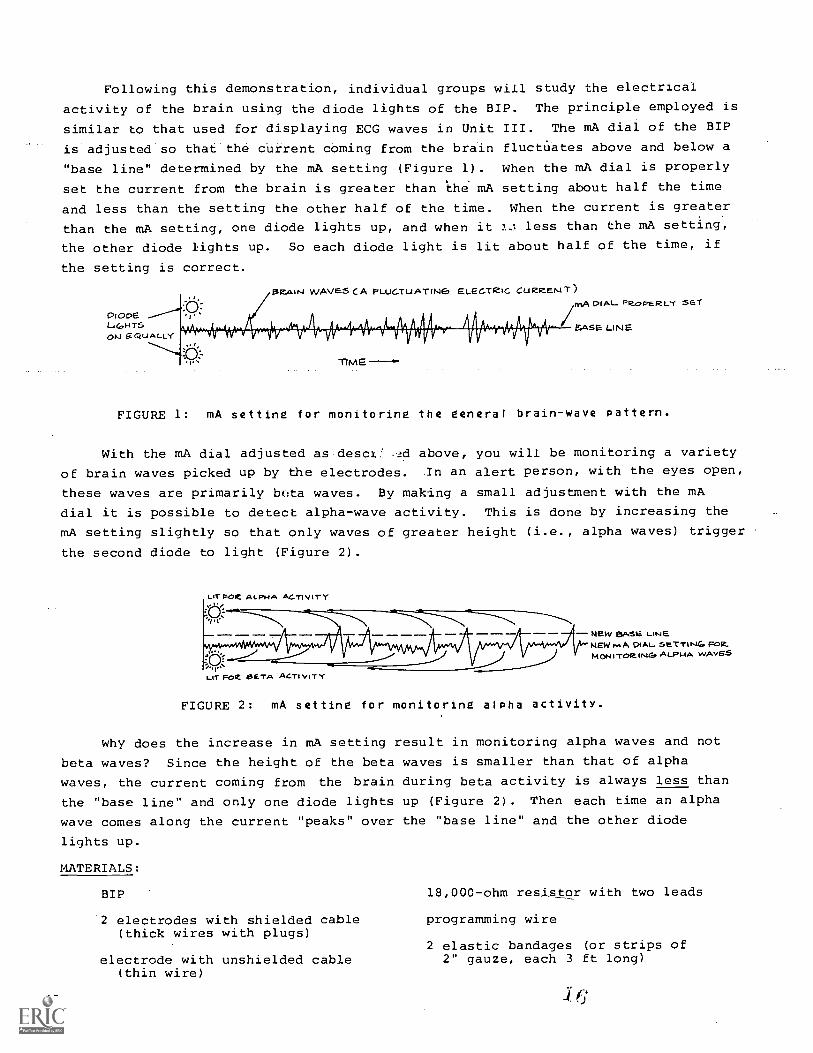
Following this demonstration, individual groups will study the electrical
activity of the brain using the diode lights of the BIP. The principle employed is
similar to that used for displaying ECG waves in Unit III. The mA dial of the BIP
is adjusted so that the current coming from the brain fluctUates above and below a
"base line" determined by the mA setting (Figure 1). When the mA dial is properly
set the current from the brain is greater than the mA setting about half the time
and less than the setting the other half of the time. When the current is greater
than the mA setting, one diode lights up, and when it 2.3 less than the mA setting,
the other diode lights up. So each diode light is lit about half of the time, if
the setting is correct.
DIODE .--/--4;°:LaG,HTSON EQuALLY
..t.
1.,
ESEAINI waves CA PLUCTUATINE2 ELEGTIZiC. CUZZeMT)DIAL PCLOPEFZLY SET
, A ,.f
. Liii II,fr
1IME
E.Asa LINE
FIGURE 1: mA setting for monitoring the general brain-wave pattern.
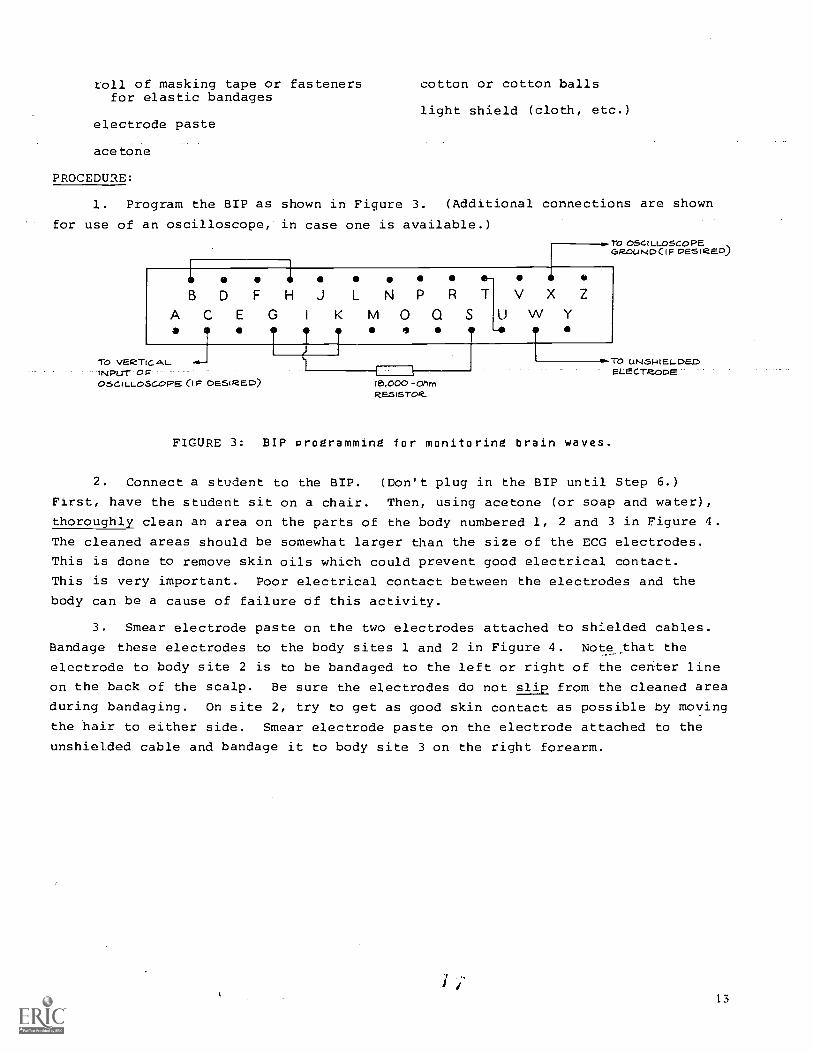
With the mA dial adjusted as desci: -.id above, you will be monitoring a variety
of brain waves picked up by the electrodes. In an alert person, with the eyes open,
these waves are primarily beta waves. By making a small adjustment with the mA
dial it is possible to detect alpha-wave activity. This is done by increasing the
mA setting slightly so that only waves of greater height (i.e., alpha waves) trigger
the second diode to light (Figure 2).
LIT FOC ALPHA AGTIvITY
NEW gave'. LINENEW ov, A DIAL. SeTrtniC.FoR.MONITORING, ALPHA WAVES
LIT FoC BETA ACTIVITY
FIGURE 2: mA setting for monitoring alpha activity.
Why does the increase in mA setting result in monitoring alpha waves and not
beta waves? Since the height of the beta waves is smaller than that of alpha
waves, the current coming from the brain during beta activity is always less than
the "base line" and only one diode lights up (Figure 2). Then each time an alpha
wave comes along the current "peaks" over the "base line" and the other diode
lights up.
MATERIALS:
BIP
2 electrodes with shielded cable(thick wires with plugs)
electrode with unshielded cable(thin wire)
12 1.6
18,000-ohm resistor with two leads
programming wire
2 elastic bandages (or strips of2" gauze, each 3 ft long)
roll of masking tape or fasteners cotton or cotton ballsfor elastic bandages
light shield (cloth, etc.)electrode paste
acetone
PROCEDURE:
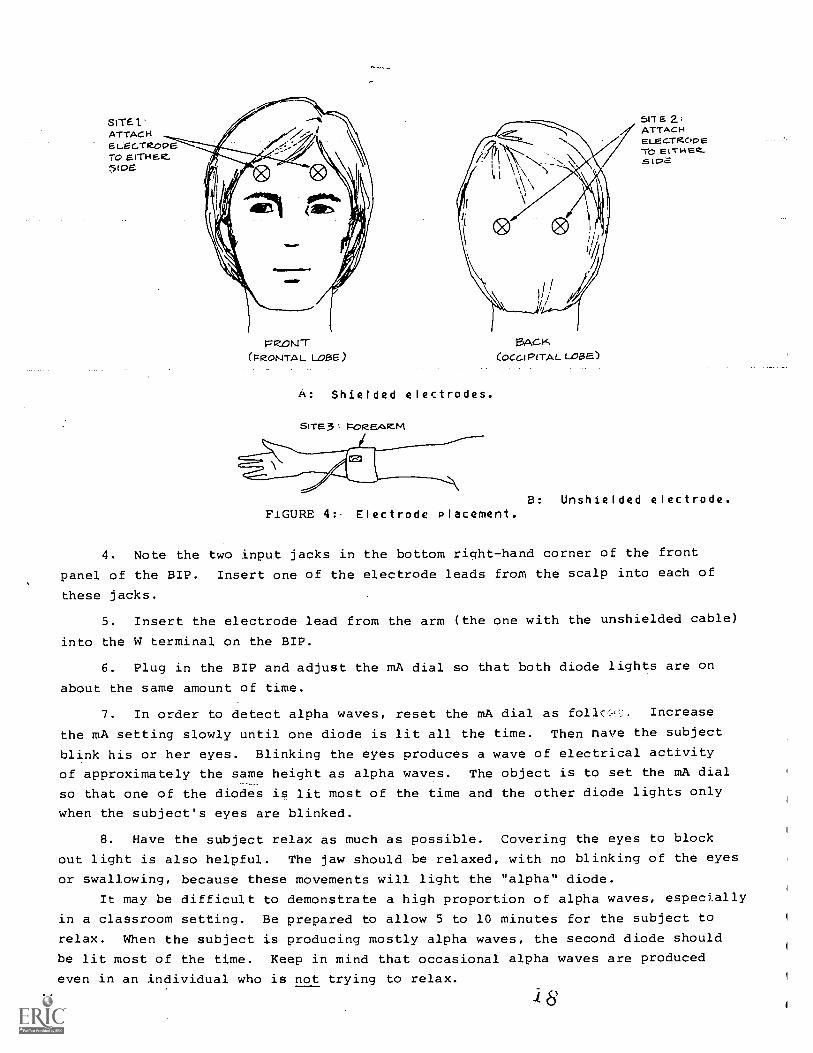
1. Program the BIP as shown in Figure 3. (Additional connections are shown
for use of an oscilloscope, in case one is available.)
To OSCILLOSCOPEGROUNDCIF DESIRED)
osDFHJLNPRTACEG I K MOQSe
TO VERTICAL.INPUT OF05CILLoScopE (IF DESIRED) 18,000 -Ohm
RE_SISTOR_
V X Z
UWY-.
TO UNSHIELDEDELECTRODE
FIGURE 3: BIP programming for monitoring brain waves.
2. Connect a student to the BIP. (Don't plug in the BIP until Step 6.)
First, have the student sit on a chair. Then, using acetone (or soap and water),
thoroughly clean an area on the parts of the body numbered 1, 2 and 3 in Figure 4.
The cleaned areas should be somewhat larger than the size of the ECG electrodes.
This is done to remove skin oils which could prevent good electrical contact.
This is very important. Poor electrical contact between the electrodes and the
body can be a cause of failure of this activity.
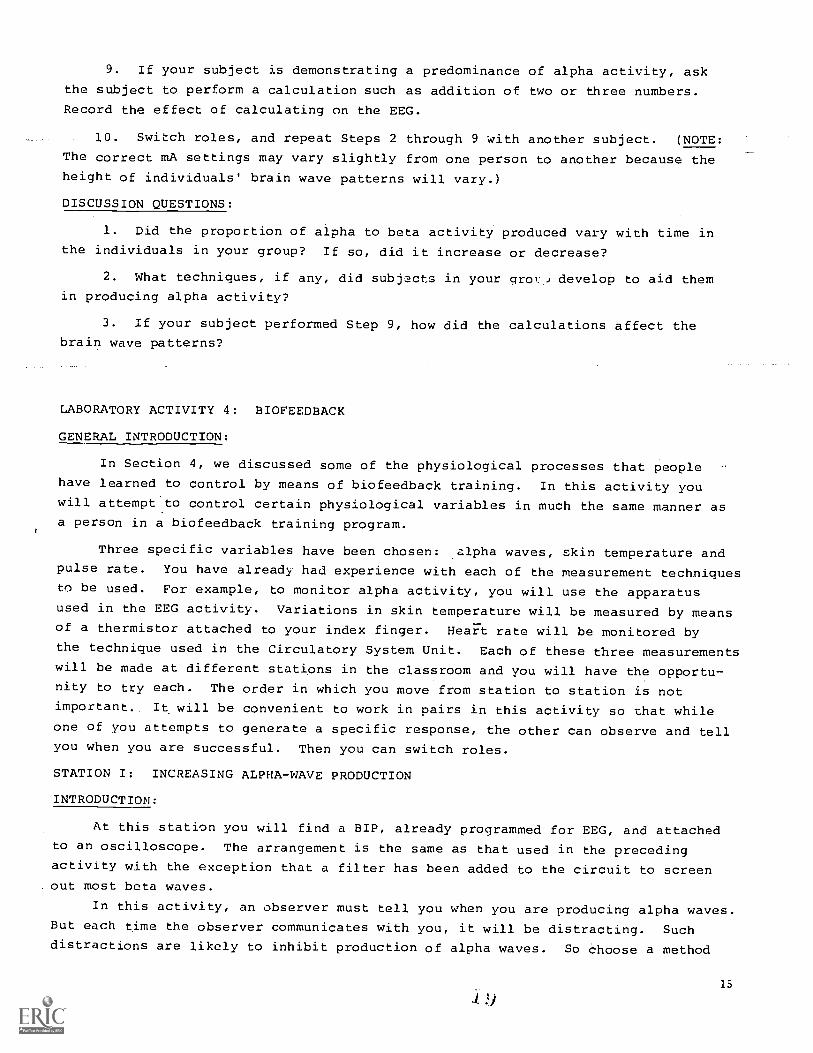
3. Smear electrode paste on the two electrodes attached to shielded cables.
Bandage these electrodes to the body sites 1 and 2 in Figure 4. Note that the
electrode to body site 2 is to be bandaged to the left or right of the center line
on the back of the scalp. Be sure the electrodes do not sliE from the cleaned area
during bandaging. On site 2, try to get as good skin contact as possible by moving
the hair to either side. Smear electrode paste on the electrode attached to the
unshielded cable and bandage it to body site 3 on the right forearm.
13
FRONT(KrZoNTAL LOBE)
A: Shielded electrodes.
SITE3 PoreeAztA
BACKCOCca Pt TA L LoEsE)
FIGURE 4:- Electrode Placement.
SITEATTACHELEC-TIZODETO EITNEe....512a
B: Unshielded electrode.
4. Note the two input jacks in the bottom right-hand corner of the front
panel of the BIP. Insert one of the electrode leads from the scalp into each of
these jacks.
5. Insert the electrode lead from the arm (the one with the unshielded cable)
into the W terminal on the BIP.
6. Plug in the BIP and adjust the mA dial so that both diode lights are on
about the same amount of time.
7. In order to detect alpha waves, reset the mA dial as Increase
the mA setting slowly until one diode is lit all the time. Then have the subject
blink his or her eyes. Blinking the eyes produces a wave of electrical activity
of approximately the same height as alpha waves. The object is to set the mA dial
so that one of the diodes is lit most of the time and the other diode lights only
when the subject's eyes are blinked.
8. Have the subject relax as much as possible. Covering the eyes to block
out light is also helpful. The jaw should be relaxed, with no blinking of the eyes
or swallowing, because these movements will light the "alpha" diode.
It may be difficult to demonstrate a high proportion of alpha waves, especially
in a classroom setting. Be prepared to allow 5 to 10 minutes for the subject to
relax. When the subject is producing mostly alpha waves, the second diode should
be lit most of the time. Keep in mind that occasional alpha waves are produced
even in an individual who is not trying to relax.
14 8
9. If your subject is demonstrating a predominance of alpha activity, ask
the subject to perform a calculation such as addition of two or three numbers.
Record the effect of calculating on the EEG.
10. Switch roles, and repeat Steps 2 through 9 with another subject. (NOTE:
The correct mA settings may vary slightly from one person to another because the
height of individuals' brain wave patterns will vary.)
DISCUSSION QUESTIONS:
1. Did the proportion of alpha to beta activity produced vary with time in
the individuals in your group? If so, did it increase or decrease?
2. What techniques, if any, did subjects in your grog:' develop to aid themin producing alpha activity?
3. If your subject performed Step 9, how did the calculations affect thebrain wave patterns?
LABORATORY ACTIVITY 4: BIOFEEDBACK
GENERAL INTRODUCTION:
In Section 4, we discussed some of the physiological processes that peoplehave learned to control by means of biofeedback training. In this activity youwill attempt to control certain physiological variables in much the same manner asa person in a biofeedback training program.
Three specific variables have been chosen: alpha waves, skin temperature andpulse rate. You have alreadl, had experience with each of the measurement techniquesto be used. For example, to monitor alpha activity, you will use the apparatusused in the EEG activity. Variations in skin temperature will be measured by meansof a thermistor attached to your index finger. Heart rate will be monitored bythe technique used in the Circulatory System Unit. Each of
will be made at different stations in the classroom and younity to try each. The
important. It will be
one of you attempts to
order in which you move from station
these three measurements
will have the opportu-
to station is not
convenient to work in pairs in this activity so that while
generate a specific response, the other can observe and tellyou when you are successful. Then you can switch roles.
STATION INCREASING ALPHA-WAVE PRODUCTION
INTRODUCTION:
At this station you will find a BIP, already programmed for EEG, and attachedto an oscilloscope. The arrangement is the same as that used in the preceding
activity with the exception that a filter has been added to the circuit to screenout most beta waves.
In this activity, an observer must tell you when you are producing alpha waves.But each time the observer communicates with you, it will be distracting. Suchdistractions are likely to inhibit production of alpha waves. So choose a method
15
of communication that will bother you as little as possible. Exactly how you do
this is up to you. You might try having the observer touch you lightly whenever
alpha waves are on the oscilloscope. Or perhaps you could have the observer simply
say "now" in a soft voice, each time alpha waves appear.
MATERIALS:
2 electrodes with shielded leads(thick cables)
electrode with unshielded lead
18,000-ohm resistor, with twoleads attached
131P
2 elastic bandages (1 meter each),with 2 clips
PROCEDURE:
programming wire
electrode paste
acetone
absorbent cotton
light shield (cloth, etc.)
clock or watch with second hand
1. Connect the three electrodes to a subject as you did in Laboratory Activity
3. Then ask the instructor to adjust the oscilloscope.
2. Have the subject blink his or her eyes a few times. The waveform that
rnsults will give a rough idea of the height of an alpha wave. However, in general,
alpha waves are a bit smaller than those resulting from eye blinking.
3. Have the subject close his or her eyes. (It may help to cover the sub-
ject's eyes to keep out the light.) Instruct the subject to begin to attempt to
increase aloha -wave production. Each time alpha waves appear, give the subject the
signal that has been decided on.
(NOTE: It may take some time for the subject to relax. Plan to allow at
least 5 to 10 minutes for this portion of the activity. During this time try not
to do anything that would distract the sub:act, i.e., no talking, moving around,
fiddling with things, etc.)
4. You may wish to count the number of times you observe alpha waves being
produced during three five-minute periods to see whether the subject is learning
how to generate the alpha waves. To do this, tell the subject when to start, note
the time and then note every time alpha waves appear. At the end of the activity
you can tabulate :he results.
5. Switch roles and repeat the entire procedure.
STATION II: ALTERING SKIN TEMPERATURE
INTRODUCTION:
One biofeedback method commonly used to help people who suffer from migraine
headaches is,to train them to increase the temperature in their hands or fingers.
In this portion of the activity you will attempt' to .perform this feat. A thermis-
tor attached to a finger will monitor skin temperature'of that finger. The observ-
er will be taking your skin temperature every minute for 5 to 10 minutes and will
notify you of any changes that occur.
16 20
If you do not have any ideas about how you might try to raise the temperature
in your finger, you may memorize and think about some of the following phrases.
(These phrases have been used successfully by biofeedback specialists to raise theskin temperature of subjects.)
1. I feel quite quiet.
2. I am becoming more and more relaxed.
3. My whole body feels quiet, heavy and relaxed.
4. My hands and fingers are heavy.
5. My fingers are warm.
6. Warmth is flowing into my fingers. They are warm.
7. My fingers are warm--relaxed and warm.
MATERIALS:
BIP with thermistor component
cotton tape
PROCEDURE:
1. Have the subject relax in the chair provided at the station.
clOck-Or watch with second hand
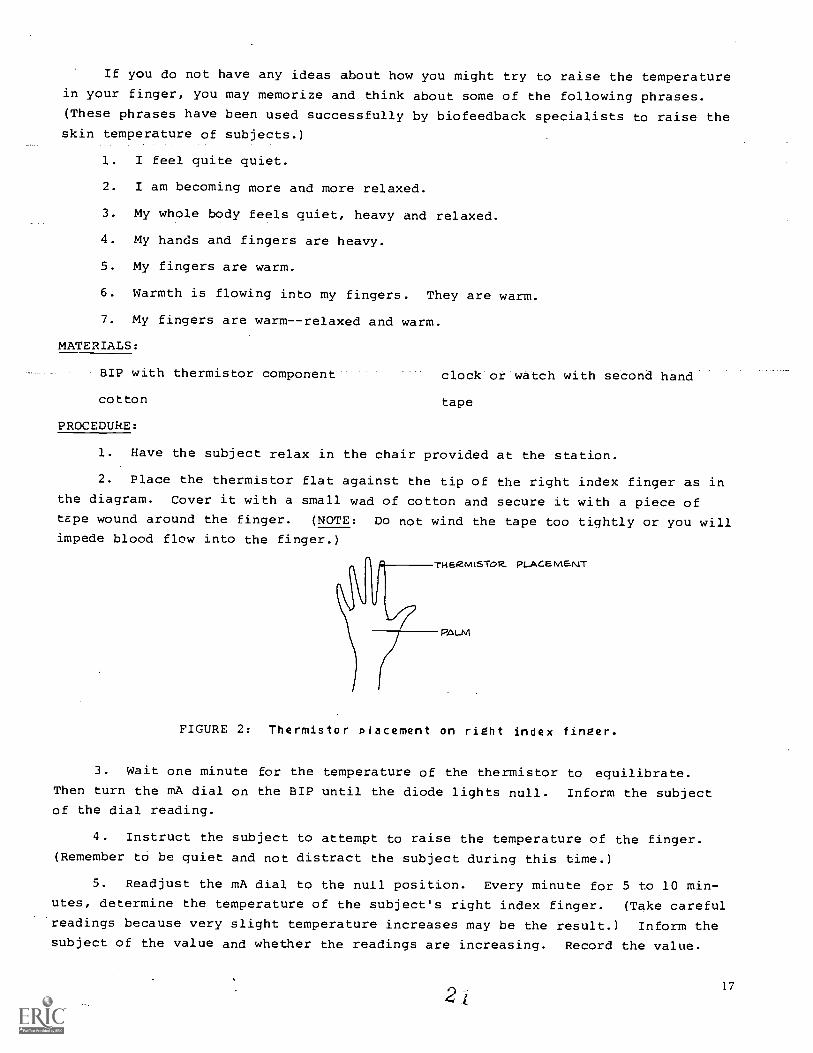
2. Place the thermistor flat against the tip of the right index finger as inthe diagram. Cover it with a small wad of cotton and secure it with a piece oftape wound around the finger. (NOTE: Do not wind the tape too tightly or you willimpede blood flow into the finger.)
EaM 15TO R. PLACEMENT
PALM
FIGURE 2: Thermistor placement on right index finger.
3. Wait one minute for the temperature of the thermistor to equilibrate.
Then turn the mA dial on the BIP until the diode lights null. Inform the subjectof the dial reading.
4. Instruct the subject to attempt to raise the temperature of the finger.
(Remember to be quiet and not distract the subject during this time.)
5. Readjust the mA dial to the null position. Every minute for 5 to 10 min-
utes, determine the temperature of the subject's right index finger. (Take careful
readings because very slight temperature increases may be the result.) Inform the
subject of the value and whether the readings are increasing. Record the value.
17
(Note: in experiments of this type, the initial response is often a decrease
in temperature.)
6. Switch roles and repeat the procedure for the second subject.
STATION III: INCREASING HEART RATE
INTRODUCTION:
Biofeedback involving the regulation of a person's heart rate has been used
with people who suffer from certain types of heart disease. In clinical situations,a decrease of heart rate is often desired. Some subjects merely give themselves
the suggestion that they are becoming more and more relaxed and then "will" their
heart rate to decrease. Other people prefer to use visual images of relaxing scenes.
At this station you will find a BIP attached to a photocell. This set-up is
the same as the one you used to measure heart rate (arteriolar pulse rate) in Unit
III. One student will serve as the subject and will attempt to increase his or herheart rate. (It is easier to increase the heart rate than to decrease it.) The
observer will make 15-second pulse counts about every half minute and inform the
subject of the heart rate.
MATERIALS:
clock or watch with second hand photocell and associated circuitry
BIP ring stand and 2 clamps
light source
PROCEDURE:
1. At this station there is a lamp and photocell mounted on a ring stand.
The photocell is connected to a BIP. Plug in the BIP and have the subject place
the end of his or her middle finger on the top of the photocell so that it com-
pletely covers the cell.
2. Adjust the lamp so that it touches the top of the subject's finger.
3. Use the mA dial to null the diode lights on the BIP. The BIP lights
monitor the change in blood flow in the finger that occurs with each heartbeat.
The subject may have to press harder or lighter on the photocell until the diode
lights becjin to blink. (The mA dial may need to be adjusted to give a more sensi-tive indication )
4. Have the subject rest his or her arm on the table, so that it is relaxed
and does not move.
5. Determine the subject's pulse by counting the blinking of the BIP diode
lights for 15 seconds. This should not be hard for you to do if you hold a watch
with a second hand next to the diode lights, so that you can see both things atonce. Practice doing this a few times until you feel confident with the technique.
6. Instruct the subject to begin attempting to increase the heart rate.
Roughly every 30 seconds take the subject's heart rate by counting the blinks of
the diode lights. Multiply that number by four. Inform the subject of his or tier
heart rate and whether it is increasing. Record the data.
7. Switch roles and repeat the procedure.
DISCUSSION.QUESTIONS:
1. Were you able to increase production of alpha waves? If so, what condi.'
tions or factors were helpful? What conditions inhibited production of alpha waVe"?
2. Do you know of any students in your class who meditate regularly? If so,
were they more or less successful in producing alpha waves than non-meditators?
3. Were you able to increase the skin temperature of your finger? How might
this ability be useful in medicine?
4. Were you able to increase your heart rate?
5. Speculate about what other body functions might be suitable for biofeebacKtraining.
LABORATORY ACTIVITY 5: EXPLORING REFLEXES
INTRODUCTION:
The reflexes of the body are useful for checking out many portions of the hervOlIS
system. If the neurons that make up a reflex arc are not functioning properly, the
normal reflex may be absent or at least reduced. Anfl if brain neurons that inhibit
the reflex are not functioning properly, the reflex may be stronger than normal.
A normal response may vary quite a lot from one person to the next. So the im'
portant question, usually, is whether both halves of the patient behave alike.
strong knee jerk may not be significant if both legs show a strong reflex. But .j.k vri
is weak, something's probably wrong.
In this activity you will examine several different reflexes. There are mero,
more that may be used to test other parts of the body, but these are among the moot
commonly tested.
It would be a good idea to compare reflexes on both sides of your subject's Poe
to see whether they are equally vigorous. But don't be alarmed if the responses diE-,
fer a little--a reflex action is very sensitive to (1) getting the subject to relax
completely, (2) locating the exact point to stimulate and (3) applying the right
amount of force.
In all the tests, you and the other students in your team should take turns as
tester and subject. The activity is designed to be performed in any order. In 001er
words, it is not necessary to do Part I before Part II and so on.
MATERIALS:
reflex hammer pencil with eraser tip
clear plastic sheet pen-light
PROCEDURE:
PART I: Quadriceps Reflex ("Knee Jerk")
1. This reflex is probably most easily produced if the subject sits on a duOk
19
4 ti
or table with both legs hanging loosely. Alternatively, have the subject sit with
legs crossed at the knee so that the leg to be tested hangs free. It may be helpful
here to have the male subjects roll up their pants above the knee.
2. The tendon that attaches the quadriceps muscle to the lower leg bone runs
under the knee cap. Striking that tendon with a reflex hammer stretches the muscle,
which brings on the "knee jerk" reflex. Test for the knee jerk reflex by giving your
subject a sharp tap just below the knee cap. (Do not tap too hard.)
3. You may wish to try an alternative technique. Place your finger on the ten-
don and tap your finger. That technique demands less accuracy than the hammer blow
(and also ensures that the tester will do the suffering if he is heavy-handed).
4. Sometimes a reflex is inhibited by the brain. Your subject may be a little
tense, causing the quadriceps muscle to be partially contracted. The subject may not
be sufficiently relaxed to give the normal response. Neurologists cause their sub-
jects to relax one muscle by having their subjects concentrate on other muscles.
For example have your subject hook fingers together and pull. While your subject
is doing this, repeat Steps 1 to 3.
5. Record your observations.
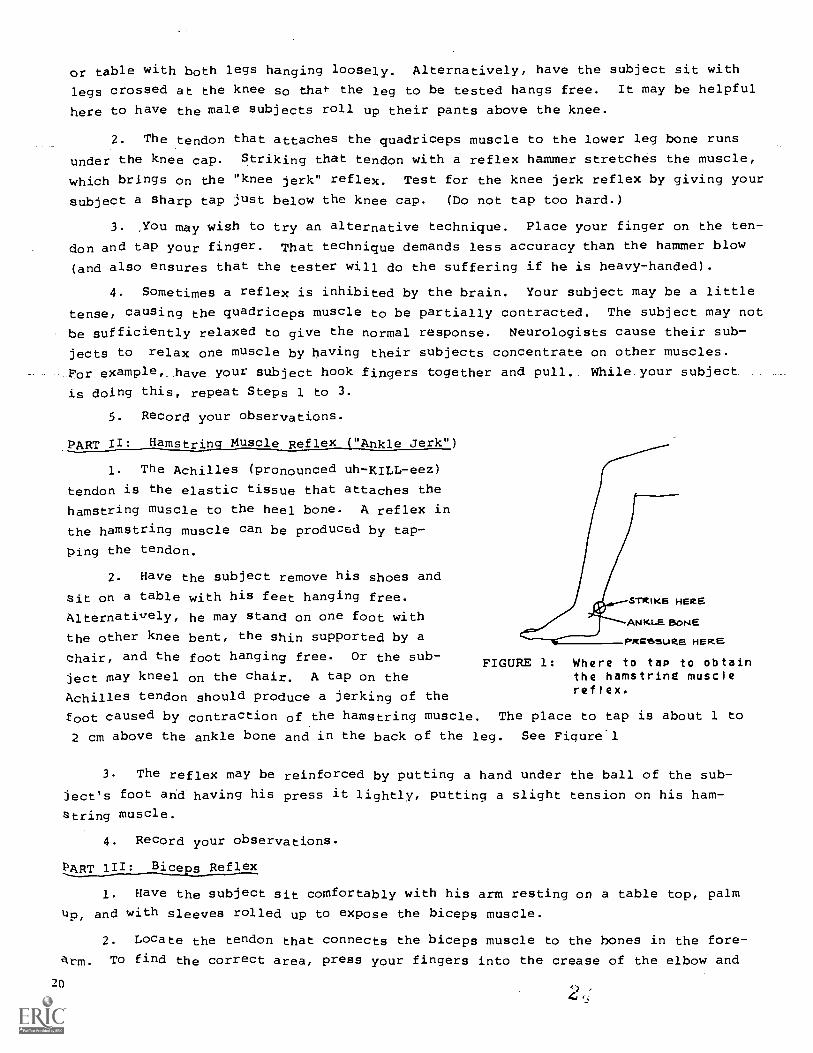
PART II: Hamstring Muscle Reflex ("Ankle Jerk")
1. The Achilles (pronounced uh- KILL -eez)
tendon is the elastic tissue that attaches the
hamstring muscle to the heel bone. A reflex in
the hamstring muscle can be produced by tap-
ping the tendon.
2. Have the subject remove his shoes and
sit on a table with his feet hanging free.
Alternatively, he may stand on one foot with
the other knee bent, the shin supported by a
chair, and the foot hanging free. Or the sub-
ject may kneel on the chair. A tap on the
Achilles tendon should produce a jerking of the
foot caused by contraction of the hamstring muscle. The place to tap is about 1 to
2 cm above the ankle bone and in the back of the leg. See Figure1
STRIKE HERE
ANKLE BONE
PRESsuks HERE
FIGURE 1: Where to tap to obtainthe hamstring musclereflex.
3. The reflex may be reinforced by putting a hand under the ball of the sub-
ject's foot and having his press it lightly, putting a slight tension on his ham-
string muscle.
4. Record your observations.
PART Biceps Reflex
1. Have the subject sit comfortably with his arm resting on a table top, palm
tip, and with sleeves rolled up to expose the biceps muscle.
2. Locate the tendon that connects the biceps muscle to the bones in the fore-
arm. To find the correct area. press your fingers into the crease of the elbow and
20

have the subject contract the biceps muscle. The string-like tendon can be easily
felt and may also be visible.
3. Tap sharply at the point indicated in Figure 2. It will be important for
the subject's arm muscles to be relaxed.
FIGURE 2: Positioning a subject to check for the biceps reflex.
4. It may be helpful to press the tendon with two fingers and then strike your
fingers.
5. Record your observations.
PART IV: Triceps Reflex
1. Position the subject as in Part III, except with the elbow extended 2 to
5 cm beyond the edge of the table. The subject's palm may be up or down.
2. Find the tendon connecting the triceps muscle to the bone, just above the
elbow. The triceps muscle runs down the back of the upper arm. The correct region
may be most easily found if the subject contracts the biceps muscle voluntarily.
The region on the opposite side of the arm that stiffens is the triceps muscle.
3. Have the subject relax the triceps muscle. Then tap the subject about
three cm above the elbow--at a point on the arm opposite to the region tapped in
Part III.
4. Record your observations.
PART V: Brachioradialis Reflex
1. Position the subject as in Part III, except with his palm down and with his.
hand dangling off the edge of the table.
2. Tap the muscle that runs diagonally across the forearm (Figure 3 on thefollowing page). This is the brachioradialis (pronounced BRAY-key-o-RAY-dee-A-liss)
muscle.
3. Record your observations.
21
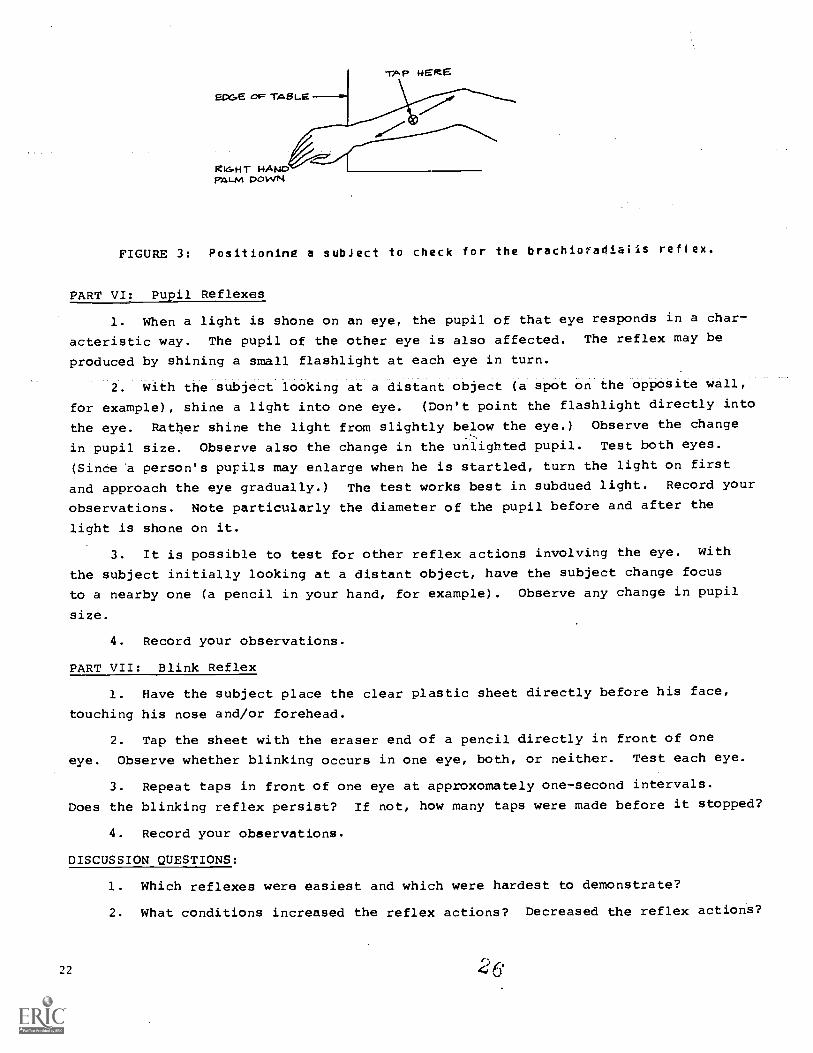
FIGURE 3: Positioning a subject to check for the brachioradisiis reflex.
PART VI: Pupil Reflexes
1. When a light is shone on an eye, the pupil of that eye responds in a char-
acteristic way. The pupil of the other eye is also affected. The reflex may be
produced by shining a small flashlight at each eye in turn.
2. With the subject looking at a distant object (a spot on the opposite wall,
for example), shine a light into one eye. (Don't point the flashlight directly into
the eye. Rather shine the light from slightly below the eye.) Observe the change
in pupil size. Observe also the change in the unlighted pupil. Test both eyes.
(Since 'a person's pupils may enlarge when he is startled, turn the light on first
and approach the eye gradually.) The test works best in subdued light. Record your
observations. Note particularly the diameter of the pupil before and after the
light is shone on it.
3. It is possible to test for other reflex actions involving the eye. With
the subject initially looking at a distant object, have the subject change focus
to a nearby one (a pencil in your hand, for example). Observe any change in pupil
size.
4. Record your observations.
PART VII: Blink Reflex
1. Have the subject place the clear plastic sheet directly before his face,
touching his nose and/or forehead.
2. Tap the sheet with the eraser end of a pencil directly in front of one
eye. Observe whether blinking occurs in one eye, both, or neither. Test each eye.
3. Repeat taps in front of one eye at approxomately one-second intervals.
Does the blinking reflex persist? If not, how many taps were made before it stopped?
4. Record your observations.
DISCUSSION QUESTIONS:
1. Which reflexes were easiest and which were hardest to demonstrate?
2. What conditions increased the reflex actions? Decreased the reflex actions?
22 26.
3. You probably found that you could increase the quadriceps reflex action
by having the subject clasp fingers and pull the arms in opposite directions. What
does the brain have to do with this increase in response?
4. Uneven responses in reflex tests on opposite sides of the body may indicate
a disorder of the nervous system. You may have obtained different results on oppo-
site sides of your subject. Yet your subject could be perfectly normal. Explain.
LABORATORY ACTIVITY 6: ANALYSIS OF CEREBROSPINAL FLUID
INTRODUCTION:
Analysis of the cerebrospinal fluid (CSF) is an important method in the diag-
nosis of a variety of conditions that affect the central nervous system. In this
activity you will analyze CSF for the presence of (1) red blood cells, (2) increased
total protein concentration and (3) increased gamma globulin concentration. These
tests are made routinely whenever a spinal fluid sample is taken. You will test four
different simulated spinal fluids for these abnormalities.
The test for red blood cells uses a centrifuge to concentrate any red blood
cells that may be in the sample, and a microscope for looking for the blood cells.
In the test for high protein concentration, the protein is precipitated by adding
sulfosalicylic acid solution to the sample. The resulting turbidity is measured
with the BIP. Testing for high levels of gamma globulin involves precipitating
the gamma globulin by mixing spinal fluid and ammonium sulfate solution. Other pro-
teins (such as albumin) are not precipitated by this procedure. Note: it is possible
to have a clinically high gamma globulin concentration in CSF and yet have a normal
total protein concentration, since gamma globulin accounts for only a small per-
centage (q,10%) of the total protein in normal blood.
PART I: EXAMINATION FOR RED BLOOD CELLS
MATERIALS:
4 simulated cerebrospinal fluids (incontainers labeled "A," "B," "C"and "D")
centrifuge
4 centrifuge tubes
Parafilm
PROCEDURE:
two microscope slides withcover slips
4 medicine droppers
microscope
glass-marking pencil
test-tube rack
1. Label four centrifuge tubes "A," "B," "C" and "D." (Since the number of
centrifuges may be limited, you may have to share the centrifuges and centrifuge
tubes with your classmates. If a centrifuge and centrifuge tubes are not available,
do either Part II or Part III of the activity before.beginning Part I.)
2. Fill each centrifuge tube about half full with the corresponding cerebro-
spinal fluid sample. Seal each tube with a small piece of Parafilm.
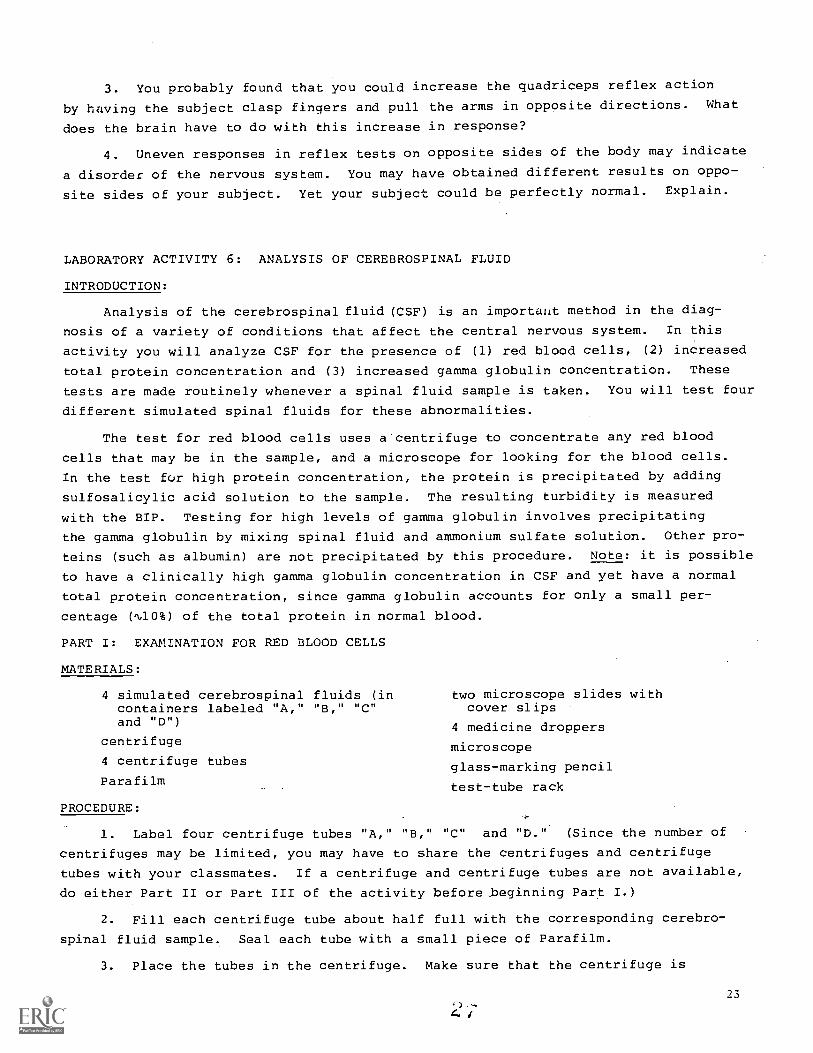
3. Place the tubes in the centrifuge. Make sure that the centrifuge is
23
4 /
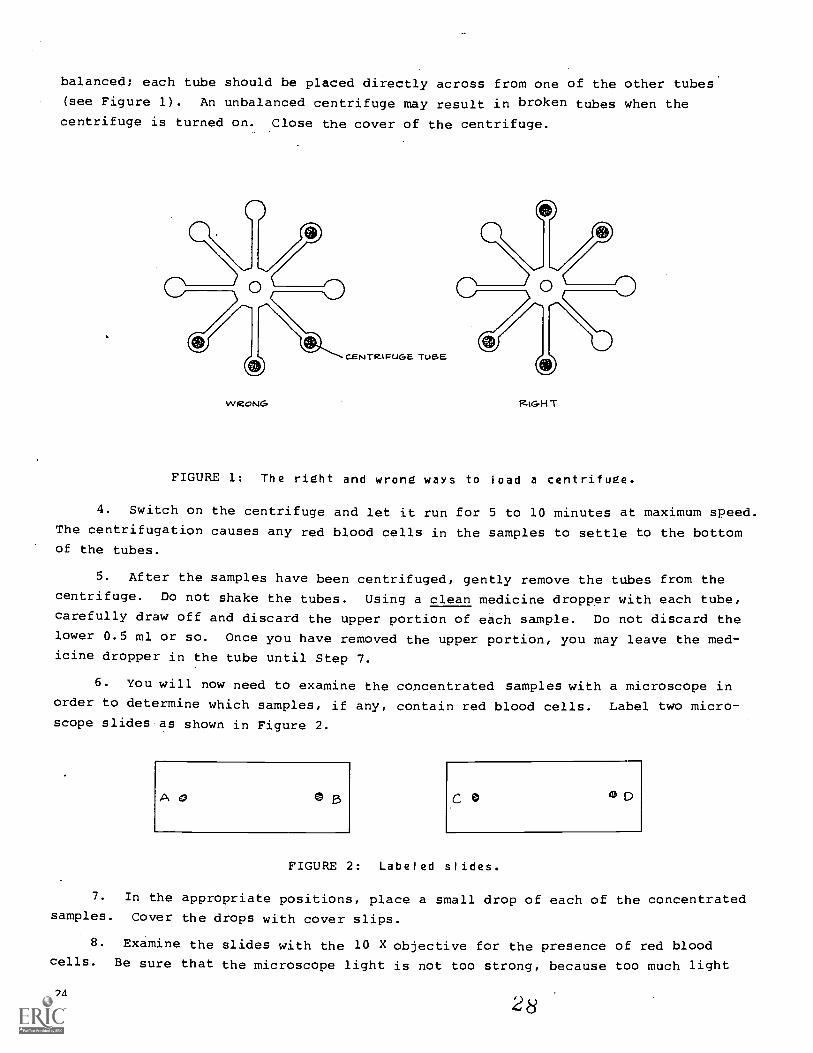
balanced; each tube should be placed directly across from one of the other tubes
(see Figure 1). An unbalanced centrifuge may result in broken tubes when the
centrifuge is turned on. Close the cover of the centrifuge.
WRONG
CENTRIFUGE TUBE
RIGHT
FIGURE 1: The right and wrong wars to ioad a centrifuge.
4. Switch on the centrifuge and let it run for 5 to 10 minutes at maximum speed.
The centrifugation causes any red blood cells in the samples to settle to the bottomof the tubes.
5. After the samples have been centrifuged, gently remove the tubes from thecentrifuge. Do not shake the tubes. Using a clean medicine dropper with each tube,carefully draw off and discard the upper portion of each sample. Do not discard thelower 0.5 ml or so. Once you have removed the upper portion, you may leave the med-icine dropper in the tube until Step 7.
6. You will now need to examine the concentrated samples with a microscope inorder to determine which samples, if any, contain red blood cells. Label two micro-
scope slides as shown in Figure 2.
A is, 0 B
FIGURE 2: Labeled slides.
7. In the appropriate positions, place a small drop of each of the concentratedsamples. Cover the drops with cover slips.
8. Examine the slides with the 10 X objective for the presence of red bloodcells. Be sure that the microscope light is not too strong, because too much light
24
can make the cells hard to see. You may recall that the red blood cells look likesmall doughnut-like discs. If you don't find any
sample for several minutes, there probably aren't
9. Record your results.
red blood cells after examining a
any.
10. Clean the centrifuge tubes and medicine droppersby other groups.
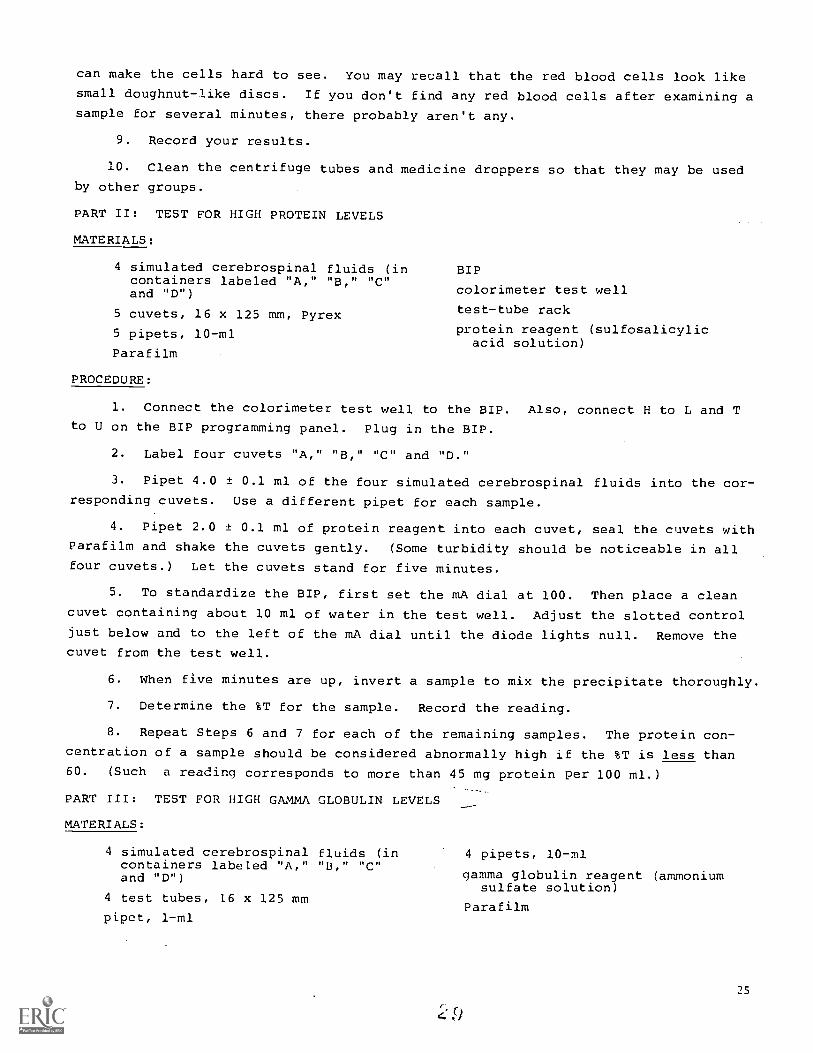
PART II: TEST FOR HIGH PROTEIN LEVELS
MATERIALS:
4 simulated cerebrospinalcontainers labeled "A,"and "D")
fluids (in"B," ''C''
5 cuvets, 16 x 125 mm, Pyrex
5 pipets, 10-ml
Parafilm
PROCEDURE:
1.
BIP
so that they may be used
colorimeter test well
test-tube rack
protein reagent (sulfosalicylicacid solution)
Connect the colorimeter test well to the BIP.to U on the BIP programming panel. Plug in the BIP.
2. Label four cuvets "A," "B," "C" and "D."
Also, connect H to L and T
3. Pipet 4.0 ± 0.1 ml of the four simulated cerebrospinal fluids into the cor-
responding cuvets. Use a different pipet for each sample.
4. Pipet 2.0 ± 0.1 ml of protein reagent into each cuvet, seal the cuvets withParafilm and shake the cuvets gently. (Some turbidity should be noticeable in allfour cuvets.) Let the cuvets stand for five minutes.
5. To standardize the BIP, first set the mA dial at 100. Then place a clean
cuvet containing about 10 ml of water in the test well. Adjust the slotted control
just below and to the left of the mA dial until the diode lights null. Remove thecuvet from the test well.
6. When five minutes are up, invert
7. Determine the %T for the sample.
a sample to mix the precipitate thoroughly.
Record the reading.
8. Repeat Steps 6 and 7 for each of the remaining samples. The protein con-
centration of a sample should be considered abnormally high if the %T is less than60. (Such a reading corresponds to more than 45 mg protein per 100 ml.)
PART III: TEST FOR HIGH GAMMA GLOBULIN LEVELS
MATERIALS:
4 simulated cerebrospinalcontainers labeled "A,"and "D")
4 test tubes, 16 x 125 mm
pipet, 1-ml
fluids (in"B," "C"
4 pipets, 10-ml
gamma globulin reagent (ammoniumsulfate solution)
Parafilm
25
PROCEDURE:
1. Clean four test tubes and relabel them (A,B,C,D) if necessary.
2. Pipet 1.0 ± 0.1 ml of gamma globulin reagent into each of the tubes.
3. To one tube, add 1.0 ± .1 ml of the spinal fluid to be tested, cover the
tube with Parafilm and shake gently. Repeat for the other three samples. Use a
different pipet for each sample.
4. Examine the tubes for turbidity (cloudiness). A sample containing highlevels of gamma globulin should be slightly turbid. Record your results.
DISCUSSION QUESTIONS:
1. What brain diseases might correspond to each of the four cerebrospinal fluid
samples tested?
2. If you did not find red blood cells in the cerebrospinal fluid of a patient,speculate onhemorrhage.
whether you could assume that the patient did not have a cerebral
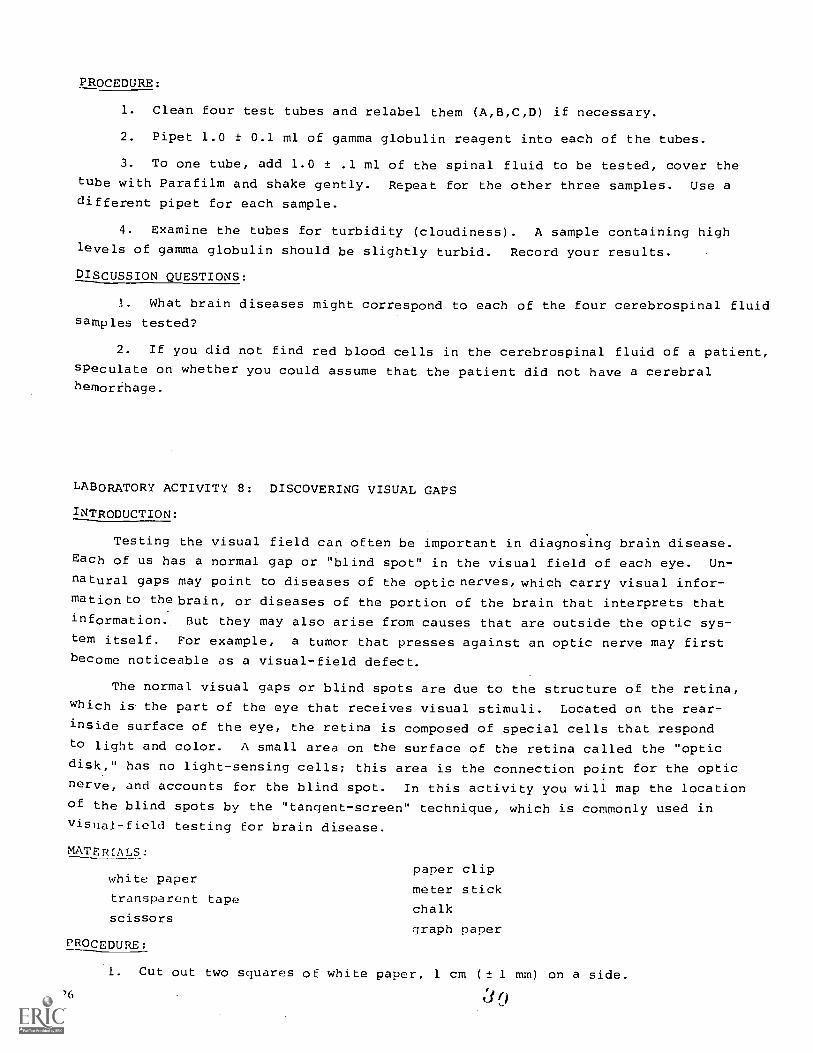
LABORATORY ACTIVITY 8: DISCOVERING VISUAL GAPS
INTRODUCTION:
Testing the
Each of us has a
natural gaps may
visual field can often be important in diagnosing
normal gap or "blind spot" in the visual field of
point to diseases of the optic nerves, which carry
brain disease.
each eye. Un-
visual infor-
mationto the brain, or diseases of the portion of the brain that interprets thatinformation. But they may also arise from causes that are outside the optic sys-tem itself. For example, a tumor that presses against an optic nerve may firstbecome noticeable as a visual-field defect.
The normal visual gaps or blind spots
which is the part of the eye that receives
are due to the structure of
visual stimuli. Located on
the
the
retina,
rear-
inside surface of the eye, the retina is composed of special cells that respondto light and color. A small area on the surface of the retina called the "opticdisk," has no light-sensing cells; this area is the connection point for the optic
nerve, and accounts for the blind spot. In this activity you will map the locationof the blind spots by the "tangent-screen" technique, which is commonly used invisual-field testing for brain disease.
MATERIALS:
white paper
transparent tape
scissors
PROCEDURE:
1.
paper clip
meter stick
chalk
graph paper
Cut out two squares of white paper, 1 cm (± 1 mm) on a side.
26tj ()
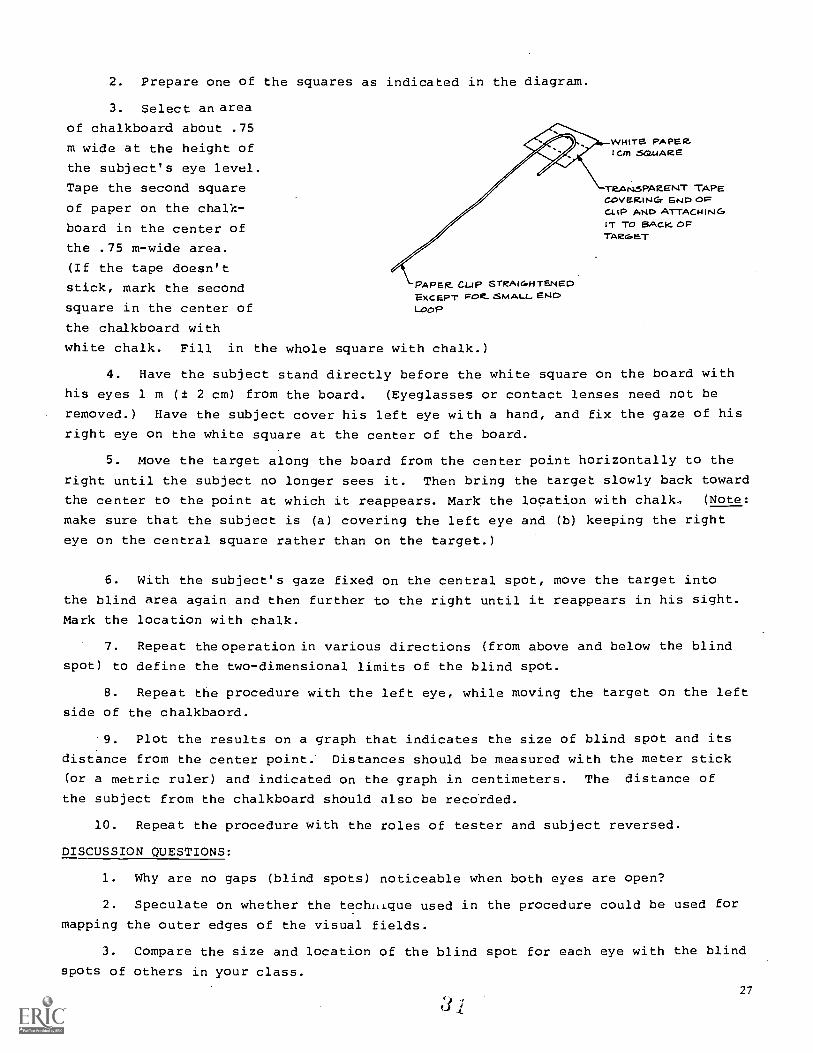
2. Prepare one of the squares as indicated in the diagram.
3. Select an area
of chalkboard about .75
m wide at the height of
the subject's eye level.
Tape the second square
of paper on the chalk-
board in the center of
the .75 m-wide area.
(If the tape doesn't
stick, mark the second PAPER. CLIP STRAIGHTENEDEXGEPT FoR.SNAAL.L. END
square in the center of LooP
the chalkboard with
white chalk. Fill in the whole square with chalk.)
4. Have the subject stand directly before the white square on the board with
his eyes 1 m (± 2 cm) from the board. (Eyeglasses or contact lenses need not be
removed.) Have the subject cover his left eye with a hand, and fix the gaze of his
right eye on the white square at the center of the board.
5. Move the target along the board from the center point horizontally to the
right until the subject no longer sees it. Then bring the target slowly back toward
the center to the point at which it reappears. Mark the location with chalk., (Note:
make sure that the subject is (a) covering the left eye and (b) keeping the right
eye on the central square rather than on the target.)
WHITE PAPER.ICrn Si:WARE
TRANSPARENT TAPECOVERING END OFCLIP AND ATTACHINGIT To BACK OFTARGET
6. With the subject's gaze fixed on the central spot, move the target into
the blind area again and then further to the right until it reappears in his sight.
Mark the location with chalk.
7. Repeat the operation in various directions (from above and below the blind
spot) to define the two-dimensional limits of the blind spot.
8. Repeat the procedure with the left eye, while moving the target on the left
side of the chalkbaord.
9. Plot the results on a graph that indicates the size of blind spot and its
distance from the center point. Distances should be measured with the meter stick
(or a metric ruler) and indicated on the graph in centimeters. The distance of
the subject from the chalkboard should also be recorded.
10. Repeat the procedure with the roles of tester and subject reversed.
DISCUSSION QUESTIONS:
1. Why are no gaps (blind spots) noticeable when both eyes are open?
2. Speculate on whether the techr,lque used in the procedure could be used for
mapping the outer edges of the visual fields.
3. Compare the size and location of the blind spot for each eye with the blind
spots of others in your class.
27
ACTIVITY 9: AN INTRODUCTION TO COMPUTER DIAGNOSIS OF BRAIN DISEASE
INTRODUCTION:
In Sections 1 through 8 of the Student Text, you studied the anatomy and
physiology of the central nervous system. In the course of this study some of the
most common disorders of the brain were discussed, i.e., epilepsy, multiple scle-
rosis, brain tumor, head injury, cerebral thrombosis and cerebral hemorrhage. Si-
multaneously, in Mathematics, you have been learning how to analyze logic state-
ments and how to perform a variety of functions, including (1) creating truthtables when given a logic statement, (2) determining the switching functions that
correspond to information presented to you in a truth table and (3) determining
the circuitry that corresponds to given switching functions. You will be putting
all of this knowledge to use in the next week or so as you design and build a com-
puter that will aid you in the diagnosis of brain disease.
In order to progress from a list of diseases and clinical findings to design-
ing a computer that will give you a correct diagnosis based on a set of clinical
findings, a number of steps are necessary. The first step is to create a truth
table in which the clinical findings related to the diseases in question are the
input and the possible diagnosis (or disease) is the output. We say possible
because usually such a table will not tell us exactly what disease the patient has.
Instead it will indicate what the possibilities are so that a physician will know
what future testing must be done.
To make the approach clear, let's start out with an example that involves
only a few variables. We will take a cold as the example of the disease and
sniffles and fever (above 38 °C) as the clinical findings. Suppose we are given
the information that a cold always involves the sniffles and never involves a
fever. In order to construct a truth table, we must first assign a letter to each
possible clinical finding. We may choose the following statements.
p: sniffles present
q: fever present
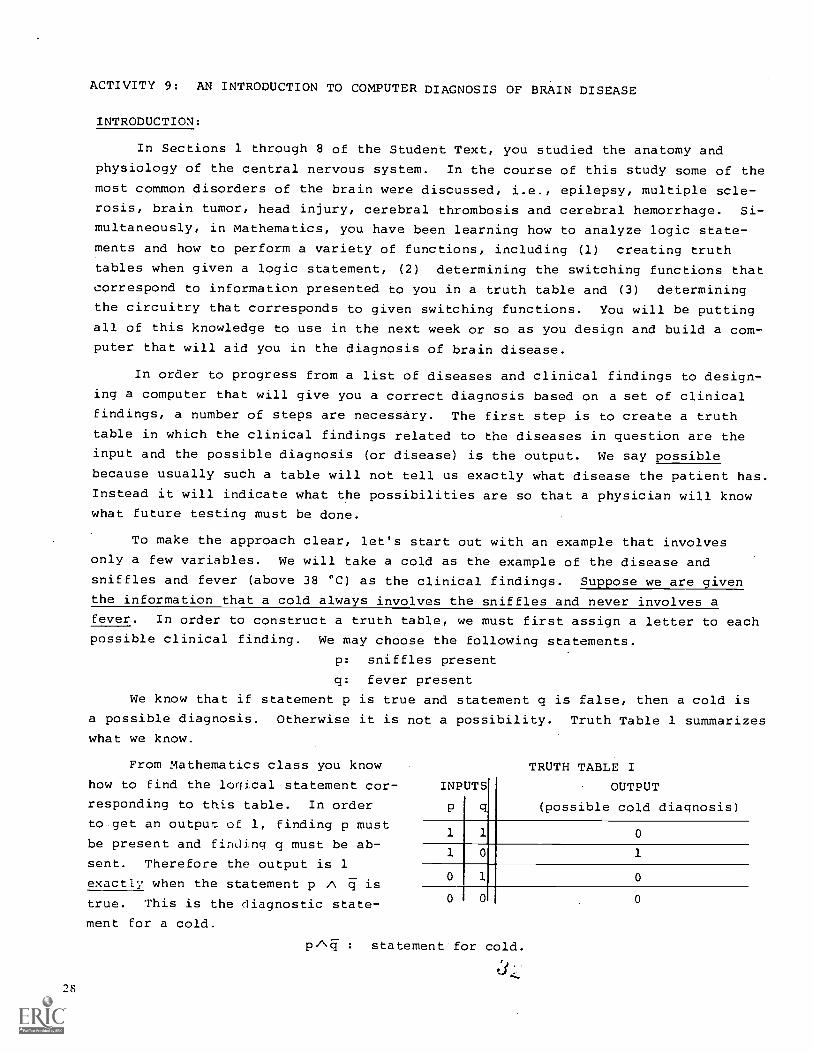
We know that if statement p is true and statement q is false, then a cold is
a possible diagnosis. Otherwise it is not a possibility. Truth Table 1 summarizes
what we know.
From Mathematics class you know TRUTH TABLE Ihow to find the logical statement cor-INPUTSresponding to this table. In order P q
OUTPUT
(possible cold diagnosis)to get an output of 1, finding p must
1 1 0be present and firldinq q must be ab-
1 0 1sent. Therefore the output is 1
0the A is
1 0exactly when statement p q0 00true. This is the diagnostic state-
ment for a cold.
PAEI
28
statement for cold.
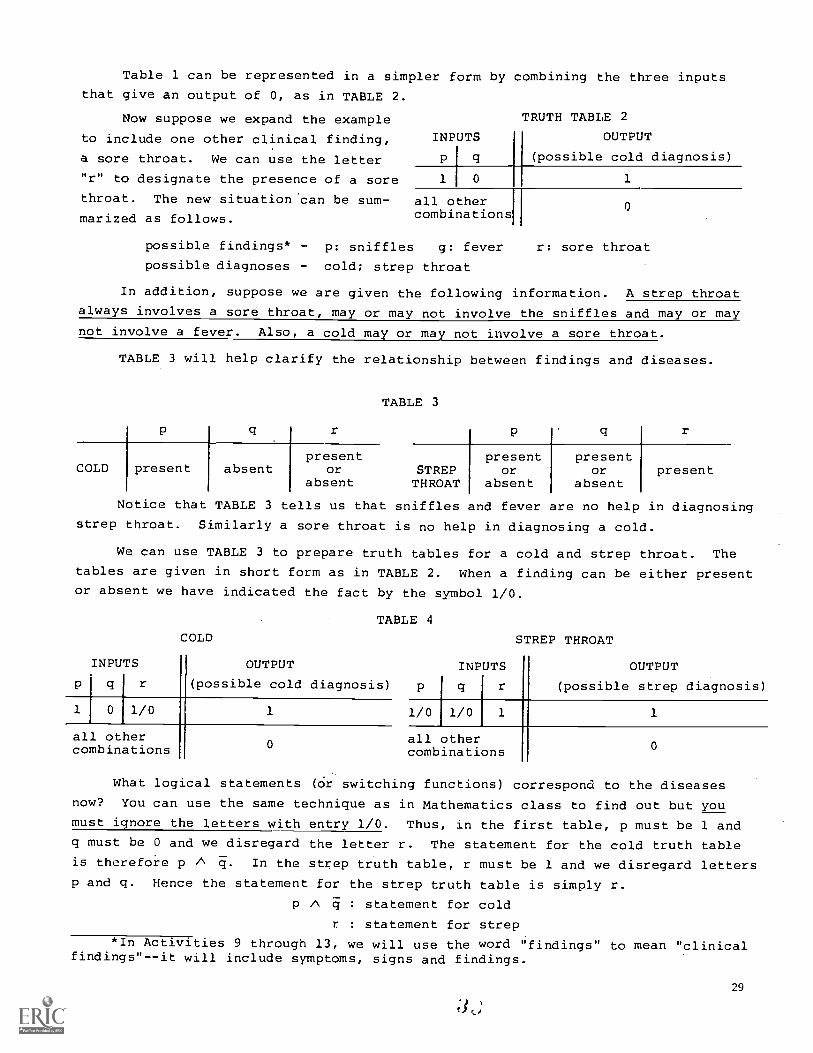
Table 1 can be represented in a simpler form by combining the three inputs
that give an output of 0, as in TABLE 2.
Now suppose we expand the example
to include one other clinical finding,
a sore throat. We can use the letter
"r" to designate the presence of a sore
throat. The new situation can be sum- all othermarized as follows. combinations
INPUTS
1 0
TRUTH TABLE 2
OUTPUT
(possible cold diagnosis)
1
0
possible findings* - p: sniffles g: fever r: sore throat
possible diagnoses cold; strep throat
In addition, suppose we are given the following information. A strep throat
always involves a sore throat, may or may not involve the sniffles and may or may
not involve a fever. Also, a cold may or may not involve a sore throat.
TABLE 3 will help clarify the relationship between findings and diseases.
q r
COLD present absent
TABLE 3
q
presentor STREP
absent THROAT
presentor
absent
presentor
absentpresent
Notice that TABLE 3 tells us that sniffles and fever are no help in diagnosing
strep throat. Similarly a sore throat is no help in diagnosing a cold.
We can use TABLE 3 to prepare truth tables for a cold and strep throat. The
tables are given in short form as in TABLE 2. When a finding can be either present
or absent we have indicated the fact by the symbol 1/0.
INPUTS
1 0 1/0
all othercombinations
COLD
TABLE 4
OUTPUT
(possible cold diagnosis)
INPUTS
q r
STREP THROAT
OUTPUT
(possible strep diagnosis)
1 1/0
0
1/0 1 1
all othercombinations 0
What logical statements (Or switching functions) correspond to the diseases
now? You can use the same technique as in Mathematics class to find out but you
must i nore the letters with entry 1/0. Thus, in the first table, p must be 1 andq must be 0 and we disregard the letter r. The statement for the cold truth tableis therefore p A q. In the strep truth table, r must be 1 and we disregard lettersp and q. Hence the statement for the strep truth table is simply r.
p A q : statement for cold
r : statement for strep
*In Activities 9 through 13, we will use the word "findings" to mean "clinicalfindings"--it will include symptoms, signs and findings.
29
If the finding of a sore throat is included in our discussion, why doesn't r
appear in the statement for a cold? The reason is simple;
help us diagnose a cold, so it need not be considered.
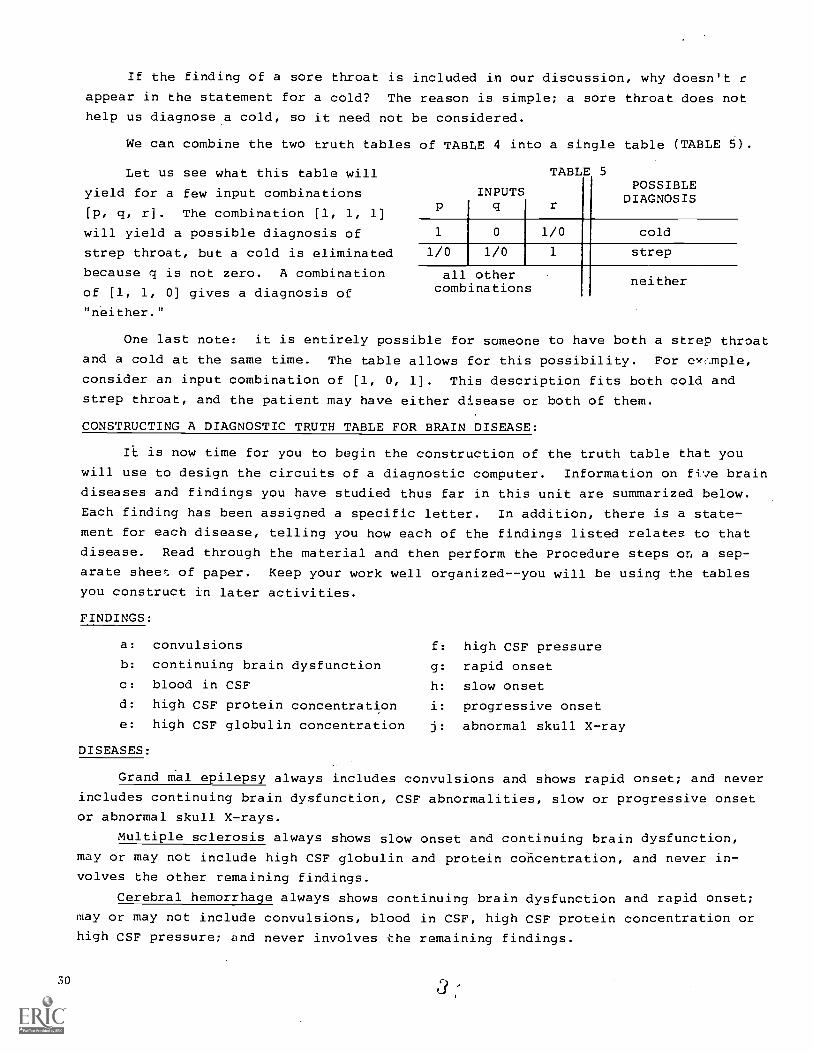
We can combine the two truth tables of TABLE 4 into a
Let us see
yield for a few
[p, q, r]. The
what this table will
input combinations
combination [1, 1, 1]
will yield a possible diagnosis of
strep throat, but a cold is eliminated
because q is not zero. A combination
of [1, 1, 0] gives a diagnosis of
"neither."
a sore throat does not
single table (TABLE 5).
TABLE 5
INPUTSp q r
POSSIBLEDIAGNOSIS
1 0 1/0
1/0 1/0 1
all othercombinations
cold
strep
neither
One last note: it is entirely possible for someone to have both a strep throat
and a cold at the
consider an input
strep throat, and
same time. The table allows for this possibility. For ex-unple,
combination of [1, 0, 1]. This description fits both cold and
the patient may have either disease or both of them.
CONSTRUCTING A DIAGNOSTIC TRUTH TABLE FOR BRAIN DISEASE:
It is now time for you to begin the construction of the truth table that you
will use to design the circuits of a diagnostic computer. Information on five brain
diseases and findings you have studied thus far in this unit are summarized below.
Each finding has been assigned a specific letter. In addition, there is a state-
ment for each disease, telling you how each of the findings listed relates to that
disease. Read through the material and then perform the Procedure steps on a sep-
arate sheet of paper. Keep your work well organized--you will be using the tables
you construct in later activities.
FINDINGS:
a:
b:
c:
d:
convulsions
continuing brain
blood in CSF
high CSF protein
f:
dysfunction g:
h:
concentration is
high CSF pressure
rapid onset
slow onset
progressive onset
e: high CSF globulin concentration j: abnormal skull X-ray
DISEASES:
Grand mal epilepsy always includes convulsions and shows rapid onset; and never
includes continuing brain dysfunction, CSF abnormalities, slow or progressive onset
or abnormal skull X-rays.
Multiple sclerosis always shows slow onset and continuing brain dysfunction,
may or may not include high CSF globulin and protein concentration, and never in-
volves the other remaining findings.
Cerebral hemorrhage always shows continuing brain dysfunction and rapid onset;
may or may not include convulsions, blood in CSF, high CSF protein concentration or
high CSF pressure; and never involves the remaining findings.
30
Cerebral thrombosis always shows continuing brain dysfunction; may or may not
show convulsions, rapid onset, slow onset or progressive onset; and never involves
the remaining findings.
Brain tumor always shows continuing brain dysfunction; may or may not show
convulsions, blood in CSF, high CSF protein concentration, high CSF pressure, rapid
onset, slow onset or abnormal skull X-rays; and never shows the remaining findings.
PROCEDURE:
1. Write the simplified truth table for each of the five
information on all 10 of the possible findings.
Example: FINDINGS
diseases. Include
a b c e f g J
1/0 1 1/0 1/0 0 1/0 1/0 1/0 0 1/0 Brain Tumor
2. Use the truth tables to write a logical statement for each disease.
Example: Brain tumor: using the truth table in Step 1, we get b n e A I.
3. Combine all the simplified truth tables into one complete diagnostic truth
table, as was done for cold and strep throat in TABLE 5 in the Introduction.
4. Use the truth table you have constructed to determine the diagnosis(es)
that are possible for each of the following sets of findings. Record your answers.
DISEASE POSSIBILITIES FINDINGS
a b c d e f g h i j
? 0 1 0 1 0 1 0 1 0 1
? 1 1 1 1 1 1 1 1 1 1
? 0 1 0 0 0 0 1 0 0 0
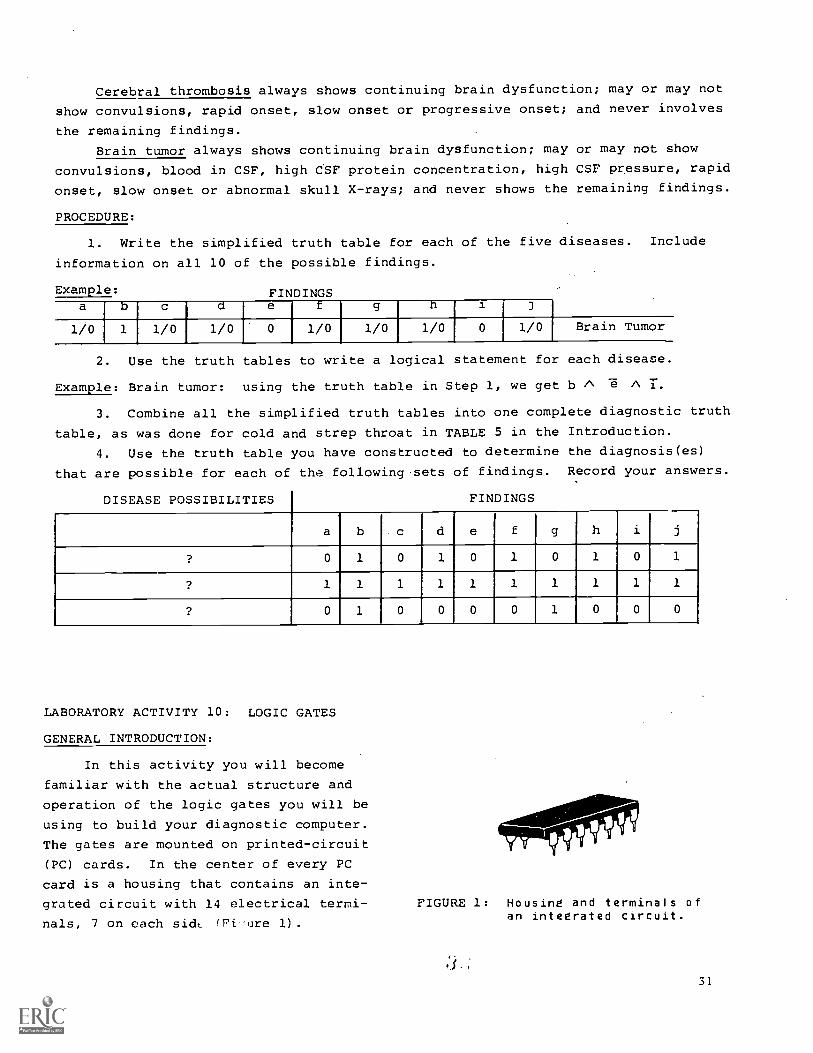
LABORATORY ACTIVITY 10: LOGIC GATES
GENERAL INTRODUCTION:
In this activity you will become
familiar with the actual structure and
operation of the logic gates you will be
using to build your diagnostic computer.
The gates are mounted on printed-circuit
(PC) cards. In the center of every PC
card is a housing that contains an inte-
grated circuit with 14 electrical termi-
nals, 7 on each sidt (Fiure 1).
FIGURE 1: Housing and terminals ofan integrated circuit.
31
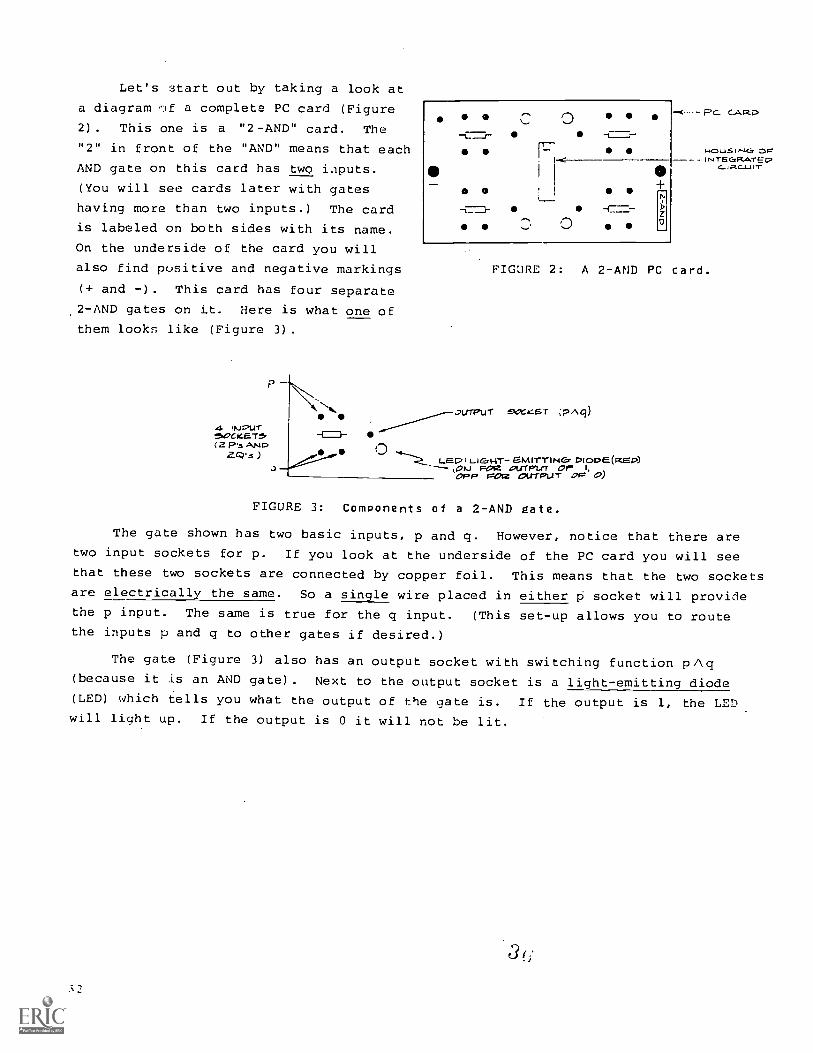
Let's start out by taking a look at
a diagram -.If a complete PC card (Figure
2). This one is a "2-AND" card. The
"2" in front of the "AND" means that each
AND gate on this card has two inputs.
(You will see cards later with gates
having more than two inputs.) The card
is labeled on both sides with its name.
On the underside of the card you will
also find pusitive and negative markings
(+ and -). This card has four separate
2 -AND gates on it. Here is what one of
them looks like (Figure 3).
quau-r
( 2 P5 AND2cr5 )
a
-4(
-=- N
Pc C_A
1-40 LAS I P-Aci cIN -rEC.R.2.-rEp
FIGURE 2: A 2-AND PC card.
JUIT71.17 soGicar ;pAq)
4=3-ID
LED; SMITTINGr DIODE(map)(map)- pru polz au-rmrr or j,
F012 Out -PUT
FIGURE 3: Components of a 2-AND gate.
The gate shown has two basic inputs, p and q. However, notice that there aretwo input sockets for p. If you look at the underside of the PC card you will seethat these two sockets are connected by copper foil. This means that the two socketsare electrically the same. So a single wire placed in either P socket will providethe p input. The same is true for the q input. (This set-up allows you to routethe inputs p and q to other gates if desired.)
The gate (Figure 3) also has an output socket with switching function pAq(because it is an AND gate). Next to the output socket is a light-emitting diode(LED) which tells you what the output of the gate is. If the output is 1, the LED,will light up. If the output is 0 it will not be lit.
a
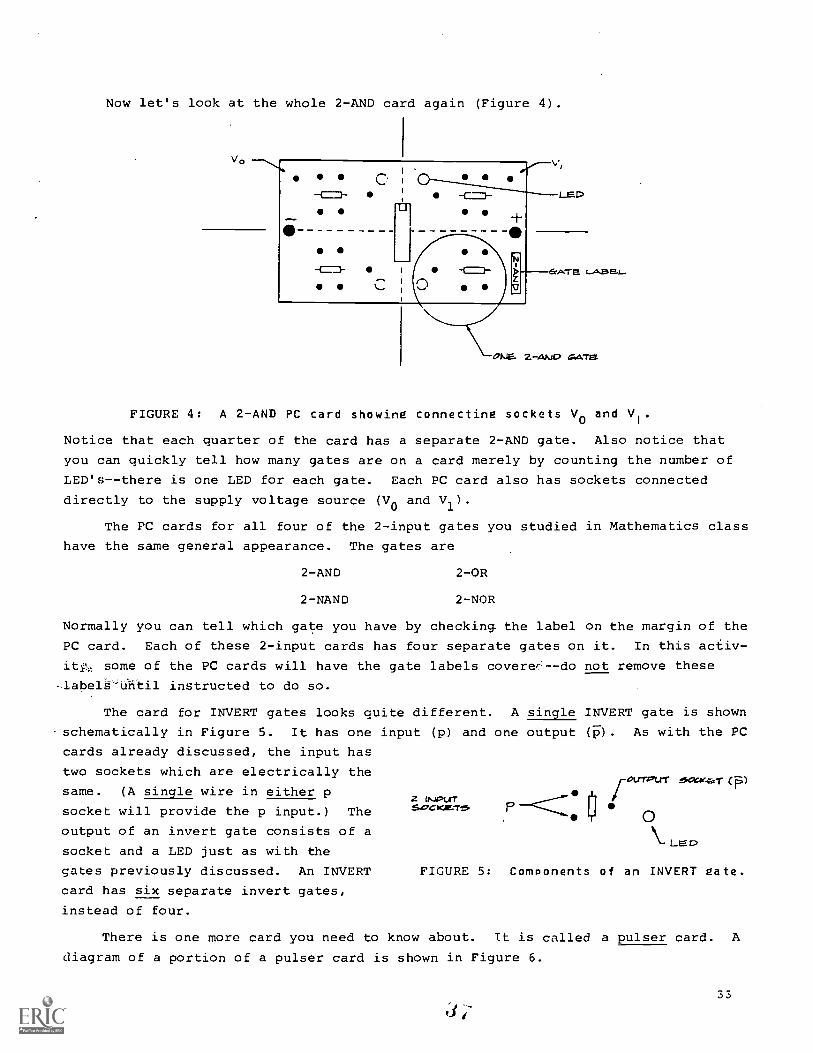
Now let's look at the whole 2-AND card again (Figure 4).
Vo
-C=1-
-C=-J-
-C=-
ND
LED
ErAT E LABEL
oms. 2-Avuo aokma
FIGURE 4: A 2-AND PC card showing connecting sockets V0 and VI.
Notice that each quarter of the card has a separate 2-AND gate. Also notice that
you can quickly tell how many gates are on a card merely by counting the number of
LED's--there is one LED for each gate. Each PC card also has sockets connected
directly to the supply voltage source (V0 and V1).
The PC cards for all four of the 2-input gates you studied in Mathematics class
have the same general appearance. The gates are
2-AND 2-OR
2-NAND 2 -NOR
Normally you can tell which gate you have by checking the label on the margin of the
PC card. Each of these 2-input cards has four separate gates on it. In this activ-
it., some of the PC cards will have the gate labels coverer - -do not remove these
-label'S'until instructed to do so.
The card for INVERT gates looks quite different. A single INVERT gate is shown
schematically in Figure 5. It has one input (p) and one output (i). As with the PC
cards already discussed, the input has
two sockets which are electrically theetrTPUT ekX+e-ger (P)
same. (A single wire in either ptp..Iptxr
socie-m-rvPsocket will provide the p input.) The
C)output of an invert gate consists of a
LEAsocket and a LED just as with the
Sates previously discussed. An INVERT FIGURE 5: Components of an INVERT gate.
card has six separate invert gates,
instead of four.
There is one more card you need to know about. It is called a pulser card. A
diagram of a portion of a pulser card is shown in Figure 6.
33
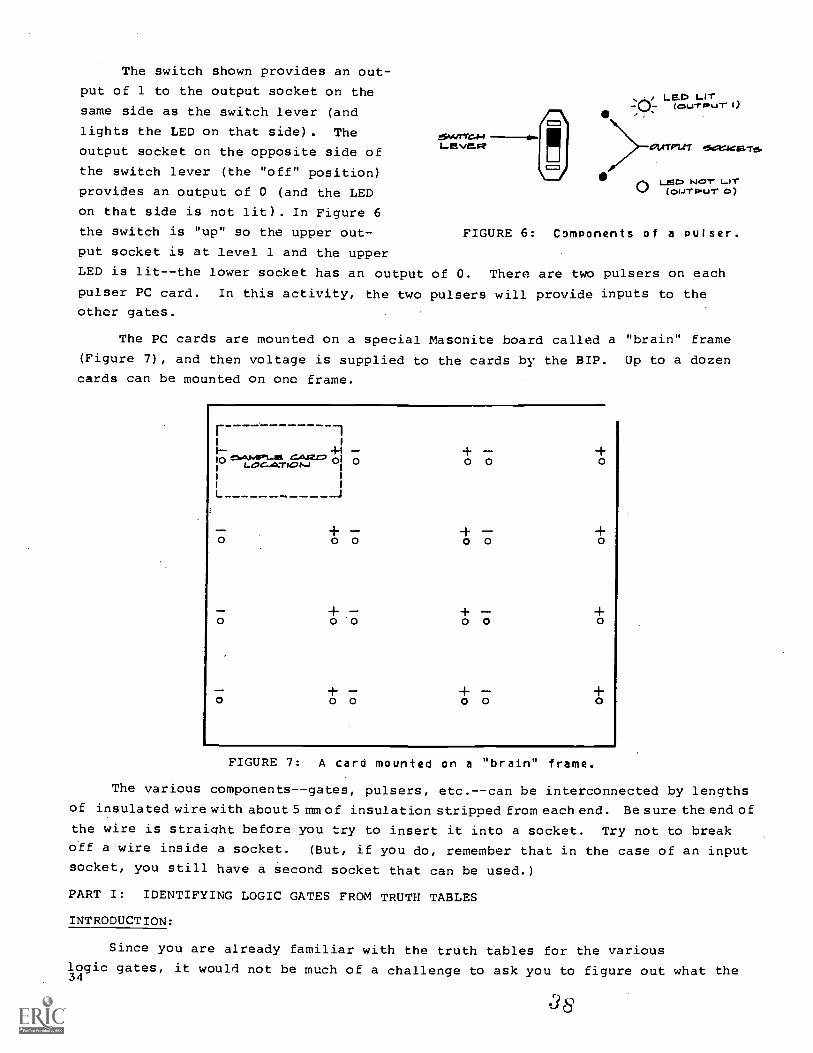
The switch shown provides an out-
put of 1 to the output socket on the LED LrrI)
same side as the switch lever (and -Li - (ourou-r
lights the LED on that side). The1..._Evapr mew:* ser....was-r6.output socket on the opposite side of
the switch lever (the "off" position)C) LIS 0 NOT 1.-iT
provides an output of 0 (and the LED ( owl"PDUT o)
on that side is not lit). In Figure 6
the switch is "up" so the upper out-
put socket is at level 1 and the upper
LED is lit--the lower socket has an output of 0. There are two pulsers on each
pulser PC card. In this activity, the two pulsers will provide inputs to the
other gates.
The PC cards are mounted on a special Masonite board called a "brain" frame
(Figure 7), and then voltage is supplied to the cards by the BIP. Up to a dozen
cards can be mounted on one frame.
FIGURE 6: Components of a pulser.
10 .,A.141:n-iil CARO 0LOGAT/OP-1 0 0 0
0 0 0 0
+0 0 o o
+0 0 0 0 0
FIGURE 7: A card mounted on a "brain" frame.
The various components--gates, pulsers, etc.--can be interconnected by lengths
of insulated wire with about 5 mm of insulation stripped from each end. Be sure the end of
the wire is straight before you try to insert it into a socket. Try not to breakoff a wire inside a socket. (But, if you do, remember that in the case of an input
socket, you still have a second socket that can be used.)
PART I: IDENTIFYING LOGIC GATES FROM TRUTH TABLES
INTRODUCTION:
Since you are already familiar with the truth tables for the various
logic gates, it would not be much of a challenge to ask you to figure out what the34
truth table for a 2-NAND gate is; you already have that information. Instead, in
this activity, you will be given a series of logic gates, but you will not be told
what kind of gates they are. It will be your job to connect them to the BIP and
determine what the truth table for each one is. Then by comparing the truth table
you obtain with those you have been given previously, you will identify the gate as
either a NAND, NOR, OR or AND gate.
MATERIALS:
BIP "unknown" cards
"brain" frame (with thumb nuts) wire
pulser card wire cutter-strippers
PROCEDURE:
1. Set a brain frame on your desk or table as shown in Figure 7. The screws
should be pointing upward.
2. Install the pulser card in the upper-left corner of the brain frame. (See
Figure 7.) The end of the card marked "+" should be at the right and the end marked"-" at the left. (The "+" and "-" are on the underside of the card, but you should
be able to see them through the card.) Another useful fact is that the gate labels
are always on the "+" side. IMPORTANT! ALL CARDS MUST ALWAYS BE INSTALLED WITH THE"+" SIDE AT THE RIGHT. OTHERWISE, WHEN THE FRAME IS CONNECTED TO THE BIP, THE CARD
MAY BE RUINED.
Screw on the thumb nuts firmly to insure good electrical contact between the
card and the frame. If the card won't fit properly on the screws, inform your
instructor.
3. Connect T to X on the BIP programming panel.
4. Connect the "W" terminal on the BIP to the pin in the upper-left corner of
the pulser card. Connect the "S" terminal on the BIP to the pin in the upper-right
corner of the pulser card. Plug in the BT?.
5. If no LED's are lit. on your pulser card, there is something wrong with
either the pulser card or the BIP. Make the following checks.
a. Is one LED on the BIP panel lit? If so the BIP is functioning.
b. If the BIP is functioning, something is wrong with the pulser card or
the way you have connected the card to the BIP.
c. Is the pulser card positioned correctly on the brain frame? Are the
connections from the BIP to the card made correctly?
d. You can check your pulser card by mounting it on another nearby brain
frame. If you still have no lit LED's, the card may be defective. If the LED'.:
light up on another frame, the card is functional, but the problem lies elsewhere.
You should consult your instructor.
6. Install one of your unknown cards in a position near the pulser card.
Remember to place the "+" side of the card to the right and the."-" side to the left.
At this point you may find that the output LED's on the unknown gates light up. This35
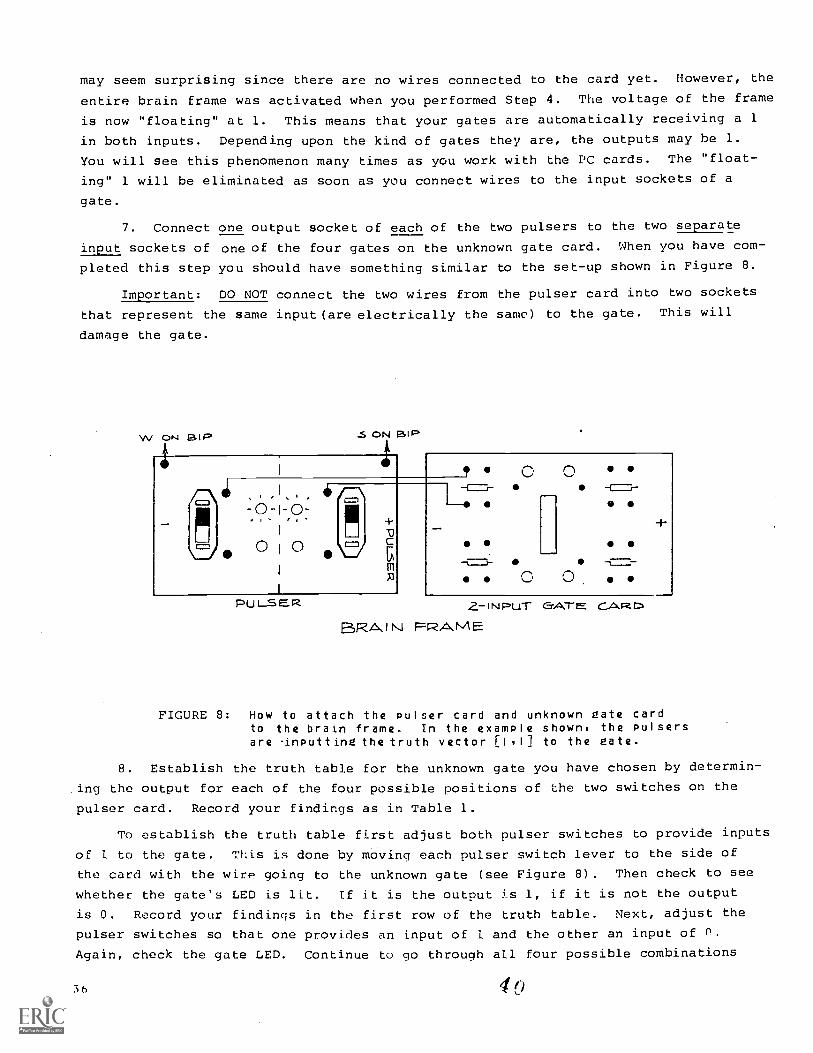
may seem surprising since there are no wires connected to the card yet. However, the
entire brain frame was activated when you performed Step 4. The voltage of the frame
is now "floating" at 1. This means that your gates are automatically receiving a 1
in both inputs. Depending upon the kind of gates they are, the outputs may he 1.
You will see this phenomenon many times as you work with the PC cards. The "float-
ing" 1 will be eliminated as soon as you connect wires to the input sockets of a
gate.
7. Connect one output socket of each of the two pulsers to the two separate
input sockets of one of the four gates on the unknown gate card. When you have com-
pleted this step you should have something similar to the set-up shown in Figure 8.
Important: DO NOT connect the two wires from the pulser card into two sockets
that represent the same input(are electrically the samo) to the gate. This will
damage the gate.
W ON air:, S ON El P
e , +i -0
0 1 0 \f/I
I
PULER
IP C' 0L=-41CZ=1- -C=7:1-
4-
-L.=-01-
Z- IN PuT GATE CARDBRAIN PRA, M E
FIGURE 8: How to attach the pulser card and unknown gate cardto the brain frame. In the example shown, the pulsersare inputting the truth vector [HI] to the gate.
8. Establish the truth table for the unknown gate you have chosen by determin-
ing the output for each of the four possible positions of the two switches on the
pulser card. Record your findings as in Table 1.
To establish the truth table first adjust both pulser switches to provide inputs
of 1 to the gate. This is done by moving each pulser switch lever to the side of
the card with the wire going to the unknown gate (see Figure 8). Then check to see
whether the gate's LED is lit. If it is the output is 1, if it is not the output
is 0. Record your findings in the first row of the truth table. Next, adjust the
pulser switches so that one provides an input of 1 and the other an input of O.
Again, check the gate LED. Continue to go through all four possible combinations
36
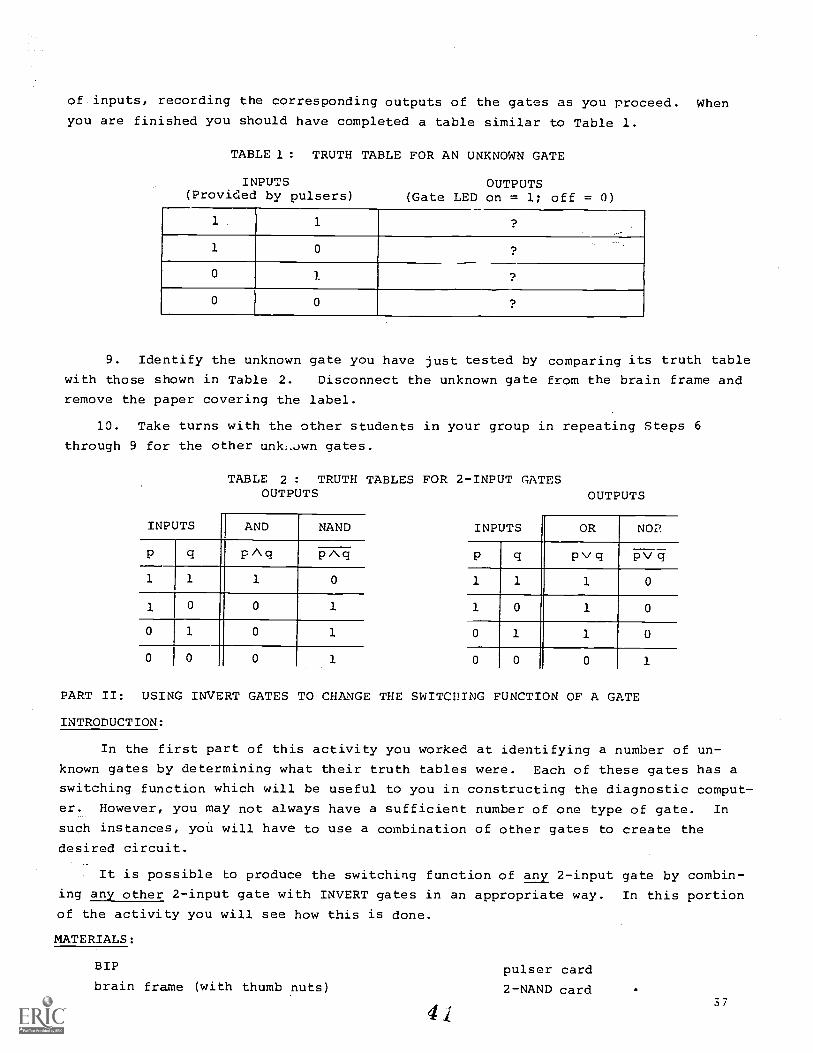
of inputs, recording the corresponding outputs of the gates as you proceed. When
you are finished you should have completed a table similar to Table 1.
TABLE 1: TRUTH TABLE FOR AN UNKNOWN GATE
INPUTS(Provided by pulsers)
OUTPUTS(Gate LED on = 1; off = 0)
1 ?
1 0 ?
o 1 ?
o 0 ?
9. Identify the unknown gate you have just tested by comparing its truth table
with those shown in Table 2. Disconnect the unknown gate from the brain frame and
remove the paper covering the label.
10. Take turns with the other students in your group in repeating Steps 6
through 9 for the other unic.uwn gates.
TABLE 2 : TRUTH TABLES FOR 2-INPUT GATESOUTPUTS
INPUTS AND NAND
P q p A q pAq
1 1 1 0
1 0 0 1
0 1 0 1
0 0 0 1
OUTPUTS
INPUTS OR NOR
P q p v q PV ci
1 1 1 0
1 0 1 0
0 1 1 0
0 0 0 1
PART II: USING INVERT GATES TO CHANGE THE SWITCHING FUNCTION OF A GATE
INTRODUCTION:
In the first part of this activity you worked at identifying a number of un-
known gates by determining what their truth tables were. Each of these gates has a
switching function which will be useful to you in constructing the diagnostic comput-
er. However, you may not always have a sufficient number of one type of gate. In
such instances, you will have to use a combination of other gates to create the
desired circuit.
It is possible to produce the switching function of any 2-input gate by combin-
ing any other 2-input gate with INVERT gates in an appropriate way. In this portion
of the activity you will see how this is done.
MATERIALS:
BIP
brain frame (with thumb nuts)
4
pulser card
2-NAND card37
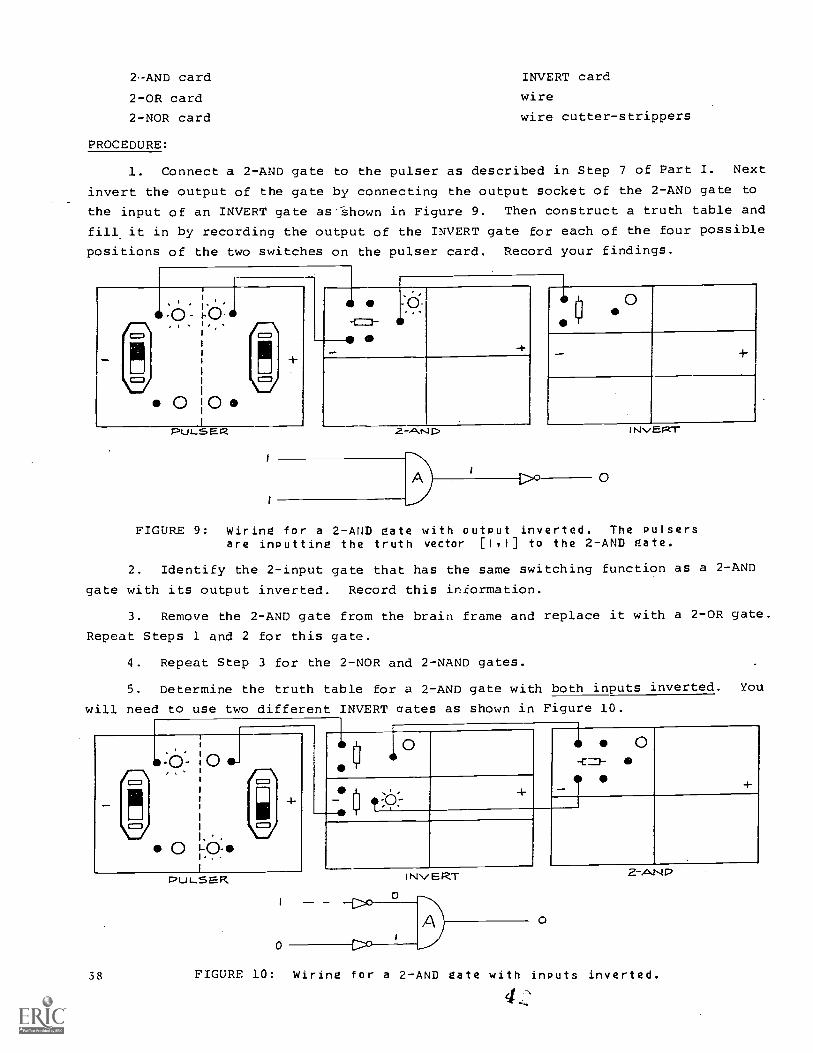
2 AND card INVERT card
2-OR card wire
2-NOR card wire cutter-strippers
PROCEDURE:
1. Connect a 2-AND gate to the pulser as described in Step 7 of Part I. Next
invert the output of the gate by connecting the output socket of the 2-AND gate to
the input of an INVERT gate as--Shown in Figure 9. Then construct a truth table and
fill it in by recording the output of the INVERT gate for each of the four possible
positions of the two switches on the pulser card. Record your findings.
- 0CD
0 1 0 *RuL_SER
FIGURE 9:
1
1
0
z-ANA r>
0
0
NvE.FtY
Wiring for a 2-AND gate with output inverted. The pulsersare inputting the truth vector [I,I] to the 2-AND gate.
2. Identify the 2-input gate that has the same switching function as a 2-AND
gate with its output inverted. Record this information.
3. Remove the 2-AND gate from the brain frame and replace it with a 2-OR gate.
Repeat Steps 1 and 2 for this gate.
4. Repeat Step 3 for the 2-NOR and 2-NAND gates.
5. Determine the truth table for a 2-AND gate with both inputs inverted.
will need to use two different INVERT crates as shown in Figure 10.
P.0 1-SER
1
0
/ [lij I 0
0 A,
Er]
. ,t ,c).-
+
INVERT0
0
You
1 ...,_
I'+
2-A1117
38 FIGURE 10: Wiring for a 2-AND gate with inputs inverted.
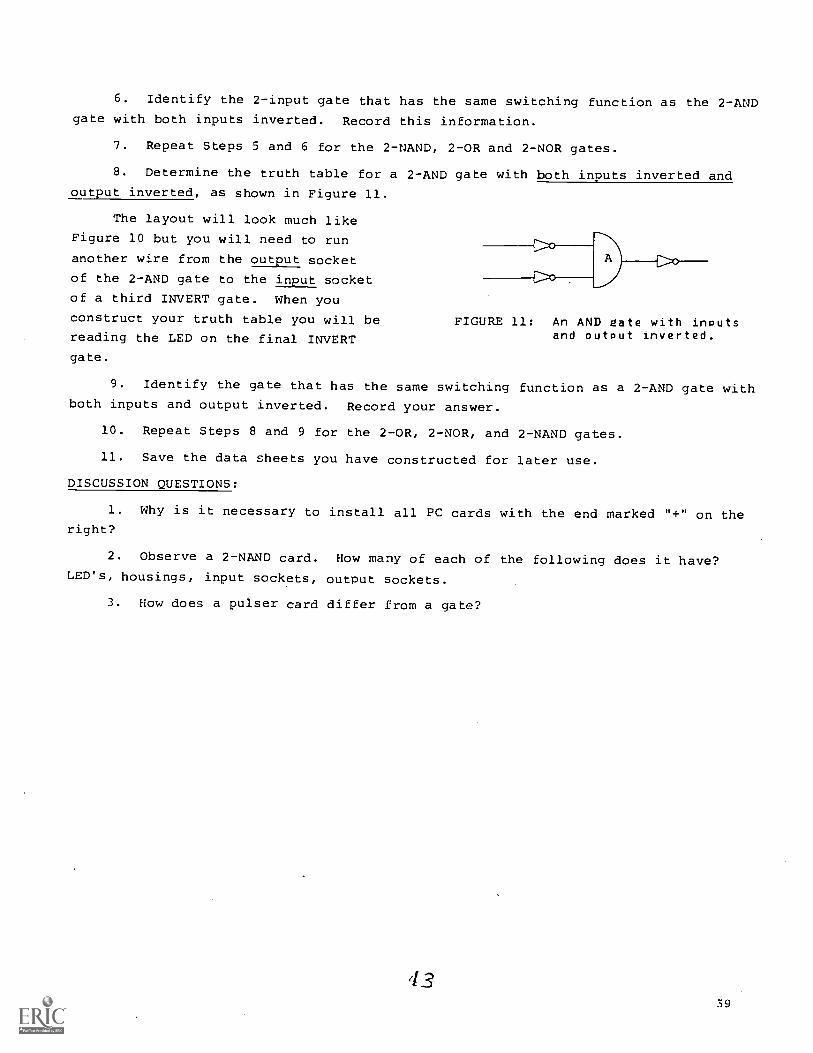
6. Identify the 2-input gate that has the same switching function as the 2-ANDgate with both inputs inverted. Record this information.
7. Repeat Steps 5 and 6 for the 2-NAND, 2-OR and 2-NOR gates.
8. Determine the truth table for a 2-AND gate with both inputs inverted and
output inverted, as shown in Figure 11.
The layout will look much like
Figure 10 but you will need to run
another wire from the output socket
of the 2-AND gate to the input socket
of a third INVERT gate. When you
construct your truth table you will be FIGURE 11: An AND gate with inputsreading the LED on the final INVERT and output inverted.
gate.
9. Identify the gate that has the same switching function as a 2-AND gate withboth inputs and output inverted. Record your answer.
10. Repeat Steps 8 and 9 for the 2 -OR, 2-NOR, and 2-NAND gates.
11. Save the data sheets you have constructed for later use.
DISCUSSION QUESTIONS:
1. Why is it necessary to install all PC cards with the end marked "+" on theright?
2. Observe a 2-NAND card. How many of each of the following does it have?
LED's, housings, input sockets, output sockets.
3. How does a pulser card differ from a gate?
1339
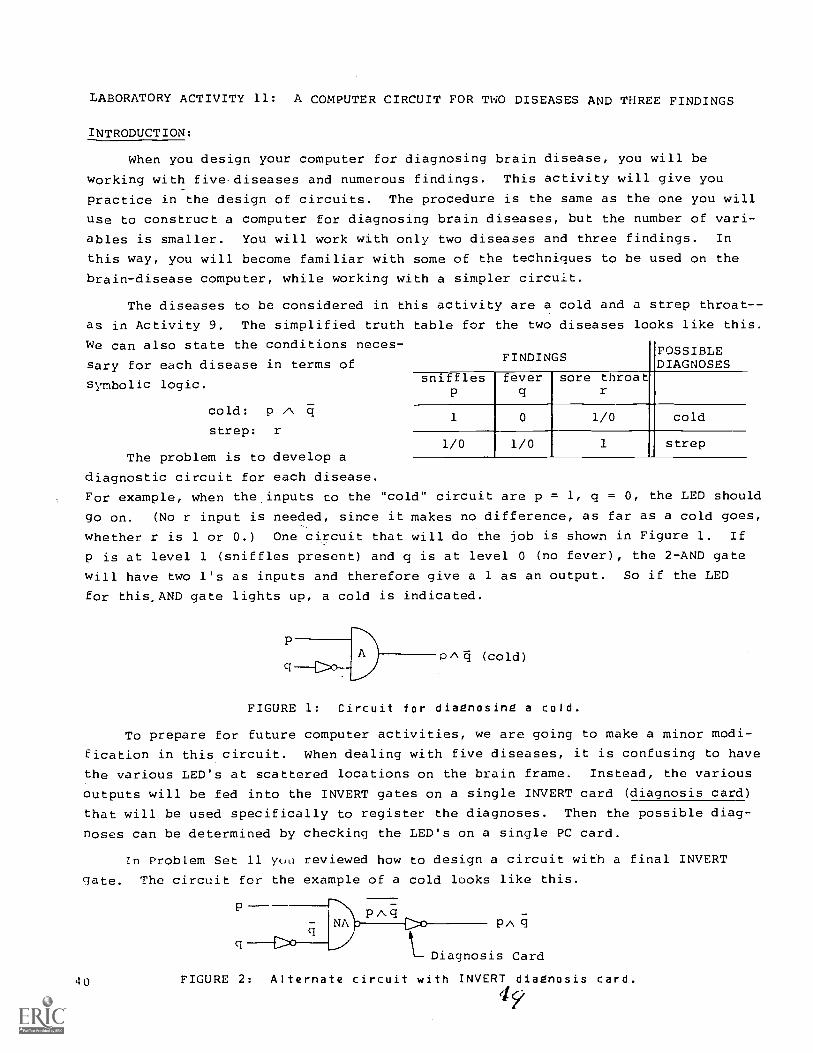
LABORATORY ACTIVITY 11: A COMPUTER CIRCUIT FOR TWO DISEASES AND THREE FINDINGS
INTRODUCTION:
When you design your computer for diagnosing brain disease, you will be
working with five diseases and numerous findings. This activity will give you
practice in the design of circuits. The procedure is the same as the one you will
use to construct a computer for diagnosing brain diseases, but the number of vari-
ables is smaller. You will work with only two diseases and three findings. In
this way, you will become familiar with some of the techniques to be used on the
brain-disease computer, while working with a simpler circuit.
The diseases to be considered in this activity are a cold and a strep throat- -
as in Activity 9. The simplified truth table for the two diseases looks like this.
We can also state the conditions neces-
sary for each disease in terms of
symbolic logic.
cold: p "strep:
The problem is to develop a
diagnostic circuit for each disease.
POSSIBLEOSSIBLEDIAGNOSES
snifflesP
feverq
sore throatr
1 0 1/0 cold
1/0 1/0 1 strep
For example, when the inputs to the "cold" circuit are p = 1, q = 0, the LED should
go on. (No r input is needed, since it makes no difference, as far as a cold goes,
whether r is 1 or 0.) One circuit that will do the job is shown in Figure 1. If
p is at level 1 (sniffles present) and q is at level 0 (no fever), the 2-AND gate
will have two l's as inputs and therefore give a 1 as an output. So if the LED
for this, AND gate lights up, a cold is indicated.
PA El- (cold)
FIGURE 1: Circuit for diagnosing a cold.
To prepare for future computer activities, we are going to make a minor modi-
fication in this circuit. When dealing with five diseases, it is confusing to have
the various LED's at scattered locations on the brain frame. Instead, the various
outputs will be fed into the INVERT gates on a single INVERT card (diagnosis card)
that will be used specifically to register the diagnoses. Then the possible diag-
noses can be determined by checking the LED's on a single PC card.
In Problem Set 11 you reviewed how to design a circuit with a final INVERT
gate. The circuit for the example of a cold looks like this.
40
p A Ei
q coPA
Diagnosis Card
FIGURE 2: Alternate circuit with INVERT diagnosis card.

Similarly, the simplest circuit for a strep throat involving a diagnosiscard is this one.
rr
r (Strep)
Diagnosis Card
FIGURE 3: Circuit for diagnosing strep throat.
As discussed in Problem Set 11 (Part I), there are several ways to createequivalent circuits by using different gates. For example, the circuit in Figure3 is equivalent to the one in Figure 4.
r (Strep)
FIGURE 4: Alternate "strep" circuit.
The two inputs of the NAND gate have been connected. Therefore both inputs areequal to r. The output of the gate is rA r which is the same as r. The gate nowbehaves like an INVERT gate. In other words, the output is the opposite of theinput.
In order to make this connection for a 2-input gate, we insert a wire in the
socket next to the r input wire. Then we insert the other end of the wire in asocket for the second gate input. See Figure 5. Both inputs to the gate are nowelectrically the same.
r wpu-r comhJEcrinja. maim
OUTPUT
FIGURE 5: How to Provide the same input to both input sockets of a 2 -input gate.
Figures 2 and 3 show circuit diagrams for each of the two diseases under con-sideration: cold and strep throat. We will now combine these diagrams into asingle diagram. We begin by splitting each input wire (p, q, r) into two wires
with an INVERT gate on one of them.Look at the wiring below input p
in Figure 6. The left wire has
truth value p but the right wire
passes through an INVERT gate and
therefore has truth value p. The
same is true of the other two in-
puts. We now have six inputs avail-
able: p, p, q, q, r and T..
q r
FIGURE 6: Combining circuits for cold and
4.;strep diagnosis.
41

We complete the diagram by connecting the proper input wires to the appropri-
ate gates. The circuit in Figure 2 for a cold requires inputs of p and q to the
NAND gate, so we connect wires to the p and i input lines. The circuit in Figure
3 for strep requires an input of r, so we connect the r wire to the INVERT gate.
The result is shown in Figure 7.
p q r
Liagnosiscard
(Cold)
FIGURE 7: Combined circuit for cold and strep diagnosis.
(strep)
Since this activity (as well as the brain-disease computer) will require more
inputs than one pulser card can supply, a special input card will be used instead.
It is labeled TRUTH TABLE (Figure 8).
FIGURE 8: TRUTH TABLE card.
If you look at the underside of this card, you will see that the eight input
sockets in the upper row (level 1) are all interconnected. The same is true of
the second row. This card has no + and - signs at the edges and could be installed
with the input sockets at either the top or the bottom of the card.
We recommend that the TRUTH TABLE card be installed each time you use it with
the input sockets at the top (see Figure 8). In this case, every socket in the
upper row will provide an input at logic level 1, and every socket in the second
row will provide an input at logic level 0. Each lead on the card may be plugged
into either level 1 or level 0.
42
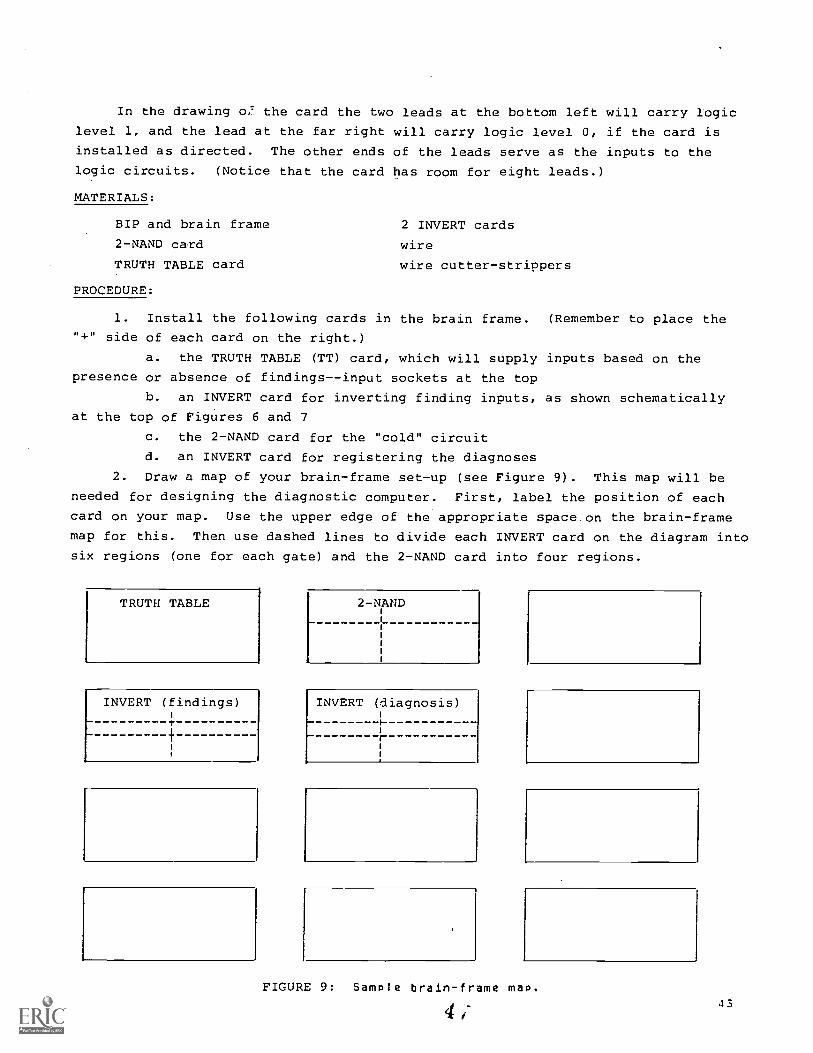
In the drawing cp,' the card the two leads at the bottom left will carry logic
level 1, and the lead at the far right will carry logic level 0, if the card is
installed as directed. The other ends of the leads serve as the inputs to the
logic circuits. (Notice that the card has room for eight leads.)
MATERIALS:
BIP and brain frame 2 INVERT cards
2-NAND card wire
TRUTH TABLE card wire cutter-strippers
PROCEDURE:
1. Install the following cards in the brain frame. (Remember to place the
"+" side of each card on the right.)
a. the TRUTH TABLE (TT) card, which will supply inputs based on the
presence or absence of findings--input sockets at the top
b. an INVERT card for inverting finding inputs, as shown schematically
at the top of Figures 6 and 7
c. the 2-NAND card for the "cold" circuit
d. an INVERT card for registering the diagnoses
2. Draw a map of your brain-frame set-up (see Figure 9). This map will be
needed for designing the diagnostic computer. First, label the position of each
card on your map. Use the upper edge of the appropriate space on the brain-frame
map for this. Then use dashed lines to divide each INVERT card on the diagram into
six regions (one for each gate) and the 2-NAND card into four regions.
TRUTH TABLE
INVERT (findings)
T
2-NAND
INVERT (diagnosis)
r
FIGURE 9: Sample brain-frame map.
443
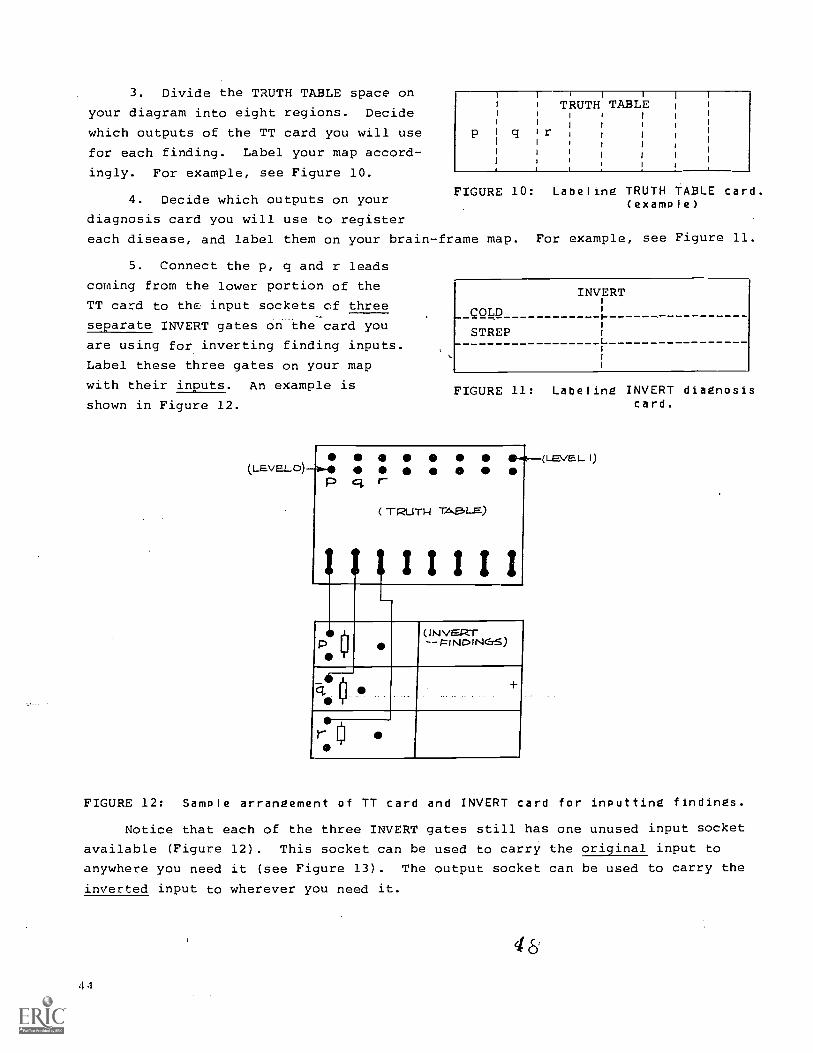
3. Divide the TRUTH TABLE space on
your diagram into eight regions. Decide
which outputs of the TT card you will use
for each finding. Label your map accord-
ingly. For example, see Figure 10.
TRUTH TABLE
q r
I
FIGURE 10: Labeling TRUTH TABLE card.4. Decide which outputs on your (example)
diagnosis card you will use to register
each disease, and label them on your brain-frame map. For example, see Figure 11.
5. Connect the p, q and r leads
coming from the lower portion of the
TT card to the input sockets cf three
separate INVERT gates on the card you
are using for inverting finding inputs.
Label these three gates on your map
with their inputs. An example is
shown in Figure 12.
(LavEa_o)
INVERT
COLD
STREPL
FIGURE 11: Labeling INVERT diagnosiscard.
c o - 4 1
Pcir-
(
!III!!!
ed
TRUTH TA,L3LE)
P O(INVEALer-- FINDINGS)
+
r
! (LEVEL. I)
FIGURE 12: Sample arrangement of TT card and INVERT card for inputting findings.
Notice that each of the three INVERT gates still has one unused input socket
available (Figure 12). This socket can be used to carry the original input to
anywhere you need it (see Figure 13). The output socket can be used to carry the
inverted input to wherever you need it.
46
4 4
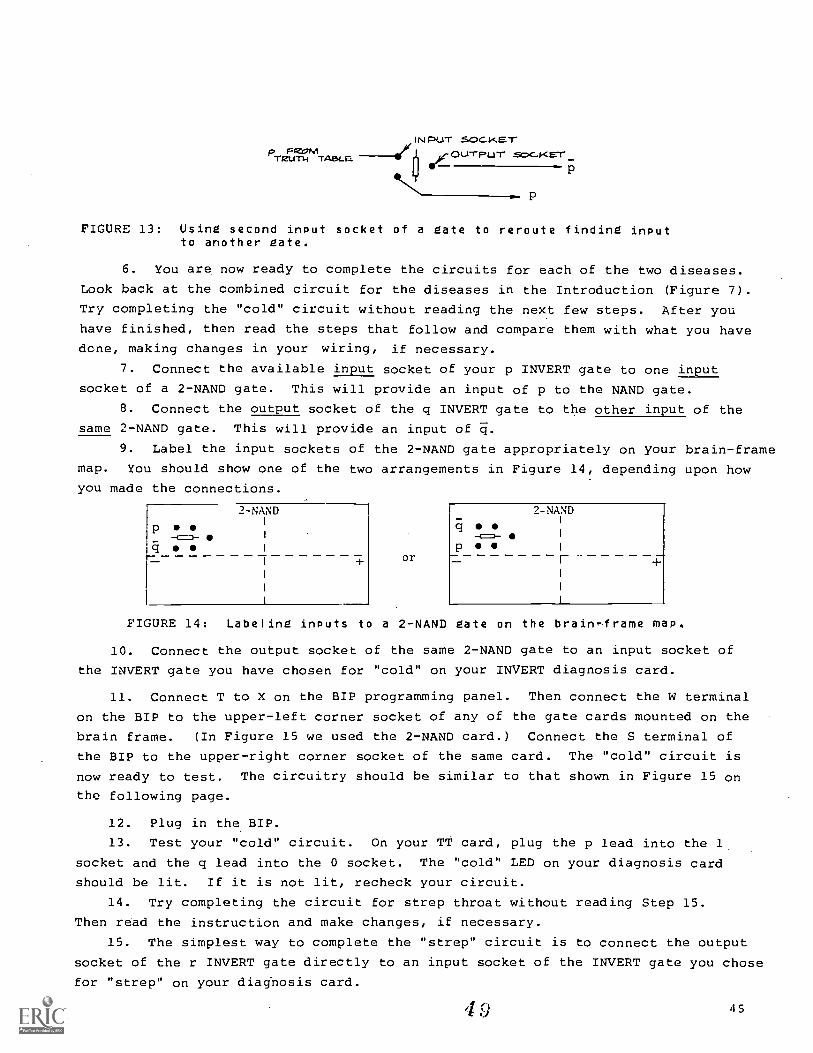
I N PUT SOCKET'
-rFzu-n4 TAeg..a -P
p przom ou-i-pu-r Soc.-14.MT
FIGURE 13: Using second input socket of a gate to reroute finding inputto another gate.
6. You are now ready to complete the circuits for each of the two diseases.
Look back at the combined circuit for the diseases in the Introduction (Figure 7).
Try completing the "cold" circuit without reading the next few steps. After you
have finished, then read the steps that follow and compare them with what you have
done, making changes in your wiring, if necessary.
7. Connect the available input socket of your p INVERT gate to one input
socket of a 2-NAND gate. This will provide an input of p to the NAND gate.
8. Connect the output socket of the q INVERT gate to the other input of the
same 2-NAND gate. This will provide an input of 4.
9. Label the input sockets of the 2-NAND gate appropriately on your brain-frame
map. You should show one of the two arrangements in Figure 14, depending upon how
you made the connections.
p-(=)-
2-NAND
Or
q-c=i-
p
2 -NAND
FIGURE 14: Labeling inputs to a 2-NAND gate on the brain -frame map,
10. Connect the output socket of the same 2-NAND gate to an input socket of
the INVERT gate you have chosen for "cold" on your INVERT diagnosis card.
11. Connect T to X on the BIP programming panel. Then connect the W terminal
on the BIP to the upper-left corner socket of any of the gate cards mounted on the
brain frame. (In Figure 15 we used the 2-NAND card.) Connect the S terminal of
the BIP to the upper-right corner socket of the same card. The "cold" circuit is
now ready to test. The circuitry should be similar to that shown in Figure 15 on
the following page.
12. Plug in the BIP.
13. Test your "cold" circuit. On your TT card, plug the p lead into the 1
socket and the q lead into the 0 socket. The "cold" LED on your diagnosis card
should be lit. If it is not lit, recheck your circuit.
14. Try completing the circuit for strep throat without reading Step 15.
Then read the instruction and make changes, if necessary.
15. The simplest way to complete the "strep" circuit is to connect the output
socket of the r INVERT gate directly to an input socket of the INVERT gate you chose
for "strep" on your diaghosis card.
45
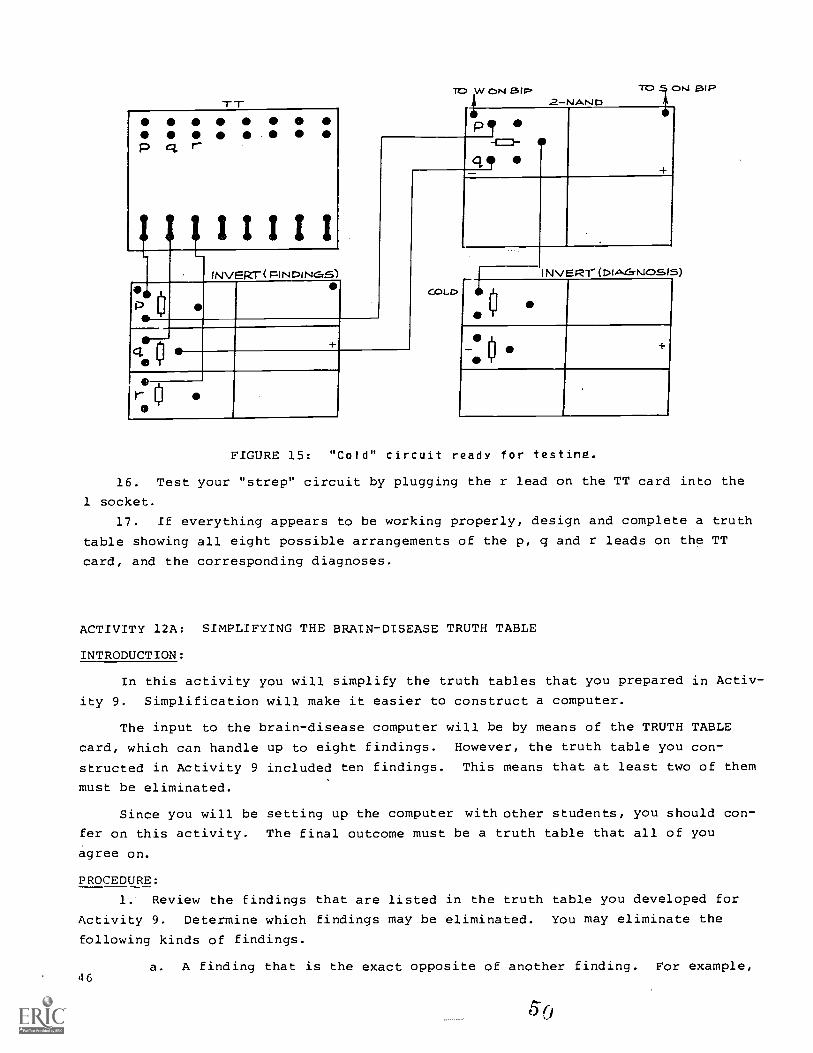
-r-r-
P q.
IIII IINVERT( FINDINGS)
4e
FIGURE 15:
W ON alp.2-NAND
P -c-
COLD
T1D oni BIP
INVERT (DIA.G.No.S1s)
"Cold" circuit ready for testing.
16. Test your "strep" circuit by plugging the r lead on the TT card into the
1 socket.
17. If everything appears to be working properly, design and complete a truth
table showing all eight possible arrangements of the p, q and r leads on the TT
card, and the corresponding diagnoses.
ACTIVITY 12A: SIMPLIFYING THE BRAIN-DISEASE TRUTH TABLE
INTRODUCTION:
In this activity you will simplify the truth tables that you prepared in Activ-
ity 9. Simplification will make it easier to construct a computer.
The input to the brain-disease computer will be by means of the TRUTH TABLE
card, which can handle up to eight findings. However, the truth table you con-
structed in Activity 9 included ten findings. This means that at least two of them
must be eliminated.
Since you will be setting up the computer with other students, you should con-
fer on this activity. The final outcome must be a truth table that all of you
agree on.
PROCEDURE:
1. Review the Findings that are listed in the truth table you developed for
Activity 9. Determine which findings may be eliminated. You may eliminate the
following kinds of findings.
46a. A finding that is the exact opposite of another finding. For example,
5 0
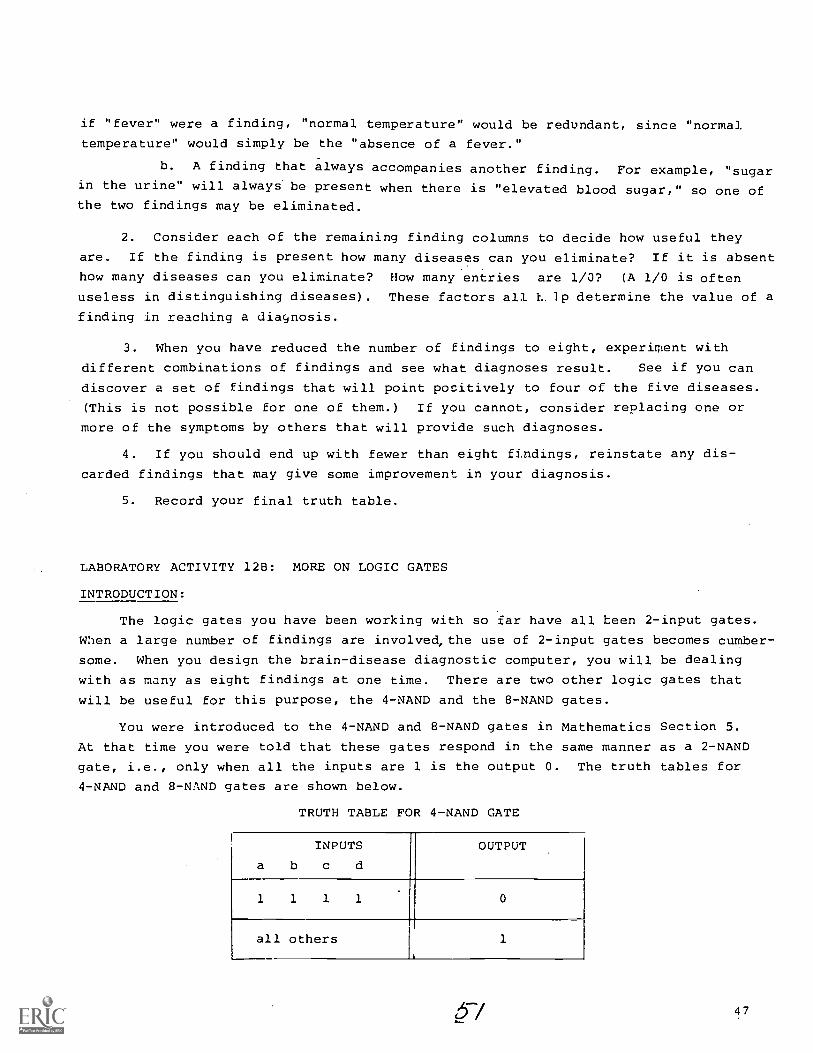
if "fever" were a finding, "normal temperature" would be redundant, since "normal
temperature" would simply be the "absence of a fever."
b. A finding that always accompanies another finding. For example, "sugarin the urine" will always be present when there is "elevated blood sugar," so one ofthe two findings may be eliminated.
2. Consider each of the remaining finding columns to decide how useful they
are. If the finding is present how many diseases can you eliminate? If it is absent
how many diseases can you eliminate? How many entries are 1/0? (A 1/0 is often
useless in distinguishing diseases). These factors all 1. , 1p determine the value of a
finding in reaching a diagnosis.
3. When you have reduced the number of findings to eight, experiment with
different combinations of findings and see what diagnoses result. See if you can
discover a set of findings that will point positively to four of the five diseases.
(This is not possible for one of them.) If you cannot, consider replacing one or
more of the symptoms by others that will provide such diagnoses.
4. If you should end up with fewer than eight findings, reinstate any dis-
carded findings that may give some improvement in your diagnosis.
5. Record your final truth table.
LABORATORY ACTIVITY 12B: MORE ON LOGIC GATES
INTRODUCTION:
The logic gates you have been working with so far have all been 2-input gates.
When a large number of findings are involved, the use of 2-input gates becomes cumber-
some. When you design the brain-disease diagnostic computer, you will be dealing
with as many as eight findings at one time. There are two other logic gates that
will be useful for this purpose, the 4-NAND and the 8-NAND gates.
You were introduced to the 4-NAND and 8-NAND gates in Mathematics Section 5.
At that time you were told that these gates respond in the same manner as a 2-NAND
gate, i.e., only when all the inputs are 1 is the output 0. The truth tables for
4-NAND and 8-NAND gates are shown below.
TRUTH TABLE FOR 4-NAND GATE
INPUTS
a b c d
OUTPUT
1 1 1 1 0
all others 1
L.7 47
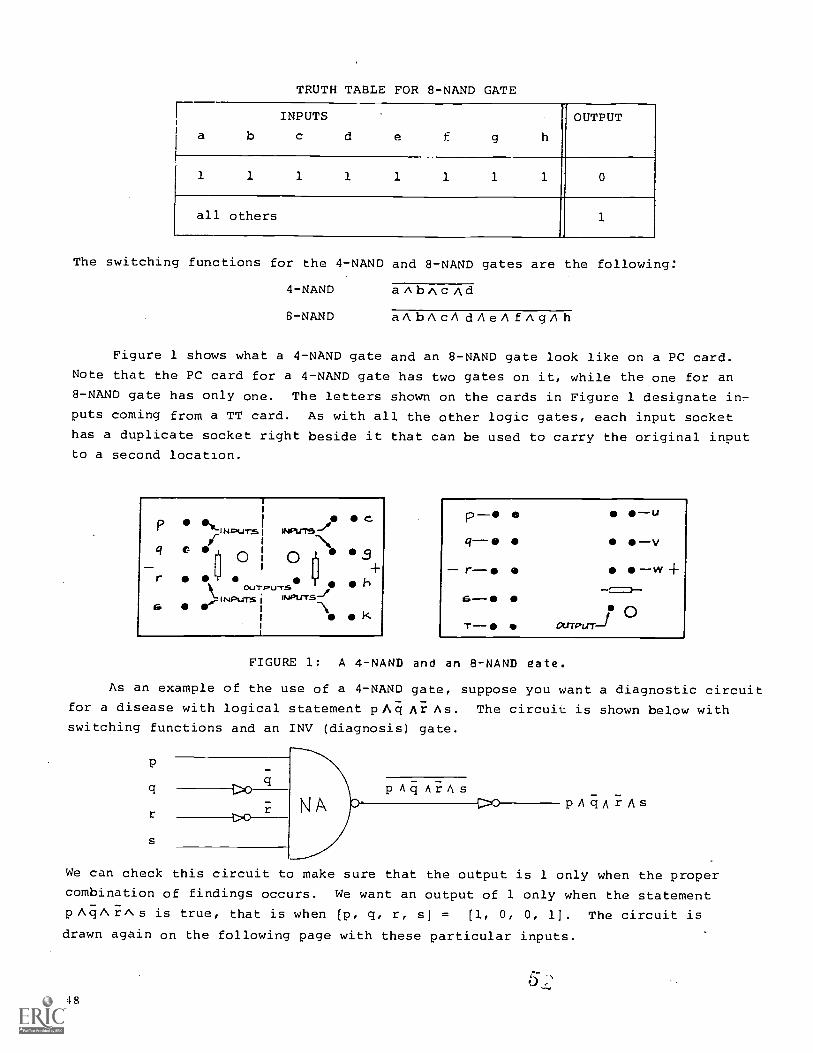
TRUTH TABLE FOR 8-NAND GATE
INPUTS
a
OUTPUT
1 1 1 1 1 1 1 1 0
all others
-A-1
The switching functions for the 4-NAND and 8-NAND gates are the following:
4-NAND aAbAc Ad
8-NAND aAbAcA dAeA fAgAh
Figure 1 shows what a 4-NAND gate and an 8-NAND gate look like on a PC card.
Note that the PC card for a 4-NAND gate has two gates on it, while the one for an
8-NAND gate has only one. The letters shown on the cards in Figure 1 designate in-
puts coming from a TT card. As with all the other logic gates, each input socket
has a duplicate socket right beside it that can be used to carry the original input
to a second location.
P at-i1.4=urS
-q 0 o,-. 0 40
3
r T (le oh+
\..OUTPUTS
6INPUTS i u4etrrs-/
--\ k1
ewou-r9 -/e
P - 14q -v
-r-- -w-==a-
G--0 0T--0 WW,Wpi
FIGURE 1: A 4-NAND and an 8-NAND gate.
As an example of the use of a 4-NAND gate, suppose you want a diagnostic circuit
for a disease with logical statement pAq Ar As.
switching functions and an INV (diagnosis) gate.
q
r
q
r NAp Aq AiAs
The circuit is shown below with
pfgfrAs
We can check this circuit to make sure that the output is 1 only when the proper
combination of findings occurs. We want an output of 1 only when the statement
pAclAiAs is true, that is when [p, q, r, s] = [1, 0, 0, 1]. The circuit is
drawn again on the following page with these particular inputs.
48
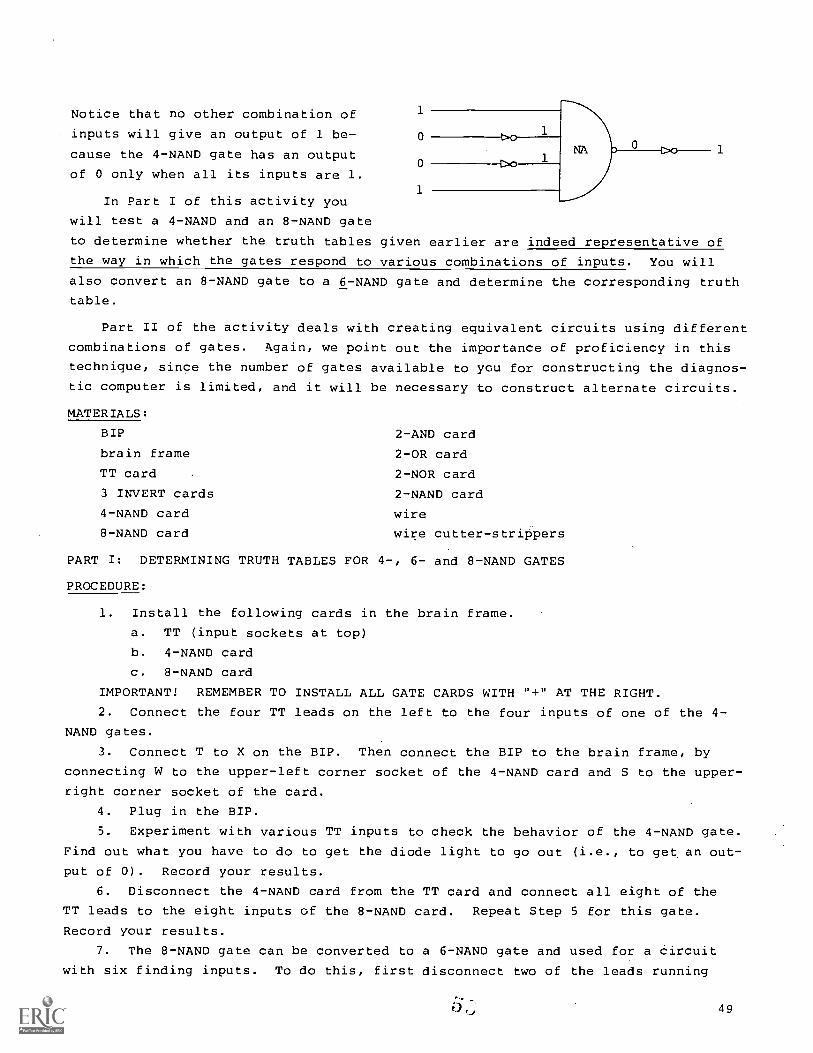
Notice that no other combination of
inputs will give an output of 1 be-
cause the 4-NAND gate has an output
of 0 only when all its inputs are 1.
In Part I of this activity you
will test a 4-NAND and an 8-NAND gate
to determine whether the truth tables given earlier are indeed representative of
the way in which the gates respond to various combinations of inputs. You will
also convert an 8-NAND gate to a 6-NAND gate and determine the corresponding truth
table.
Part II of the activity deals with creating equivalent circuits using different
combinations of gates. Again, we point out the importance of proficiency in this
technique, since the number of gates available to you for constructing the diagnos-
tic computer is limited, and it will be necessary to construct alternate circuits.
MATERIALS:
BIP 2-AND card
brain frame 2-OR card
TT card 2-NOR card
3 INVERT cards 2-NAND card
4-NAND card wire
8-NAND card wire cutter-strippers
PART I: DETERMINING TRUTH TABLES FOR 4-, 6- and 8-NAND GATES
PROCEDURE:
1. Install the following cards in the brain frame.
a. TT (input sockets at top)
b. 4-NAND card
c. 8-NAND card
IMPORTANT! REMEMBER TO INSTALL ALL GATE CARDS WITH "+" AT THE RIGHT.
2. Connect the four TT leads on the left to the four inputs of one of the 4-
NAND gates.
3. Connect T to X on the BIP. Then connect the BIP to the brain frame, by
connecting W to the upper-left corner socket of the 4-NAND card and S to the upper-
right corner socket of the card.
4. Plug in the BIP.
5. Experiment with various TT inputs to check the behavior of the 4-NAND gate.
Find out what you have to do to get the diode light to go out (i.e., to get an out-
put of 0). Record your results.
6. Disconnect the 4-NAND card from the TT card and connect all eight of the
TT leads to the eight inputs of the 8-NAND card. Repeat Step 5 for this gate.
Record your results.
7. The 8-NAND gate can be converted to a 6-NAND gate and used for a circuit
with six finding inputs. To do this, first disconnect two of the leads running
e.) 49
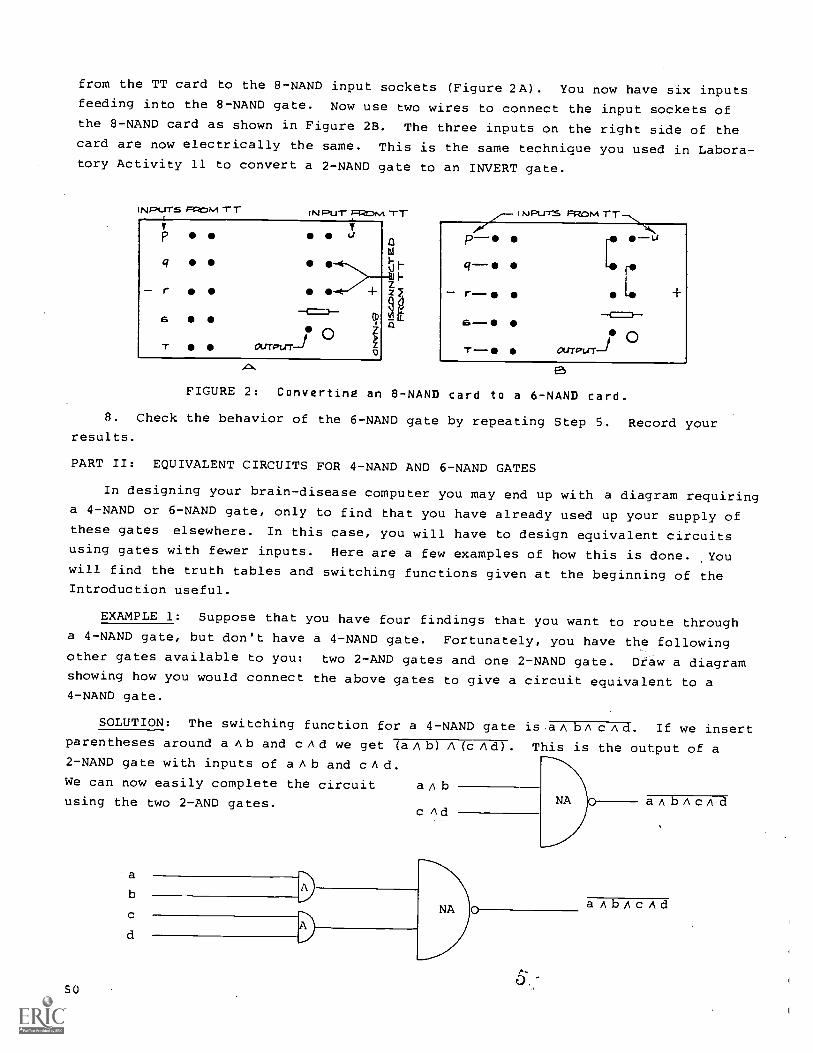
from the TT card to the 8-NAND input sockets (Figure 2A). You now have six inputsfeeding into the 8-NAND gate. Now use two wires to connect the input sockets ofthe 8-NAND card as shown in Figure 2B. The three inputs on the right side of thecard are now electrically the same. This is the same technique you used in Labora-tory Activity 11 to convert a 2-NAND gate to an INVERT gate.
INPUTS FL37M TT INPUT 1=RONA
p U
q
r +
6
C)T OUTPLIT-1
NPu-r5 FRAM -r-r
pqr6
0OUTPUT--I
FIGURE 2: Converting an 8-NAND card to a 6-NAND card.
8. Check the behavior of the 6-NAND gate by repeating Step 5. Record yourresults.
PART II: EQUIVALENT CIRCUITS FOR 4-NAND AND 6-NAND GATES
In designing your brain-disease computer you may end up with a diagram requiringa 4-NAND or 6-NAND gate, only to find that you have already used up your supply ofthese gates elsewhere. In this case, you will have to design equivalent circuitsusing gates with fewer inputs. Here are a few examples of how this is done. Youwill find the truth tables and switching functions given at the beginning of theIntroduction useful.
EXAMPLE 1: Suppose that you have four findings that you want to route througha 4-NAND gate, but don't have a 4-NAND gate. Fortunately, you have the followingother gates available to you: two 2-AND gates and one 2-NAND gate. Draw a diagramshowing how you would connect the above gates to give a circuit equivalent to a4-NAND gate.
SOLUTION: The switching function for a 4-NAND gate is .a A bA c Ad. If we insertparentheses around a A b and c A d we get (a A b) A (c Ad). This is the output of a2-NAND gate with inputs of a A b and c A d.We can now easily complete the circuit a A b
Ausing the two 2-AND gates. anbAc dAd
b
c
d
50
NA 0 anbAcAd
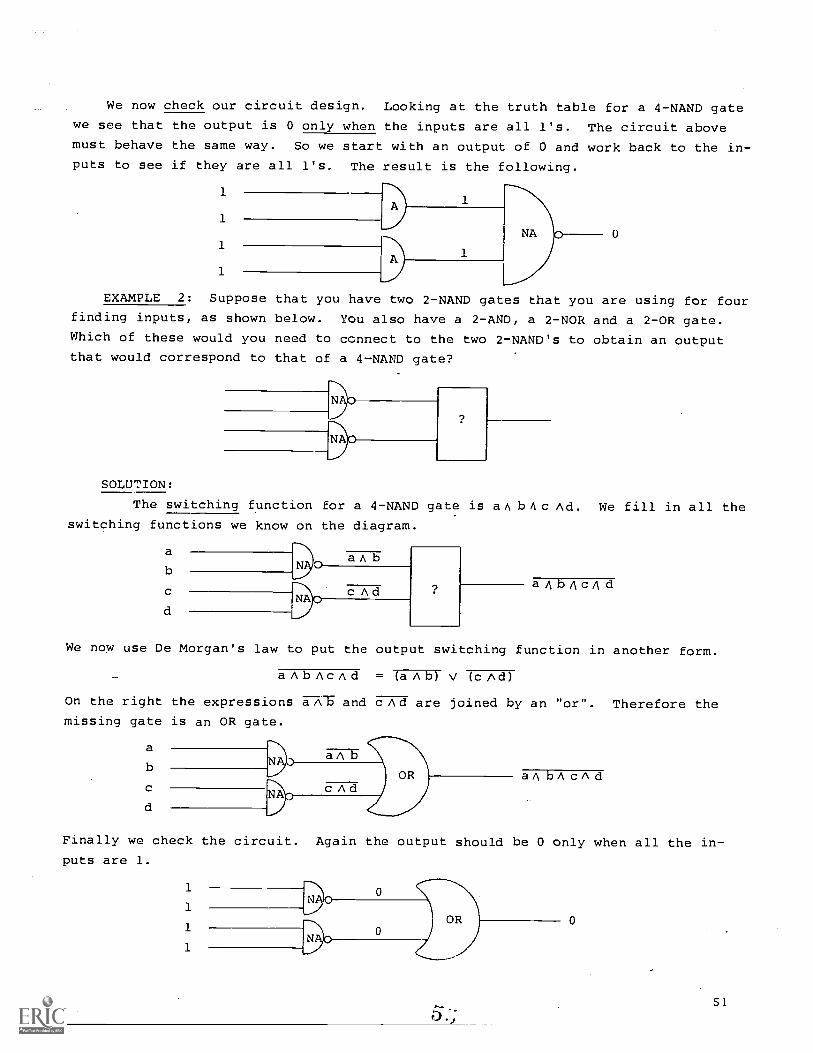
We now check our circuit design. Looking at the truth table for a 4-NAND gate
we see that the output is 0 only when the inputs are all l's. The circuit abovemust behave the same way. So we start with an output of 0 and work back to the in-
puts to see if they are all l's. The result is the following.
1
1
1
1
NA U
EXAMPLE 2: Suppose that you have two 2-NAND gates that you are using for fourfinding inputs, as shown below. You also have a 2-AND, a 2-NOR and a 2-OR gate.
Which of these would you need to connect to the two 2-NAND's to obtain an output
that would correspond to that of a 4-NAND gate?
NAO
3SOLUTION:
The switching function for a 4-NAND gate is aA b c Ad. We fill in all the
switching functions we know on the diagram.
a
b
c
d
N
NA
A b
Ad aAbAcAd
We now use De Morgan's law to put the output switching function in another form.
aAbAcAd = Ti7Tro V (C Ad)
On the right the expressions a A b and c Ad are joined by an "or". Therefore themissing gate is an OR gate.
a
b
dNA
aA b
c A dOR aA CA cA d
Finally we check the circuit. Again the output should be 0 only when all the in-
puts are 1.
1
1
1
1
0
0OR 0
51

PROCEDURE:
There are three problems below that deal with constructing circuits equivalent
to either a 4-NAND or a 6-NAND gate. First solve each problem on paper, i.e., draw
the circuit that provides the correct answer and check it. After you have done
this connect up the appropriate cards on the brain frame and test your solution.
If you don't remember how gates respond to specific input combinations refer back
to the truth tables in Laboratory Activity 10.
PROBLEM 1: You are provided with the initial circuit shown below. In addition
you are provided with a 2-NAND, 2-NOR, 2-AND and an INVERT gate card. How could you
use one or more of these cards to complete the circuit in such a way that it gives
the same output as a 4-NAND gate? (You will need to use the fact that aAbAc Ad =
( a A b ) V (C Ad) )
a
e
c3N
a, bA CA d
PROBLEM 2: You are given a 4-NAND gate, a 2-NAND gate and a 2-OR gate. How
can you combine them to form a circuit equivalent to a 6-NAND gate? (Hint: the
fu7.ction for a 6-NAND gate is aA b Ac Ad Ae Af. By De Morgan's law this
is equivalent to (aAbAcAd) V (eAf).)
PROBLEM 3: You are given three 2-NAND and two 2-OR gates. How might you
combine them to form a circuit equivalent to a 6-NAND gate?
52
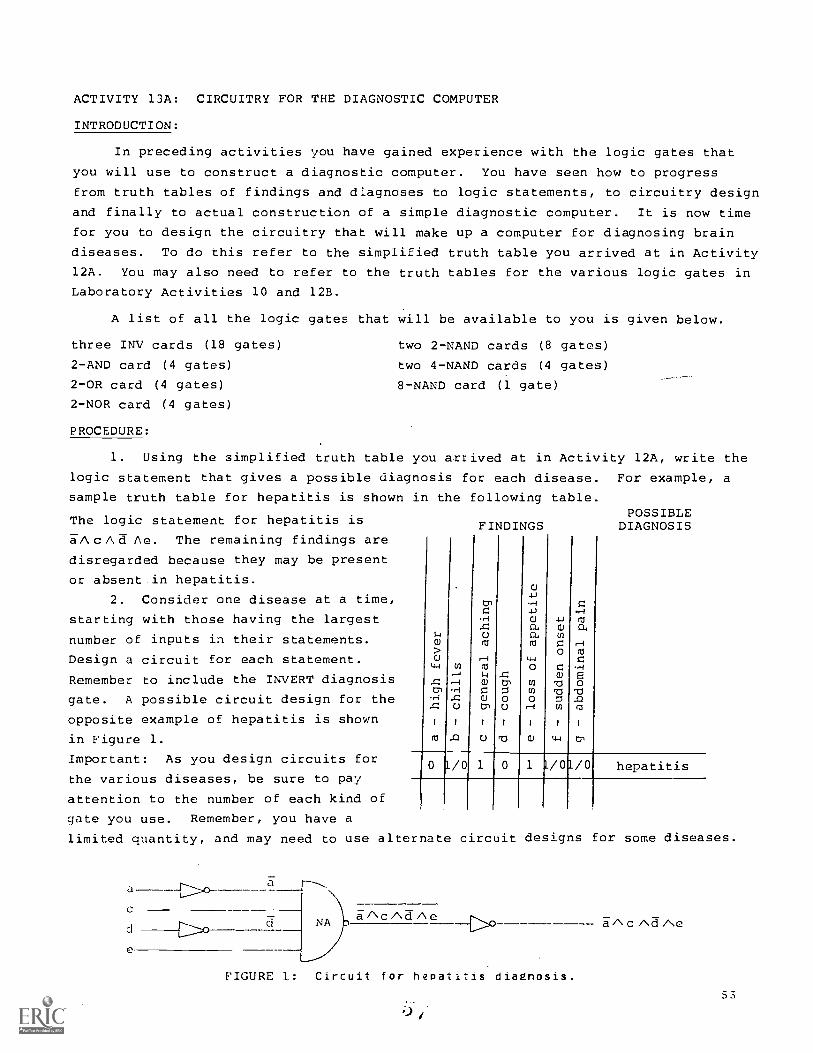
ACTIVITY 13A: CIRCUITRY FOR THE DIAGNOSTIC COMPUTER
INTRODUCTION:
In preceding activities you have gained experience with the logic gates that
you will use to construct a diagnostic computer. You have seen how to progress
from truth tables of findings and diagnoses to logic statements, to circuitry design
and finally to actual construction of a simple diagnostic computer. It is now time
for you to design the circuitry that will make up a computer for diagnosing brain
diseases. To do this refer to the simplified truth table you arrived at in Activity
12A. You may also need to refer to the truth tables for the various logic gates in
Laboratory Activities 10 and 12B.
A list of all the logic gates that will be available to you is given below.
three INV cards (18 gates)
2-AND card (4 gates)
2-OR card (4 gates)
2-NOR card (4 gates)
PROCEDURE:
two 2-NAND cards (8 gates)
two 4-NAND cards (4 gates)
8-NAND card (1 gate)
1. Using the simplified truth table you arrived at in Activity 12A, write the
logic statement that gives a possible diagnosis for each disease. For example, a
sample truth table for hepatitis is shown
The logic statement for hepatitis is
an cAa Ae. The remaining findings are
disregarded because they may be present
or absent in hepatitis.
2. Consider one disease at a time,
starting with those having the largest
number of inputs in their statements.
Design a circuit for each statement.
Remember to include the INVERT diagnosis
gate. A possible circuit design for the
opposite example of hepatitis is shown
in the following table.
444 ri
in Figure 1. mi
Important: As you design circuits for 0 1/0the various diseases, be sure to pay
attention to the number of each kind of
gate you use. Remember, you have a
limited quantity, and may need to use alternate
e
a
ci NA
FINDINGS
4
0o
WCl m0
0wo
M 721
oM
w
POSSIBLEDIAGNOSIS
1 1 1/01/0 hepatitis
circuit designs for some diseases.
i/NcAFIAe a-Ac"Fi"e
FIGURE 1: Circuit for hepatitis diagnosis.
53
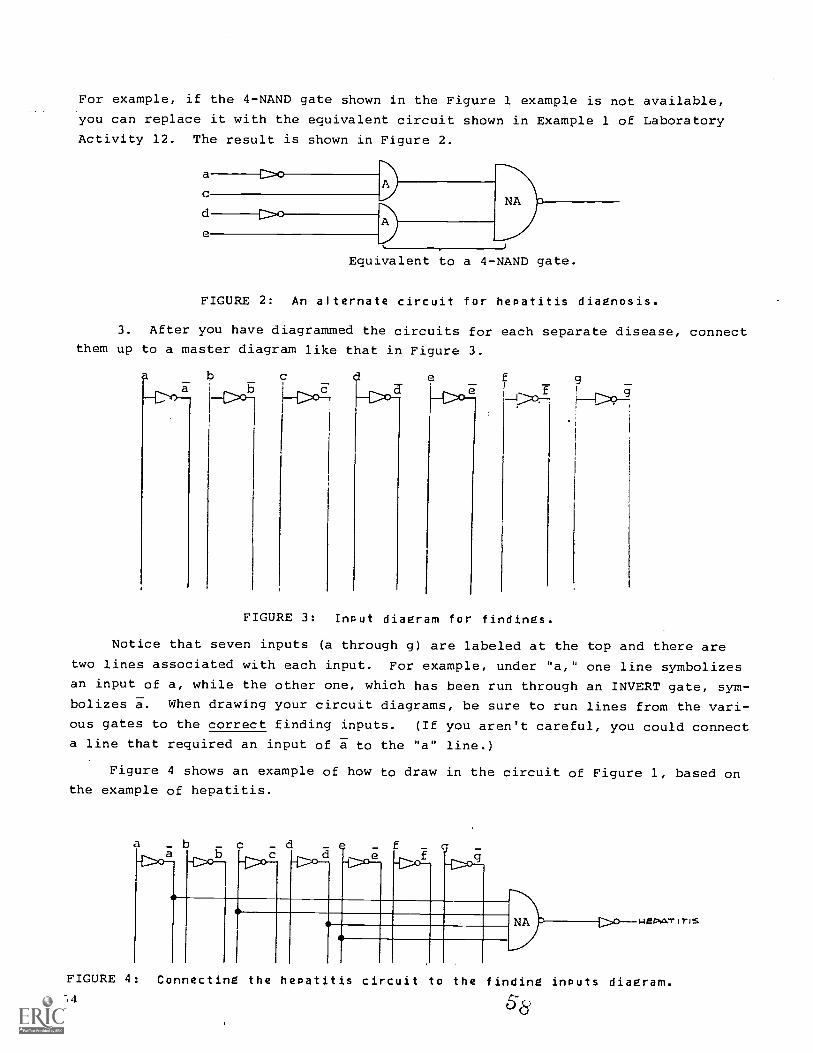
For example, if the 4-NAND gate shown in the Figure 1 example is not available,
you can replace it with the equivalent circuit shown in Example 1 of Laboratory
Activity 12. The result is shown in Figure 2.
C
d
e
NA
Equivalent to a 4-NAND gate.
FIGURE 2: An alternate circuit for hepatitis diagnosis.
3. After you have diagrammed the circuits for each separate disease, connect
them up to a master diagram like that in Figure 3.
f
FIGURE 3: Input diagram for findings.
Notice that seven inputs (a through g) are labeled at the top and there are
two lines associated with each input. For example, under "a," one line symbolizes
an input of a, while the other one, which has been run through an INVERT gate, sym-
bolizes a. When drawing your circuit diagrams, be sure to run lines from the vari-
ous gates to the correct finding inputs. (If you aren't careful, you could connect
a line that required an input of a to the "a" line.)
Figure 4 shows an example of how to draw in the circuit of Figure 1, based onthe example of hepatitis.
13-C-(1-1-lio:fb.-E>o-- -:)-9-
d->o e f-Co gg-Go
1
NA -1-ISCVNT I TiS
FIGURE 4: Connecting the hepatitis circuit to the finding inputs diagram.
54 58
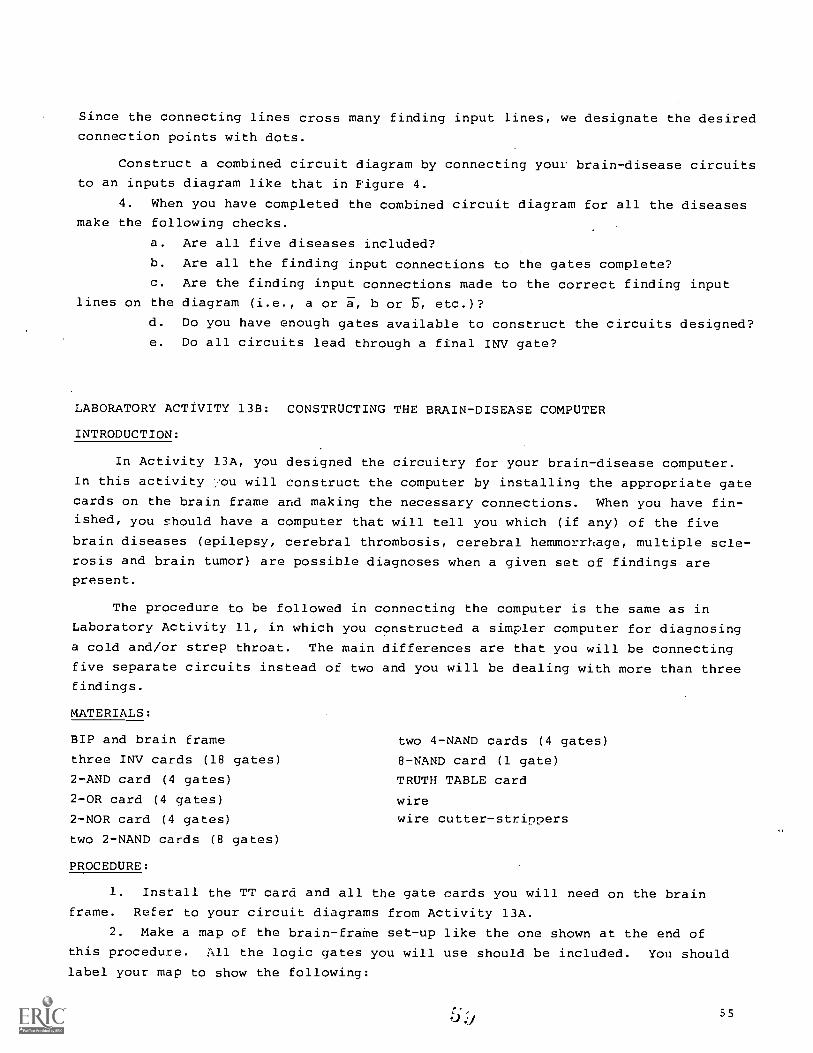
Since the connecting lines cross many finding input lines, we designate the desired
connection points with dots.
Construct a combined circuit diagram by connecting your brain-disease circuits
to an inputs diagram like that in Figure 4.
4. When you have completed the combined circuit diagram for all the diseases
make the following checks.
a. Are all five diseases included?
b. Are all the finding input connections to the gates complete?
c. Are the finding input connections made to the correct finding input
lines on the diagram (i.e., a or a, b or B, etc.)?
d. Do you have enough gates available to construct the circuits designed?
e. Do all circuits lead through a final INV gate?
LABORATORY ACTIVITY 13B: CONSTRUCTING THE BRAIN-DISEASE COMPUTER
INTRODUCTION:
In Activity 13A, you designed the circuitry for your brain-disease computer.
In this activity -:ou will construct the computer by installing the appropriate gate
cards on the brain frame and making the necessary connections. When you have fin-ished, you should have a computer that will tell you which (if any) of the five
brain diseases (epilepsy, cerebral thrombosis, cerebral hemmorrlage, multiple scle-
rosis and brain tumor) are possible diagnoses when a given set of findings are
present.
The procedure to be followed in connecting the computer is the same as in
Laboratory Activity 11, in which you constructed a simpler computer for diagnosing
a cold and/or strep throat. The main differences are that you will be connecting
five separate circuits instead of two and you will be dealing with more than three
findings.
MATERIALS:
BIP and brain frame
three INV cards (18 gates)
2-AND card (4 gates)
2-OR card (4 gates)
2-NOR card (4 gates)
two 2-NAND cards (8 gates)
PROCEDURE:
two 4-NAND cards (4 gates)
8-NAND card (1 gate)
TRUTH TABLE card
wire
wire cutter-strippers
1. Install the TT card and all the gate cards you will need on the brain
frame. Refer to your circuit diagrams from Activity 13A.
2. Make a map of the brain-frame set-up like the one shown at the end of
this procedure. All the logic gates you will use should be included. You should
label your map to show the following:
55

a. the positions of the various findings on the TT card,
b. the positions of the brain diseases on the diagnosis INVERT card,
c. information on which gates on each card are associated with which
disease circuit,
d. information on which inputs on each gate you will use for which
findings.
IMPORTANT: The map shown at the end of this procedure is only a sample
map. Your map will be labeled differently, depending upon how you have
designed the circuitry.
3. Connect as many TT leads as you have findings to the input sockets of
separate INVERT gates. (This will require two INVERT cards if you have more than
six findings.) Label, on your map, the input for each INVERT gate you have used.
From these "finding" INVERT gates you now have available both p (from the other
input socket) and T (from the output socket) for each of your findings.
4. Complete the circuit for epilepsy all the way to the diagnosis card.
5. Connect T to X on the BIP. Then connect the BIP uo the brain frame by
connecting the W lead to the upper-left terminal on one of the gate cards and
the S lead to the upper-right terminal on the same card.
6. Plug in the BIP.
7. Test your "epilepsy" circuit by connecting, on the TT card, an input of 1
for every finding that mult be present and an input of 0 for every finding that
can't be present. If the "epilepsy" LED on the diagnosis card does not come on,
recheck your wiring.
8. Try a few combinations other than the one tested in Step 7. In each case
the LED should not light up.
9.. Complete the circuit for each of the remaining four diseases in turn. The
circuits involving 8-input and 4-input gates should be done first. Test each
disease circuit before going on to the next. As you proceed, it will become more
complicated to find an available socket for the particular finding input you need.
In order to find an available socket use the following procedure.
a. Suppose you need an input of T. Is the output socket of the "finding"
INVERT card free? If so use it. If not, follow the wire leaving it
to the socket where the other end is connected.
b. You are now at the input soc!;et for a gate. There are always two in-
put sookes which are electrically the Is the other input socket
free? If so, use it. If not, follow the wire from that second socket
to its end.
c. You are now at the input socket for another gate. You can now repeat
Step b, checking the other eleCtrically eauivalent input socket. Con-
tinue this process of following wires until you find a free socket.
10. Check out the completed computer by trying various combinations of findings.
Use your truth tables to try sets of findings that shouid produce more than one dis-
ease possibility. Try combinations of findings that should produce no disease.
Record your results in a truth table like the one on the following page.
56 6' 0
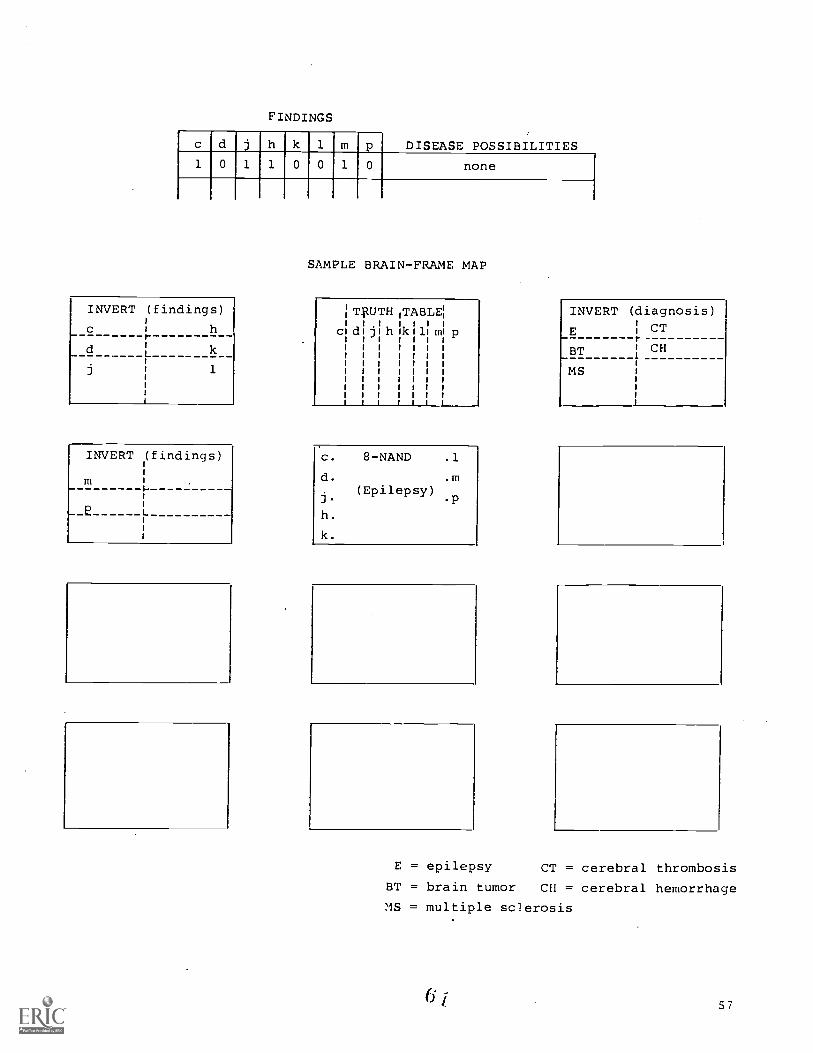
FINDINGS
c d j h k 1 m p DISEASE POSSIBILITIES1 0 1 1 0 0 1 0 none
INVERT (findings)
d
J
L k
1
SAMPLE BRAIN-FRAME MAP
TRUTH TABLE
d J h k 1 m
INVERT
m
E
(findings) c.
d.
J -
h.
k.
8-NAND
(Epilepsy)
.1
.m
P
INVERT (diagnosis)CT
BT CH
MS
E = epilepsy CT = cerebral thrombosis
BT = brain tumor CH = cerebral hemorrhage
MS = multiple sclerosis
57
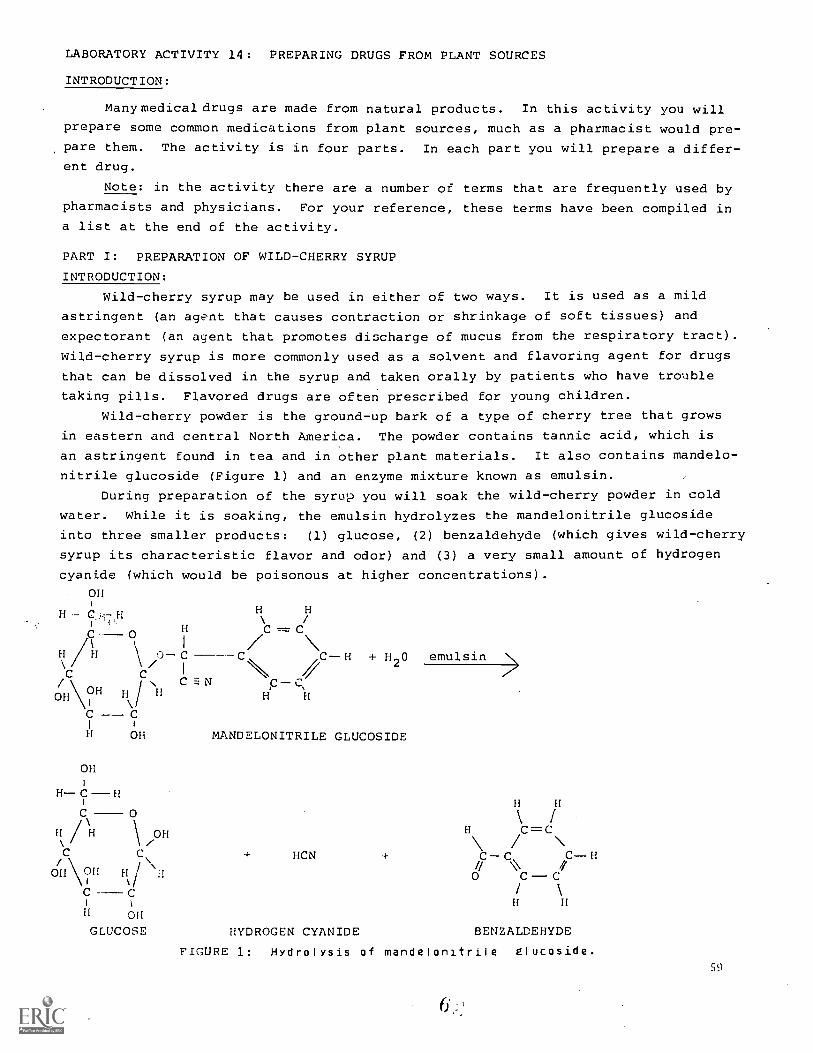
LABORATORY ACTIVITY 14: PREPARING DRUGS FROM PLANT SOURCES
INTRODUCTION:
Manymedical drugs are made from natural products. In this activity you will
prepare some common medications from plant sources, much as a pharmacist would pre-
pare them. The activity is in four parts. In each part you will prepare a differ-
ent drug.
Note: in the activity there are a number of terms that are frequently used by
pharmacists and physicians. For your reference, these terms have been compiled in
a list at the end of the activity.
PART I: PREPARATION OF WILD-CHERRY SYRUP
INTRODUCTION:
Wild-cherry syrup may be used in either of two ways. It is used as a mild
astringent (an agent that causes contraction or shrinkage of soft tissues) and
expectorant (an agent that promotes discharge of mucus from the respiratory tract).
Wild-cherry syrup is more commonly used as a solvent and flavoring agent for drugs
that can be dissolved in the syrup and taken orally by patients who have trouble
taking pills. Flavored drugs are often prescribed for young children.
Wild-cherry powder is the ground-up bark of a type of cherry tree that grows
in eastern and central North America. The powder contains tannic acid, which is
an astringent found in tea and in other plant materials. It also contains mandelo-
nitrile glucoside (Figure 1) and an enzyme mixture known as emulsin.
During preparation of the syrup you will soak the wild-cherry powder in cold
water. While it is soaking, the emulsin hydrolyzes the mandelonitrile glucoside
into three smaller products: (1) glucose, (2) benzaldehyde (which gives wild-cherry
syrup its characteristic flavor and odor) and (3) a very small amount of hydrogen
cyanide (which would be poisonous at higher concentrations).
OH
H - C, H
C,-- H
\==
i
'1, H C/
C 0I / \
El // H \
/
0- C --\ C-H + H2O emulsin
C C 1
OH\OH H / Hi \
HS- C
H
C -- CI
H OH MANDELONITRILE GLUCOSIDE
OH
H--C---H
0
H // H 1 OH
/OAT! El :1
C C
OHGLUCOSE
HCN
El El
H C =C
1/- C C - H
0 C C
H H
HYDROGEN CYANIDE BENZALDEHYDE
FIGURE 1: Hydrolysis of mandelonitrile glucoside.59

MATERIALS:
materials for percolator set-up:
acrylic column
purified sand
cotton
rubber stopper, one-hole,#4
rubber stopper, solid, #4
glass stirring rod
2 beakers, 50-m1
pipet, 10-ml
sucrose (table sugar)
PROCEDURE:
pinch clamp (or screw clamp)
rubber tubing
glass tubing
ring stand and clamp
filter paper
balance
wild-cherry powder
glycerin
1. Construct a percolator as shown in Figure 2. ("Percolation" is the process'
of passing a liquid through a porous solid.) The purified sand is used to hold the
cotton in place and to provide a firm, porous support for the filter paper. Be sure
to insert the filter paper so that it fits snugly against the sides of the column.
Otherwise some liquid may seep around instead of through the paper, resulting in i
proper filtration. Close the pinch clamp.
2. Moisten 3 ± .2 g of wild-cherry
powder with approximately 2 ml of tap
water in a beaker. Then transfer the pow-
der into the percolator.
3. Rinse the beaker with 5 to 10 mlwater. Use this water to transfer any re-
maining powder to the column. There should
be a few ml of water above the powder.
4. Stopper the top of the column
and let the powder soak for 30 to 60 min-
utes. This soaking is called "maceration."
During maceration the mandelonitrile glu-
coside in the wild-cherry powder is hydro-
lyzed enzymatically. If you unstopper the
top of the column after a half-hour or
more of maceration, you should be able to
detect the familiar wild-cherry odor of
benzaldehyde, one of the hydrolysis pro-
ducts. Wh.Lle the maceration is taking
place, go on to Part II of the activity.
1.-OLUMN
FIL.-rE;2 PAPE e-4-- I crn PUC EG SAND
GO-rraN121-113E3Ele h-re:FIC
T1.1.1:31/-41=c
g=1.-LE3E3e4e 11...t 131 N/A-
PI N(-H CLAMPF_AI4Et2
FIGURE 2: A percolator set-up.
). when the maceration is complete, remove the upper stopper, release thepinch clamp and allow t.h percolation to proceed. Collect 8 k 2 ml of percolate
in a beaker, adding additional water to the column if needed.
6. Add 13.5 ± .5 q sucrose to the percolate and dissolve the sugar by stirring.
The sucrose is added for flavor. It is dissolved by stirring rather than by heating
because two of the compounds in the syrup, benzaldehyde and hydrogen cyanide, can
be readily vaporized and driven off by heat.
7. Add 3 ± .5 ml glycerin with a pipet. Glycerin is added to keep the tannicacid dissolved in the syrup. Tannic acid is poorly soluble in water and precipi-tates if glycerin is not added.
8. Add enough water to make about 20 ml of syrup. At this point a pharmacist
would strain the syrup to remove any particles that had escaped from the percolator.
9. Observe and smell the syrup. Do not put any of it in your mouth. Record
your observations on a data sheet.
PART II: PREPARING CASCARA-SAGRADA INFUSION
INTRODUCTION:
Cgscara sagrada is the dried, powdered bark of cascara buckthorn, a tree that
grows on the Pacific Coast of North America. The California Indians used a prepa-
ration of this bark as a cathartic (a drug that cuases people to defecate), and the
drug is still used for that purpose. The name of the drug, cascara sagrada, means
"sacred bark" in Spanish.
The main active ingredient in cascara sagrada is a complex organic compound
called cascarin, or frangulin. This substance in itself does not have an effect onthe body. However, when it reaches the bowel it is broken down, probably with the
aid of enzymes produced by intestinal bacteria. One of the breakdown products is acompound called emodin. This substance, also found in rhubarb, promotes defecation
by stimulating peristalsis in the large intestine. Since the drug does not become
active until it is broken down in the bowel, it does not begin to take effect until
six to eight hours after it is ingested.
Cascara sagrada is most commonly prepared by treating it before percolation to
remove some of its bitter flavor and then mixing it after percolation with a prepa-
ration of dried licorice root. The licorice is added to mask the bitter flavor ofthe drug.
In this part of the activity, you will prepare an infusion of cascara sagrada.
An infusion is a preparation made by macerating or percolating a substance withhot water.
MATERIALS:
coarse cascara - sagrada powder ring stand
tea strainer wire gauze
2 beakers, 150-ml glass stirring rod
cover for beaker(watch glass or tongs (or asbestos gloves or pot holder)
Petri-dish lid) balance
as burner
61
PROCEDURE:
1. Place 1 ± .1 g of cascara sagrada in a beaker. Add a few drops of cold
water and mix well to moisten the powder.
2. Measure 20 ml of water into the other beaker and heat it until the water
begins to boil.
3. When the water in the beaker boils, turn off the burner and pour the water
carefully into the beaker that has the powder in it.
glove or a pot holder to grip the beaker.) Cover the
Petri-dish lid) and allow the drug to macerate for 15
(Use tongs or an asbestos
beaker (with a watch glass or
minutes.
4. After maceration, pour the preparation through a fine tea strainer into
a clean beaker.
5. Pour enough cold water through the strainer and into the beaker to bring
the volume of product up to approximately 20 ml.
6. Record your observations. Do not put any of the infusion in your mouth.
PART III: PREPARATION OF WITCH-HAZEL-LEAF EXTRACT
INTRODUCTION:
Witch hazel is the common name for a shrub, Hamamelis, which is widely distri-
buted in Canada and the eastern United States. Witch-hazel preparations are used
mainly as astringents, their active ingredient being hamamelitannin, a compound simi-
lar to tannic acid. These preparations are used on bruises, on insect bites and
stings, and on sunburn and other burns. The American Indians used a witch-hazel
preparation as an invigorating rub for muscular soreness after athletic contests.
In this part of the activity, you will prepare an extract of witch-hazel leaf.
An extract is a preparation, usually in concentrated form, obtained by treating
plant or animal tissue
MATERIALS:
with a solvent to remove desired components of the tissue.
percolator set-up (from
2 beakers, 50-ml
2 pipets, 10-ml
glass stirring rod
PROCEDURE:
Part I) glycerin
ethyl alcohol, 95%
witch-hazel leaf (a coarse powder)
balance
1. Construct a percolator as in Part I, Step 1. (Note: the percolator used
in Part I must be rinsed and repacked with fresh sand, cotton and filter paper.)
2. Pipet 9 1 ml of ethyl alcohol and 1 z: .1 ml of glycerin into a beaker.
Water is not used for witch hazel preparations because the tannic acid in the pow-
der is much more soluble in alcohol and glycerin than in water.
3. Place 10 .1 g of the witch-hazel powder in another beaker, and add about
6 ml or the solvent (the alcohol-glycerin mixture). Mix well to dampen the powder.
4. Let the dampened powder stand for about 15 minutes. While the powder is
macerating, proceed to Part IV.62.

5. When 15 minutes are up, rinse the beaker with the remainder of the solvent.Add this suspension to the percolator.
6. Stopper the top of the column and let the powder macerate for one to twodays.
7. When the maceration is complete, remove the rubber stopper from the topof the percolator. Open the pinch clamp and let the percolation proceed into a
50-ml beaker.
8. When there is no more solvent above the powder, add another 5 to 10 ml ofethyl alcohol. Allow the percolation to proceed until you have collected 8 to 12ml of percolate.
9. Record your observations of the extract. How does the extract look? De-scribe its odor. Place a few drops on your hand and rub the extract in. How doesit feel?
PART IV: PREPARING SPIRITS OF CAMPHOR
INTRODUCTION:
Camphor is a complex organic compound taken from the wood and bark of the cam-phor tree, which is native to several parts of Asia and is widespread in Taiwan andJapan. Camphor has long been used in Chinese medici* It has some uses in modernmedicine, but most camphor sold in this country is .actured synthetically ratherthan being extracted from the camphor tree.
Camphor has a variety of medical uses. Applied to the skin, it is a counter-irritant, causing inflammation of the skin and thus reducing inflammation of nearbyinternal parts (e.g., a sprained ankle). It is also a mild local anesthetic, andmay produce a feeling of numbness on the skin where it is applied. In addition, itproduces a feeling of coolness on the skin (and, if inhaled, on mucous membranes) bystimulating the nerve endings that are sensitive to cold. Finally, camphor is amild antiseptic.
Although camphor is no longer used internally, it was once used as a heartand circulatory stimulant (it mildly stimulates the central nervous system), a car-minative (an agent that promotes expulsion of gas from the digestive system andthus helps to relieve intestinal cramps) and an expectorant.
"Spirits" may be generally defined as a solution of a volatile substance inalcohol. (A volatile substance is one that readily vaporizes, such as camphor.)The alcohol in spirits evaporates quickly, and spirits must be kept in well-stop-pered bottles. They must also be kept away from heat and light to prevent chemicalchanges in the substance dissolved in the alcohol.
MATERIALS:
camphor
ethyl alcohol, 95%
beaker, 50-m1
pipet, 10-ml
glass stirring rod
balance
63

PROCEDURE:
1. Place 1 ± .1 g camphor in a beaker.
2. Add 9 ± 1 ml of ethyl alcohol to the beaker. Stir to dissolve the camphor.
3. Record observations of your product. Describe its odor. Rub a few dropson the hack of your hand. How does it feel?
DISCUSSION QUESTIONS:
1. Have you ever ingested wild-cherry syrup? If so, for what purpose?
2. Have you ever used a witch-hazel preparation? If so, for what purpose?
3. Why must spirits be bottled and capped?
4. What infusions have you used? (Hint: not all infusions are medicines.)
5. Why do you suppose cascara sagrada can be macerated in boiling water, whilewild-cherry bark cannot?
VOCABULARY:
astringent (a-STRIN-junt)--an agent that causes contraction or shrinkage of soft
tissues--used for treating bruises, burns, insect bites, etc.
carminative (kahr-MIN-uh-tiv)--an agent that promotes expulsion of gas from thedigestive system.
cathartic (kuh-THAHR-tick)--an agent that promotes defecation.
counterirritant (KOWN-tur-EAR-ih-tunt)--an agent that causes inflammation of theskin, thus reducing more deep-seated inflammation.
,xpectorant (eck-SPECK-tow-runt)--an agent that promotes discharge of mucus fromthe respiratory tract.
extract (ECK-stract)--a preparation, usually in concentrated form, obtained by
treating plant or animal tissue with a solvent to remove desired tissue com-ponents.
infusion (in-FEW-zhun)--a preparation made by macerating or percolating a substancewith hot water.
maceration (MASS-ur-A-shun)--the process of soaking plant or animal tissue in aliquid.
percolation (PUHR-ko-LAY-shun)--the process of passing a solvent through a columncontaining a solid substance, thereby removing soluble constituents of thesubstance.
spirits--a solution of a volatile substance in alcohol.
61
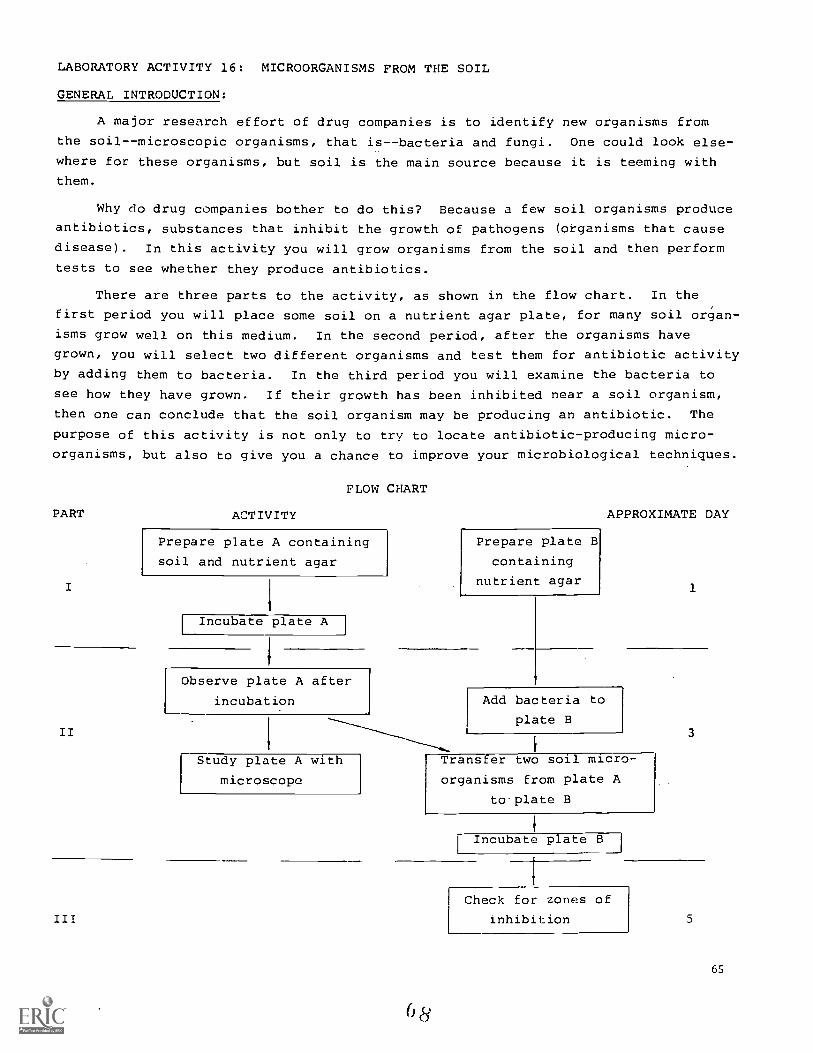
LABORATORY ACTIVITY 16: MICROORGANISMS FROM THE SOIL
GENERAL INTRODUCTION:
A major research effort of drug companies is to identify new organisms from
the soil--microscopic organisms, that is--bacteria and fungi. One could look else-
where for these organisms, but soil is the main source because it is teeming with
them.
Why do drug companies bother to do this? Because a few soil organisms produce
antibiotics, substances that inhibit the growth of pathogens (organisms that cause
disease). In this activity you will grow organisms from the soil and then perform
tests to see whether they produce antibiotics.
There are three parts to the activity, as shown in the flow chart. In the
first period you will place some soil on a nutrient agar plate, for many soil organ-
isms grow well on this medium. In the second period, after the organisms have
grown, you will select two different organisms and test them for antibiotic activity
by adding them to bacteria. In the third period you will examine the bacteria to
see how they have grown. If their growth has been inhibited near a soil organism,
then one can conclude that the soil organism may be producing an antibiotic. The
purpose of this activity is not only to try to locate antibiotic-producing micro-
organisms, but also to give you a chance to improve your microbiological techniques.
PART ACTIVITY
I
II
FLOW CHART
Prepare plate A containing
soil and nutrient agar
Incubate plate A I
Observe plate A after
incubation
APPROXIMATE DAY
Prepare plate B
containing
nutrient agar
Add bacteria to
plate B
Study plate A with
microscope
1
Transfer two soil micro-
organisms from plate A
to plate B
Incubate plate
6 8
3
Check for zones of
inhibition 5
65
WARNING
In this and other activities you will be working with cultures of bacteria.
Bacteria should always be treated with respect. While the bacteria that are pro-
vided are normally harmless, they can cause disease if they find their way tocertain places in the body. For example, E. coli, a normally harmless and even
useful bacterium found in human intestines can cause infections of the urinary
bladder if it gets into the urinary tract. Therefore, care mist be exercised
even though infections from handling bacteria in the laboratory are rare.
It is important that you learn correct methods of handling bacteria while you
are working with bacteria that are normally harmless. You will then be able toapply the same techniques if you work with pathogenic bacteria. This is importantif you ever work in a medical laboratory.
The following precautions should be employed each time you work with bac-
teria.
1. Wash your hands thoroughly with soap and water before and after the
laboratory activity.
2. When working with bacteria, do not eat any food, drink from laboratory
glassware, or put fingers, pencils, etc., in your mouth. Keep all sources ofbacteria away from open cuts or sores.
3. If a bacterial culture is spilled, notify your instructor immediately.
4. Discard all cultures, liquid wastes and media as directed by your in-structor, and only in containers specified for this purpose. Sterilize all livecultures before disposal.
5. At the conclusion of the laboratory period, wash the top of the lab deskwith disinfectant.
PART I: PLATING SOIL MICROORGANISMS
INTRODUCTION:
In this part you will melt two sterile tubes of nutrient agar (sterile meansfree of any microorganisms). To c7;e, you will add some diluted soil sample. Then,
you will pout the contents of eac:: tube into a Petri dish to make agar plates. One
plate will thus contain agar with soil, and the other will contain sterile agar.
In order to ensure that only microorganisms from the soil grow on the agar, wewill use sterile technique. This technique prevents microorganisms from othersources, such as dust in the air, from getting into the agar.
66

MATERIALS:
2 capped test tubes containing
sterile nutrient agar
test tube, 16 x 125 mm
2 Petri dishes, sterile
hot water bath
germicide
paper towels
glass-marking pencil
test-tube holder
PROCEDURE:
#4 or 5 stopper
250-ml Erlenmeyer flask
250-ml beaker
test-tube rack
scale
thermometer
500- or 1000-ml beaker
1-ml pipet
10-ml pipet
1. Clear away unnecessary papers and other items, and disinfect (clean) a
large area
solution.
bacteria.
is poured.)
of the t le top around your work space by wiping it down with germicide
(This procedure wipes away dust that is on the table and also kills many
Dust kicked up from the table would contaminate the sterile agar when it
2. Obtain two test tubes of sterile nutrient agar and melt the agar in a
boiling water bath. (In boiling water, melting takes about five minutes.) Leave
the caps on the test tubes to keep dust out.
3. While the agar is heating up, proceed to Step 6, but keep an eye on the
agar. As soon as it melts completely, continue with Steps 4 and 5.
4. As soon as the agar is completely melted, remove the test tubes from the
hot water bath with a test-tube holder. Obtain a 250-ml beaker half-full of water
at a temperature of 45 to 50 °C. Place the melted agar tubes in the water bath
without removing their caps. Allow the tubes to cool down to the same temperature
as the water bath. This can be tested after about 5 minutes by rolling the tubes
in the palms of your hands. They should feel approximately as warm as the surround-
ing water. Note: do not overcool, as the agar medium will resolidify and the tubes
will have to be melted once again in a hot water bath.
5. While the tubes of nutrient agar are cooling, place two sterile Petri
diF;.1. on the table. Do not open them. Label one Petri dish "A" .ana the other "B."
6. Dilution of the soil sample is necessary because soil rich in micro-
organisms that if placed in agar directly, there would be so much growth that it
would be impossible to distinguish one kind of microorganism frol, another. Many
colonies of microorganisms would overlap. Dilute the soil as follows.
Suspend 2.0 ± 0.1 g oFT soil in 200 ± 5 ml of tap water in a 250-ml Erlenmeyer
flask. Stopper and shake this suspension very thoroughly. This dilutes your soil
by a factor of 100.
7. Now you will dilute the soil suspension even more' to arrive at a final soil
dilution factor. of 1,000. Do this by taking the 100-f dilution and diluting it
by a factor ,r lo (100 x 10 = 1,000) as follows. a 1- and a 10-ml pipet
and a test tbe. Label the test tube "S." Pipet 0.1 ml of water into test
6 7
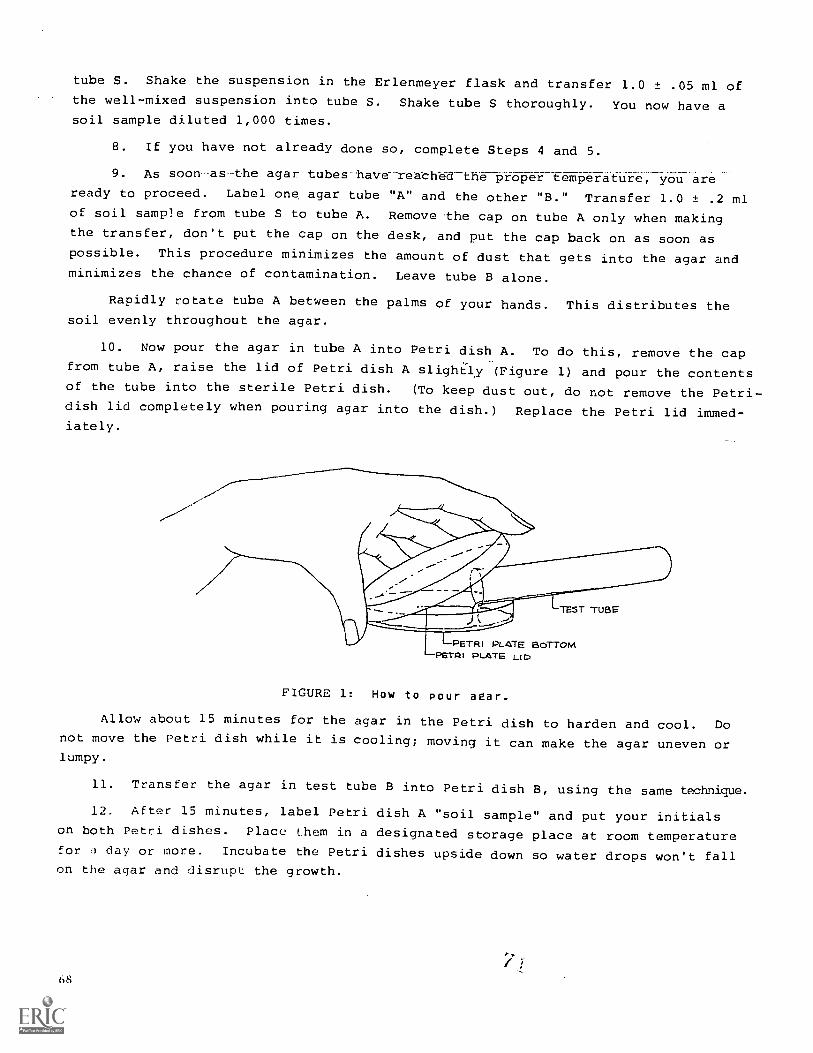
tube S. Shake the suspension in the Erlenmeyer flask and transfer 1.0 ± .05 ml ofthe well-mixed suspension into tube S. Shake tube S thoroughly. You now have asoil sample diluted 1,000 times.
8. If you have not already done so, complete Steps 4 and 5.
9. As soon-as-the-agar-tubes-bave-reached-the-proPer temperature, you areready to proceed. Label one, agar tube "A" and the other "B." Transfer 1.0 ± .2 mlof soil sample from tube S to tube A. Remove-the cap on tube A only when makingthe transfer, don't put the cap on the desk, and put the cap back on as soon aspossible. This procedure minimizes the amount of dust that gets into the agar andminimizes the chance of contamination. Leave tube B alone.
Rapidly rotate tube A between the palms of your hands. This distributes thesoil evenly throughout the agar.
10. Now pour the agar in tube A into Petri dish A. To do this, remove the capfrom tube A, raise the lid of Petri dish A slightly (Figure 1) and pour the contentsof the tube into the sterile Petri dish. (To keep dust out, do not remove the Petri-dish lid completely when pouring agar into the dish.) Replace the Petri lid immed-iately.
TEST TUBE
PETRI PLATE BOTTOM-PETRI PLATE L.I
FIGURE 1: How to pour agar.
Allow about 15 minutes for the agar in the Petri dish to harden and cool. Donot move the Petri dish while it is cooling; moving it can make the agar uneven orlumpy.
11. Transfer the agar in test tube B into Petri dish B, using the same technique.
12. After 15 minutes, label Petri dish A "soil sample" and put your initialson both Petri dishes. Place them in a designated storage place at room temperaturefor a day or more. Incubate the Petri dishes upside down so water drops won't fallon the agar and disrupt the growth.
68
PART II: OBSERVING THE SOIL SAMPLE
INTRODUCTION:
In Part I, you
organisms that have
of the organisms to
inoculated agar with a soil sample. Now you will observe the
grown on the agar plate. You will also pick out and test two
see whether they can inhibit the growth of bacteria. This is
done by spreading bacteria over the surface of another agar plate and then adding
the organisms from the soil. You will then incubate the plate to see li--/Iccher the
bacteria fail to grow near the organisms from the soil. Review the flow chartbefore proceeding.
MATERIALS:
tube with bacterial suspension
agar plates A and B from Part I
inoculating loop
germicide
packets of sterile cotton balls,
wrapped in aluminum foil
PROCEDURE:
alcohol, with cups or small beakers for
distribution
aluminum foil, for disposing of used cotton
balls
glass-marking pencil
forceps
gas burner
1. Clear the work table and wipe it down with germicide solution.
2. Select a tube of bacterial suspension.
'3. Obtain plates A and B prepared in Part I. Observe the growth on the plate
marked "soil sample." Two kinds of organisms should be visible on the surface:
bacteria and fungi. Fungi consist of many delicate thread-like strands. They are
often markedly elevated above the surface of the agar. Soil bacteria, on the other
hand, are usually solid, round masses, often with a shiny, white or yellow appear-
ance. Each round mass of bacteria on the surface of the agar is a colony. Bac-
terial colonies are usually no more than 3 mm across (after 24 hours of incubation).
(Wien a single bacterium lands in the agar it multiplies until it forms a visible
mass--a colony.) Fungal colonies, on the other hand, may be 10 mm across or larger.
4. There are colonies growing inside the agar, and one cannot tell whether
these are bacteria or fungi. Estimate the total number of colonies in the plate,
including both those on the surface and those inside the agar. (1) Estimate the
number of bacterial and the number of fungal colonies on the surface of the agar.(2) Which are in greater number on the surface, the bacterial or fungal colonies?
(3) Do your estimates suggest that the number of microorganisms in soil is hundreds
per ml of soil, thousands per ml of soil, hundreds of thousands per ml of soil, or
more? (4) (Hint: assume that each colony arose from one microbe and also remember
that you diluted the soil in water 1,000 times before putting 1 ml of it in the agar.)
5. Select any two colonies to test for antibacterial activity. You may choose
two colonies of bacteria, two of fungi, or one of each. Use a glass-marking pencil
to mark the underside of the Petri plate at the place where each colony you select
69
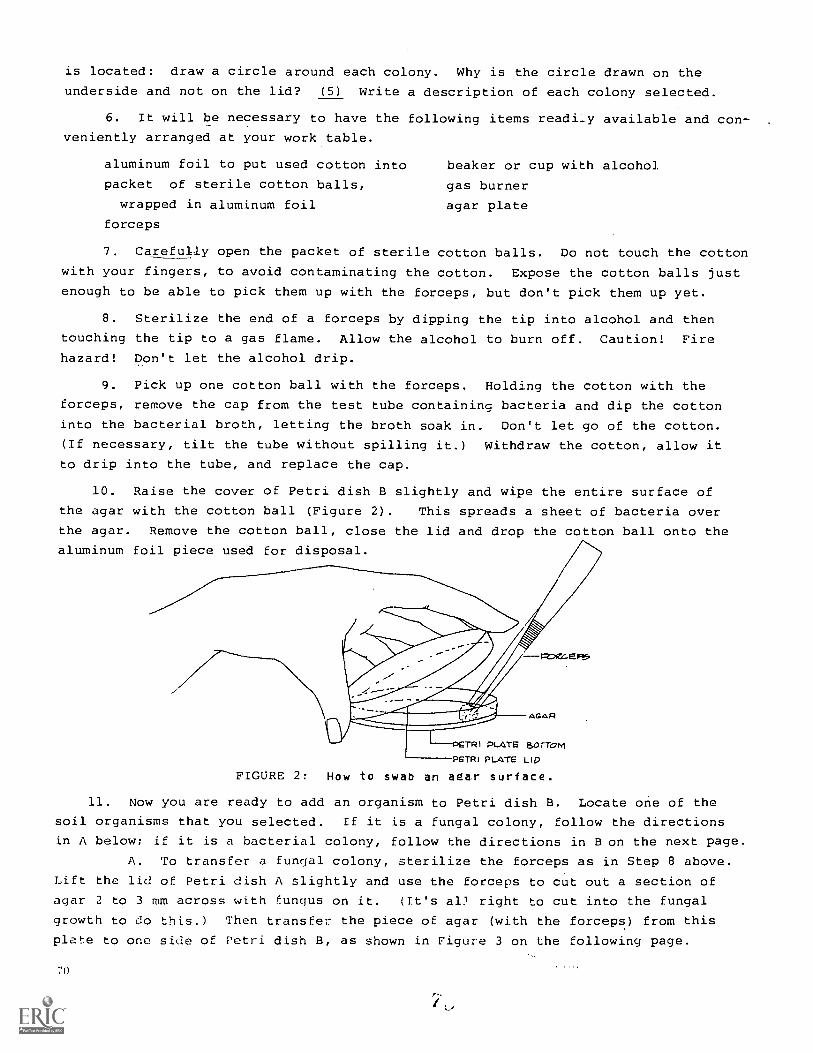
is located: draw a circle around each colony. Why is the circle drawn on the
underside and not on the lid? (5) Write a description of each colony selected.
6. It will be necessary to have the following items readi_y available and con-
veniently arranged at your work table.
aluminum foil to put used cotton into
packet of sterile cotton balls,
wrapped in aluminum foil
forceps
beaker or cup with alcohol
gas burner
agar plate
7. Carefully open the packet of sterile cotton balls. Do not touch the cotton
with your fingers, to avoid contaminating the cotton. Expose the cotton balls just
enough to be able to pick them up with the forceps, but don't pick them up yet.
8. Sterilize the end of a forceps by dipping the tip into alcohol and then
touching the tip to a gas flame. Allow the alcohol to burn off. Caution! Fire
hazard! Don't let the alcohol drip.
9. Pick up one cotton ball with the forceps. Holding the cotton with the
forceps, remove the cap from the test tube containing bacteria and dip the cotton
into the bacterial broth, letting the broth soak in. Don't let go of the cotton.
(If necessary, tilt the tube without spilling it.) Withdraw the cotton, allow it
to drip into the tube, and replace the cap.
10. Raise the cover of Petri dish B slightly and wipe the entire surface of
the agar with the cotton ball (Figure 2). This spreads a sheet of bacteria over
the agar. Remove the cotton ball, close the lid and drop the cotton ball onto the
aluminum foil piece used for disposal.
1:;=42Z.Erob
AGAR
RG-TRIPLATE BOTTOM
FVTRIPLATE LIP
FIGURE 2: How to swab an agar surface.
11. Now you are ready to add an organism to Petri dish B. Locate one of the
soil organisms that you selected. If it is a fungal colony, follow the directions
in A below; if it is a bacterial colony, follow the directions in B on the next page.
A. To transfer a fungal colony, sterilize the forceps as in Step 8 above.
Lift the lid of Petri dish A slightly and use the forceps to cut out a section of
agar 2 to 3 mm across with fungus on it. (It's al) right to cut into the fungal
growth to do this.) Then transfer the piece of agar (with the forceps) from this
plate to one side of Petri dish B, as shown in Figure 3 on the following page.
70
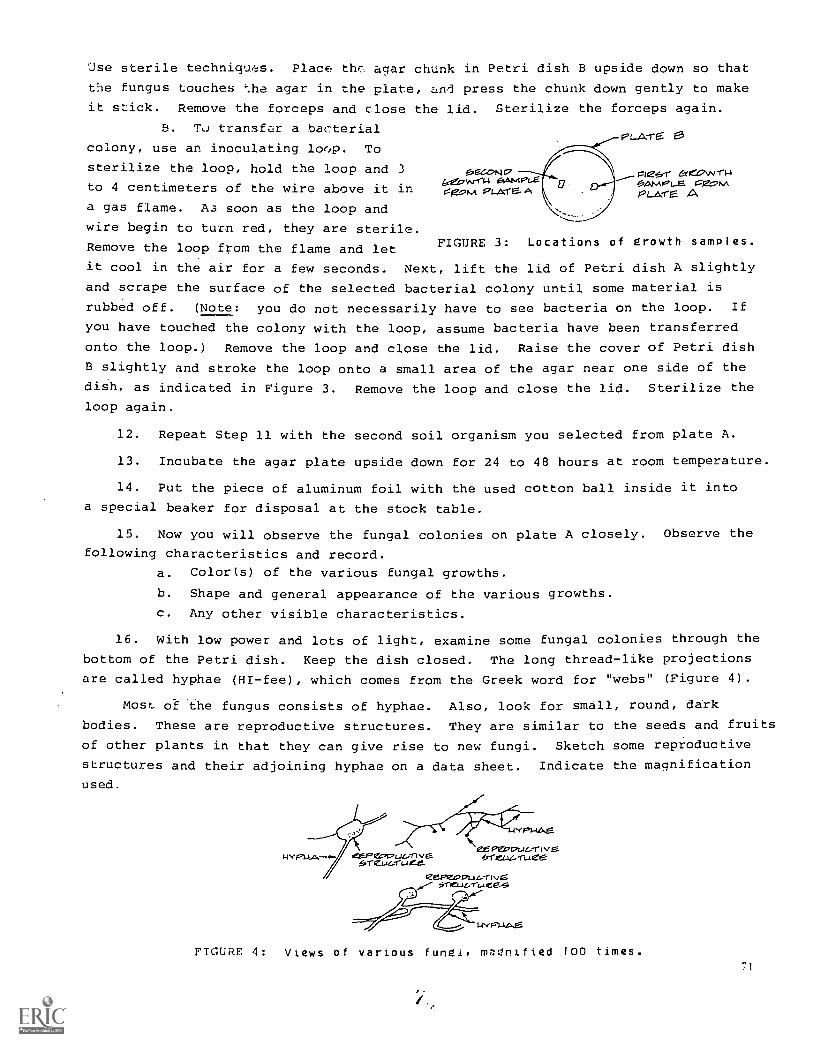
ase sterile techniqus. Place thr: agar chunk in Petri dish B upside down so that
the fungus touches the agar in the plate, and press the chunk down gently to make
it slick. Remove the forceps and close the lid. Sterilize the forceps again.
B. To transfer a .bacterial
colony, use an inoculating lor,p. To
sterilize the loop, hold the loop and 3
to 4 centimeters of the wire above it in
a gas flame. As soon as the loop and
wire begin
Remove the
it cool in
and scrape
to turn red, they are sterile.
loop from the flame and let
the air for a few seconds. Next, lift the lid of Petri dish A slightly
the surface of the selected bacterial colony until some material is
FIGURE 3: Locations of growth samples.
rubbed off. (Note: you do not necessarily have to see bacteria on the loop. If
you have touched the colony with the loop, assume bacteria have been transferred
onto the loop.) Remove the loop and close the lid. Raise the cover of Petri dish
B slightly and stroke the loop onto a small area of the agar near one side of the
dish, as indicated in Figure 3. Remove the loop and close the lid. Sterilize the
loop again.
12. Repeat Step 11 with the second soil organism you selected from plate A.
13. Incubate the agar plate upside down for 24 to 48 hours at room temperature.
14. Put the piece of aluminum foil with the used cotton ball inside it into
a special beaker for disposal at the stock table.
15. Now you will observe the fungal colonies on plate A closely. Observe the
following characteristics and record.
a. Colorls) of the various fungal growths.
b. Shape and general appearance of the various growths.
c. Any other visible characteristics.
16. With low power and lots of light, examine some fungal colonies through the
bottom of the Petri dish. Keep the dish closed. The long thread-like projections
are called hyphae (HI-fee), which comes from the Greek word for "webs" (Figure 4).
Most of the fungus consists of hyphae. Also, look for small, round, dark
bodies. These are reproductive structures. They are similar to the seeds and fruits
of other plants in that they can give rise to new fungi. Sketch some reproductive
structures and their adjoining hyphae on a data sheet. Indicate the magnification
used.
FIGURE 4: Views of various fungi, macf.nified 100 times.71

PART III: CHECKING FOR ANTIBIOTIC ACTIVITY
INTRODUCTION:
In Part II you prepared an agar plate with bacteria and then added organisms
grown from soil. Now you will observe the plate to see whether the organisms from
the soil inhibited the growth of the bacteria. You may wish to review the flow
chart before continuing.
MATERIALS:
agar plate B (from Part II)
ruler
PROCEDURE:
1. Obtain Petri dish B.
2. Observe the plate. Look for a clear or relatively clear area around either
sample of soil organism that you added. Such a clear area is called a "zone of inhi-
bition." It results when few or no bacteria grow around the soil organism because
the soil organism produces an antibiotic that prevents the bacteria from growing.
For each soil organism record whether a zone of inhibition is present or
absent. If present, record the approximate width of the zone.
DISCUSSION QUESTIONS:
PART I:
1. At what points in th, procedure may organisms other than those in the
original soil sample have contaminated the sample? What measures could be taken to
prevent this?
2. What is agar? nutrient agar? (An encyclopedia or other reference may prove
helpful.)
PART II:
1. The organisms that grew from the diluted soil sample represent only a frac-
tion of all the living organisms that were in the sample when it was placed on. the
plate. Speculate on how this is possible.
2. If you wanted more colonies on Petri dish A, how could you change the pro-
cedure in Part I to produce them? How could you change the procedure to produce
less colonies?.3. A soil sample is diluted 5,000 times. One ml of the 'soil suspension is
then found to grow into ISO colonies on an agar plate. How many microorganisms
per ml of soil were there in the soil sample before it was diluted, assuming one
colony comes from one organism and that the agar plate was not contaminated by
other organisms?4. Bacteria and fungi on agar plates can be easily seen with the naked eye.
Why then are they often referred to as "microscopic organisms?"
5.
while. Why?
Ef fruit is left to sit, it usually becomes covered with fungus after a

PART III:
1. Were there any organisms present on your plate other than the two soil or-
ganisms and the bacteria you tested them with? If so, how is this possible?
2. What advantage is it to a soil organism to be able to produce an antibiotic
against other organisms?
LABORATORY ACTIVITY 18: TESTING ANTIBACTERIAL AGENTS
GENERAL INTRODUCTION:
The purpose of this activity is to compare the effects of some antibacterial
compounds on bacterial growth. These substances include household disinfectants,
antiseptics and laboratory chemicals.
On the first day, you will expose a sample of bacteria to an antibacterial
agent for two different lengths of time. Then after the different times you will
transfer samples of this mixture into nutrient broth. (See the flowchart on the
following page.) Those bacteria still alive after the chemical treatment will
grow well in the nutrient broth. By measuring the amount of growth on the second
day, you can tell how effective your antibacterial agent was.
You will be provided with nutrient broth that is sterile (free of microorgan-
isms). To the sterile broth, you will add the test bacteria. It is important to
use sterile techniques to ensure that no other microorganisms contaminate the nutri-
ent broth, since contamination would invalidate the conclusions. Sterile technique
involves taking special care to prevent microorganisms from the outside, such as on
dust particles, from getting into your broth. In Part I, you have the opportunity
to practice two procedures that call for sterile technique. In Part II you will
use sterile techniques in a test of antibacterial agents and in Part III you will
observe the results.
PART I: STERILE TRANSFER TECHNIQUES
INTRODUCTION:
In this part, you will practice two procedures requiring sterile technique.
Both involve transfers--one with a pipet and the other with a loop. By practicing
these techniques, you will be able to perform them more easily in Part II and in
later activities when sterile techniques are crucial to the success of the activity.
MATERIALS:
2 test tubes, 16 x 125 mm inoculating loop
2 test-tube caps, 18 mm gas burner
1-ml pipet wrapped in aluminum foil test-tube rack
250-ml beaker clock with second hand
73
ti
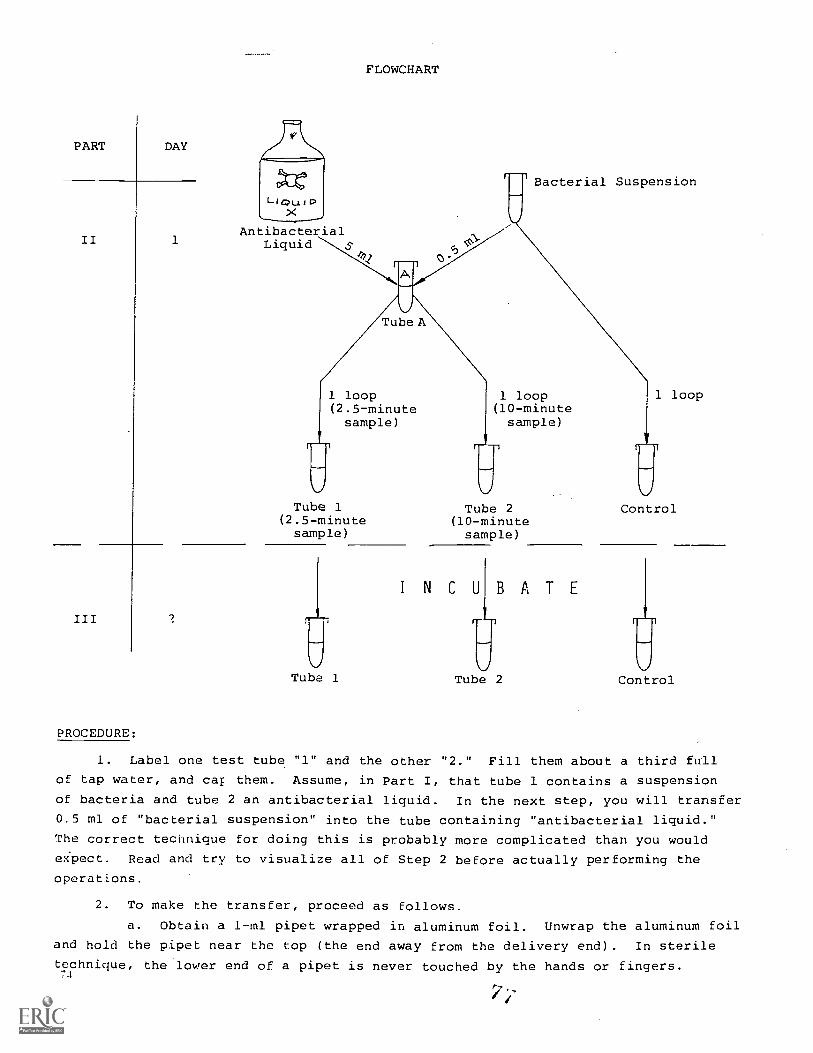
PART DAY
II
III
PROCEDURE:
1
Llou JPX
AntibacterialLiquid
17?
FLOWCHART
Tube A
1 loop(2.5-minutesample)
Bacterial Suspension
1 loop(10-minutesample)
Tube 1(2.5-minutesample)
Tube 1
Tube 2(10-minutesample)
Tube 2
A T E
1 loop
Control
Control
1. Label one test tube "1" and the other "2." Fill them about a third full
of tap water, and car them. Assume, in Part I, that tube 1 contains a suspension
of bacteria and tube 2 an antibacterial liquid. In the next step, you will transfer
0.5 ml of "bacterial suspension" into the tube containing "antibacterial liquid."
The correct technique for doing this is probably more complicated than you would
expect. Read and try to visualize all of Step 2 before actually performing the
operations.
2. To make the transfer, proceed as follows.
a. Obtain a 1-ml pipet wrapped in aluminum foil. Unwrap the aluminum foil
and hold the pipet near the top (the end away from the delivery end). In sterile
technique, the lower end of a pipet is never touched by the hands or fingers.74
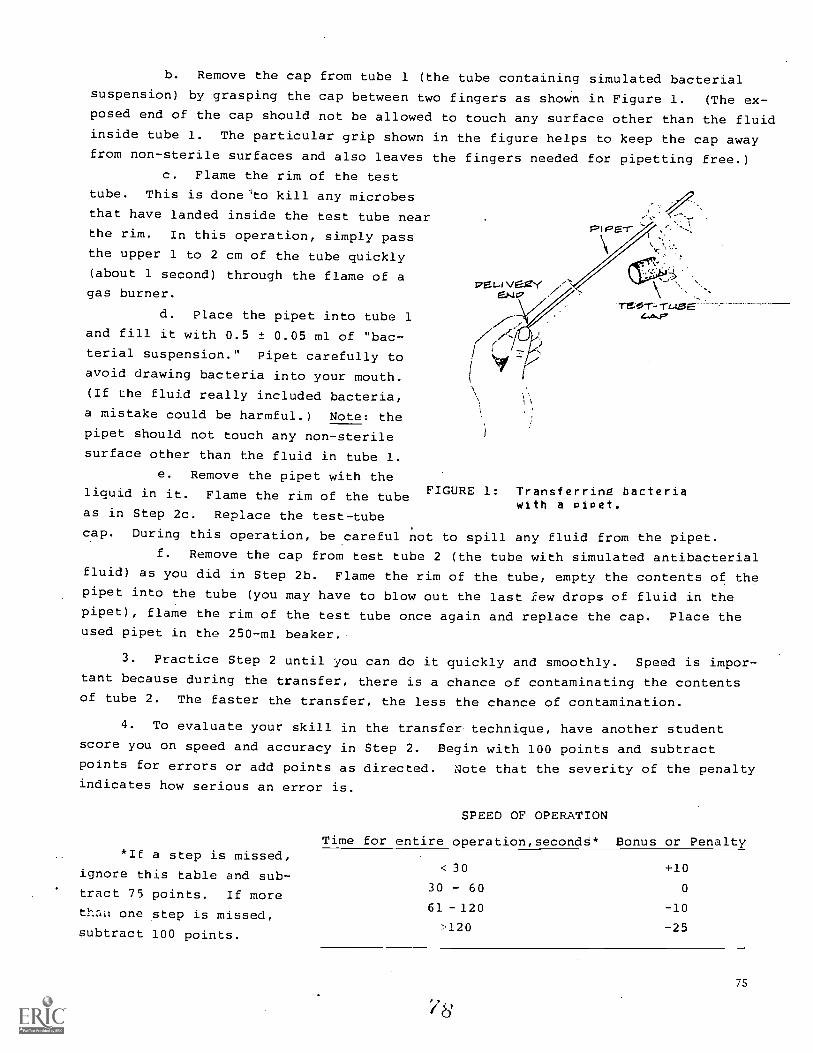
b. Remove the cap from tube 1 (the tube containing simulated bacterialsuspension) by grasping the cap between two fingers as shown in Figure 1. (The ex-posed end of the cap should not be allowed to touch any surface other than the fluidinside tube 1. The particular grip shown in the figure helps to keep the cap awayfrom non-sterile surfaces and also leaves the fingers needed for pipetting free.)
c. Flame the rim of the test
tube. This is done 'to kill any microbes
that have landed inside the test tube nearthe rim. In this operation, simply pass
the upper 1 to 2 cm of the tube quickly
(about 1 second) through the flame of a
gas burner.
d. Place the pipet into tube 1
and fill it with 0.5 ± 0.05 ml of "bac-
terial suspension." Pipet carefully to
avoid drawing bacteria into your mouth.
(If the fluid really included bacteria,
a mistake could be harmful.) Note: the
pipet should not touch any non-sterile
surface other than the fluid in tube 1.
e. Remove the pipet with theliquid in it. Flame the rim of the tube FIGURE 1:
as in Step 2c. Replace the test-tubecap. During this operation, be careful not to spill any fluid from the pipet.
f. Remove the cap from test tube 2 (the tube with simulated antibacterialfluid) as you did in Step 2b. Flame the rim of the tube, empty the contents of thepipet into the tube (you may have to blow out the last few drops of fluid in thepipet), flame the rim of the test tube once again and replace the cap. Place theused pipet in the 250-ml beaker.
Transferring bacteriawith a Pipet.
3. Practice Step 2 until you can do it quickly and smoothly. Speed is impor-
tant because during the transfer, there is a chance of contaminating the contentsof tube 2. The faster the transfer, the less the chance of contamination.
4. To evaluate your skill in the transfer technique, have another student
score you on speed and accuracy in Step 2. Begin with 100 points and subtractpoints for errors or add points as directed. Note that the severity of the penaltyindicates how serious an error is.
*IE a step is missed,
ignore this table and sub-
tract 75 points. If more
than one step is missed,
subtract 100 points.
SPEED OF OPERATION
Time for entire operation,seconds* Bonus or Penalty
30 +10
30 60 0
61 120 -10
>120 -25
75
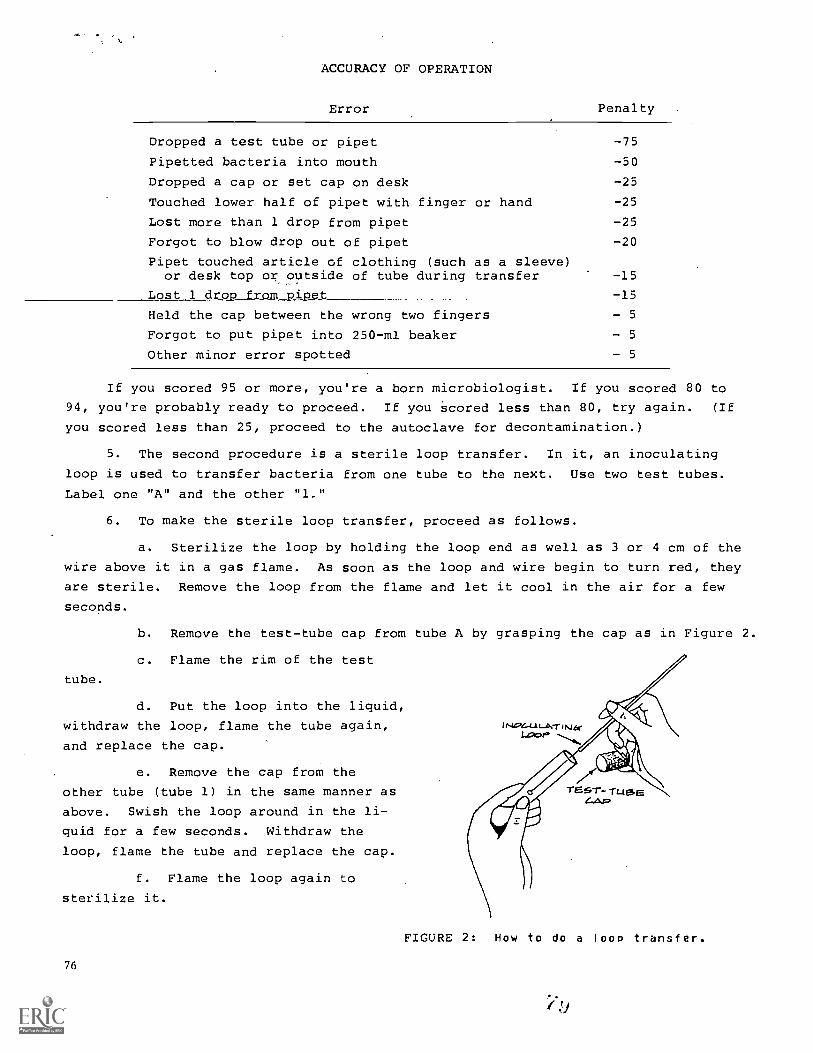
ACCURACY OF OPERATION
Error Penalty
Dropped a test tube or pipet -75
Pipetted bacteria into mouth -50
Dropped a cap or set cap on desk -25
Touched lower half of pipet with finger or hand -25
Lost more than 1 drop from pipet -25
Forgot to blow drop out of pipet -20
Pipet touched article of clothing (such as a sleeve)or desk top or outside of tube during transfer -15
Lost 1 drop from pipet -15
Held the cap between the wrong two fingers - 5
Forgot to put pipet into 250-ml beaker 5
Other minor error spotted - 5
If you scored 95 or more, you're a born microbiologist. If you scored 80 to
94, you're probably ready to proceed. If you scored less than 80, try again. (If
you scored less than 25, proceed to the autoclave for decontamination.)
5. The second procedure is a sterile loop transfer. In it, an inoculating
loop is used to transfer bacteria from one tube to the next. Use two test tubes.
Label one "A" and the other "1."
6. To make the sterile loop transfer, proceed as follows.
a. Sterilize the loop by holding the loop end as well as 3 or 4 cm of the
wire above it in a gas flame. As soon as the loop and wire begin to turn red, they
are sterile. Remove the loop from the flame and let it cool in the air for a few
seconds.
b. Remove the test-tube cap from tube A by grasping the cap as in Figure 2.
c. Flame the rim of the test
tube.
d. Put the loop into the liquid,
withdraw the loop, flame the tube again,
and replace the cap.
e. Remove the cap from the
other tube (tube 1) in the same manner as
above. Swish the loop around in the li-
quid for a few seconds. Withdraw the
loop, flame the tube and replace the cap.
f. Flame the loop again to
sterilize it.
76
FIGURE 2: How to do a 100P transfer.
7. Practice Step 6 until you can do it smoothly and quickly. You may wish to
devise a scoring system similar to the one in Step 4 for evaluating your technique.
If so, keep in mind that the loop transfer should only take about half as much time
as the pipet transfer.
PART II: EXPOSING BACTERIA TO AN ANTIBACTERIAL AGENT
INTRODUCTION:
In this part, as shown in the flOwchart, you will mix bacteria with an anti-
bacterial agent for different lengths of time and then transfer samples to nutrient
broth. Review the flowchart before proceeding.
MATERIALS:
antibacterial agents 10-ml pipet, sterile (wrapped)
test tube, 16 x 125 mm 1-ml pipet, sterile (wrapped)
test-tube cap glass-marking pencil
empty capped test tube, sterile, test-tube rack
16 x 125 mm inoculating loop
3 capped test tubes containing gas burner
nutrient broth, sterile, 16 x 125 mm germicide
PROCEDURE:
1. Disinfect (clean) a large area of the table top as in Laboratory Activity
17. You may wish to review the Warning at the end of the General Introduction to
Laboratory Activity 17.
2. In the uncapped test tube, obtain about 6 ml of an antibacterial liquid;
either an antibacterial agent provided or one you have brought. Then cap the tube.
In this activity, assume that this fluid is sterile and that sterile techniques are
not needed yet. (If you have brought a liquid that is normally diluted before use,
such as a household disinfectant, then first make the dilution that the label calls
for.) Record the name and description of the antibacterial agent, its concentration
(if given) and any dilutions made.
3. Unwrap the sterile pipet packet slightly so that the ends you put your mouth
to are exposed (not the delivery ends). Remove the 10-ml pipet and close the packet.
Using the 10-ml pipet, pipet 5 .1- .5 ml of the liquid into the empty sterile capped
test tube. (Use sterile techniques.) Label this tube "A."
4. Now you will add bacteria to tube A and incubate the tube. It will be
necessary to have the following items conveniently arranged at your work table.
3 capped test tubes containing
sterile nutrient broth
test tube of bacterial culture
test-tube rack
sterile l-ml pipet in its wrapper
gas burner
inoculating loop
77
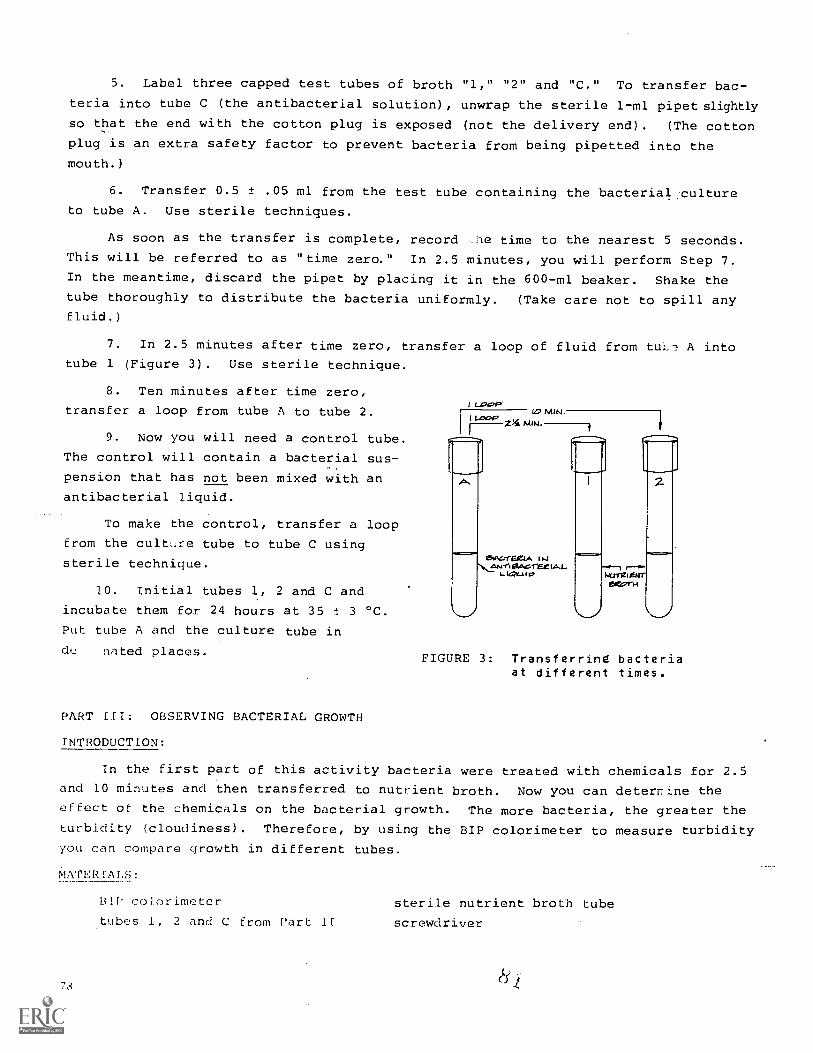
5. Label three capped test tubes of broth "1," "2" and "C." To transfer bac-
teria into tube C (the antibacterial solution), unwrap the sterile 1-ml pipet slightly
so that the end with the cotton plug is exposed (not the delivery end). (The cotton
plug is an extra safety factor to prevent bacteria from being pipetted into the
mouth.)
6. Transfer 0.5 ± .05 ml from the test tube containing the bacterial culture
to tube A. Use sterile techniques.
As soon as the transfer is complete, record he time to the nearest 5 seconds.
This will be referred to as "time zero." In 2.5 minutes, you will perform Step 7.
In the meantime, discard the pipet by placing it in the 600-ml beaker. Shake the
tube thoroughly to distribute the bacteria uniformly. (Take care not to spill anyfluid.)
7. In 2.5 minutes after time zero, transfer a loop of fluid from tth_7! A intotube 1 (Figure 3). Use sterile technique.
8. Ten minutes after time zero,
transfer a loop from tube A to tube 2.
9. Now you will need a control tube.
The control will contain a bacterial sus-
pension that has not been mixed with an
antibacterial liquid.
To make the control, transfer a loop
from the culture tube to tube C using
sterile technique.
10. Initial tubes 1, 2 and C and
incubate them for 24 hours at 35 ± 3 °C.
Put tube A and the culture tube in
de nated places.
1 LOOP'to
II Loop -r--.Z4s,MIN.
FIGURE 3: Transferring bacteriaat different times.
PART III: OBSERVING BACTERIAL GROWTH
INTRODUCTION:
In the first part of this activity bacteria were treated with chemicals for 2.5
and 10 minutes and then transferred to nutrient broth. Now you can deteruine theeffect of the chemicals on the bacterial growth. The more bacteria, the greater the
turbidity (cloudiness). Therefore, by using the BIP colorimeter to measure turbidity
you can compare growth in different tubes.
MATERIALS:
BlP colorimeter sterile nutrient broth tubetubes 1, 2 and C from Part II screwdriver
78

PROCEDURE:
1. Program the BIP for colorimetry and allow it to warm up for at least 10
minutes before use.
2. Obtain the tubes prepared in Part II.
3. Standardize the colorimeter at 100% transmittance using a sterile nutrient
broth tube as the blank.
4. Agitate tube C to distribute its contents thoroughly, but be careful to
avoid spills. Determine and record its percentage transmittance.
5. Agitate the other tubes and determine and record their percentage trans-
mittances.
6. Determine the corresponding absorbances.
7. From the absorbance values, you can estimate the actual number of bacteria
per ml of broth. The greater the absorbance, the higher the concentration of bac-
teria.
Use the standard graph to estimate the number cf bacteria per ml for each tube.
Record your results. Don't be surprised if the numbers are very high--bacterial
populations can grow to concentrations of 107 bacteria per ml or -fen higher.
DISCUSSION QUESTIONS:
1. Did you find a difference in the bacterial population at the two different
times? If so, why?
2. Was there a difference in population between the control tube and the
other tubes? Explain.
3. Were there differences in population among the various agents tested by
the class? Explai:l.
4. Why does the absorbance of a solution increase with the number of bacteria?
5. A disinfectant tested in the activity may only have had a minor effect
on population, but it could still be an excellent disinfectant for household
surfaces. How is this possible? How could you run a test to find out how well
a disinfectant kills bacteria in a practical application?
6. If someone spilled a culture of bacteria on the lab table, how would
you disinfect the area?
79
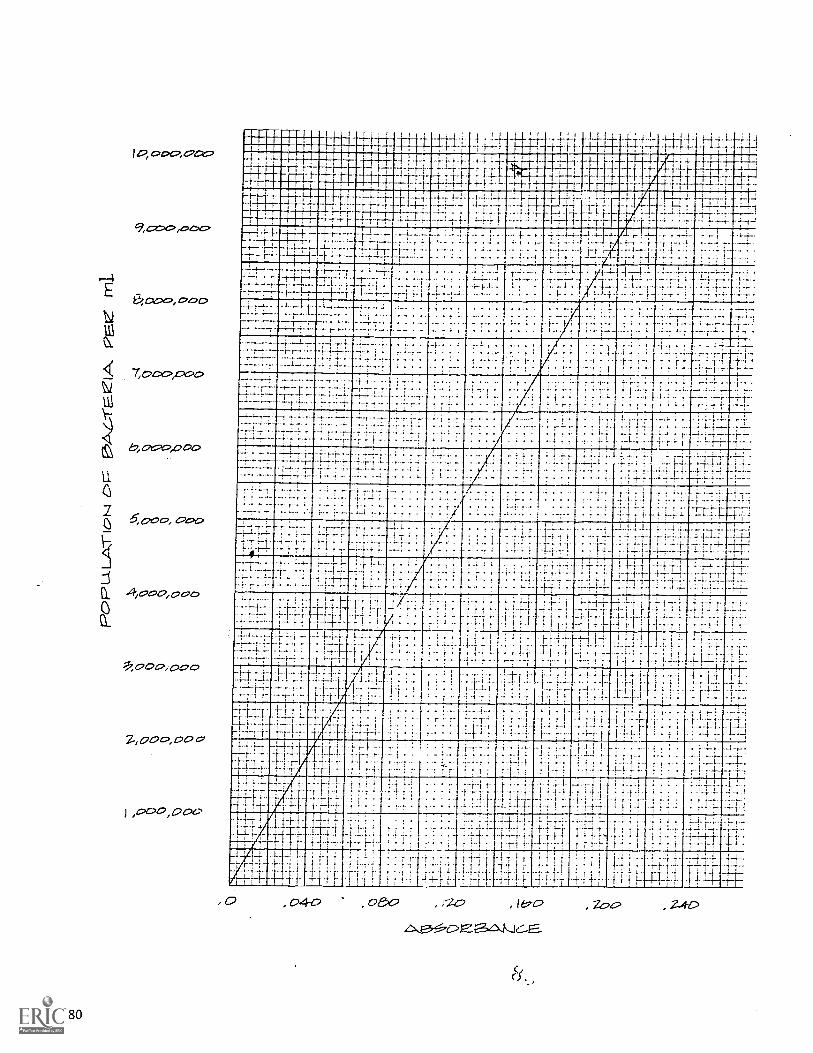
ci
ci ci
N\1 ci ci ci ci
POPU
LA
TIO
N c
,E
3Az-
-re.
etA
, t7t
e. m
L
ci
-ri-
-ri
-;-.
1r-
pti-
:'1
--
i ,i
1-1-
1":
1-1-
1 I-
MIN
1
ifL
i- ;
1--
:--i
- 4
4-1-
1-
4-:-
-,1-
1- 4
-1.7
-1-4
-;-
-.
-1.-
*-,
.
-1--
4I.4
4.
-i--
i-{-
1-
-:-.
4.-i
-4-
_.1.
4 4
I_4
4-;
:.-i
-1--
-:
:._.
t.
.'-:
4-11
;1-
1"
:. 4_
: ..
'.
,__I
!.
4t
'.
1
.4.- I ; 1
..4.1
-
f_4i
.
t. .
.1
''.'
'1
1
;1
1
if 4
.',
I
!1
I!
.1i
t_
.i_1-
1..!
'i
11
1-.
t4
t1
r1
11-
1i
11.
-
4.4
ii
.11
**-'-
''
-I
1+
4i
.t
11-
1.'
1,1
1
.
,. 1-
.
1'
-'-
1,
f I
1-1_
,--
'.1
-l
. ill lin1
-
in.-
1--
-4--
i---
r--7
-; 4
;4
1 i.-
!7-
",
-1_4
4 ,
-"--
1-.
1-1
7
1 :_
;1
1! -
. 4 .4
,4
'-
.7
_,.,.
._I
4-
i7
..1
1.
'.
'
7 4
7' .
,,
._ .
14
1.4-
'.
1--
-..4
.,_,..
-1.1
1.
'1
1.t -
tt
4 4
,_.1
- -'1
11
1-11
i 1
-4 -
,t
1-,
-4...
4_;
:'
1-*
1
i- 1
4-4-
. 4-
-,..
.:-
_4_4
,4_
1-I
-
-4,
_4,
.4-1
1'
-1-
'
I4-4
- -4
-I-{
-4-1
-,--
I- 1
--:
!
r. 1
-TT
-. -
-
14-H
-t--
-1-_
. -r-
,_
,,
r---
- _4
--1
-1
i1
.1.
i-4
-.
.
11
: -r
..t-4
----
t_4
..
, r,
,
--t-
-4-i
--__
r_.,
:t
,...
_.;_
:..
- 7-
-!!-
_.._
r t_
,H,
-,-
-t
'1
_f_
---r
--1
1'
i
i-r,
i7
''
!ii-
;-1
1.'
-1.
..
.....
I'
1T
;;
-, 4
--1-
:.:1.
_.;
---
4-I
I7I
It
1-.-
4...
;.
r;
:'"
,
i
-,4
; .. 4
't4
4
' t.
-,-.
4-4
4r-
11.
' '7
-4.
,
.1
44
- r
4t
1"
-7
..,1-
-;1
.4_
1:
1
.-1
4 -4
1- -T-T
.T-f
..7
1--
1--;
r -
-1"
'"-
4- 4
r -4
-
i :-i
I-4
-1--
4i
-.-
- -.
--.
---
-: -
-:
. -...
.,-
-..
: _: -
-,-
-.-
44
l_i _
1.
'-._.
..
-4_
74-
7-. .
.--.
:.-7.
-.4_
1-1,
7,-.
--1
-:.-
14-7
4.
.1-
1
f-'
'.
:_-i
_:-.
1
-' 'T
t_.
_'_-
:.:-!
,
r t-
1-1
-.:
i_,.1
-:
.'
1 4
;
..: 4
._:.
I -
,,
.,
-
:71:
: :_
- -.
-_,
-_:._
1
- -;
-1-i
-4-
.
t_f_
'4-t
.
44-
4- 4-;
1--
.,i-_
' ,
Waa
lII
-r -
-- -
,-
.:
.__-
_....
..
...-
4.-
_.. -
. .
_:...
.._
iL
...
.---
.....
.....
4...
._._
-,
T:
4T
-4 ., r.
"-'
-i.
4-7
.,-7-
,"
- '-4
--
.r
r-,-
7- -
::
"4
'"
,
-r
-
,,
,.
,'
1.
1
r -r
r1
1.:
-.
.I
;1
1-
t-r
4.
4 -,
.
-7-'-
:
,
1--r ''
r-+ _f
_4--
r:-
1-{
-1-4
.-t
..._4
.__-
.4.1
-,
- -!
-
4---
---
:--f
-' -
---.
--.,
:
-4, .
.
tt-
'I
",.-
-1-;
--t . .-.
--r
:':'',
.,-
,7
-, ,,
-,' 1
-7 -
-7
"7
..
--
-.'
--'
...; -
.1
!i
i:
..
-1'
t7
: ; .
-4
t-
, L.
,.
:
-4_
-.4_
11-
':4
._;
.7'
.-4
--.;_
_ 7-
-.
-.-
.
--
---.
-T-4
1,-7
-4--
-4 .4
-:
:-.-
---1
--.-
-4 -
.---
;4
.
.-.
. -.
4-1 .1
1
':
t -
:.
..
',.
4,
.,_
''
..
.
..
..
.
4_,
:.
:' 4
.,
'h_
:
!-;
-7
a...
.4
_;.
17
1
.:
.4
7'I-
1-
!',..
.,:. .
;:
4._.
.4.
i_ 4
_
:-.
.
-1-
11-
1-; -
r-i -
7-
-,-.
--0-
I- -4-7
-7 4
-
i- -
;--}
-,--
i-4-
-/-
_:_,
__:_
:._--
,---
-
''
-i--
-i-
:---
.
--,,-
---
--
--4-
--;-
t--i
--i
4
----
7..,
-- 1
-.
'---r
---
,--
.
!' 7
14-- ,
-i-4
,
4 .
'--
---
-!--
i-
1--
--,
---4
----
--,-
----
-;-i
--
',
.
77
.-
.
.7-
,-,
:--
'
..,..:
--
L '
1 '
-:-1
- '
:.....
_--
-I4
_f_. ,
-1-4
1-1
,--4
-4-.
.--4
-4-4
--,-
--
.. -.
.,--
- -
-- 7
.' -
11.
--!-
. 44_
4.H
. -'-!
...-.
. -i-
-7'
7-1
-7-
.....1
_,f
--4-
-!-4
--!-
---
:.
,,
'-'--
-,-
*-
_4_4
_ 4.
_
.7
7_,
,1
.4-4
4.-
---
.1-
i-i
.....,
,
..
44
..-
-7'
.. -
.!!
---
,.-
4-.
.'-' 1
-71
,
7--
--}
.
-
--f
, i
- . .
1..
.
- 7
-7 h
-1-t
..'-'
'.
4-1:
_i4
_1-1
-
:
-.' -
.1.
-+-
-7-1
--.
--1-
1-'-
__;_
_....
..-
-h
---
- --
-1
.....4
__._
r *.
- 4-
r
-7
.
-4-
!--
-7-4
-7.
..
r-i-
-
, -.4
.4.
_;_:
.,-_.
---
---i
-
'44-
4 .-
-4 -
7-.4
._,-
-
!
4 ...
,:-
.4-
4- I
-,._
4
4. ,
.;
.
111-
4
.
-!-
-!
j---
-.,
'--!
...'
' 71
";-!
" -± :
1,
;1
, :-,
-.1-
-i-
'.
-
--,
';.-4
--1
"1 1
----
1-1-
,,-
,1--
-1--
1-
.1-1
--1.
1-4
--
---
i-i-
i--4
-'
"t
:--1
-;-.
1,-
4- 4
- i -
.-4
---
'4 .
.._. I
-":"
r! -
-!.
. -:-.
--.-
-: -
4-. 1
-- {
: 4-4
-1-,
.-:
1:-
.--1
--
7.-
4.4
-:.
1
4: -
7
H.
.74,
4,-
.4-
,4,
,
:1 ,-.f
. -
4, I
;"
1
..._
......
__L
._1-
:. .
......
.i..._
._.,.
.4_
4_ ..
._...
.._. :
..
..
.4.,
,.
_:_.
;__.
_.:
:.-
.;_
,.4__
,4.
.4_1
_:
:':
_I-
,i
.1__ ...4
....n
-,.
..
4.44
, .--
4--1
-t-,
---,
-
.. -.
71_
,
..
,-.
----
, -i -
!-
1_.
7.
4..
;7
1
7-7
1.7"
-
.--.
-4
- !-
,---
tt-
---
.-
--1!
-T -
1.-
--
- -i
-,-
7--
' 4---
-1-
4,-4
-l-
--
,
11
-I:
.t.',
----
--i
.7
. tI.
+
-,-
/4
}.
i--1
-1-* t-i-
-1-
.t
-1 L
.1.
,--
7!
-, -
,:
- --
... :-.
'- .-
--,
':-
7-, .
.1-
- .4
4 ..:
-'f--
,e-
i,
_,.:_
i.1
1..
7- -
-17
-- -
-
7_1_
7 ._
44.
f4-
4- '.
., :
4-,
4.4_
4 _.
.-1
i-
.- I
-
.4_4
.,..
-.1_
_:-.
'
-. i-
7411
11--
,-, -
1..
_.__
._f_
:_1
+-4
r.
t-r+
+ -
1'4-
:.1-.
...,
It_
;
4 --
-rr
11-
'-
4"
..,.
,.
7i-
r.-j
- t
- 4-
1-1-
:-
.,
.' -!'
- 1-
i-
-r--
-1--
'.._.
....
::
--;
'4-
4 i-
--
--4-
'--
,...
.....
! '
,-4-
-, 4
--4
-4-4
-r -
1-
....
" -
..._
:_I
S
:-.
1.-.
.-
''- ' ,
..
:.:_
...1
.
1-1-
ii -
2 4
._,
4
.f.'
t. 1.
-11.
1:
'-'1
-1-
-4,
-1.
'
LT
I_L
t_
ri-r
-1-1
- j-
i*
- -1
` -
1:1
.I
11,
-:. i
:7_1
. -1-1
--
re--
..1-
--
-1t -
, I1t I
r 1
7-..
,.r
---t
-14-
-j:
4 4
1-.
, .1!-
-1-1
11
! -1
r'r
7
-41-
,1-
-jj
!j-
1 4-
4-,
11-,
1-1
-11.
-- 1
-1-
11-.
;
-1!
-r-
-i-1
-!
--. 1
-; -
'4,
--
-1H
1-1-
4-1-
*,
-1r
r:
1':
T
t-:
4;
r-r-
r..
4 .1
,-.1
'-
- -1
:- ,
- -
rr
.."-
:t
.
----
7.--
-:-
-,
,
-,-
-
--4
1-1-
-1-
-T-
-1-
.--t
-'41
'-
,
.,--4
--
-1-f
,-.
1 7
H.H
-4,
i:
.7
i
..
.
-1-1
" -
-I.-
. :_
71.
-.
I"_7
....
r-'--
T-
_1_7
_7 .2
.
-1 1
-1i
!'.
:7
1:
,
_1_, 4_
1_,
i'
.
,
-1-1
-1-!
- -
1-4-
-t1-
: '-1
- i.-
-1
..1".
. 1-;
f.. i
-r i
!1.
''
74-
'
-IL
L-
4_
LABORATORY ACTIVITY 19: TESTING THE ANTIBIOTIC ACTIVITY OF PENICILLIUM
GENERAL INTRODUCTION:
The purpose of this activ.:.ty is
vity. The mold you will use is a spE
11.1ces penicillin.
a mold (fungus) for antibacterial acti-
f Penicillium, the type of mold that pro-
In the f..s period you will spread some bacteria on the surface of nutrient
ajar and e-oi tr.e a chunk of Penicillium mold on the agar. On the second day you
will obsery: agar to see whether the bacteria have been inhibited from growing
near the Penicillium.
To ensure that no other organisms contaminate the nutrient agar, it will be
important to use sterile technique. Sterile technique will help to prevent micro-
organisms from the outside, such as on dust particles, from getting on the agar.
PART I: INOCULATION OF NUTRIENT AGAR
INTRODUCTION:
In this part the contents of a sterile tube of nutrient agar will be melted
and then poured into a Petri dish. Then, you will spread bacteria over the surfac
of the nutrient agar and add Penicillium mold.
MATERIALS:
capped test tube containing sterile forceps
nutrient agar tube with bacterial suspension
sterile Petri dish packet of sterile cotton balls, wrapped
hot water bath in aluminum foi:
germicide alcohol in a cup or beaker
paper towels aluminum foil for disposal of used
glass-marking pencil cotton balls
250-m1 beaker
PROCEDURE:
Review the Warning in the General InLroduction to Laboratory Activity 16.
2. Clean the work area as in Laboratory Activity 16, Part 1, Step 1.
3. Obtain atest tube of sterile nutrient agar and melt the agar in a boilingwater bath. (This should take about five minutes.) Do not remove the cap from th8
test tube, since this would let dust in.
4. When the agar is melted, let it cool. Directions for this procedure are
given in Laboratory Activity 16, Part 1, Step 4, for two tubes. Follow those direc-
tions, but apply them to your one tube instead.
Meanwhile, obtain a sterile Petri dish and place it on the table with the lidon top. Do not open it.
5. As soon as the agar tube has reached the proper temperature, pour the agar
into the Petri dish using sterile technique. You may wish to review the illustration
8, SI
in Laboratory Activity 16, Figure 1. Proceed as follows: remove the cap from the
tube, raise the Petri-dish lid slightly and pour the contents of the tube into thesterile Petri dish. (To keep dust out, do not remove the Petri-dish lid completely
when pouring agar into the dish.) Replace the Petri-dish lid immediately.
6. Allow about 10 minutes for the agar in the Petri dish to harden and cool.
Do not move the Petri dish while it is cooling; moving it can make the agar uneven
or lumpy.
7. Now you will add bacteria and Penicillium to the agar plate. To do this,
it will be necessary to have the following items conveniently located at your worktable:
packet of sterile cotton balls, wrappd aluminum foil
piece of aluminum foil to put used cotton balls into
forceps
beaker or cup with alcohol
gas burner
8. To coat the surface with bacteria, a sterile cotton ball will be used. The
direction:-3 for this procedure are given in Laboratory Activity 16, Part II, Steps 7,
8,9, and 10. (Step 10 mentions a Petri dish "B"--treat your Petri dish like Petridish "B.")
9. Next, Penicillium wilt be added to t1.7! Petri dish. Obtain a Petr dish
containing Penicillium mold. Sterilize the forceps as in Lab'Jratory Activity 16,
Part II, Step 8. Lift the lid of the agar plate slightly and use the forceps to cutout a 2 to 1 mm section of agar containing Penicillium mold. (It's all right to cutinto the m, : to do this.) Then use the forceps to transfer the piece of agar from
the plate onto the middle of the agar in your freshly prepared plate. Turn the agar
chunk upside down so that the mold touches the agar in the plate, and press the
chunk down gently to make it stick. Remove the forceps, close the lid and sterilizethe forceps arain.
10. Incubate your Petri dish upside down in the incubator at a temperature of35 ' 3 'C for a day or more.
IL. Dispose of the bacteria-soaked cotton ball as directed.
PART II: OBSERVATION OF PENICILLIUM AND BACTERIAL GROWTH
INTRODUCTION:
In Part I, you added Penicillium mold to bacteria on a nutrient agar plate. In
this part yea will observe the bacterial growth to see whether it has been inhibited
by the Penicillium mold.
MATERIALS:
Petri dish Cram Part I mm ruler.
PROCEDURE:
1. Obtain the Petri dish from Part I
82

2. Observe the plate. It may be helpful to hold it up to the light. Look for
a clear or nearly clear area around the Penicillium. Such a clear area is called a
zone of inhibition. It occurs when few or no microbes grow around an antibacterial
agent such as penicillin.
If a zone of inhibition is present, record the width of the clear area to the
nearest mm.
DISCUSSION QUESTIONS:
1. At which points in the activity may contaminating microorganisms have gotten
into the agar?
2. Why isn't penicillin effective against allergies?
3. If there was no zone of inhibition, speculate as tc why. (Seve-al
are possible.)
'1S
4. A Penicillium mold may be effective against bacterial T:owtt in an c:gar
plate. Yet, if penicillin were extracted from the mold and tested in animals that
have a bacterial disease, it might prove useless against the disease. Speculate as
to why.
LABORATORY ACTIVITY 20: TESTING THE EFFECTIVENESS OF ANTIBACTERIAL AGENTS
INTRODUCTION:
The purpose of this activity is to test the effectiveness of various
terial agents. The paper-disc method is used in the test. Th:. proceduri7. is siL,ilar
to the one used in hospital laboratories to determine tile mo_t effective ant.ibiot.ir
for a particular bacterium.FL'..iCHART
In the activity, bacteria are placed
on nutrient agar in the presence of paper Melt nutrient agar
discs that contain antibacterial agents. Ppur ?latesAfter a day of incubation bacterial
growth should be evident. Bacteria shouldSwab bacteria on plates
grow well everywhere on the plate except Add antibacterial r its
near the antibacterial discs. Around the incubate platesdiscs you may find clear (or nearly clear)
zones where bacterial growth has been in- Observe plates
'hibited. The size of the zone indicates
how well the antibacterial agent prevents bacterial growth; the larger the zone,
the mole effective the antibacterial agent.
MATERIALS:
broth culture of Serratia marcescens 2 sterile Petri dishes
broth culture of Staphylococcus 4 sterile filter-paper discs
aureus 2 antibacterial liquids
2 capped test :_ubes containing 2 streptomycin antibiotic discs
sterile nutrient agar 2 penicillin antibiotic discs
ti.
83

forceps gas burner
hot water bath alcohol
glass-marking pencil beaker, 50-mi
Lncubator packet of sterile cotton balls, wrapped
test-tube holder in aluminum foil
germicide aluminum foil
PROCEDURE:
1. With a glass-marking pencil, divide the bottom of each Petri dish i,to foursections (Figure 1). Do not remove the covers of the dishes. Number the sections1, 2, 3 and 4. Mark one of the dishes
"SM" (for S. marcescens) and the other
dish "SA" (for S. aureus). Label the
'tier of the dish with your initials.
2. Obtain two test tubes of sterile
nutrient agar and melt the agar in a
boiling water bath. (This takes about
five minutes.) Do not remove the caps
from the tubes; this could let in dust,
which would contaminate the agar
FIGURE 1: Labeling the Petri-dish bottoms.
3. When the agar has melted completely, use a tes' be holder to remove thetest tubes from the hot water bath. Let the tubes cool they are still hot, butnot hot enough to burn you. The agar will still be liquid. Mea'nwhile, arranye the
two sterile Petri dishes so that the lids are on top. Do not open the ?etri dishes.
4. When the agar has cooled, raise one of the Petri-dish lids slightly (see
Figure 2) and pour the contents of one of the tubes into the sterile Petri dish.
(To keep dust out, do not remove the Petri-dish lid completely when pouring agar intothe dish.) Replace the lid immediately. Rees at the pouring procedure with the
secolld ^t i _lish and agar tube.
84
(
TEST TUBE
TR% PLATE BOTTOMLPETQt PLATE COVE-g
FIGURE 2: How to pour agar.
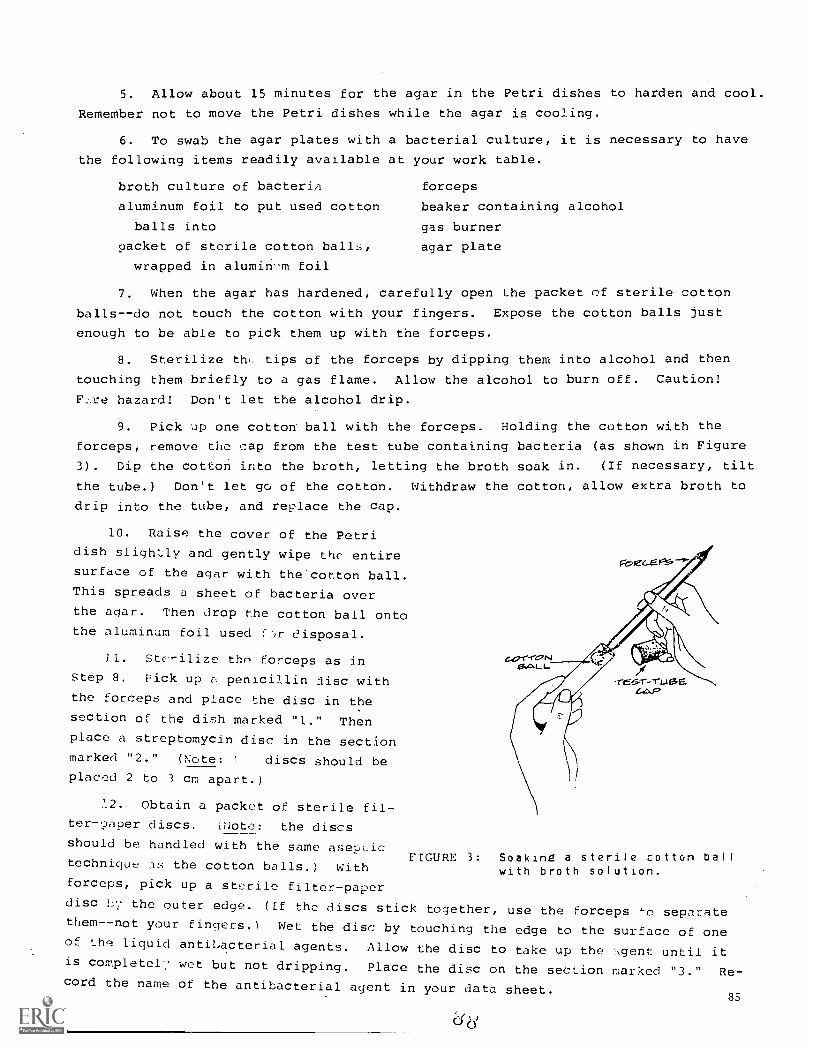
5. Allow about 15 minutes for the agar in the Petri dishes to harden and cool.
Remember not to move the Petri dishes while the agar is cooling.
6. To swab the agar plates with a bacterial culture, it is necessary to have
the following items readily available at your work table.
broth culture of bacteria forceps
aluminum foil to put used cotton beaker containing alcohol
balls into gas burner
packet of sterile cotton balls, agar plate
wrapped in alumin-m foil
7. When the agar has hardened, carefully open the packet of sterile cotton
balls--do not touch the cotton with your fingers. Expose the cotton balls just
enough to be able to pick them up with the forceps.
8. Sterilize th, tips of the forceps by dipping them into alcohol and then
touching them briefly to a gas flame. Allow the alcohol to burn off. Caution!
F..re hazard! Don't let the alcohol drip.
9. Pick up one cotton ball with the forceps. Holding the cotton with the
forceps, remove the cap from the test tube containing bacteria (as shown in Figure
3). Dip the cotton into the broth, letting the broth soak in. (If necessary, tilt
the tube.) Don't let go of the cotton. Withdraw the cotton, allow extra broth to
drip into the tube, and replace the cap.
10. Raise the cover of the Petri
dish slightly and gently wipe thE entire
surface of the agar with the cotton ball.This spreads a sheet of bacteria overthe agar. Then drop the cotton ball onto
the aluminum foil used I;r disposal.
11. Stc'ilize thn forceps as inStep 8. Pick up e, penicillin lisc with
the forceps and place the disc in the
section of the dish marked "1." Thenplace a streptomycin disc in the sectionmarked "2." (Note: 1 discs should beplaced 2 to 3 cm apart.)
!.2. Obtain a packet of sterile fil-ter-2aper discs. (Note: the discs
should be handled with the same asepticFIGURE 3: Soaking a sterile cotton ball
technique as the cotton balls.) With
forceps, pick up a sterile filter-paper
disc by the outer edge. (Ef the discs stick together, use the forceps separatethem--not your fingers.) Wet the disc by touching the edge to the surface of oneof the liquid antibacterial agents. Allow the disc to take up the ;,gent until itis completel wet but not dripping. Place the disc on the section marked "3." Re-cord the name of the antibacterial agent in your data-sheet.
85
with broth solution.
dd

13. Wet a second filter-paper disc with a different antibacterial liquid.
Place the disc on the section marked "4," and then record the name of the antibac-
terial agent.
14. Repea': Steps 6 through 13 with the second Petri dish and the second bacte-
rial culture.
15. Incubate the Petri dishes at 35 ± 3 °C for one to two days. The dishes
should be incubated upside down. This prevents condensation from confusing the
results.
16. Dispose of the used cotton balls as directed by your instruc4.or.
17. After at least a 'ay of incubation, observe the bacteria growing on the
acar. Check the areas arc.Ind the antibacterial discs for clear zones where bacte-
rial growth has been inhil ted. Note which clear zones are the largest--the agents
in these zones are the most effective in preventing the growth of the bacterium
used. Record the radii of the clear zones in mm. For each type of bacterium, rate
the effectiveness of the four. antibacterial agents.
ThISCUSSION QUESTIONS:
1. Which antibacterial agent is most effective in preventing the growth of
S. marcescens? of S. aureus?
2, Which antibacterial agent is least effective in preventing the growth of
S. marcescens? of S. aureus?
3. When a clear zone is present, why does the number of bacteria increase at
greater distances from the discs?
4. Discuss the effects of different antibacterial agents with your classmates.
t1,-.! the class data to rank all of the antibacterial agents according to the ability
J1 the agents to inhibit the growth of S. marcescens and S. aureus under the condi-
tions in your laboratory.
5. Why do th clear zones around the discs have different diameters?
6. An arv.ibioti:: that inhibits the growth of a bacterium in a Petri dish may
be inef use,: in the body to combat disease. Speculate as to why,.
'"
gh
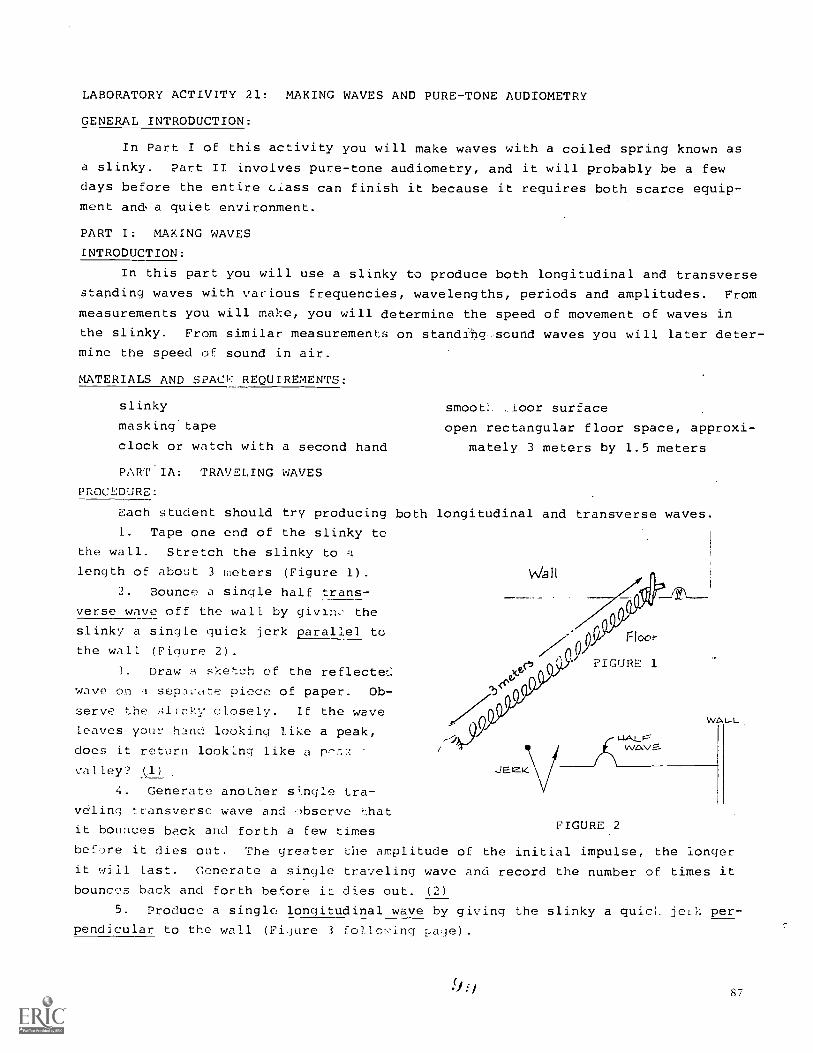
LABORATORY ACTIVITY 21: MAKING WAVES AND PURE-TONE AUDIOMETRY
GENERAL INTRODUCTION:
In Part I of this activity you will make waves with a coiled spring known as
a slinky. Part II involves pure-tone audiometry, and it will probably be a few
days before the entire crass can finish it because it requires both scarce equip-
ment and a quiet environment.
PART MAKING WAVES
INTRODUCTION:
In this part you will use a slinky to produce both longitudinal and transverse
standing waves with various frequencies, wavelengths, periods and amplitudes. From
measurements you will make, you will determine the speed of movement of waves in
the slinky. From similar measurements on standAg sound waves you will later deter-
mine the speed of sound in air.
MATERIALS AND SPACP, REQUIREMENTS;
slinky smoot!. ,loor surface
masking tape open rectangular floor space, approxi-
clock or watch with a second hand mately 3 meters by 1.5 meters
PART IA: TRAVELING WAVES
PROCEDURE:
Each student should try producing both longitudinal and transverse waves.1. Tape one end of the slinky to
the wall. Stretch the slinky to
length of about 3 meters (Figure 1).
2. Bounce a single half trans-
verse wave off the wall by givin, the
slinky a single quick jerk parallel to
the wall (Figure 2).
3. Draw a sketch of the reflected
wave on 1 separae piece of paper. Ob-
serve the i;link closely. If the wave
leaves your hand looking like a peak,
does it return looking like a r,7 : +:
valley? Cl).
4. Generate another sngle tra-
veling transverse wave and observe that
it bounces back and forth a few times FIGURE 2
before it dies out. The greater Lhe amplitude of the initial impulse, the longer
it will last. Generate a single traveling wave and record the number of times it
bounces back and forth beEore it dies out. (2)
5. Produce a single: longitudinal wave by giving the slinky a quit). jerk per-
pendicular to the wall (Figure 3 following page).
51;7 87

6. How many times can you make the
wave go back and forth? Record the maximum
number of times you were able to make it
"yo-yo." (3)
PART IB: STANDING WAVES
INTRODUCTION:
Standing waves result from the addi-
tion of waves traveling in opposite direc-
tions:'.With this set-up waves approaching and reflected from the wall will add.
In this tart you will practice making standing transverse and longitudinal waves.
The set of graphs on the following page represents a sequence of snapshots of a
standing full wave. A standing transverse wave takes the shape of a sine wave. The
amplitude of the waves varies regularly with time.
Observe that the displacement (vertical coordinate) is always zero at points
a, c and e (Figure 4). These poiats are called nodes; no mot-on occurs at nodes.
Maximum motion occurs at b and d. These points are the locations of antinodes. The
displacement at the antinodes varies from +2 to -2 times the amplitui of the origi-
nal waves.
Je2sc \ \AAA
WAVE.
FIGURE 3
VvAL-L-
Some experimentation will be necessary before you successfully generate stand-
ing waves. Here are some hints.
--Standing waves will occur only at certain frequencies of hand motion and
not others.
--To maintain a particular standing wave pattern you will need to keep to a
regular rhythm or beat of 'nand movement.
--Slower frequencies will produce 1,-nger waves; faster frequencies, shorter
waves.
PROCEDURE:
1. Generate a transverse standing half wive in the entire length of the
slinky.
2. To generate a full standing wave you must oscillate your hand at twice the
frequency required to achieve a standing half wave. Generate a full standing wave
in the slinky.
3. Increase the frequency of your hand motions and observe 11/2 standing waves,
2 standing waves and so forth until you reach your maximum.
4. Setting up a standing longitudinal wave resembles bouncing a ball against
the wall. For a half wave, the reflected compression wave will hit your hand at
the peak of your backswing. Generate a standing longitudinal half wave.
5. To generate a standing longitudinal full wave you will need to double the
frequency required for. Step 4. Generate a standing longitudinal full wave (Figure 6).
88 5.
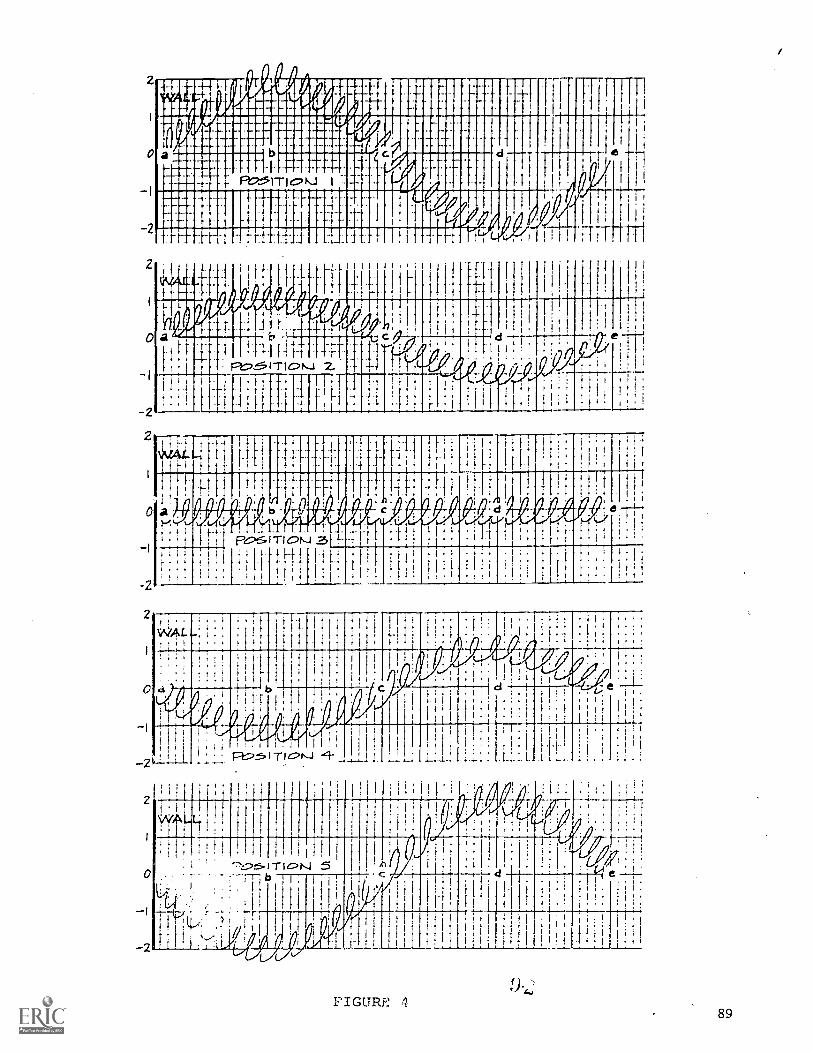
2
0
2
2
0
2
2
0
-2
2
-2
2
0
I
-2
ZIP11.4.1
thlIMPOEFalli 1111111
1111101
Iii
1
11
1.]
Li
gig P1.T.:J7.11 JP )111 I
j1I11111 1111111111111/0 I
is r t _ I III : d 1 .1
f is!
iL
/Li. It I i
.
I
71,
ii ,
t
1
1.
1
1
1
,
i .1
it11i
! t
.../.
,,,Itil
.
-1-7-7,--Ili,Hi'
!
I
t t
I
i
!
i
,
1:,..
t. l
)11
.1 '
pi ir,
a1-
1-1 4 I: F:,,e,...
rt.
til-- 4 -tTlatti
f 1-I7_.
c.....-
/-,
1
1
I I
; ,I t -
4,;!
1 ;
. i
.
' 11111 1 t I
-11 ,
4 ,
t 4 (I
i
; , f
1111I
tillI i! I
1 1'' ;;
'
.
'i f
,
i
!
1
/Ir{. -!-I !
I
9vie'
pe3S
ifilib
rill....
T oON 3
1c.)
1
i
1
1
1, T
l i 1 1
i i
I,I I
i
,I,/1 . ii
1
+
I 1
, .
1 tI !
f
r
:
1.i! ' Li f ft
t li 1! t t : r t . 1 1
1
p1 .
4 : !
I
, I
r
I
4 : t
1
i
! ! I '
,,,,t . , t
! ! .
WAL!.4!'
.
L.; i :
!
! ;
, 11; r44
1
h h I4 ,
4 4
1,
4
l',
. .
I
. . .
! 1
I
t,
1 /11
I I!;
: tt I
4 4 4,
1 4 1
/i I. i
I i.
-r- -I I
: .
I , :
t
1I1
!
. I
!
/
1 t I
.
I
Iti 1
ci 1
r I rl'ilt
.
;; 1
t
: : 1
-1
.1R=..'
fl
1p
I
,1111111
""i" _:
1
' 1 *I. _._.
I t
i__: '..
ply;...,_._ .
11 I
i Itill._
I 1
: ..... . I. .
!
.
11, I
; i I _____:
1.11 T 1 c."1"-I
. I j I.
i 1 ;I
I I.; '
1 1 ;
1
;
i. I ' ! ,
1
Li.i
i
I
' r 1 t
f I
i
; 1 1
1
i
1
. . ; .i i I .
! I !! i
1
; 1 ?I I.
', ! 1
'7"z2s.I
4 T 4 c>
I
Ni 5I
i
1 I
1
I I I
1 1 I
i 4 1
I ;
I ,
i
I 1
i1
II
I
I
I
! i
4 1 i
I
i
1
I
1
1
I
<f' I
11.
I
) I !;,I. : :191
1
dfiL 4
i I it
;
p
Vi I 1
!
t,
t I
I I
1 I 1! 1
1 i
in iI .I 1 i
FIGURE 489
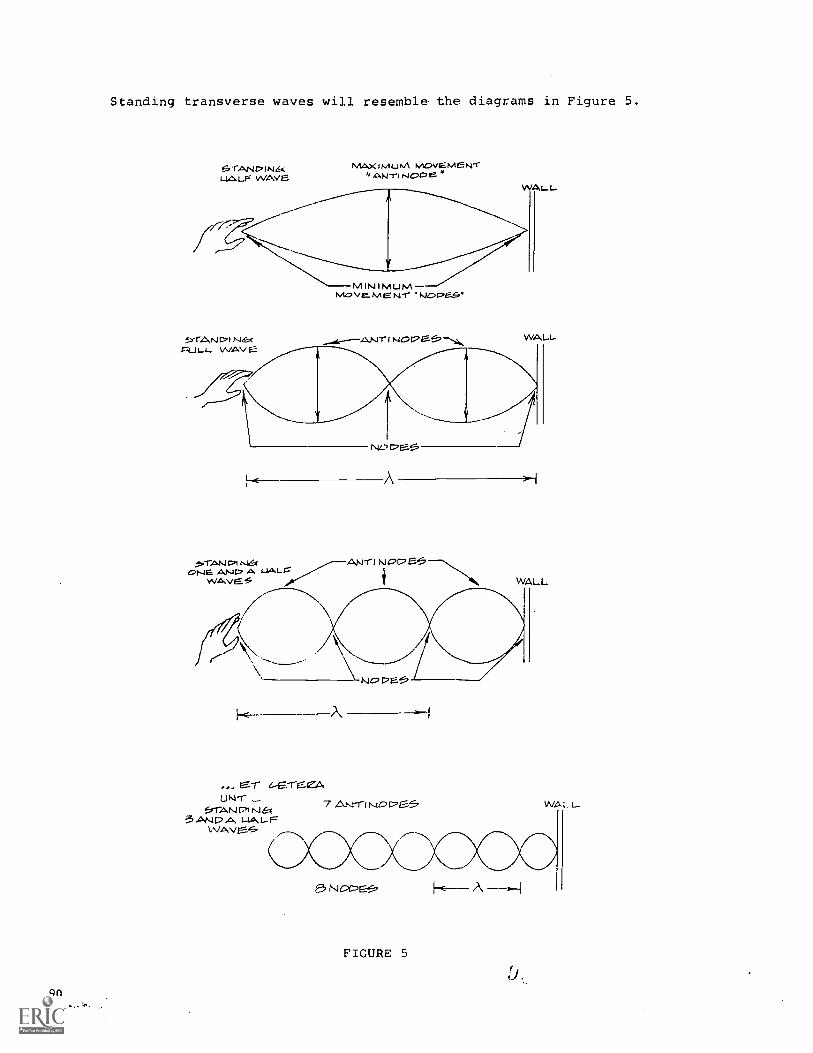
Standing transverse waves will resemble the diagrams in Figure 5.
r-A.NciN6cgL,NLF vVAve
MAXIMUM roovmENI-rhAN-rinlac,e
r-ULL_ vvAvEr.:
nib v tvi "Kbcpc7a...s"
WALL-
\Y-4Ni-' GPE-5
A
-r.A.Kirm r.6( -roNe. Ar-it".
WAVES
AN NapWALL
rA "I N6I 7 4--r1 NO 7E5SANE,
vv.eons.
90
WALL-
NODE -5
FIGURE 5
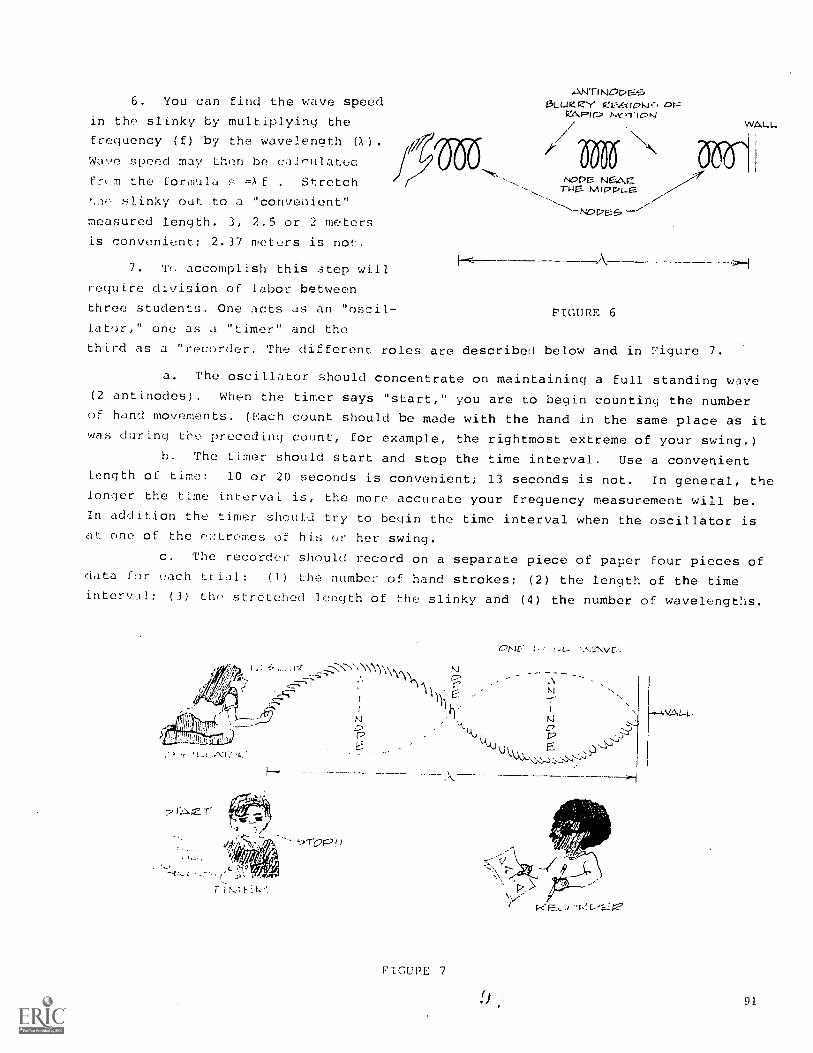
6. You can find the wave speed
in the slinky by multiplying the
frequency (E) by the wavelength ()).
WaYe speed may then be ca1f-ulatec
fr,..m the formula ,=Af . Stretch
slinky out to a "convenient"
measured length. 3, 2.5 or 2 meters
is convenient; 2.37 meters is not.
7. T' accomplish this step will
require division of labor between
three students. One acts as an "oscil- FIGURE 6lator," one as a "timer" and the
third as a "recorder. The different roles are described below and in figure 7.
ANTINOt7,,Sf3LuzZY CfrinN or-:
RAP' noc,rior.4
N4,c)M NEAPTuE MIPPLe
WALL.
a. The oscillator should concentrate on maintaining a full standing wave(2 antinodes). When the timer says "start," you are to begin counting the numberof hand movements. (Each count should be made with the hand in the same place as itwas during the preceding count, for example, the rightmost extreme of your swing.)
b. The timer should start and stop the time interval. Use a convenientlength of time: 10 or 20 seconds is convenient; 13 seconds is not. In general, thelonger the time interval is, the more accurate your frequency measurement will be.In addition the timer should try to begin the time interval when the oscillator isat one of the etremes of his er her swing.
c. The recorder should record on a separate piece of paper Eour pieces ofdata for each trial: (l) the number of hand strokes; (2) the length of the timeinterval; (3) the stretched length of the slinky and (4) the number of wavelengths.
c--.
1.1,-,
r.-' A,
.-c7I
\ N N
,-...)ifif 1
N , M.:,.2."---
Z.-, :A .,A., , ..y2 2 `.,..-1
ON(
r 1,.: 1 F.
.21-013 I I
FIGURE 7
91
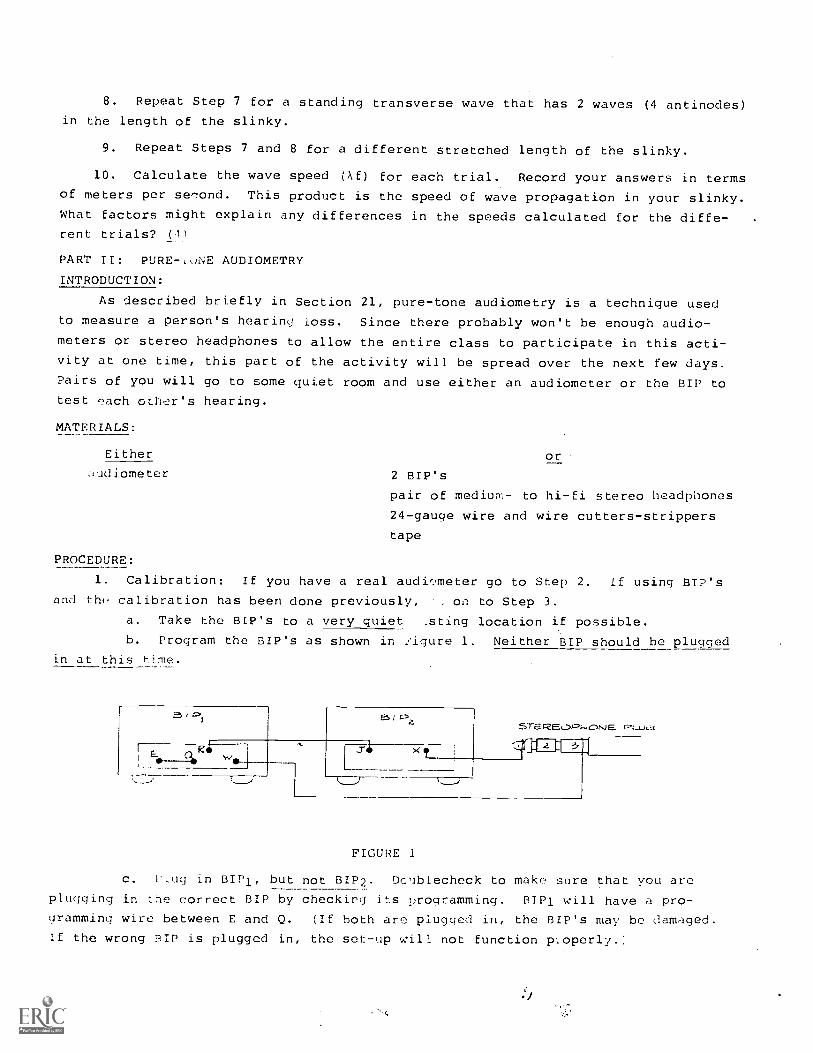
8. Repeat Step 7 for a standing transverse wave that has 2 waves (4 aninodes)in the length of the slinky.
9. Repeat Steps 7 and 8 for a different stretched length of the slinky.
10. Calculate the wave speed Ptf) for each trial. Record your answers in termsof meters per se,lond. This product is the speed of wave propagation in your slinky.
What factors might explain any differences in the speeds calculated for the diffe-rent trials? (11
PART II: PURE-',)NE AUDIOMETRY
INTRODUCTION:
As described briefly in Section 21, pure-tone audiometry is a technique used
to measure a person's hearing loss. Since there probably won't be enough audio-
meters or stereo headphones to allow the entire class to participate in this acti-
vity at one time, this part of the activity will be spread over the next few days.
Pairs of you will go to some quiet room and use either an audiometer or the BIP totest 'ach other's hearing.
MATERIALS:
Either
diometer
or
2 BIP's
pair of medium- to hi-fi stereo headphones
24-gauge wire and wire cutters-strippers
tape
PROCEDURE:
1. Calibration: If you have a real audiometer go to Step 2. If using BIP's
and the calibration has been done previously, on to Step 3.
a. Take the BIP's to a very quiet .sting location if possible.
b. Program the BIP's as shown in :'figure 1. Neither BIP should be pluggedin at this time.. _
c>I
E _r
5TE RE.4_,R1-i ONJe
ID
FIGURE 1
c. Ptig in BIP1, but not BIP2. Dc'iblecheck to make sure that you are
plugging in tne correct BIP by checking its programming. BIP1 will have a pro-
gramming wire between E and Q. (If both are plugged in, the BIP's may be damaged.
If the wrong BIP is plugged in, the set-up wilt not function pl,operly.:
92
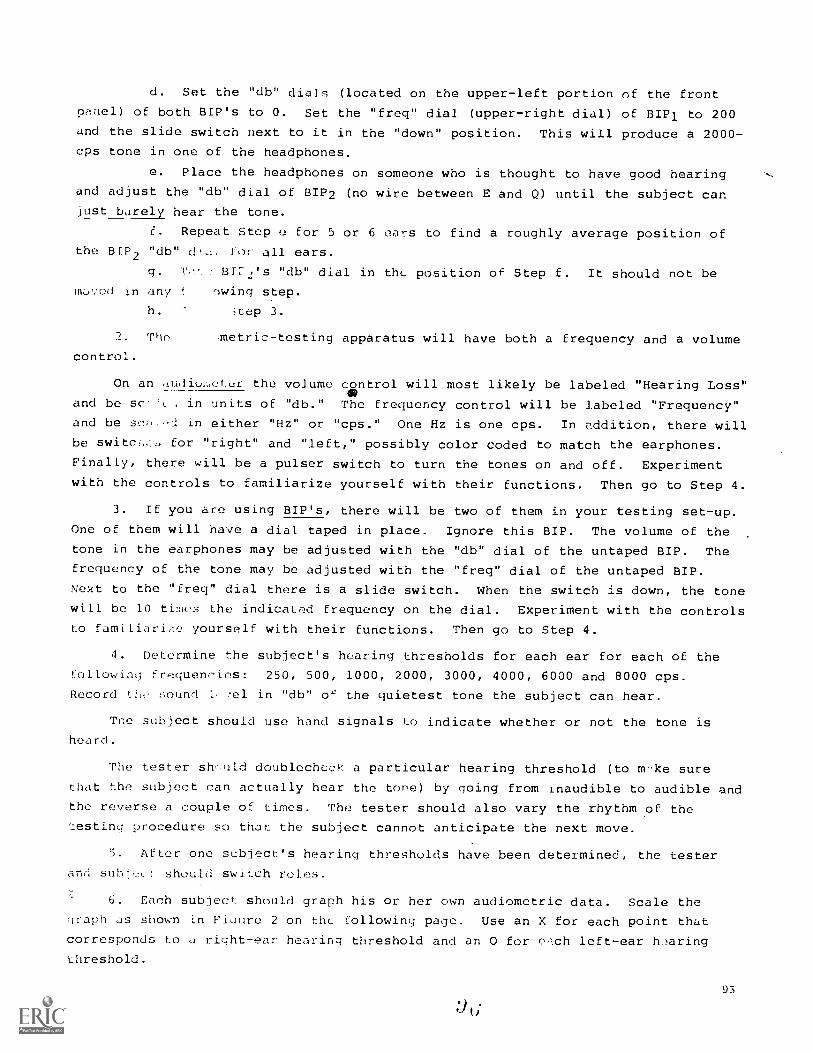
d. Set the "db" dials (located on the upper-left portion of the front
paaell of both BIP's to 0. Set the "freq" dial (upper-right dial) of BIP1 to 200
and the slide switch next to it in the "down" position. This will produce a 2000 -
cps tone in one of the headphones.
e. Place the headphones on someone who is thought to have good hearing
and adjust the "db" dial of BIP2 (no wire between E and Q) until the subject can
just barely hear the tone.
C. Repeat Step u Eor 5 or 6 ears to find a roughly average position of
the BIP2
"db" d 1')r all ears.
q. "db" dial in thL position of Step f. It should not be
moved in any ,Iwinq step.
h. itep 3.
2. The metric-testing apparatus will have both a frequency and a volumecontrol.
On an audiul,w,LeL the volume control will most likely be labeled "Hearing Loss"dO
and be sc- , in units of "db." The frequency control will be labeled "Frequency"
and be sc;1:: in either "Hz" or "cps." One Hz is one cps. In addition, there will
be switc, for "right" and "left," possibly color coded to match the earphones.
Finally, there will be a pulser switch to turn the tones on and off. Experiment
with the controls to familiarize yourself with their functions. Then go to Step 4.
3. If you are using BIP's, there will be two of them in your testing set-up.
One of them will have a dial taped in place. Ignore this BIP. The volume of the
tone in the earphones may be adjusted with the "db" dial of the untaped BIP. The
frequency of the tone may be adjusted with the "freq" dial of the untaped BIP.
Next to the "freq" dial there is a slide switch. When the switch is down, the tone
will be 10 times the indicated frequency on the dial. Experiment with the controls
to famiLiariz.e yourself with their functions. Then go to Step 4.
4. Determine the subject's hearing thresholds for each ear for each of the
folLowinq freguenries: 250, 500, 1000, 2000, 3000, 4000, 6000 and 8000 cps.
Record the t..ound el in "db" 0' the quietest tone the subject can hear.
The subject should use hand signals to indicate whether or not the tone is
heard.
The tester shc.uld doublechec! a particular hearing threshold (to mrke sure
that the subject can actually hear the tore) by going from inaudible to audible and
the reverse a couple of times. The tester should also vary the rhythm of the
'.:esting procedure so that the subject cannot anticipate the next move.
5. After ono subject's hearing thresholds have been determined, the tester
And suhj,r.,,t should switch roles.
6. Each subject should graph his or her own audiometric data. Scale the
graph as shown in Fioure 2 on the following page. Use an X for each point that
corresponds to a right-ear hearing threshold and an 0 for c.ch left -ear haring
threshold.
93
Ok;
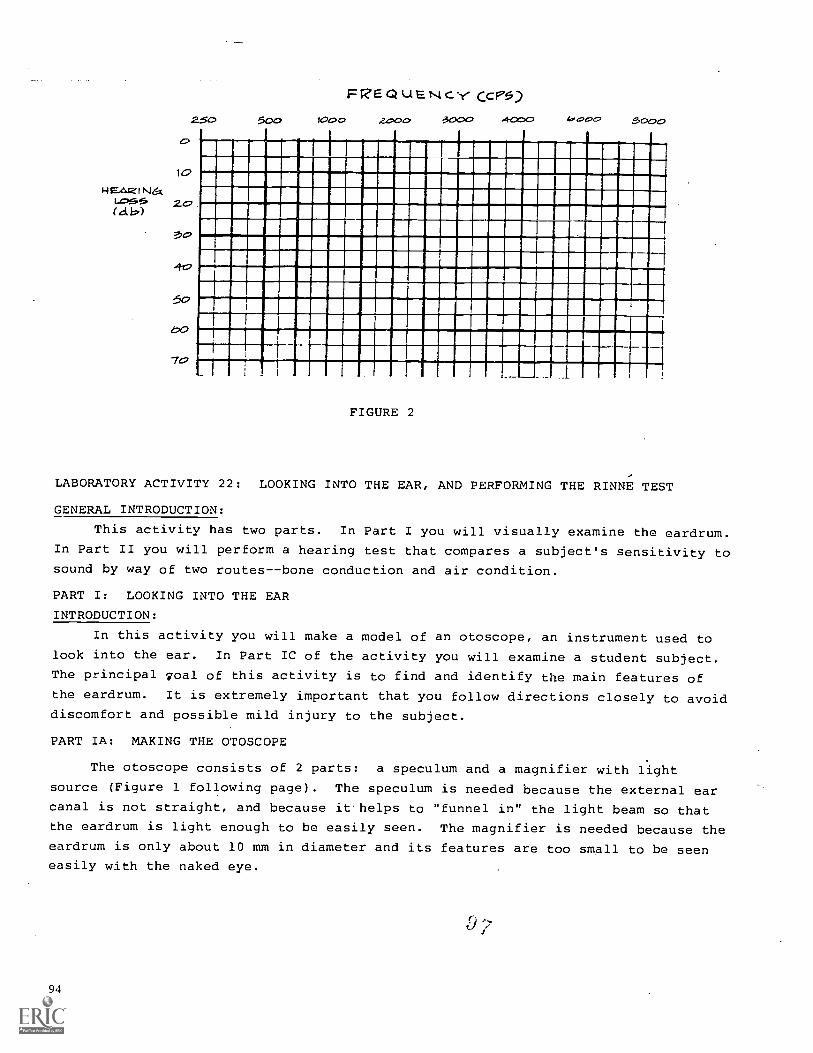
10EA. Z IN&lei z
70
FREQueNtc.-{, ccP5)500 1000 2.000 3000 4000 dodo .S000
IL11LI 1 tL1L
1 I
1
FIGURE 2
LABORATORY ACTIVITYACTIVITY 22: LOOKING INTO THE EAR, AND PERFORMING THE RINNE TEST
GENERAL INTRODUCTION:
This activity has two parts. In Part I you will visually examine the eardrum.
In Part II you will perform a hearing test that compares a subject's sensitivity to
sound by way of two routes--bone conduction and air condition.
PART I: LOOKING INTO THE EAR
INTRODUCTION:
In this activity you will make a model of an otoscope, an instrument used to
look into the ear. In Part IC of the activity you will examine a student subject.
The principal goal of this activity is to find and identify the main features ofthe eardrum. It is extremely important that you follow directions closely to avoid
discomfort and possible mild injury to the subject.
PART IA: MAKING THE OTOSCOPE
The otoscope consists of 2 parts: a speculum and a magnifier with light
source (Figure 1 following page). The speculum is needed because the external ear
canal is not straight, and because it helps to "funnel in" the light beam so thatthe eardrum is light enough to be easily seen. The magnifier is needed because the
eardrum is only about 10 mm in diameter and its features are too small to be seeneasily with the naked eye.
94
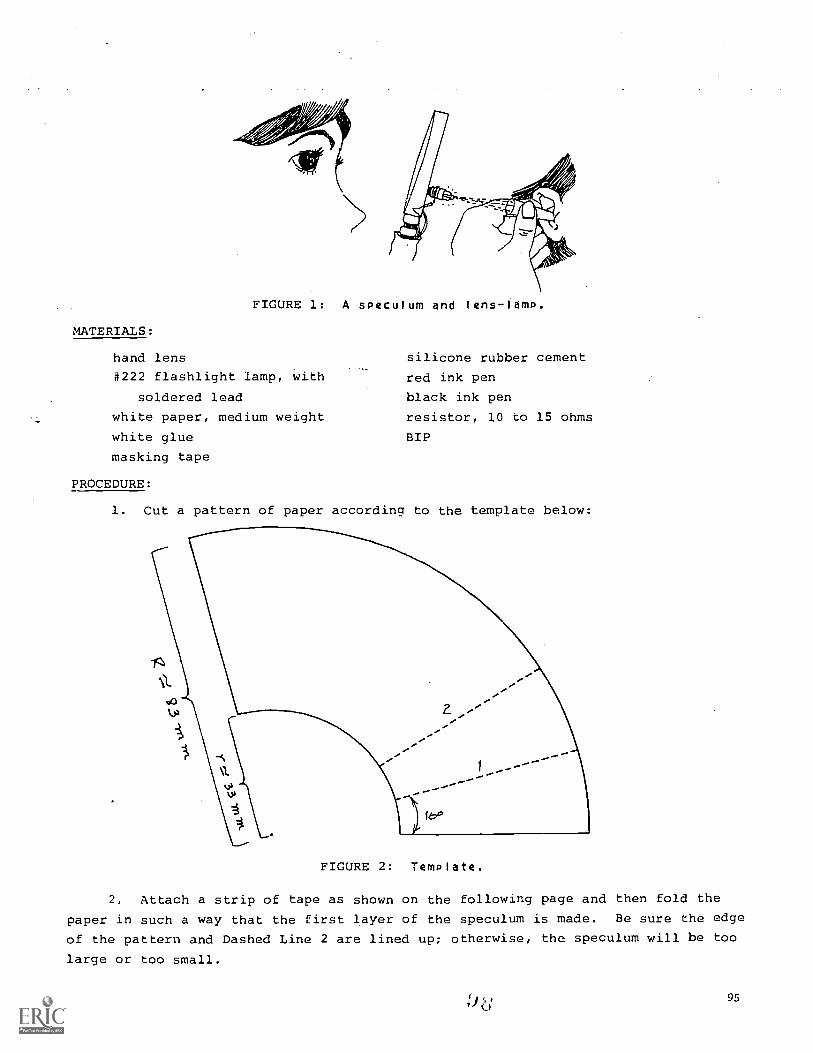
FIGURE 1: A speculum and lens-tamp.
MATERIALS:
hand lens
#222 flashlight lamp, with
soldered lead
white paper, medium weight
white glue
masking tape
PROCEDURE:
silicone rubber cement
red ink pen
black ink pen
resistor, 10 to 15 ohms
BIP
1. Cut a pattern of paper according to the template below:
FIGURE 2: Template.
2. Attach a strip of tape as shown on the following page and then fold the
paper in such a way that the first layer of the speculum is made. Be sure the edge
of the pattern and Dashed Line 2 are lined up; otherwise, the speculum will be too
large or too small.
:/a 95
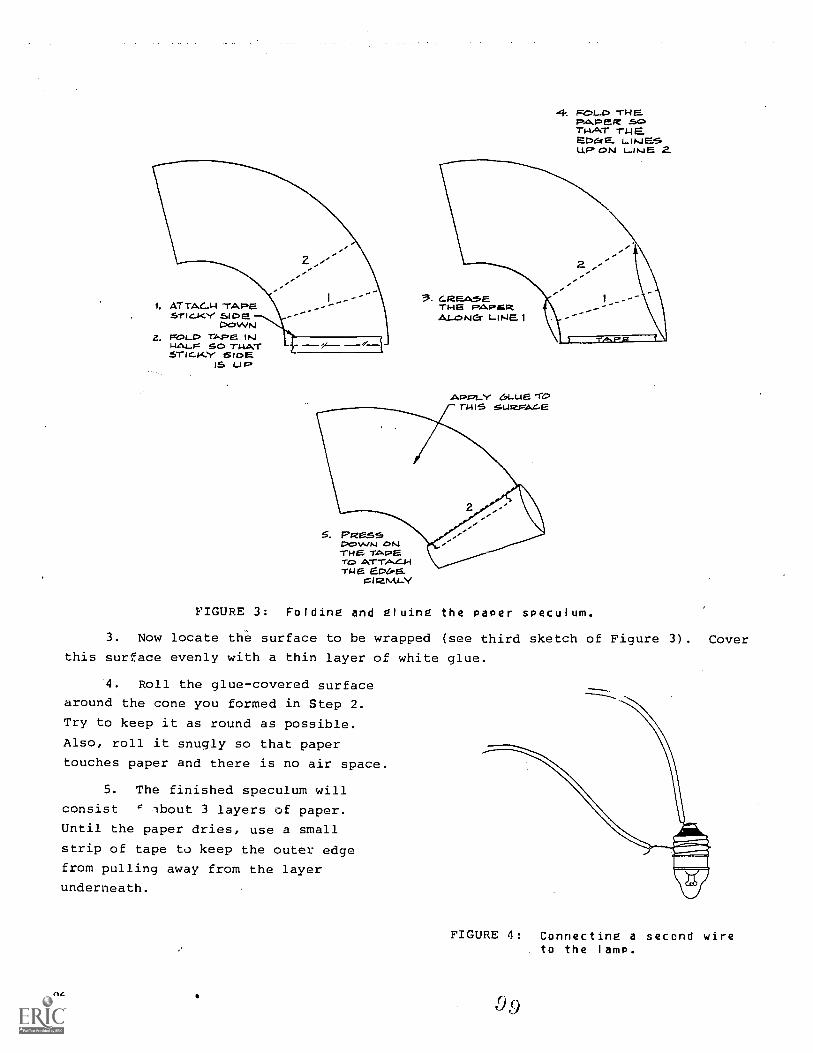
1. ATTACH 'TAPESTIC...K.V. SIDE
DOWNZ. FOLD rA,PE. IN
1-14.1. 74.41.5T1414.se 15 ID M
IS 1..J
4. FOLD THEP.41..PegeTHAT -1-1.4
ED6rE_UPON LINE 2.
APPLY GLUE 'f0rN IS suszp-A.e.e
5. PPW...SSDowns ONTHE TAPE70 ATTACHTI4E
I IznA.L.Y
FIGURE 3: Folding and gluing the paper speculum.
3. Now locate the surface to be wrapped (see third sketch of Figure 3). Cover
this surface evenly with a thin layer of white glue.
4. Roll the glue-covered surface
around the cone you formed in Step 2.
Try to keep it as round as possible.
Also, roll it snugly so that paper
touches paper and there is no air space.
5. The finished speculum will
consist 4 'bout 3 layers of paper.
Until the paper dries, use a small
strip of tape to keep the outer edge
from pulling away from the layer
underneath.
96
FIGURE 4: Connecting a second wireto the lamp.
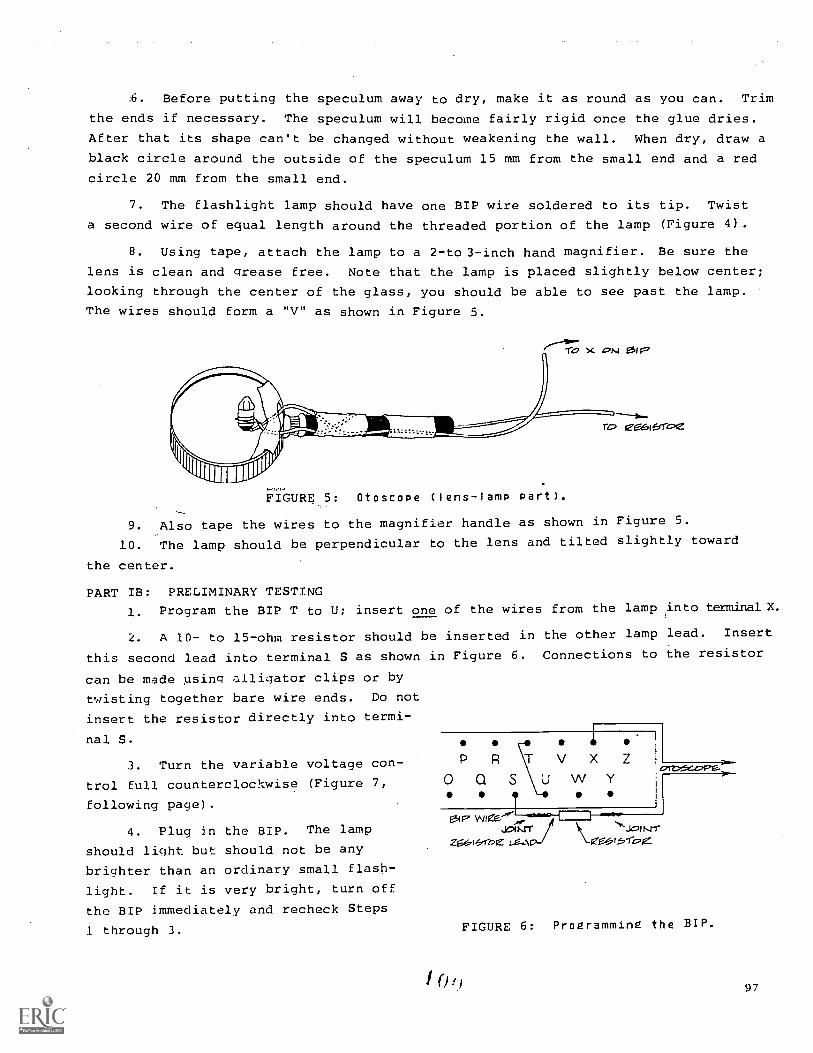
.6. Before putting the speculum away to dry, make it as round as you can. Trim
the ends if necessary. The speculum will become fairly rigid once the glue dries.
After that its shape can't be changed without weakening the wall. When dry, draw a
black circle around the outside of the speculum 15 mm from the small end and a red
circle 20 mm from the small end.
7. The flashlight lamp should have one BIP wire soldered to its tip. Twist
a second wire of equal length around the threaded portion of the lamp (Figure 4).
8. Using tape, attach the lamp to a 2-to 3-inch hand magnifier. Be sure the
lens is clean and grease free. Note that the lamp is placed slightly below center;
looking through the center of the glass, you should be able to see past the lamp.
The wires should form a "V" as shown in Figure 5.
TO X
FIGURE 5: Otoscope (lens-lamp part).
9. Also tape the wires to the magnifier handle as shown in Figure 5.
10. The lamp should be perpendicular to the lens and tilted slightly toward
the center.
PART IB: PRELIMINARY TESTING
1. Program the BIP T to U; insert one of the wires from the lamp into terminal X.
2. A 10- to 15-ohm resistor should be inserted in the other lamp lead. Insert
this second lead into terminal S as shown in Figure 6. Connections to the resistor
can be made using alligator clips or by
twisting together bare wire ends. Do not
insert the resistor directly into termi-
nal S.
3. Turn the variable voltage con-
trol full counterclockwise (Figure 7,
following page).
4. Plug in the BIP. The lamp
should light but should not be any
brighter than an ordinary small flash-
light. If it is very bright, turn off
the BIP immediately and recheck Steps
1 through 3.
P R
0 CI
V X ZC117.CaPa.W Y
007vm0a4°--1JoiNrrri 1/4 Jair,41-
0 1 ,1-1,e Z.Eh I -1-,c,rz
FIGURE 6: Programming the BIP.
97
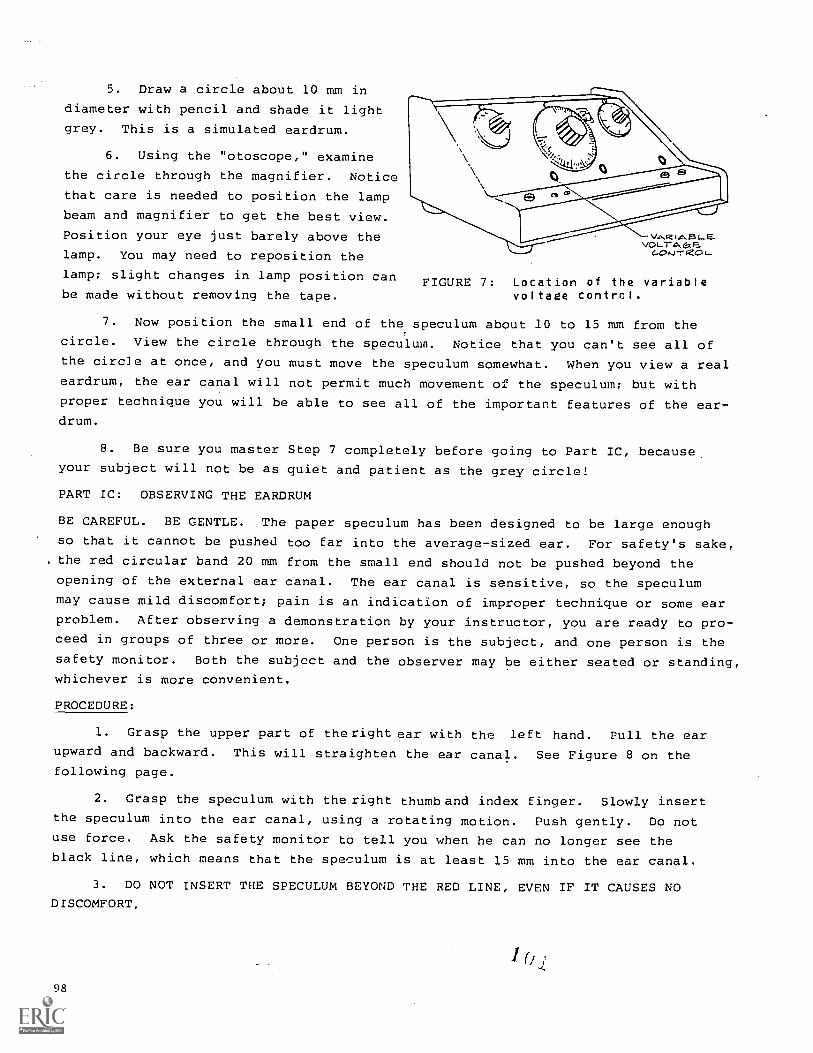
5. Draw a circle about 10 mm in
diameter with pencil and shade it light
grey. This is a simulated eardrum.
6. Using the "otoscope," examine
the circle through the magnifier. Notice
that care is needed to position the lamp
beam and magnifier to get the best view.
Position your eye just barely above the
lamp. You may need to reposition the
lamp; slight changes in lamp position can
be made without removing the tape.FIGURE 7: Location of the variable
voltage control.
7. Now position the small end of the speculum about 10 to 15 mm from thecircle. View the circle through the speculum. Notice that you can't see all ofthe circle at once, and you must move the speculum somewhat. When you view a real
eardrum, the ear canal will not permit much movement of the speculum; but with
proper technique you will be able to see all of the important features of the ear-drum.
8. Be sure you master Step 7 completely before going to Part IC, because
your subject will not be as quiet and patient as the grey circle!
PART IC: OBSERVING THE EARDRUM
BE CAREFUL. BE GENTLE. The paper speculum has been designed to be large enoughso that it cannot be pushed too far into the average-sized ear. For safety's sake,
the red circular band 20 mm from the small end should not be pushed beyond the
opening of the external ear canal. The ear canal is sensitive, so the speculum
may cause mild discomfort; pain is an indication of improper technique or some earproblem. After observing a demonstration by your instructor, you are ready to pro-ceed in groups of three or more. One person is the subject, and one person is thesafety monitor. Both the subject and the observer may be either seated or standing,whichever is more convenient.
PROCEDURE:
1. Grasp the upper part of the right ear with the left hand. Full the earupward and backward. This will straighten the ear canal. See Figure 8 on thefollowing page.
2. Grasp the speculum with the right thumband index finger. Slowly insert
the speculum into the ear canal, using a rotating motion. Push gently. Do notuse force. Ask the safety monitor to tell you when he can no longer see the
black line, which means that the speculum is at least 15 mm into the ear canal.
3. DO NOT INSERT THE SPECULUM BEYOND THE RED LINE, EVEN IF IT CAUSES NODISCOMFORT.
98
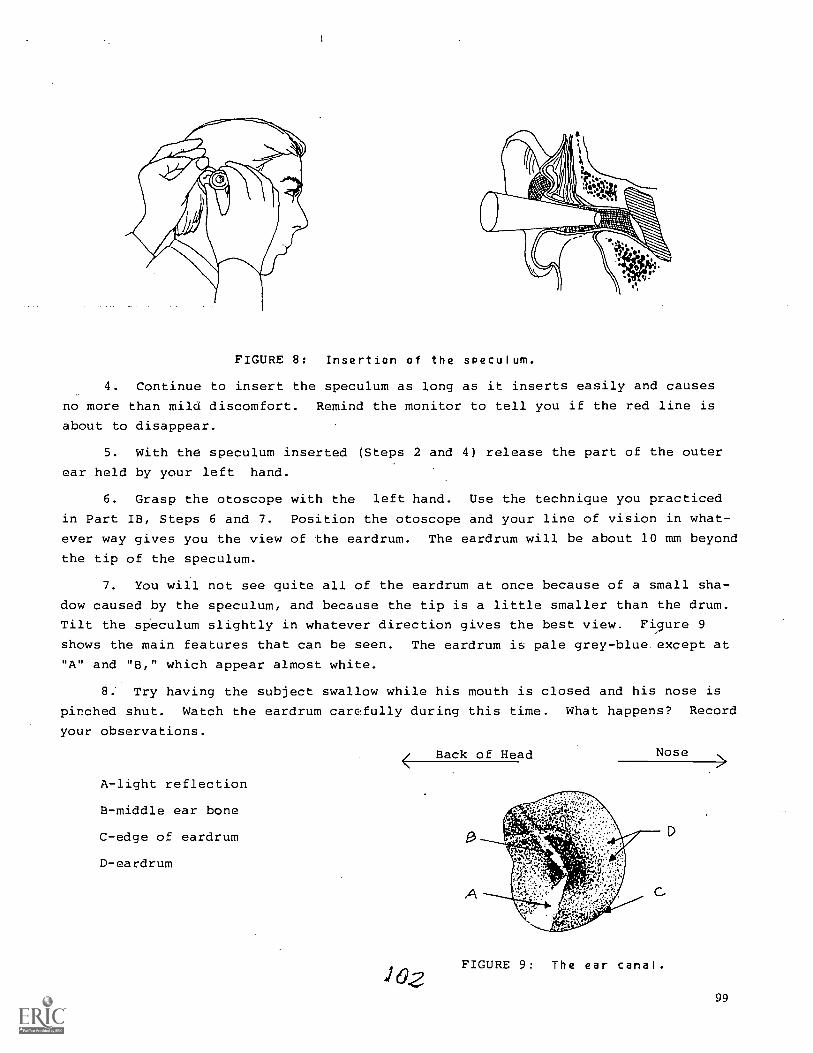
FIGURE 8: Insertion of the soeculum.
4. Continue to insert the speculum as long as it inserts easily and causes
no more than mild discomfort. Remind the monitor to tell you if the red line is
about to disappear.
5. With the speculum inserted (Steps 2 and 4) release the part of the outer
ear held by your left hand.
6. Grasp the otoscope with the left hand. Use the technique you practiced
in Part IB, Steps 6 and 7. Position the otoscope and your line of vision in what-
ever way gives you the view of the eardrum. The eardrum will be about 10 mm beyond
the tip of the speculum.
7. You will not see quite all of the eardrum at once because of a small sha-
dow caused by the speculum, and because the tip is a little smaller than the drum.
Tilt the speculum slightly in whatever direction gives the best view. Figure 9
shows the main features that can be seen. The eardrum is pale grey-blue except at
"A" and "B," which appear almost white.
8. Try having the subject swallow while his mouth is closed and his nose is
pinched shut. Watch the eardrum carefully during this time. What happens? Record
your observations.
A-light reflection
B-middle ear bone
C-edge of eardrum
D-eardrum
Back of Head Nose
FIGURE 9: The ear canal.
99

PART II: THE RINNE TEST
INTRODUCTION:
Sound waves reach the cochlea (inner ear) by either of two routes. As described
in Section 22, they may come in through the auditory canal and generate vibrations
in the eardrum which are conducted to the oval window of the cochlea by means of
the bones of the middle ear. This route is called "air conduction."
The cochlea is encased in the bones of the skull, and vibrations of the skull
bones will cause vibrations of the inner ear fluid directly. Thus the sensation of
hearing can be produced by this second route, called "bone conduction."
We hear our own voices by a combination of air and bone conduction while others
(and tape recorders) hear us by means of air conduction alone. The lower frequencies
are transmitted more easily in bone than in air. Therefore, our own voices seem
lower pitched to us than to others, and we may be surprised at the higher pitch of
our voices when we listen to ourselves on tape.
The existence of these two hearing pathways creates possibilities for the diag-
nosis of particular kinds of hearing disorders. Suppose a middle ear infection has
damaged the bones of the middle ear while leaving the cochlea. unharmed. Then bone
conduction would be unimpaired, but air conducti n would be less responsive. The
Rinne Test is a technique used by audiologists to compare air and bone conduction.
MATERIALS:
tuning forks--from one to 5 of different frequencies in the range 256 cps to
2048 cps
pencil stuck into the hole of a rubber stopper (the size of the rubber stopper
is unimportant)
PROCEDURE:
1. The Rinne Test. Hold the tuning fork by the base. Set the tuning fork
into vibration by striking one tine with the stopper-pencil mallet.
2. Place the vibrating tuning fork next to the subject's ear as shown on the
following page.
forward.
100
It is important that the tines be pointing backward and the base
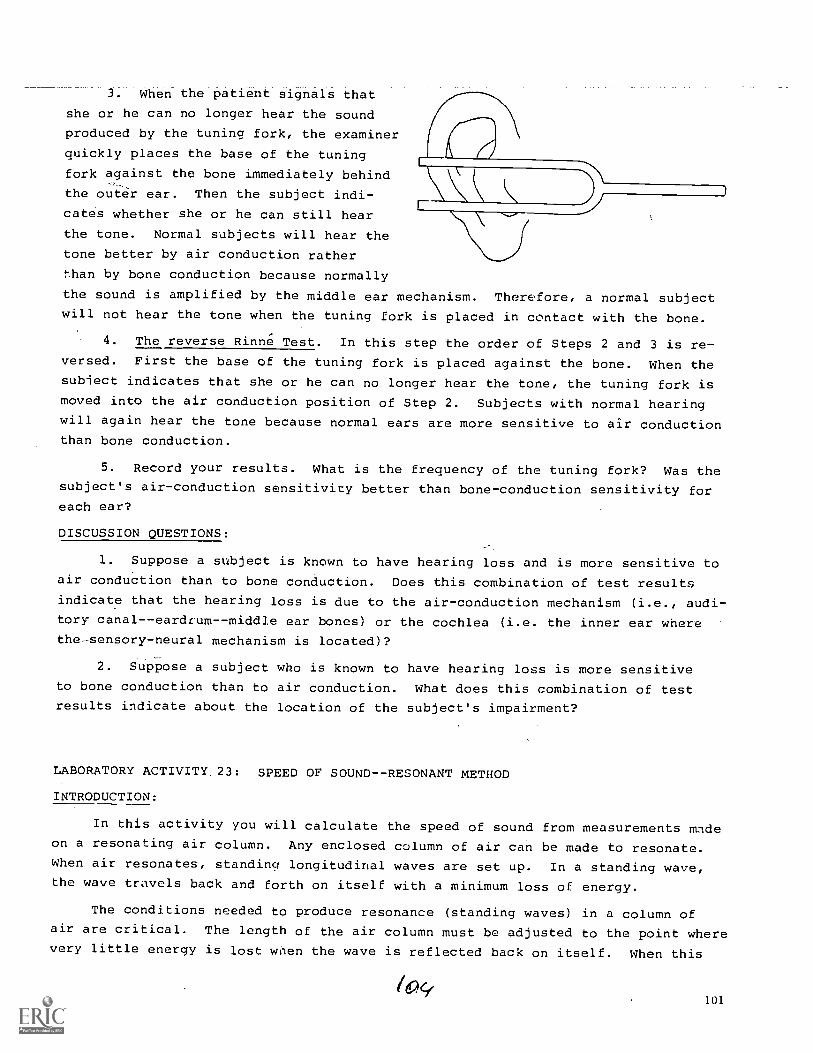
3. When the patient signals that
she or he can no longer hear the sound
produced by the tuning fork, the examiner
quickly places the base of the tuning
fork against the bone immediately behind
the outer ear. Then the subject indi-
cates whether she or he can still hear
the tone. Normal subjects will hear the
tone better by air conduction rather
than by bone conduction because normally
the sound is amplified by the middle ear mechanism. Therefore, a normal subject
will not hear the tone when the tuning fork is placed in contact with the bone.
4. The reverse Rinne Test. In this step the order of Steps 2 and 3 is re-versed. First the base of the tuning fork is placed against the bone. When thesubject indicates that she or he can no longer hear the tone, the tuning fork ismoved into the air conduction position of Step 2. Subjects with normal hearingwill again hear the tone because normal ears are more sensitive to air conductionthan bone conduction.
5. Record your results. What is the frequency of the tuning fork? Was the
subject's air-conduction sensitivity better than bone-conduction sensitivity foreach ear?
DISCUSSION QUESTIONS:
1. Suppose a subject is known to have hearing loss and is more sensitive to
air conduction than to bone conduction. Does this combination of test results
indicate that the hearing loss is due to the air-conduction mechanism (i.e., audi-
tory canal--eardrum--middle ear bones) or the cochlea (i.e. the inner ear wherethe - -- sensory- neural mechanism is located)?
2. Suppose a subject who is known to have hearing loss is more sensitive
to bone conduction than to air conduction. What does this combination of test
results indicate about the location of the subject's impairment?
LABORATORY ACTIVITY23: SPEED OF SOUND--RESONANT METHOD
INTRODUCTION:
In this activity you will calculate the speed of sound from measurements madeon a resonating air column. Any enclosed column of air can be made to resonate.When air resonates, standing longitudinal waves are set up. In a standing wave,the wave travels back and forth on itself with a minimum loss of energy.
The conditions needed to produce resonance (standing waves) in a column ofair are critical. The length of the air column must be adjusted to the point where
very little energy is lost wren the wave is reflected back on itself. When this
101
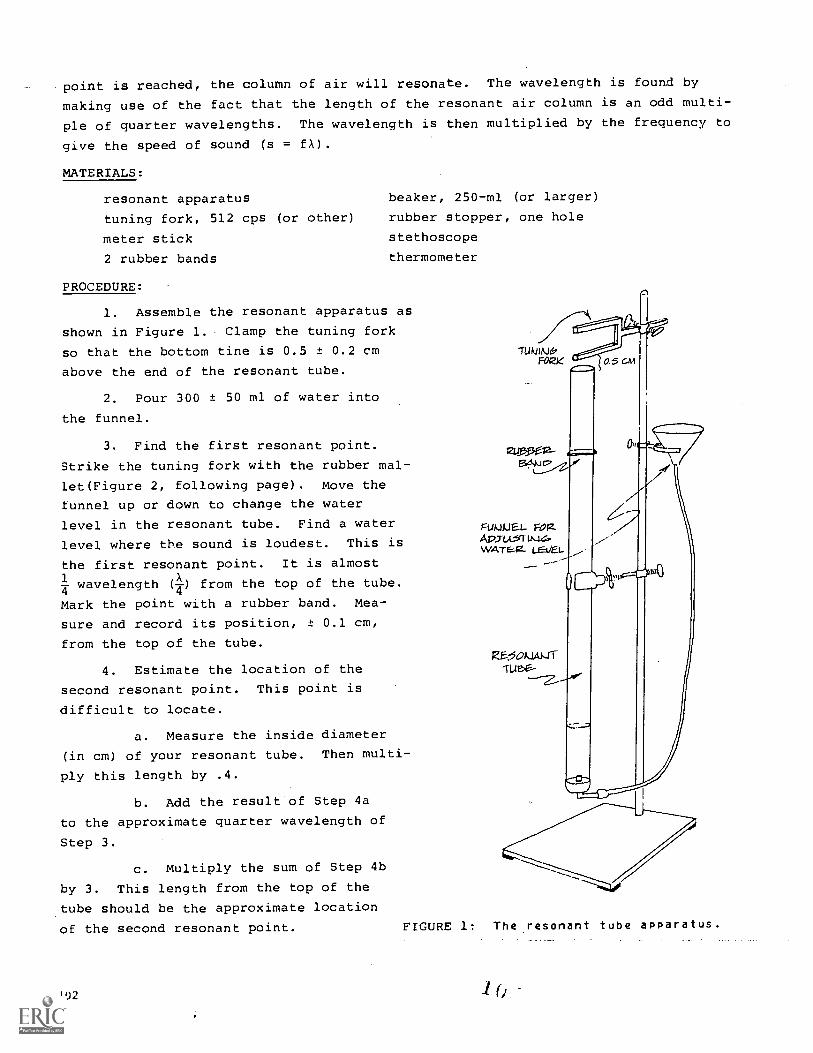
point-is-reached, the column of air will resonate. The wavelength is found by
making use of the fact that the length of the resonant air column is an odd multi-
ple of quarter wavelengths. The wavelength is then multiplied by the frequency to
give the speed of sound (s = fA).
MATERIALS:
resonant apparatus
tuning fork, 512 cps (or other) rubber stopper, one hole
meter stick stethoscope
2 rubber bands thermometer
beaker, 250-ml (or larger)
PROCEDURE:
1. Assemble the resonant apparatus as
shown in Figure 1. Clamp the tuning fork
so that the bottom tine is 0.5 ± 0.2 cm
above the end of the resonant tube.
2. Pour 300 ± 50 ml of water into
the funnel.
3. Find the first resonant point.
Strike the tuning fork with the rubber mal-
let(Figure 2, following page). Move the
tunnel up or down to change the water
level in the resonant tube. Find a water
level where the sound is loudest. This is
the first resonant point. It is almostXT wavelength (T) from the top of the tube.
Mark the point with a rubber band. Mea-
sure and record its position, ± 0.1 cm,
from the top of the tube.
4. Estimate the location of the
second resonant point. This point is
difficult to locate.
a. Measure the inside diameter
(in cm) of your resonant tube. Then multi-
ply this length by .4.
b. Add the result of Step 4a
to the approximate quarter wavelength of
Step 3.
c. Multiply the sum of Step 4b
by 3. This length from the top of the
tube should be the approximate location
of the second resonant point.
102
FIGURE 1: The resonant tube apparatus.

5. Locate the second
resonant point. It will not
be as strong as the first
point. It is perhaps easiest
to locate when the tone is
crossing the threshold of
hearing. As the water level
passes the resonant point,
the loudness of the tone will
go from inaudible to audible
and back to inaudible.
Use the stethoscope.
Hold the stethoscope beside
the tuning fOrk and point
the bell downward as much as
possible. Be sure that the
bell does nottouch the tube.
Mallet (Pencil ina rubber stopper)
Tuning Fork (A la Escher)
FIGURE 2: The rubber mallet and an unusualtuning fork.
The person listening through the stethoscope should also hold the funnel and
move the water level up and down. Others can do such things as strike the tuning
fork when requested and mark the location of the resonant point.
6. If your tuning fork has a frequency of 456 cps or more you may be able tolocate a third resonant point. If your tuning fork's frequency is less than 456cps go on to Step 9.
7. Measure the distance between the first and second resonant points, then
measure down beyond the second resonant point an equal distance. This should be
the approximate location of the third resonant point.
8. Find the third resonant point. Use the techniques described in Step 5.
9. Determine and record the wavelength of the tone produced by your tuningEork.
If you were able to locate a third resonant point, the wavelength (A) will be
the distance between the first and third resonant points.
Otherwise, A will be twice the distance between the first and second resonantpoints.
10. Calculate the speed of sound in air. The speed is equal to the frequency(f) times wavelength (A) (i.e., s = Af).
The speed of sound in air depends upon the temperature of the air--the warmer
the air, the faster the sound. Sound travels 0.6 m/sec faster for each °C rise intemperature. Measure the temperature of the air in your room and then calculate
the speed of sound in air at 20 °C.
S20° Sroomtemp.
-r,room
temp.' 20 °J (.6)
103

DISCUSSION QUESTIONS:
1. The auditory canal is known to
resonate in the range of 3,000 to 4,000
cps. Suppose that a particular auditory
canal resonates at 3,300 cps. A standing
quarter wave is set up in the canal.
Calculate the length of the canal. (As-
sume that the first resonant point is one
quarter wavelength from the entrance to
the canal, and use s = 330 m/sec).
2. The vocal tract from your vocal
cords to your mouth may be thought of as
an unevenly shaped air-filled tube, open
at one end (your mouth) and closed at the
other (your vocal cords). It is about
16.5 cm long.
a. At what frequency would a1
standing TA be set up in a uniform cir-
cular column of air 16.5 cm long? (Make
the same assumptions as in Question 1.)
b. At what frequency would a3standing TA be set up?
c. At what frequency would a5standing TA be set up?
LABORATORY ACTIVITY 24: STANDING WAVES
IN STRINGS
INTRODUCTION:
Standing waves are very important
in any study of waves. In hearing, it
is the location of an antinode in the
basilar membrane which tells us the pitch
of a sound. In speech, standing waves
are generated in the vocal cords. The
amplitude of these waves governs the loud-
ness of speech, and the frequency deter-
mines the pitch. In this activity you
will explore various factors which affect
the pitch of sounds generated by the
larynx. This information will help you
understand changes that occurred in your FIGURE 3:
voice as you grew up and how you can
change the pitch of your voice as you please.
104
First three resonant lengthsfor a given tuning fork.

In this activity you will use a BIP and speaker to generate standing waves
in a stretched string.
PART I: THE EFFECT OF TENSION, LENGTH AND LINEAR DENSITY ON THE VIBRATIONAL
FREQUENCIES OF STRETCHED STRINGS
MATERIALS:
BIP
speaker, permanent magnet type, 4 to 16 .0, impedance
short programming wire, stripped on both ends
2 long (-40 cm) wires, stripped on both ends
2 alligator clips
meter stick or other measuring device
2 paper clips
2 C-clamps or equivalent
balance
weight kit
pair of pliers (optional)
assorted strings, cords and wires of various lengths and linear densities
PROCEDURE:
1. One person should assemble the equipment as shown in Figure 1, while
another does Step 2 and a third does Step 3.
517AVEZ iz x
L. I- I 6{05.1-OCZ. I-1 PS
TALE TOP
A00.1-AT AO4m
FIGURE 1: Initial arrangement of BIP, clamps and speaker.
2. Measure and cut off 1-meter lengths of two kinds of string or other kind
of material. Then weigh them.
Record three pieces of information for each item (1) a description (e.g., "20-
lb test monofilament fishing line"), (2) its length (1 m), and (3) its mass.
The mass of a 1-meter length of string is numerically equal to its linear
density in g/meter.
105
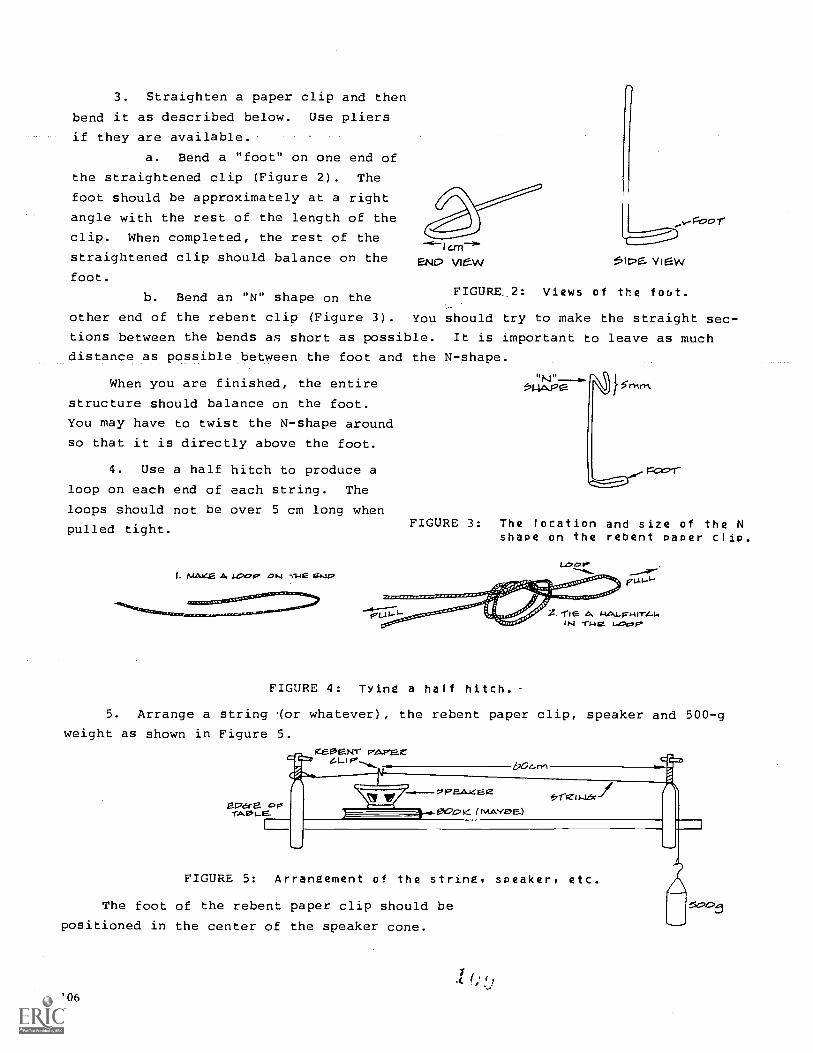
3. Straighten a paper clip and then
bend it as described below. Use pliers
if they are available.
a. Bend a "foot" on one end of
the straightened clip (Figure 2). The
foot should be approximately at a right
angle with the rest of the length of the
clip. When completed, the rest of the
straightened clip should balance on the
foot.
b. Bend an "N" shape on the
other end of the rebent clip (Figure 3). You should try to make the straight sec-
tions between the bends as short as possible. It is important to leave as much
distance as possible between the foot and the N-shape.
END view
v-r-00r-EEEE=D
ViEW.
FIGURE_2: Views of the foot.
When you are finished, the entire
structure should balance on the foot.
You may have to twist the N-shape around
so that it is directly above the foot.
4. Use a half hitch to produce a
loop on each end of each string. The
loops should not be over 5 cm long when
pulled tight.
I. MAKE A 1...nap o N -,14E 04-117
FIGURE 3: The location and size of the Nshape on the rebent paper clip.
FIGURE 4: Tying a half hitch.
5. Arrange a string or whatever), the rebent paper clip, speaker and 500-g
weight as shown in Figure 5.
El 76r e. or~
CER,e.WrP:a.Par
E,70e-n-1
FIGURE 5: Arrangement of the stringy speaker, etc.
The foot of the rebent paper clip should be
positioned in the center of the speaker cone.
106
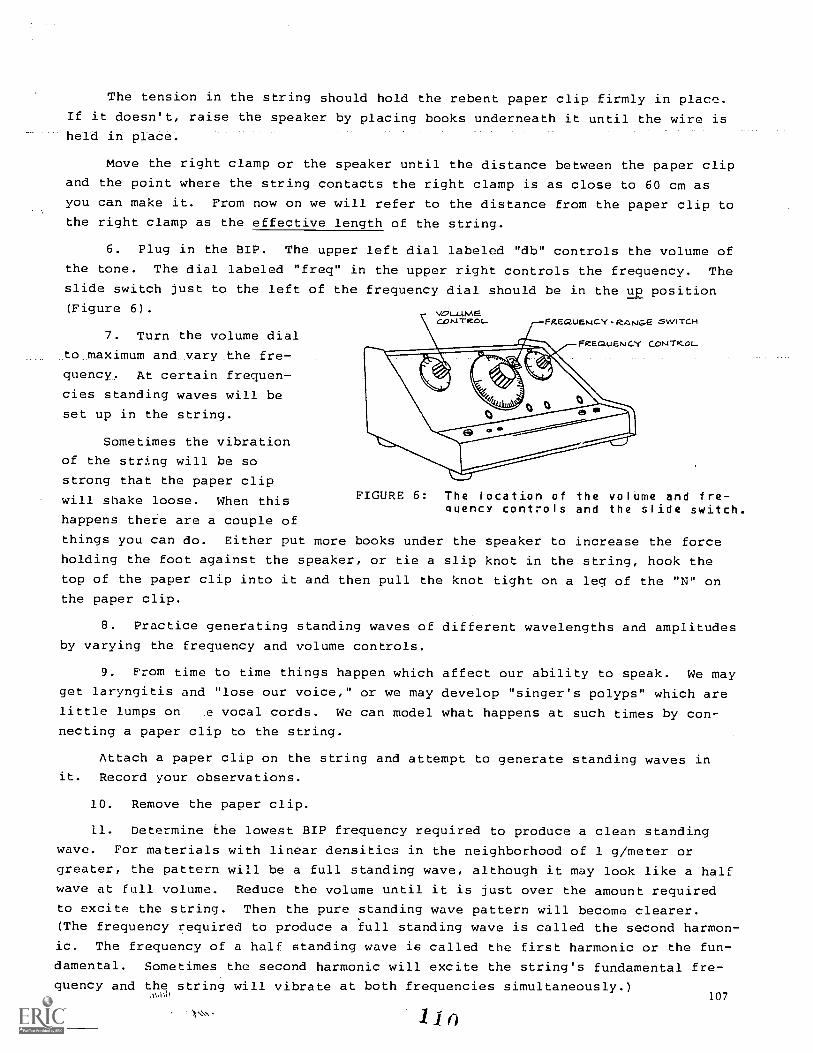
The tension in the string should hold the rebent paper clip firmly in place.
If it doesn't, raise the speaker by placing books underneath it until the wire is
held in place'.
Move the right clamp or the speaker until the distance between the paper clip
and the point where the string contacts the right clamp is as close to 60 cm asyou can make it. From now on we will refer to the distance from the paper clip to
the right clamp as the effective length of the string.
6. Plug in the BIP. The upper left dial labeled "db" controls the volume ofthe tone. The dial labeled "freq" in the upper right controls the frequency. The
slide switch just to the left of the frequency dial should be in the up position(Figure 6) . voLLthAE
7. Turn the volume dial
to maximum and_vary the fre-7
quency, At certain frequen-
cies standing waves will be
set up in the string.
Sometimes the vibration
of the string will be so
strong that the paper clip
will shake loose. When this
happens there are a couple of
things you can do. Either put more books under the speaker to increase the force
holding the foot against the speaker, or tie a slip knot in the string, hook the
top of the paper clip into it and then pull the knot tight on a leg of the "N" on
the paper clip.
cont TROT- FREQUENCY -RANGE 5WI To-1
FizetauEni ConITFr_ol_
FIGURE 6: The location of the volume and fre-quency controls and the slide switch.
8. Practice generating standing waves of different wavelengths and amplitudes
by varying the frequency and volume controls.
9. From time to time things happen which affect our ability to speak. We may
get laryngitis and "lose our voice," or we may develop "singer's polyps" which are
little lumps on e vocal cords. We can model what happens at such times by con-
necting a paper clip to the string.
Attach a paper clip on the string and attempt to generate standing waves in
it. Record your observations.
10. Remove the paper clip.
11. Determine the lowest BIP frequency required to produce a clean standing
wave. For materials with linear densities in the neighborhood of 1 g/meter or
greater, the pattern will be a full standing wave, although it may look like a half
wave at full volume. Reduce the volume until it is just over the amount required
to excite the string. Then the pure standing wave pattern will become clearer.(The frequency required to produce a full standing wave is called the second harmon-
ic. The frequency of a half standing wave is called the first harmonic or the fun-
damental. Sometimes the second harmonic will excite the string's fundamental fre-
quency and the string will vibrate at both frequencies simultaneously.)av)o, 107
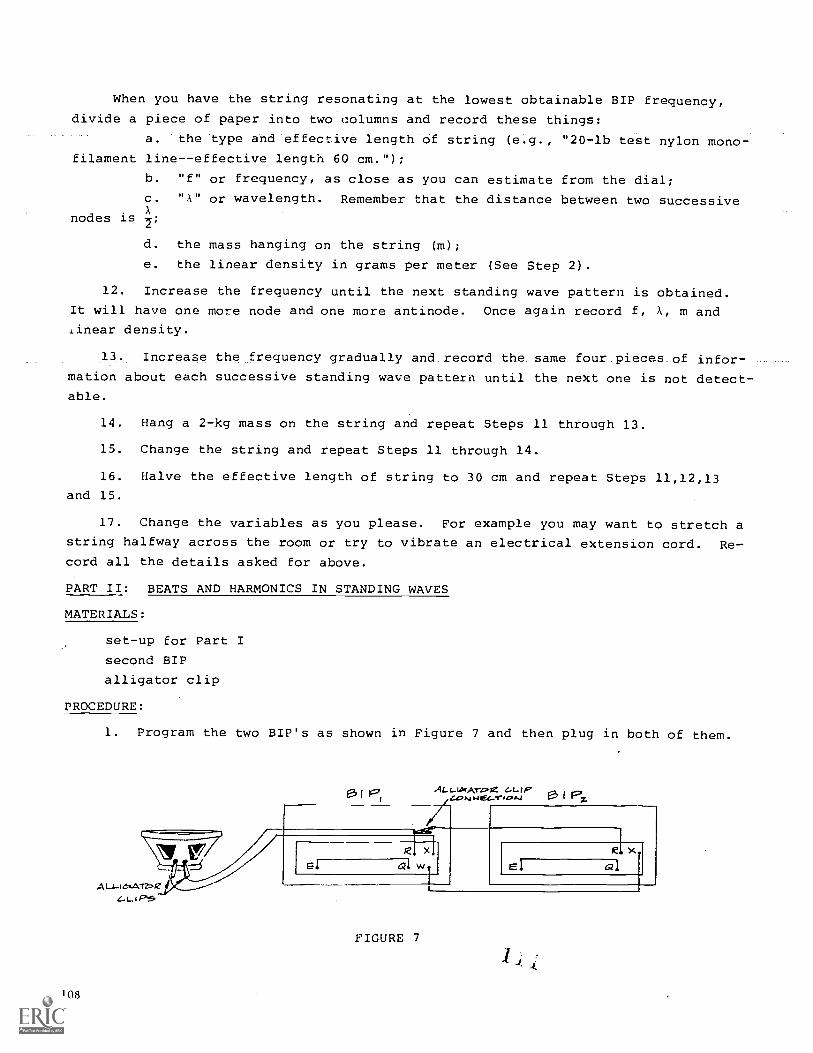
When you have the string resonating at the lowest obtainable BIP frequency,
divide a piece of paper into two columns and record these things:
a. the type and effective length of string (e.g., "20-lb test nylon mono-filament line--effective length 60 cm.");
b. "f" or frequency, as close as you can estimate from the dial;
c. "A" or wavelength. Remember that the distance between two successiveX
nodes is 7;
d. the mass hanging on the string (m);
e. the linear density in grams per meter (See Step 2).
12. Increase the frequency until the next standing wave pattern is obtained.
It will have one more node and one more antinode. Once again record f, X, m and
linear density.
13. Inc.rPase thefrequency gradually and record the same_four.pieces_of infor-
mation about each successive standing wave pattern until the next one is not detect-
able.
14. Hang a 2-kg mass on the string and repeat Steps 11 through 13.
15. Change the string and repeat Steps 11 through 14.
16. Halve the effective length of string to 30 cm and repeat Steps 11,12,13
and 15.
17. Change the variables as you please. For example you may want to stretch a
string halfway across the room or try to vibrate an electrical extension cord. Re-
cord all the details asked for above.
PART II: BEATS AND HARMONICS IN STANDING WAVES
MATERIALS:
set-up for Part I
second BIP
alligator clip
PROCEDURE:
1. Program the two BIP's as shown in Figure 7 and then plug in both of them.
108
LGONWEG,V,Z,N E3 I P/R. x
al w
FIGURE 7
XLal
1 A

2. Turn the volume control of BIP2to zero and use BIP
1to set up a standing
half wave.
3. Reverse Step 2. Turn BIP1down and set up a standing half wave with BIP2.
4. Turn both BIP's to maximum volume.
5. By varying slightly the frequency of one BIP, various beat patterns may be
observed.
6. Turn one BIP to zero volume and change the frequency of the other one so
that a full standing wave is set up.
7. Turn the other BIP back up. You will probably have to adjust the frequency
of one of the BIP's to minimize the beat effects. With careful adjustment of the
BIP's and close observation of the string, you should be able to observe both vibra-
tional modes occurring in the string simultaneously.
DISCUSSION QUESTIONS:
1. In general, the longer the string, the (lower, higher) the fundamental
frequency.
2. As we grow from small ..Ildren to adults, the length of our vocal cords
increases. What general effect will this have on the pitch of our voices?
3. The theoreti:..al formula which is supposed to predict the fundamental
frequency (f) is1
f Tr: a
where L = the effective length of the string
F = the tension in th string
d = the linear density of the string
This Eormula predicts that if the effective length of the string (i.e., from
driven point to clamp) is cut in half, then the fundamental frequency will double
(all other variables remaining the same). Did you observe this? Refer to data
that you collected to confirm or deny the prediction.
4. In general, when the tension on a string is increased, the fundamental
frequency (increases, decreases).
5. Suppose we increase the tension on our vocal cords. What effect will this
action have on the sound produced? Explain.
6. Another prediction of the Eormula of Question 3 is that if the tension in
the string is quadrupled, the fundamental frequency should double (all other vari-
ables remaining the same). What did you observel? Did it,mare than double, less
than double? Refer to your data to support youranswer.?..
7. In general, the greater the linear density-df-the string, the (greater,
smaller) the fundamental Erequency (all other variables remaining the same.
8. One effect of secondary sex changes which occurs at puberty is a thicken-
ing of the vocal cords in males. What eEEect will this have in general? Explain.
109
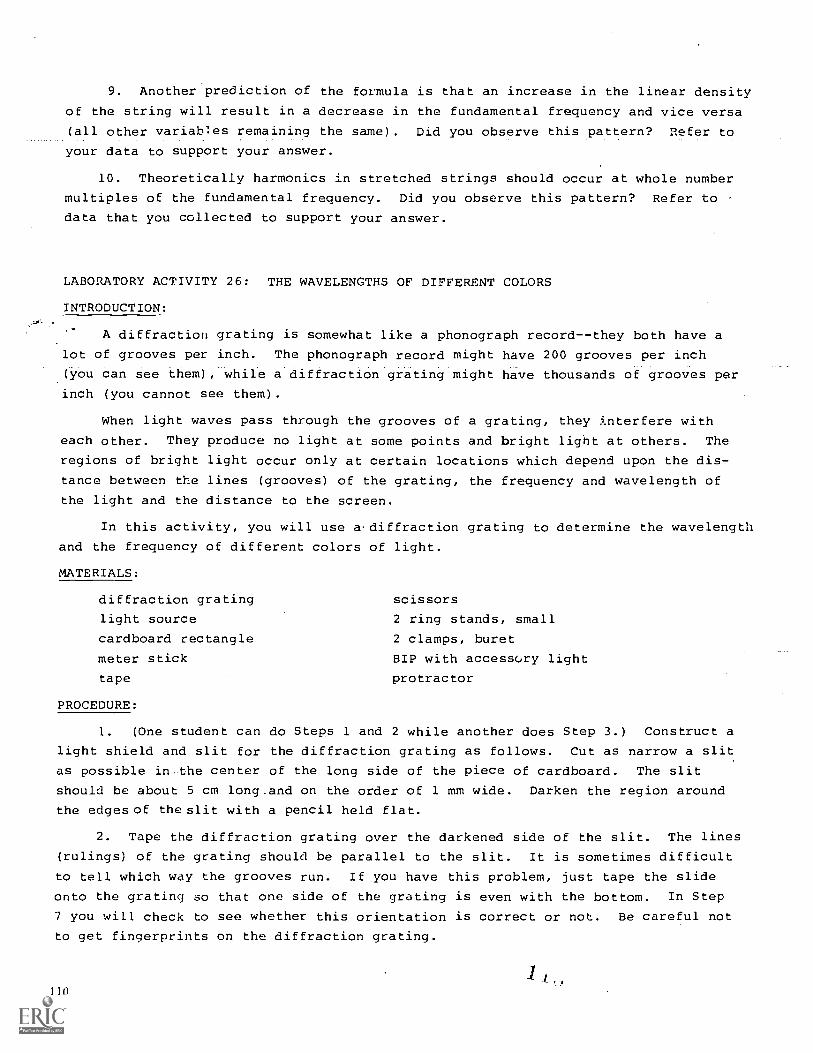
9. Another prediction of the formula is that an increase in the linear density
of the string will result in a decrease in the fundamental frequency and vice versa
(all other variables remaining the same) Did you observe this pattern? Refer to
your data to support your answer.
10. Theoretically harmonics in stretched strings should occur at whole number
multiples of the fundamental frequency. Did you observe this pattern? Refer to
data that you collected to support your answer.
LABORATORY ACTIVITY 26: THE WAVELENGTHS OF DIFFERENT COLORS
INTRODUCTION:
A diffraction grating is somewhat like a phonograph record--they both have a
lot of grooves per inch. The phonograph record might have 200 grooves per inch
(you can see them), while a diffraction grating might have thousands of grooves per
inch (you cannot see them).
When light waves pass through the grooves of a grating, they interfere with
each other. They produce no light at some points and bright light at others. The
regions of bright light occur only at certain locations which depend upon the dis-
tance between the lines (grooves) of the grating, the frequency and wavelength of
the light and the distance to the screen.
In this activity, you will use adiffraction
and the frequency of different colors of light.
MATERIALS:
diffraction grating
light source
cardboard rectangle
meter stick
tape
PROCEDURE:
1. (One student can
light shield and slit for
as possible in the center
do Steps
grating to determine the wavelength
scissors
2 ring stands, small
2 clamps, buret
BIP with accessory light
protractor
1 and 2 while another does Step
the diffraction grating as follows. Cut
3.) Construct a
as narrow a slit
of the long side of the piece of cardboard. The slit
should be about 5 cm long.and on the order of 1 mm wide.
the edges of the slit with a pencil held flat.
Darken the region around
2. Tape the diffraction grating over the darkened side of the slit. The lines
(rulings) of the grating should be parallel to the slit. It is sometimes difficult
to tell which way the grooves run. If you have this problem, just tape the slide
onto the grating so that one side of the grating is even with the bottom. In Step
7 you will check to see whether this orientation is correct or not. Be careful not
to get fingerprints on the diffraction grating.
I

3. Attach two strips of tape to the table for recording various locations.
Arrange the pieces of tape as shown in Figure 1. Pencil a cross in the center of
the 10-cm strip.
FIGURE 1: Initial placement of tape.
4. Arrange the equipment as shown in Figure 2.
PQIIEL.
FIGURE 2: Initial arrangement of equipment.
5. Before turning on the lamp (by plugging in
the BIP) rotate it so that the fil'ament is perpendic-
ular to the light shield. The filament is very small
and hard to see, but its two supports may be lined up
as shown in Figure 3. Tighten the clamp to hold the
lamp in position and turn on the BIP. Your teacher
will show you how to adjust the brightness of the
lamp.
..L 4194IFsp
3: Orientationof the lamp.
111
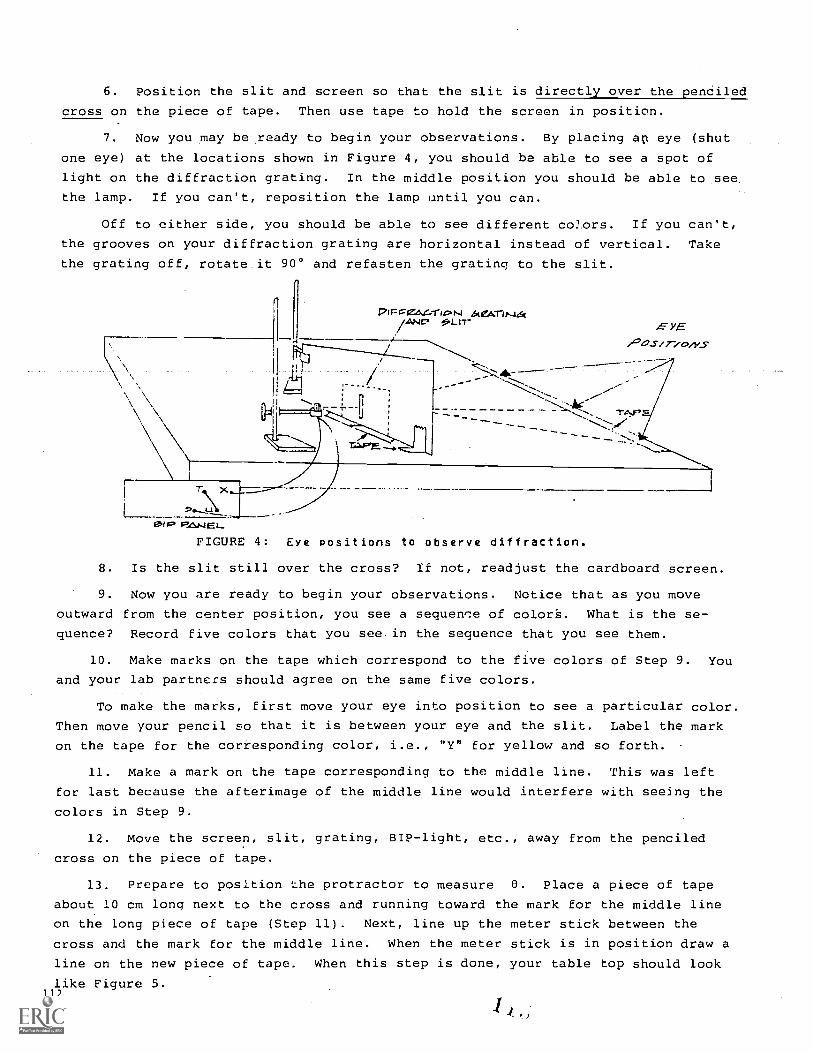
6. Position the slit and screen so that the slit is directly over the penciled
cross on the piece of tape. Then use tape to hold the screen in position.
7. Now you may be ready to begin your observations. By placing ap eye (shut
one eye) at the locations shown in Figure 4, you should be able to see a spot of
light on the diffraction grating. In the middle position you should be able to see
the lamp. If you can't, reposition the lamp until you can.
Off to either side, you should be able to see different colors. If you can't,
the grooves on your diffraction grating are horizontal instead of vertical. Take
the grating off, rotate it 90° and refasten the grating to the slit.
Plr:FIZAL.fric>t,1/ANC. gLrr EYE
J°0s/rovv.s
\\ \`\\
I
=Jane
OraPAj E LFIGURE 4: Eve positions to observe diffraction.
8. Is the slit still over the cross? If not, readjust the cardboard screen.
9. Now you are ready to begin your observations. Notice that as you move
outward from the center position, you see a sequen,:e of colorS. What is the se-
quence? Record five colors that you see in the sequence that you see them.
10. Make marks on the tape which correspond to the five colors of Step 9. You
and your lab partners should agree on the same five colors.
To make the marks, first move your eye into position to see a particular color.
Then move your pencil so that it is between your eye and the slit. Label the mark
on the tape for the corresponding color, i.e., "Y" for yellow and so forth.
11. Make a mark on the tape corresponding to the middle line. This was left
for last because the afterimage of the middle line would interfere with seeing the
colors in Step 9.
12. Move the screen, slit, grating, BIP-light, etc., away from the penciled
cross on the piece of tape.
13. Prepare to position the protractor to measure 0. Place a piece of tape
about 10 cm long next to the cross and running toward the mark for the middle line
on the long piece of tape (Step 11). Next, line up the meter stick between the
cross and the mark for the middle line. When the meter stick is in position draw a
line on the new piece of tape. When this step is done, your table top should look
112like Figure 5.
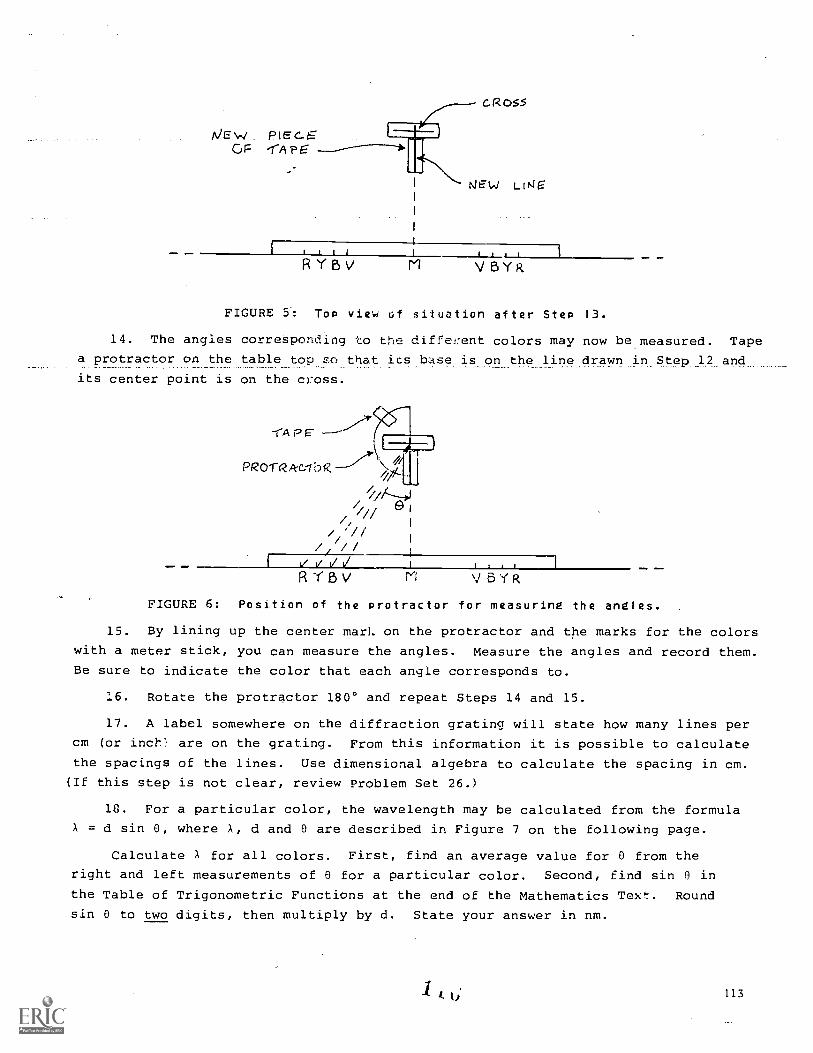
WEWOF -1-APE
RYBV V B YR
FIGURE 5: To view of situation after Step 13.
14. The angles corresponding to the diffef:ent colors may now be measured. Tape
a protractor on the table too so that ics base is on the line drawn in Step 12 and
its center point is on the cross.
PRO1-2A-C-IbCZ
//VA-4
// e//7'/
RYBV V BYR
FIGURE 6: Position of the protractor for measuring the angles.
15. By lining up the center marl, on the protractor and the marks for the colors
with a meter stick, you can measure the angles. Measure the angles and record them.
Be sure to indicate the color that each angle corresponds to.
16. Rotate the protractor 180° and repeat Steps 14 and 15.
17. A label somewhere on the diffraction grating will state how many lines per
cm (or inch' are on the grating. From this information it is possible to calculate
the spacings of the lines. Use dimensional algebra to calculate the spacing in cm.
(If this step is not clear, review Problem Set 26.)
18. For a particular color, the wavelength may be calculated from the formula
A = d sin 0, where A, d and 0 are described in Figure 7 on the following page.
Calculate A for all colors. First, find an average value for 0 from the
right and left measurements of 0 for a particular color. Second, find sin 0 in
the Table of Trigonometric Functions at the end of the Mathematics Text. Round
sin 0 to two digits, then multiply by d. State your answer in nm.
1 113
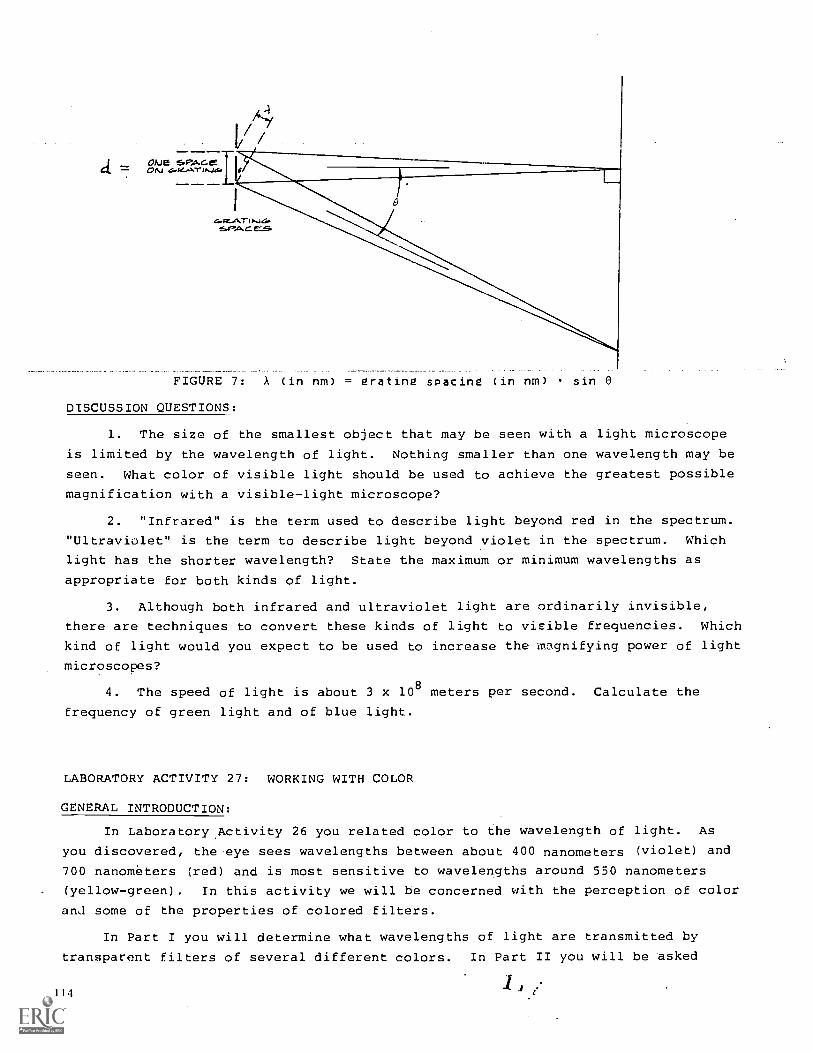
Oki sPA-ceON 4.,e-A-r I J6
SPA. G
FIGURE 7: A (in nm) = grating spacing (in nm) sin
DISCUSSION QUESTIONS:
1. The size of the smallest object that may be seen with a light microscope
is limited by the wavelength of light. Nothing smaller than one wavelength may be
seen. What color of visible light should be used to achieve the greatest possible
magnification with a visible-light microscope?
2. "Infrared" is the term used to describe light beyond red in the spectrum.
"Ultraviolet" is the term to describe light beyond violet in the spectrum. Which
light has the shorter wavelength? State the maximum or minimum wavelengths as
appropriate for both kinds of light.
3. Although both infrared and ultraviolet light are ordinarily invisible,
there are techniques to convert these kinds of light to visible frequencies. Which
kind of light would you expect to be used to increase the magnifying power of light
microscopes?
4. The speed of light is about 3 x 10⁸ meters per second. Calculate the
frequency of green light and of blue light.
LABORATORY ACTIVITY 27: WORKING WITH COLOR
GENERAL INTRODUCTION:
In Laboratory Activity 26 you related color to the wavelength of light. As
you discovered, the eye sees wavelengths between about 400 nanometers (violet) and
700 nanometers (red) and is most sensitive to wavelengths around 550 nanometers
(yellow-green). In this activity we will be concerned with the perception of color
an,1 some of the properties of colored filters.
In Part I you will determine what wavelengths of light are transmitted by
transparent filters of several different colors. In Part II you will be asked
114

questions about the colors you see when you use the filters in various ways. You
will need information from Part I to obtain correct answers in Part II. In addi-
tion, you will need the basic information about the perception of color which
follows in this introduction.
Later in this unit you will study the anatomy of the eye in some detail. What
you need to know now is that the back of the eye (the retina) contains three kinds
of special color receptors called "cones." The three types of cones respond dif-
ferently to light of any given wavelength. These tiny cones are very close together,
so that even a small point of light falling on the retina will stimulate many cones.
The responses of the cone receptors are then transmitted to the brain's visual center.
The brain somehow fuses the information that it receives from the cones, with the
result that we see color or white, depending upon how much each receptor is stimu-
lated.
The differences among the responses of the three types of cones are illustrated
in the following diagram. Each curve on the graph shows the intensity of the re-
sponse of one type of cone (B, G or R) to light of the wavelengths indicated on the
horizontal axis.
1
r
- t_
_
41-co
vlo GLUE r GREEN T t600 700 WAVE L E (nn;)
RED1
COLORS
YF.LL0v,./1 tor:0\06E
In Laboratory Activity 26 you used a diffraction grating to break white light
up into wavelengths that you could see separately as bands of different colors.
When you saw green, the wavelength of light was a narrow band of light centered at
about 525 nm. From the graph, you can see that light of this wavelength will stimu-
late the G receptors most strongly, R receptors less strongly and B receptors least
strongly. When these three responses are relayed to the brain, they are fused and
we perceive the color we call green.
Light with a wavelength of about 'SO nm will stimulate B receptors most strong-
ly, R receptors less strongly and G receptors least strongly. The color we "see"
is blue-violet: If the retina is stimulated by light of many wavelengths at the
(6 115
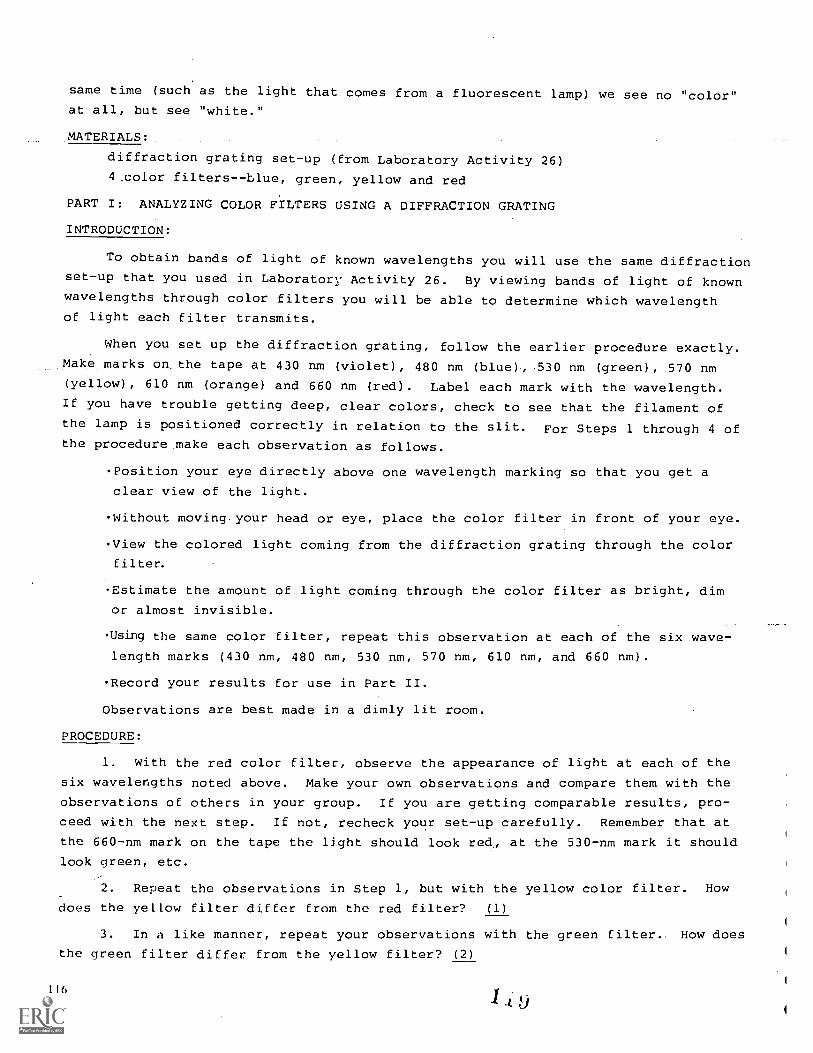
same time (such as the light that comes from a fluorescent lamp) we see no "color"at all, but see "white."
MATERIALS:
diffraction grating set-up (From Laboratory Activity 26)
4 .color filters - -blue, green, yellow and red
PART I: ANALYZING COLOR FILTERS USING A DIFFRACTION GRATING
INTRODUCTION:
To obtain bands of light of known wavelengths you will use the same diffractionset-up that you used in Laboratory Activity 26. By viewing bands of light of knownwavelengths through color filters you will be able to determine which wavelengthof light each filter transmits.
When you set up the diffraction grating, follow the earlier procedure exactly.
Make marks on, the tape at 430 nm (violet), 480 nm (blue), 530 nm (green), 570 nm(yellow), 610 nm (orange) and 660 nm (red). Label each mark with the wavelength.If you have trouble getting deep, clear colors, check to see that the filament of
the lamp is positioned correctly in relation to the slit. For Steps 1 through 4 ofthe procedure make each observation as follows.
-Position your eye directly above one wavelength marking so that you get a
clear view of the light.
-Without moving your head or eye, place the color filter in front of your eye.
-View the colored light coming from the diffraction grating through the color
filter.
-Estimate the amount of light coming through the color filter as bright, dim
or almost invisible.
Using the same color filter, repeat this observation at each of the six wave-
length marks (430 nm, 480 nm, 530 nm, 570 nm, 610 nm, and 660 nm).
-Record your results for use in Part II.
Observations are best made in a dimly lit room.
PROCEDURE:
1. With the red color filter, observe the appearance of light at each of the
six wavelengths noted above. Make your own observations and compare them with the
observations of others in your group. If you are getting comparable results, pro-
ceed with the next step. If not, recheck your set-up carefully. Remember that at
the 660-nm mark on the tape the light should look red., at the 530-nm mark it should
look green, etc.
2. Repeat the observations in Step 1, but with the yellow color filter. How
does the yellow filter differ from the red filter? (1)
3. In a like manner, repeat your observations with the green filter.. How does
the green filter differ from the yellow filter? (2)
116

4. Finally, repeat your observations with the blue filter. How does the
blue filter differ from the green filter? (3)
PART II: Analyzing Color Filters in White Light.
INTRODUCTION:
In Part 1 you determined the wavelengths of light that are transmitted through
filters of cer":ain colors. In Part II you will observe a source of white light
(such as a fluorescent lamp) through a color filter or combination of filters. You
should be able to explain the results of your observations on the basis of the in-
formation provided in the Introduction to this Activity, together with your own
observations from Part I. Even if you aren't sure, speculate on the answers to
each question before going on to the next step.
PROCEDURE:
1. Observe a source of white.light through the yellow filter. In Part I
you should have determined that the "yellow" filter actually transmits green,
orange and red as well as it does yellow light. How can you explain the fact that
this filter appears to your eye as yellow? (4)
2. Observe white light through the yellow and blue filters together. How do
you explain that you now see green? (5)
3. Observe white light through the green filter. From Part I you observed
that the green filter transmitted blue and yellow light as freely as green light.
How do you explain the fact that this filter appears to your eye as green? (6)
4. Can you come to any conclusions as to the brain's perception of color from
the results of Steps 2 and 3? (7)
5. Observe white light through the green and red filters together. You will
probably see a' deep-yellow: Can you explain this result? (8)
LABORATORY ACTIVITY 28: INDEX OF REFRACTION
INTRODUCTION:
When light passes from one medium to another it bends. This process is called
the refraction of light. The degree of refraction, or amount the light bends, de-
pends upon the two media involved.
For each medium there is a number, called the index of refraction, which de-
scribes the relationship between the angle of incidence and the angle of refraction
when light enters that medium from a vacuum. In practice, measurements are normally
made on light moving from air into a second medium, because the use of air instead
of a vacuum has very little effect on the results.
Refraction is an important aspect of the behavior of light, for in order to
understand the path that light follows as it passes through the different media with-
in the eye, it is necessary to have a knowledge of the indices of refraction that
are involved. /20 117
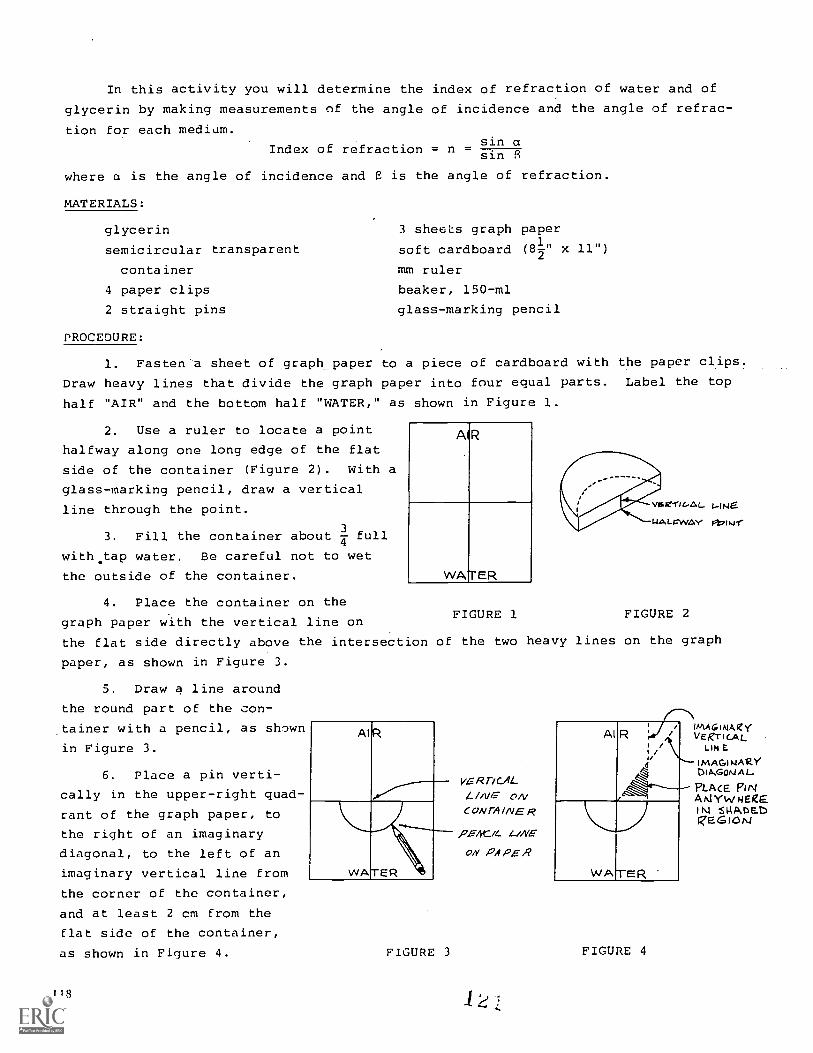
In this activity you will determine the index of refraction of water and of
glycerin by making measurements of the angle of incidence and the angle of refrac-
tion for each medium.
Index of refraction = nsin asin
where a is the angle of incidence and is the angle of refraction.
MATERIALS:
glycerin 3 sheeLs graph paper
semicircular transparent soft cardboard (81" x 11")2
container mm ruler
4 paper clips beaker, 150-ml
2 straight pins glass-marking pencil
PROCEDURE:
1. Fasten-a sheet of graph paper to a piece of cardboard with the paper clips.
Draw heavy lines that divide the graph paper into four equal parts. Label the top
half "AIR" and the bottom half "WATER," as shown in Figure 1.
2. Use a ruler to locate a point
halfway along one long edge of the flat
side of the container (Figure 2). With a
glass-marking pencil, draw a vertical
line through the point.
3. Fill the container about 2 full4
with.tap water. Be careful not to wet
the outside of the container.
4. Place the container on the
graph paper with the vertical line on
the flat side directly above the intersection of the two heavy lines on the graph
paper, as shown in Figure 3.
AlR
WATER
FIGURE 1
vilsoric.AL LINENALrINAY APowT
FIGURE 2
5. Draw a line around
the round part of the con-
tainer with a pencil, as shown
in Figure 3.
6. Place a pin verti-
cally in the upper-right quad-
rant of the graph paper, to
the right of an imaginary
diagonal, to the left of an
imaginary vertical line from
the corner of the container,
and at least 2 cm from the
flat side of the container,
as shown in Figure 4.
118
Al
WA
FIGURE 3
VERTICALL 04/CONTAINER
PE4C/L LINEON PA PE R
Al R V /1 AI /I/
WATER
FIGURE 4
INM6INIARYVERTICAL
LINE
IMAGINARYDIAGONAL-
PLACE PINANIYWHEIZE11\1 SIAADE_D(ZEGI0 I1
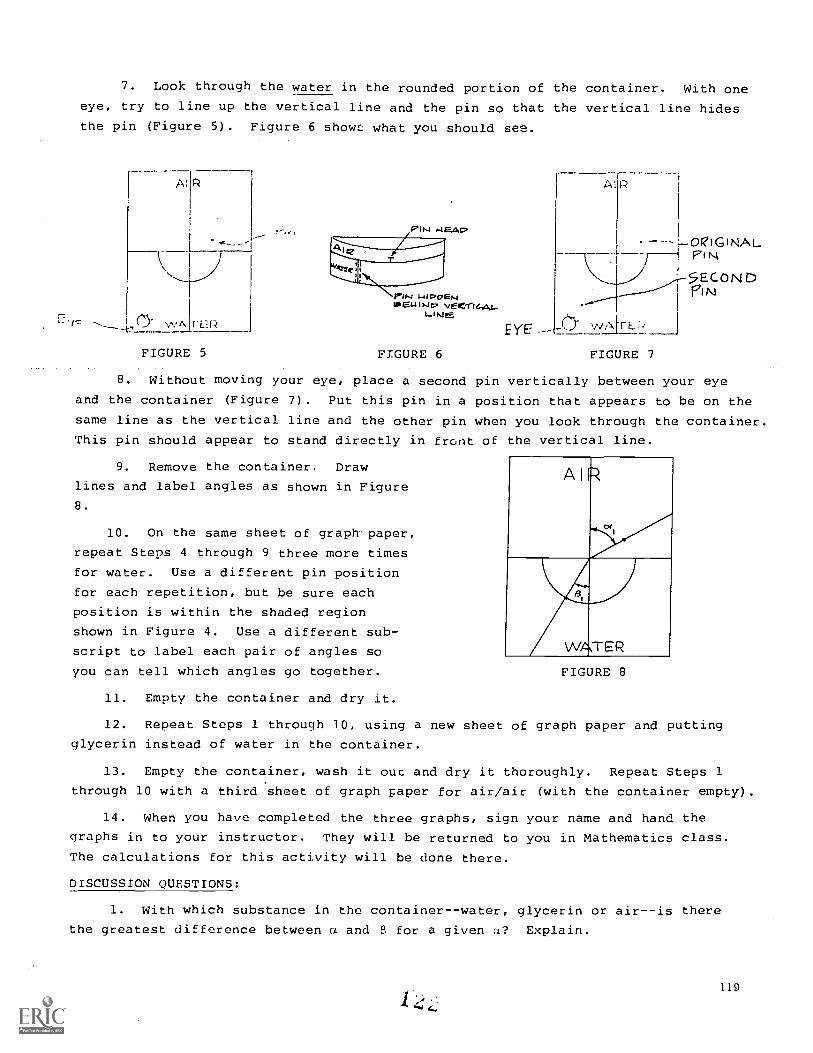
7. Look through the water in the rounded portion of the container. With one
eye, try to line up the vertical line and the pin so that the vertical line hides
the pin (Figure 5). Figure 6 shows what you should see.
At R
WA FER
FIGURE 5
PIN HEAD
PD.J 1-412ver4ault.41:7 voc-rse-AL-
1_1 tsi,
FIGURE 6
A
rORIGINALpf
5ECON D
EYE ___ wAITE;,
FIGURE 7
8. Without moving your eye, place a second pin vertically between your eye
and the container (Figure 7). Put this pin in a position that appears to be on the
same line as the vertical line and the other pin when you look through the container.
This pin should appear to stand directly in front of the vertical line.
9. Remove the container. Draw
lines and label angles as shown in Figure
8.
10. On the same sheet of graph paper,
repeat Steps 4 through 9 three more times
for water. Use a different pin position
for each repetition, but be sure each
position is within the shaded region
shown in Figure 4. Use a different sub-
script to label each pair of angles so
you can tell which angles go together.
11. Empty the container and dry it.
AIR
WATER
FIGURE 8
12. Repeat Steps 1 through 10, using a new sheet of graph paper and putting
glycerin instead of water in the container.
13. Empty the container, wash it out and dry it thoroughly. Repeat Steps 1
through 10 with a third sheet of graph paper for air/air (with the container empty).
14. When you have completed the three graphs, sign your name and hand the
graphs in to your instructor. They will be returned to you in Mathematics class.
The calculations for this activity will be done there.
DISCUSSION QUESTIONS:
1. With which substance in the container--water, glycerin or air--is there
the greatest difference between a and 8 for a given a? Explain.
119

2. Which substance in the container causes light to bend the most?
3. Why does light bend as it passes through water and glycerin?
LABORATORY ACTIVITY 29: MAKING LENSES
INTRODUCTION:
In this activity you will be constructing two lenses (Part I) and making two
sucrose solutions (Part II) to fill these lenses with. The lenses will be two
different sizes and the solutions will be two different concentrations of sucrose.
Using these materials, you can vary two factors tha' affect the focal length of a
lens: its shape and its index of refraction. In the next activity you will deter-
mine the focal lengths using the lenses and solutions that you prepare today.
PART I: MAKING LENSES
MATERIALS:
2 watch glasses, 100-mm diameter
2 watch glasses, 50-mm diameter
glass plate, 100 mm x 110 mm
glass plate, 50 mm x 60 mm
tube of air-curing silicone rubber
glass-marking pencil
PROCEDURE:
1. In this part of the activity one member of the team can make a large lens
and one a small lens. The procedure is the same for both.
2. Carefully wash and dry the glass plate and the two watch glasses.
3. Lay the glass plate on the table. Set a watch glass on the plate with the
watch glass overlapping the glass plate by about 1 cm. The overlap should be enough
for filling the watch glass with liquid from a pipet or squeeze bottle. (See dia-
gram below.) With a marking pencil, outline the watch glass on the plate.
e---- Overlof cor910.5sc5f
licv;c1
EDGE VI EW
120
plc e
5, I,cor,ela r
FRONT VIEW

4. Turn the plate over and outline the watch glass on the other side, making
sure the two outlines line up.
5. Place a layer of silicone rubber sealant about .5 cm wide just inside the
outline on one side of the plate. Wipe any fingerprints off the watch glass and
set the watch glass onto the ring of rubber sealant, using the outline as a guide.
Wait 1 to 2 minutes. Then place a layer of sealant around the edge of the watch
glass. This will seal any leak between the watch glass and glass plate.
6. Record the time. Allow 10 minutes for the sealant to dry. While you are
waiting, you can get started on Part II.
7. When the 10 minutes are up, wipe off fingerprints from the other watch
glass and cement it onto the other side of the plate. Make sure the two watch
glasses line up with each other.
8. Set the lens aside for one day for the rubber to cure. Proceed to Part II
9. After the rubber sealant has cured for one day, check for leaks as follows.
Fill each side of the lens with water, dry the outside, and look for leaking. If
a leak is present, note its location with a glass-marking pencil. Empty the lens,
dry the outside thoroughly and place a layer of rubber on the defective area.
10. Set the lens aside for one day to let the new layer of rubber cure.
If you found a leak and repaired it in Step 9, repeat Step 9 again a day after
the repair, to check for further leaks. Repair any leaks.
PART II: PREPARING SUCROSE SOLUTIONS
MATERIALS:
2 beakers, 250-ml balance
2 Erlenmeyer flasks, 250-ml stirring rod
graduated cylinder, 100-ml 2 cork stoppers, #14
graduated cylinder, 10-ml sucrose
PROCEDURE:
1. In Laboratory Activity 30 you will be filling your lens with two different
sucrose solutions. The two solutions needed should have the following concentra-
tions.
50 g sucrose 100 g sucrose200 g solution and 200 g solution
2. The mass of water in each solution may be found by subtracting the mass of
the sucrose from the mass of the solution. The first solution will contain 50 g
sucrose + 150 g H2O. The second solution will contain 100 g sucrose + 100 g H2O.
Since 1 g of H2O has a volume of 1 ml, the two solutions will consist of 50 g
sucrose + 150 ml H2O and 100 g sucrose + 100 ml H2O.
3. Label your two beakers "A" and "B." Determine and record the mass of each
beaker to t 0.1 g.
4. Use beaker 13 to weigh out 50 0.1 g sucrose.
121
5. Sucrose dissolves best in hot water. Add 150 ± 2 ml of hot tap water to
beaker A.
6. Add the sucrose to the water slowly, while stirring, until all the sucrose
is dissolved.
7. Pour the solution into an Erlenmeyer flask. Label the flask "50 g/200 g."
8. Rinse and dry beaker A.
9. Repeat Steps 4 through 7, but use 100 ± 0.2 g sucrose and 100 ± 2 ml
hot tap water. Label the second flask "100 g/200 g."
10. Initial both flasks, and stopper and store them.
LABORATORY ACTIVITY 30: DETERMINING THE FOCAL LENGTH OF LENSES
INTRODUCTION:
In this activity you will use the lenses you constructed during the last
activity to collect data from which you can determine the focal lengths of the
lenses.
In Part I you will measure the dimensions of your lens. You will use these
measurements later in the Mathematics class to calculate the focal length of the
lens, using formulas.
In Part II you will work with images that the lens produces, using a light
source and a screen. You will vary the index of refraction of the lens by filling
it with three different liquids: water and the two sucrose solutions you prepared
during the preceding activity. You will measure the distances involved and use
these measurements in the Mathematics class to make a second calculation of the
focal length of the lens.
By comparing the results from Part I with the results from Part II, you will
be able to determine how closely the focal length calculated from the dimensions of
the lens agrees with the focal length calculated from the distances of the images
the lens produces.
MATERIALS:
small and large lenses made in
Laboratory Activity 29
two sucrose solutions made in
Laboratory Activity 29
meter stick
mm ruler
3 index cards (4" x 6" or 5" x
masking tape
122
pipet, 10-ml
wash bottle
scissors
light source:
100-watt clear bulb
bulb socket with cord and plug
8") ring stand with clamp
Data Sheet 30
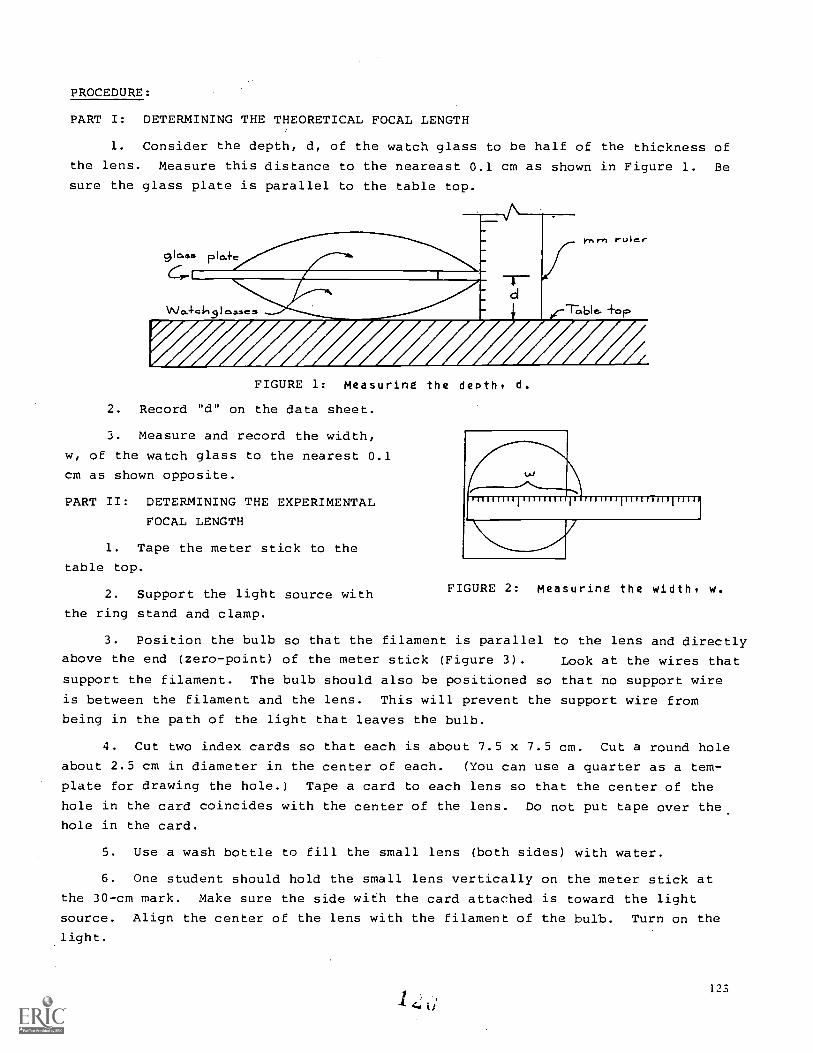
PROCEDURE:
PART I: DETERMINING THE THEORETICAL FOCAL LENGTH
1. Consider the depth, d, of the watch glass to be half of the thickness of
the lens. Measure this distance to the neareast 0.1 cm as shown in Figure 1. Be
sure the glass plate is parallel to the table top.
glass
VVC4.0 1.1 032C3
yr. rn ruicr
Table. +op
df,FIGURE 1: Measuring the depth, d.
2. Record "d" on the data sheet.
3. Measure and record the width,
w, of the watch glass to the nearest 0.1
cm as shown opposite.
PART II: DETERMINING THE EXPERIMENTAL
FOCAL LENGTH
1. Tape the meter stick to the
table top.
2. Support the light source with
the ring stand and clamp.
1 IM 1 1 1 1 1 1 1 1 1 1 1 1 1 I I I 1 I I I I I I I I I I I I I I I I I I r
FIGURE 2: Measuring the width, w.
3. Position the bulb so that the filament is parallel to the lens and directly
above the end (zero-point) of the meter stick (Figure 3). Look at the wires that
support the filament. The bulb should also be positioned so that no support wire
is between the filament and the lens. This will prevent the support wire from
being in the path of the light that leaves the bulb.
4. Cut two index cards so that each is about 7.5 x 7.5 cm. Cut a round hole
about 2.5 cm in diameter in the center of each. (You can use a quarter as a tem-
plate for drawing the hole.) Tape a card to each lens so that the center of the
hole in the card coincides with the center of the lens. Do not put tape over the
hole in the card.
5. Use a wash bottle to fill the small lens (both sides) with water.
6. One student should hold the small lens vertically on the meter stick at
the 30-cm mark. Make sure the side with the card attached is toward the light
source. Align the center of the lens with the filament of the bulb. Turn on the
light.
123
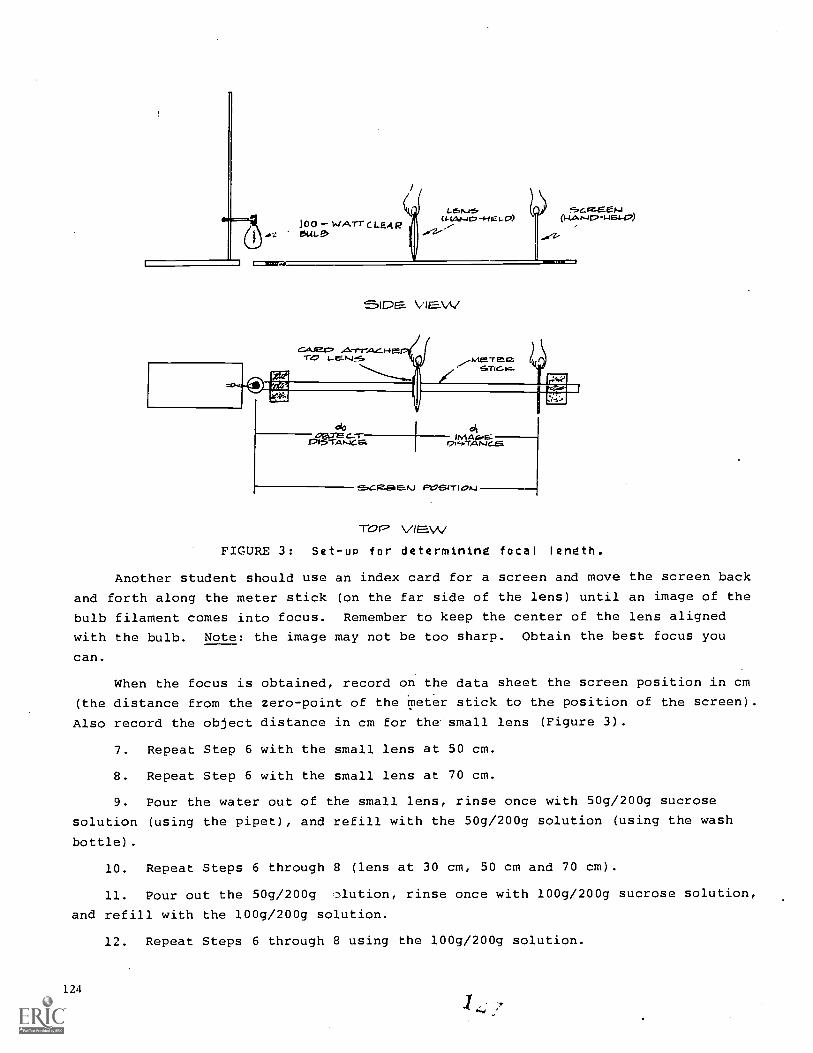
100 14.4TrCLEARL.&n_rs
(1-1Ar-il7-Ha1 -cP) (-4,4-417-14e442)
SIB VI\A/
eSTICK
do08.71EGrr Melga,EVI5TAK4GM 170,..7/04c45
Pc261Tiok.i
-ror- viewFIGURE 3: Set-up for determining focal length.
Another student should use an index card for a screen and move the screen back
and forth along the meter stick (on the far side of the lens) until an image of the
bulb filament comes into focus. Remember to keep the center of the lens aligned
with the bulb. Note: the image may not be too sharp. Obtain the best focus you
can.
When the focus is obtained, record on the data sheet the screen position in cm
(the distance from the zero-point of the meter stick to the position of the screen).
Also record the object distance in cm for the small lens (Figure 3).
7. Repeat Step 6 with the small lens at 50 cm.
8. Repeat Step 6 with the small lens at 70 cm.
9. Pour the water out of the small lens, rinse once with 50g/200g sucrose
solution (using the pipet), and refill with the 50g/200g solution (using the wash
bottle).
10. Repeat Steps 6 through 8 (lens at 30 cm, 50 cm and 70 cm).
11. Pour out the 50g/200g Dlution, rinse once with 100g/200g sucrose solution,
and refill with the 100g/200g solution.
12. Repeat Steps 6 through 8 using the 100g/200g solution.
124
13. Extend the range of measurement by adding the centimeter rule to the end
of the meter stick. This will be needed for the large lens.
14. Reverse roles with your partner and repeat Steps 5 through 12 using the
large lens. In order to keep the center of the large lens aligned with the fila-
ment of the bulb, you may have to raise the bulb.
15.Subtractdofromthescreenpositiontoobtaind.1 for each trial. Record.
16. Put your name on your data sheet and hand it in. It will be returned in
Mathematics class.
DISCUSSION QUESTION:
Were you able to get a sharp image at the focus? If not, speculate as to why.
LABORATORY ACTIVITY 31: DISSECTION OF THE EYE
INTRODUCTION:
Vision is perhaps the most important sense by which humans gain knowledge of
the external environment. The receptor organ that makes vision possible is the eye.
Light rays pass into it and trigger nerve impulses that travel to the brain, where
they are converted to visual images.
One of the methods commonly used to study the structure and function of an or-
gan is dissection. You have used this method previously to study the lung, the
digestive tract and the heart. In this activity you will once again make use of
this technique to study the structure of the eye. In this activity, you will be
using a sheep's eye; its structure is very similar to that of the human eye and
thus will provide information relevant to the human eye.
MATERIALS:
sheep eye forceps
Petri dish (or dissecting tray) hand lens
razor blade hand mirror
dissecting scissors, or scissors light source (to be shared by all students)
with sharp points
PROCEDURE:
1. Examine the eye and locate the optic nerve. It is the whitish stump
sticking out of the back of the eyeball. This is where all the nerve fibers from
the retina join together. You will also see a series of muscles around the eye.
What do you think the function of these muscles is? (1)
2. The optic nerve is surrounded by whitish fatty tissue. Remove this with
the help of the forceps or a pair of scissors and examine the optic nerve. Where
does the optic nerve enter the eyeball? (2)
3. Examine the outer covering of the eyeball. Can you locate the sclera? (3)
The cornea? (4) How does the cornea differ in appearance from the sclera? (5)
I 4; 8 125
4. Put the eye on a wet paper towel in the Petri dish so that the cornea is
up. Holding the eye firmly (don't squeeze it) make a small incision (about 3 mm
deep) in the cornea near the edge. A watery substance will begin to ooze out
through the cut. What is this substance and what is its function? (6)
5. Insert your scissors into the cut you just made, and cut all the way
around the cornea. Remove the cornea with a pair of forceps. Make a drawing of
the eye with the cornea removed, labeling sclera, iris, pupil and lens. (7)
6. Use the hand lens to look through the pupil and examine the lens of the
eye. It is transparent in the living eye but will appear cloudy or opaque in a
preserved specimen. Make a note of your observations. (8)
7. You can easily pop the lens out of the eye by squeezing the eye gently.
Remove the lens and describe it--the shape, color, texture, etc. (9)
8. Behind the lens lies the vitreous humor. Take the eye over to the lamp
that has been set up and, using a hand mirror, look inside the eye. If necessary,
remove any tissue that prevents you from seeing the back of the eye. Record your
observations. (10)
9. Squeeze the vitreous humor out of the eye into a wet paper towel. Do you
see a dark ring-shaped muscular area around the space where the lens was? (11)
This is the ciliary body and contains the ciliary muscles, which change the shape
of the lens.
10. Beginning at the edge of the cut in the front of the eye, make a cut back
to the optic nerve on either side. (Don't touch the inside of the eye with your
fingers as you do this.)
11. Turn the eye inside out and look for a thin gray or blackish-blue mem-
brane. This is the retina. In the retina are located the specialized cells that
are sensitive to light.
12. Using a razor blade, scrape the inside surface of the eye until you reach
the sclera. What layers do you pass through? (12)
LABORATORY ACTIVITY 34: TESTING VISUAL ACUITY
INTRODUCTION:
In this activity you will administer the Snellen test to one another. Make
sure that each member of your group has an opportunity to administer the test. It
is important that each of you be familiar with the test materials when you test
primary-school children later.
The procedure for administering the Snellen test is described below. However,
before proceeding with the testing, you should first get together with all the mem-
bers of your group, read the informational material that follows and make any
necessary preparations. For example, your group will need to mark off the testing
area you will be using and check the illumination in the room, etc., before begin-
ning the actual testing. Also, we suggest that you come to a decision as to what
126
method you will use to explain the procedure to the children you will be testing,
and then practice this method on the other members of your group. If you follow
this procedure you will know exactly what to do and how to do it when you administer
the test to the elementary-school students.
Before proceeding, check the size of the room and the room lighting as follows.
1. The room should be large enough so that there is a length of at least
25 feet of clear floor space with even, glare-free lighting over the entire ler;th.
2. Visual acuity increases as the intensity of light increases until a
level is reached that causes eye discomfort, and visual acuity decreases as the
intensity of light decreases. It is therefore important to have the entire area
over which the testing is to be done properly lighted at all times. The intensity
of light over this area should be 10 to 15 foot-candles and evenly diffused. The
intensity should be checked with a light meter that reads in foot-candler., if one
is available.
In performing the Snellen test, consider the following guidelines taken from
A Guide for Vision Screening in California Public Schools, Calif. State Dept. c,f
Education, Sacramento, 1964, p.8.
ADMINISTERING THE SNELLEN TEST:
In order to secure the confidence, understanding, and cooperation of pupils
when they are taking the test for the first time, explain to them the purpose rand
procedures. With very young children who have never taken a vision test, demon-
strate the procedure with the large symbol .E card. Turn the E to various positions
and, as it is held in each position, show the pupil how to indicate the direction
in which the legs of the E point. This procedure may be carried on :,r1 the spirit
of a game; the pupils indicate with both arms the direction in which the "legs" of
the "table" are pointing. The pretesting activities may be carried out in regular
classrooms.
Pupils who are far enough along in school that they can be relied upon to re-
port verbally the direction in which the symbol points may be taught to respond by
saying "left," "right," "up," or "clown." However, they may be permitted to indicate
the positions by pointing.
Testing. In testing a pupil, employ the following practices:
Adopt and employ a standard testing procedure.
If the pupil is wearing glasses, test him without glasses and indicate on the
test form that he had glasses.
Test the vision in one eye at a time--the right eye first, the left eye next.
Use an occluder or hold a small cover card obliquely along the nose of the pupil to
cover the eye not being tested. Pupils are to keep both eyes open during the test- -
the one being tested and the one covered by the card. Care should be taken that the
card does not press on the eye.
127

Use a fresh cover card with each pupil so as to prevent any infectious condi-
tion from being communicated from one pupil to another.
Do not allow the pupil to squint.
MATERIALS:
set of Snellen cards (hand-
held "E" set)
3" x 5" index cards
PROCEDURE:
Visual Acuity Test Form
yardstick (or tape measure)
light meter (optional)
1. Measure a distance of 20 feet (or 6.1 meters). Make chalk lines on the
floor at both ends of one 20-foot distance. Record the distance.
The location of the subject should be protected from bright or glaring light
coming from directly in front of him.
2. Seat or stand the subject at one end of the measured 20 feet.
3. Exhibit various sizes of "E's" from the hand-hold set, starting with the
50 card. Hold each card directly over the chalk line 20 feet from the subject.
Determine the smallest-sized E that the subject can accurately indicate the direc-
tion of at 20 feet.
The visual acuity testing situation should look like the following diagram.
E
I I I I I I I I I 1111111I. 1 3. 4. 5' 6* e. 9' KV t Q.' 13 41; 7 is 19 20
4. At this point the tester should flip the E card
in three or four different directions to determine
whether the subject can accurately tell the correct
direction on every trial.
5. Record the number of the card on your test form
under the title, "Standard Distance."
6. Record the visual-acuity ratio (distance between
subject and "E" card/standard distance) and the
scale on your test form. Use the table to the right
to determine the appropriate scale for the visual-
acuity rat,).
128
--reteS4C1r.
Acuity Ratio Scale
20/5 1
20/7.5 2
20/10 3
20/15 4
20/20 5
20/25 6
20/40 7
20/50 8
20/100 9
Less than 20/100 10
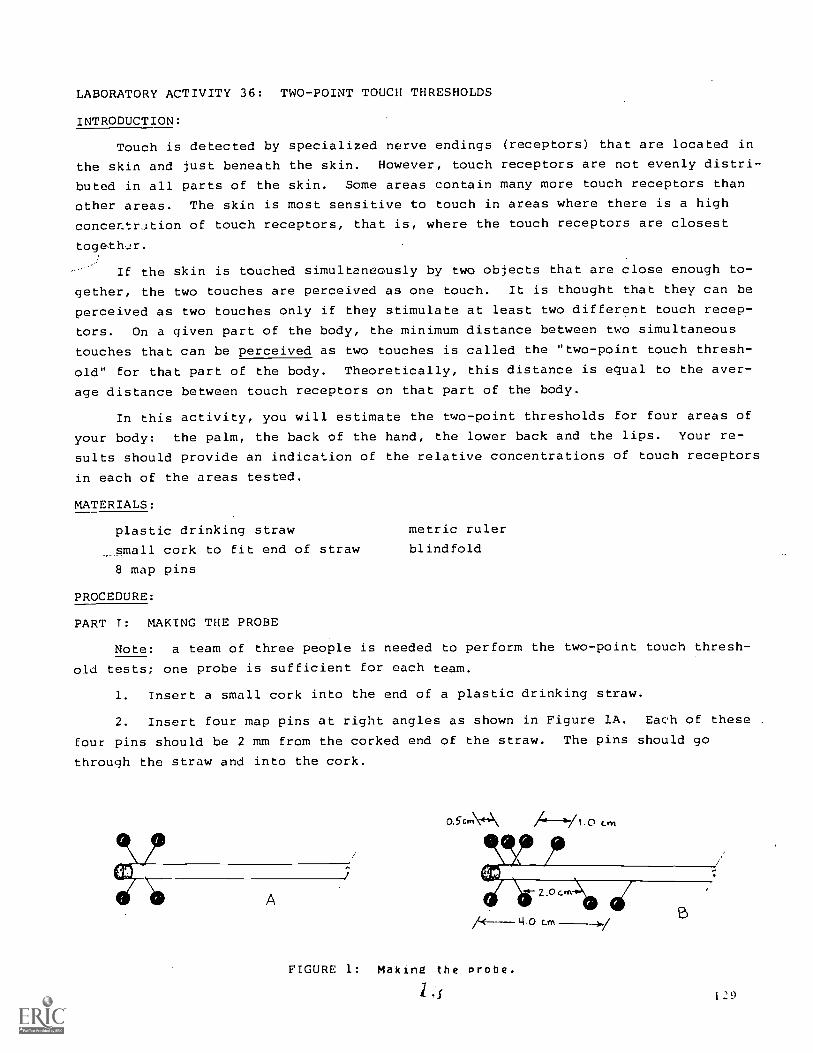
LABORATORY ACTIVITY 36: TWO-POINT TOUCH THRESHOLDS
INTRODUCTION:
Touch is detected by specialized nerve endings (receptors) that are located in
the skin and just beneath the skin. However, touch receptors are not evenly distri-
buted in all parts of the skin. Some areas contain many more touch receptors than
other areas. The skin is most sensitive to touch in areas where there is a high
concentr.:tion of touch receptors, that is, where the touch receptors are closest
togeth.:r.
If the skin is touched simultaneously by two objects that are close enough to-
gether, the two touches are perceived as one touch. It is thought that they can be
perceived as two touches only if they stimulate at least two different touch recep-
tors. On a given part of the body, the minimum distance between two simultaneous
touches that can be perceived as two touches is called the "two-point touch thresh-
old" for that part of the body. Theoretically, this distance is equal to the aver-
age distance between touch receptors on that part of the body.
In this activity, you will estimate the two-point thresholds for four areas of
your body: the palm, the back of the hand, the lower back and the lips. Your re-
sults should provide an indication of the relative concentrations of touch receptors
in each of the areas tested.
MATERIALS:
plastic drinking straw
small cork to fit end of straw
8 map pins
PROCEDURE:
PART T: MAKING THE PROBE
metric ruler
blindfold
Note: a team of three people is needed to perform the two-point touch thresh-
old tests; one probe is sufficient for each team.
1. Insert a small cork into the end of a plastic drinking straw.
2. Insert four map pins at right angles as shown in Figure 1A. Each of these
four pins should be 2 mm from the corked end of the straw. The pins should go
through the straw and into the cork.
A
1
a5 cr,N*4-1\ - /I .D cm
/4-- 4.0 cm
FIGURE 1: Making the probe.
1 29

3. Insert a pin at a point 0.5 cm from one of the pins already in place, and
in line with it, as shown in Figure 1B.
4. Rotate the straw 90° and insert a pin at a point 1.0 cm from the pin at
the end.
5. Rotate the straw 90° and insert a pin at a point 2.0 cm from the pin at
the end.
6. Rotate the straw 90° and insert a pin at a point 4.0 cm from the pin at
the end.
7. You should now have four pairs of pins in place that are 0.5, 1.0, 2.0 and
4.0 cm apart, respectively. The completed probe should appear as shown in Figure 1B.
PART II: PERFORMING THE TEST
1. The test requires a team of three students: a subject, a tester and a
recorder. Rotate the roles as you perform the activity, until each of you has acted
in each of the three roles.
2. In using the probe, it is important that both pin heads touch the skin at
the same time and with the same pressure. Hold the straw in the middle and practice
touching the pairs of pin heads to the back of your own hand. The touch should be
fairly firm and should last approximately one second. The pins that are farther
apart are more difficult to apply simultaneously. Practice touching each of the
four pairs of pin heads to your skin.
3. Before starting the test, position the subject so that his hand and arm
are comfortable when held still. At this time, the subject should be blindfolded
so that he cannot observe what the tester is doing.
4. The recorder should prepare a data table similar to the one shown below.
DISTANCE BETWEEN PIN HEADS (cm)
CONTROL (0 cm) .5 1 2 4
S
I
T
E
PALM
BACK OF HAND
BACK
LIPS
5. To begin the test, the tester touches the pinheads to the area of the sub-
ject's palm indicated by the shading in Figure 2A on the following page. The subject
must decide whether he feels one pin head or two. The tester should not repeat a
trial even if the subject asks for a repeat. As a check, the tester must occasion-
ally touch only one pin head to the skin. Each of the four pairs of pin heads should
be applied to the skin in mixed-up order until all of the spaces on the data sheet
for the palm have been filled with the subject's responses. For each site there
should be 12 responses in all.130
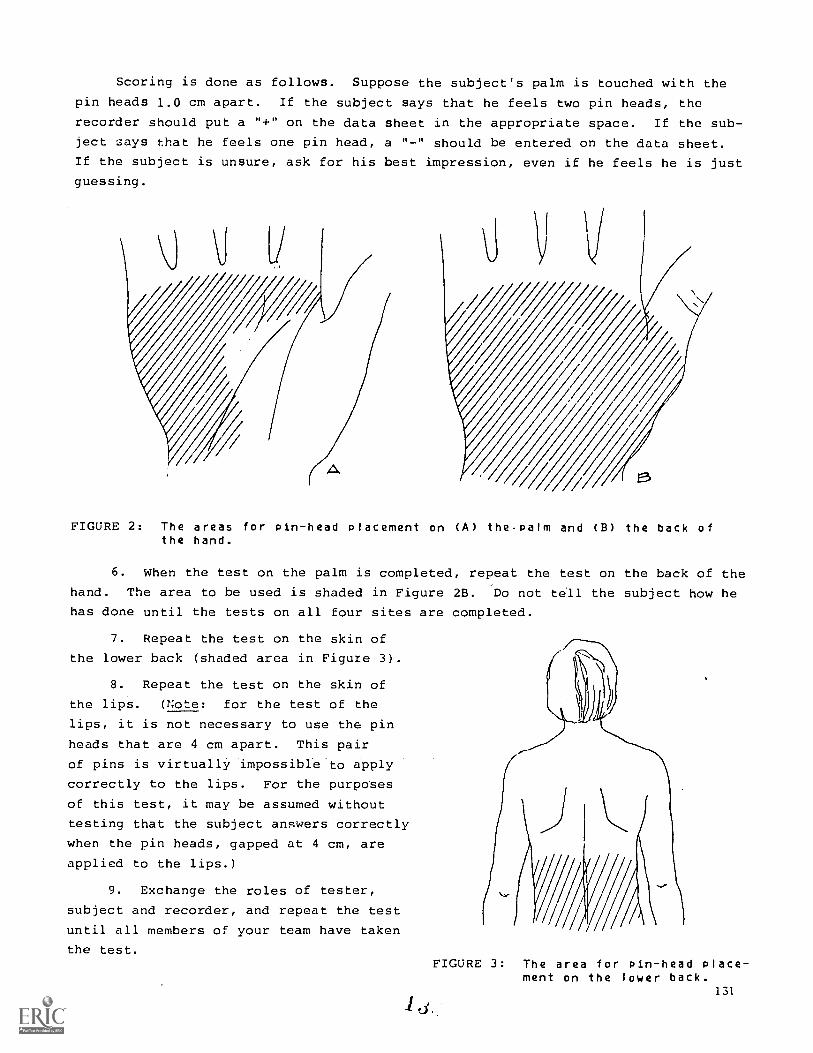
Scoring is done as follows. Suppose the subject's palm is touched with the
pin heads 1.0 cm apart. If the subject says that he feels two pin heads, the
recorder should put a "+" on the data sheet in the appropriate space. If the sub-
ject says that he feels one pin head, a "-" should be entered on the data sheet.
If the subject is unsure, ask for his best impression, even if he feels he is just
guessing.
FIGURE 2: The areas for pin-head Placement on (A) the-Palm and (B) the back ofthe hand.
6. When the test on the palm is completed, repeat the test on the back of the
hand. The area to be used is shaded in Figure 2B. Do not tell the subject how he
has done until the tests on all four sites are completed.
7. Repeat the test on the skin of
the lower back (shaded area in Figure 3).
8. Repeat the test on the skin of
the lips. (Note: for the test of the
lips, it is not necessary to use the pin
heads that are 4 cm apart. This pair
of pins is virtually impossible to apply
correctly to the lips. For the purposes
of this test, it may be assumed without
testing that the subject answers correctly
when the pin heads, gapped at 4 cm, are
applied to the lips.)
9. Exchange the roles of tester,
subject and recorder, and repeat the test
until all members of your team have taken
the test.FIGURE 3: The area for pin-head Place-
ment on the lower back.131
DISCUSSION QUESTIONS:
1. Which of the four areas seem to be the most sensitive to two-point touch-
ing? Rank the four areas on the basis of their sensitivity. (Ignore the responses
in the "control" columns.)
2. What would you estimate your two-point thresholds to be (in centimeters)
from the results of your test? Can you detect significant differences between your
thresholds and your classmates'?
3. Check the results of other teams and compare females with males for sensi-
tivity.
4. Why might it be advantageous to have greater sensitivity to touch in some
areas than in others?
5. The areas tested were chosen in part for their relative lack of hair. Why?
LABORATORY ACTIVITY 37: TASTE THRESHOLDS
INTRODUCTION:
In this activity you will measure your taste thresholds for salt, sugar (su-
crose) and saccharin. As you might expect, your taste threshold for a given sub-
stance is the lowest concentration of that substance that youcan taste. Therefore,
to measure your taste threshold for salt you taste a number of salt solutions of
different concentrations and decide at which concentration you first perceive the
taste of salt.
It is important during this activity that you not know what concentration you
are tasting. Prior knowledge could easily affect the results. (Recall the placebo
effect.) For this reason you will administer the test to each other. The subject
should not know what solution the tester is administering on any given trial.
MATERIALS:
.032 M NaC1 solution 6 medicine droppers
.032 M sucrose solution paper cups
64 x 10 -6 M saccharin solution blindfold
PROCEDURE:
Note: three people are needed to perform the taste-threshold test. While one
member of your team is preparing the sucrose dilutions, the other two members can
be preparing dilutions of NaCl and saccharin (see Steps 15 and 16), if enough paper
cups are available.
1. Label 5 cups as follows: .032 M, .016 M, .008 M, .004 M and .002 M.
2. In an unmarked cup, obtain approximately 100 ml of .032 M sucrose solution.
Label this vessel "measuring cup."
3. Pour approximately one half of the sucrose solution from the measuring cup
into the cup marked .032 M.
132

4. On the measuring cup mark a line indicating the level of the remaining
solution. This cup is used in the following steps for preparing the remaining dilu-
tions. Each dilution is prepared by diluting the previous solution by a factor of
two.
5. Pour the contents of the measuring cup into the cup marked .016 M.
6. Fill the measuring cup to the mark with water. Pour the water into the
cup marked .016 M. Swirl the cup to mix the contents thoroughly.
7. Fill the measuring cup to the mark with .016 M sucrose.
8. Repeat Steps 5, 6 and 7 using the cup marked .008 M. Continue making dilu-
tions until you have filled all of the labeled cups with the proper solutions.
9. Rinse the measuring cup thoroughly and fill it with fresh water. Place a
clean medicine dropper in each of the six cups.
10. Organize your team into a subject, tester and recorder. The recorder should
prepare a data sheet similar to the one shown below.
CONCENTRATION
SOLUTION 0.OM (control--water) .002 M .004 M .008 M .016 M .032 M
SUCROSE
Nail
SACCHARIN0.OM (water 4.10-6M
_8.10 M
_16.10 M
_32.10 M
_64.10
11. Blindfold the person who has been chosen as the subject. The subject shouldrinse his mouth thoroughly with water.
12. To perform the test, the tester applies three drops of each solution in
mixed-up order to the tongue of the subject. The subject must decide whether hedoes or does not taste the sucrose. The recorder should record the subject's re-sponses in the data sheet. A plus (+) should be marked for a correct response anda minus (-) for an incorrect response. Between each application, the subject shouldrinse his mouth briefly with a small quantity of water. Testing should continue un-til the entire row on the data sheet is completed (15 responses in all). Under nocircumstances should a test be repeated, or should more than three drops be appliedto the tongue.
13. Interchange the roles of tester, subject and recorder and repeat Steps 11and 12 until all members of your team have taken the test.
14. Rinse the cups and the droppers thoroughly with water.
15. Repeat Steps 1 to 14 using the .032 M NaC1 solution. The NaC1 dilutionsshould be prepared in the same manner as the sucrose dilutions.
16.- Repeat Steps 1 to 13 using the 64 x 10 -6 M saccharin solution. The saccha-rin dilutions are prepared in the same manner as the sucrose and NaC1 dilutions
tj(. 133
except that the cups should be relabeled as follows: 64 x 10 -6 M, 32 x 10 -6M,
16 x 10-6 M, 8 x 10 -6 M and 4 x 10⁻⁶ M.
DISCUSSION QUESTIONS:
1. What observations can you make about people's sensitivity to the tastes of
salt, sucrose and saccharin from the results of this activity?
2. Calculate the molecular mass of 6:lit (NaC1) and sucrose (C12 H 22
011
). Why
did this activity compare solutions of equal molarity rather than solutions contain-
ing equal masses of salt and sugar?
3. Do the results you obtained agree with the manufacturer's claim that,
"Saccharin is 300 to 500 times as sweet as sugar"?
4. How do your results compare with the value given for quinine in Section
37-1 of the Student Text?
5. How could this activity be converted into a "double-blind" test?
6. What mass of solute is needed to prepare 1000m1 of a.032M sucrose solution?
100 ml of a .032 M NaC1 solution? 100 ml of a 64 x 10 -6 M saccharin solution? (The
molecular formula oe saccharin is C7H5NO
3S.)
134
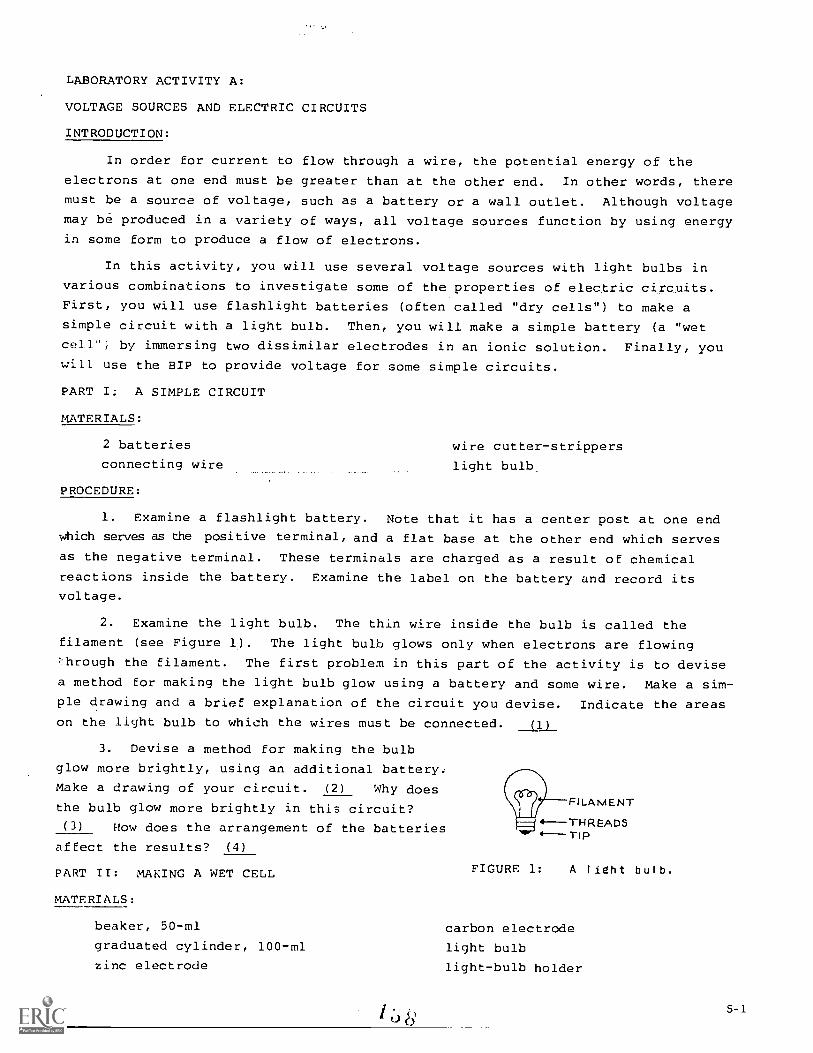
LABORATORY ACTIVITY A:
VOLTAGE SOURCES AND ELECTRIC CIRCUITS
INTRODUCTION:
In order for current to flow through a wire, the potential energy of the
electrons at one end must be greater than at the other end. In other words, there
must be a source of voltage, such as a battery or a wall outlet. Although voltage
may be produced in a variety of ways, all voltage sources function by using energy
in some form to produce a flow of electrons.
In this activity, you will use several voltage sources with light bulbs in
various combinations to investigate some of the properties of electric circuits.
First, you will use flashlight batteries (often called "dry cells") to make a
simple circuit with a light bulb. Then, you will make a simple battery (a "wet
cell") by immersing two dissimilar electrodes in an ionic solution. Finally, you
will use the BIP to provide voltage for some simple circuits.
PART I: A SIMPLE CIRCUIT
MATERIALS:
2 batteries wire cutter-strippers
connecting wire light bulb
PROCEDURE:
1. Examine a flashlight battery. Note that it has a center post at one endwhich serves as the positive terminal, and a flat base at the other end which servesas the negative terminal. These terminals are charged as a result of chemical
reactions inside the battery. Examine the label on the battery and record itsvoltage.
2. Examine the light bulb. The thin wire inside the bulb is called the
filament (see Figure 1). The light bulb glows only when electrons are flowing
:through the filament. The first problem in this part of the activity is to devise
a method for making the light bulb glow using a battery and some wire. Make a sim-
ple drawing and a brief explanation of the circuit you devise. Indicate the areas
on the light bulb to which the wires must be connected. (1)
3. Devise a method for making the bulb
glow more brightly, using an additional battery.
Make a drawing of your circuit. (2) Why does
the bulb glow more brightly in this circuit?
(3) How does the arrangement of the batteries
affect the results? (4)
PART II: MAKING A WET CELL
MATERIALS:
beaker, 50-ml
graduated cylinder, 100-ml
zinc electrode
FIGURE 1: A light bulb.
carbon electrode
light bulb
light-bulb holder
5-1

potassium dichromate, 0.2 M
sulfuric acid, 1.0 M
2 connecting wires with alligatorclips
wire cutter-strippers
screwdriver
PROCEDURE:
1. To make a wet cell, first mix approximately 20 ml of 1.0 M sulfuric acid
and 20 ml of 0.2 M potassium dichromate in a 50-ml beaker. The reactions that take
place between this ionic solution and the carbon and zinc electrodes provide the
energy needed to produce a voltage and a flow of current.
2. Screw the light bulb into the light-bulb holder. The threads and the tip
of the light bulb touch contacts inside the holder, which in turn are connected to
the two screws on the outside.
3. Attach the bare ends of the two alligator-clip connecting wires to the
screw connections on the light-bulb holder as shown in Figure 2. The wire should
be wound clockwise around the screw, so that a good connection is made as the screw
is tightened.
4. Attach one of the alligator clips to the carbon electrode, and place the
electrode in the ionic solution.
FIGURE 2:
CARBON ELECTRODE.ALLIGATOR CLIP
ZINC ELECTRODE
A. Making a simple wet cell. B. How to attach a wire to thescrew connection on thelight-bulb holder.
5. Attach the other alligator clip to the zinc strip. Then dip the zinc
electrode into the beaker, being careful to avoid touching the carbon electrode.
If all of the connections have been made properly, the light should go on. Examine
the two electrodes carefully and record any observations. (5) (Important: The
zinc electrode deteriorates rapidly if left in the acidic solution. Therefore,
make your observations as quickly as possible, and remove the zinc electrode when-
ever you are not observing the cell directly. The electrode should be rinsed thor-
oughly with water after it has been removed from the acidic solution.)
6. Does the wet cell light the bulb as brightly as the dry cell? (6) How
do you think the intensity of the light is related to the voltage provided by tne
cells? (7) How does the voltage of the wet cell compare with the voltage of the
dry cell? (8)
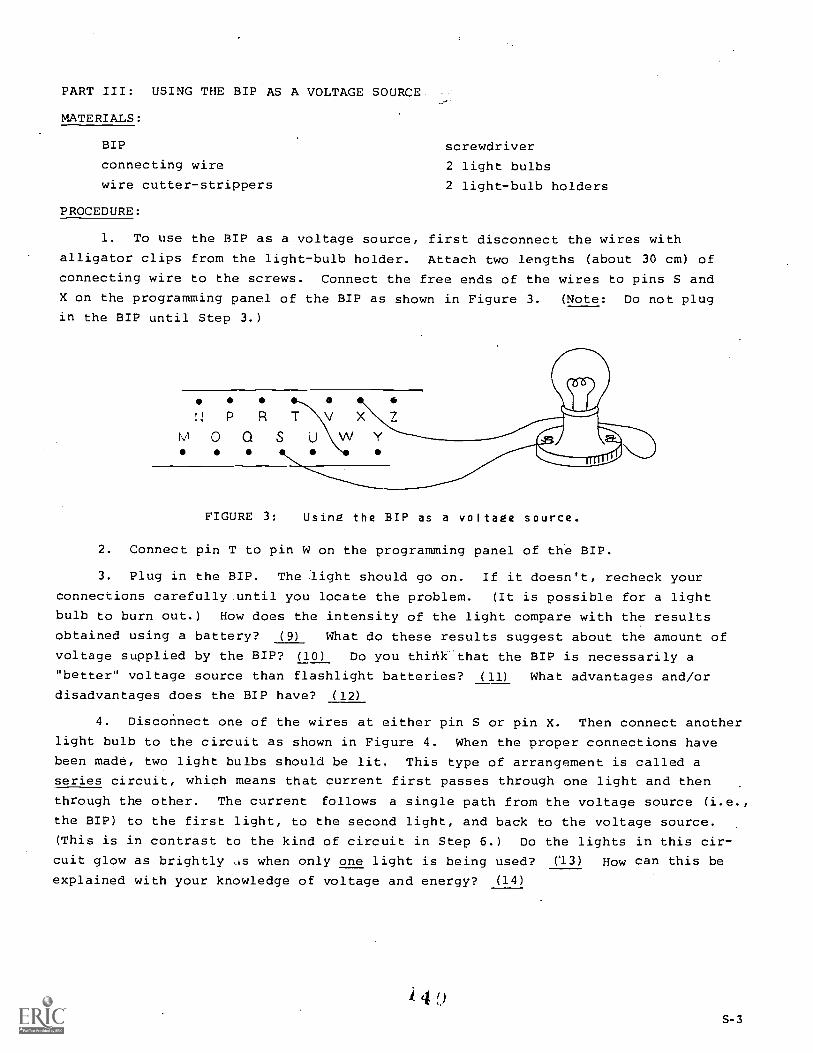
PART III: USING THE BIP AS A VOLTAGE SOURCE
MATERIALS:
BIP screwdriver
connecting wire 2 light bulbs
wire cutter-strippers 2 light-bulb holders
PROCEDURE:
1. To use the BIP as a voltage source, first disconnect the wires with
alligator clips from the light-bulb holder. Attach two lengths (about 30 cm) of
connecting wire to the screws. Connect the free ends of the wires to pins S and
X on the programming panel of the BIP as shown in Figure 3. (Note: Do not plug
in the BIP until Step 3.)
:IP R T V X
M 0 Q S i.JWY
FIGURE 3: Using the BIP as a voltage source.
2. Connect pin T to pin W on the programming panel of the BIP.
3. Plug in the BIP. The light should go on. If it doesn't, recheck your
connections carefully until you locate the problem. (It is possible for a light
bulb to burn out.) How does the intensity of the light compare with the results
obtained using a battery? (9) What do these results suggest about the amount of
voltage supplied by the BIP? (10) Do you think that the BIP is necessarily a
"better" voltage source than flashlight batteries? (11) What advantages and/or
disadvantages does the BIP have? (12)
4. Disconnect one of the wires at either pin S or pin X. Then connect another
light bulb to the circuit as shown in Figure 4. When the proper connections have
been made, two light bulbs should be lit. This type of arrangement is called a
series circuit, which means that current first passes through one light and then
through the other. The current follows a single path from the voltage source (i.e.,
the BIP) to the first light, to the second light, and back to the voltage source.
(This is in contrast to the kind of circuit in Step 6.) Do the lights in this cir-
cuit glow as brightly ...Ls when only one light is being used? ('13) How can this be
explained with your knowledge of voltage and energy? (14)
A4/)S-3
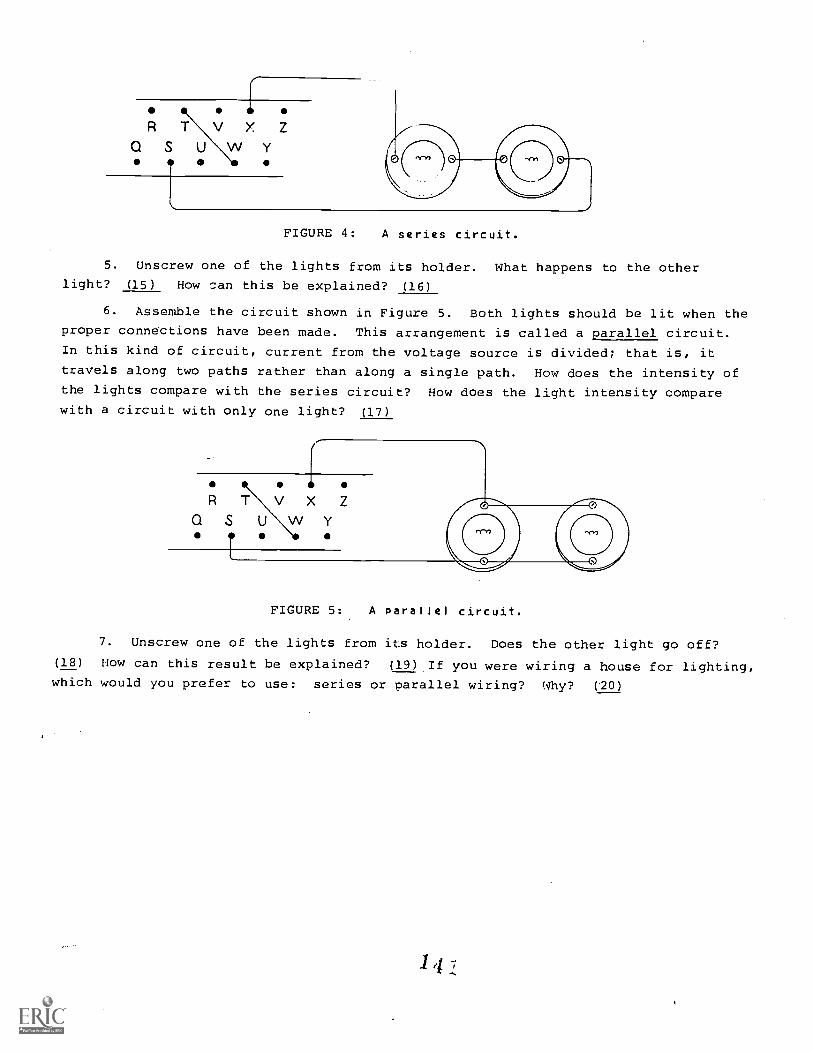
iiV X ZQSUWY
FIGURE 4: A series circuit.
5. Unscrew one of the lights from its holder. What happens to the otherlight? (15) How can this be explained? (16)
6. Assemble the circuit shown in Figure 5. Both lights should be lit when the
proper connections have been made. This arrangement is called a parallel circuit.
In this kind of circuit, current from the voltage source is divided; that is, it
travels along two paths rather than along a single path. How does the intensity ofthe lights compare with the series circuit? How does the light intensity comparewith a circuit with only one light? (17)
R T ViX Zas uwy
FIGURE 5: A parallel circuit.
7. Unscrew one of the lights from its holder. Does the other light go off?
(18) How can this result be explained? (19) If you were wiring a house for lighting,which would you prefer to use: series or parallel wiring? Why? (20)
LABORATORY ACTIVITY C:
THE EFFECT OF RESISTANCE ON CURRENT
INTRODUCTION:
Electric current, if properly controlled, can be used for a wide variety of
tasks such as lighting a light bulb, producing music on a loudspeaker or running a
computer. Consequently, controlling the amount of current in a circuit is one of
the most important electrical problems. We have already mentioned in Sections A and
B that current is affected by both voltage and resistance. For example, increasing
the voltage in a circuit also increases the current. Therefore, a light bulb glows
more brightly if two flashlight batteries are used instead of one.
Resistance also can be used to control current. The purpose of this activity
is to investigate the nature of the relationship between current and resistance when
the voltage is kept constant. In other words, how does a change in resistance af-fect the current?
To answer this question, a constant voltage is applied to different lengths of
a long wire, and the current flowing through the wire is measured. The source of
voltage is the BIP; the BIP is also used for measuring current. The resistance in
the circuit is adjusted by varying the length of the wire. Doubling the length of
the wire increases the resistance by a factor of two. In other words, the resistance
is directly proportional to the length of the wire. This means that our units for
resistance can be expressed in units of length--in this case, in centimeters.
The data collected for the activity should list the amount of current associ-
ated with various lengths of wire. It is then possible to graph current versus
the length of the wire in order to determine the effect of resistance on current.
MATERIALS:
BIP wire cutter-strippers
310 cm nichrome wire tape
connecting wire meter stick
2 connecting wires with alligatorclips on one end
PROCEDURE:
1. Obtain a length of nichrome wire approximately 310 cm long. Tape it
to a meter stick as shown in the figure on the following page. Keep the wire asstraight as possible. Different parts of the wires should not touch each other. It
may be desirable to tape the meter stick to the table to prevent the meter stick
from moving.
2. Program the BIP as shown in the figure. Attach the alligator clip that is
connected to pin G to the nichrome wire next to the "zero" on the meter stick. Plug
in the BIP.
3. Touch the alligator clip that is connected to Pin S to the free end of the
nichrome wire. At this point, the potential difference supplied by the BIP should
be across a total length of 300 cm of nichrome wire.

BD F H J L NPR T V X ZACEG I K M\OQSUWY
AI-LI&ATORC.1-11=.
mow:tome WIREIII Iii
I. sc.3,mi.1,,1,1.1.1.1,,,Iiiii.1.,,,i,1,,,i.1,,, 111111111111 1 II
TAPE
4. Hold the clip firmly against the nichrome wire (it is not necessary to
hold the wire between the jaws of the clip). Adjust the mA dial until the diode
lights null. The reading on the dial is the current in milliamperes that is flow-
ing through the wire. (A milliampere equals 10-3 amperes. Therefore, 100 mA equals
0.10 A.) Record your reading in a data sheet similar to the one shown below.
5. Move the alligator clip (connected
to pin S) to a position 20 cm down the
meter stick. The potential difference
should now be across a total of 280 cm.
Readjust the mA dial until the diode lights
null. Record your reading.
6. Repeat Step 5 at different posi-
tions on the meter stick until you have a
series of current readings corresponding
to lengths down to 140 cm.
7. Prepare a graph plotting the cur-
rent readings against the length of the
wire. (Since current is the dependent
variable in the investigation, the current
axis).
Length ofNichromeWire (cm)
Current(mA)
1
Current
300
280
160
140
values should be plotted on the vertical
8. Calculate the inverse of each of your current readings and enter these
values in your data sheet. Prepare another graph plotting resistance (in terms of1
cm of nichrome wire) versus (current).
DISCUSSION QUESTIONS:
1. How is the flow of current affected by an increase in the length of
wire? by a decrease in the length of the wire?
2. From the results of the activity, does it appear that current and resis-
tance are directly proportional, or inversely proportional? Why?
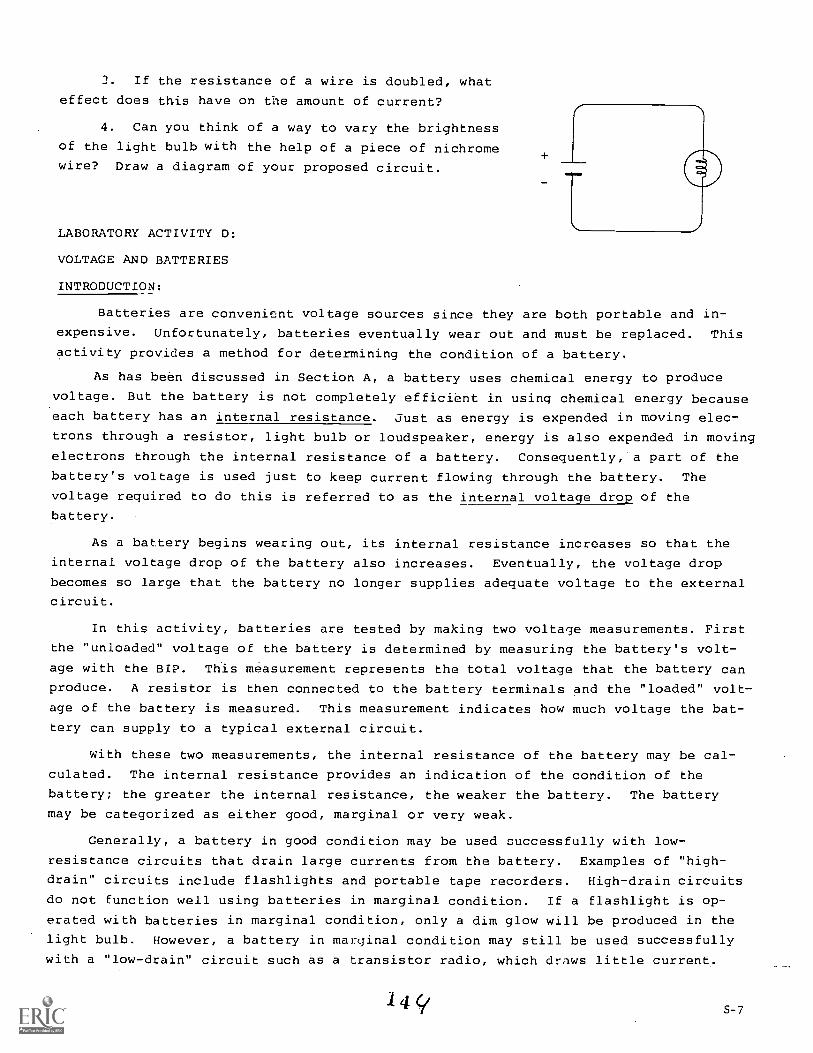
2. If the resistance of a wire is doubled, what
effect does this have on the amount of current?
4. Can you think of a way to vary the brightness
of the light bulb with the help of a piece of nichrome
wire? Draw a diagram of your proposed circuit.
LABORATORY ACTIVITY D:
VOLTAGE AND BATTERIES
INTRODUCTION:
Batteries are convenient voltage sources since they are both portable and in-
expensive. Unfortunately, batteries eventually wear out and must be replaced. This
activity provides a method for determining the condition of a battery.
As has been discussed in Section A, a battery uses chemical energy to produce
voltage. But the battery is not completely efficient in using chemical energy because
each battery has an internal resistance. Just as energy is expended in moving elec-
trons through a resistor, light bulb or loudspeaker, energy is also expended in moving
electrons through the internal resistance of a battery. Consequently, a part of the
battery's voltage is used just to keep current flowing through the battery. The
voltage required to do this is referred to as the internal voltage drop of the
battery.
As a battery begins wearing out, its internal resistance increases so that the
internal voltage drop of the battery also increases. Eventually, the voltage drop
becomes so large that the battery no longer supplies adequate voltage to the external
circuit.
In this activity, batteries are tested by making two voltage measurements. First
the "unloaded" voltage of the battery is determined by measuring the battery's volt-
age with the BIP. This measurement represents the total voltage that the battery can
produce. A resistor is then connected to the battery terminals and the "loaded" volt-
age of the battery is measured. This measurement indicates how much voltage the bat-
tery can supply to a typical external circuit.
With these two measurements, the internal resistance of the battery may be cal-
culated. The internal resistance provides an indication of the condition of the
battery; the greater the internal resistance, the weaker the battery. The battery
may be categorized as either good, marginal or very weak.
Generally, a battery in good condition may be used successfully with low-
resistance circuits that drain large currents from the battery. Examples of "high-
drain" circuits include flashlights and portable tape recorders. High-drain circuits
do not function well using batteries in marginal condition. If a flashlight is op-
erated with batteries in marginal condition, only a dim glow will be produced in the
light bulb. However, a battery in marginal condition may still be used successfully
with a "low-drain" circuit such as a transistor radio, which draws little current.
14. S-7
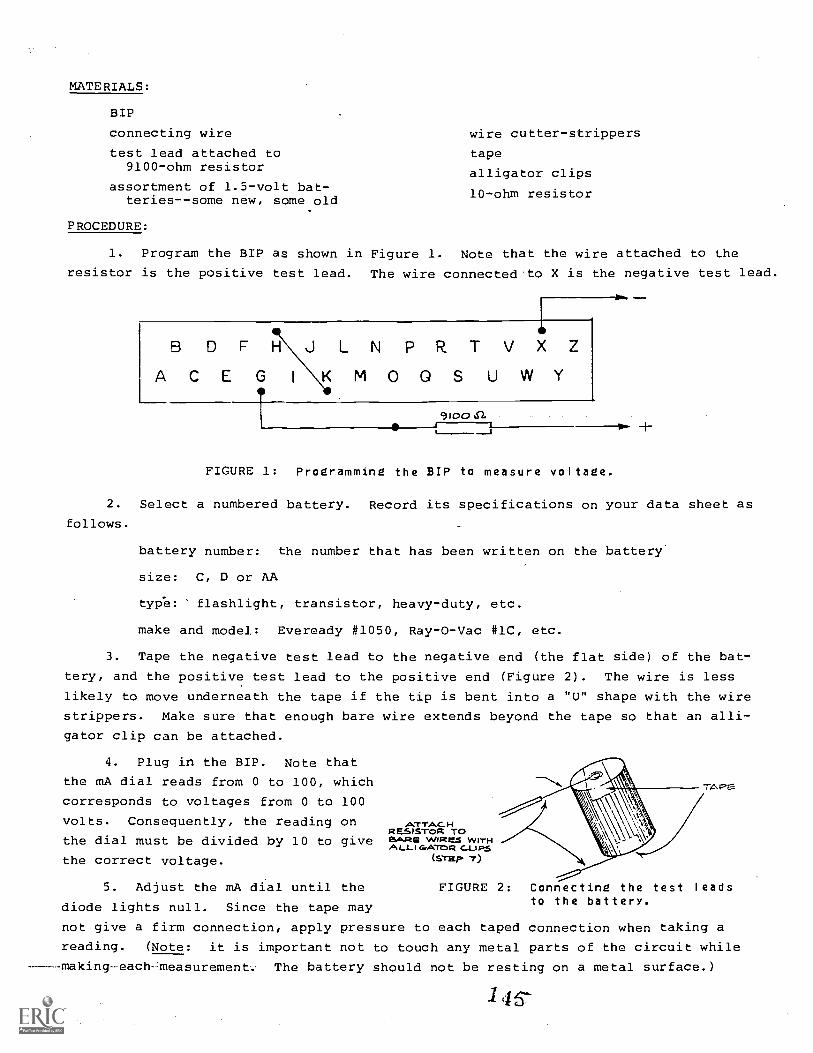
MATERIALS:
BIP
connecting wire
test lead attached to9100-ohm resistor
assortment of 1.5-volt bat-teries--some new, some old
PROCEDURE:
1. Program the BIP as shown in Figure 1.
resistor is the positive test lead. The wire
wire cutter-strippers
tape
alligator clips
10-ohm resistor
Note that the wire attached to the
connected to X is the negative test lead.
BDFACE G
LNPR T V X Z
MOOS UWY9100 a
FIGURE 1: Programming the BIP to measure voltage.
2. Select a numbered battery. Record its specifications on your data sheet as
follows.
battery number: the number that has been written on the battery
size: C, D or AA
type:' flashlight, transistor, heavy-duty, etc.
make and model: Eveready #1050, Ray-O-Vac #1C, etc.
3. Tape the negative test lead to the negative end (the flat side) of the bat-
tery, and the positive test lead to the positive end (Figure 2). The wire is less
likely to move underneath the tape if the tip is bent into a "U" shape with the wire
strippers. Make sure that enough bare wire extends beyond the tape so that an alli-
gator clip can be attached.
4. Plug in the BIP. Note that
the mA dial reads from 0 to 100, which
corresponds to voltages from 0 to 100
volts. Consequently, the reading on
the dial must be divided by 10 to give
the correct voltage.
5. Adjust the mA dial until the
diode lights null. Since the tape may
not give a firm connection, apply pressure to each taped connection when taking a
reading. (Note: it is important not to touch any metal parts of the circuit while
----making-eachmeasurement. The battery should not be resting on a metal surface.)
A.7TACHRESISTOR TOBARR WoRes WITHALLIGrAToRcups
(Wrap. 7)
FIGURE 2: Connecting the test leadsto the battery.
S-8146--
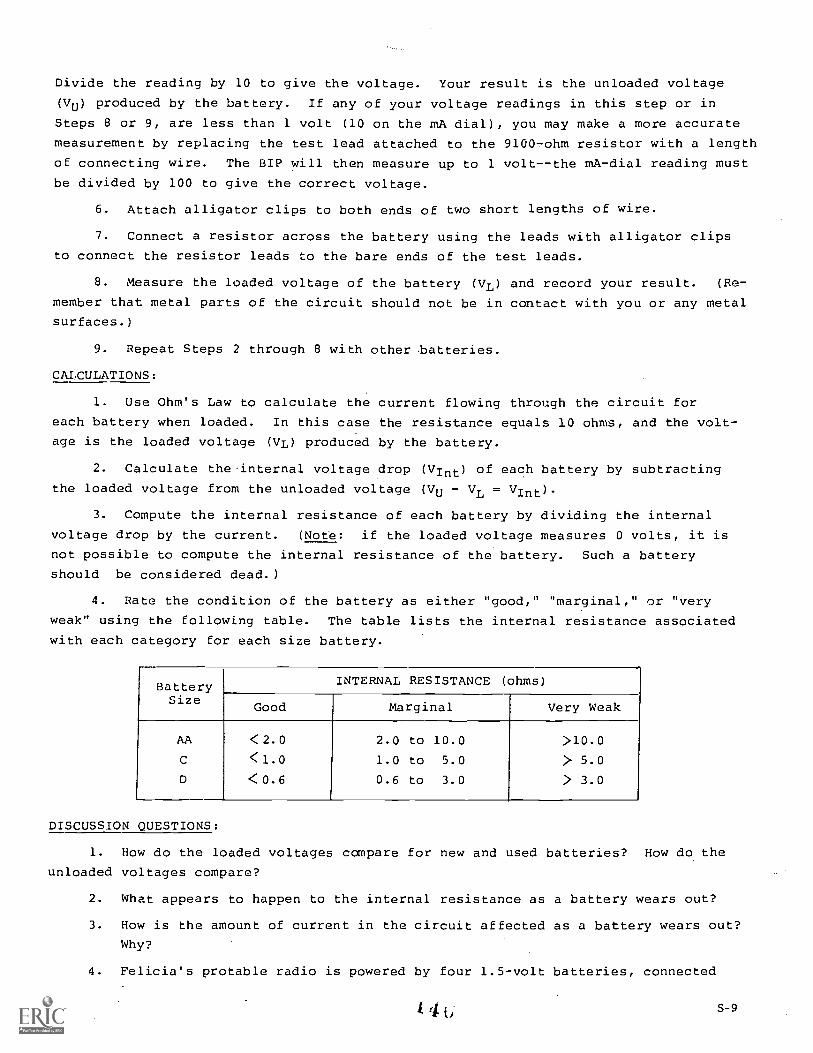
Divide the reading by 10 to give the voltage. Your result is the unloaded voltage
(Vu) produced by the battery. If any of your voltage readings in this step or in
Steps 8 or 9, are less than 1 volt (10 on the mA dial), you may make a more accurate
measurement by replacing the test lead attached to the 9100-ohm resistor with a length
of connecting wire. The BIP will then measure up to 1 volt--the mA-dial reading must
be divided by 100 to give the correct voltage.
6. Attach alligator clips to both ends of two short lengths of wire.
7. Connect a resistor across the battery using the leads with alligator clips
to connect the resistor leads to the bare ends of the test leads.
8. Measure the loaded voltage of the battery (VL) and record your result. (Re-
member that metal parts of the circuit should not be in contact with you or any metal
surfaces.)
9. Repeat Steps 2 through 8 with other batteries.
CALCULATIONS:
1. Use Ohm's Law to calculate the current flowing through the circuit for
each battery when loaded. In this case the resistance equals 10 ohms, and the volt-
age is the loaded voltage (VL) produced by the battery.
2. Calculate theinternal voltage drop (Vint) of each battery by subtracting
the loaded voltage from the unloaded voltage (VU VL = Vint).
3. Compute the internal resistance of each battery by dividing the internal
voltage drop by the current. (Note: if the loaded voltage measures 0 volts, it is
not possible to compute the internal resistance of the battery. Such a battery
should be considered dead.)
4. Rate the condition of the battery as either "good," "marginal," or "very
weak" using the following table. The table lists the internal resistance associated
with each category for each size battery.
Battery INTERNAL RESISTANCE (ohms)
SizeGood Marginal Very Weak
AA <2.0 2.0 to 10.0 >10.0
C <1.0 1.0 to 5.0 > 5.0
D < 0.6 0.6 to 3.0 > 3.0
DISCUSSION QUESTIONS:
1. How do the loaded voltages compare for new and used batteries? How do the
unloaded voltages compare?
2. What appears to happen to the internal resistance as a battery wears out?
3. How is the amount of current in the circuit affected as a battery wears out?
Why?
4. Felicia's protable radio is powered by four 1.5-volt batteries, connected
I It S- 9
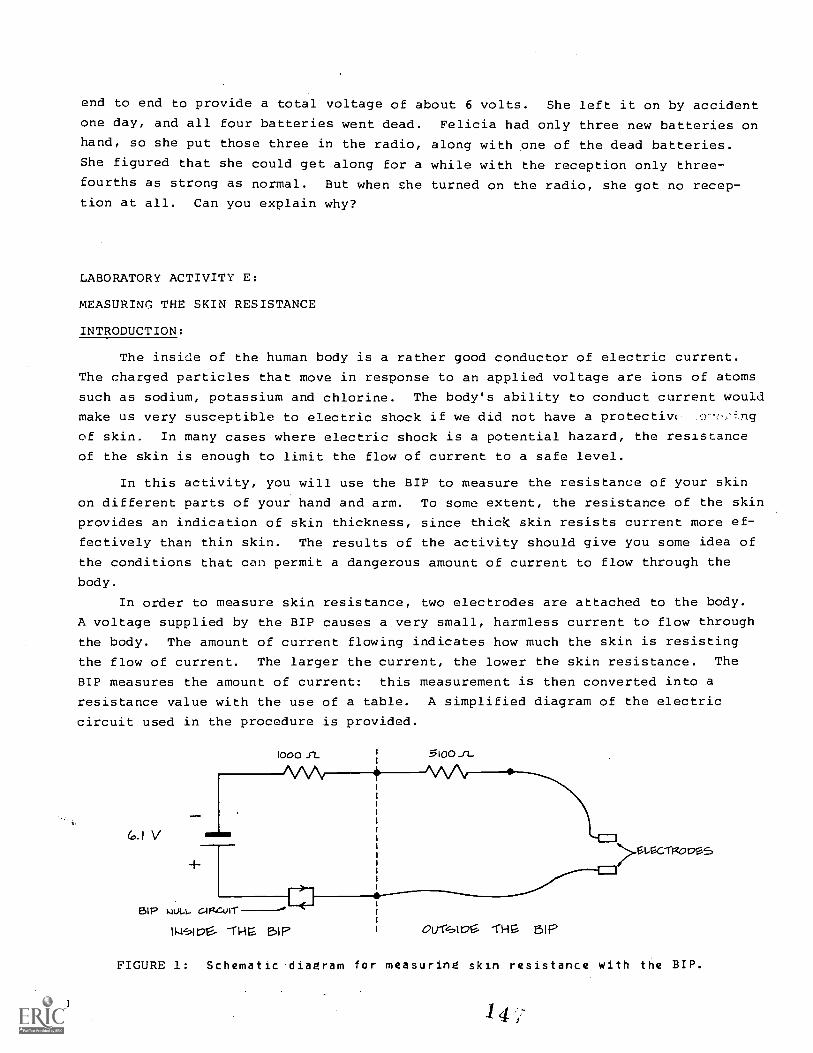
end to end to provide a total voltage of about 6 volts. She left it on by accident
one day, and all four batteries went dead. Felicia had only three new batteries on
hand, so she put those three in the radio, along with one of the dead batteries.
She figured that she could get along for a while with the reception only three-
fourths as strong as normal. But when she turned on the radio, she got no recep-tion at all. Can you explain why?
LABORATORY ACTIVITY E:
MEASURING THE SKIN RESISTANCE
INTRODUCTION:
The inside of the human body is a rather good conductor of electric current.
The charged particles that move in response to an applied voltage are ions of atoms
such as sodium, potassium and chlorine. The body's ability to conduct current would
make us very susceptible to electric shock if we did not have a protective
of skin. In many cases where electric shock is a potential hazard, the resistance
of the skin is enough to limit the flow of current to a safe level.
In this activity, you will use the BIP to measure the resistance of your skin
on different parts of your hand and arm. To some extent, the resistance of the skin
provides an indication of skin thickness, since thick skin resists current more ef-
fectively than thin skin. The results of the activity should give you some idea of
the conditions that can permit a dangerous amount of current to flow through the
body.
In order to measure skin resistance, two electrodes are attached to the body.
A voltage supplied by the BIP causes a very small, harmless current to flow through
the body. The amount of current flowing indicates how much the skin is resisting
the flow of current. The larger the current, the lower the skin resistance. The
BIP measures the amount of current: this measurement is then converted into a
resistance value with the use of a table. A simplified diagram of the electric
circuit used in the procedure is provided.
40.1 V
1000 XL 51001L..
BIP ktuL.t. CAP2Zurr--4'
si "TH5. IN F' Otrre-At9E THE BIP
...6L.isc1 t.zyPES
FIGURE 1: Schematic diagram for measuring skin resistance with the BIP.
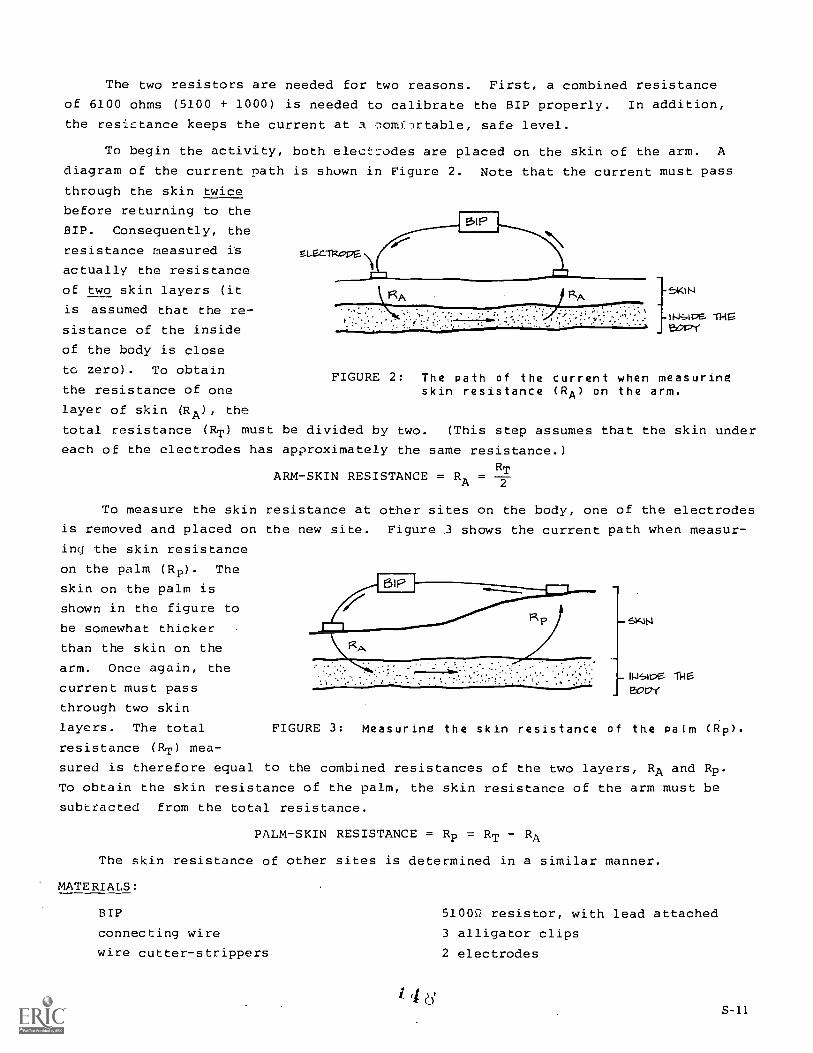
The two resistors are needed for two reasons. First, a combined resistance
of 6100 ohms (5100 + 1000) is needed to calibrate the BIP properly. In addition,
the resistance keeps the current at a nomOrtable, safe level.
To begin the activity, both electrodes are placed on the skin of the arm. A
diagram of the current path is shown in Figure 2. Note that the current must pass
through the skin twice
before returning to the
BIP. Consequently, the
resistance measured is
actually the resistance
RAis assumed that the re-
two skin layers (it RA SKIN
gLEcllzopE
IN.Sive TH5sistance of the inside eot;,..r
of the body is close
to zero). To obtain
the resistance of one
layer of skin (RA), the
total resistance (RT) must be divided by two. (This step assumes that the skin under
each of the electrodes has approximately the same resistance.)
FIGURE 2: The Path of the current when measuringskin resistance (RA) on the arm.
RTARM-SKIN RESISTANCE = RA =
To measure the skin resistance at other sites on the body, one of the electrodes
is removed and placed on the new site. Figure .3 shows the current path when measur-
ing the skin resistance
on the palm (Rp). The
skin on the palm is
shown in the figure to
be somewhat thicker
than the skin on the
arm. Once again, the
current must pass
through two skin
layers. The total
resistance (RT) mea-
sured is therefore equal to the combined resistances of the two layers, RA and Rp.
To obtain the skin resistance of the palm, the skin resistance of the arm must be
subtracted from the total resistance.
PALM-SKIN RESISTANCE = Rp = RT RA
The skin resistance of other sites is determined in a similar manner.
MATERIALS:
BIP 51000 resistor, with lead attached
connecting wire 3 alligator clips
wire cutter-strippers 2 electrodes
- SKIN
- 114411:75 114 E
eonl,
FIGURE 3: Measuring the skin resistance of the Palm (Rp).
S - 1 1
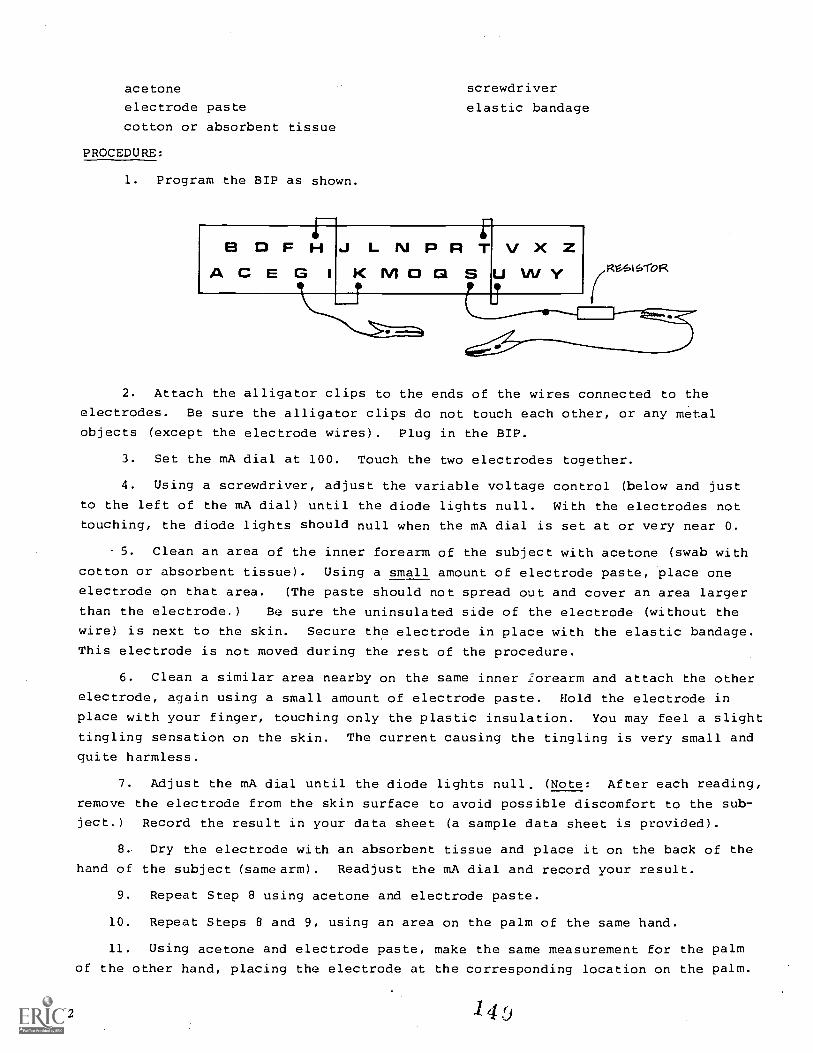
acetone
electrode paste
cotton or absorbent tissue
PROCEDURE:
1. Program the BIP as shown.
FBDFHJ LNPRTACEG I KIVIOG1S
screwdriver
elastic bandage
V X ZUWY RV,61S1-05Z
2. Attach the alligator clips to the ends of the wires connected to the
electrodes. Be sure the alligator clips do not touch each other, or any metal
objects (except the electrode wires). Plug in the BIP.
3. Set the mA dial at 100. Touch the two electrodes together.
4. Using a screwdriver, adjust the variable voltage control (below and just
to the left of the mA dial) until the diode lights null. With the electrodes not
touching, the diode lights should null when the mA dial is set at or very near 0.
5. Clean an area of the inner forearm of the subject with acetone (swab with
cotton or absorbent tissue). Using a small amount of electrode paste, place one
electrode on that area. (The paste should not spread out and cover an area larger
than the electrode.) Be sure the uninsulated side of the electrode (without the
wire) is next to the skin. Secure the electrode in place with the elastic bandage.
This electrode is not moved during the rest of the procedure.
6. Clean a similar area nearby on the same inner forearm and attach the other
electrode, again using a small amount of electrode paste. Hold the electrode in
place with your finger, touching only the plastic insulation. You may feel a slight
tingling sensation on the skin. The current causing the tingling is very small and
quite harmless.
7. Adjust the mA dial until the diode lights null. (Note: After each reading,
remove the electrode from the skin surface to avoid possible discomfort to the sub-
ject.) Record the result in your data sheet (a sample data sheet is provided).
8. Dry the electrode with an absorbent tissue and place it on the back of the
hand of the subject (same arm). Readjust the mA dial and record your result.
9. Repeat Step 8 using acetone and electrode paste.
10. Repeat Steps 8 and 9, using an area on the palm of the same hand.
11. Using acetone and electrode paste, make the same measurement for the palm
of the other hand, placing the electrode at the corresponding location on the palm.
S-12
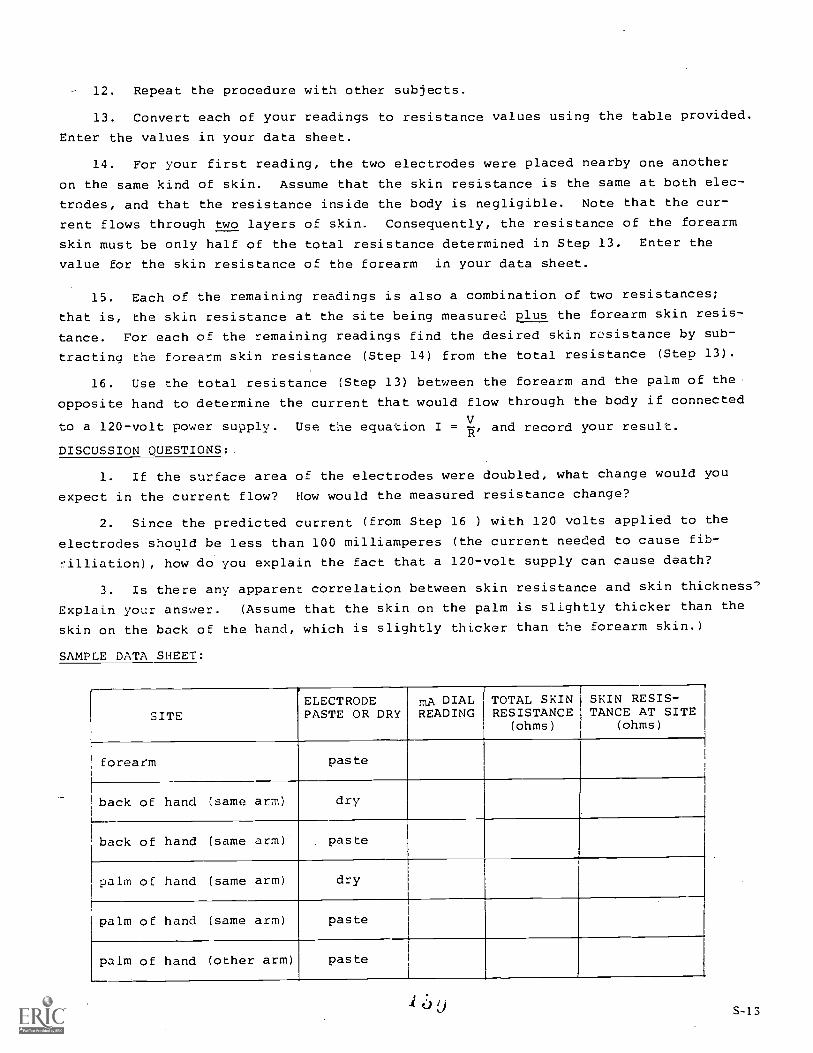
12. Repeat the procedure with other subjects.
13. Convert each of your readings to resistance values using the table provided.
Enter the values in your data sheet.
14. For your first reading, the two electrodes were placed nearby one another
on the same kind of skin. Assume that the skin resistance is the same at both elec-
trodes, and that the resistance inside the body is negligible. Note that the cur-
rent flows through two layers of skin. Consequently, the resistance of the forearm
skin must be only half of the total resistance determined in Step 13. Enter the
value for the skin resistance of the forearm in your data sheet.
15. Each of the remaining readings is also a combination of two resistances;
that is, the skin resistance at the site being measured plus the forearm skin resis-
tance. For each of the remaining readings find the desired skin rosistance by sub-
tracting the forearm skin resistance (Step 14) from the total resistance (Step 13).
16. Use the total resistance (Step 13) between the forearm and the palm of the
opposite hand to determine the current that would flow through the body if connected
to a 120-volt power supply. Use the equation I =V-
'
and record your result.R
DISCUSSION QUESTIONS:
1. If the surface area of the electrodes were doubled, what change would you
expect in the current flow? How would the measured resistance change?
2. Since the predicted current (from Step 16 ) with 120 volts applied to the
electrodes should be less than 100 milliamperes (the current needed to cause fib-
illiation), how do you explain the fact that a 120-volt supply can cause death?
3. Is there any apparent correlation between skin resistance and skin thickness'
Explain your answer. (Assume that the skin on the palm is slightly thicker than the
skin on the back of the hand, which is slightly thicker than the forearm skin.)
SAMPLE DATA SHEET:
T
I
'ELECTRODEPASTE OR DRY
mA DIALREADING
TOTAL SKINRESISTANCE
(ohms)
SKIN RESIS-TANCE AT SITE
(ohms)
forearm paste
back of hand (same arm) dry
back of hand (same arm) paste
palm of hand (same arm) dry
palm of hand (same arm) paste
palm of hand (other arm) paste
S-13

mA DIALREADING
RESISTANCE(ohms)
0
1 600,000
2 300,000
3 197,000
4 146,000
5 116,000
6 95,600
7 81,000
3 70,200
9 61,700
10 54,900
11 49,400
12 44,700
13 40,800
14 37,500
15 34,600
16 32,000
mA DIALREADING
RESISTANCE(ohms)
17 29,800
18 27,800
19 26,000
20 24,400
21 22,900
22 21,600
23 20;400
24 19,300
25 18,300
26 17,400
27 16,500
28 15,700
29 14,900
30 14,200
31 13,600
32 13,000
33 12,400
mA DIALREADING
RESISTANCE(ohms)
34 11,800
35 11,300
36 10,800
37 10,400
38 9,950
39 9,540
40 9,150
41 8,780
42 8,420
43 8,090
44 7,760
45 7,460
46 7,160
47 6,880
48 6,610
49 6,350
50 6,100