Embed Size (px)
Citation preview
TEMPORAL EVALUATION OF AN EX VIVO BIOREACTOR
MODEL OF ABDOMINAL AORTIC ANEURYSM
EMILY RUTH CLARK
Submitted in accordance with the requirements for the degree of
Doctor of Philosophy
The University of Leeds
School of Mechanical Engineering
May 2016

i
The candidate confirms that the work submitted is her own, except where
otherwise stated or where work which has formed part of jointly authored
publications has been included. The contribution of the candidate and the other
authors to this work has been explicitly indicated below. The candidate confirms
that appropriate credit has been given within the thesis where reference has been
made to work of others.
A portion of the work in Chapter 5 of the thesis has appeared in publication as
follows:
Exploring smooth muscle phenotype and function in a bioreactor model of
abdominal aortic aneurysm (2013) Kirsten Riches, Timothy G Angelini, Gurprit
S Mudhar, Jean Kaye, Emily Clark, Marc A Bailey, Sourosh Sohrabi, Sotirios
Korossis, Peter G Walker, D Julian A Scott, Karen E Porter.
I was responsible for conducting the porcine immunohistochemical studies and
capturing images for publication. The contribution of the other authors was
leading and participating in execution of porcine and human cellular studies and
manuscript drafting (Riches), conducting human cell studies (Angelini),
conducting porcine cell studies (Mudhar), designing and developing the
bioreactor (Korossis and Walker), establishing and running the bioreactor
experiments (Kaye and Porter), design and performance of apoptosis studies
(Bailey), responsibility for all aspects of porcine surgery (Sohrabi), obtaining
funding and providing clinical perspective (Scott) and conceiving and managing
the study with overall responsibility for its execution (Porter).
This copy has been supplied on the understanding that it is copyright material
and that no quotation from the thesis may be published without proper
acknowledgement.
© 2016 The University of Leeds and Emily Ruth Clark
The right of Emily Ruth Clark to be identified as the Author of this work has
been asserted by her in accordance with the Copyright, Designs and Patents Act
1988.

ii
I. ACKNOWLEDGEMENTS
Firstly, my thanks must go to my supervisors Dr. Karen Porter (who took me
on and believed in an engineer) and Dr. Louise Jennings (who kindly agreed to
take me on at a late stage). Thank you so much to you both for making this
project work despite initial difficulties and providing expert guidance along the
way. I am very grateful to Karen for helping me to feel at home in biological
sciences.
I have learned so much during the course of this thesis and a large majority of
this is thanks to Dr. Kirsty Riches. You are a very patient and wise woman and
much of my knowledge is directly from you.
This work would not have been possible without the surgical expertise of Marc
Bailey, Katy Bridge and Kathryn Griffin. Thank you for putting in those early
mornings!
Thank you to everyone in LICAMM for your scientific and non-scientific
support, especially Karen, Aliah and Patri. Those endless days in cell culture
would have been even more awful without you.
Another thanks must go to those who were subjected to the CDTMBE
programme alongside me. You have all become very valuable friends and I hope
to carry this on far into the future. Jeni, Steve and Ash you are the best results
of this PhD, if only I could publish you too.
Thanks to Chris and to my mum for moral support during the troughs and for
your shared happiness in the peaks.
All I can say is…..PHEW!
iii
II. ABSTRACT
Abdominal aortic aneurysm (AAA) is an asymptomatic dilatation of the
abdominal aorta which ultimately leads to rupture without intervention. Rupture
is typically fatal. Due to the silent nature of the disease, the National Abdominal
Aortic Aneurysm Screening Programme (NAAASP) has recently been
implemented in the UK. It is an unprecedented opportunity to explore the nature
of early AAA development and uncover new targets for therapeutics.
Smooth muscle cells (SMCs) are the principle component of the arterial wall
and have the ability to stabilise the pathological remodelling which is
characteristic of AAA. In AAA tissue, SMCs have been shown to be
dysfunctional. Phenotypic switching of SMCs has been reported as an early
event in AAA development.
The aim of this study was therefore to further characterise an ex vivo porcine
model of AAA and temporally characterise SMC phenotype. The approach was
to harvest porcine carotid arteries and subject them to a protease pre-treatment.
They were then cultured under flow and pressure in a vascular bioreactor for
specified periods of time to model the early and end stage of AAA. The model
was then temporally characterised in terms of the structure and function of
arterial tissue and SMCs. This study directly followed a previous study in our
laboratory which validated SMCs from the end-stage model with human AAA
SMCs.
Histology and immunohistochemistry for SMCs and components of the
extracellular matrix were used to qualitatively analyse tissue structure in the
early and end-stage models. Uniaxial tensile testing was used to
biomechanically characterise the function of the tissue. Whole vessel pressure-
dilation analysis was also evaluated as a method of biomechanical
characterisation for this model.
The structure of the SMCs in the early and end-stage models were characterised
using image analysis and fluorescence microscopy of the actin cytoskeleton.
SMC circularity was an indication of a change in phenotype. The function of
iv
the SMCs was also assessed using proliferation assays, scratch wound migration
assays, senescence associated beta-galactosidase assays and gelatin
zymography for matrix metalloproteinase-2 and 9 (MMP-2 and -9).
It was determined that a combination of the protease pre-treatment and
bioreactor culture was required to induce the phenotypic switch seen previously
in the end-stage model. This study managed to reproduce the results seen in the
previous study; in the end-stage model, protease pre-treatment followed by
bioreactor culture for twelve days induced an increase in SMC circularity,
impaired proliferation, elevated levels of senescence and decreased levels of
MMP secretion. These characteristics are also observed in human AAA SMCs.
A period of SMC hyperproliferation was also observed in the early-stage model.
The SMCs had not yet undergone the phenotypic switch characteristic of the
end-stage model. The SMCs were also more active in terms of MMP secretion
and had much lower levels of senescence compared to the end-stage model.
In terms of tissue structure, Sirius Red histological staining revealed a peri-
luminal deposition of collagen in the end-stage model which was not present in
the early-stage model. It was hypothesised that this was an attempt at an ECM
stabilisation mechanism. The early-stage model also reached aneurysmal
dimensions but inwards remodelling of the artery had occurred by the end stage
of the model.
Uniaxial tensile testing revealed that culture in the bioreactor caused arterial
remodelling regardless of pre-treatment. Generally, vessels which received
protease pre-treatment tended to be thinner, weaker and less compliant then
those without pre-treatment.
This study shows that it may not be appropriate to characterise AAA SMCs
according to classical SMC phenotype. The early-stage model may be used to
illuminate potential targets which is particularly pertinent given the recent
advent of AAA screening, providing a window of opportunity for early
therapeutic intervention.
v
III. STATEMENT OF WORK
During the course of this study, people additional to the candidate have
contributed to the work.
Animal sacrifice was conducted under the Humane Killing of Animals under
Schedule 1 to the Animals (Scientific Procedures) Act 1986 and was carried out
by the technicians of Central Biomedical Services.
A Home Office Project License was not required for this project as no regulated
procedures were performed as part of the experiments. All experiments were
performed on tissue following Schedule 1 procedure.
Tissue harvesting and surgical expertise were carried out variously by Marc
Bailey, Katy Bridge and Kathryn Griffin.
Morphology images and proliferation data for one end-stage AAA model
experiment were conducted by Gurprit Mudhar, an intercalating BSc Medical
Sciences student.
vi
IV. TABLE OF CONTENTS
I. Acknowledgements………………………………………………ii
II. Abstract………………………………………………………….iii
III. Statement of work………………………………………………..v
IV. Contents…………………………………………………….........vi
V. List of figures……………………………………………………xi
VI. List of tables……………………………………………………xvi
VII. Abbreviations………………………………………………….xvii
VIII. Project specific nomenclature…………………………………xix
CHAPTER 1 Introduction .............................................................................. 2
1.1. Abdominal aortic aneurysms ............................................................... 2
1.2. Epidemiology ...................................................................................... 3
1.2.1. Risk factors .................................................................................. 5
1.3. Treatment options for AAA ................................................................ 6
1.4. Arterial anatomy .................................................................................. 9
1.5. Characteristics of AAA ..................................................................... 12
1.5.1. Histological markers .................................................................. 12
1.5.2. Biomechanical behaviour ........................................................... 14
1.6. Atherosclerosis and AAA.................................................................. 21
1.7. AAA Pathophysiology ...................................................................... 22
1.7.1. Extracellular matrix degradation ................................................ 23
1.7.2. Role of the intra-luminal thrombus ............................................ 26
1.7.3. Oxidative stress .......................................................................... 26
1.7.4. Inflammation .............................................................................. 27
1.7.5. Role of the smooth muscle cell in AAA .................................... 29
1.7.6. AAA Haemodynamics ............................................................... 35
1.8. Animal models of AAA .................................................................... 39
1.8.1. Species selection ........................................................................ 40
1.8.2. Methods of experimental AAA creation .................................... 45
1.8.3. Biomechanical characterisation of AAA models ....................... 55
1.9. Bioreactors in vascular research ........................................................ 56
1.9.1. Bioreactor models of AAA ........................................................ 57
vii
1.10. Conclusions ................................................................................... 58
1.11. Project rationale ............................................................................. 59
1.12. Aims and objectives....................................................................... 59
CHAPTER 2 Materials and Methods ........................................................... 62
2.1. Suppliers of materials and reagents ................................................... 62
2.2. General experimental approach ......................................................... 63
2.2.1. Experimental tissue groups ........................................................ 64
2.3. Media and reagent composition ........................................................ 66
2.4. Cell culture techniques ...................................................................... 66
2.4.1. Cell passaging ............................................................................ 66
2.4.2. Cell counting .............................................................................. 67
2.4.3. Cell cryopreservation ................................................................. 67
2.5. Primary smooth muscle cell isolation ............................................... 69
2.6. Preparation of arterial tissue .............................................................. 71
2.6.1. Fixation of arterial segments ...................................................... 71
2.6.2. Tissue processing ....................................................................... 71
2.6.3. Paraffin wax embedding ............................................................ 71
2.6.4. Sectioning of embedded tissue................................................... 71
2.7. Histology and immunohistochemistry .............................................. 72
2.7.1. Alpha-smooth muscle actin and Miller’s elastin co-stain .......... 72
2.7.2. Picro-sirius red ........................................................................... 73
2.8. Cellular characterisation .................................................................... 76
2.8.1. Morphometric analysis............................................................... 77
2.8.2. F-actin immunofluorescence ...................................................... 78
2.8.3. Cell proliferation ........................................................................ 79
2.8.4. Scratch wound migration ........................................................... 80
2.8.5. Senescence associated beta-galactosidase staining .................... 82
2.8.6. Gelatin zymography ................................................................... 84
2.9. Biomechanical characterisation......................................................... 87
2.9.1. Characterisation of protease pre-treatment ................................ 88
2.9.2. Uniaxial tensile testing ............................................................... 90
2.9.3. Dilation burst pressure testing ................................................... 96
2.9.4. Characterisation of ex vivo model biomechanics ....................... 99
CHAPTER 3 Ex Vivo Model of AAA ........................................................ 102
3.1. Introduction ..................................................................................... 102
3.2. Materials and reagents ..................................................................... 103
viii
3.2.1. Reagents ................................................................................... 103
3.2.2. Materials and consumables ...................................................... 103
3.2.3. Bioreactor components ............................................................ 104
3.2.4. Media composition................................................................... 106
3.3. Tissue for ex vivo AAA model ........................................................ 106
3.3.1. Animals .................................................................................... 107
3.3.2. Non-sterile dissection of carotid artery .................................... 110
3.4. Bioreactor for organ culture ............................................................ 110
3.4.1. Bioreactor configuration .......................................................... 110
3.4.2. Sterilisation of bioreactor for organ culture ............................. 112
3.5. Creation of ex vivo porcine model................................................... 113
3.5.1. Combined collagenase and elastase pre-treatment .................. 113
3.6. Bioreactor dynamic environment .................................................... 116
3.6.1. Calibration of pressure transducers .......................................... 117
3.6.2. Measurement of luminal pressure ............................................ 118
3.6.3. Flow rate calibration ................................................................ 119
3.6.4. Characterisation of local pressures .......................................... 120
3.6.5. Ex vivo AAA model pressures ................................................. 122
3.7. Discussion ....................................................................................... 124
CHAPTER 4 Tissue structure of ex vivo AAA model ............................... 132
4.1. Introduction ..................................................................................... 132
4.2. Chapter aims and objectives ............................................................ 133
4.2.1. Objectives ................................................................................ 133
4.3. Tissue morphology .......................................................................... 134
4.4. Histoarchitecture of cultured arteries .............................................. 135
4.4.1. Static culture ............................................................................ 136
4.4.2. Bioreactor culture..................................................................... 138
4.5. Luminal diameter ............................................................................ 141
4.6. Discussion ....................................................................................... 143
CHAPTER 5 Structure and function of ex vivo AAA model SMCs ......... 150
5.1. Introduction ..................................................................................... 150
5.2. Chapter aims and objectives ............................................................ 151
5.2.1. Objectives ................................................................................ 151
5.3. Smooth muscle cell structure .......................................................... 152
5.3.1. SMC circularity ........................................................................ 152
5.3.2. F-actin cytoskeleton ................................................................. 155
ix
5.4. Smooth muscle cell function ........................................................... 157
5.4.1. Proliferation ............................................................................. 157
5.4.2. Migration.................................................................................. 160
5.4.3. Senescence ............................................................................... 165
5.4.4. Secretion of MMP-2 and MMP-9 ............................................ 167
5.5. Discussion ....................................................................................... 172
CHAPTER 6 Ex vivo model biomechanics ................................................ 182
6.1. Introduction ..................................................................................... 182
6.2. Chapter aims and objectives ............................................................ 185
6.2.1. Objectives ................................................................................ 185
6.3. Whole artery pressure-dilation testing ............................................ 185
6.3.2. Burst pressure........................................................................... 188
6.4. Uniaxial tensile testing .................................................................... 189
6.4.1. Tissue behaviour ...................................................................... 190
6.4.2. Arterial thickness ..................................................................... 191
6.4.3. Tissue Behaviour ..................................................................... 193
6.4.4. Effect of treatment on elastin region stiffness ......................... 196
6.4.5. Effect of treatment on collagen region stiffness ...................... 198
6.4.6. Effect of treatment on transition strain .................................... 201
6.4.7. Effect of treatment on ultimate tensile strength ....................... 203
6.5. Comparison of uniaxial and dilation testing ................................... 204
6.6. Discussion ....................................................................................... 205
CHAPTER 7 Discussion, Conclusions and future work ............................ 214
7.1. Strengths and limitations ................................................................. 222
7.2. Recommendations for future work .................................................. 223
7.3. Thesis summary and conclusion ..................................................... 226
References…………………………………………………………………229
Appendices………………………………………………………………...254
x
V. LIST OF FIGURES
Figure 1.1 Cartoon of the abdominal aorta ........................................................ 3
Figure 1.2 Open surgical repair of AAA ........................................................... 7
Figure 1.3 Left) Preoperative CT scan of an AAA with 3D reconstruction ...... 7
Figure 1.4 Schematic of healthy arterial wall and its components .................. 10
Figure 1.5 Arterial anatomy (porcine carotid artery) ....................................... 11
Figure 1.6 Elastin von Gieson staining of intima/media in A) normal aorta and
B) AAA ............................................................................................................ 13
Figure 1.7 Schematic of a J-curve stress-strain graph of a healthy aorta ........ 17
Figure 1.8 Modified Maxwell model of smooth muscle and ECM components
.......................................................................................................................... 17
Figure 1.9 Diagram of changes in AAA wall compared to healthy artery ...... 22
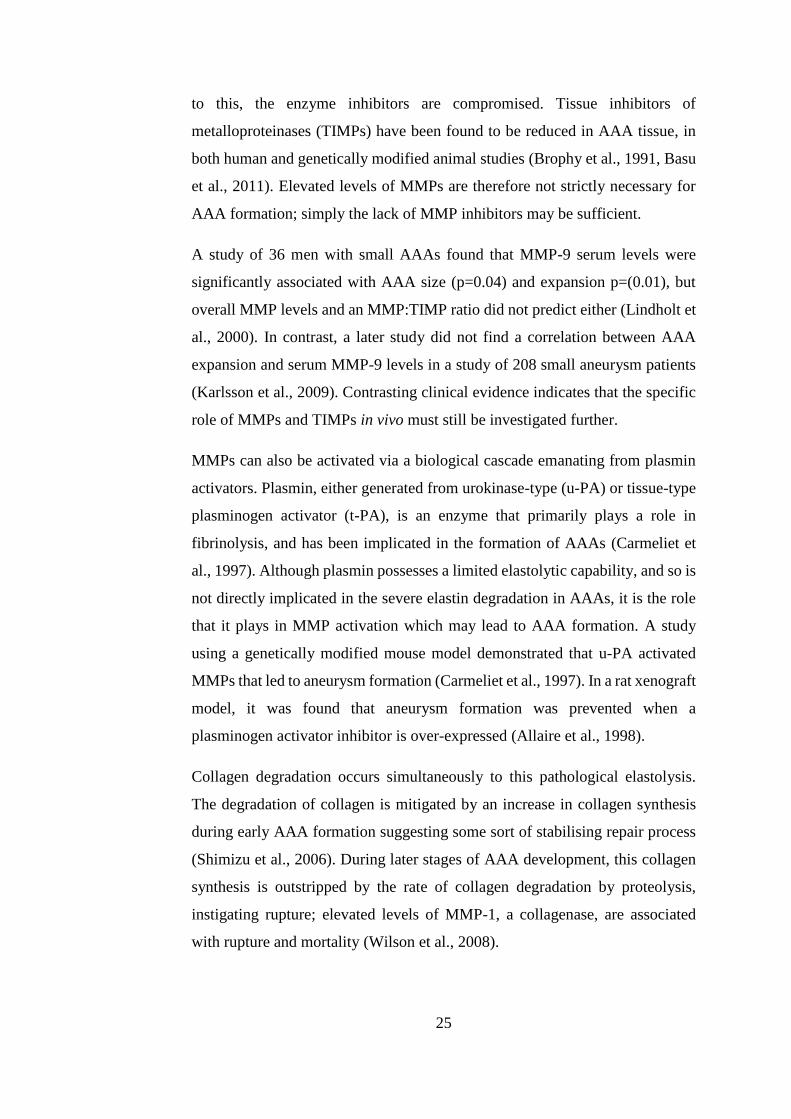
Figure 1.10 Interactive pathways of possible promotion of aneurysm formation
.......................................................................................................................... 27
Figure 1.11 Inflammatory infiltrate in AAA.................................................... 28
Figure 1.12 SMC phenotype structure and function ........................................ 30
Figure 1.13 Haemodynamic forces involved in blood flow through arteries .. 36
Figure 1.14 Schematic of experimental aneurysm creation via the arterial patch
method.............................................................................................................. 49
Figure 2.1 Workflow for overall project .......................................................... 65
Figure 2.2 Timecycle schematic of SMC cryopreservation. END = End model
artery, EARLY = Early model artery, (n=3). ................................................... 68
Figure 2.3 Primary SMC explanting from a fragment of porcine carotid artery
.......................................................................................................................... 70
Figure 2.4 Representative image of SMC grown to confluence ...................... 70
Figure 2.5 Measurement of luminal perimeter ................................................ 75
Figure 2.6 Transformation of measured luminal circumference to idealised
diameter............................................................................................................ 76
Figure 2.7 Pattern of field of view capture ...................................................... 78
Figure 2.8 Schematic of etching pattern .......................................................... 80
Figure 2.9 Confluent monolayers of SMC wounded to give area clear of cells
.......................................................................................................................... 81
xi
Figure 2.10 Schematic of image order pattern for each well ........................... 83
Figure 2.11 Experimental workflow of biomechanical characterisation ......... 89
Figure 2.12 Tissue strips for uniaxial tensile testing ....................................... 91
Figure 2.13 Left: tissue cutting block .............................................................. 91
Figure 2.14 Soft tissue grips ............................................................................ 92
Figure 2.15 Left: tissue strip installed into soft tissue grips ............................ 93
Figure 2.16 Typical stress-strain curve detailing outputs ................................ 94
Figure 2.17 Representative MatLab script output............................................ 95
Figure 2.18 Dilation testing. ............................................................................ 97
Figure 2.19 Representative images taken during dilation test ......................... 98
Figure 2.20 Representative image of image analysis method.......................... 99
Figure 3.1 Disassembled components of bioreactor ...................................... 104
Figure 3.2 Superfluous connective tissue and adventitia ............................... 108
Figure 3.3 Surgical approach ......................................................................... 109
Figure 3.4 Schematic of bioreactor configuration ......................................... 111
Figure 3.5 Porcine carotid artery installed into the bioreactor ....................... 112
Figure 3.6 Vehicle and CCE gels ................................................................... 114
Figure 3.7 Focal treatment ............................................................................. 114
Figure 3.8 Arterial rings cultured under static conditions in a 6-well plate .. 115
Figure 3.9 Bioreactor schematic showing the four available local pressure
measuring points ............................................................................................ 116
Figure 3.10 Manual sphygmomanometer used for calibration of pressure
transducers. .................................................................................................... 117
Figure 3.11 Measurement of luminal pressure with front glass plate removed
from bioreactor chamber. ............................................................................... 118
Figure 3.12 Flow rate calibration with porcine carotid artery ....................... 119
Figure 3.13 Mean relative pressures at specified positions around the bioreactor
........................................................................................................................ 121
Figure 3.14 Inlet pressures of CCE and VEH treated porcine vessels........... 123
Figure 4.1 Observed differences in tissue morphology after culture in
bioreactor. ...................................................................................................... 135
Figure 4.2 Representative images of α-smooth muscle actin with Miller’s elastin
co-stain ........................................................................................................... 137
xii
Figure 4.3 Representative images of α-smooth muscle actin with Miller’s elastin
co-stain ........................................................................................................... 138
Figure 4.4 Representative images of α-smooth muscle actin with Miller’s elastin
co-stain ........................................................................................................... 139
Figure 4.5 Representative images of α-smooth muscle actin with Miller’s elastin
co-stain ........................................................................................................... 140
Figure 4.6 Mean luminal perimeter ............................................................... 142
Figure 5.1 SMC morphology. ........................................................................ 153
Figure 5.2 Immunofluorescence of cytoskeleton ........................................... 156
Figure 5.3 Passage-matched mean proliferation curves ................................ 159
Figure 5.4 Area under curve analysis for proliferation .................................. 160
Figure 5.5 Scratch wound migration analysis ................................................ 162
Figure 5.6 Effect of SMC orientation on migration ....................................... 163
Figure 5.7 Mean scratch wound migration cell counts .................................. 164
Figure 5.8 Senescence analysis with β-galactosidase staining ...................... 166
Figure 5.9 Sample loading volume calibration .............................................. 168
Figure 5.10 Representative zymogram images .............................................. 169
Figure 5.11 Quantification of relative MMP levels ....................................... 171
Figure 6.1 Arterial compliance of FRESH, VEH and CCE pre-treatment .... 186
Figure 6.2 Matched dilation experiments before and after CCE treatment ... 188
Figure 6.3 Burst pressure of non-sterile FRESH, VEH and CCE treated arteries
........................................................................................................................ 189
Figure 6.4 Representative images of tissue strips undergoing uniaxial tensile
testing. ............................................................................................................ 191
Figure 6.5 Non-uniformity of arterial thickness ............................................ 192
Figure 6.6 Mean arterial thickness ................................................................. 193
Figure 6.7 Representative engineering stress-strain graphs ........................... 195
Figure 6.8 Raw stress-strain curves for BIOCCE tissue ................................ 196
Figure 6.9 Elastin region stiffness ................................................................. 197
Figure 6.10 Collagen region stiffness ............................................................ 200
Figure 6.11 Transition strain .......................................................................... 202
Figure 6.12 Ultimate tensile strength ............................................................. 204
xiii
Figure 6.13 Comparison of whole vessel burst pressure and uniaxial tensile
testing parameters .......................................................................................... 205
Figure 7.1 Distinct AAA phenotype outside of classical SMC phenotype .... 221
Figure 7.2 Summary of principal thesis findings and directions for future work
........................................................................................................................ 227
xiv
VI. LIST OF TABLES
Table 1.1 Project specific nomenclature ........................................................ xvii
Table 1.1 Summary of small animal species used as models for AAA research.
.......................................................................................................................... 42
Table 1.2 Summary of large animal species used for AAA research .............. 43
Table 2.1 Experimental tissue groups .............................................................. 64
Table 2.2 Cell culture media compositions...................................................... 66
Table 2.3 Stimuli used on SMC to collect conditioned media ........................ 85
Table 2.4 Experimental groups ........................................................................ 88
Table 3.1 Bioreactor components for single bioreactor system ..................... 105
Table 3.2 Bought-in bioreactor components and equipment. ........................ 106
Table 3.3 Percentage pressure drop between specified bioreactor positions . 122
Table 5.1 Mean circularity measurements ..................................................... 154
xv
VII. ABBREVIATIONS
AAA Abdominal aortic aneurysm
AO Atherosclerotic occlusive
ApoE Apolipoprotein E
APS Ammonium persulphate
BIO Bioreactor culture
CaCl2 Calcium chloride
CCA Common carotid artery
CCE Combined collagenase and elastase
CT Computed tomography
DAB 3,3’-diaminobenzidine
DAPI 4’,6-diamidino-2-phenylindole
DMEM Dulbecco’s Modified Eagle Medium
DMSO Dimethyl sulphoxide
DPX Distyrene plasticizer xylene
EC Collagen region stiffness
ECM Extracellular matrix
EDP Elastin derived peptides
EDTA Ethylenediaminetetraacetic acid
EE Elastin region stiffness
EVAR Endovascular aneurysm repair
FCS Foetal calf serum
FGM Full growth medium
HBSS Hank’s Balanced Salt Solution
IJV Internal jugular vein
IL-1α Interleukin-1 alpha
ILT Intraluminal thrombus
IMA Inferior mesenteric artery
IMV Inferior mesenteric vein
L-G L-Glutamine
LMP Low Melting Point
xvi
MCP Monocyte chemotactic protein
MGM Minimal growth medium
miR MicroRNA
mmHg Millimetres of mercury
MMP Matrix metalloproteinase
MPa Megapascal
MSC Mesenchymal stromal cell
OSR Open surgical repair
PBS Phosphate buffered saline
PDGF Platelet derived growth factor
PFA Paraformaldehyde
PMN Polymorphonuclear neutrophils
PSF Pencillin / Streptomycin / Fungizone
RNA Ribonucleic acid
ROS Reactive oxygen species
S Static culture
SASP Senescence associated secretory phenotype
SDS Sodium dodecyl sulphate
SDS-PAGE Sodium dodecyl sulphate polyacrylamide gel
electrophoresis
SFM Serum free medium
SGM Sub-maximal growth medium
SMC Smooth muscle cell
SM-MHC Smooth muscle-myosin heavy chain
TEMED N,N,N’,N’-Tetramethylethylene diamine
TIMP Tissue inhibitor of metalloproteinase
TNF-α Tumour necrosis factor alpha
TPA 12-O-tetradecanoylphorbol-13-acetate
UTS Ultimate tensile strength
VEH Vehicle treatment
α-SMA Alpha-smooth muscle actin
εt Transition strain
xvii
VIII. PROJECT SPECIFIC NOMENCLATURE
Throughout this document, several project specific terms are used for ease of
readability. These terms are summarised in Table 1.1.
Table 1.1 Project specific nomenclature
Nomenclature Meaning
S Static organ culture in a 6-well plate
BIO Dynamic ex vivo organ culture in the bioreactor
FRESH Harvested tissue with no manipulation
VEH Pre-treatment with vehicle control gel
CCE Pre-treatment with gel containing combination of
collagenase and elastase
EARLY Cultured in the bioreactor for three days
END Cultured in the bioreactor for twelve days


1
CHAPTER 1
INTRODUCTION
2
CHAPTER 1 INTRODUCTION
The aims of this project were: to develop an ex vivo model of AAA in a
bioreactor and use the model to investigate the structure and function of the
smooth muscle cell with respect to time.
Abdominal aortic aneurysm (AAA) is a disease prevalent in developed
countries whereby the abdominal aorta gradually dilates via multifactorial
biological processes until rupture. Patients are destined for surgery as there are
no current pharmacological or therapeutic treatments. This chapter will
examine: the epidemiology and risk factors; the current clinical management
techniques; the biomechanics and histoarchitecture compared to healthy aortas;
factors involved with aneurysm formation and progression with emphasis on
the role of the smooth muscle cell; experimental aneurysm models in terms of
animal species; the various methods to induce experimental AAA, and the
limitations.
1.1. ABDOMINAL AORTIC ANEURYSMS
Abdominal aortic aneurysm (AAA) can be loosely described as an abnormal
dilation which typically occurs in the abdominal aorta between the renal arteries
and the iliac branches (Lippincott et al., 2009). It is a condition which affects
the abdominal aorta whereby it dilates to greater than 3cm in diameter
(approximately 150% of normal diameter), and is considered for elective
prophylactic repair when it reaches a diameter greater than 5.5cm: the aneurysm
must be large enough for the risk of rupture to exceed the perioperative mortality
risk (Powell, 1998, BHF, 2008, Nordon et al., 2011). These are generally
accepted thresholds, although definitions such as an aneurysm greater than 4cm
and an infrarenal to suprarenal diameter ratio of 1.2 to 1.5 can also be observed
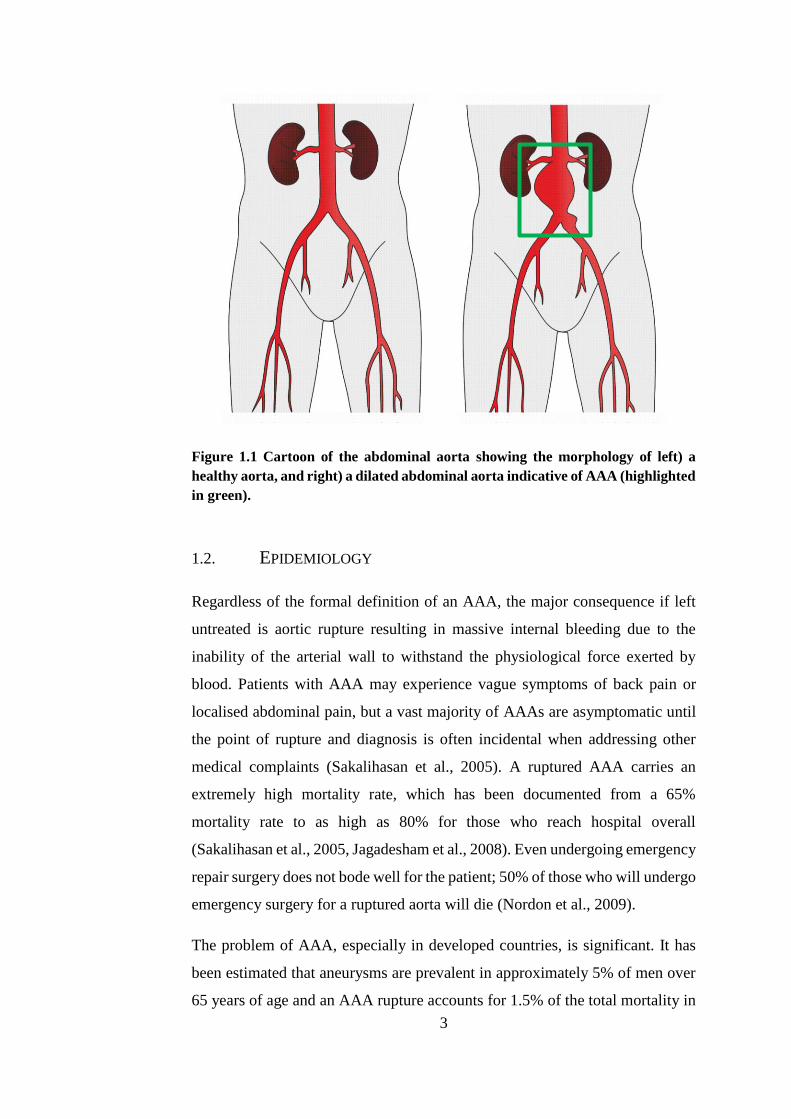
(Golledge et al., 2006). Figure 1.1 shows the distortion of the aneurysmal artery
in comparison to a healthy aorta.
3
Figure 1.1 Cartoon of the abdominal aorta showing the morphology of left) a
healthy aorta, and right) a dilated abdominal aorta indicative of AAA (highlighted
in green).
1.2. EPIDEMIOLOGY
Regardless of the formal definition of an AAA, the major consequence if left
untreated is aortic rupture resulting in massive internal bleeding due to the
inability of the arterial wall to withstand the physiological force exerted by
blood. Patients with AAA may experience vague symptoms of back pain or
localised abdominal pain, but a vast majority of AAAs are asymptomatic until
the point of rupture and diagnosis is often incidental when addressing other
medical complaints (Sakalihasan et al., 2005). A ruptured AAA carries an
extremely high mortality rate, which has been documented from a 65%
mortality rate to as high as 80% for those who reach hospital overall
(Sakalihasan et al., 2005, Jagadesham et al., 2008). Even undergoing emergency
repair surgery does not bode well for the patient; 50% of those who will undergo
emergency surgery for a ruptured aorta will die (Nordon et al., 2009).
The problem of AAA, especially in developed countries, is significant. It has
been estimated that aneurysms are prevalent in approximately 5% of men over
65 years of age and an AAA rupture accounts for 1.5% of the total mortality in
4
males over 55 (Choke et al., 2005, Jagadesham et al., 2008, Michel et al., 2011,
Nordon et al., 2011). Another estimate placed AAA as the tenth most common
cause of mortality and responsible for approximately 2% of all deaths (Golledge
et al., 2006). It has also been argued that the conservative estimates of mortality
linked with AAA are hindered by low rates of post-mortems and that it is likely
that some sudden deaths attributed to ruptured AAA are certified as cardiac
deaths unless a pre-existing AAA was documented (Golledge et al., 2006).
The National Abdominal Aortic Aneurysm Screening Programme (NAAASP)
was introduced to the UK in 2010 as an effective way to reduce AAA mortality
after a pilot study in 2009 (Thompson et al., 2009). This AAA screening is
currently targeted to men over the age of 65 and has been found to reduce the
number of deaths related to AAA by half over 10 years (Benson et al., 2016).
The screening programme offers the unprecedented opportunity to identify
AAAs more often and earlier on in the development of the disease.
AAA disease is more common in men than in women (Anidjar and Kieffer,
1992, Jagadesham et al., 2008, Michel et al., 2011). Incidence rates have been
estimated to be between 1.3% and 8.9% for men and 0.5% and 2.2% for women,
or approximately six times greater in men than in women (Sakalihasan et al.,
2005, Nordon et al., 2011, Svensjo et al., 2013). However, although AAA is
rarer in women, they represent a higher mortality rate in comparison to men
with increased growth rate, greater likelihood of rupture and rupture at a smaller
diameter (Heller et al., 2000, Hultgren et al., 2007, Lo and Schermerhorn, 2016).
Unlike other cardiovascular diseases endemic in industrialised countries, in
recent times the incidence of AAA is increasing; this may be due to improved
detection as a result of screening regimes and therefore a greater diagnostic
efficiency, or even due to improved mortality rates from other cardiovascular
diseases (Anidjar and Kieffer, 1992, Golledge et al., 2006). However, the
increase in age standardised mortality indicates a genuine increase in the
incidence of AAA. For example, a Scottish study found that mortality rates from
AAA increased 2.6-fold between 1981 and 2000 (Best et al., 2003). The ageing
population of industrialised countries is likely to be a major contributor to this
5
fact, as the risk of developing AAA increases with age (Sakalihasan et al.,
2005).
1.2.1. RISK FACTORS
Cigarette smoking is recognised as the strongest risk factor for AAA; Lederle
et al. found that the association of ever smoking with aortic aneurysm is 2.5-
fold greater than the association of ever smoking with coronary heart disease
(Lederle et al., 2003). In another large study, smoking accounted for 75% of the
excess prevalence of AAA greater than 4.0 cm (Perlstein and Lee, 2006). This
may be due to the fact that cigarette smokers possess increased numbers of
circulating markers of inflammation or the ability of cigarette smoke to oxidise
α1-antitrypsin, a protease inhibitor (Perlstein and Lee, 2006, Michel et al.,
2011). Protease inhibition and inflammatory markers will be examined in more
detail later on in this chapter.
Ethnicity may have a role to play in the development of AAA; Afro-Caribbean
ethnicity has been associated with decreased aneurysm susceptibility and there
is evidence to suggest that AAAs are more commonly found in Caucasians than
other races (Lederle et al., 1997, Golledge et al., 2006). AAA has also been
linked with familial history of the disorder (Lederle et al., 1997, Sakalihasan et
al., 2005, Golledge et al., 2006, Nordon et al., 2011).
The association of both familial history and ethnicity (inherent genetic factors)
and smoking (an overtly environmental factor) with AAA indicates that there is
likely to be an interplay between genetic predisposition and environmental
factors in aneurysm formation. The Swedish Twin Registry has been used to
analyse the role of hereditary and environmental factors. Of the 265 pairs of
twins affected with AAA, genetic effects accounted for 70% and non-shared
environmental effects for 30% of the phenotypic variance (Wahlgren et al.,
2010). They found that there was no contribution of shared environmental
effects.
6
1.3. TREATMENT OPTIONS FOR AAA
Although AAA is a major issue in developed countries, at present there are no
approved therapeutic or pharmacological treatments for AAA. Prophylactic
surgical intervention is the certified route, but only once the aneurysm has a
diameter greater than 5.5 cm (Thompson et al., 2009, Benson et al., 2016). Open
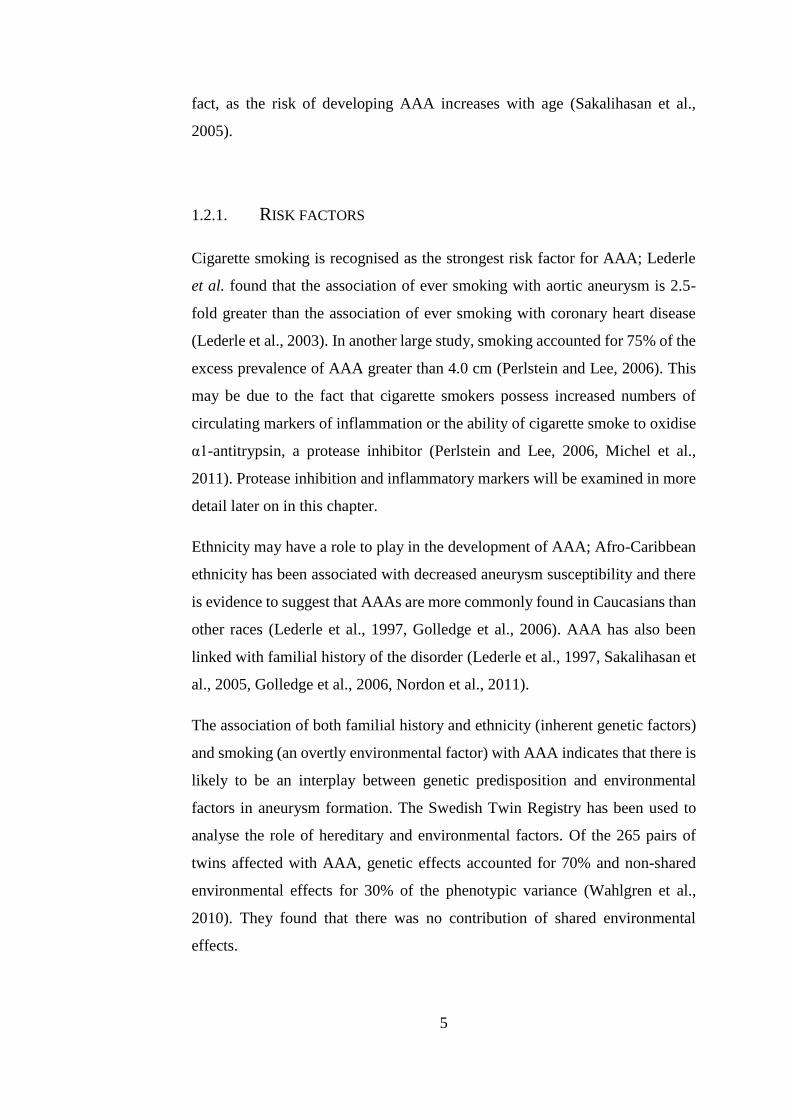
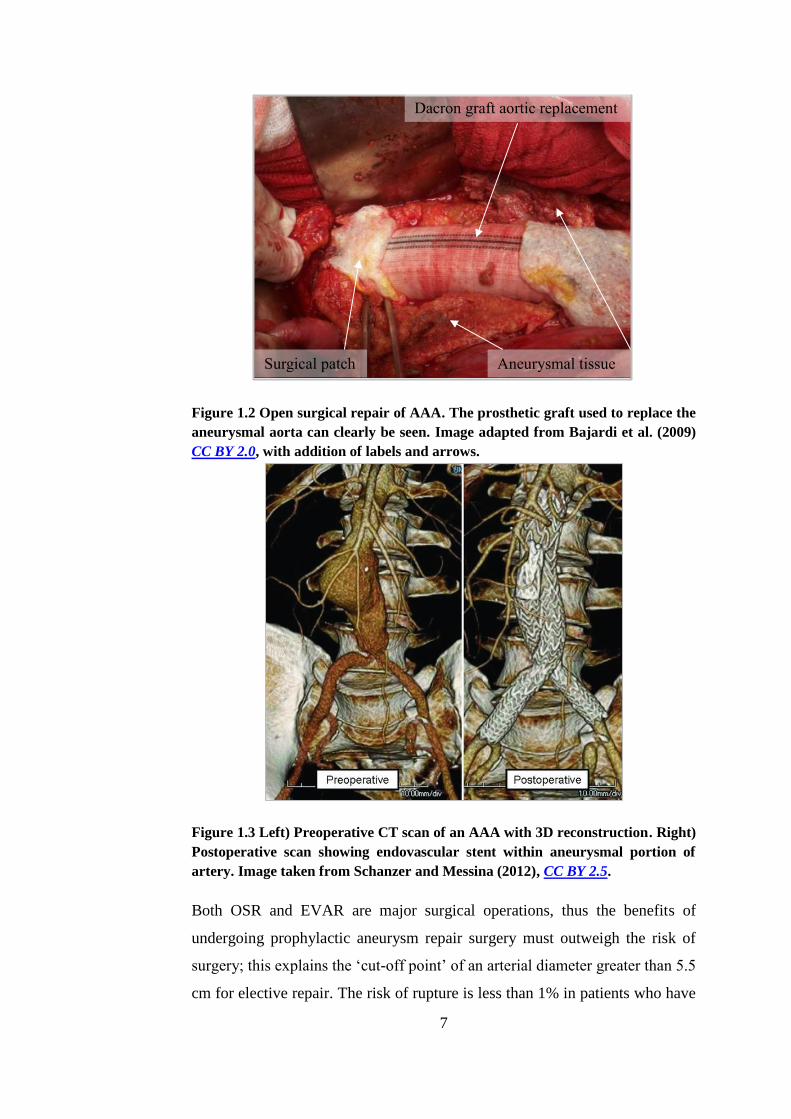
surgical repair (OSR) involves exposure of the abdominal aorta and replacement
of the aneurysmal segment with a prosthetic graft (BHF, 2008). Figure 1.2 is an
image of OSR for AAA.
Depending on the morphology of the aneurysm, and the patient’s suitability for
surgery, it may be possible to undergo endovascular aneurysm repair (EVAR).
EVAR as an alternative to OSR was pioneered by Parodi (Parodi et al., 1991).
It is a minimally invasive surgery involving insertion of a stent-anchored
Dacron graft into the femoral arteries where it is passed through the circulatory
system until it sits inside the aneurysm. It is then sutured to the proximal and
distal necks of the non-aneurysmal aorta. This excludes the aneurysm from
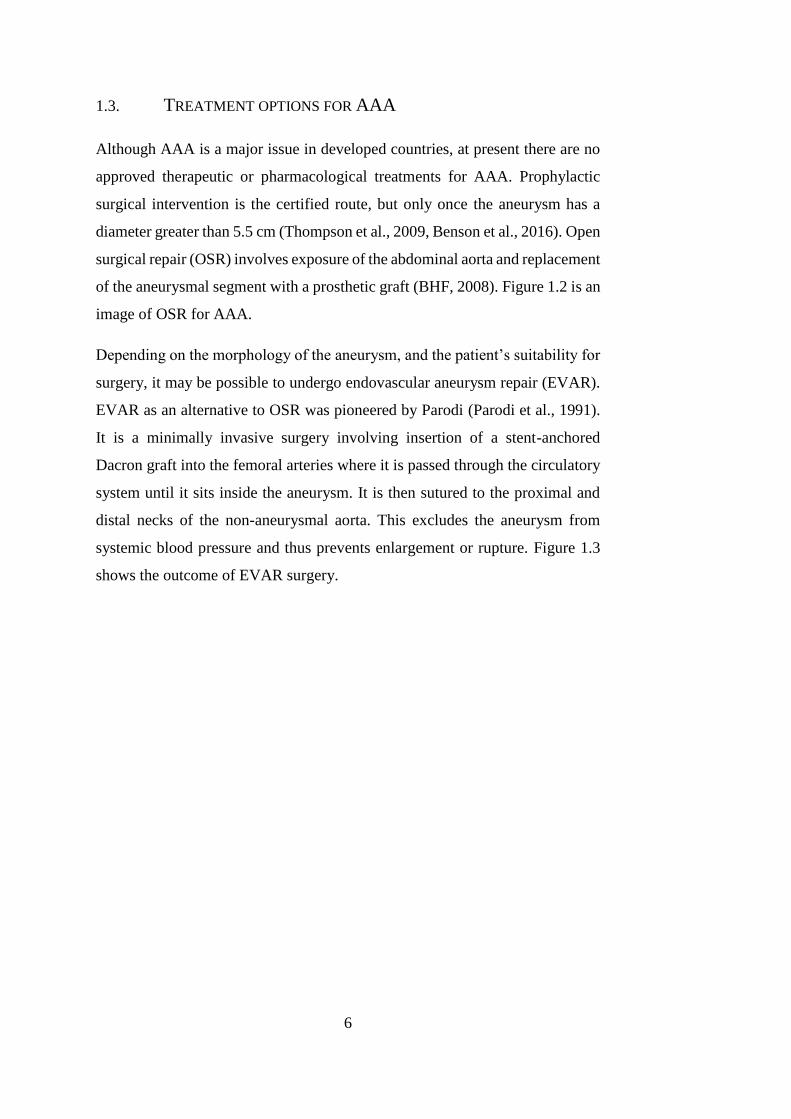
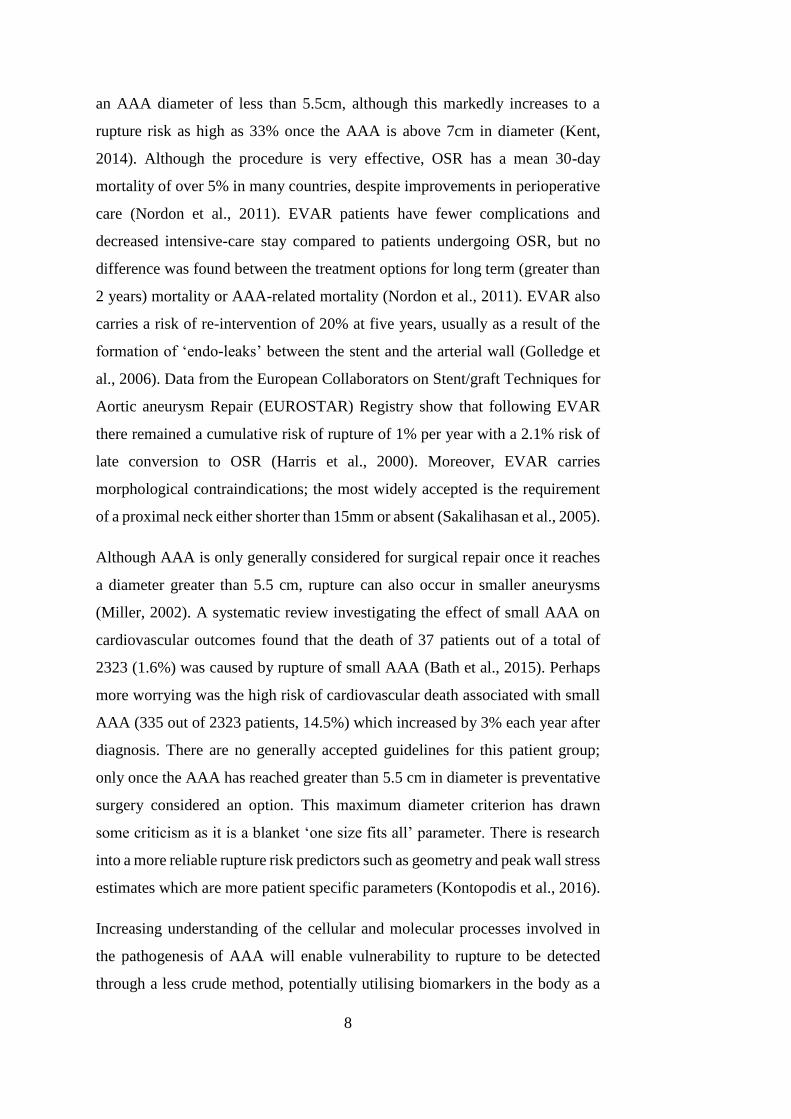
systemic blood pressure and thus prevents enlargement or rupture. Figure 1.3
shows the outcome of EVAR surgery.
7
Figure 1.2 Open surgical repair of AAA. The prosthetic graft used to replace the
aneurysmal aorta can clearly be seen. Image adapted from Bajardi et al. (2009)
CC BY 2.0, with addition of labels and arrows.
Figure 1.3 Left) Preoperative CT scan of an AAA with 3D reconstruction. Right)
Postoperative scan showing endovascular stent within aneurysmal portion of
artery. Image taken from Schanzer and Messina (2012), CC BY 2.5.
Both OSR and EVAR are major surgical operations, thus the benefits of
undergoing prophylactic aneurysm repair surgery must outweigh the risk of
surgery; this explains the ‘cut-off point’ of an arterial diameter greater than 5.5
cm for elective repair. The risk of rupture is less than 1% in patients who have
Aneurysmal tissue Surgical patch
Dacron graft aortic replacement
8
an AAA diameter of less than 5.5cm, although this markedly increases to a
rupture risk as high as 33% once the AAA is above 7cm in diameter (Kent,
2014). Although the procedure is very effective, OSR has a mean 30-day
mortality of over 5% in many countries, despite improvements in perioperative
care (Nordon et al., 2011). EVAR patients have fewer complications and
decreased intensive-care stay compared to patients undergoing OSR, but no
difference was found between the treatment options for long term (greater than
2 years) mortality or AAA-related mortality (Nordon et al., 2011). EVAR also
carries a risk of re-intervention of 20% at five years, usually as a result of the
formation of ‘endo-leaks’ between the stent and the arterial wall (Golledge et
al., 2006). Data from the European Collaborators on Stent/graft Techniques for
Aortic aneurysm Repair (EUROSTAR) Registry show that following EVAR
there remained a cumulative risk of rupture of 1% per year with a 2.1% risk of
late conversion to OSR (Harris et al., 2000). Moreover, EVAR carries
morphological contraindications; the most widely accepted is the requirement
of a proximal neck either shorter than 15mm or absent (Sakalihasan et al., 2005).
Although AAA is only generally considered for surgical repair once it reaches
a diameter greater than 5.5 cm, rupture can also occur in smaller aneurysms
(Miller, 2002). A systematic review investigating the effect of small AAA on
cardiovascular outcomes found that the death of 37 patients out of a total of
2323 (1.6%) was caused by rupture of small AAA (Bath et al., 2015). Perhaps
more worrying was the high risk of cardiovascular death associated with small
AAA (335 out of 2323 patients, 14.5%) which increased by 3% each year after
diagnosis. There are no generally accepted guidelines for this patient group;
only once the AAA has reached greater than 5.5 cm in diameter is preventative
surgery considered an option. This maximum diameter criterion has drawn
some criticism as it is a blanket ‘one size fits all’ parameter. There is research
into a more reliable rupture risk predictors such as geometry and peak wall stress
estimates which are more patient specific parameters (Kontopodis et al., 2016).
Increasing understanding of the cellular and molecular processes involved in
the pathogenesis of AAA will enable vulnerability to rupture to be detected
through a less crude method, potentially utilising biomarkers in the body as a
9
predication of oncoming rupture whereupon the patient will undergo
prophylactic repair (Hellenthal et al., 2009a), reviewed in (Wanhainen et al.,
2016).
Surgery is still the sole option offered to AAA patients; there are no approved
alternative pharmacological or therapeutic treatments. Patients – in particular
elderly patients – may be deemed unsuitable for surgery due to medical co-
morbidity and in these cases there are no forms of effective treatment. For
example, out of 251 AAA patients admitted to a specialist vascular unit, 32
(13%) were deemed unsuitable for surgical intervention (Karthikesalingam et
al., 2011). Lim et al. reported that 59 out of 334 patients (18%) were not able to
have intervention within 3 months (Lim et al., 2015). In these cases, it is simply
a matter of time until rupture or unrelated death of the patient. However, the
advent of a nationwide AAA screening programme offered to at-risk individuals
offers the opportunity to detect and diagnose AAAs at an earlier stage. This may
reveal stages of the disease where it may be appropriate to intervene with
therapeutics or pharmacological treatments which have not previously been
identified.
There is also evidence from animal models that anti-inflammatory and
immunosuppressive drugs may limit the expansion of AAAs, but as the cellular
and molecular targets are unknown, research is still ongoing into non-surgical
treatments for AAA (Jagadesham et al., 2008, Davis et al., 2014).
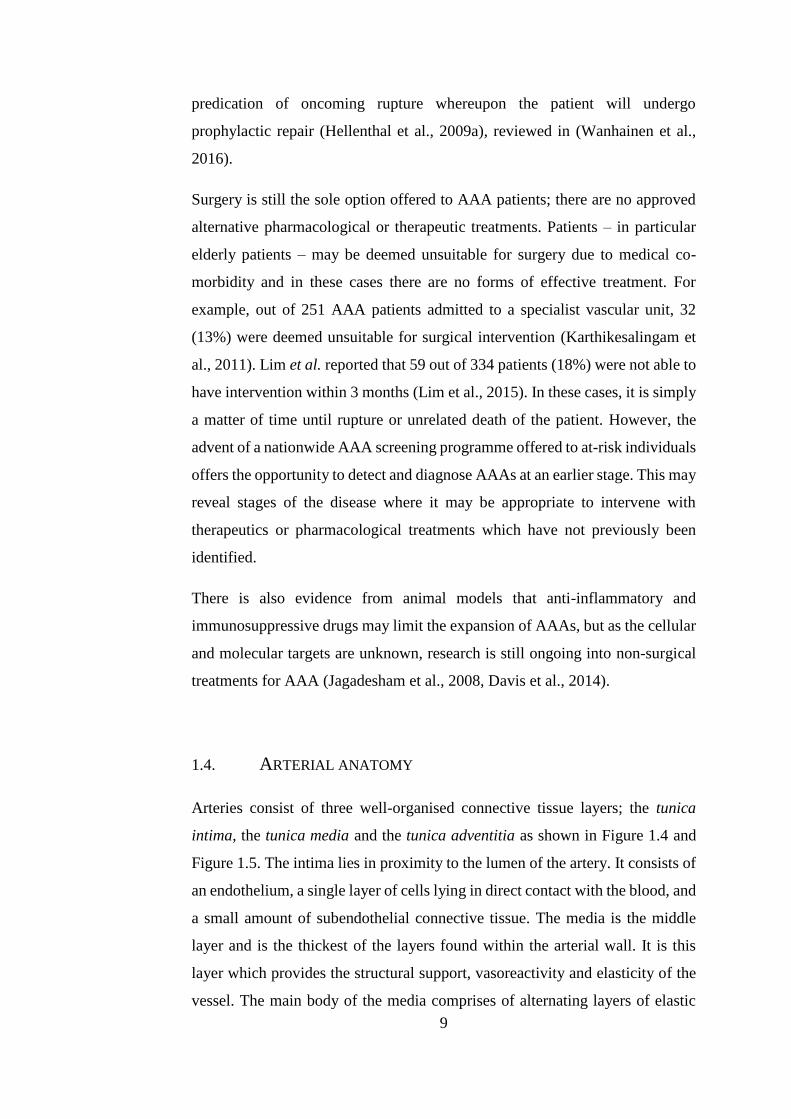
1.4. ARTERIAL ANATOMY
Arteries consist of three well-organised connective tissue layers; the tunica
intima, the tunica media and the tunica adventitia as shown in Figure 1.4 and
Figure 1.5. The intima lies in proximity to the lumen of the artery. It consists of
an endothelium, a single layer of cells lying in direct contact with the blood, and
a small amount of subendothelial connective tissue. The media is the middle
layer and is the thickest of the layers found within the arterial wall. It is this
layer which provides the structural support, vasoreactivity and elasticity of the
vessel. The main body of the media comprises of alternating layers of elastic
10
fibres and smooth muscle cells arranged circumferentially. The outermost layer
is the adventitia which is the most robust of all the layers. It consists of
longitudinally arranged connective tissue fibres of both elastin and collagen and
connective tissue cells such as fibroblasts. (Singh, 2008, D'Souza, 2009).
Figure 1.4 Schematic of healthy arterial wall and its components. Top: cross
section of arterial wall. Bottom: zoomed in section of arterial wall layers.
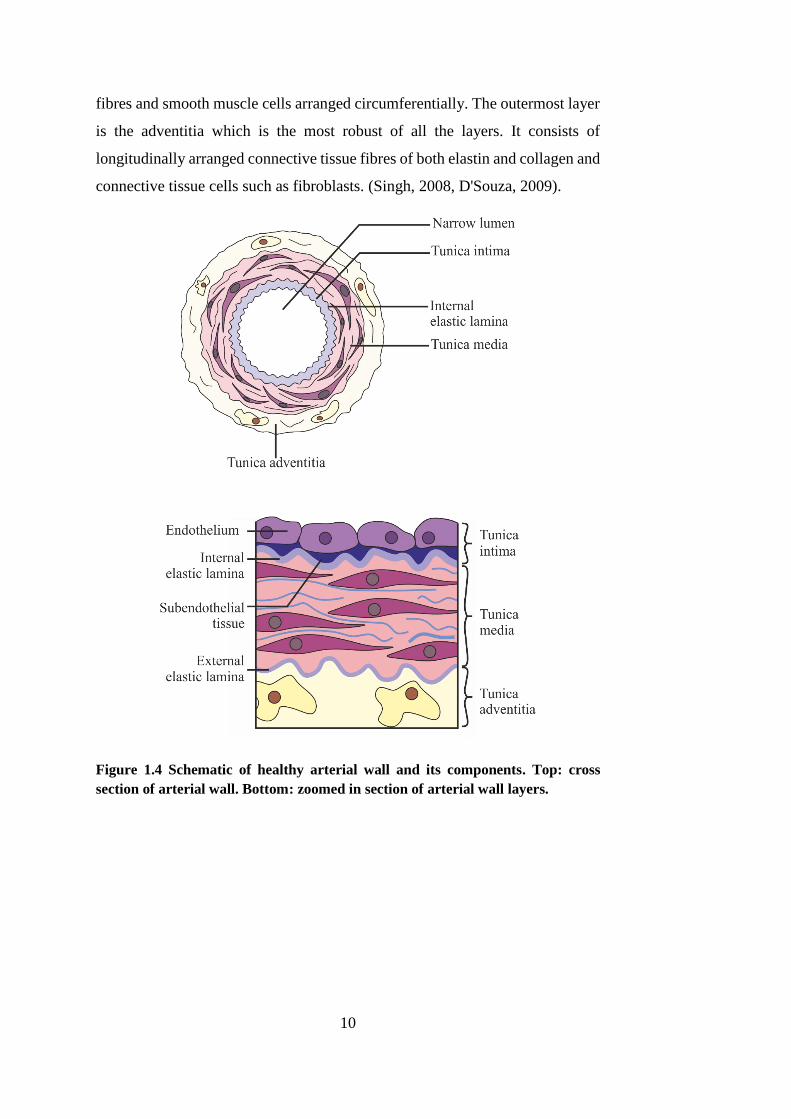
11
Figure 1.5 Arterial anatomy (porcine carotid artery) - histological staining of
healthy arterial wall. IEL = internal elastic lamina (purple stain), TI = tunica
intima, TM= tunica media, TA = tunica adventitia. A) Sirius red with Miller’s
elastin co-stain. Elastin fibres are shown blue-purple and are ordered throughout
the wall. B) Sirius red with Miller’s elastin co-stain viewed under polarised light.
Collagen fibres (white arrows) are birefringent and are red, green or yellow
depending on the orientation of the fibres in relation to the polarising filter.
In carotid arteries, used throughout this study and shown in Figure 1.5, there is
no real distinction of the intima; it is simply a single cell layer of endothelial
cells. The elastic fibres in the tunica media (as seen in purple in Figure 1.5, blue
arrows) allow the artery to possess arterial compliance; the artery is able to
expand during systole storing elastic energy and then recoil during diastole,
releasing the stored energy back into the blood stream, thus transporting the
blood through the vasculature. This affects the pressure of the blood throughout
the cardiovascular system. In addition to elastin, the majority of the extracellular
matrix (ECM) in the aorta is comprised of Type I collagen (as seen in red in
Lumen Lumen
A B
TM
TA
IEL
TI
500µm 500µm
12
Figure 1.5, white arrows). Smooth muscle cells (SMCs) form the majority of
the cellular components and perform both mechanical (e.g. contractile) and
synthetic (e.g. ECM) functions. The elastin fibres of the ECM allow passive
arterial regulation, whilst the contraction of SMCs is an active component. By
periodically relaxing and contracting, the luminal diameter can be controlled
thus enabling arteries to maintain appropriate pressure levels throughout the
vasculature (Rensen et al., 2007). SMC contraction is initiated by a calcium
(Ca2+) dependent phosphorylation of light chain myosin, often triggered by
mechanical stretch due to transmural blood pressure (Webb, 2003). In addition
to active vasoregulation, SMCs are responsible for the production of the
structural proteins in the ECM, and, in addition, are capable of secreting
cytokines to recruit other cell types. They also play an important role in vascular
remodelling; SMCs are also able to express ECM degrading enzymes (Curci,
2009). This is discussed in detail in Section 1.7.1.
1.5. CHARACTERISTICS OF AAA
1.5.1. HISTOLOGICAL MARKERS
The development of AAA is intrinsically linked to alterations in the connective
tissues and cells within the arterial wall. The compliant and viscoelastic
properties of the aorta are attributed to the elastin fibres (Figure 1.5), whereas
type I and type III collagen provide the tensile strength and maintain the
integrity of the aortic wall (Sakalihasan et al., 2005, Shimizu et al., 2006). AAAs
are characterised by severe elastin fragmentation and loss of smooth muscle
cells (SMCs), as well as chronic inflammation of the adventitia and media (He
and Roach, 1994, Henderson et al., 1999, Shimizu et al., 2006). These studies
utilised human tissue that had been taken at autopsy or during elective repair of
the aorta, and so are only indicative of the state of the tissue at end-stage
aneurysm disease. However, perfusion of mouse aortas with elastase will also
induce AAAs with these same histological markers within 14 days (Pyo et al.,
2000). This characteristic loss of elastin is shown in Figure 1.6.
13
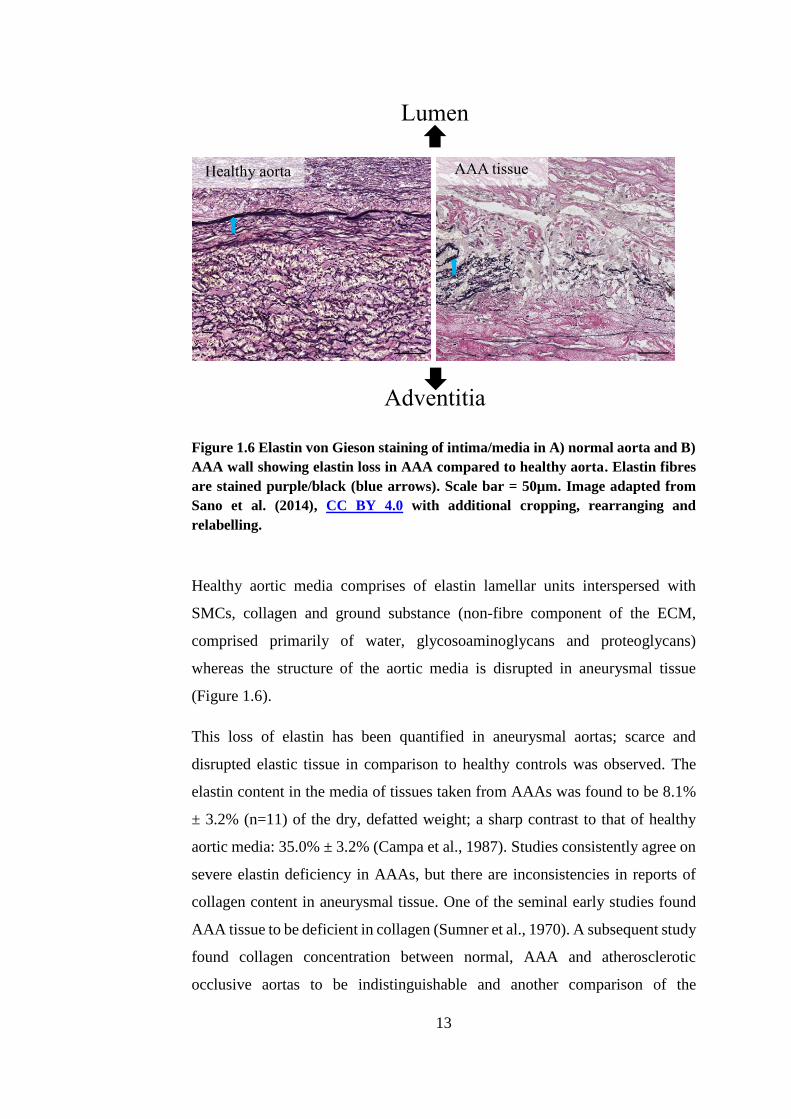
Figure 1.6 Elastin von Gieson staining of intima/media in A) normal aorta and B)
AAA wall showing elastin loss in AAA compared to healthy aorta. Elastin fibres
are stained purple/black (blue arrows). Scale bar = 50µm. Image adapted from
Sano et al. (2014), CC BY 4.0 with additional cropping, rearranging and
relabelling.
Healthy aortic media comprises of elastin lamellar units interspersed with
SMCs, collagen and ground substance (non-fibre component of the ECM,
comprised primarily of water, glycosoaminoglycans and proteoglycans)
whereas the structure of the aortic media is disrupted in aneurysmal tissue
(Figure 1.6).
This loss of elastin has been quantified in aneurysmal aortas; scarce and
disrupted elastic tissue in comparison to healthy controls was observed. The
elastin content in the media of tissues taken from AAAs was found to be 8.1%
± 3.2% (n=11) of the dry, defatted weight; a sharp contrast to that of healthy
aortic media: 35.0% ± 3.2% (Campa et al., 1987). Studies consistently agree on
severe elastin deficiency in AAAs, but there are inconsistencies in reports of
collagen content in aneurysmal tissue. One of the seminal early studies found
AAA tissue to be deficient in collagen (Sumner et al., 1970). A subsequent study
found collagen concentration between normal, AAA and atherosclerotic
occlusive aortas to be indistinguishable and another comparison of the
Healthy aorta
Lumen
Adventitia
AAA tissue
14
connective tissue matrix in control vs. AAA aortas found that the collagen
content was unaltered between the two (Dubick et al., 1988, Gandhi et al.,
1994). On the other hand, an early study found that collagen content was
significantly increased from 24% ± 5% in healthy aortas to 37% ± 16% in AAA
tissue and this has since become the accepted view (Rizzo et al., 1989). A more
recent study aiming to link clinical characteristics with histological features,
including levels of extracellular matrix proteins found that there was increased
collagen content in both electively repaired and ruptured AAAs (Hellenthal et
al., 2009c). The structure of the collagen in AAA has been reported to be
disordered with a marked decrease in the ‘waviness’ associated with
physiological collagen fibre crimping leading to conclusions that in AAA the
collagen fibres did not act as a coherent network (Gandhi et al., 1994). It is also
reported that the collagen network in AAA had 350% of the levels of cross-
linking of non-aneurysmal aorta, leading to suggestions that collagen
accumulates in aneurysmal walls via cross-linking whilst new collagen
synthesis is defective (Carmo et al., 2002).
It is not only the extracellular connective tissues of the aortic wall which were
found to be abnormal in AAAs; a marked decrease in the number of SMCs in
the media has also been widely observed. One study discovered that AAAs
lacked the orderly structure of elastic laminae seen in healthy aortic media and
demonstrated disorganisation of remaining SMCs. A cell count also revealed an
average 44% (range 25% to 60%) reduction in SMC density in AAA tissue
(n=29) compared to healthy controls (n=5) (Henderson et al., 1999).
Inflammatory cell infiltrations are also observed in abundant quantities in all
layers of the aneurysmal arterial wall (Shimizu et al., 2006, Hellenthal et al.,
2009b). This will be discussed in detail in Section 1.7.4.
1.5.2. BIOMECHANICAL BEHAVIOUR
Aortic rupture is the ultimate catastrophic outcome without surgical
intervention and this is a biomechanical failure of the aortic wall which occurs
when haemodynamic stresses overcome the tissue strength. The SMCs, found
15
in abundance in the aortic media, define the active mechanical properties of the
aorta by their contraction mechanism used to pump blood. The ECM acts as the
passive component. The ECM is comprised of two major proteins: elastin,
characterised as compliant and eponymously elastic, and collagen, generally
stiffer and more robust (Raghavan et al., 1996).
1.5.2.1. ARTERIAL BIOMECHANICS
Elastin enables the large arteries of the body to not only expand during
ventricular contraction in order to accommodate the surge of blood from the
heart, but also to impart recoil to the arterial wall. It is comprised of soluble
tropoelastin monomers cross-linked by lysine residues, rendering the protein as
a whole insoluble with a half-life of approximately 40 to 70 years (Rucker and
Tinker, 1977, Shah, 1997). Elastin fibres possess an elastic modulus of
approximately 0.6 MPa and the ability to stretch as much as 70% of the original
length (Lasheras, 2007).
Collagen, in its various forms, is ubiquitous in the connective tissue of the body.
In the aorta, Type I collagen is the most abundant with Type III collagen
following this, with a ratio of about 70:30 (Rizzo et al., 1989). Polypeptide
chains of collagen form into a stable triple helix structure which is only able to
stretch 2 – 4% of its original, uncoiled length (Goodall et al., 2002a). Collagen
fibres uncoil during loading, and only begin to bear such loads once the fibres
have straightened and have been recruited for load-bearing (Sumner et al., 1970,
Thubrikar et al., 2001).
The degradation of elastin fibres has been linked with the initiation and
expansion of AAAs whereas the ultimate failure of the arterial wall, resulting in
arterial rupture, is associated with collagen (Dobrin and Mrkvicka, 1994,
Petersen et al., 2002).
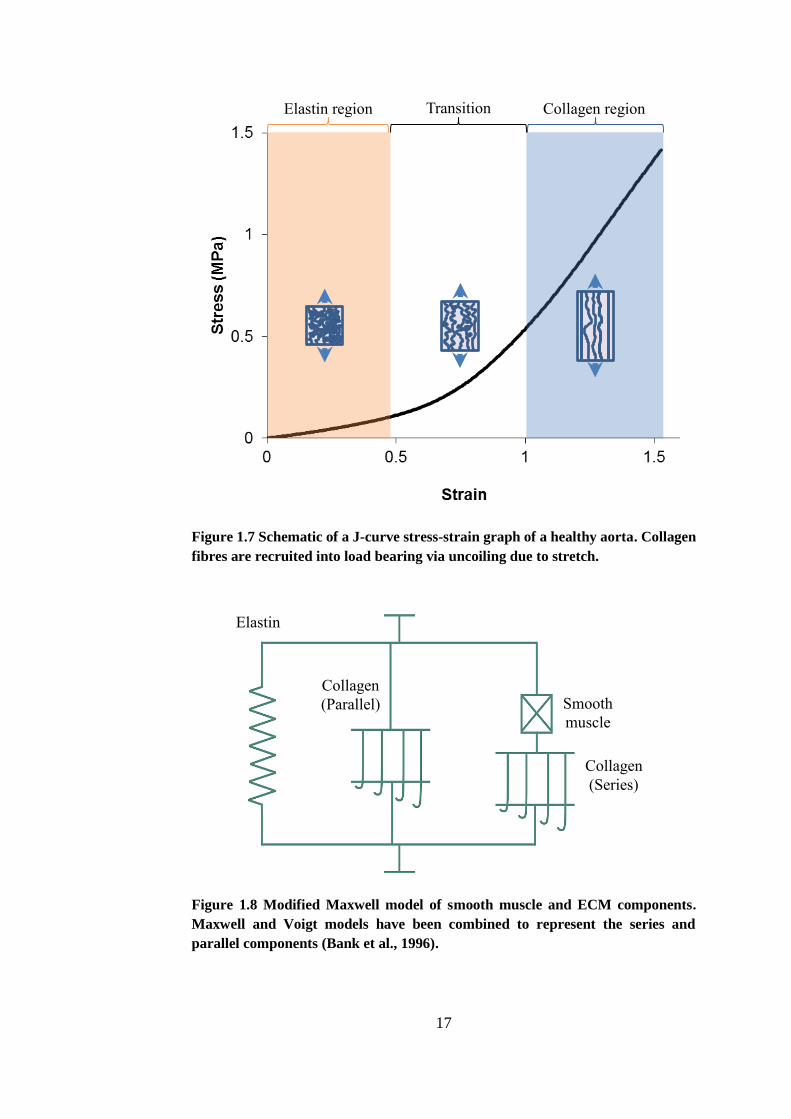
Early studies linked these two proteins of the extracellular matrix with the
characteristic J-shape stress-strain curves seen in healthy arterial tissue (Roach
and Burton, 1957, Sumner et al., 1970, Vaishnav et al., 1972). A schematic of
16
such a curve can be seen in Figure 1.7. The vessel is compliant at low strains
and gradually becomes stiffer as strain increases.
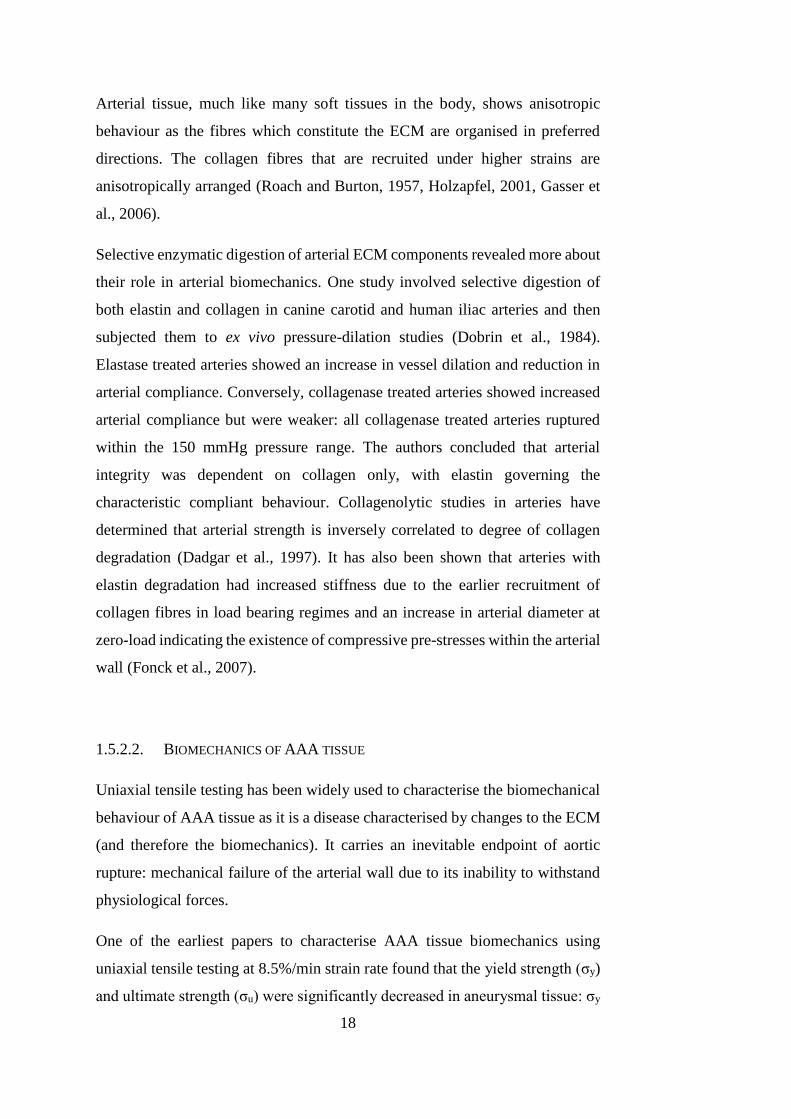
A modified Maxwell model can be used to demonstrate the physiological
contributions of the ECM components and the SMCs to the arterial
biomechanics which explains this characteristic biphasic behaviour (Bank et al.,
1996). A schematic of the model is shown in Figure 1.8. This model highlights
the strain-dependent elasticity initiated either by external strain (such as blood
pressure) or by contraction of SMCs. The elastin and the parallel collagen
component represent the elastic behaviour of the arterial wall when the SMCs
are completely relaxed. At low strains, elastin governs the biomechanical
behaviour. At increased strains, the collagen is gradually recruited into load-
bearing hence increasing the stiffness of the tissue (illustrated in Figure 1.8 with
a hook mechanism). The series collagen component also represents the
increasing stiffness of the tissue with regards to SMC contraction (Bank et al.,
1996).
17
Figure 1.7 Schematic of a J-curve stress-strain graph of a healthy aorta. Collagen
fibres are recruited into load bearing via uncoiling due to stretch.
Figure 1.8 Modified Maxwell model of smooth muscle and ECM components.
Maxwell and Voigt models have been combined to represent the series and
parallel components (Bank et al., 1996).
Elastin region Collagen region Transition
region
Elastin
Collagen
(Parallel) Smooth
muscle
Collagen
(Series)
18
Arterial tissue, much like many soft tissues in the body, shows anisotropic
behaviour as the fibres which constitute the ECM are organised in preferred
directions. The collagen fibres that are recruited under higher strains are
anisotropically arranged (Roach and Burton, 1957, Holzapfel, 2001, Gasser et
al., 2006).
Selective enzymatic digestion of arterial ECM components revealed more about
their role in arterial biomechanics. One study involved selective digestion of
both elastin and collagen in canine carotid and human iliac arteries and then
subjected them to ex vivo pressure-dilation studies (Dobrin et al., 1984).
Elastase treated arteries showed an increase in vessel dilation and reduction in
arterial compliance. Conversely, collagenase treated arteries showed increased
arterial compliance but were weaker: all collagenase treated arteries ruptured
within the 150 mmHg pressure range. The authors concluded that arterial
integrity was dependent on collagen only, with elastin governing the
characteristic compliant behaviour. Collagenolytic studies in arteries have
determined that arterial strength is inversely correlated to degree of collagen
degradation (Dadgar et al., 1997). It has also been shown that arteries with
elastin degradation had increased stiffness due to the earlier recruitment of
collagen fibres in load bearing regimes and an increase in arterial diameter at
zero-load indicating the existence of compressive pre-stresses within the arterial
wall (Fonck et al., 2007).
1.5.2.2. BIOMECHANICS OF AAA TISSUE
Uniaxial tensile testing has been widely used to characterise the biomechanical
behaviour of AAA tissue as it is a disease characterised by changes to the ECM
(and therefore the biomechanics). It carries an inevitable endpoint of aortic
rupture: mechanical failure of the arterial wall due to its inability to withstand
physiological forces.
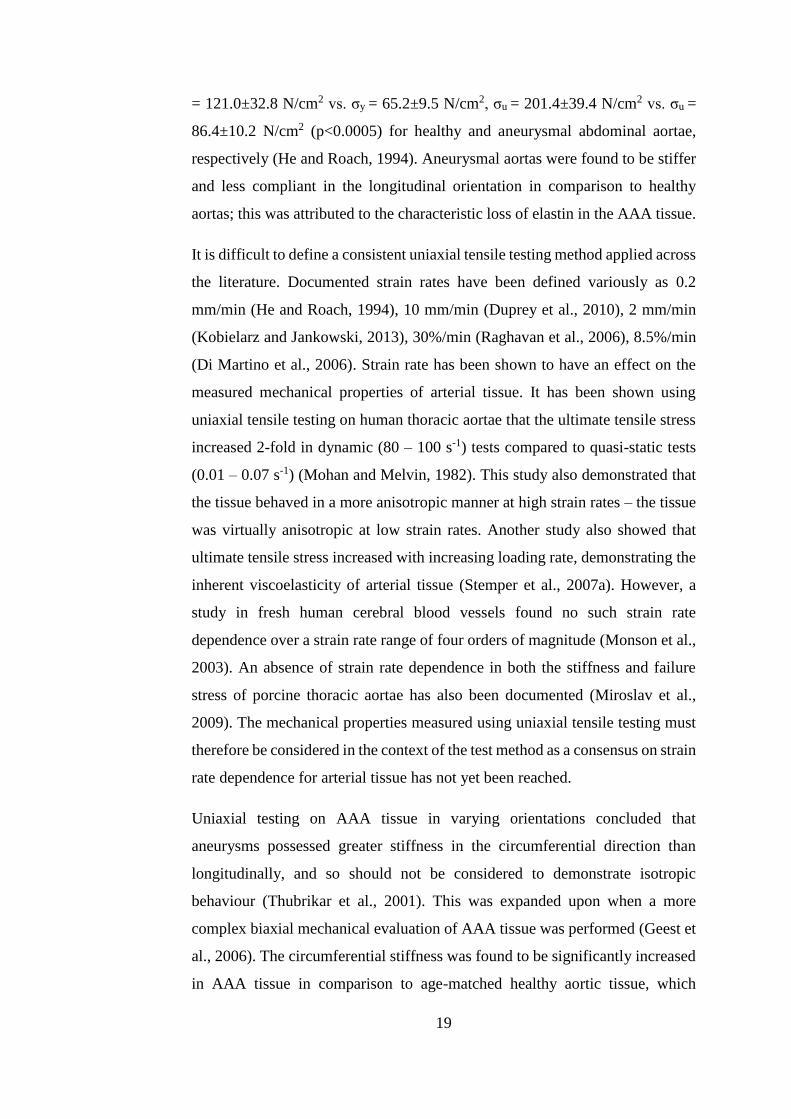
One of the earliest papers to characterise AAA tissue biomechanics using
uniaxial tensile testing at 8.5%/min strain rate found that the yield strength (σy)
and ultimate strength (σu) were significantly decreased in aneurysmal tissue: σy
19
= 121.0±32.8 N/cm2 vs. σy = 65.2±9.5 N/cm2, σu = 201.4±39.4 N/cm2 vs. σu =
86.4±10.2 N/cm2 (p<0.0005) for healthy and aneurysmal abdominal aortae,
respectively (He and Roach, 1994). Aneurysmal aortas were found to be stiffer
and less compliant in the longitudinal orientation in comparison to healthy
aortas; this was attributed to the characteristic loss of elastin in the AAA tissue.
It is difficult to define a consistent uniaxial tensile testing method applied across
the literature. Documented strain rates have been defined variously as 0.2
mm/min (He and Roach, 1994), 10 mm/min (Duprey et al., 2010), 2 mm/min
(Kobielarz and Jankowski, 2013), 30%/min (Raghavan et al., 2006), 8.5%/min
(Di Martino et al., 2006). Strain rate has been shown to have an effect on the
measured mechanical properties of arterial tissue. It has been shown using
uniaxial tensile testing on human thoracic aortae that the ultimate tensile stress
increased 2-fold in dynamic (80 – 100 s-1) tests compared to quasi-static tests
(0.01 – 0.07 s-1) (Mohan and Melvin, 1982). This study also demonstrated that
the tissue behaved in a more anisotropic manner at high strain rates – the tissue
was virtually anisotropic at low strain rates. Another study also showed that
ultimate tensile stress increased with increasing loading rate, demonstrating the
inherent viscoelasticity of arterial tissue (Stemper et al., 2007a). However, a
study in fresh human cerebral blood vessels found no such strain rate
dependence over a strain rate range of four orders of magnitude (Monson et al.,
2003). An absence of strain rate dependence in both the stiffness and failure
stress of porcine thoracic aortae has also been documented (Miroslav et al.,
2009). The mechanical properties measured using uniaxial tensile testing must
therefore be considered in the context of the test method as a consensus on strain
rate dependence for arterial tissue has not yet been reached.
Uniaxial testing on AAA tissue in varying orientations concluded that
aneurysms possessed greater stiffness in the circumferential direction than
longitudinally, and so should not be considered to demonstrate isotropic
behaviour (Thubrikar et al., 2001). This was expanded upon when a more
complex biaxial mechanical evaluation of AAA tissue was performed (Geest et
al., 2006). The circumferential stiffness was found to be significantly increased
in AAA tissue in comparison to age-matched healthy aortic tissue, which
20
indicated a higher degree of anisotropic behaviour. The authors concluded that
aneurysmal degradation is associated with an increase in mechanical anisotropy,
with preferential circumferential stiffening due to loss of elastin in AAA tissue.
Biomechanical differences have been documented between electively repaired
and ruptured AAA tissue: it was found that ruptured AAAs were significantly
weaker in spite of being thicker (Di Martino et al., 2006).
Advances in biomedical imaging techniques have enabled in vivo measurement
of AAA biomechanics. An ultrasound phase-locked echo-tracking system was
used to measure the diameter of healthy abdominal aortas during systole and
diastole, hence deriving the arterial compliance in the aneurysm (Lanne et al.,
1992). The age range of the subjects was 5 to 71 years old and they concluded
that the stiffness of the artery increased exponentially with age. Using an
alternative method, computed tomography (CT) scanning was used to determine
the aortic distensibility of 67 patients with AAAs (Ganten et al., 2008).
Distensibility is a measure of the arterial ability to expand and contract and is
therefore related to stiffness measured during uniaxial tensile testing. Mirroring
the reports of increased stiffness in AAAs arising from uniaxial tensile testing
studies, they reported that the distensibility of AAAs were significantly lower
than in the proximal non-aneurysmal aorta and that there was no correlation
with AAA size. The authors suggested that the fact that the distensibility of both
small and large AAAs were indistinguishable may indicate that this reduced
distensibility (and hence increased stiffness) is an early event in AAA
development. These findings are comparable to a study which also reported
reduced distensibility in AAA tissue and no correlation between distensibility
and diameter (Molacek et al., 2011). A follow-up study of 61 AAA patients
from a previous study in 1998 reported that the AAA elasticity (as measured by
ultrasound) showed positive correlation with the annual AAA expansion rate
(Hoegh and Lindholt, 2009).
21
1.6. ATHEROSCLEROSIS AND AAA
Historically, atherosclerosis was considered to be a cause of AAA. However, in
more recent years, there is considerable debate as to whether the relationship
between atherosclerosis and aortic aneurysm is causal or whether the two forms
of vascular remodelling simply share common risk factors. Golledge and
Norman outlined the three philosophies regarding this relationship. Firstly,
patients who are afflicted with an AAA are likely to also have atherosclerosis
so it is postulated that atherosclerosis plays a causative role. Secondly, various
shared genetic and environmental risk factors are causal in the development of
both atherosclerosis and AAA but the two mechanisms are distinct and
independent. The third theory is a combination of the previous two; either AAA
or atherosclerosis can develop first and then promote the development of the
other (Golledge and Norman, 2010).
Although patients with AAA are likely to also suffer from atherosclerosis, not
all patients with atherosclerosis go on to develop an aneurysm; in fact only 9%
to 16%, of patients with atherosclerotic abdominal aortas develop an AAA
(Shimizu et al., 2006). At present, there is fervent discussion as to whether some
sort of defining mechanism between AAA and atherosclerosis exists. The
Tromsø study, with a large sample size (n=6446) recently found that
atherosclerosis was more common in patients with AAA and that it was an
independent risk marker for AAA, but could not conclude as to whether
atherosclerosis played a causative role (Johnsen et al., 2010).
A paradox that has recently emerged is the relationship of AAA and
atherosclerosis with diabetes. Diabetes is a risk factor for cardiovascular disease
but there has been an increasingly large amount of evidence that there is, in fact,
a negative association with AAA whilst it delivers the opposite effect with
atherosclerosis (Shantikumar et al., 2010, Lederle, 2012, Pafili et al., 2015).
Although more investigation is required with regards to the exact biological
mechanism, this paradox provides strong evidence that aneurysmal and
atherosclerotic disease are separate diseases with separate aetiologies, though
they may exacerbate each other. The ineffectiveness of pharmacological agents
commonly used to treat atherosclerosis in treating AAA also suggests that
22
differing biological mechanisms are involved (Ferguson et al., 2010, Golledge
and Norman, 2010).
1.7. AAA PATHOPHYSIOLOGY
As previously discussed in section 1.4.1, one of the defining markers of AAA
is severe elastin degradation in the aortic media. Elastin possesses an extremely
long half-life of anywhere from 40 to 70 years and so is a highly stable ECM
protein. The loss of elastin in AAA tissue is therefore almost certainly due to
active elastolytic processes rather than insufficient synthesis or natural passive
degradation (Thompson et al., 1995, Shah, 1997, Shimizu et al., 2006). In basic
terms, AAA pathophysiology can be divided into several separate, yet
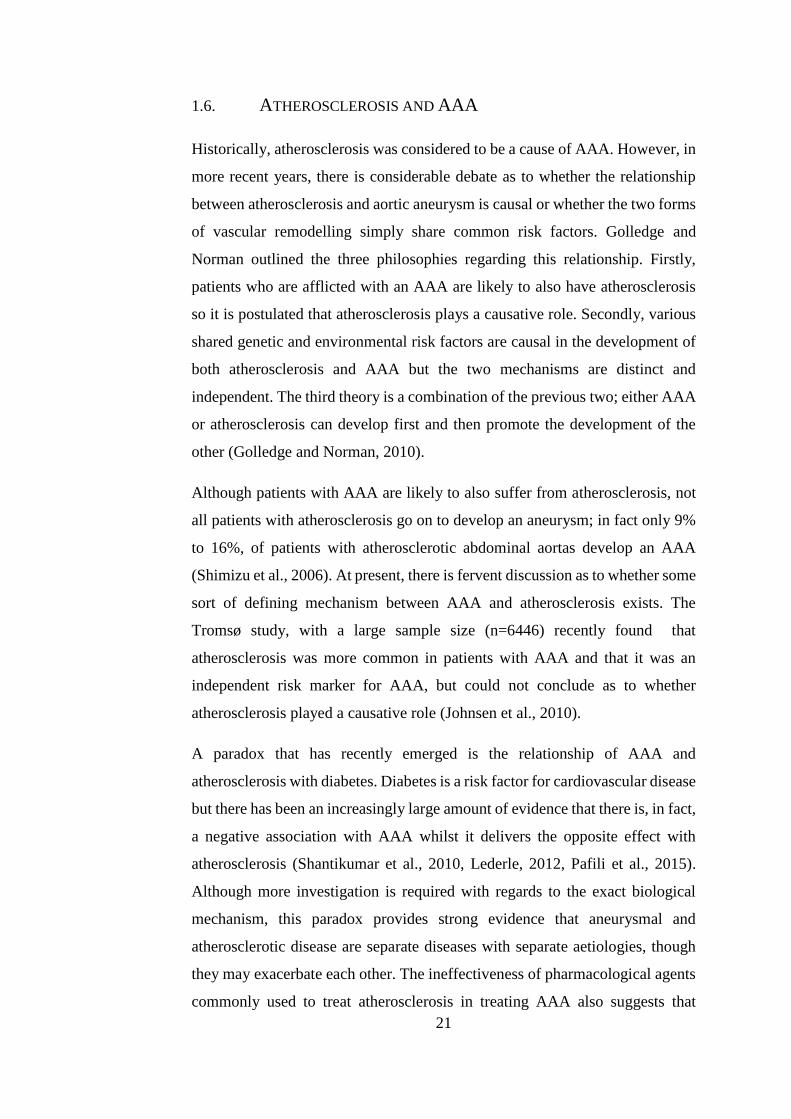
inextricably linked, processes. Characteristics and physiology of aneurysmal
arterial wall are shown in Figure 1.9. The subsequent sections of this chapter
will examine the biological and mechanical mechanisms underlying AAA
disease.
Figure 1.9 Diagram of changes in AAA wall compared to healthy artery. MMPs =
matrix metalloproteinases, SMC = smooth muscle cell, PMN =
polymorphonuclear neutrophils. The media thickens in AAA compared to healthy
arterial wall and AAA are often found with intra-luminal thrombus (red) present.
23
1.7.1. EXTRACELLULAR MATRIX DEGRADATION
The number one culprit responsible for the ECM degradation in AAA tissue is
a family of endopeptidases known as matrix metallo-proteinases (MMPs).
MMPs are vital in normal body function for organ development, wound healing
and necessary protein remodelling, but can also contribute to various
pathological remodelling mechanisms (Galis and Khatri, 2002).
Various members of the MMP family have previously been identified in the
aneurysmal aorta, including MMP-2 (gelatinase A), MMP-9 (gelatinase B),
MMP-3 (stromelysin), MMP-1, MMP-7, MMP-12 and MMP-13 (Shah, 1997,
Lijnen, 2001, Fontaine et al., 2002, Wilson et al., 2008).
A study to determine the role of 92kD gelatinase-B (MMP-9) in the formation
of AAA, with atherosclerotic occlusive (AO) and healthy controls found that
conditioned medium from AAA tissue in organ culture consistently secreted
prominent proteolytic activity in comparison to AO and healthy tissue. AAA
tissue produced 10.5-fold and AO tissue produced 5.9-fold the level of MMP-9
versus normal tissue (Thompson et al., 1995). It must be noted that MMP-9 is a
prominent elastolytic enzyme, so this finding is supported by the severe elastin
degradation observed in AAA tissue.
Furthermore, an in vivo study investigated the levels of MMP-9 in the serum
levels of AAA patients. Again, it was found AAA patients had increased levels
of this enzyme in comparison to AO and normal patients. Severely elevated
levels were found in 48% of AAA patients in comparison to 7% of AO patients.
These elevated levels decreased by 92.7%±3.2% following surgical AAA
repair, indicating a relationship between expanding AAAs and MMP-9 levels
(Hovsepian et al., 2000).
Both of these studies used tissue where an aneurysm had already manifested,
and so was at end-stage disease. Therefore, the role of MMP-9 in initial
causation of human AAA disease cannot be determined from these cases. The
role of MMP-9 in AAA formation has been investigated in animals using a
genetically modified mouse model with targeted MMP-9 and MMP-12
deficiency. Elastase perfusion in wild-type mice induced AAAs in 91% of
24
cases, whereas the aortic diameter in MMP-9 only and MMP-9 with MMP-12
deficient animals was markedly reduced at 7 days and 14 days after perfusion.
MMP-12 deficient only mice exhibited a similar increase in aortic diameter to
wild-type mice (Pyo et al., 2000). The authors concluded that their observations
showed evidence that MMP-9 is required for AAA development.
Biopsies of human AAAs revealed that expression of MMP-2 was predominant
in smaller, earlier AAAs, and MMP-9 became more prevalent once aortic
diameter had further increased (Freestone et al., 1995). A positive correlation
has been documented with regards to MMP-9 expression and aortic diameter
(McMillan et al., 1997). Elevated serum levels of MMP-1 and MMP-9 in AAA
patients was associated with imminent aortic rupture (Wilson et al., 2008).
However, a large cohort study of AAA patients (n=987) found that MMP-9
serum levels in AAA patients failed to serve as a potential biomarker for AAA
(Eugster et al., 2005).
MMPs are secreted by SMCs as a normal physiological remodelling process.
However, other cell types are implicated in MMP expression in AAAs. Firstly,
adventitial mast cells (involved in innate and adaptive immunity) have been
shown to contribute towards progression of AAAs. Significantly increased
number of mast cells have been found in human AAA tissue showing a positive
relationship between number and AAA diameter (Tsuruda et al., 2008).
Additionally, mast cell deficient rats did not develop AAA using a standard
calcium chloride (CaCl2) animal model. Secondly, mesenchymal stromal cells
(MSCs) have been implicated in AAA progression through impaired
immunomodulatory activity and MMP-9 secretion (Ciavarella et al., 2015).
MSCs were isolated from AAA tissue and were shown to have a 400-fold
increased expression of MMP-9 compared to MSCs from healthy controls.
Finally, MMP-9 is readily secreted by infiltrating macrophages in AAA tissue
which exhibited a 10-fold increased MMP-9 expression compared to normal
aorta. This was entirely localised to the numerous macrophages in the tissue
(Thompson et al., 1995)
The evidence seems to suggest that elevated levels of ECM-degrading MMPs
are responsible for the formation, expansion and rupture of AAAs. In addition
25
to this, the enzyme inhibitors are compromised. Tissue inhibitors of
metalloproteinases (TIMPs) have been found to be reduced in AAA tissue, in
both human and genetically modified animal studies (Brophy et al., 1991, Basu
et al., 2011). Elevated levels of MMPs are therefore not strictly necessary for
AAA formation; simply the lack of MMP inhibitors may be sufficient.
A study of 36 men with small AAAs found that MMP-9 serum levels were
significantly associated with AAA size (p=0.04) and expansion p=(0.01), but
overall MMP levels and an MMP:TIMP ratio did not predict either (Lindholt et
al., 2000). In contrast, a later study did not find a correlation between AAA
expansion and serum MMP-9 levels in a study of 208 small aneurysm patients
(Karlsson et al., 2009). Contrasting clinical evidence indicates that the specific
role of MMPs and TIMPs in vivo must still be investigated further.
MMPs can also be activated via a biological cascade emanating from plasmin
activators. Plasmin, either generated from urokinase-type (u-PA) or tissue-type
plasminogen activator (t-PA), is an enzyme that primarily plays a role in
fibrinolysis, and has been implicated in the formation of AAAs (Carmeliet et
al., 1997). Although plasmin possesses a limited elastolytic capability, and so is
not directly implicated in the severe elastin degradation in AAAs, it is the role
that it plays in MMP activation which may lead to AAA formation. A study
using a genetically modified mouse model demonstrated that u-PA activated
MMPs that led to aneurysm formation (Carmeliet et al., 1997). In a rat xenograft
model, it was found that aneurysm formation was prevented when a
plasminogen activator inhibitor is over-expressed (Allaire et al., 1998).
Collagen degradation occurs simultaneously to this pathological elastolysis.
The degradation of collagen is mitigated by an increase in collagen synthesis
during early AAA formation suggesting some sort of stabilising repair process
(Shimizu et al., 2006). During later stages of AAA development, this collagen
synthesis is outstripped by the rate of collagen degradation by proteolysis,
instigating rupture; elevated levels of MMP-1, a collagenase, are associated
with rupture and mortality (Wilson et al., 2008).
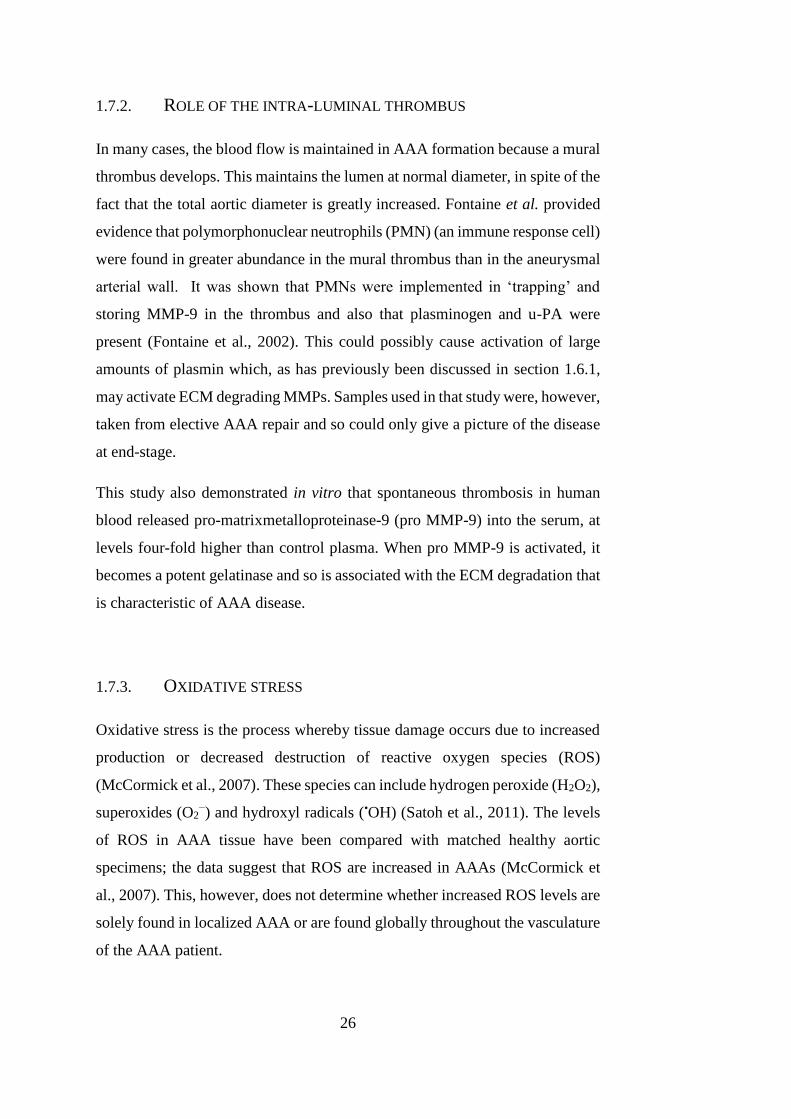
26
1.7.2. ROLE OF THE INTRA-LUMINAL THROMBUS
In many cases, the blood flow is maintained in AAA formation because a mural
thrombus develops. This maintains the lumen at normal diameter, in spite of the
fact that the total aortic diameter is greatly increased. Fontaine et al. provided
evidence that polymorphonuclear neutrophils (PMN) (an immune response cell)
were found in greater abundance in the mural thrombus than in the aneurysmal
arterial wall. It was shown that PMNs were implemented in ‘trapping’ and
storing MMP-9 in the thrombus and also that plasminogen and u-PA were
present (Fontaine et al., 2002). This could possibly cause activation of large
amounts of plasmin which, as has previously been discussed in section 1.6.1,
may activate ECM degrading MMPs. Samples used in that study were, however,
taken from elective AAA repair and so could only give a picture of the disease
at end-stage.
This study also demonstrated in vitro that spontaneous thrombosis in human
blood released pro-matrixmetalloproteinase-9 (pro MMP-9) into the serum, at
levels four-fold higher than control plasma. When pro MMP-9 is activated, it
becomes a potent gelatinase and so is associated with the ECM degradation that
is characteristic of AAA disease.
1.7.3. OXIDATIVE STRESS
Oxidative stress is the process whereby tissue damage occurs due to increased
production or decreased destruction of reactive oxygen species (ROS)
(McCormick et al., 2007). These species can include hydrogen peroxide (H2O2),
superoxides (O2−) and hydroxyl radicals (•OH) (Satoh et al., 2011). The levels
of ROS in AAA tissue have been compared with matched healthy aortic
specimens; the data suggest that ROS are increased in AAAs (McCormick et
al., 2007). This, however, does not determine whether increased ROS levels are
solely found in localized AAA or are found globally throughout the vasculature
of the AAA patient.
27
A later study measured ROS levels in AAA tissues and compared these to non-
aneurysmal aortic adjacent aortic segments (Miller et al., 2002). It was found
that levels of ROS – and therefore also oxidative stress – were 2.5-fold higher
in AAA tissue than in the non-aneurysmal adjacent segments. Again, the
problem emerges that the tissues used in this experiment were taken from
patients at elective repair, and so only represented the state of the tissue at end-
stage disease. Therefore no conclusions can be drawn regarding the role of ROS
in AAA formation or early development. Figure 1.10 presents some of the
mechanisms by which ROS has the potential to augment aneurysm formation.
Figure 1.10 Interactive pathways of possible promotion of aneurysm formation.
ROS = reactive oxygen species. Blue arrows denote aneurysmal promotion effects
of ROS.
1.7.4. INFLAMMATION
Immune response cells involved in the inflammatory process are also found in
abundance in AAA tissue (Shimizu et al., 2006, Hellenthal et al., 2009b). Figure
1.11 shows typical AAA histology and highlights the presence of these
inflammatory cells.
These dense localisations of inflammatory cells occur more frequently and
abundantly in AAA tissue than in normal or stenosed atherosclerotic arteries
(Koch et al., 1990). B-cells are only very rarely found in atherosclerotic aortae,
Tissue remodelling
Inflammation
MMPs
SMC apoptosis ECM degradation
Cell death
promoting cytokines;
Fas activation ROS
28
whereas local depositions of immunoglobulin, secreted by B-cells, are
frequently observed in AAAs (Shimizu et al., 2006).
Figure 1.11 Inflammatory infiltrate in AAA (left) compared to healthy control
aortae (right). Immunostaining for CD68+ cells (brown) shows distribution of
monocytes and macrophages, common inflammatory cell types. Image taken
from Kin et al. (2012), CC BY 2.5.
It was determined that the majority of the inflammatory infiltrate was generally
located at the medial-adventitial junction and was composed of
immunophenotypic cells: T-cells, B-cells and macrophages (alongside very
small numbers of neutrophils) (Satta et al., 1998). The specimens used were
taken from patients undergoing elective repair and so this is only an insight into
the inflammatory state of the tissue at end-stage disease. Therefore, it is unclear
at which stage of arterial wall degeneration this infiltration occurred and its role
in aneurysm formation. That study also suggested that the degree of
inflammation in each aneurysm positively correlated with the degree to which
elastin degradation had occurred, especially with respect to T and B
lymphocytes and macrophages.
Adventitial mast cells have also been documented as contributing to AAA
progression and development. It was found that there was a significant positive
correlation between this type of cell and the maximum aortic diameter, and that
the proportion of degranulated mast cells was significantly increased in AAA
compared to atherosclerotic controls (Tsuruda et al., 2008). Mast cells are also
involved in the recruitment of T lymphocytes and macrophages via pro-
AAA Control aorta
29
inflammatory mediators. Macrophages contribute to AAA development by
directly secreting ECM degrading elastases and collagenases (Shimizu et al.,
2006).
It is theorised that the recruitment of inflammatory cells into the media and
adventitia of the aneurysm stems from elastin-derived peptide (EDP) induced
chemotaxis. Elastolysis produces these EDPs which then recruit inflammatory
cells into the media. The inflammatory cells are then able to secrete additional
proteolytic enzymes, trapping the artery in a vicious cycle of pathological
vascular remodelling, resulting in aneurysm (Satta et al., 1998).
It has been proposed that the inflammatory cell infiltrates that are so pervasive
in AAA disease are part of a dysregulated autoimmune system response against
the arterial wall (Jagadesham et al., 2008).
A current frame of thinking is that inflammatory cell recruitment following an
unknown instigating factor is the first stage of AAA progression. These cells,
in addition to SMCs, then produce the proteases required for the observed ECM
degradation (Ailawadi et al., 2003).
1.7.5. ROLE OF THE SMOOTH MUSCLE CELL IN AAA
Inflammatory characteristics of AAA have been studied for many years, yet
relatively fewer studies have considered the role of SMCs in AAA pathogenesis.
One main aim of this project is to characterise the alterations in SMC function
over time in an ex vivo AAA bioreactor model.
1.7.5.1. SMC PHENOTYPIC MODULATION
It has been well documented that vascular SMCs are able to undergo profound
changes in phenotype in response to alterations in the extracellular environment
(such as growth factors/inhibitors, mechanical influences, cell-cell and cell-
matrix interactions, and various inflammatory mediators) and are also able to
exhibit a wide variety of cell phenotypes at different stages of development or
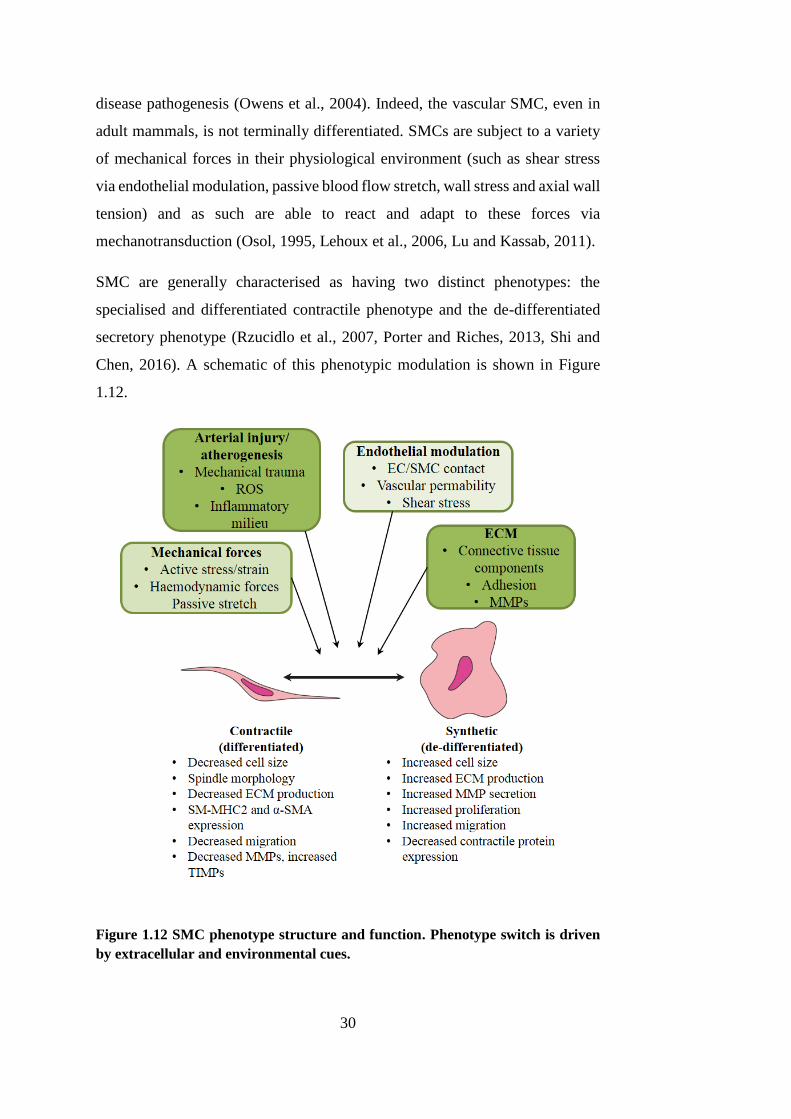
30
disease pathogenesis (Owens et al., 2004). Indeed, the vascular SMC, even in
adult mammals, is not terminally differentiated. SMCs are subject to a variety
of mechanical forces in their physiological environment (such as shear stress
via endothelial modulation, passive blood flow stretch, wall stress and axial wall
tension) and as such are able to react and adapt to these forces via
mechanotransduction (Osol, 1995, Lehoux et al., 2006, Lu and Kassab, 2011).
SMC are generally characterised as having two distinct phenotypes: the
specialised and differentiated contractile phenotype and the de-differentiated
secretory phenotype (Rzucidlo et al., 2007, Porter and Riches, 2013, Shi and
Chen, 2016). A schematic of this phenotypic modulation is shown in Figure
1.12.
Figure 1.12 SMC phenotype structure and function. Phenotype switch is driven
by extracellular and environmental cues.
31
The main function of the SMC in the heathy artery is to regulate blood flow and
pressure via contracting and relaxing to force blood through the artery by
altering the vessel diameter (Owens et al., 2004, Shi and Chen, 2016). Under
these circumstances, SMCs possess low turnover and synthetic activity (Porter
and Riches, 2013). Differentiated SMCs express high levels of smooth muscle
specific proteins, including α-smooth muscle actin (α-SMA), smooth muscle
myosin heavy chain (SM-MHC), calponin and smoothelin (Hungerford et al.,
1996, Shi and Chen, 2016). Differentiated SMCs have a spindle morphology
with highly aligned actin fibres which are reorganised during phenotypic
modulation (Worth et al., 2001b, Han et al., 2009).
In response to a multitude of external factors (including arterial injury,
mechanical forces and atherogenesis) SMCs de-differentiate into a secretory
phenotype. In contrast to the low SMC turnover often observed in the
differentiated phenotype, de-differentiated SMCs are highly proliferative and
migratory and are also able to remodel the ECM with increased secretion of
MMPs and matrix proteins (Owens et al., 2004, Rensen et al., 2007, Porter and
Riches, 2013). This process of reversible differentiation is relatively poorly
understood due to the derivation of SMCs from multiple precursors throughout
embryogenesis (Majesky, 2007). Extensive studies into the mechanism behind
SMC differentiation have found that it is orchestrated by a precisely co-
ordinated molecular network which incorporates different environmental cues,
mechanical forces, signalling pathways, transcription factors, reactive oxygen
species, extracellular matrix and micro RNAs (most notably miR-145 and miR
143) (Rensen et al., 2007, Cordes et al., 2009, Alexander and Owens, 2012, Qiu
et al., 2014, Shi and Chen, 2016) and reviewed in Zhang et al. (2015).
MicroRNAs are small, non-coding endogenous RNAs which are able to post-
transcriptionally regulate gene expression via RNA silencing and repression in
a field of study termed epigenetics, reviewed in Alexander and Owens (2012)
Many studies have detailed the changes that SMCs undergo due to development
of cardiovascular diseases, such as atherosclerosis, via gene profiling (as
reviewed in Owens et al. (2004)). However, studies such as this are limited in
capturing the dynamic nature of SMC phenotypic modulation; for example,
32
SMC proliferation generally increases following early stages of disease, but is
decreased in mature lesions (Owens et al., 2004, Ailawadi et al., 2009).
1.7.5.2. SMOOTH MUSCLE CELL LOSS AND DYSFUNCTION IN AAA
As mentioned in chapter 1.4.1, in addition to degradation of the ECM, SMC
apoptosis is a defining characteristic of AAA. The inflammatory cell infiltration
of macrophages and T lymphocytes produce significantly increased numbers of
cell death promoting proteins, such as perforin, Fas and FasL, in end-stage
aneurysm disease tissue (Henderson et al., 1999). The authors of that study
suggest that the secretion of mediators of apoptosis may be mainly targeted to
the inflammatory cells themselves, rather than the SMCs, as a potential
mechanism of self-limitation of the immune response. The medial SMC and the
adventitial fibroblasts are principally responsible for the synthesis of collagen
and elastin in the aortic wall; hence the depletion of medial SMC has the
potential to be a major factor in AAA development.
SMCs contribute to the architecture of the aortic wall in addition to their ECM
remodelling capabilities – a decrease in the number of SMCs will therefore have
a notable effect on the functional and structural integrity of the aorta. It has been
shown that there was no significant difference in medial SMC density measured
via immunohistochemistry for α-SMA and direct cell counts between normal
(n=5) and atherosclerotic occlusive (AO) aorta (n=6), but a 74% decrease in
SMC number in AAA tissue (n=10) (Lopez-Candales et al., 1997). Light and
electron microscopy revealed ultrastructural changes consistent with SMC
apoptosis and up to 30% of AAA SMC demonstrated fragmented DNA.
Apoptotic SMC were found solely in the neointimal plaque in AO disease but
were distributed throughout the degenerative media in AAA tissue.
The problem remains that the AAA and AO samples were taken from end-stage
diseases, and so again cannot give any information as to the development of the
pathology. A decrease in the number of SMCs in the aneurysmal aortic wall
implies that the rate of ECM synthesis is decreased hence there exists an
imbalance between proteolytic degradation and matrix synthesis in favour of
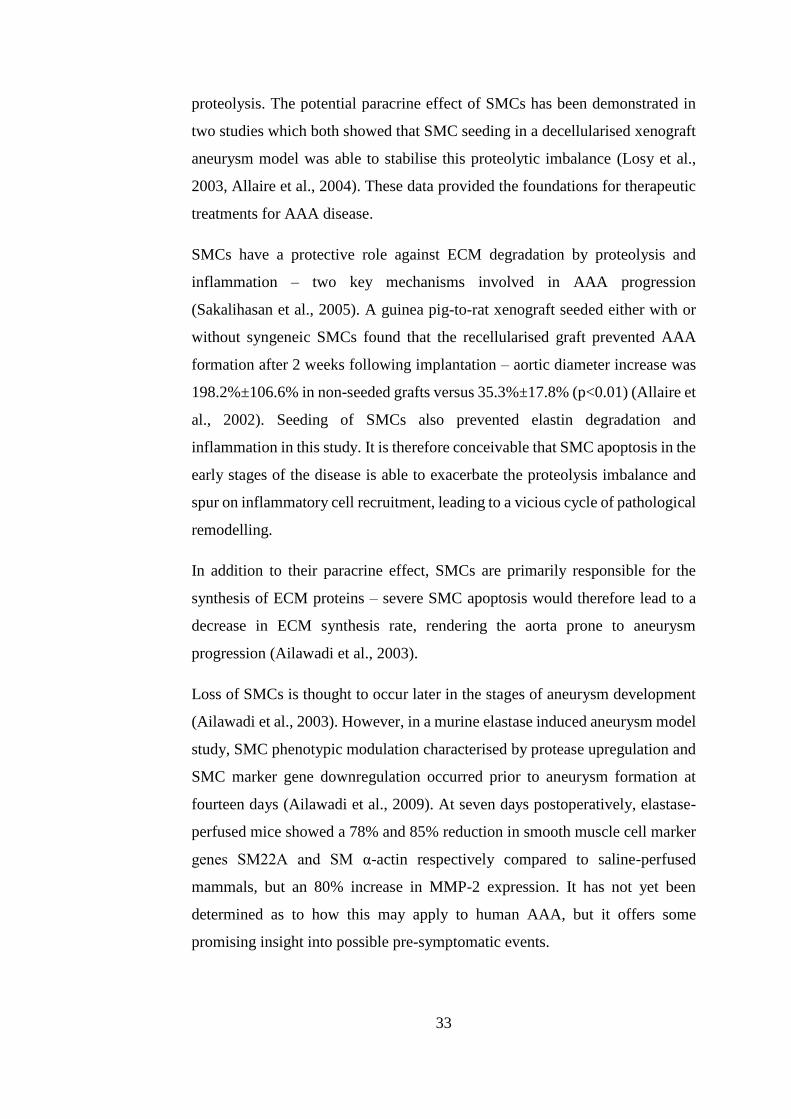
33
proteolysis. The potential paracrine effect of SMCs has been demonstrated in
two studies which both showed that SMC seeding in a decellularised xenograft
aneurysm model was able to stabilise this proteolytic imbalance (Losy et al.,
2003, Allaire et al., 2004). These data provided the foundations for therapeutic
treatments for AAA disease.
SMCs have a protective role against ECM degradation by proteolysis and
inflammation – two key mechanisms involved in AAA progression
(Sakalihasan et al., 2005). A guinea pig-to-rat xenograft seeded either with or
without syngeneic SMCs found that the recellularised graft prevented AAA
formation after 2 weeks following implantation – aortic diameter increase was
198.2%±106.6% in non-seeded grafts versus 35.3%±17.8% (p<0.01) (Allaire et
al., 2002). Seeding of SMCs also prevented elastin degradation and
inflammation in this study. It is therefore conceivable that SMC apoptosis in the
early stages of the disease is able to exacerbate the proteolysis imbalance and
spur on inflammatory cell recruitment, leading to a vicious cycle of pathological
remodelling.
In addition to their paracrine effect, SMCs are primarily responsible for the
synthesis of ECM proteins – severe SMC apoptosis would therefore lead to a
decrease in ECM synthesis rate, rendering the aorta prone to aneurysm
progression (Ailawadi et al., 2003).
Loss of SMCs is thought to occur later in the stages of aneurysm development
(Ailawadi et al., 2003). However, in a murine elastase induced aneurysm model
study, SMC phenotypic modulation characterised by protease upregulation and
SMC marker gene downregulation occurred prior to aneurysm formation at
fourteen days (Ailawadi et al., 2009). At seven days postoperatively, elastase-
perfused mice showed a 78% and 85% reduction in smooth muscle cell marker
genes SM22A and SM α-actin respectively compared to saline-perfused
mammals, but an 80% increase in MMP-2 expression. It has not yet been
determined as to how this may apply to human AAA, but it offers some
promising insight into possible pre-symptomatic events.
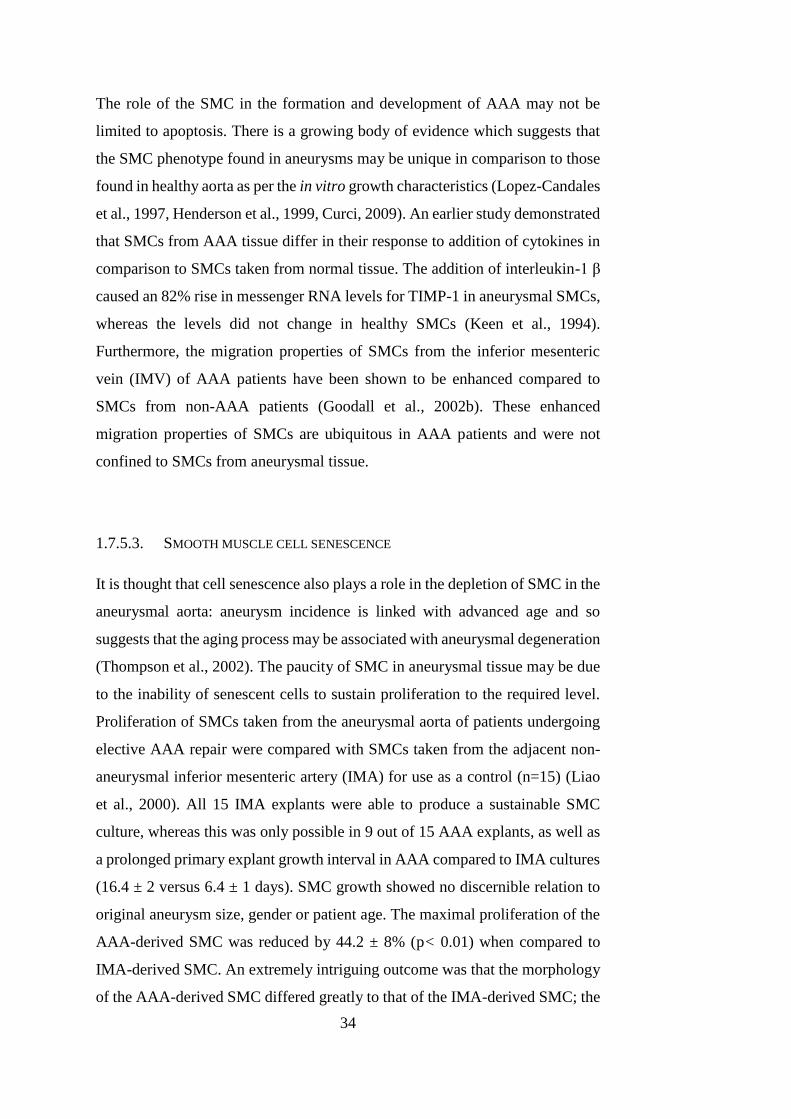
34
The role of the SMC in the formation and development of AAA may not be
limited to apoptosis. There is a growing body of evidence which suggests that
the SMC phenotype found in aneurysms may be unique in comparison to those
found in healthy aorta as per the in vitro growth characteristics (Lopez-Candales
et al., 1997, Henderson et al., 1999, Curci, 2009). An earlier study demonstrated
that SMCs from AAA tissue differ in their response to addition of cytokines in
comparison to SMCs taken from normal tissue. The addition of interleukin-1 β
caused an 82% rise in messenger RNA levels for TIMP-1 in aneurysmal SMCs,
whereas the levels did not change in healthy SMCs (Keen et al., 1994).
Furthermore, the migration properties of SMCs from the inferior mesenteric
vein (IMV) of AAA patients have been shown to be enhanced compared to
SMCs from non-AAA patients (Goodall et al., 2002b). These enhanced
migration properties of SMCs are ubiquitous in AAA patients and were not
confined to SMCs from aneurysmal tissue.
1.7.5.3. SMOOTH MUSCLE CELL SENESCENCE
It is thought that cell senescence also plays a role in the depletion of SMC in the
aneurysmal aorta: aneurysm incidence is linked with advanced age and so
suggests that the aging process may be associated with aneurysmal degeneration
(Thompson et al., 2002). The paucity of SMC in aneurysmal tissue may be due
to the inability of senescent cells to sustain proliferation to the required level.
Proliferation of SMCs taken from the aneurysmal aorta of patients undergoing
elective AAA repair were compared with SMCs taken from the adjacent non-
aneurysmal inferior mesenteric artery (IMA) for use as a control (n=15) (Liao
et al., 2000). All 15 IMA explants were able to produce a sustainable SMC
culture, whereas this was only possible in 9 out of 15 AAA explants, as well as
a prolonged primary explant growth interval in AAA compared to IMA cultures
(16.4 ± 2 versus 6.4 ± 1 days). SMC growth showed no discernible relation to
original aneurysm size, gender or patient age. The maximal proliferation of the
AAA-derived SMC was reduced by 44.2 ± 8% (p< 0.01) when compared to
IMA-derived SMC. An extremely intriguing outcome was that the morphology
of the AAA-derived SMC differed greatly to that of the IMA-derived SMC; the
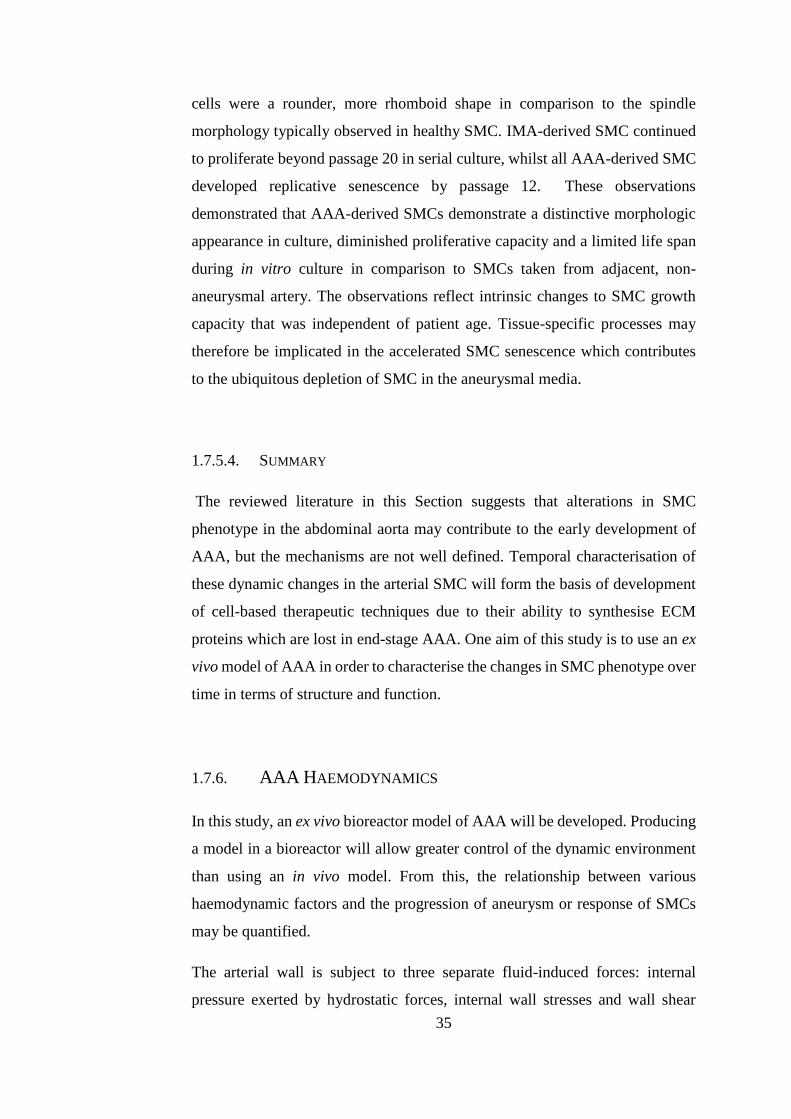
35
cells were a rounder, more rhomboid shape in comparison to the spindle
morphology typically observed in healthy SMC. IMA-derived SMC continued
to proliferate beyond passage 20 in serial culture, whilst all AAA-derived SMC
developed replicative senescence by passage 12. These observations
demonstrated that AAA-derived SMCs demonstrate a distinctive morphologic
appearance in culture, diminished proliferative capacity and a limited life span
during in vitro culture in comparison to SMCs taken from adjacent, non-
aneurysmal artery. The observations reflect intrinsic changes to SMC growth
capacity that was independent of patient age. Tissue-specific processes may
therefore be implicated in the accelerated SMC senescence which contributes
to the ubiquitous depletion of SMC in the aneurysmal media.
1.7.5.4. SUMMARY
The reviewed literature in this Section suggests that alterations in SMC
phenotype in the abdominal aorta may contribute to the early development of
AAA, but the mechanisms are not well defined. Temporal characterisation of
these dynamic changes in the arterial SMC will form the basis of development
of cell-based therapeutic techniques due to their ability to synthesise ECM
proteins which are lost in end-stage AAA. One aim of this study is to use an ex
vivo model of AAA in order to characterise the changes in SMC phenotype over
time in terms of structure and function.
1.7.6. AAA HAEMODYNAMICS
In this study, an ex vivo bioreactor model of AAA will be developed. Producing
a model in a bioreactor will allow greater control of the dynamic environment
than using an in vivo model. From this, the relationship between various
haemodynamic factors and the progression of aneurysm or response of SMCs
may be quantified.
The arterial wall is subject to three separate fluid-induced forces: internal
pressure exerted by hydrostatic forces, internal wall stresses and wall shear
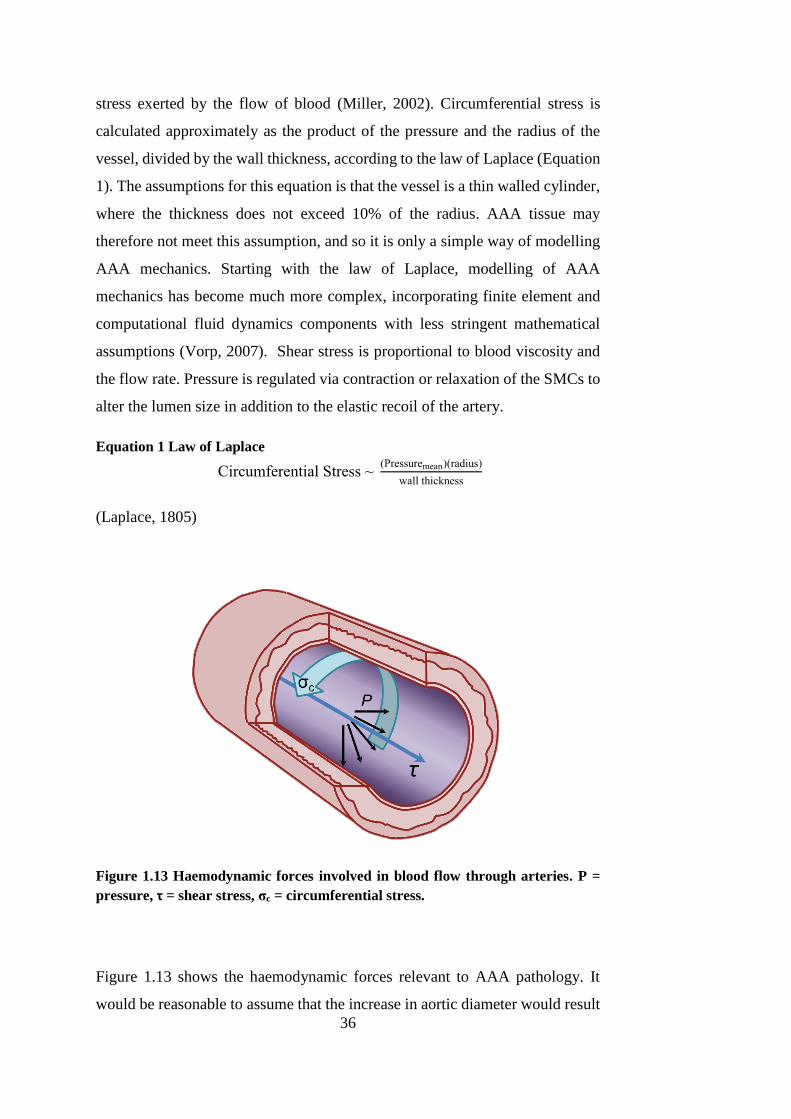
36
stress exerted by the flow of blood (Miller, 2002). Circumferential stress is
calculated approximately as the product of the pressure and the radius of the
vessel, divided by the wall thickness, according to the law of Laplace (Equation
1). The assumptions for this equation is that the vessel is a thin walled cylinder,
where the thickness does not exceed 10% of the radius. AAA tissue may
therefore not meet this assumption, and so it is only a simple way of modelling
AAA mechanics. Starting with the law of Laplace, modelling of AAA
mechanics has become much more complex, incorporating finite element and
computational fluid dynamics components with less stringent mathematical
assumptions (Vorp, 2007). Shear stress is proportional to blood viscosity and
the flow rate. Pressure is regulated via contraction or relaxation of the SMCs to
alter the lumen size in addition to the elastic recoil of the artery.
Equation 1 Law of Laplace
Circumferential Stress ~ (Pressuremean)(radius)
wall thickness
(Laplace, 1805)
Figure 1.13 Haemodynamic forces involved in blood flow through arteries. P =
pressure, τ = shear stress, σc = circumferential stress.
Figure 1.13 shows the haemodynamic forces relevant to AAA pathology. It
would be reasonable to assume that the increase in aortic diameter would result
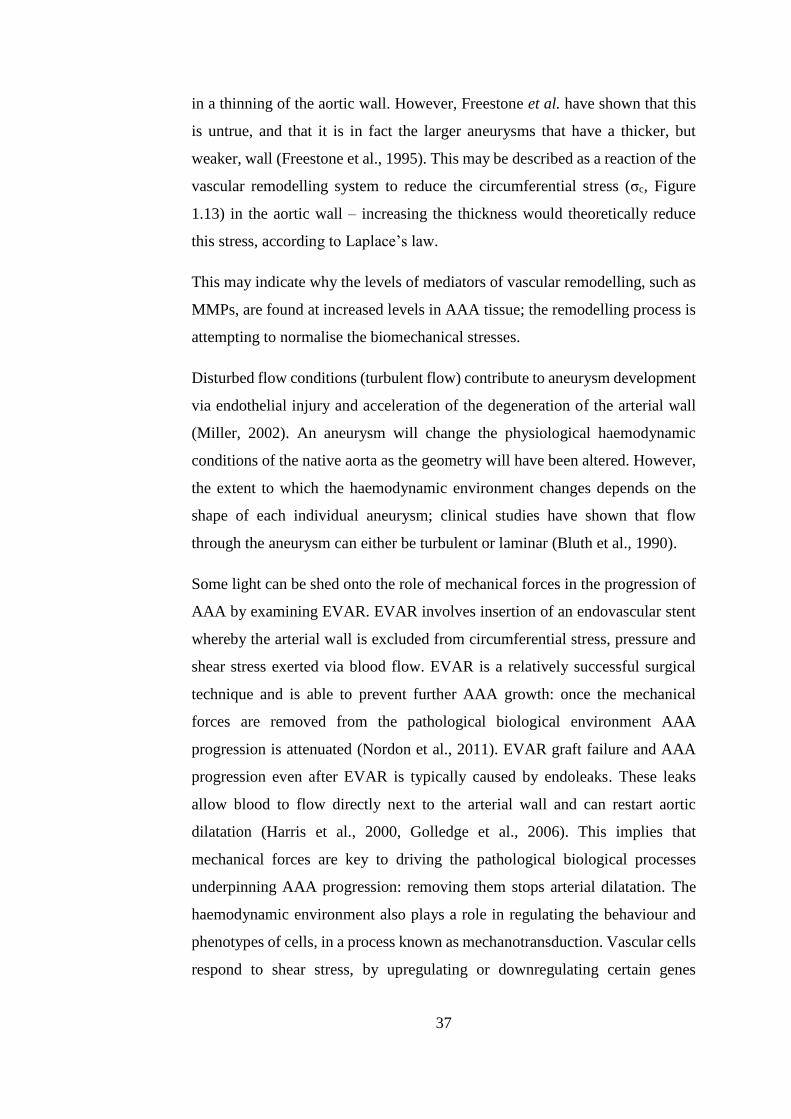
37
in a thinning of the aortic wall. However, Freestone et al. have shown that this
is untrue, and that it is in fact the larger aneurysms that have a thicker, but
weaker, wall (Freestone et al., 1995). This may be described as a reaction of the
vascular remodelling system to reduce the circumferential stress (σc, Figure
1.13) in the aortic wall – increasing the thickness would theoretically reduce
this stress, according to Laplace’s law.
This may indicate why the levels of mediators of vascular remodelling, such as
MMPs, are found at increased levels in AAA tissue; the remodelling process is
attempting to normalise the biomechanical stresses.
Disturbed flow conditions (turbulent flow) contribute to aneurysm development
via endothelial injury and acceleration of the degeneration of the arterial wall
(Miller, 2002). An aneurysm will change the physiological haemodynamic
conditions of the native aorta as the geometry will have been altered. However,
the extent to which the haemodynamic environment changes depends on the
shape of each individual aneurysm; clinical studies have shown that flow
through the aneurysm can either be turbulent or laminar (Bluth et al., 1990).
Some light can be shed onto the role of mechanical forces in the progression of
AAA by examining EVAR. EVAR involves insertion of an endovascular stent
whereby the arterial wall is excluded from circumferential stress, pressure and
shear stress exerted via blood flow. EVAR is a relatively successful surgical
technique and is able to prevent further AAA growth: once the mechanical
forces are removed from the pathological biological environment AAA
progression is attenuated (Nordon et al., 2011). EVAR graft failure and AAA
progression even after EVAR is typically caused by endoleaks. These leaks
allow blood to flow directly next to the arterial wall and can restart aortic
dilatation (Harris et al., 2000, Golledge et al., 2006). This implies that
mechanical forces are key to driving the pathological biological processes
underpinning AAA progression: removing them stops arterial dilatation. The
haemodynamic environment also plays a role in regulating the behaviour and
phenotypes of cells, in a process known as mechanotransduction. Vascular cells
respond to shear stress, by upregulating or downregulating certain genes
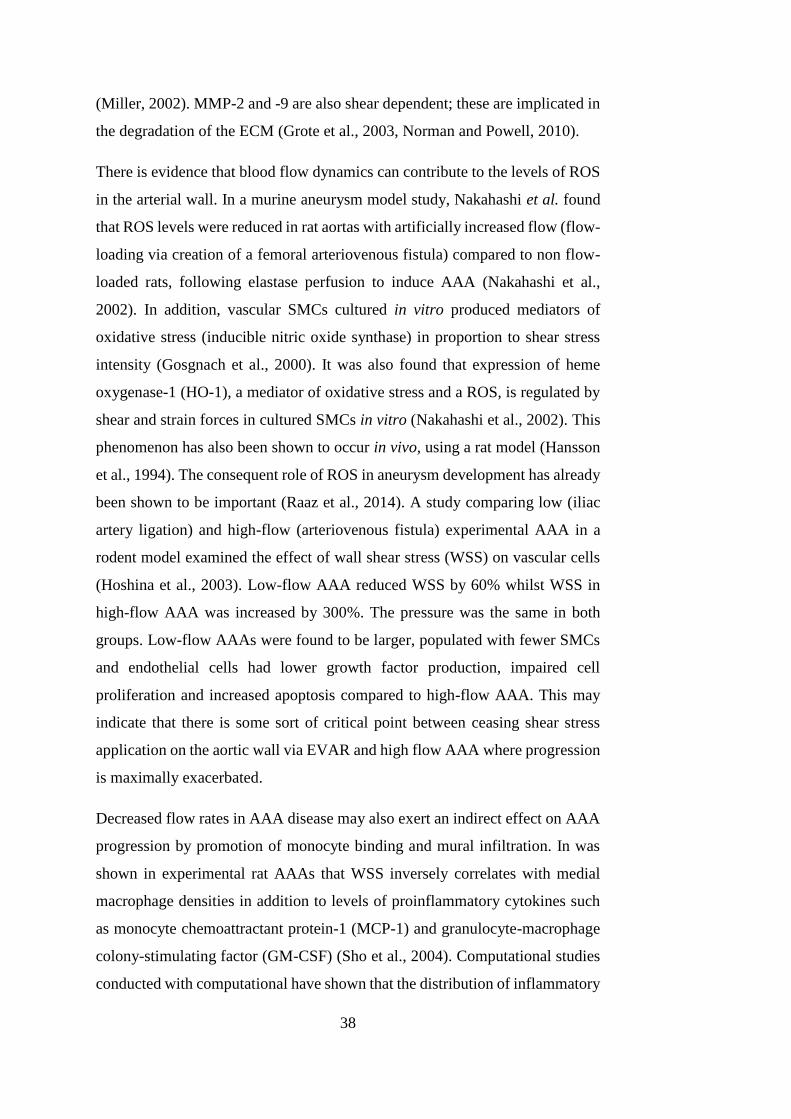
38
(Miller, 2002). MMP-2 and -9 are also shear dependent; these are implicated in
the degradation of the ECM (Grote et al., 2003, Norman and Powell, 2010).
There is evidence that blood flow dynamics can contribute to the levels of ROS
in the arterial wall. In a murine aneurysm model study, Nakahashi et al. found
that ROS levels were reduced in rat aortas with artificially increased flow (flow-
loading via creation of a femoral arteriovenous fistula) compared to non flow-
loaded rats, following elastase perfusion to induce AAA (Nakahashi et al.,
2002). In addition, vascular SMCs cultured in vitro produced mediators of
oxidative stress (inducible nitric oxide synthase) in proportion to shear stress
intensity (Gosgnach et al., 2000). It was also found that expression of heme
oxygenase-1 (HO-1), a mediator of oxidative stress and a ROS, is regulated by
shear and strain forces in cultured SMCs in vitro (Nakahashi et al., 2002). This
phenomenon has also been shown to occur in vivo, using a rat model (Hansson
et al., 1994). The consequent role of ROS in aneurysm development has already
been shown to be important (Raaz et al., 2014). A study comparing low (iliac
artery ligation) and high-flow (arteriovenous fistula) experimental AAA in a
rodent model examined the effect of wall shear stress (WSS) on vascular cells
(Hoshina et al., 2003). Low-flow AAA reduced WSS by 60% whilst WSS in
high-flow AAA was increased by 300%. The pressure was the same in both
groups. Low-flow AAAs were found to be larger, populated with fewer SMCs
and endothelial cells had lower growth factor production, impaired cell
proliferation and increased apoptosis compared to high-flow AAA. This may
indicate that there is some sort of critical point between ceasing shear stress
application on the aortic wall via EVAR and high flow AAA where progression
is maximally exacerbated.
Decreased flow rates in AAA disease may also exert an indirect effect on AAA
progression by promotion of monocyte binding and mural infiltration. In was
shown in experimental rat AAAs that WSS inversely correlates with medial
macrophage densities in addition to levels of proinflammatory cytokines such
as monocyte chemoattractant protein-1 (MCP-1) and granulocyte-macrophage
colony-stimulating factor (GM-CSF) (Sho et al., 2004). Computational studies
conducted with computational have shown that the distribution of inflammatory
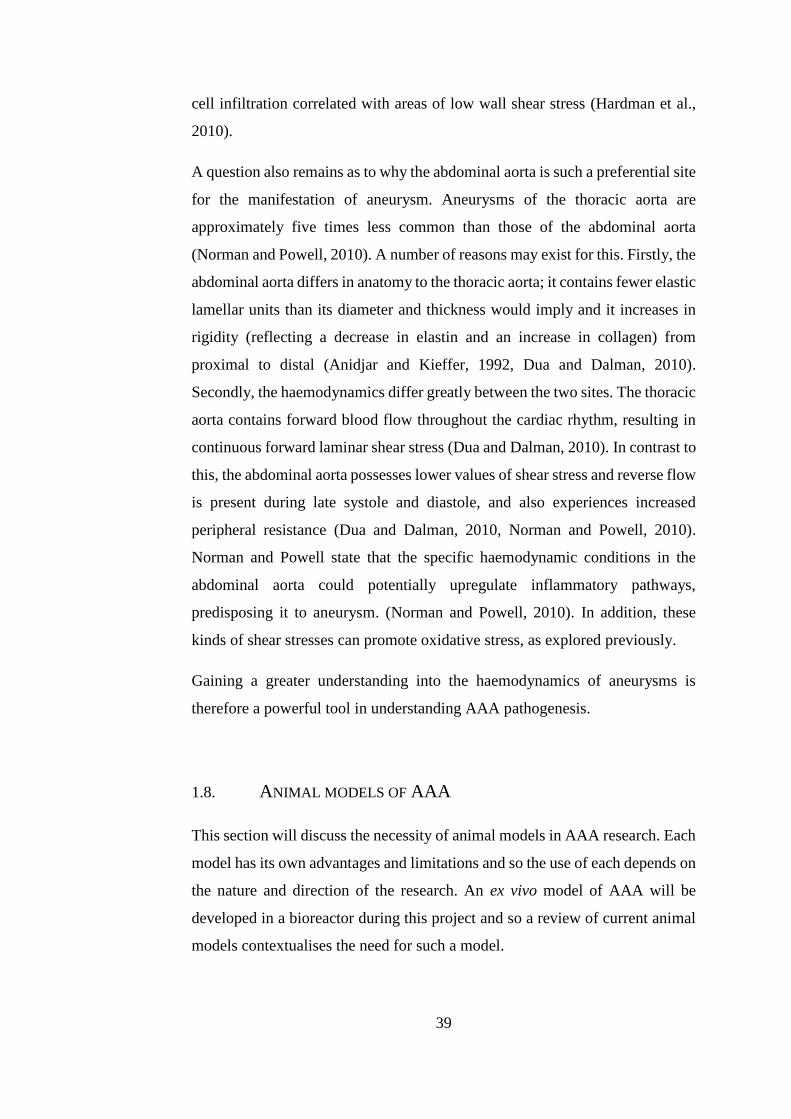
39
cell infiltration correlated with areas of low wall shear stress (Hardman et al.,
2010).
A question also remains as to why the abdominal aorta is such a preferential site
for the manifestation of aneurysm. Aneurysms of the thoracic aorta are
approximately five times less common than those of the abdominal aorta
(Norman and Powell, 2010). A number of reasons may exist for this. Firstly, the
abdominal aorta differs in anatomy to the thoracic aorta; it contains fewer elastic
lamellar units than its diameter and thickness would imply and it increases in
rigidity (reflecting a decrease in elastin and an increase in collagen) from
proximal to distal (Anidjar and Kieffer, 1992, Dua and Dalman, 2010).
Secondly, the haemodynamics differ greatly between the two sites. The thoracic
aorta contains forward blood flow throughout the cardiac rhythm, resulting in
continuous forward laminar shear stress (Dua and Dalman, 2010). In contrast to
this, the abdominal aorta possesses lower values of shear stress and reverse flow
is present during late systole and diastole, and also experiences increased
peripheral resistance (Dua and Dalman, 2010, Norman and Powell, 2010).
Norman and Powell state that the specific haemodynamic conditions in the
abdominal aorta could potentially upregulate inflammatory pathways,
predisposing it to aneurysm. (Norman and Powell, 2010). In addition, these
kinds of shear stresses can promote oxidative stress, as explored previously.
Gaining a greater understanding into the haemodynamics of aneurysms is
therefore a powerful tool in understanding AAA pathogenesis.
1.8. ANIMAL MODELS OF AAA
This section will discuss the necessity of animal models in AAA research. Each
model has its own advantages and limitations and so the use of each depends on
the nature and direction of the research. An ex vivo model of AAA will be
developed in a bioreactor during this project and so a review of current animal
models contextualises the need for such a model.
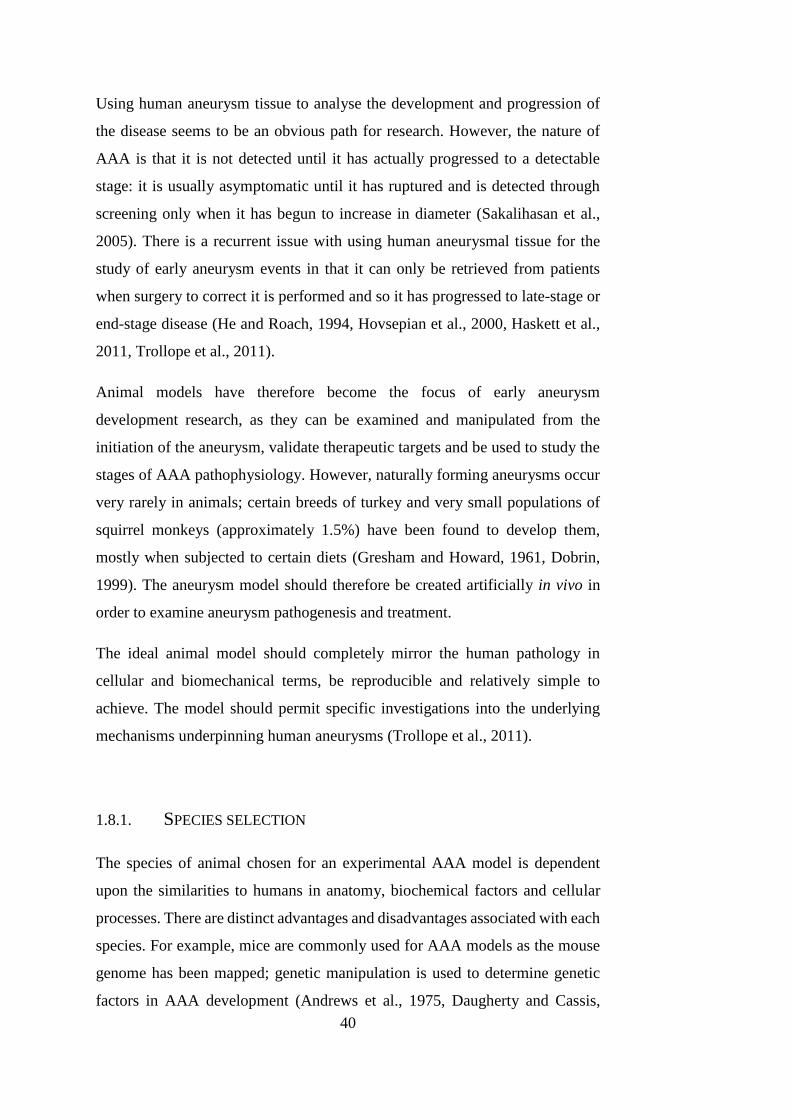
40
Using human aneurysm tissue to analyse the development and progression of
the disease seems to be an obvious path for research. However, the nature of
AAA is that it is not detected until it has actually progressed to a detectable
stage: it is usually asymptomatic until it has ruptured and is detected through
screening only when it has begun to increase in diameter (Sakalihasan et al.,
2005). There is a recurrent issue with using human aneurysmal tissue for the
study of early aneurysm events in that it can only be retrieved from patients
when surgery to correct it is performed and so it has progressed to late-stage or
end-stage disease (He and Roach, 1994, Hovsepian et al., 2000, Haskett et al.,
2011, Trollope et al., 2011).
Animal models have therefore become the focus of early aneurysm
development research, as they can be examined and manipulated from the
initiation of the aneurysm, validate therapeutic targets and be used to study the
stages of AAA pathophysiology. However, naturally forming aneurysms occur
very rarely in animals; certain breeds of turkey and very small populations of
squirrel monkeys (approximately 1.5%) have been found to develop them,
mostly when subjected to certain diets (Gresham and Howard, 1961, Dobrin,
1999). The aneurysm model should therefore be created artificially in vivo in
order to examine aneurysm pathogenesis and treatment.
The ideal animal model should completely mirror the human pathology in
cellular and biomechanical terms, be reproducible and relatively simple to
achieve. The model should permit specific investigations into the underlying
mechanisms underpinning human aneurysms (Trollope et al., 2011).
1.8.1. SPECIES SELECTION
The species of animal chosen for an experimental AAA model is dependent
upon the similarities to humans in anatomy, biochemical factors and cellular
processes. There are distinct advantages and disadvantages associated with each
species. For example, mice are commonly used for AAA models as the mouse
genome has been mapped; genetic manipulation is used to determine genetic
factors in AAA development (Andrews et al., 1975, Daugherty and Cassis,

41
2004). In addition to this, mice have good practical advantages – they are
relatively simple to handle in large numbers at modest cost. Consequently,
murine models are the most widely used at present (Zaragoza et al., 2011). Rat
models are also used, as they are larger and therefore the surgery is less complex
(Anidjar et al., 1990). Small mammals are, however, limited due to their
miniature size especially when considering arterial biomechanics.
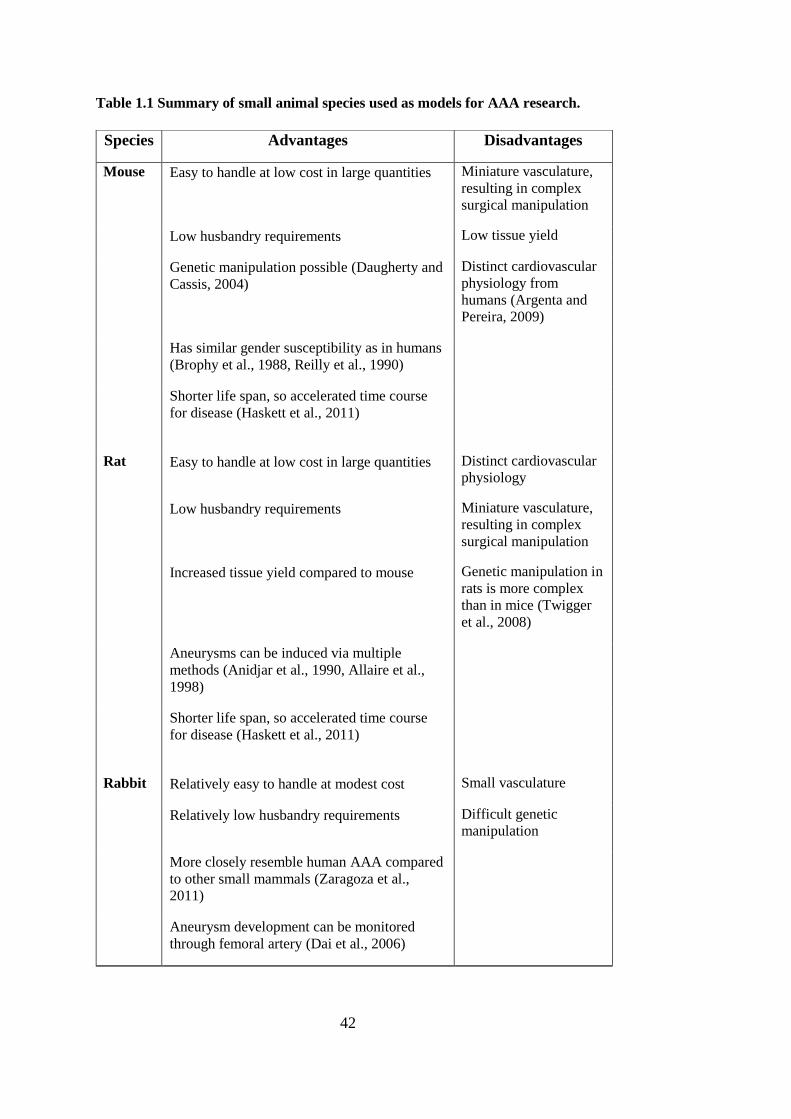
42
Table 1.1 Summary of small animal species used as models for AAA research.
Species Advantages Disadvantages
Mouse Easy to handle at low cost in large quantities Miniature vasculature,
resulting in complex
surgical manipulation
Low husbandry requirements Low tissue yield
Genetic manipulation possible (Daugherty and
Cassis, 2004)
Distinct cardiovascular
physiology from
humans (Argenta and
Pereira, 2009)
Has similar gender susceptibility as in humans
(Brophy et al., 1988, Reilly et al., 1990)
Shorter life span, so accelerated time course
for disease (Haskett et al., 2011)
Rat Easy to handle at low cost in large quantities Distinct cardiovascular
physiology
Low husbandry requirements Miniature vasculature,
resulting in complex
surgical manipulation
Increased tissue yield compared to mouse Genetic manipulation in
rats is more complex
than in mice (Twigger
et al., 2008)
Aneurysms can be induced via multiple
methods (Anidjar et al., 1990, Allaire et al.,
1998)
Shorter life span, so accelerated time course
for disease (Haskett et al., 2011)
Rabbit Relatively easy to handle at modest cost Small vasculature
Relatively low husbandry requirements Difficult genetic
manipulation
More closely resemble human AAA compared
to other small mammals (Zaragoza et al.,
2011)
Aneurysm development can be monitored
through femoral artery (Dai et al., 2006)
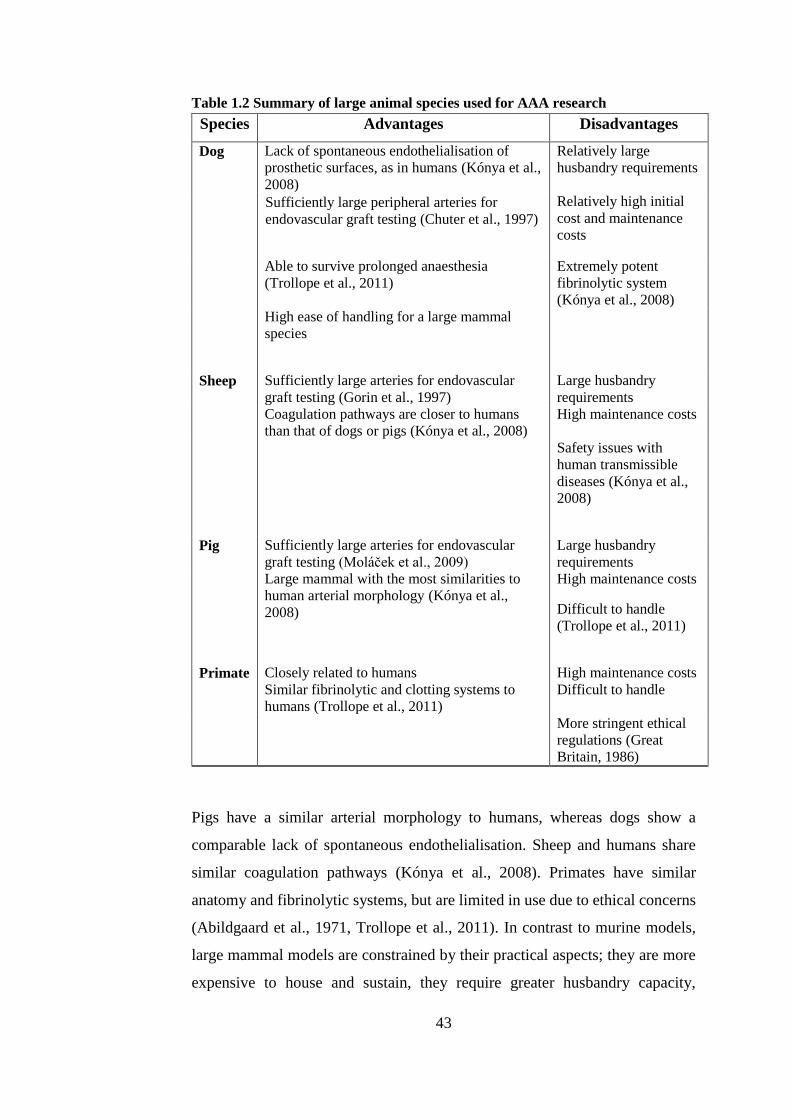
43
Table 1.2 Summary of large animal species used for AAA research
Species Advantages Disadvantages
Dog Lack of spontaneous endothelialisation of
prosthetic surfaces, as in humans (Kónya et al.,
2008)
Relatively large
husbandry requirements
Sufficiently large peripheral arteries for
endovascular graft testing (Chuter et al., 1997)
Relatively high initial
cost and maintenance
costs
Able to survive prolonged anaesthesia
(Trollope et al., 2011)
Extremely potent
fibrinolytic system
(Kónya et al., 2008)
High ease of handling for a large mammal
species
Sheep Sufficiently large arteries for endovascular
graft testing (Gorin et al., 1997)
Large husbandry
requirements
Coagulation pathways are closer to humans
than that of dogs or pigs (Kónya et al., 2008)
High maintenance costs
Safety issues with
human transmissible
diseases (Kónya et al.,
2008)
Pig Sufficiently large arteries for endovascular
graft testing (Moláček et al., 2009)
Large husbandry
requirements
Large mammal with the most similarities to
human arterial morphology (Kónya et al.,
2008)
High maintenance costs
Difficult to handle
(Trollope et al., 2011)
Primate Closely related to humans High maintenance costs
Similar fibrinolytic and clotting systems to
humans (Trollope et al., 2011)
Difficult to handle
More stringent ethical
regulations (Great
Britain, 1986)
Pigs have a similar arterial morphology to humans, whereas dogs show a
comparable lack of spontaneous endothelialisation. Sheep and humans share
similar coagulation pathways (Kónya et al., 2008). Primates have similar
anatomy and fibrinolytic systems, but are limited in use due to ethical concerns
(Abildgaard et al., 1971, Trollope et al., 2011). In contrast to murine models,
large mammal models are constrained by their practical aspects; they are more
expensive to house and sustain, they require greater husbandry capacity,
44
increased doses of anaesthetic and have more stringent ethical considerations
(Yazdani and Berry, 2009).
As is demonstrated by Table 1.1 and Table 1.2, it is clear that the choice of
animal for in vivo models is often a trade-off between arterial geometry and
morphology, physiological comparisons with humans, ease of genetic
manipulation, availability, and cost. Murine and other small mammal models
are extremely useful when investigating the cellular and genetic processes
which contribute to aneurysm development. The pre-clinical testing of
endovascular stents is, however, virtually impossible in all but large mammals
due to the discrepancy in size and arterial haemodynamics compared to humans.
This type of pre-clinical testing is essential in the development and assessment
of novel devices and technologies, but is heavily limited by the high costs and
time-consuming protocols associated with research on larger animals, making
temporal studies routinely prohibitive. The result is that a high number of new
devices are available for testing, but only a limited number of animals can be
obtained (Touroo and Williams, 2012).
Disease models each have a set of advantages and limitations and so the model
must be chosen carefully considering the nature of the investigation. In vivo
models are able to directly inform about the underpinning mechanisms and
processes of the disease as it exists physiologically. However, compounding
systemic effects are present and, especially where human tissues are used, safety
and ethical consideration must be upheld. The premise of ex vivo models is that
the tissue is removed from an organism to an external environment whilst
attempting to minimally alter the natural conditions. Ex vivo models allow more
stringent experimental control, may remove compounding factors and safety
and wellbeing of the organism is less of a concern. These apparent advantages
are also inextricably linked with the decreased model similarity to the
physiological condition (Denayer et al., 2014).
This study aims to develop and use an ex vivo bioreactor model of AAA in
porcine arteries which would not be subject to the same costs and logistical
complexities associated with in vivo large animal models.
45
1.8.2. METHODS OF EXPERIMENTAL AAA CREATION
A wide variety of techniques have been developed in order to create animal
models of AAA encompassing physical, chemical and genetic manipulations
each with their own considerations and limitations.
1.8.2.1. SPONTANEOUS MUTATION
The earliest AAA models included certain strains of species that demonstrated
a higher level of spontaneous aneurysm formation and rupture than others of
their kind, such as the broad-breasted bronze turkey and the Blotchy mouse
strain. These animals develop aortic disruptions that often lead to aortic rupture
associated with genetic defects in connective tissue structure (Gresham and
Howard, 1961, Neumann and Ungar, 1973, Brophy et al., 1988). Both animals
also demonstrate a gender bias in aortic rupture similar to that in humans:
increased in males in comparison to females (Daugherty and Cassis, 2004,
Trollope et al., 2011).
However, the pathologic features of the diseases in these animals bear greater
resemblance to aortic dissection as opposed to aneurysm (Thompson et al.,
2002). As the animals possess a generalized disorder in their connective tissues,
compounding factors such as aneurysms in other parts of the vasculature and
emphysema have limited the usefulness of this type of model (Daugherty and
Cassis, 2004). Furthermore, the advent of alternative models which are more
representative of human AAA disease have led to the decrease in use of the
spontaneous formation model.
1.8.2.2. GENETIC MANIPULATION
As with the spontaneous formation model, animals are ‘bred’ to develop aortic
aneurysms that are analogous to the human disease. However, advances in
genomic understanding and techniques have progressed so that specific genes
can be omitted in order to understand their role in the pathogenesis of disease.
46
Knockout mice have recently become extremely useful models when
investigating vascular disease aetiology. This term refers to the targeted
disruption of one or more specific alleles for which the role of that gene in AAA
disease can be determined. As discussed in the previous section, this type of
model is currently only possible with small animals where the genome has been
sufficiently mapped for genetic manipulation: mice and, more recently, rats.
Mice lacking the apolipoprotein E (ApoE) gene or low-density lipoprotein
receptor (hyperlipidemic mice) form aortic aneurysms when subjected to a
cholesterol-rich diet for prolonged periods of time (Tangirala et al., 1995). The
purpose of that study was to induce atherosclerotic lesions but aneurysm
formation was frequently noted in advanced lesions. The links between
atherosclerosis and aneurysm formation in humans have already been
previously discussed earlier in section 1.5.
Subcutaneous angiotensin-II (part of the renin-angiotensin system that regulates
vasoconstriction) infusion into hyperlipidemic mice has also shown to induce
aortic aneurysms in mice. This model has several parallels to human AAA
disease; there is preponderance for aneurysm development in males, luminal
dilation, medial degeneration, thrombus formation, inflammatory influx,
consistent localization and cytokine upregulation similar to that observed in
humans (Manning et al., 2002). Although generally reproducible, some
hyperlipidemic mice infused with angiotensin-II appeared to be resistant to
aneurysm formation and displayed aortic diameters indistinguishable from
control mice. In addition, the aneurysms are consistently localized at the
suprarenal aorta in mice contrasting with aneurysms commonly found in the
infrarenal aorta in humans. It is postulated that this may be due to one or all of
the following factors: inherent differences in cell properties at this level, the
ratio of collagen to elastin or the density and subtype expression of the
angiotensin-II receptor in this region (Manning et al., 2002). Dilation of the
lumen and degradation of the ECM analogous to human AAA can be observed.
This model has been used to generate relevant pharmacological and mechanistic
data for the human AAA, and so has proved useful for determining genetic
factors implicated in AAA formation and progression (Trollope et al., 2011).
47
The role of MMPs in aneurysm development can also be investigated using
genetically modified animal models. One group produced AAAs in mice with a
combined apolipoprotein E and TIMP-1 (tissue inhibitor of MMP-1) deficiency
(Silence et al., 2002). Aneurysms were more common in mice with combined
deficiency than those with apolipoprotein deficiency only (23±5.1 vs. 11±3.0
aneurysms per 100 sections analysed, p<0.001). Atherosclerotic lesions were
significantly larger in apolipoprotein deficiency only compared to combined
deficiency (p<0.001). As with human AAAs, a paucity of SMCs was observed
and the role of MMPs has been implicated in AAA progression. This strain may
therefore be extremely useful when conducting AAA-specific studies.
The roles of MMP-9 and MMP-12 in AAA development have been confirmed
by studies in genetically modified animals. Mice deficient in MMP-9, either
alone or in combination with MMP-12 deficiency exhibited significant
reduction in aortic dilatation (Pyo et al., 2000). MMP-12 deficiency in isolation
did not show a significant difference from wild-type mice. The study used a
genetically modified animal model to give information about the requirements
for aneurysms to form. Genetically modified mouse studies have implicated the
COX-2 gene in AAA development. AAA incidence in wild-type mice was 54%
(n=24) whereas no aneurysms were detected in COX-2 deficient mice (Gitlin et
al., 2007). Inhibition of COX-2 with celecoxib has since been shown to reduce
AAA incidence by 61% and AAA severity in mice subjected to angiotensin
treatment, in addition to attenuation of late-stage AAA progression (Ghoshal
and Loftin, 2012). This shows that COX-2 inhibition may have therapeutic
potential in the future.
This type of model is extremely useful in determining molecular events
involved in aneurysm formation and can aid focus in developing therapeutic
targets, but can only be used in animals where the genome has been mapped:
namely mice and rats.
48
1.8.2.3. PHYSICAL MODELS
Genetic manipulation is not currently feasible in large mammals, but models are
needed that are more biomechanically relevant to humans as well as being
sufficiently large to test surgical treatment devices.
It is possible to induce AAA by surgically weakening a portion of the aortic
wall in large mammals via crushing or blunt force trauma (Zatina et al., 1984,
Schmoker et al., 2008). Even lasers have been employed to physically injure the
wall of a rat common carotid artery, resulting in development of focal
aneurysms at the injured site (Ammirati et al., 1988). These methods are not
widely used due to extremely variable size, growth rate and rupture risk as well
as a tendency to produce saccular aneurysms or pseudoaneurysms which are not
relevant to human AAA (Tsui, 2010).
A widely used method of experimental aneurysm creation is the arterial patch
method; this is an especially common aneurysm creation method in large
mammals for the testing and development of endovascular stents (Haskett et al.,
2011). The premise of the arterial patch method is that an incision in the arterial
wall is repaired using a structurally weaker material. A schematic of the surgical
construction of the AAA is shown in Figure 1.14.
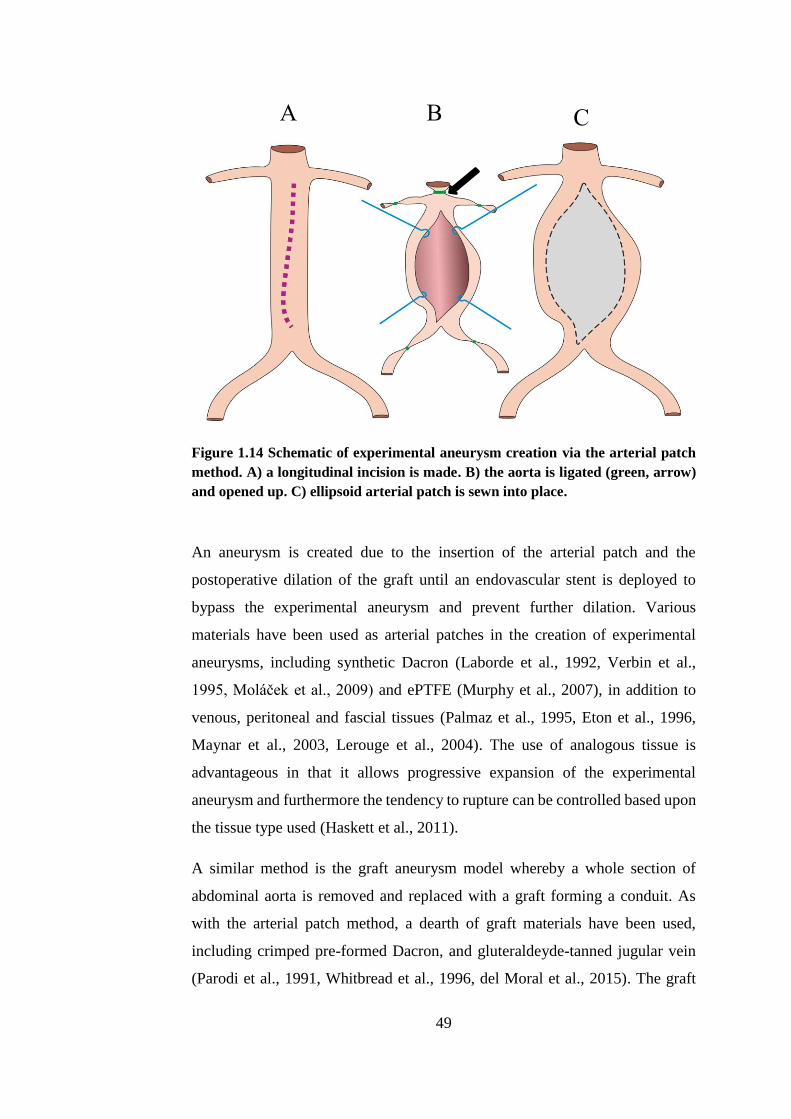
49
Figure 1.14 Schematic of experimental aneurysm creation via the arterial patch
method. A) a longitudinal incision is made. B) the aorta is ligated (green, arrow)
and opened up. C) ellipsoid arterial patch is sewn into place.
An aneurysm is created due to the insertion of the arterial patch and the
postoperative dilation of the graft until an endovascular stent is deployed to
bypass the experimental aneurysm and prevent further dilation. Various
materials have been used as arterial patches in the creation of experimental
aneurysms, including synthetic Dacron (Laborde et al., 1992, Verbin et al.,
1995, Moláček et al., 2009) and ePTFE (Murphy et al., 2007), in addition to
venous, peritoneal and fascial tissues (Palmaz et al., 1995, Eton et al., 1996,
Maynar et al., 2003, Lerouge et al., 2004). The use of analogous tissue is
advantageous in that it allows progressive expansion of the experimental
aneurysm and furthermore the tendency to rupture can be controlled based upon
the tissue type used (Haskett et al., 2011).
A similar method is the graft aneurysm model whereby a whole section of
abdominal aorta is removed and replaced with a graft forming a conduit. As
with the arterial patch method, a dearth of graft materials have been used,
including crimped pre-formed Dacron, and gluteraldeyde-tanned jugular vein
(Parodi et al., 1991, Whitbread et al., 1996, del Moral et al., 2015). The graft
A B C
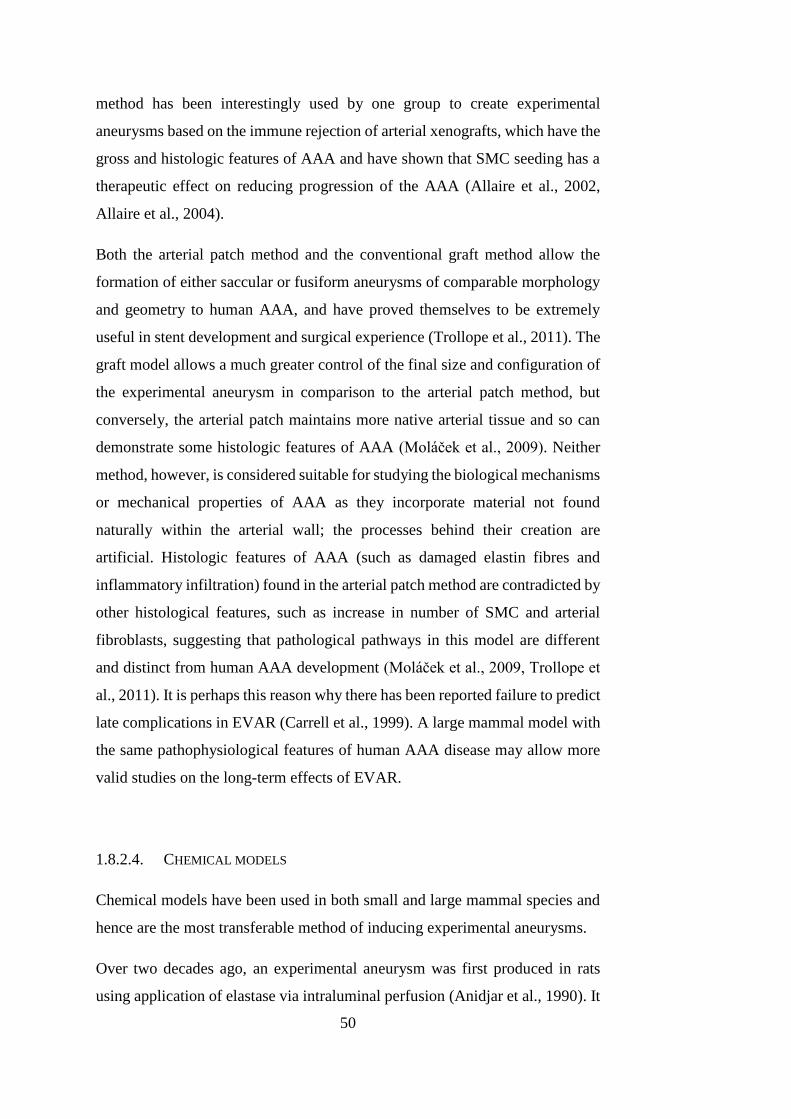
50
method has been interestingly used by one group to create experimental
aneurysms based on the immune rejection of arterial xenografts, which have the
gross and histologic features of AAA and have shown that SMC seeding has a
therapeutic effect on reducing progression of the AAA (Allaire et al., 2002,
Allaire et al., 2004).
Both the arterial patch method and the conventional graft method allow the
formation of either saccular or fusiform aneurysms of comparable morphology
and geometry to human AAA, and have proved themselves to be extremely
useful in stent development and surgical experience (Trollope et al., 2011). The
graft model allows a much greater control of the final size and configuration of
the experimental aneurysm in comparison to the arterial patch method, but
conversely, the arterial patch maintains more native arterial tissue and so can
demonstrate some histologic features of AAA (Moláček et al., 2009). Neither
method, however, is considered suitable for studying the biological mechanisms
or mechanical properties of AAA as they incorporate material not found
naturally within the arterial wall; the processes behind their creation are
artificial. Histologic features of AAA (such as damaged elastin fibres and
inflammatory infiltration) found in the arterial patch method are contradicted by
other histological features, such as increase in number of SMC and arterial
fibroblasts, suggesting that pathological pathways in this model are different
and distinct from human AAA development (Moláček et al., 2009, Trollope et
al., 2011). It is perhaps this reason why there has been reported failure to predict
late complications in EVAR (Carrell et al., 1999). A large mammal model with
the same pathophysiological features of human AAA disease may allow more
valid studies on the long-term effects of EVAR.
1.8.2.4. CHEMICAL MODELS
Chemical models have been used in both small and large mammal species and
hence are the most transferable method of inducing experimental aneurysms.
Over two decades ago, an experimental aneurysm was first produced in rats
using application of elastase via intraluminal perfusion (Anidjar et al., 1990). It
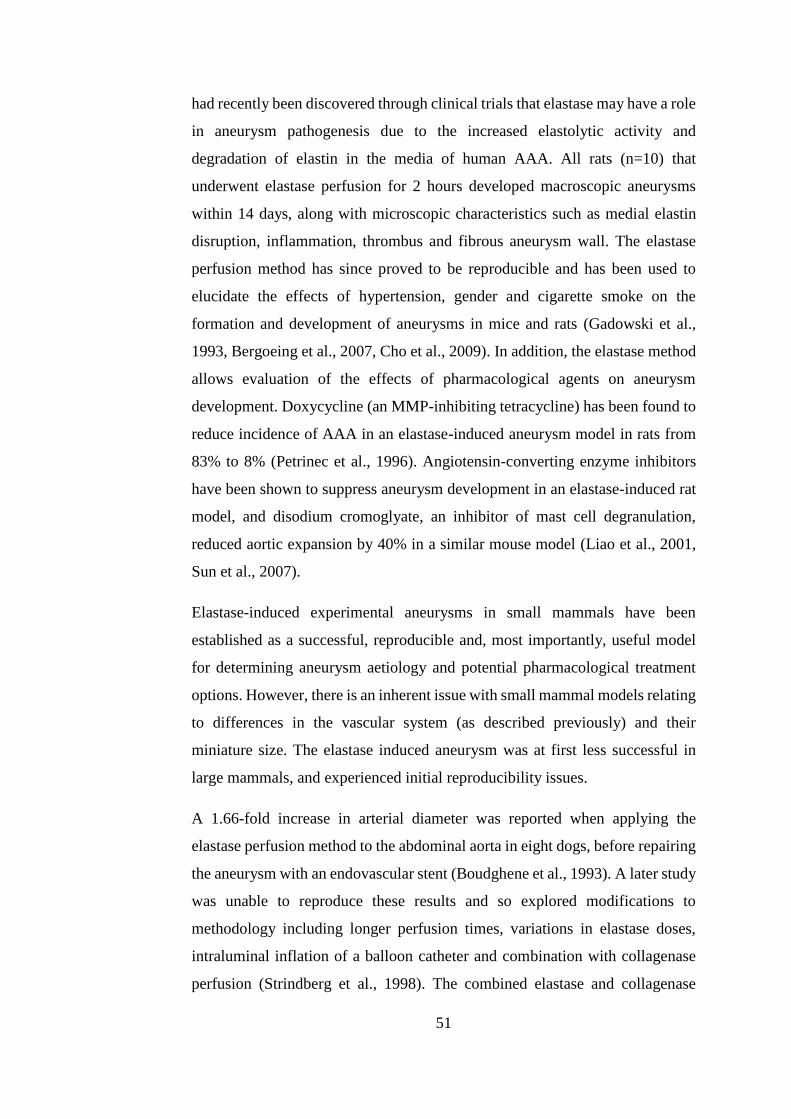
51
had recently been discovered through clinical trials that elastase may have a role
in aneurysm pathogenesis due to the increased elastolytic activity and
degradation of elastin in the media of human AAA. All rats (n=10) that
underwent elastase perfusion for 2 hours developed macroscopic aneurysms
within 14 days, along with microscopic characteristics such as medial elastin
disruption, inflammation, thrombus and fibrous aneurysm wall. The elastase
perfusion method has since proved to be reproducible and has been used to
elucidate the effects of hypertension, gender and cigarette smoke on the
formation and development of aneurysms in mice and rats (Gadowski et al.,
1993, Bergoeing et al., 2007, Cho et al., 2009). In addition, the elastase method
allows evaluation of the effects of pharmacological agents on aneurysm
development. Doxycycline (an MMP-inhibiting tetracycline) has been found to
reduce incidence of AAA in an elastase-induced aneurysm model in rats from
83% to 8% (Petrinec et al., 1996). Angiotensin-converting enzyme inhibitors
have been shown to suppress aneurysm development in an elastase-induced rat
model, and disodium cromoglyate, an inhibitor of mast cell degranulation,
reduced aortic expansion by 40% in a similar mouse model (Liao et al., 2001,
Sun et al., 2007).
Elastase-induced experimental aneurysms in small mammals have been
established as a successful, reproducible and, most importantly, useful model
for determining aneurysm aetiology and potential pharmacological treatment
options. However, there is an inherent issue with small mammal models relating
to differences in the vascular system (as described previously) and their
miniature size. The elastase induced aneurysm was at first less successful in
large mammals, and experienced initial reproducibility issues.
A 1.66-fold increase in arterial diameter was reported when applying the
elastase perfusion method to the abdominal aorta in eight dogs, before repairing
the aneurysm with an endovascular stent (Boudghene et al., 1993). A later study
was unable to reproduce these results and so explored modifications to
methodology including longer perfusion times, variations in elastase doses,
intraluminal inflation of a balloon catheter and combination with collagenase
perfusion (Strindberg et al., 1998). The combined elastase and collagenase
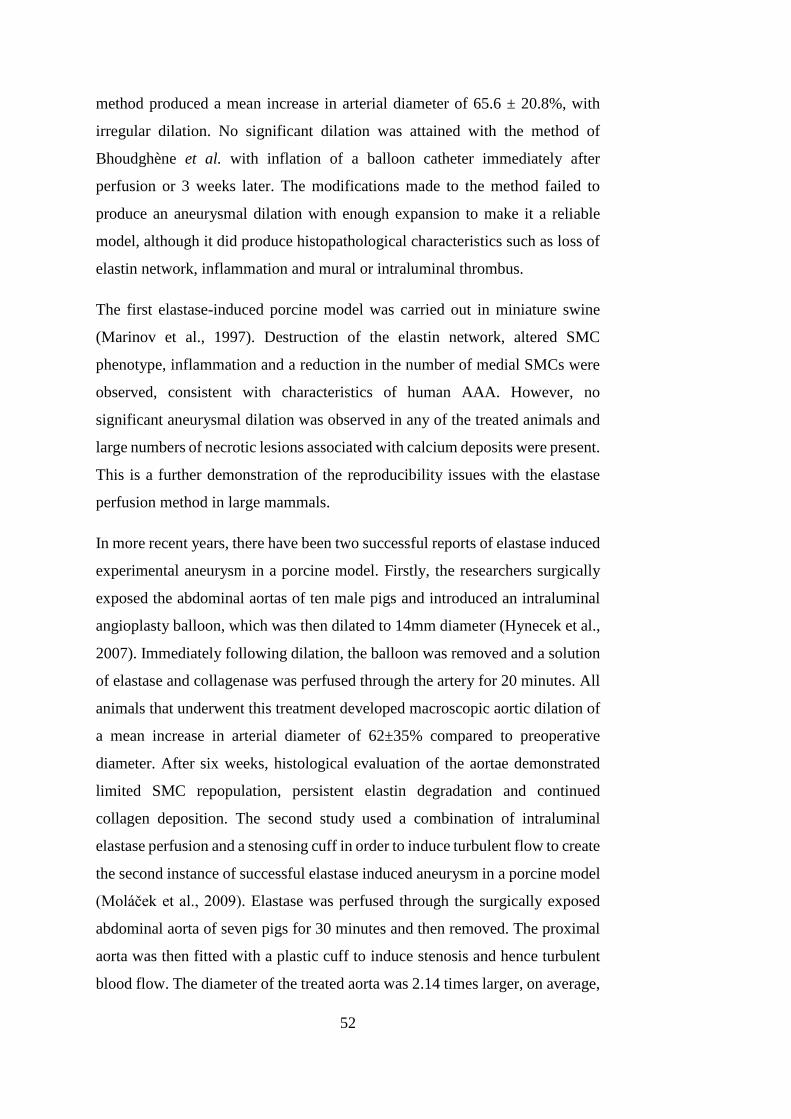
52
method produced a mean increase in arterial diameter of 65.6 ± 20.8%, with
irregular dilation. No significant dilation was attained with the method of
Bhoudghène et al. with inflation of a balloon catheter immediately after
perfusion or 3 weeks later. The modifications made to the method failed to
produce an aneurysmal dilation with enough expansion to make it a reliable
model, although it did produce histopathological characteristics such as loss of
elastin network, inflammation and mural or intraluminal thrombus.
The first elastase-induced porcine model was carried out in miniature swine
(Marinov et al., 1997). Destruction of the elastin network, altered SMC
phenotype, inflammation and a reduction in the number of medial SMCs were
observed, consistent with characteristics of human AAA. However, no
significant aneurysmal dilation was observed in any of the treated animals and
large numbers of necrotic lesions associated with calcium deposits were present.
This is a further demonstration of the reproducibility issues with the elastase
perfusion method in large mammals.
In more recent years, there have been two successful reports of elastase induced
experimental aneurysm in a porcine model. Firstly, the researchers surgically
exposed the abdominal aortas of ten male pigs and introduced an intraluminal
angioplasty balloon, which was then dilated to 14mm diameter (Hynecek et al.,
2007). Immediately following dilation, the balloon was removed and a solution
of elastase and collagenase was perfused through the artery for 20 minutes. All
animals that underwent this treatment developed macroscopic aortic dilation of
a mean increase in arterial diameter of 62±35% compared to preoperative
diameter. After six weeks, histological evaluation of the aortae demonstrated
limited SMC repopulation, persistent elastin degradation and continued
collagen deposition. The second study used a combination of intraluminal
elastase perfusion and a stenosing cuff in order to induce turbulent flow to create
the second instance of successful elastase induced aneurysm in a porcine model
(Moláček et al., 2009). Elastase was perfused through the surgically exposed
abdominal aorta of seven pigs for 30 minutes and then removed. The proximal
aorta was then fitted with a plastic cuff to induce stenosis and hence turbulent
blood flow. The diameter of the treated aorta was 2.14 times larger, on average,
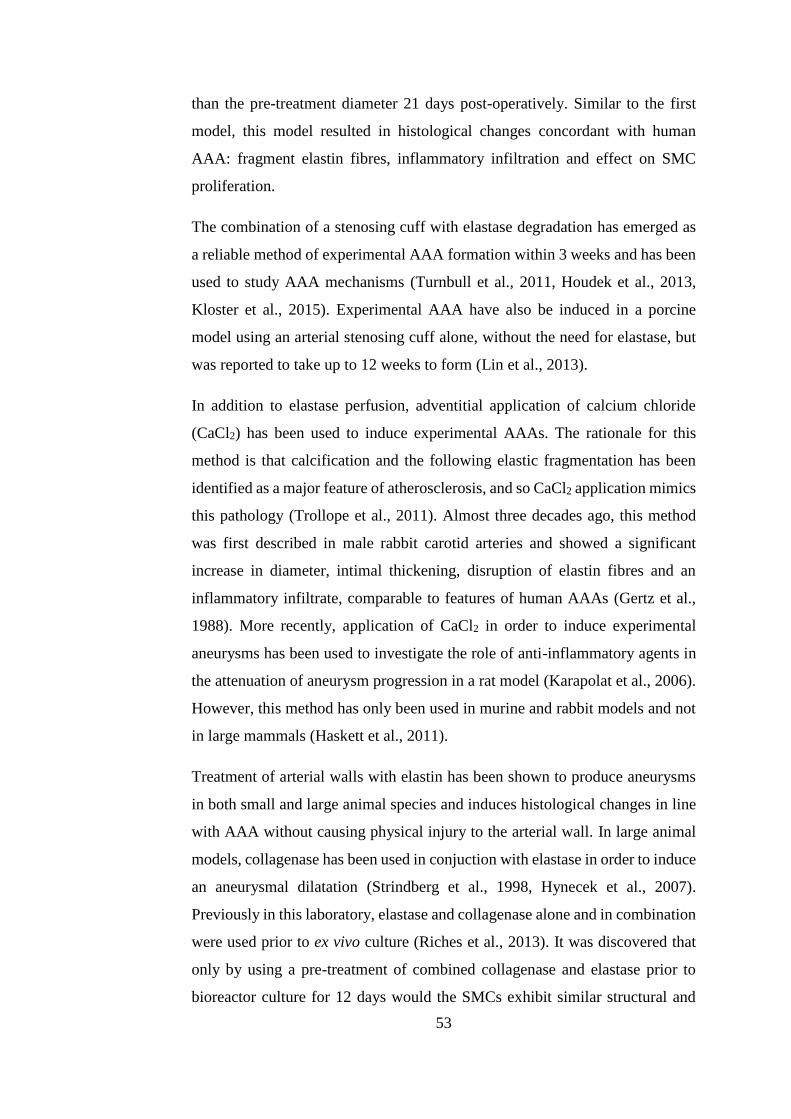
53
than the pre-treatment diameter 21 days post-operatively. Similar to the first
model, this model resulted in histological changes concordant with human
AAA: fragment elastin fibres, inflammatory infiltration and effect on SMC
proliferation.
The combination of a stenosing cuff with elastase degradation has emerged as
a reliable method of experimental AAA formation within 3 weeks and has been
used to study AAA mechanisms (Turnbull et al., 2011, Houdek et al., 2013,
Kloster et al., 2015). Experimental AAA have also be induced in a porcine
model using an arterial stenosing cuff alone, without the need for elastase, but
was reported to take up to 12 weeks to form (Lin et al., 2013).
In addition to elastase perfusion, adventitial application of calcium chloride
(CaCl2) has been used to induce experimental AAAs. The rationale for this
method is that calcification and the following elastic fragmentation has been
identified as a major feature of atherosclerosis, and so CaCl2 application mimics
this pathology (Trollope et al., 2011). Almost three decades ago, this method
was first described in male rabbit carotid arteries and showed a significant
increase in diameter, intimal thickening, disruption of elastin fibres and an
inflammatory infiltrate, comparable to features of human AAAs (Gertz et al.,
1988). More recently, application of CaCl2 in order to induce experimental
aneurysms has been used to investigate the role of anti-inflammatory agents in
the attenuation of aneurysm progression in a rat model (Karapolat et al., 2006).
However, this method has only been used in murine and rabbit models and not
in large mammals (Haskett et al., 2011).
Treatment of arterial walls with elastin has been shown to produce aneurysms
in both small and large animal species and induces histological changes in line
with AAA without causing physical injury to the arterial wall. In large animal
models, collagenase has been used in conjuction with elastase in order to induce
an aneurysmal dilatation (Strindberg et al., 1998, Hynecek et al., 2007).
Previously in this laboratory, elastase and collagenase alone and in combination
were used prior to ex vivo culture (Riches et al., 2013). It was discovered that
only by using a pre-treatment of combined collagenase and elastase prior to
bioreactor culture for 12 days would the SMCs exhibit similar structural and
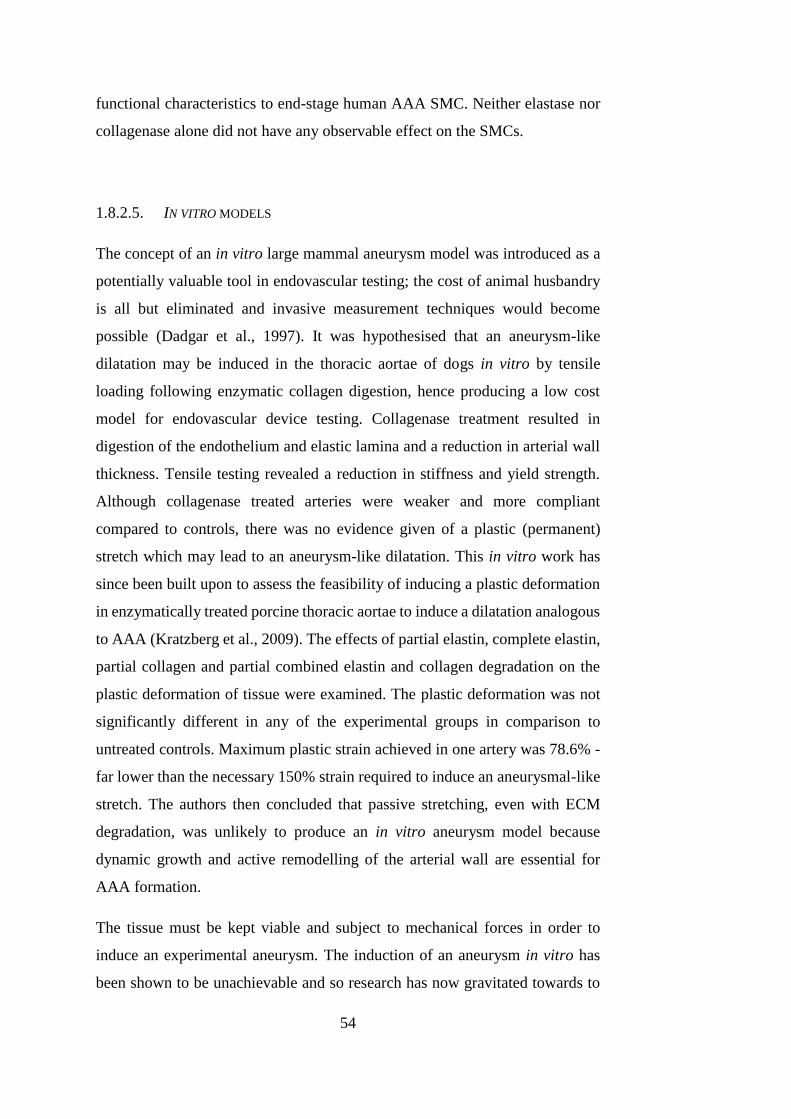
54
functional characteristics to end-stage human AAA SMC. Neither elastase nor
collagenase alone did not have any observable effect on the SMCs.
1.8.2.5. IN VITRO MODELS
The concept of an in vitro large mammal aneurysm model was introduced as a
potentially valuable tool in endovascular testing; the cost of animal husbandry
is all but eliminated and invasive measurement techniques would become
possible (Dadgar et al., 1997). It was hypothesised that an aneurysm-like
dilatation may be induced in the thoracic aortae of dogs in vitro by tensile
loading following enzymatic collagen digestion, hence producing a low cost
model for endovascular device testing. Collagenase treatment resulted in
digestion of the endothelium and elastic lamina and a reduction in arterial wall
thickness. Tensile testing revealed a reduction in stiffness and yield strength.
Although collagenase treated arteries were weaker and more compliant
compared to controls, there was no evidence given of a plastic (permanent)
stretch which may lead to an aneurysm-like dilatation. This in vitro work has
since been built upon to assess the feasibility of inducing a plastic deformation
in enzymatically treated porcine thoracic aortae to induce a dilatation analogous
to AAA (Kratzberg et al., 2009). The effects of partial elastin, complete elastin,
partial collagen and partial combined elastin and collagen degradation on the
plastic deformation of tissue were examined. The plastic deformation was not
significantly different in any of the experimental groups in comparison to
untreated controls. Maximum plastic strain achieved in one artery was 78.6% -
far lower than the necessary 150% strain required to induce an aneurysmal-like
stretch. The authors then concluded that passive stretching, even with ECM
degradation, was unlikely to produce an in vitro aneurysm model because
dynamic growth and active remodelling of the arterial wall are essential for
AAA formation.
The tissue must be kept viable and subject to mechanical forces in order to
induce an experimental aneurysm. The induction of an aneurysm in vitro has
been shown to be unachievable and so research has now gravitated towards to
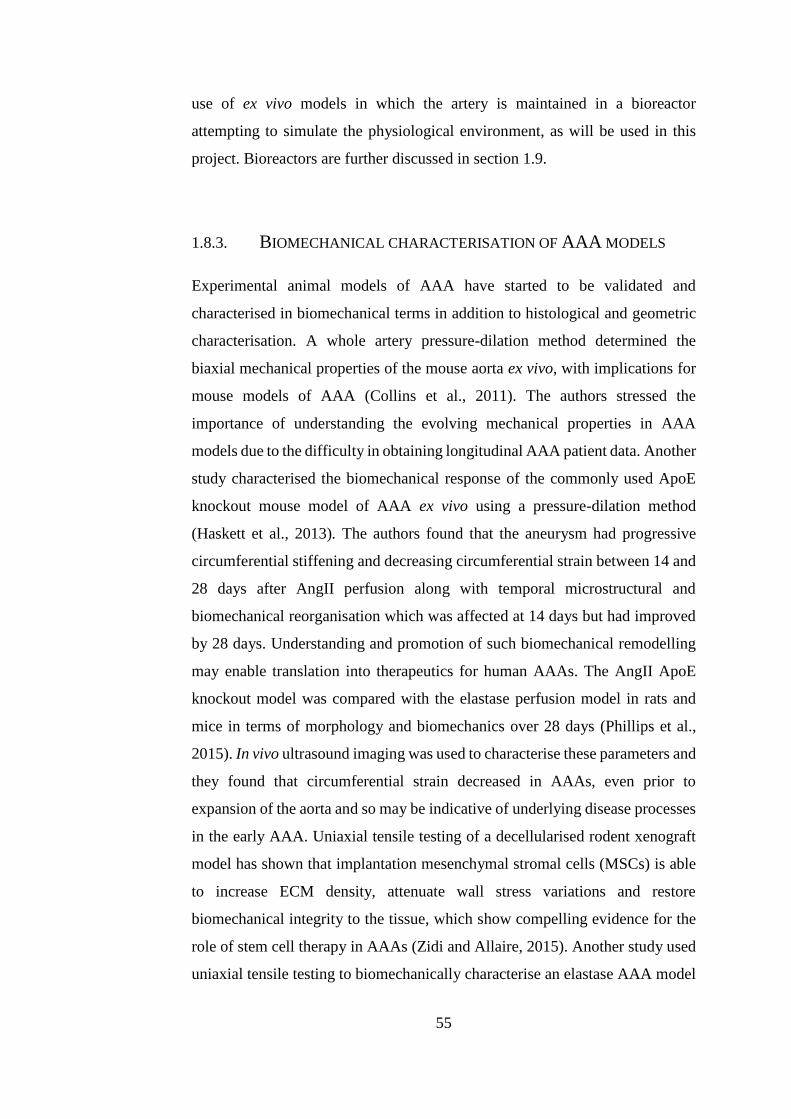
55
use of ex vivo models in which the artery is maintained in a bioreactor
attempting to simulate the physiological environment, as will be used in this
project. Bioreactors are further discussed in section 1.9.
1.8.3. BIOMECHANICAL CHARACTERISATION OF AAA MODELS
Experimental animal models of AAA have started to be validated and
characterised in biomechanical terms in addition to histological and geometric
characterisation. A whole artery pressure-dilation method determined the
biaxial mechanical properties of the mouse aorta ex vivo, with implications for
mouse models of AAA (Collins et al., 2011). The authors stressed the
importance of understanding the evolving mechanical properties in AAA
models due to the difficulty in obtaining longitudinal AAA patient data. Another
study characterised the biomechanical response of the commonly used ApoE
knockout mouse model of AAA ex vivo using a pressure-dilation method
(Haskett et al., 2013). The authors found that the aneurysm had progressive
circumferential stiffening and decreasing circumferential strain between 14 and
28 days after AngII perfusion along with temporal microstructural and
biomechanical reorganisation which was affected at 14 days but had improved
by 28 days. Understanding and promotion of such biomechanical remodelling
may enable translation into therapeutics for human AAAs. The AngII ApoE
knockout model was compared with the elastase perfusion model in rats and
mice in terms of morphology and biomechanics over 28 days (Phillips et al.,
2015). In vivo ultrasound imaging was used to characterise these parameters and
they found that circumferential strain decreased in AAAs, even prior to
expansion of the aorta and so may be indicative of underlying disease processes
in the early AAA. Uniaxial tensile testing of a decellularised rodent xenograft
model has shown that implantation mesenchymal stromal cells (MSCs) is able
to increase ECM density, attenuate wall stress variations and restore
biomechanical integrity to the tissue, which show compelling evidence for the
role of stem cell therapy in AAAs (Zidi and Allaire, 2015). Another study used
uniaxial tensile testing to biomechanically characterise an elastase AAA model
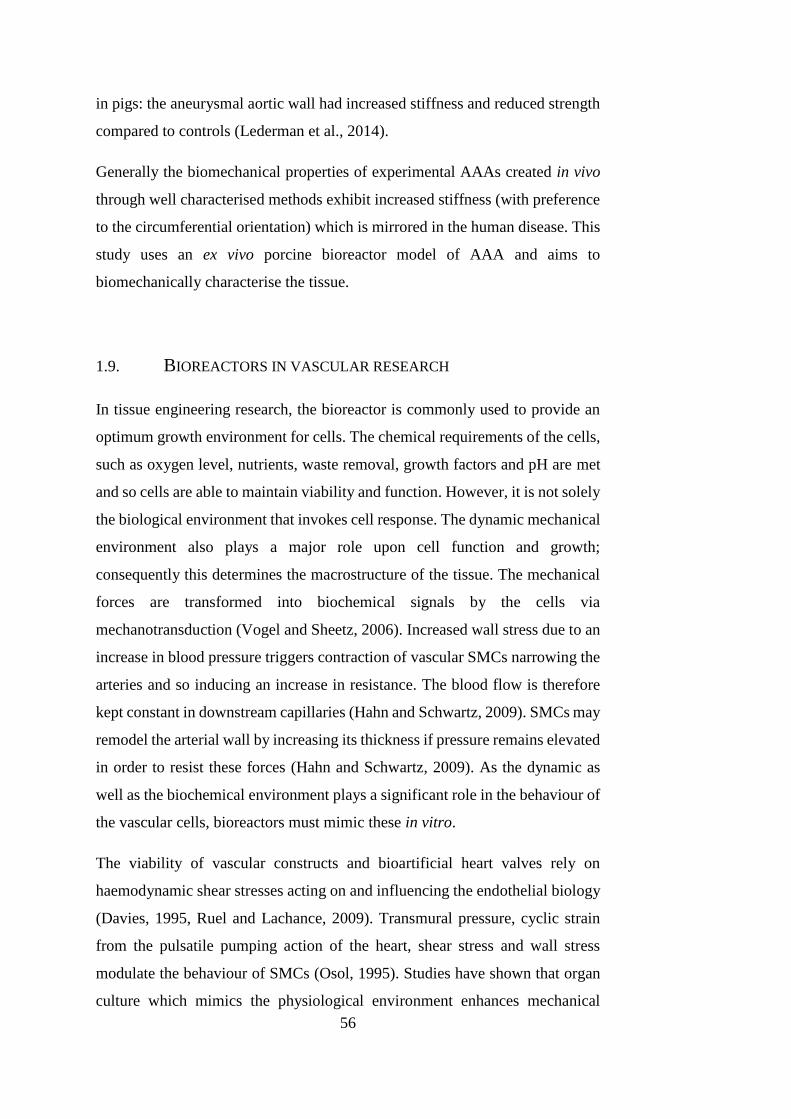
56
in pigs: the aneurysmal aortic wall had increased stiffness and reduced strength
compared to controls (Lederman et al., 2014).
Generally the biomechanical properties of experimental AAAs created in vivo
through well characterised methods exhibit increased stiffness (with preference
to the circumferential orientation) which is mirrored in the human disease. This
study uses an ex vivo porcine bioreactor model of AAA and aims to
biomechanically characterise the tissue.
1.9. BIOREACTORS IN VASCULAR RESEARCH
In tissue engineering research, the bioreactor is commonly used to provide an
optimum growth environment for cells. The chemical requirements of the cells,
such as oxygen level, nutrients, waste removal, growth factors and pH are met
and so cells are able to maintain viability and function. However, it is not solely
the biological environment that invokes cell response. The dynamic mechanical
environment also plays a major role upon cell function and growth;
consequently this determines the macrostructure of the tissue. The mechanical
forces are transformed into biochemical signals by the cells via
mechanotransduction (Vogel and Sheetz, 2006). Increased wall stress due to an
increase in blood pressure triggers contraction of vascular SMCs narrowing the
arteries and so inducing an increase in resistance. The blood flow is therefore
kept constant in downstream capillaries (Hahn and Schwartz, 2009). SMCs may
remodel the arterial wall by increasing its thickness if pressure remains elevated
in order to resist these forces (Hahn and Schwartz, 2009). As the dynamic as
well as the biochemical environment plays a significant role in the behaviour of
the vascular cells, bioreactors must mimic these in vitro.
The viability of vascular constructs and bioartificial heart valves rely on
haemodynamic shear stresses acting on and influencing the endothelial biology
(Davies, 1995, Ruel and Lachance, 2009). Transmural pressure, cyclic strain
from the pulsatile pumping action of the heart, shear stress and wall stress
modulate the behaviour of SMCs (Osol, 1995). Studies have shown that organ
culture which mimics the physiological environment enhances mechanical
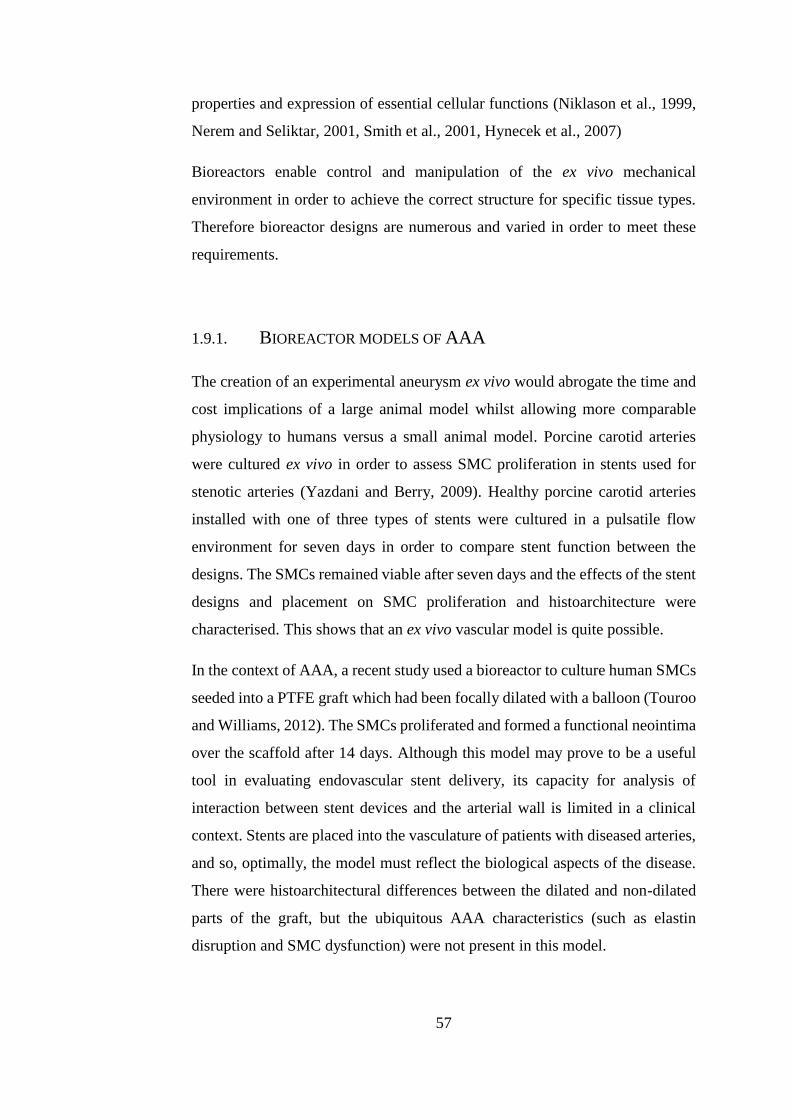
57
properties and expression of essential cellular functions (Niklason et al., 1999,
Nerem and Seliktar, 2001, Smith et al., 2001, Hynecek et al., 2007)
Bioreactors enable control and manipulation of the ex vivo mechanical
environment in order to achieve the correct structure for specific tissue types.
Therefore bioreactor designs are numerous and varied in order to meet these
requirements.
1.9.1. BIOREACTOR MODELS OF AAA
The creation of an experimental aneurysm ex vivo would abrogate the time and
cost implications of a large animal model whilst allowing more comparable
physiology to humans versus a small animal model. Porcine carotid arteries
were cultured ex vivo in order to assess SMC proliferation in stents used for
stenotic arteries (Yazdani and Berry, 2009). Healthy porcine carotid arteries
installed with one of three types of stents were cultured in a pulsatile flow
environment for seven days in order to compare stent function between the
designs. The SMCs remained viable after seven days and the effects of the stent
designs and placement on SMC proliferation and histoarchitecture were
characterised. This shows that an ex vivo vascular model is quite possible.
In the context of AAA, a recent study used a bioreactor to culture human SMCs
seeded into a PTFE graft which had been focally dilated with a balloon (Touroo
and Williams, 2012). The SMCs proliferated and formed a functional neointima
over the scaffold after 14 days. Although this model may prove to be a useful
tool in evaluating endovascular stent delivery, its capacity for analysis of
interaction between stent devices and the arterial wall is limited in a clinical
context. Stents are placed into the vasculature of patients with diseased arteries,
and so, optimally, the model must reflect the biological aspects of the disease.
There were histoarchitectural differences between the dilated and non-dilated
parts of the graft, but the ubiquitous AAA characteristics (such as elastin
disruption and SMC dysfunction) were not present in this model.
58
An ex vivo large animal model of AAA cultured in a bioreactor which reflects
the biological aspects of the disease will be a useful research tool. This thesis
aims to develop such a model in order to temporally characterise alterations in
biomechanics, tissue structure and SMC behaviour in order elucidate the
mechanisms involved of AAA formation and early disease.
1.10. CONCLUSIONS
AAA disease has myriad aspects of pathogenesis and progression, but is usually
only discovered in humans after aortic dilatation has been initiated. Currently,
no pharmacological or therapeutic treatments are available for attenuation or
inhibition of AAA progression and so patients are destined for surgery. The
instigating factor or factors in development of AAA is unknown, and so this has
driven researchers to examine the early stages of the disease. However, research
is limited by the paucity of human aneurysmal tissue which is at an early stage
of AAA progression. In order to combat this, in vivo animal models are widely
used; murine models offer a low cost, genetically malleable solution. Small
mammal models are limited in evaluation of surgical solutions and
biomechanics due to their miniature size and are not as similar physiologically
to humans as large mammals. Studies with large mammals are limited due to
great expense in terms of both time and cost, but ex vivo culturing of the arteries
of large mammals in a bioreactor may hold the solution to this problem.
Comparatively fewer studies have been conducted to reveal the role of the SMC
in AAA pathogenesis versus other aspects of the disease. Given that SMCs are
known to have an inherently plastic nature, the temporal mapping of alterations
in SMC phenotype over time in the context of early aneurysmal events may lead
to the identification of AAA prior to aortic dilatation. Biomechanical analysis
will investigate the function of the whole artery, as the ECM is maintained by
the SMCs. Identifying changes in SMCs may also uncover targets for
therapeutic or pharmacological therapies which have not yet been identified.
59
1.11. PROJECT RATIONALE
AAA is a progressive dilatation of the abdominal aorta which will lead to
rupture without intervention. Rupture of an AAA carries an extremely high
mortality rate. The only treatment options currently available for AAA are
surgical procedures which leave no treatment options for patients who are
unable to undergo surgery. Recently, a national programme has been
implemented whereby AAA screening is offered to individuals considered to be
at risk of developing the disease. Prior to this, AAAs were often detected
incidentally to other medical conditions.
The AAA screening programme offers unprecedented opportunity to study the
in vivo progression from the early to end-stages of the disease. This may reveal
earlier stages of the disease where it would be appropriate to intervene with
therapeutic or pharmacological agents. However, understanding the underlying
mechanisms behind AAA formation and early development is essential for
uncovering early therapeutic targets. It is virtually impossible conduct research
on human AAA tissue in the earliest stages of the disease due to its very nature.
Therefore, over the past four decades, a wide range of AAA models have been
developed to order to understand the longitudinal disease and the underlying
mechanisms which are implicated in AAA.
SMCs are vascular cells responsible for maintaining the arterial ECM and are
thought to play a role in AAA development. SMCs from human AAA tissue are
dysfunctional and SMC seeding has been shown to attenuate AAA progression
animal models. Given the inherent plasticity of adult SMCs and their ability to
maintain the ECM they have been identified as an appealing target for study.
1.12. AIMS AND OBJECTIVES
It has been shown that using an ex vivo bioreactor porcine model of end-stage
AAA causes the SMCs to adopt a phenotype which is comparable to SMCs from
end-stage human AAA tissue. The main aim of this study was to develop and
60
use this ex vivo model to investigate and characterise the temporal phenotypic
modulation in SMCs and relate this to function of the whole artery via
biomechanical testing. This may reveal potential early targets for AAA disease
which is especially important in the context of the recent implementation of
AAA screening.
An early AAA model was developed and the arterial structure and SMC
morphology and function were characterised and compared to SMC behaviour
in the end-stage model. The biomechanical behaviour of the end-stage AAA
model was characterised in order to relate SMC dysfunction to the function of
the artery as a whole organ.
Specific objectives:
1 To characterise the structure of the artery in the early- and end-stage
model
2 To determine the role of chemical ECM degradation and bioreactor
culture on SMC morphology
3 To determine changes in SMC structure and function with respect to
time
4 To characterise and calibrate the dynamic environment within the
bioreactor
5 To investigate the biomechanical impact of ECM degradation used to
induce the experimental AAA model
6 To characterise the biomechanical properties of the end-stage AAA
model

61
CHAPTER 2
MATERIALS AND METHODS
62
CHAPTER 2 MATERIALS AND METHODS
This chapter describes the materials and methods used to investigate the
cellular, histological and biomechanical properties of aneurysm model arteries
and their respective explanted SMCs after two different intervals of time in
culture. Firstly, details of all reagents and consumables and their suppliers are
given, along with the general experimental approach used for this study. The
cell culture and primary SMC explant and isolation techniques are also
described.
Secondly, the methods used to characterise the structure and function of the
tissues and cells are described. Lastly, the methods for biomechanical
assessment of the ex vivo model are given. The aforementioned biomechanics
section is separated into two sections: methods for uniaxial tensile testing and
whole artery dilation testing.
2.1. SUPPLIERS OF MATERIALS AND REAGENTS
The supplier details for the materials, reagents and equipment used throughout
this study are listed in Appendix A, categorised in Tables A.1 to A.7.
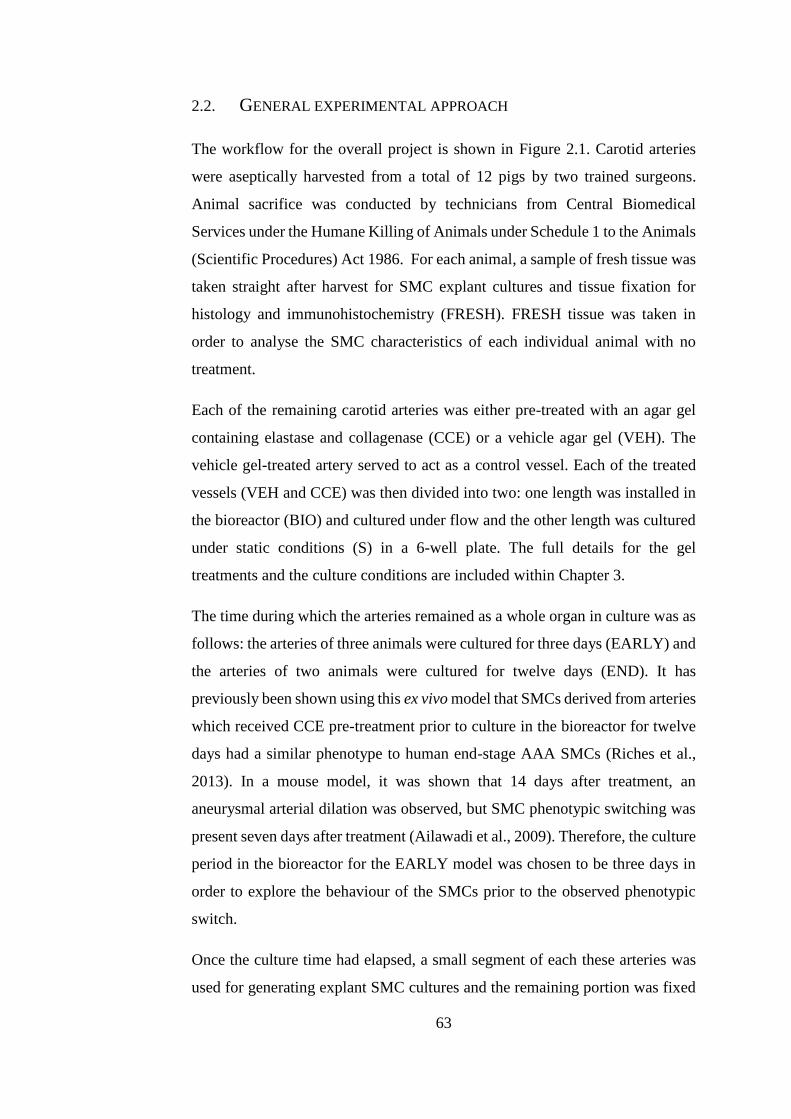
63
2.2. GENERAL EXPERIMENTAL APPROACH
The workflow for the overall project is shown in Figure 2.1. Carotid arteries
were aseptically harvested from a total of 12 pigs by two trained surgeons.
Animal sacrifice was conducted by technicians from Central Biomedical
Services under the Humane Killing of Animals under Schedule 1 to the Animals
(Scientific Procedures) Act 1986. For each animal, a sample of fresh tissue was
taken straight after harvest for SMC explant cultures and tissue fixation for
histology and immunohistochemistry (FRESH). FRESH tissue was taken in
order to analyse the SMC characteristics of each individual animal with no
treatment.
Each of the remaining carotid arteries was either pre-treated with an agar gel
containing elastase and collagenase (CCE) or a vehicle agar gel (VEH). The
vehicle gel-treated artery served to act as a control vessel. Each of the treated
vessels (VEH and CCE) was then divided into two: one length was installed in
the bioreactor (BIO) and cultured under flow and the other length was cultured
under static conditions (S) in a 6-well plate. The full details for the gel
treatments and the culture conditions are included within Chapter 3.
The time during which the arteries remained as a whole organ in culture was as
follows: the arteries of three animals were cultured for three days (EARLY) and
the arteries of two animals were cultured for twelve days (END). It has
previously been shown using this ex vivo model that SMCs derived from arteries
which received CCE pre-treatment prior to culture in the bioreactor for twelve
days had a similar phenotype to human end-stage AAA SMCs (Riches et al.,
2013). In a mouse model, it was shown that 14 days after treatment, an
aneurysmal arterial dilation was observed, but SMC phenotypic switching was
present seven days after treatment (Ailawadi et al., 2009). Therefore, the culture
period in the bioreactor for the EARLY model was chosen to be three days in
order to explore the behaviour of the SMCs prior to the observed phenotypic
switch.
Once the culture time had elapsed, a small segment of each these arteries was
used for generating explant SMC cultures and the remaining portion was fixed
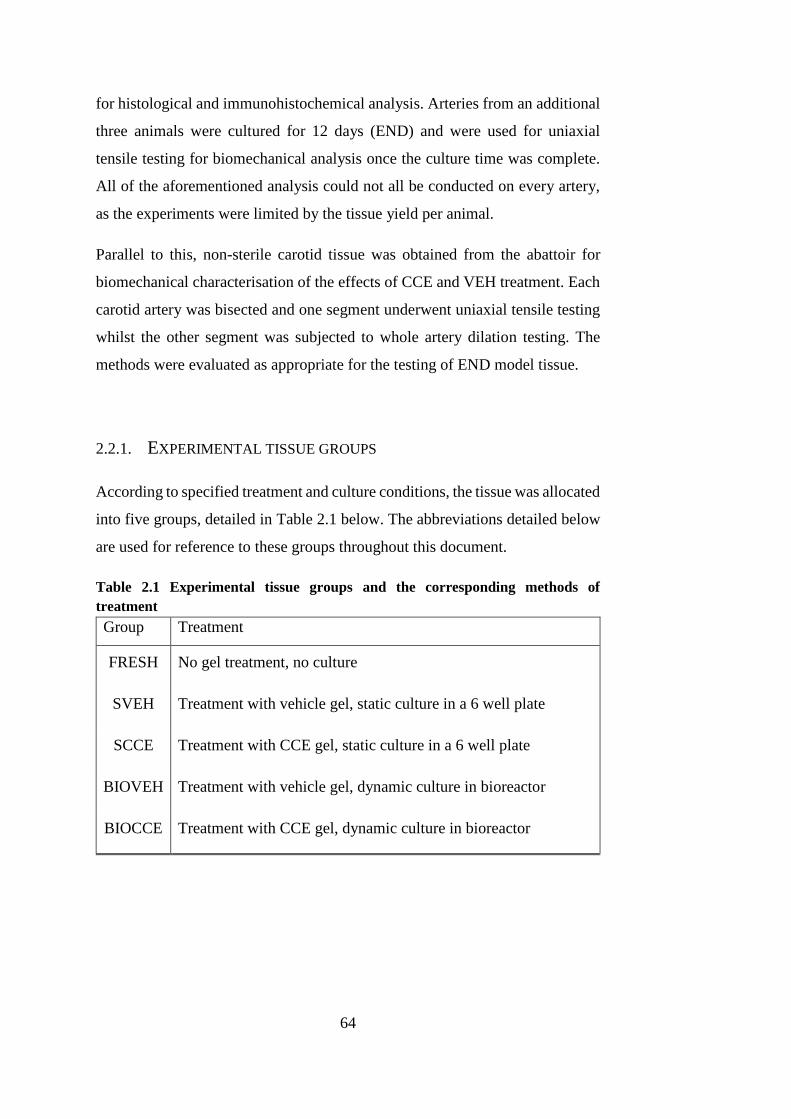
64
for histological and immunohistochemical analysis. Arteries from an additional
three animals were cultured for 12 days (END) and were used for uniaxial
tensile testing for biomechanical analysis once the culture time was complete.
All of the aforementioned analysis could not all be conducted on every artery,
as the experiments were limited by the tissue yield per animal.
Parallel to this, non-sterile carotid tissue was obtained from the abattoir for
biomechanical characterisation of the effects of CCE and VEH treatment. Each
carotid artery was bisected and one segment underwent uniaxial tensile testing
whilst the other segment was subjected to whole artery dilation testing. The
methods were evaluated as appropriate for the testing of END model tissue.
2.2.1. EXPERIMENTAL TISSUE GROUPS
According to specified treatment and culture conditions, the tissue was allocated
into five groups, detailed in Table 2.1 below. The abbreviations detailed below
are used for reference to these groups throughout this document.
Table 2.1 Experimental tissue groups and the corresponding methods of
treatment
Group Treatment
FRESH No gel treatment, no culture
SVEH Treatment with vehicle gel, static culture in a 6 well plate
SCCE Treatment with CCE gel, static culture in a 6 well plate
BIOVEH Treatment with vehicle gel, dynamic culture in bioreactor
BIOCCE Treatment with CCE gel, dynamic culture in bioreactor
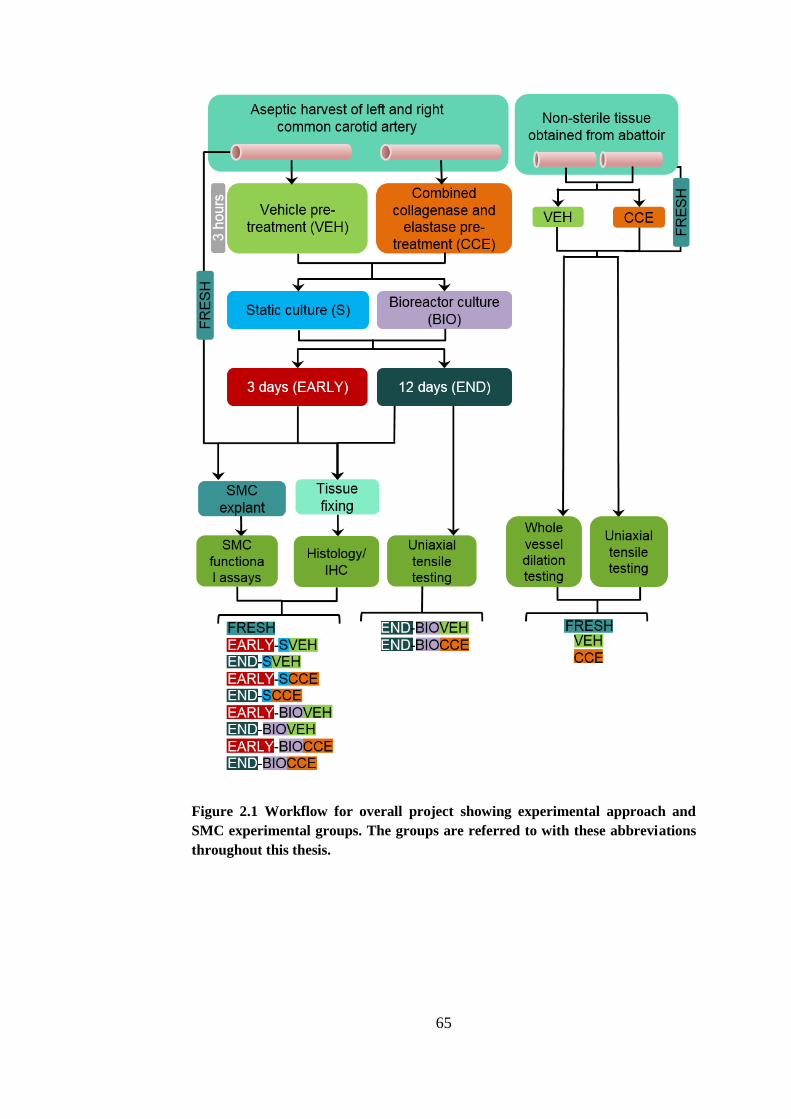
65
Figure 2.1 Workflow for overall project showing experimental approach and
SMC experimental groups. The groups are referred to with these abbreviations
throughout this thesis.
66
2.3. MEDIA AND REAGENT COMPOSITION
The compositions of media used throughout cell culture are detailed in
Appendix B. These media were used throughout the project and are referred to
throughout this document by abbreviations, as follows.
Table 2.2 Cell culture media compositions
Media Abbreviation
10% full growth medium FGM
5% sub-maximal growth medium SGM
0.4% minimal growth medium MGM
Serum free medium SFM
2.4. CELL CULTURE TECHNIQUES
All cell culture procedures and techniques were carried out aseptically in a Class
II laminar flow hood. All culture media and reagents were warmed to 37°C
before use.
2.4.1. CELL PASSAGING
Once the cells had formed a confluent layer, the culture medium was aspirated
from the flasks, along with detached cells and cell debris. The cells were then
washed in PBS to remove traces of the culture medium. Trypsin/EDTA (2 ml)
was then added and the flasks incubated at 37°C for 5 to 10 minutes to facilitate
cell detachment. Detachment was aided by gentle physical agitation and
monitored via a light microscope. When cell detachment had occurred, medium
containing serum (SGM) (10 ml) was then added to inhibit the action of the
trypsin/EDTA, and the cell suspension was transferred to a conical bottomed
centrifuge tube and centrifuged for 6 minutes at 600g. Following centrifugation,
the supernatant was carefully poured off. The cell pellet was re-suspended in
FGM (10 ml) and an equal volume was transferred to three new tissue culture
flasks. The culture medium was half changed every 3 to 4 days until cell
confluence had once again been reached.
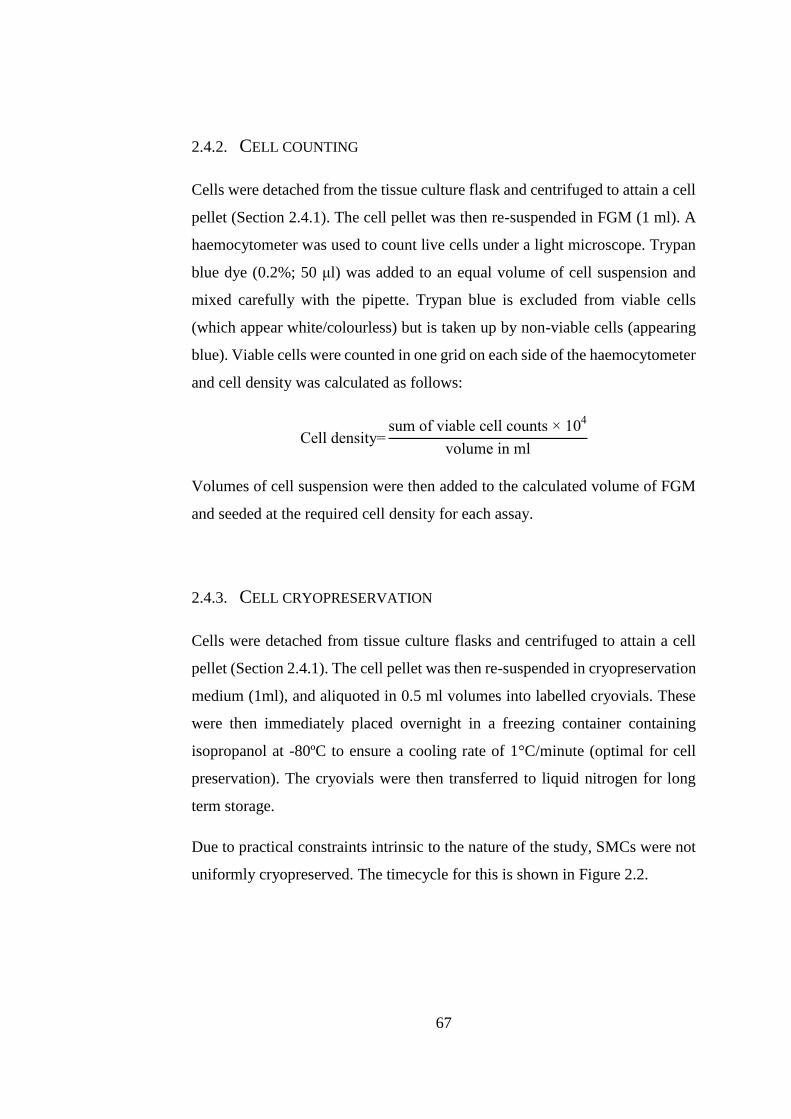
67
2.4.2. CELL COUNTING
Cells were detached from the tissue culture flask and centrifuged to attain a cell
pellet (Section 2.4.1). The cell pellet was then re-suspended in FGM (1 ml). A
haemocytometer was used to count live cells under a light microscope. Trypan
blue dye (0.2%; 50 μl) was added to an equal volume of cell suspension and
mixed carefully with the pipette. Trypan blue is excluded from viable cells
(which appear white/colourless) but is taken up by non-viable cells (appearing
blue). Viable cells were counted in one grid on each side of the haemocytometer
and cell density was calculated as follows:
Cell density=sum of viable cell counts × 10
4
volume in ml
Volumes of cell suspension were then added to the calculated volume of FGM
and seeded at the required cell density for each assay.
2.4.3. CELL CRYOPRESERVATION
Cells were detached from tissue culture flasks and centrifuged to attain a cell
pellet (Section 2.4.1). The cell pellet was then re-suspended in cryopreservation
medium (1ml), and aliquoted in 0.5 ml volumes into labelled cryovials. These
were then immediately placed overnight in a freezing container containing
isopropanol at -80ºC to ensure a cooling rate of 1°C/minute (optimal for cell
preservation). The cryovials were then transferred to liquid nitrogen for long
term storage.
Due to practical constraints intrinsic to the nature of the study, SMCs were not
uniformly cryopreserved. The timecycle for this is shown in Figure 2.2.
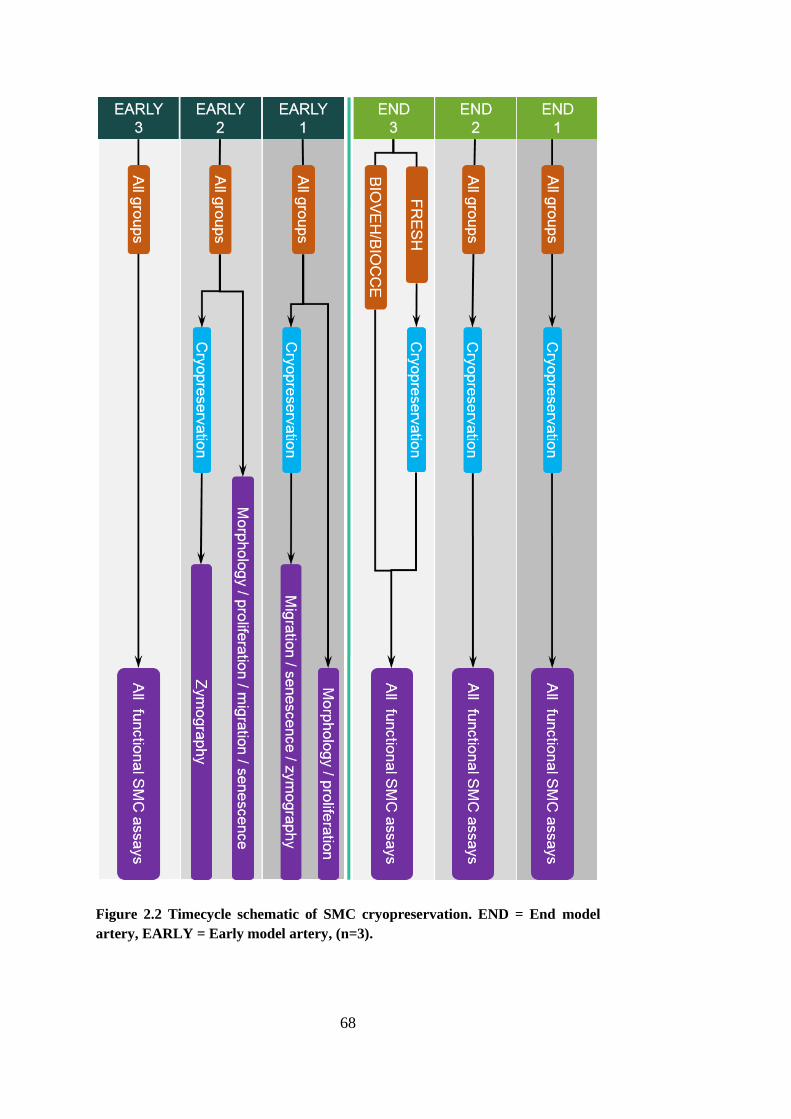
68
Figure 2.2 Timecycle schematic of SMC cryopreservation. END = End model
artery, EARLY = Early model artery, (n=3).
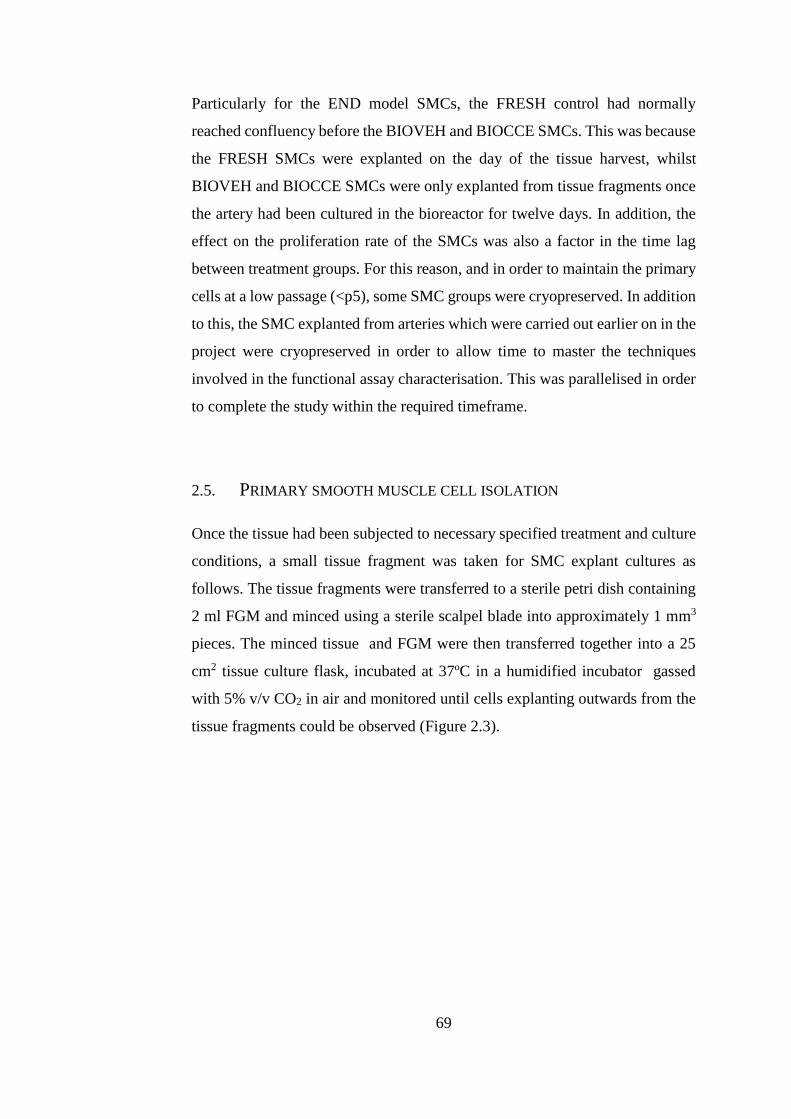
69
Particularly for the END model SMCs, the FRESH control had normally
reached confluency before the BIOVEH and BIOCCE SMCs. This was because
the FRESH SMCs were explanted on the day of the tissue harvest, whilst
BIOVEH and BIOCCE SMCs were only explanted from tissue fragments once
the artery had been cultured in the bioreactor for twelve days. In addition, the
effect on the proliferation rate of the SMCs was also a factor in the time lag
between treatment groups. For this reason, and in order to maintain the primary
cells at a low passage (<p5), some SMC groups were cryopreserved. In addition
to this, the SMC explanted from arteries which were carried out earlier on in the
project were cryopreserved in order to allow time to master the techniques
involved in the functional assay characterisation. This was parallelised in order
to complete the study within the required timeframe.
2.5. PRIMARY SMOOTH MUSCLE CELL ISOLATION
Once the tissue had been subjected to necessary specified treatment and culture
conditions, a small tissue fragment was taken for SMC explant cultures as
follows. The tissue fragments were transferred to a sterile petri dish containing
2 ml FGM and minced using a sterile scalpel blade into approximately 1 mm3
pieces. The minced tissue and FGM were then transferred together into a 25
cm2 tissue culture flask, incubated at 37ºC in a humidified incubator gassed
with 5% v/v CO2 in air and monitored until cells explanting outwards from the
tissue fragments could be observed (Figure 2.3).
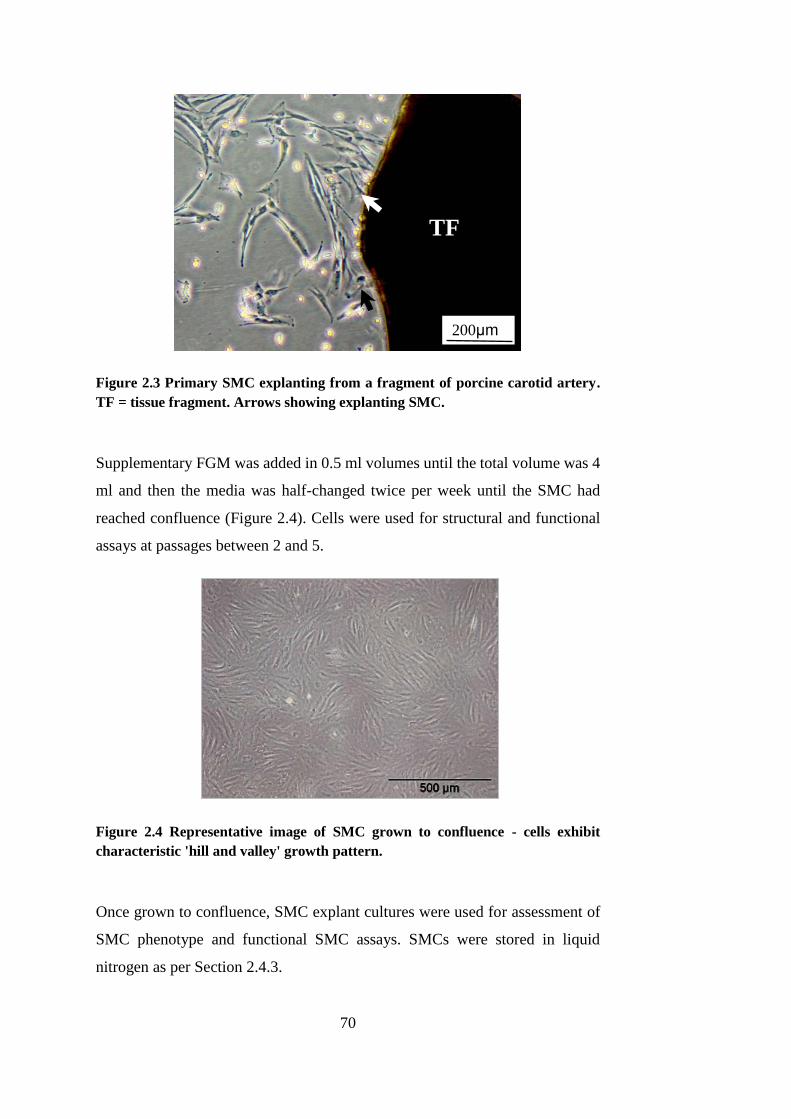
70
Figure 2.3 Primary SMC explanting from a fragment of porcine carotid artery.
TF = tissue fragment. Arrows showing explanting SMC.
Supplementary FGM was added in 0.5 ml volumes until the total volume was 4
ml and then the media was half-changed twice per week until the SMC had
reached confluence (Figure 2.4). Cells were used for structural and functional
assays at passages between 2 and 5.
Figure 2.4 Representative image of SMC grown to confluence - cells exhibit
characteristic 'hill and valley' growth pattern.
Once grown to confluence, SMC explant cultures were used for assessment of
SMC phenotype and functional SMC assays. SMCs were stored in liquid
nitrogen as per Section 2.4.3.
200μm
TF
71
2.6. PREPARATION OF ARTERIAL TISSUE
2.6.1. FIXATION OF ARTERIAL SEGMENTS
Vessels removed from the bioreactor were divided into three portions
representing the inlet, centre and outlet portions. These arterial portions, along
with the portions cultured statically were fixed in neutral buffered 10%
Formalin for 3 to 5 days. Fixed tissues were then either subjected to tissue
processing, or were held in 70% ethanol until they were able to be processed in
order to prevent over-fixation.
2.6.2. TISSUE PROCESSING
Fixed tissues (see section 2.6.1) were placed in plastic histology cassettes and
processed using a Leica TP 1020 Tissue Processor (Leica, Wetzlar, Germany)
on an overnight programme starting through graded alcohols (70%, 1hr; 90%,
1hr; 95%, 1hr; 100%, 1hr; 100%, 2hrs) then moving to Histo-Clear (3 buckets;
1hr, 1hr, 1.5hrs) then ending in molten paraffin wax (2 buckets; 2hrs, 2hrs).
2.6.3. PARAFFIN WAX EMBEDDING
Tissue embedding was performed on a Medite TES99 embedding system
(Medite, Hannover, Germany). Molten wax was poured into moulds and the
arterial segments orientated to provide a transverse arterial section on cutting.
The top of the processing cassette was then embedded into the molten wax
mould to provide grip for the microtome. The wax blocks were then left to
harden at room temperature overnight.
2.6.4. SECTIONING OF EMBEDDED TISSUE
Wax blocks containing embedded tissue were placed on ice prior to sectioning
in order to increase the quality of the cut. Sections 5 μm thick were cut using a
72
Leica RM2235 microtome (Leica, Wetzlar, Germany) and then floated onto
distilled water at 50°C to smooth creases in the tissue. Glass slides were placed
underneath the floating sections so that they adhered to the slide as it was lifted
out of the water. Slides were then left to dry vertically and then were placed into
a 50°C incubator overnight to ensure complete adherence of the tissue to the
glass slide.
2.7. HISTOLOGY AND IMMUNOHISTOCHEMISTRY
2.7.1. ALPHA-SMOOTH MUSCLE ACTIN AND MILLER’S ELASTIN CO-
STAIN
Alpha-smooth muscle actin (α-SMA) with Miller’s elastin co-stain allows
visualisation of α-SMA, which is a marker of SMCs, and of the elastin fibres in
the tissue, respectively. Horse-radish peroxidase methods of
immunohistochemistry form a brown precipitate in the presence of primary
antibody binding (α-SMA). Miller’s elastin stains elastin fibres purple.
Sections were deparaffinised by submerging slides in two changes of Histo-
Clear for 8 minutes each and then rehydrated by passing through a series of
graded alcohols (100%, 5 minutes; 100% 3 minutes; 90%, 3 minutes; 70%, 2
minutes) and then tap water for 2 minutes. Endogenous peroxidase activity was
blocked by submerging the slides in 3% v/v hydrogen peroxide in distilled water
for 10 minutes. Slides were then briefly washed in still tap water before being
transferred to 100 μl coverplate chambers for all subsequent steps unless stated.
Sections were then washed continuously by pipetting 1X Tris buffered saline
(TBS) (1M Tris base, 1.5 NaCl in distilled water) into the coverplates for 5
minutes. To block non-specific binding of the primary antibody, 100 μl per slide
of normal goat serum diluted 1:20 with 1X TBS was added to the coverplates
and then incubated for 10 minutes. Sections were then incubated overnight at
4°C with 100 μl per slide of mouse monoclonal anti-alpha smooth muscle actin
clone 1A4 diluted 1:400 with 1X TBS. Sections were then washed for 20
minutes by continuous pipetting of 1X TBS into the coverplates, then incubated
73
in horse radish peroxidase-conjugated anti-mouse secondary IgG antibody
diluted 1:50 with 1X TBS for 30 minutes at room temperature. Slides were once
again washed continuously with 1X TBS for 20 minutes. Detection of
subsequent peroxidase activity was carried out using a solution containing 0.7
mg.ml-1 3,3’-diaminobenzidine (DAB) and 2.0 mg.ml-1 urea hydrogen peroxide
(SIGMAFASTTM) in deionised water. Formation of brown precipitate was
monitored closely and 1 – 2 minutes was sufficient for all sections.
Slides were quickly detached from the Shandon coverplate system and washed
in still tap water to inactivate DAB action. Slides were then rinsed in 95%
methylated spirits (5% v/v methanol in ethanol) followed by a rinse in 95%
ethanol. For the elastin co-stain, slides were then submerged in Miller’s staining
solution for 20 minutes. The slides were then put through a series of 95%
ethanol washes in order to remove the surface stain (3 x 3 minute washes).
Slides were then fully dehydrated by submerging in 100% ethanol (2 x 2
minutes) and cleared with Histo-Clear for 10 minutes. Slides were then mounted
with DPX mountant and glass coverslips and allowed to air dry for at least 24
hours before microscopic visualisation.
2.7.2. PICRO-SIRIUS RED
Fixed tissue segments from one animal were stained with picro-sirius red in the
laboratory. All other picro-sirius red staining was completed by Mike Shires of
the Leeds Institute of Cancer and Pathology. Picro-sirius red allows
visualisation of collagen fibres under polarised light (appearing red, green or
yellow depending on fibre orientation).
Sections were deparaffinised by submerging slides in two changes of Histo-
Clear for 8 minutes each and then rehydrated by passing through a series of
graded alcohols (100%, 5 minutes; 100% 3 minutes; 90%, 3 minutes; 70%, 2
minutes) and then running tap water for 3 minutes. The nuclei of the tissue were
then stained by immersing the slides in Weigert’s haematoxylin (1:1 ratio
solution A to solution B) for 10 minute. The sections were then washed in tap
water for 1 minute. The slides were then immersed in picro-sirius red (0.1% w/v
74
aqueous saturated picric acid solution) for 1 hour. The excess dye was then
removed by washing each slide in distilled water and then blotting dry. The
slides were then dehydrated by passing them through a series of graded alcohols
(70% ethanol v/v in distilled water, 5 seconds; 95% ethanol v/v 5% methanol,
5 seconds; 95% ethanol v/v 5% methanol, 2 minutes; 95% ethanol v/v 5%
methanol, 3 minutes). Sections were then cleared in Histo-Clear for 10 minutes
before being mounted with glass coverslips with DPX mountant. Slides were
allowed to air dry for at least 24 hours before microscopic visualisation.
2.7.2.1. VISUALISATION OF PICRO-SIRIUS RED STAINED SLIDES
The collagen of picro-sirius red stained sections was visualised using brightfield
microscopy with a linear polarising filter.
2.7.2.2. LUMINAL PERIMETER
Analysis of luminal circumference was carried out post-tissue fixation on
paraffin embedded fixed slides. The luminal circumference of ten 5 μm sections
from the centre portion of the fixed artery were measured per artery (n=5).
Whole stained sections were visualised using low magnification brightfield
microscopy. The ‘Find Edges’ tool in ImageJ was used to emphasise the edges
of the lumen. The ‘Find Edges’ tool uses a Sobel edge algorithm to complete
this task, and is commonly used in image processing. The images were then
converted into a binary image (Figure 2.5) using ImageJ and the ‘magic wand’
tool used to select the luminal region (http://imagej.nih.gov/ij/). The perimeter
of the luminal section was then recorded.
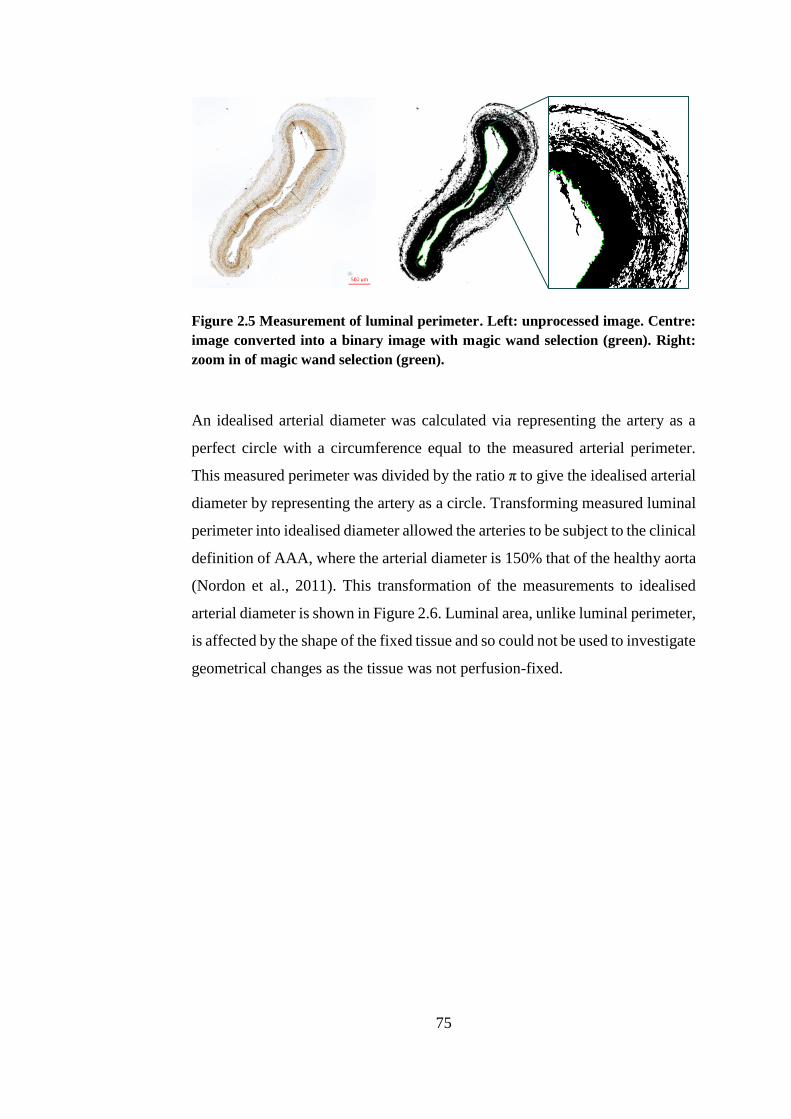
75
Figure 2.5 Measurement of luminal perimeter. Left: unprocessed image. Centre:
image converted into a binary image with magic wand selection (green). Right:
zoom in of magic wand selection (green).
An idealised arterial diameter was calculated via representing the artery as a
perfect circle with a circumference equal to the measured arterial perimeter.
This measured perimeter was divided by the ratio π to give the idealised arterial
diameter by representing the artery as a circle. Transforming measured luminal
perimeter into idealised diameter allowed the arteries to be subject to the clinical
definition of AAA, where the arterial diameter is 150% that of the healthy aorta
(Nordon et al., 2011). This transformation of the measurements to idealised
arterial diameter is shown in Figure 2.6. Luminal area, unlike luminal perimeter,
is affected by the shape of the fixed tissue and so could not be used to investigate
geometrical changes as the tissue was not perfusion-fixed.
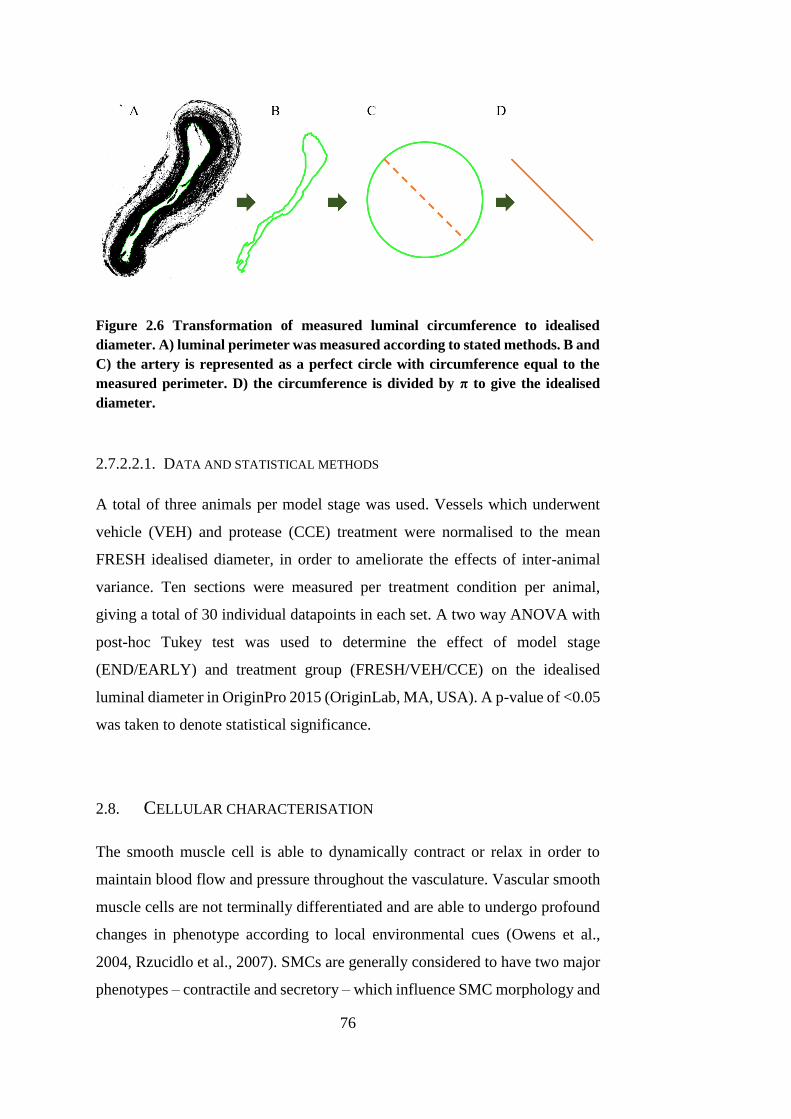
76
Figure 2.6 Transformation of measured luminal circumference to idealised
diameter. A) luminal perimeter was measured according to stated methods. B and
C) the artery is represented as a perfect circle with circumference equal to the
measured perimeter. D) the circumference is divided by π to give the idealised
diameter.
2.7.2.2.1. DATA AND STATISTICAL METHODS
A total of three animals per model stage was used. Vessels which underwent
vehicle (VEH) and protease (CCE) treatment were normalised to the mean
FRESH idealised diameter, in order to ameliorate the effects of inter-animal
variance. Ten sections were measured per treatment condition per animal,
giving a total of 30 individual datapoints in each set. A two way ANOVA with
post-hoc Tukey test was used to determine the effect of model stage
(END/EARLY) and treatment group (FRESH/VEH/CCE) on the idealised
luminal diameter in OriginPro 2015 (OriginLab, MA, USA). A p-value of <0.05
was taken to denote statistical significance.
2.8. CELLULAR CHARACTERISATION
The smooth muscle cell is able to dynamically contract or relax in order to
maintain blood flow and pressure throughout the vasculature. Vascular smooth
muscle cells are not terminally differentiated and are able to undergo profound
changes in phenotype according to local environmental cues (Owens et al.,
2004, Rzucidlo et al., 2007). SMCs are generally considered to have two major
phenotypes – contractile and secretory – which influence SMC morphology and
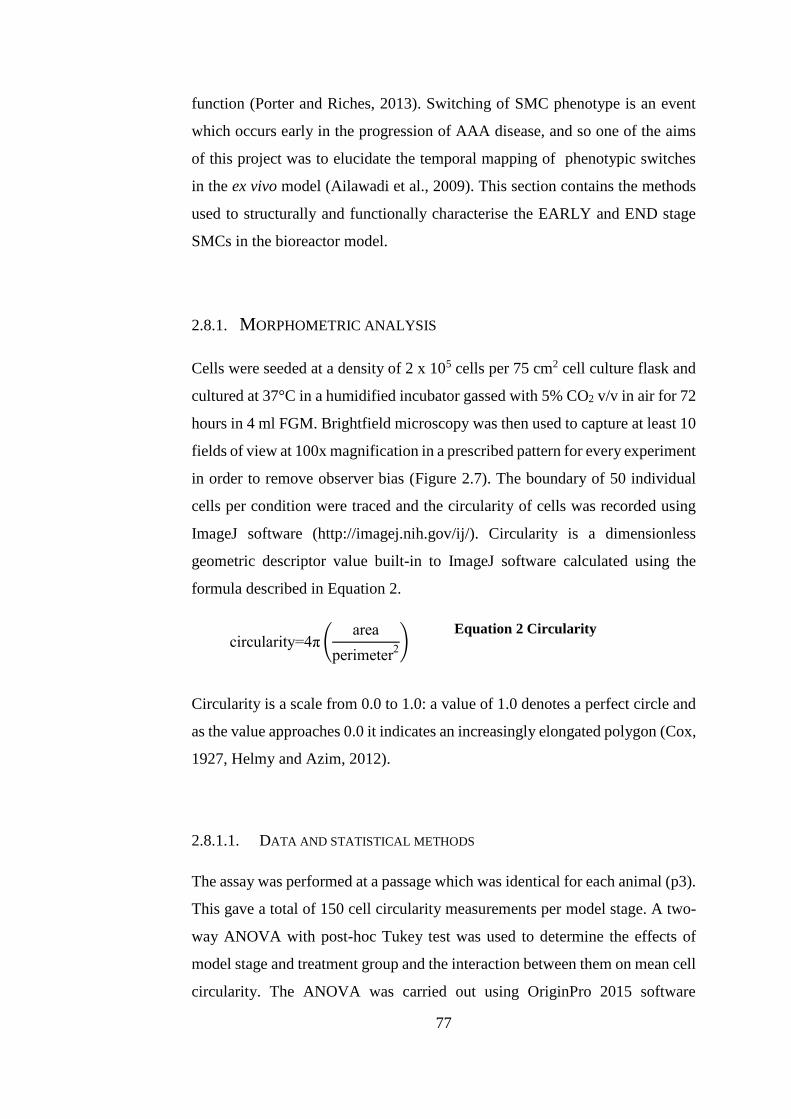
77
function (Porter and Riches, 2013). Switching of SMC phenotype is an event
which occurs early in the progression of AAA disease, and so one of the aims
of this project was to elucidate the temporal mapping of phenotypic switches
in the ex vivo model (Ailawadi et al., 2009). This section contains the methods
used to structurally and functionally characterise the EARLY and END stage
SMCs in the bioreactor model.
2.8.1. MORPHOMETRIC ANALYSIS
Cells were seeded at a density of 2 x 10⁵ cells per 75 cm2 cell culture flask and
cultured at 37°C in a humidified incubator gassed with 5% CO2 v/v in air for 72
hours in 4 ml FGM. Brightfield microscopy was then used to capture at least 10
fields of view at 100x magnification in a prescribed pattern for every experiment
in order to remove observer bias (Figure 2.7). The boundary of 50 individual
cells per condition were traced and the circularity of cells was recorded using
ImageJ software (http://imagej.nih.gov/ij/). Circularity is a dimensionless
geometric descriptor value built-in to ImageJ software calculated using the
formula described in Equation 2.
circularity=4π (area
perimeter2)
Equation 2 Circularity
Circularity is a scale from 0.0 to 1.0: a value of 1.0 denotes a perfect circle and
as the value approaches 0.0 it indicates an increasingly elongated polygon (Cox,
1927, Helmy and Azim, 2012).
2.8.1.1. DATA AND STATISTICAL METHODS
The assay was performed at a passage which was identical for each animal (p3).
This gave a total of 150 cell circularity measurements per model stage. A two-
way ANOVA with post-hoc Tukey test was used to determine the effects of
model stage and treatment group and the interaction between them on mean cell
circularity. The ANOVA was carried out using OriginPro 2015 software
78
(OriginLab, MA, USA). A p-value of <0.05 was taken to denote statistical
significance.
Figure 2.7 Pattern of field of view capture in a 75 cm2 flask for morphometric cell
analysis
2.8.2. F-ACTIN IMMUNOFLUORESCENCE
The cytoskeletal f-actin microfilament was visualised by staining with
rhodamine phalloidin fluorescent probe. Cell nuclei were visualised by using a
mounting medium containing 4’,6-diamidino-2-phenylindole (DAPI), a nuclear
dye specific to DNA.
2.8.2.1. CELL SEEDING AND FIXATION
Cells were seeded in a 24-well plate at a density of 1 x 10⁴ cells per well on top
of sterilised, circular coverslips and cultured in 1 ml FGM at 37°C in a
humidified incubator gassed with 5% CO2 v/v in air for 96 hours. The media
was then removed and the cells washed with 1X PBS. Cell fixation was
achieved by adding 400 – 500 μl per well of 4% paraformaldehyde (PFA) and
then leaving the plate on a rocker for 20 minutes. The PFA was then removed
and the cells once again washed with 1X PBS. Wells were then filled with 1X
PBS and stored at 4°C until staining.
1 2 3 4 5
6 7 8 9 10
11 12 13 14 15
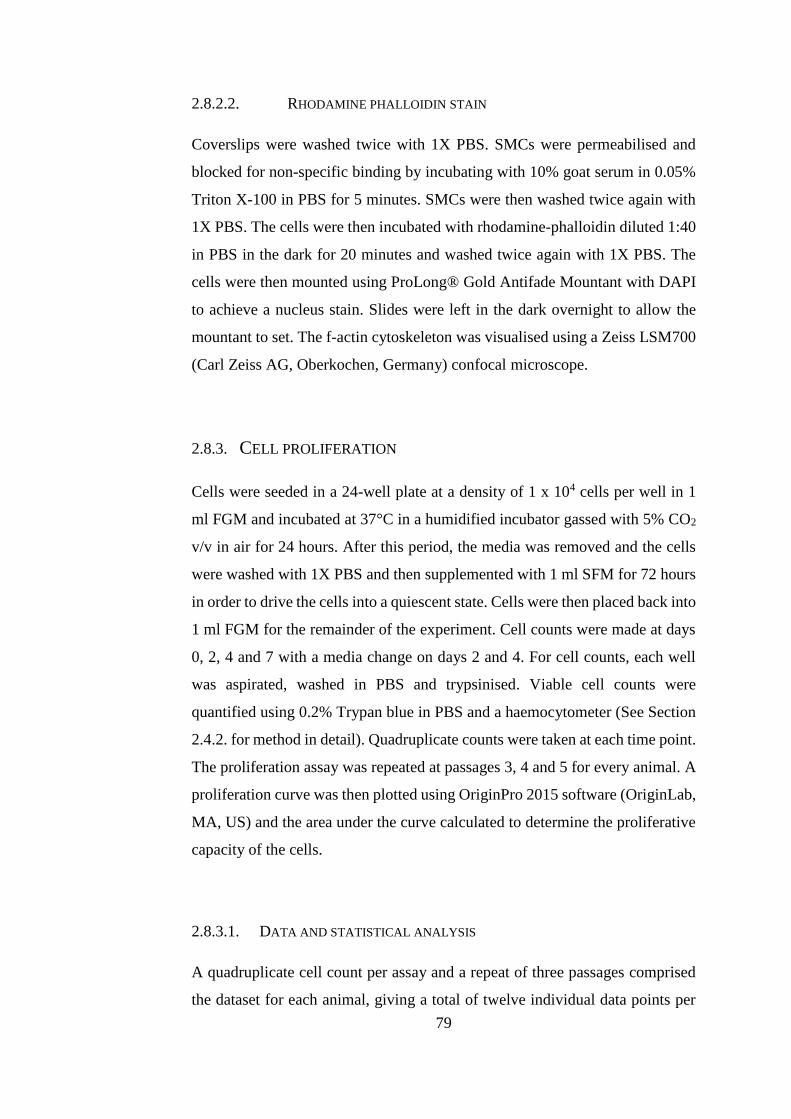
79
2.8.2.2. RHODAMINE PHALLOIDIN STAIN
Coverslips were washed twice with 1X PBS. SMCs were permeabilised and
blocked for non-specific binding by incubating with 10% goat serum in 0.05%
Triton X-100 in PBS for 5 minutes. SMCs were then washed twice again with
1X PBS. The cells were then incubated with rhodamine-phalloidin diluted 1:40
in PBS in the dark for 20 minutes and washed twice again with 1X PBS. The
cells were then mounted using ProLong® Gold Antifade Mountant with DAPI
to achieve a nucleus stain. Slides were left in the dark overnight to allow the
mountant to set. The f-actin cytoskeleton was visualised using a Zeiss LSM700
(Carl Zeiss AG, Oberkochen, Germany) confocal microscope.
2.8.3. CELL PROLIFERATION
Cells were seeded in a 24-well plate at a density of 1 x 10⁴ cells per well in 1
ml FGM and incubated at 37°C in a humidified incubator gassed with 5% CO2
v/v in air for 24 hours. After this period, the media was removed and the cells
were washed with 1X PBS and then supplemented with 1 ml SFM for 72 hours
in order to drive the cells into a quiescent state. Cells were then placed back into
1 ml FGM for the remainder of the experiment. Cell counts were made at days
0, 2, 4 and 7 with a media change on days 2 and 4. For cell counts, each well
was aspirated, washed in PBS and trypsinised. Viable cell counts were
quantified using 0.2% Trypan blue in PBS and a haemocytometer (See Section
2.4.2. for method in detail). Quadruplicate counts were taken at each time point.
The proliferation assay was repeated at passages 3, 4 and 5 for every animal. A
proliferation curve was then plotted using OriginPro 2015 software (OriginLab,
MA, US) and the area under the curve calculated to determine the proliferative
capacity of the cells.
2.8.3.1. DATA AND STATISTICAL ANALYSIS
A quadruplicate cell count per assay and a repeat of three passages comprised
the dataset for each animal, giving a total of twelve individual data points per
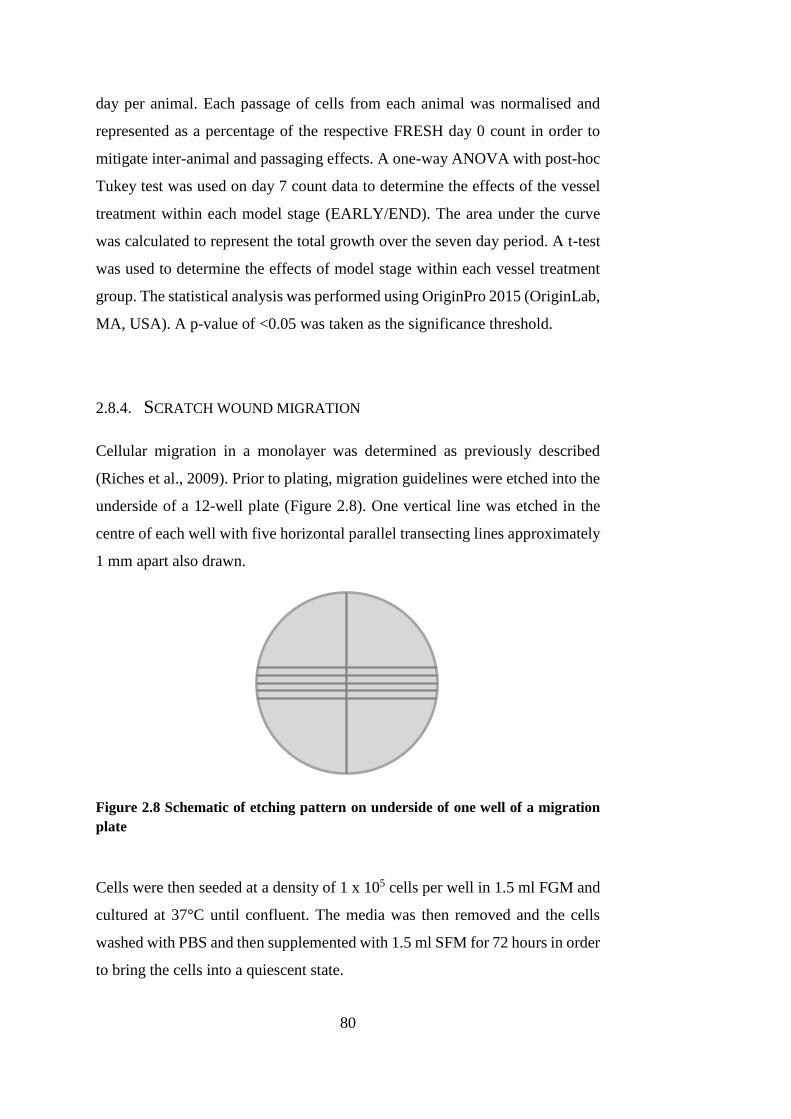
80
day per animal. Each passage of cells from each animal was normalised and
represented as a percentage of the respective FRESH day 0 count in order to
mitigate inter-animal and passaging effects. A one-way ANOVA with post-hoc
Tukey test was used on day 7 count data to determine the effects of the vessel
treatment within each model stage (EARLY/END). The area under the curve
was calculated to represent the total growth over the seven day period. A t-test
was used to determine the effects of model stage within each vessel treatment
group. The statistical analysis was performed using OriginPro 2015 (OriginLab,
MA, USA). A p-value of <0.05 was taken as the significance threshold.
2.8.4. SCRATCH WOUND MIGRATION
Cellular migration in a monolayer was determined as previously described
(Riches et al., 2009). Prior to plating, migration guidelines were etched into the
underside of a 12-well plate (Figure 2.8). One vertical line was etched in the
centre of each well with five horizontal parallel transecting lines approximately
1 mm apart also drawn.
Figure 2.8 Schematic of etching pattern on underside of one well of a migration
plate
Cells were then seeded at a density of 1 x 10⁵ cells per well in 1.5 ml FGM and
cultured at 37°C until confluent. The media was then removed and the cells
washed with PBS and then supplemented with 1.5 ml SFM for 72 hours in order
to bring the cells into a quiescent state.
81
The cell monolayer was then wounded in line with the vertical etched line using
a sterile 10 ml Gilson pipette tip (Figure 2.9). Once an adequate uniform scratch
wound has been achieved, medium was aspirated and wells were washed in PBS
to remove cellular debris and replenished with 1.5 ml SFM.
Images of the four spaces between the transecting horizontal lines were then
taken using brightfield microscopy at this 0 hour (0h) time point; four images
were taken per well. The cells were then aspirated once more and placed into
1.5 ml SGM and incubated at 37°C for 24 hours. This assay was performed in
SGM as it provides a submaximal stimulus compared to FGM (maximal
stimulus) and so any subtle changes in migration were not potentially masked
by the maximal stimulus. After 24 hours, images of each of the same areas were
taken (24h).
Figure 2.9 Confluent monolayers of SMC wounded to give area clear of cells
2.8.4.1. DATA AND STATISTICAL ANALYSIS
Each 0h image was then imported into Microsoft Office along with its
corresponding 24h image and aligned using the guidelines etched onto the
underside of the well. The wound edge was traced, duplicated and translated
1.52 cm towards the vertical etched line – previous study in our laboratory using
Uniform wound in cell monolayer
Etched migration guidelines
82
a microscope and a ruler has shown that 1.52 cm is equivalent to 200 μm. The
number of cells migrated past the 200 μm marker was then recorded. The
distance (in cm) between the etched horizontal guidelines was measured and
converted into actual distance in mm on the plate. Data was displayed as the
number of cells migrated past the 200 μm marker per mm of wound width.
Each count was performed in quadruplicate in 4 wells per condition. Three
animals were used per model stage and counts from passages 3, 4 and 5 were
collected from each animal to give twelve individual data points for each of the
three animals. The mean migration data calculated from the quadruplicate count
was expressed as a percentage of the corresponding FRESH mean migration
data for the same passage in order to mitigate the effects of passaging and
variations between animals. A two-way ANOVA was performed using
OriginPro 2015 (OriginLab, MA, USA). A p-value of <0.05 was taken to be
significant. Effects of SMC orientation were analysed with a one-tailed t-test.
2.8.5. SENESCENCE ASSOCIATED BETA-GALACTOSIDASE STAINING
The Cell Signalling Senescence-associated β-galactosidase (SA-βgal) Staining
Kit detects β-galactosidase at pH6, a known characteristic of senescent cells not
found in presenescent, quiescent or immortal cells. The manufacturer’s
instructions were followed. Briefly, cells were seeded in a 6-well plate at a
density of 7.5 x 10⁴ cells per well in 2 ml FGM and incubated at 37°C in a
humidified incubator gassed with 5% CO2 v/v in air for 24 hours.
After this period, the culture media was aspirated and the cells were washed
with 2 ml 1X PBS per well. The cells were then fixed using the kit Fixative
Solution (20% formaldehyde, 2% gluteraldehyde in 10X PBS). Following two
washes of 1X PBS, 1 ml per well of β-galactosidase Staining Solution (930 µl
400 mM citric acid/sodium phosphate, 1.5 M NaCl, 20 mM MgCl2 + 10 µl 500
mM potassium ferrocyanide + 10 µl 500 mM potassium ferricyanide + 50 µl 5-
bromo-4-chloro-3-indolyl-βD-galactopyranoside (X-gal) in N-N-
dimethylformamide (DMF)) ensuring that the final pH of the staining solution
was between pH5.9 – 6.1. 1 M hydrochloric acid was used to adjust the pH if
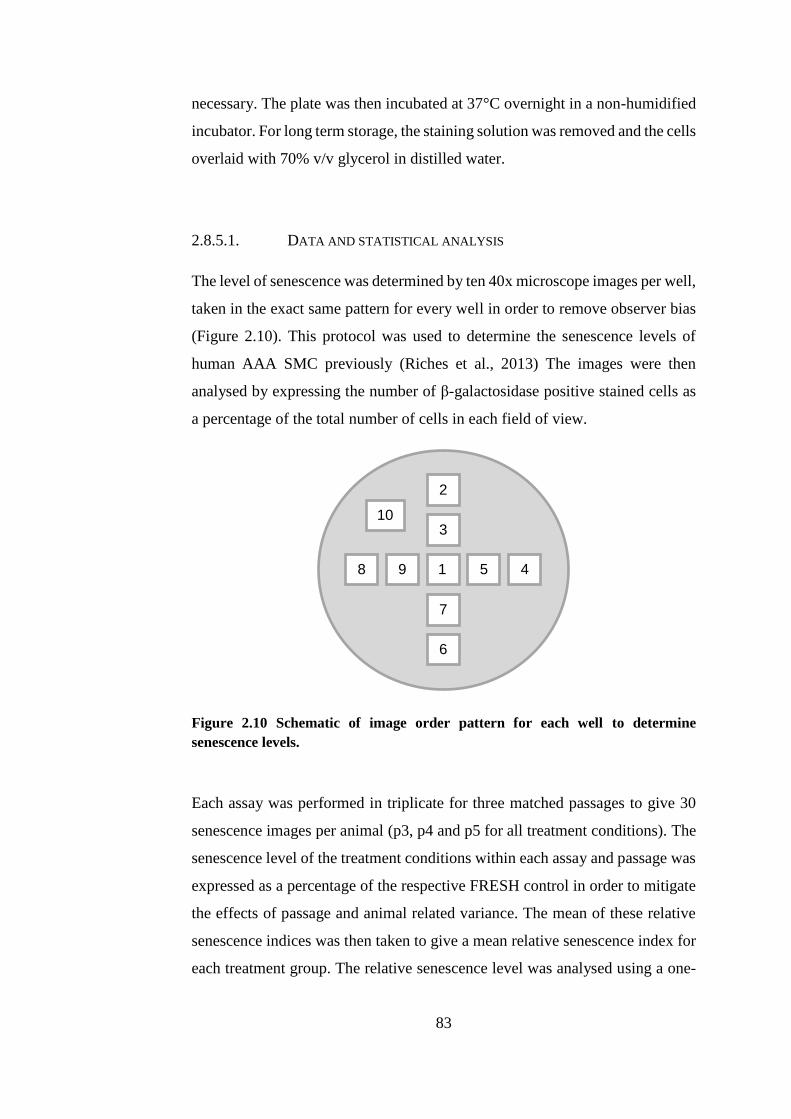
83
necessary. The plate was then incubated at 37°C overnight in a non-humidified
incubator. For long term storage, the staining solution was removed and the cells
overlaid with 70% v/v glycerol in distilled water.
2.8.5.1. DATA AND STATISTICAL ANALYSIS
The level of senescence was determined by ten 40x microscope images per well,
taken in the exact same pattern for every well in order to remove observer bias
(Figure 2.10). This protocol was used to determine the senescence levels of
human AAA SMC previously (Riches et al., 2013) The images were then
analysed by expressing the number of β-galactosidase positive stained cells as
a percentage of the total number of cells in each field of view.
Figure 2.10 Schematic of image order pattern for each well to determine
senescence levels.
Each assay was performed in triplicate for three matched passages to give 30
senescence images per animal (p3, p4 and p5 for all treatment conditions). The
senescence level of the treatment conditions within each assay and passage was
expressed as a percentage of the respective FRESH control in order to mitigate
the effects of passage and animal related variance. The mean of these relative
senescence indices was then taken to give a mean relative senescence index for
each treatment group. The relative senescence level was analysed using a one-
1
2
3
4 5
6
7
8 9
10
84
way ANOVA per treatment group with a post-hoc Tukey test. A p-value of
<0.05 was taken to denote statistical significance.
2.8.6. GELATIN ZYMOGRAPHY
Gelatin zymography allows analysis of levels of secreted matrix
metalloproteinases (MMP) on a gelatin based acrylamide gel. MMP activity is
visualised by clear bands of lysis on a stained dark background.
The effect of treatment group and model stage on stimulated, as well as basal
level, secretion was also investigated in order to explore their effects on reaction
to normal stimuli. A known stimulus of MMP secretion, phorbol ester (12-O-
Tetradecanoylphorbol-13-acetate), and a more physiologically relevant
combination of pro-inflammatory cytokines – platelet-derived growth factor
(PDGF) and interleukin-1α (IL-1α) – were used to investigate changes in
secretion in response to these stimuli.
2.8.6.1. COLLECTION OF CONDITIONED MEDIA
SMCs were seeded at a density of 2 x 10⁵ cells per 25 cm2 flask and cultured in
4 ml FGM in a humidified incubator at 37°C and gassed with 5% CO2 v/v in air
for 24 hours. Per condition, three separate flasks were needed. The media was
then removed, the SMCs washed with PBS and then supplemented with SFM
for 72 hours to bring them into a quiescent state. Each of the three flasks per
experimental condition was then subjected to either a vehicle control, 12-O-
Tetradecanoylphorbol-13-acetate (TPA) or a combination of PDGF and IL-1α
as shown in Table 2.3.
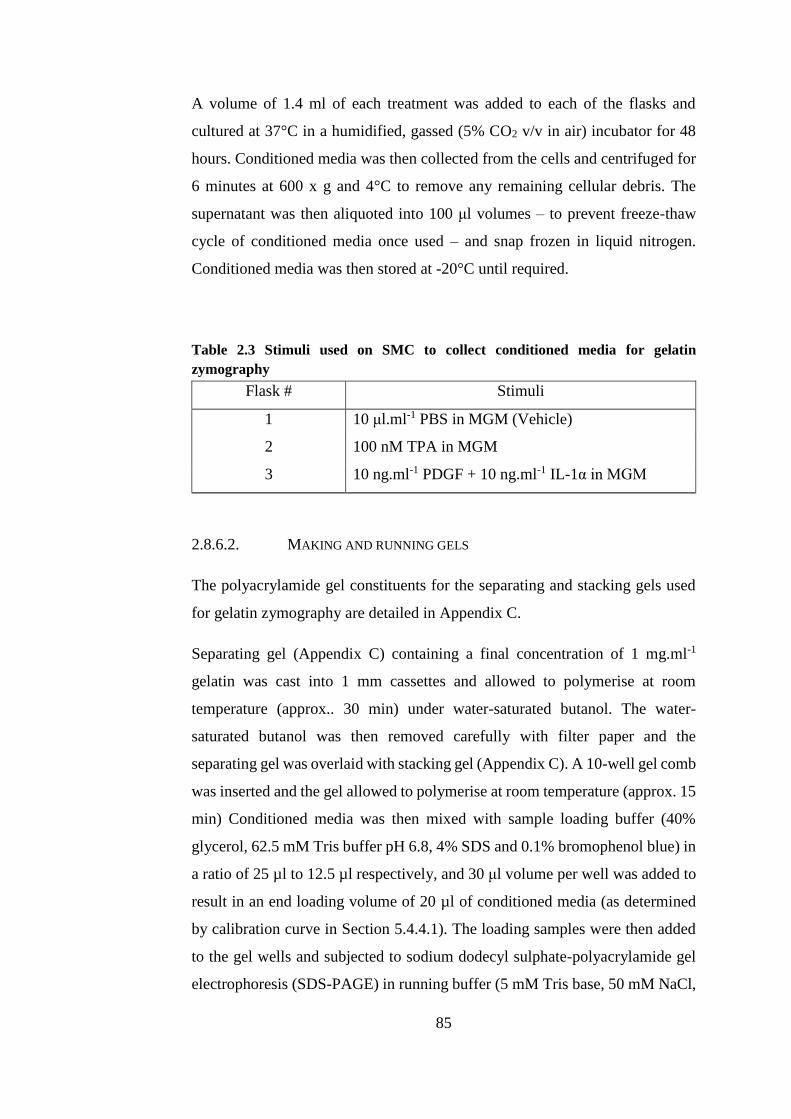
85
A volume of 1.4 ml of each treatment was added to each of the flasks and
cultured at 37°C in a humidified, gassed (5% CO2 v/v in air) incubator for 48
hours. Conditioned media was then collected from the cells and centrifuged for
6 minutes at 600 x g and 4°C to remove any remaining cellular debris. The
supernatant was then aliquoted into 100 μl volumes – to prevent freeze-thaw
cycle of conditioned media once used – and snap frozen in liquid nitrogen.
Conditioned media was then stored at -20°C until required.
Table 2.3 Stimuli used on SMC to collect conditioned media for gelatin
zymography
2.8.6.2. MAKING AND RUNNING GELS
The polyacrylamide gel constituents for the separating and stacking gels used
for gelatin zymography are detailed in Appendix C.
Separating gel (Appendix C) containing a final concentration of 1 mg.ml-1
gelatin was cast into 1 mm cassettes and allowed to polymerise at room
temperature (approx.. 30 min) under water-saturated butanol. The water-
saturated butanol was then removed carefully with filter paper and the
separating gel was overlaid with stacking gel (Appendix C). A 10-well gel comb
was inserted and the gel allowed to polymerise at room temperature (approx. 15
min) Conditioned media was then mixed with sample loading buffer (40%
glycerol, 62.5 mM Tris buffer pH 6.8, 4% SDS and 0.1% bromophenol blue) in
a ratio of 25 µl to 12.5 µl respectively, and 30 μl volume per well was added to
result in an end loading volume of 20 µl of conditioned media (as determined
by calibration curve in Section 5.4.4.1). The loading samples were then added
to the gel wells and subjected to sodium dodecyl sulphate-polyacrylamide gel
electrophoresis (SDS-PAGE) in running buffer (5 mM Tris base, 50 mM NaCl,
Flask # Stimuli
1 10 μl.ml-1 PBS in MGM (Vehicle)
2 100 nM TPA in MGM
3 10 ng.ml-1 PDGF + 10 ng.ml-1 IL-1α in MGM
86
0.02% SDS) for 110 minutes at 120 V. The gels were then removed from the
electrophoresis apparatus and washed three times in 2.5% Triton X-100 for 20
minutes on a rocker to remove the SDS and allow the MMPs to renature. The
gels were then incubated with incubation buffer to allow MMP digestion of the
gelatin substrate (5mM Tris base, 1% CaCl2, 5 mM NaCl, 0.5% Brij-35, pH 7.6)
for 26 hours in a non-gassed dry incubator at 37°C.
Visualisation of gelatinolytic activity was achieved by staining the gels with
Coomassie Blue (25% methanol, 10% glacial acetic acid, 0.02% w/v Coomassie
Brilliant Blue) for 20 minutes. Gelatinolytic activity was seen as clear bands of
digested gelatin on a bright blue background of intact substrate.
2.8.6.3. DATA AND STATISTICAL ANALYSIS
Densitometry of the total levels of gelatin digestion was conducted using the
Analyze Gels tool in ImageJ (http://imagej.nih.gov/ij/). The total level of gelatin
digestion was expressed as a percentage of the respective FRESH control for
each of the three animals to give a relative total MMP level for the EARLY and
END models. A three-way ANOVA was used to measure significance between
model stage (EARLY / END), treatment condition (FRESH /BIOVEH
/BIOCCE), stimulus (VEH /TPA /PDGF+IL-1α) and any interaction between
the levels. A post-hoc Tukey test was performed for direct means comparison
and a p-value of <0.05 was taken to denote statistical significance.
2.8.6.4. HT1080 CELL LINE
Each of the gels were subjected to SDS-PAGE with a well containing a sample
of conditioned media from the HT-1080 cell line. This is a human fibrosarcoma
line originally derived from biopsy of a 35 year old Caucasian male in 1972
who presented with metastatic tumour and received no chemotherapy or
radiotherapy. These highly invasive tumorigenic cells constitutively secrete
high levels of MMP-2 and MMP-9 which are involved with basement
87
membrane degradation (Giambernardi et al., 1998). This cell line serves as a
useful reference for MMP-2 and MMP-9 secretion during zymography.
2.9. BIOMECHANICAL CHARACTERISATION
As described in Section 1.4, the arterial wall is composed of three distinct layers:
the intima, media and adventitia. Alongside the individual cell types residing
within the arterial wall, collagen and elastin fibres form the extracellular matrix
and contribute to the bi-phasic strain-dependent material behaviour of the
arterial wall (He and Roach, 1994, Bank et al., 1996, Kobielarz and Jankowski,
2013). The artery itself exhibits anisotropic behaviour due to the circumferential
arrangement of cells and extracellular matrix fibres in the media hence it is
important to evaluate the mechanical behaviour in both directions (Gasser et al.,
2006, Geest et al., 2006).
In the human disease the effect of aneurysm is to decrease the strength of the
arterial wall whilst inducing stiffening of the aorta, especially in the
circumferential direction (He and Roach, 1994, Raghavan et al., 1996,
Thubrikar et al., 2001, Geest et al., 2006). With this in mind, the aim of this part
of the study was to characterise the mechanical behaviour of the end-stage ex
vivo model and validate this against human data reported in the literature.
Encompassed within this aim was also the characterisation of the protease pre-
treatment so that the state of the biomechanical properties of the artery prior to
any culture (and therefore any active remodelling role of the SMC) in the
bioreactor were known and understood. Uniaxial tensile testing in longitudinal
and circumferential orientations was used in order to understand the inherent
mechanical properties within the artery. Dilation burst-pressure testing was used
alongside this to assess the behaviour of the artery as it exists physiologically,
as a whole organ.
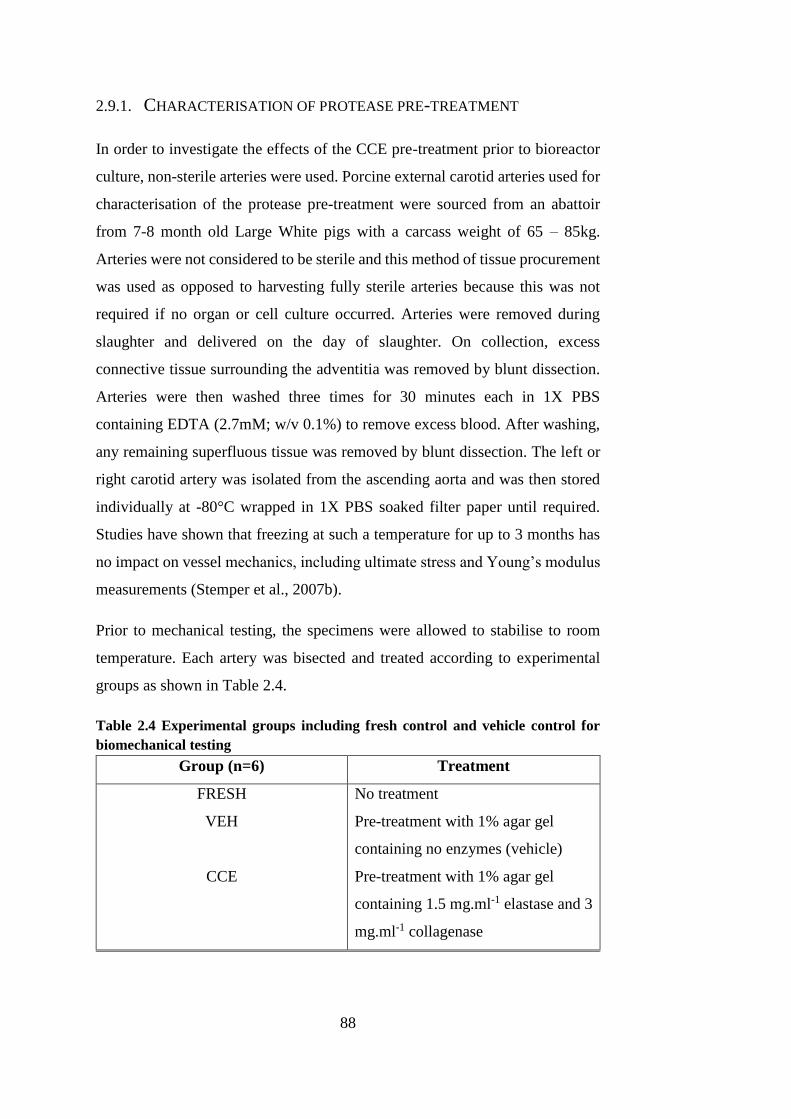
88
2.9.1. CHARACTERISATION OF PROTEASE PRE-TREATMENT
In order to investigate the effects of the CCE pre-treatment prior to bioreactor
culture, non-sterile arteries were used. Porcine external carotid arteries used for
characterisation of the protease pre-treatment were sourced from an abattoir
from 7-8 month old Large White pigs with a carcass weight of 65 – 85kg.
Arteries were not considered to be sterile and this method of tissue procurement
was used as opposed to harvesting fully sterile arteries because this was not
required if no organ or cell culture occurred. Arteries were removed during
slaughter and delivered on the day of slaughter. On collection, excess
connective tissue surrounding the adventitia was removed by blunt dissection.
Arteries were then washed three times for 30 minutes each in 1X PBS
containing EDTA (2.7mM; w/v 0.1%) to remove excess blood. After washing,
any remaining superfluous tissue was removed by blunt dissection. The left or
right carotid artery was isolated from the ascending aorta and was then stored
individually at -80°C wrapped in 1X PBS soaked filter paper until required.
Studies have shown that freezing at such a temperature for up to 3 months has
no impact on vessel mechanics, including ultimate stress and Young’s modulus
measurements (Stemper et al., 2007b).
Prior to mechanical testing, the specimens were allowed to stabilise to room
temperature. Each artery was bisected and treated according to experimental
groups as shown in Table 2.4.
Table 2.4 Experimental groups including fresh control and vehicle control for
biomechanical testing
Group (n=6) Treatment
FRESH No treatment
VEH Pre-treatment with 1% agar gel
containing no enzymes (vehicle)
CCE Pre-treatment with 1% agar gel
containing 1.5 mg.ml-1 elastase and 3
mg.ml-1 collagenase
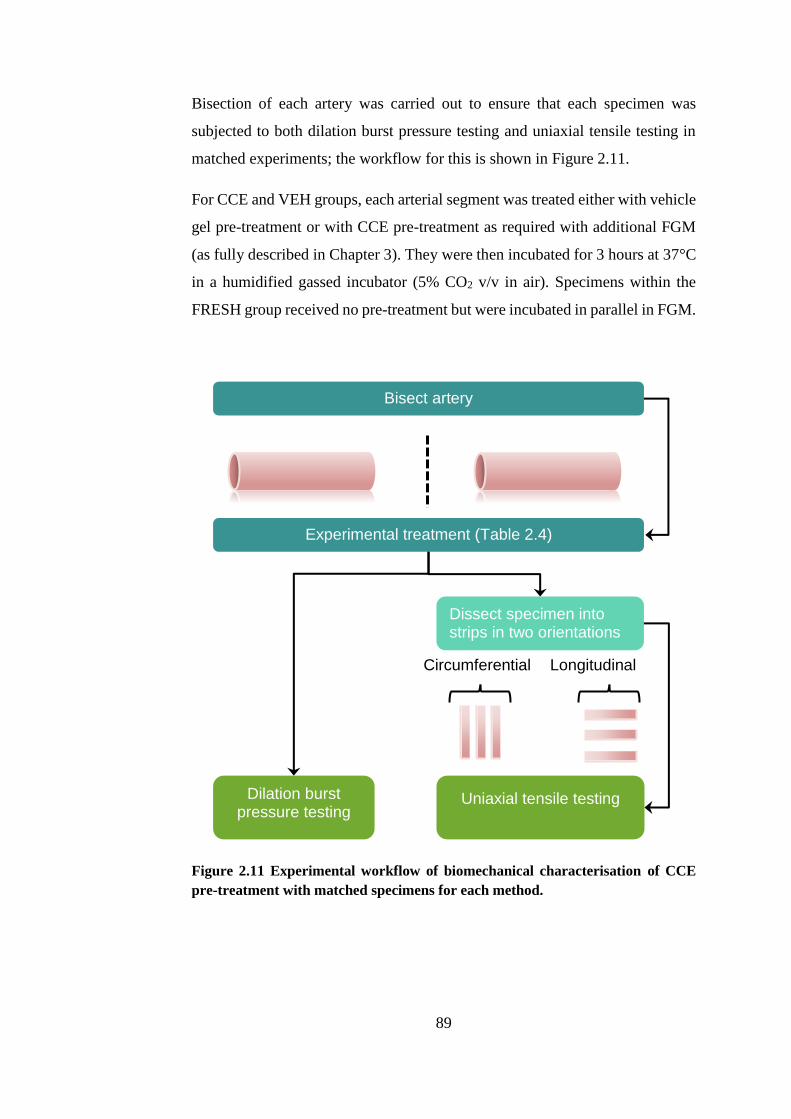
89
Bisection of each artery was carried out to ensure that each specimen was
subjected to both dilation burst pressure testing and uniaxial tensile testing in
matched experiments; the workflow for this is shown in Figure 2.11.
For CCE and VEH groups, each arterial segment was treated either with vehicle
gel pre-treatment or with CCE pre-treatment as required with additional FGM
(as fully described in Chapter 3). They were then incubated for 3 hours at 37°C
in a humidified gassed incubator (5% CO2 v/v in air). Specimens within the
FRESH group received no pre-treatment but were incubated in parallel in FGM.
Figure 2.11 Experimental workflow of biomechanical characterisation of CCE
pre-treatment with matched specimens for each method.
Dilation burst pressure testing
Uniaxial tensile testing
Circumferential
Longitudinal
Experimental treatment (Table 2.4)
Dissect specimen into strips in two orientations
Bisect artery
90
2.9.2. UNIAXIAL TENSILE TESTING
The specimens destined for uniaxial tensile testing were divided into
circumferential (C) and longitudinal (L) test strips of at least three per group as
shown in Figure 2.12. The circumferentially orientated tissue strips were always
taken from the distal section of the arteries, as this has a slightly larger diameter
than the proximal part. Longitudinally orientated tissue strips were always taken
from the proximal part of the artery. This was done as it was necessary for the
circumference to be at least 6mm with extra for the tissue to be gripped in the
tensile testing equipment. A tissue cutter of parallel razor blades mounted in a
cutting block was used to cut the test strips to 3 mm in width and 6 mm gauge
length (Figure 2.13). Rectangular shaped strips were used as opposed to
dumbbell shaped tissue strips in order to maximise the tissue yield per artery.
The dimensions of the tissue testing strips were chosen as these were the
smallest possible with the existing tissue grips for the tensile testing equipment.
The thickness of each strip was measured in three places using a digital
micrometer and the mean value was calculated and recorded. The samples were
kept moist with PBS during specimen preparation and testing. The tissue strips
were not subjected to any preload or preconditioning regime. Preload can mask
the inherent properties in the tissue in the elastin phase by starting the data
collection at an arbitrary value rather than the true relaxed state of the tissue.
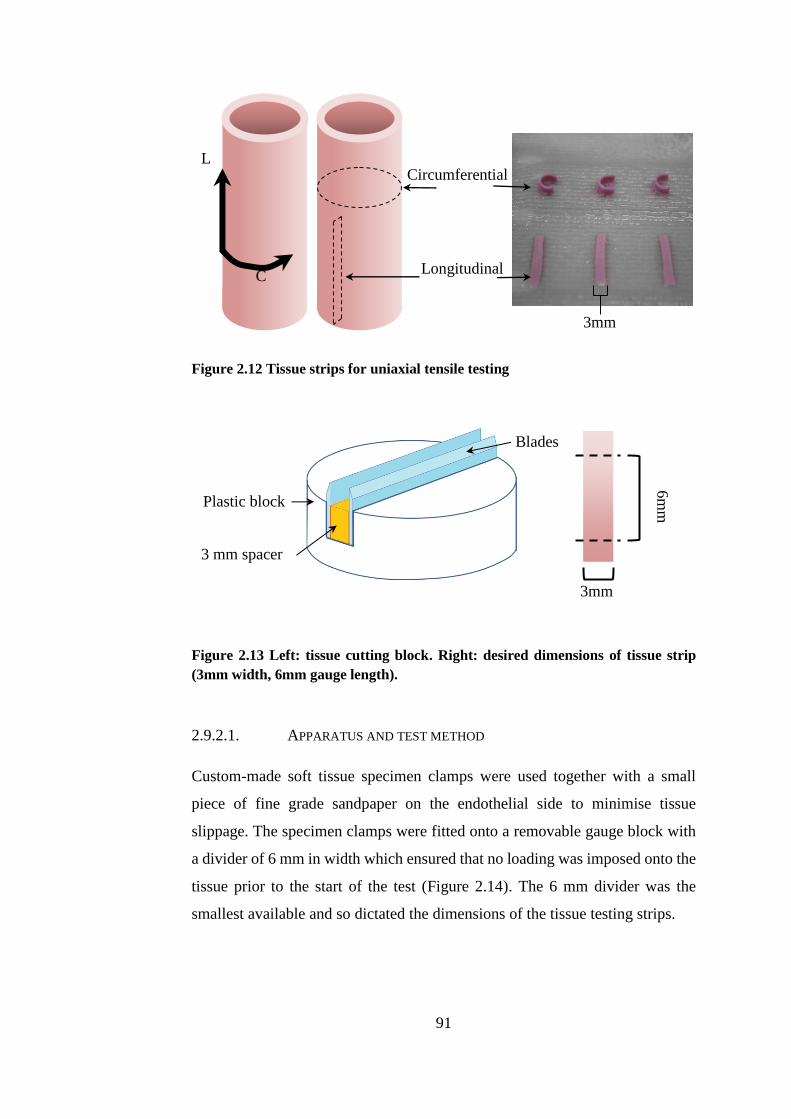
91
Figure 2.12 Tissue strips for uniaxial tensile testing
Figure 2.13 Left: tissue cutting block. Right: desired dimensions of tissue strip
(3mm width, 6mm gauge length).
2.9.2.1. APPARATUS AND TEST METHOD
Custom-made soft tissue specimen clamps were used together with a small
piece of fine grade sandpaper on the endothelial side to minimise tissue
slippage. The specimen clamps were fitted onto a removable gauge block with
a divider of 6 mm in width which ensured that no loading was imposed onto the
tissue prior to the start of the test (Figure 2.14). The 6 mm divider was the
smallest available and so dictated the dimensions of the tissue testing strips.
L
C
Longitudinal
Circumferential
3mm
Plastic block
3 mm spacer
Blades
3mm
6m
m
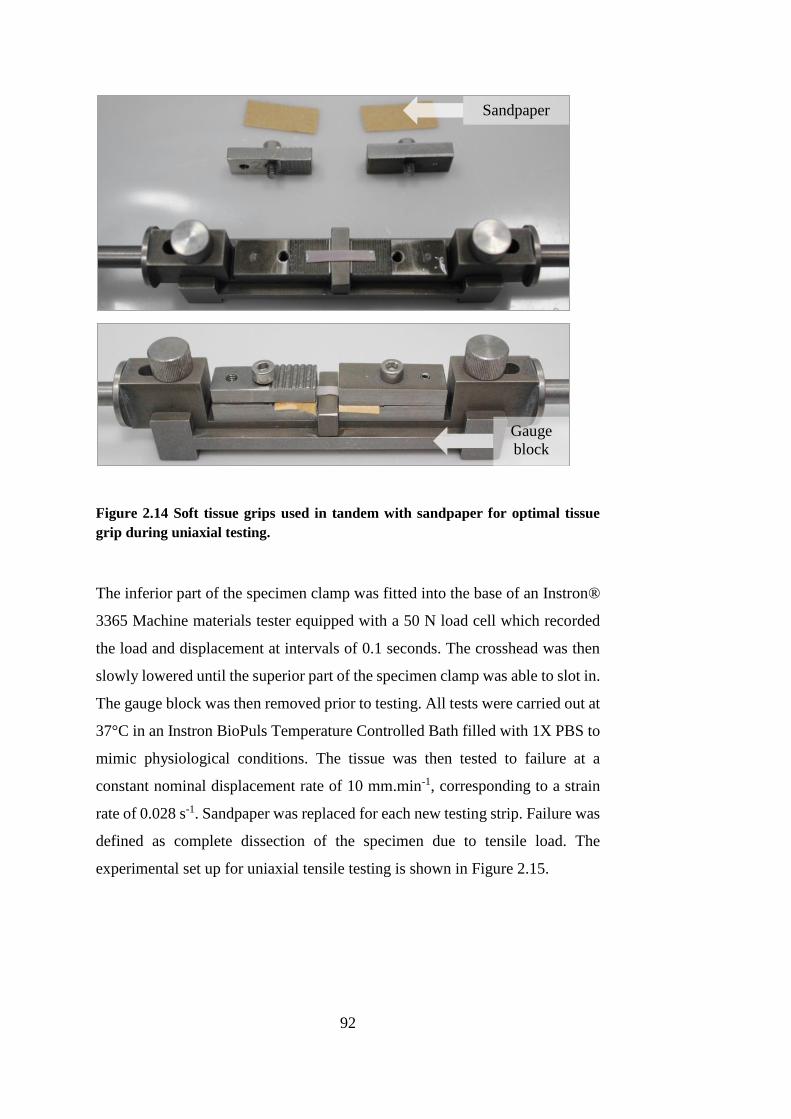
92
Figure 2.14 Soft tissue grips used in tandem with sandpaper for optimal tissue
grip during uniaxial testing.
The inferior part of the specimen clamp was fitted into the base of an Instron®
3365 Machine materials tester equipped with a 50 N load cell which recorded
the load and displacement at intervals of 0.1 seconds. The crosshead was then
slowly lowered until the superior part of the specimen clamp was able to slot in.
The gauge block was then removed prior to testing. All tests were carried out at
37°C in an Instron BioPuls Temperature Controlled Bath filled with 1X PBS to
mimic physiological conditions. The tissue was then tested to failure at a
constant nominal displacement rate of 10 mm.min-1, corresponding to a strain
rate of 0.028 s-1. Sandpaper was replaced for each new testing strip. Failure was
defined as complete dissection of the specimen due to tensile load. The
experimental set up for uniaxial tensile testing is shown in Figure 2.15.
Gauge
block
Sandpaper
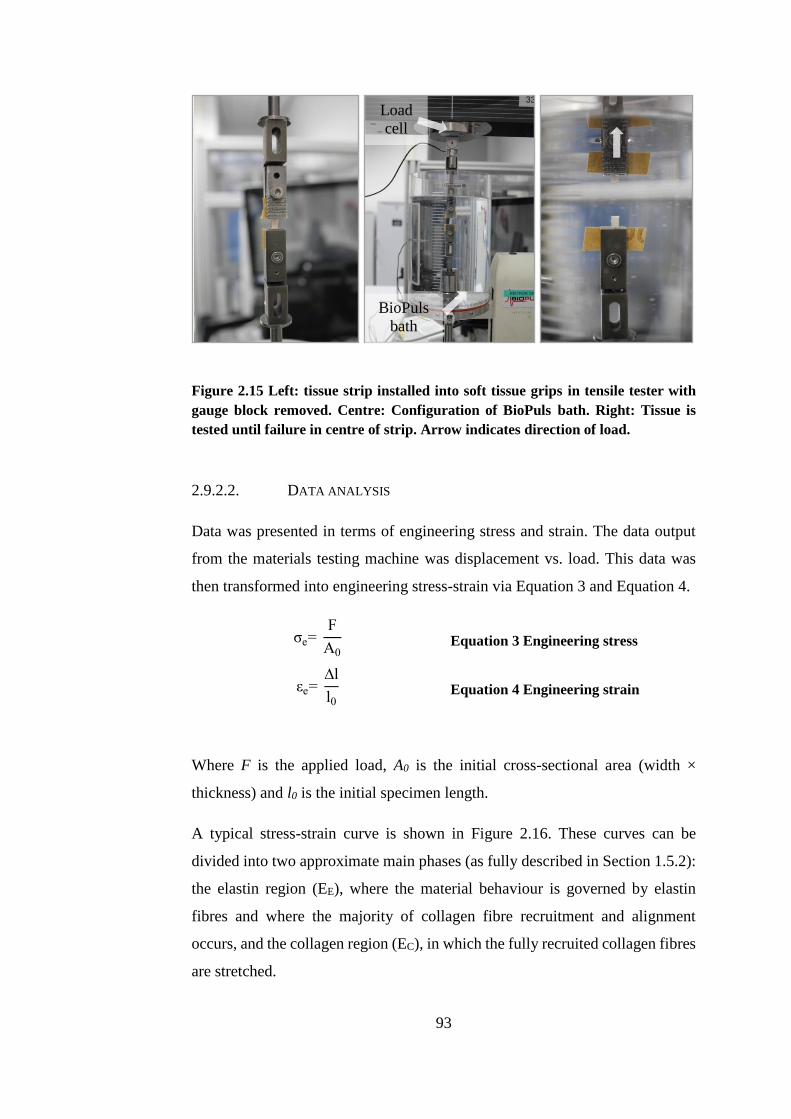
93
Figure 2.15 Left: tissue strip installed into soft tissue grips in tensile tester with
gauge block removed. Centre: Configuration of BioPuls bath. Right: Tissue is
tested until failure in centre of strip. Arrow indicates direction of load.
2.9.2.2. DATA ANALYSIS
Data was presented in terms of engineering stress and strain. The data output
from the materials testing machine was displacement vs. load. This data was
then transformed into engineering stress-strain via Equation 3 and Equation 4.
σe= F
A0
Equation 3 Engineering stress
εe= ∆l
l0 Equation 4 Engineering strain
Where F is the applied load, A0 is the initial cross-sectional area (width ×
thickness) and l0 is the initial specimen length.
A typical stress-strain curve is shown in Figure 2.16. These curves can be
divided into two approximate main phases (as fully described in Section 1.5.2):
the elastin region (EE), where the material behaviour is governed by elastin
fibres and where the majority of collagen fibre recruitment and alignment
occurs, and the collagen region (EC), in which the fully recruited collagen fibres
are stretched.
BioPuls
bath
Load
cell
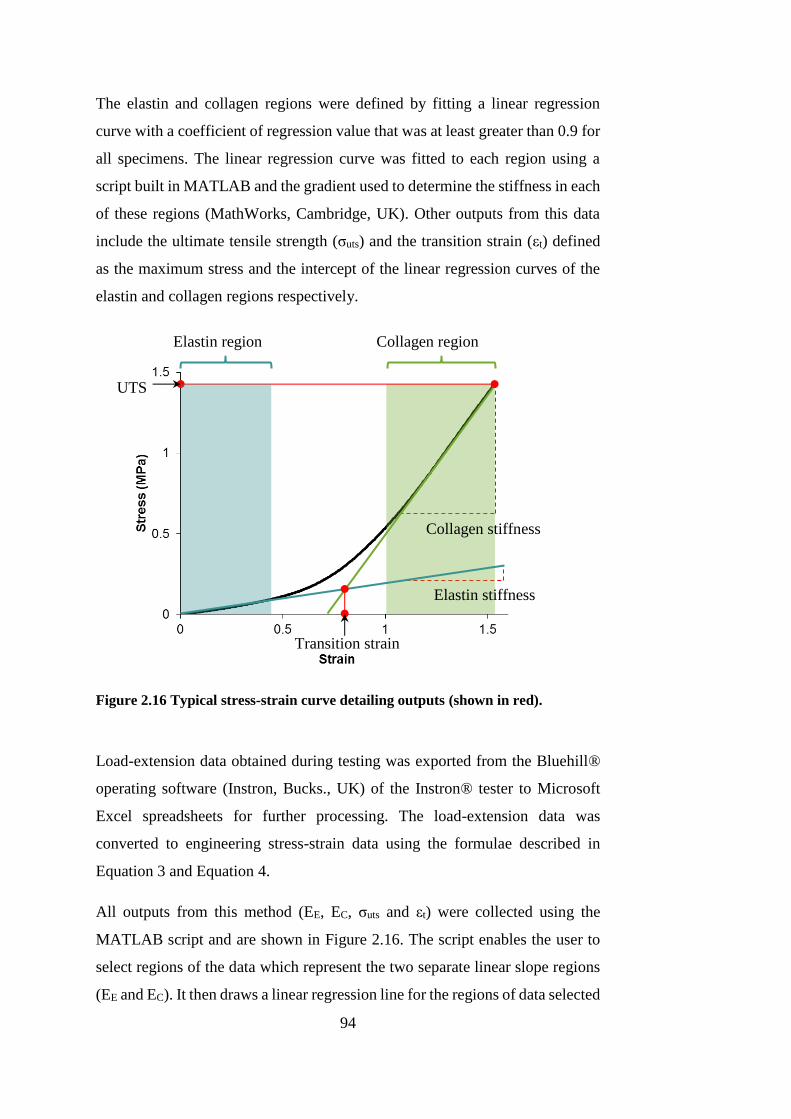
94
The elastin and collagen regions were defined by fitting a linear regression
curve with a coefficient of regression value that was at least greater than 0.9 for
all specimens. The linear regression curve was fitted to each region using a
script built in MATLAB and the gradient used to determine the stiffness in each
of these regions (MathWorks, Cambridge, UK). Other outputs from this data
include the ultimate tensile strength (σuts) and the transition strain (εt) defined
as the maximum stress and the intercept of the linear regression curves of the
elastin and collagen regions respectively.
Figure 2.16 Typical stress-strain curve detailing outputs (shown in red).
Load-extension data obtained during testing was exported from the Bluehill®
operating software (Instron, Bucks., UK) of the Instron® tester to Microsoft
Excel spreadsheets for further processing. The load-extension data was
converted to engineering stress-strain data using the formulae described in
Equation 3 and Equation 4.
All outputs from this method (EE, EC, σuts and εt) were collected using the
MATLAB script and are shown in Figure 2.16. The script enables the user to
select regions of the data which represent the two separate linear slope regions
(EE and EC). It then draws a linear regression line for the regions of data selected
Elastin region Collagen region
UTS
Elastin stiffness
Transition strain
Collagen stiffness
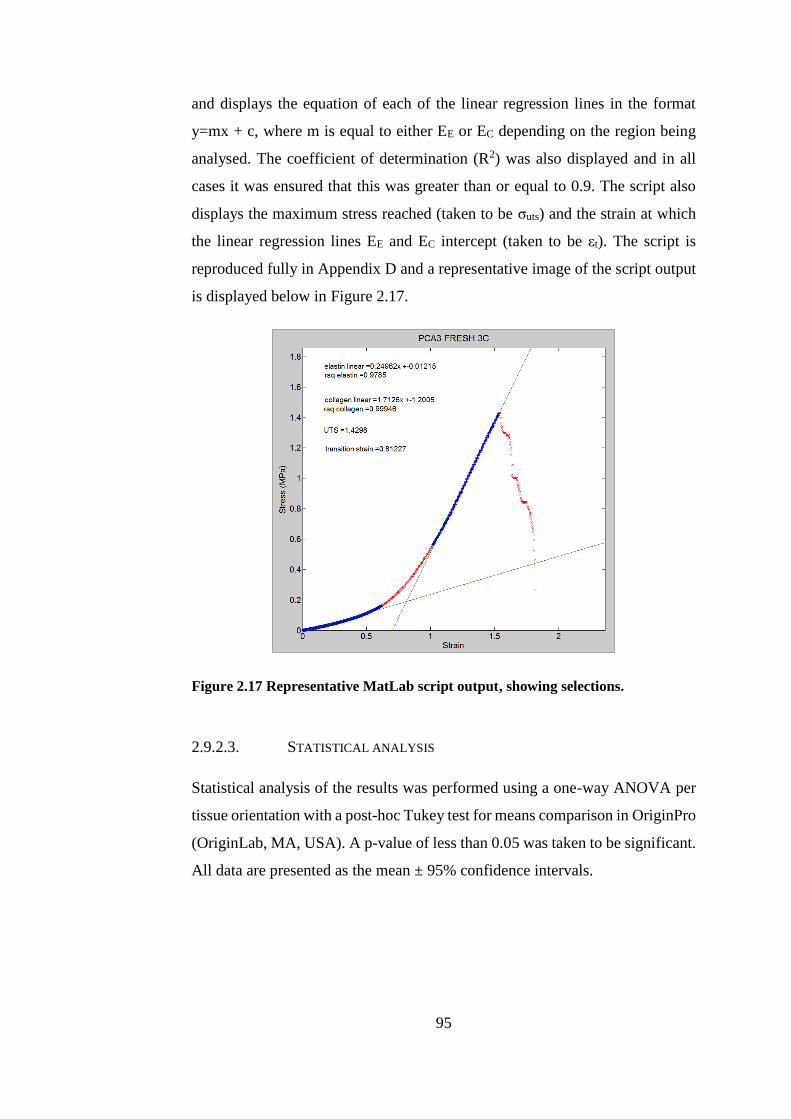
95
and displays the equation of each of the linear regression lines in the format
y=mx + c, where m is equal to either EE or EC depending on the region being
analysed. The coefficient of determination (R2) was also displayed and in all
cases it was ensured that this was greater than or equal to 0.9. The script also
displays the maximum stress reached (taken to be σuts) and the strain at which
the linear regression lines EE and EC intercept (taken to be εt). The script is
reproduced fully in Appendix D and a representative image of the script output
is displayed below in Figure 2.17.
Figure 2.17 Representative MatLab script output, showing selections.
2.9.2.3. STATISTICAL ANALYSIS
Statistical analysis of the results was performed using a one-way ANOVA per
tissue orientation with a post-hoc Tukey test for means comparison in OriginPro
(OriginLab, MA, USA). A p-value of less than 0.05 was taken to be significant.
All data are presented as the mean ± 95% confidence intervals.
96
2.9.3. DILATION BURST PRESSURE TESTING
One section of each treated artery was tested whole for dilation analysis so as
to match all data with that from uniaxial tensile testing analysis (Figure 2.11).
The dilation testing rig is shown in Figure 2.18.
The artery was left whole and tested for leakage using a syringe filled with 1X
PBS. If no leaks were apparent in the vessel, it was painted with blue tissue dye
to ensure high contrast for image analysis. The vessel was then secured to a hose
barb using cable ties and catgut. The hose barb was then inserted into a push fit
connector so that the vessel sat within a clear Perspex chamber. A 10 g weight
was attached to the free end of the vessel to exert a 0.1 N longitudinal pre-load
to vessel to ensure that it remained horizontal throughout the experiment.
Previous investigation has shown that 10 g is the optimum weight to use (Jake
Milton Barker, iMBE SOP). A volume of 120 ml of 1X PBS was syringed into
the compliance chamber and the air supply tube connected to the rig. A camera
was set up on a tripod so that both the calibration rule and the digital display of
the pressure gauge was within the field of view and so the exact pressure at the
instant the image was taken was recorded. The pressure meter was then set to 0
mmHg.
The air supply valve was turned on such that the pressure through the vessel
slowly increased at a constant rate. Images were taken on the camera at
approximate 20 mmHg intervals up to 180 mmHg. Post-180 mmHg, the display
on the pressure gauge was changed to record the maximum pressure reached.
The pressure was then increased at a constant rate until either rupture of the
vessel or the pressure reached 5000 mmHg. The burst pressure was then
recorded and the air supply quickly turned off.
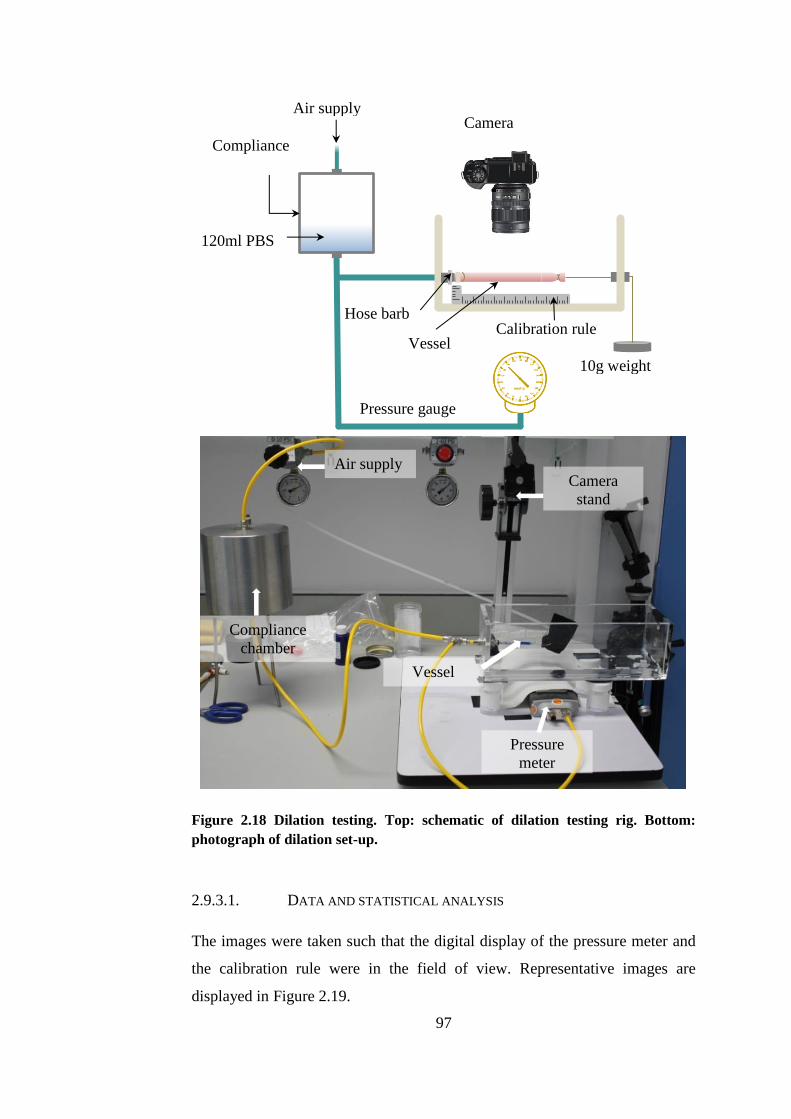
97
Figure 2.18 Dilation testing. Top: schematic of dilation testing rig. Bottom:
photograph of dilation set-up.
2.9.3.1. DATA AND STATISTICAL ANALYSIS
The images were taken such that the digital display of the pressure meter and
the calibration rule were in the field of view. Representative images are
displayed in Figure 2.19.
Camera
stand
Pressure
meter
Compliance
chamber
Air supply
Vessel
120ml PBS
Air supply
Pressure gauge
Compliance
chamber
10g weight
Camera
(Fixed position)
Calibration rule Hose barb
Vessel
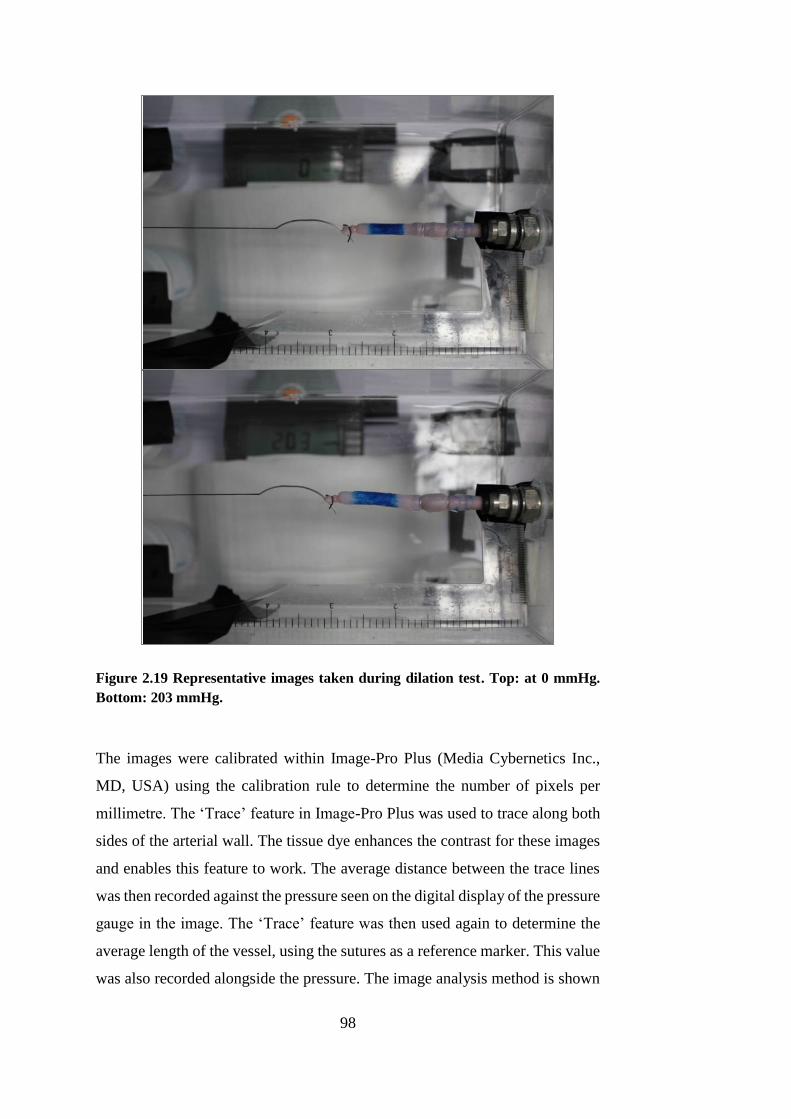
98
Figure 2.19 Representative images taken during dilation test. Top: at 0 mmHg.
Bottom: 203 mmHg.
The images were calibrated within Image-Pro Plus (Media Cybernetics Inc.,
MD, USA) using the calibration rule to determine the number of pixels per
millimetre. The ‘Trace’ feature in Image-Pro Plus was used to trace along both
sides of the arterial wall. The tissue dye enhances the contrast for these images
and enables this feature to work. The average distance between the trace lines
was then recorded against the pressure seen on the digital display of the pressure
gauge in the image. The ‘Trace’ feature was then used again to determine the
average length of the vessel, using the sutures as a reference marker. This value
was also recorded alongside the pressure. The image analysis method is shown
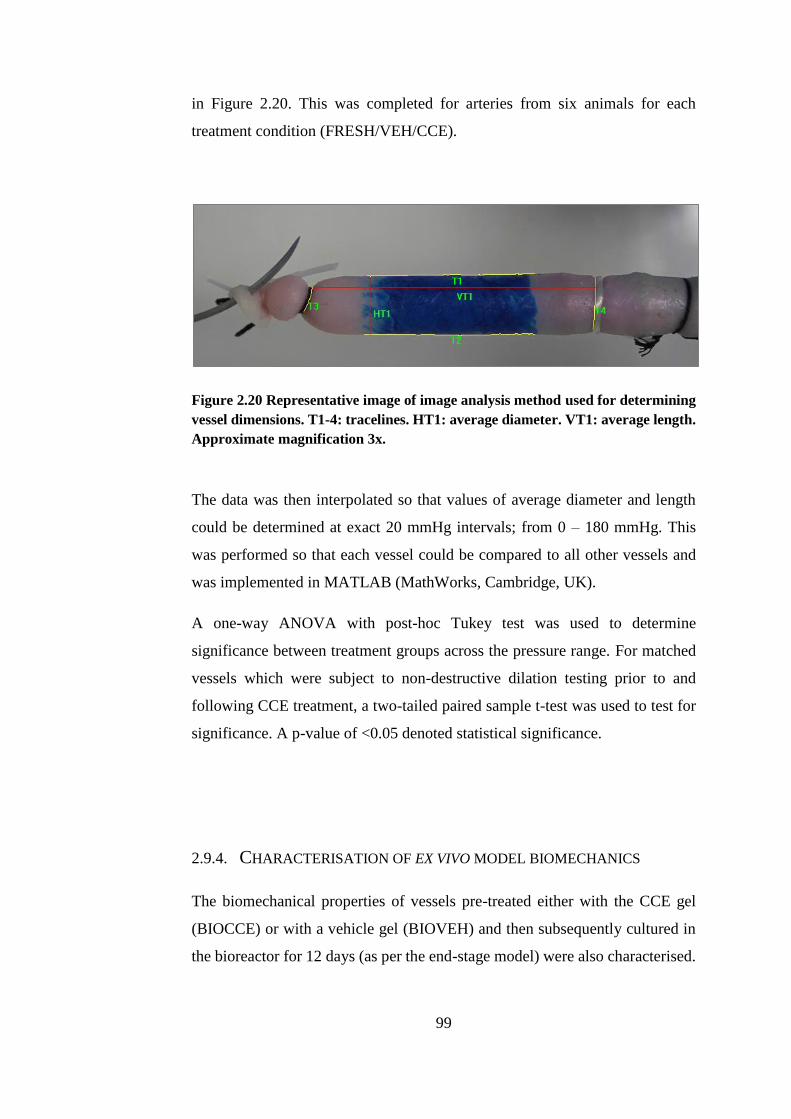
99
in Figure 2.20. This was completed for arteries from six animals for each
treatment condition (FRESH/VEH/CCE).
Figure 2.20 Representative image of image analysis method used for determining
vessel dimensions. T1-4: tracelines. HT1: average diameter. VT1: average length.
Approximate magnification 3x.
The data was then interpolated so that values of average diameter and length
could be determined at exact 20 mmHg intervals; from 0 – 180 mmHg. This
was performed so that each vessel could be compared to all other vessels and
was implemented in MATLAB (MathWorks, Cambridge, UK).
A one-way ANOVA with post-hoc Tukey test was used to determine
significance between treatment groups across the pressure range. For matched
vessels which were subject to non-destructive dilation testing prior to and
following CCE treatment, a two-tailed paired sample t-test was used to test for
significance. A p-value of <0.05 denoted statistical significance.
2.9.4. CHARACTERISATION OF EX VIVO MODEL BIOMECHANICS
The biomechanical properties of vessels pre-treated either with the CCE gel
(BIOCCE) or with a vehicle gel (BIOVEH) and then subsequently cultured in
the bioreactor for 12 days (as per the end-stage model) were also characterised.

100
This was carried out using the same method for uniaxial tensile testing described
in Section 2.9.2.
Three animals were used for these experiments, with both carotid arteries from
each animal, providing a contralateral control. A total of three arteries were used
for each treatment group (BIOVEH/BIOCCE).

101
CHAPTER 3
EX VIVO MODEL OF AAA
102
CHAPTER 3 EX VIVO MODEL OF AAA
This chapter describes the methodology used to generate an experimental AAA
model using porcine carotid arteries in a dynamic flow bioreactor. The first
section details the experimental groups throughout this project, including the
various controls used for model validation. The vessel pre-treatment used to
experimentally induce SMC with an aneurysmal phenotype and the
configuration of the bioreactor are also detailed within this chapter.
The bioreactor system used in the present study was used to impart flow-related
mechanical forces through the arterial wall ex vivo in order to mimic the
physiological forces present in vivo.
The bioreactor used in this study is existing equipment and was built and
designed by Sotirios Korossis of the Institute of Medical and Biological
Engineering at the University of Leeds (Riches et al., 2013). The surgical
removal of the tissue was carried out by Marc Bailey, Katy Bridge and Kathryn
Griffin variously in pairs. Animal sacrifice was carried out under Schedule 1 to
the Animals (Scientific Procedures) Act 1986 by Central Biomedical Services
technicians and veterinarian.
3.1. INTRODUCTION
Experimental models of disease are essential for elucidating mechanisms of
pathogenesis, therapeutics and treatment. Their importance is, perhaps, even
more significant in AAA disease because its tendency to only be detected
clinically once the aorta has dilated significantly: at end-stage disease.
Experimental models are required to investigate the processes involved before
the artery reaches a critical size where rupture becomes a problem.
Genetic, physical and chemical animal models have been developed and used
for investigations for a number of years (Trollope et al., 2011). Almost three
decades ago, peri-adventitial elastase treatment was first used in mice to induce
an experimental AAA, and this has since progressed to using a combination of
103
collagenase or flow disturbance and elastase when translating the methodology
to large animals (Anidjar et al., 1990, Goericke et al., 2009, Moláček et al.,
2009, Kloster et al., 2015).
Early research concentrated on small animal models due to their relatively low
cost, genetic malleability and ease of husbandry. Large animal models are
desirable due to a more closely matched geometry and physiology to humans,
but these are limited by practical requirements such as housing and handling
costs. The advent of bioreactors has, in recent years, enabled large animal tissue
to be studied ex vivo without the practicalities and logistics of keeping large
animals, by mimicking the physiological environment for a small tissue
construct (Yazdani and Berry, 2009, Touroo and Williams, 2012).
The aim of this chapter is to describe the methodology used to create a
chemically induced ex vivo porcine tissue AAA model in a bioreactor. The
bioreactor enables media to flow through the lumen of the artery, imparting
shear stress and intraluminal pressure on the SMCs and endothelial cells, whilst
maintaining tissue viability for up to 12 days.
3.2. MATERIALS AND REAGENTS
3.2.1. REAGENTS
The supplier details for the reagents used to create the ex vivo bioreactor model
are detailed below, in Appendix A.7.1, Table A.8. Details of media composition
AAA are given in Table 2.2.
3.2.2. MATERIALS AND CONSUMABLES
The supplier details of materials and consumables used throughout this chapter
are detailed in Appendix A.7.2, Table A.9.
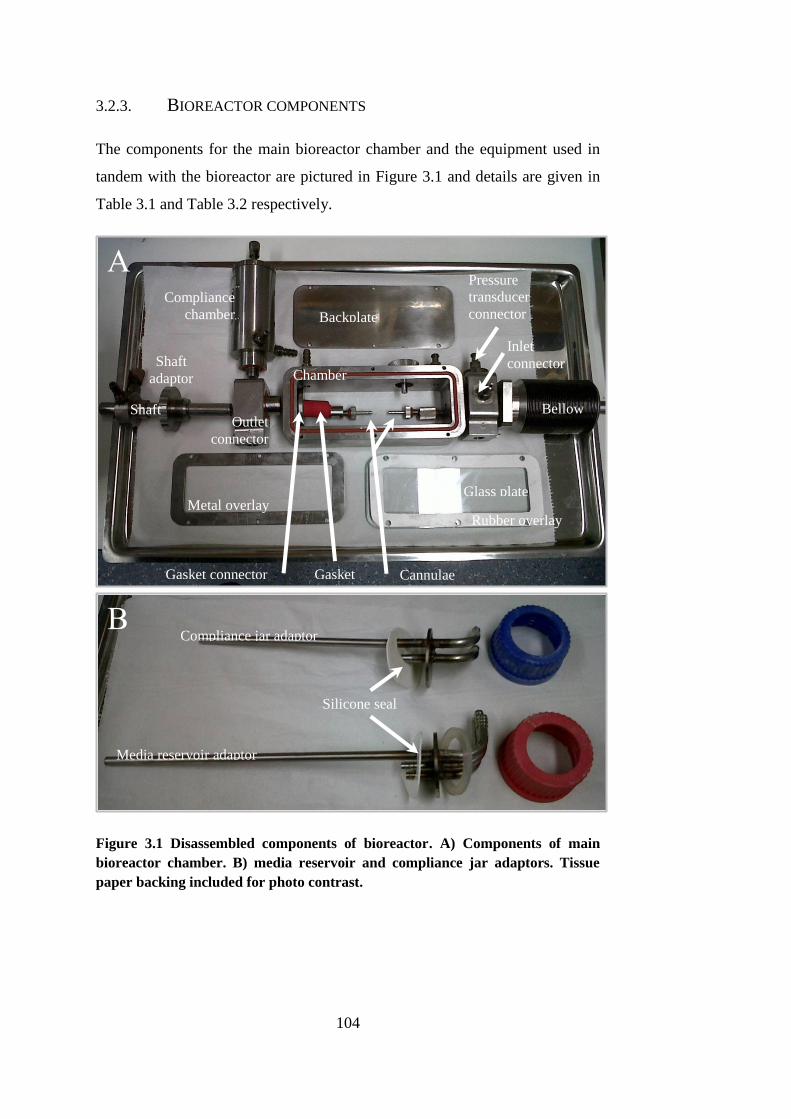
104
3.2.3. BIOREACTOR COMPONENTS
The components for the main bioreactor chamber and the equipment used in
tandem with the bioreactor are pictured in Figure 3.1 and details are given in
Table 3.1 and Table 3.2 respectively.
Figure 3.1 Disassembled components of bioreactor. A) Components of main
bioreactor chamber. B) media reservoir and compliance jar adaptors. Tissue
paper backing included for photo contrast.
Backplate
Bellow
s
Glass plate Metal overlay
Compliance
chamber
Chamber
Shaft
Shaft
adaptor
Rubber overlay
Gasket connector
Outlet
connector
Inlet
connector
Cannulae Gasket
Compliance jar adaptor
Media reservoir adaptor
Silicone seal
Pressure
transducer
connector
A
B
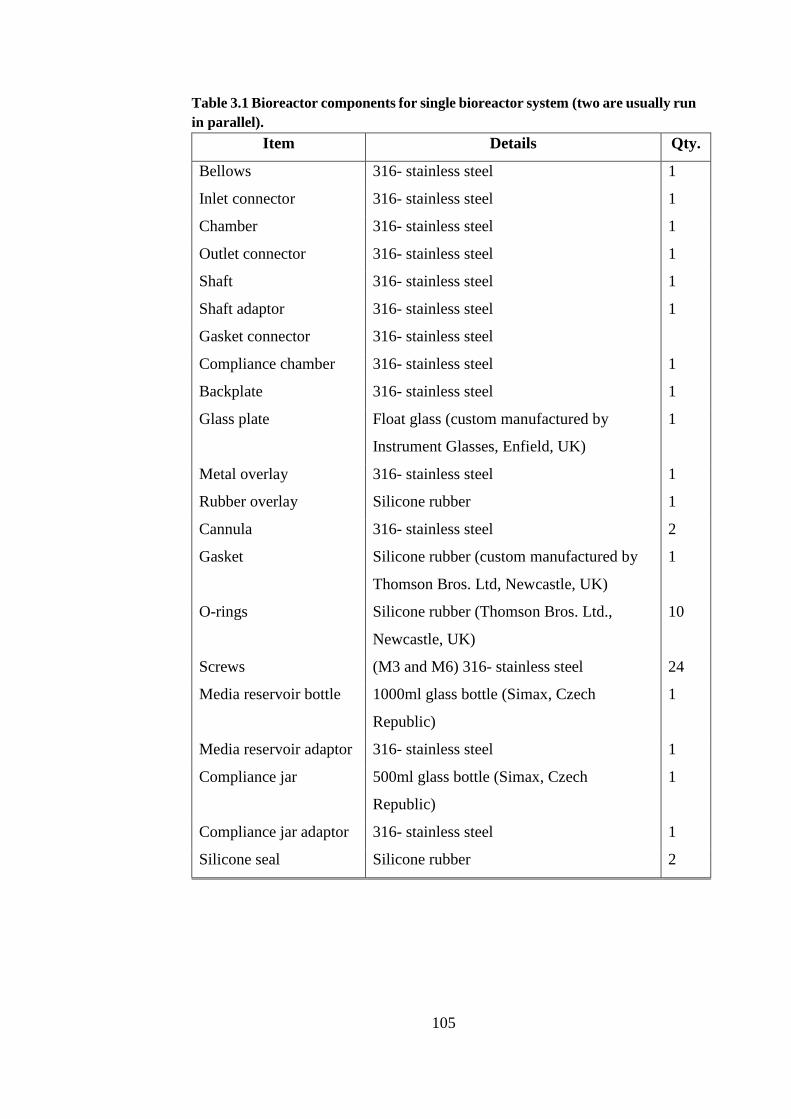
105
Table 3.1 Bioreactor components for single bioreactor system (two are usually run
in parallel).
Item Details Qty.
Bellows 316- stainless steel 1
Inlet connector 316- stainless steel 1
Chamber 316- stainless steel 1
Outlet connector 316- stainless steel 1
Shaft 316- stainless steel 1
Shaft adaptor 316- stainless steel 1
Gasket connector 316- stainless steel
Compliance chamber 316- stainless steel 1
Backplate 316- stainless steel 1
Glass plate Float glass (custom manufactured by
Instrument Glasses, Enfield, UK)
1
Metal overlay 316- stainless steel 1
Rubber overlay Silicone rubber 1
Cannula 316- stainless steel 2
Gasket Silicone rubber (custom manufactured by
Thomson Bros. Ltd, Newcastle, UK)
1
O-rings Silicone rubber (Thomson Bros. Ltd.,
Newcastle, UK)
10
Screws (M3 and M6) 316- stainless steel 24
Media reservoir bottle 1000ml glass bottle (Simax, Czech
Republic)
1
Media reservoir adaptor 316- stainless steel 1
Compliance jar 500ml glass bottle (Simax, Czech
Republic)
1
Compliance jar adaptor 316- stainless steel 1
Silicone seal Silicone rubber 2
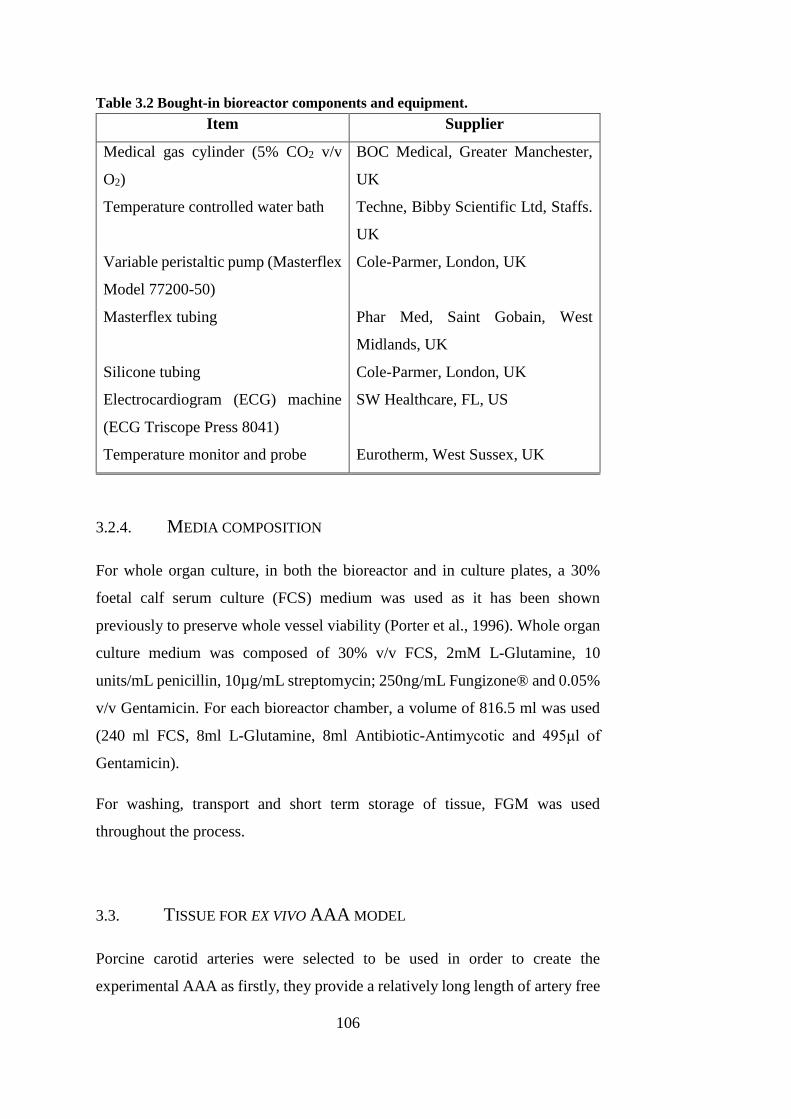
106
Table 3.2 Bought-in bioreactor components and equipment.
Item Supplier
Medical gas cylinder (5% CO2 v/v
O2)
BOC Medical, Greater Manchester,
UK
Temperature controlled water bath Techne, Bibby Scientific Ltd, Staffs.
UK
Variable peristaltic pump (Masterflex
Model 77200-50)
Cole-Parmer, London, UK
Masterflex tubing Phar Med, Saint Gobain, West
Midlands, UK
Silicone tubing Cole-Parmer, London, UK
Electrocardiogram (ECG) machine
(ECG Triscope Press 8041)
SW Healthcare, FL, US
Temperature monitor and probe Eurotherm, West Sussex, UK
3.2.4. MEDIA COMPOSITION
For whole organ culture, in both the bioreactor and in culture plates, a 30%
foetal calf serum culture (FCS) medium was used as it has been shown
previously to preserve whole vessel viability (Porter et al., 1996). Whole organ
culture medium was composed of 30% v/v FCS, 2mM L-Glutamine, 10
units/mL penicillin, 10µg/mL streptomycin; 250ng/mL Fungizone® and 0.05%
v/v Gentamicin. For each bioreactor chamber, a volume of 816.5 ml was used
(240 ml FCS, 8ml L-Glutamine, 8ml Antibiotic-Antimycotic and 495μl of
Gentamicin).
For washing, transport and short term storage of tissue, FGM was used
throughout the process.
3.3. TISSUE FOR EX VIVO AAA MODEL
Porcine carotid arteries were selected to be used in order to create the
experimental AAA as firstly, they provide a relatively long length of artery free
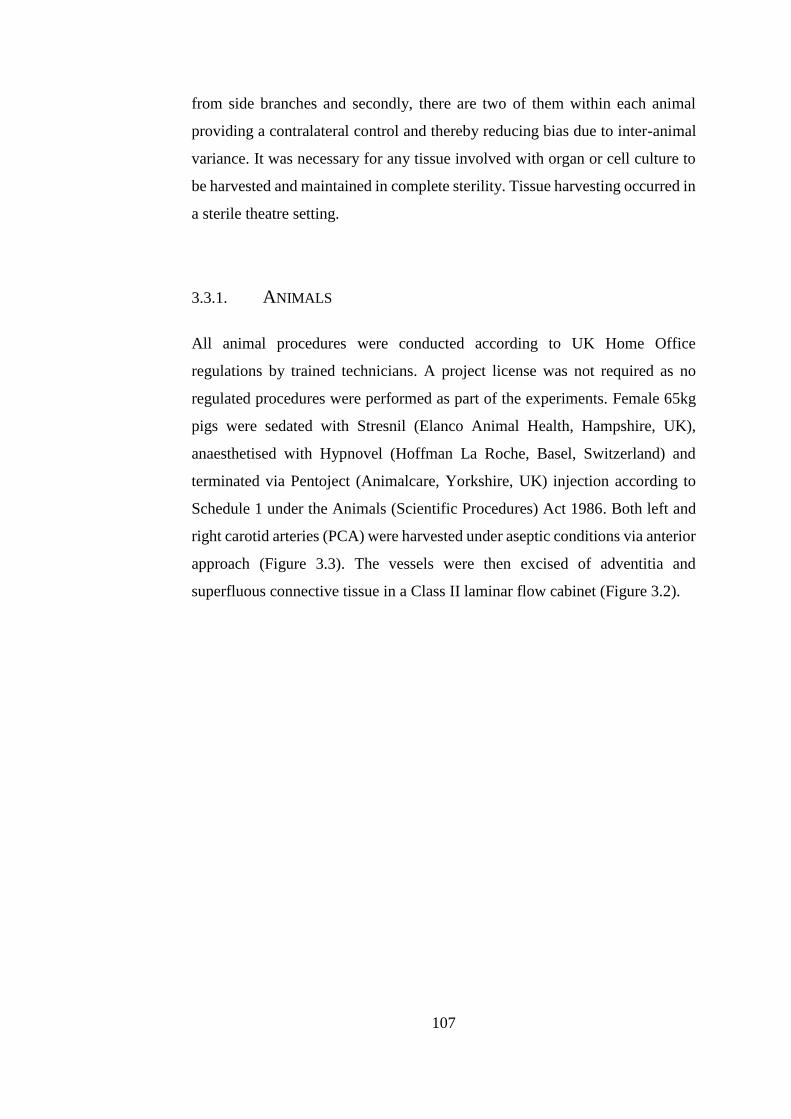
107
from side branches and secondly, there are two of them within each animal
providing a contralateral control and thereby reducing bias due to inter-animal
variance. It was necessary for any tissue involved with organ or cell culture to
be harvested and maintained in complete sterility. Tissue harvesting occurred in
a sterile theatre setting.
3.3.1. ANIMALS
All animal procedures were conducted according to UK Home Office
regulations by trained technicians. A project license was not required as no
regulated procedures were performed as part of the experiments. Female 65kg
pigs were sedated with Stresnil (Elanco Animal Health, Hampshire, UK),
anaesthetised with Hypnovel (Hoffman La Roche, Basel, Switzerland) and
terminated via Pentoject (Animalcare, Yorkshire, UK) injection according to
Schedule 1 under the Animals (Scientific Procedures) Act 1986. Both left and
right carotid arteries (PCA) were harvested under aseptic conditions via anterior
approach (Figure 3.3). The vessels were then excised of adventitia and
superfluous connective tissue in a Class II laminar flow cabinet (Figure 3.2).
108
Figure 3.2 Superfluous connective tissue and adventitia were excised from the
porcine carotid arteries following harvesting.
3.3.1.1. SURGICAL APPROACH
Surgical extraction of the tissue was performed by a team of two trainee
surgeons. In all cases an anterior approach to the carotid artery was made
through the neck of the animal. One incision was made through which both left
and right common carotid arteries were harvested. The sternohyoideus muscle
was located and the approach to each carotid artery was located laterally to the
sternohyoideus on both sides, superior to the salivary gland. The common
carotid artery lies in close proximity to the vagus nerve and the internal jugular
vein. Images of the surgical approach used for all tissue harvesting are shown
in Figure 3.3. Although the carotid artery was selected for this project
specifically for its relatively long length with lack of side branches, occasionally
a side branch would be present which is an anatomical peculiarity of singular
animals. If a side branch was present, it was sutured closed in order to retain
characterised flow and pressure throughout the carotid artery when installed in
the bioreactor.
Carotid artery
Excised superfluous tissue
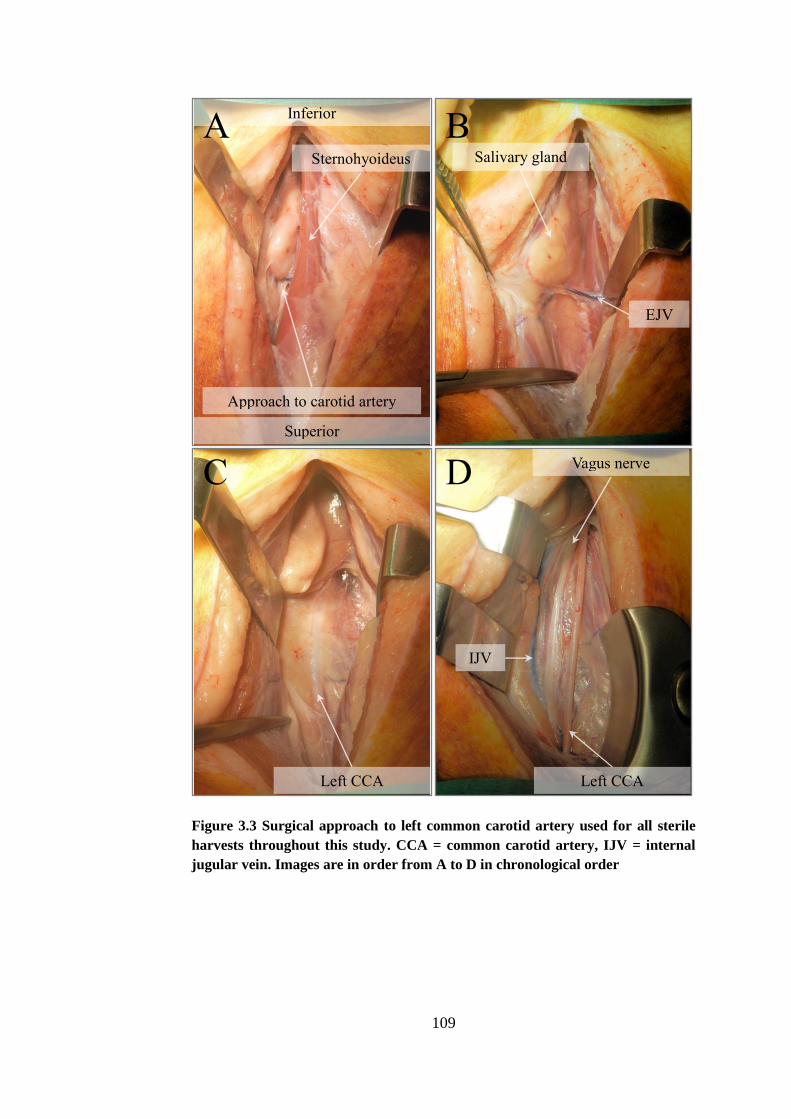
109
Figure 3.3 Surgical approach to left common carotid artery used for all sterile
harvests throughout this study. CCA = common carotid artery, IJV = internal
jugular vein. Images are in order from A to D in chronological order
Superior
Inferior
Left CCA Left CCA
Salivary gland
Approach to carotid artery
Vagus nerve
Sternohyoideus
EJV
IJV
A B
C D
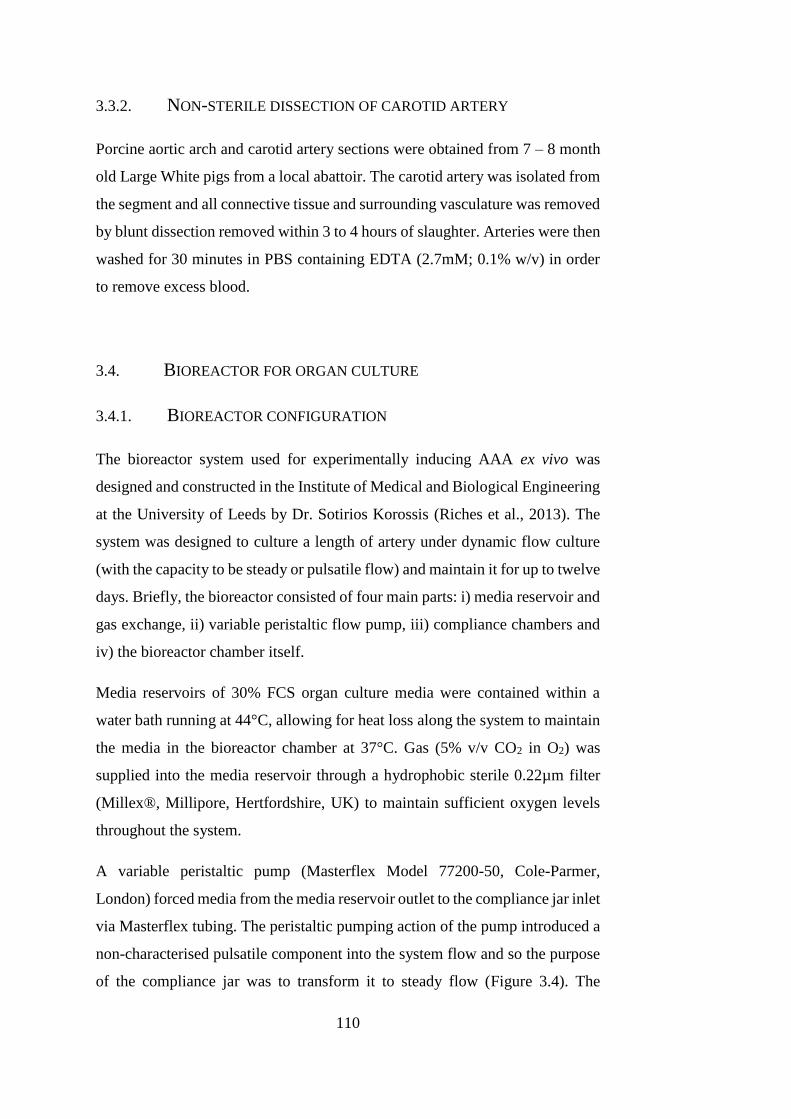
110
3.3.2. NON-STERILE DISSECTION OF CAROTID ARTERY
Porcine aortic arch and carotid artery sections were obtained from 7 – 8 month
old Large White pigs from a local abattoir. The carotid artery was isolated from
the segment and all connective tissue and surrounding vasculature was removed
by blunt dissection removed within 3 to 4 hours of slaughter. Arteries were then
washed for 30 minutes in PBS containing EDTA (2.7mM; 0.1% w/v) in order
to remove excess blood.
3.4. BIOREACTOR FOR ORGAN CULTURE
3.4.1. BIOREACTOR CONFIGURATION
The bioreactor system used for experimentally inducing AAA ex vivo was
designed and constructed in the Institute of Medical and Biological Engineering
at the University of Leeds by Dr. Sotirios Korossis (Riches et al., 2013). The
system was designed to culture a length of artery under dynamic flow culture
(with the capacity to be steady or pulsatile flow) and maintain it for up to twelve
days. Briefly, the bioreactor consisted of four main parts: i) media reservoir and
gas exchange, ii) variable peristaltic flow pump, iii) compliance chambers and
iv) the bioreactor chamber itself.
Media reservoirs of 30% FCS organ culture media were contained within a
water bath running at 44°C, allowing for heat loss along the system to maintain
the media in the bioreactor chamber at 37°C. Gas (5% v/v CO2 in O2) was
supplied into the media reservoir through a hydrophobic sterile 0.22µm filter
(Millex®, Millipore, Hertfordshire, UK) to maintain sufficient oxygen levels
throughout the system.
A variable peristaltic pump (Masterflex Model 77200-50, Cole-Parmer,
London) forced media from the media reservoir outlet to the compliance jar inlet
via Masterflex tubing. The peristaltic pumping action of the pump introduced a
non-characterised pulsatile component into the system flow and so the purpose
of the compliance jar was to transform it to steady flow (Figure 3.4). The
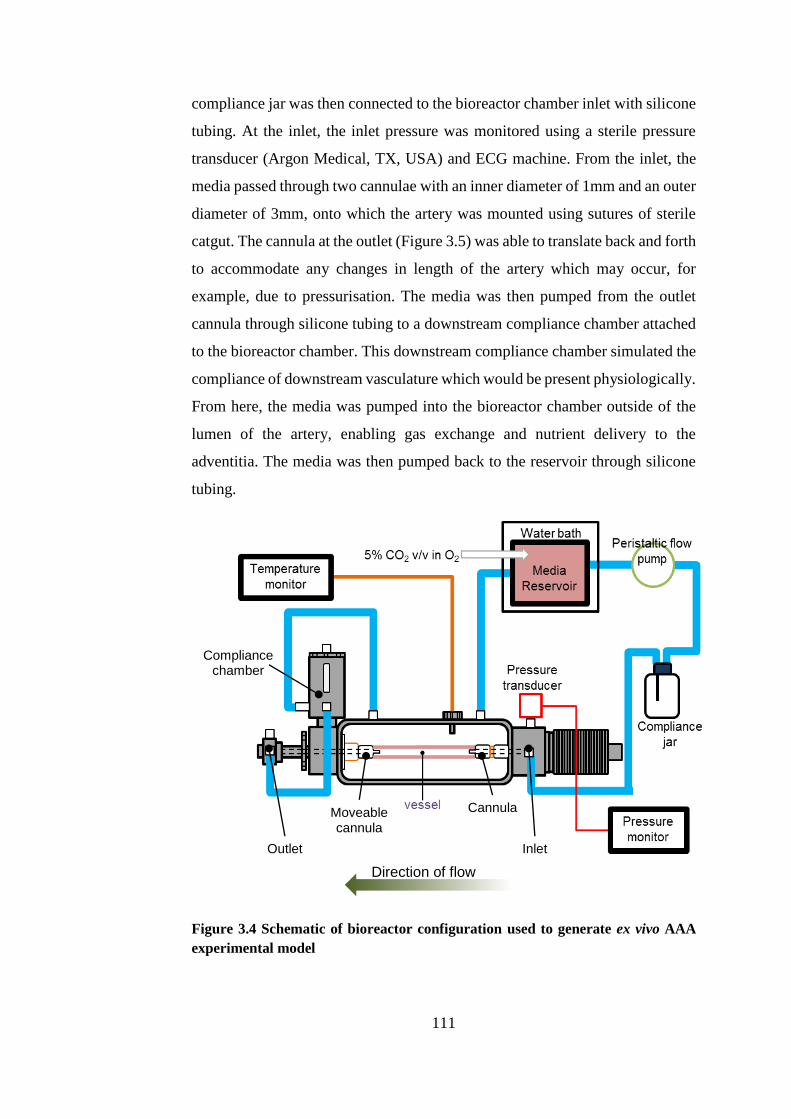
111
compliance jar was then connected to the bioreactor chamber inlet with silicone
tubing. At the inlet, the inlet pressure was monitored using a sterile pressure
transducer (Argon Medical, TX, USA) and ECG machine. From the inlet, the
media passed through two cannulae with an inner diameter of 1mm and an outer
diameter of 3mm, onto which the artery was mounted using sutures of sterile
catgut. The cannula at the outlet (Figure 3.5) was able to translate back and forth
to accommodate any changes in length of the artery which may occur, for
example, due to pressurisation. The media was then pumped from the outlet
cannula through silicone tubing to a downstream compliance chamber attached
to the bioreactor chamber. This downstream compliance chamber simulated the
compliance of downstream vasculature which would be present physiologically.
From here, the media was pumped into the bioreactor chamber outside of the
lumen of the artery, enabling gas exchange and nutrient delivery to the
adventitia. The media was then pumped back to the reservoir through silicone
tubing.
Figure 3.4 Schematic of bioreactor configuration used to generate ex vivo AAA
experimental model
Cannula Moveable cannula
Compliance chamber
Outlet Inlet
Direction of flow
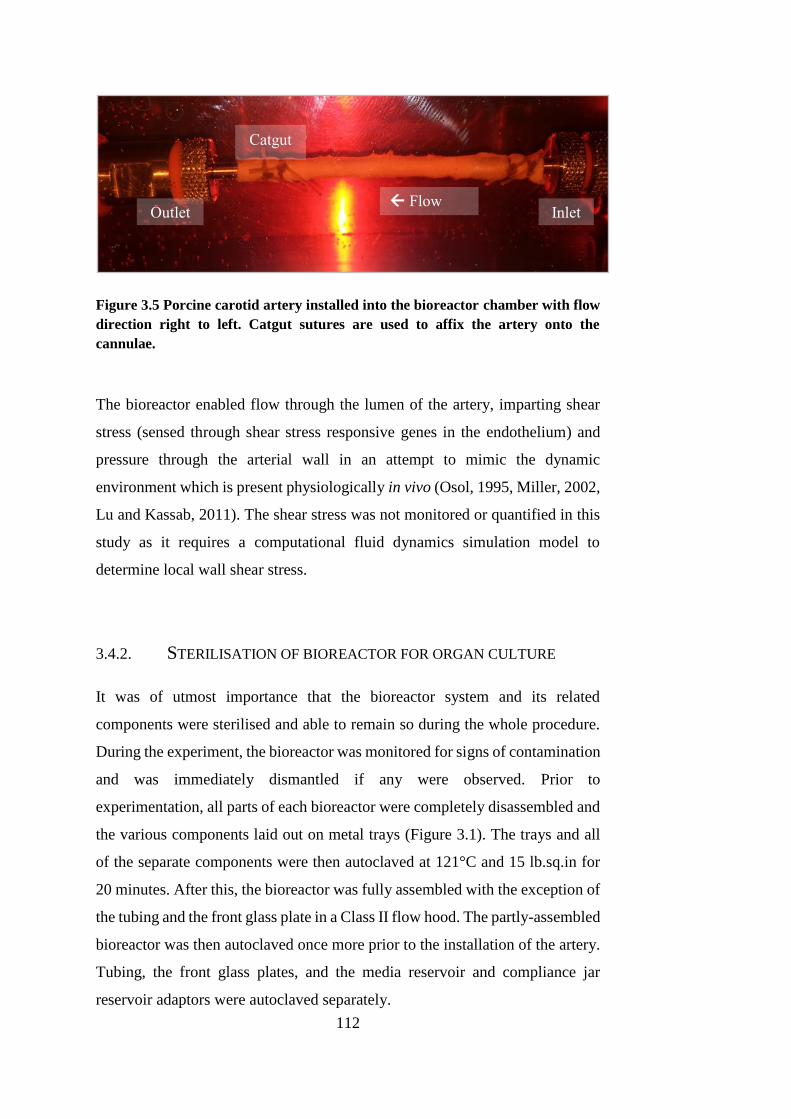
112
Figure 3.5 Porcine carotid artery installed into the bioreactor chamber with flow
direction right to left. Catgut sutures are used to affix the artery onto the
cannulae.
The bioreactor enabled flow through the lumen of the artery, imparting shear
stress (sensed through shear stress responsive genes in the endothelium) and
pressure through the arterial wall in an attempt to mimic the dynamic
environment which is present physiologically in vivo (Osol, 1995, Miller, 2002,
Lu and Kassab, 2011). The shear stress was not monitored or quantified in this
study as it requires a computational fluid dynamics simulation model to
determine local wall shear stress.
3.4.2. STERILISATION OF BIOREACTOR FOR ORGAN CULTURE
It was of utmost importance that the bioreactor system and its related
components were sterilised and able to remain so during the whole procedure.
During the experiment, the bioreactor was monitored for signs of contamination
and was immediately dismantled if any were observed. Prior to
experimentation, all parts of each bioreactor were completely disassembled and
the various components laid out on metal trays (Figure 3.1). The trays and all
of the separate components were then autoclaved at 121°C and 15 lb.sq.in for
20 minutes. After this, the bioreactor was fully assembled with the exception of
the tubing and the front glass plate in a Class II flow hood. The partly-assembled
bioreactor was then autoclaved once more prior to the installation of the artery.
Tubing, the front glass plates, and the media reservoir and compliance jar
reservoir adaptors were autoclaved separately.
Flow Inlet Outlet
Catgut
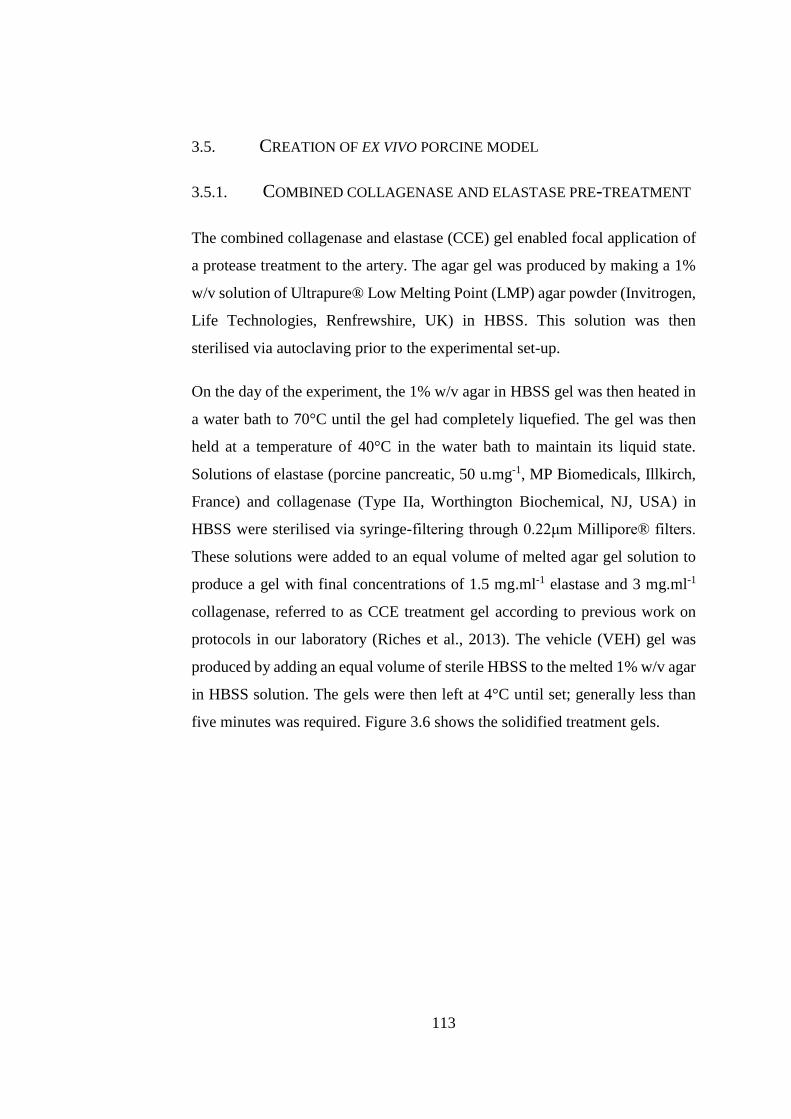
113
3.5. CREATION OF EX VIVO PORCINE MODEL
3.5.1. COMBINED COLLAGENASE AND ELASTASE PRE-TREATMENT
The combined collagenase and elastase (CCE) gel enabled focal application of
a protease treatment to the artery. The agar gel was produced by making a 1%
w/v solution of Ultrapure® Low Melting Point (LMP) agar powder (Invitrogen,
Life Technologies, Renfrewshire, UK) in HBSS. This solution was then
sterilised via autoclaving prior to the experimental set-up.
On the day of the experiment, the 1% w/v agar in HBSS gel was then heated in
a water bath to 70°C until the gel had completely liquefied. The gel was then
held at a temperature of 40°C in the water bath to maintain its liquid state.
Solutions of elastase (porcine pancreatic, 50 u.mg-1, MP Biomedicals, Illkirch,
France) and collagenase (Type IIa, Worthington Biochemical, NJ, USA) in
HBSS were sterilised via syringe-filtering through 0.22μm Millipore® filters.
These solutions were added to an equal volume of melted agar gel solution to
produce a gel with final concentrations of 1.5 mg.ml-1 elastase and 3 mg.ml-1
collagenase, referred to as CCE treatment gel according to previous work on
protocols in our laboratory (Riches et al., 2013). The vehicle (VEH) gel was
produced by adding an equal volume of sterile HBSS to the melted 1% w/v agar
in HBSS solution. The gels were then left at 4°C until set; generally less than
five minutes was required. Figure 3.6 shows the solidified treatment gels.
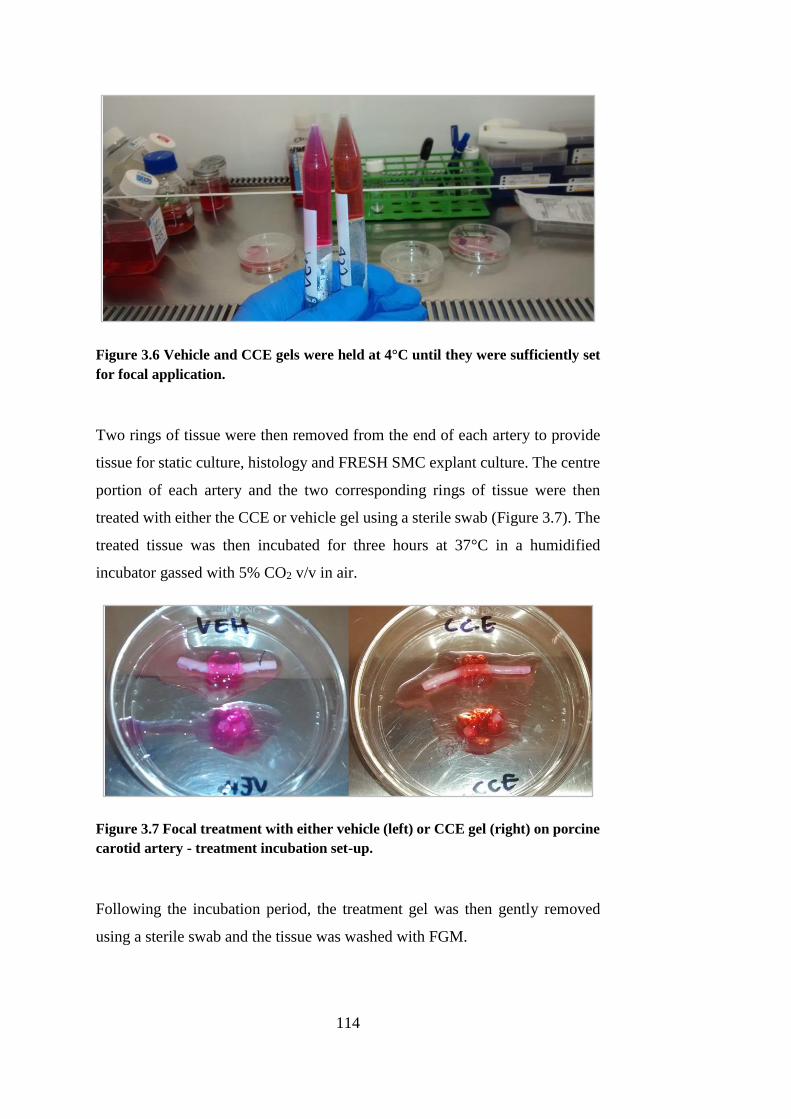
114
Figure 3.6 Vehicle and CCE gels were held at 4°C until they were sufficiently set
for focal application.
Two rings of tissue were then removed from the end of each artery to provide
tissue for static culture, histology and FRESH SMC explant culture. The centre
portion of each artery and the two corresponding rings of tissue were then
treated with either the CCE or vehicle gel using a sterile swab (Figure 3.7). The
treated tissue was then incubated for three hours at 37°C in a humidified
incubator gassed with 5% CO2 v/v in air.
Figure 3.7 Focal treatment with either vehicle (left) or CCE gel (right) on porcine
carotid artery - treatment incubation set-up.
Following the incubation period, the treatment gel was then gently removed
using a sterile swab and the tissue was washed with FGM.
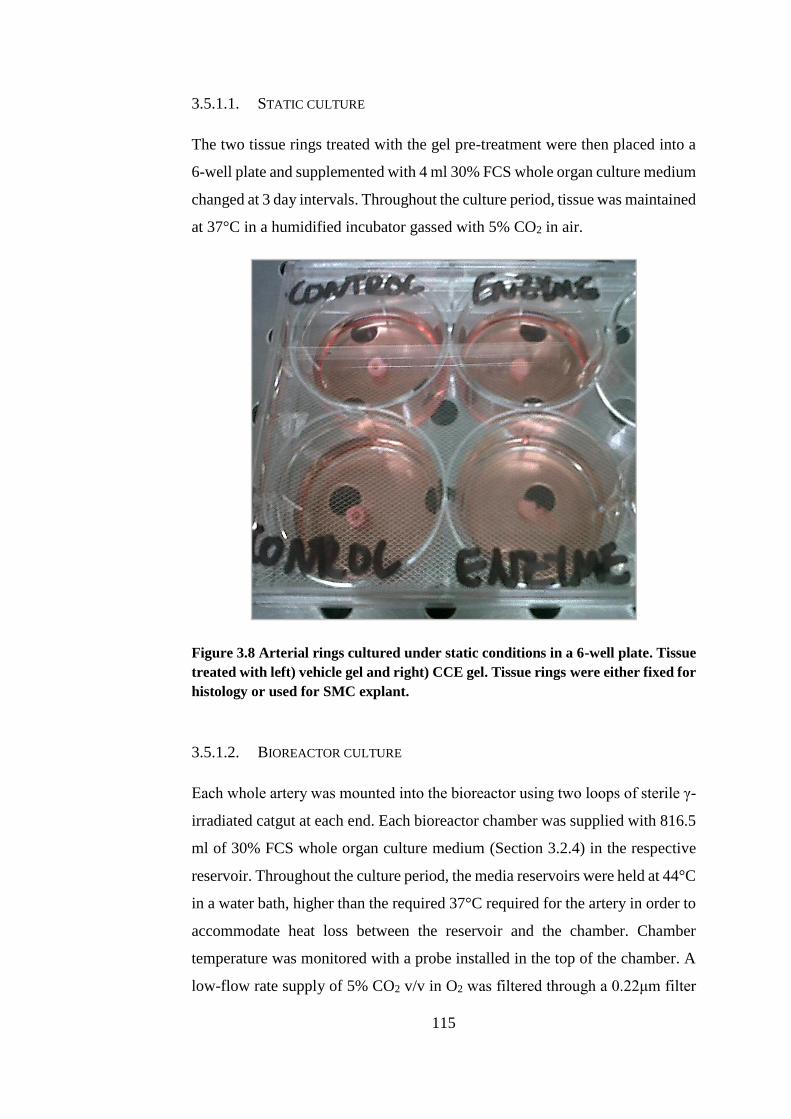
115
3.5.1.1. STATIC CULTURE
The two tissue rings treated with the gel pre-treatment were then placed into a
6-well plate and supplemented with 4 ml 30% FCS whole organ culture medium
changed at 3 day intervals. Throughout the culture period, tissue was maintained
at 37°C in a humidified incubator gassed with 5% CO2 in air.
Figure 3.8 Arterial rings cultured under static conditions in a 6-well plate. Tissue
treated with left) vehicle gel and right) CCE gel. Tissue rings were either fixed for
histology or used for SMC explant.
3.5.1.2. BIOREACTOR CULTURE
Each whole artery was mounted into the bioreactor using two loops of sterile γ-
irradiated catgut at each end. Each bioreactor chamber was supplied with 816.5
ml of 30% FCS whole organ culture medium (Section 3.2.4) in the respective
reservoir. Throughout the culture period, the media reservoirs were held at 44°C
in a water bath, higher than the required 37°C required for the artery in order to
accommodate heat loss between the reservoir and the chamber. Chamber
temperature was monitored with a probe installed in the top of the chamber. A
low-flow rate supply of 5% CO2 v/v in O2 was filtered through a 0.22μm filter
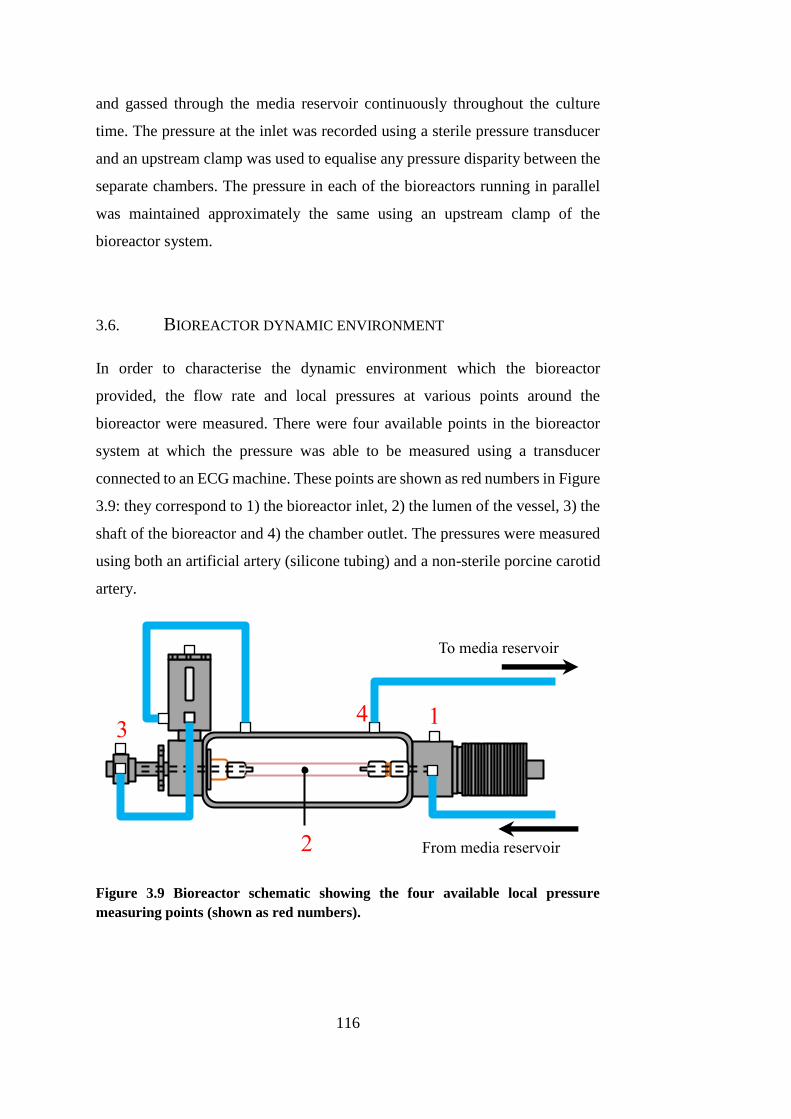
116
and gassed through the media reservoir continuously throughout the culture
time. The pressure at the inlet was recorded using a sterile pressure transducer
and an upstream clamp was used to equalise any pressure disparity between the
separate chambers. The pressure in each of the bioreactors running in parallel
was maintained approximately the same using an upstream clamp of the
bioreactor system.
3.6. BIOREACTOR DYNAMIC ENVIRONMENT
In order to characterise the dynamic environment which the bioreactor
provided, the flow rate and local pressures at various points around the
bioreactor were measured. There were four available points in the bioreactor
system at which the pressure was able to be measured using a transducer
connected to an ECG machine. These points are shown as red numbers in Figure
3.9: they correspond to 1) the bioreactor inlet, 2) the lumen of the vessel, 3) the
shaft of the bioreactor and 4) the chamber outlet. The pressures were measured
using both an artificial artery (silicone tubing) and a non-sterile porcine carotid
artery.
Figure 3.9 Bioreactor schematic showing the four available local pressure
measuring points (shown as red numbers).
To media reservoir
From media reservoir
1
2
3 4
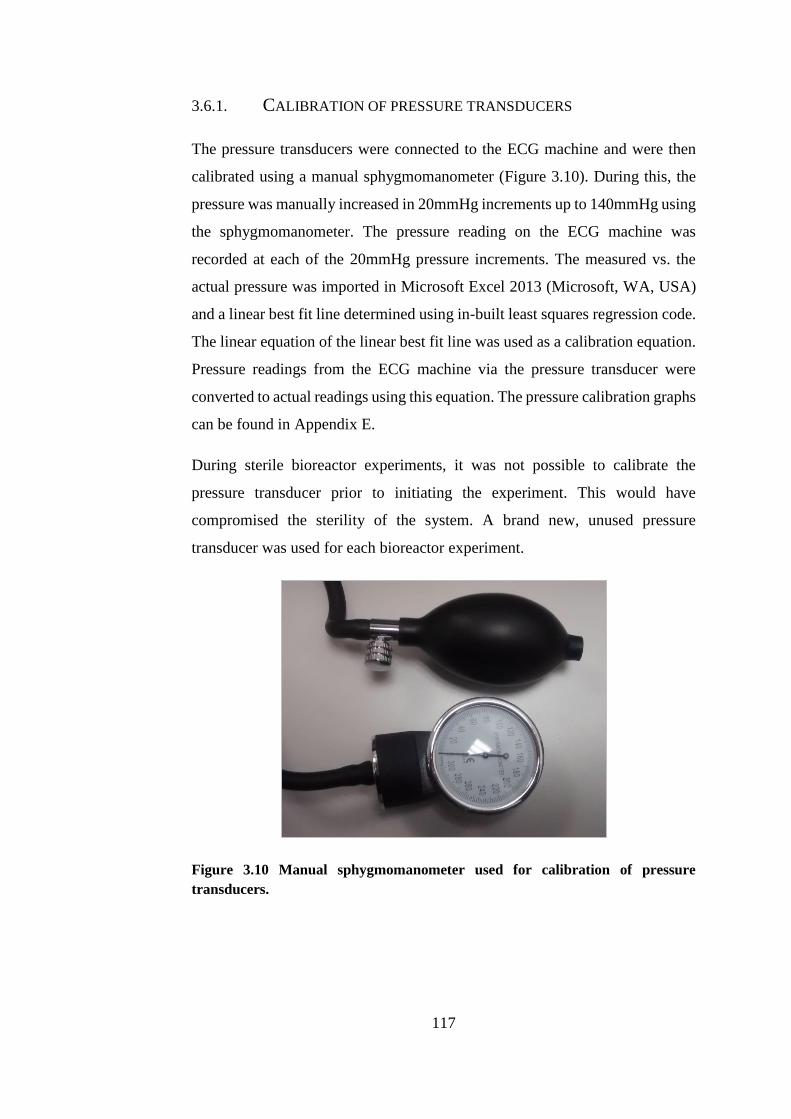
117
3.6.1. CALIBRATION OF PRESSURE TRANSDUCERS
The pressure transducers were connected to the ECG machine and were then
calibrated using a manual sphygmomanometer (Figure 3.10). During this, the
pressure was manually increased in 20mmHg increments up to 140mmHg using
the sphygmomanometer. The pressure reading on the ECG machine was
recorded at each of the 20mmHg pressure increments. The measured vs. the
actual pressure was imported in Microsoft Excel 2013 (Microsoft, WA, USA)
and a linear best fit line determined using in-built least squares regression code.
The linear equation of the linear best fit line was used as a calibration equation.
Pressure readings from the ECG machine via the pressure transducer were
converted to actual readings using this equation. The pressure calibration graphs
can be found in Appendix E.
During sterile bioreactor experiments, it was not possible to calibrate the
pressure transducer prior to initiating the experiment. This would have
compromised the sterility of the system. A brand new, unused pressure
transducer was used for each bioreactor experiment.
Figure 3.10 Manual sphygmomanometer used for calibration of pressure
transducers.
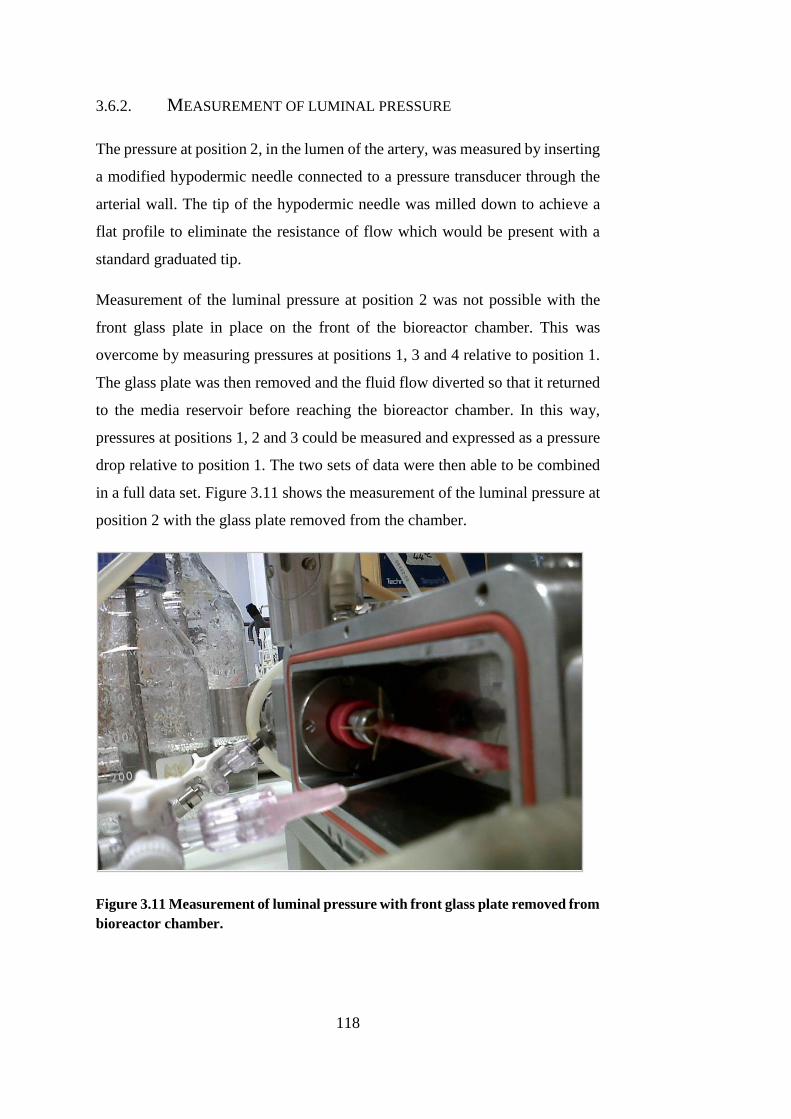
118
3.6.2. MEASUREMENT OF LUMINAL PRESSURE
The pressure at position 2, in the lumen of the artery, was measured by inserting
a modified hypodermic needle connected to a pressure transducer through the
arterial wall. The tip of the hypodermic needle was milled down to achieve a
flat profile to eliminate the resistance of flow which would be present with a
standard graduated tip.
Measurement of the luminal pressure at position 2 was not possible with the
front glass plate in place on the front of the bioreactor chamber. This was
overcome by measuring pressures at positions 1, 3 and 4 relative to position 1.
The glass plate was then removed and the fluid flow diverted so that it returned
to the media reservoir before reaching the bioreactor chamber. In this way,
pressures at positions 1, 2 and 3 could be measured and expressed as a pressure
drop relative to position 1. The two sets of data were then able to be combined
in a full data set. Figure 3.11 shows the measurement of the luminal pressure at
position 2 with the glass plate removed from the chamber.
Figure 3.11 Measurement of luminal pressure with front glass plate removed from
bioreactor chamber.
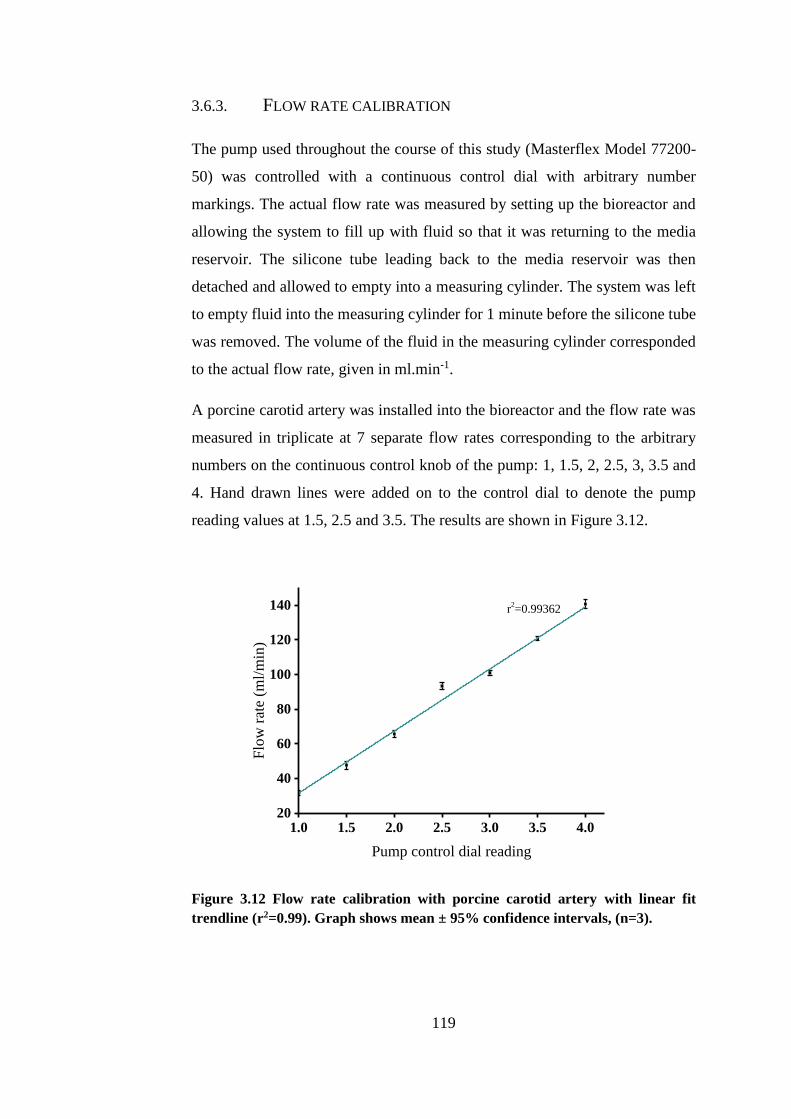
119
3.6.3. FLOW RATE CALIBRATION
The pump used throughout the course of this study (Masterflex Model 77200-
50) was controlled with a continuous control dial with arbitrary number
markings. The actual flow rate was measured by setting up the bioreactor and
allowing the system to fill up with fluid so that it was returning to the media
reservoir. The silicone tube leading back to the media reservoir was then
detached and allowed to empty into a measuring cylinder. The system was left
to empty fluid into the measuring cylinder for 1 minute before the silicone tube
was removed. The volume of the fluid in the measuring cylinder corresponded
to the actual flow rate, given in ml.min-1.
A porcine carotid artery was installed into the bioreactor and the flow rate was
measured in triplicate at 7 separate flow rates corresponding to the arbitrary
numbers on the continuous control knob of the pump: 1, 1.5, 2, 2.5, 3, 3.5 and
4. Hand drawn lines were added on to the control dial to denote the pump
reading values at 1.5, 2.5 and 3.5. The results are shown in Figure 3.12.
1.0 1.5 2.0 2.5 3.0 3.5 4.020
40
60
80
100
120
140
Flo
w r
ate
(ml/
min
)
Pump control dial reading
r2=0.99362
Figure 3.12 Flow rate calibration with porcine carotid artery with linear fit
trendline (r2=0.99). Graph shows mean ± 95% confidence intervals, (n=3).
120
A linear best fit line was applied to the data using Origin Pro 8.5.1 graphing
software with in-built linear regression code (OriginLab Corporation, MA, US),
giving an adjusted R2 value of 0.99 (Figure 3.12). An adjusted R2 value gives
an indication of the degree of variation explained only by the independent
variables that actually affect the dependent variable. From this, it was concluded
that the pump control dial acted to alter the flow rate in a linear manner, rather
than exponential. This relationship could then be used to determine the required
flow rate through the bioreactor system.
The normal carotid flow rate in humans is in the range of approximately 360 –
720 ml.min-1 (Bogren et al., 1994, Oshinski et al., 2006). However, a much
lower flow rate of 120 ml.min-1 found throughout the literature was chosen for
the bioreactor experiments: the ex vivo nature of the experiments demanded that
the flow rate must allow optimal oxygen perfusion and nutrient delivery for the
tissue (Swartz et al., 2005, Hahn et al., 2006, Aper et al., 2007, Riches et al.,
2013). Although a relatively large difference between the chosen and
physiological flow rates was present, both the vehicle control and CCE treated
arteries were cultured using the same flow rate so the relative differences could
be analysed.
3.6.4. CHARACTERISATION OF LOCAL PRESSURES
The local pressures at positions 1, 2, 3 and 4 were measured at three different
flow rates using a pressure transducer (Argon Medical, TX, US) and an ECG
machine (SW Healthcare, FL, US). The flow rates corresponded to the arbitrary
number markings on the control dial on the pump, as a point of reference. The
mean local pressures at the specified positions when a porcine carotid artery
was installed are shown in Figure 3.13.
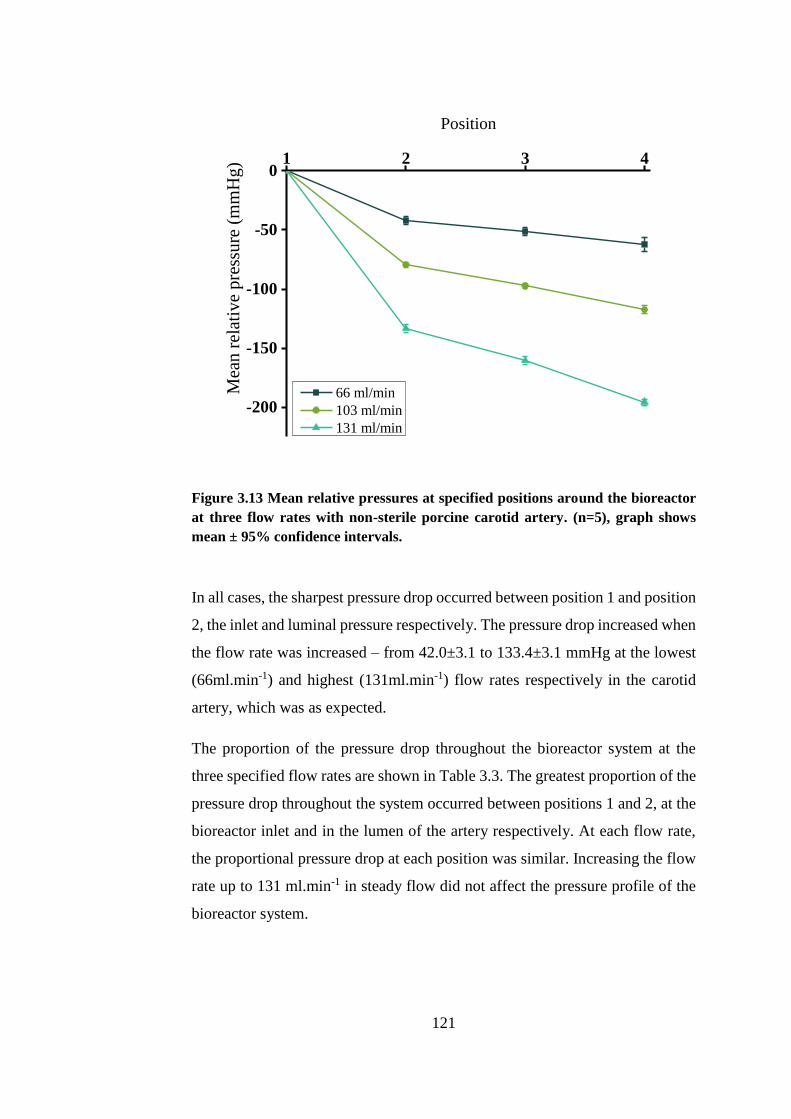
121
1 2 3 4
-200
-150
-100
-50
0
Mea
n r
elat
ive
pre
ssu
re (
mm
Hg)
Position
66 ml/min
103 ml/min
131 ml/min
Figure 3.13 Mean relative pressures at specified positions around the bioreactor
at three flow rates with non-sterile porcine carotid artery. (n=5), graph shows
mean ± 95% confidence intervals.
In all cases, the sharpest pressure drop occurred between position 1 and position
2, the inlet and luminal pressure respectively. The pressure drop increased when
the flow rate was increased – from 42.0±3.1 to 133.4±3.1 mmHg at the lowest
(66ml.min-1) and highest (131ml.min-1) flow rates respectively in the carotid
artery, which was as expected.
The proportion of the pressure drop throughout the bioreactor system at the
three specified flow rates are shown in Table 3.3. The greatest proportion of the
pressure drop throughout the system occurred between positions 1 and 2, at the
bioreactor inlet and in the lumen of the artery respectively. At each flow rate,
the proportional pressure drop at each position was similar. Increasing the flow
rate up to 131 ml.min-1 in steady flow did not affect the pressure profile of the
bioreactor system.
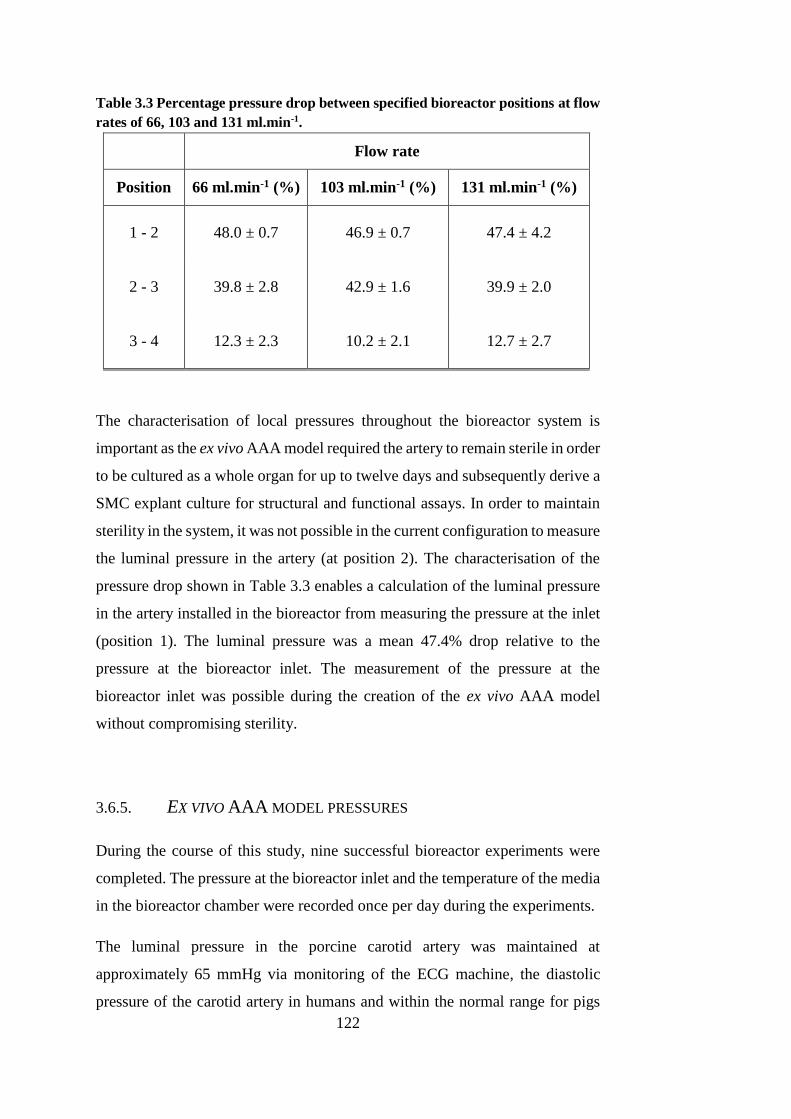
122
Table 3.3 Percentage pressure drop between specified bioreactor positions at flow
rates of 66, 103 and 131 ml.min-1.
Flow rate
Position 66 ml.min-1 (%) 103 ml.min-1 (%) 131 ml.min-1 (%)
1 - 2 48.0 ± 0.7 46.9 ± 0.7 47.4 ± 4.2
2 - 3 39.8 ± 2.8 42.9 ± 1.6 39.9 ± 2.0
3 - 4 12.3 ± 2.3 10.2 ± 2.1 12.7 ± 2.7
The characterisation of local pressures throughout the bioreactor system is
important as the ex vivo AAA model required the artery to remain sterile in order
to be cultured as a whole organ for up to twelve days and subsequently derive a
SMC explant culture for structural and functional assays. In order to maintain
sterility in the system, it was not possible in the current configuration to measure
the luminal pressure in the artery (at position 2). The characterisation of the
pressure drop shown in Table 3.3 enables a calculation of the luminal pressure
in the artery installed in the bioreactor from measuring the pressure at the inlet
(position 1). The luminal pressure was a mean 47.4% drop relative to the
pressure at the bioreactor inlet. The measurement of the pressure at the
bioreactor inlet was possible during the creation of the ex vivo AAA model
without compromising sterility.
3.6.5. EX VIVO AAA MODEL PRESSURES
During the course of this study, nine successful bioreactor experiments were
completed. The pressure at the bioreactor inlet and the temperature of the media
in the bioreactor chamber were recorded once per day during the experiments.
The luminal pressure in the porcine carotid artery was maintained at
approximately 65 mmHg via monitoring of the ECG machine, the diastolic
pressure of the carotid artery in humans and within the normal range for pigs
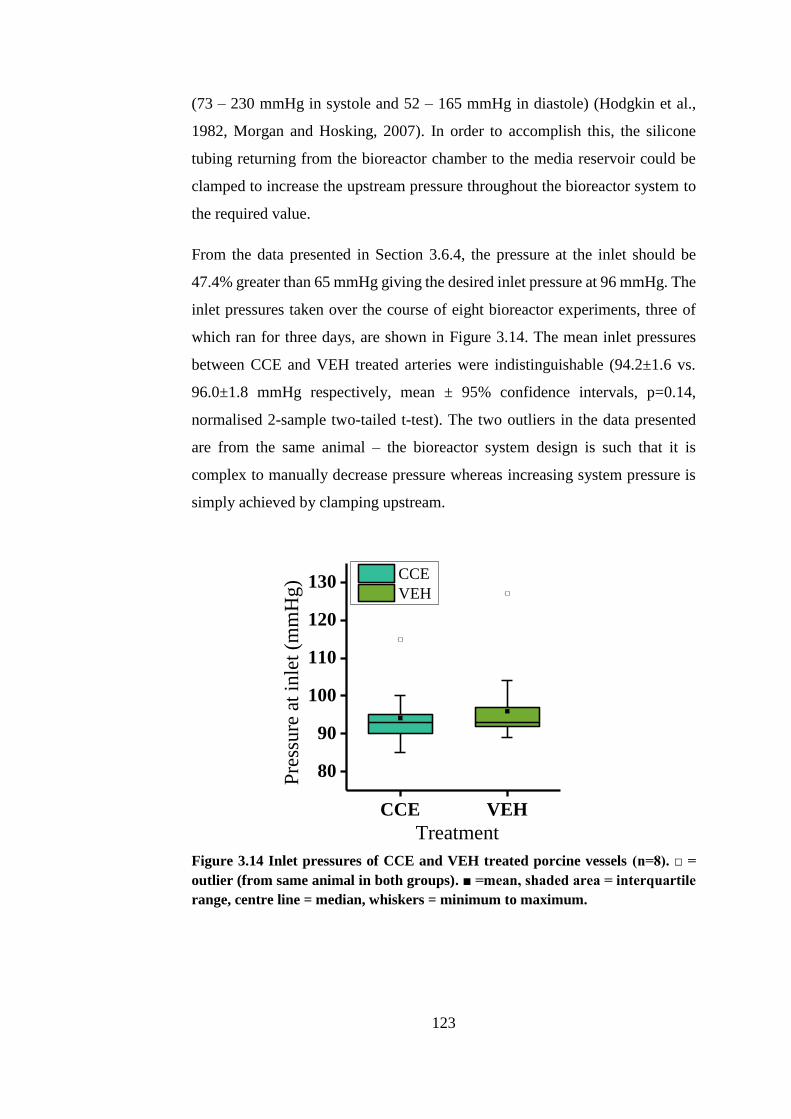
123
(73 – 230 mmHg in systole and 52 – 165 mmHg in diastole) (Hodgkin et al.,
1982, Morgan and Hosking, 2007). In order to accomplish this, the silicone
tubing returning from the bioreactor chamber to the media reservoir could be
clamped to increase the upstream pressure throughout the bioreactor system to
the required value.
From the data presented in Section 3.6.4, the pressure at the inlet should be
47.4% greater than 65 mmHg giving the desired inlet pressure at 96 mmHg. The
inlet pressures taken over the course of eight bioreactor experiments, three of
which ran for three days, are shown in Figure 3.14. The mean inlet pressures
between CCE and VEH treated arteries were indistinguishable (94.2±1.6 vs.
96.0±1.8 mmHg respectively, mean ± 95% confidence intervals, p=0.14,
normalised 2-sample two-tailed t-test). The two outliers in the data presented
are from the same animal – the bioreactor system design is such that it is
complex to manually decrease pressure whereas increasing system pressure is
simply achieved by clamping upstream.
CCE VEH
80
90
100
110
120
130
Pre
ssu
re a
t in
let
(mm
Hg) CCE
VEH
Treatment
Figure 3.14 Inlet pressures of CCE and VEH treated porcine vessels (n=8). □ =
outlier (from same animal in both groups). ■ =mean, shaded area = interquartile
range, centre line = median, whiskers = minimum to maximum.
124
3.7. DISCUSSION
The method described throughout this chapter enabled aseptic parallel culture
of viable porcine carotid arteries under steady flow conditions for up to twelve
days. When CCE treatment was applied to the artery prior to culture, it is
understood that a SMC phenotype is induced which is comparable to human
AAA SMCs (Riches et al., 2013). Following CCE pre-treatment, a period of
three days of bioreactor culture was chosen to model early-stage AAA disease.
Previously in a mouse model, it was shown that although aneurysmal dilatation
was observed after 14 days, phenotypic switching of the SMCs was present only
seven days after elastase perfusion (Ailawadi et al., 2009). The rationale for
choosing a culture period of three days to simulate early AAA was to elucidate
any alterations in SMCs prior to switching phenotype. These potential
alterations may then serve as molecular targets for therapeutics.
The use of steady flow through the arterial lumen was used in the only other
AAA bioreactor model to date. However, the methods differ greatly between
the two studies: Touroo and Williams seeded stromal vascular fraction cells
onto previously dilated ePTFE scaffolds and then used the bioreactor to
differentiate the cells and seed the scaffold (Touroo and Williams, 2012). The
model described in this chapter was not intended to induce differentiation from
stem cells, but removes the functional organ and cultures it in an ex vivo
environment. Therefore, the structure of the organ and organisation of the cells
are exactly as they would exist in vivo as the artery is installed into the bioreactor
and does not require tissue conditioning. Bioreactors are more commonly used
for imparting forces onto a scaffold seeded with some type of stem cell with an
aim of differentiating the cells into the desired phenotypes using
mechanotransduction (Niklason et al., 1999, Sivarapatna et al., 2015). Although
pulsatile flow is closer to the physiological haemodynamics, it has been shown
that steady flow is able to induce an AAA SMC phenotype after 12 days in the
bioreactor, as validated by human AAA SMCs previously in this laboratory by
human AAA SMCs (Riches et al., 2013).
The luminal pressure was maintained at approximately 65mmHg, measured by
calculating the pressure drop from the bioreactor inlet. This value was selected
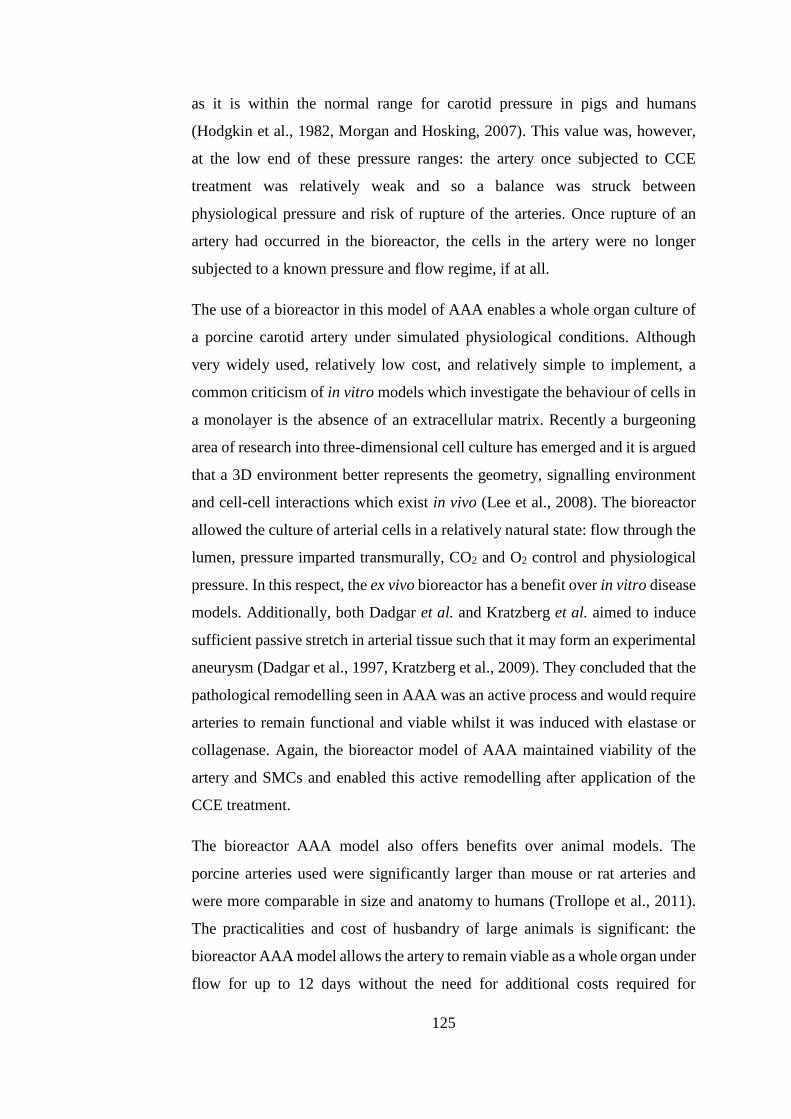
125
as it is within the normal range for carotid pressure in pigs and humans
(Hodgkin et al., 1982, Morgan and Hosking, 2007). This value was, however,
at the low end of these pressure ranges: the artery once subjected to CCE
treatment was relatively weak and so a balance was struck between
physiological pressure and risk of rupture of the arteries. Once rupture of an
artery had occurred in the bioreactor, the cells in the artery were no longer
subjected to a known pressure and flow regime, if at all.
The use of a bioreactor in this model of AAA enables a whole organ culture of
a porcine carotid artery under simulated physiological conditions. Although
very widely used, relatively low cost, and relatively simple to implement, a
common criticism of in vitro models which investigate the behaviour of cells in
a monolayer is the absence of an extracellular matrix. Recently a burgeoning
area of research into three-dimensional cell culture has emerged and it is argued
that a 3D environment better represents the geometry, signalling environment
and cell-cell interactions which exist in vivo (Lee et al., 2008). The bioreactor
allowed the culture of arterial cells in a relatively natural state: flow through the
lumen, pressure imparted transmurally, CO2 and O2 control and physiological
pressure. In this respect, the ex vivo bioreactor has a benefit over in vitro disease
models. Additionally, both Dadgar et al. and Kratzberg et al. aimed to induce
sufficient passive stretch in arterial tissue such that it may form an experimental
aneurysm (Dadgar et al., 1997, Kratzberg et al., 2009). They concluded that the
pathological remodelling seen in AAA was an active process and would require
arteries to remain functional and viable whilst it was induced with elastase or
collagenase. Again, the bioreactor model of AAA maintained viability of the
artery and SMCs and enabled this active remodelling after application of the
CCE treatment.
The bioreactor AAA model also offers benefits over animal models. The
porcine arteries used were significantly larger than mouse or rat arteries and
were more comparable in size and anatomy to humans (Trollope et al., 2011).
The practicalities and cost of husbandry of large animals is significant: the
bioreactor AAA model allows the artery to remain viable as a whole organ under
flow for up to 12 days without the need for additional costs required for
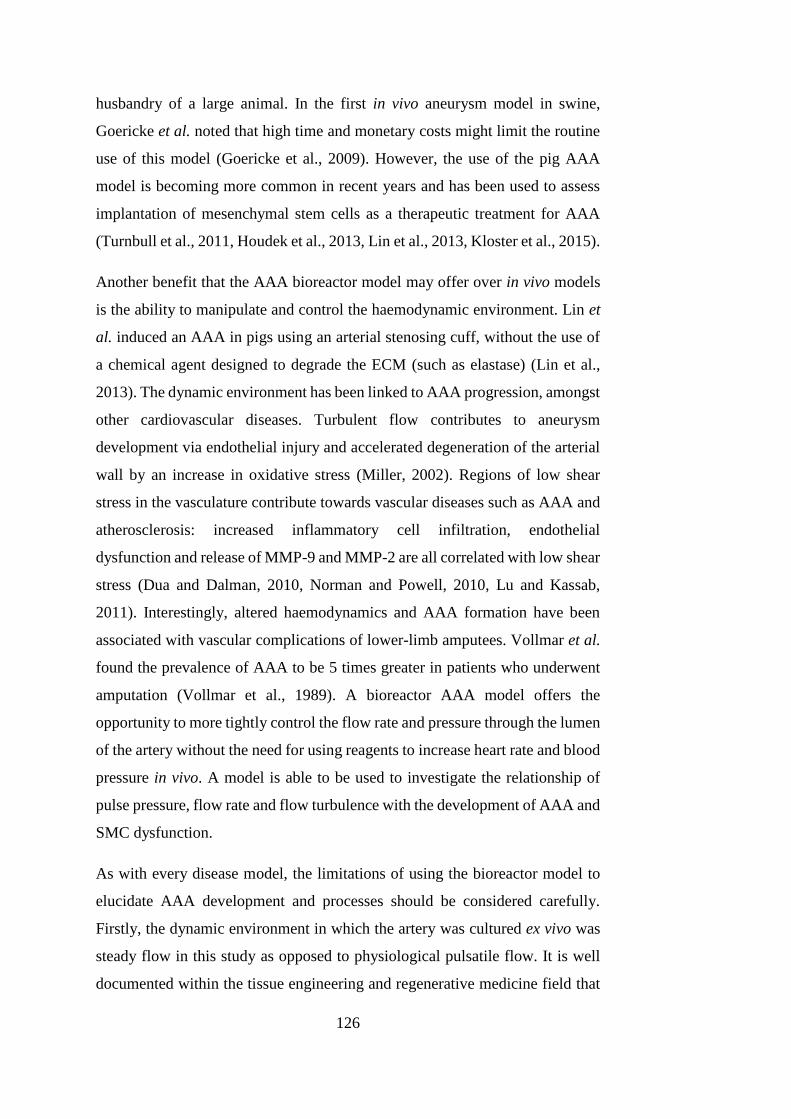
126
husbandry of a large animal. In the first in vivo aneurysm model in swine,
Goericke et al. noted that high time and monetary costs might limit the routine
use of this model (Goericke et al., 2009). However, the use of the pig AAA
model is becoming more common in recent years and has been used to assess
implantation of mesenchymal stem cells as a therapeutic treatment for AAA
(Turnbull et al., 2011, Houdek et al., 2013, Lin et al., 2013, Kloster et al., 2015).
Another benefit that the AAA bioreactor model may offer over in vivo models
is the ability to manipulate and control the haemodynamic environment. Lin et
al. induced an AAA in pigs using an arterial stenosing cuff, without the use of
a chemical agent designed to degrade the ECM (such as elastase) (Lin et al.,
2013). The dynamic environment has been linked to AAA progression, amongst
other cardiovascular diseases. Turbulent flow contributes to aneurysm
development via endothelial injury and accelerated degeneration of the arterial
wall by an increase in oxidative stress (Miller, 2002). Regions of low shear
stress in the vasculature contribute towards vascular diseases such as AAA and
atherosclerosis: increased inflammatory cell infiltration, endothelial
dysfunction and release of MMP-9 and MMP-2 are all correlated with low shear
stress (Dua and Dalman, 2010, Norman and Powell, 2010, Lu and Kassab,
2011). Interestingly, altered haemodynamics and AAA formation have been
associated with vascular complications of lower-limb amputees. Vollmar et al.
found the prevalence of AAA to be 5 times greater in patients who underwent
amputation (Vollmar et al., 1989). A bioreactor AAA model offers the
opportunity to more tightly control the flow rate and pressure through the lumen
of the artery without the need for using reagents to increase heart rate and blood
pressure in vivo. A model is able to be used to investigate the relationship of
pulse pressure, flow rate and flow turbulence with the development of AAA and
SMC dysfunction.
As with every disease model, the limitations of using the bioreactor model to
elucidate AAA development and processes should be considered carefully.
Firstly, the dynamic environment in which the artery was cultured ex vivo was
steady flow in this study as opposed to physiological pulsatile flow. It is well
documented within the tissue engineering and regenerative medicine field that
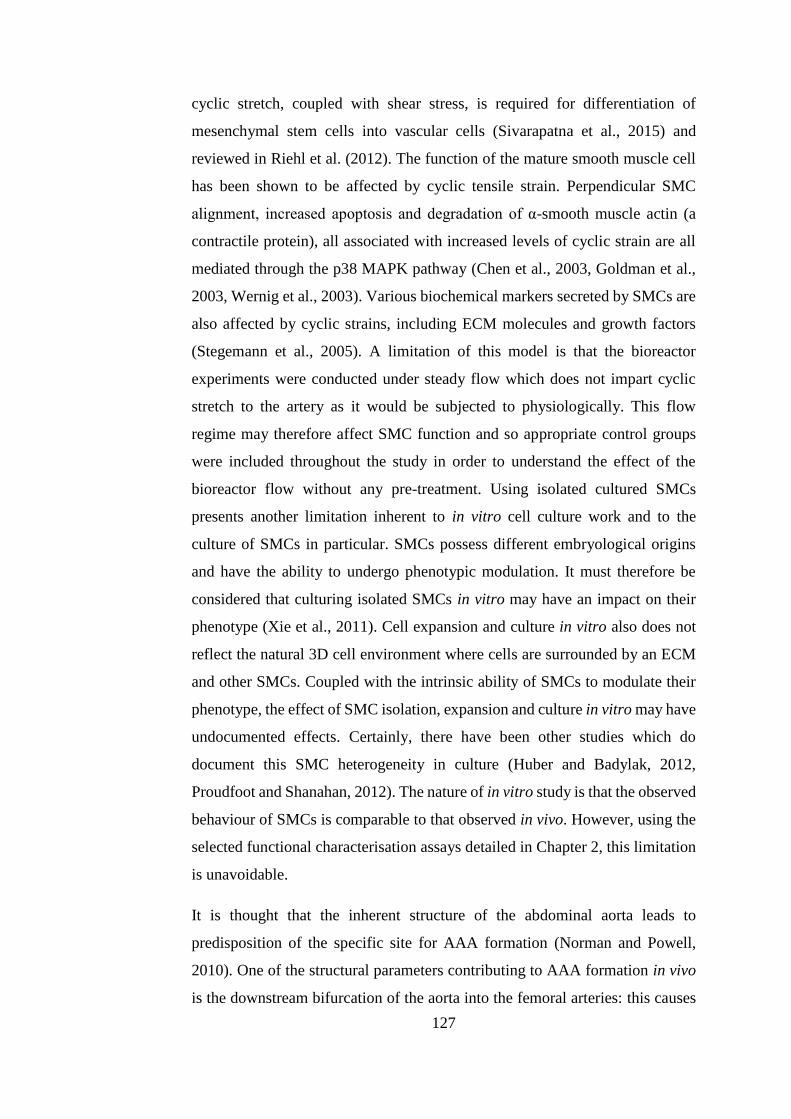
127
cyclic stretch, coupled with shear stress, is required for differentiation of
mesenchymal stem cells into vascular cells (Sivarapatna et al., 2015) and
reviewed in Riehl et al. (2012). The function of the mature smooth muscle cell
has been shown to be affected by cyclic tensile strain. Perpendicular SMC
alignment, increased apoptosis and degradation of α-smooth muscle actin (a
contractile protein), all associated with increased levels of cyclic strain are all
mediated through the p38 MAPK pathway (Chen et al., 2003, Goldman et al.,
2003, Wernig et al., 2003). Various biochemical markers secreted by SMCs are
also affected by cyclic strains, including ECM molecules and growth factors
(Stegemann et al., 2005). A limitation of this model is that the bioreactor
experiments were conducted under steady flow which does not impart cyclic
stretch to the artery as it would be subjected to physiologically. This flow
regime may therefore affect SMC function and so appropriate control groups
were included throughout the study in order to understand the effect of the
bioreactor flow without any pre-treatment. Using isolated cultured SMCs
presents another limitation inherent to in vitro cell culture work and to the
culture of SMCs in particular. SMCs possess different embryological origins
and have the ability to undergo phenotypic modulation. It must therefore be
considered that culturing isolated SMCs in vitro may have an impact on their
phenotype (Xie et al., 2011). Cell expansion and culture in vitro also does not
reflect the natural 3D cell environment where cells are surrounded by an ECM
and other SMCs. Coupled with the intrinsic ability of SMCs to modulate their
phenotype, the effect of SMC isolation, expansion and culture in vitro may have
undocumented effects. Certainly, there have been other studies which do
document this SMC heterogeneity in culture (Huber and Badylak, 2012,
Proudfoot and Shanahan, 2012). The nature of in vitro study is that the observed
behaviour of SMCs is comparable to that observed in vivo. However, using the
selected functional characterisation assays detailed in Chapter 2, this limitation
is unavoidable.
It is thought that the inherent structure of the abdominal aorta leads to
predisposition of the specific site for AAA formation (Norman and Powell,
2010). One of the structural parameters contributing to AAA formation in vivo
is the downstream bifurcation of the aorta into the femoral arteries: this causes
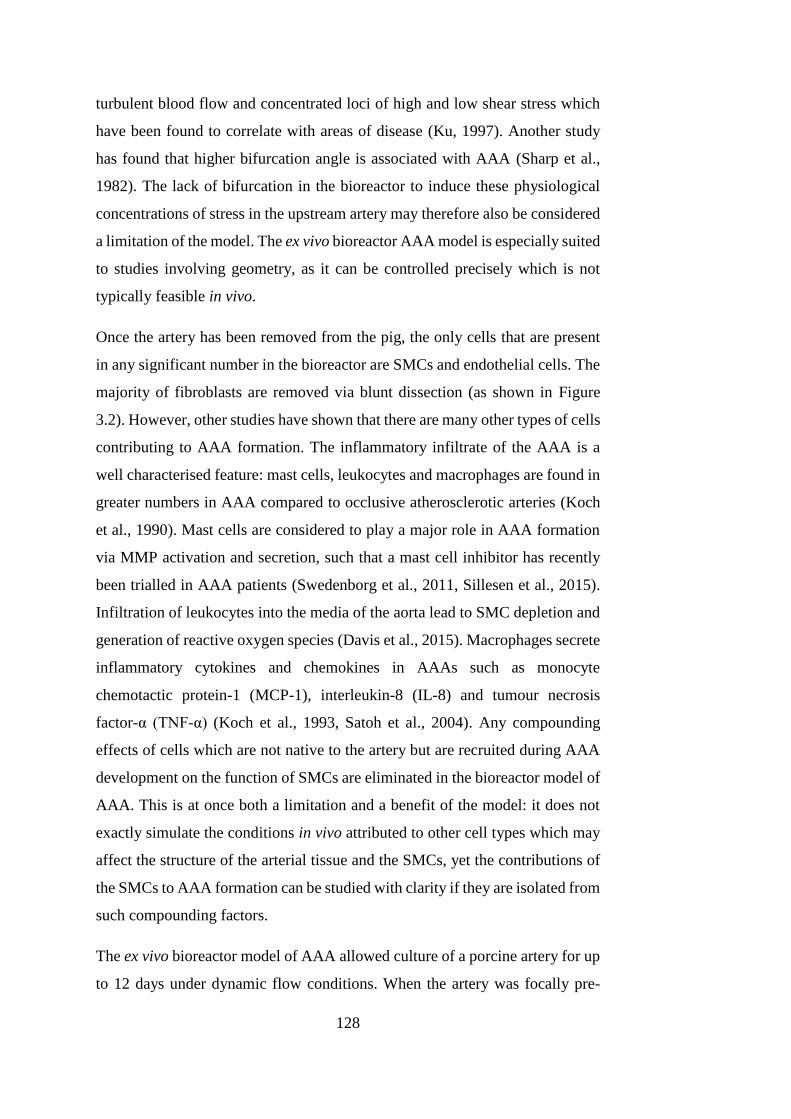
128
turbulent blood flow and concentrated loci of high and low shear stress which
have been found to correlate with areas of disease (Ku, 1997). Another study
has found that higher bifurcation angle is associated with AAA (Sharp et al.,
1982). The lack of bifurcation in the bioreactor to induce these physiological
concentrations of stress in the upstream artery may therefore also be considered
a limitation of the model. The ex vivo bioreactor AAA model is especially suited
to studies involving geometry, as it can be controlled precisely which is not
typically feasible in vivo.
Once the artery has been removed from the pig, the only cells that are present
in any significant number in the bioreactor are SMCs and endothelial cells. The
majority of fibroblasts are removed via blunt dissection (as shown in Figure
3.2). However, other studies have shown that there are many other types of cells
contributing to AAA formation. The inflammatory infiltrate of the AAA is a
well characterised feature: mast cells, leukocytes and macrophages are found in
greater numbers in AAA compared to occlusive atherosclerotic arteries (Koch
et al., 1990). Mast cells are considered to play a major role in AAA formation
via MMP activation and secretion, such that a mast cell inhibitor has recently
been trialled in AAA patients (Swedenborg et al., 2011, Sillesen et al., 2015).
Infiltration of leukocytes into the media of the aorta lead to SMC depletion and
generation of reactive oxygen species (Davis et al., 2015). Macrophages secrete
inflammatory cytokines and chemokines in AAAs such as monocyte
chemotactic protein-1 (MCP-1), interleukin-8 (IL-8) and tumour necrosis
factor-α (TNF-α) (Koch et al., 1993, Satoh et al., 2004). Any compounding
effects of cells which are not native to the artery but are recruited during AAA
development on the function of SMCs are eliminated in the bioreactor model of
AAA. This is at once both a limitation and a benefit of the model: it does not
exactly simulate the conditions in vivo attributed to other cell types which may
affect the structure of the arterial tissue and the SMCs, yet the contributions of
the SMCs to AAA formation can be studied with clarity if they are isolated from
such compounding factors.
The ex vivo bioreactor model of AAA allowed culture of a porcine artery for up
to 12 days under dynamic flow conditions. When the artery was focally pre-
129
treated with a combination of collagenase and elastase, the SMCs in the artery
after 12 days in bioreactor culture are comparable to human end-stage AAA
SMCs (Riches et al., 2013). The local pressures at positions throughout the
bioreactor under steady flow have been characterised in order to understand the
dynamic culture environment. The flow rate through the bioreactor under steady
flow has also been calibrated with regards to the peristaltic pump. The
bioreactor AAA model represents a practical and relatively low cost large
animal model of AAA which has been used to characterise the structure and
function of SMCs over time and their contribution to arterial biomechanics in
the subsequent chapters of this thesis. The aim is to uncover therapeutic targets
of AAA in SMCs in the early-stages of the disease.

130

131
CHAPTER 4
TISSUE STRUCTURE OF EX VIVO AAA MODEL
132
CHAPTER 4 TISSUE STRUCTURE OF EX VIVO
AAA MODEL
This chapter examines the changes in structure of tissue in terms of
histoarchitecture and luminal perimeter due to the bioreactor AAA model
methodology described in the previous chapter (Chapter 3). Firstly, the effect
of dynamic/static culture, CCE treatment and model stage (EARLY/END) on
tissue histoarchitecture will be examined. The last section details the vessel
dilation seen in the bioreactor AAA model in terms of luminal perimeter
(Section 2.7.2.2).
4.1. INTRODUCTION
A ubiquitous characteristic of AAA is the degradation and fragmentation of the
extracellular matrix (ECM), most notably the elastin component. The function
of elastin is to provide the recoiling mechanism of the arterial wall in response
to blood pressure pulses. The other main component of the ECM is load-bearing
collagen fibrils; the fate of collagen in response to AAA formation appears to
be less consistent, with various studies finding levels to increase, decrease and
remain unchanged. It is, however, the generally accepted view that collagen
content tends to increase in AAA. These alterations in the composition of the
ECM are coupled with a loss of SMCs throughout the arterial wall (Lopez-
Candales et al., 1997, Henderson et al., 1999). When considering suitability of
animal models, often the argument for the success of a model centres around
the ability to mimic the histological structure of the human disease as opposed
to a more crude surgical patch model (Daugherty and Cassis, 2004, Tsui, 2010,
Trollope et al., 2011). The gold standard mark of success for experimental AAA
models is to be able to induce a progressive dilatation of the artery.
Exploring the structure of the ECM in the ex vivo model is useful, not only to
compare it to the structure of human AAA, but also to compare it to other in
vivo models as a comparator. To do this, histological staining of elastin and
collagen and immunostaining of α-smooth muscle actin (α-SMA) were
133
undertaken across various treatment groups with various combinations of
treatment and culture conditions at two different time-points. The effects of the
CCE treatment and dynamic bioreactor culture alone were investigated, as well
as the effect of the combination of both.
Porcine carotid arteries were subjected to either a pre-treatment containing a
combination of collagenase and elastase or a vehicle gel treatment. The
treatment was washed off after 3 hours and the arteries were cultured in parallel
bioreactors. This method is fully described in Chapter 3. The arteries were
cultured in the bioreactor for either 3 days or 12 days representing the early and
end-stage disease respectively (Riches et al., 2013). Corresponding arterial rings
were also cultured statically.
4.2. CHAPTER AIMS AND OBJECTIVES
The aim of the work presented in this chapter was to investigate the
histoarchitecture and gross morphology of the tissues produced using the ex vivo
bioreactor model of AAA protocol as fully described in Chapter 3. The effect
of the bioreactor culture and the CCE treatment used alone and in combination
was examined. In terms of arterial structure, the ex vivo AAA model tissue was
then compared to human AAA tissue as reported in the literature as an
evaluation of the model. These changes in gross morphology as a result of
treatment or culture regime were investigated with respect to time, as
determined at two time-points representing the early- and end-stage AAA
disease.
4.2.1. OBJECTIVES
Specifically, the objectives of this chapter were:
1 To examine changes in the gross morphology of the whole vessel under
various treatment and culture regimes at two time-points, 3 days
(EARLY) and 12 days (END).
134
2 To examine the levels of elastin, collagen and α-smooth muscle actin
qualitatively at these points
3 To determine changes in the luminal perimeter of the artery at these
points
4.3. TISSUE MORPHOLOGY
Quantitative measurements of the gross morphology of the arteries once
installed into the bioreactor was not possible, or precise enough, as maintaining
sterility was of utmost importance during the culture period. Therefore,
introducing new components into the chamber as a reference for image analysis
from photographs was not deemed possible. Representative qualitative images
of the arteries installed into the bioreactor and after removal are shown in Figure
4.1. In general, the BIOVEH arteries did not show distension, even when
pressurised. In contrast, CCE treated tissue tended to be much more distended
when subjected to the same pressure and flow conditions in the bioreactor.
Often, the wall of the BIOCCE arteries was observed to be translucent – this
can be seen in Figure 4.1A in the centre of the BIOCCE artery. Once the
BIOVEH and BIOCCE arteries were removed from the bioreactor, the greater
degree of distention in the BIOCCE arteries compared to BIOVEH arteries was
still apparent.
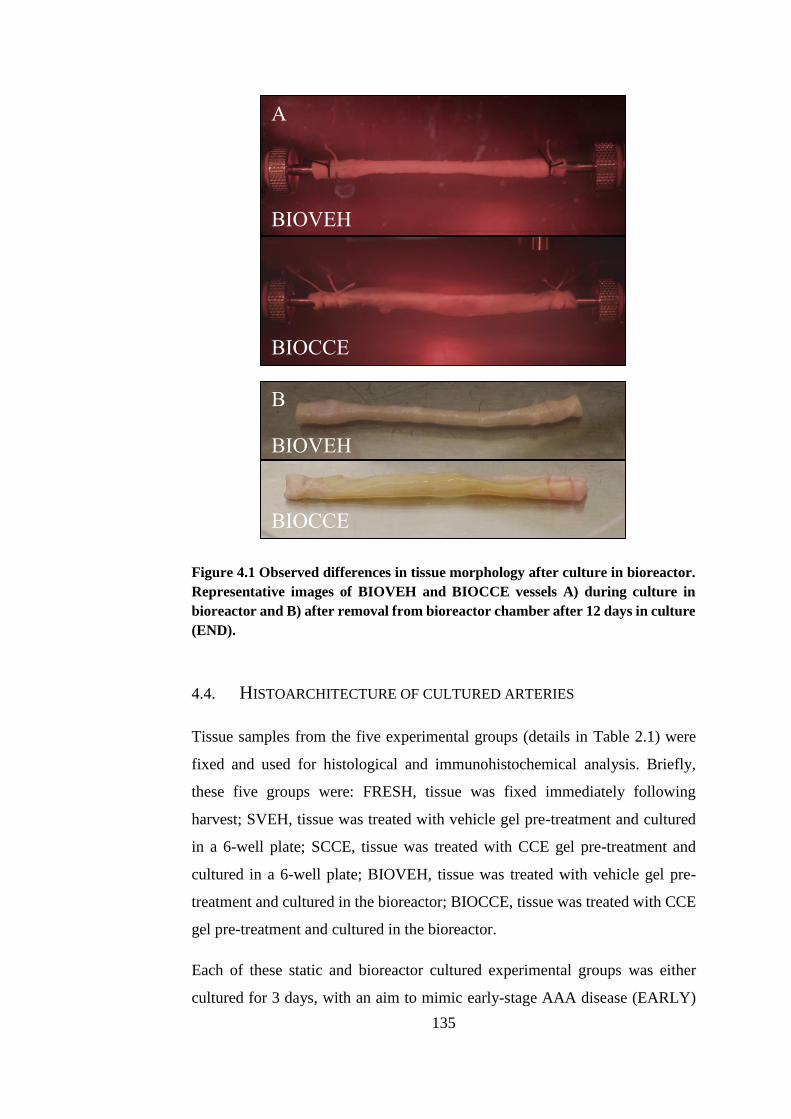
135
Figure 4.1 Observed differences in tissue morphology after culture in bioreactor.
Representative images of BIOVEH and BIOCCE vessels A) during culture in
bioreactor and B) after removal from bioreactor chamber after 12 days in culture
(END).
4.4. HISTOARCHITECTURE OF CULTURED ARTERIES
Tissue samples from the five experimental groups (details in Table 2.1) were
fixed and used for histological and immunohistochemical analysis. Briefly,
these five groups were: FRESH, tissue was fixed immediately following
harvest; SVEH, tissue was treated with vehicle gel pre-treatment and cultured
in a 6-well plate; SCCE, tissue was treated with CCE gel pre-treatment and
cultured in a 6-well plate; BIOVEH, tissue was treated with vehicle gel pre-
treatment and cultured in the bioreactor; BIOCCE, tissue was treated with CCE
gel pre-treatment and cultured in the bioreactor.
Each of these static and bioreactor cultured experimental groups was either
cultured for 3 days, with an aim to mimic early-stage AAA disease (EARLY)
BIOVEH
BIOCCE
A
B
BIOVEH
BIOCCE
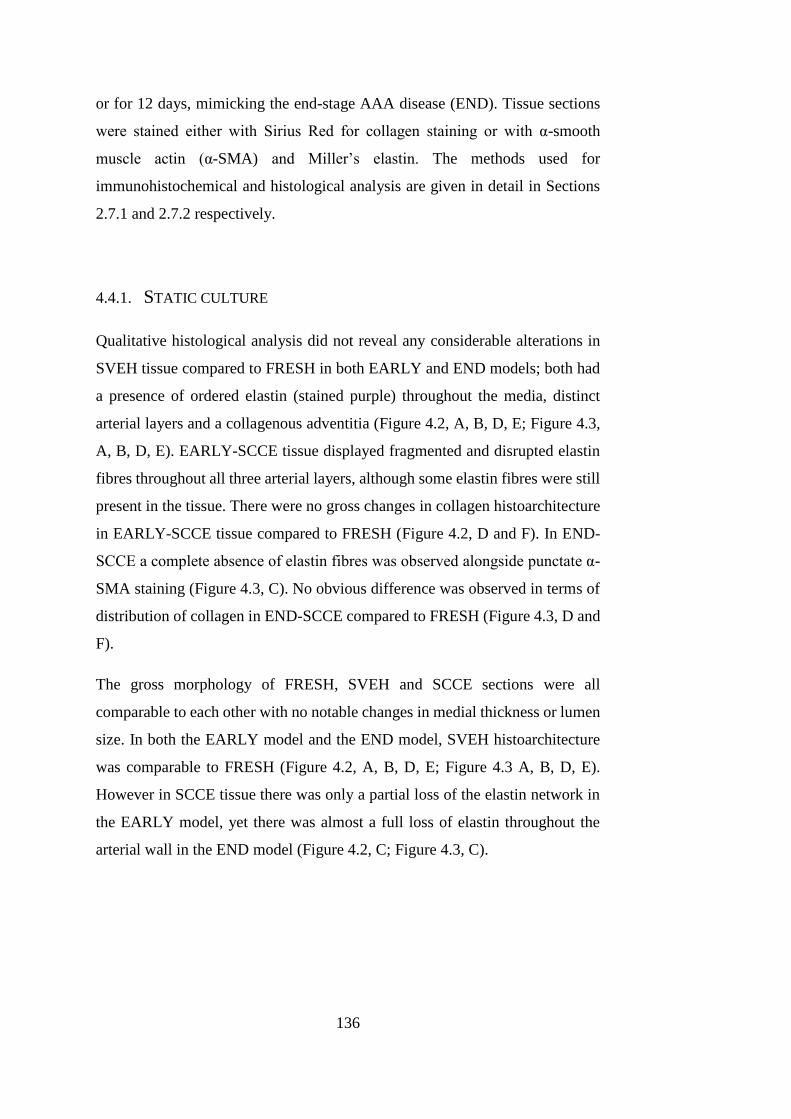
136
or for 12 days, mimicking the end-stage AAA disease (END). Tissue sections
were stained either with Sirius Red for collagen staining or with α-smooth
muscle actin (α-SMA) and Miller’s elastin. The methods used for
immunohistochemical and histological analysis are given in detail in Sections
2.7.1 and 2.7.2 respectively.
4.4.1. STATIC CULTURE
Qualitative histological analysis did not reveal any considerable alterations in
SVEH tissue compared to FRESH in both EARLY and END models; both had
a presence of ordered elastin (stained purple) throughout the media, distinct
arterial layers and a collagenous adventitia (Figure 4.2, A, B, D, E; Figure 4.3,
A, B, D, E). EARLY-SCCE tissue displayed fragmented and disrupted elastin
fibres throughout all three arterial layers, although some elastin fibres were still
present in the tissue. There were no gross changes in collagen histoarchitecture
in EARLY-SCCE tissue compared to FRESH (Figure 4.2, D and F). In END-
SCCE a complete absence of elastin fibres was observed alongside punctate α-
SMA staining (Figure 4.3, C). No obvious difference was observed in terms of
distribution of collagen in END-SCCE compared to FRESH (Figure 4.3, D and
F).
The gross morphology of FRESH, SVEH and SCCE sections were all
comparable to each other with no notable changes in medial thickness or lumen
size. In both the EARLY model and the END model, SVEH histoarchitecture
was comparable to FRESH (Figure 4.2, A, B, D, E; Figure 4.3 A, B, D, E).
However in SCCE tissue there was only a partial loss of the elastin network in
the EARLY model, yet there was almost a full loss of elastin throughout the
arterial wall in the END model (Figure 4.2, C; Figure 4.3, C).
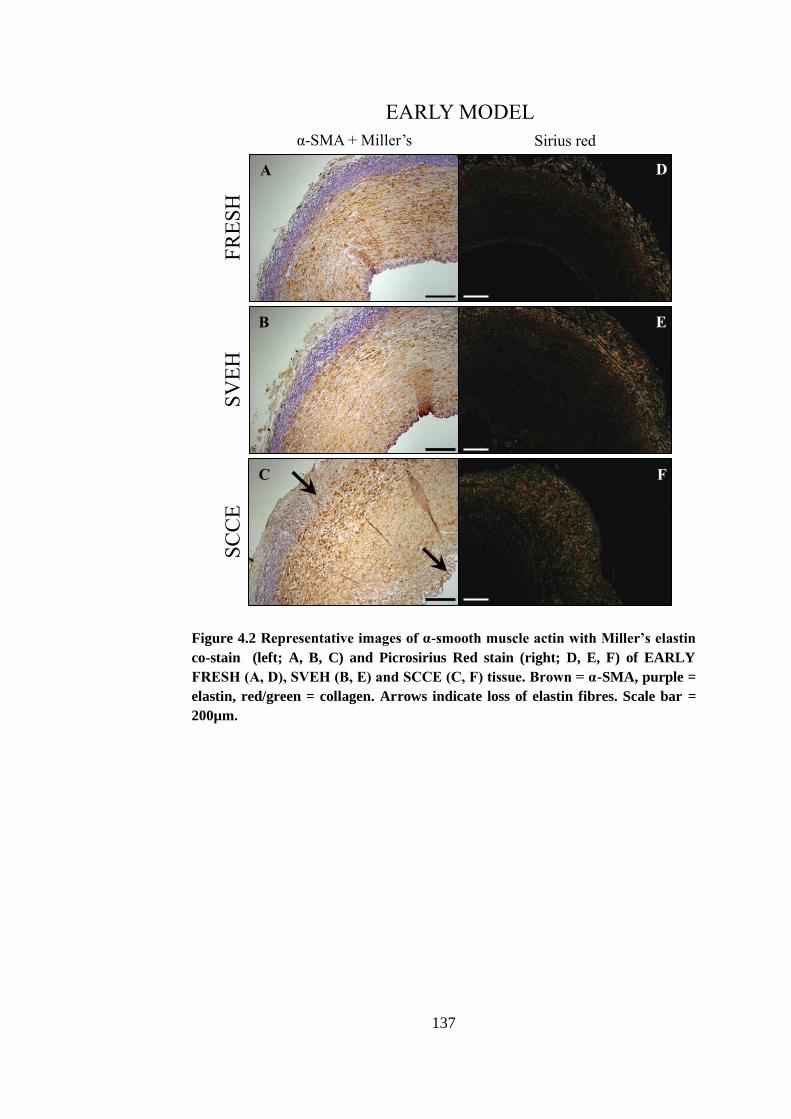
137
Figure 4.2 Representative images of α-smooth muscle actin with Miller’s elastin
co-stain (left; A, B, C) and Picrosirius Red stain (right; D, E, F) of EARLY
FRESH (A, D), SVEH (B, E) and SCCE (C, F) tissue. Brown = α-SMA, purple =
elastin, red/green = collagen. Arrows indicate loss of elastin fibres. Scale bar =
200µm.
FR
ES
H
SV
EH
S
CC
E
EARLY MODEL
α-SMA + Miller’s Sirius red
A
B
C
D
E
F
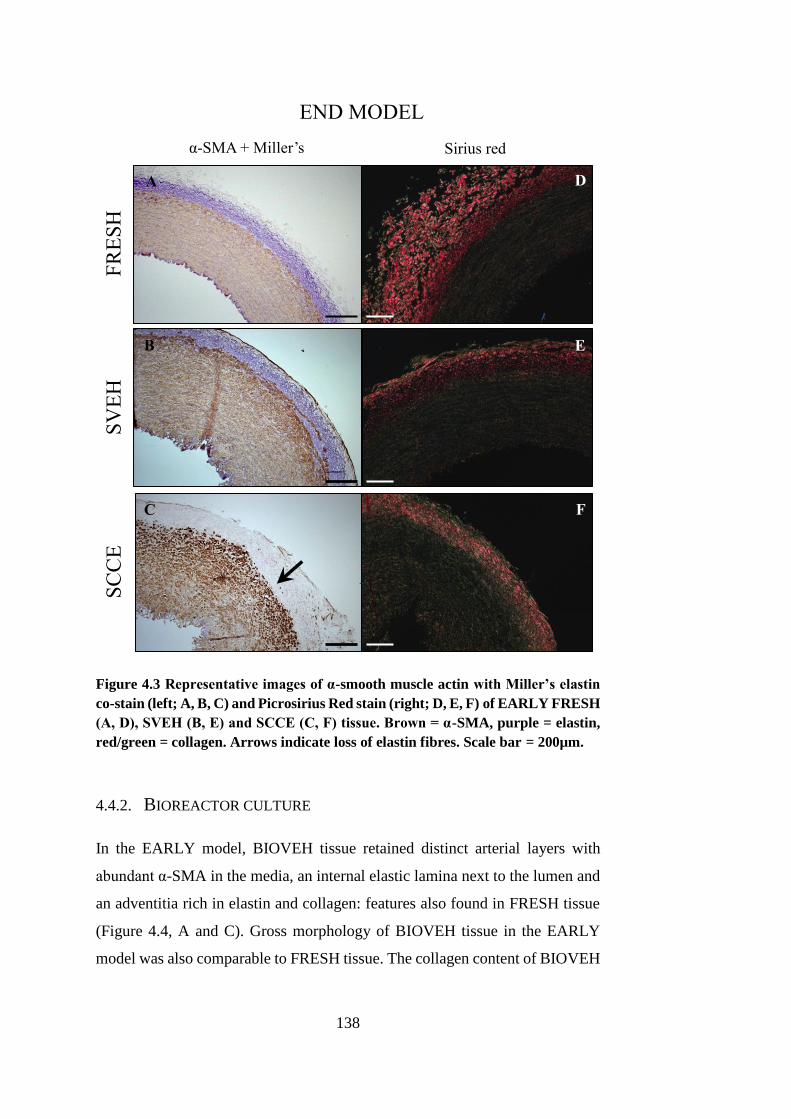
138
Figure 4.3 Representative images of α-smooth muscle actin with Miller’s elastin
co-stain (left; A, B, C) and Picrosirius Red stain (right; D, E, F) of EARLY FRESH
(A, D), SVEH (B, E) and SCCE (C, F) tissue. Brown = α-SMA, purple = elastin,
red/green = collagen. Arrows indicate loss of elastin fibres. Scale bar = 200µm.
4.4.2. BIOREACTOR CULTURE
In the EARLY model, BIOVEH tissue retained distinct arterial layers with
abundant α-SMA in the media, an internal elastic lamina next to the lumen and
an adventitia rich in elastin and collagen: features also found in FRESH tissue
(Figure 4.4, A and C). Gross morphology of BIOVEH tissue in the EARLY
model was also comparable to FRESH tissue. The collagen content of BIOVEH
FR
ES
H
SV
EH
S
CC
E
END MODEL
α-SMA + Miller’s Sirius red
A
B
C
D
E
F
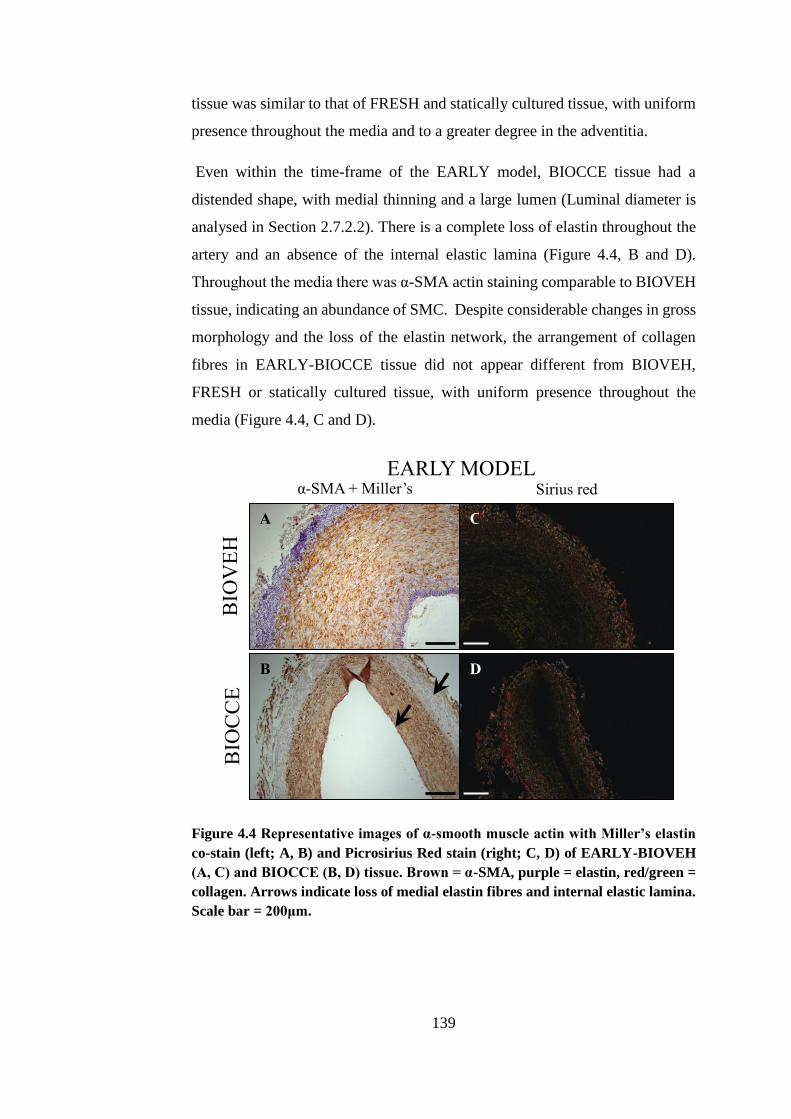
139
tissue was similar to that of FRESH and statically cultured tissue, with uniform
presence throughout the media and to a greater degree in the adventitia.
Even within the time-frame of the EARLY model, BIOCCE tissue had a
distended shape, with medial thinning and a large lumen (Luminal diameter is
analysed in Section 2.7.2.2). There is a complete loss of elastin throughout the
artery and an absence of the internal elastic lamina (Figure 4.4, B and D).
Throughout the media there was α-SMA actin staining comparable to BIOVEH
tissue, indicating an abundance of SMC. Despite considerable changes in gross
morphology and the loss of the elastin network, the arrangement of collagen
fibres in EARLY-BIOCCE tissue did not appear different from BIOVEH,
FRESH or statically cultured tissue, with uniform presence throughout the
media (Figure 4.4, C and D).
Figure 4.4 Representative images of α-smooth muscle actin with Miller’s elastin
co-stain (left; A, B) and Picrosirius Red stain (right; C, D) of EARLY-BIOVEH
(A, C) and BIOCCE (B, D) tissue. Brown = α-SMA, purple = elastin, red/green =
collagen. Arrows indicate loss of medial elastin fibres and internal elastic lamina.
Scale bar = 200μm.
BIO
VE
H
BIO
CC
E
EARLY MODEL
α-SMA + Miller’s Sirius red
A
B D
C
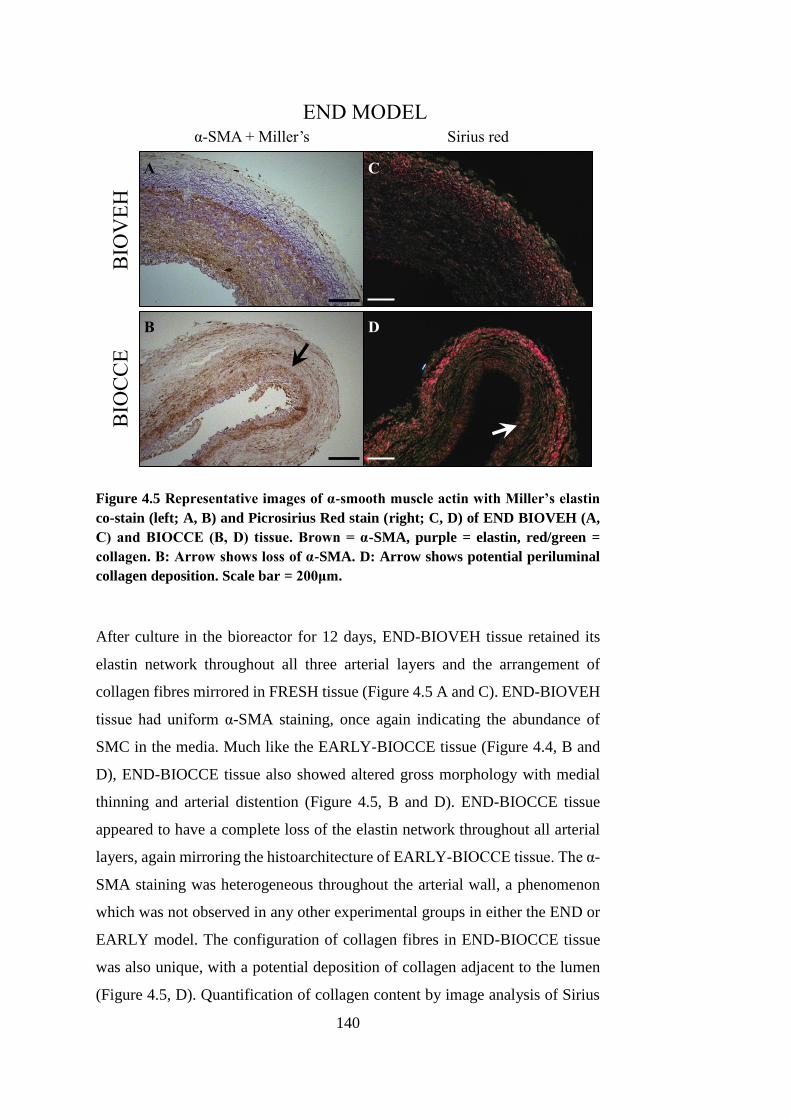
140
Figure 4.5 Representative images of α-smooth muscle actin with Miller’s elastin
co-stain (left; A, B) and Picrosirius Red stain (right; C, D) of END BIOVEH (A,
C) and BIOCCE (B, D) tissue. Brown = α-SMA, purple = elastin, red/green =
collagen. B: Arrow shows loss of α-SMA. D: Arrow shows potential periluminal
collagen deposition. Scale bar = 200μm.
After culture in the bioreactor for 12 days, END-BIOVEH tissue retained its
elastin network throughout all three arterial layers and the arrangement of
collagen fibres mirrored in FRESH tissue (Figure 4.5 A and C). END-BIOVEH
tissue had uniform α-SMA staining, once again indicating the abundance of
SMC in the media. Much like the EARLY-BIOCCE tissue (Figure 4.4, B and
D), END-BIOCCE tissue also showed altered gross morphology with medial
thinning and arterial distention (Figure 4.5, B and D). END-BIOCCE tissue
appeared to have a complete loss of the elastin network throughout all arterial
layers, again mirroring the histoarchitecture of EARLY-BIOCCE tissue. The α-
SMA staining was heterogeneous throughout the arterial wall, a phenomenon
which was not observed in any other experimental groups in either the END or
EARLY model. The configuration of collagen fibres in END-BIOCCE tissue
was also unique, with a potential deposition of collagen adjacent to the lumen
(Figure 4.5, D). Quantification of collagen content by image analysis of Sirius
BIO
VE
H
BIO
CC
E
END MODEL
α-SMA + Miller’s Sirius red
A
B D
C
141
red stained sections was not attempted and so this is only subjective and
qualitative evidence of this periluminal deposition.
In summary, application of vehicle pre-treatment did not affect the
histoarchitecture of the tissue whether it was subjected to either static (SVEH)
or bioreactor culture (BIOVEH). After both 3 days (EARLY) and 12 days
(END) in culture in the bioreactor, VEH treated arteries (BIOVEH) had a
similar architecture to fresh tissue fixed straight after harvest (FRESH).
Application of CCE treatment disrupted the elastin network in arteries cultured
statically and in the bioreactor. However, the gross morphology of the tissue
was only considerably altered when the artery was subjected to both CCE pre-
treatment and bioreactor culture (BIOCCE). This alteration in tissue
morphology was observable in both the EARLY and END models. It is a
possibility that after 12 days in culture in the bioreactor, arteries which received
CCE pre-treatment deposit collagen around the lumen of the artery (END-
BIOCCE), a feature which was not observed in the EARLY model.
4.5. LUMINAL DIAMETER
The ubiquitous characteristic of the AAA from which its name is derived is
arterial dilation; to be termed aneurysmal in clinical terms the diameter must
reach 150% of the original (Powell, 1998, Nordon et al., 2011). Bearing this in
mind, the luminal perimeter of ten fixed, stained sections from each group was
measured using ImageJ and idealised as the diameter of a circle with
circumference equal to this measured luminal perimeter (as described in Section
2.7.2.2). The results are presented in Figure 4.6. The luminal diameters of
BIOVEH and BIOCCE vessels are presented as a percentage of the luminal
diameter of their respective FRESH vessel from the same animal in order to
mitigate the effects of inter-animal variance.
The luminal diameter of BIOVEH vessels was not affected by culture time in
the bioreactor. BIOCCE vessels typically had a greater luminal diameter than
BIOVEH vessels at both model stages, though this difference was more
pronounced in the EARLY model compared to the END model. There was a
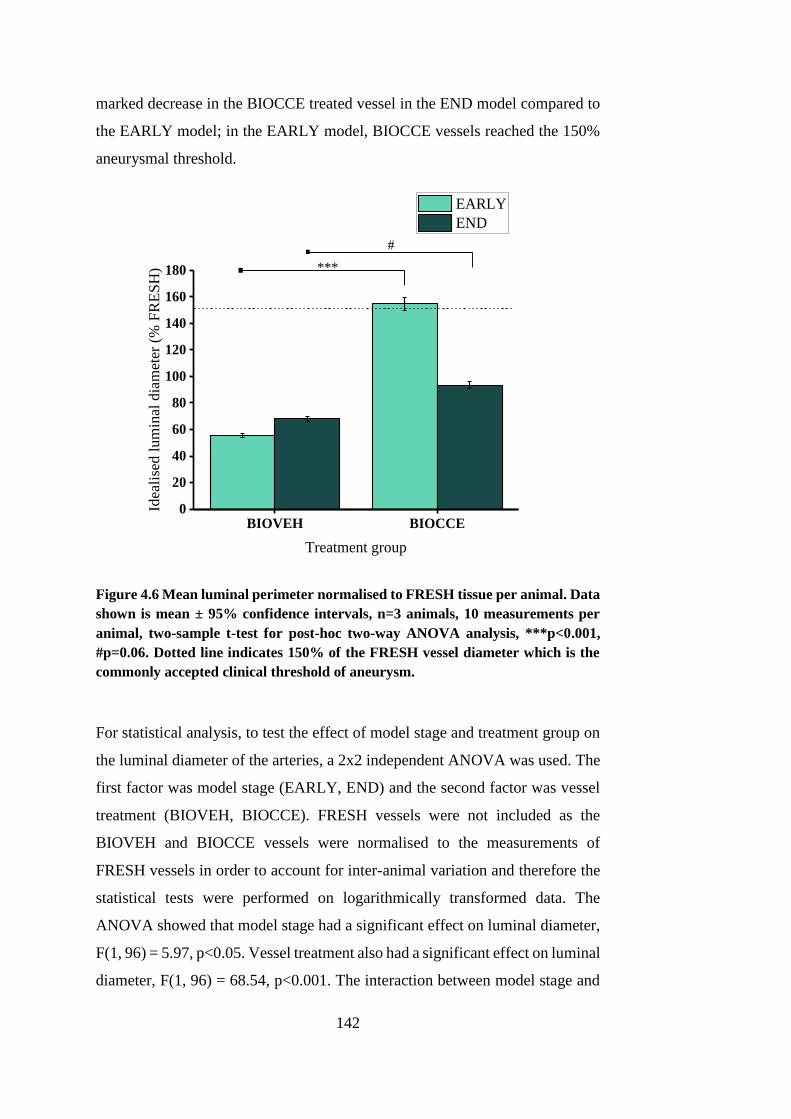
142
marked decrease in the BIOCCE treated vessel in the END model compared to
the EARLY model; in the EARLY model, BIOCCE vessels reached the 150%
aneurysmal threshold.
BIOVEH BIOCCE0
20
40
60
80
100
120
140
160
180
Idea
lise
d l
um
inal
dia
met
er (
% F
RE
SH
)
Treatment group
EARLY
END
***. . #
Figure 4.6 Mean luminal perimeter normalised to FRESH tissue per animal. Data
shown is mean ± 95% confidence intervals, n=3 animals, 10 measurements per
animal, two-sample t-test for post-hoc two-way ANOVA analysis, ***p<0.001,
#p=0.06. Dotted line indicates 150% of the FRESH vessel diameter which is the
commonly accepted clinical threshold of aneurysm.
For statistical analysis, to test the effect of model stage and treatment group on
the luminal diameter of the arteries, a 2x2 independent ANOVA was used. The
first factor was model stage (EARLY, END) and the second factor was vessel
treatment (BIOVEH, BIOCCE). FRESH vessels were not included as the
BIOVEH and BIOCCE vessels were normalised to the measurements of
FRESH vessels in order to account for inter-animal variation and therefore the
statistical tests were performed on logarithmically transformed data. The
ANOVA showed that model stage had a significant effect on luminal diameter,
F(1, 96) = 5.97, p<0.05. Vessel treatment also had a significant effect on luminal
diameter, F(1, 96) = 68.54, p<0.001. The interaction between model stage and
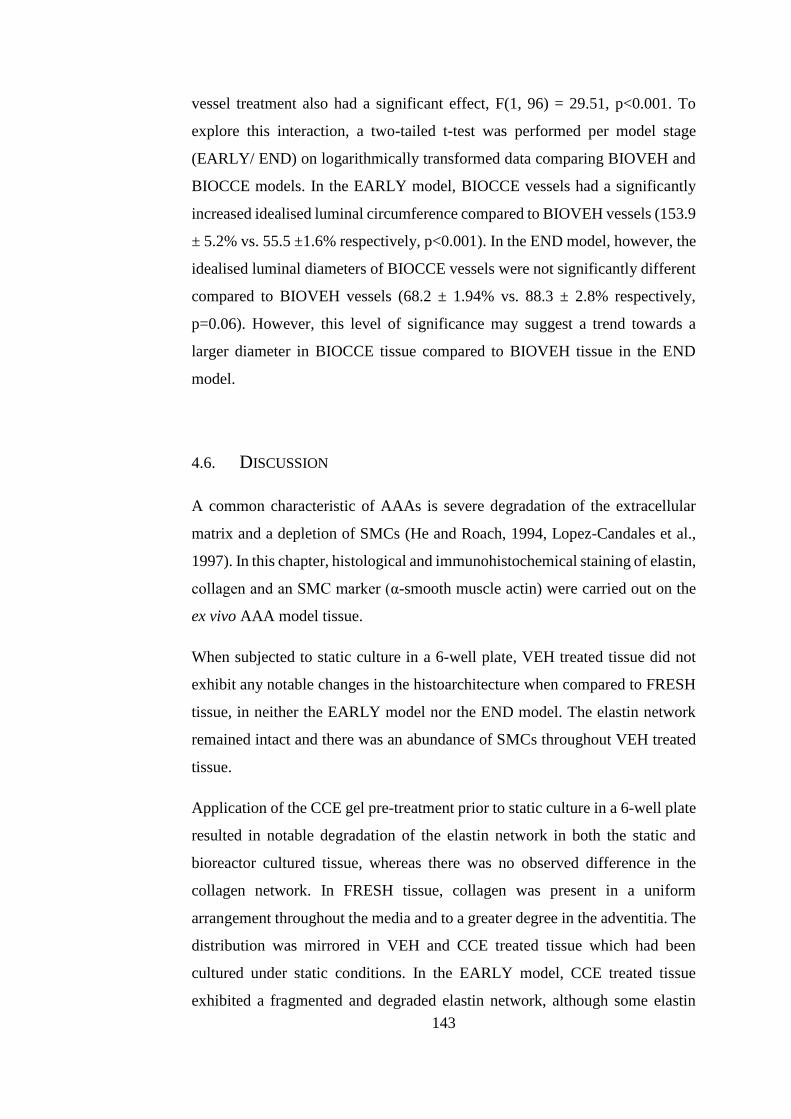
143
vessel treatment also had a significant effect, F(1, 96) = 29.51, p<0.001. To
explore this interaction, a two-tailed t-test was performed per model stage
(EARLY/ END) on logarithmically transformed data comparing BIOVEH and
BIOCCE models. In the EARLY model, BIOCCE vessels had a significantly
increased idealised luminal circumference compared to BIOVEH vessels (153.9
± 5.2% vs. 55.5 ±1.6% respectively, p<0.001). In the END model, however, the
idealised luminal diameters of BIOCCE vessels were not significantly different
compared to BIOVEH vessels (68.2 ± 1.94% vs. 88.3 ± 2.8% respectively,
p=0.06). However, this level of significance may suggest a trend towards a
larger diameter in BIOCCE tissue compared to BIOVEH tissue in the END
model.
4.6. DISCUSSION
A common characteristic of AAAs is severe degradation of the extracellular
matrix and a depletion of SMCs (He and Roach, 1994, Lopez-Candales et al.,
1997). In this chapter, histological and immunohistochemical staining of elastin,
collagen and an SMC marker (α-smooth muscle actin) were carried out on the
ex vivo AAA model tissue.
When subjected to static culture in a 6-well plate, VEH treated tissue did not
exhibit any notable changes in the histoarchitecture when compared to FRESH
tissue, in neither the EARLY model nor the END model. The elastin network
remained intact and there was an abundance of SMCs throughout VEH treated
tissue.
Application of the CCE gel pre-treatment prior to static culture in a 6-well plate
resulted in notable degradation of the elastin network in both the static and
bioreactor cultured tissue, whereas there was no observed difference in the
collagen network. In FRESH tissue, collagen was present in a uniform
arrangement throughout the media and to a greater degree in the adventitia. The
distribution was mirrored in VEH and CCE treated tissue which had been
cultured under static conditions. In the EARLY model, CCE treated tissue
exhibited a fragmented and degraded elastin network, although some elastin
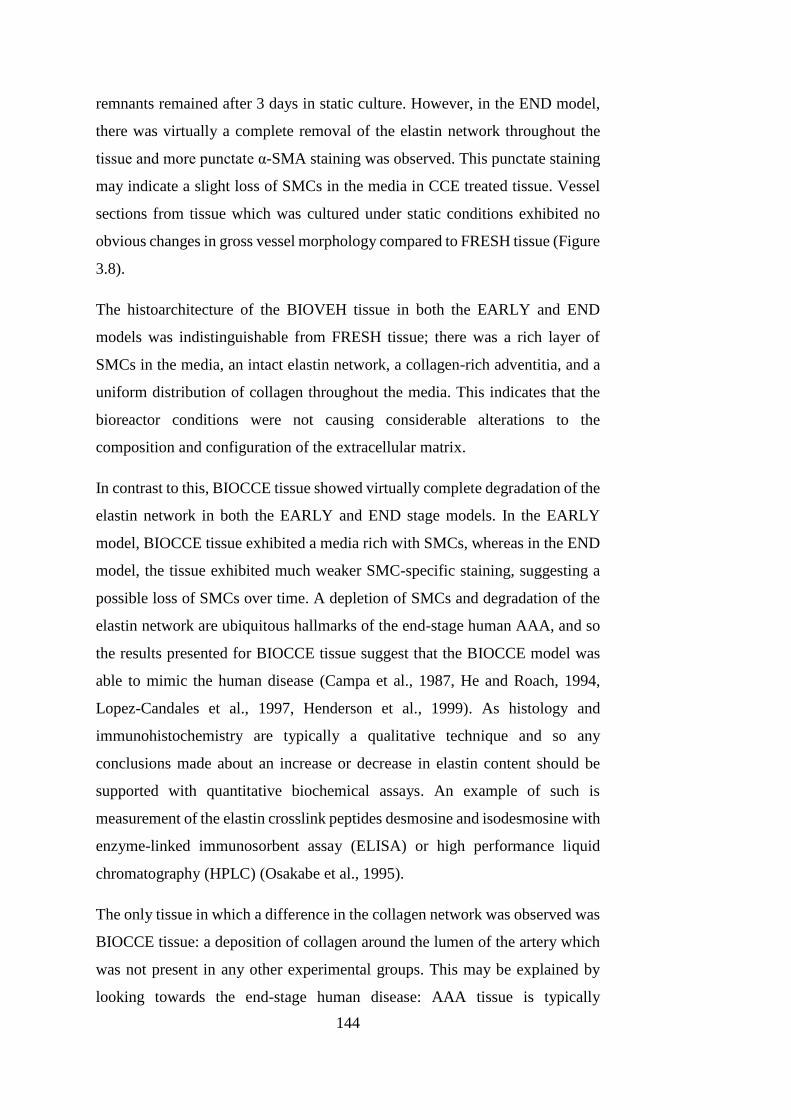
144
remnants remained after 3 days in static culture. However, in the END model,
there was virtually a complete removal of the elastin network throughout the
tissue and more punctate α-SMA staining was observed. This punctate staining
may indicate a slight loss of SMCs in the media in CCE treated tissue. Vessel
sections from tissue which was cultured under static conditions exhibited no
obvious changes in gross vessel morphology compared to FRESH tissue (Figure
3.8).
The histoarchitecture of the BIOVEH tissue in both the EARLY and END
models was indistinguishable from FRESH tissue; there was a rich layer of
SMCs in the media, an intact elastin network, a collagen-rich adventitia, and a
uniform distribution of collagen throughout the media. This indicates that the
bioreactor conditions were not causing considerable alterations to the
composition and configuration of the extracellular matrix.
In contrast to this, BIOCCE tissue showed virtually complete degradation of the
elastin network in both the EARLY and END stage models. In the EARLY
model, BIOCCE tissue exhibited a media rich with SMCs, whereas in the END
model, the tissue exhibited much weaker SMC-specific staining, suggesting a
possible loss of SMCs over time. A depletion of SMCs and degradation of the
elastin network are ubiquitous hallmarks of the end-stage human AAA, and so
the results presented for BIOCCE tissue suggest that the BIOCCE model was
able to mimic the human disease (Campa et al., 1987, He and Roach, 1994,
Lopez-Candales et al., 1997, Henderson et al., 1999). As histology and
immunohistochemistry are typically a qualitative technique and so any
conclusions made about an increase or decrease in elastin content should be
supported with quantitative biochemical assays. An example of such is
measurement of the elastin crosslink peptides desmosine and isodesmosine with
enzyme-linked immunosorbent assay (ELISA) or high performance liquid
chromatography (HPLC) (Osakabe et al., 1995).
The only tissue in which a difference in the collagen network was observed was
BIOCCE tissue: a deposition of collagen around the lumen of the artery which
was not present in any other experimental groups. This may be explained by
looking towards the end-stage human disease: AAA tissue is typically
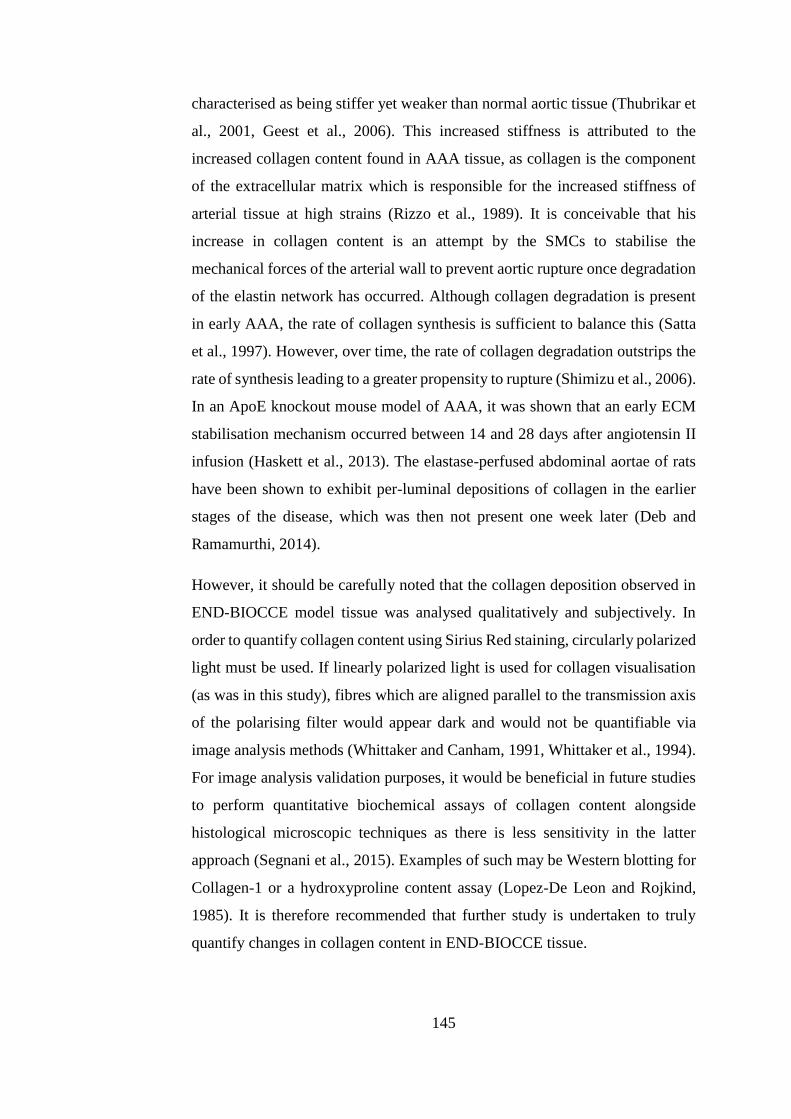
145
characterised as being stiffer yet weaker than normal aortic tissue (Thubrikar et
al., 2001, Geest et al., 2006). This increased stiffness is attributed to the
increased collagen content found in AAA tissue, as collagen is the component
of the extracellular matrix which is responsible for the increased stiffness of
arterial tissue at high strains (Rizzo et al., 1989). It is conceivable that his
increase in collagen content is an attempt by the SMCs to stabilise the
mechanical forces of the arterial wall to prevent aortic rupture once degradation
of the elastin network has occurred. Although collagen degradation is present
in early AAA, the rate of collagen synthesis is sufficient to balance this (Satta
et al., 1997). However, over time, the rate of collagen degradation outstrips the
rate of synthesis leading to a greater propensity to rupture (Shimizu et al., 2006).
In an ApoE knockout mouse model of AAA, it was shown that an early ECM
stabilisation mechanism occurred between 14 and 28 days after angiotensin II
infusion (Haskett et al., 2013). The elastase-perfused abdominal aortae of rats
have been shown to exhibit per-luminal depositions of collagen in the earlier
stages of the disease, which was then not present one week later (Deb and
Ramamurthi, 2014).
However, it should be carefully noted that the collagen deposition observed in
END-BIOCCE model tissue was analysed qualitatively and subjectively. In
order to quantify collagen content using Sirius Red staining, circularly polarized
light must be used. If linearly polarized light is used for collagen visualisation
(as was in this study), fibres which are aligned parallel to the transmission axis
of the polarising filter would appear dark and would not be quantifiable via
image analysis methods (Whittaker and Canham, 1991, Whittaker et al., 1994).
For image analysis validation purposes, it would be beneficial in future studies
to perform quantitative biochemical assays of collagen content alongside
histological microscopic techniques as there is less sensitivity in the latter
approach (Segnani et al., 2015). Examples of such may be Western blotting for
Collagen-1 or a hydroxyproline content assay (Lopez-De Leon and Rojkind,
1985). It is therefore recommended that further study is undertaken to truly
quantify changes in collagen content in END-BIOCCE tissue.
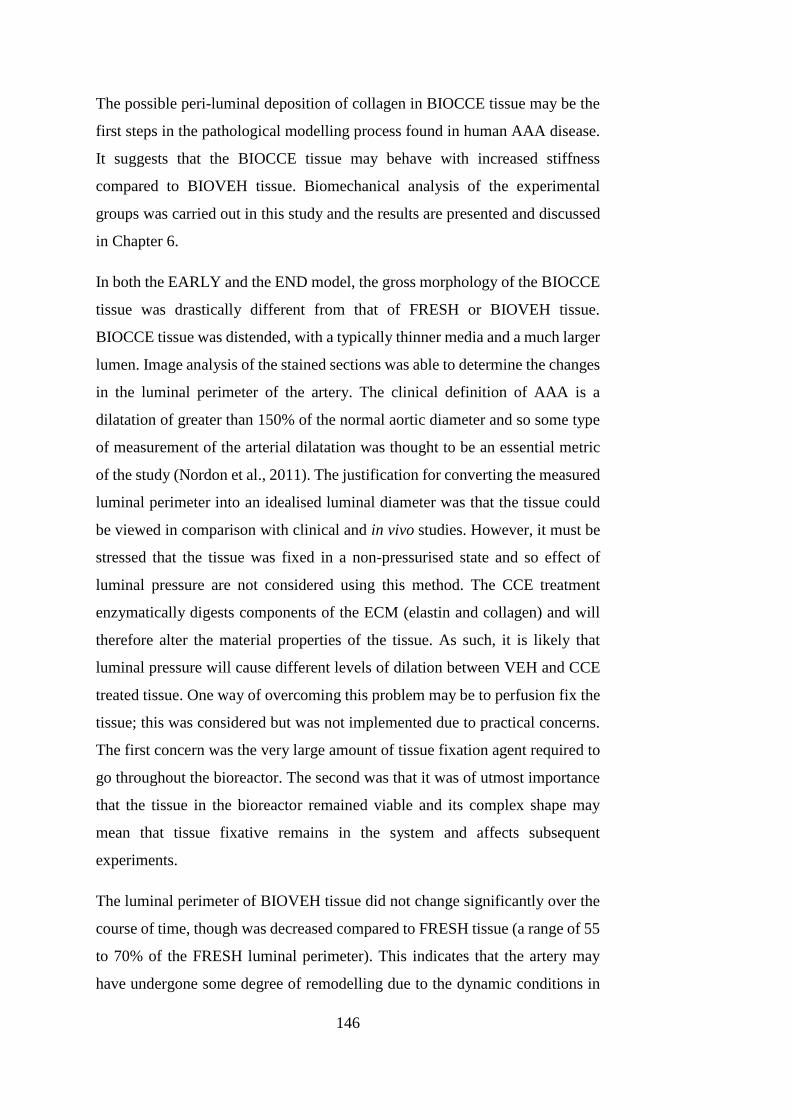
146
The possible peri-luminal deposition of collagen in BIOCCE tissue may be the
first steps in the pathological modelling process found in human AAA disease.
It suggests that the BIOCCE tissue may behave with increased stiffness
compared to BIOVEH tissue. Biomechanical analysis of the experimental
groups was carried out in this study and the results are presented and discussed
in Chapter 6.
In both the EARLY and the END model, the gross morphology of the BIOCCE
tissue was drastically different from that of FRESH or BIOVEH tissue.
BIOCCE tissue was distended, with a typically thinner media and a much larger
lumen. Image analysis of the stained sections was able to determine the changes
in the luminal perimeter of the artery. The clinical definition of AAA is a
dilatation of greater than 150% of the normal aortic diameter and so some type
of measurement of the arterial dilatation was thought to be an essential metric
of the study (Nordon et al., 2011). The justification for converting the measured
luminal perimeter into an idealised luminal diameter was that the tissue could
be viewed in comparison with clinical and in vivo studies. However, it must be
stressed that the tissue was fixed in a non-pressurised state and so effect of
luminal pressure are not considered using this method. The CCE treatment
enzymatically digests components of the ECM (elastin and collagen) and will
therefore alter the material properties of the tissue. As such, it is likely that
luminal pressure will cause different levels of dilation between VEH and CCE
treated tissue. One way of overcoming this problem may be to perfusion fix the
tissue; this was considered but was not implemented due to practical concerns.
The first concern was the very large amount of tissue fixation agent required to
go throughout the bioreactor. The second was that it was of utmost importance
that the tissue in the bioreactor remained viable and its complex shape may
mean that tissue fixative remains in the system and affects subsequent
experiments.
The luminal perimeter of BIOVEH tissue did not change significantly over the
course of time, though was decreased compared to FRESH tissue (a range of 55
to 70% of the FRESH luminal perimeter). This indicates that the artery may
have undergone some degree of remodelling due to the dynamic conditions in
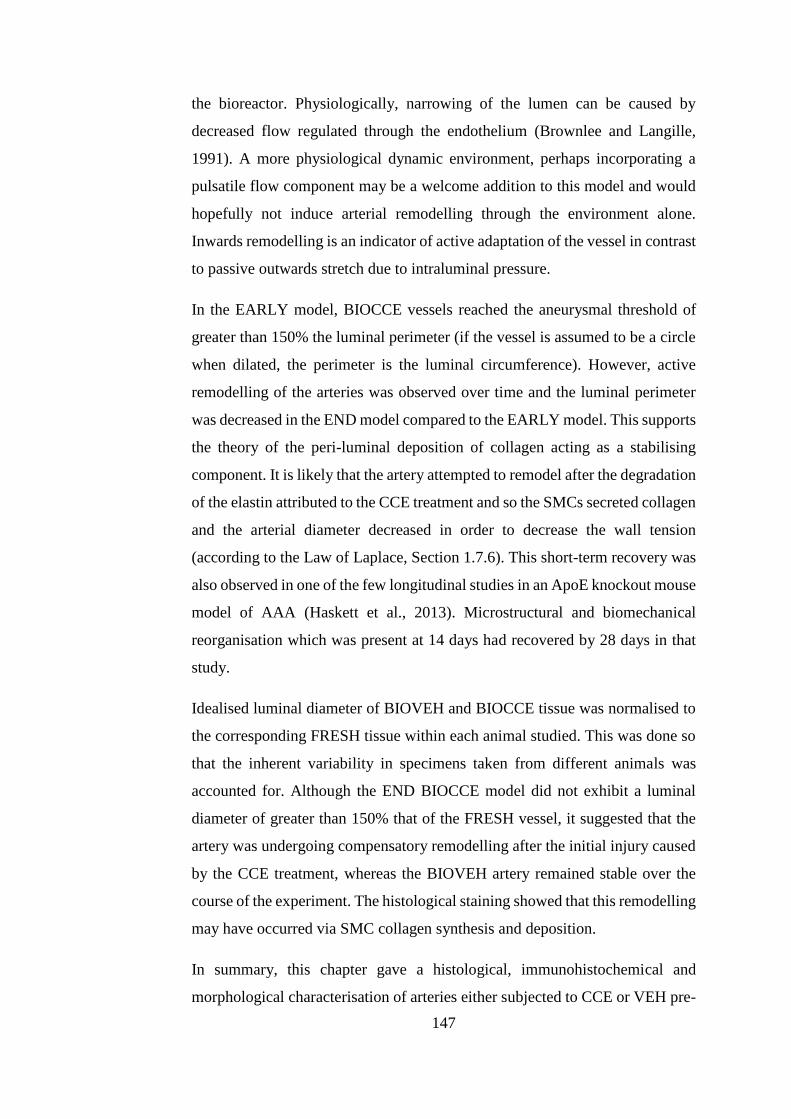
147
the bioreactor. Physiologically, narrowing of the lumen can be caused by
decreased flow regulated through the endothelium (Brownlee and Langille,
1991). A more physiological dynamic environment, perhaps incorporating a
pulsatile flow component may be a welcome addition to this model and would
hopefully not induce arterial remodelling through the environment alone.
Inwards remodelling is an indicator of active adaptation of the vessel in contrast
to passive outwards stretch due to intraluminal pressure.
In the EARLY model, BIOCCE vessels reached the aneurysmal threshold of
greater than 150% the luminal perimeter (if the vessel is assumed to be a circle
when dilated, the perimeter is the luminal circumference). However, active
remodelling of the arteries was observed over time and the luminal perimeter
was decreased in the END model compared to the EARLY model. This supports
the theory of the peri-luminal deposition of collagen acting as a stabilising
component. It is likely that the artery attempted to remodel after the degradation
of the elastin attributed to the CCE treatment and so the SMCs secreted collagen
and the arterial diameter decreased in order to decrease the wall tension
(according to the Law of Laplace, Section 1.7.6). This short-term recovery was
also observed in one of the few longitudinal studies in an ApoE knockout mouse
model of AAA (Haskett et al., 2013). Microstructural and biomechanical
reorganisation which was present at 14 days had recovered by 28 days in that
study.
Idealised luminal diameter of BIOVEH and BIOCCE tissue was normalised to
the corresponding FRESH tissue within each animal studied. This was done so
that the inherent variability in specimens taken from different animals was
accounted for. Although the END BIOCCE model did not exhibit a luminal
diameter of greater than 150% that of the FRESH vessel, it suggested that the
artery was undergoing compensatory remodelling after the initial injury caused
by the CCE treatment, whereas the BIOVEH artery remained stable over the
course of the experiment. The histological staining showed that this remodelling
may have occurred via SMC collagen synthesis and deposition.
In summary, this chapter gave a histological, immunohistochemical and
morphological characterisation of arteries either subjected to CCE or VEH pre-
148
treatment under static and dynamic culture regimes over a period of up to 12
days. Bioreactor culture alone (VEH) did not alter the histoarchitecture of the
artery, but did cause a narrowing of the lumen. BIOCCE tissue showed a loss
of elastin consistent in both the EARLY and END stage models, whereas there
was a decrease in SMC density over time. Peri-luminal deposition of collagen
solely observed in BIOCCE tissue may be part of a compensatory stabilisation
mechanism, leading the artery to decrease in diameter over time.
The characterisation of cellular and biomechanical aspects of the experimental
AAA model was also performed in this study and are found in Chapters 5 and
6 respectively.

149
CHAPTER 5
STRUCTURE AND FUNCTION OF EX VIVO AAA
MODEL SMCS
150
CHAPTER 5 STRUCTURE AND FUNCTION OF EX
VIVO AAA MODEL SMCS
This chapter describes the structure and function of the SMCs derived from the
tissues examined in Chapter 4. The SMCs are derived from tissue which aimed
to model AAA disease in an ex vivo bioreactor model. Firstly, the cellular and
cytoskeletal structure of the SMCs will be examined. The last section will
explore the functional capacity of the SMCs in terms of proliferation, migration,
senescence and MMP secretion.
5.1. INTRODUCTION
A widely researched property of SMCs is their ability to undergo profound
changes in phenotype in order to respond to the changing physiological
environment (reviewed in Owens et al. (2004) and given in more detail in
Section 1.7.2.1). This change in phenotype brings about changes to the structure
and function of the SMCs: contractile, differentiated cells have aligned actin
fibres and low turnover and ECM secretion whereas synthetic, de-differentiated
cells have a larger, hypertrophic appearance and are able to proliferate, migrate
and remodel the ECM more readily (Shi and Chen, 2016).
SMCs in end-stage human AAA disease and a few experimental animal models
have been characterised and found to be dysfunctional and attenuated in number
compared to SMCs derived from healthy arterial tissue (Lopez-Candales et al.,
1997, Ailawadi et al., 2009, Curci, 2009, Riches et al., 2013). SMCs in human
AAA disease taken from tissue removed during surgical repair have higher
levels of apoptosis (coupled with lower number of SMCs in the tissue),
increased replicative senescence, are involved with increased levels of reactive
oxygen species (ROS) and have a decreased ECM synthesis rate (Henderson et
al., 1999, Liao et al., 2000, Carmo et al., 2002, Miller et al., 2002, Riches et al.,
2013). It was shown in a murine elastase model that phenotypic switching of
SMCs occurred early on in AAA formation, a study impossible to execute with
human tissue (Ailawadi et al., 2009).
151
Attention has turned to SMCs in the treatment of AAA disease as they are the
biological mechanism for stabilising, synthesising and remodelling the ECM
(degradation of which is ubiquitous in AAA). The paracrine effect of SMCs has
been demonstrated in animal models, where seeding of SMCs was able to
stabilise AAA progression (Allaire et al., 2002, Losy et al., 2003). As the SMCs
are variously (and potentially uniquely) dysfunctional in end-stage human
AAA, they have come to be viewed as a potential target for AAA therapeutic
treatment (Riches et al., 2013, Airhart et al., 2014).
The early phenotypic switch of SMCs in AAA, coupled with the dysfunction
inherently linked to structure and function has driven one of the main aims of
this work, to use an ex vivo large animal model to characterise alteration in SMC
structure and function with respect to time. By investigating the behaviour of
the SMCs in the early disease, early therapeutic targets may be revealed which
may have potential to stabilise AAA progression before it has become overtly
unstable.
5.2. CHAPTER AIMS AND OBJECTIVES
The aim of this chapter was to characterise the structure and function of the
SMCs derived from the bioreactor AAA model and to examine the effects of
CCE treatment and dynamic culture in the bioreactor. The SMCs were also
characterised at two time-points representing the early- and end-stage of AAA
disease, with a view to mapping the phenotypic modulation of the SMCs and
gaining insight into the early, pre-dilating AAA.
5.2.1. OBJECTIVES
The specific objectives of this chapter were:
1 To characterise the cellular and cytoskeletal morphology of the SMCs
and relate this to the model stage, treatment and culture regime
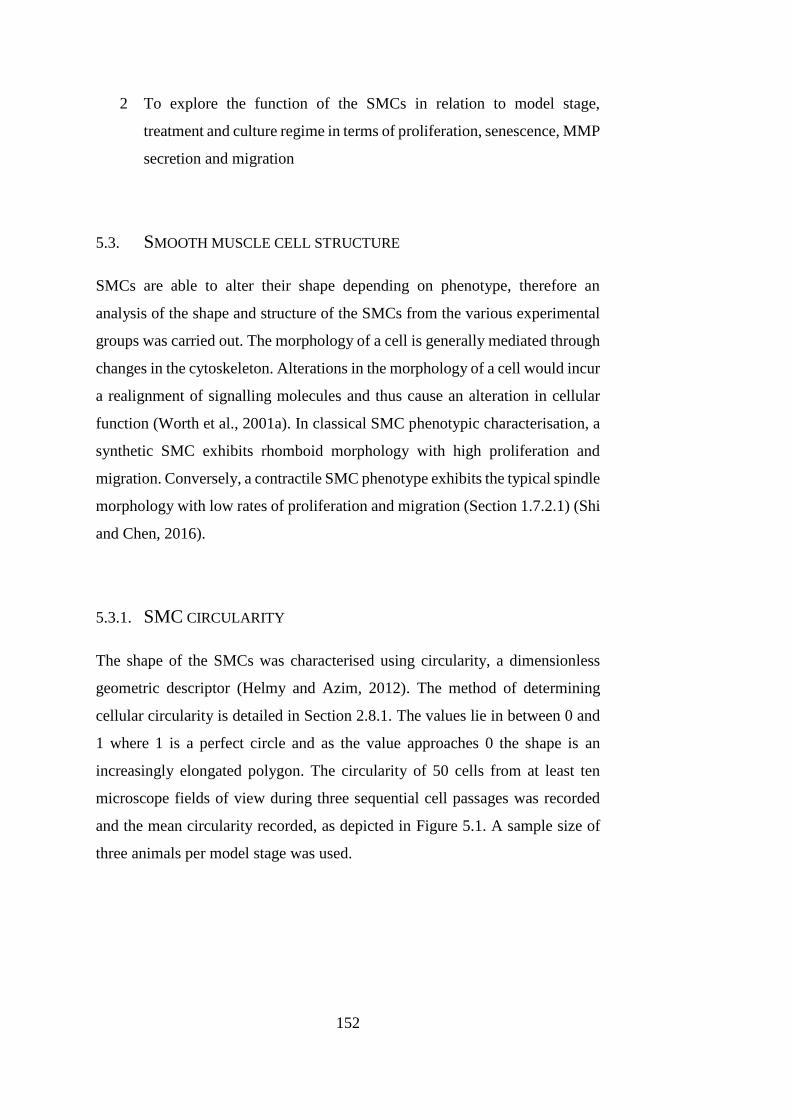
152
2 To explore the function of the SMCs in relation to model stage,
treatment and culture regime in terms of proliferation, senescence, MMP
secretion and migration
5.3. SMOOTH MUSCLE CELL STRUCTURE
SMCs are able to alter their shape depending on phenotype, therefore an
analysis of the shape and structure of the SMCs from the various experimental
groups was carried out. The morphology of a cell is generally mediated through
changes in the cytoskeleton. Alterations in the morphology of a cell would incur
a realignment of signalling molecules and thus cause an alteration in cellular
function (Worth et al., 2001a). In classical SMC phenotypic characterisation, a
synthetic SMC exhibits rhomboid morphology with high proliferation and
migration. Conversely, a contractile SMC phenotype exhibits the typical spindle
morphology with low rates of proliferation and migration (Section 1.7.2.1) (Shi
and Chen, 2016).
5.3.1. SMC CIRCULARITY
The shape of the SMCs was characterised using circularity, a dimensionless
geometric descriptor (Helmy and Azim, 2012). The method of determining
cellular circularity is detailed in Section 2.8.1. The values lie in between 0 and
1 where 1 is a perfect circle and as the value approaches 0 the shape is an
increasingly elongated polygon. The circularity of 50 cells from at least ten
microscope fields of view during three sequential cell passages was recorded
and the mean circularity recorded, as depicted in Figure 5.1. A sample size of
three animals per model stage was used.
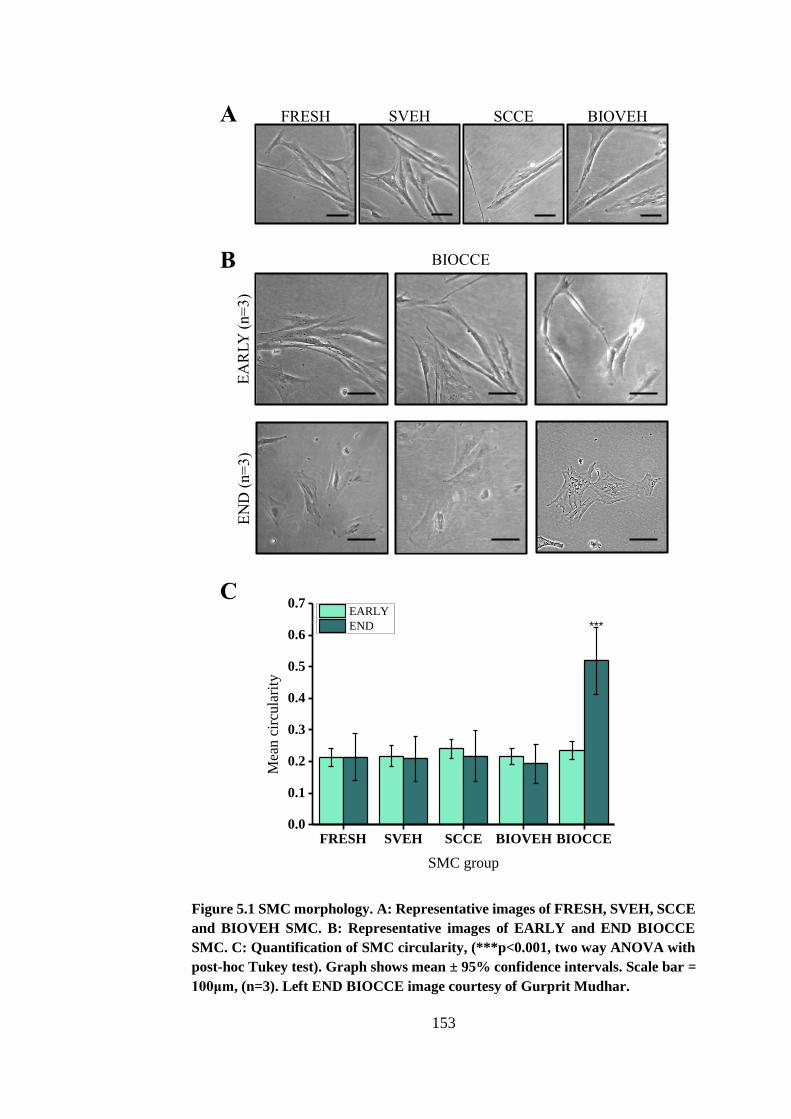
153
Figure 5.1 SMC morphology. A: Representative images of FRESH, SVEH, SCCE
and BIOVEH SMC. B: Representative images of EARLY and END BIOCCE
SMC. C: Quantification of SMC circularity, (***p<0.001, two way ANOVA with
post-hoc Tukey test). Graph shows mean ± 95% confidence intervals. Scale bar =
100μm, (n=3). Left END BIOCCE image courtesy of Gurprit Mudhar.
A FRESH SVEH SCCE BIOVEH
B
C
EA
RLY
(n=
3)
EN
D (
n=
3)
BIOCCE
FRESH SVEH SCCE BIOVEH BIOCCE0.0
0.1
0.2
0.3
0.4
0.5
0.6
0.7
Mea
n c
ircu
lari
ty
SMC group
EARLY
END ***
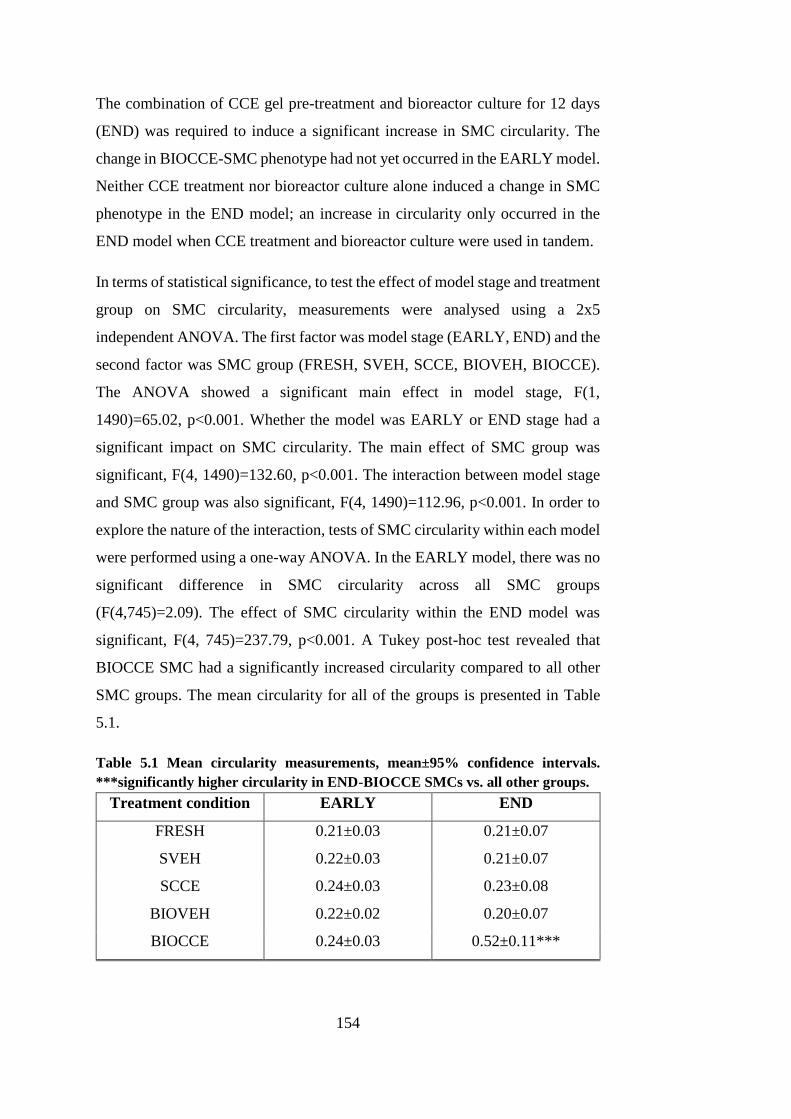
154
The combination of CCE gel pre-treatment and bioreactor culture for 12 days
(END) was required to induce a significant increase in SMC circularity. The
change in BIOCCE-SMC phenotype had not yet occurred in the EARLY model.
Neither CCE treatment nor bioreactor culture alone induced a change in SMC
phenotype in the END model; an increase in circularity only occurred in the
END model when CCE treatment and bioreactor culture were used in tandem.
In terms of statistical significance, to test the effect of model stage and treatment
group on SMC circularity, measurements were analysed using a 2x5
independent ANOVA. The first factor was model stage (EARLY, END) and the
second factor was SMC group (FRESH, SVEH, SCCE, BIOVEH, BIOCCE).
The ANOVA showed a significant main effect in model stage, F(1,
1490)=65.02, p<0.001. Whether the model was EARLY or END stage had a
significant impact on SMC circularity. The main effect of SMC group was
significant, F(4, 1490)=132.60, p<0.001. The interaction between model stage
and SMC group was also significant, F(4, 1490)=112.96, p<0.001. In order to
explore the nature of the interaction, tests of SMC circularity within each model
were performed using a one-way ANOVA. In the EARLY model, there was no
significant difference in SMC circularity across all SMC groups
(F(4,745)=2.09). The effect of SMC circularity within the END model was
significant, F(4, 745)=237.79, p<0.001. A Tukey post-hoc test revealed that
BIOCCE SMC had a significantly increased circularity compared to all other
SMC groups. The mean circularity for all of the groups is presented in Table
5.1.
Table 5.1 Mean circularity measurements, mean±95% confidence intervals.
***significantly higher circularity in END-BIOCCE SMCs vs. all other groups.
Treatment condition EARLY END
FRESH 0.21±0.03 0.21±0.07
SVEH 0.22±0.03 0.21±0.07
SCCE 0.24±0.03 0.23±0.08
BIOVEH 0.22±0.02 0.20±0.07
BIOCCE 0.24±0.03 0.52±0.11***
155
5.3.2. F-ACTIN CYTOSKELETON
SMCs explanted from END-BIOCCE tissue and the corresponding BIOVEH
and FRESH controls were stained with DAPI and rhodamine-phalloidin stain in
order to visualise the cell nuclei and actin cytoskeleton using the method given
in Section 2.8.2. Representative images are shown in Figure 5.2.
FRESH-SMCs were spindle shaped with aligned actin fibres reaching from pole
to pole (Figure 5.2A). BIOVEH-SMCs also exhibited the characteristic spindle
SMC shape with aligned actin fibres, much like the FRESH-SMCs (Figure 5.2B
and C, arrows). In contrast to this, END-BIOCCE cells exhibited a rhomboid
phenotype with a disrupted actin cytoskeleton. Actin fibres were not aligned
within the cell and were disordered (Figure 5.2D and E, arrows).
END-BIOCCE SMC had a rhomboid phenotype and a disrupted actin
cytoskeleton. This was solely a qualitative assessment from observation of 5
images per treatment condition (FRESH/ BIOVEH/ BIOCCE) per animal (15
images total). Three animals were used per model stage (45 images total).
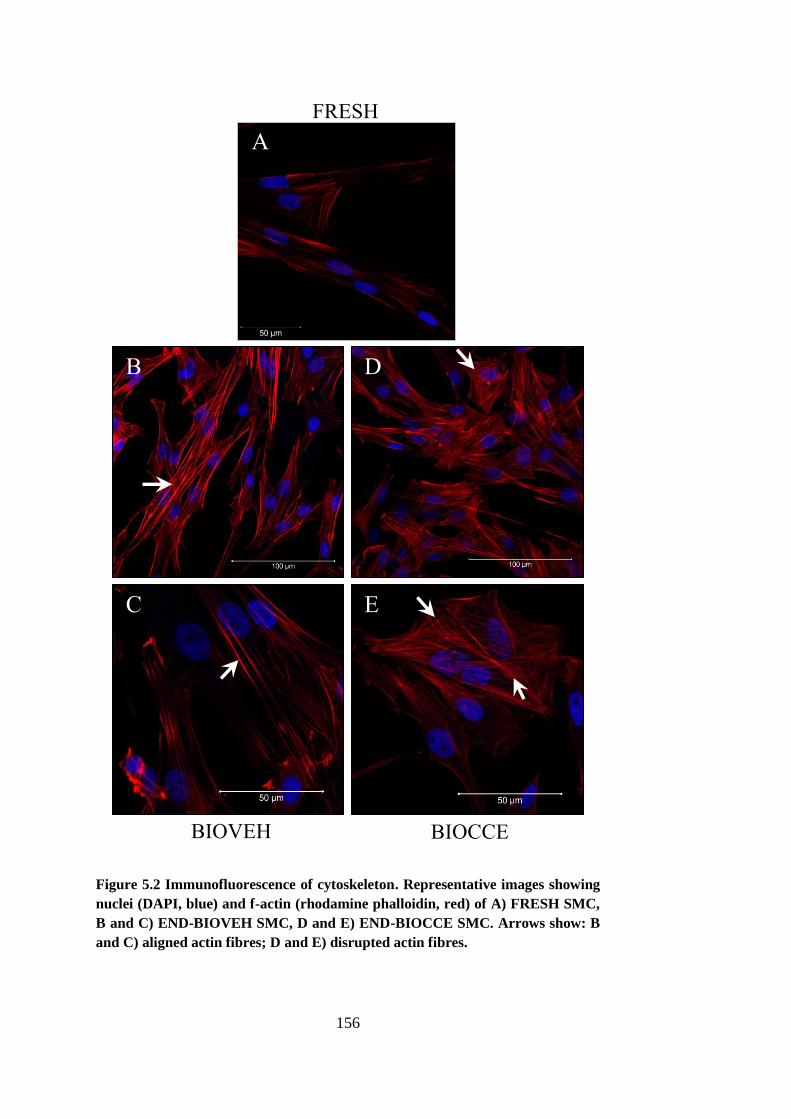
156
Figure 5.2 Immunofluorescence of cytoskeleton. Representative images showing
nuclei (DAPI, blue) and f-actin (rhodamine phalloidin, red) of A) FRESH SMC,
B and C) END-BIOVEH SMC, D and E) END-BIOCCE SMC. Arrows show: B
and C) aligned actin fibres; D and E) disrupted actin fibres.
A
B
C
D
E
BIOVEH BIOCCE
FRESH
157
5.4. SMOOTH MUSCLE CELL FUNCTION
In humans, SMCs explanted from end-stage AAA tissue exhibit impaired
function including increased levels of senescence, impaired proliferation and
altered MMP release (Chapter 1). The function of the SMCs from the ex vivo
AAA model was therefore characterised at two time-points in order to develop
a temporal overview of alteration in SMC function with a view to relating this
to changes observed in SMC structure (Section 5.3).
5.4.1. PROLIFERATION
The proliferation of the SMCs from each of the treatment groups was also
analysed using cell counting. The method is described in full in Section 2.8.3.
Each proliferation assay was repeated three times per animal with passage-
matched experiments (p3, p4 and p5). The proliferation curves for each model
are shown in Figure 5.3 and area under the curve analysis for proliferative
capacity is shown in Figure 5.4.
SMC were seeded at a known density, serum-starved to bring them into a
quiescent state and then grown in 10% FCS FGM for 7 days. Quadruplicate cell
counts were taken at days 0, 2, 4 and 7.
Overall, END-BIOCCE SMCs (possessing rhomboid morphology) exhibited
impaired proliferative capacity compared to controls, similar to the
characteristics of end-stage human AAA-SMC (Liao et al., 2000, Riches et al.,
2013). In contrast, EARLY SMCs subjected to only 3 days in bioreactor culture
were observed to be undergoing hyperproliferation. The proliferative capacity
of BIOVEH SMCs was indistinguishable from matched FRESH controls.
Statistically, the impact of treatment and culture conditions on SMC
proliferation was analysed using a one-way ANOVA per model stage (EARLY,
END). In the END model (Figure 5.3A), the results were significant, F(2,
213)=15.03, p<0.001. A post-hoc Tukey test revealed that there was no
significant difference between FRESH and BIOVEH-SMC (1930±209% vs.
2232±98% of cells at day 0 at day 7 respectively, p=0.35) but BIOCCE-SMC
158
proliferation was significantly impaired (1165±56% at day 7) compared to both
FRESH (p<0.001) and BIOVEH-SMC (p<0.001). In the EARLY model (Figure
5.3B), the results were also significant, F(4, 395)=3.39, p<0.01. A post-hoc
Tukey test showed that, again, there was no significant difference in
proliferation in BIOVEH-SMC compared to FRESH (1973±57% vs. 1819±48%
at day 7, respectively, p=0.82) but BIOCCE-SMC was significantly different
(2648±71% at day 7) compared to both FRESH (p<0.05) and BIOVEH-SMC
(p<0.05). However, the proliferative capacity of BIOCCE-SMC was increased
in the EARLY model, in contrast to an impairment of proliferation observed in
the END model compared to both FRESH and BIOVEH SMCs.
The two models were then compared by using area under the curve (AUC)
analysis on the proliferation curves seen in Figure 5.3. The AUC analysis is
shown in Figure 5.4. There was no difference in the proliferative capacity of
FRESH and BIOVEH SMCs between the EARLY and END models: only
BIOCCE SMCs showed an alteration in proliferation.
AUC analysis and a two-tailed two-sample t-test of model stage per treatment
group showed that there was no significant difference between the EARLY and
END models in the FRESH (5799±866 and 6089±1820 for EARLY and END
respectively, p=0.8) and BIOVEH groups (5609±958 and 7823±3017 for
EARLY and END respectively, p=0.25). However, there was a significant
difference in BIOCCE-SMC proliferation between the EARLY and END
models (8252±1034 vs. 3307±760 respectively, p<0.001).
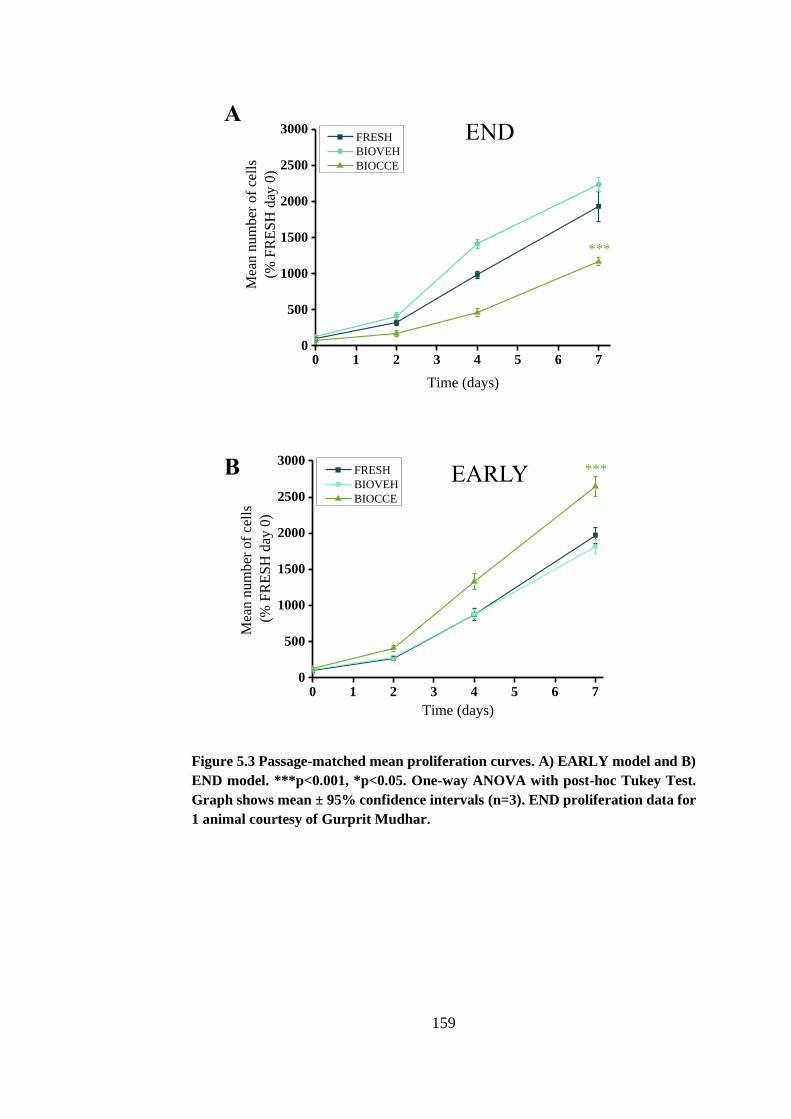
159
Figure 5.3 Passage-matched mean proliferation curves. A) EARLY model and B)
END model. ***p<0.001, *p<0.05. One-way ANOVA with post-hoc Tukey Test.
Graph shows mean ± 95% confidence intervals (n=3). END proliferation data for
1 animal courtesy of Gurprit Mudhar.
0 1 2 3 4 5 6 70
500
1000
1500
2000
2500
3000
Mea
n n
um
ber
of
cell
s
(% F
RE
SH
day
0)
Time (days)
FRESH
BIOVEH
BIOCCE
***
0 1 2 3 4 5 6 70
500
1000
1500
2000
2500
3000
Mea
n n
um
ber
of
cell
s
(% F
RE
SH
day
0)
Time (days)
FRESH
BIOVEH
BIOCCE
***
A
B
END
EARLY
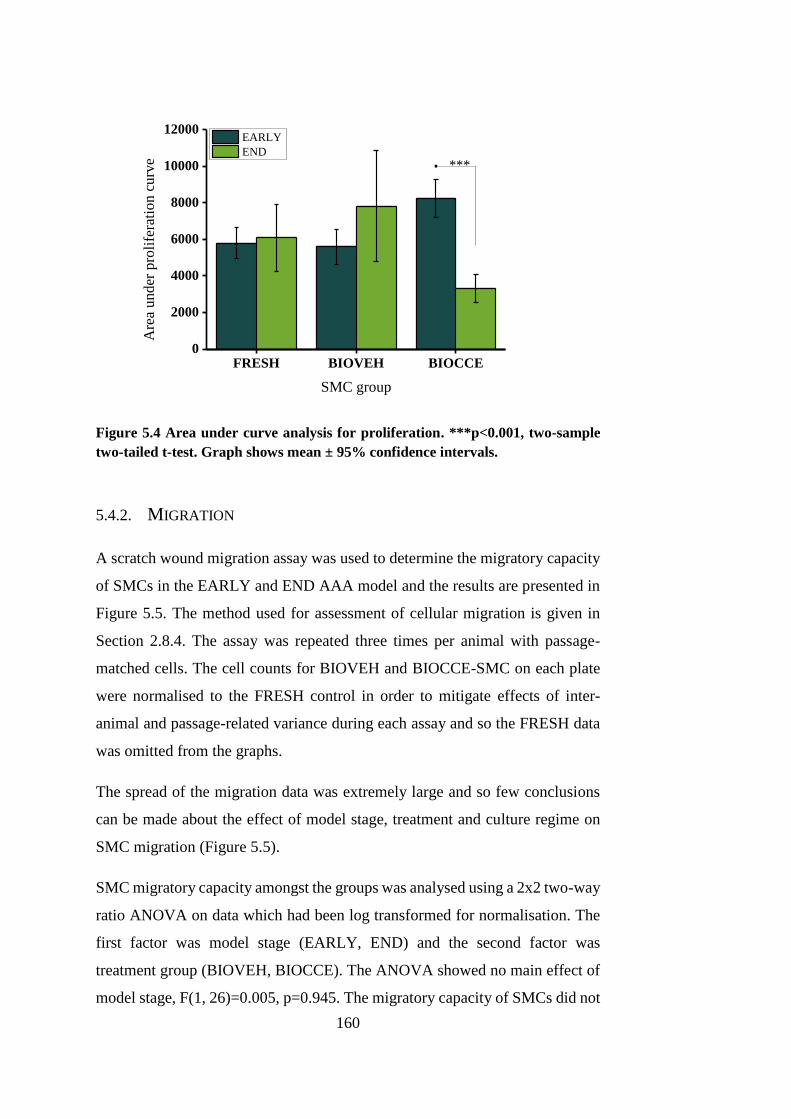
160
FRESH BIOVEH BIOCCE0
2000
4000
6000
8000
10000
12000
Are
a u
nd
er p
roli
fera
tio
n c
urv
e
SMC group
EARLY
END
***.
Figure 5.4 Area under curve analysis for proliferation. ***p<0.001, two-sample
two-tailed t-test. Graph shows mean ± 95% confidence intervals.
5.4.2. MIGRATION
A scratch wound migration assay was used to determine the migratory capacity
of SMCs in the EARLY and END AAA model and the results are presented in
Figure 5.5. The method used for assessment of cellular migration is given in
Section 2.8.4. The assay was repeated three times per animal with passage-
matched cells. The cell counts for BIOVEH and BIOCCE-SMC on each plate
were normalised to the FRESH control in order to mitigate effects of inter-
animal and passage-related variance during each assay and so the FRESH data
was omitted from the graphs.
The spread of the migration data was extremely large and so few conclusions
can be made about the effect of model stage, treatment and culture regime on
SMC migration (Figure 5.5).
SMC migratory capacity amongst the groups was analysed using a 2x2 two-way
ratio ANOVA on data which had been log transformed for normalisation. The
first factor was model stage (EARLY, END) and the second factor was
treatment group (BIOVEH, BIOCCE). The ANOVA showed no main effect of
model stage, F(1, 26)=0.005, p=0.945. The migratory capacity of SMCs did not
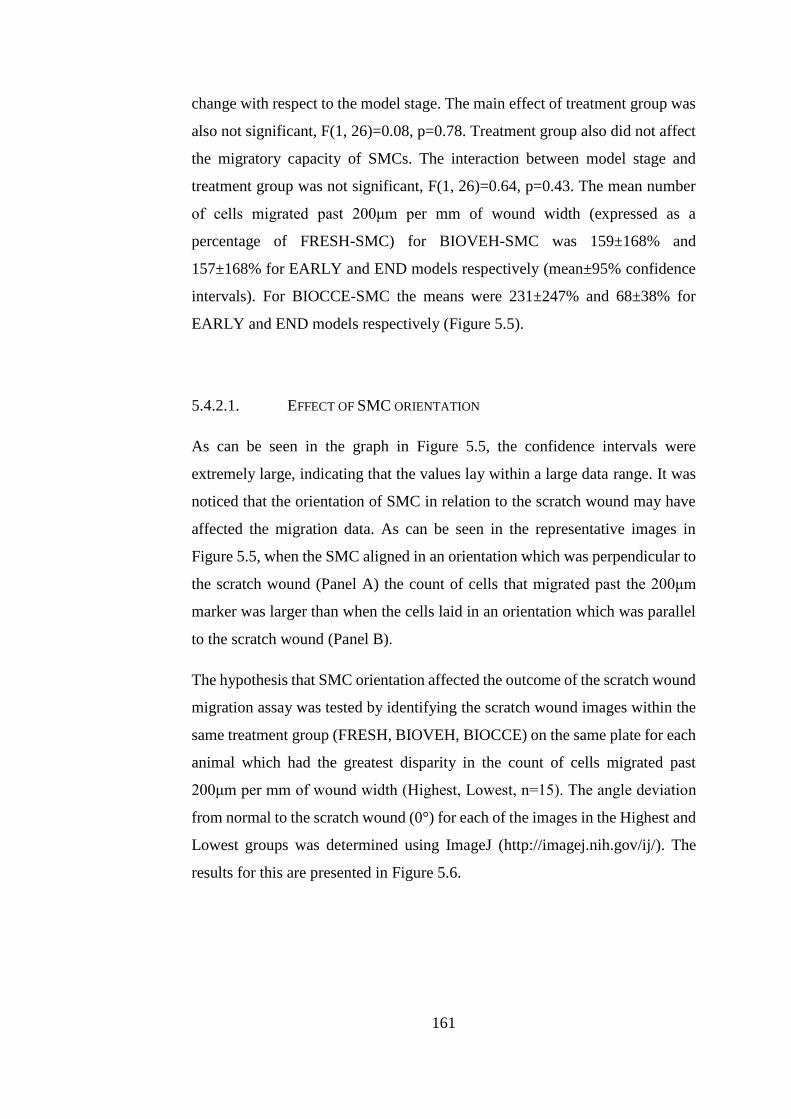
161
change with respect to the model stage. The main effect of treatment group was
also not significant, F(1, 26)=0.08, p=0.78. Treatment group also did not affect
the migratory capacity of SMCs. The interaction between model stage and
treatment group was not significant, F(1, 26)=0.64, p=0.43. The mean number
of cells migrated past 200μm per mm of wound width (expressed as a
percentage of FRESH-SMC) for BIOVEH-SMC was 159±168% and
157±168% for EARLY and END models respectively (mean±95% confidence
intervals). For BIOCCE-SMC the means were 231±247% and 68±38% for
EARLY and END models respectively (Figure 5.5).
5.4.2.1. EFFECT OF SMC ORIENTATION
As can be seen in the graph in Figure 5.5, the confidence intervals were
extremely large, indicating that the values lay within a large data range. It was
noticed that the orientation of SMC in relation to the scratch wound may have
affected the migration data. As can be seen in the representative images in
Figure 5.5, when the SMC aligned in an orientation which was perpendicular to
the scratch wound (Panel A) the count of cells that migrated past the 200μm
marker was larger than when the cells laid in an orientation which was parallel
to the scratch wound (Panel B).
The hypothesis that SMC orientation affected the outcome of the scratch wound
migration assay was tested by identifying the scratch wound images within the
same treatment group (FRESH, BIOVEH, BIOCCE) on the same plate for each
animal which had the greatest disparity in the count of cells migrated past
200μm per mm of wound width (Highest, Lowest, n=15). The angle deviation
from normal to the scratch wound (0°) for each of the images in the Highest and
Lowest groups was determined using ImageJ (http://imagej.nih.gov/ij/). The
results for this are presented in Figure 5.6.
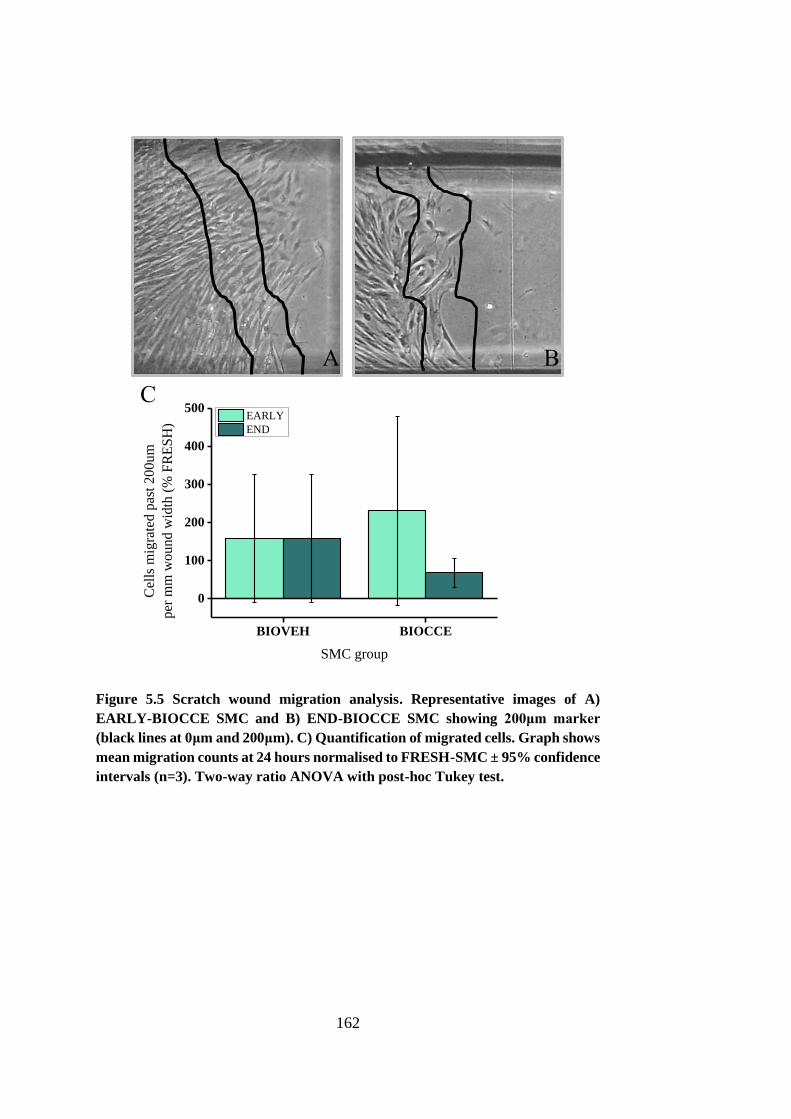
162
Figure 5.5 Scratch wound migration analysis. Representative images of A)
EARLY-BIOCCE SMC and B) END-BIOCCE SMC showing 200μm marker
(black lines at 0μm and 200μm). C) Quantification of migrated cells. Graph shows
mean migration counts at 24 hours normalised to FRESH-SMC ± 95% confidence
intervals (n=3). Two-way ratio ANOVA with post-hoc Tukey test.
A B
BIOVEH BIOCCE
0
100
200
300
400
500
Cel
ls m
igra
ted p
ast
20
0u
m
per
mm
wou
nd
wid
th (
% F
RE
SH
)
SMC group
EARLY
END
C
163
Figure 5.6 Effect of SMC orientation on migration. A) Representative images of
greatest cell count disparity within assay with 200μm traceline included. B)
Significant increase in angle deviation from normal to scratch wound in the lowest
cell counts vs. highest, ***p<0.001, two sample t-test. Graph shows mean ± 95%
confidence intervals (n=15).
Highest Lowest0
10
20
30
40
50
60
70
80
90
Ang
le d
evia
tion
fro
m n
orm
al (
°)
Cell count
***
FR
ES
H
BIO
VE
H
EA
RLY
-BIO
CC
E
EN
D-B
IOC
CE
Highest Lowest A
B
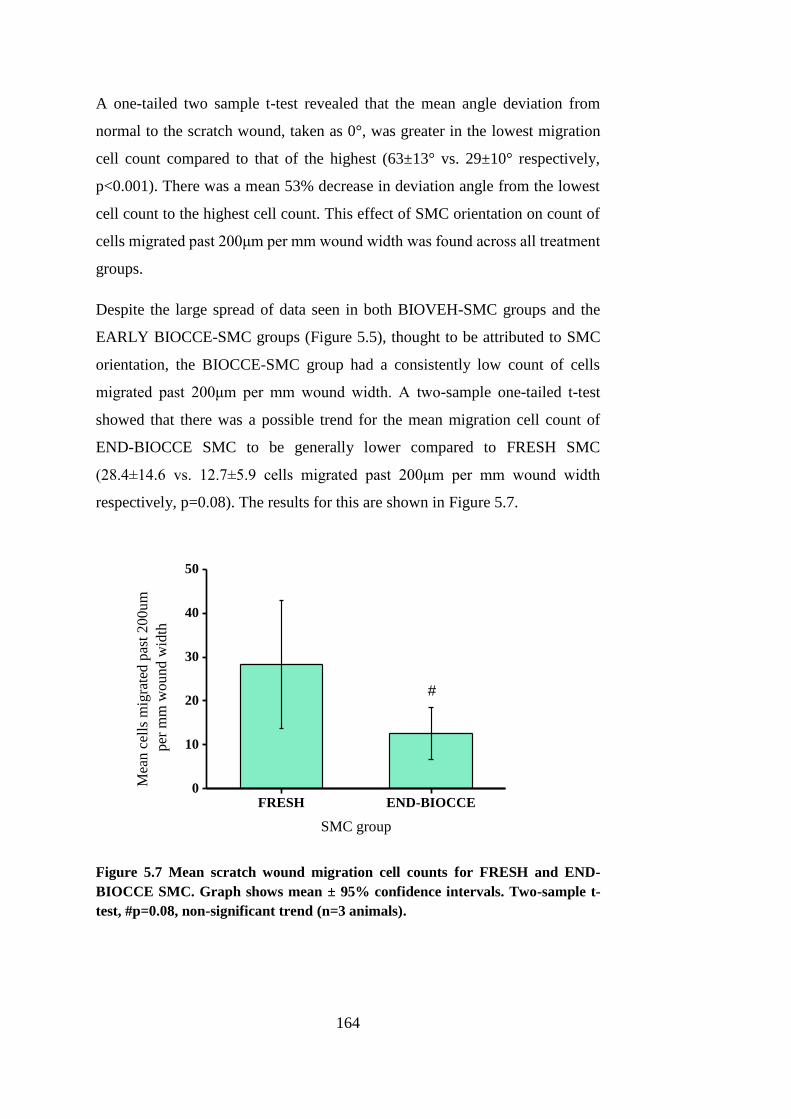
164
A one-tailed two sample t-test revealed that the mean angle deviation from
normal to the scratch wound, taken as 0°, was greater in the lowest migration
cell count compared to that of the highest (63±13° vs. 29±10° respectively,
p<0.001). There was a mean 53% decrease in deviation angle from the lowest
cell count to the highest cell count. This effect of SMC orientation on count of
cells migrated past 200μm per mm wound width was found across all treatment
groups.
Despite the large spread of data seen in both BIOVEH-SMC groups and the
EARLY BIOCCE-SMC groups (Figure 5.5), thought to be attributed to SMC
orientation, the BIOCCE-SMC group had a consistently low count of cells
migrated past 200μm per mm wound width. A two-sample one-tailed t-test
showed that there was a possible trend for the mean migration cell count of
END-BIOCCE SMC to be generally lower compared to FRESH SMC
(28.4±14.6 vs. 12.7±5.9 cells migrated past 200μm per mm wound width
respectively, p=0.08). The results for this are shown in Figure 5.7.
FRESH END-BIOCCE0
10
20
30
40
50
Mea
n c
ells
mig
rate
d p
ast
20
0u
m
per
mm
wo
un
d w
idth
SMC group
#
Figure 5.7 Mean scratch wound migration cell counts for FRESH and END-
BIOCCE SMC. Graph shows mean ± 95% confidence intervals. Two-sample t-
test, #p=0.08, non-significant trend (n=3 animals).
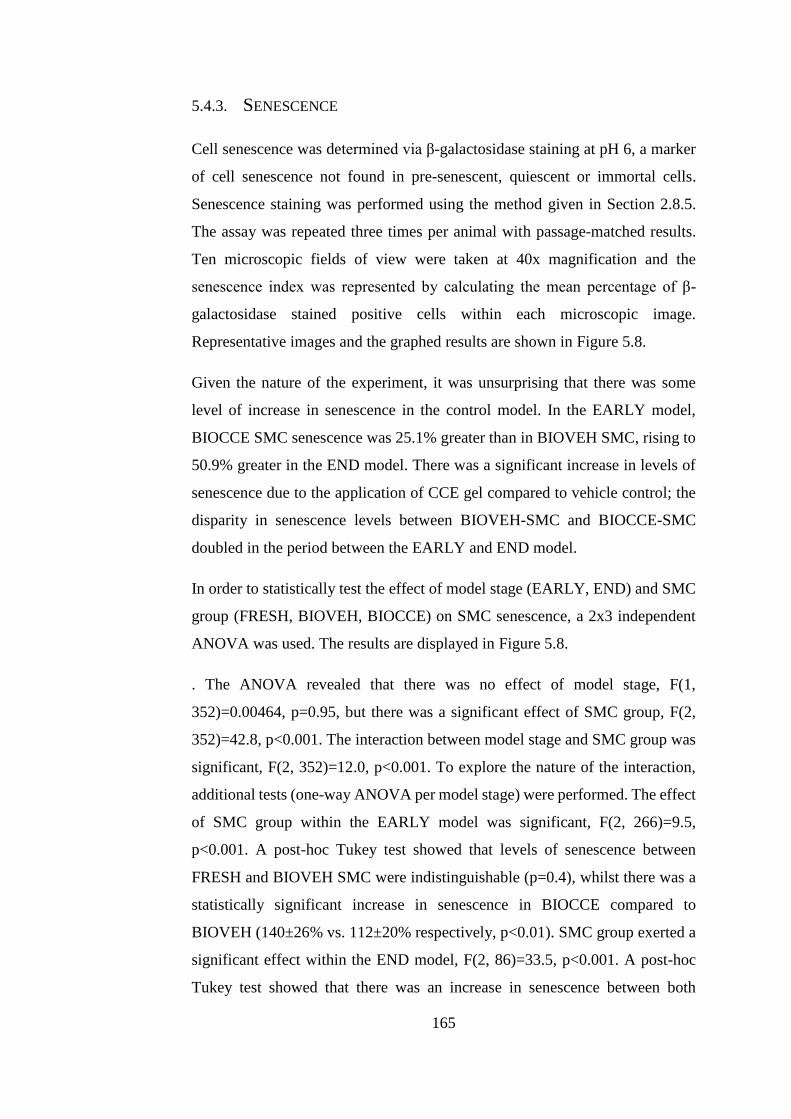
165
5.4.3. SENESCENCE
Cell senescence was determined via β-galactosidase staining at pH 6, a marker
of cell senescence not found in pre-senescent, quiescent or immortal cells.
Senescence staining was performed using the method given in Section 2.8.5.
The assay was repeated three times per animal with passage-matched results.
Ten microscopic fields of view were taken at 40x magnification and the
senescence index was represented by calculating the mean percentage of β-
galactosidase stained positive cells within each microscopic image.
Representative images and the graphed results are shown in Figure 5.8.
Given the nature of the experiment, it was unsurprising that there was some
level of increase in senescence in the control model. In the EARLY model,
BIOCCE SMC senescence was 25.1% greater than in BIOVEH SMC, rising to
50.9% greater in the END model. There was a significant increase in levels of
senescence due to the application of CCE gel compared to vehicle control; the
disparity in senescence levels between BIOVEH-SMC and BIOCCE-SMC
doubled in the period between the EARLY and END model.
In order to statistically test the effect of model stage (EARLY, END) and SMC
group (FRESH, BIOVEH, BIOCCE) on SMC senescence, a 2x3 independent
ANOVA was used. The results are displayed in Figure 5.8.
. The ANOVA revealed that there was no effect of model stage, F(1,
352)=0.00464, p=0.95, but there was a significant effect of SMC group, F(2,
352)=42.8, p<0.001. The interaction between model stage and SMC group was
significant, F(2, 352)=12.0, p<0.001. To explore the nature of the interaction,
additional tests (one-way ANOVA per model stage) were performed. The effect
of SMC group within the EARLY model was significant, F(2, 266)=9.5,
p<0.001. A post-hoc Tukey test showed that levels of senescence between
FRESH and BIOVEH SMC were indistinguishable (p=0.4), whilst there was a
statistically significant increase in senescence in BIOCCE compared to
BIOVEH (140±26% vs. 112±20% respectively, p<0.01). SMC group exerted a
significant effect within the END model, F(2, 86)=33.5, p<0.001. A post-hoc
Tukey test showed that there was an increase in senescence between both
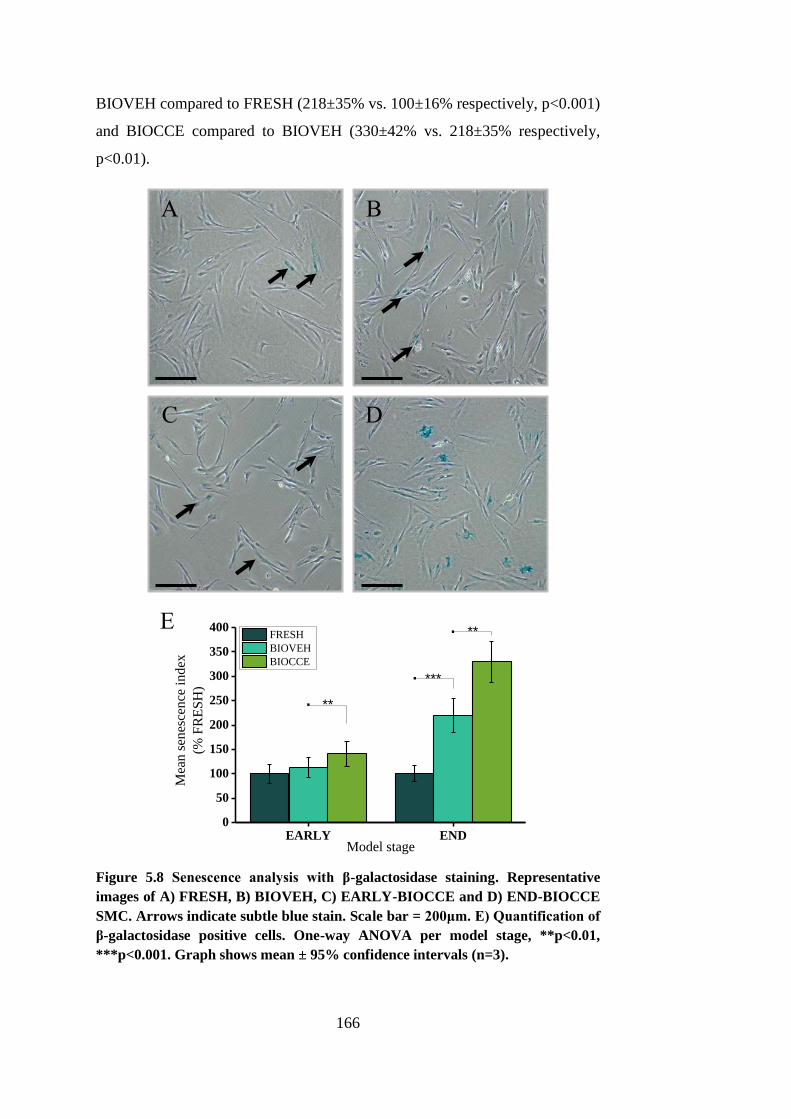
166
BIOVEH compared to FRESH (218±35% vs. 100±16% respectively, p<0.001)
and BIOCCE compared to BIOVEH (330±42% vs. 218±35% respectively,
p<0.01).
Figure 5.8 Senescence analysis with β-galactosidase staining. Representative
images of A) FRESH, B) BIOVEH, C) EARLY-BIOCCE and D) END-BIOCCE
SMC. Arrows indicate subtle blue stain. Scale bar = 200μm. E) Quantification of
β-galactosidase positive cells. One-way ANOVA per model stage, **p<0.01,
***p<0.001. Graph shows mean ± 95% confidence intervals (n=3).
EARLY END0
50
100
150
200
250
300
350
400
.
. **
***
Mea
n s
enes
cence
ind
ex
(% F
RE
SH
)
Model stage
FRESH
BIOVEH
BIOCCE
**.
A B
C D
E
167
5.4.4. SECRETION OF MMP-2 AND MMP-9
AAA is a pathological remodelling disease and so indications of alterations in
remodelling capability in the ex vivo model were analysed (Galis and Khatri,
2002). Secretion of MMP-2 and MMP-9 (gelatinases) is an indication of SMC
protease remodelling activity and they are secreted at higher levels in human
AAA tissue compared to healthy tissue (Goodall et al., 2002b, Wilson et al.,
2008). Levels of MMP-2 and MMP-9 were measured using gelatin zymography
of conditioned media obtained from non-stimulated and stimulated SMC from
three treatment groups (FRESH, BIOVEH, BIOCCE) at two model stages
(EARLY, END). Samples were incorporated within a gelatin substrate and were
subjected to sodium dodecyl sulphate-polyacrylamide gel electrophoresis
(SDS-PAGE). They were then analysed using densitometry of clear bands of
lysis against blue stained gelatin background. Full detail of the method is given
in Section 2.8.6.
5.4.4.1. SAMPLE LOADING VOLUME CALIBRATION
A calibration was performed to determine the sample loading volume; optimally
this would be the greatest volume before saturation of the substrate occurs and
with any increase in sample loading volume there is no such increase in relative
densitometry of the bands of gelatin digestion (Figure 5.9). Samples in volumes
from 5μl to 30μl from two experimental groups (FRESH-SMC from an animal
in the EARLY group and FRESH-SMC from an animal in the END group) were
loaded onto a zymogram. It can be seen in Figure 5.9 that the point of saturation
starts at 20μl of sample volume and so this was chosen as the sample loading
volume for all further experiments.
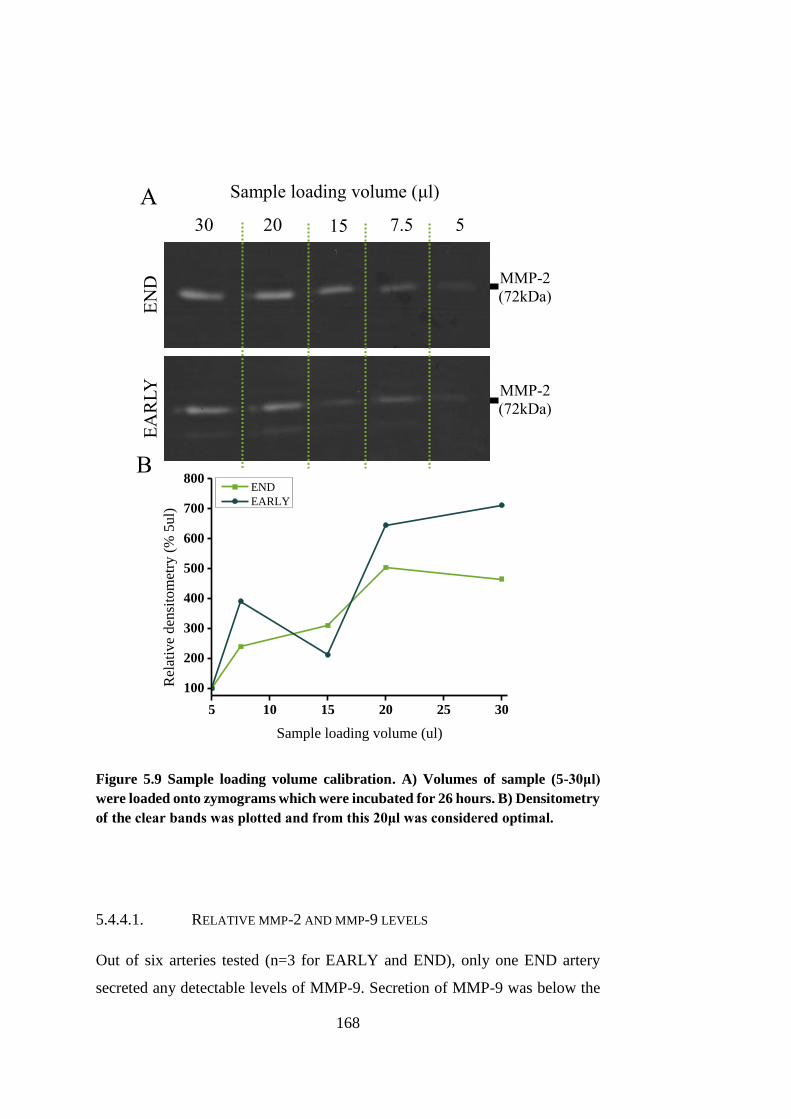
168
Figure 5.9 Sample loading volume calibration. A) Volumes of sample (5-30μl)
were loaded onto zymograms which were incubated for 26 hours. B) Densitometry
of the clear bands was plotted and from this 20μl was considered optimal.
5.4.4.1. RELATIVE MMP-2 AND MMP-9 LEVELS
Out of six arteries tested (n=3 for EARLY and END), only one END artery
secreted any detectable levels of MMP-9. Secretion of MMP-9 was below the
5 10 15 20 25 30
100
200
300
400
500
600
700
800
Rel
ativ
e d
ensi
tom
etry
(%
5u
l)
Sample loading volume (ul)
END
EARLY
Sample loading volume (μl) A
B
EN
D
EA
RL
Y
30 20 15 7.5 5
MMP-2
(72kDa)
MMP-2
(72kDa)
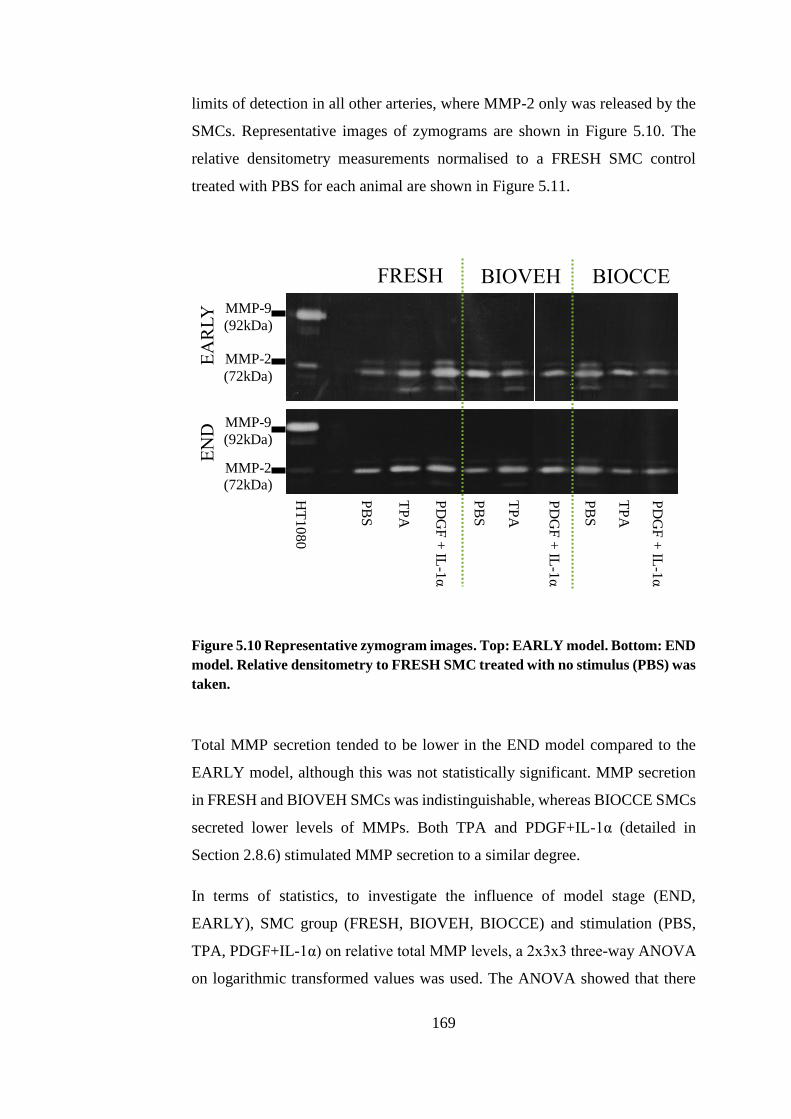
169
limits of detection in all other arteries, where MMP-2 only was released by the
SMCs. Representative images of zymograms are shown in Figure 5.10. The
relative densitometry measurements normalised to a FRESH SMC control
treated with PBS for each animal are shown in Figure 5.11.
Figure 5.10 Representative zymogram images. Top: EARLY model. Bottom: END
model. Relative densitometry to FRESH SMC treated with no stimulus (PBS) was
taken.
Total MMP secretion tended to be lower in the END model compared to the
EARLY model, although this was not statistically significant. MMP secretion
in FRESH and BIOVEH SMCs was indistinguishable, whereas BIOCCE SMCs
secreted lower levels of MMPs. Both TPA and PDGF+IL-1α (detailed in
Section 2.8.6) stimulated MMP secretion to a similar degree.
In terms of statistics, to investigate the influence of model stage (END,
EARLY), SMC group (FRESH, BIOVEH, BIOCCE) and stimulation (PBS,
TPA, PDGF+IL-1α) on relative total MMP levels, a 2x3x3 three-way ANOVA
on logarithmic transformed values was used. The ANOVA showed that there
FRESH BIOVEH BIOCCE
MMP-9 (92kDa)
MMP-2 (72kDa)
PB
S
TP
A
PD
GF
+ IL
-1α
PB
S
TP
A
PD
GF
+ IL
-1α
PB
S
TP
A
PD
GF
+ IL
-1α
HT
10
80
MMP-9 (92kDa)
MMP-2 (72kDa)
EA
RL
Y
EN
D
170
was not a significant effect of model stage, F(1, 36) = 3.76, p=0.06. However,
a p-value of 0.06 indicates a possible trend towards a decrease in MMP levels
in the END model compared to the EARLY model. The effect of SMC group
on relative MMP levels was significant, F(2, 36) = 8.40, p<0.001. A Tukey post-
hoc test showed that there was no difference in relative MMP levels between
FRESH and BIOVEH SMCs (p=0.907). There was a decrease in relative MMP
levels in BIOCCE SMCs compared to both FRESH (p<0.01) and BIOVEH
SMCs (p<0.01). The effect of the type of stimulant applied to the SMCs on the
relative MMP levels was also significant, F(2, 36) = 8.89, p<0.001. The Tukey
test showed that there was an increase in relative MMP levels between PBS
control and TPA (p<0.001). There was also an increase in relative MMP levels
in PDGF+IL-1α treated SMCs compared to SMCs treated with PBS (p<0.01).
The degree of stimulation from TPA and PDGF+IL-1α was not different; there
was no difference between relative MMP levels in stimulated groups (p=0.923).
The interaction between model stage, SMC group and stimulation was found to
be not statistically significant, F(4, 36) = 0.22, p=0.928.
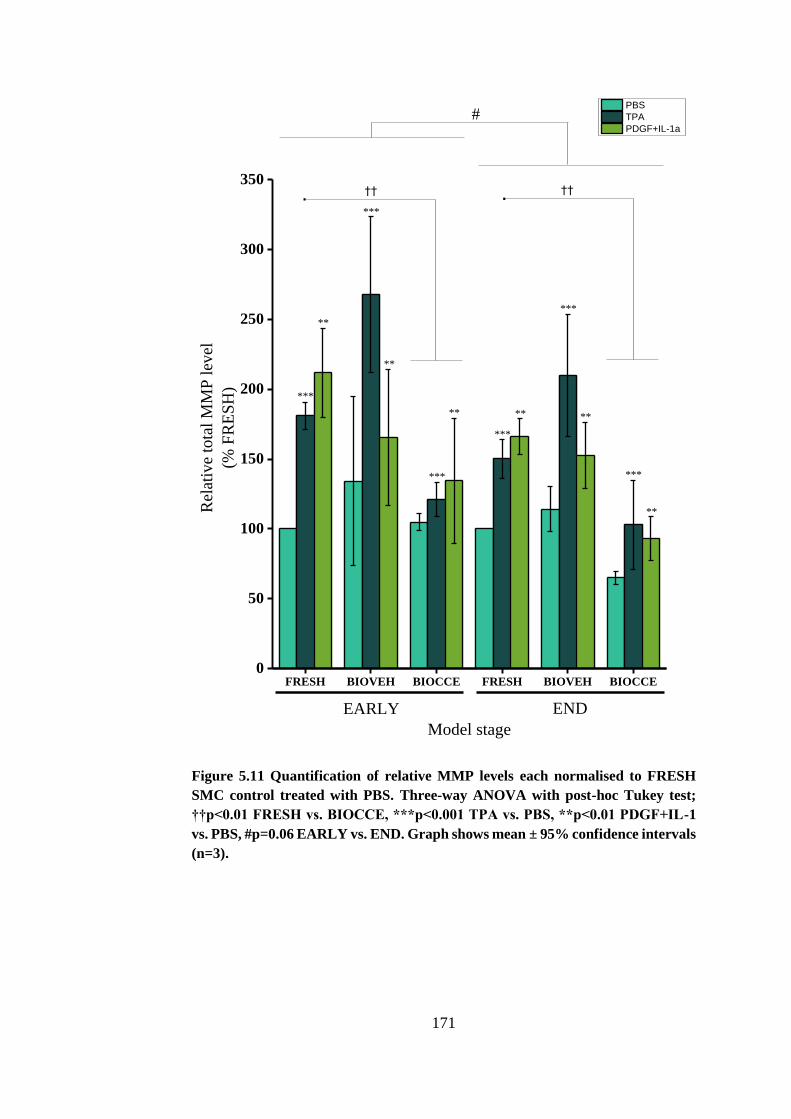
171
FRESH BIOVEH BIOCCE FRESH BIOVEH BIOCCE0
50
100
150
200
250
300
350††
**
******
**
**
***
***
***
***
***
.
END
Rel
ativ
e to
tal
MM
P l
evel
(% F
RE
SH
)
Model stage
PBS
TPA
PDGF+IL-1a
EARLY
#
.
***
††
Figure 5.11 Quantification of relative MMP levels each normalised to FRESH
SMC control treated with PBS. Three-way ANOVA with post-hoc Tukey test;
††p<0.01 FRESH vs. BIOCCE, ***p<0.001 TPA vs. PBS, **p<0.01 PDGF+IL-1
vs. PBS, #p=0.06 EARLY vs. END. Graph shows mean ± 95% confidence intervals
(n=3).
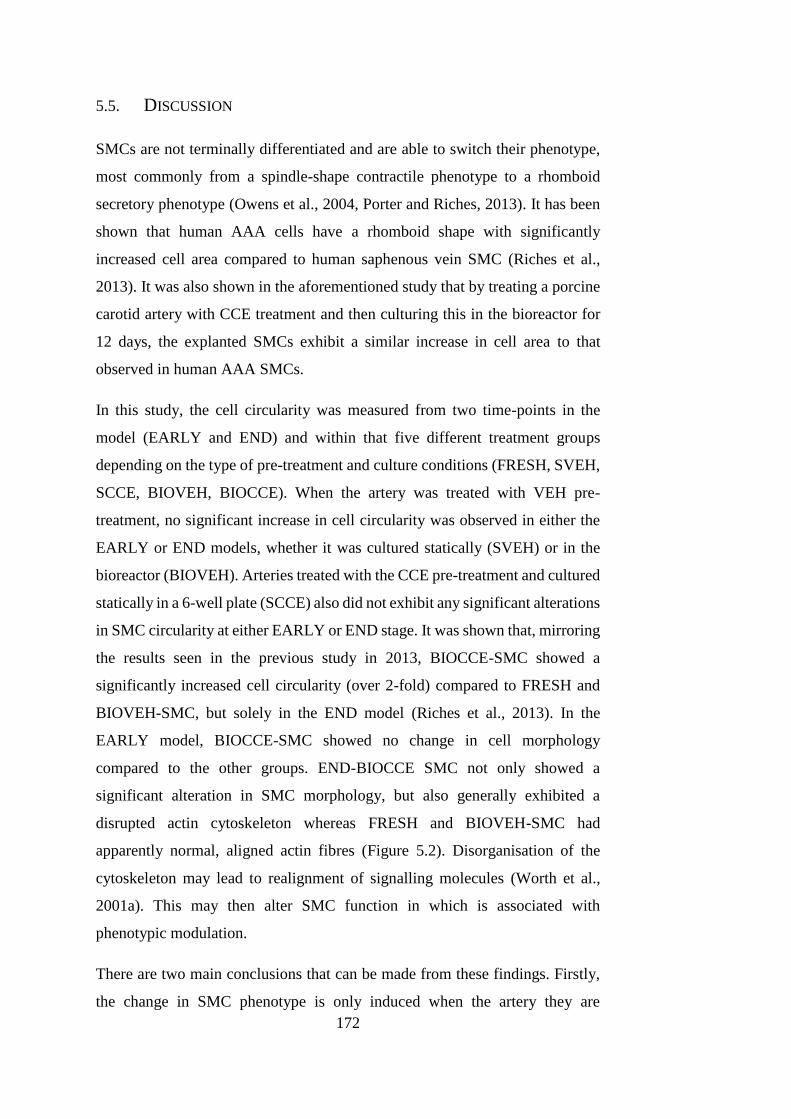
172
5.5. DISCUSSION
SMCs are not terminally differentiated and are able to switch their phenotype,
most commonly from a spindle-shape contractile phenotype to a rhomboid
secretory phenotype (Owens et al., 2004, Porter and Riches, 2013). It has been
shown that human AAA cells have a rhomboid shape with significantly
increased cell area compared to human saphenous vein SMC (Riches et al.,
2013). It was also shown in the aforementioned study that by treating a porcine
carotid artery with CCE treatment and then culturing this in the bioreactor for
12 days, the explanted SMCs exhibit a similar increase in cell area to that
observed in human AAA SMCs.
In this study, the cell circularity was measured from two time-points in the
model (EARLY and END) and within that five different treatment groups
depending on the type of pre-treatment and culture conditions (FRESH, SVEH,
SCCE, BIOVEH, BIOCCE). When the artery was treated with VEH pre-
treatment, no significant increase in cell circularity was observed in either the
EARLY or END models, whether it was cultured statically (SVEH) or in the
bioreactor (BIOVEH). Arteries treated with the CCE pre-treatment and cultured
statically in a 6-well plate (SCCE) also did not exhibit any significant alterations
in SMC circularity at either EARLY or END stage. It was shown that, mirroring
the results seen in the previous study in 2013, BIOCCE-SMC showed a
significantly increased cell circularity (over 2-fold) compared to FRESH and
BIOVEH-SMC, but solely in the END model (Riches et al., 2013). In the
EARLY model, BIOCCE-SMC showed no change in cell morphology
compared to the other groups. END-BIOCCE SMC not only showed a
significant alteration in SMC morphology, but also generally exhibited a
disrupted actin cytoskeleton whereas FRESH and BIOVEH-SMC had
apparently normal, aligned actin fibres (Figure 5.2). Disorganisation of the
cytoskeleton may lead to realignment of signalling molecules (Worth et al.,
2001a). This may then alter SMC function in which is associated with
phenotypic modulation.
There are two main conclusions that can be made from these findings. Firstly,
the change in SMC phenotype is only induced when the artery they are
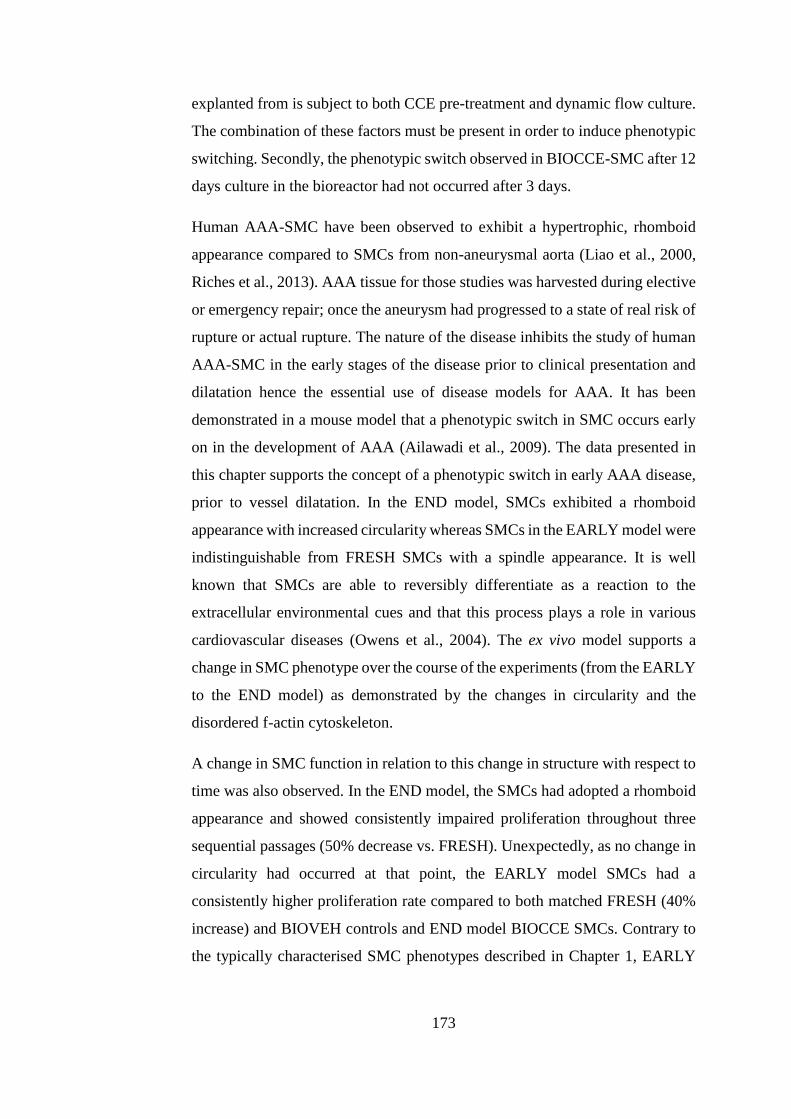
173
explanted from is subject to both CCE pre-treatment and dynamic flow culture.
The combination of these factors must be present in order to induce phenotypic
switching. Secondly, the phenotypic switch observed in BIOCCE-SMC after 12
days culture in the bioreactor had not occurred after 3 days.
Human AAA-SMC have been observed to exhibit a hypertrophic, rhomboid
appearance compared to SMCs from non-aneurysmal aorta (Liao et al., 2000,
Riches et al., 2013). AAA tissue for those studies was harvested during elective
or emergency repair; once the aneurysm had progressed to a state of real risk of
rupture or actual rupture. The nature of the disease inhibits the study of human
AAA-SMC in the early stages of the disease prior to clinical presentation and
dilatation hence the essential use of disease models for AAA. It has been
demonstrated in a mouse model that a phenotypic switch in SMC occurs early
on in the development of AAA (Ailawadi et al., 2009). The data presented in
this chapter supports the concept of a phenotypic switch in early AAA disease,
prior to vessel dilatation. In the END model, SMCs exhibited a rhomboid
appearance with increased circularity whereas SMCs in the EARLY model were
indistinguishable from FRESH SMCs with a spindle appearance. It is well
known that SMCs are able to reversibly differentiate as a reaction to the
extracellular environmental cues and that this process plays a role in various
cardiovascular diseases (Owens et al., 2004). The ex vivo model supports a
change in SMC phenotype over the course of the experiments (from the EARLY
to the END model) as demonstrated by the changes in circularity and the
disordered f-actin cytoskeleton.
A change in SMC function in relation to this change in structure with respect to
time was also observed. In the END model, the SMCs had adopted a rhomboid
appearance and showed consistently impaired proliferation throughout three
sequential passages (50% decrease vs. FRESH). Unexpectedly, as no change in
circularity had occurred at that point, the EARLY model SMCs had a
consistently higher proliferation rate compared to both matched FRESH (40%
increase) and BIOVEH controls and END model BIOCCE SMCs. Contrary to
the typically characterised SMC phenotypes described in Chapter 1, EARLY
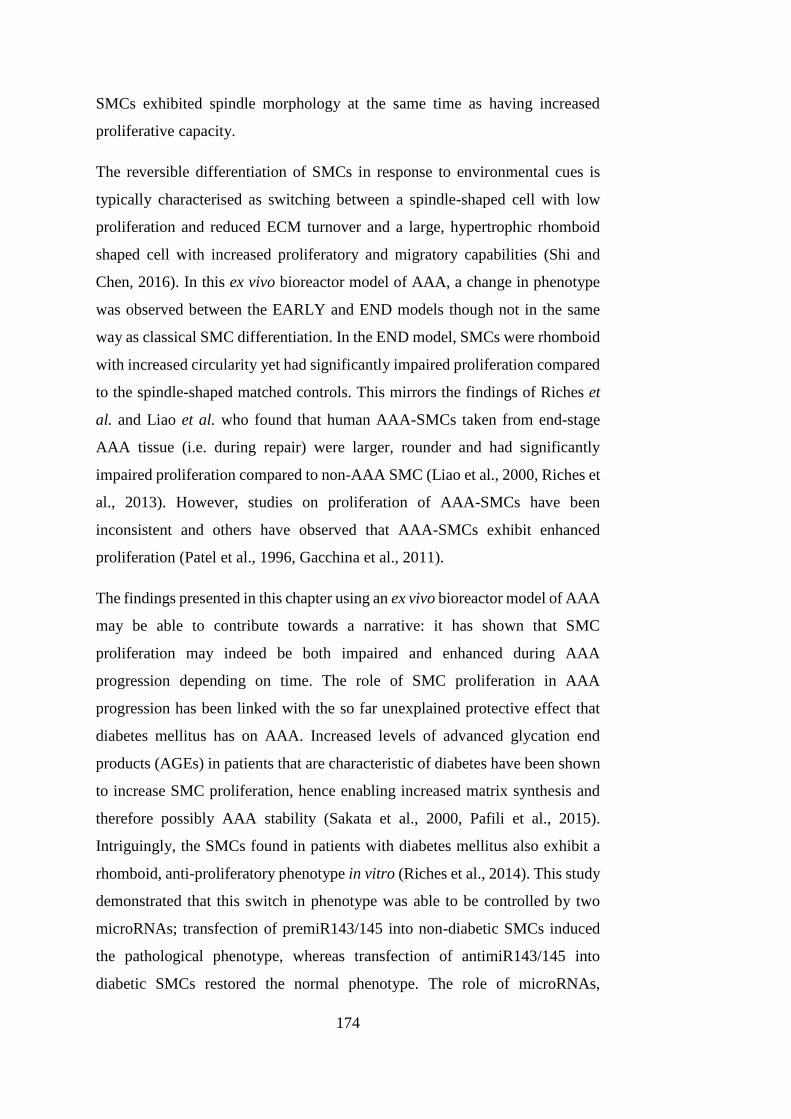
174
SMCs exhibited spindle morphology at the same time as having increased
proliferative capacity.
The reversible differentiation of SMCs in response to environmental cues is
typically characterised as switching between a spindle-shaped cell with low
proliferation and reduced ECM turnover and a large, hypertrophic rhomboid
shaped cell with increased proliferatory and migratory capabilities (Shi and
Chen, 2016). In this ex vivo bioreactor model of AAA, a change in phenotype
was observed between the EARLY and END models though not in the same
way as classical SMC differentiation. In the END model, SMCs were rhomboid
with increased circularity yet had significantly impaired proliferation compared
to the spindle-shaped matched controls. This mirrors the findings of Riches et
al. and Liao et al. who found that human AAA-SMCs taken from end-stage
AAA tissue (i.e. during repair) were larger, rounder and had significantly
impaired proliferation compared to non-AAA SMC (Liao et al., 2000, Riches et
al., 2013). However, studies on proliferation of AAA-SMCs have been
inconsistent and others have observed that AAA-SMCs exhibit enhanced
proliferation (Patel et al., 1996, Gacchina et al., 2011).
The findings presented in this chapter using an ex vivo bioreactor model of AAA
may be able to contribute towards a narrative: it has shown that SMC
proliferation may indeed be both impaired and enhanced during AAA
progression depending on time. The role of SMC proliferation in AAA
progression has been linked with the so far unexplained protective effect that
diabetes mellitus has on AAA. Increased levels of advanced glycation end
products (AGEs) in patients that are characteristic of diabetes have been shown
to increase SMC proliferation, hence enabling increased matrix synthesis and
therefore possibly AAA stability (Sakata et al., 2000, Pafili et al., 2015).
Intriguingly, the SMCs found in patients with diabetes mellitus also exhibit a
rhomboid, anti-proliferatory phenotype in vitro (Riches et al., 2014). This study
demonstrated that this switch in phenotype was able to be controlled by two
microRNAs; transfection of premiR143/145 into non-diabetic SMCs induced
the pathological phenotype, whereas transfection of antimiR143/145 into
diabetic SMCs restored the normal phenotype. The role of microRNAs,
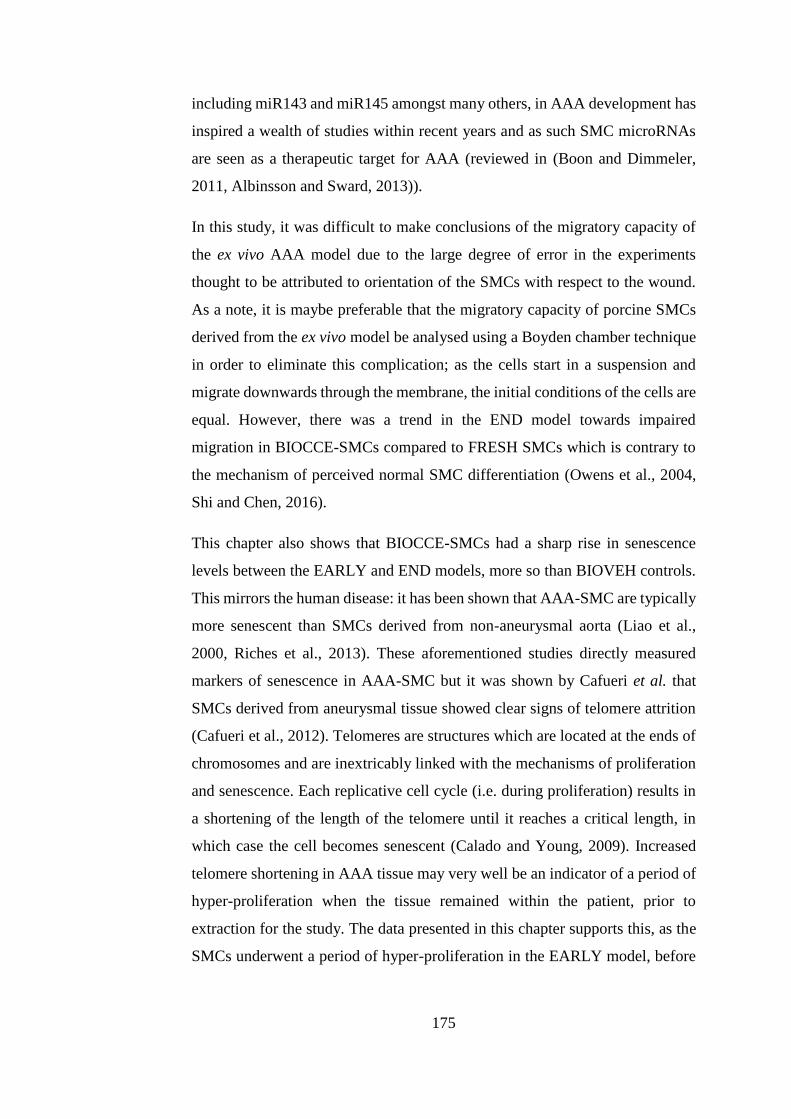
175
including miR143 and miR145 amongst many others, in AAA development has
inspired a wealth of studies within recent years and as such SMC microRNAs
are seen as a therapeutic target for AAA (reviewed in (Boon and Dimmeler,
2011, Albinsson and Sward, 2013)).
In this study, it was difficult to make conclusions of the migratory capacity of
the ex vivo AAA model due to the large degree of error in the experiments
thought to be attributed to orientation of the SMCs with respect to the wound.
As a note, it is maybe preferable that the migratory capacity of porcine SMCs
derived from the ex vivo model be analysed using a Boyden chamber technique
in order to eliminate this complication; as the cells start in a suspension and
migrate downwards through the membrane, the initial conditions of the cells are
equal. However, there was a trend in the END model towards impaired
migration in BIOCCE-SMCs compared to FRESH SMCs which is contrary to
the mechanism of perceived normal SMC differentiation (Owens et al., 2004,
Shi and Chen, 2016).
This chapter also shows that BIOCCE-SMCs had a sharp rise in senescence
levels between the EARLY and END models, more so than BIOVEH controls.
This mirrors the human disease: it has been shown that AAA-SMC are typically
more senescent than SMCs derived from non-aneurysmal aorta (Liao et al.,
2000, Riches et al., 2013). These aforementioned studies directly measured
markers of senescence in AAA-SMC but it was shown by Cafueri et al. that
SMCs derived from aneurysmal tissue showed clear signs of telomere attrition
(Cafueri et al., 2012). Telomeres are structures which are located at the ends of
chromosomes and are inextricably linked with the mechanisms of proliferation
and senescence. Each replicative cell cycle (i.e. during proliferation) results in
a shortening of the length of the telomere until it reaches a critical length, in
which case the cell becomes senescent (Calado and Young, 2009). Increased
telomere shortening in AAA tissue may very well be an indicator of a period of
hyper-proliferation when the tissue remained within the patient, prior to
extraction for the study. The data presented in this chapter supports this, as the
SMCs underwent a period of hyper-proliferation in the EARLY model, before
176
reverting to rhomboid senescent SMCs with impaired proliferation in the END
model.
MMPs (and their inhibitors) are heavily implicated in the progression of AAAs.
These proteases are secreted as part of the normal tissue remodelling process,
but in the case of AAA matrix degradation and synthesis is unbalanced
(reviewed in Keeling et al. (2005) and Galis and Khatri (2002)). In this study,
levels of MMP-2 and MMP-9 were examined specifically. Out of the six
samples analysed, only SMCs from one animal secreted any detectable levels
of MMP-9. All samples secreted higher levels of MMP-2, including proMMP-
2 and intermediate MMP-2. BIOCCE-SMCs typically secreted lower levels of
MMPs compared to the matched controls, and secretions of MMPs tended to be
higher in the EARLY model compared to the END model. It was demonstrated
that END SMCs have an aberrant phenotype, with impaired proliferation and
markedly increased levels of senescence. Therefore, it was not unexpected that
they secreted lower levels of MMPs.
Due to the increased proliferation in the EARLY BIOCCE SMCs it was
expected that a similar increase in MMP secretion would have been observed.
However, there were similar basal MMP levels compared to the matched
EARLY FRESH and BIOVEH control SMCs. An explanation for this may be
that SMCs at the same density were left to adhere for less than 24 hours before
being transferred to serum free media to induce the SMCs into a quiescent state.
When in such a state, cells will arrest in the G0 phase of the cell cycle where
they are neither dividing nor preparing to divide. Any contribution of
proliferation to MMP levels should therefore be minimised as a typical cell
cycle length for porcine SMCs is 32 hours (Breton et al., 1986). In addition,
stimuli treatments were carried out in minimal growth media (containing only
0.4% FCS) and so the SMCs will be minimally proliferating. Therefore, it is
assumed that MMP levels would have been investigated on a very similar SMC
density across all groups. It is conceivable that further investigation would
reveal increased MMP secretion in the EARLY model tissue due to the
increased SMC number as a result of the observed hyperproliferation.
177
MMP-2 and MMP-9 are found in abundance in human AAA tissue, to the extent
that attempts have been made to assess their suitability as an AAA biomarker
(Longo et al., 2002, Eugster et al., 2005, Wilson et al., 2008). MMP-2 is
typically found to be associated with smaller aneurysms, earlier on in their
progression, whereas MMP-9 becomes dominant once the aortic diameter had
increased (Freestone et al., 1995). MMP-2 expression was increased in SMCs
derived from end-stage human AAA tissue cultured in vitro (Crowther et al.,
2000). AAAs are characterised by considerable overexpression of various
MMPs. The levels of overexpression in the model may be considered modest in
comparison however an intra-luminal thrombus (ILT) is not present in the
model. ILT is commonly found in human AAAs and is a rich source of MMPs
and pro-inflammatory cytokines (Fontaine et al., 2002). The lack of an ILT in
this model may therefore be considered a limitation of the model as it plays a
major role in exacerbation of the pathological remodelling associated with
AAA. In animal models, ILT are typically only present in angiotensin II
infusion in ApoE knockout mice and the elastase perfusion method in rats only
(Wilson et al., 2013).
In contrast to human AAA tissue, the END model SMCs secreted reduced levels
of MMPs compared to matched controls. This may be explained by the fact that
the nature of the model requires arterial cells alone (adventitial fibroblasts,
SMCs and endothelial cells) are isolated from the animal for culture in the
bioreactor and so removes the effect of the rest of the entity, most notably the
immune system. MMPs are secreted not just by SMCs, but also by
macrophages, B lymphocytes, mesenchymal stromal cells and the intraluminal
thrombus (Fontaine et al., 2002, Tsuruda et al., 2008, Ciavarella et al., 2015,
Zhang and Wang, 2015). The origin of MMP-2 in AAAs is SMCs and
fibroblasts whereas MMP-9 is highly expressed by macrophages, which were
not present in the ex vivo model (Ailawadi et al., 2003). The removal of these
compounding factors may explain why increased MMP production is not
observed in the EARLY and END model SMCs.
Although their rhomboid morphology is similar, contrary to de-differentiated
rhomboid secretory SMCs, AAA-SMCs have impaired proliferation and
178
migration and possess increased levels of senescence which are sustained
through in vitro culture passages. This persistent phenotype may point to the
role of epigenetic mechanisms and microRNAs in SMC phenotypic modulation
in AAA disease (Boon and Dimmeler, 2011, Davis et al., 2015). It was shown
in both previous and current studies in our laboratory that the ex vivo END
model is able to mimic these criteria in END-BIOCCE SMCs (Riches et al.,
2013). Conversely, the data presented in this chapter have shown that
differentiated SMCs with spindle morphology exhibit increased proliferation
which contradicts the classical characterisation of SMC phenotype (Shi and
Chen, 2016). Hyperproliferation in SMCs has been documented as a cellular
response to arterial insult (Owens et al., 2004). It is hypothesised that as the
SMCs hyperproliferate, they become senescent more quickly as the
proliferation-associated telomeres are shortened more rapidly resulting in a
dysfunctional, aberrant and senescent SMC phenotype in the later stages of the
disease, as described in the END model. Indeed, as mentioned previously,
shortened telomeres appear to be a feature of human AAA-SMCs (Cafueri et
al., 2012). The SMCs are unable to proliferate sufficiently to balance their
descent into senescence and apoptosis, resulting in the observed loss of SMCs
in AAA tissue (Lopez-Candales et al., 1997). Due to the nature of AAA disease,
any validation of the EARLY model with human tissue, prior to clinical
presentation, is virtually impossible.
Considering the results presented in this chapter, it would be inappropriate to
include EARLY and END BIOCCE SMCs as part of the classical SMC
phenotype. As discussed in Chapter 1, SMCs are typically characterised as
having two distinct phenotypes: a spindle shape contractile phenotype with low
proliferative and migratory capacity or a hypertrophic rhomboid shape synthetic
phenotype which is highly proliferative and migratory (Rzucidlo et al., 2007,
Shi and Chen, 2016). The data indicated that BIOCCE SMCs exhibited a
distinct phenotype incorporating both classical differentiated and de-
differentiated characteristics. BIOCCE SMCs also entered a state of early
senescence compared to the experimental control groups and exhibited high
numbers of senescence-associated β-galactosidase positive cells. In the last two
decades, a specific senescent cell phenotype has been identified in humans and
179
this was recently characterised in human SMCs and implicated in vascular
calcification (Coppé et al., 2008, Burton et al., 2010, Liu et al., 2013). This
senescence associated secretory phenotype (SASP) leads SMCs to display a
commonly altered secretome similar to a wound healing response, including
increased levels of TGFβ1, IL-1, IL-6 and IL-8 (Adams, 2009). This state of
cellular senescence is a protective mechanism triggered by DNA damage in two
distinct pathways. Telomeres are structures which prevent the ends of the
chromosome being recognised as a double strand DNA break. Telomeres
become shorter when cells divide, as mentioned previously, and when they
reach a critical length they are no longer able to protect against the DNA damage
response and senescence is triggered. This first mechanism is replicative
senescence (Burton and Krizhanovsky, 2014). The second mechanism is
mediated via factors independent of telomere length which involve DNA
damage, such as ROS or various oncogenes (Nelson et al., 2014). Further
investigation in our laboratory has revealed that both END BIOCCE SMCs and
human AAA SMCs have higher numbers of aberrant nuclei and increased levels
of γ-H2AX, both indicators of DNA damage (unpublished). This is compelling
evidence showing that the documented structure and dysfunction of human
AAA SMCs and END BIOCCE SMCs are possibly part of accelerated
senescence due to DNA damage and so have adopted SASP.
Previous investigation in this laboratory also found a similar contradiction to
the classical SMC phenotype in SMCs from patients with Type 2 diabetes
mellitus. This distinct phenotype was able to be reversibly driven by miR-143
and 145: transfection of antimiR-143 and 145 into diabetic SMCs restored
normal morphology and function (Riches et al., 2014). This was characterised
as a distinct diabetic SMC phenotype, however it may also be found in AAA
SMCs. It is extremely interesting to note that diabetes is typically considered to
have a protective effect from AAA disease and so further investigation into this
link is heavily encouraged.
In summary, this chapter has characterised the structure and function of SMCs
explanted from an ex vivo bioreactor model of AAA. CCE treatment and flow
culture used in combination induce a persistent SMC phenotype similar to that
180
seen in human end-stage AAA tissue. The END model produced SMCs which
were rhomboid with a disordered cytoskeleton, had an impaired proliferative
capacity, and had high levels of senescence with low MMP secretion. The
EARLY model has revealed a period of hyper-proliferation, potentially
accelerating the onset of general SMC senescence. This may have revealed a
potential molecular target of early hyperproliferative markers for stabilisation
of SMC numbers in AAA as a therapeutic treatment.

181
CHAPTER 6
EX VIVO MODEL BIOMECHANICS
182
CHAPTER 6 EX VIVO MODEL BIOMECHANICS
This chapter describes the development of methodology for biomechanical
testing of the ex vivo model arterial tissues as examined in Chapter 4. The tissue
was subjected to various treatment and culture regimes, details of which are
given in Chapter 3. The effects of CCE treatment and bioreactor culture on
tissue biomechanics were explored in order to validate the END ex vivo
bioreactor model with human AAA biomechanical data reported in the
literature. The first section of this chapter gives the results of the whole artery
dilation testing. Following this, the results for uniaxial tensile testing of the
END AAA model are given.
6.1. INTRODUCTION
Once an AAA has developed, the aorta will continue to expand at a rate
proportional to its diameter until rupture of the AAA will inevitably occur
unless elective repair is undertaken (Brady et al., 2004, Kent, 2014). Rupture of
the arterial wall is a mechanical failure whereby the haemodynamic stresses
exceed the failure strength of the aorta and so biomechanical properties of the
aneurysmal wall have been widely studied over the years (Sumner et al., 1970,
Vorp et al., 2003, Kontopodis et al., 2015, Schriefl et al., 2015). Although
rupture is the catastrophic end-point of AAA, aneurysmal biomechanics are
relevant throughout the AAA initiation and development process. Alterations in
the matrix stemming from dysfunction of SMCs – responsible for ECM
secretion – and high expression of MMPs throughout AAA tissue directly affect
biomechanics and therefore the function of the aorta (Shah, 1997, Galis and
Khatri, 2002, Curci, 2009). The typical mechanical behaviour of arterial tissue
follows a biphasic linear pattern where elastin governs the biomechanical
behaviour at low strains and during increasing strain collagen fibres are
gradually recruited through a transition phase. Increasing strain further, the
biomechanics enter a collagen phase with greater strength and stiffness. This
typical biphasic curve can be seen in Figure 1.7.
183
Myriad modelling and experimental techniques have been employed to
investigate the biomechanical properties of AAA. Peak wall stress has been
modelled variously, from using idealized AAA models with two-dimensional
analysis right up to patient-specific finite element and fluid structure interaction
models (Stringfellow et al., 1987, Scotti et al., 2008, Nestola et al., 2016). In
order to determine bulk material properties of AAA (necessary for
computational model inputs), experimental work has been used. The simplest
and most implementable method for determining bulk material properties is the
uniaxial test. Many studies into biphasic arterial behaviour and the effect of
aneurysm used uniaxial tensile tests to compare the composition of the matrix
and its alterations in AAA and their subsequent effect on AAA biomechanics
(Sumner et al., 1970, Sakalihasan et al., 1993, He and Roach, 1994, Thubrikar
et al., 2001, Tavares Monteiro et al., 2014, Schriefl et al., 2015) . Ex vivo
mechanical testing has shown AAA tissue to have a greatly reduced strength
whilst being stiffer, especially in the circumferential orientation (Vorp et al.,
1996, Thubrikar et al., 2001, Geest et al., 2006). The AAA wall was assumed to
be linearly elastic and isotropic in earlier studies, though this has since been
deemed unsuitable for purpose as aneurysmal tissue is materially non-linear and
undergoes large strains prior to failure (Raghavan and Vorp, 2000, Vande Geest
et al., 2008). Uniaxial tensile testing is considered to be the least complex and
simplest test of mechanical properties. For most biological tissues, uniaxial
tensile testing is usually conducted in two tissue orientations for consideration
of the anisotropy. However, the simplicity of the uniaxial tensile testing method
is reflected in the results, as it does not conclusively allow the mechanical
properties of the whole organ to be determined.
Uniaxial/biaxial tensile testing techniques require the removal of tissue from the
patient and so are suited for tissue removed during repair surgery. However, in
order to investigate the mechanical properties of aneurysms at earlier stages of
the disease to appreciate temporal changes, development of non-invasive
methods was necessary. Systemic pressurisation of the AAA in vivo results in
changes in the AAA diameter during systole and diastole which are able to be
measured by ultrasound, magnetic resonance imaging (MRI) and computerised
tomography scan (CT scan). Concordant with ex vivo uniaxial testing, AAAs
184
measured in vivo have been found to have increased stiffness and reduced
distensibility compared to healthy aorta (Lanne et al., 1992, Ganten et al., 2008,
Hoegh and Lindholt, 2009, Molacek et al., 2011). These in vivo imaging
techniques rely on measuring the diameter of the artery in relation to
characterised pressurisation via imagine techniques. This method can also be
performed ex vivo as it is a more functional test. Maintaining the artery as a
whole organ as opposed to manipulating tissue into flat strips would provide
more informed analysis of the artery functioning as a physiological organ. The
anisotropic response of AAA tissue is not able to be conclusively assessed using
the simpler method of uniaxial tensile testing (Vorp and Geest, 2005, Zeinali-
Davarani et al., 2013). Whole artery pressure-dilation techniques for
determining biomechanical properties of animal AAA models are able to be
directly compared to in situ human AAAs and so a clinical comparison can be
made (Tierney et al., 2010). In addition, it may not be practical to segment tissue
with very low yield such as small animal aortae into strips suitable for uniaxial
tensile testing (Collins et al., 2011, Haskett et al., 2013).
Biomechanical validation of experimental AAAs in animal models appears to
be more commonly used only in recent years. In small animal models,
uniaxial/biaxial tensile testing and both in vivo and ex vivo whole artery
pressure-dilation testing have been used to assess arterial biomechanics (Collins
et al., 2011, Haskett et al., 2013, Phillips et al., 2015, Trachet et al., 2015, Zidi
and Allaire, 2015). For large animals, there is a smaller body of work which has
used uniaxial/biaxial tensile testing and ex vivo whole artery pressure-dilation
testing (Kratzberg et al., 2009, Tierney et al., 2010, Zeinali-Davarani et al.,
2013).
Investigating the biomechanical behaviour of the ex vivo bioreactor model of
AAA enables biomechanical validation compared to human disease. It also
enables the relationship between the dysfunction in the SMCs – responsible for
secreting and degrading ECM – and the function of the artery as a whole organ
to be elucidated.
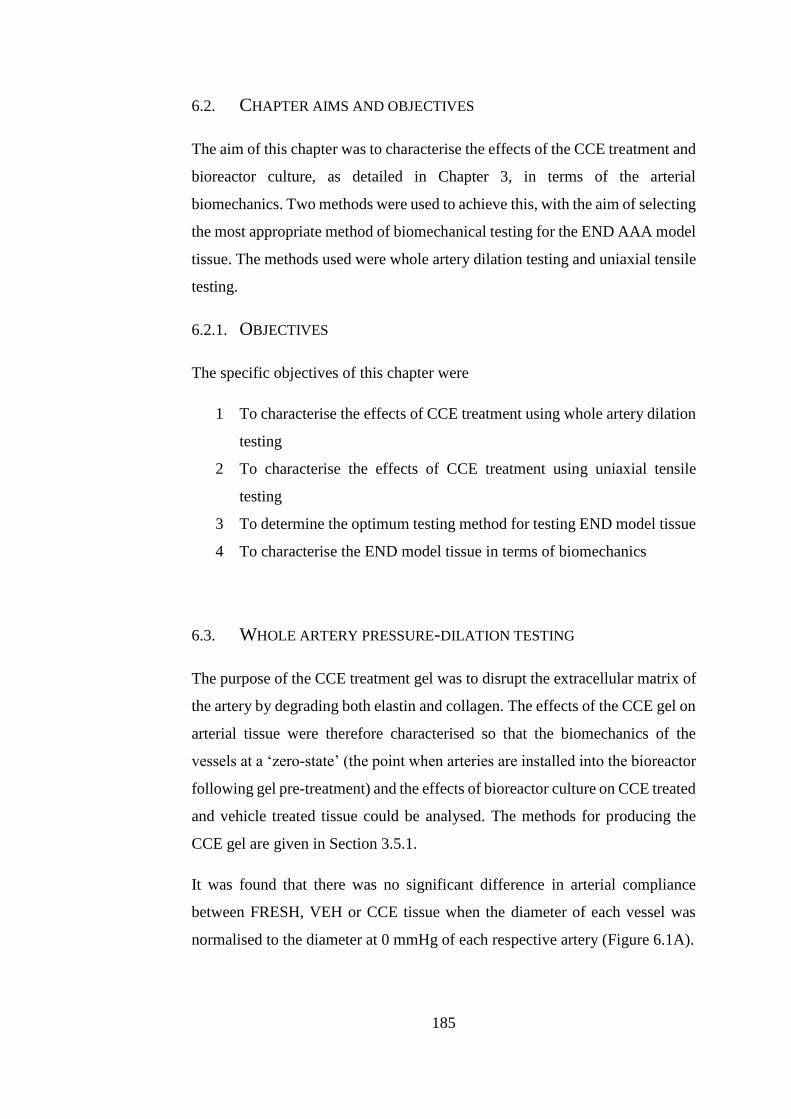
185
6.2. CHAPTER AIMS AND OBJECTIVES
The aim of this chapter was to characterise the effects of the CCE treatment and
bioreactor culture, as detailed in Chapter 3, in terms of the arterial
biomechanics. Two methods were used to achieve this, with the aim of selecting
the most appropriate method of biomechanical testing for the END AAA model
tissue. The methods used were whole artery dilation testing and uniaxial tensile
testing.
6.2.1. OBJECTIVES
The specific objectives of this chapter were
1 To characterise the effects of CCE treatment using whole artery dilation
testing
2 To characterise the effects of CCE treatment using uniaxial tensile
testing
3 To determine the optimum testing method for testing END model tissue
4 To characterise the END model tissue in terms of biomechanics
6.3. WHOLE ARTERY PRESSURE-DILATION TESTING
The purpose of the CCE treatment gel was to disrupt the extracellular matrix of
the artery by degrading both elastin and collagen. The effects of the CCE gel on
arterial tissue were therefore characterised so that the biomechanics of the
vessels at a ‘zero-state’ (the point when arteries are installed into the bioreactor
following gel pre-treatment) and the effects of bioreactor culture on CCE treated
and vehicle treated tissue could be analysed. The methods for producing the
CCE gel are given in Section 3.5.1.
It was found that there was no significant difference in arterial compliance
between FRESH, VEH or CCE tissue when the diameter of each vessel was
normalised to the diameter at 0 mmHg of each respective artery (Figure 6.1A).
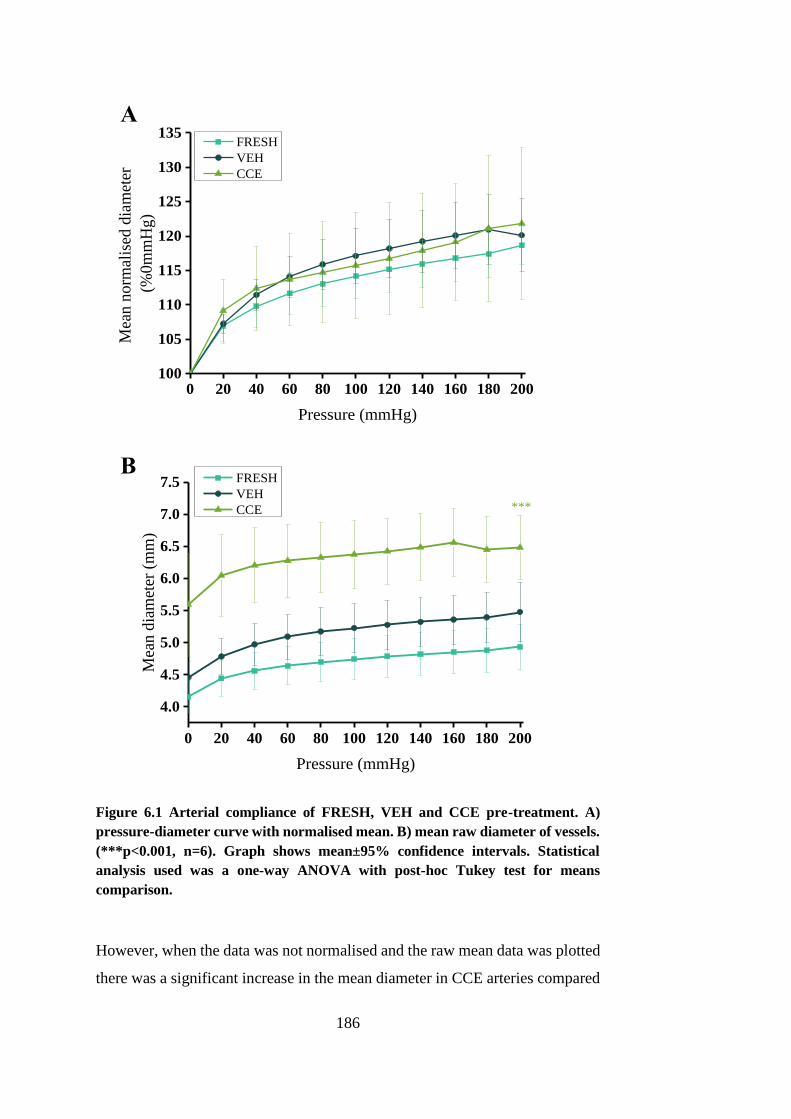
186
Figure 6.1 Arterial compliance of FRESH, VEH and CCE pre-treatment. A)
pressure-diameter curve with normalised mean. B) mean raw diameter of vessels.
(***p<0.001, n=6). Graph shows mean±95% confidence intervals. Statistical
analysis used was a one-way ANOVA with post-hoc Tukey test for means
comparison.
However, when the data was not normalised and the raw mean data was plotted
there was a significant increase in the mean diameter in CCE arteries compared
0 20 40 60 80 100 120 140 160 180 200100
105
110
115
120
125
130
135M
ean
no
rmal
ised
dia
met
er
(%0
mm
Hg
)
Pressure (mmHg)
FRESH
VEH
CCE
0 20 40 60 80 100 120 140 160 180 200
4.0
4.5
5.0
5.5
6.0
6.5
7.0
7.5
Mea
n d
iam
eter
(m
m)
Pressure (mmHg)
FRESH
VEH
CCE ***
A
B
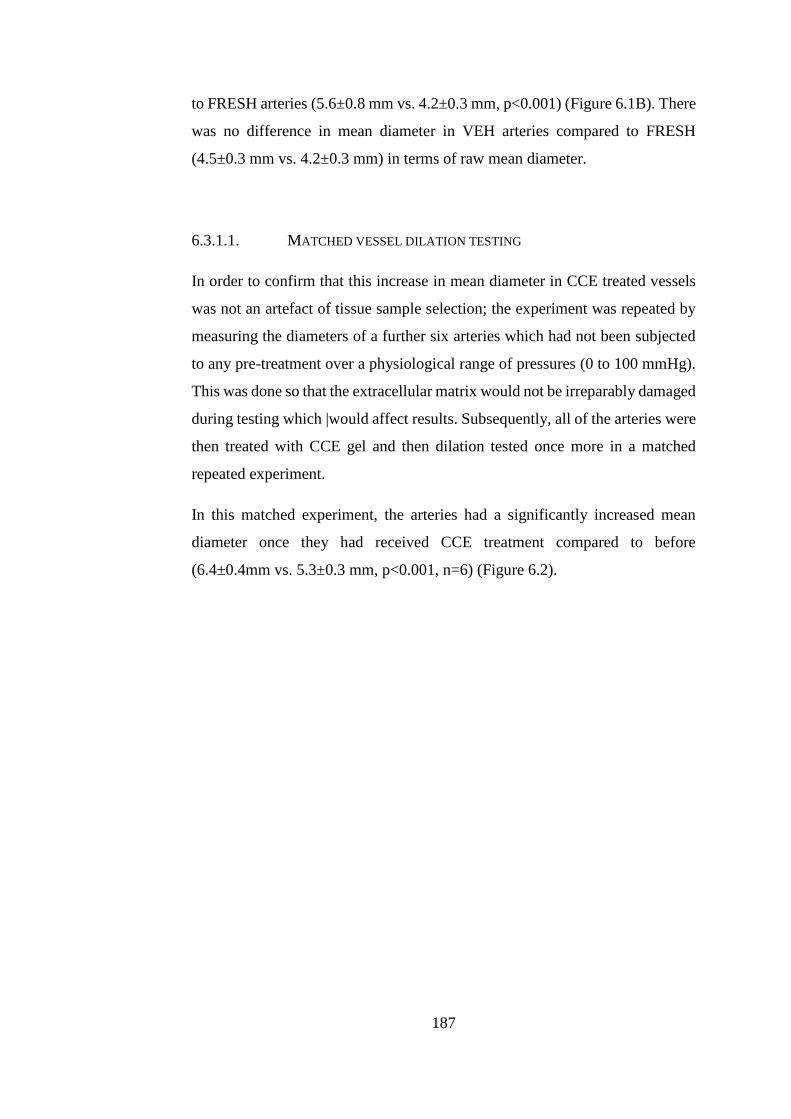
187
to FRESH arteries (5.6±0.8 mm vs. 4.2±0.3 mm, p<0.001) (Figure 6.1B). There
was no difference in mean diameter in VEH arteries compared to FRESH
(4.5±0.3 mm vs. 4.2±0.3 mm) in terms of raw mean diameter.
6.3.1.1. MATCHED VESSEL DILATION TESTING
In order to confirm that this increase in mean diameter in CCE treated vessels
was not an artefact of tissue sample selection; the experiment was repeated by
measuring the diameters of a further six arteries which had not been subjected
to any pre-treatment over a physiological range of pressures (0 to 100 mmHg).
This was done so that the extracellular matrix would not be irreparably damaged
during testing which |would affect results. Subsequently, all of the arteries were
then treated with CCE gel and then dilation tested once more in a matched
repeated experiment.
In this matched experiment, the arteries had a significantly increased mean
diameter once they had received CCE treatment compared to before
(6.4±0.4mm vs. 5.3±0.3 mm, p<0.001, n=6) (Figure 6.2).
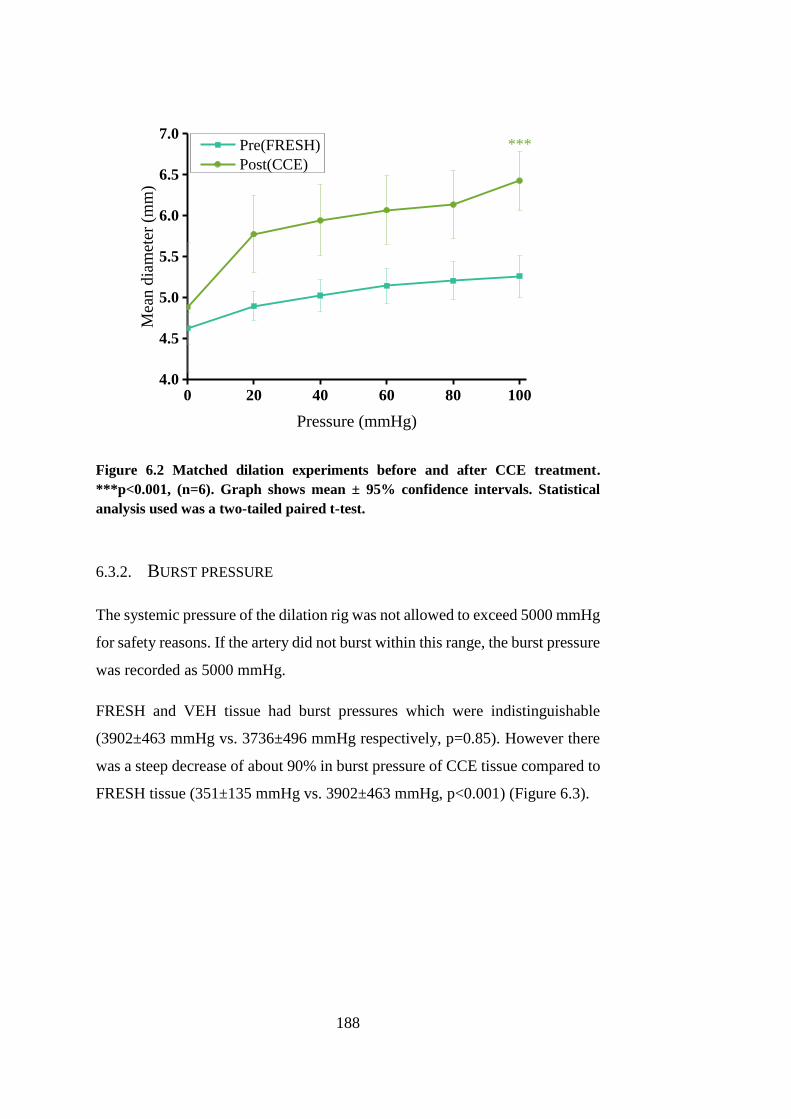
188
0 20 40 60 80 1004.0
4.5
5.0
5.5
6.0
6.5
7.0M
ean
dia
met
er (
mm
)
Pressure (mmHg)
Pre(FRESH)
Post(CCE)
***
Figure 6.2 Matched dilation experiments before and after CCE treatment.
***p<0.001, (n=6). Graph shows mean ± 95% confidence intervals. Statistical
analysis used was a two-tailed paired t-test.
6.3.2. BURST PRESSURE
The systemic pressure of the dilation rig was not allowed to exceed 5000 mmHg
for safety reasons. If the artery did not burst within this range, the burst pressure
was recorded as 5000 mmHg.
FRESH and VEH tissue had burst pressures which were indistinguishable
(3902±463 mmHg vs. 3736±496 mmHg respectively, p=0.85). However there
was a steep decrease of about 90% in burst pressure of CCE tissue compared to
FRESH tissue (351±135 mmHg vs. 3902±463 mmHg, p<0.001) (Figure 6.3).
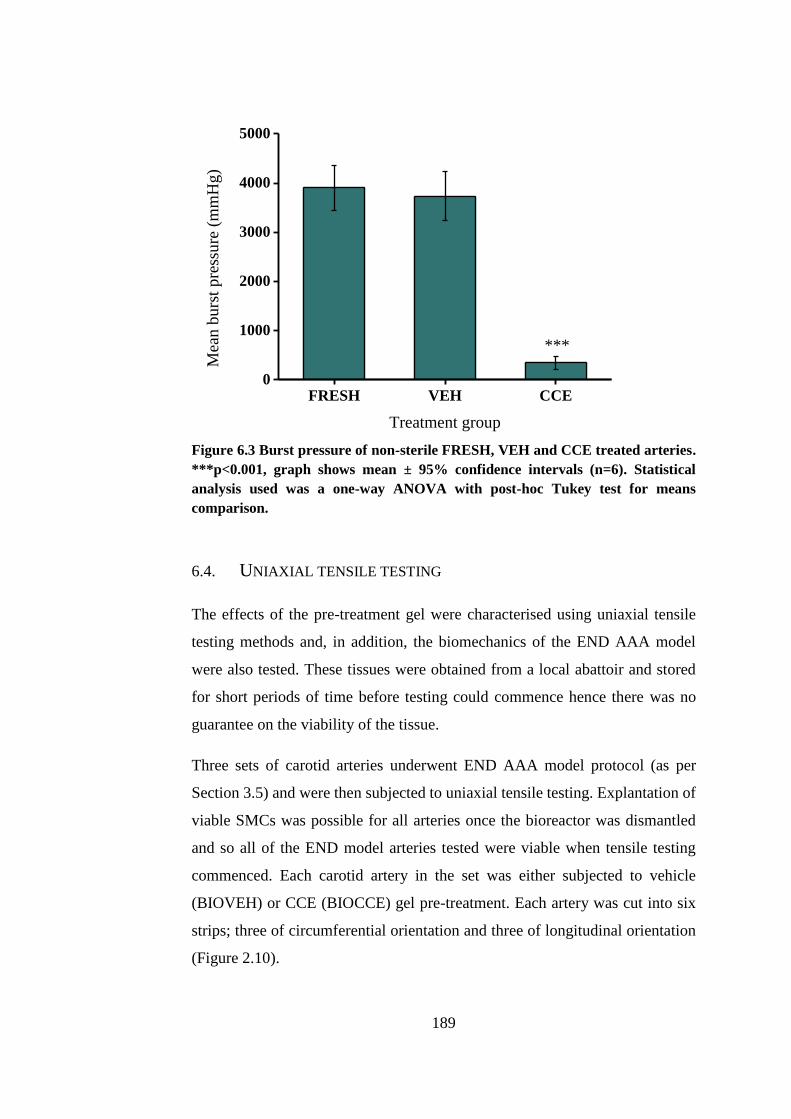
189
FRESH VEH CCE0
1000
2000
3000
4000
5000
Mea
n b
urs
t p
ress
ure
(m
mH
g)
Treatment group
***
Figure 6.3 Burst pressure of non-sterile FRESH, VEH and CCE treated arteries.
***p<0.001, graph shows mean ± 95% confidence intervals (n=6). Statistical
analysis used was a one-way ANOVA with post-hoc Tukey test for means
comparison.
6.4. UNIAXIAL TENSILE TESTING
The effects of the pre-treatment gel were characterised using uniaxial tensile
testing methods and, in addition, the biomechanics of the END AAA model
were also tested. These tissues were obtained from a local abattoir and stored
for short periods of time before testing could commence hence there was no
guarantee on the viability of the tissue.
Three sets of carotid arteries underwent END AAA model protocol (as per
Section 3.5) and were then subjected to uniaxial tensile testing. Explantation of
viable SMCs was possible for all arteries once the bioreactor was dismantled
and so all of the END model arteries tested were viable when tensile testing
commenced. Each carotid artery in the set was either subjected to vehicle
(BIOVEH) or CCE (BIOCCE) gel pre-treatment. Each artery was cut into six
strips; three of circumferential orientation and three of longitudinal orientation
(Figure 2.10).
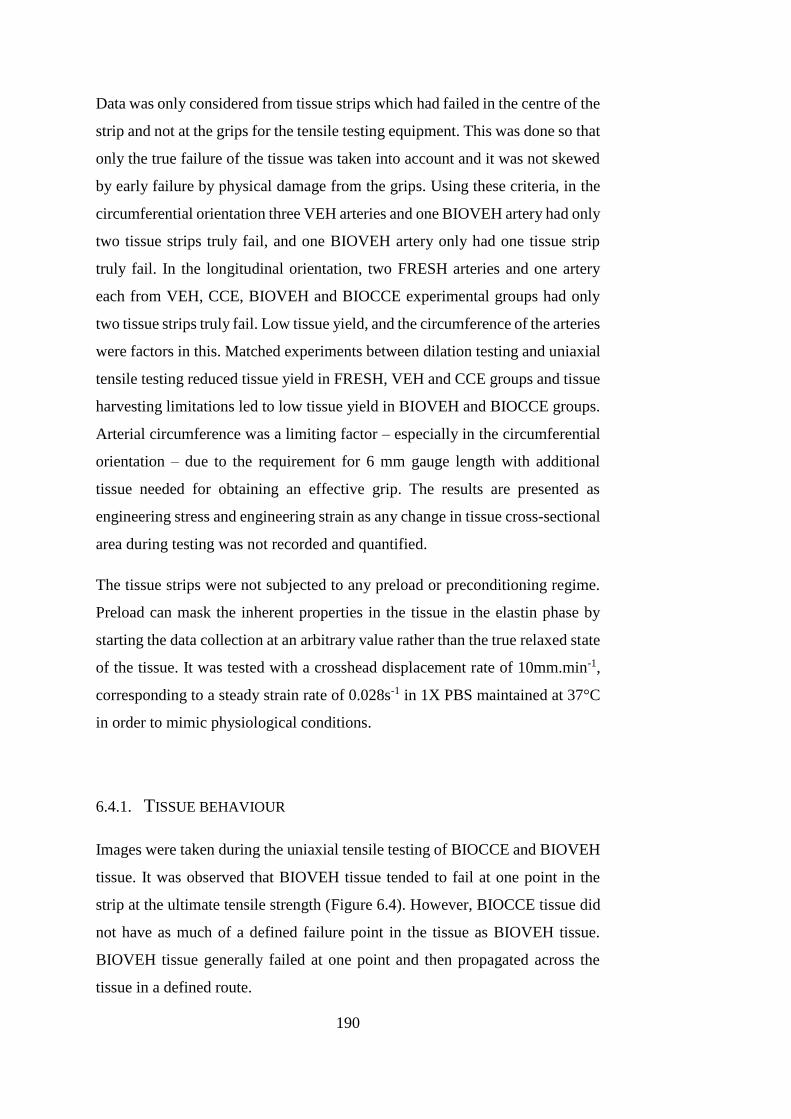
190
Data was only considered from tissue strips which had failed in the centre of the
strip and not at the grips for the tensile testing equipment. This was done so that
only the true failure of the tissue was taken into account and it was not skewed
by early failure by physical damage from the grips. Using these criteria, in the
circumferential orientation three VEH arteries and one BIOVEH artery had only
two tissue strips truly fail, and one BIOVEH artery only had one tissue strip
truly fail. In the longitudinal orientation, two FRESH arteries and one artery
each from VEH, CCE, BIOVEH and BIOCCE experimental groups had only
two tissue strips truly fail. Low tissue yield, and the circumference of the arteries
were factors in this. Matched experiments between dilation testing and uniaxial
tensile testing reduced tissue yield in FRESH, VEH and CCE groups and tissue
harvesting limitations led to low tissue yield in BIOVEH and BIOCCE groups.
Arterial circumference was a limiting factor – especially in the circumferential
orientation – due to the requirement for 6 mm gauge length with additional
tissue needed for obtaining an effective grip. The results are presented as
engineering stress and engineering strain as any change in tissue cross-sectional
area during testing was not recorded and quantified.
The tissue strips were not subjected to any preload or preconditioning regime.
Preload can mask the inherent properties in the tissue in the elastin phase by
starting the data collection at an arbitrary value rather than the true relaxed state
of the tissue. It was tested with a crosshead displacement rate of 10mm.min-1,
corresponding to a steady strain rate of 0.028s-1 in 1X PBS maintained at 37°C
in order to mimic physiological conditions.
6.4.1. TISSUE BEHAVIOUR
Images were taken during the uniaxial tensile testing of BIOCCE and BIOVEH
tissue. It was observed that BIOVEH tissue tended to fail at one point in the
strip at the ultimate tensile strength (Figure 6.4). However, BIOCCE tissue did
not have as much of a defined failure point in the tissue as BIOVEH tissue.
BIOVEH tissue generally failed at one point and then propagated across the
tissue in a defined route.
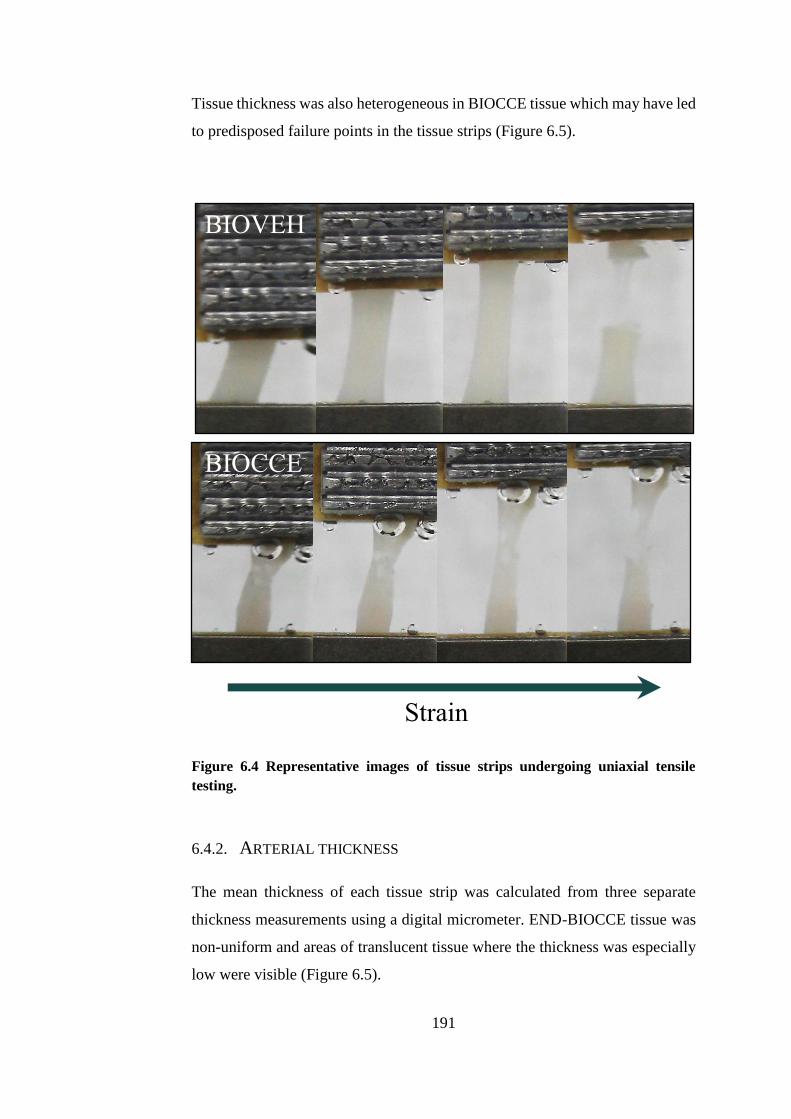
191
Tissue thickness was also heterogeneous in BIOCCE tissue which may have led
to predisposed failure points in the tissue strips (Figure 6.5).
Figure 6.4 Representative images of tissue strips undergoing uniaxial tensile
testing.
6.4.2. ARTERIAL THICKNESS
The mean thickness of each tissue strip was calculated from three separate
thickness measurements using a digital micrometer. END-BIOCCE tissue was
non-uniform and areas of translucent tissue where the thickness was especially
low were visible (Figure 6.5).
Strain
BIOCCE
BIOVEH
192
Figure 6.5 Non-uniformity of arterial thickness in END-BIOCCE tissue. Arrows
indicate translucent areas in excessively thinned tissue.
The application of CCE treatment induced a significant reduction in arterial
thickness. In addition, bioreactor culture on either VEH or CCE treated arteries
induced a marked reduction in arterial thickness.
A one-way ANOVA showed that there was a significant difference in mean
arterial thickness between experimental groups, F(4, 136)=18.1, p<0.001. The
results for this are displayed in
Figure 6.6. A post-hoc Tukey test revealed that the thickness of FRESH and
VEH arteries did not differ. There was a decrease in thickness in CCE tissue
compared to FRESH tissue (0.65±0.04mm vs. 0.85±0.06mm respectively,
p<0.001). The effect of bioreactor culture in both VEH and CCE treated tissue
was to reduce thickness by a similar degree (0.81±0.09mm vs. 0.66±0.05mm,
VEH and BIOVEH respectively, p<0.05, 19% reduction; 0.65±0.04mm vs.
0.52±0.12mm, CCE and BIOCCE respectively, p<0.05, 21% reduction).
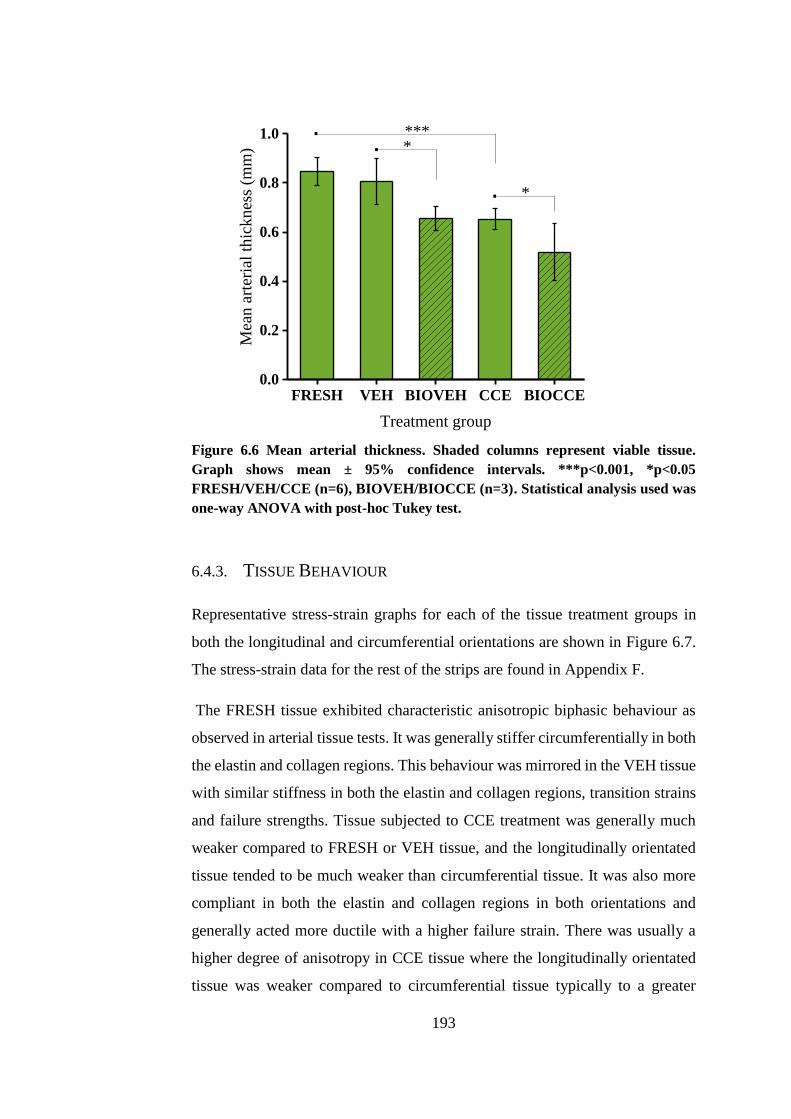
193
FRESH VEH BIOVEH CCE BIOCCE0.0
0.2
0.4
0.6
0.8
1.0 .
Mea
n a
rter
ial
thic
kn
ess
(mm
)
Treatment group
***
. *
. *
Figure 6.6 Mean arterial thickness. Shaded columns represent viable tissue.
Graph shows mean ± 95% confidence intervals. ***p<0.001, *p<0.05
FRESH/VEH/CCE (n=6), BIOVEH/BIOCCE (n=3). Statistical analysis used was
one-way ANOVA with post-hoc Tukey test.
6.4.3. TISSUE BEHAVIOUR
Representative stress-strain graphs for each of the tissue treatment groups in
both the longitudinal and circumferential orientations are shown in Figure 6.7.
The stress-strain data for the rest of the strips are found in Appendix F.
The FRESH tissue exhibited characteristic anisotropic biphasic behaviour as
observed in arterial tissue tests. It was generally stiffer circumferentially in both
the elastin and collagen regions. This behaviour was mirrored in the VEH tissue
with similar stiffness in both the elastin and collagen regions, transition strains
and failure strengths. Tissue subjected to CCE treatment was generally much
weaker compared to FRESH or VEH tissue, and the longitudinally orientated
tissue tended to be much weaker than circumferential tissue. It was also more
compliant in both the elastin and collagen regions in both orientations and
generally acted more ductile with a higher failure strain. There was usually a
higher degree of anisotropy in CCE tissue where the longitudinally orientated
tissue was weaker compared to circumferential tissue typically to a greater
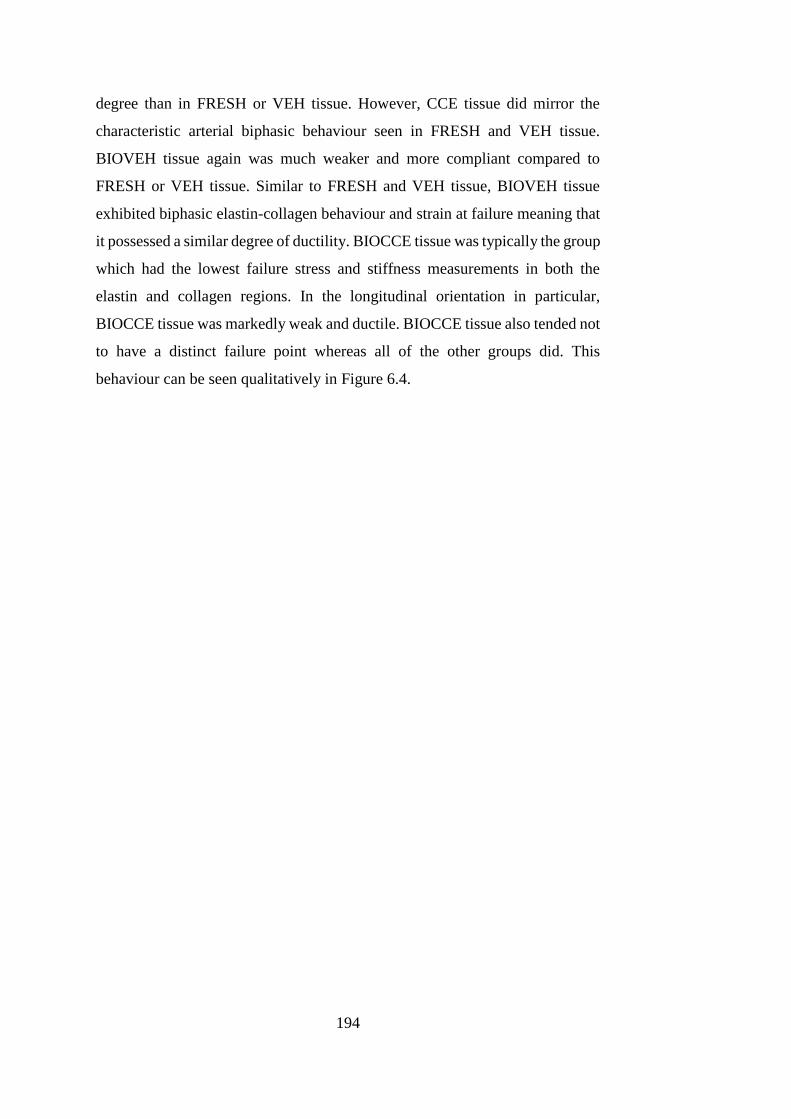
194
degree than in FRESH or VEH tissue. However, CCE tissue did mirror the
characteristic arterial biphasic behaviour seen in FRESH and VEH tissue.
BIOVEH tissue again was much weaker and more compliant compared to
FRESH or VEH tissue. Similar to FRESH and VEH tissue, BIOVEH tissue
exhibited biphasic elastin-collagen behaviour and strain at failure meaning that
it possessed a similar degree of ductility. BIOCCE tissue was typically the group
which had the lowest failure stress and stiffness measurements in both the
elastin and collagen regions. In the longitudinal orientation in particular,
BIOCCE tissue was markedly weak and ductile. BIOCCE tissue also tended not
to have a distinct failure point whereas all of the other groups did. This
behaviour can be seen qualitatively in Figure 6.4.
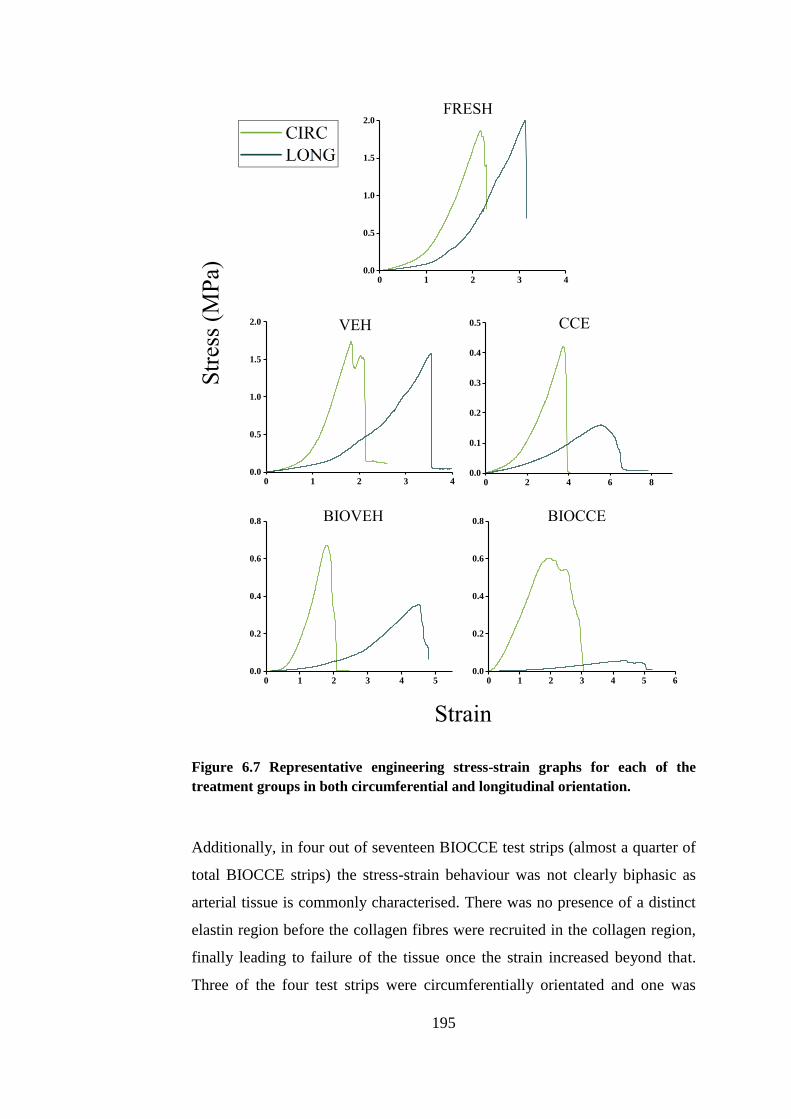
195
Figure 6.7 Representative engineering stress-strain graphs for each of the
treatment groups in both circumferential and longitudinal orientation.
Additionally, in four out of seventeen BIOCCE test strips (almost a quarter of
total BIOCCE strips) the stress-strain behaviour was not clearly biphasic as
arterial tissue is commonly characterised. There was no presence of a distinct
elastin region before the collagen fibres were recruited in the collagen region,
finally leading to failure of the tissue once the strain increased beyond that.
Three of the four test strips were circumferentially orientated and one was
0 1 2 3 40.0
0.5
1.0
1.5
2.0
0 1 2 3 40.0
0.5
1.0
1.5
2.0
0 2 4 6 80.0
0.1
0.2
0.3
0.4
0.5
0 1 2 3 4 50.0
0.2
0.4
0.6
0.8
0 1 2 3 4 5 60.0
0.2
0.4
0.6
0.8
FRESH
VEH CCE
BIOVEH BIOCCE
Str
ess
(MP
a)
Strain
196
longitudinally orientated. Three test strips were from the same artery (two
circumferential and one longitudinal).
The raw data stress-strain curves for each of the four strips are shown in Figure
6.8. The values for elastin region stiffness and transition strain for these strips
were taken to be zero.
Figure 6.8 Raw stress-strain curves for BIOCCE tissue which did not exhibit
distinct biphasic behaviour with absence of elastin region.
6.4.4. EFFECT OF TREATMENT ON ELASTIN REGION STIFFNESS
The stiffness of the elastin region is the resistance of the artery in the low strain
region, as described in Section 1.5.2. The ability of the artery to expand and
contract to drive to create a pressure pulse which drives blood through them
relies on the biomechanical properties of elastin. The mean elastin region
stiffness for the arteries in circumferential and longitudinal orientations is
displayed in
0.0 0.5 1.0 1.5 2.0 2.5 3.0 3.5 4.00.000
0.005
0.010
0.015
0.020
0.025
0.030
Str
ess
(M
Pa)
Strain0.0 0.5 1.0 1.5 2.0 2.5 3.0
0.0
0.1
0.2
0.3
0.4
0.5
0.6
0.7
Str
ess
(M
Pa)
Strain
0.0 0.5 1.0 1.5 2.00.00
0.05
0.10
0.15
0.20
Str
ess
(M
Pa)
Strain
0.0 0.5 1.0 1.5 2.00.00
0.02
0.04
0.06
0.08
0.10
0.12
Str
ess
(M
Pa)
Strain
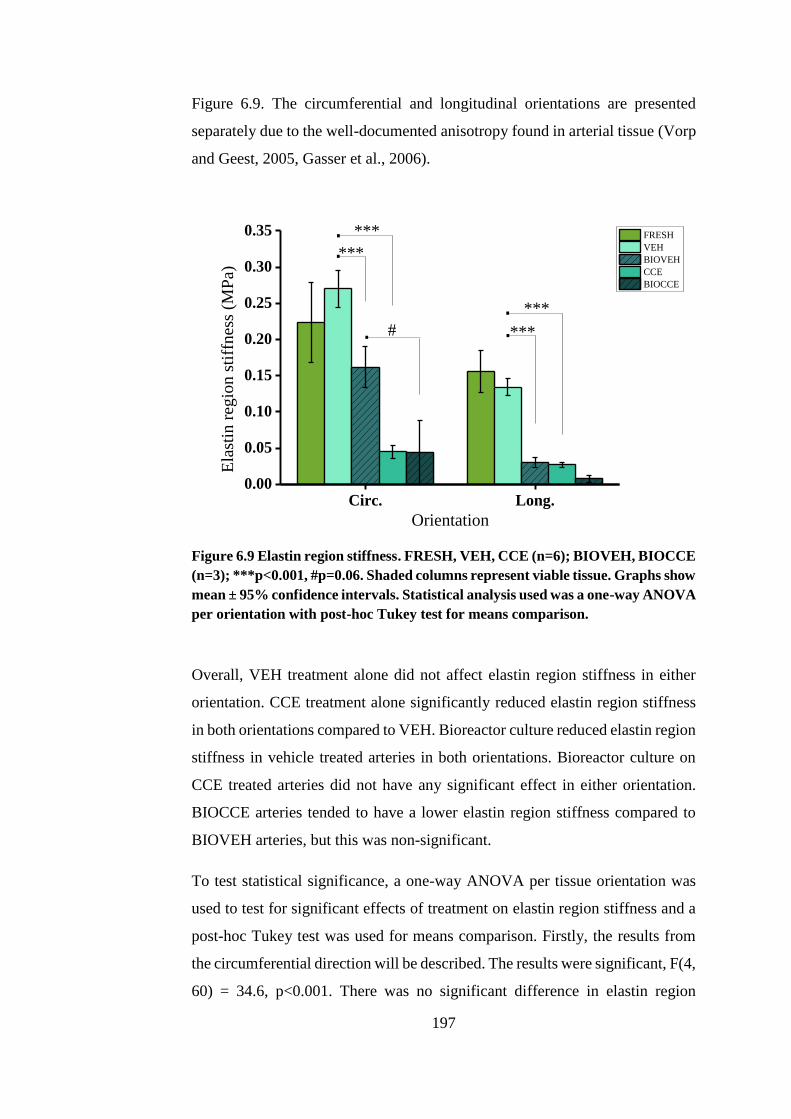
197
Figure 6.9. The circumferential and longitudinal orientations are presented
separately due to the well-documented anisotropy found in arterial tissue (Vorp
and Geest, 2005, Gasser et al., 2006).
Circ. Long.0.00
0.05
0.10
0.15
0.20
0.25
0.30
0.35
#...
.
***
Ela
stin
reg
ion s
tiff
nes
s (M
Pa)
Orientation
FRESH
VEH
BIOVEH
CCE
BIOCCE
***
***
***
.
Figure 6.9 Elastin region stiffness. FRESH, VEH, CCE (n=6); BIOVEH, BIOCCE
(n=3); ***p<0.001, #p=0.06. Shaded columns represent viable tissue. Graphs show
mean ± 95% confidence intervals. Statistical analysis used was a one-way ANOVA
per orientation with post-hoc Tukey test for means comparison.
Overall, VEH treatment alone did not affect elastin region stiffness in either
orientation. CCE treatment alone significantly reduced elastin region stiffness
in both orientations compared to VEH. Bioreactor culture reduced elastin region
stiffness in vehicle treated arteries in both orientations. Bioreactor culture on
CCE treated arteries did not have any significant effect in either orientation.
BIOCCE arteries tended to have a lower elastin region stiffness compared to
BIOVEH arteries, but this was non-significant.
To test statistical significance, a one-way ANOVA per tissue orientation was
used to test for significant effects of treatment on elastin region stiffness and a
post-hoc Tukey test was used for means comparison. Firstly, the results from
the circumferential direction will be described. The results were significant, F(4,
60) = 34.6, p<0.001. There was no significant difference in elastin region
198
stiffness between FRESH and VEH arteries (0.22±0.06 vs. 0.27±0.03 MPa
respectively). Application of CCE treatment without culture induced
significantly decreased elastin region stiffness compared to VEH (0.04±0.01 vs.
0.27±0.03 MPa respectively, p<0.001). The effect of bioreactor culture in VEH
arteries was to decrease the elastin region stiffness (0.27±0.03 vs. 0.16±0.03
MPa, VEH and BIOVEH respectively, p<0.01). In CCE treated arteries there
was no difference between CCE and BIOCCE treated arteries (0.04±0.01 vs.
0.06±0.05 respectively). There was a non-significant trend towards a decreased
elastin region stiffness in BIOCCE arteries compared to BIOVEH arteries.
BIOCCE and BIOVEH arteries (0.06±0.05 vs. 0.16±0.03 MPa respectively,
p=0.06).
In the longitudinal orientation, the results were also significantly different, F(4,
61) = 79.4, p<0.001. The Tukey test showed that elastin region stiffness in
FRESH and VEH arteries were similar (0.16±0.03 vs. 0.13±0.01 MPa
respectively). The effect of CCE treatment alone reduced the stiffness in the
elastin region compared to VEH (0.03±0.003 vs. 0.13±0.01, p<0.001). In both
VEH treated arteries, the effect of bioreactor culture was to reduce elastin region
stiffness (0.03±0.01 vs. 0.13±0.01, BIOVEH and VEH respectively, p<0.001).
There was no effect of bioreactor culture on CCE treated arteries (0.01±0.004
vs. 0.03±0.003 MPa, BIOCCE and CCE respectively).
6.4.5. EFFECT OF TREATMENT ON COLLAGEN REGION STIFFNESS
Collagen is the less elastic component of the arterial extracellular matrix and it
provides strength to the tissue at higher strains. It is formed into fibres which
are gradually recruited into a load-bearing role as strain is increased (Thubrikar
et al., 2001). The collagenase contained within the CCE gel treatment would
have degraded a proportion of the collagen in the artery and so the stiffness in
the collagen region amongst the treatment groups was analysed. SMCs are also
able to secret collagen as part of a remodelling process, so the biomechanics in
the collagen region gave an insight into the function of the SMCs. The mean
199
collagen region stiffness for each of the experimental groups is shown in Figure
6.10.
The results for measurements of collagen region stiffness appeared to follow the
same trend as for elastin region stiffness. VEH treatment did not affect collagen
region stiffness in either orientation. CCE treatment significantly reduced
collagen region stiffness in both orientations compared to VEH control.
Bioreactor culture significantly reduced collagen region stiffness in both
orientations in VEH arteries, but had no effect in CCE arteries.
A one-way ANOVA was performed per tissue strip orientation. In the
circumferential direction, there was a significant effect of arterial treatment on
collagen region stiffness, F(4, 60) = 27.8, p<0.001. The Tukey test showed that
there was no difference in collagen region stiffness between FRESH and VEH
arteries (1.46±0.38 vs. 1.54±0.11 MPa respectively). The application of CCE
treatment significantly reduced collagen region stiffness compared to VEH
control (0.36±0.07 vs. 1.54±0.11 MPa respectively, p<0.001). The effect of
bioreactor culture on VEH treated arteries was to significantly decrease collagen
region stiffness (0.89±0.10 vs. 1.54±0.11 MPa, BIOVEH and VEH
respectively, p<0.001). In contrast to this, in CCE treated arteries there was no
effect of bioreactor culture (0.24±0.09 vs. 0.36±0.07 MPa, BIOCCE and CCE
respectively).
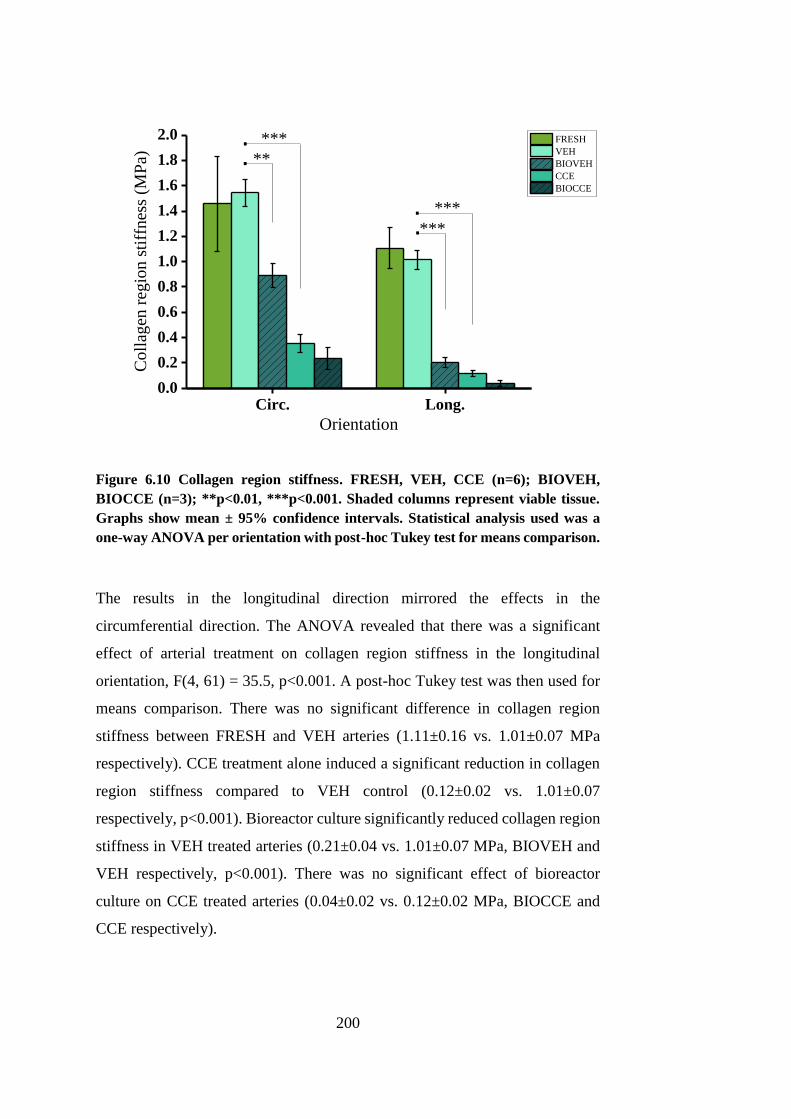
200
Circ. Long.0.0
0.2
0.4
0.6
0.8
1.0
1.2
1.4
1.6
1.8
2.0
.
.
.
***
***
Coll
agen
reg
ion s
tiff
nes
s (M
Pa)
Orientation
FRESH
VEH
BIOVEH
CCE
BIOCCE
***
**.
Figure 6.10 Collagen region stiffness. FRESH, VEH, CCE (n=6); BIOVEH,
BIOCCE (n=3); **p<0.01, ***p<0.001. Shaded columns represent viable tissue.
Graphs show mean ± 95% confidence intervals. Statistical analysis used was a
one-way ANOVA per orientation with post-hoc Tukey test for means comparison.
The results in the longitudinal direction mirrored the effects in the
circumferential direction. The ANOVA revealed that there was a significant
effect of arterial treatment on collagen region stiffness in the longitudinal
orientation, F(4, 61) = 35.5, p<0.001. A post-hoc Tukey test was then used for
means comparison. There was no significant difference in collagen region
stiffness between FRESH and VEH arteries (1.11±0.16 vs. 1.01±0.07 MPa
respectively). CCE treatment alone induced a significant reduction in collagen
region stiffness compared to VEH control (0.12±0.02 vs. 1.01±0.07
respectively, p<0.001). Bioreactor culture significantly reduced collagen region
stiffness in VEH treated arteries (0.21±0.04 vs. 1.01±0.07 MPa, BIOVEH and
VEH respectively, p<0.001). There was no significant effect of bioreactor
culture on CCE treated arteries (0.04±0.02 vs. 0.12±0.02 MPa, BIOCCE and
CCE respectively).
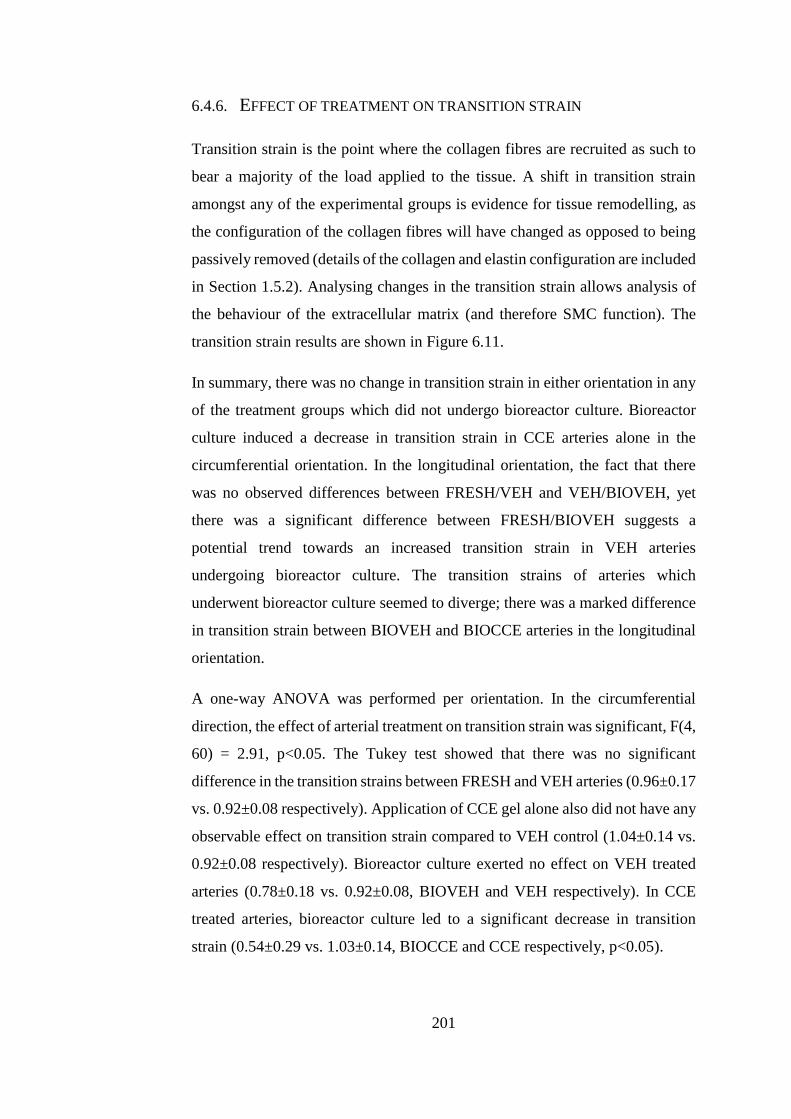
201
6.4.6. EFFECT OF TREATMENT ON TRANSITION STRAIN
Transition strain is the point where the collagen fibres are recruited as such to
bear a majority of the load applied to the tissue. A shift in transition strain
amongst any of the experimental groups is evidence for tissue remodelling, as
the configuration of the collagen fibres will have changed as opposed to being
passively removed (details of the collagen and elastin configuration are included
in Section 1.5.2). Analysing changes in the transition strain allows analysis of
the behaviour of the extracellular matrix (and therefore SMC function). The
transition strain results are shown in Figure 6.11.
In summary, there was no change in transition strain in either orientation in any
of the treatment groups which did not undergo bioreactor culture. Bioreactor
culture induced a decrease in transition strain in CCE arteries alone in the
circumferential orientation. In the longitudinal orientation, the fact that there
was no observed differences between FRESH/VEH and VEH/BIOVEH, yet
there was a significant difference between FRESH/BIOVEH suggests a
potential trend towards an increased transition strain in VEH arteries
undergoing bioreactor culture. The transition strains of arteries which
underwent bioreactor culture seemed to diverge; there was a marked difference
in transition strain between BIOVEH and BIOCCE arteries in the longitudinal
orientation.
A one-way ANOVA was performed per orientation. In the circumferential
direction, the effect of arterial treatment on transition strain was significant, F(4,
60) = 2.91, p<0.05. The Tukey test showed that there was no significant
difference in the transition strains between FRESH and VEH arteries (0.96±0.17
vs. 0.92±0.08 respectively). Application of CCE gel alone also did not have any
observable effect on transition strain compared to VEH control (1.04±0.14 vs.
0.92±0.08 respectively). Bioreactor culture exerted no effect on VEH treated
arteries (0.78±0.18 vs. 0.92±0.08, BIOVEH and VEH respectively). In CCE
treated arteries, bioreactor culture led to a significant decrease in transition
strain (0.54±0.29 vs. 1.03±0.14, BIOCCE and CCE respectively, p<0.05).
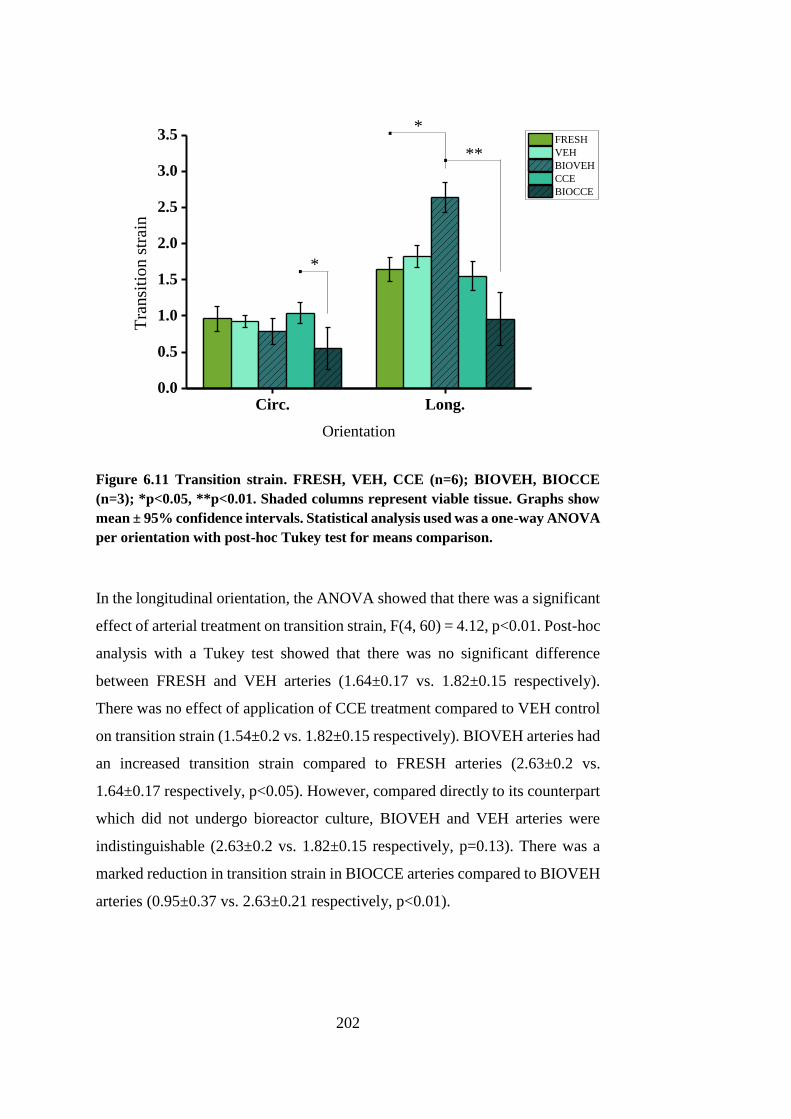
202
Circ. Long.0.0
0.5
1.0
1.5
2.0
2.5
3.0
3.5*.
*.
Tra
nsi
tio
n s
trai
n
Orientation
FRESH
VEH
BIOVEH
CCE
BIOCCE
**.
Figure 6.11 Transition strain. FRESH, VEH, CCE (n=6); BIOVEH, BIOCCE
(n=3); *p<0.05, **p<0.01. Shaded columns represent viable tissue. Graphs show
mean ± 95% confidence intervals. Statistical analysis used was a one-way ANOVA
per orientation with post-hoc Tukey test for means comparison.
In the longitudinal orientation, the ANOVA showed that there was a significant
effect of arterial treatment on transition strain, F(4, 60) = 4.12, p<0.01. Post-hoc
analysis with a Tukey test showed that there was no significant difference
between FRESH and VEH arteries (1.64±0.17 vs. 1.82±0.15 respectively).
There was no effect of application of CCE treatment compared to VEH control
on transition strain (1.54±0.2 vs. 1.82±0.15 respectively). BIOVEH arteries had
an increased transition strain compared to FRESH arteries (2.63±0.2 vs.
1.64±0.17 respectively, p<0.05). However, compared directly to its counterpart
which did not undergo bioreactor culture, BIOVEH and VEH arteries were
indistinguishable (2.63±0.2 vs. 1.82±0.15 respectively, p=0.13). There was a
marked reduction in transition strain in BIOCCE arteries compared to BIOVEH
arteries (0.95±0.37 vs. 2.63±0.21 respectively, p<0.01).
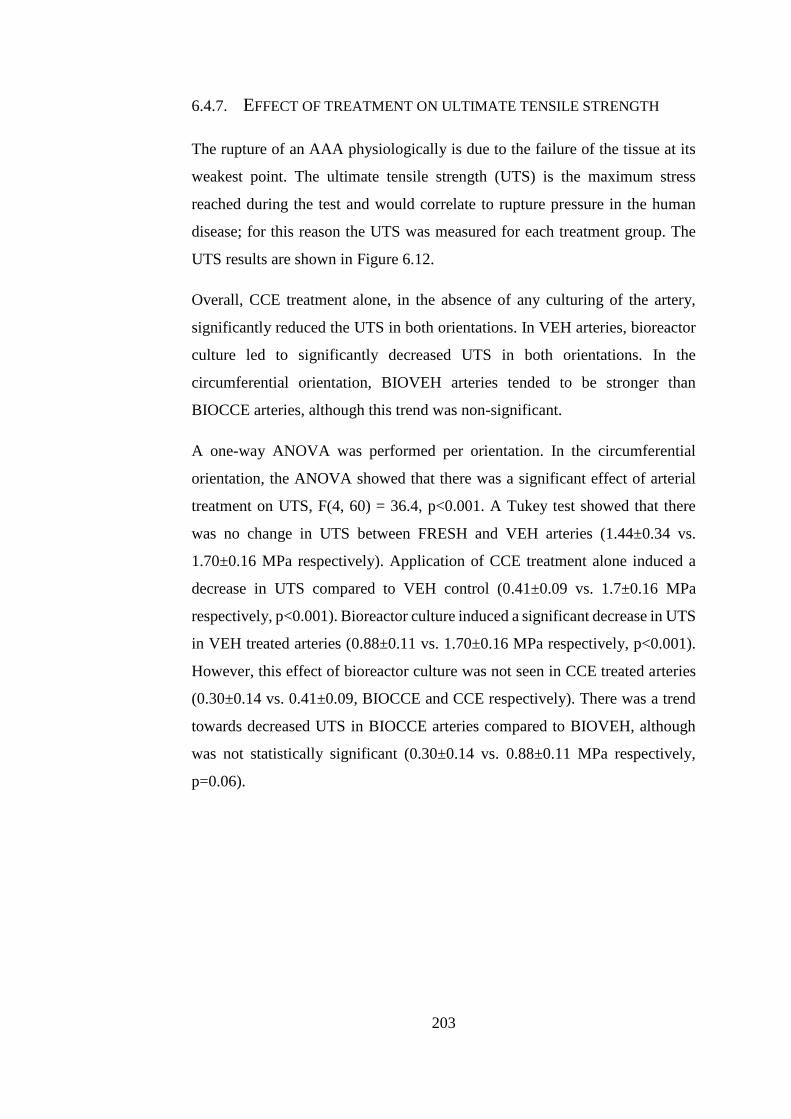
203
6.4.7. EFFECT OF TREATMENT ON ULTIMATE TENSILE STRENGTH
The rupture of an AAA physiologically is due to the failure of the tissue at its
weakest point. The ultimate tensile strength (UTS) is the maximum stress
reached during the test and would correlate to rupture pressure in the human
disease; for this reason the UTS was measured for each treatment group. The
UTS results are shown in Figure 6.12.
Overall, CCE treatment alone, in the absence of any culturing of the artery,
significantly reduced the UTS in both orientations. In VEH arteries, bioreactor
culture led to significantly decreased UTS in both orientations. In the
circumferential orientation, BIOVEH arteries tended to be stronger than
BIOCCE arteries, although this trend was non-significant.
A one-way ANOVA was performed per orientation. In the circumferential
orientation, the ANOVA showed that there was a significant effect of arterial
treatment on UTS, F(4, 60) = 36.4, p<0.001. A Tukey test showed that there
was no change in UTS between FRESH and VEH arteries (1.44±0.34 vs.
1.70±0.16 MPa respectively). Application of CCE treatment alone induced a
decrease in UTS compared to VEH control (0.41±0.09 vs. 1.7±0.16 MPa
respectively, p<0.001). Bioreactor culture induced a significant decrease in UTS
in VEH treated arteries (0.88±0.11 vs. 1.70±0.16 MPa respectively, p<0.001).
However, this effect of bioreactor culture was not seen in CCE treated arteries
(0.30±0.14 vs. 0.41±0.09, BIOCCE and CCE respectively). There was a trend
towards decreased UTS in BIOCCE arteries compared to BIOVEH, although
was not statistically significant (0.30±0.14 vs. 0.88±0.11 MPa respectively,
p=0.06).
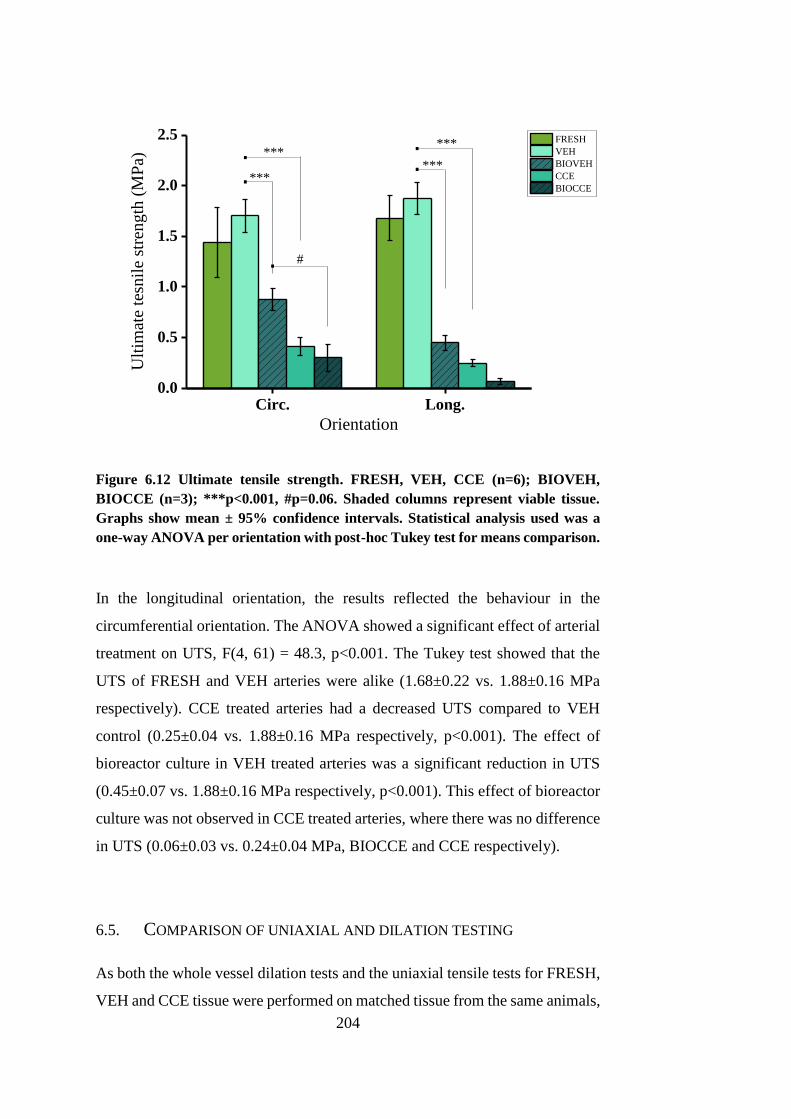
204
Circ. Long.0.0
0.5
1.0
1.5
2.0
2.5
#.
.
..***
***U
ltim
ate
tesn
ile
stre
ng
th (
MP
a)
Orientation
FRESH
VEH
BIOVEH
CCE
BIOCCE***
***
.
Figure 6.12 Ultimate tensile strength. FRESH, VEH, CCE (n=6); BIOVEH,
BIOCCE (n=3); ***p<0.001, #p=0.06. Shaded columns represent viable tissue.
Graphs show mean ± 95% confidence intervals. Statistical analysis used was a
one-way ANOVA per orientation with post-hoc Tukey test for means comparison.
In the longitudinal orientation, the results reflected the behaviour in the
circumferential orientation. The ANOVA showed a significant effect of arterial
treatment on UTS, F(4, 61) = 48.3, p<0.001. The Tukey test showed that the
UTS of FRESH and VEH arteries were alike (1.68±0.22 vs. 1.88±0.16 MPa
respectively). CCE treated arteries had a decreased UTS compared to VEH
control (0.25±0.04 vs. 1.88±0.16 MPa respectively, p<0.001). The effect of
bioreactor culture in VEH treated arteries was a significant reduction in UTS
(0.45±0.07 vs. 1.88±0.16 MPa respectively, p<0.001). This effect of bioreactor
culture was not observed in CCE treated arteries, where there was no difference
in UTS (0.06±0.03 vs. 0.24±0.04 MPa, BIOCCE and CCE respectively).
6.5. COMPARISON OF UNIAXIAL AND DILATION TESTING
As both the whole vessel dilation tests and the uniaxial tensile tests for FRESH,
VEH and CCE tissue were performed on matched tissue from the same animals,
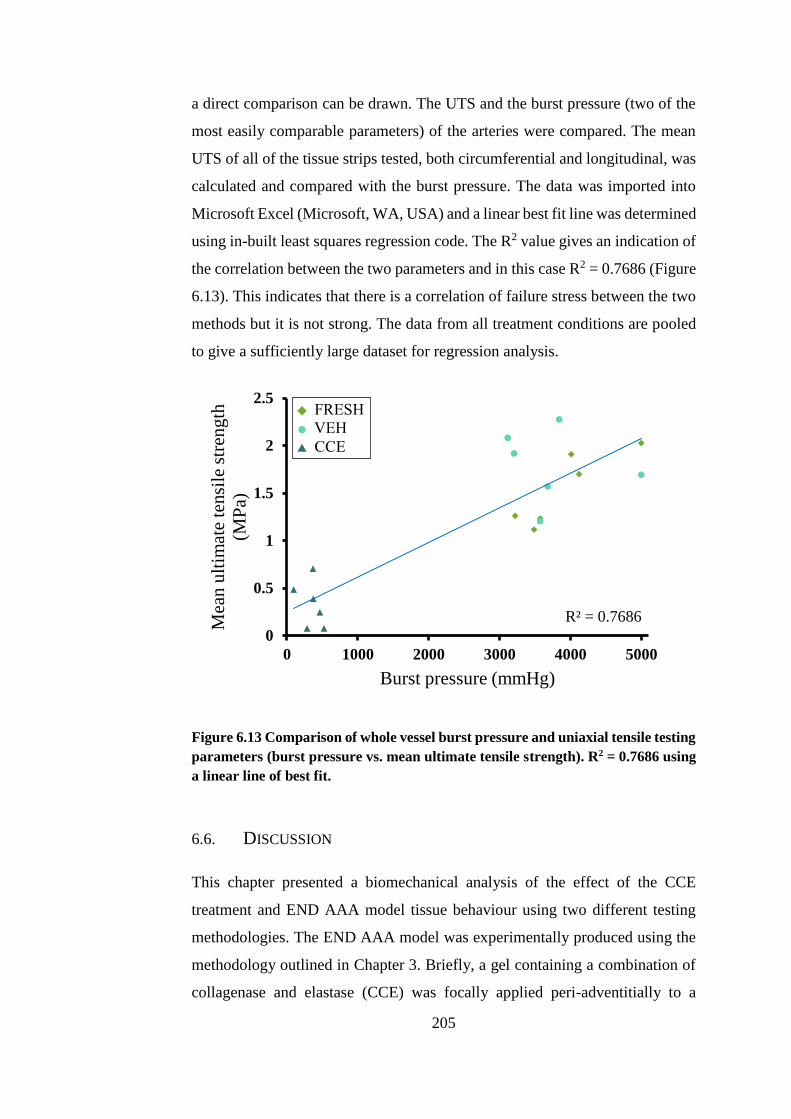
205
a direct comparison can be drawn. The UTS and the burst pressure (two of the
most easily comparable parameters) of the arteries were compared. The mean
UTS of all of the tissue strips tested, both circumferential and longitudinal, was
calculated and compared with the burst pressure. The data was imported into
Microsoft Excel (Microsoft, WA, USA) and a linear best fit line was determined
using in-built least squares regression code. The R2 value gives an indication of
the correlation between the two parameters and in this case R2 = 0.7686 (Figure
6.13). This indicates that there is a correlation of failure stress between the two
methods but it is not strong. The data from all treatment conditions are pooled
to give a sufficiently large dataset for regression analysis.
Figure 6.13 Comparison of whole vessel burst pressure and uniaxial tensile testing
parameters (burst pressure vs. mean ultimate tensile strength). R2 = 0.7686 using
a linear line of best fit.
6.6. DISCUSSION
This chapter presented a biomechanical analysis of the effect of the CCE
treatment and END AAA model tissue behaviour using two different testing
methodologies. The END AAA model was experimentally produced using the
methodology outlined in Chapter 3. Briefly, a gel containing a combination of
collagenase and elastase (CCE) was focally applied peri-adventitially to a
R² = 0.7686
0
0.5
1
1.5
2
2.5
0 1000 2000 3000 4000 5000
Mea
n u
ltim
ate
ten
sile
str
eng
th
(MP
a)
Burst pressure (mmHg)
FRESH
VEH
CCE
206
porcine artery and left for 3 hours. The treatment was then removed and the
artery was installed into a bioreactor able to impart luminal pressure and flow
through the artery for 12 days. The characterisation of the CCE treatment was
only carried out using non-sterile arteries due to high cost and ease of
implementation: the tissue did not undergo culture for any length of time and so
sterility was not necessary.
Whole artery pressure-dilation testing showed that the burst pressure was
drastically decreased in CCE tissue compared to FRESH or VEH tissue. It also
revealed that the tissue compliance between untreated tissue and that which
underwent VEH or CCE treatment was indistinguishable. Compliance is the
relationship between a change in pressure and a change in diameter. A
proportion of the same tissue which underwent CCE characterisation in whole
artery pressure-dilation testing was used in matched uniaxial tensile testing
experiments. A disparity between the marked change in CCE tissue
biomechanics compared to FRESH or VEH controls observed in the uniaxial
tests compared to no alterations in the tissue in the pressure-dilation tests
emerged. The mean change in diameter was then examined rather than the
normalised change in diameter and it was found that the CCE treated tissue has
an increased mean diameter compared to both FRESH and VEH tissue.
It was then hypothesised that the CCE treatment induces an increase in mean
diameter in the range of pressures measured. As a bias of experimental
groupings of arteries could not be ruled out, a further set of repeated
experiments was carried out where the tissue was non-destructively tested prior
to and after CCE treatment. In this second set of experiments it was confirmed
that CCE treatment significantly increased mean arterial diameter despite
having no effect on compliance.
The reason for this may lie within the configuration of elastin and collagen in
the arterial tissue. Elastin is the component of the ECM which is responsible for
arterial compliance and is degraded via elastase during application of the CCE
treatment. In Chapter 4, histological analysis revealed that CCE treated tissue
exhibited clear elastin loss and so the potential elastic energy residing in the
tissue would have decreased. Other studies have shown that elastin degradation
207
in arteries leads to an increase in arterial diameter. In selective elastolytic and
collagenolytic in vitro pressure-dilation arterial studies, Dobrin et al. showed
that elastase degraded arteries had increased diameter and were stiffer at lower
pressures whilst collagenase treated arteries were more compliant and weaker
overall (Dobrin et al., 1984). Subsequent studies concurred that elastin
degradation leads to an increased arterial diameter with increased stiffness at
lower pressures and equated this with pre-stresses within elastin present even at
zero-load (Fonck et al., 2007).
The significant increase in mean arterial diameter even at zero-load as a direct
effect of the CCE treatment was shown in repeated experiments on the same
arterial tissue. The CCE treatment did induce a significant increase in mean
diameter, but did not induce a change in stiffness at any level of pressure. It is
thought that this is attributed to the inclusion of collagenase in addition to
elastase within the CCE treatment. Collagenase degrades collagen which is the
component of the arterial wall associated with stiffness at higher loads and wall
strength. Therefore the lack of increased stiffness at lower pressures associated
with elastinolytic studies when characterising the effects of CCE treatment may
be attributed to the decreased stiffness associated with collagenase activity.
Decreased arterial strength and stiffness has also been associated with
degradation of collagenase (Dadgar et al., 1997). As the burst pressure of the
CCE treated tissue was severely decreased compared to controls, collagen
degradation had a significant effect on the mechanical properties of the artery.
However, the matched uniaxial tensile testing experiments revealed a
significant decrease in both the elastin and collagen regions which was not
mirrored in the pressure-dilation experiments. It is thought that this was an
experimental artefact in the methodology for the CCE tissue: when the PBS was
allowed to flow into the artery lumen, prior to zeroing the pressure meter, it
caused a deformation in the weakened tissue. This deformation was not then
observed during the experiment as it occurred outside the pressure range.
Whole artery pressure-dilation testing and uniaxial tensile testing were both
used for CCE treatment characterisation whereas the END AAA model
biomechanics were characterised using uniaxial tensile testing only. Although
208
whole artery pressure-dilation testing enables multidirectional mechanics of the
whole artery, which is a limitation of uniaxial tensile testing, there was a small
amount of tissue once the artery had been removed from the bioreactor. If the
artery was punctured in some way during the experimental set-up then it would
not be feasible to conduct pressure-dilation testing. Up to three strips per artery
were tested using uniaxial tensile testing, generating a larger dataset than
pressure-dilation testing. In addition, the experimental artefact due to the
arbitrary position of zero-state pressure was thought to be a limitation in the
whole artery pressure-dilation testing method.
CCE treatment induced a decrease in arterial thickness. As shown by the
pressure-dilation experiments, the mean diameter of the arteries increased and
so it is expected that the thickness would decreased via a Poisson’s ratio
mechanism. Regardless of tissue treatment, bioreactor culture induced a
decrease in arterial thickness by a similar amount (19% and 21% decrease for
VEH vs. BIOVEH and CCE vs. BIOCCE respectively). This may be attributed
to the bioreactor environment inducing a decrease in thickness but may also be
as a result of experimental practicalities. This decrease in thickness may be
partly due to changes in the bioreactor environment compared to the
physiological environment as the tissue adapts to the bioreactor environment.
The pressure pulse which arterial tissue is subject to in the body was not present
in the bioreactor flow profile, as the arteries were cultured under steady flow.
Incorporation of a physiological pulsatile component which exerts cyclic stretch
and a dynamic pressure gradient on the arterial wall may mitigate this unwanted
remodelling. The installation of the tissue into the bioreactor and potential
stretching of the tissue over time (as the shaft of the bioreactor translates
outwards to accommodate the increase in tissue length once pressurised) may
also cause longer term visco-plastic relaxation changes in tissue dimension. The
viscoelastic behaviour of arterial and AAA tissue was not investigated in this
study but has been relatively widely studied (Holzapfel et al., 2002, Čanić et al.,
2006, Zhang et al., 2008). The manipulation of the tissue once removed from
the bioreactor should also be considered as a factor in the decreased thickness
of the tissue. As the elastin has been virtually totally degraded during the course
of the experiments (as a result of CCE treatment, bioreactor culture or a
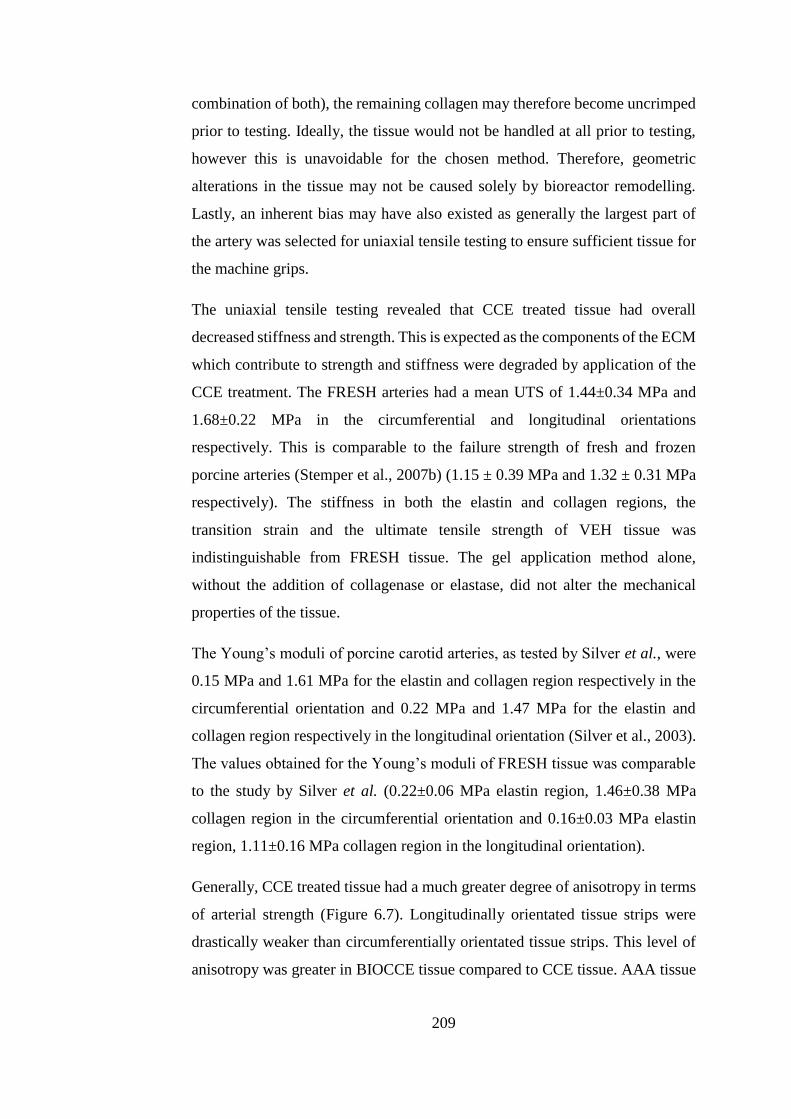
209
combination of both), the remaining collagen may therefore become uncrimped
prior to testing. Ideally, the tissue would not be handled at all prior to testing,
however this is unavoidable for the chosen method. Therefore, geometric
alterations in the tissue may not be caused solely by bioreactor remodelling.
Lastly, an inherent bias may have also existed as generally the largest part of
the artery was selected for uniaxial tensile testing to ensure sufficient tissue for
the machine grips.
The uniaxial tensile testing revealed that CCE treated tissue had overall
decreased stiffness and strength. This is expected as the components of the ECM
which contribute to strength and stiffness were degraded by application of the
CCE treatment. The FRESH arteries had a mean UTS of 1.44±0.34 MPa and
1.68±0.22 MPa in the circumferential and longitudinal orientations
respectively. This is comparable to the failure strength of fresh and frozen
porcine arteries (Stemper et al., 2007b) (1.15 ± 0.39 MPa and 1.32 ± 0.31 MPa
respectively). The stiffness in both the elastin and collagen regions, the
transition strain and the ultimate tensile strength of VEH tissue was
indistinguishable from FRESH tissue. The gel application method alone,
without the addition of collagenase or elastase, did not alter the mechanical
properties of the tissue.
The Young’s moduli of porcine carotid arteries, as tested by Silver et al., were
0.15 MPa and 1.61 MPa for the elastin and collagen region respectively in the
circumferential orientation and 0.22 MPa and 1.47 MPa for the elastin and
collagen region respectively in the longitudinal orientation (Silver et al., 2003).
The values obtained for the Young’s moduli of FRESH tissue was comparable
to the study by Silver et al. (0.22±0.06 MPa elastin region, 1.46±0.38 MPa
collagen region in the circumferential orientation and 0.16±0.03 MPa elastin
region, 1.11±0.16 MPa collagen region in the longitudinal orientation).
Generally, CCE treated tissue had a much greater degree of anisotropy in terms
of arterial strength (Figure 6.7). Longitudinally orientated tissue strips were
drastically weaker than circumferentially orientated tissue strips. This level of
anisotropy was greater in BIOCCE tissue compared to CCE tissue. AAA tissue
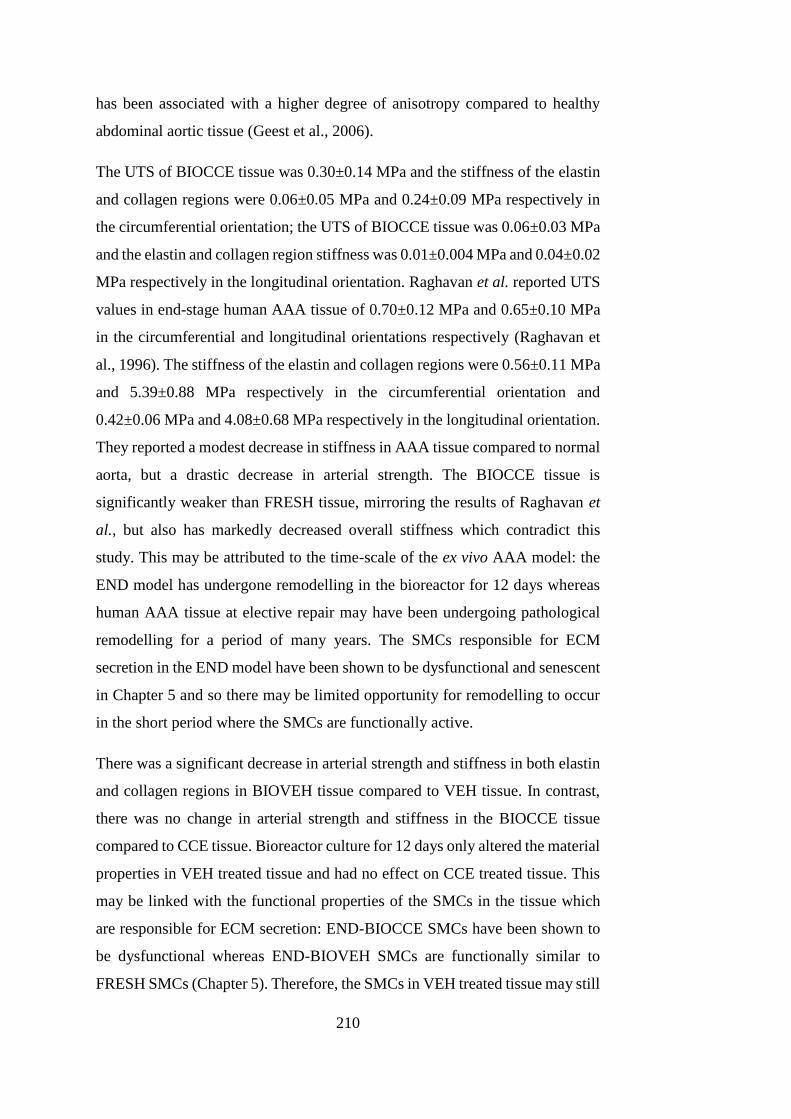
210
has been associated with a higher degree of anisotropy compared to healthy
abdominal aortic tissue (Geest et al., 2006).
The UTS of BIOCCE tissue was 0.30±0.14 MPa and the stiffness of the elastin
and collagen regions were 0.06±0.05 MPa and 0.24±0.09 MPa respectively in
the circumferential orientation; the UTS of BIOCCE tissue was 0.06±0.03 MPa
and the elastin and collagen region stiffness was 0.01±0.004 MPa and 0.04±0.02
MPa respectively in the longitudinal orientation. Raghavan et al. reported UTS
values in end-stage human AAA tissue of 0.70±0.12 MPa and 0.65±0.10 MPa
in the circumferential and longitudinal orientations respectively (Raghavan et
al., 1996). The stiffness of the elastin and collagen regions were 0.56±0.11 MPa
and 5.39±0.88 MPa respectively in the circumferential orientation and
0.42±0.06 MPa and 4.08±0.68 MPa respectively in the longitudinal orientation.
They reported a modest decrease in stiffness in AAA tissue compared to normal
aorta, but a drastic decrease in arterial strength. The BIOCCE tissue is
significantly weaker than FRESH tissue, mirroring the results of Raghavan et
al., but also has markedly decreased overall stiffness which contradict this
study. This may be attributed to the time-scale of the ex vivo AAA model: the
END model has undergone remodelling in the bioreactor for 12 days whereas
human AAA tissue at elective repair may have been undergoing pathological
remodelling for a period of many years. The SMCs responsible for ECM
secretion in the END model have been shown to be dysfunctional and senescent
in Chapter 5 and so there may be limited opportunity for remodelling to occur
in the short period where the SMCs are functionally active.
There was a significant decrease in arterial strength and stiffness in both elastin
and collagen regions in BIOVEH tissue compared to VEH tissue. In contrast,
there was no change in arterial strength and stiffness in the BIOCCE tissue
compared to CCE tissue. Bioreactor culture for 12 days only altered the material
properties in VEH treated tissue and had no effect on CCE treated tissue. This
may be linked with the functional properties of the SMCs in the tissue which
are responsible for ECM secretion: END-BIOCCE SMCs have been shown to
be dysfunctional whereas END-BIOVEH SMCs are functionally similar to
FRESH SMCs (Chapter 5). Therefore, the SMCs in VEH treated tissue may still
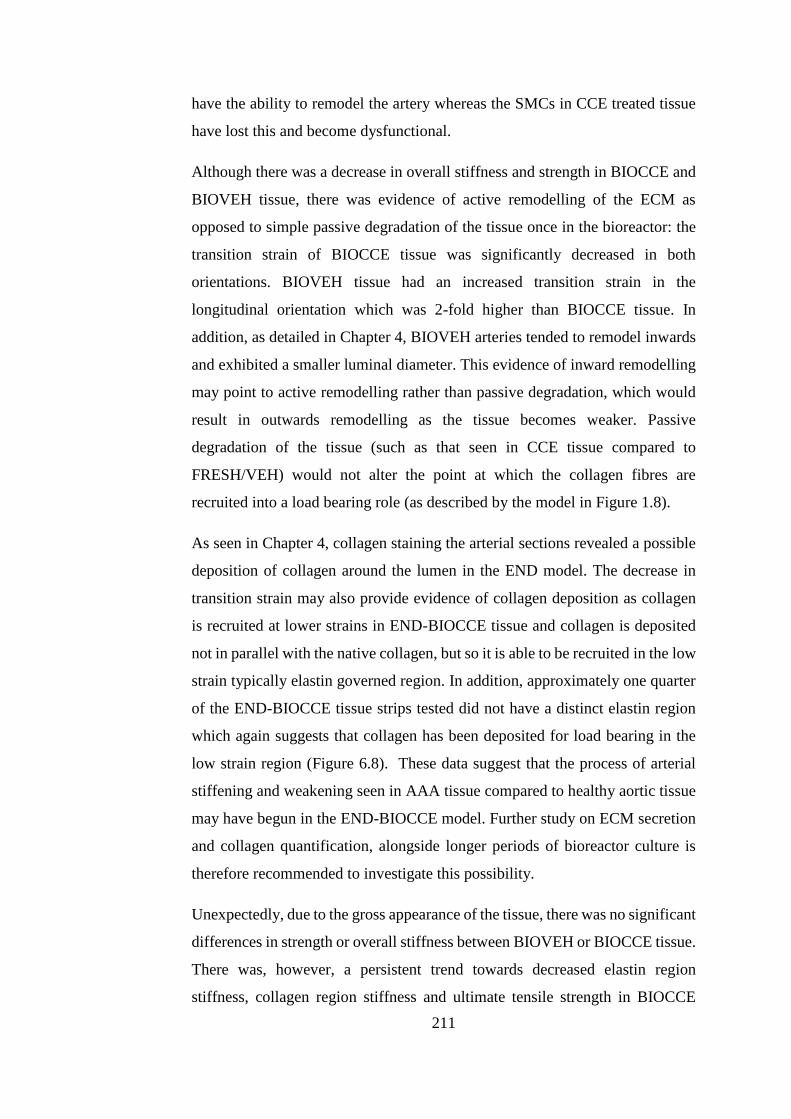
211
have the ability to remodel the artery whereas the SMCs in CCE treated tissue
have lost this and become dysfunctional.
Although there was a decrease in overall stiffness and strength in BIOCCE and
BIOVEH tissue, there was evidence of active remodelling of the ECM as
opposed to simple passive degradation of the tissue once in the bioreactor: the
transition strain of BIOCCE tissue was significantly decreased in both
orientations. BIOVEH tissue had an increased transition strain in the
longitudinal orientation which was 2-fold higher than BIOCCE tissue. In
addition, as detailed in Chapter 4, BIOVEH arteries tended to remodel inwards
and exhibited a smaller luminal diameter. This evidence of inward remodelling
may point to active remodelling rather than passive degradation, which would
result in outwards remodelling as the tissue becomes weaker. Passive
degradation of the tissue (such as that seen in CCE tissue compared to
FRESH/VEH) would not alter the point at which the collagen fibres are
recruited into a load bearing role (as described by the model in Figure 1.8).
As seen in Chapter 4, collagen staining the arterial sections revealed a possible
deposition of collagen around the lumen in the END model. The decrease in
transition strain may also provide evidence of collagen deposition as collagen
is recruited at lower strains in END-BIOCCE tissue and collagen is deposited
not in parallel with the native collagen, but so it is able to be recruited in the low
strain typically elastin governed region. In addition, approximately one quarter
of the END-BIOCCE tissue strips tested did not have a distinct elastin region
which again suggests that collagen has been deposited for load bearing in the
low strain region (Figure 6.8). These data suggest that the process of arterial
stiffening and weakening seen in AAA tissue compared to healthy aortic tissue
may have begun in the END-BIOCCE model. Further study on ECM secretion
and collagen quantification, alongside longer periods of bioreactor culture is
therefore recommended to investigate this possibility.
Unexpectedly, due to the gross appearance of the tissue, there was no significant
differences in strength or overall stiffness between BIOVEH or BIOCCE tissue.
There was, however, a persistent trend towards decreased elastin region
stiffness, collagen region stiffness and ultimate tensile strength in BIOCCE
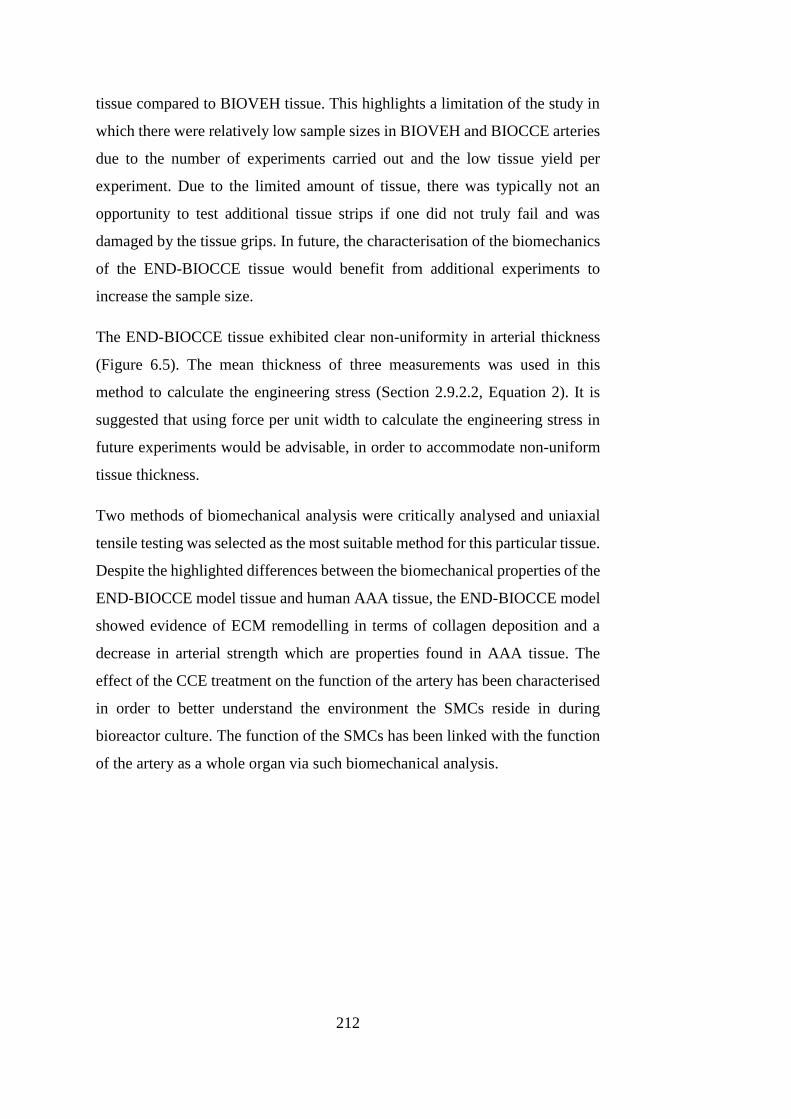
212
tissue compared to BIOVEH tissue. This highlights a limitation of the study in
which there were relatively low sample sizes in BIOVEH and BIOCCE arteries
due to the number of experiments carried out and the low tissue yield per
experiment. Due to the limited amount of tissue, there was typically not an
opportunity to test additional tissue strips if one did not truly fail and was
damaged by the tissue grips. In future, the characterisation of the biomechanics
of the END-BIOCCE tissue would benefit from additional experiments to
increase the sample size.
The END-BIOCCE tissue exhibited clear non-uniformity in arterial thickness
(Figure 6.5). The mean thickness of three measurements was used in this
method to calculate the engineering stress (Section 2.9.2.2, Equation 2). It is
suggested that using force per unit width to calculate the engineering stress in
future experiments would be advisable, in order to accommodate non-uniform
tissue thickness.
Two methods of biomechanical analysis were critically analysed and uniaxial
tensile testing was selected as the most suitable method for this particular tissue.
Despite the highlighted differences between the biomechanical properties of the
END-BIOCCE model tissue and human AAA tissue, the END-BIOCCE model
showed evidence of ECM remodelling in terms of collagen deposition and a
decrease in arterial strength which are properties found in AAA tissue. The
effect of the CCE treatment on the function of the artery has been characterised
in order to better understand the environment the SMCs reside in during
bioreactor culture. The function of the SMCs has been linked with the function
of the artery as a whole organ via such biomechanical analysis.

213
CHAPTER 7
DISCUSSION, CONCLUSIONS AND FUTURE WORK
214
CHAPTER 7 DISCUSSION, CONCLUSIONS AND
FUTURE WORK
Abdominal aortic aneurysm (AAA) is a progressive dilatation of the abdominal
aorta which without intervention results in rupture (Golledge et al., 2006,
Nordon et al., 2011). With an estimated prevalence of 5% in men over 65 and
thought to account for 1.5% of the total mortality in males over 55, it is not an
uncommon disease (Choke et al., 2005, Michel et al., 2011, Nordon et al., 2011).
Currently, the only treatment available is surgical repair once AAA diameter
has exceeded 5.5cm: this is considered to be the point where the risk of rupture
outweighs the surgical risk (Kent, 2014). Endovascular aneurysm repair
(EVAR) is a minimally invasive procedure, but is not appropriate for every
patient (Golledge et al., 2006). Open surgical repair (OSR) is a major surgical
procedure with a mean 30-day mortality rate of over 5% (Nordon et al., 2011).
AAA progression is typically asymptomatic (Sakalihasan et al., 2005). The
silent nature of AAA has often led to incidental diagnosis when addressing other
medical complaints. As such, The National Abdominal Aortic Aneurysm
Screening Programme (NAAASP) was implemented in the UK in 2010,
offering AAA screening to all men over 65 years of age(Benson et al., 2016). A
screening programme offers the unique opportunity to diagnose AAA at an
earlier stage in its development and gain insight into the progression of the
disease over time. However, current surgical treatments are still only offered
once the AAA is determined to have a considerable rupture risk. By
understanding the early stages of AAA progression, new targets for therapeutics
may be revealed.
A hurdle to the study of early AAA disease is the paucity of early-stage human
AAA tissue which is available. Animal models are therefore widely used in
AAA research in order to understand the underlying mechanisms and a wide
range of techniques are used (Trollope et al., 2011).
215
Smooth muscle cells (SMCs) are the principal cellular component of the arterial
wall but are depleted and dysfunctional in AAAs (Keen et al., 1994, Lopez-
Candales et al., 1997, Liao et al., 2000, Riches et al., 2013). They exhibit a
distinct phenotype and this phenotypic switch occurs early on in AAA
formation (Ailawadi et al., 2009). SMC seeding has shown therapeutic potential
for AAA in a rat model (Losy et al., 2003, Allaire et al., 2004). Given their
inherently plastic nature and their seemingly protective role in AAA disease,
they are an appealing target of study.
The overall aim of this study was to explore the early stages of AAA disease
using an ex vivo porcine bioreactor model and to further evaluate the established
model. The adopted approach was to pre-treat porcine carotid arteries with a
protease treatment containing a combination of collagenase and elastase (CCE)
before culture for a specified length of time in a bioreactor under steady flow.
Following CCE treatment, bioreactor culture for twelve days resulted in SMCs
which were phenotypically comparable to human end-stage AAA SMCs (END
model) (Riches et al., 2013). For this thesis, a culture period of three days was
selected to attempt to simulate early AAA development (EARLY model). In a
mouse model, although an aneurysmal arterial dilation was observed 14 days
after treatment, there was evidence that SMCs had undergone phenotypic
switching only seven days after treatment. Therefore, in the EARLY model,
arteries were culture for three days in order to investigate the SMC behaviour
prior to phenotypic switching (Ailawadi et al., 2009).
Following this, the tissue was either used for histology, immunohistochemistry
and SMC explant cultures or for biomechanical analysis. The long term strategy
was envisaged to create a reproducible and logistically simple large animal
model of AAA which would be able to inform research to develop SMC
therapeutic targets in early AAA disease.
During the course of this study, the structure and function of SMCs from the
early and end-stage AAA model were characterised. The tissue from the end-
stage model was characterised biomechanically in order to understand the
relationship between the observed SMC dysfunction and the function of the
216
artery as a whole organ. Both early and end-stage models were qualitatively
characterised using histology and immunohistochemistry. The local dynamics
in the bioreactor were also characterised using porcine carotid arteries:
previously, this had only been done using artificial silicone arteries.
This study directly followed a previous investigation in our laboratory which
used protease pre-treatment followed by culture under steady flow in a
bioreactor for twelve days to produce SMCs which were found to be comparable
to human end-stage AAA SMCs (Riches et al., 2013). In that study, it was found
that only a combination of collagenase and elastase (neither protease alone)
prior to bioreactor culture was able to induce this AAA SMC phenotype. It was,
however, unclear as to the contributions of the bioreactor and the treatment
alone. The characterisation of the ECM was also limited in that study. In this
thesis, by including static culture controls, the contributions of the culture
environment and the protease treatment were able to be separated and explored.
In addition, biomechanical and histological analysis allowed a greater insight
into the status of the ECM. An early AAA model was also developed, in an
attempt to temporally map the SMC behaviour, prior to the phenotypic switch.
This switch is regarded as an early event in AAA formation (Ailawadi et al.,
2009). In the current study, there were several principal findings.
1. Both CCE treatment and dynamic culture are required to induce SMC
phenotypic switch
The previous study investigating the ex vivo bioreactor AAA model showed that
by treating the artery with a combination of collagenase and elastase, after
twelve days culture in the bioreactor the SMCs were phenotypically comparable
to human AAA SMCs (Riches et al., 2013). However, the roles of protease
treatment and bioreactor culture in SMC phenotype separately were not
determined in that study. In this study, appropriate vehicle treatment and static
culture controls were selected and investigated. In cellular terms, it was found
that the combination of CCE pre-treatment and bioreactor culture was required
for the SMCs to undergo this switch in phenotype. Neither CCE treatment nor
217
bioreactor culture alone was able to induce this change. The morphology and
behaviour of SMCs derived from control arteries which were applied with a
vehicle gel and then cultured in the bioreactor were comparable to fresh SMCs.
This study was able to reproduce the reduced proliferation, rhomboid, end-stage
AAA SMC phenotype which was comparable to human AAA SMC.
2. Early and end-stage model SMCs exhibit two distinct phenotypes
Another finding was revealed when the SMCs from the EARLY model were
characterised in terms of structure and function. The structure of these EARLY
SMCs were indistinguishable from control cells and exhibited a typical spindle
morphology with aligned actin cytoskeleton. According to the classical SMC
phenotype, this morphology would suggest a contractile SMC with low
proliferation. However, the EARLY SMCs consistently exhibited
hyperproliferation; in the END model SMC proliferation was significantly
impaired. This behaviour, coupled with the finding that senescence levels of
BIOCCE SMCs was significantly increased in the END model may point to
accelerated aging with ensuing senescence in the SMCs. Indeed, it has already
been shown that SMCs and endothelial cells from human AAA tissue exhibit
shortened telomeres, indicative of early hyperproliferation in the human disease
(Cafueri et al., 2012). Further unpublished data from our laboratory has also
shown that human AAA SMCs have increased levels of nuclear aberrancy and
DNA damage (Riches et al., unpublished). These indications of DNA damage
are also found in the end-stage BIOCCE SMCs. These observations are not
without precedent, as SMCs from patients with diabetes mellitus have also been
shown to exhibit a phenotype which is neither classically differentiated or de-
differentiated (Riches et al., 2014). SMCs may therefore exist within a
phenotypic spectrum rather than existing between binary differentiated and de-
differentiated phenotypes.
The ex vivo model was able to produce SMCs which were phenotypically
similar to human AAA SMCs indicative of prematurely aged cells.
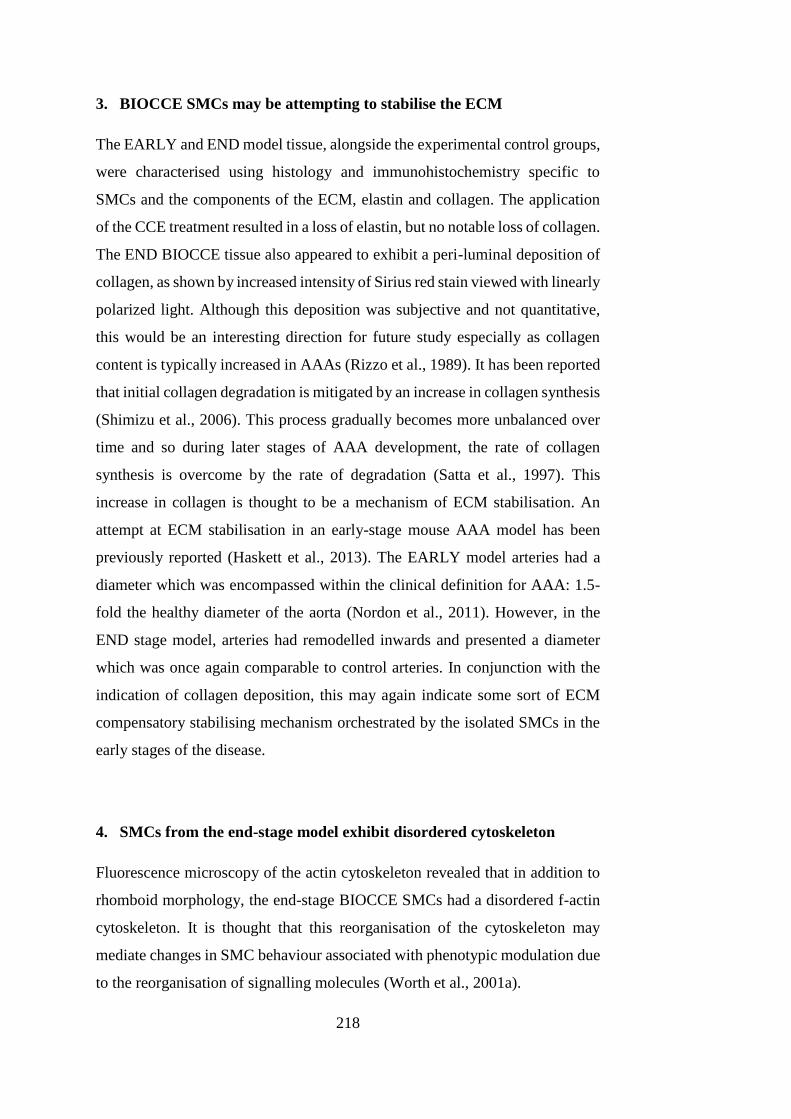
218
3. BIOCCE SMCs may be attempting to stabilise the ECM
The EARLY and END model tissue, alongside the experimental control groups,
were characterised using histology and immunohistochemistry specific to
SMCs and the components of the ECM, elastin and collagen. The application
of the CCE treatment resulted in a loss of elastin, but no notable loss of collagen.
The END BIOCCE tissue also appeared to exhibit a peri-luminal deposition of
collagen, as shown by increased intensity of Sirius red stain viewed with linearly
polarized light. Although this deposition was subjective and not quantitative,
this would be an interesting direction for future study especially as collagen
content is typically increased in AAAs (Rizzo et al., 1989). It has been reported
that initial collagen degradation is mitigated by an increase in collagen synthesis
(Shimizu et al., 2006). This process gradually becomes more unbalanced over
time and so during later stages of AAA development, the rate of collagen
synthesis is overcome by the rate of degradation (Satta et al., 1997). This
increase in collagen is thought to be a mechanism of ECM stabilisation. An
attempt at ECM stabilisation in an early-stage mouse AAA model has been
previously reported (Haskett et al., 2013). The EARLY model arteries had a
diameter which was encompassed within the clinical definition for AAA: 1.5-
fold the healthy diameter of the aorta (Nordon et al., 2011). However, in the
END stage model, arteries had remodelled inwards and presented a diameter
which was once again comparable to control arteries. In conjunction with the
indication of collagen deposition, this may again indicate some sort of ECM
compensatory stabilising mechanism orchestrated by the isolated SMCs in the
early stages of the disease.
4. SMCs from the end-stage model exhibit disordered cytoskeleton
Fluorescence microscopy of the actin cytoskeleton revealed that in addition to
rhomboid morphology, the end-stage BIOCCE SMCs had a disordered f-actin
cytoskeleton. It is thought that this reorganisation of the cytoskeleton may
mediate changes in SMC behaviour associated with phenotypic modulation due
to the reorganisation of signalling molecules (Worth et al., 2001a).
219
5. The bioreactor caused arterial remodelling, regardless of pre-treatment
Biomechanical analysis revealed that during bioreactor culture, BIOCCE
arteries showed a decreased transition strain in both orientations. This also
supports the previous finding that collagen content may have increased and that
the arteries were actively remodelling to adapt to the insult to the ECM from the
CCE treatment. Control arteries which were treated with a vehicle gel only prior
to culture in the bioreactor also appeared to undergo active remodelling. The
arterial diameter tended to be decreased compared to control arteries and there
was a significant increase in transition strain in one orientation. Neither of these
behaviours are suggestive of passive degradation as changes in transition strain
are driven by collagen remodelling (Bank et al., 1996). Inwards remodelling of
the artery is indicative of active remodelling as the luminal pressure was greater
than the outer pressure – the artery was resisting the pressure gradient. In terms
of arterial tissue and biomechanics, the control arteries were affected by the
dynamic environment in the bioreactor. Ideally, a bioreactor would completely
mirror the in vivo situation and so the addition of a pulsatile component to the
flow would be a natural development of the model. In this way, the tissue would
be subjected to cyclic stress and possibly oscillatory shear stress as it would
physiologically (Osol, 1995). A more complex simulation of physiological flow
in the bioreactor may lead to the biomechanical behaviour of the tissue to
behave in a more similar way to fresh tissue.
6. End-stage SMCs showed a loss of remodelling capabilities
The strength and stiffness of CCE treated arteries was not affected by bioreactor
culture, unlike vehicle control treated arteries. In addition, there was a trend
towards decreased levels of MMP secretion which is necessary for arterial
remodelling. Although there was evidence that at some point during the twelve
days in culture the SMCs in the CCE treated arteries attempted to stabilise the
ECM, this was not sufficient to alter the biomechanical function of the artery in
the end-stage model. The dysfunctional, senescent SMCs indicated a potential
loss of remodelling capabilities in the end-stage model. Further biomechanical
220
analysis of the early-stage model may elucidate the temporal changes in
biomechanics; it is conceivable that collagen was secreted when the SMCs are
still relatively active before the tissue is degraded due to impaired SMC
function. Although MMPs are greatly implicated in the formation and
development of AAA, it may be that in the ex vivo model, the cells primarily
responsible were not present. Adventitial mast cells and macrophages have been
shown to produce copious amounts of MMPs in AAA tissue (Thompson et al.,
1995, Tsuruda et al., 2008). The intra-luminal thrombus and polymorphonuclear
neutrophils have also been shown to secrete high levels of MMPs (Fontaine et
al., 2002). In isolation, once SMCs switch to the end-stage AAA phenotype,
they are not active and are possibly limited in their ability to secrete MMPs.
Overall, it appears that, from the literature and the data included in this study,
AAA SMCs do not fit into the classical SMC phenotype, exhibiting
characteristics from both differentiated and de-differentiated SMCs (Figure
7.1). A previously identified distinct senescent cell phenotype, senescence
associated secretory phenotype (SASP), is characterised by an altered
secretome. An intriguing path of future study would be to characterise the
secretome of the early and end-stage BIOCCE SMCs in order to investigate if
they have, or are likely to adopt this distinct phenotype.
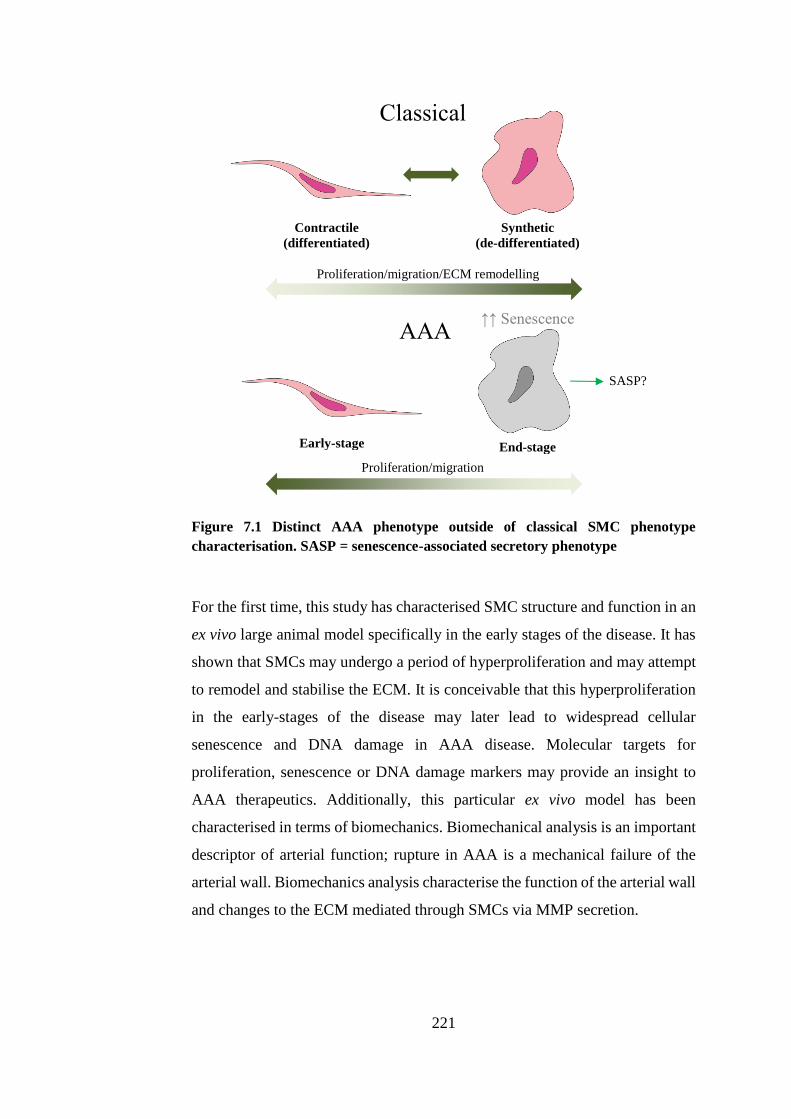
221
Figure 7.1 Distinct AAA phenotype outside of classical SMC phenotype
characterisation. SASP = senescence-associated secretory phenotype
For the first time, this study has characterised SMC structure and function in an
ex vivo large animal model specifically in the early stages of the disease. It has
shown that SMCs may undergo a period of hyperproliferation and may attempt
to remodel and stabilise the ECM. It is conceivable that this hyperproliferation
in the early-stages of the disease may later lead to widespread cellular
senescence and DNA damage in AAA disease. Molecular targets for
proliferation, senescence or DNA damage markers may provide an insight to
AAA therapeutics. Additionally, this particular ex vivo model has been
characterised in terms of biomechanics. Biomechanical analysis is an important
descriptor of arterial function; rupture in AAA is a mechanical failure of the
arterial wall. Biomechanics analysis characterise the function of the arterial wall
and changes to the ECM mediated through SMCs via MMP secretion.
Classical
AAA
Contractile (differentiated)
Synthetic (de-differentiated)
Early-stage End-stage
Proliferation/migration/ECM remodelling
Proliferation/migration
↑↑ Senescence
SASP?
222
7.1. STRENGTHS AND LIMITATIONS
The ex vivo nature of the model presents as a double-edged sword, with unique
strengths and weaknesses. Firstly, the SMCs are able to be virtually isolated
from confounding factors allowing sole exploration of the role of SMCs in AAA
development. Such confounding factors may be differences in the dynamic
culture environment that may exist between individual animals or patients or
the presence of immune cells (such as mast cells, macrophages, neutrophils)
which likely contribute to AAA formation (Satta et al., 1998, Sun et al., 2007,
Tsuruda et al., 2008, Lai et al., 2016). Therefore, although the SMCs are
removed from the physiological environment when cultured ex vivo, it enables
their exact role to be established. In addition, an ex vivo model is logistically
more practical compared to in vivo models. Although not within the scope of
this current project, the ex vivo nature also allows more direct control of the
dynamic culture environment. This would enable some investigation into the
role of haemodynamics in AAA development even outside of safe physiological
parameters for living subjects.
The non-physiological steady flow may have had an effect on the behaviour of
the SMCs (Osol, 1995, Hoshina et al., 2003, Lehoux et al., 2006, Hahn and
Schwartz, 2009). Although the SMC phenotype in the end-stage model has been
previously validated with human AAA SMCs, it was not feasible to also validate
the early-stage model due to scarcity of human AAA tissue in the earliest stages
of development. Further to this, the arteries in the end-stage model displayed no
significant dilatation, as they did in the early-stage model (Chapter 4). This was
thought to be some sort of ECM stabilisation mechanism. However, the clinical
definition of AAA is a focal dilatation of the arterial wall; the end-stage AAA
model does not technically meet this criterion (Nordon et al., 2011). An
intriguing future study would be to maintain the arteries in the bioreactor for
longer than twelve days. Another limitation is that little is known about the
nature of the flow through the vessel in the bioreactor. Turbulent and low-shear
flow is known to exacerbate (or potentially even cause) vascular dysfunction,
and so this may provide an insightful view into AAA pathogenesis with the ex
223
vivo model (Davies, 1995, Miller et al., 2002, Lin et al., 2013). Ideally, the same
technique used clinically for flow analysis, magnetic resonance angiography
(MRA), would be used to visualise the flow through the bioreactor. However,
the bioreactor was constructed primarily of stainless steel and so MRA analysis
is not possible. A combination of ultrasound with computational fluid dynamics
(CFD) modelling may, however, enable better understanding of the bioreactor
flow in various conditions (Scotti et al., 2008, Vande Geest et al., 2008). Peak
wall shear stress (WSS) has been shown to be a promising indicator of AAA
growth and rupture; building knowledge of the flow would enable WSS analysis
(Vorp and Geest, 2005, Scotti et al., 2008, Xiong et al., 2008, Kontopodis et al.,
2015).
7.2. RECOMMENDATIONS FOR FUTURE WORK
1. Investigation into control of dynamic culture environment and its effect
on arterial and cellular behaviour
One of the advantages to using a bioreactor ex vivo model over an in vivo model
is that the dynamic culture environment can be more tightly controlled in terms
of flow type, flow rate, pressure and various pulsatile waveforms. The scope of
this study was to identify the point at which the SMCs underwent a switch in
phenotype and so a temporal analysis was undertaken. However, in terms of
paths for future study, the bioreactor ex vivo model is perfectly suited to the
effect of the dynamic environment on AAA progression. For example,
comparing arterial tissue and SMC phenotype in arteries cultured under
physiological and high pressure may provide an insight into the role of
hypertension in AAA, already thought to play a role (Nordon et al., 2011).
Higher flow rates or an addition of downstream resistance may be able to model
increased stiffness in the vasculature due to the effect of aging or smoking, and
also be able to look at AAA progression in more ‘aged’ arteries. Age and
smoking are major risk-factors for development of AAA (Lederle et al., 2003,
Sakalihasan et al., 2005).
224
2. Biomechanical analysis of the early-stage model
Time and resource limitations meant that it was not feasible to undertake
biomechanical analysis of the early-stage model. For future study, the uniaxial
tensile testing method employed in this thesis to characterise biomechanics of
the end-stage model arteries could be used for the early-stage model. This would
be a natural progression of the model and also may illuminate further the
possible ECM stabilisation by peri-luminal collagen deposition seen in this
study and its effects on the arterial function.
3. Analysis of secretome in early and end-stage model
Senescence-associated secretory phenotype cells (SASPs) are characterised
through an altered secretome. Analysis of the secretome of the SMCs from the
early and end-stage models would enable more conclusions to be made about
the true phenotypic nature of the SMCs in this model. If a combination of
dynamic culture and protease degradation induces a classical SASP SMC, then
this may be able to inform future therapies for early AAA development
involving slowing of vascular aging and stabilisation or replenishment of
functional SMCs.
4. Investigation into role of DNA damage in SMC senescence
Some further work to this thesis has already commenced (Riches et al.,
unpublished). Nuclear aberrancy and γ-H2AX, a marker of double-stranded
DNA damage, are both significantly increased in human AAA SMCs and end-
stage SMCs in the ex vivo model. The role of DNA damage on SMC structure
and function using the ex vivo model and possible methods of mitigating this
damage would be a very exciting path of future research.
225
5. Inhibition of proliferation and localisation of proliferation markers
This study identified an early period of hyperproliferation which may explain
the onset of increased SMC dysfunction and senescence. Therefore, a natural
progression of the project would be to investigate the role of inhibition of SMC
proliferation on AAA development. Proliferative markers, such as Ki67 could
be localised using immunohistochemistry in order to visualise this behaviour
over time using the ex vivo model.
6. Characterisation of flow through bioreactor and computational
modelling of peak wall shear stress
The nature of the flow through the artery in the bioreactor is currently not
known. A study involving computational simulation of the bioreactor and
construction of a computational fluid dynamics (CFD) model would enable
more insight into the dynamic environment in which the artery is cultured. A
computational model would potentially also allow the rupture locations and
pressures to be investigated using peak wall shear stress (WSS) measurements.
This would then be validated using the ex vivo model.
7. Increased culture period for the ex vivo AAA model and the effects on
arterial and SMC function
The ex vivo model was shown to exhibit a clinically aneurysmal dilatation of
1.5-fold normal arterial diameter in the early model, but then fall back below
this value in the end-stage model, thought to be an attempt at stabilisation.
Therefore the extension of length of culture time would provide more
information as to the effects of SMC dysfunction further on the arterial
structure. Tissue viability over a longer period of time may be the major hurdle
to this proposed future work, therefore this would have to be further evaluated
in terms of establishing conditions to retain viability.
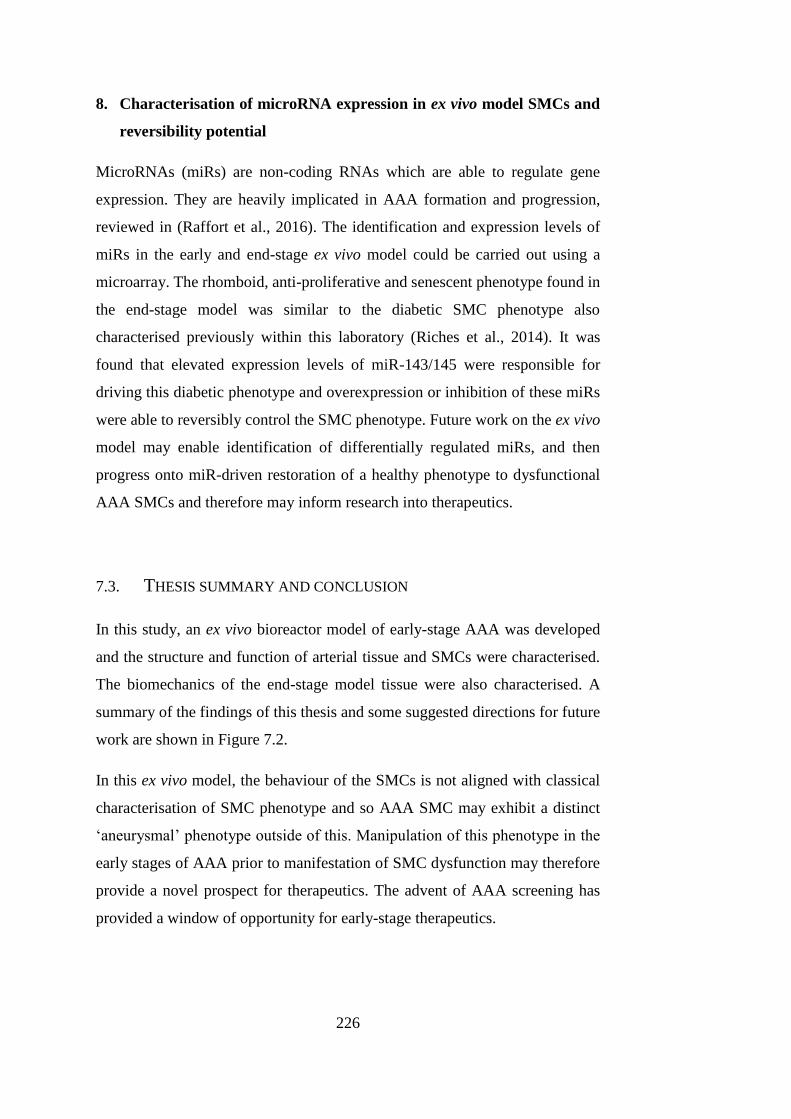
226
8. Characterisation of microRNA expression in ex vivo model SMCs and
reversibility potential
MicroRNAs (miRs) are non-coding RNAs which are able to regulate gene
expression. They are heavily implicated in AAA formation and progression,
reviewed in (Raffort et al., 2016). The identification and expression levels of
miRs in the early and end-stage ex vivo model could be carried out using a
microarray. The rhomboid, anti-proliferative and senescent phenotype found in
the end-stage model was similar to the diabetic SMC phenotype also
characterised previously within this laboratory (Riches et al., 2014). It was
found that elevated expression levels of miR-143/145 were responsible for
driving this diabetic phenotype and overexpression or inhibition of these miRs
were able to reversibly control the SMC phenotype. Future work on the ex vivo
model may enable identification of differentially regulated miRs, and then
progress onto miR-driven restoration of a healthy phenotype to dysfunctional
AAA SMCs and therefore may inform research into therapeutics.
7.3. THESIS SUMMARY AND CONCLUSION
In this study, an ex vivo bioreactor model of early-stage AAA was developed
and the structure and function of arterial tissue and SMCs were characterised.
The biomechanics of the end-stage model tissue were also characterised. A
summary of the findings of this thesis and some suggested directions for future
work are shown in Figure 7.2.
In this ex vivo model, the behaviour of the SMCs is not aligned with classical
characterisation of SMC phenotype and so AAA SMC may exhibit a distinct
‘aneurysmal’ phenotype outside of this. Manipulation of this phenotype in the
early stages of AAA prior to manifestation of SMC dysfunction may therefore
provide a novel prospect for therapeutics. The advent of AAA screening has
provided a window of opportunity for early-stage therapeutics.
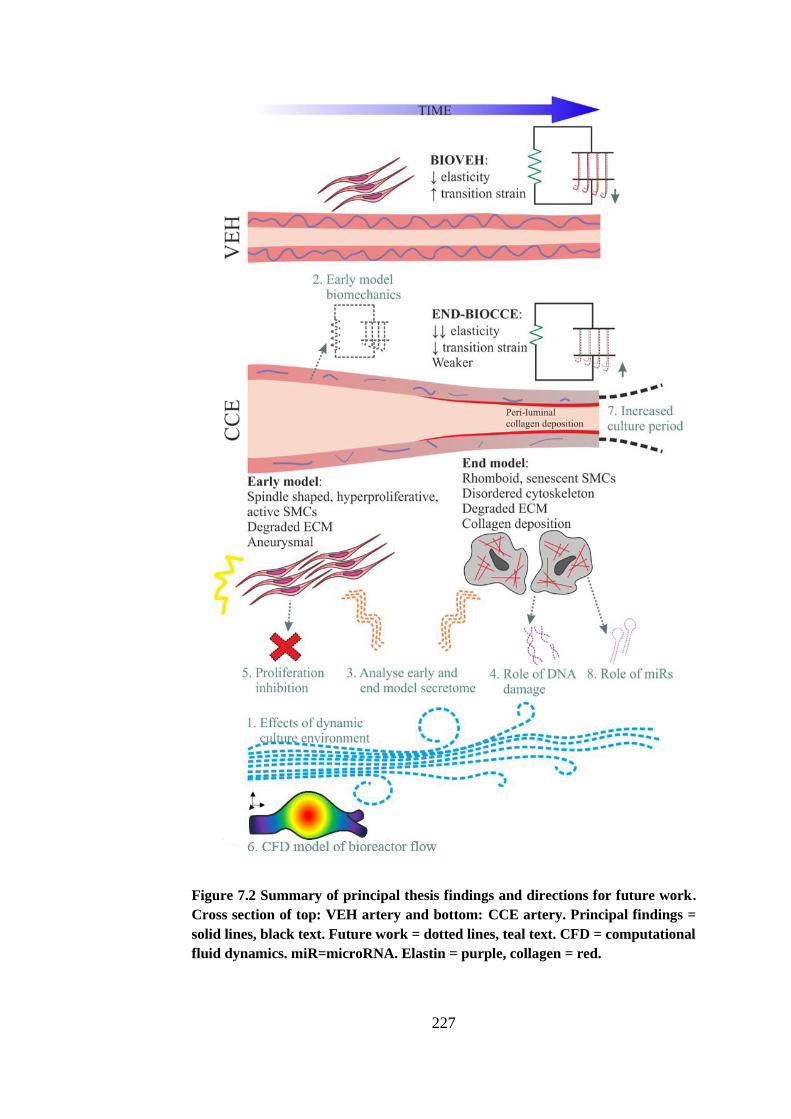
227
Figure 7.2 Summary of principal thesis findings and directions for future work.
Cross section of top: VEH artery and bottom: CCE artery. Principal findings =
solid lines, black text. Future work = dotted lines, teal text. CFD = computational
fluid dynamics. miR=microRNA. Elastin = purple, collagen = red.

228

229
REFERENCES
230
LIST OF REFERENCES
ABILDGAARD, C. F., HARRISON, J. & JOHNSON, C. A. 1971. Comparative
study of blood coagulation in nonhuman primates. J Appl Physiol, 30,
400-5.
ADAMS, P. D. 2009. Healing and Hurting: Molecular Mechanisms, Functions,
and Pathologies of Cellular Senescence. Molecular Cell, 36, 2-14.
AILAWADI, G., ELIASON, J. L. & UPCHURCH, G. R. 2003. Current
concepts in the pathogenesis of abdominal aortic aneurysm. Journal of
Vascular Surgery, 38, 584 - 588.
AILAWADI, G., MOEHLE, C. W., PEI, H., WALTON, S. P., YANG, Z.,
KRON, I. L., LAU, C. L. & OWENS, G. K. 2009. Smooth muscle
phenotypic modulation is an early event in aortic aneurysms. The
Journal of Thoracic and Cardiovascular Surgery, 138, 1392-1399.
AIRHART, N., BROWNSTEIN, B. H., COBB, J. P., SCHIERDING, W.,
ARIF, B., ENNIS, T. L., THOMPSON, R. W. & CURCI, J. A. 2014.
Smooth muscle cells from abdominal aortic aneurysms are unique and
can independently and synergistically degrade insoluble elastin. Journal
of Vascular Surgery, 60, 1033-1042.e5.
ALBINSSON, S. & SWARD, K. 2013. Targeting smooth muscle microRNAs
for therapeutic benefit in vascular disease. Pharmacological Research,
75, 28-36.
ALEXANDER, M. R. & OWENS, G. K. 2012. Epigenetic control of smooth
muscle cell differentiation and phenotypic switching in vascular
development and disease. Annu Rev Physiol, 74, 13-40.
ALLAIRE, E., HASENSTAB, D., KENAGY, R. D., STARCHER, B.,
CLOWES, M. M. & CLOWES, A. W. 1998. Prevention of aneurysm
development and rupture by local overexpression of plasminogen
activator inhibitor-1. Circulation, 98, 249 - 255.
ALLAIRE, E., MUSCATELLI-GROUX, B., GUINAULT, A.-M., PAGES, C.,
GOUSSARD, A., MANDET, C., BRUNEVAL, P., MÉLLIÈRE, D. &
BECQUEMIN, J.-P. 2004. Vascular Smooth Muscle Cell Endovascular
Therapy Stabilizes Already Developed Aneurysms in a Model of Aortic
Injury Elicited by Inflammation and Proteolysis. Annals of Surgery, 239,
417 - 427.
ALLAIRE, E., MUSCATELLI-GROUX, B., MANDET, C., GUINAULT, A.-
M., BRUNEVAL, P., DESGRANGES, P., CLOWES, A., MÉLLIÈRE,
D. & BECQUEMIN, J.-P. 2002. Paracrine effect of vascular smooth
muscle cells in the prevention of aortic aneurysm formation. Journal of
Vascular Surgery, 36, 1018 - 1026.
231
AMMIRATI, M., CIRIC, I. & RABIN, E. 1988. Induction of experimental
aneurysms on the rat common carotid artery using a microsurgical CO2
laser. Microsurgery, 9, 78-81.
ANDREWS, E., WHITE, W. & BULLOCK, L. 1975. Spontaneous aortic
aneurysms in blotchy mice. American Journal of Pathology, 78, 199-
210.
ANIDJAR, S. & KIEFFER, E. 1992. Pathogenesis of Acquired Aneurysms of
the Abdominal Aorta. Annals of Vascular Surgery, 6, 298 - 305.
ANIDJAR, S., SALZMANN, J. L., GENTRIC, D., LAGNEAU, P.,
CAMILLERI, J. P. & MICHEL, J. B. 1990. Elastase-induced
experimental aneurysms in rats. Circulation, 82, 973 - 81.
APER, T., SCHMIDT, A., DUCHROW, M. & BRUCH, H. P. 2007.
Autologous Blood Vessels Engineered from Peripheral Blood Sample.
European Journal of Vascular and Endovascular Surgery, 33, 33-39.
ARGENTA, R. & PEREIRA, A. H. 2009. Modelos animais de aneurisma de
aorta. Jornal Vascular Brasileiro, 8, 148-153.
BAJARDI, G., PECORARO, F. & MIRABELLA, D. 2009. Efficacy of
TachoSil® patches in controlling Dacron suture-hole bleeding after
abdominal aortic aneurysm open repair. Journal of Cardiothoracic
Surgery, 4, 1-5.
BANK, A. J., WANG, H., HOLTE, J. E., MULLEN, K., SHAMMAS, R. &
KUBO, S. H. 1996. Contribution of Collagen, Elastin, and Smooth
Muscle to In Vivo Human Brachial Artery Wall Stress and Elastic
Modulus. Circulation, 94, 3263-3270.
BASU, R., MORTON, J., KANDALAM, V., WANG, X., DAVIDGE, S. T.,
OUDIT, G. Y. & KASSIRI, Z. 2011. Loss of TIMP3 leads to adverse
remodelling of the vascular wall structure and development of
abdominal aortic aneurysm following angiotensin II treatment.
Circulation, 124, S115 - S116.
BATH, M. F., GOKANI, V. J., SIDLOFF, D. A., JONES, L. R., CHOKE, E.,
SAYERS, R. D. & BOWN, M. J. 2015. Systematic review of
cardiovascular disease and cardiovascular death in patients with a small
abdominal aortic aneurysm. British Journal of Surgery, 102, 866-872.
BENSON, R. A., POOLE, R., MURRAY, S., MOXEY, P. & LOFTUS, I. M.
2016. Screening results from a large United Kingdom abdominal aortic
aneurysm screening center in the context of optimizing United Kingdom
National Abdominal Aortic Aneurysm Screening Programme protocols.
Journal of Vascular Surgery, 63, 301-304.
BERGOEING, M. P., ARIF, B., HACKMANN, A. E., ENNIS, T. L.,
THOMPSON, R. W. & CURCI, J. A. 2007. Cigarette smoking increases
aortic dilatation without affecting matrix metalloproteinase-9 and -12
expression in a modified mouse model of aneurysm formation. Journal
232
of vascular surgery : official publication, the Society for Vascular
Surgery [and] International Society for Cardiovascular Surgery, North
American Chapter, 45, 1217-1227.e2.
BEST, V. A., PRICE, J. F. & FOWKES, F. G. 2003. Persistent increase in the
incidence of abdominal aortic aneurysm in Scotland, 1981 - 2000.
British Journal of Surgery, 90, 1510 - 1515.
BHF. 2008. British Heart Foundation Factfile: Abdominal Aortic Aneurysms
[Online]. Available: http://www.bhf.org.uk/idoc.ashx?docid=f6657a6e-
d1c7-485d-aaae-77e5868c6309&version=-1 [Accessed 6th January
2012].
BLUTH, E. I., MURPHEY, S. M., HOLLIER, L. H. & SULLIVAN, M. A.
1990. Color flow Doppler in the evaluation of aortic aneurysms.
International Angiology, 9, 8 - 10.
BOGREN, H. G., BUONOCORE, M. H. & GU, W.-Z. 1994. Carotid and
vertebral artery blood flow in left- and right-handed healthy subjects
measured with MR velocity mapping. Journal of Magnetic Resonance
Imaging, 4, 37-42.
BOON, R. A. & DIMMELER, S. 2011. MicroRNAs and Aneurysm Formation.
Trends in Cardiovascular Medicine, 21, 172-177.
BOUDGHENE, F., ANIDJAR, S., ALLAIRE, E., OSBORNE-PELLEGRIN,
M., BIGOT, J. M. & MICHEL, J. B. 1993. Endovascular grafting in
elastase-induced experimental aortic aneurysms in dogs: feasibility and
preliminary results. J Vasc Interv Radiol, 4, 497-504.
BRADY, A. R., THOMPSON, S. G., FOWKES, F. G. R., GREENHALGH, R.
M. & POWELL, J. T. 2004. Abdominal aortic aneurysm expansion risk
factors and time intervals for surveillance. Circulation, 110, 16-21.
BRETON, M., BERROU, E., BRAHIMI-HORN, M. C., DEUDON, E. &
PICARD, J. 1986. Synthesis of sulfated proteoglycans throughout the
cell cycle in smooth muscle cells from pig aorta. Exp Cell Res, 166, 416-
26.
BROPHY, C. M., MARKS, W. H., REILLY, J. M. & TILSON, M. D. 1991.
Decreased Tissue Inhibitor of Metalloproteinases (TIMP) in Abdominal
Aortic Aneurysm Tissue: A Preliminary Report. Journal of Surgical
Research, 50, 653 - 657.
BROPHY, C. M., TILSON, J. E., BRAVERMAN, I. M. & TILSON, M. D.
1988. Age of onset, pattern of distribution, and histology of aneurysm
development in a genetically predisposed mouse model. Journal of
Vascular Surgery, 8, 45-8.
BROWNLEE, R. D. & LANGILLE, B. L. 1991. Arterial adaptations to altered
blood flow. Can J Physiol Pharmacol, 69, 978-83.
233
BURTON, D. G. A. & KRIZHANOVSKY, V. 2014. Physiological and
pathological consequences of cellular senescence. Cellular and
Molecular Life Sciences, 71, 4373-4386.
BURTON, D. G. A., MATSUBARA, H. & IKEDA, K. 2010. Pathophysiology
of vascular calcification Pivotal role of cellular senescence in vascular
smooth muscle cells. Experimental Gerontology, 45, 819-824.
CAFUERI, G., PARODI, F., PISTORIO, A., BERTOLOTTO, M., VENTURA,
F., GAMBINI, C., BIANCO, P., DALLEGRI, F., PISTOIA, V.,
PEZZOLO, A. & PALOMBO, D. 2012. Endothelial and Smooth Muscle
Cells from Abdominal Aortic Aneurysm Have Increased Oxidative
Stress and Telomere Attrition. PLoS ONE, 7, e35312.
CALADO, R. T. & YOUNG, N. S. 2009. Telomere Diseases. New England
Journal of Medicine, 361, 2353-2365.
CAMPA, J. S., GREENHALGH, R. M. & POWELL, J. T. 1987. Elastin
degradation in abdominal aortic aneurysms. Atherosclerosis, 65, 13-21.
ČANIĆ, S., TAMBAČA, J., GUIDOBONI, G., MIKELIĆ, A., HARTLEY, C.
& ROSENSTRAUCH, D. 2006. Modeling Viscoelastic Behavior of
Arterial Walls and Their Interaction with Pulsatile Blood Flow. SIAM
Journal on Applied Mathematics, 67, 164-193.
CARMELIET, P., MOONS, L., LIJNEN, R., BAES, M., LEMAITRE, V.,
TIPPING, P., DREW, A., EECKHOUT, Y., SHAPIRO, S., LUPU, F. &
COLLEN, D. 1997. Urokinase-generated plasmin activates matrix
metalloproteinases during aneurysm formation. Nature Genetics, 17,
439 - 444.
CARMO, M., COLOMBO, L., BRUNO, A., CORSI, F. R. M., RONCORONI,
L., CUTTIN, M. S., RADICE, F., MUSSINI, E. & SETTEMBRINI, P.
G. 2002. Alteration of elastin, collagen and their cross-links in
abdominal aortic aneurysms. European Journal of Vascular and
Endovascular Surgery, 23, 543-549.
CARRELL, T. W., SMITH, A. & BURNAND, K. G. 1999. Experimental
techniques and models in the study of the development and treatment of
abdominal aortic aneurysm. Br J Surg, 86, 305-12.
CHEN, Q., LI, W., QUAN, Z. & SUMPIO, B. E. 2003. Modulation of vascular
smooth muscle cell alignment by cyclic strain is dependent on reactive
oxygen species and P38 mitogen-activated protein kinase. Journal of
Vascular Surgery, 37, 660-668.
CHO, B. S., WOODRUM, D. T., ROELOFS, K. J., STANLEY, J. C., HENKE,
P. K. & UPCHURCH, G. R., JR. 2009. Differential regulation of aortic
growth in male and female rodents is associated with AAA
development. J Surg Res, 155, 330-8.
CHOKE, E., COCKERILL, G., WILSON, W. R. W., SAYED, S., DAWSON,
J., LOFTUS, I. & THOMPSON, M. M. 2005. A review of biological
234
factors implicated in abdominal aortic aneurysm rupture. European
Journal of Vascular and Endovascular Surgery, 30, 227 - 244.
CHUTER, T. A. M., VISCOMI, S., SLATER, J. L., NOWYGROD, R. &
RISBERG, B. 1997. Canine model of abdominal aortic aneurysm treated
by endovascular graft implantation. Cardiovascular Surgery, 5, 490-
496.
CIAVARELLA, C., ALVIANO, F., GALLITTO, E., RICCI, F., BUZZI, M.,
VELATI, C., STELLA, A., FREYRIE, A. & PASQUINELLI, G. 2015.
Human Vascular Wall Mesenchymal Stromal Cells Contribute to
Abdominal Aortic Aneurysm Pathogenesis Through an Impaired
Immunomodulatory Activity and Increased Levels of Matrix
Metalloproteinase-9. Circulation Journal, 79, 1460-U277.
COLLINS, M. J., BERSI, M., WILSON, E. & HUMPHREY, J. D. 2011.
Mechanical properties of suprarenal and infrarenal abdominal aorta:
Implications for mouse models of aneurysms. Medical Engineering &
Physics, 33, 1262-1269.
COPPÉ, J.-P., PATIL, C. K., RODIER, F., SUN, Y., MUÑOZ, D. P.,
GOLDSTEIN, J., NELSON, P. S., DESPREZ, P.-Y. & CAMPISI, J.
2008. Senescence-Associated Secretory Phenotypes Reveal Cell-
Nonautonomous Functions of Oncogenic RAS and the p53 Tumor
Suppressor. PLoS Biol, 6, e301.
CORDES, K. R., SHEEHY, N. T., WHITE, M. P., BERRY, E. C., MORTON,
S. U., MUTH, A. N., LEE, T.-H., MIANO, J. M., IVEY, K. N. &
SRIVASTAVA, D. 2009. miR-145 and miR-143 regulate smooth
muscle cell fate and plasticity. Nature, 460, 705-710.
COX, E. P. 1927. A Method of Assigning Numerical and Percentage Values to
the Degree of Roundness of Sand Grains. Journal of Paleontology, 1,
179-183.
CROWTHER, M., GOODALL, S., JONES, J. L., BELL, P. R. F. &
THOMPSON, M. M. 2000. Increased matrix metalloproteinase 2
expression in vascular smooth muscle cells cultured from abdominal
aortic aneurysms. Journal of Vascular Surgery, 32, 575-583.
CURCI, J. A. 2009. Digging in the "Soil" of the Aorta to Understand the Growth
of Abdominal Aortic Aneurysms. Vascular, 17, S21- S29.
D'SOUZA, D. 2009. Radiopedia.org [Online]. Available:
http://radiopaedia.org/articles/histology-of-blood-vessels [Accessed 6th
January 2012].
DADGAR, L., MAROIS, Y., DENG, X. & GUIDOIN, R. 1997. Arterial wall
mechanical characteristics after treatment in collagenase: an in vitro
aneurysm model. Clin Invest Med, 20, 25-34.
235
DAI, D., DING, Y., LEWIS, D. & KALLMES, D. 2006. A proposed ordinal
scale for grading histology in elastase-induced, saccular aneurysms.
American Journal of Neuroradiology, 27, 132-138.
DAUGHERTY, A. & CASSIS, L. A. 2004. Mouse Models of Abdominal
Aortic Aneurysms. Arteriosclerosis, Thrombosis, and Vascular Biology,
24, 429-434.
DAVIES, P. F. 1995. Flow-mediated endothelial mechanotransduction.
Physiological Reviews, 75, 519-560.
DAVIS, F. M., RATERI, D. L. & DAUGHERTY, A. 2014. Mechanisms of
aortic aneurysm formation: translating preclinical studies into clinical
therapies. Heart, 100, 1498-1505.
DAVIS, F. M., RATERI, D. L. & DAUGHERTY, A. 2015. Abdominal aortic
aneurysm: novel mechanisms and therapies. Current Opinion in
Cardiology, 30, 566-573.
DEB, P. P. & RAMAMURTHI, A. 2014. Spatiotemporal mapping of matrix
remodelling and evidence of in situ elastogenesis in experimental
abdominal aortic aneurysms. J Tissue Eng Regen Med.
DEL MORAL, L. R., LARGO, C., RAMIREZ, J. R., CLEMENTE, L. V.,
HEREDERO, A. F., DE CUBAS, L. R., GARCIA-OLMO, D. &
GARCIA-ARRANZ, M. 2015. Potential of mesenchymal stem cell in
stabilization of abdominal aortic aneurysm sac. Journal of Surgical
Research, 195, 325-333.
DENAYER, T., STÖHR, T. & VAN ROY, M. 2014. Animal models in
translational medicine: Validation and prediction. New Horizons in
Translational Medicine, 2, 5-11.
DI MARTINO, E. S., BOHRA, A., VANDE GEEST, J. P., GUPTA, N.,
MAKAROUN, M. S. & VORP, D. A. 2006. Biomechanical properties
of ruptured versus electively repaired abdominal aortic aneurysm wall
tissue. Journal of Vascular Surgery, 43, 570-576.
DOBRIN, P. B. 1999. Animal models of aneurysms. Ann Vasc Surg, 13, 641-8.
DOBRIN, P. B., BAKER, W. H. & GLEY, W. C. 1984. Elastolytic and
collagenolytic studies of arteries. Implications for the mechanical
properties of aneurysms. Arch Surg, 119, 405-9.
DOBRIN, P. B. & MRKVICKA, R. 1994. Failure of elastin or collagen as
possible critical connective tissue alterations underlying aneurysmal
dilatation. Cardiovascular Surgery, 2, 484 - 488.
DUA, M. M. & DALMAN, R. L. 2010. Hemodynamic influences on abdominal
aortic aneurysm disease: Application of biomechanics to aneurysm
pathophysiology. Vascular Pharmacology, 53, 11 - 21.
DUBICK, M. A., HUNTER, G. C., PEREZ-LIZANO, E., MAR, G. &
GEOKAS, M. C. 1988. Assessment of the role of pancreatic proteases
236
in human abdominal aortic aneurysms and occlusive disease. Clinica
Chimica Acta, 177, 1-10.
DUPREY, A., KHANAFER, K., SCHLICHT, M., AVRIL, S., WILLIAMS, D.
& BERGUER, R. 2010. In Vitro Characterisation of Physiological and
Maximum Elastic Modulus of Ascending Thoracic Aortic Aneurysms
Using Uniaxial Tensile Testing. European Journal of Vascular and
Endovascular Surgery, 39, 700-707.
ETON, D., WARNER, D., OWENS, C., MCCLENIC, B., CAVA, R., OFEK,
B., BORHANI, M., BARANIEWSKI, H. & SCHULER, J. J. 1996.
Results of endoluminal grafting in an experimental aortic aneurysm
model. Journal of Vascular Surgery, 23, 819-831.
EUGSTER, T., HUBER, A., OBEID, T., SCHWEGLER, I., GURKE, L. &
STIERLI, P. 2005. Aminoterminal propeptide of Type III procollagen
and matix metalloproteinases-2 and -9 failed to serve as serum markers
for abdominal aortic aneurysm. European Journal of Vascular and
Endovascular Surgery, 29, 378 - 382.
FERGUSON, C. D., CLANCY, P., BOURKE, B., WALKER, P. J., DEAR, A.,
BUCKENHAM, T., NORMAN, P. & GOLLEDGE, J. 2010.
Association of statin prescription with small abdominal aortic aneurysm
progression. American Heart Journal, 159, 307 - 313.
FONCK, E., PROD'HOM, G., ROY, S., AUGSBURGER, L., RÜFENACHT,
D. A. & STERGIOPULOS, N. 2007. Effect of elastin degradation on
carotid wall mechanics as assessed by a constituent-based
biomechanical model. American Journal of Physiology - Heart and
Circulatory Physiology, 292, H2754-H2763.
FONTAINE, V., JACOB, M. P., HOUARD, X., ROSSIGNOL, P.,
PLISSONNIER, D., ANGLES-CANO, E. & MICHEL, J. B. 2002.
Involvement of the mural thrombus as a site of protease release and
activation in human aortic aneurysms. American Journal of Pathology,
161, 1701-1710.
FREESTONE, T., TURNER, R. J., COADY, A., HIGMAN, D. J.,
GREENHALGH, R. M. & POWELL, J. T. 1995. Inflammation and
matrix metalloproteinases in the enlarging abdominal aortic aneurysm.
Arteriosclerosis, Thrombosis, and Vascular Biology, 15, 1145 - 1151.
GACCHINA, C., BROTHERS, T. & RAMAMURTHI, A. 2011. Evaluating
smooth muscle cells from CaCl2-induced rat aortal expansions as a
surrogate culture model for study of elastogenic induction of human
aneurysmal cells. Tissue Eng Part A, 17, 1945-58.
GADOWSKI, G. R., RICCI, M. A., HENDLEY, E. D. & PILCHER, D. B.
1993. Hypertension accelerates the growth of experimental aortic
aneurysms. J Surg Res, 54, 431-6.
237
GALIS, Z. S. & KHATRI, J. J. 2002. Matrix metalloproteinases in vascular
remodeling and atherogenesis - The good, the bad, and the ugly.
Circulation Research, 90, 251-262.
GANDHI, R. H., IRIZARRY, E., CANTOR, J. O., KELLER, S., NACKMAN,
G. B., HALPERN, V. J., NEWMAN, K. M. & TILSON, M. D. 1994.
ANALYSIS OF ELASTIN CROSS-LINKING AND THE
CONNECTIVE-TISSUE MATRIX OF ABDOMINAL AORTIC-
ANEURYSMS. Surgery, 115, 617-620.
GANTEN, M. K., KRAUTTER, U., VON TENGG-KOBLIGK, H.,
BOCKLER, D., SCHUMACHER, H., STILLER, W., DELORME, S.,
KAUCZOR, H. U., KAUFFMANN, G. W. & BOCK, M. 2008.
Quantification of aortic distensibility in abdominal aortic aneurysm
using ECG-gated multi-detector computed tomography. Eur Radiol, 18,
966-73.
GASSER, T. C., OGDEN, R. W. & HOLZAPFEL, G. A. 2006. Hyperelastic
modelling of arterial layers with distributed collagen fibre orientations.
GEEST, J. P. V., SACKS, M. S. & VORP, D. A. 2006. The effects of aneurysm
on the biaxial mechanical behaviour of human abdominal aorta. Journal
of Biomechanics, 39, 1324 - 1334.
GERTZ, S. D., KURGAN, A. & EISENBERG, D. 1988. Aneurysm of the rabbit
common carotid artery induced by periarterial application of calcium
chloride in vivo. J Clin Invest, 81, 649-56.
GHOSHAL, S. & LOFTIN, C. D. 2012. Cyclooxygenase-2 Inhibition
Attenuates Abdominal Aortic Aneurysm Progression in Hyperlipidemic
Mice. PLoS ONE, 7, e44369.
GIAMBERNARDI, T. A., GRANT, G. M., TAYLOR, G. P., HAY, R. J.,
MAHER, V. M., MCCORMICK, J. J. & KLEBE, R. J. 1998. Overview
of matrix metalloproteinase expression in cultured human cells. Matrix
Biology, 16, 483-496.
GITLIN, J. M., TRIVEDI, D. B., LANGENBACH, R. & LOFTIN, C. D. 2007.
Genetic deficiency of cyclooxygenase-2 attenuates abdominal aortic
aneurysm formation in mice. Cardiovascular Research, 73, 227-236.
GOERICKE, S. L., PAROHL, N., ALBERT, J., DUDDA, M. & FORSTING,
M. 2009. Elastase-induced aneurysm in Swine: proof of feasibility in a
first case. A technical note. Interventional Neuroradiology, 15, 413 -
416.
GOLDMAN, J., ZHONG, L. & LIU, S. Q. 2003. Degradation of α-actin
filaments in venous smooth muscle cells in response to mechanical
stretch. American Journal of Physiology - Heart and Circulatory
Physiology, 284, H1839-H1847.
GOLLEDGE, J., MULLER, J., DAUGHERTY, A. & NORMAN, P. 2006.
Abdominal aortic aneurysm: Pathogenesis and implications for
238
management. Arteriosclerosis, Thrombosis, and Vascular Biology, 26,
pp 2605 - 2613.
GOLLEDGE, J. & NORMAN, P. E. 2010. Atherosclerosis and Abdominal
Aortic Aneurysm : Cause, Response, or Common Risk Factors?
Arteriosclerosis, Thrombosis, and Vascular Biology, 30, 1075 - 1077.
GOODALL, S., CROWTHER, M., BELL, P. R. & THOMPSON, M. M. 2002a.
The association between venous structural alterations and
biomechanical weakness in patients with abdominal aortic aneurysms.
Journal of Vascular Surgery, 35, 937-942.
GOODALL, S., PORTER, K. E., BELL, P. R. & THOMPSON, M. M. 2002b.
Enhanced Invasive Properties Exhibited by Smooth Muscle Cells are
Associated with Elevated Production of MMP-2 in Patients with Aortic
Aneurysms. European Journal of Vascular and Endovascular Surgery,
24, 72-80.
GORIN, D. R., ARBID, E. J., D'AGOSTINO, R., KENT YUCEL, E.,
SOLOVAY, K. S., LA MORTE, W. W., QUIST, W. C., MULLIGAN,
N. & MENZOIAN, J. O. 1997. A new generation endovascular graft for
repair of abdominal aortic aneurysms. The American Journal of Surgery,
173, 159-164.
GOSGNACH, W., MESSIKA-ZEITOUN, D., GONZALEZ, D., PHILIPE, M.
& MICHEL, J. B. 2000. Shear stress induces iNOS expression in
cultured smooth muscle cells: role of oxidative stress. American Journal
of Physiology: Cell Physiology, 279, C1880 - C1888.
GREAT BRITAIN 1986. Animals (Scientific Procedures) Act 1986. c. 14.
London.
GRESHAM, G. A. & HOWARD, A. N. 1961. Aortic rupture in the Turkey.
Journal of Atherosclerosis Research, 1, 75-80.
GROTE, K., FLACH, I., LUCHTEFELD, M., AKIN, E., HOLLAND, S. M.,
DREXLER, H. & SCHIEFFER, B. 2003. Mechanical stretch enhances
mRNA expression and proenzyme release of matrix metalloproteinase-
2 (MMP-2) via NAD(P)H oxidase-derived reactive oxygen species. Circ
Res, 92, e80-6.
HAHN, C. & SCHWARTZ, M. 2009. Mechanotransduction in vascular
physiology and atherogenesis. Nature Reviews Molecular Cell Biology,
10, 53 - 62.
HAHN, M. S., MCHALE, M. K., WANG, E., SCHMEDLEN, R. H. & WEST,
J. L. 2006. Physiologic Pulsatile Flow Bioreactor Conditioning of
Poly(ethylene glycol)-based Tissue Engineered Vascular Grafts. Annals
of Biomedical Engineering, 35, 190-200.
HAN, M., DONG, L. H., ZHENG, B., SHI, J. H., WEN, J. K. & CHENG, Y.
2009. Smooth muscle 22 alpha maintains the differentiated phenotype
239
of vascular smooth muscle cells by inducing filamentous actin bundling.
Life Sci, 84, 394-401.
HANSSON, G. K., GENG, Y. J., HOLM, J., HÅRDHAMMAR, P.,
WENNMALM, A. & JENNSICHE, E. 1994. Arterial smooth muscle
cells express nitric oxide synthase in response to endothelial injury.
Journal of Experimental Medicine, 180, 733 - 738.
HARDMAN, D., EASSON, W. J., HOSKINS, P. R., DÖSSEL, O. &
SCHLEGEL, W. C. 2010. Computation of the Distribution of Monocyte
Deposition in Abdominal Aortic Aneurysm Disease. International
Federation for Medical and Biological Engineering Proceedings, 25,
1961-1964.
HARRIS, P. L., VALLABHANENI, S. R., DESGRANGES, P., BECQUEMIN,
J.-P., VAN MARREWIJK, C. & LAHEIJ, R. J. F. 2000. Incidence and
risk factors of late rupture, conversion, and death after endovascular
repair of infrarenal aortic aneurysms: The EUROSTAR experience.
Journal of Vascular Surgery, 32, 739-749.
HASKETT, D., AZHAR, M., UTZINGER, U. & VANDE GEEST, J. P. 2013.
Progressive alterations in microstructural organization and
biomechanical response in the ApoE mouse model of aneurysm.
Biomatter, 3.
HASKETT, D., AZHAR, M. & VANDE GEEST, J. 2011. Biomechanical
Considerations of Animal Models of Aortic Aneurysms, London,
Springer.
HE, C. M. & ROACH, M. R. 1994. The composition and mechanical properties
of abdominal aortic aneuryms. Journal of Vascular Surgery, 20, 6-13.
HELLENTHAL, F. A. M. V. I., BUURMAN, W. A., WODZIG, W. K. W. H.
& SCHURINK, G. W. H. 2009a. Biomarkers of AAA progression. Part
1: extracellular matrix degeneration. Nature Reviews Cardiology, 6,
464-474.
HELLENTHAL, F. A. M. V. I., BUURMAN, W. A., WODZIG, W. K. W. H.
& SCHURINK, G. W. H. 2009b. Biomarkers of abdominal aortic
aneurysm progression. Part 2: inflammation. Nature Reviews
Cardiology, 6, 543 - 552.
HELLENTHAL, F. A. M. V. I., GEENEN, I. L. A., TEIJINK, J. A. W.,
HEENEMAN, S. & SCHURINK, G. W. H. 2009c. Histological features
of human abdominal aortic aneurysm are not related to clinical
characteristics. Cardiovascular Pathology, 18, 286-293.
HELLER, J. A., WEINBERG, A., ARONS, R., KRISHNASASTRY, K. V.,
LYON, R. T., DEITCH, J. S., SCHULICK, A. H., BUSH, H. L. &
KENT, K. C. 2000. Two decades of abdominal aortic aneurysm repair:
Have we made any progress? Journal of Vascular Surgery, 32, 1091 -
1100.
240
HELMY, I. M. & AZIM, A. M. A. 2012. Efficacy of ImageJ in the assessment
of apoptosis. Diagnostic Pathology, 7, 6.
HENDERSON, E. L., GENG, Y. J., SUKHOVA, G. K., WHITTEMORE, A.
D., KNOX, J. & LIBBY, P. 1999. Death of smooth muscle cells and
expression of mediators of apoptosis by T lymphocytes in human
abdominal aortic aneurysms. Circulation, 99, 96 - 104.
HODGKIN, B. C., BURKETT, D. E. & SMITH, E. B. 1982. Noninvasive
measurement of systolic and diastolic blood pressure in swine. American
Journal of Physiology - Heart and Circulatory Physiology, 242, H127-
H130.
HOEGH, A. & LINDHOLT, J. S. 2009. Basic science review. Vascular
distensibility as a predictive tool in the management of small
asymptomatic abdominal aortic aneurysms. Vasc Endovascular Surg,
43, 333-8.
HOLZAPFEL, G. A. 2001. Biomechanics of soft tissue. The handbook of
materials behavior models, 3, 1049-1063.
HOLZAPFEL, G. A., GASSER, T. C. & STADLER, M. 2002. A structural
model for the viscoelastic behavior of arterial walls: Continuum
formulation and finite element analysis. European Journal of Mechanics
- A/Solids, 21, 441-463.
HOSHINA, K., SHO, E., SHO, M., NAKAHASHI, T. K. & DALMAN, R. L.
2003. Wall shear stress and strain modulate experimental aneurysm
cellularity. J Vasc Surg, 37, 1067-74.
HOUDEK, K., MOLACEK, J., TRESKA, V., KRIZKOVA, V., EBERLOVA,
L., BOUDOVA, L., NEDOROST, L., TOLINGER, P., KOCOVA, J.,
KOBR, J., BAXA, J., LISKA, V., WITTER, K. & TONAR, Z. 2013.
Focal histopathological progression of porcine experimental abdominal
aortic aneurysm is mitigated by atorvastatin. International Angiology,
32, 291-306.
HOVSEPIAN, D. M., ZIPORIN, S. J., SAKURAI, M. K., LEE, J. K., CURCI,
J. A. & THOMPSON, R. W. 2000. Elevated plasma levels of matrix
metalloproteinase-9 in patients with abdominal aortic aneurysms: a
circulating marker of degenerative aneurysm disease. Journal of
Vascular and Interventional Radiology, 11, 1345 - 1352.
HUBER, A. & BADYLAK, S. F. 2012. Phenotypic changes in cultured smooth
muscle cells: limitation or opportunity to tissue engineering of hollow
organs? Journal of Tissue Engineering and Regenerative Medicine, 6,
505-511.
HULTGREN, R., GRANATH, F. & SWEDENBORG, J. 2007. Different
Disease Profiles for Women and Men with Abdominal Aortic
Aneurysms. European Journal of Vascular and Endovascular Surgery,
33, 556-560.
241
HUNGERFORD, J. E., OWENS, G. K., ARGRAVES, W. S. & LITTLE, C. D.
1996. Development of the aortic vessel wall as defined by vascular
smooth muscle and extracellular matrix markers. Dev Biol, 178, 375-92.
HYNECEK, R. L., DERUBERTIS, B. G., TROCCIOLA, S. M., ZHANG, H.,
PRINCE, M. R., ENNIS, T. L., KENT, K. C. & FARIES, P. L. 2007.
The creation of an infrarenal aneurysm within the native abdominal
aorta of swine. Surgery, 142, 143-149.
JAGADESHAM, V. P., SCOTT, D. J. A. & CARDING, S. R. 2008. Abdominal
aortic aneurysms: an autoimmune disease? Trends in Molecular
Medicine, 14, 522-529.
JOHNSEN, S. H., FORSDAHL, S. H., SINGH, K. & JACOBSEN, B. K. 2010.
Atherosclerosis in Abdominal Aortic Aneurysms: A Causal Event or a
Process Running in Parallel? The Tromsø Study. Arteriosclerosis,
Thrombosis, and Vascular Biology, 30, 1263 - 1268.
KARAPOLAT, S., UNLU, Y., ERKUT, B., KOCAK, H. & ERDOGAN, F.
2006. Influence of indomethacin in the rat aneurysm model. Ann Vasc
Surg, 20, 369-75.
KARLSSON, L., BERGQVIST, D., LINDBÄCK, J. & PÄRSSON, H. 2009.
Expansion of small diameter abdominal aortic aneurysms is not
reflected by the release of inflammatory mediators IL-6, MMP-9 and
CRP in plasma. European Journal of Vascular and Endovascular
Surgery, 37, 420 - 424.
KARTHIKESALINGAM, A., NICOLI, T. K., HOLT, P. J., HINCHLIFFE, R.
J., PASHA, N., LOFTUS, I. M. & THOMPSON, M. M. 2011. The Fate
of Patients Referred to a Specialist Vascular Unit with Large Infra-renal
Abdominal Aortic Aneurysms over a Two-year Period. European
Journal of Vascular and Endovascular Surgery, 42, 295-301.
KEELING, W. B., ARMSTRONG, P. A., STONE, P. A., BANDYK, D. F. &
SHAMES, M. L. 2005. An Overview of Matrix Metalloproteinases in
the Pathogenesis and Treatment of Abdominal Aortic Aneurysms.
Vascular and Endovascular Surgery, 39, 457-464.
KEEN, R. R., NOLAN, K. D., CIPOLLONE, M., SCOTT, E., SHIVELY, V.
P., YAO, J. S. T. & PEARCE, W. H. 1994. Interleukin-1 beta induces
differential gene expression in aortic smooth muscle cells. Journal of
Vascular Surgery, 20, 774-786.
KENT, K. C. 2014. Abdominal Aortic Aneurysms. New England Journal of
Medicine, 371, 2101-2108.
KIN, K., MIYAGAWA, S., FUKUSHIMA, S., SHIRAKAWA, Y., TORIKAI,
K., SHIMAMURA, K., DAIMON, T., KAWAHARA, Y., KURATANI,
T. & SAWA, Y. 2012. Tissue- and Plasma-Specific MicroRNA
Signatures for Atherosclerotic Abdominal Aortic Aneurysm. Journal of
242
the American Heart Association: Cardiovascular and Cerebrovascular
Disease, 1, e000745.
KLOSTER, B. O., LUND, L. & LINDHOLT, J. S. 2015. Induction of
continuous expanding infrarenal aortic aneurysms in a large porcine
animal model. Annals of Medicine and Surgery, 4, 30-35.
KOBIELARZ, M. & JANKOWSKI, L. J. 2013. Experimental characterization
of the mechanical properties of the abdominal aortic aneurysm wall
under uniaxial tension. Journal of Theoretical and Applied Mechanics,
51, 949--958.
KOCH, A. E., HAINES, G. K., RIZZO, R. J., RADOSEVICH, J. A., POPE, R.
M., ROBINSON, P. G. & PEARCE, W. H. 1990. Human abdominal
aortic aneurysms. Immunophenotypic analysis suggesting an immune-
mediated response. American Journal of Pathology, 137, 1199 - 1213.
KOCH, A. E., KUNKEL, S. L., PEARCE, W. H., SHAH, M. R., PARIKH, D.,
EVANOFF, H. L., HAINES, G. K., BURDICK, M. D. & STRIETER,
R. M. 1993. Enhanced production of the chemotactic cytokines
interleukin-8 and monocyte chemoattractant protein-1 in human
abdominal aortic aneurysms. Am J Pathol, 142, 1423-31.
KONTOPODIS, N., METAXA, E., PAPAHARILAOU, Y., TAVLAS, E.,
TSETIS, D. & IOANNOU, C. 2015. Advancements in identifying
biomechanical determinants for abdominal aortic aneurysm rupture.
Vascular, 23, 65-77.
KONTOPODIS, N., PANTIDIS, D., DEDES, A., DASKALAKIS, N. &
IOANNOU, C. V. 2016. The - Not So - Solid 5.5cm Threshold for
Abdominal Aortic Aneurysm Repair: Facts, Misinterpretations, and
Future Directions. Frontiers in surgery, 3, 1.
KÓNYA, A., WRIGHT, K., GOUNIS, M. & KANDARPA, K. 2008. Animal
Models for Atherosclerosis, Restenosis, and Endovascular Aneurysm
Repair. In: CONN, P. M. (ed.) Sourcebook of Models for Biomedical
Research. Totowa, NJ: Humana Press Inc.
KRATZBERG, J. A., WALKER, P. J., RIKKERS, E. & RAGHAVAN, M. L.
2009. The effect of proteolytic treatment on plastic deformation of
porcine aortic tissue. Journal of the Mechanical Behavior of Biomedical
Materials, 2, 65-72.
KU, D. N. 1997. Blood flow in arteries. Annual Review of Fluid Mechanics, 29,
399-434.
LABORDE, J. C., PARODI, J. C., CLEM, M. F., TIO, F. O., BARONE, H. D.,
RIVERA, F. J., ENCARNACION, C. E. & PALMAZ, J. C. 1992.
Intraluminal bypass of abdominal aortic aneurysm: feasibility study.
Radiology, 184, 185-190.
LAI, C. H., WANG, K. C., LEE, F. T., TSAI, H. W., MA, C. Y., CHENG, T.
L., CHANG, B. I., YANG, Y. J., SHI, G. Y. & WU, H. L. 2016. Toll-
243
Like Receptor 4 Is Essential in the Development of Abdominal Aortic
Aneurysm. Plos One, 11, 17.
LANNE, T., SONESSON, B., BERGQVIST, D., BENGTSSON, H. &
GUSTAFSSON, D. 1992. Diameter and compliance in the male human
abdominal aorta: influence of age and aortic aneurysm. Eur J Vasc Surg,
6, 178-84.
LASHERAS, J. C. 2007. The Biomechanics of Arterial Aneurysms. Annual
Review of Fluid Mechanics, 39, 293-319.
LEDERLE, F. A. 2012. The Strange Relationship between Diabetes and
Abdominal Aortic Aneurysm. European Journal of Vascular and
Endovascular Surgery, 43, 254-256.
LEDERLE, F. A., JOHNSON, G. R., WILSON, S. E., CHUTE, E. P.,
LITTOOY, F. N., BANDYK, D., KRUPSKI, W. C., BARONE, G. W.,
ACHER, C. W. & BALLARD, D. J. 1997. Prevalence and Associations
of Abdominal Aortic Aneurysm Detected through Screening. Annals of
Internal Medicine, 126, 441 - 449.
LEDERLE, F. A., NELSON, D. B. & JOSEPH, A. M. 2003. Smoker's relative
risk for aortic aneurysm compared with other smoking-related diseases:
a systematic review. Journal of Vascular Surgery, 38, 329-334.
LEDERMAN, A., SALITURE NETO, F. T., FERREIRA, R., DE
FIGUEIREDO, L. F. P., OTOCH, J. P., AUN, R. & DA SILVA, E. S.
2014. Endovascular model of abdominal aortic aneurysm induction in
swine. Vascular Medicine, 19, 167-174.
LEE, J., CUDDIHY, M. J. & KOTOV, N. A. 2008. Three-dimensional cell
culture matrices: State of the art. Tissue Engineering Part B-Reviews,
14, 61-86.
LEHOUX, S., CASTIER, Y. & TEDGUI, A. 2006. Molecular mechanisms of
the vascular responses to haemodynamic forces. J Intern Med, 259, 381-
92.
LEROUGE, S., RAYMOND, J., SALAZKIN, I., QIN, Z., GABOURY, L.,
CLOUTIER, G., OLIVA, V. L. & SOULEZ, G. 2004. Endovascular
aortic aneurysm repair with stent-grafts: experimental models can
reproduce endoleaks. J Vasc Interv Radiol, 15, 971-9.
LIAO, S., CURCI, J. A., KELLEY, B. J., SICARD, G. A. & THOMPSON, R.
W. 2000. Accelerated Replicative Senescence of Medial Smooth Muscle
Cells Derived from Abdominal Aortic Aneurysms Compared to the
Adjacent Inferior Mesenteric Artery. Journal of Surgical Research, 92,
85-95.
LIAO, S., MIRALLES, M., KELLEY, B. J., CURCI, J. A., BORHANI, M. &
THOMPSON, R. W. 2001. Suppression of experimental abdominal
aortic aneurysms in the rat by treatment with angiotensin-converting
enzyme inhibitors. J Vasc Surg, 33, 1057-64.
244
LIJNEN, H. R. 2001. Plasmin and matrix metalloproteinases in vascular
remodelling. Journal of Thrombosis and Haemostasis, 86, 324 - 333.
LIM, J., WOLFF, J., RODD, C. D., COOPER, D. G. & EARNSHAW, J. J.
2015. Outcome in Men with a Screen-detected Abdominal Aortic
Aneurysm Who are not Fit for Intervention. European Journal of
Vascular and Endovascular Surgery, 50, 732-736.
LIN, P. Y., WU, Y. T., LIN, G. C., SHIH, Y. H., SAMPILVANJIL, A., CHEN,
L. R., YANG, Y. J., WU, H. L. & JIANG, M. J. 2013. Coarctation-
induced degenerative abdominal aortic aneurysm in a porcine model.
Journal of Vascular Surgery, 57, 806-+.
LINDHOLT, J. S., VAMMEN, S., FASTING, H., HENNEBERG, E. W. &
HEICKENDORFF, L. 2000. The plasma level of matrix
metalloproteinase-9 may predict the natural history of small abdominal
aortic aneurysms. A preliminary study. European Journal of Vascular
and Endovascular Surgery, 20, 281 - 285.
LIPPINCOTT, WILLIAMS & WILKINS 2009. Professional Guide to
Diseases, China, Wolters Kluwer Health.
LIU, Y. W., DROZDOV, I., SHROFF, R., BELTRAN, L. E. & SHANAHAN,
C. M. 2013. Prelamin A Accelerates Vascular Calcification Via
Activation of the DNA Damage Response and Senescence-Associated
Secretory Phenotype in Vascular Smooth Muscle Cells. Circulation
Research, 112, E99-+.
LO, R. C. & SCHERMERHORN, M. L. 2016. Abdominal aortic aneurysms in
women. Journal of Vascular Surgery, 63, 839-844.
LONGO, G. M., XIONG, W. F., GREINER, T. C., ZHAO, Y., FIOTTI, N. &
BAXTER, B. T. 2002. Matrix metalloproteinases 2 and 9 work in
concert to produce aortic aneurysms. Journal of Clinical Investigation,
110, 625-632.
LOPEZ-CANDALES, A., HOLMES, D., LIAO, S., SCOTT, M. J. & W, S. A.
1997. Decreased vascular smooth muscle cell density in medial
degeneration of human abdominal aortic aneurysms. American Journal
of Pathology, 150, 993 - 1007.
LOPEZ-DE LEON, A. & ROJKIND, M. 1985. A simple micromethod for
collagen and total protein determination in formalin-fixed paraffin-
embedded sections. J Histochem Cytochem, 33, 737-43.
LOSY, F., DAI, J., PAGES, C., GINAT, M., MUSCATELLI-GROUX, B. A.,
GUINAULT, A.-M., ROUSSELLE, E., SMEDILE, G., LOISANCE,
D., BECQUEMIN, J.-P. & ALLAIRE, E. 2003. Paracrine secretion of
transforming growth factor-β1 in aneurysm healing and stabilization
with endovascular smooth muscle cell therapy. Journal of Vascular
Surgery, 37, 1301-1309.
245
LU, D. & KASSAB, G. S. 2011. Role of shear stress and stretch in vascular
mechanobiology. Journal of the Royal Society Interface, 8, 1379 - 1385.
MAJESKY, M. W. 2007. Developmental Basis of Vascular Smooth Muscle
Diversity. Arteriosclerosis, Thrombosis, and Vascular Biology, 27,
1248-1258.
MANNING, M. W., CASSI, L. A., HUANG, J., SZILVASSY, S. J. &
DAUGHERTY, A. 2002. Abdominal aortic aneurysms: fresh insights
from a novel animal model of the disease. Vasc Med, 7, 45-54.
MARINOV, G. R., MAROIS, Y., PARIS, E., ROBY, P., FORMICHI, M.,
DOUVILLE, Y. & GUIDOIN, R. 1997. Can the infusion of elastase in
the abdominal aorta of the Yucatan miniature swine consistently
produce experimental aneurysms? J Invest Surg, 10, 129-50.
MAYNAR, M., QIAN, Z., HERNANDEZ, J., SUN, F., DEMIGUEL, C.,
CRISOSTOMO, V., USON, J., PINEDA, L. F., ESPINOZA, C. G. &
CASTANEDA, W. R. 2003. An animal model of abdominal aortic
aneurysm created with peritoneal patch: Technique and initial results.
Cardiovascular and Interventional Radiology, 26, 168-176.
MCCORMICK, M. L., GAVRILA, D. & WEINTRAUB, N. L. 2007. Role of
Oxidative Stress in the Pathogenesis of Abdominal Aortic Aneurysms.
Arteriosclerosis, Thrombosis, and Vascular Biology, 27, 461 - 469.
MCMILLAN, W. D., TAMARINA, N. A., CIPOLLONE, M., JOHNSON, D.
A., PARKER, M. A. & PEARCE, W. H. 1997. Size matters: the
relationship between MMP-9 expression and aortic diameter.
Circulation, 96, 2228 - 2232.
MICHEL, J. B., MARTIN-VENTURA, J. L., EGIDO, J., SAKALIHASAN, N.,
TRESKA, V., LINDHOLT, J., ALLAIRE, E., THORSTEINSDOTTIR,
U., COCKERILL, G. & SWEDENBORG, J. 2011. Novel aspects of the
pathogenesis of aneurysms of the abdominal aorta in humans.
Cardiovascular Research, 90, 18-27.
MILLER, F. J. 2002. Aortic Aneurysms: It's All About the Stress.
Arteriosclerosis, Thrombosis, and Vascular Biology, 22, 1948 - 1949.
MILLER, F. J., SHARP, W. J., FANG, X., OBERLEY, L. W., OBERLEY, T.
D. & WEINTRAUB, N. L. 2002. Oxidative stress in human abdominal
aortic aneurysms: a potential mediator of aneurysmal remodelling.
Arteriosclerosis, Thrombosis, and Vascular Biology, 22, 560 - 565.
MIROSLAV, Z., JIRI, B. & MICHAL, D. 2009. Biaxial Tension Tests with
Soft Tissues of Arterial Wall. Engineering Mechanics, 16, 3 - 11.
MOHAN, D. & MELVIN, J. W. 1982. Failure properties of passive human
aortic tissue. I--uniaxial tension tests. J Biomech, 15, 887-902.
MOLACEK, J., BAXA, J., HOUDEK, K., TRESKA, V. & FERDA, J. 2011.
Assessment of abdominal aortic aneurysm wall distensibility with
246
electrocardiography-gated computed tomography. Ann Vasc Surg, 25,
1036-42.
MOLÁČEK, J., TŘEŠKA, V., KOBR, J., ČERTÍK, B., SKALICKÝ, T.,
KUNTSCHER, V. & KŘÍŽKOVÁ, V. 2009. Optimization of the model
of abdominal aortic aneurysm--experiment in an animal model. J Vasc
Res, 46, 1-5.
MONSON, K. L., GOLDSMITH, W., BARBARO, N. M. & MANLEY, G. T.
2003. Axial Mechanical Properties of Fresh Human Cerebral Blood
Vessels. Journal of Biomechanical Engineering, 125, 288-294.
MORGAN, A. J. & HOSKING, S. L. 2007. Non-invasive vascular impedance
measures demonstrate ocular vasoconstriction during isometric
exercise. British Journal of Ophthalmology, 91, 385-390.
MURPHY, E. H., JOHNSON, E. D. & ARKO, F. R. 2007. Device-specific
resistance to in vivo displacement of stent-grafts implanted with
maximum iliac fixation. J Endovasc Ther, 14, 585-92.
NAKAHASHI, T. K., HOSHINA, K., TSAO, P. S., SHO, E., SHO, M.,
KARWOWSKI, J. K., YEH, C., YANG, R.-B., TOPPER, J. N. &
DALMAN, R. L. 2002. Flow loading induces macrophage antioxidative
gene expression in experimental aneurysms. Arteriosclerosis,
Thrombosis, and Vascular Biology, 22, 2017 - 2022.
NELSON, D. M., MCBRYAN, T., JEYAPALAN, J. C., SEDIVY, J. M. &
ADAMS, P. D. 2014. A comparison of oncogene-induced senescence
and replicative senescence: implications for tumor suppression and
aging. Age (Dordr), 36, 9637.
NEREM, R. M. & SELIKTAR, D. 2001. Vascular tissue engineering. Annual
Review of Biomedical Engineering, 3, 225-243.
NESTOLA, M. G. C., GIZZI, A., CHERUBINI, C. & FILIPPI, S. 2016. Three-
band decomposition analysis in multiscale FSI models of abdominal
aortic aneurysms. International Journal of Modern Physics C, 27, 19.
NEUMANN, F. & UNGAR, H. 1973. Spontaneous aortic rupture in turkeys and
the vascularization of the aortic wall. Canadian Veterinary Journal, 14,
136-138.
NIKLASON, L. E., GAO, J., ABBOTT, W. M., HIRSCHI, K. K., HOUSER,
S., MARINI, R. & LANGER, R. 1999. Functional Arteries Grown in
Vitro. Science, 284, 489-493.
NORDON, I. M., HINCHCLIFFE, R. J., HOLT, P. J., LOFTUS, I. M. &
THOMPSON, M. M. 2009. Review of Current Theories for Abdominal
Aortic Aneurysm Pathogenesis. Vascular, 17, 253 - 263.
NORDON, I. M., HINCHLIFFE, R. J., LOFTUS, I. M. & THOMPSON, M. M.
2011. Pathophysiology and epidemiology of abdominal aortic
aneurysms. Nature Reviews Cardiology, 8, 92-102.
247
NORMAN, P. E. & POWELL, J. T. 2010. Site Specificity of Aneurysmal
Disease. Circulation, 121, 560 - 568.
OSAKABE, T., SEYAMA, Y. & YAMASHITA, S. 1995. Comparison of
ELISA and HPLC for the determination of desmosine or isodesmosine
in aortic tissue elastin. J Clin Lab Anal, 9, 293-6.
OSHINSKI, J. N., CURTIN, J. L. & LOTH, F. 2006. Mean-average wall shear
stress measurements in the common carotid artery. Journal of
cardiovascular magnetic resonance : official journal of the Society for
Cardiovascular Magnetic Resonance, 8, 717-722.
OSOL, G. 1995. Mechanotransduction by Vascular Smooth Muscle. Journal of
Vascular Research, 32, 275 - 292.
OWENS, G. K., KUMAR, M. S. & WAMHOFF, B. R. 2004. Molecular
regulation of vascular smooth muscle cell differentiation in development
and disease. Physiol Rev, 84, 767-801.
PAFILI, K., GOUNI-BERTHOLD, I., PAPANAS, N. & MIKHAILIDIS, D. P.
2015. Abdominal aortic aneurysms and diabetes mellitus. Journal of
Diabetes and its Complications, 29, 1330-1336.
PALMAZ, J. C., TIO, F. O., LABORDE, J. C., CLEM, M., RIVERA, F. J.,
MURPHY, K. D. & ENCARNACION, C. E. 1995. Use of Stents
Covered with Polytetrafluoroethylene in Experimental Abdominal
Aortic Aneurysm. Journal of Vascular and Interventional Radiology, 6,
879-885.
PARODI, J. C., PALMAZ, J. C. & BARONE, H. D. 1991. Transfemoral
Intraluminal Graft Implantation for Abdominal Aortic Aneurysms.
Annals of Vascular Surgery, 5, 491-499.
PATEL, M. I., GHOSH, P., MELROSE, J. & APPLEBERG, M. 1996. Smooth
muscle cell migration and proliferation is enhanced in abdominal aortic
aneurysms. Australian and New Zealand Journal of Surgery, 66, 305-
308.
PERLSTEIN, T. S. & LEE, R. T. 2006. Smoking, Metalloproteinases, and
Vascular Disease. Arteriosclerosis, Thrombosis, and Vascular Biology,
26, 250 - 256.
PETERSEN, E., WÅGBERG, F. & ÄNGQUIST, K.-A. 2002. Proteolysis of the
Abdominal Aortic Aneurysm Wall and the Association with Rupture.
European Journal of Vascular and Endovascular Surgery, 23, 153 -
157.
PETRINEC, D., LIAO, S., HOLMES, D. R., REILLY, J. M., PARKS, W. C. &
THOMPSON, R. W. 1996. Doxycycline inhibition of aneurysmal
degeneration in an elastase-induced rat model of abdominal aortic
aneurysm: preservation of aortic elastin associated with suppressed
production of 92 kD gelatinase. J Vasc Surg, 23, 336-46.
248
PHILLIPS, E. H., YRINEO, A. A., SCHROEDER, H. D., WILSON, K. E.,
CHENG, J.-X. & GOERGEN, C. J. 2015. Morphological and
Biomechanical Differences in the Elastase and AngII apoE-/- Rodent
Models of Abdominal Aortic Aneurysms. BioMed Research
International, 2015, 12.
PORTER, KAREN E. & RICHES, K. 2013. The vascular smooth muscle cell:
a therapeutic target in Type 2 diabetes? Clinical Science, 125, 167-182.
PORTER, K. E., VARTY, K., JONES, L., BELL, P. R. & LONDON, N. J.
1996. Human saphenous vein organ culture: a useful model of intimal
hyperplasia? Eur J Vasc Endovasc Surg, 11, 48-58.
POWELL, J. T. 1998. Mortality results for randomised controlled trial of early
elective surgery or ultrasonographic surveillance for small abdominal
aortic aneurysms. The Lancet, 352, 1649-1655.
PROUDFOOT, D. & SHANAHAN, C. 2012. Human vascular smooth muscle
cell culture. Methods Mol Biol, 806, 251-63.
PYO, R., LEE, J. K., SHIPLEY, J. M., CURCI, J. A., MAO, D., ZIPORIN, S.
J., ENNIS, T. L., SHAPIRO, S. D., SENIOR, R. M. & THOMPSON, R.
W. 2000. Targeted gene disruption of matrix metalloproteinase-9
(gelatinase B) suppresses development of experimental abdominal
aortic aneurysms. Journal of Clinical Investigation, 105, 1641 - 1649.
QIU, J., ZHENG, Y., HU, J., LIAO, D., GREGERSEN, H., DENG, X., FAN,
Y. & WANG, G. 2014. Biomechanical regulation of vascular smooth
muscle cell functions: from in vitro to in vivo understanding. Journal of
the Royal Society Interface, 11, 20130852.
RAAZ, U., TOH, R., MAEGDEFESSEL, L., ADAM, M., NAKAGAMI, F.,
EMRICH, F. C., SPIN, J. M. & TSAO, P. S. 2014. Hemodynamic
regulation of reactive oxygen species: implications for vascular
diseases. Antioxid Redox Signal, 20, 914-28.
RAFFORT, J., LAREYRE, F., CLEMENT, M. & MALLAT, Z. 2016. Micro-
RNAs in abdominal aortic aneurysms: insights from animal models and
relevance to human disease. Cardiovascular Research, 110, 165-177.
RAGHAVAN, M. L., KRATZBERG, J., CASTRO DE TOLOSA, E. M.,
HANAOKA, M. M., WALKER, P. & DA SILVA, E. S. 2006. Regional
distribution of wall thickness and failure properties of human abdominal
aortic aneurysm. Journal of Biomechanics, 39, 3010-3016.
RAGHAVAN, M. L. & VORP, D. A. 2000. Toward a biomechanical tool to
evaluate rupture potential of abdominal aortic aneurysm: identification
of a finite strain constitutive model and evaluation of its applicability.
Journal of Biomechanics, 33, 475-482.
RAGHAVAN, M. L., WEBSTER, M. W. & VORP, D. A. 1996. Ex vivo
biomechanical behaviour of abdominal aortic aneurysm: assessment
249
using a new mathematical model. Annals of Biomedical Engineering,
24, 573 - 582.
REILLY, J. M., SAVAGE, E. B., BROPHY, C. M. & TILSON, M. D. 1990.
Hydrocortisone rapidly induces aortic rupture in a genetically
susceptible mouse. Archives of surgery (Chicago, Ill. : 1960), 125, 707-
709.
RENSEN, S. S. M., DOEVENDANS, P. & VAN EYS, G. 2007. Regulation and
characteristics of vascular smooth muscle cell phenotypic diversity.
Netherlands Heart Journal, 15, 100-108.
RICHES, K., ALSHANWANI, A. R., WARBURTON, P., O'REGAN, D. J.,
BALL, S. G., WOOD, I. C., TURNER, N. A. & PORTER, K. E. 2014.
Elevated expression levels of miR-143/5 in saphenous vein smooth
muscle cells from patients with Type 2 diabetes drive persistent changes
in phenotype and function. J Mol Cell Cardiol, 74, 240-50.
RICHES, K., ANGELINI, T. G., MUDHAR, G. S., KAYE, J., CLARK, E.,
BAILEY, M. A., SOHRABI, S., KOROSSIS, S., WALKER, P. G.,
SCOTT, D. J. & PORTER, K. E. 2013. Exploring smooth muscle
phenotype and function in a bioreactor model of abdominal aortic
aneurysm. J Transl Med, 11, 208.
RICHES, K., MORLEY, M. E., TURNER, N. A., O'REGAN, D. J., BALL, S.
G., PEERS, C. & PORTER, K. E. 2009. Chronic hypoxia inhibits MMP-
2 activation and cellular invasion in human cardiac myofibroblasts.
Journal of Molecular and Cellular Cardiology, 47, 391-399.
RIEHL, B. D., PARK, J. H., KWON, I. K. & LIM, J. Y. 2012. Mechanical
Stretching for Tissue Engineering: Two-Dimensional and Three-
Dimensional Constructs. Tissue Engineering Part B-Reviews, 18, 288-
300.
RIZZO, R. J., MCCARTHY, W. J., DIXIT, S. N., LILLY, M. P., SHIVELY,
V. P., FLINN, W. R. & YAO, J. S. T. 1989. Collagen types and matrix
protein content in human abdominal aortic aneurysms. Journal of
Vascular Surgery, 10, 365-373.
ROACH, M. R. & BURTON, A. C. 1957. THE REASON FOR THE SHAPE
OF THE DISTENSIBILITY CURVES OF ARTERIES. Canadian
Journal of Biochemistry and Physiology, 35, 681-690.
RUCKER, R. B. & TINKER, D. 1977. Structure and metabolism of arterial
elastin. Int Rev Exp Pathol, 17, 1-47.
RUEL, J. & LACHANCE, G. 2009. A new bioreactor for the development of
tissue-engineered heart valves. Annals of Biomedical Engineering, 37,
674 - 681.
RZUCIDLO, E. M., MARTIN, K. A. & POWELL, R. J. 2007. Regulation of
vascular smooth muscle cell differentiation. Journal of Vascular
Surgery, 45, A25-A32.
250
SAKALIHASAN, N., HEYERES, A., NUSGENS, B. V., LIMET, R. &
LAPIERE, C. M. 1993. Modifications of the extracellular matrix of
aneurysmal abdominal aortas as a function of their size. Eur J Vasc Surg,
7, 633-7.
SAKALIHASAN, N., LIMET, R. & DEFAWE, O. D. 2005. Abdominal aortic
aneurysm. The Lancet, 365, 1577-1589.
SAKATA, N., MENG, J. & TAKEBAYASHI, S. 2000. Effects of advanced
glycation end products on the proliferation and fibronectin production
of smooth muscle cells. J Atheroscler Thromb, 7, 169-76.
SANO, M., SASAKI, T., HIRAKAWA, S., SAKABE, J., OGAWA, M.,
BABA, S., ZAIMA, N., TANAKA, H., INUZUKA, K., YAMAMOTO,
N., SETOU, M., SATO, K., KONNO, H. & UNNO, N. 2014.
Lymphangiogenesis and Angiogenesis in Abdominal Aortic Aneurysm.
PLoS ONE, 9, e89830.
SATOH, H., NAKAMURA, M., SATOH, M., NAKAJIMA, T., IZUMOTO,
H., MAESAWA, C., KAWAZOE, K., MASUDA, T. & HIRAMORI,
K. 2004. Expression and localization of tumour necrosis factor-alpha
and its converting enzyme in human abdominal aortic aneurysm. Clin
Sci (Lond), 106, 301-6.
SATOH, K., BERK, B. C. & SHIMOKAWA, H. 2011. Vascular-derived
reactive oxygen species for homeostasis and diseases. Nitric Oxide-
Biology and Chemistry, 25, 211-215.
SATTA, J., HAUKIPURO, K., KAIRALUOMA, M. I. & JUVONEN, T. 1997.
Aminoterminal propeptide of type III procollagen in the follow-up of
patients with abdominal aortic aneurysms. J Vasc Surg, 25, 909-15.
SATTA, J., LAURILA, A., PAAKKO, P., HAUKIPURO, K., SORMUNEN,
R., PARKKILA, S. & JUVONEN, T. 1998. Chronic inflammation and
elastin degradation in abdominal aortic aneurysm disease: an
immunohistochemical and electron microscopic study. European
Journal of Vascular and Endovascular Surgery, 15, 313-319.
SCHANZER, A. & MESSINA, L. 2012. Two Decades of Endovascular
Abdominal Aortic Aneurysm Repair: Enormous Progress With Serious
Lessons Learned. Journal of the American Heart Association, 1.
SCHMOKER, J. D., LEE, C. H., TAYLOR, R. G., CHUNG, A., TROMBLEY,
L., HARDIN, N., RUSSELL, S. R. & HOWARD, A. 2008. A novel
model of blunt thoracic aortic injury: a mechanism confirmed? J
Trauma, 64, 923-31.
SCHRIEFL, A. J., SCHMIDT, T., BALZANI, D., SOMMER, G. &
HOLZAPFEL, G. A. 2015. Selective enzymatic removal of elastin and
collagen from human abdominal aortas: Uniaxial mechanical response
and constitutive modeling. Acta Biomaterialia, 17, 125-136.
251
SCOTTI, C. M., JIMENEZ, J., MULUK, S. C. & FINOL, E. A. 2008. Wall
stress and flow dynamics in abdominal aortic aneurysms: finite element
analysis vs. fluid-structure interaction. Comput Methods Biomech
Biomed Engin, 11, 301-22.
SEGNANI, C., IPPOLITO, C., ANTONIOLI, L., PELLEGRINI, C.,
BLANDIZZI, C., DOLFI, A. & BERNARDINI, N. 2015. Histochemical
Detection of Collagen Fibers by Sirius Red/Fast Green Is More Sensitive
than van Gieson or Sirius Red Alone in Normal and Inflamed Rat Colon.
PLoS ONE, 10, e0144630.
SHAH, P. K. 1997. Inflammation, Metalloproteinases and Increased
Proteolysis. An Emerging Pathophysiological Paradigm in Aortic
Aneurysm. Circulation, 96, 2115 - 2117.
SHANTIKUMAR, S., AJJAN, R., PORTER, K. E. & SCOTT, D. J. A. 2010.
Diabetes and the Abdominal Aortic Aneurysm. European Journal of
Vascular and Endovascular Surgery, 39, 200-207.
SHARP, W. V., DONOVAN, D. L., TEAGUE, P. C. & MOSTELLER, R. D.
1982. ARTERIAL OCCLUSIVE DISEASE - A FUNCTION OF
VESSEL BIFURCATION ANGLE. Surgery, 91, 680-685.
SHI, N. & CHEN, S.-Y. 2016. Smooth Muscle Cell Differentiation: Model
Systems, Regulatory Mechanisms, and Vascular Diseases. Journal of
Cellular Physiology, 231, 777-787.
SHIMIZU, K., MITCHELL, R. N. & LIBBY, P. 2006. Inflammation and
Cellular Immune Responses in Abdominal Aortic Aneurysms.
Arteriosclerosis, Thrombosis, and Vascular Biology, 26, 987 - 994.
SHO, E., SHO, M., HOSHINA, K., KIMURA, H., NAKAHASHI, T. K. &
DALMAN, R. L. 2004. Hemodynamic forces regulate mural
macrophage infiltration in experimental aortic aneurysms. Exp Mol
Pathol, 76, 108-16.
SILENCE, J., COLLEN, D. & LIJNEN, H. R. 2002. Reduced Atherosclerotic
Plaque but Enhanced Aneurysm Formation in Mice With Inactivation of
the Tissue Inhibitor of Metalloproteinase-1 (TIMP-1) Gene. Circulation
Research, 90, 897-903.
SILLESEN, H., ELDRUP, N., HULTGREN, R., LINDEMAN, J., BREDAHL,
K., THOMPSON, M., WANHAINEN, A., WINGREN, U. &
SWEDENBORG, J. 2015. Randomized clinical trial of mast cell
inhibition in patients with a medium-sized abdominal aortic aneurysm.
Br J Surg, 102, 894-901.
SILVER, F. H., SNOWHILL, P. B. & FORAN, D. J. 2003. Mechanical
behavior of vessel wall: a comparative study of aorta, vena cava, and
carotid artery. Ann Biomed Eng, 31, 793-803.
SINGH, V. 2008. General Anatomy. Chennai: Elsevier.
252
SIVARAPATNA, A., GHAEDI, M., LE, A. V., MENDEZ, J. J., QYANG, Y.
B. & NIKLASON, L. E. 2015. Arterial specification of endothelial cells
derived from human induced pluripotent stem cells in a biomimetic flow
bioreactor. Biomaterials, 53, 621-633.
SMITH, J. D., DAVIES, N., WILLIS, A. I., SUMPIO, B. E. & ZILLA, P. 2001.
Cyclic Stretch Induces the Expression of Vascular Endothelial Growth
Factor in Vascular Smooth Muscle Cells. Endothelium, 8, 41-48.
STEGEMANN, J. P., HONG, H. & NEREM, R. M. 2005. Mechanical,
biochemical, and extracellular matrix effects on vascular smooth muscle
cell phenotype. Journal of Applied Physiology, 98, 2321-2327.
STEMPER, B. D., YOGANANDAN, N. & PINTAR, F. A. 2007a. Mechanics
of arterial subfailure with increasing loading rate. Journal of
Biomechanics, 40, 1806-1812.
STEMPER, B. D., YOGANANDAN, N., STINEMAN, M. R., GENNARELLI,
T. A., BAISDEN, J. L. & PINTAR, F. A. 2007b. Mechanics of Fresh,
Refrigerated, and Frozen Arterial Tissue. Journal of Surgical Research,
139, 236-242.
STRINDBERG, G., NICHOLS, P., RICCI, M. A., MARINOV, G., MAROIS,
Y., ROBY, P. & GUIDOIN, R. 1998. Experimental modifications to a
canine infrarenal aortic aneurysm model for the validation of
endovascular stent-grafts: an exploratory study. J Invest Surg, 11, 185-
97.
STRINGFELLOW, M. M., LAWRENCE, P. F. & STRINGFELLOW, R. G.
1987. The influence of aorta-aneurysm geometry upon stress in the
aneurysm wall. J Surg Res, 42, 425-33.
SUMNER, D. S., HOKANSON, D. E. & STRANDNESS, D. E., JR. 1970.
Stress-strain characteristics and collagen-elastin content of abdominal
aortic aneurysms. Surg Gynecol Obstet, 130, 459-66.
SUN, J., SUKHOVA, G. K., YANG, M., WOLTERS, P. J., MACFARLANE,
L. A., LIBBY, P., SUN, C., ZHANG, Y., LIU, J., ENNIS, T. L.,
KNISPEL, R., XIONG, W., THOMPSON, R. W., BAXTER, B. T. &
SHI, G. P. 2007. Mast cells modulate the pathogenesis of elastase-
induced abdominal aortic aneurysms in mice. J Clin Invest, 117, 3359-
68.
SVENSJO, S., BJORCK, M. & WANHAINEN, A. 2013. Current prevalence
of abdominal aortic aneurysm in 70-year-old women. Br J Surg, 100,
367-72.
SWARTZ, D. D., RUSSELL, J. A. & ANDREADIS, S. T. 2005. Engineering
of fibrin-based functional and implantable small-diameter blood vessels.
American Journal of Physiology - Heart and Circulatory Physiology,
288, H1451-H1460.
253
SWEDENBORG, J., MÄYRÄNPÄÄ, M. I. & KOVANEN, P. T. 2011. Mast
Cells: Important Players in the Orchestrated Pathogenesis of Abdominal
Aortic Aneurysms. Arteriosclerosis, Thrombosis, and Vascular Biology,
31, 734-740.
TANGIRALA, R. K., RUBIN, E. M. & PALINSKI, W. 1995. Quantitation of
atherosclerosis in murine models: correlation between lesions in the
aortic origin and in the entire aorta, and differences in the extent of
lesions between sexes in LDL receptor-deficient and apolipoprotein E-
deficient mice. Journal of Lipid Research, 36, 2320-8.
TAVARES MONTEIRO, J. A., DA SILVA, E. S., RAGHAVAN, M. L.,
PUECH-LEAO, P., DE LOURDES HIGUCHI, M. & OTOCH, J. P.
2014. Histologic, histochemical, and biomechanical properties of
fragments isolated from the anterior wall of abdominal aortic
aneurysms. J Vasc Surg, 59, 1393-401 e1-2.
THOMPSON, R. W., GERAGHTY, P. J. & LEE, J. K. 2002. Abdominal aortic
aneurysms: basic mechanisms and clinical implications. Current
Problems in Surgery, 39, 110-230.
THOMPSON, R. W., HOLMES, D. R., MERTENS, R. A., LIAO, S.,
BOTNEY, M. D., MECHAM, R. P., WELGUS, H. G. & PARKS, W.
C. 1995. Production and localization of 92-Kilodalton gelatinase in
abdominal aortic aneurysms. Journal of Clinical Investigation, 96, 318
- 326.
THOMPSON, S. G., ASHTON, H. A., GAO, L. & SCOTT, R. A. P. 2009.
Screening men for abdominal aortic aneurysm: 10 year mortality and
cost effectiveness results from the randomised Multicentre Aneurysm
Screening Study. BMJ, 338.
THUBRIKAR, M. J., LABROSSE, M., ROBICSEK, F., AL-SOUDI, J. &
FOWLER, B. 2001. Mechanical properties of abdominal aortic
aneurysm wall. Journal of Medical Engineering & Technology, 25, 133
- 142.
TIERNEY, A. P., DUMONT, D. M., CALLANAN, A., TRAHEY, G. E. &
MCGLOUGHLIN, T. M. 2010. ACOUSTIC RADIATION FORCE
IMPULSE IMAGING ON EX VIVO ABDOMINAL AORTIC
ANEURYSM MODEL. Ultrasound in Medicine and Biology, 36, 821-
832.
TOUROO, J. S. & WILLIAMS, S. K. 2012. A tissue-engineered aneurysm
model for evaluation of endovascular devices. Journal of biomedical
materials research. Part A, 100, 3189-3196.
TRACHET, B., BOLS, J., DEGROOTE, J., VERHEGGHE, B.,
STERGIOPULOS, N., VIERENDEELS, J. & SEGERS, P. 2015. An
animal-specific FSI model of the abdominal aorta in anesthetized mice.
Ann Biomed Eng, 43, 1298-309.
254
TROLLOPE, A., MOXON, J. V., MORAN, C. S. & GOLLEDGE, J. 2011.
Animal models of abdominal aortic aneurysm and their role in furthering
management of human disease. Cardiovascular Pathology, 20, 114 -
123.
TSUI, J. C. 2010. Experimental models of abdominal aortic aneurysms. The
Open Cardiovascular Medicine Journal, 4, 221-230.
TSURUDA, T., KATO, J., HATAKEYAMA, K., KOJIMA, K., YANO, M.,
YANO, Y., NAKAMURA, K., NAKAMURA-UCHIYAMA, F.,
MATSUSHIMA, Y., IMAMURA, T., ONITSUKA, T., ASADA, Y.,
NAWA, Y., ETO, T. & KITAMURA, K. 2008. Adventitial mast cells
contribute to pathogenesis in the progression of abdominal aortic
aneurysm. Circulation Research, 102, 1368 - 1377.
TURNBULL, I. C., HADRI, L., RAPTI, K., SADEK, M., LIANG, L. F., SHIN,
H. J., COSTA, K. D., MARIN, M. L., HAJJAR, R. J. & FARIES, P. L.
2011. Aortic Implantation of Mesenchymal Stem Cells after Aneurysm
Injury in a Porcine Model. Journal of Surgical Research, 170, E179-
E188.
TWIGGER, S., PRUITT, K., FERNÁNDEZ-SUÁREZ, X., KAROLCHIK, D.,
WORLEY, K., MAGLOTT, D., BROWN, G., WEINSTOCK, G.,
GIBBS, R., KENT, J., BIRNEY, E. & JACOB, H. 2008. What
everybody should know about the rat genome and its online resources.
Nature Genetics, 40, 523-527.
VAISHNAV, R. N., YOUNG, J. T., JANICKI, J. S. & PATEL, D. J. 1972.
Nonlinear Anisotropic Elastic Properties of the Canine Aorta.
Biophysical Journal, 12, 1008-1027.
VANDE GEEST, J. P., SCHMIDT, D. E., SACKS, M. S. & VORP, D. A. 2008.
The effects of anisotropy on the stress analyses of patient-specific
abdominal aortic aneurysms. Ann Biomed Eng, 36, 921-32.
VERBIN, C., DONAYRE, C., KOPCHOK, G., SCOCCIANTI, M. & WHITE,
R. A. 1995. ANTERIOR PATCH AORTIC-ANEURYSM MODEL
FOR THE STUDY OF ENDOLUMINAL GRAFTS. Journal of
Investigative Surgery, 8, 381-388.
VOGEL, V. & SHEETZ, M. 2006. Local force and geometry sensing regulate
cell functions. Nature Reviews Molecular Cell Biology, 7, 265-275.
VOLLMAR, J. F., PAUSCHINGER, P., PAES, E., HENZE, E. & FRIESCH,
A. 1989. AORTIC ANEURYSMS AS LATE SEQUELAE OF
ABOVE-KNEE AMPUTATION. The Lancet, 334, 834-835.
VORP, D. A. 2007. BIOMECHANICS OF ABDOMINAL AORTIC
ANEURYSM. Journal of biomechanics, 40, 1887-1902.
VORP, D. A. & GEEST, J. P. V. 2005. Biomechanical Determinants of
Abdominal Aortic Aneurysm Rupture. Arteriosclerosis, Thrombosis,
and Vascular Biology, 25, 1558-1566.
255
VORP, D. A., RAGHAVAN, M. L., MULUK, S. C., MAKAROUN, M. S.,
STEED, D. L., SHAPIRO, R. & WEBSTER, M. W. 1996. Wall strength
and stiffness of aneurysmal and nonaneurysmal abdominal aorta. Ann N
Y Acad Sci, 800, 274-6.
VORP, D. A., SCHIRO, B. J., EHRLICH, M. P., JUVONEN, T. S., ERGIN, M.
A. & GRIFFITH, B. P. 2003. Effect of aneurysm on the tensile strength
and biomechanical behavior of the ascending thoracic aorta. The Annals
of Thoracic Surgery, 75, 1210-1214.
WAHLGREN, C. M., LARSSON, E., MAGNUSSON, P. K. E., HULTGREN,
R. & SWEDENBORG, J. 2010. Genetic and environmental
contributions to abdominal aortic aneurysm development in a twin
population. Journal of Vascular Surgery, 51, 3-7.
WANHAINEN, A., MANI, K. & GOLLEDGE, J. 2016. Surrogate Markers of
Abdominal Aortic Aneurysm Progression. Arteriosclerosis Thrombosis
and Vascular Biology, 36, 236-244.
WEBB, R. C. 2003. SMOOTH MUSCLE CONTRACTION AND
RELAXATION. Advances in Physiology Education, 27, 201-206.
WERNIG, F., MAYR, M. & XU, Q. 2003. Mechanical Stretch-Induced
Apoptosis in Smooth Muscle Cells Is Mediated by β1-Integrin Signaling
Pathways. Hypertension, 41, 903-911.
WHITBREAD, T., BIRCH, P., ROGERS, S., MAJEED, A., ROCHESTER, J.,
BEARD, J. D. & GAINES, P. 1996. A new animal model for abdominal
aortic aneurysms: Initial results using a multiple-wire stent. European
Journal of Vascular and Endovascular Surgery, 11, 90-97.
WHITTAKER, P. & CANHAM, P. B. 1991. Demonstration of quantitative
fabric analysis of tendon collagen using two-dimensional polarized light
microscopy. Matrix, 11, 56-62.
WHITTAKER, P., KLONER, R. A., BOUGHNER, D. R. & PICKERING, J.
G. 1994. Quantitative assessment of myocardial collagen with
picrosirius red staining and circularly polarized light. Basic Res Cardiol,
89, 397-410.
WILSON, J. S., VIRAG, L., DI ACHILLE, P., KARŠAJ, I. & HUMPHREY, J.
D. 2013. Biochemomechanics of Intraluminal Thrombus in Abdominal
Aortic Aneurysms. Journal of Biomechanical Engineering, 135,
0210111-02101114.
WILSON, W. R. W., ANDERTON, M., CHOKE, E. C., DAWSON, J.,
LOFTUS, I. M. & THOMPSON, M. M. 2008. Elevated plasma MMP1
and MMP9 are associated with abdominal aortic aneurysm rupture.
European Journal of Vascular and Endovascular Surgery, 35, 580 -
584.
WORTH, N. F., ROLFE, B. E., SONG, J. & CAMPBELL, G. R. 2001a.
Vascular smooth muscle cell phenotypic modulation in culture is
256
associated with reorganisation of contractile and cytoskeletal proteins.
Cell Motil Cytoskeleton, 49, 130-45.
WORTH, N. F., ROLFE, B. E., SONG, J. & CAMPBELL, G. R. 2001b.
Vascular smooth muscle cell phenotypic modulation in culture is
associated with reorganisation of contractile and cytoskeletal proteins.
Cell Motility and the Cytoskeleton, 49, 130-145.
XIE, C.-Q., RITCHIE, R. P., HUANG, H., ZHANG, J. & CHEN, Y. E. 2011.
Smooth muscle cell differentiation in vitro: Models and underlying
molecular mechanisms. Arteriosclerosis, thrombosis, and vascular
biology, 31, 1485-1494.
XIONG, J., WANG, S. M., ZHOU, W. & WU, J. G. 2008. Measurement and
analysis of ultimate mechanical properties, stress-strain curve fit, and
elastic modulus formula of human abdominal aortic aneurysm and
nonaneurysmal abdominal aorta. Journal of Vascular Surgery, 48, 189-
195.
YAZDANI, S. K. & BERRY, J. L. 2009. Development of an In Vitro System
to Assess Stent-induced Smooth Muscle Cell Proliferation: A Feasibility
Study. Journal of Vascular and Interventional Radiology, 20, 101-106.
ZARAGOZA, C., GOMEZ-GUERRERO, C., MARTIN-VENTURA, J. L.,
BLANCO-COLIO, L., LAVIN, B., MALLAVIA, B., TARIN, C., MAS,
S., ORTIZ, A. & EGIDO, J. 2011. Animal models of cardiovascular
diseases. Journal of Biomedicine and Biotechnology, 2011.
ZATINA, M. A., ZARINS, C. K., GEWERTZ, B. L. & GLAGOV, S. 1984.
Role of medial lamellar architecture in the pathogenesis of aortic
aneurysms. Journal of Vascular Surgery, 1, 442-448.
ZEINALI-DAVARANI, S., CHOW, M.-J., TURCOTTE, R. & ZHANG, Y.
2013. Characterization of Biaxial Mechanical Behavior of Porcine Aorta
under Gradual Elastin Degradation. Annals of Biomedical Engineering,
41, 1528-1538.
ZHANG, L. L. & WANG, Y. 2015. B lymphocytes in abdominal aortic
aneurysms. Atherosclerosis, 242, 311-317.
ZHANG, M.-J., ZHOU, Y., CHEN, L., WANG, Y.-Q., WANG, X., PI, Y.,
GAO, C.-Y., LI, J.-C. & ZHANG, L.-L. 2015. An overview of potential
molecular mechanisms involved in VSMC phenotypic modulation.
Histochemistry and Cell Biology, 145, 119-130.
ZHANG, W., GUO, X. & KASSAB, G. S. 2008. A Generalized Maxwell Model
for Creep Behavior of Artery Opening Angle. Journal of biomechanical
engineering, 130, 054502-054502.
ZIDI, M. & ALLAIRE, E. 2015. Mechanical behavior of abdominal aorta
aneurysm in rat model treated by cell therapy using mesenchymal stem
cells. Biomech Model Mechanobiol, 14, 185-94.