Embed Size (px)
Citation preview
Synthesis of Polyaniline Composites and Their Applications
A dissertation submitted to the Institute of Chemical Sciences, Bahauddin
Zakariya University, Multan in partial fulfillment of the
requirements for the degree of
Doctor of Philosophy
In
Physical Chemistry
By
Muhammad Aamir
ROLL NO. Ph.D.C-09-05
Reg. #: 99-icm-7
(2016)

Institute of Chemical Sciences, Bahauddin Zakariya University
Multan, Pakistan-2016
Dedicated to:

MY GREAT AND LOVING FATHER
ABDUL SALAM
AND MY KIND AND LOVING MOTHER FOR HER
MORAL SUPPORT, PRAYERS.
Declaration of Candidate

I hereby declare that the work described in this thesis was carried out by me under the supervision of
Dr. Ghazala Yasmeen, Associate Professor and Dr. Muhammad Naeem Ashiq, Associate
Professor of Institute of Chemical Sciences Bahauddin Zakariya University, Multan.
I also hereby declare that the substance of this thesis has neither been submitted elsewhere nor is
being concurrently submitted for any other degree.
I further declare that the thesis embodies the result of my own research or advanced studies and that
it has been composed by me. Where appropriate, I have made acknowledgement to the work of
others.
Muhammad Aamir
Declaration of Institute
This is to certify that this dissertation entitled “Synthesis of Polyaniline Composites and Their
Applications” submitted by Mr. Muhammad Aamir is accepted in its present form by the Institute
of Chemical Sciences Bahauddin Zakariya University Multan-Pakistan, as satisfying the partial
requirement for the degree of Doctor of Philosophy in Physical Chemistry.
Submitted through:
SupervisorI:
Dr. Ghazala Yasmeen
Associate Professor
Institute of Chemical Sciences
Bahauddin Zakariya University Multan

Supervisor II:
Dr. Muhammad Naeem Ashiq
Associate Professor
Institute of Chemical Sciences
Bahauddin Zakariya University Multan
Acknowledgements

All praises are for almighty ALLAH, the most kind, magnificent and merciful who gave me
strength, power, knowledge and above all good health to complete this work amicably. This work is
acknowledged to many people whose contribution to accomplish this work has been marvelous;
especially, my supervisors Dr. Ghazala Yasmeen and Dr. Muhammad Naeem Ashiq for
accepting me, giving me intellectual freedom in my work, engaging me in new ideas, and
demanding a high quality of work in all my endeavors.
I would like to thank to ICS (Institute of Chemical Sciences) of Bahauddin Zakaryia University
Multan Pakistan for providing me an opportunity to complete my Ph. D and administrative staff for
their cooperation and facilitating me during PhD studies.
I would like to thank my father, mother, brother, sister, and my wife for their endless love,
continuous moral supports, and helping me achieve this feat in my academic career.
I would like to thank Fahad Ehsan and Sana for their help in my research work. I would like to
thank my friend Sajid Abbas for his continuous motivations and supports. I am really grateful to all
of you.
Muhammad Aamir
Sr. No. Topic Page #
Abstract
Chapter 1 1-84
1. Introduction 01
1.1. Conducting polymers 01
1.1.1. Historical Background of Conducting Polymers 02
1.1.2. Conduction Mechanism 02
1.1.3. Applications of Conducting Polymers 03
1.1.3.1. Biosensors 04
1.1.3.2. Supercapacitors 05
1.1.3.3. Field Effect Transistors (FET). 06
1.1.3.4. Light Emitting Diodes (LED). 07
1.1.3.5. Solar Cell 08
1.1.4. Polyaniline 08
1.1.4.1. Structure of PANI 09
1.1.4.2. Applications of Polyaniline 11
1.2. Nanomaterial 12
1.2.1. Multiferroics 13
1.2.2. Ferrites. 14
1.2.2.1. Spinel Ferrites 15
1.2.2.2. Hexagonal Ferrites 18
1.2.2.3. Garnets 18
1.2.2.4. Ferrites Categories 18
1.2.2.4.1. Soft Ferrites 18
1.2.2.4.2. Hard Ferrites 19
1.2.3. Uses of Nanomaterials 23
1.2.4. Applications of Nanoparticles in Biology and Medicine 27
1.3. Polymer Nanomatrials Composite 29
1.4. Dyes. 35
1.4.1. Classification of Dyes. 35
1.4.2. Usage Classification. 35
1.4.3. Chemical Classification. 36
1.4.4. Dyes Importance and Applications 36
1.4.5. Hazardous Effects. 39
1.4.5.1.Toxicity of Methylene Blue and Methylene Orange 40
1.4.5.2.Removal Technique 41
1.5. Photodegradation 41
1.5.1. Mechanism of Photodegradation 43
1.6. Aim of Work 47
References 49
Chapter 2 85-94
2. Experimental 85
2.1.Chemicals. 85
2.2.Preparation of Nanomaterial 85
2.3.Preparation of Composite 86
2.4.Characterization 86
2.3.1. X-ray Diffraction (XRD) 86
2.3.2. Scanning Electron Microscopy (SEM) 88
2.3.3. UV-Vis Spectroscopy 88
2.3.4. X-ray Photoelectron Spectrometer (XPS) 89
2.3.5. Fourier Transform Infrared Spectroscopy (FTIR) 90
2.3.6. Photo-degradation Experiment. 91
References 93
Chapter 3 95-159
3. Results and discussion 95
3.1. UV/Visible spectroscopy 96
3.2. FTIR study 104
3.3. XRD 109
3.4. Scanning Electron Microscopy 115
3.5. XPS Study 120
3.6. BET 127
3.7. Photodegradation Study of Dyes 129
3.1.1. Influence of Reaction Time. 128
3.1.2. Effect of Nanomaterial (%) Age in Composite 138
3.1.3. Kinetic 140
Conclusion 154
Reference 156
Index of Figures
Figure No. Caption Page #
Fig. 1(a). UV/Visible spectra XRD patterns for PANI, nanomaterial and
PANI/NiFe1.2Zr0.4Co0.4O4 composites.
101
Fig. 1(b). UV/Visible spectra for PANI, nanomaterial and PANI/ NiFeZr0.5Co0.5O4
composites.
102
Fig. 1(C). UV/Visible spectra for PANI, nanomaterial and
PANI/BiAl0.3Mn0.3Fe0.4O3 composites.
103
Fig. 2(a). FTIR spectra of PANI and PANI/nanomaterial composite of
NiFe1.2Zr0.4Co0.4O4.
106
Fig. 2(b). FTIR spectra of PANI and PANI/nanomaterial composite of
NiFeZr0.5Co0.5O4.
107
Fig. 2(c). FTIR spectra of PANI and PANI/nanomaterial composite of
BiAl0.3Mn0.3Fe0.4O3.
108
Fig. 3(a). XRD patterns for PANI, nanomaterial and PANI/ NiFe1.2Zr0.4Co0.4O4
composites.
112
Fig. 3(b). XRD patterns for PANI, nanomaterial and PANI/ NiFeZr0.5Co0.5O4
composites.
113
Fig. 3(C). XRD patterns for PANI, nanomaterial and PANI/BiAl0.3Mn0.3Fe0.4O3
composites.
114
Fig. 4(a). SEM images of PANI, 117
Fig. 4(b). SEM images of Nanomaterial(NiFe1.2Zr0.4Co0.4O4) 117
Fig. 4(c). SEM images of composite containing 12.5% (NiFe1.2Zr0.4Co0.4O4) and
87.5%(PANI),
117
Fig. 4(d). SEM images of composite containing 25% (NiFe1.2Zr0.4Co0.4O4) and
75% (PANI)
117
Fig. 4(e). SEM images of composite containing 37.5% (NiFe1.2Zr0.4Co0.4O4) and
62.5% (PANI)
117
Fig. 4(f). SEM images of composite containing 50% (NiFe1.2Zr0.4Co0.4O4) and
50% (PANI)
117
Fig. 5(a). SEM images for PANI, 118
Fig. 5(b). SEM images for Nanomaterial(NiFeZrCoO4) 118
Fig. 5(c). SEM images of composite containing 12.5% (NiFeZr0.5Co0.5O4) and
87.5%(PANI),
118
Fig. 5(d). SEM images of composite containing 25% (NiFeZr0.5Co0.5O4) and 75%
(PANI)
118
Fig. 5(e). SEM images of composite containing 37.5% (NiFeZr0.5Co0.5O4) and 118
62.5% (PANI)
Fig. 5(f). SEM images of composite containing 50% (NiFeZr0.5Co0.5O4) and 50%
(PANI)
118
Fig. 6(a). SEM images for PANI 119
Fig. 6(b). SEM images for Nanomaterial(BiAl0.3Mn0.3Fe0.4O3) 119
Fig. 6(c). SEM images of composite containing 12.5% (BiAl0.3Mn0.3Fe0.4O3) and
87.5%(PANI),
119
Fig. 6(d). SEM images of composite containing 25% (BiAl0.3Mn0.3Fe0.4O3) and
75% (PANI)
119
Fig. 6(e). SEM images of composite containing 37.5% (BiAl0.3Mn0.3Fe0.4O3) and
62.5% (PANI)
119
Fig. 6(f). SEM images of composite containing 50% (BiAl0.3Mn0.3Fe0.4O3) and
50% (PANI)
119
Fig. 7(a). XPS spectra for Ni2p 123
Fig. 7(b). XPS spectra for Zr3d 123
Fig. 7(c). XPS spectra for Co2p 123
Fig. 7(d). XPS spectra for Fe2p 123
Fig. 7(e). XPS spectra for C1s 123
Fig. 7(f). XPS survey for PANI composite with 50% NiFe1.2Zr0.4Co0.4O4. 124
Fig. 8(a). XPS spectra for Ni2p 125
Fig. 8(b). XPS spectra for Zr3d 125
Fig. 8(c). XPS spectra for Co2p 125
Fig. 8(d). XPS spectra for Fe2p 125
Fig. 8(e). XPS spectra for C1s 125
Fig. 8(f). XPS survey for PANI composite with 50% NiFeZr0.5Co0.5O4. 126
Fig. 9(a). Influence of time on the photodegradation of MO by PANI/
NiFeZr0.5Co0.5O4Composites
135
Fig. 9(b). Influence of time on the photodegradation of MB by PANI/
NiFe1.2Zr0.4Co0.4O4 Composites
135
Fig. 9(c). Influence of time on the photodegradation of MO by PANI/
NiFeZr0.5Co0.5O4Composites
136
Fig. 9(d). Influence of time on the photodegradation of MB by PANI/
NiFeZr0.5Co0.5O4Composites
136
Fig. 9(e). Influence of time on the photodegradation of MO by PANI/
BiAl0.3Mn0.3Fe0.4O3Composites
137
Fig. 9(f). Influence of time on the photodegradation of MB by PANI/ 137
BiAl0.3Mn0.3Fe0.4O3Composites
Fig. 10(a). First-order kinetic plot for the photodegradation of MO by PANI/
NiFe1.2Zr0.4Co0.4O4 Composites
148
Fig. 11(a). Second-order kinetic plot for the photodegradation of MO by PANI/
NiFe1.2Zr0.4Co0.4O4 Composites
148
Fig. 10(b). First-order kinetic plot for the photodegradation of MB by PANI/
NiFe1.2Zr0.4Co0.4O4 Composites
149
Fig. 11(b). Second-order kinetic plot for the photodegradation of MB by PANI/
NiFe1.2Zr0.4Co0.4O4 Composites
149
Fig. 10(c). First-order kinetic plot for the photodegradation of MO by PANI/
NiFeZr0.5Co0.5O4Composites
150
Fig. 11(c). Second-order kinetic plot for the photodegradation of MO by PANI/
NiFeZr0.5Co0.5O4Composites
150
Fig. 10(d). First-order kinetic plot for the photodegradation of MB by PANI/
NiFeZr0.5Co0.5O4Composites
151
Fig. 11(d). Second-order kinetic plot for the photodegradation of MB by PANI/
NiFeZr0.5Co0.5O4Composites
151
Fig. 10(e). First-order kinetic plot for the photodegradation of MO by PANI/
BiAl0.3Mn0.3Fe0.4O3Composites
152
Fig. 11(e). Second-order kinetic plot for the photodegradation of MO by PANI/
BiAl0.3Mn0.3Fe0.4O3Composites
152
Fig. 10(f). First-order kinetic plot for the photodegradation of MB by PANI/
BiAl0.3Mn0.3Fe0.4O3Composites
153
Fig. 11(f). Second-order kinetic plot for the photodegradation of MB. 153
Index of Tables
Table No. Caption Page #
Table. 1(a) The amount of element (atomic%) for PANI/
NiFe1.2Zr0.4Co0.4O4Composites investigated from XPS analysis
122
Table. 1(b) The amount of element (atomic%) for PANI/
NiFeZr0.5Co0.5O4Composites investigated from XPS analysis
122
Table. 2(a) BET and Langmuir Surface area and maximum pore size of PANI/
NiFe1.2Zr0.4Co0.4O4Composites
127
Table. 2(b) BET and Langmuir Surface area and maximum pore size of PANI/
NiFeZr0.5Co0.5O4Composites.
128
Table. 2(c) BET and Langmuir Surface area and maximum pore size of PANI/
BiAl0.3Mn0.3Fe0.4O3Composites
128
Table. 3(a) MO %age Degradation with time. 132
Table. 3(b) MB % degradation with time. 132
Table. 3(c) MO %age Degradation with time. 133
Table. 3(d) MB % degradation with time. 133
Table. 3(e) MO %age Degradation with time 134
Table. 3(f) MB % degradation with time 134
Table. 4(a)
First-order specific rate constant for k1, second-order specific rate
constant k2, and correlation coefficient R2
145
Table. 4(b)
First-order specific rate constant for k1, second-order specific rate
constant k2, and correlation coefficient R2
145
Table. 4(c)
First-order specific rate constant for k1, second-order specific rate
constant k2, and correlation coefficient R2
146
Table 4(d)
First-order specific rate constant for k1, second-order specific rate
constant k2, and correlation coefficient R2
146
Table. 4(e)
First-order specific rate constant for k1, second-order specific rate
constant k2, and correlation coefficient R2
147
Table. 4(f)
First-order specific rate constant for k1, second-order specific rate
constant k2, and correlation coefficient R2
147

List of Abbreviation
PANI Polyaniline
MB Methylene Blue
MO Methyl Orange
NPs Nanoparticles
Abstract
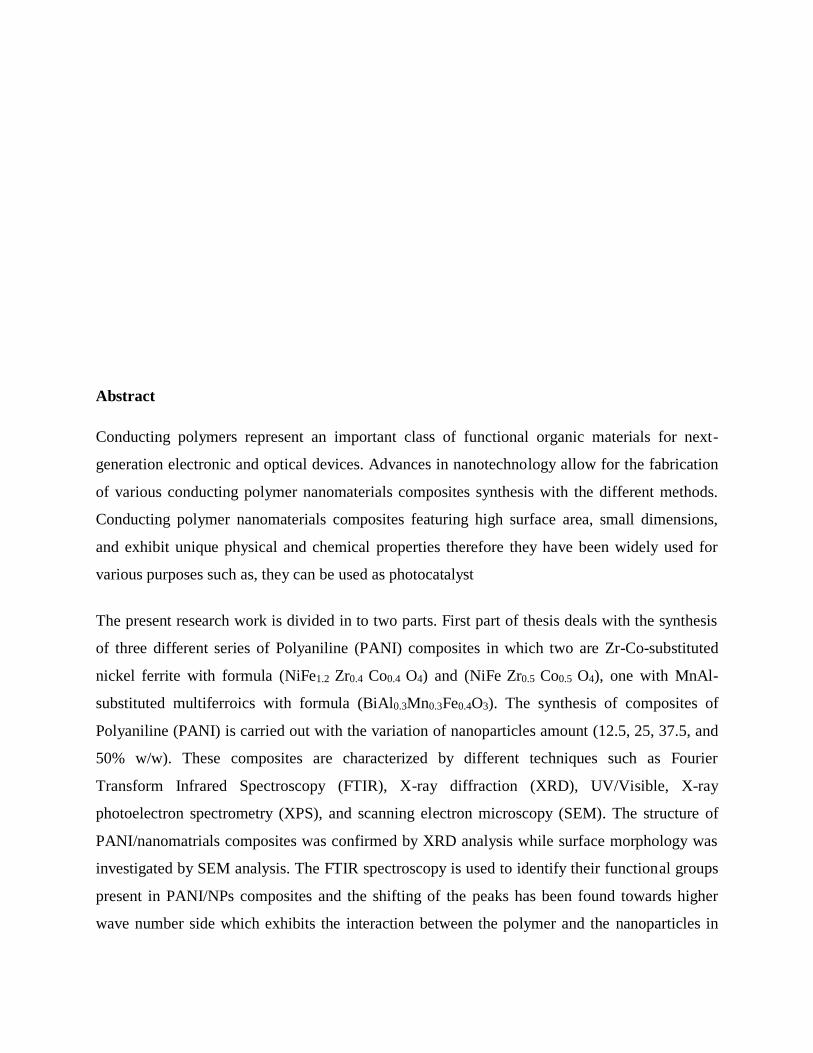
Conducting polymers represent an important class of functional organic materials for next-
generation electronic and optical devices. Advances in nanotechnology allow for the fabrication
of various conducting polymer nanomaterials composites synthesis with the different methods.
Conducting polymer nanomaterials composites featuring high surface area, small dimensions,
and exhibit unique physical and chemical properties therefore they have been widely used for
various purposes such as, they can be used as photocatalyst
The present research work is divided in to two parts. First part of thesis deals with the synthesis
of three different series of Polyaniline (PANI) composites in which two are Zr-Co-substituted
nickel ferrite with formula (NiFe1.2 Zr0.4 Co0.4 O4) and (NiFe Zr0.5 Co0.5 O4), one with MnAl-
substituted multiferroics with formula (BiAl0.3Mn0.3Fe0.4O3). The synthesis of composites of
Polyaniline (PANI) is carried out with the variation of nanoparticles amount (12.5, 25, 37.5, and
50% w/w). These composites are characterized by different techniques such as Fourier
Transform Infrared Spectroscopy (FTIR), X-ray diffraction (XRD), UV/Visible, X-ray
photoelectron spectrometry (XPS), and scanning electron microscopy (SEM). The structure of
PANI/nanomatrials composites was confirmed by XRD analysis while surface morphology was
investigated by SEM analysis. The FTIR spectroscopy is used to identify their functional groups
present in PANI/NPs composites and the shifting of the peaks has been found towards higher
wave number side which exhibits the interaction between the polymer and the nanoparticles in
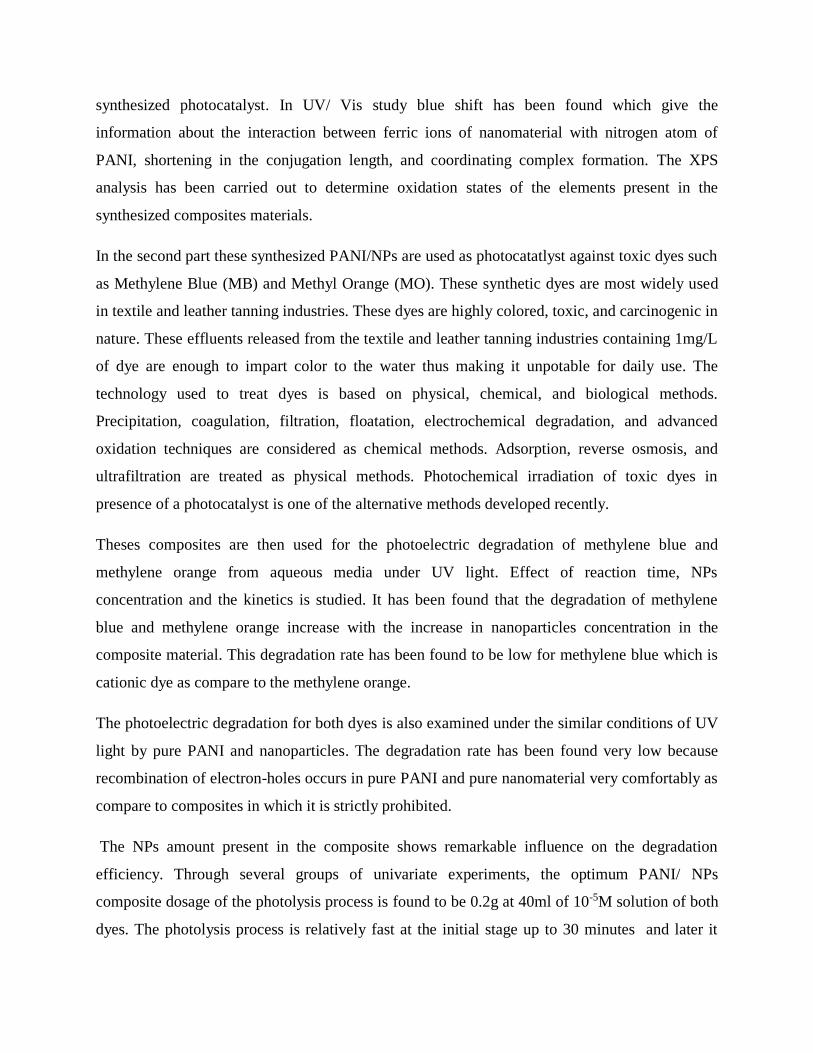
synthesized photocatalyst. In UV/ Vis study blue shift has been found which give the
information about the interaction between ferric ions of nanomaterial with nitrogen atom of
PANI, shortening in the conjugation length, and coordinating complex formation. The XPS
analysis has been carried out to determine oxidation states of the elements present in the
synthesized composites materials.
In the second part these synthesized PANI/NPs are used as photocatatlyst against toxic dyes such
as Methylene Blue (MB) and Methyl Orange (MO). These synthetic dyes are most widely used
in textile and leather tanning industries. These dyes are highly colored, toxic, and carcinogenic in
nature. These effluents released from the textile and leather tanning industries containing 1mg/L
of dye are enough to impart color to the water thus making it unpotable for daily use. The
technology used to treat dyes is based on physical, chemical, and biological methods.
Precipitation, coagulation, filtration, floatation, electrochemical degradation, and advanced
oxidation techniques are considered as chemical methods. Adsorption, reverse osmosis, and
ultrafiltration are treated as physical methods. Photochemical irradiation of toxic dyes in
presence of a photocatalyst is one of the alternative methods developed recently.
Theses composites are then used for the photoelectric degradation of methylene blue and
methylene orange from aqueous media under UV light. Effect of reaction time, NPs
concentration and the kinetics is studied. It has been found that the degradation of methylene
blue and methylene orange increase with the increase in nanoparticles concentration in the
composite material. This degradation rate has been found to be low for methylene blue which is
cationic dye as compare to the methylene orange.
The photoelectric degradation for both dyes is also examined under the similar conditions of UV
light by pure PANI and nanoparticles. The degradation rate has been found very low because
recombination of electron-holes occurs in pure PANI and pure nanomaterial very comfortably as
compare to composites in which it is strictly prohibited.
The NPs amount present in the composite shows remarkable influence on the degradation
efficiency. Through several groups of univariate experiments, the optimum PANI/ NPs
composite dosage of the photolysis process is found to be 0.2g at 40ml of 10-5M solution of both
dyes. The photolysis process is relatively fast at the initial stage up to 30 minutes and later it

become slow, moreover the degradation of both dyes is in accordance with the first-order kinetic
equation.
Chapter 1
This chapter covers the general introduction of polymers, conducting polymers, nanomatrials,
ferrites nanomaterials, polymer nanomatrials composite, photodegradation and the mechanism of
photodegradation.
1. Introduction
Polymer is a large molecule (macromolecule) consists of repeating structural units joined by
covalent chemical bonds. The word is derived from the Greek words (poly), meaning "many"
and mer meaning "part"[1].
1.2. Conducting Polymers
Conductive polymers are unique class of materials which may be named as synthetic metals who
associates the electronic properties of semiconductors and metals with the chemical applications,
electrochemical characteristics and mechanical features of polymers [2]. These organic materials
are true metallic conductors or semiconductors who conduct electricity. Their biggest advantage
is their processibility. They can be defining as; these are synthetics plastics in which high
electrical conductivity is associated with the mechanical properties like elasticity, malleability,
flexibility, etc. of plastics. It is also possible to polish up their properties by using the different
methods of organic synthesis [3].
The characteristics such as electrical conductivity and electrochemical characterizations (like
metals), mechanical strength and easiness of processing (like polymers) and option of both
chemical and electrochemical synthesis, make them valuable in extensive area of applications
[4].
1.1.2.1. Historical Background of Conducting Polymers
Excellent quantities of researches are in progress since 1977, when it became possible to conduct
the electricity from the conjugated polymer polyacetylene by doping with halogen [5-7]. It was
supported by Shirakawa et al when he successfully synthesis the conducting polymer
polyacetylene in 1977 [9]. Electrically conducting polymers have their interesting potential uses
in various fields of electrical and mechanical also, therefore they have got great attraction for the
new researchers [2]. Twenty five years of research work and 2000 Nobel Prize in Chemistry in
this field shows the importance of conducting polymers [8]. These have become one of the most
attractive subjects of investigations in the last few decades [10].
1.1.2.2. Conduction Mechanism
The conducting polymers which consist on large molecules have characteristics of interchanging
the single and double bond and electrons can travel from one end to the other end of polymer
chain through the stretched p-orbital system [11]. In this way they get unique optical and
electrical properties due to their π electron delocalization along the polymer chain [12].
Conducting polymers have sp2 hybridized π-conjugated polymer with a systematic alternating
system of single (C-C) and double (C=C) bonds leads to a lower band gap energy, Eg in the
delocalized π system [13]. Semiconducting and metallic organic polymers conductivity
generated due to some extent of sp2 hybridized linear carbon chains. Backbone of sp2 hybridized
carbons form by three in plane sigma-orbitals, one sigma-orbital is bonded to the hydrogen atom
and remaining two are bonded to the adjacent carbons atoms. The conductive polymers special
properties are generated by the fourth electron which remains in the Pz orbital and is decoupled
with the backbone sigma orbitals. In case of classical polymers, which behaved like electrical
insulators, such as polyethylenes, all valence electrons are engaged in sp3 hybridized covalent
bonded electrons, therefore there will be no movable electrons will available to participate in
electronic transport [14]. In the undoped state of conjugated polymers energy gap could be more
than 2 eV, this energy gap is huge in case of thermally activated conduction. Due to this reason
polythiophenes, polyacetylenes which are conjugated polymers shows low electrical conductivity
in the range of 10-10 to 10-8 S/cm in their undoped form. Even at very low level of doping (< 1 %)
the electrical conductivity increases in about 10-1 S/cm which are several orders of magnitude as
compare to pure polymer material. Therefore for different conduction polymers doping will
bring fullness of the conductivity at values near around 100-10000 S/cm. Highest reported value
for the conductivity of stretch oriented polyacetylene till now, with definite values, is around
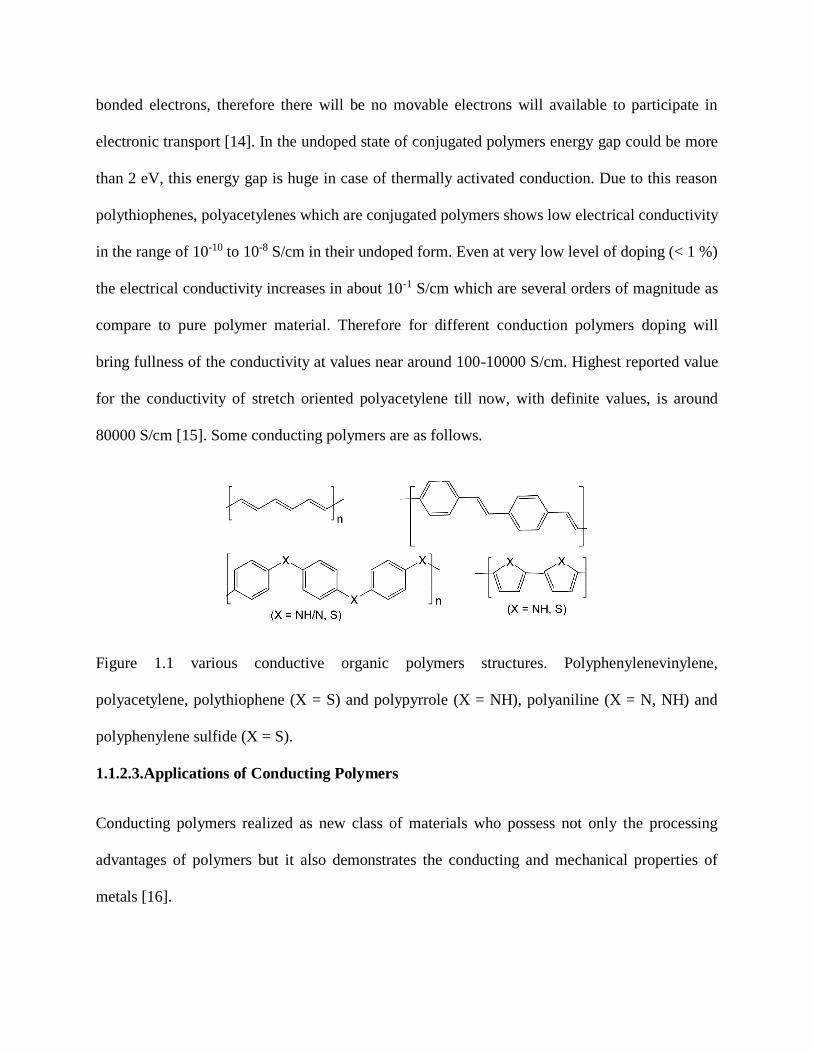
80000 S/cm [15]. Some conducting polymers are as follows.
Figure 1.1 various conductive organic polymers structures. Polyphenylenevinylene,
polyacetylene, polythiophene (X = S) and polypyrrole (X = NH), polyaniline (X = N, NH) and
polyphenylene sulfide (X = S).
1.1.2.3.Applications of Conducting Polymers
Conducting polymers realized as new class of materials who possess not only the processing
advantages of polymers but it also demonstrates the conducting and mechanical properties of
metals [16].
As well, conjugated conduction polymers have numerous applications in all field of life. Some of
their current prospective and commercial applications of these polymers are supercapacitors, fuel
cells, storage batteries, electrolytic capacitors, [17], ion-specific membranes, sensors,
electrochromic displays, biosensors and chemical sensors, corrosion protection, transparent
conductors, electromagnetic shutters, EMI shielding, gas separation membranes, anti-static films
and fibers, conductive textiles, photoconductive switching, conductor/insulator shields, non-
linear optics, conductive adhesives and inks [18], electronic devices, and electroluminescence
etc. [19-21]. For the devices based on conducting polymers such as switchable windows and
mirrors, dynamic camouflage and electrochromic, have made the conducting polymer a new
center of research. This is the reason that all electro-active and conducting polymers can be
easily synthesis as compare to inorganic electrochromic materials and potentially electrochromic
materials, even the advantage of high degree of color tailorability is also suggested [22].
Conducting polymers application to use in some modern instruments is also discussed
1.1.3.1. Biosensors
The device in which biological sensing element is integrated within or connected to or transducer
is called biosensor. Its purpose is to generate digital electronic signals, and these digital
electronic signals will be related to the concentration of particular chemical [23].
Conductive polymers based biosensors have been used to sense an inducible nitric oxide
synthesis, peroxynitrite [24], superoxide [25], NADH [26] thrombin [27], DNA [28-29],
glutamate [30], heavy metal ions [31], etc.
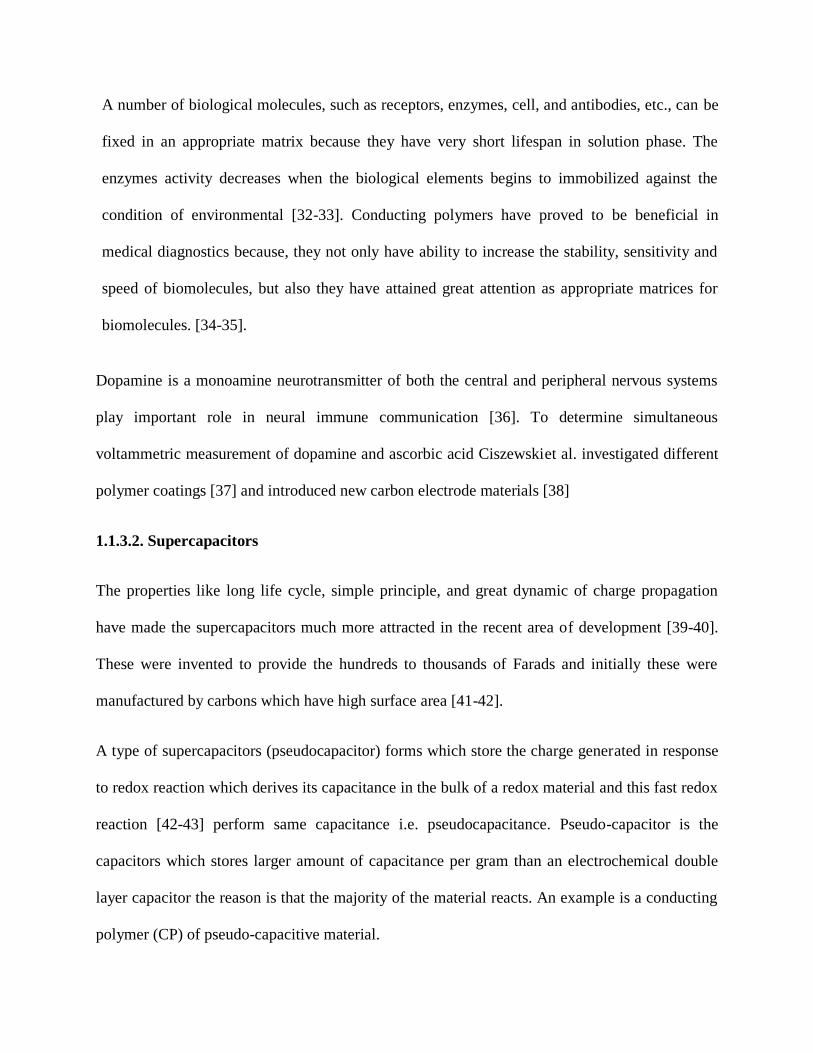
A number of biological molecules, such as receptors, enzymes, cell, and antibodies, etc., can be
fixed in an appropriate matrix because they have very short lifespan in solution phase. The
enzymes activity decreases when the biological elements begins to immobilized against the
condition of environmental [32-33]. Conducting polymers have proved to be beneficial in
medical diagnostics because, they not only have ability to increase the stability, sensitivity and
speed of biomolecules, but also they have attained great attention as appropriate matrices for
biomolecules. [34-35].
Dopamine is a monoamine neurotransmitter of both the central and peripheral nervous systems
play important role in neural immune communication [36]. To determine simultaneous
voltammetric measurement of dopamine and ascorbic acid Ciszewskiet al. investigated different
polymer coatings [37] and introduced new carbon electrode materials [38]
1.1.3.2. Supercapacitors
The properties like long life cycle, simple principle, and great dynamic of charge propagation
have made the supercapacitors much more attracted in the recent area of development [39-40].
These were invented to provide the hundreds to thousands of Farads and initially these were
manufactured by carbons which have high surface area [41-42].
A type of supercapacitors (pseudocapacitor) forms which store the charge generated in response
to redox reaction which derives its capacitance in the bulk of a redox material and this fast redox
reaction [42-43] perform same capacitance i.e. pseudocapacitance. Pseudo-capacitor is the
capacitors which stores larger amount of capacitance per gram than an electrochemical double
layer capacitor the reason is that the majority of the material reacts. An example is a conducting
polymer (CP) of pseudo-capacitive material.
Now supercapacitors are focusing on the growth of modified, new and innovative electrode
materials with better-quality and performance. Supercapacitors electrode constituents are divided
into three categories: transition metal oxides, high-surface carbons, and conducting polymers
[44-45]. Conducting polymers increase the progress of device. The increase in energy stored
while reducing self-discharge is observed, when they passes through a redox reaction to store
charge in the main part of the material. In almost all inorganic battery electrode materials these
electrodes have well kinetics than others which are pseudo-capacitive materials therefore it can
be suggested that the gap in the middle of the batteries and double-layer supercapacitors can be
filled by conducting polymers [46].
To decrease the resistance, it is combined as inorganic-organic hybrid electrode material, it is
used amended membrane which is coated by the good conductive material (conductive polymer),
in this way it completely consumes its respective advantages [47-48].
Polyaniline is the one of the best and attractive p-dopablepolymer. For redox supercapacitors
synthesis of polyaniline by electrochemical procedures has suggested as an electrode material
[49-51]. Ryuet al. [52] created two types of supercapacitors, by doping of polyaniline with LiPF6,
These are of redox nature and are symmetric type, on the bases of two LiPF6 doped polyaniline
electrodes, and second one is of the hybrid nature and asymmetric type, on the bases of PANI-
LiPF6 and active carbon electrodes.
1.1.3.3. Field Effect Transistors (FET).
Conducting polymers due to low price and easiness of processing have advantages over the
conventional materials, for example silicon and germanium. Field-effect transistors (FETs) has
manufactured by organic or polymer-based semiconductors [53]. The classification of sensors on
the bases of work function modulation composed of three kinds of Micro Fabricated Devices
which are; “Chemically sensitive Diodes, chemically sensitive capacitors, and chemically
sensitive FET’s [55]. To distinguish whether the current runs through the silicon or through the
conducting polymer they are divided in two categories; (a) thin film transistors [56] and (b)
insulated gate Field-Effect Transistors are also included [57]. For the thin film transistors, its
conductivity is generated from electric fields when the current runs throughout a conducting
polymer or by the reaction with the analytes. Therefore it was purposed that the work function
and conductivity of the conducting polymer are two things on which reply signal depends. In
both these things conductivity of the conducting polymer do not effected but the interpreted
energy states can affected the work function values [58].
1.1.3.4. Light Emitting Diodes (LED).
Polymers can also manufacture for microlithography uses [59-60]. The polymer light-emitting
diodes (PLEDs) were studied by Burroughes et al. They suggested that when inorganic and
organic materials compared for LEDs, the polymer electroluminescence (EL) devices found the
several advantages of quick response times, process ability etc. and it is also possible by
changing their structure to get fin-tun their electrical characteristics and optical properties by
applying different methods of preparation [61-63]. The excellent promising potential for polymer
light emitting-diodes usage is shown by π-conjugated polymers and their derivatives for
example, poly(p-phenylenevinylenes) [64-65], poly(dialkylfluorenes) [66], and polythiophenes
[67], these are used extensively.
High chemical solidity and structural tailorability is shown by polythiophene which is a
conjugated polymer. It can be comfortably use to exploit for manufacturing the correct structures
with the targeted areas for the different physical properties such as color emission, transition
temperatures etc. [68].
1.1.3.5. Solar Cell
Several researches have been reported which prove that conducting materials are the basic
component of solar cells [69-70]. Easy solution processing capability, low-cost production, and
large applications in electronic devices, have made the polymer solar cells more popular [69-72].
Conducting polymers materials has gain remarkable attention due to their applications in the
production and design of low prices organic electronic and photovoltaic devices.
Low prices solution processing, lesser thermal budget with fast speed of processing is only
suggested by organic photovoltaic [73]. Poly (3 hexylthiophene) is one of the best
semiconducting polymers for the polymer solar cells [74]. Moreover to get the outstanding PV
properties the mixture of poly (3-hexylthiophene) and the C60 derivative is used which give
performance outside 5 % [75-78].
1.1.4. Polyaniline
Even though a number of conducting polymers have been manufactured as well as studied, but it
is till now, one of the best polymer having the top combination of environmental stability,
excellent and control conductivity with lesser price [2]. It is also one of the best materials, among
the family of conjugated polymer, which is air and moisture resistance in its either doped form
weather it is conducting or insulating form [79-81].
For more than a hundred years it is known as ‘aniline black’. It is by product which is formed
during the electrolysis on the surface of anode as undesirable black deposited. Simple way of
synthesis, manageable electrical conductivity with good resistance against environmental
conditions make polyaniline most favorable polymer among all other conducting polymers [82].
Polyaniline has taken great attention of the scientists only since the early 1980s; it is because of
rediscovery of high electrical conductivity [83]. It has a countless variation of potential uses with
batteries, sensors, separation membranes, and antistatic coatings [07, 84].
Polyaniline has potential use as electrochromic device, as corrosion protecting paint and as
sensor also. These applications make polyaniline highly beneficial and attractive to use in
electromagnetic shielding devices, solar cells, displays, lightweight battery electrodes, and
sensors [85]. PANI possess semiconducting properties, generally with inorganic semiconductors,
in reply to exterior effects by altering particular features for example, conductivity, density,
color, permeability to gases and liquids [86]
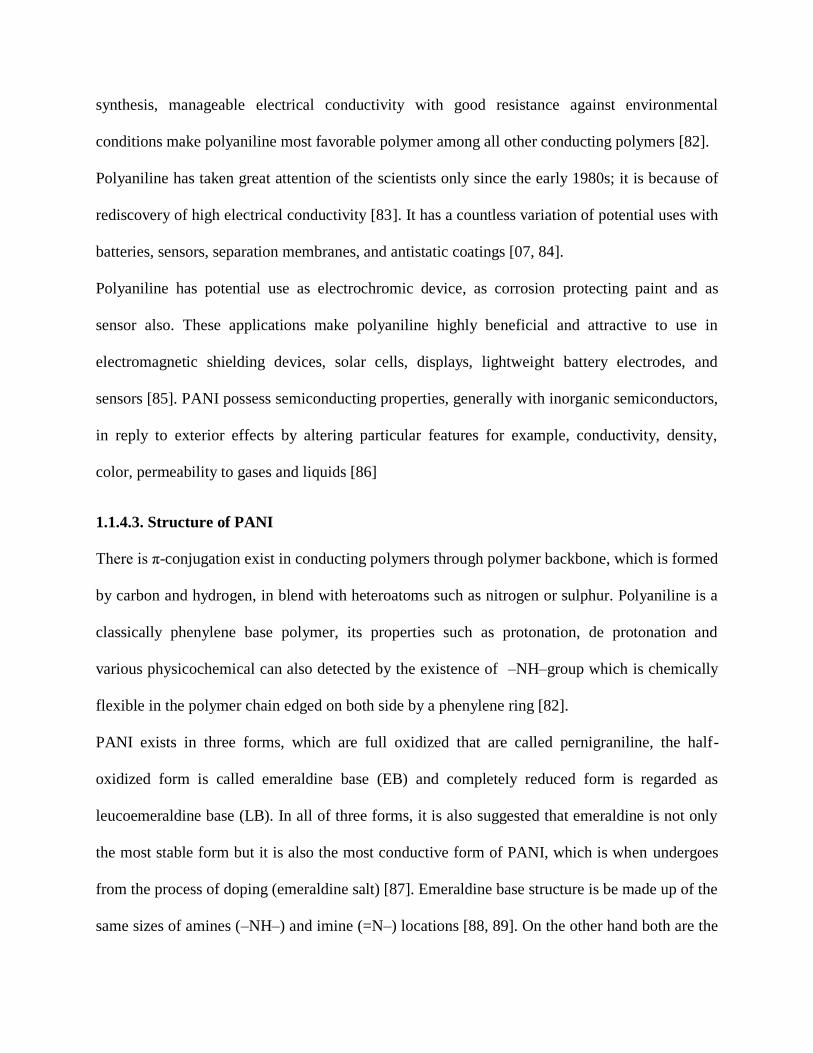
1.1.4.3. Structure of PANI
There is π-conjugation exist in conducting polymers through polymer backbone, which is formed
by carbon and hydrogen, in blend with heteroatoms such as nitrogen or sulphur. Polyaniline is a
classically phenylene base polymer, its properties such as protonation, de protonation and
various physicochemical can also detected by the existence of –NH–group which is chemically
flexible in the polymer chain edged on both side by a phenylene ring [82].
PANI exists in three forms, which are full oxidized that are called pernigraniline, the half-
oxidized form is called emeraldine base (EB) and completely reduced form is regarded as
leucoemeraldine base (LB). In all of three forms, it is also suggested that emeraldine is not only
the most stable form but it is also the most conductive form of PANI, which is when undergoes
from the process of doping (emeraldine salt) [87]. Emeraldine base structure is be made up of the
same sizes of amines (–NH–) and imine (=N–) locations [88, 89]. On the other hand both are the
nonconducting forms of PANI weather it is fully reduced leucoemeraldine base or fully oxidized
pernigraniline base [90]. The pernigraniline form of polyaniline is the only polymer; accept the
polyacetylene, who exhibits twofold degenerate ground state [91-93].
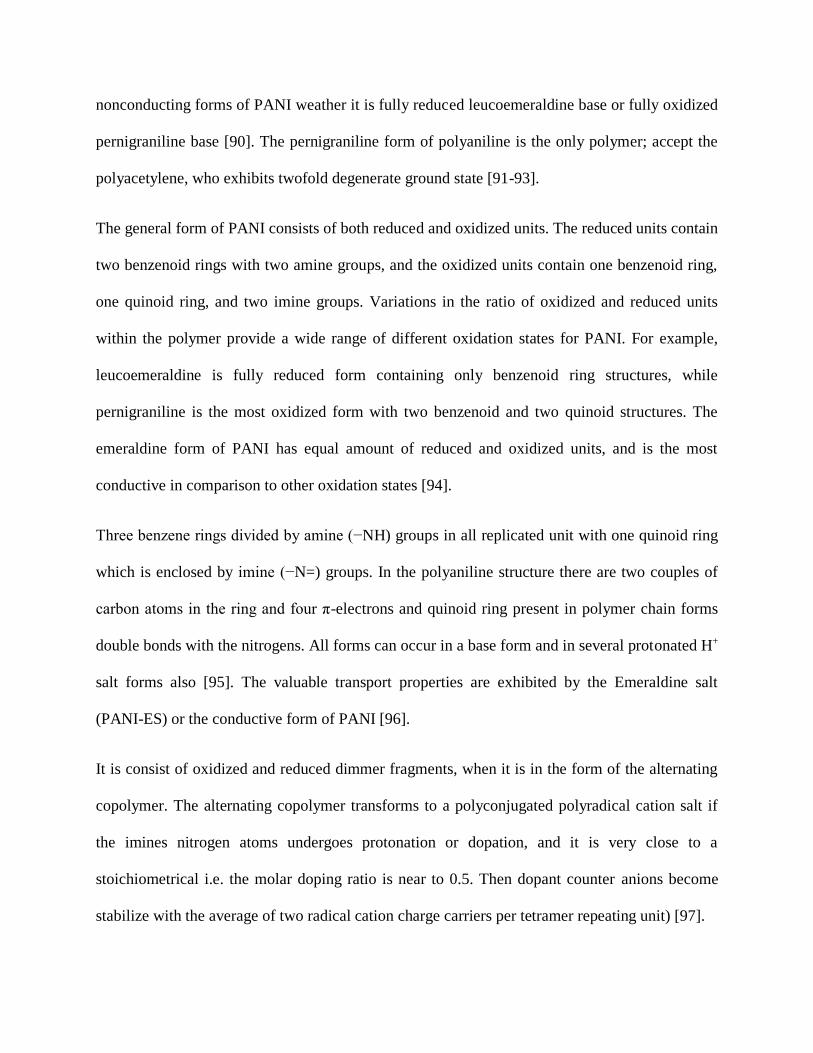
The general form of PANI consists of both reduced and oxidized units. The reduced units contain
two benzenoid rings with two amine groups, and the oxidized units contain one benzenoid ring,
one quinoid ring, and two imine groups. Variations in the ratio of oxidized and reduced units
within the polymer provide a wide range of different oxidation states for PANI. For example,
leucoemeraldine is fully reduced form containing only benzenoid ring structures, while
pernigraniline is the most oxidized form with two benzenoid and two quinoid structures. The
emeraldine form of PANI has equal amount of reduced and oxidized units, and is the most
conductive in comparison to other oxidation states [94].
Three benzene rings divided by amine (−NH) groups in all replicated unit with one quinoid ring
which is enclosed by imine (−N=) groups. In the polyaniline structure there are two couples of
carbon atoms in the ring and four π-electrons and quinoid ring present in polymer chain forms
double bonds with the nitrogens. All forms can occur in a base form and in several protonated H+
salt forms also [95]. The valuable transport properties are exhibited by the Emeraldine salt
(PANI-ES) or the conductive form of PANI [96].
It is consist of oxidized and reduced dimmer fragments, when it is in the form of the alternating
copolymer. The alternating copolymer transforms to a polyconjugated polyradical cation salt if
the imines nitrogen atoms undergoes protonation or dopation, and it is very close to a
stoichiometrical i.e. the molar doping ratio is near to 0.5. Then dopant counter anions become
stabilize with the average of two radical cation charge carriers per tetramer repeating unit) [97].
Conductivity of the polyamine changes with the number of electrons or level of oxidation and
the number of protons or amount of protonation [98]. PANI possesses controlled conductivity in
the range of 10-10 – 101 Scm-1.
Polyaniline almost composed of para-substituted monomer and have organized super molecular
structures. These factors in polyaniline are responsible for the high conductivity of macroscopic
sample and also the existence of elongated-polyconjugated system [99].
1.1.4.4. Applications of Polyaniline
In recent years many researchers has concentrated on the development of least price, printed
electrochemical sensor platforms for clinical diagnostics and environmental monitoring.
Considerably effort has been applied for consuming the redox properties of polyaniline. To get
the best sensing applications several groups have examined various mass-amenable fabrication
approaches to obtain suitable thin films of PANI. During this observation it was found that nano-
dispersions have shown a great deal of promise for sensing applications providing that they are
inkjet-printable. Two dimensional pattern, thickness, and conductivity can be finely controlled
the inkjet-printed films of polyaniline, and it highlight the level of precision achievable by inkjet
printing. Polyaniline can also be used in many other application areas such as energy storage,
displays, organic light-emitting diodes etc. [354]. There is several application of polyaniline in
industries and in our daily life. Few of them are discuses here.
The electrical conductivity of polyaniline can be controlled in wide area of range. Its
conductivity level as high as 100 S/cm and less than 10-10 to 10-1 S/cm can be achieved by
making the polymer blends in which polyaniline will be present in different composites.
Polyaniline based compositions can withstand against the high temperatures of 230-
240°C but for short time i.e.5-10 minutes and prohibited any significant change in their electrical
properties,
By using the polyaniline with different material it is possible to manufacture the
electrically conductive transparent thin films and coatings.
One of the best applications of these materials is that they are used in protection from
Electrostatic Discharge (ESD). During the handling of sensitive electronic components,
explosive or dry powder electrostatic discharge causes problems. The use of the controllable
conductivity material in ESD protection materials is one of the basic benefits of conductive
polymer technology.
In packing industry polyaniline is used in Injection molded antistatic products and also
for making the antistatic films.
Polyaniline has its application in electronics it is used in antistatic packaging of
components and also in the manufacturing of the printed circuit boards
1.1.2.Nanomaterial
One of the most popular areas among all recent developments and research topics in technical
disciplines the field of nanotechnology is at the top. It would include microelectronics, polymers
based biomaterials, polymer bound catalyst fuel cell electrode, polymer films formed layer by
layer by self-assembling, nanofibers of electrospun, and nanocomposites with polymer [100-
102].
Ferrites are divided into three groups hexagonal, garnet and spinel ferrite, this classification is
based upon their structure. Among all these, spinel ferrites are one of the most studied ferrites
because of their various applications in different fields. The chemical formula of spinel ferrite is
MFe2O4 in this formula, M represent divalent metal ions, it may be Co, Ni, Mn etc. Spinel
ferrites have two sub-lattice sites which are tetrahedral site represent as “A” and octahedral
represent as “B”. The accommodation of different cations having different valance at the
interstitial sites can bring extensive variation in the electrical and magnetic properties [103-104].
Each unit cell of spinel stricter has 56 ions, 32 oxygen and 24 metal ions. If M shows cations that
occupy tetrahedron sites and x is degree of inversion then ferrite can be represented by a general
formula (M1-xFex)[MxFe2-x] O4[105]. The transition metal ions in the spinels are capable of
possessing one or more oxidation states and they can occupy tetrahedral and octahedral positions
and the cations present in two different interstitial sites strongly effected on the physical
properties such as crystal structure, electronic conduction, and magnetism [106-114].
We are interested in the magnetic nanomaterials. The ferrites and multiferroics are the most
popular because of their chemical stability structural, corrosion inhibition large saturation as
alloys and e saturation magnetization and suitable to their counterparts such as metal and alloys.
1.2.1. Multiferroics
Multiferroics are the material which reveals two or more primary ferroic properties. This
definition was basically suggested by Schmid, he made efforts to characterize the materials and
study the effects that allow the formation of switchable domains [115,116]
Multiferroics have potential uses in future technology like information storage [117] sensors and
number of many other applications [118]; therefore they have got a significant attention. It is one
of the best property of multiferroics that they have inherent ferroelectric properties along with
ferromagnetic or ferroelastic characteristic. Magneto electric effect occurs in these materials and
magnetization is controlled by the applied electric field or the electric polarization is controlled
by magnetic field [119]. Multiferroics can be grouped in various ways according to different
characteristics. One method is to classify the materials according to the mechanism that drives
the ferroelectricity: proper and improper ferroelectrics [120].
1.1.2.2. Ferrites.
Magnetic materials which have combined electrical and magnetic properties are known as
ferrites. Iron oxide and metal oxides are the main constituents of the ferrites [126]. These are
ceramic materials which are non-conductive and ferrimagnetic in nature. These comprise of
various combinations of iron oxides such as Magnetite (Fe3O4) or Hematite (Fe2O3) and the
metal oxides like CuO, NiO, ZnO, CoO, and MnO. When ferrites are in magnetized state then all
the spin magnetic moments are not sloping in the same path, it is one of the major properties of
ferrites.
If M is stands for the divalent metal such as Fe, Mn, Co, Ni, Cu, Mg, Zn or Cd then ferrites can
be represented by general molecular formula of M2+O.Fe2 3+O3. A unit cell of spinel structure is
composed of on 8 molecules in which 32 oxygen (O2-) ions, 16 Fe3+ ions and 8 M2+ ions are
present in each unit cell. Structure of ferrites is organizes in such a way that 8 Fe3+ ions and 8
M2+ ions are positioned at octahedral sites and each one ion is encircled by 6 oxygen ions. [127].
Ferrites impact strongly on the characteristics of magnetic materials. At the room temperature
resistivity of ferrites fluctuate from 10-2 Ω-cm to 1011 Ω-cm, depending upon their chemical
compositions [126]. No material which have ferrites like wide ranging properties exists and
therefore ferrites are unique magnetic materials which find applications in almost all fields.
Preparation of ferrites are highly sensitive, it is strongly effected by sintering condition, amount
of constituent metal oxides used for the preparation, and other various additives include in
dopants and impurities [128-130].
Classification
Ferrites are categorized into three different types [131].
(1) Spinel ferrites (Cubic ferrites)
(2) Hexagonal ferrites
(3) Garnets
We shall concentrate on the topic of spinel ferrites nanocrystals because they are regarded as two
of the most important inorganic nanomaterials. Spinel ferrites properties like electronic, optical,
electrical, magnetic, and catalytic make them important and attract to study them. It is observed
that the majority of the important ferrites are spinel [132]. We shell discuses spinel ferrites in
detail because spinel ferrites are one of the main components of our research work.
1.1.2.2.1.Spinel Ferrites
Spinel or cubic ferrites [131] are the materials which have the general formula AB2O4 and these
are when crystallize they attain the spinel configuration. In the general formula “A" represents
the tetrahedral cation sites and “B” is for octahedral cation sites, where the “O” represents the
oxygen anion site. Spinel ferrites can also be represents by general formula MeO Fe2O3 or Me
(ІІ) Fe2 (ІІІ) O4, In this is representation Me (ІІ) is for divalent metal cation for example, Mn, Fe,
Co, Ni, Cu, Zn, Cd, Mg, or (0.5Li (І) + 0.5Fe (ІІІ)), and Fe (ІІІ) is the trivalent iron cation, their
crystallographic structure (MgAl2O4) is similar to mineral spinel which was purposed by Bragg
[133].
The use for spinel at microwave frequencies is most suitable because of its special characteristics
of unexpected values of electrical resistivity and lesser eddy current losses, therefore spinel is the
one of the most broadly used type among the ferrites [131]. When the unit cell of spinel ferrites
is discussed it is found that, it has cubic structure which is formed by eight MeOFe2O3 molecules
and consists of 32 of O2- anions. In this cubic structure oxygen anions built the close face-
centered cube packing which have 64 tetrahedral (A) and 32 octahedral (B) empty spaces, these
empty spaces are partially filled by Fe3+ and Me2+ cations [134].
There are 96 interstitial positions are present in the unit cell which are of two types, these are
occupied by metallic cations, 64 are at tetrahedral positions occupied by A and 32 at octahedral
sites occupied by B. This distribution of cations is depending up spinel structure weather it is
normal, mixed or inversed spinel, order or position of A and B which they occupied and types of
ions have also great impact on spinel structure [135].
Classification of Spinel Ferrites
Distribution of cations on octahedral (B) and tetrahedral (A) positions is different in spinels, this
distribution decide the class of spinel. In this, way spinel ferrites have divided in three classes.
(i) Normal spinel ferrites
(ii) Inverse spinel ferrites
(iii) Intermediate spinel ferrites
i) Normal Spinel Ferrites
When only one type of cations is located on octahedral (B) positions they will be called a normal
spinel. Divalent cations in normal spinel ferrites are located on tetrahedral (A) position while the
trivalent cations take the position at octahedral (B) sites. General formula used for the
representation of normal spinel is (M2+)A[Me3+]B O4. In this formula M represents the divalent
ions and Me for trivalent ions. In this formula, square brackets are used to represent the ionic
separation of the octahedral (B) sites. This sort of distribution happened in zinc
ferrites Zn+2[Fe+2Fe3+]O4−2.
ii) Inverse Spinel Ferrites
As compared to normal spinel in which only one type of cations are located on octahedral (B)
positions, but in case of inverse spinel, half trivalent ions located at tetrahedral (A) positions and
half are at octahedral (B) positions. There are some cations also left over which separated
randomly among the octahedral (B) sites. General formula used to represent the invers spinel is
(Me3+)A[M2+Me3+]BO4. Its example is Fe3O4 in which Fe which is divalent cations is situated at
the octahedral (B) positions [136]. In the inversed ferrites the magnetic moments is compensated
mutually by the half of Fe3+ is positioned located at A-sites and half of Fe3+ is positioned located
at B-sites. And resultant moment of the ferrite is appear due to the magnetic moments of bivalent
cations Me2+ located at the B-positions.
iii) Intermediate Spinel Ferrites
When the distribution of ions is intermediate between the normal and invers in spinel, these are
identified as mixed. Spinel is called mixed when there are unequal numbers of each kind of
cations are on octahedral positions. Classical example of mixed spinel ferrites are MgFe2O4 and
MnFe2O4 [137]. Generally it is observed that, the magnetic ions of A- sites and B-sites (AB-sites
interaction) interaction is the strongest. When we compare, it was found that interaction between
AA-sites ten times weaker than that of A-B site interaction whereas the BB-sites interaction is
the weakest once. The leading AB-sites interaction is recognized as ferrimagnetism which is
resulted from the complete or partial anti-ferromagnetism [138].
1.1.2.2.2. Hexagonal Ferrites
Went, Rathenau, Gorter & Van Oostershout 1952 and Jonker, Wijn & Braun 1956 were the first
how identified hexagonal ferrites. Hexa ferrites are hexagonal or rhombohedral ferromagnetic
oxides with formula M Fe12O19, where M symbolizes for an element. Oxygen ions have closed
packed hexagonal crystal structure. These are broadly used as permanent magnets and have high
coercivity. These have their good application at very high frequency. Hexagonal ferrites ions are
bigger than that of garnet ferrites. [131].
1.1.2.2.3. Garnets
Garnets ferrites general formula is Me3Fe5O12, in which Me is for rare earth metal ions. It
contains 160 atoms or 8 formula units in single cubic unit which can be described as a three-
dimensional arrangement of 96 O2- with interstitial cations. [139].
1.1.2.2.4. Ferrites Categories According to their Hardness
Ferrites are of divided in two classes i.e. hard and soft and this classification is based on the
tenacity of the magnetization, which tell their capability of magnetization or demagnetization.
Soft ferrites can easily magnetize or demagnetized but it is difficult for hard ferrites [140].
1.1.2.2.1. Soft Ferrites
The special property of soft ferrites is that they can easily magnetize and have low corrosive
field. Moreover they have high magnetization and broad applications in this field, it is also
observed that if and when hysteresis loop for soft loop is thin and long its energy loss will
minimum. It can be understand by taking the examples of nickel, iron, cobalt, manganese etc.
which have their applications in transformer cores, recording heads and microwave devices
[141].As compare to other electromagnetic materials soft ferrites behaves batter when they are
used over the wide frequency range in the sense of high resistivity and low eddy current losses.
It is the characteristic benefits which dominate the soft ferrites over all other magnetic materials
that they are unchanged over a wide temperature range and have high permeability. Mn Zn-
ferrites are among the most extensively used soft ferrites in various types of transformers and
magnetic recording heads [142].
1.1.2.2.2. Hard Ferrites
Hard ferrites have wide hysteresis loop and high coercive field e.g. alnico, rare earth metal alloys
etc. These are also used as permanent magnets and are difficult to magnetize or demagnetize
[141]. These are the hard ferrites that their introduction was greatly promoted the growth of
permanent magnet. These are ferrimagnetic in nature with fairly low remanence (~400 mT) as
compare to other materials which have coercivity of their magnets in the range (~250 kAm-1) that
is far in excess. The maximum energy product is found only in the range of ~ 40 kJm-3. To
moderate the demagnetization of fields these magnets can also be used and it also has its
applications in permanent magnet motors..
Lead over other Magnetic Materials
There are many magnetic materials such as metallic alloys, iron and can be used in electronics.
But they have high dc electrical conductivity and low dc electrical resistivity therefore they could
not be used at high frequency equipments for example, inductor cores used in TV circuit.
The reason is that heat is generated due to their low electrical resistivity induces currents when it
flow through the material. This phenomenon makes the material inefficient and wastage of

energy take place this wastage become increase at high frequency.
On the other hand, ferrites have high electrical resistivity therefore they can execute much better
at high frequencies. They also have high temperature stability which is their important and
additional characteristic. These characteristics of ferrites boost the usage of ferrites at high
frequency equipment, in wide-band transformers, and in a number of high-frequency electronic
circuits. One of the most imperative features of the ferrites is that they have low cost as compare
to other alloys and magnetic metals and when they are used in high frequencies equipment they
perform better comparative to that of other circuit components. When one wants a good
combination of low cost, best worth, and small volume at the frequencies range from 10 kHz to a
small number of MHz the performance of ferrites is found excellent.
Ferrites are imperative magnetic materials and have comprehensive uses in technology, mainly at
high frequencies. Including the high electric resistivity they also show good magnetic and
mechanical properties their largely applications due to their following properties
1- High flux transformers and low power which are used in television ferrites are their essential
part.
2- Manufacturing of inductor core in combination with capacitor circuits to use in telephone is
possible with soft ferrites.
3- Small antennas used in transistor radio receiver can only be prepared by winding a coil on
ferrite rod.
4- Ferrite materials are used in the manufacturing of nonvolatile memories used in computer
because of their high stability against vibrations and severe shock.
5- Ferrites have also their applications in microwave devices like isolators circulators, switches
etc.
6- Ferrites can also be used in high frequency transformer core and computer memories i.e.
credit cards, computer hard disk etc.
7- High frequency equipment like wide band transformers, high speed relays, and inductors are
made by nickel alloy.
8- At low dielectric values ferrites are used as electromagnetic wave absorbers.
9- Ferrofluids cool the coils with vibrations are used as a cooling material in speakers.
Ferrites are also used in various technological because of extraordinary electrical resistivity and
wide ranges of saturation magnetization. Ferrites have large technological applications such as
LPG gas sensor; humidity sensor etc. because of their good permeability, excellent
magnetization and little losses at higher frequencies [143-146].The combination of magnetic and
electrical properties of the ferrites with spinel structure makes them helpful in several
technological appliances. It is also possible to modify the basic electrical and magnetic properties
of ferrite to suit the required application; it can be carried out by several ways. One of the simple
methods for the modification of ferrite properties is to apply different synthesis methods by
optimizing the suitable parameters. Several chemical methods have been applied for the
preparation of ferrite nanoparticles. These methods includes sol-gel [147], micro emulsion [148],
chemical co-precipitation [149] etc. Stirring time and speed, fuel, metal nitrates to fuel ratio, pH
and preparative parameters have major effects on size and the properties of spinel ferrite
nanoparticles [150]. The most important parameters which strongly affected by the size of
magnetic material is increase in electrical resistivity, saturation magnetization, coercivity etc.
when nanoparticles are compared with the bulk material as the particle size reduces to nanoscale
[151]
The superior properties and applications of nano-size spinel ferrite in new and innovative fields,
for example, magnetic drug delivery, catalyst, sensors etc. have increased the much more interest
for researchers from last ten years [152]. It has been done lot of work by many workers on the
structural and magnetic characterization of spinel ferrites in the nano-size form [153-154].
Spinels of the type AB2O4 such as: MnFe2O4, NiFe2O4 and CoFe2O4 have got great attention
among the different ferrites, which are a main component of magnetic ceramic materials, due to
their extensive uses in several technological fields [155]. The soft ferromagnetic material
NiFe2O4 is one of the most important nano-size materials it crystallizes in a completely inverse
spinel structure with all nickel ions located in the octahedral sites and iron ions reside in
tetrahedral and octahedral sites [156.] exist in its cubic structure.
Proper and regular ferromagnetism which originates from magnetic moment of anti-parallel
spins is also shows by the NiFe2O4 [157-159].
The moderate saturation magnetization, high electrical properties, high magneto-crystalline
anisotropy, good mechanical properties and chemical stability among the different spinel ferrites
with inverse spinel structure cobalt ferrite (CoFe2O4) is the most promising magnetic materials
[151].
Several workers have done a lot of work on the synthesis and magnetic properties of spinel
cobalt ferrite nanoparticles [160, 161].

1.1.2.3.Uses of Nanomaterials [162]
Now days most current and modern uses of nanomaterial represent the evolutionary expansions
of present technologies: for example, the electronics devices size reduction. Underneath we list
some significant uses of nanomaterials.
i) Sunscreens and Cosmetics
The old chemicals used for UV shield shows poor long lasting stability. Titanium dioxide based
sunscreens have its numerous benefits and shows good UV defense property.
To reflect and absorb ultraviolet(UV) rays and also to transparent visible light nanosized
titanium dioxide and zinc oxide are presently used on large scale and shows great results, which
makes them more appealing to the consumers. Lipstick which is one of on ordinary used
cosmetic product is composed of nanosized iron oxide which is used as a pigment.
ii) Paints
Combining nanoparticles with paint technology can enhance their performance by converting
them in light weight and giving them diverse properties. The nanotechnology can provide a
superior solution to block light and heat entering through windows.
Coating is significant part in construction which is widely used to paint the buildings. The
purpose of coating is to create a protective layer and bound to the base material for desired
shielding of the surface with different functional properties. Nanotechnology with paint creates
the ability of self-healing and corrosion resistance under insulation. These coatings are
hydrophobic in nature and fight with water against the damage of the metal pipe; it acts as guard
to the metals from salt water attack.
iii ) Displays
Nanomaterials are key factor for the development of vast market of sharp brightness, flat-panel
displays which have their important applications in television screens and computer monitors.
For the next era of light-emitting phosphors, cadmium sulphide, zinc selenide, zinc sulphide, and
lead telluride nanocrystalline, which are synthesized by sol gel methods, will be the best
selection.
iv) Batteries
With the passage of time demand and growth of electronic devices e.g. remote sensors, laptop,
computer and mobile phone is increasing continuously, therefore, high energy density batteries
with lightweight demand which are used in these equipments is also increasing continuously.
Nanocrystalline materials synthesized by sol-gel method form foam like (aerogel) structure.
These are best nominees for separator plates in the batteries because they can hold significant
amount of energy than customary ones. Nickel metal hydride batteries have bright future,
because they require less and frequent recharging to run longer, these are prepared by
nanocrystalline nickel and metal hydrides and have bulky surface area.
v ) Catalysis
In general, nanoparticles have high surface area and provide higher catalytic activity. Catalysis is
essential for the good qualitative and quantitative fabrication of chemicals. Due to very large
surface to volume ratio nanoparticles work as efficient catalyst for certain chemical reactions.
For the new era of catalytic converters, platinum nanoparticles is going to be one of the best
considerations by reducing the amount of platinum required because of very high surface area of
nanoparticles. Several chemical reactions such as, reduction of nickel oxide to the base metal Ni,
are also carried out by using nanomaterials.
vi ) Medicine
With the help of nanoparticles application it has become possible to pointing the drugs to
specific cells. This property of nanoparticles has boosted the nanotechnology in medical field. It
is possible to avoid the higher dosage and lower the drugs side effects by decreasing the
consumption it can be done by studding the deposition of the active agent in the morbid section.
Reproduction or healing of damaged tissues can be achieved with the help of nanotechnology.
The usage of gold in medicinal synthesis is not new. In the Indian medical system called
Ayurveda, gold is used in a number of syntheses. One famous synthesis called Saras
watharishtam, recommended for the memory development. To improve the mental ability of
babies’ gold is also added in certain medicine syntheses procedures. Over 5000 years ago,
Egyptians used gold in dentistry. In Alexandria, to restore the youth, alchemists developed
energetic colloidal elixir, identified as liquid gold. In china, to replenish gold in their bodies,
people cook their rice with a gold coin.
vii ) Sensors of Gases
The gases like NO2 and NH3 can be simply detected on the basis of the variation in the electrical
conductivity in gas sensor, because due to charge transfer from nanomaterials to NO2 and the gas
molecules bind by the nanomaterials the concentration of holes in nanomaterials increases which
increase the conductivity which is readable by the gas sensor.
viii) Food
Application of nanotechnology is also useful in the food technology, it is when applied in the
manufacturing, process treatment, safety and packaging good results are obtained. Food
packaging quality can be improved by nanocomposite coating process, which is carried out by
placing anti-microbial agents directly on the surface of the coated film.
ix) Construction
It is possible with the help of nanotechnology to make construction faster, low-priced and safer.
In this modern era of nanotechnology it is much easier to create and complete the huge
skyscrapers quickly and at low price. Silica which is used in concrete as a part of the normal mix
since old time, now with the help of nanotechnology by adding nano silica in concrete it is
possible to enhance the mechanical properties of particle of packing. In this way it does not only
control the degradation of calcium silicate hydrate reaction occurs in the concrete but it also
prohibited the penetration of water in the concrete surface, enhancement in durability is resulted.
Strength of concrete can also be increase the by the addition of hematite (Fe2O3) nanoparticles.
Construction industry can also be make more durable by improving the strength of steel which is
extensively accessible material and has a main role in it, for example in the bridge construction
nano size steel can be used to get much better strength by using stronger cables of nano size
steel,
x) Agriculture
With the help of nanotechnology applications it is possible to positively modify the agriculture
sector completely and it is also possible to bring positive change in food sector from production
to transportation and even it is also possible to treat the waste material.
xi) Energy
The most advanced nanotechnology challenging projects associated to energy are the energy
storage and its conversion, energy saving and improved renewable energy sources. Today's best
solar cells only attain the 40 percent of the Sun's energy although they have several layers of
diverse semiconductors which are loaded together to absorb light at different energies. By using
nanostructures it is possible that nanotechnology could help to increase the efficiency of light
conversion.
1.1.2.4.Applications of Nanoparticles in Biology and Medicine
Nanomaterials have move in a commercial exploration era [162, 163]. Living organisms are
constructed with cells. These cells are 10 µm across and cell parts are in the range of sub-micron
size even smaller are the proteins size of just 5 nm. And this size is comparable to the
dimensions of least size synthetic nanoparticles. Not only the size dependent physical properties
of nanomaterials but optical [164] and magnetic [165] effects are also have the most useful
application in biological sciences. In a similar way to get the unusual optoelectronics, electronic
and memory devices hybrid bio-nanomaterials are widely used [166, 167].
Nanoparticles occur in the size which is suitable for bio tagging or labeling in protein. Size is one
of the leading characteristics of nanomaterial that they are rarely sufficient to use as biological
tags. In order to use nanomaterials for biological application, molecular coating or layer acting as
a bioinorganic boundary should be attached to the nanoparticle [168], or it should be able to
create the nanoparticles biocompatible monolayers of small molecules [169].
i) Cancer Therapy
The process of cancer cells destruction by the laser generated atomic oxygen (which is cytotoxic)
is called cancer therapy. A larger amount of a special dye that is used to produce the atomic
oxygen is taken in by the cancer cells when matched with a healthy tissue. Therefore, only
cancer cells are damaged then visible to a laser radiation. In this process the residual dye
molecules move to the eyes and skin and make the patient very sensitive to the daylight
exposure. This effect can make problem up to six weeks. This side effect can be avoided by the
use of hydrophobic version of the dye molecule was sealed off inside a porous nanoparticle
[172]. The dye remained trapped inside the Ormosil nanoparticle and could not spread to the
other parts of the body. Moreover, its oxygen generating ability would not affect and the pore
size of about 1 nm freely allowed for the oxygen to diffuse out at the same time.
ii) Protein Detection [173]
The understanding and the functionalities of proteins are very essential because, these are the
important part of the cell's language and structure, and it is extremely important for further
progress in human well-being. It widely used of the gold nanoparticles in immunohistochemistry
to recognize protein-protein contact.
There are some applications of nanomaterials in biology and in medicines are listed below:
iv) Fluorescent biological tags [174-176]
v) Delivery of drug and gene [177, 178]
vi) Bio detection of pathogens [179]
vii) Proteins Detection [180]
viii) DNA structure Probing [181]
ix) Tissue engineering [171, 182]
x) Tumour destruction via heating (hyperthermia) [183]
xi) Separation and purification of biological molecules and cells [184]
xii) MRI contrast enhancement [185]
xiii) Phagokinetic studies [186]
1.3. Polymer Nanomatrials Composite
MacDiarmid and Heeger were surprised to observed that when high quality films trans-
polyacetylene expose to bromine vapor at room temperature there is an increase in conductivity
take place and it was million times in a few minutes, this change was very which the exhausted
the electronics of the measuring instrument. Now days it is possible to achieve the conductivity
similar to that of copper by doping the best quality samples of polyacetylene in similar way. It is
polyacetylene which purposed a new theoretical model for research the metal insulator transition
in organic materials and their conduction mechanisms also. It is possible to convert the
polyacetylene in an insulator, semiconductor or full metal by changing the dopant material and
their concentration. It generated the practical view of low cost, lightweight electronic devices
idea in mind [187]. The composite materials having less than 100 nm at least from one
dimension with polymer matrix and filler particles are call polymer nano-composites. These
composites are needed because of their low density, extraordinary corrosion resistance, and
easiness of manufacturing etc. [188- 191]. It is the aim to reduce the price and upgrading in
stiffness of polymer material for this purpose presence of inorganic fillers into polymers for

marketable presentations is needed upgrading [192]. These composite materials represent a new
and attractive alternative to conventionally filled polymers. A characteristic feature of polymeric
nanocomposites is that filler particles are of nanometer sizes. Nowadays, most often used are
inorganic nanofillers including silicates, clays, carbon nanotubes and carbon nanofibers. Owing
to a large surface area of interactions between filler nanoparticles and a polymer a desirable
modification of material characteristics together with improved modulus and strength, toughness,
exceptional barrier characteristics, better solvent and heat resistance, reduced weight and
improved dimensional stability, induced electrical conductivity, thermal conductivity, scratch
resistance and other properties, can be achieved at low filler loadings (1÷5 wt. %) [193].The
composite materials, now days, shows progressive performance and play important role because
of their special properties of corrosion resistance and light weight characteristic. Composites
materials are commonly consist of polymers which have fibers or minor filler particles in their
matrix these are distributed toughly e.g. in plastic and paper calcite particles as fillers are used
commonly. The calcite not only reduce the price but also make its tensile strength stronger and
stiffness of the base resin which form the composite also increases therefore it exhibit the good
performance. It is essential the filler must be distributed in good manner in the polymer matrix to
avoid the creation of weaker region of consistency, where defects or flaws can be introduced
when stress is applied [194]. The polymers which have extensive application and low price filler
have become more popular and gain much attraction in this developing world. Many physical
properties of the materials for example, mechanical strength, and modulus and adhesion
performance are improved by introducing the inorganic mineral as fillers into the plastic resins.
[195]. Filler particles are also used in the polymer matrix for fulfilling the additional
requirements i.e. stiffing enhancement, decreeing dielectric loss or increasing the absorption of
infrared radiation capability of polymers filler particles are also used. For this purpose calcium
carbonate is one of the best easily available filler which can be uses for size and surface
treatment. . Moreover several kinds of particular precipitated calcium carbonate filler particles
have comparatively regular shapes [196]. To determine the properties of manufactured
composite materials it is the best way to know the polymer composite material synthesis method.
Normally to best known method for the preparation of polymer composite are the, in situ
polymerization and solution mixing. Polyaniline composites are one of the best examples of
polymer composites [197]. Attempts have been made for the development of nano- particle
filled-polymer composites with better tribological presentation of the materials are undergoing
with growing of nano-phased materials in the recent ages. When it is compared to those
composites which are filled with microscale particles it is predictable that good tribological
properties can be achieved form the polymers filled in which polymer matrix are filled with
nanoscale fillers [198, 199]. It is also possible to fabricate the polymer composites 107with the
combination of inorganic material injection into the polymer matrix. The characteristics,
dimensions, shapes of inorganic fillers, and interfacial bonding strength also highly effected on
resulting polymer composites properties. It was suggested that major improvement in the contact
area between the polymer matrix and filler with decreasing filler dimensions or increasing filler
concentration is observed, which would effectively and greatly develop the sharing of the load
between the fillers and the polymer matrix [200]. The inorganic nanofillers which ranges from 1
to 50 nm were effectively combined with the polymeric matrix, to make stronger and increase
the ductile polymer with the additional better stiff and resistant for abrasion [201, 202].
Substantially, it is possible to improve stiffness and thermal stability of composites, by addition
of the ceramic nano- fillers into the extra flexible and poorer thermal resistance polymers [203-
206] and the added particles size, shapes, volume fractions and surface are area affect strongly
on the mechanical characteristics of the polymer nanocomposites. Now, several researches are
in progress to determine that how a single-particle size disturbs mechanical properties of the
composites [207-210]. It was discussed by Ho- Shino et al. [207], he studied the impact of shape
and size of particles of silica on the fracture toughness and strength particle matrix adhesion
which based on strength, he observed that increase of flexural and tensile strength occur with the
increase in specific surface area of particles Yamamoto et al. [208] also reported that the shape
and structure of silica particle have greatly influenced on the mechanical characteristics such as
tensile and fracture characteristic and fatigue resistance also. The inorganic nanometer particles,
such as SiC, SiO2, Si3N4 and ZrO2, when combined with different polymer material effects of
on the tribological characteristics of few polymers have. Wang et al. reported that [211-217] after
filling the Polyetheretherketone with different weight fractions of SiC, Si3N4, SiO2, and ZrO2
concluded that if filler addition is less than 10 % by weight it will enhanced the wear resistance
and compact the friction coefficient. Schwartz and Bahadur [199] studied the filling of the
polyphenylene sulfide with alumina nanoparticles and they confirmed the distribution of filler
particles in the polyphenylene sulfide matrix with scanning electron microscopy. Li et al. [218]
successfully filled the nano particles of ZnO in Polytetrafluoroethylene matrix. Petrovicova et al.
[219] found that the friction coefficient of the nano-composite formed by filling Nylon 11 with
silica was lower than that of the unfilled Nylon by filling Nylon 11 with silica. They also
observed that wear resistance improved with increasing the concentrations of nanoscale silica up
to certain optimum value. Similar studies were also carried out by Avella et al. [220] who filled
polymethylmethacrylate with nanoscale CaCO3 and he found an increased in abrasion resistance
with the increase of the filler content .And this increase rate was by a factor of 2% with 3%
CaCO3 by weight and Yu et al. [221] who studied the surface area and the bonding strength of
polyoxymethylene composite by filling the micrometer and submicron copper particles in
polyoxymethylene matrix and he concluded that at filler/matrix interface increase in surface area
and improved in bonding strength by of the submicron copper filler particles take place. [222]. It
shows that strong potential of polyaniline and its composites on a bulky scale for the industrial
uses [223-225]. Polyaniline and its derivatives also have been applied for anticorrosive purposes
by coatings it on metal surfaces [226-230]. But the problem is that pure coatings of polyaniline
and its derivatives undergoes from poor bond strength and low mechanical properties also [231-
232]. Polyaniline composites were also synthesized with different metals and these were coated
on various metals surface for corrosion protection after improving the anticorrosive efficiency,
mechanical properties and their adhesion strength [2, 233-234]. Wonderful developments in this
field have been evident and verified by the rapid advances of chemistry in the development of
nanoparticles over the recent years. Due to the exclusive mechanical, electrical, optical, and
thermal properties of composites by using nanomaterials, the concept of using nanoparticles as
fillers in polymer materials have taken the considerable attention of researchers [235-240].
Nowadays, polymer nanocomposite materials are coming with incorporation of nano
reinforcements into elastomers, which considerably enhance their thermal and mechanical
applications in conjunction with visible developments in linkage, rheological and processing
actions. Furthermore, better dispersion of these fillers within the matrix provides high
performance nano composites and also the properties of the nano scale filler are significantly
higher than those of the base matrix [241-242]. There are ranges of nanoparticles such as
alumina [243], Micro and nanosized silicon carbide [244], Silica [245], Zinc [246], calcium
carbonate [247], carbon black nanoparticles [248], etc., were also used as fillers to improve the
material characteristics for polymer nanocomposites. To improve the interfacial properties of
composites the performance of nanomaterials in epoxy adhesive was also investigated.
Consequently, nanoparticles with developed active surface composition will perform as stress
concentrators and a binding channel at the interphase. Moreover as a new material, these
nanoparticles have been widely used to progress the strength, toughness and stiffness of resin
composites [249]. In this way, the discovery and the subsequent use of carbon nanotubes to
produce composites, show some of the carbon nanotubes related characteristic which are
mechanical, thermal and electrical properties and apply to a new and exciting dimension of this
area [250-254]. Pavia and Curtin [255] has been made to elaborate the effects of polymer
reinforced nanocomposites after considering the above facts, an effort has been made to
elaborate the impact of polymer reinforced nanocomposites. Ferrites which represent special
class of materials have also used, because of their several functional applications, as for example
installations of magnetic devices in electronic, optical and microwave equipments [256-257]
Many divers topics exist in the field of nanocomposites which include the barrier properties,
composite reinforcement, flame resistance, and cosmetic applications also. It can be concluded
that phase divided polymer composites frequently attain nanoscale phase sizes; in this way
nanoscale level is observed in block copolymer domain morphology; asymmetric membranes
frequently have nanoscale annulled structure, interfacial phenomena involve nanoscale
dimensions in blends and composites and miniemulsion particles have their size below 100 nm.
[100-102, 258]. For the determination of quality and properties of the nanocomposite the
interfacial contact between nanoparticles and polymer matrix plays a critical role. In the
nanocomposites, the well-dispersed nanoparticles which are in close to the particle surfaces are
surrounded by polymer chains. If the surface of the particles has strong contact with polymer
chains then the polymer chain will lose some of their freedom of movement and a region of low
movement polymer will exist around each particle [260]. The polymer chains in this region have
different behavior from those in bulk form. It is obvious that the interaction region between
polymer chains and nanoparticles has a great impact on thermal and mechanical characteristics.
Surface functionalization of nanoparticles makes the interface between the polymer matrix and
the nanoparticles stronger. This can be used to optimize the properties of resulting
nanocomposites [261].
1.4. Dyes.
For the coloration of numerous material including paper, leather, fur, hair, foods, drugs, plastics
and textile materials dyes are used which are powerfully colored substances. These Dyes may
attach or retain in these materials in several ways e.g. by physical adsorption, by metal complex
formation or salt formation or it may also be attached by covalent bond formation [262]
1.4.1. Classification of Dyes.
Dyes are usually classified in two ways [263]:
1. Fist of them is it is classified by the application method of the dye e.g. direct dyes, acid dyes,
reactive dyes, vat dyes, disperse dyes, sulphur dyes, metal complex dyes, mordant dyes, basic
dyes and azoic dyes.
2. Second one is the classification of the dyes based on the chemical constitution of the dye
molecules e.g. azo dyes, triphenylmethane dyes, stilbene dyes, anthraquinoid dyes etc.
1.4.2. Usage Classification.
There is system of dyes nomenclature and terminology; therefore before considering the
chemical structures of the dyes briefly, it is much better to study the dyes classification by
process of their applications. This classification is based upon the treatment or usages principal
system, approved by the Color Index [264.].
1.4.3. Chemical Classification.
Classification by chemical structure is one of the most suitable systems for the dyes, which has
numerous benefits. First of them is that with the help of this system it is possible to readily
identifies dyes as be in the right place in a related group which has their individual properties, it
can be explained form the example of azo dyes which are not only strong, economical and good
in all-round properties. Second one is that there are, about one dozen, controllable number of
chemical groups. [265].
Azo dyes as compare to the other commercial dyes has been studied more than any other class
because it has over 50 % of all market shares then other commercial dyes. These dyes are may be
define as; those dyes which have at least one azo group are called azo dyes. In their structure azo
group is attached to two groups in which one or both may be aromatic. These are exists in trans
form one of which is at bond angle 120° with sp2 hybridized nitrogen atoms [264].
1.4.4. Dyes Importance and Applications (leather, textile, food, paper)
The most important industrial sector that uses the dyes is the textile industries. The dyes used to
dyeing the polyester and cotton blends, dyes are consider most important which are used in
dyeing the important textile fibers, it means dye importance is depend upon it application. Other
dyes used in textile sector for dying fibers contain nylon, polyacrylonitrile, and cellulose acetates
are also considered from the important class. Similarly those dyes which are used in high-tech
applications, such as in electronics, medical, and nonimpact printing industries are also
considered important once for example, the dyes used in electrophotography in both organic
photoconductor and in the toner, in ink-jet printing, and in thermal transfer and in direct printing
[267]. When we discuss about the classical applications, azo dyes dominate over the use of;
anthraquinone, phthalocyanine, triphenylmethane and xanthene.
i) Reactive Dyes.
The reactive dye which could react with cellulosic fiber was first discovered in 1956. For the
cotton fabrics, reactive dyes are highly desirable to from covalent bond formation between dye
and cellulose for the excellent wash fastness arising in the alkaline conditions at pH 11. Due to
this covalent bonds formation during the dyeing procedure, reactive dyes have property of high
wet fastness. In this way reactive dyes not only give full range of bright shades but also decent
wet fastness with excellent light fastness which is basic need of textile sector. One of its
evidence is that approximately one-third of the money spent on dyes has been spent on reactive
dyes. In spite all these benefits there are some limitations also regarding the reactive dye usages,
with their cost and alkali, they also have time-consuming uses process, and dye losses also take
place due to hydrolysis.
ii) Disperse Dyes.
These are nonionic dyes which are water-insoluble and from aqueous dispersion which are used
for the hydrophobic fibers. Mostly these are used for polyester and cellulose acetate and to a
smaller extent on nylon also. The particles of disperse dye should be as fine as possible in the
range of 400 – 600 for the efficient diffusion. These are frequently substituted azo,
anthraquinone or diphenylamine compounds which do not contain water solubilizing groups and
are non-ionic. [138].
ii) Direct Dyes.
Direct dyes are anionic dyes which are water-soluble, in the presence of electrolytes when dyed
from aqueous solution, these are functional and have high affinity for cellulosic fibers. General
usage of theses dyes are dying of paper, cotton and regenerated cellulose, applications of these
dyes for nylon is to lesser extent. For these dyes it is possible to develop the wash fastness
properties after certain treatment.
It is important to note that the discovery of direct dyes has eliminated the requirement of
mordents during the dyeing of cotton, because these have affinity for cotton [139]. Most of these
contain four to seven derivatives of benzene and naphthalene. To confer water solubility of dyes,
sodium sulphonate group, -SO3Na, which is attached to benzene and naphthalene rings is one of
the best substituent for direct dyes [54].
iii) Vat Dyes.
These are water-insoluble and are used for cellulosic fibers as soluble leuco salts after reduction
in an alkaline bath, for this purpose sodium hydrogensulfite is used frequently. As the alkali is
used along with the reductive agent therefore protein fibers are not suitable for these dyes. Due
to their fixation mechanism most of vat dyes have excellent wash fastness properties.
iv) Sulfur Dyes.
It is one of the minor groups of dyes compare to other dyes groups. These dyes in the presence
of reducing agent i.e. sodium sulfide are applied on the cotton from an alkaline reducing bath.
The important feature of this class of dye is that these are from and imperative from economic
point of view because of their excellent wash fastness characteristics of the dyeing and low
prices.
v) Cationic (Basic) Dyes.
These are water-soluble and have their applications in paper industries, modified polyesters, and
modified nylons. One of the basic applications of cationic dyes is that they are applied on wool
silk and tannin-mordant cotton, when brightness of shade needed more than the fastness to light
and washing. These are basic in nature and are also use to color the cations in solution.
Therefore, these are also referred to as cationic dyes.
vi) Acid Dyes.
The fibers are based on polymer chains containing free amino group, such as nylon, wool and
silk are used to dye with acid dyes. Because an ionic bond formation take place under acid
conditions and the strength of this bond gives the rapid rate of color development. These are
classified into leveling dyes, premetallized acid dyes and milling/super milling acid dyes.
viii) Solvent Dyes.
These are water-insoluble dyes and suffering from polar solubilizing groups, for example
carboxylic acid and sulfonic acid etc. Normally these are used for coloring gasoline, plastics, and
oils. These dyes are mostly contains azo and anthraquinone, but some time phthalocyanine and
triarylmethane dyes are also used.
1.4.5. Hazardous Effects
Textile industries effluents containing the dyes are going to become one of the most serious
environmental issues. Behind this, the reason is that, they are the major cause of high chemical
oxygen demand content, toxicity, and biological degradation [268]. These unspent coloring
materials are discharged in water without passing from any treatment plant there by growing
aquatic pollution. These organic dyes are extremely colored polymer and have low bio-
degradability, they travel for long distances in regular stream of water, hinders photosynthetic
action, prevent the development of aquatic biota by hindering out sunlight and using dissolved
oxygen and it also reduce the regeneration value of stream. In the tropical country like India,
sunlight can be conveniently exploited for the irradiation of semi-conductor because it is one of
the plentifully available natural sources of energy. [269-270] These dyes contain the large
amounts of benzene rings, amino groups, naphthalene nuclei and azo groups, among others,
these are very difficult to dispose efficiently and completely, unfortunately these are very
common in dye structures [271]. Methylene blue (MB) dye is one of the most difficult to degrade
among the various dyes, therefore it is normally use to assess the activity of a photocatalyst as a
model dye contaminant for both in visible and in ultraviolet light irradiation [272-274]
1.4.5.1. Toxicity of Methylene blue and Methylene Orange
The toxic effects of the discharge of colored compounds on the ecological systems in the
environment have attracted much interest. Compare to others, azo dyes and thiazine dyes are the
two families of dyes which can cause serious health risk factors [275-276]. There are certain
aromatic amines used in azo-dye synthesis have makes the cause of bladder cancer. Moreover it
was also evaluated after extensive studies and research over on the effect of, variety of
chemicals on animal that, aromatic amines and azo compounds are cause of carcinogenic [277]
Methylene blue is major cause of effluent toxicity [278], genotoxicity [279, 280] and it is the
reason of following diseases hematotoxicity [281], microbial toxicity;[282] , mutagenicity[283],
neurotoxicity[284], nucleic acid damage[285, 286], photodynamic toxicity[287], reproductive
toxicity[288], teratogenicity[289] Methylene orange is not only Carcinogenicity; [290-292.] but
it also make the cause of genotoxicity;[ 279, 293-295] and mutagenicity [283, 296-298]
1.4.5.2. Removal Technique
A number of classical techniques have been applied to treat industrial effluents, but each one has
its own some limitations [268, 300-305]One of the main techniques used for pollution removal
from waste water is adsorption [306] which is common now a days. It has some drawbacks,
especially if we are dealing with toxic compounds or micro pollutants, is that what we actually
achieve is to accumulate and transfer the pollution load from the aqueous to the adsorbent phase.
We do not eliminate the pollutants but simply transfer the problem. Spent of adsorbent is also
kind of another hazardous waste and various pollutants used which were adsorbed may suffer
violent exothermically with adsorbent and may cause of explosion danger. It is well known that
adsorption is always an exothermic and desorption can thus be produced by increasing the
temperature of the adsorbent. Since the loading of the adsorbate is reduced at higher temperature.
Other techniques such as precipitation coprecipitation [307-314] are also used. However, these
approaches have been used extensively, in spite of several shortcomings: high operational and
waste treatment charges, extraordinary ingestion of expensive chemicals and huge volume of
sludge production [315-319]. The main drawbacks of all these old fashion methods are difficult
separation i.e. filtering or centrifugation, waste formation from both sludge and liquid, and it was
also faced in many circumstances that poor adsorption capacity of adsorbent occurs [320].
1.5. Photodegradation
The combination of the semiconductors nanoparticles with polymers, plastic, glass and other
semiconductors has proved to be an important initial step for the fabrication of many photonic as
well as optoelectronic devices [321]. Various inorganic-polymer nanocomposites composed of
several number of blends of two or more constituents have gain progressive consideration in
today’s world due to their remarkable potential uses and physical characteristics [322, 323]. Not
only these particles also have the positive characteristics of both metals and polymers, but they
also show several new characteristics, which are different from the both pure polymer and metal
[324]. Those materials which possess the delocalized conjugated structures have been
extensively experimented in this regard because of their relative slow charge recombination and
their speedy photoinduced charge separation [325]. For the stable photosensitizers to adjust the
band gap conjugated polymers are used with inorganic semiconductors in the fabrication of
electronic, optical and in the electronic photoelectric conversion devices [326, 327]. These are
also good hole transporters and efficient electron donors upon visible-light excitation [328]. The
extraordinary absorption coefficients in the visible portion of the spectrum, unexpected
movement of charge carriers with the brilliant environmental stability is shows by the conjugated
polymers which have extended π -conjugated electron systems e.g. polyaniline polypyrrole etc.
[329]. Being a conducting polymer polyaniline (PANI) also have an extended conjugated
electron system, proved to be a promising candidate, it does not only shows the great movement
of charge carriers but also have excellent absorption coefficients in visible portion of light and
[330-332]. Whenever polyaniline undergoes through photoexcitation, weather it is in partially
doped form or undoped form in both states it performs as electron donors and also act as a good
holes conductor, and it can carry current with number of milliamperes [321-335]. The
polyaniline has its some properties which are similar to metals for example, magnetic, electronic,
and optical, as well as it also has the properties of conventional polymers like flexibility and
processibility [336]. PANI has capability to upkeep positive charge carriers along with negative
charge carriers due to the existence of conjugated -electrons beside the main polymer chain
[337], it can be used in synthesis of heterostructure nanocomposites. Polyaniline semiconductor
nanocomposites are known to possess quite different chemical, physical, optical and electrical
properties from those characteristic of the parent polyaniline due to the interaction of delocalized
carriers between semiconductor quantum dots and PANI [338-340]. These nanocomposite
materials play a promising role in the manufacturing those electronic devices which have good
combination of outstanding magnetic, electronic and optical characteristics of metals and
polymers [341-342]. The efficient and equal separation of photoinduced charges is essential for
photo voltaic and photocatalytic applications, which is only provided by nanocomposites which
have large surface to volume ratio [343-344]. Several different composites of
polymer/semiconductor with different combinations of the two components have also been
reported [345-349]. Several reports have described the synthesis of photoactive nanocomposites
of polyaniline (PANI) with semiconductors such as PANI/BiVO4 [321], PANI/SnO2 [350],
PANI/CdS [351,], PANI/V2O5 [352,] and PANI/Fe3O4/SiO2/TiO2 [344,]. F. Wang et al [353,]
prepared PANI-sensitized TiO2 composite photocatalysts to improve the photocatalytic
efficiency of TiO2 nanoparticles in which PANI extend the photoresponse of TiO2 for
degradation of methylene blue. For the PANI and TiO2 it has been reported that in the, in the
conduction band of TiO2 polyaniline injected the excited electrons due to π – π transition under
the visible-light radiation, in this way the electrons are transported to an adsorbed electron
receiver for the production of oxygenous radicals [354]. H. Xu et al [355,] used MnO2/PANI
composite for degradation of organic dyes and Z. Liu et al [356,] also used PANI coated
TiO2/SiO2 nanofiber membranes for the degradation of dye pollutant.
1.5.1. Mechanism of Photodegradation
Photocatalytic reaction using semiconductor powders can effectively degrade many organic
pollutants, and even makes the compounds to be completely mineralized [357-362]. Different
transient species, for example radicals generated by bond homolysis or bond heterolysis, i.e.
photoionization, etc., as well as a number of photophysical processes (fluorescence,
phosphorescence, etc.) [363] with hydroxyl radical (HO.) by various different ways, giving rises
to induced photodegradation [364]. In the phenomena of photodegradation it was suggested that
one of the best active species was O−2 or OOH. The atoms which have the greatest electron
density in the normal state transferred the electron from the dye to the semiconductor. And
electron transported from the dye to the semiconductor is similar to reach from the atoms those
which have the greatest electron density in the regular state. Later on, at semiconductor surface
this atom becomes the ultimate location for the attack of superoxide anions radicals [365] as
suggested by Panchakarla LS [366] degradation reactions occurred between the metal and liquid
interface. The phenomena occur in the degradation process is, if the energy of incident light
falling on the surface of the photocatalyst is greater than the energy of the threshold limit value,
the photogenerated electrons are transferred from the valance bond to the conduction band and
leaving the positive holes after them in the valence bone. These holes directly oxidize the
impurities which are confined on the catalyst surface by surface hydroxyl groups to produce
hydroxyl radicals (OH.)[367]. These hydroxyl radicals decompose the dye into non-toxic
products. In this way conduction bands electrons react with dissolved oxygen molecules to
generate the superoxide anion radicals and it create hydroperoxy radicals upon the protonation
[368]. Moreover large surface area and low band gap energy of nanostructures are highly
favorable for the generation of maximum number of electron (e−) and hole (h+) pairs. It will
prohibited the 23recombination of the e-- and h+ pairs inside photocatalyst material, in this way
photocatalytic activity will enhance significantly [369]. It has been confirmed that the both
electrons and hydroxyl radicals transform amine functional groups are present in nitrogen
containing aromatic compounds, when they undergoes through the photodegradation phenomena
[370-371]. In the previous reports [370, 372-374], it was suggested that the maximum N-de-
alkylation proceed through the rout of production of nitrogen-centered radical, in spite the
damage of chromophore structures of dye which is followed by the generation of a carbon-
centered radical [372-373]. In the beginning of 10first two decades, photodegradation
characterization of dyes was carried out by UV active photocatalyst. And the scheme of general
degradation of dyes by the UV-active catalyst involved the photon absorption by the
photocatalyst, which combine the charge distribution and the generation of active species on the
photocatalyst surface. It was be suggested that in this mechanism the key active species, which
formed by the oxidation of water molecules from the photogenerated holes, are OH . radicals, and
the initial attack of the dye molecules is consider as oxidative [373. 375]. In case of
disappearance of color of azo dyes reflects there is an attack on the azo bond (C-N=N-) [376,]. It
followed that the opening of the aromatic rings occurred [377-378], so it can also be pointed out
that frequently observation of aromatic amines or phenolic compounds as intermediate products
is also found. This opening of the aromatic rings yields several kinds of carboxylic acids; these
carboxylic acids are eventually decarboxylate by the “photo-Kolbe” reaction to produce CO2. It
is also important to note that azo dyes, which consist of phenyl azo substitution, naphthol blue,
chromotrope 2R, etc. when degraded by hydroxyl groups, produce benzene as final product
[379]. Dyes containing nitrogen may generate NH+4, NO−3 and even N2, it depends upon the
nitrogen atoms initial oxidation state. Generally NH4 is produced by the amino group which
consists of nitrogen in the -3 oxidation state. Once ammonium ion formed, it will gradually
oxidize into nitrile ions photocatalytically [380]. As compare to N2, which exists is in its +1
oxidation state, is one of the most preferred end-product in the degradation of azo bonds. To
enhance the light utilization efficiency, several approaches have been established to plan the
oxides structures and their properties, such as doping with metal and nonmetal elements,
combination with other semiconductor materials, sensitization by organometallic dye molecules,
etc.[381-388] The combination of the semiconductors nanoparticles with polymers, plastic, glass
and other semiconductors has proved to be an important initial step for the fabrication of many
photonic as well as optoelectronic devices [321]. Various inorganic-polymer nanocomposites
composed with diverse combinations of two or more components have achieved higher and
progressive attention in today’s world due to their remarkable physical characteristics and
potential applications [322-323]. They show many new characteristics along with the
advantageous properties of both the metals and polymers which are different from individual
single phases [324]. In this way, the formation of a stepwise band gap structure in the composites
with other semiconductor materials has been found to lead to a superior photocatalytic
performance because they reduced recombination rate of photogenerated electron-hole pairs
[389]. The delocalized conjugated structures materials have been extensively experimented
because of their relatively slow charge recombination and rapid photoinduced charge separation
[325]. It is also observed that the polyaniline functional group amine and imine are predictable to
have strong affinity with metal ions [391-393] and being a conducting polymer with an
extended-conjugated electron system, proved to be a promising candidate due to high mobility of
charge carriers and its high absorption coefficients in visible-light range [330-332]. It is reported
that polyaniline has electronic, magnetic, and optical properties like metals along with the
flexibility and processibility of conventional polymers [336]. The presence of conjugated-
electrons in the backbone of polymer chain generates in capability to support the negative charge
and positive carriers also [157]. It was also reported that it is one of the best characteristic of
polyaniline that upon photoexcitation in its undoped or partially doped states, it is good electron
donor and excellent hole conductor because of this reason, it can carry current with several
milliamperes [321,333-335] Polyaniline-semiconductor nanocomposites are known to possess
quite different chemical, physical, optical and electrical properties from those characteristic of
the parent polyaniline due to the interaction of delocalized carriers between semiconductor
quantum dots and PANI [338-340]. These nanocomposites materials are ready to plays a central
role in the manufacturing of electronic devices with combine superior electronic, magnetic and
optical properties [340-342]. The large surface to volume ratio in nanocomposites enables an
efficient separation of photoinduced charges, which is important for photo voltaic and
photocatalytic applications [343-345]. There have been several reports describing the synthesis
of photoactive nanocomposites of polyaniline (PANI) with semiconductors such as PANI/TiO2
[346], PANI/BiVO4 [347], PANI/ SiO2 [348,], PANI /SnO2 [349], PANI/ CdS [350], PANI/V2O5
[351] and PANI/Fe3O4/SiO2/TiO2 [352]. Pan Xiong [353] reported that nanomaterial alone is
inactive photocatalyst but the combination of metal nanoparticles with PANI leads to high
photocatalytic activity for the degradation of the dyes. The enhancement in photoactivity is due
to transportation of excited state electrons of PANI to the conduction band (CB) of nanomaterial,
and holes i.e. photogenerated holes in the valence band (VB) of nanomaterial and it is their
nonstop migration to the HOMO of PANI, which effectively inhibiting a direct recombination of
holes and electrons.
1.6. Aim of Work
Owing to the rapid industrialization in recent decades, a huge amount of toxic effluent is being
discharged into various water bodies on a daily basis. These ongoing processes pose a serious
problem for the availability of safe water for drinking, household uses, agriculture, farming, etc.
Therefore, there appears to be an intimate shortage of clean water supply, which highlights the
urgent need for the purification of water, making waste water treatment an important issue of
concern.
A wide range of methods and technologies have been used to remove organic or inorganic
pollutants from water and waste-water to reduce their impact on the environment. These
methodologies involve adsorption on organic or inorganic materials, photocatalytic degradation,
oxidation processes, microbiological, or enzymatic decomposition. Of these, semiconductor
photocatalysis has been widely applied as a “green’’ technology for purification of air and the
elimination of organic contamination of water, and has become one of the most important
applied facets of heterogeneous catalysis.
Semiconducting metal oxide nanoparticles have long been explored as a photocatalytic material
for the degradation of pollutants. TiO2 has attracted considerable attention its photocatalytic
properties in their water splitting experiment. Similarly many other, metal oxide nanoparticles,
such as have been used to degrade non-biodegradable pollutants via photocatalytic routes.
My aim of study is to synthesize polyaniline nanocomposites with nano ferrites and multiferroics
and to study the application of these samples as photocatalyst for photo degradation of dyes. As
some dyes are very toxic so it is necessary to remove these dyes. First part deals with the
characterization of these samples and 2nd part deals with study of photo degradation of dyes in
the presence of our synthesis photocatalyst under the UV light.
As PANI (polyaniline) has also shown good potential for adsorbing dyes from the effluents. It
contains a number of imine and amine groups. PANI or nanomaterial alone are not a good
photocatalyst because in the presence of UV light electrons-holes recombine as they generate but
when they combined in the form of composite, recombination of electrons- holes is prohibited.
This phenomena is the basic reason of photodegradation of dyes
On the other hand, the photodegradation methodology is becoming popular now-a-days, because
of its cost effectiveness, low cost and user friendly/eco-friendly nature.
Chapter 2
Experimental
In the present study 12 samples of PANI/nanomaterial composites are prepared. It is done by
preparing three series of nanomaterial and the preparation of nanocomposites is carried out by
adding the nanomaterial during the preparation of polyaniline. For this purpose following
procedure is adopted.
2.1. Chemicals
The chemicals used in the synthesis of polyaniline and their composites with nanomaterial were
Bi(NO3)3 (Merck, ~75 %,), MnCl2.4H2O (Sigma-Aldrich, 98%), Al(NO3)3.6H2O (sigma-Aldrich,
99%), Aqueous NH3 (BDH, 35% purity). Fe(NO3)3·9H2O (98 %, Aldrich), Co(NO3)2·6H2O
(96%, Harris Reagent), NiCl2·6H2O (>99.5%, Merck), ZrOCl2·4H2O (96%, BDH), Aniline
chloride (99%, Merck), Ammoniumperoxy disulfate (97%, Merck), methanol (99.8%, Merck)
and acetone (98%, Merck), Methyl orange (92%, BDH), Methylene blue (95%, Merck). These
were used as such without further purification.
2.2. Preparation of Nanomaterial
All samples of nanomaterials were prepared by the chemical co-precipitation method. For this
purpose the stoichiometric molar solutions of metal salts were prepared in the deionized water
for each sample separately. Then the metal salts solutions of required samples were mixed in a
beaker and heated up to 60oC with continuous vigorous stirring. Ammonia solution (2M) was
added drop wise under the vigorous stirring to achieve the pH 11.0. The mixture was stirred
continuously for further 4 hours to obtain the homogeneity in the samples. The brown color
precipitates were obtained after addition of precipitating agent and were washed repeatedly with
deionized water until the pH reduced to 7.0. The precipitates were dried in an oven at 100oC and
finally annealed at 850oC in a box furnace (Vulcan A550) for 8 hours. The obtained powder was
used for further analysis.
2.3. Preparation of composite
The 0.2M aniline chloride solution was taken in a beaker and in this beaker weighed amount of
nanomaterial powder was added. After that 0.2 M ammonium peroxydisulphate was added in the
solution mixture drop wise with continuous stirring for 4–6 hours at temperature of 2-5°C.
Polymerization of aniline chloride was allowed to take place in the presence of fine graded
nanomaterial particles. The resulting precipitates were filtered and washed with acetone and
finally with deionized water until the filtrate becomes colorless. Acetone is used to dissolve any
unreacted aniline chloride. After washing, the precipitates were dried at 60–70°C in an oven. The
dried samples were grinded into a fine powder in a agate mortar pestle. These materials were
stored in desiccator and were used as photocatalyst for the degradation of methylene blue.
2.4. Characterization
2.4.1. X-ray diffraction (XRD)
For powder X-ray diffraction (XRD) analysis BRUKER D8 focus X-Ray diffractometer was used
to determine the purity and phase of substituted ferrite, it consists of Cu (K alph) as radiation
source at 40 kV and 40 mA. This technique is established on the Braggs law of diffraction. The
experiments executed at room temperature. The crystallite size of samples was calculated by
Scherer’s equation.
τ =Kλ
βCOSθ
Where τ is the mean size of the ordered (crystalline) domains, K is a dimensionless shape factor,
λ is the X-ray wavelength, β is the line broadening at half the maximum intensity (FWHM) in
radians and θ is the Bragg angle.
Electron beam after emitting the X-rays tube accelerated by high voltage field and are bombards
on target. A continuous spectrum of X-rays is produced after hitting of electrons with atoms in
the target and its speed becomes slow, which is named as Bremsstrahllung raditation. The high
energy electrons through the ionization process, emits inner shell electrons from the atoms. After
filling a shell from free electron, the X-ray photon is released having the energy characteristic to
the target material. Generally targets used in X-ray tubes include Cu and Mo, which emit 8 keV
and 14 keV with corresponding wavelength of 1.54 Å and 0.8 Å respectively.
X-rays first and foremost act together with electrons present in the atoms but the intensity
distribution of the waves is strongly modulated by diffraction of the waves cause by different
atoms present in the crystal. In this way it produces the diffraction of the waves in same periodic
manner. In this way measuring of diffraction pattern helps us to realize the distance between the
crystal planes [1-2].
Structure of polyaniline has been clarified by many researchers in the last thirty years [3-4].
However, the structural characteristics were investigated more in detail by Pouget et al. [5-6]
They reported two separate classes of emeraldine characterized by two different structures.
2.4.2. Scanning electron microscopy (SEM)
The surface morphology of the synthesized composite was determined by using field emission
scanning electron microscopy (HitachiS-4800 FESEM).
In the supervision of Max Knoll work for research and improvement on the electron microscopes
began in the 1920s. It was Ernst Ruska who worked for the improvement of electron lenses at the
Technical University of Berlin, Germany, in 1928 [7]. Ernst Ruska’s work was vital for
construction of an electron microscope in which lenses were required to channel the electrons of
the beam. Manfred von Ardenne invented the first scanning electron microscope in 1938 [8], it
generates the image of the sample with the help of electrons that gives to viewer the impression
of three dimensions, [9]. Scanning electron microscope has superior magnifying power which
could be applied to the study the structure of various materials [8].
Scanning Electron Microscopy (SEM) works by directing a beam of electrons to produce an
image from the surface of an article. This device is capable to describe an image with a range of
1 to 5 micrometers (10-6m) and exhibit the spatial differences within a material [10]
2.4.3. UV-Visible Spectroscopy
UV-Visible spectroscopy is a trustworthy and perfect analytical laboratory duty procedure that
permits for both qualitative and quantitative analysis of a substance.
Those atoms which absorb the light in the UV and visible regions of the electromagnetic
spectrum UV-Vis spectroscopy probe their electronic transition of molecules. The absorption of
UV and Visible light by different species can be define as, the species which have extended
system of alternation double and single bonds they will absorb UV light, and species having
color they will absorb visible light. In this way, it makes UV-Vis spectroscopy applications over
wide range of samples in multidiscipline fields [11]. For synthesis and photocatalytic
applications of materials, the Ultra-violet Visible (UV-Vis) Spectrometer is indispensible. It is
one of best application is that it identity the possibility of using the materials for photocatalytic
purpose either in the UV or visible light range, therefore we can suggest that UV-Vis spectra
define the material uniquely. To be more specific, the UV-Vis Spectra give the information
necessary to decide the maximum wavelength (minimum frequency and energy) required in the
incoming light source in order to excite the photocatalyst. The spectra generated here is due to
the optical transitions of electrons from valence band to conduction band. The UV-Vis spectra is
also a signature for a molecule with conjugated pi-electrons such as MO and MB dye, the test
dyes we used to evaluate the photocatalytic properties of Composite in this project. From the
spectra, we can decide important information like the maximum absorption wavelength of the
test dyes solutions, and evaluate any change in the absorbance of the dyes after irradiated for
certain period of time.
In this project, the UV-Vis transmission spectra of the synthesized composites arrays were
recorded by the UV-Visible/NIR spectrophotometer (Lambda 750 Shimadzu) over wavelength of
300-800nm, in order to determine the proper wavelength of the incoming light source. The UV-
Vis absorption spectra of MO and MB solutions before and after irradiation were also obtained
using the same equipment, as described in detail in the following section
2.4.4. X-ray Photoelectron Spectrometer (XPS)
The oxidation states of the elements were determined by using ESCALAB 250Xi X-ray
photoelectron spectrometer (XPS) analysis. The UV-irradiation was provided by a high pressure
mercury lamp (OSRAM 300 W).
XPS works on the basis of the photoelectric effect [12]. When a photon impinges upon an atom,
the energy of the photon might be totally transferred to an electron and excite the emission of the
electron from the atom. In XPS, X-ray as the irradiation source, can penetrate the sample on the
scale of 1000 eV are only able to penetrate less than 10nm. In XPS, only the photoelectrons
possessing characteristic emission energies will contribute to the photoemission peaks, while
electrons emitted form the surface zone that have lost some energy due to inelastic interactions
will form a scattering background. The process shows that the binding energy of the electron in
the atom is determined by the initial state and final state of the electrons. The core electron of
element has a unique binding energy, which can be seen as a “fingerprint”. Hence through the
analysis of the binding energy of defined elements, the chemical composition of a sample can be
obtained. Upward shifts in binding energies result from a decrease in electron density around the
nucleus (i,e from oxidation), whereas downward shifts result from an increase electron density
around the nucleus. The binding energy is also determined by the final state which is mainly
dependent on the relaxation effect in solids.
2.4.5. FTIR (Fourier Transform Infrared) Spectroscopy
FTIR spectroscopy is a good selection to study the molecular structures and their bonding
both for organic and inorganic materials. It can also identify the unknown elements present
in the specimen. The working principle of FTIR is that, every group of atoms in molecule
and their bonds vibrate with specific and characteristics frequency. Molecules of the
material absorbed the infrared radiations of the same energy which is the characteristics of
that material. Spot is inserted on sample for the modulation of IR beam.
There are different ranges in which the atoms shows different peaks due to vibration in FTIR
spectra e.g. adsorption bands appears in the range of 4000-1500 wave-numbers normally
revealed by functional groups CH3, N-H, C=O, OH< etc. and 1500-400 wave-numbers regions
are referred as finger print region. Compound quantitative concentration is determined by
measuring the area under in characteristics IR region curve.
2.5. Photodegradation Study
In the photodegradation study, 40 mL of methylene blue (MB) solution (10-5 ML-1 ) was taken
Four samples containing 40 ml of MB and 0.2g of each composite having different Nps 12.5%,
25%, 37.5% and 50%wt were taken as photocatalyst with dyes solution. After every 30 minutes
the dye solution was taken out from the photo reactor and centrifuge at 2000 rpm. The
absorbance of the solution was measured at wavelength of 665nm which is the λmax of methylene
blue. Similar procedure was repeated for methylene orange (MO) at λmax value 464nm.
The concentration of the compound in the solution is determined by absorbance because both of
these are directly proportional each other, as described by the Beer-Lambert Law:
A = εbC (2)
Where A is absorbance (no units), ɛ is the molar absorptivity (L mol-1cm-1), b is the path length
of the sample solution in the cuvette (cm), and C is the concentration of the compound is the
solution (moles L-1). The photodegradation efficiency can be calculated by the equation
Efficiency = Ci − Cr
Ci × 100 (2)

Where ci is the initial and cr is the remaining concentration of the dye MO at 464 nm as
measured by the UV-Vis spectrophotometer.
Chapter 3
Results and discussions
In the present study 12 samples of PANI/nanomaterial composites are prepared. It is done by
preparing three series of nanomaterial and the preparation of nanocomposites is carried out by
adding the nanomaterial during the preparation of polyaniline. Conformation of formation of
composite is done by using different characterization such as FTIR study, UV/Visible
spectroscopy, XRD, and XPS. After the confirmation of formation of composite from these
characterizations, we carried out its surface study by using the BET and Scanning electron
microscopy. The surface study indicates the formation of pores and sites which can be
available not only for the adsorption but also cause of increase in surface area.
Organic dyes which may be cationic or anionic in nature have large applications in textile
industry such as methylene blue and methylene orange. Including their positive usage they
also have their some negative aspects such as carcinogenic nature of these dyes is one of the
worst impact on human bodies when these dyes injecting into river, stream or underground
water. To reduce or minimize this impact of dyes, we used our synthesized catalyst in the
presence of UV light for their degradation and find application for degradation of both types
of dyes positive results.
3.1. UV/Visible spectroscopy
The UV/Visible spectra for PANI, NiFe1.2 Zr0.4Co0.4O4 and its composites are shown in Fig.
1(a). It is clear from the figure that three distinct peaks at 373, 417 and shoulder at 526 nm
were observed for pure PANI. The peaks appeared at 373 and 417 nm correspond to exciton
absorption of the quinoid ring and the π–π* transition of the benzenoid ring, respectively [5-
6.]. The peak at 417 is recognized to the localized polarons and characteristic of the
protonated polyaniline [7]. The shoulder at 526 nm was for the benzenoid to quinoid ring
excitonic transition [8] and also corresponds to the n-π* transitions of quinine imine groups
[9]. In UV spectra of nanocomposites when nanomaterial particles were dispersed in the
PANI matrix, a significant change was observed measured in the absorption spectra. The
shapes of UV spectra of nanocomposites were similar to those of pure PANI but certain
shifting in the peaks from 373 to 337, 417 to 396, and 526 to 480 was observed. The shifting
of peaks towards high energy and shorter wavelength increases with the concentration of
nanomaterial in composites. The spectral changes to the lower wavelength of the composite
samples indicate that the coordination of the nanomaterial particles to the nitrogen atoms
permitted the nanoparticles to interact with each other through the π-conjugate chain and also
indicates the formation of a complex between the polyaniline and the nanoparticles [10].
UV/visible spectra of all, PANI/nanomaterial composites samples shows that the intensity of
π–π* transition peak at 417 nm and excitonic transition peak at 526 nm increased compared to
that of pure PANI.
This increase in intensity of peaks suggests that there is interaction between dopant metal
complex and the polyaniline backbone chains which increases the number of charge carriers
[11]. This increase in number of charge carriers was fairly high in the excitonic transition peak
(526) as compare to π–π* transition peak which shows low trend. It indicates the presence of
interaction between the nanoparticles and quinoid rings in polymer chain which effect on
excitonic peak and resulted in a possible complexation [12].
UV/Visible spectra for the second series of PANI, NiFeZr0.5Co0.5O4 and its composites are
shown in Fig. 1(b). In the combine spectra of PANI, nanomaterial, and PANI/ NiFeZrCoO4
composite shifting of peaks towards the shorter wavelength is observed in case of composites.
The increase in intensity of peaks indicate the presence of interaction between dopant metal
complex and the polyaniline main carbon chain, in this way increase in the number of charge
carriers take place [10]. It also indicates that the coordination of the nano particles to the nitrogen
atoms permitted them to interact with each other through the π-conjugate chain and formation of
a complex between polyaniline and nanomaterial particles [11]. Compared to PANI, the peak
shift from 417 nm to 402 nm indicated that PANI is protonated in the synthesized composite and
confirmed the strong interaction between the PANI polymer and nanomaterial. Similar results
were also reported by V. H. Nguyen for the carbon nanotubes/polyaniline nanocomposites [13].
In the 4th sample of the series it was also observed that not only peak at 526 nm of benzenoid to
quinoid ring excitonic transition become stronger but it also shifted to 512 nm and becomes
invisible due to shielded by a new absorption peak at 561--594 which is characteristic peak of
pure nanomaterial. It verifies that it is not a simple mixing process between the PANI and
nanomaterial and the resulted PANI/nanocomposite could be best selection as photocatlysis
material. These results well match with the already reported for PANI-TiO2 by R. Yang, et, al.
[14].
The UV/Visible spectra for PANI, multiferroics and its composites are shown in Fig. 1(C). It
was observed that all characteristic peaks of PANI present in PANI/nanomaterial composite
along with some certain shifts of peaks , but there are certain shifts of peaks related to PANI was
observed. The shifting of peaks slightly towards lower wavelength side is observed; especially
emerging of bands at 370 wavelengths is prominent. The bands shifting in the spectra of
PANI/nanomaterial composite indicate that nanomaterial interacts strongly with PANI and
shows the influence of doping on composite spectra. Moreover it also exhibit the free carrier tail,
which indicates the conversion of localized polaron to the delocalized polaron free carrier tail
absorption similar result were also reported by Patil et, al. [15].
When spectra of nanocomposite are compared with pure PANI blue shift is observed. This blue
shift of absorption bands is evidence of interaction between ferric ions of nanomaterial with
nitrogen atom of PANI. It also confirms the presence of nanomaterial in the nanocomposites
[16]. This shift also shows shortening in the conjugation length that reported previously [17] or
may be the coordinating complex formation between NPs and PANI chains. The blue shifted
may depends on nanomaterial particles concentration in composite and concentration of
nanomaterial particles also affected on redistribution of polaron density in the band gap of PANI
emeradine. The blue shift and change in the intensity of absorption spectra of composite
suggested strong interaction between PANI and nanomaterial [18-19]. The spectral changes
indicate that the coordination of the dopant particles to the nitrogen atoms permitted the
nanoparticles to interact with each other through the π-conjugate chain and the formation of a
complex between the polyaniline and nanoparticles [10].
These blue shifts indicate that there may be an increase in band gap energy which is due to an
increase in the torsion angle between adjacent rings. This blue shift also confirms the
incorporation of nanoparticles in PANI matrix and make the causes of the change in
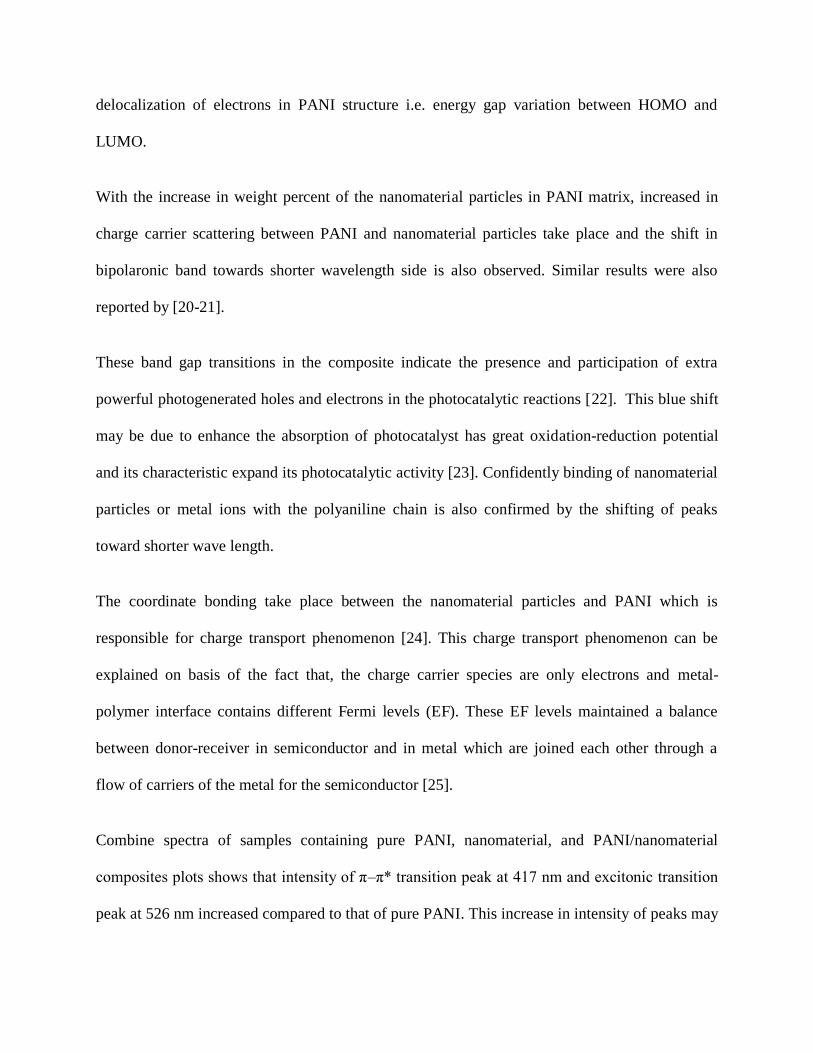
delocalization of electrons in PANI structure i.e. energy gap variation between HOMO and
LUMO.
With the increase in weight percent of the nanomaterial particles in PANI matrix, increased in
charge carrier scattering between PANI and nanomaterial particles take place and the shift in
bipolaronic band towards shorter wavelength side is also observed. Similar results were also
reported by [20-21].
These band gap transitions in the composite indicate the presence and participation of extra
powerful photogenerated holes and electrons in the photocatalytic reactions [22]. This blue shift
may be due to enhance the absorption of photocatalyst has great oxidation-reduction potential
and its characteristic expand its photocatalytic activity [23]. Confidently binding of nanomaterial
particles or metal ions with the polyaniline chain is also confirmed by the shifting of peaks
toward shorter wave length.
The coordinate bonding take place between the nanomaterial particles and PANI which is
responsible for charge transport phenomenon [24]. This charge transport phenomenon can be
explained on basis of the fact that, the charge carrier species are only electrons and metal-
polymer interface contains different Fermi levels (EF). These EF levels maintained a balance
between donor-receiver in semiconductor and in metal which are joined each other through a
flow of carriers of the metal for the semiconductor [25].
Combine spectra of samples containing pure PANI, nanomaterial, and PANI/nanomaterial
composites plots shows that intensity of π–π* transition peak at 417 nm and excitonic transition
peak at 526 nm increased compared to that of pure PANI. This increase in intensity of peaks may
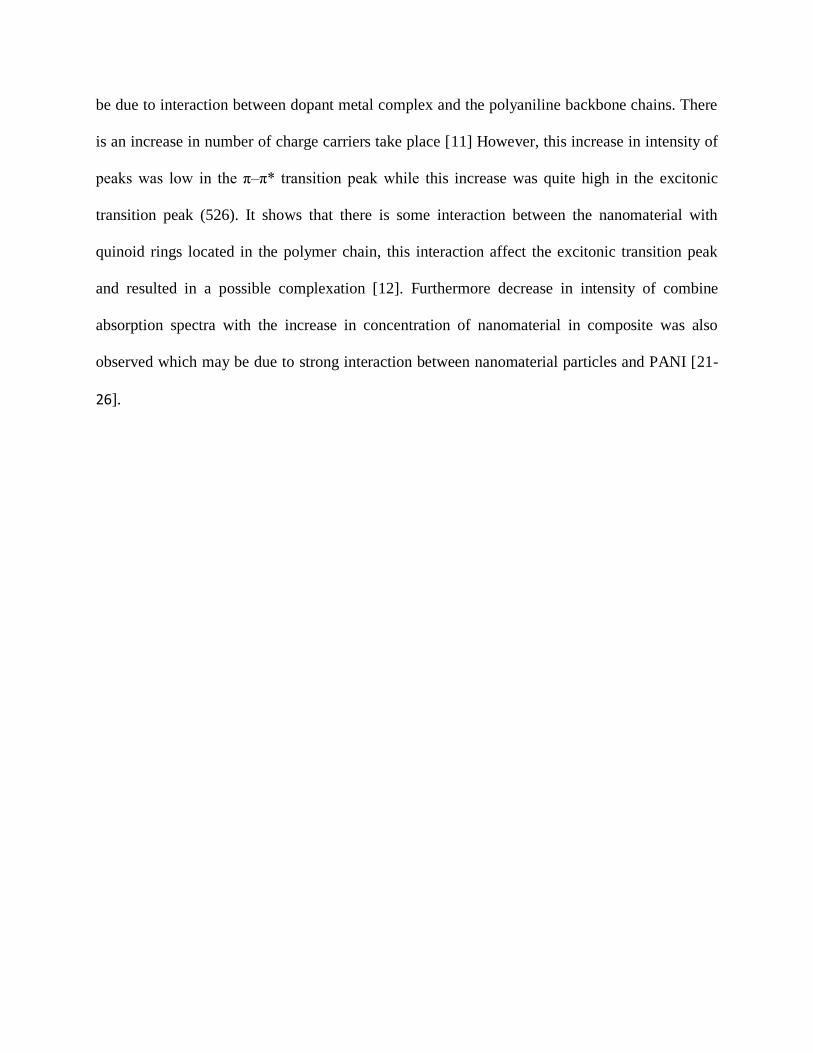
be due to interaction between dopant metal complex and the polyaniline backbone chains. There
is an increase in number of charge carriers take place [11] However, this increase in intensity of
peaks was low in the π–π* transition peak while this increase was quite high in the excitonic
transition peak (526). It shows that there is some interaction between the nanomaterial with
quinoid rings located in the polymer chain, this interaction affect the excitonic transition peak
and resulted in a possible complexation [12]. Furthermore decrease in intensity of combine
absorption spectra with the increase in concentration of nanomaterial in composite was also
observed which may be due to strong interaction between nanomaterial particles and PANI [21-
26].
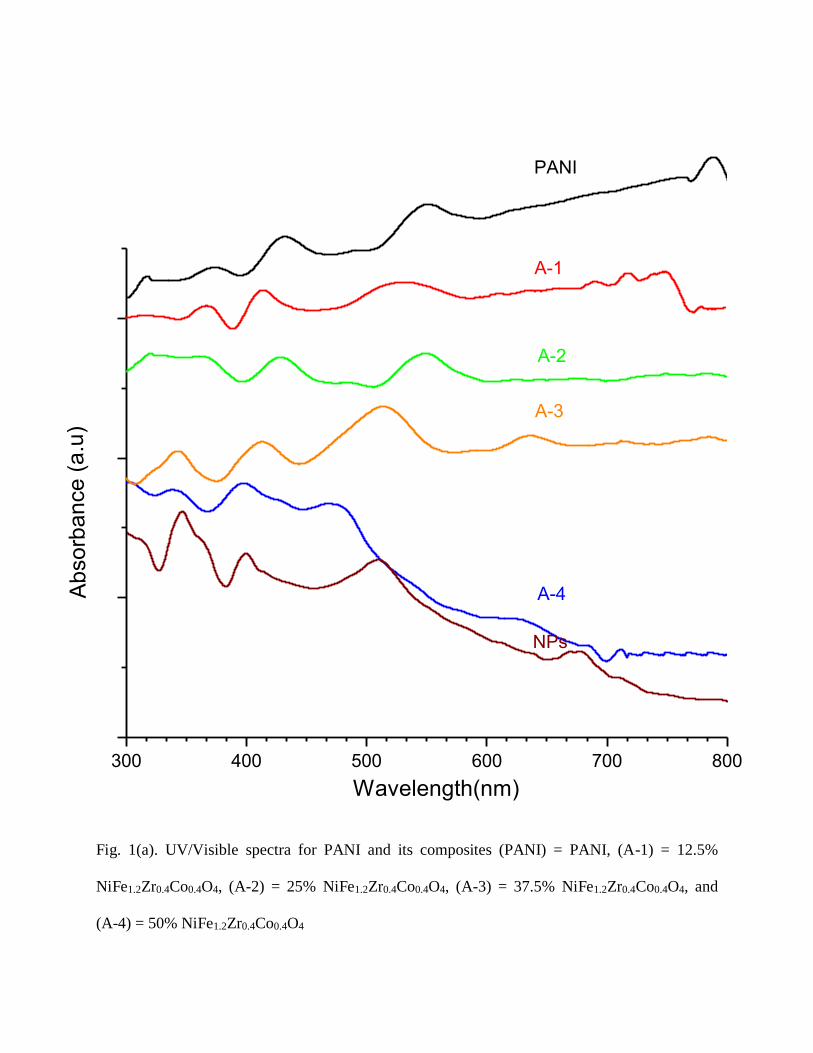
400 600 800
300 400 500 600 700 800
PANI
A-1
Ab
so
rba
nce
(a
.u)
A-2
A-4
Wavelength(nm)
NPs
A-3
Fig. 1(a). UV/Visible spectra for PANI and its composites (PANI) = PANI, (A-1) = 12.5%
NiFe1.2Zr0.4Co0.4O4, (A-2) = 25% NiFe1.2Zr0.4Co0.4O4, (A-3) = 37.5% NiFe1.2Zr0.4Co0.4O4, and
(A-4) = 50% NiFe1.2Zr0.4Co0.4O4
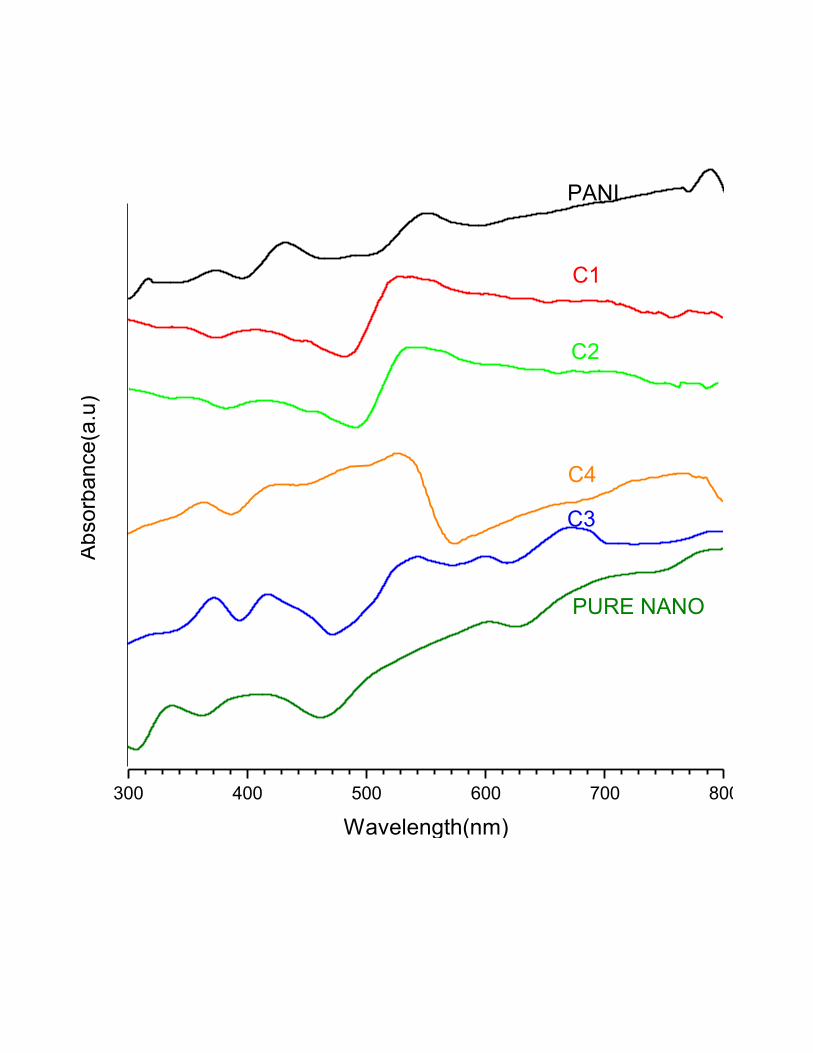
300 400 500 600 700 800
C1
C2
C3
Ab
so
rba
nce
(a.u
)
C4
PURE NANO
Wavelength(nm)
PANI

Fig. 1(b). UV/Visible spectra for PANI and its composites. (PANI) = PANI, (C-1) = 12.5%
NiFeZr0.5Co0.5O4, (C-2) = 25% NiFeZr0.5Co0.5O4, (C-3) = 37.5% NiFeZr0.5Co0.5O4, and (C-4) =
50% NiFeZr0.5Co0.5O4.
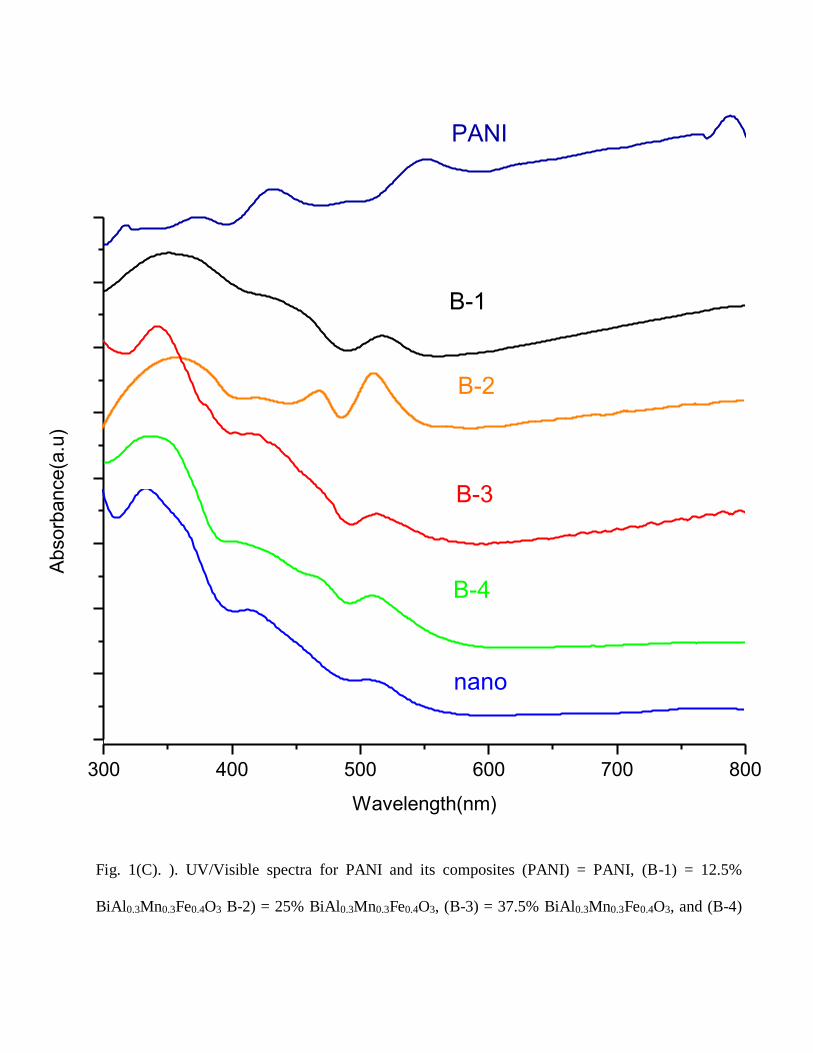
300 400 500 600 700 800
300 400 500 600 700 800
B-1
PANI
B-2
B-3
Wavelength(nm)
B-4
Absorb
ance(a
.u)
nano
Fig. 1(C). ). UV/Visible spectra for PANI and its composites (PANI) = PANI, (B-1) = 12.5%
BiAl0.3Mn0.3Fe0.4O3 B-2) = 25% BiAl0.3Mn0.3Fe0.4O3, (B-3) = 37.5% BiAl0.3Mn0.3Fe0.4O3, and (B-4)
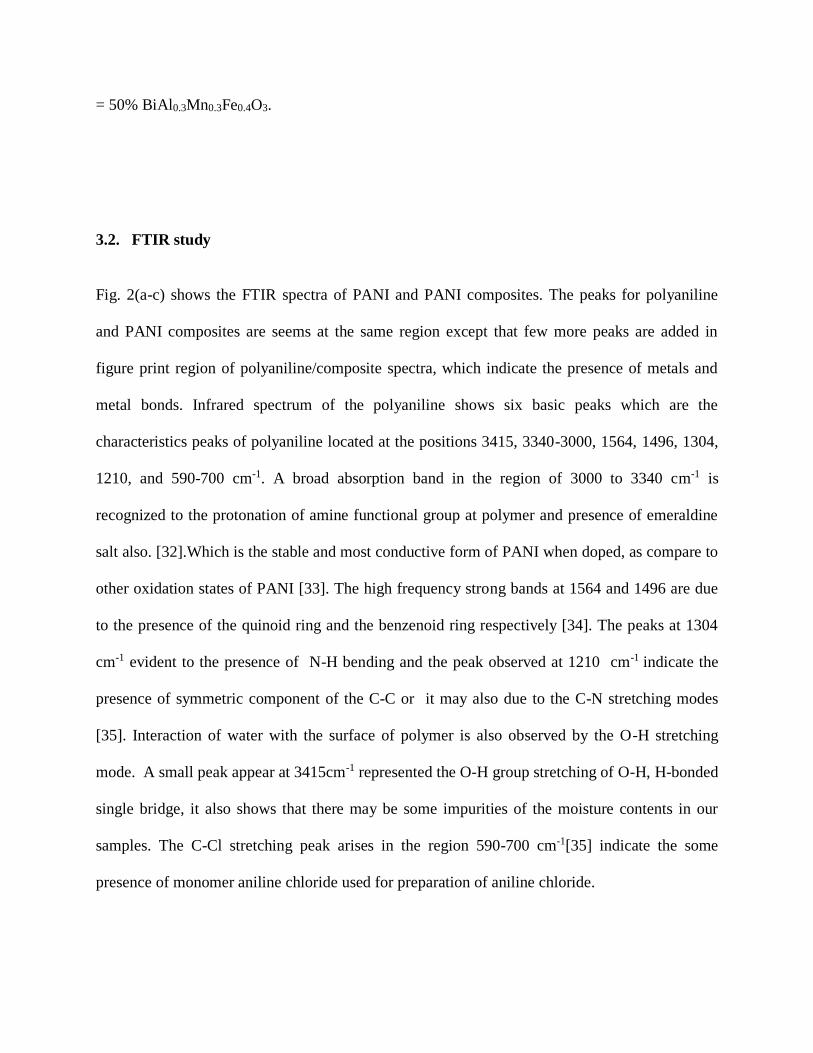
= 50% BiAl0.3Mn0.3Fe0.4O3.
3.2. FTIR study
Fig. 2(a-c) shows the FTIR spectra of PANI and PANI composites. The peaks for polyaniline
and PANI composites are seems at the same region except that few more peaks are added in
figure print region of polyaniline/composite spectra, which indicate the presence of metals and
metal bonds. Infrared spectrum of the polyaniline shows six basic peaks which are the
characteristics peaks of polyaniline located at the positions 3415, 3340-3000, 1564, 1496, 1304,
1210, and 590-700 cm-1. A broad absorption band in the region of 3000 to 3340 cm-1 is
recognized to the protonation of amine functional group at polymer and presence of emeraldine
salt also. [32].Which is the stable and most conductive form of PANI when doped, as compare to
other oxidation states of PANI [33]. The high frequency strong bands at 1564 and 1496 are due
to the presence of the quinoid ring and the benzenoid ring respectively [34]. The peaks at 1304
cm-1 evident to the presence of N-H bending and the peak observed at 1210 cm-1 indicate the
presence of symmetric component of the C-C or it may also due to the C-N stretching modes
[35]. Interaction of water with the surface of polymer is also observed by the O-H stretching
mode. A small peak appear at 3415cm-1 represented the O-H group stretching of O-H, H-bonded
single bridge, it also shows that there may be some impurities of the moisture contents in our
samples. The C-Cl stretching peak arises in the region 590-700 cm-1[35] indicate the some
presence of monomer aniline chloride used for preparation of aniline chloride.
The FTIR spectra of the both PANI/Zr-Co substituted composites are similar as shown in the
Fig. 2(a-b). The spectra of the composites show some additional peaks in addition to the pure
PANI peaks which confirm the formation of composite with spinel ferrites. Spinel ferrites shows
two high frequency absorption bands in range of 800-400 cm-1 due to tetrahedral and octahedral
M-O stretching vibrations respectively [36]. The band at 435.93cm-1 for the presence of NiO [37]
and the band at 1076.8 cm-1 are attributed to the existence of Co-substituted spinel ferrites in the
composites structures [38]. The composite spectra also indicate the bands around 540-466 cm−1
which are assigned to Fe-O stretching [39].
In case of PANI/nanoferric composites as shown in the Fig. 2(c) the peaks observed in the ranges
of 500, 689, 745 cm-1 are specified for metals. The peak at 500 cm−1 is for the stretching
vibrations of Bi-O [40-41] and peak at 689 cm-1 is due to A1- 0 stretching [54]. Mn–O band
appears at 745 cm−1 in [42] and Fe-O stretching band around 540-466 cm−1 [43] in composite
spectra.
When the FTIR spectra of pure PANI and PANI/composites are compared, it is observed that the
peaks which are corresponding to pure polyaniline are shifted towards higher wave number side.
It is because there exists an interaction between the polymer and the nanomaterial molecules in
the PANI/composite. Another difference between the PANI and PANI/nanomaterial composite is
also observed, the intensity ratio is different for the benzoid and quinoid bands. In case of pure
PANI the intensity of the benzoid band is stronger as compare to quinoid band but this ratio of
the benzoid/quinoid intensity ratio is reduced considerably in composite spectra. Which reveal
that there are lesser benzenoid units in the nanocomposites compared to pure PANI and
nanomaterial promotes the stabilization of quinoid ring structure in the nanocomposites.
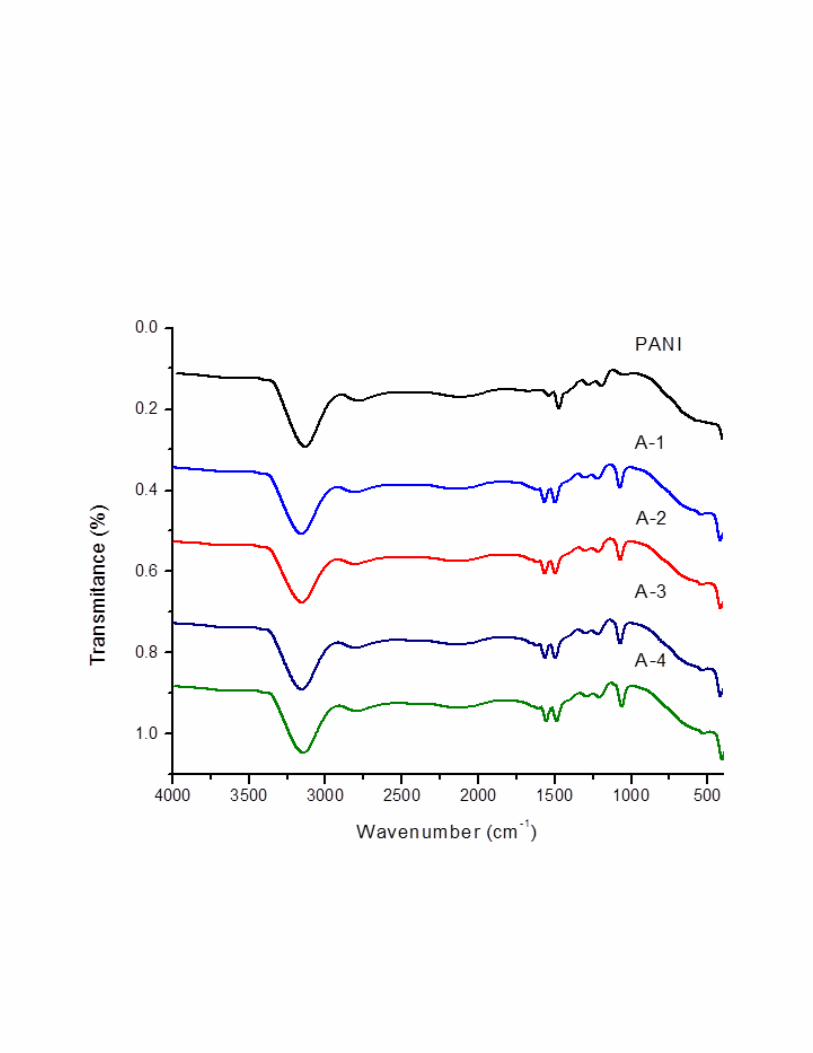
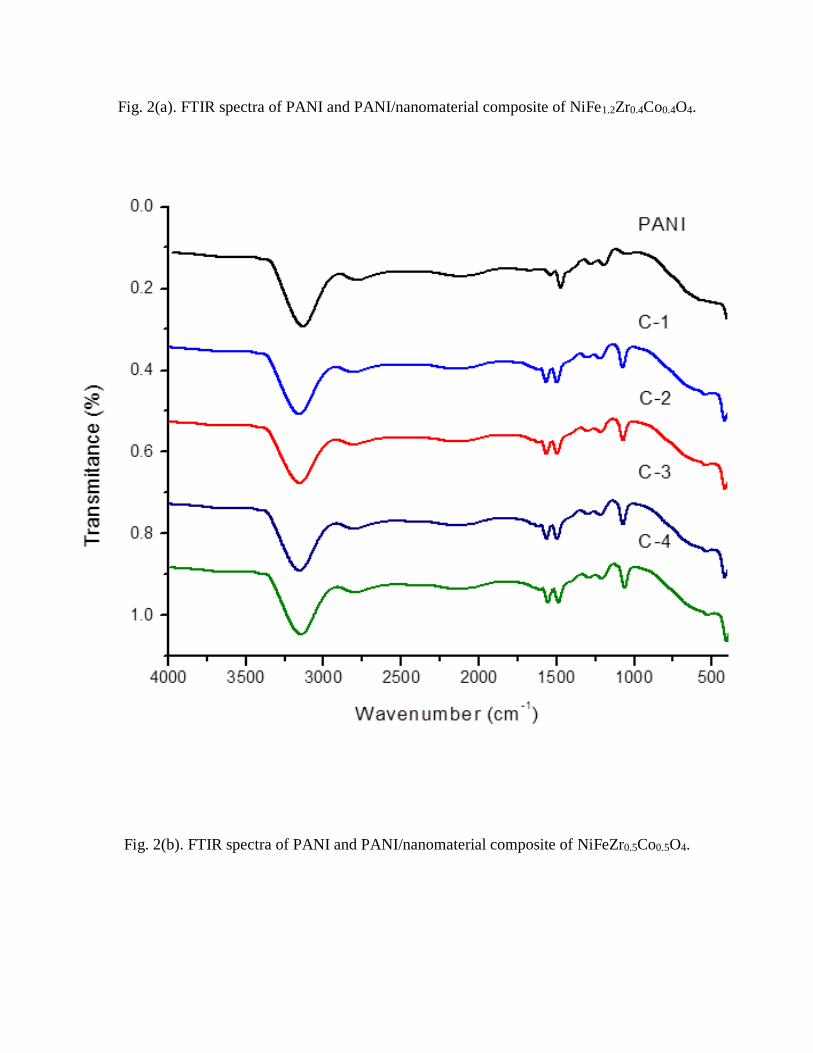
Fig. 2(a). FTIR spectra of PANI and PANI/nanomaterial composite of NiFe1.2Zr0.4Co0.4O4.
Fig. 2(b). FTIR spectra of PANI and PANI/nanomaterial composite of NiFeZr0.5Co0.5O4.
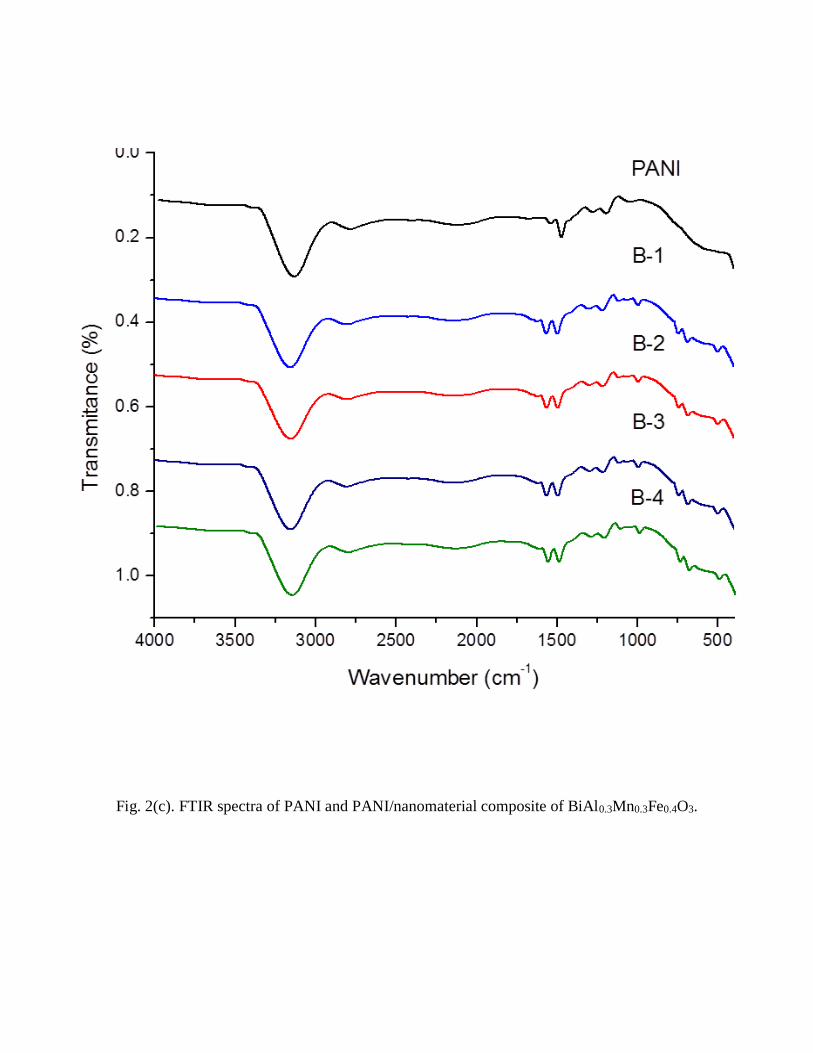
Fig. 2(c). FTIR spectra of PANI and PANI/nanomaterial composite of BiAl0.3Mn0.3Fe0.4O3.
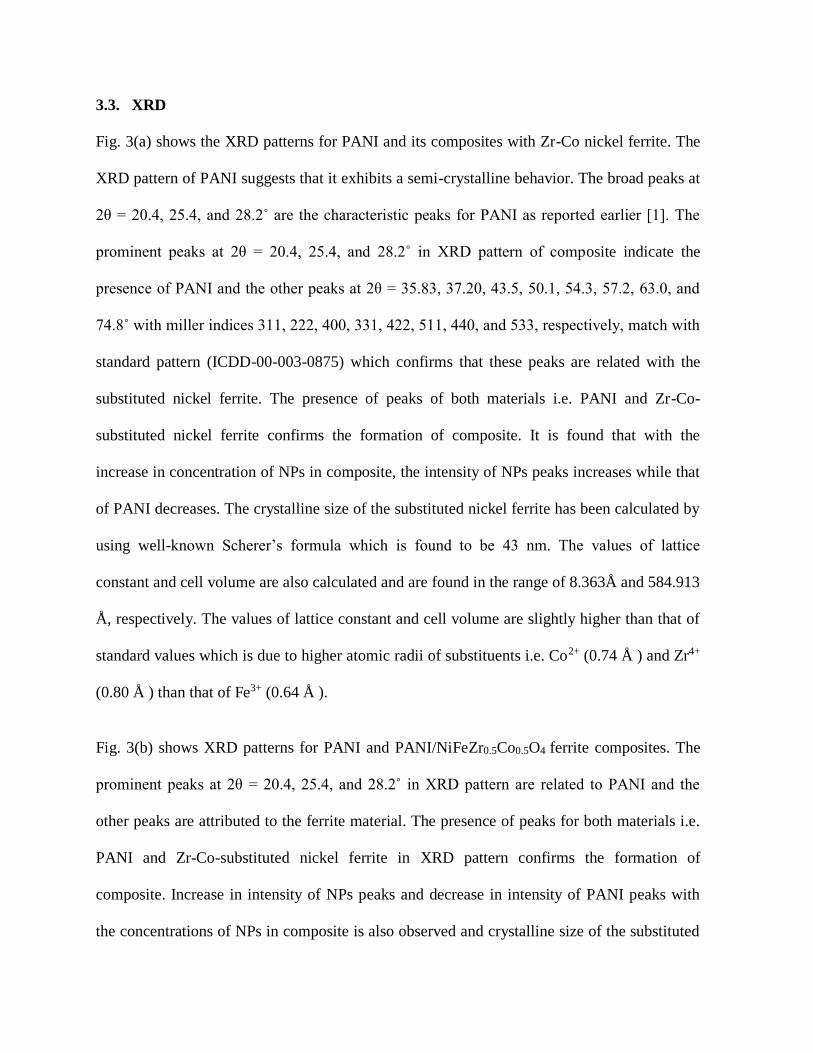
3.3. XRD
Fig. 3(a) shows the XRD patterns for PANI and its composites with Zr-Co nickel ferrite. The
XRD pattern of PANI suggests that it exhibits a semi-crystalline behavior. The broad peaks at
2θ = 20.4, 25.4, and 28.2˚ are the characteristic peaks for PANI as reported earlier [1]. The
prominent peaks at 2θ = 20.4, 25.4, and 28.2˚ in XRD pattern of composite indicate the
presence of PANI and the other peaks at 2θ = 35.83, 37.20, 43.5, 50.1, 54.3, 57.2, 63.0, and
74.8˚ with miller indices 311, 222, 400, 331, 422, 511, 440, and 533, respectively, match with
standard pattern (ICDD-00-003-0875) which confirms that these peaks are related with the
substituted nickel ferrite. The presence of peaks of both materials i.e. PANI and Zr-Co-
substituted nickel ferrite confirms the formation of composite. It is found that with the
increase in concentration of NPs in composite, the intensity of NPs peaks increases while that
of PANI decreases. The crystalline size of the substituted nickel ferrite has been calculated by
using well-known Scherer’s formula which is found to be 43 nm. The values of lattice
constant and cell volume are also calculated and are found in the range of 8.363Å and 584.913
Å, respectively. The values of lattice constant and cell volume are slightly higher than that of
standard values which is due to higher atomic radii of substituents i.e. Co2+ (0.74 Å ) and Zr4+
(0.80 Å ) than that of Fe3+ (0.64 Å ).
Fig. 3(b) shows XRD patterns for PANI and PANI/NiFeZr0.5Co0.5O4 ferrite composites. The
prominent peaks at 2θ = 20.4, 25.4, and 28.2˚ in XRD pattern are related to PANI and the
other peaks are attributed to the ferrite material. The presence of peaks for both materials i.e.
PANI and Zr-Co-substituted nickel ferrite in XRD pattern confirms the formation of
composite. Increase in intensity of NPs peaks and decrease in intensity of PANI peaks with
the concentrations of NPs in composite is also observed and crystalline size of the substituted
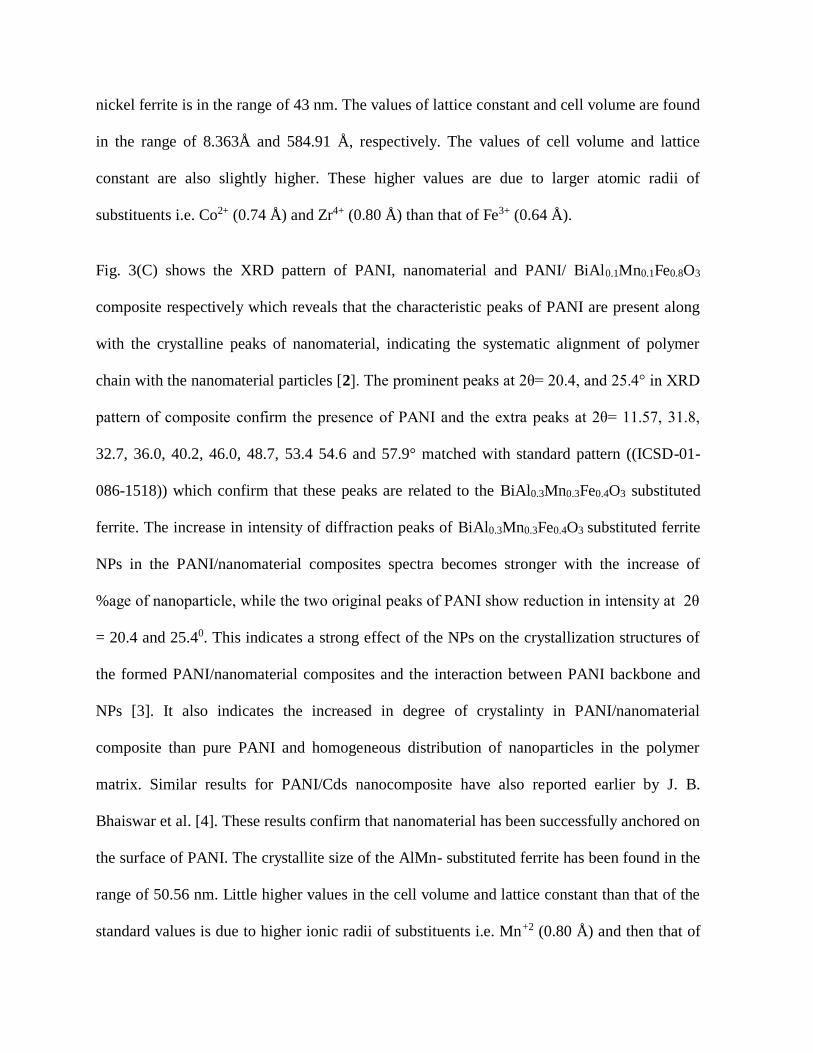
nickel ferrite is in the range of 43 nm. The values of lattice constant and cell volume are found
in the range of 8.363Å and 584.91 Å, respectively. The values of cell volume and lattice
constant are also slightly higher. These higher values are due to larger atomic radii of
substituents i.e. Co2+ (0.74 Å) and Zr4+ (0.80 Å) than that of Fe3+ (0.64 Å).
Fig. 3(C) shows the XRD pattern of PANI, nanomaterial and PANI/ BiAl0.1Mn0.1Fe0.8O3
composite respectively which reveals that the characteristic peaks of PANI are present along
with the crystalline peaks of nanomaterial, indicating the systematic alignment of polymer
chain with the nanomaterial particles [2]. The prominent peaks at 2θ= 20.4, and 25.4° in XRD
pattern of composite confirm the presence of PANI and the extra peaks at 2θ= 11.57, 31.8,
32.7, 36.0, 40.2, 46.0, 48.7, 53.4 54.6 and 57.9° matched with standard pattern ((ICSD-01-
086-1518)) which confirm that these peaks are related to the BiAl0.3Mn0.3Fe0.4O3 substituted
ferrite. The increase in intensity of diffraction peaks of BiAl0.3Mn0.3Fe0.4O3 substituted ferrite
NPs in the PANI/nanomaterial composites spectra becomes stronger with the increase of
%age of nanoparticle, while the two original peaks of PANI show reduction in intensity at 2θ
= 20.4 and 25.40. This indicates a strong effect of the NPs on the crystallization structures of
the formed PANI/nanomaterial composites and the interaction between PANI backbone and
NPs [3]. It also indicates the increased in degree of crystalinty in PANI/nanomaterial
composite than pure PANI and homogeneous distribution of nanoparticles in the polymer
matrix. Similar results for PANI/Cds nanocomposite have also reported earlier by J. B.
Bhaiswar et al. [4]. These results confirm that nanomaterial has been successfully anchored on
the surface of PANI. The crystallite size of the AlMn- substituted ferrite has been found in the
range of 50.56 nm. Little higher values in the cell volume and lattice constant than that of the
standard values is due to higher ionic radii of substituents i.e. Mn+2 (0.80 Å) and then that of

Fe3+ (0.64 Å). The XRD studies of all these variety of composites confirmed that the
composites are successfully formed.
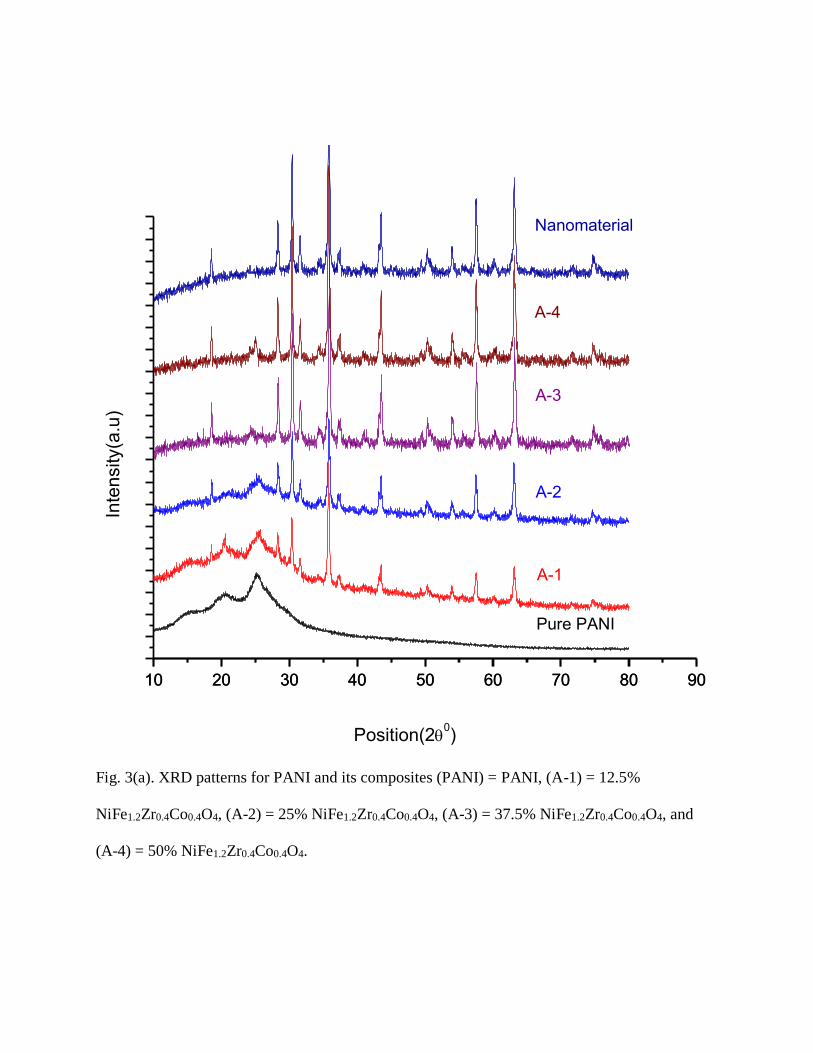
10 20 30 40 50 60 70 80 9010 20 30 40 50 60 70 80 90
Pure PANI
A-1
A-2
A-3
A-4
Position(20)
Inte
nsity(a
.u)
Nanomaterial
Fig. 3(a). XRD patterns for PANI and its composites (PANI) = PANI, (A-1) = 12.5%
NiFe1.2Zr0.4Co0.4O4, (A-2) = 25% NiFe1.2Zr0.4Co0.4O4, (A-3) = 37.5% NiFe1.2Zr0.4Co0.4O4, and
(A-4) = 50% NiFe1.2Zr0.4Co0.4O4.
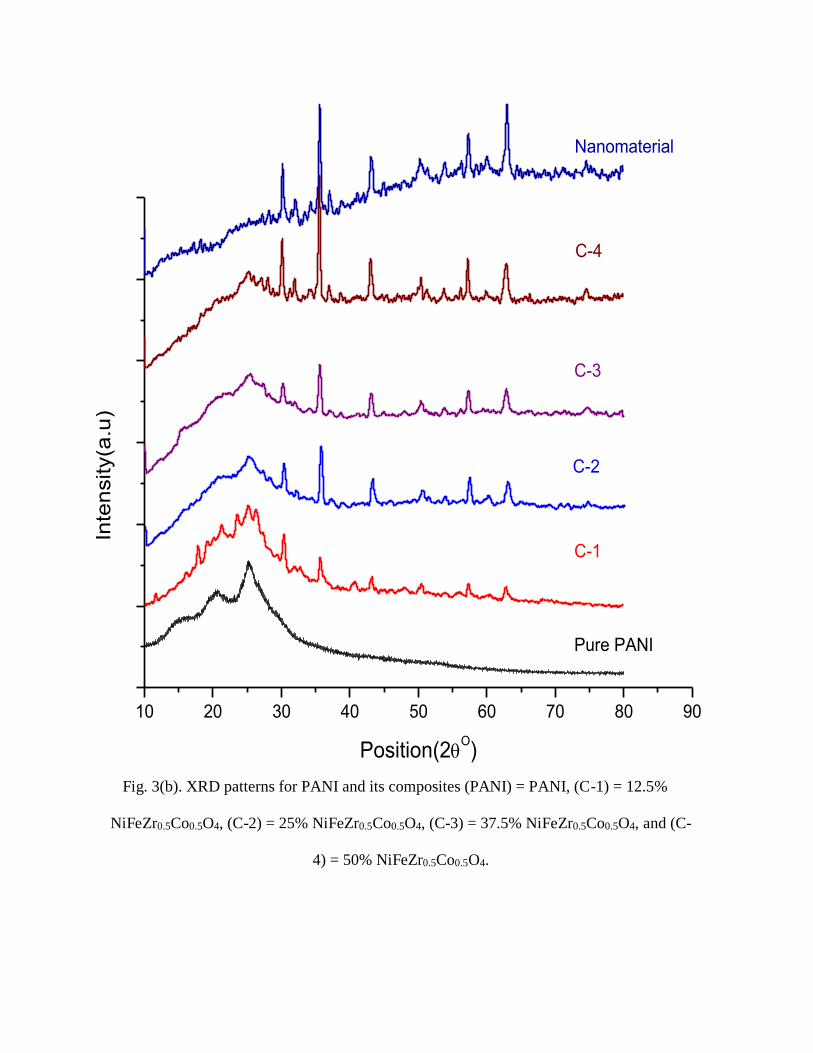
10 20 30 40 50 60 70 80 90
Position(2O)
Pure PANI
Inte
nsity(a
.u)
C-1
C-2
C-3
C-4
Nanomaterial
Fig. 3(b). XRD patterns for PANI and its composites (PANI) = PANI, (C-1) = 12.5%
NiFeZr0.5Co0.5O4, (C-2) = 25% NiFeZr0.5Co0.5O4, (C-3) = 37.5% NiFeZr0.5Co0.5O4, and (C-
4) = 50% NiFeZr0.5Co0.5O4.
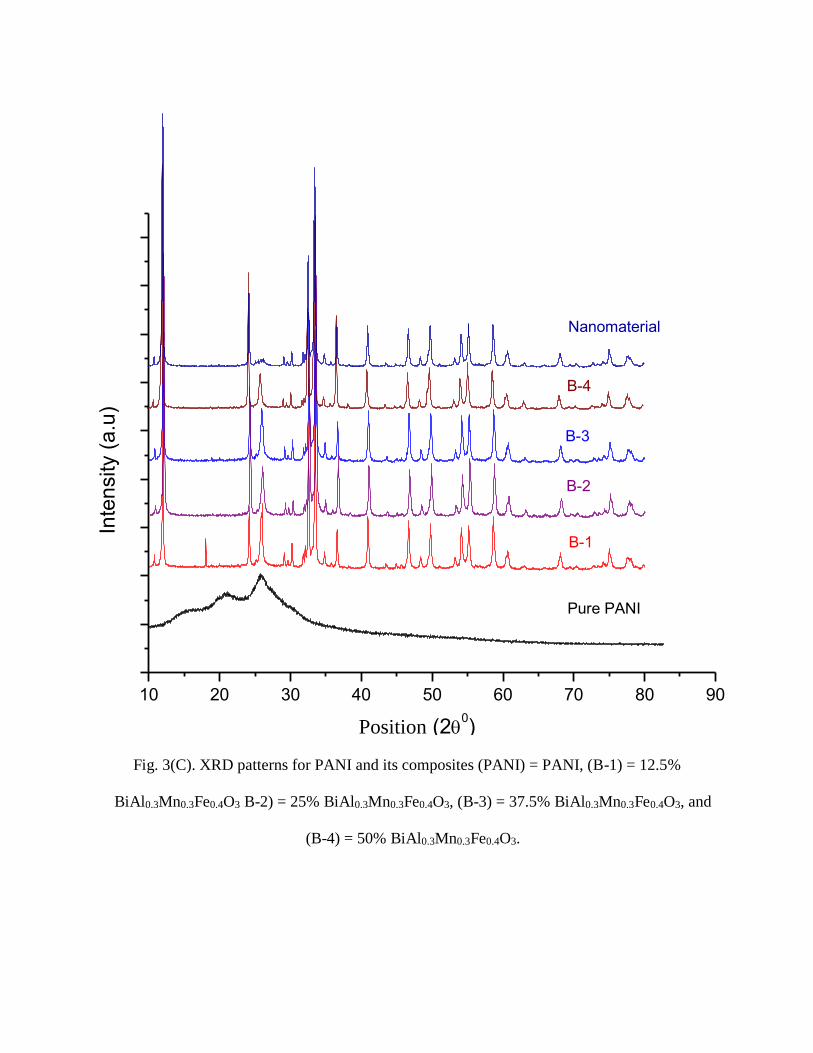
10 20 30 40 50 60 70 80 90
Pure PANI
Inte
nsity (
a.u
)
B-1
B-3
B-2
B-4
Position (20)
Nanomaterial
Fig. 3(C). XRD patterns for PANI and its composites (PANI) = PANI, (B-1) = 12.5%
BiAl0.3Mn0.3Fe0.4O3 B-2) = 25% BiAl0.3Mn0.3Fe0.4O3, (B-3) = 37.5% BiAl0.3Mn0.3Fe0.4O3, and
(B-4) = 50% BiAl0.3Mn0.3Fe0.4O3.
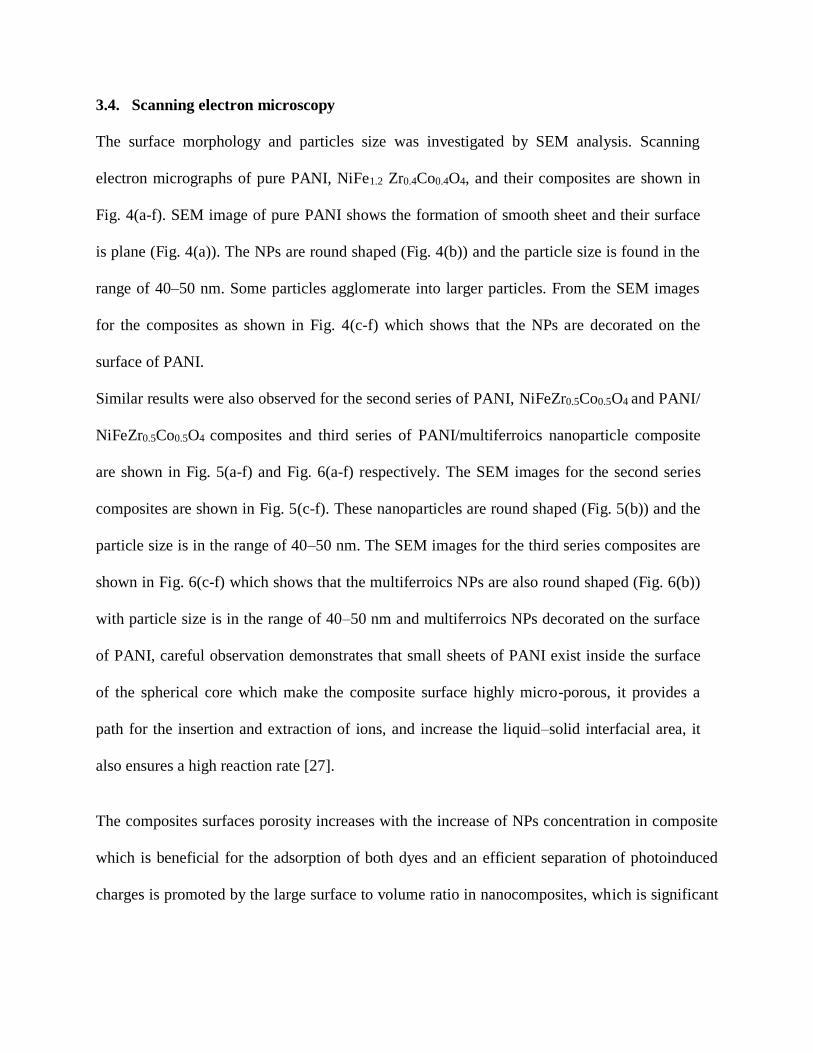
3.4. Scanning electron microscopy
The surface morphology and particles size was investigated by SEM analysis. Scanning
electron micrographs of pure PANI, NiFe1.2 Zr0.4Co0.4O4, and their composites are shown in
Fig. 4(a-f). SEM image of pure PANI shows the formation of smooth sheet and their surface
is plane (Fig. 4(a)). The NPs are round shaped (Fig. 4(b)) and the particle size is found in the
range of 40–50 nm. Some particles agglomerate into larger particles. From the SEM images
for the composites as shown in Fig. 4(c-f) which shows that the NPs are decorated on the
surface of PANI.
Similar results were also observed for the second series of PANI, NiFeZr0.5Co0.5O4 and PANI/
NiFeZr0.5Co0.5O4 composites and third series of PANI/multiferroics nanoparticle composite
are shown in Fig. 5(a-f) and Fig. 6(a-f) respectively. The SEM images for the second series
composites are shown in Fig. 5(c-f). These nanoparticles are round shaped (Fig. 5(b)) and the
particle size is in the range of 40–50 nm. The SEM images for the third series composites are
shown in Fig. 6(c-f) which shows that the multiferroics NPs are also round shaped (Fig. 6(b))
with particle size is in the range of 40–50 nm and multiferroics NPs decorated on the surface
of PANI, careful observation demonstrates that small sheets of PANI exist inside the surface
of the spherical core which make the composite surface highly micro-porous, it provides a
path for the insertion and extraction of ions, and increase the liquid–solid interfacial area, it
also ensures a high reaction rate [27].
The composites surfaces porosity increases with the increase of NPs concentration in composite
which is beneficial for the adsorption of both dyes and an efficient separation of photoinduced
charges is promoted by the large surface to volume ratio in nanocomposites, which is significant

characteristic of photocatalytic applications similar results were also reported by following
research groups [28-30].
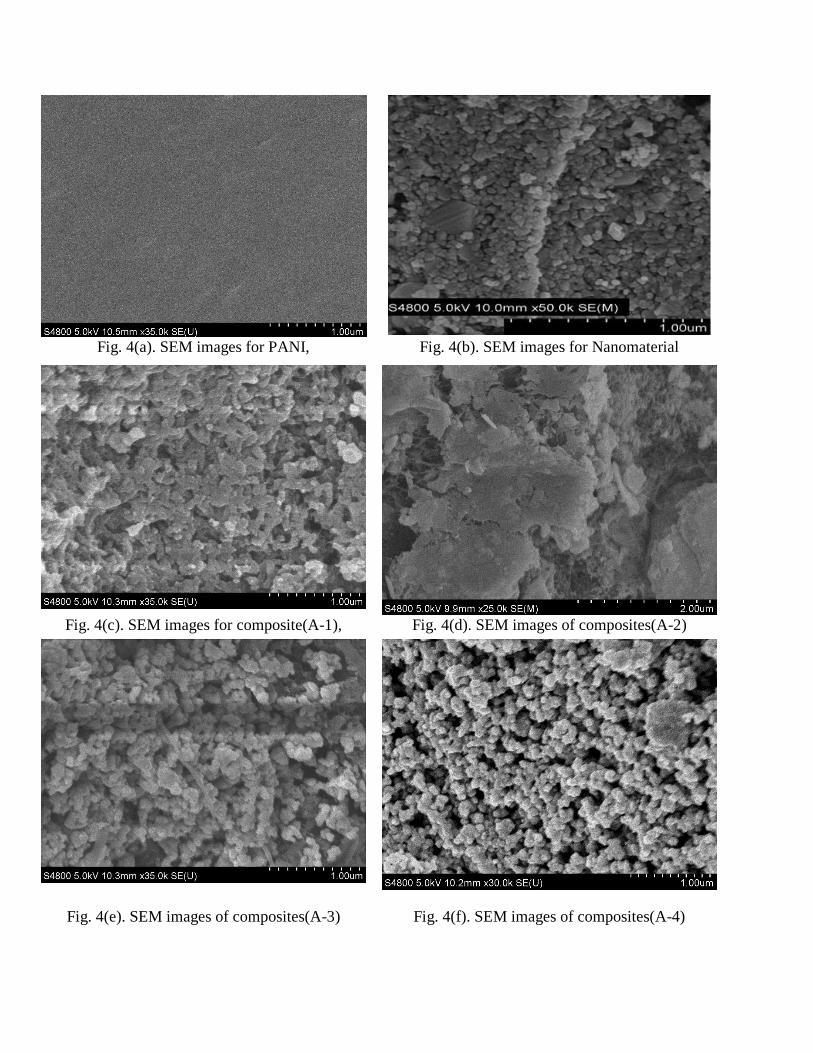
Fig. 4(a). SEM images for PANI, Fig. 4(b). SEM images for Nanomaterial
Fig. 4(c). SEM images for composite(A-1), Fig. 4(d). SEM images of composites(A-2)
Fig. 4(e). SEM images of composites(A-3) Fig. 4(f). SEM images of composites(A-4)
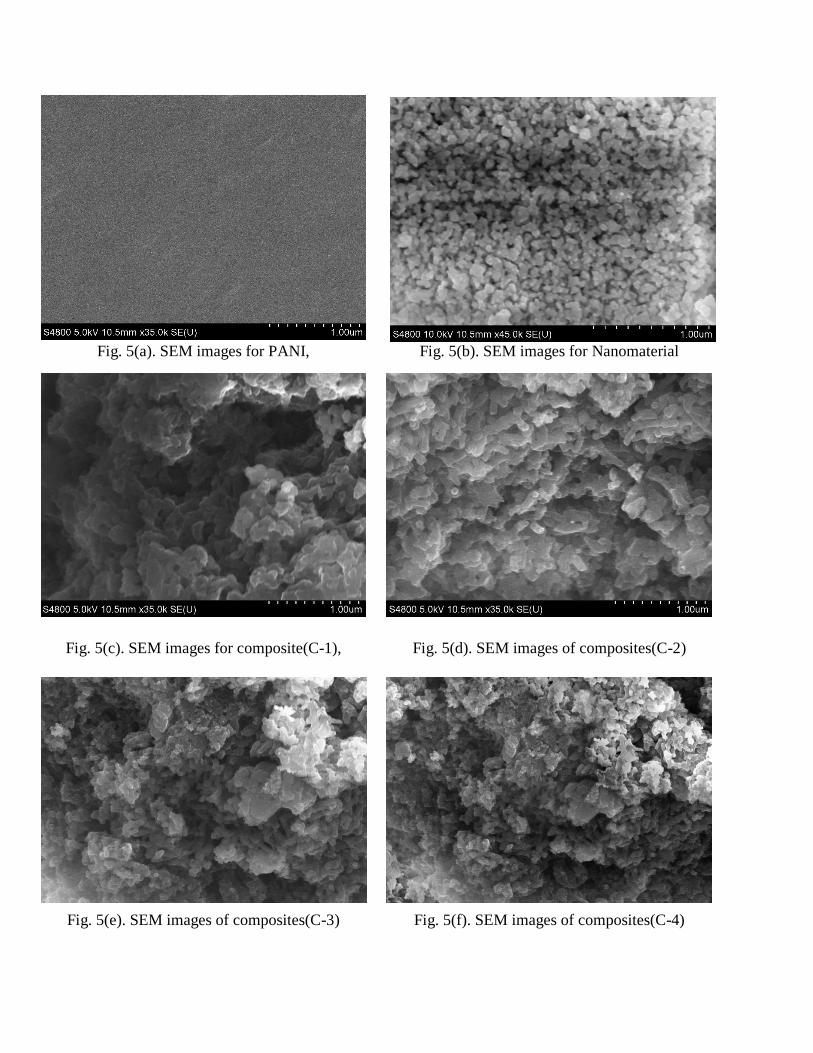
Fig. 5(a). SEM images for PANI, Fig. 5(b). SEM images for Nanomaterial
Fig. 5(c). SEM images for composite(C-1), Fig. 5(d). SEM images of composites(C-2)
Fig. 5(e). SEM images of composites(C-3) Fig. 5(f). SEM images of composites(C-4)
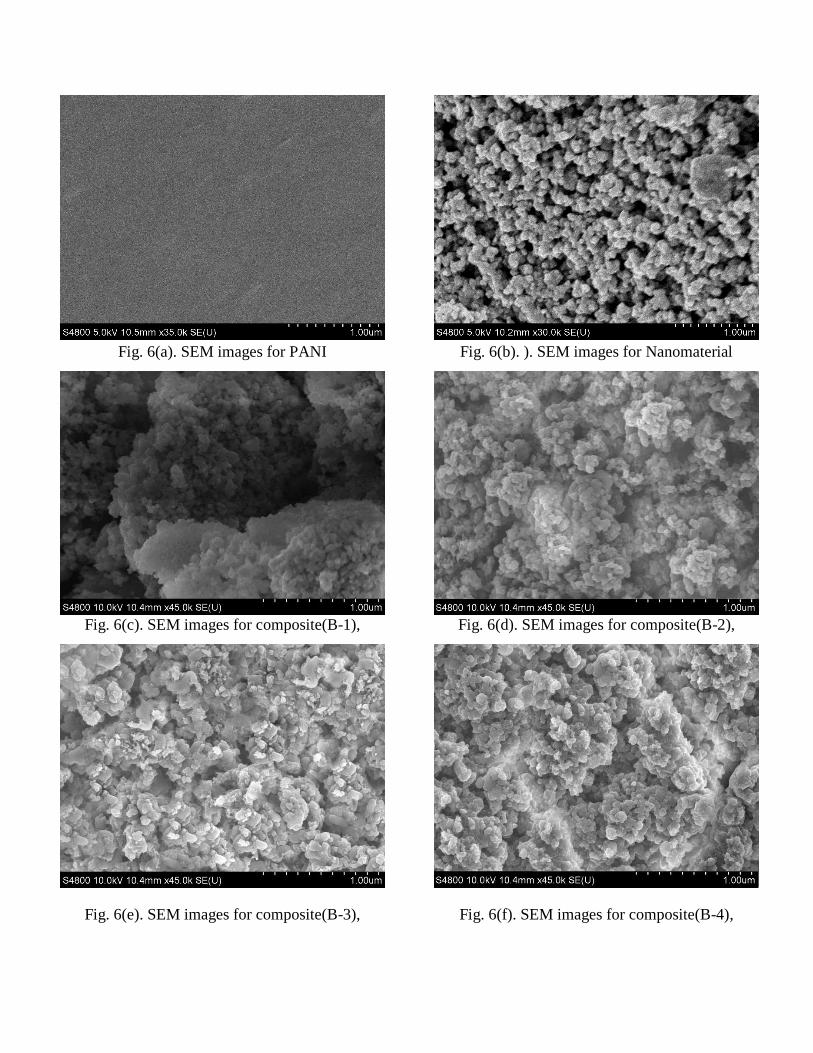
Fig. 6(a). SEM images for PANI Fig. 6(b). ). SEM images for Nanomaterial
Fig. 6(c). SEM images for composite(B-1), Fig. 6(d). SEM images for composite(B-2),
Fig. 6(e). SEM images for composite(B-3), Fig. 6(f). SEM images for composite(B-4),
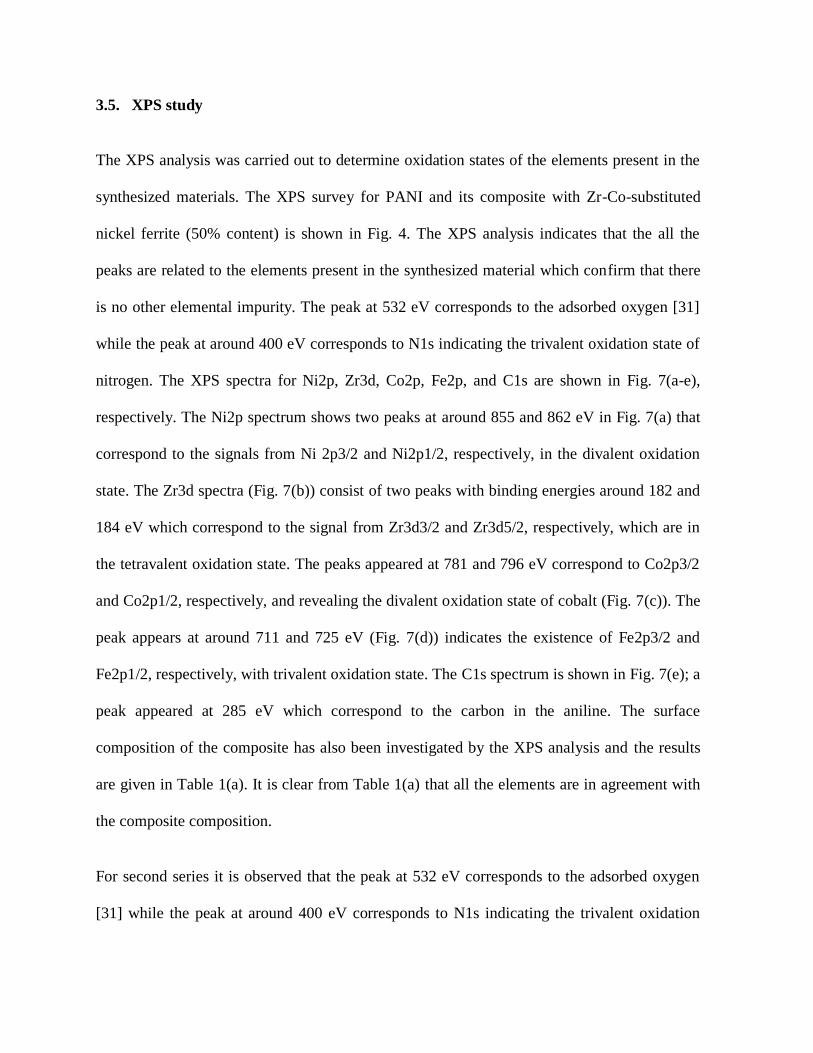
3.5. XPS study
The XPS analysis was carried out to determine oxidation states of the elements present in the
synthesized materials. The XPS survey for PANI and its composite with Zr-Co-substituted
nickel ferrite (50% content) is shown in Fig. 4. The XPS analysis indicates that the all the
peaks are related to the elements present in the synthesized material which confirm that there
is no other elemental impurity. The peak at 532 eV corresponds to the adsorbed oxygen [31]
while the peak at around 400 eV corresponds to N1s indicating the trivalent oxidation state of
nitrogen. The XPS spectra for Ni2p, Zr3d, Co2p, Fe2p, and C1s are shown in Fig. 7(a-e),
respectively. The Ni2p spectrum shows two peaks at around 855 and 862 eV in Fig. 7(a) that
correspond to the signals from Ni 2p3/2 and Ni2p1/2, respectively, in the divalent oxidation
state. The Zr3d spectra (Fig. 7(b)) consist of two peaks with binding energies around 182 and
184 eV which correspond to the signal from Zr3d3/2 and Zr3d5/2, respectively, which are in
the tetravalent oxidation state. The peaks appeared at 781 and 796 eV correspond to Co2p3/2
and Co2p1/2, respectively, and revealing the divalent oxidation state of cobalt (Fig. 7(c)). The
peak appears at around 711 and 725 eV (Fig. 7(d)) indicates the existence of Fe2p3/2 and
Fe2p1/2, respectively, with trivalent oxidation state. The C1s spectrum is shown in Fig. 7(e); a
peak appeared at 285 eV which correspond to the carbon in the aniline. The surface
composition of the composite has also been investigated by the XPS analysis and the results
are given in Table 1(a). It is clear from Table 1(a) that all the elements are in agreement with
the composite composition.
For second series it is observed that the peak at 532 eV corresponds to the adsorbed oxygen
[31] while the peak at around 400 eV corresponds to N1s indicating the trivalent oxidation
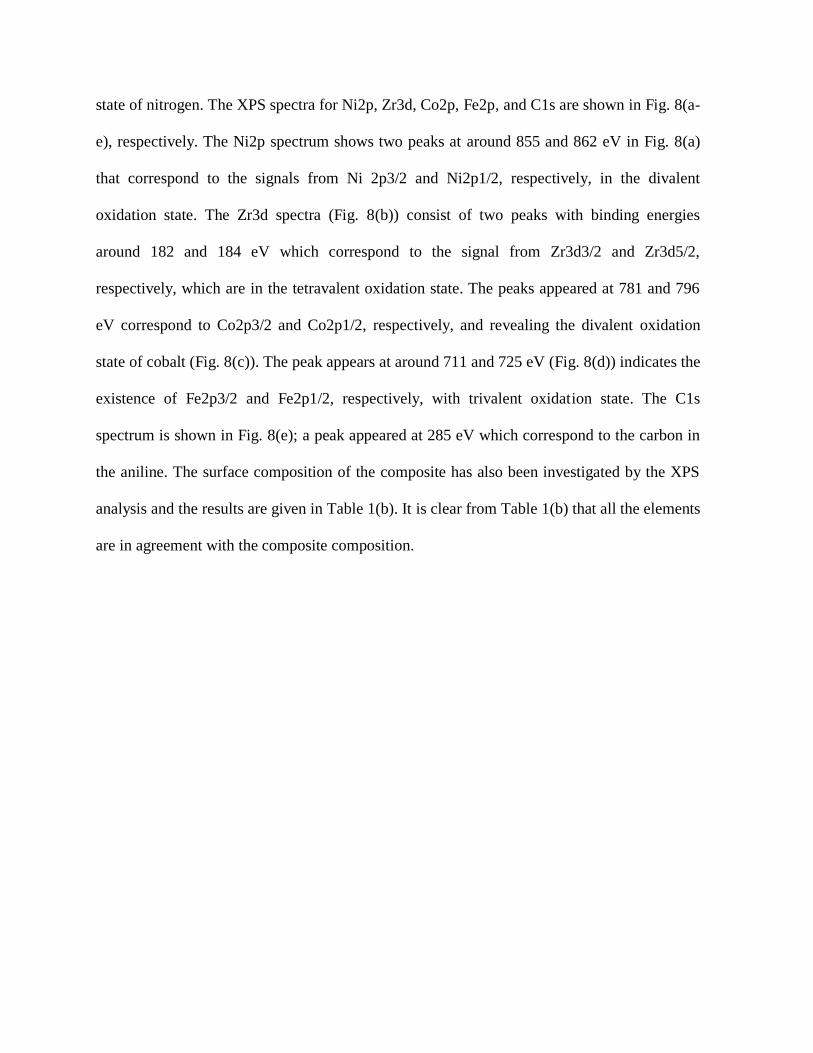
state of nitrogen. The XPS spectra for Ni2p, Zr3d, Co2p, Fe2p, and C1s are shown in Fig. 8(a-
e), respectively. The Ni2p spectrum shows two peaks at around 855 and 862 eV in Fig. 8(a)
that correspond to the signals from Ni 2p3/2 and Ni2p1/2, respectively, in the divalent
oxidation state. The Zr3d spectra (Fig. 8(b)) consist of two peaks with binding energies
around 182 and 184 eV which correspond to the signal from Zr3d3/2 and Zr3d5/2,
respectively, which are in the tetravalent oxidation state. The peaks appeared at 781 and 796
eV correspond to Co2p3/2 and Co2p1/2, respectively, and revealing the divalent oxidation
state of cobalt (Fig. 8(c)). The peak appears at around 711 and 725 eV (Fig. 8(d)) indicates the
existence of Fe2p3/2 and Fe2p1/2, respectively, with trivalent oxidation state. The C1s
spectrum is shown in Fig. 8(e); a peak appeared at 285 eV which correspond to the carbon in
the aniline. The surface composition of the composite has also been investigated by the XPS
analysis and the results are given in Table 1(b). It is clear from Table 1(b) that all the elements
are in agreement with the composite composition.
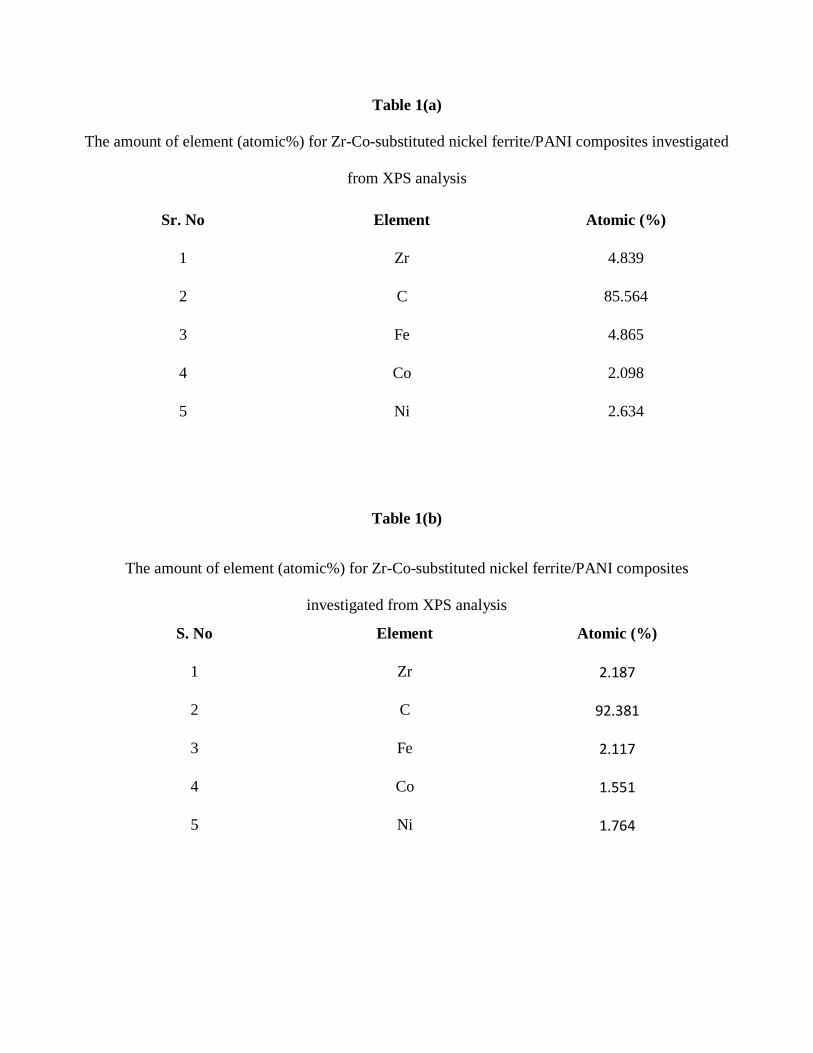
Table 1(a)
The amount of element (atomic%) for Zr-Co-substituted nickel ferrite/PANI composites investigated
from XPS analysis
Sr. No Element Atomic (%)
1 Zr 4.839
2 C 85.564
3 Fe 4.865
4 Co 2.098
5 Ni 2.634
Table 1(b)
The amount of element (atomic%) for Zr-Co-substituted nickel ferrite/PANI composites
investigated from XPS analysis
S. No Element Atomic (%)
1 Zr 2.187
2 C 92.381
3 Fe 2.117
4 Co 1.551
5 Ni 1.764
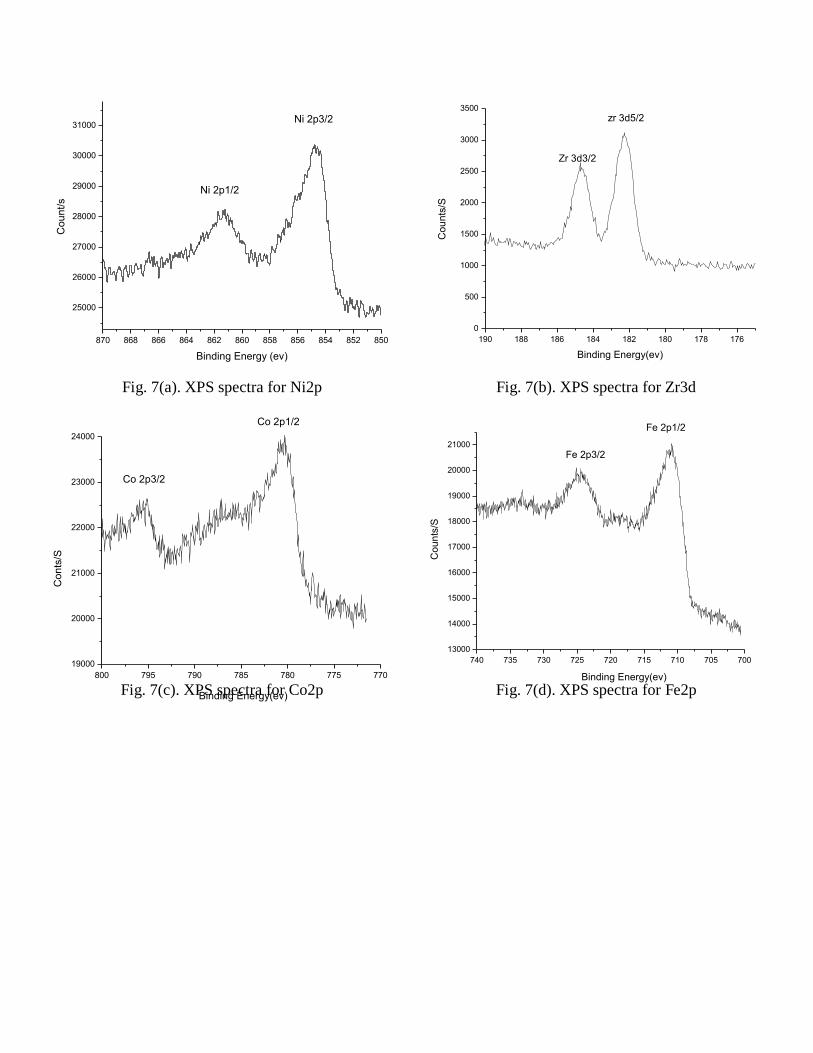
870 868 866 864 862 860 858 856 854 852 850
25000
26000
27000
28000
29000
30000
31000
Ni 2p1/2
Ni 2p3/2
Co
un
t/s
Binding Energy (ev)
190 188 186 184 182 180 178 176
0
500
1000
1500
2000
2500
3000
3500
zr 3d5/2
Zr 3d3/2
Co
un
ts/S
Binding Energy(ev)
Fig. 7(a). XPS spectra for Ni2p Fig. 7(b). XPS spectra for Zr3d
800 795 790 785 780 775 770
19000
20000
21000
22000
23000
24000
Co
nts
/S
Binding Energy(ev)
Co 2p1/2
Co 2p3/2
740 735 730 725 720 715 710 705 700
13000
14000
15000
16000
17000
18000
19000
20000
21000
Fe 2p1/2C
ou
nts
/S
Binding Energy(ev)
Fe 2p3/2
Fig. 7(c). XPS spectra for Co2p Fig. 7(d). XPS spectra for Fe2p
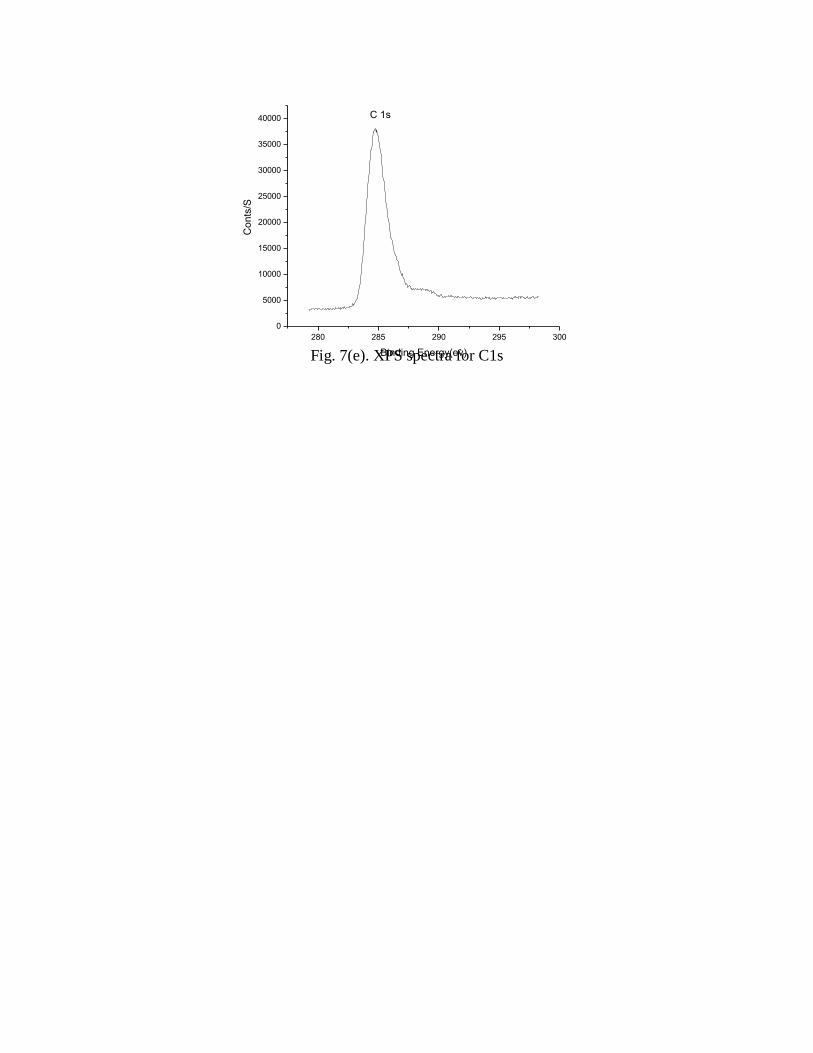
280 285 290 295 300
0
5000
10000
15000
20000
25000
30000
35000
40000
Co
nts
/S
Binding Energy(ev)
C 1s
Fig. 7(e). XPS spectra for C1s
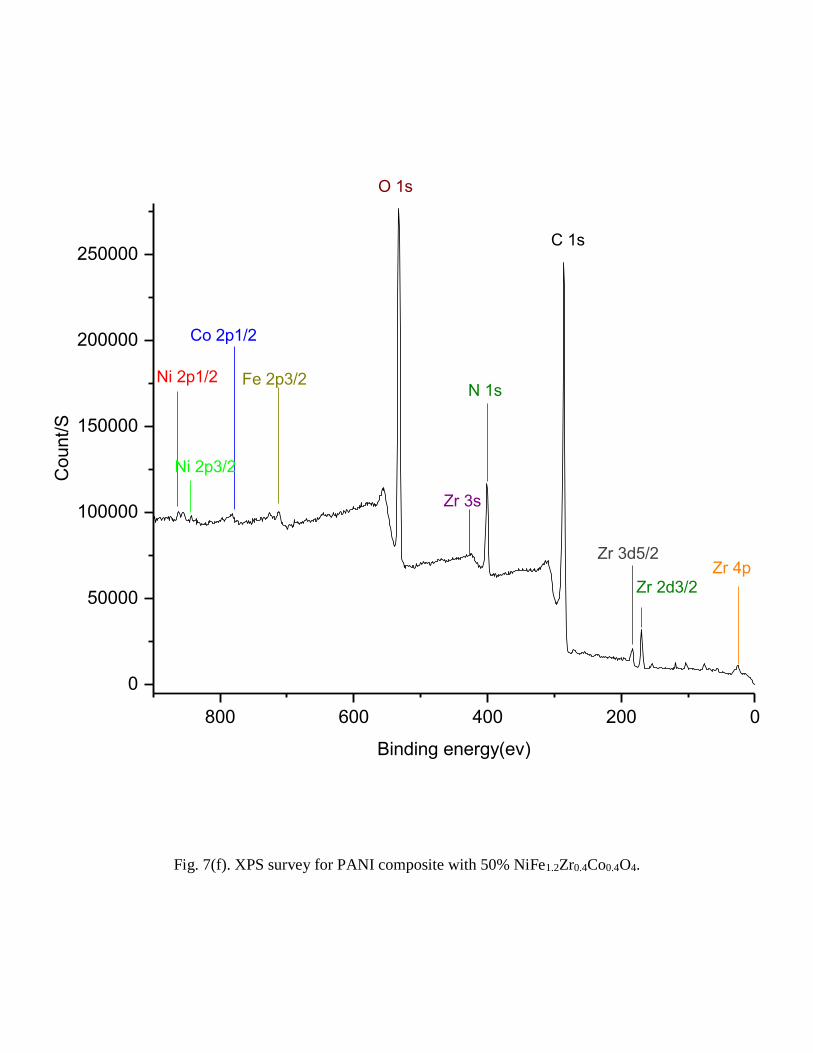
800 600 400 200 0
0
50000
100000
150000
200000
250000
Zr 3d5/2
Zr 3s
Zr 4pZr 2d3/2
N 1s
O 1s
Fe 2p3/2
Co 2p1/2
Ni 2p3/2
Count/S
Binding energy(ev)
Ni 2p1/2
C 1s
Fig. 7(f). XPS survey for PANI composite with 50% NiFe1.2Zr0.4Co0.4O4.
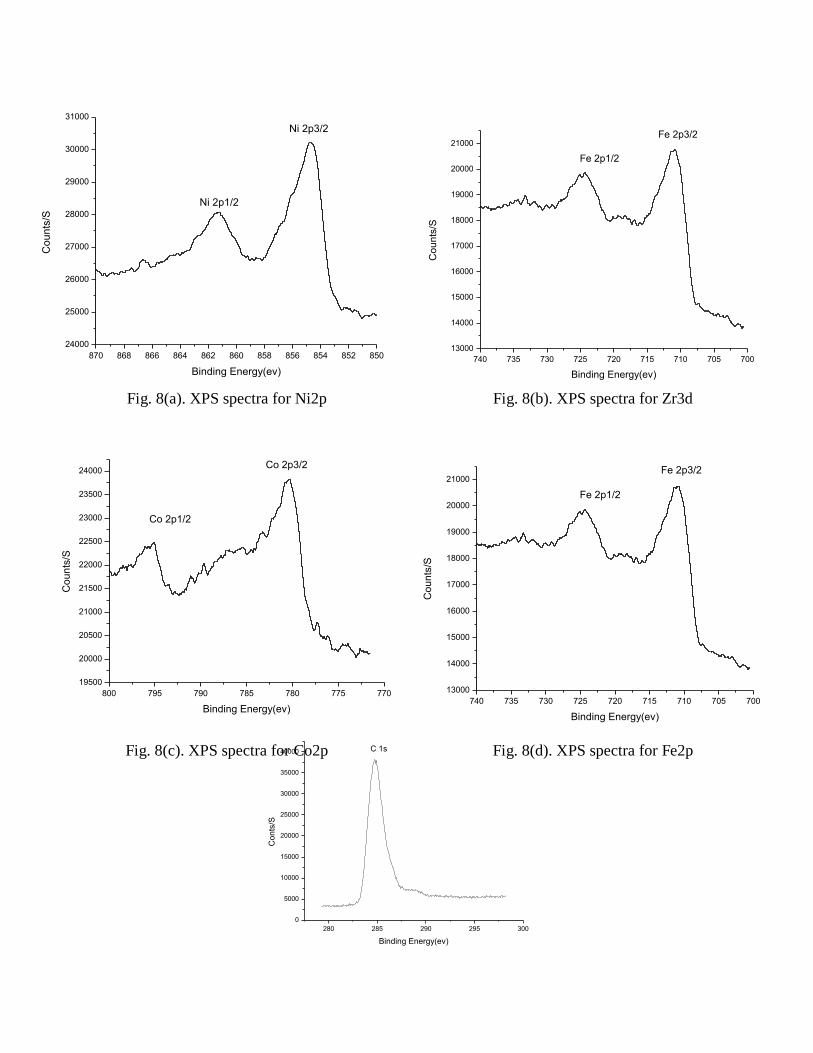
280 285 290 295 300
0
5000
10000
15000
20000
25000
30000
35000
40000
Co
nts
/S
Binding Energy(ev)
C 1s
740 735 730 725 720 715 710 705 700
13000
14000
15000
16000
17000
18000
19000
20000
21000Fe 2p3/2
Fe 2p1/2
Co
un
ts/S
Binding Energy(ev)
Fig. 8(a). XPS spectra for Ni2p Fig. 8(b). XPS spectra for Zr3d
800 795 790 785 780 775 770
19500
20000
20500
21000
21500
22000
22500
23000
23500
24000Co 2p3/2
Co
un
ts/S
Binding Energy(ev)
Co 2p1/2
Fig. 8(c). XPS spectra for Co2p Fig. 8(d). XPS spectra for Fe2p
870 868 866 864 862 860 858 856 854 852 850
24000
25000
26000
27000
28000
29000
30000
31000
Ni 2p3/2
Ni 2p1/2
Co
un
ts/S
Binding Energy(ev)
740 735 730 725 720 715 710 705 700
13000
14000
15000
16000
17000
18000
19000
20000
21000Fe 2p3/2
Fe 2p1/2
Co
un
ts/S
Binding Energy(ev)

Fig. 8(e). XPS spectra for C1s
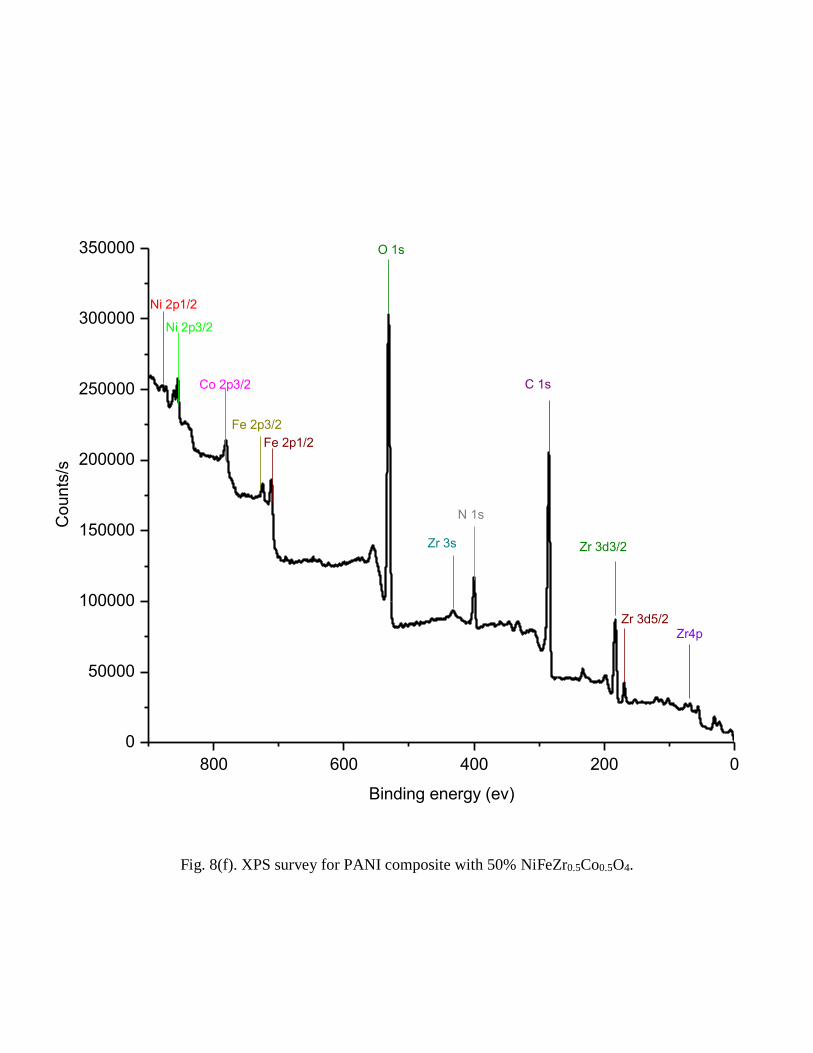
800 600 400 200 0
0
50000
100000
150000
200000
250000
300000
350000
Fe 2p1/2
Zr4p
Zr 3d3/2
Zr 3d5/2
Zr 3s
N 1s
O 1s
Fe 2p3/2
C 1s
Ni 2p3/2
Ni 2p1/2
Co 2p3/2
Counts
/s
Binding energy (ev)
Fig. 8(f). XPS survey for PANI composite with 50% NiFeZr0.5Co0.5O4.
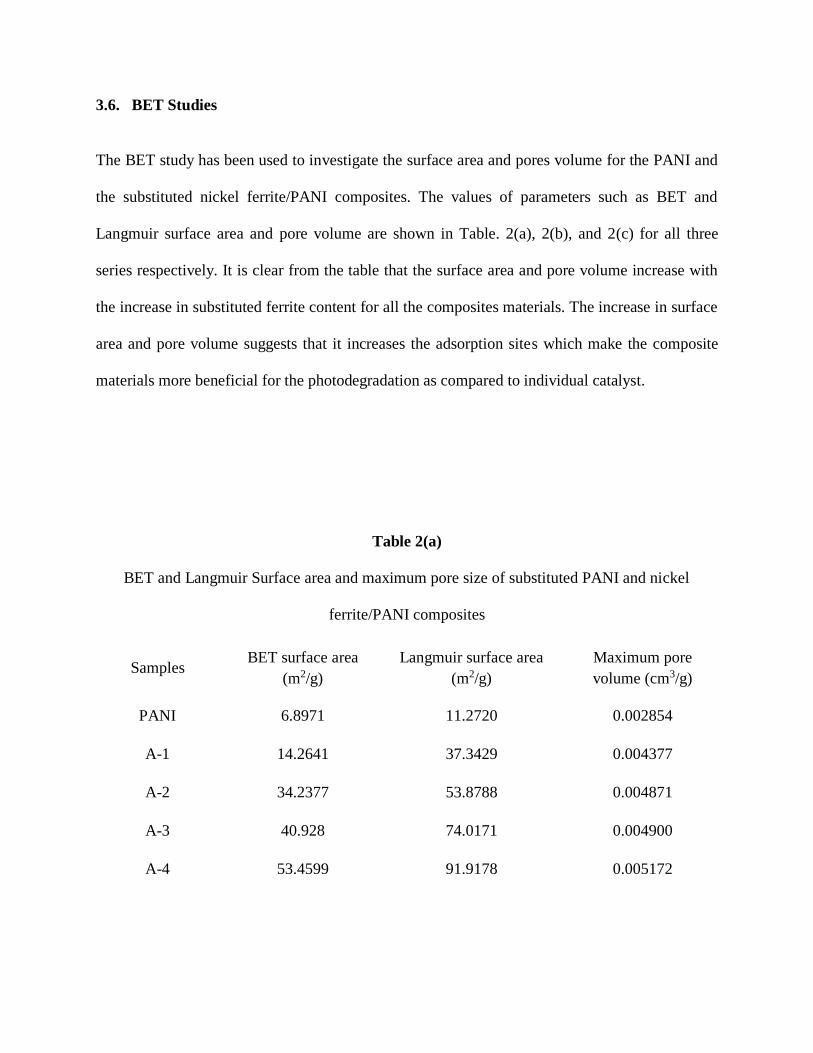
3.6. BET Studies
The BET study has been used to investigate the surface area and pores volume for the PANI and
the substituted nickel ferrite/PANI composites. The values of parameters such as BET and
Langmuir surface area and pore volume are shown in Table. 2(a), 2(b), and 2(c) for all three
series respectively. It is clear from the table that the surface area and pore volume increase with
the increase in substituted ferrite content for all the composites materials. The increase in surface
area and pore volume suggests that it increases the adsorption sites which make the composite
materials more beneficial for the photodegradation as compared to individual catalyst.
Table 2(a)
BET and Langmuir Surface area and maximum pore size of substituted PANI and nickel
ferrite/PANI composites
Samples BET surface area
(m2/g)
Langmuir surface area
(m2/g)
Maximum pore
volume (cm3/g)
PANI 6.8971 11.2720 0.002854
A-1 14.2641 37.3429 0.004377
A-2 34.2377 53.8788 0.004871
A-3 40.928 74.0171 0.004900
A-4 53.4599 91.9178 0.005172
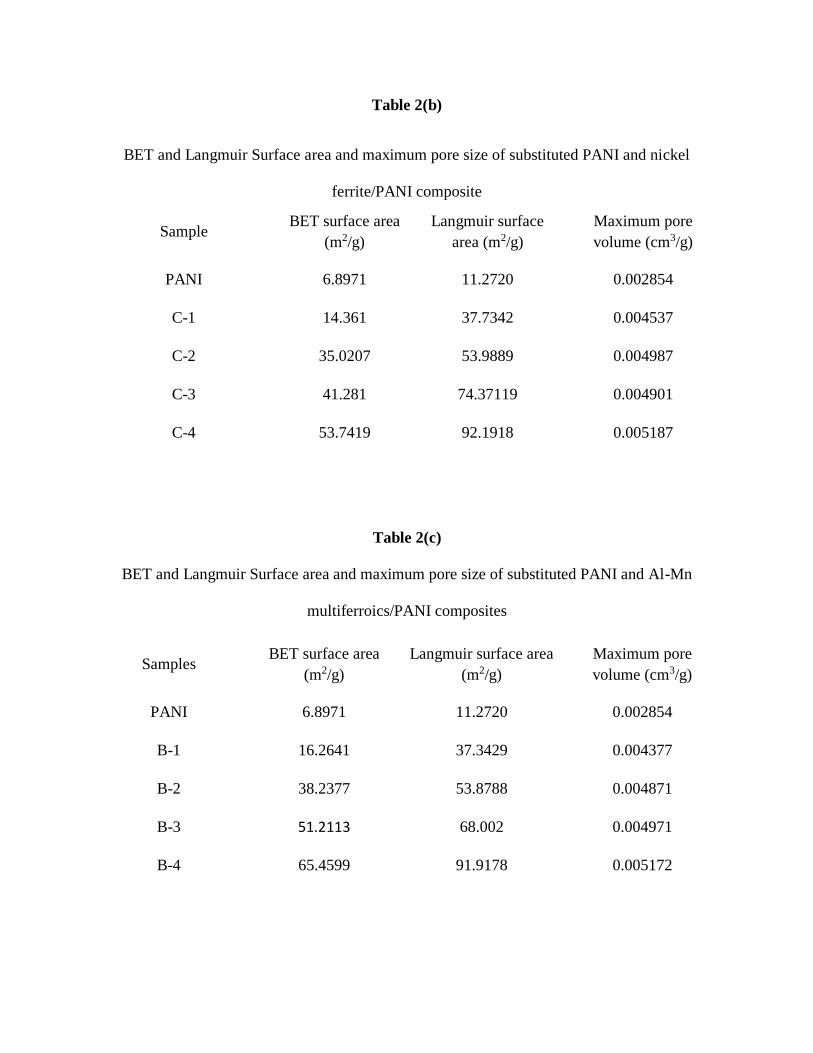
Table 2(b)
BET and Langmuir Surface area and maximum pore size of substituted PANI and nickel
ferrite/PANI composite
Sample BET surface area
(m2/g)
Langmuir surface
area (m2/g)
Maximum pore
volume (cm3/g)
PANI 6.8971 11.2720 0.002854
C-1 14.361 37.7342 0.004537
C-2 35.0207 53.9889 0.004987
C-3 41.281 74.37119 0.004901
C-4 53.7419 92.1918 0.005187
Table 2(c)
BET and Langmuir Surface area and maximum pore size of substituted PANI and Al-Mn
multiferroics/PANI composites
Samples BET surface area
(m2/g)
Langmuir surface area
(m2/g)
Maximum pore
volume (cm3/g)
PANI 6.8971 11.2720 0.002854
B-1 16.2641 37.3429 0.004377
B-2 38.2377 53.8788 0.004871
B-3 51.2113 68.002 0.004971
B-4 65.4599 91.9178 0.005172
3.7. Degradation of dyes
3.7.1. Influence of reaction time.
Residence time in light is one of the most important parameter that affects the photo- degradation
of dyes. The relationship between degradation and reaction time is shown in Fig. 9(a-f) for
methylene blue and methylene orange respectively. It is clear from figure that the degradation of
dyes increases with the increase in reaction time. It was also observed that the degradation was
very rapid during the initial stage of the reaction and after 30 min it began to slow down. The
ultimate degradation was found beyond 98% and 97% for MO and MB respectively during the
investigated reaction time of 150 min. When PANI and its composites were illuminated with UV
light, it absorbs photons to generate electron– hole pairs and these electrons and holes generate
the hydroxyl radicals (OH⦁) by reacting with water molecules. Hydroxyl radicals (OH⦁) are the
most important species in photodegradation reaction therefore the rate of degradation is directly
related to the formation or OH⦁ radicals. One more thing which play a significant role in the
photodegradation reaction i.e. the rate of reaction of OH⦁ radicals with reactant followed by the
equilibrium adsorption of that reactant on the surface of the catalyst [44]. The surface of
PANI/NPs composite is porous as shown in SEM image, its surface area as well as the pore size
is greater as confirm by BET analysis (Table. 2(a-c)). These pores act as active sites to adsorb
the MB molecule. These adsorbed molecules of MB & MO could easily captured by
photogenerated oxidizing species OH⦁ and degraded immediately, resulting a rapid degradation
of MB in first 30 min. As the time precede, availability of these active sites decreased and also
oxidizing species (OH⦁) which results in decrease in rate of degradation of MB. For the second
series relationship between degradation and reaction time is shown in Fig. 9(c-d) for methylene
blue and methylene orange, respectively. The total degradation was 98 % and 94.5 % for MO
and MB respectively during the 150 min of investigated reaction time. And for the third series of
photocatalyst the relationship between degradation and reaction time is shown in Figure 9(e-f)
for both dyes i.e. methylene blue and methylene orange respectively. The ultimate degradation
was found beyond 98 % and 93.5 % during the investigated reaction time of 150 min for
methylene blue and methylene orange respectively. It was found that the rate of degradation
increases with the increase of time. The rate of degradation was fast during the initial stage of
reaction .i.e. 30 minutes but after 30 min it began to slow down for both second and third series.
The generation of OH⦁ radicals is crucial in photodegradation process as it oxidizes the dyes
molecules to carbon dioxide and water.
The degradation goes to maximum till 30 minutes this is due to the availability of O2 and initially
more OH⦁ radicals generated rapidly. In the initial 30 minutes there will be large number of
photons reaching the catalyst surface and lot of O2 is available therefore, more OH⦁ radicals
will be formed, subsequently the relative number of OH⦁ radicals that attack the compound also
high and rate of degradation of dyes will be maximum. One more reason is also there the rapid
initial rate of degradation in the first 30 minutes, the pores at the surface of PANI/NPs composite
as shown in SEM image and BET analysis (Table. 2(a-c)) act as active sites to adsorb the dyes
molecule. These adsorbed molecules captured by photogenerated oxidizing species OH⦁ and
degraded immediately; it shows rapid degradation of both dyes in first 30 min. As the time
precede, availability of these active sites decreased and oxidizing species (OH⦁) also decreases
which results in decrease in rate of degradation. It was reported by [45] that rate of degradation
relates to the OH⦁ radical formation and the equilibrium of the adsorption of reactants on the
catalyst surface with the rate of reaction of OH⦁ radicals with other chemicals. Therefore with
the increase of time availability of the active sites decreases and degradation is also decreases
The rate of degradation of MO is little high compare to MB .It is due to the fact that
photodegradation of anionic dyes is promoted by adsorption because the negatively charged
groups of these dyes experience chemical interactions with the positively charged backbone of
polyaniline (PANI) as suggested by Xi. et.al. [46]. Methylene blue is a cationic dye [47] the
cationic dyes containing positively charged groups and due to electrostatic repulsion they cannot
easily gain contact to the positively charged backbone of PANI, giving low photodegradation
rates [46]
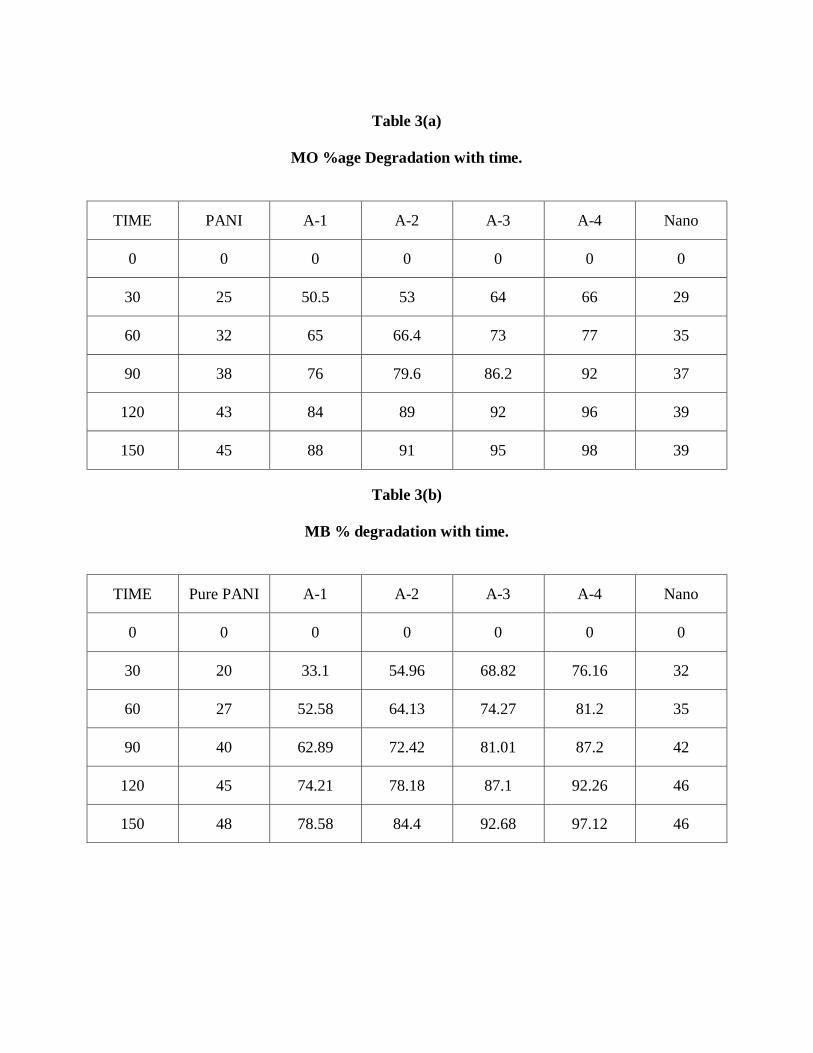
Table 3(a)
MO %age Degradation with time.
TIME PANI A-1 A-2 A-3 A-4 Nano
0 0 0 0 0 0 0
30 25 50.5 53 64 66 29
60 32 65 66.4 73 77 35
90 38 76 79.6 86.2 92 37
120 43 84 89 92 96 39
150 45 88 91 95 98 39
Table 3(b)
MB % degradation with time.
TIME Pure PANI A-1 A-2 A-3 A-4 Nano
0 0 0 0 0 0 0
30 20 33.1 54.96 68.82 76.16 32
60 27 52.58 64.13 74.27 81.2 35
90 40 62.89 72.42 81.01 87.2 42
120 45 74.21 78.18 87.1 92.26 46
150 48 78.58 84.4 92.68 97.12 46

Table 3(c)
MO %age Degradation with time
TIME PANI C-1 C-2 C-3 C-4 Nano
0 0 0 0 0 0 0
30 25 47 51 58 62 25
60 32 61 64 73 78 32
90 38 73 78 86 92 37
120 43 82 86 92 96 37
150 45 87 90 94 98 40
Table 3(d)
MB % degradation with time.
TIME Pure
PANI
C-1 C-2 C-3 C-4 Nano
0 0 0 0 0 0 0
30 20 55 59 65 78 30
60 27 65 72 74 85 34
90 40 77 82 83 91 39
120 45 84 88 89.5 93 40
150 48 89 91.5 94 94 42

Table 3(e)
MO %age Degradation with time
TIME PANI B-1 B-2 B-3 B-4 Nano
0 0 0 0 0 0 0
30 25 50.5 53 64 66 28
60 32 65 66.4 73 77 32.5
90 38 76 79.6 86.2 92 35.6
120 43 84 89 91 95 37
150 45 89 91 96 98 39
Table 3(f)
MB % degradation with time
TIME Pure
PANI
B-1 B-2 B-3 B-4 Nano
0 0 0 0 0 0 0
30 20 55 59 65 78 30
60 27 65 72 74 85 34
90 40 77 82 83 90 39
120 45 84 88 87.5 92 40
150 48 89 91.5 91 93.5 42
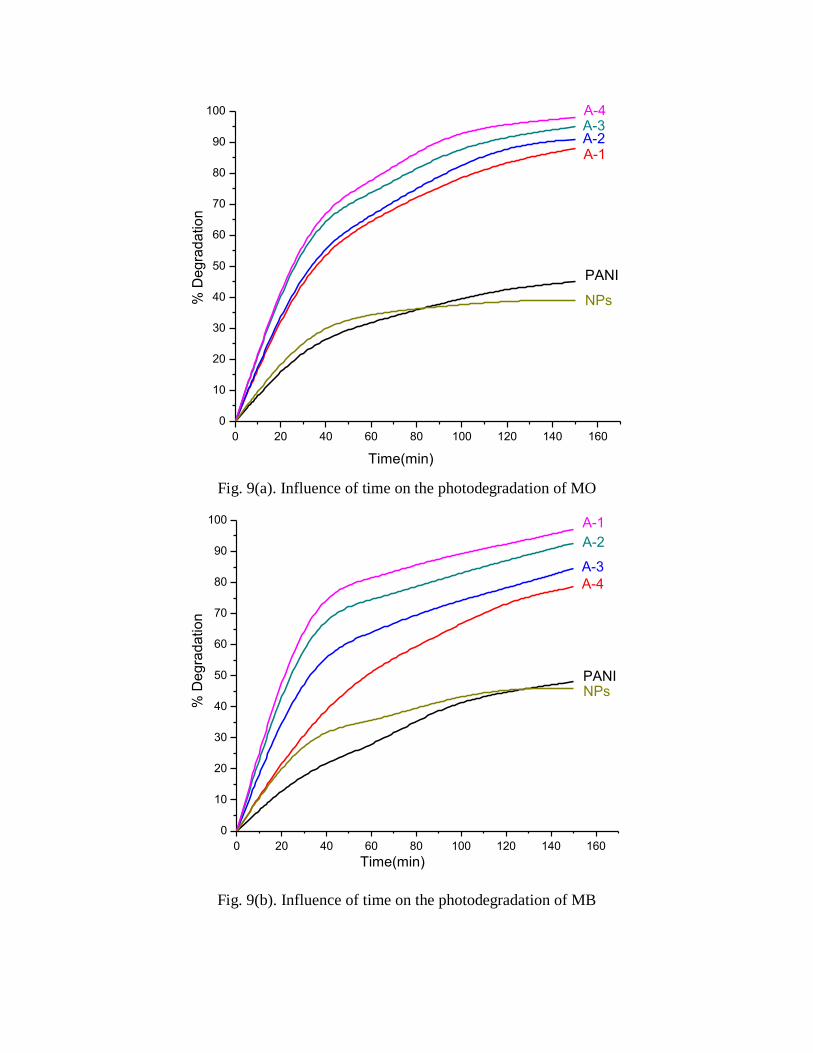
0 20 40 60 80 100 120 140 160
0
10
20
30
40
50
60
70
80
90
100
% D
eg
rad
atio
n
Time(min)
NPs
PANI
A-4A-3A-2A-1
Fig. 9(a). Influence of time on the photodegradation of MO
0 20 40 60 80 100 120 140 160
0
10
20
30
40
50
60
70
80
90
100
% D
eg
rad
atio
n
Time(min)
A-1
A-2
A-3
A-4
PANINPs
Fig. 9(b). Influence of time on the photodegradation of MB
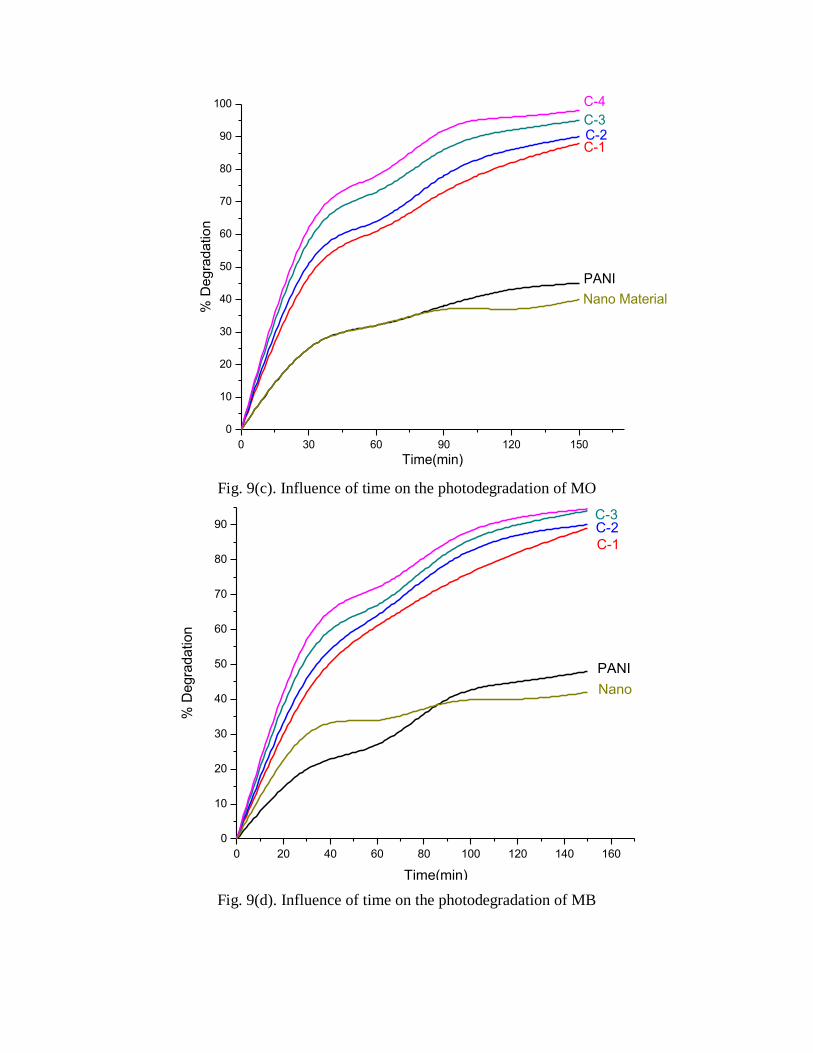
0 30 60 90 120 150
0
10
20
30
40
50
60
70
80
90
100
C-3C-2
% D
egra
dation
Time(min)
Nano Material
PANI
C-1
C-4
Fig. 9(c). Influence of time on the photodegradation of MO
0 20 40 60 80 100 120 140 160
0
10
20
30
40
50
60
70
80
90
% D
egra
dation
Time(min)
Nano
PANI
C-1
C-2C-3C-4
Fig. 9(d). Influence of time on the photodegradation of MB
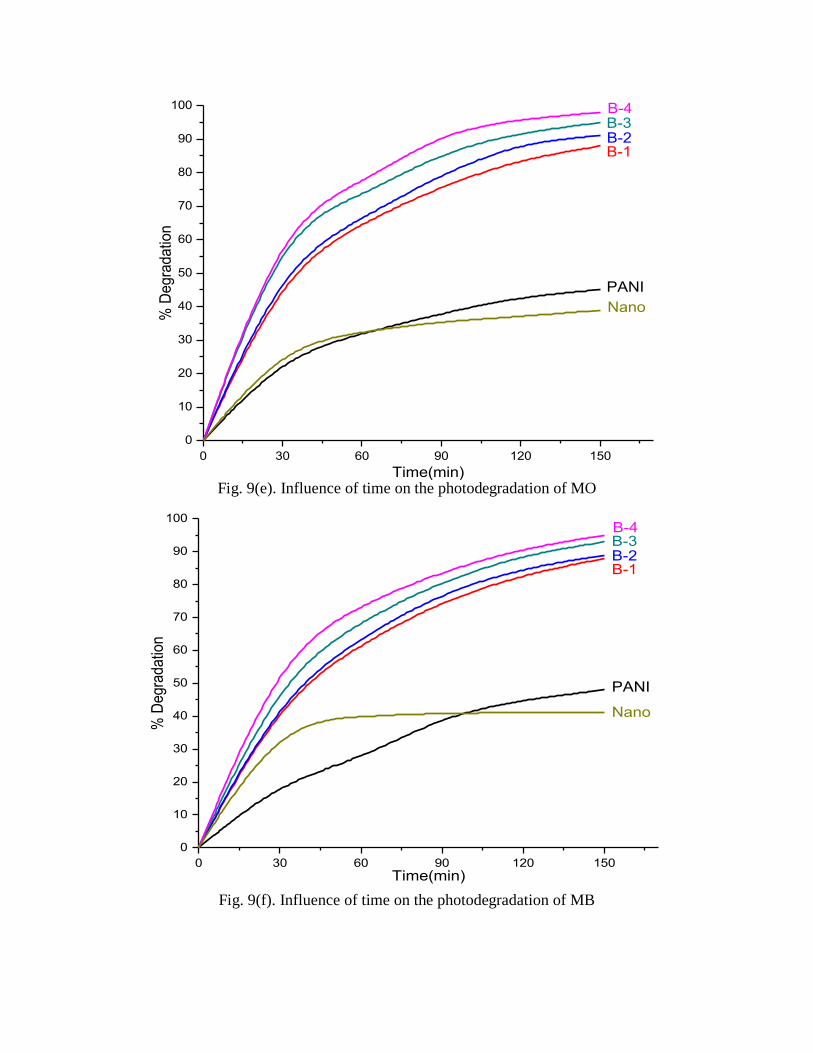
0 30 60 90 120 150
0
10
20
30
40
50
60
70
80
90
100
% D
egra
datio
n
Time(min)
Nano
PANI
B-1B-2B-3B-4
Fig. 9(e). Influence of time on the photodegradation of MO
0 30 60 90 120 150
0
10
20
30
40
50
60
70
80
90
100
% D
egra
datio
n
Time(min)
Nano
PANI
B-1B-2B-3B-4
Fig. 9(f). Influence of time on the photodegradation of MB
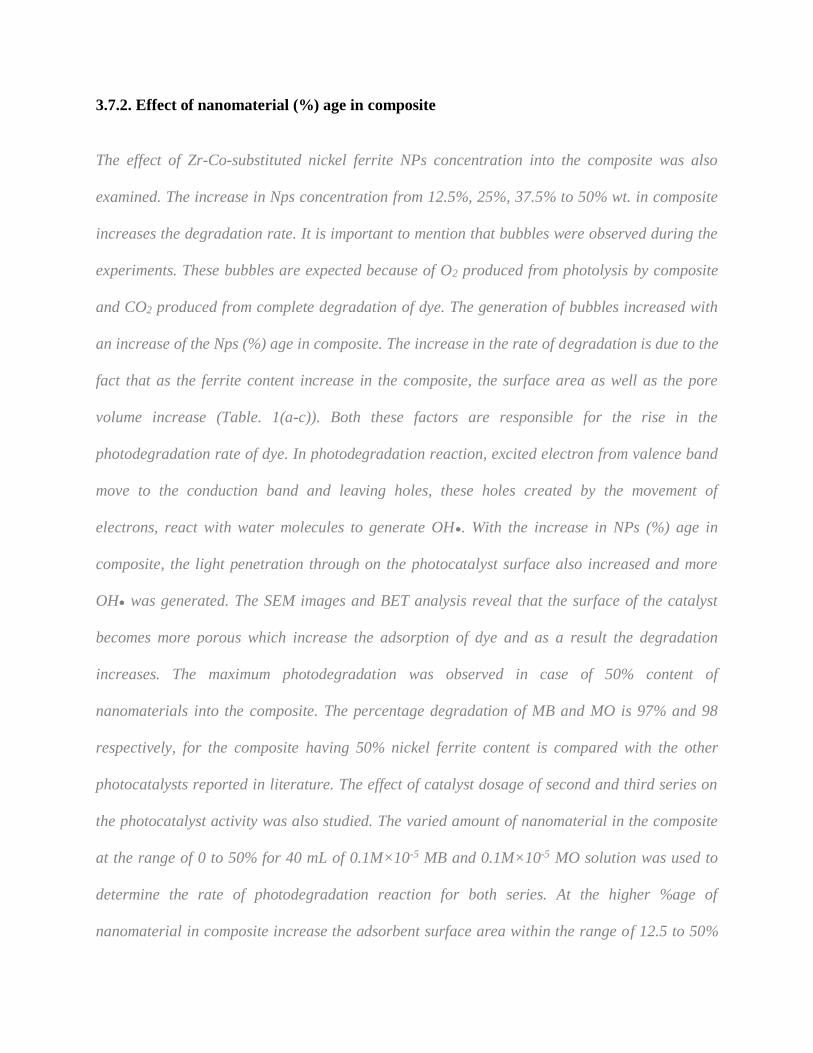
3.7.2. Effect of nanomaterial (%) age in composite
The effect of Zr-Co-substituted nickel ferrite NPs concentration into the composite was also
examined. The increase in Nps concentration from 12.5%, 25%, 37.5% to 50% wt. in composite
increases the degradation rate. It is important to mention that bubbles were observed during the
experiments. These bubbles are expected because of O2 produced from photolysis by composite
and CO2 produced from complete degradation of dye. The generation of bubbles increased with
an increase of the Nps (%) age in composite. The increase in the rate of degradation is due to the
fact that as the ferrite content increase in the composite, the surface area as well as the pore
volume increase (Table. 1(a-c)). Both these factors are responsible for the rise in the
photodegradation rate of dye. In photodegradation reaction, excited electron from valence band
move to the conduction band and leaving holes, these holes created by the movement of
electrons, react with water molecules to generate OH●. With the increase in NPs (%) age in
composite, the light penetration through on the photocatalyst surface also increased and more
OH● was generated. The SEM images and BET analysis reveal that the surface of the catalyst
becomes more porous which increase the adsorption of dye and as a result the degradation
increases. The maximum photodegradation was observed in case of 50% content of
nanomaterials into the composite. The percentage degradation of MB and MO is 97% and 98
respectively, for the composite having 50% nickel ferrite content is compared with the other
photocatalysts reported in literature. The effect of catalyst dosage of second and third series on
the photocatalyst activity was also studied. The varied amount of nanomaterial in the composite
at the range of 0 to 50% for 40 mL of 0.1M×10-5 MB and 0.1M×10-5 MO solution was used to
determine the rate of photodegradation reaction for both series. At the higher %age of
nanomaterial in composite increase the adsorbent surface area within the range of 12.5 to 50%
wt. of composite per 40 mL of MB solution. The percentage degradation of MB and MO is found
to be 94.5 % and 98 % respectively for the second series and 99 % to 97 % of MB and MO
respectively for the third series. High specific surface areas with porous structures provide more
active sites and adsorb more reactive species therefore the photocatalysts having these
characteristics are confidently recommended and are widely accepted to be beneficial for the
enhancement of photocatalytic performance [48]. It is also reported that degradation is related
to the formation of OH⦁ radical and the equilibrium, between the adsorption of reactants on the
catalyst surface and the rate of reaction of OH⦁ radicals [44]. The surface of the catalyst is
pours and this porosity is maximum at 50 % content of nanomaterial as indicated by SEM
images and BET analysis. Pores not only increases the surfaces area but also increase the
adsorption of dyes molecules on the surface of the catalyst as result the degradation increases
with the increase of nanomaterials % age in the photocatalyst. However, the activities of PANI
and pure nanomaterial were lowered as compared to PANI/Nanomaterial composite. For pure
nanomaterial decrease in degradation is because of the, amount of dyes molecules is no longer
sufficient to accept all photo-activated electron from nanomaterial molecules on time. Therefore
numbers of electron-hole pairs generated by irradiation of UV light are quickly recombined and
therefore result in reduced photocatalytic degradation of MB [49]. The percentage degradation
of MB and MO which is 99% for the composite having 50% substituted ferrite content is
compared with the other photocatalysts reported in literature.
3.7.3. Kinetic study
Experimental results showing degradation of MB in UV irradiated by PANI/nanomaterial
composite suspensions indicated that more than 95% of MB is degraded within 1 h under the
conditions shown. In comparison, no significant loss of MB occurs in PANI/nanomaterial
composite suspensions maintained under darkness only a small fraction (<10%) of the
compound is degraded by UV irradiation in the absence of PANI/nanomaterial composite.
Degradation of MB during batch reactions was described using a pseudo first-order kinetic rate
law. It was found that decrease in dye concentration take places linearly with of irradiation time.
It suggests that the pseudo first-order kinetics mechanism operates for degradation of dyes.
Langmuir-Hinshelwood (L-H) model depend upon the surface-area; therefore with irradiation
time reaction rate is expected to increase but as the time precedes decrease in organic substrate
take place and surface area also decreased after increased irradiation times. It is assume to be
zero rate of degradation if total decomposition is achieved. For the applicability in the area of
photo- mineralization many assumptions for the L-H saturation kinetics form may occurs, there
are four possible situations and any one of these may valid:
1) There are two adsorbed components and reactions take place between these two components
of radicals and organics;
2) The reactions are between the adsorbed organics and radicals in water;
3) It is also possible that reactions between the radical on the surface and organics in water take
places;
4) Reaction takes place between with both the radical and organics in water.
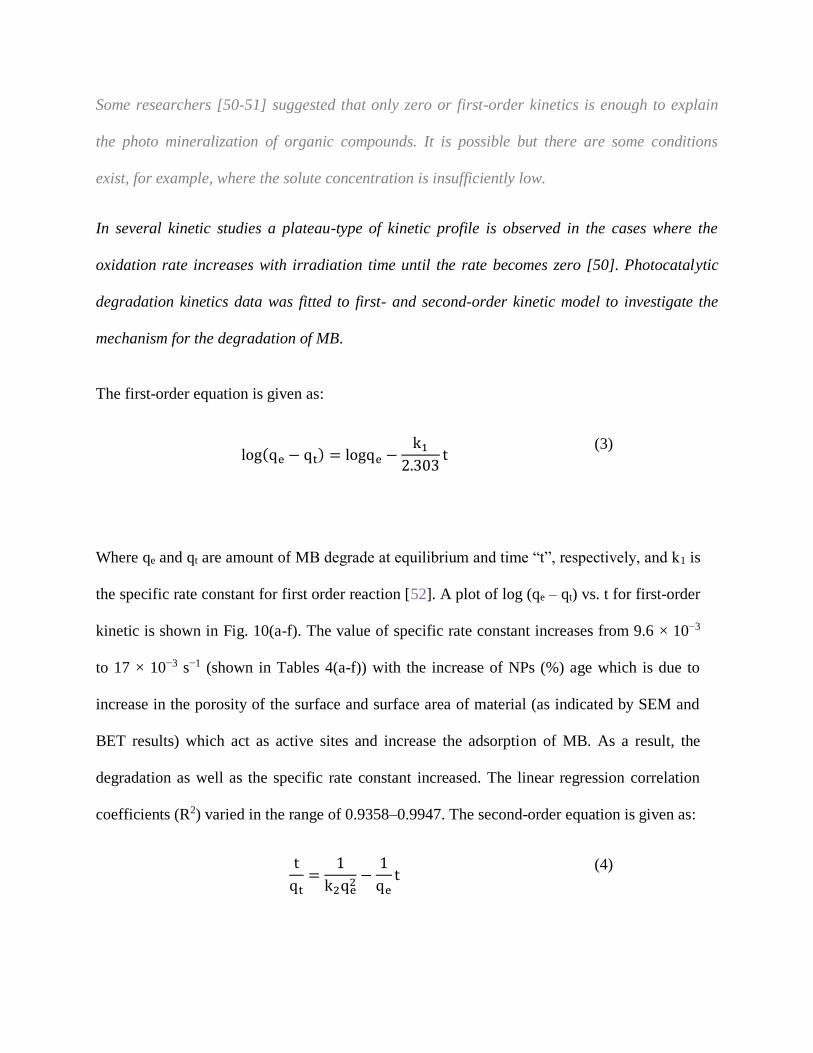
Some researchers [50-51] suggested that only zero or first-order kinetics is enough to explain
the photo mineralization of organic compounds. It is possible but there are some conditions
exist, for example, where the solute concentration is insufficiently low.
In several kinetic studies a plateau-type of kinetic profile is observed in the cases where the
oxidation rate increases with irradiation time until the rate becomes zero [50]. Photocatalytic
degradation kinetics data was fitted to first- and second-order kinetic model to investigate the
mechanism for the degradation of MB.
The first-order equation is given as:
log(qe − qt) = logqe −k1
2.303t
(3)
Where qe and qt are amount of MB degrade at equilibrium and time “t”, respectively, and k1 is
the specific rate constant for first order reaction [52]. A plot of log (qe – qt) vs. t for first-order
kinetic is shown in Fig. 10(a-f). The value of specific rate constant increases from 9.6 × 10⁻³
to 17 × 10−3 s−1 (shown in Tables 4(a-f)) with the increase of NPs (%) age which is due to
increase in the porosity of the surface and surface area of material (as indicated by SEM and
BET results) which act as active sites and increase the adsorption of MB. As a result, the
degradation as well as the specific rate constant increased. The linear regression correlation
coefficients (R2) varied in the range of 0.9358–0.9947. The second-order equation is given as:
t
qt=
1
k2qe2
−1
qet
(4)
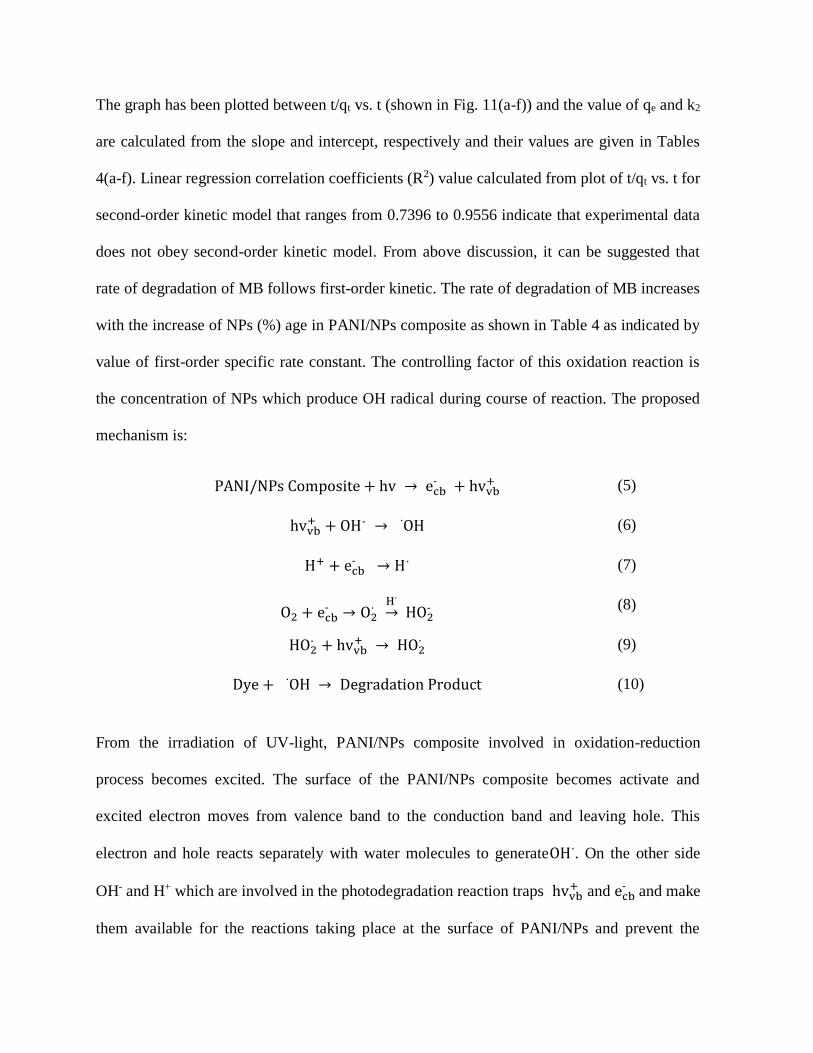
The graph has been plotted between t/qt vs. t (shown in Fig. 11(a-f)) and the value of qe and k2
are calculated from the slope and intercept, respectively and their values are given in Tables
4(a-f). Linear regression correlation coefficients (R2) value calculated from plot of t/qt vs. t for
second-order kinetic model that ranges from 0.7396 to 0.9556 indicate that experimental data
does not obey second-order kinetic model. From above discussion, it can be suggested that
rate of degradation of MB follows first-order kinetic. The rate of degradation of MB increases
with the increase of NPs (%) age in PANI/NPs composite as shown in Table 4 as indicated by
value of first-order specific rate constant. The controlling factor of this oxidation reaction is
the concentration of NPs which produce OH radical during course of reaction. The proposed
mechanism is:
PANI/NPs Composite + hv → ecb + hvvb
+ (5)
hvvb+ + OH → O· H (6)
H+ + ecb → H· (7)
O2 + ecb → O2
· H·
→ HO2
(8)
HO2 + hvvb
+ → HO2· (9)
Dye + O· H → Degradation Product (10)
From the irradiation of UV-light, PANI/NPs composite involved in oxidation-reduction
process becomes excited. The surface of the PANI/NPs composite becomes activate and
excited electron moves from valence band to the conduction band and leaving hole. This
electron and hole reacts separately with water molecules to generateOH∙. On the other side
OH and H+ which are involved in the photodegradation reaction traps hvvb+ and ecb
and make
them available for the reactions taking place at the surface of PANI/NPs and prevent the
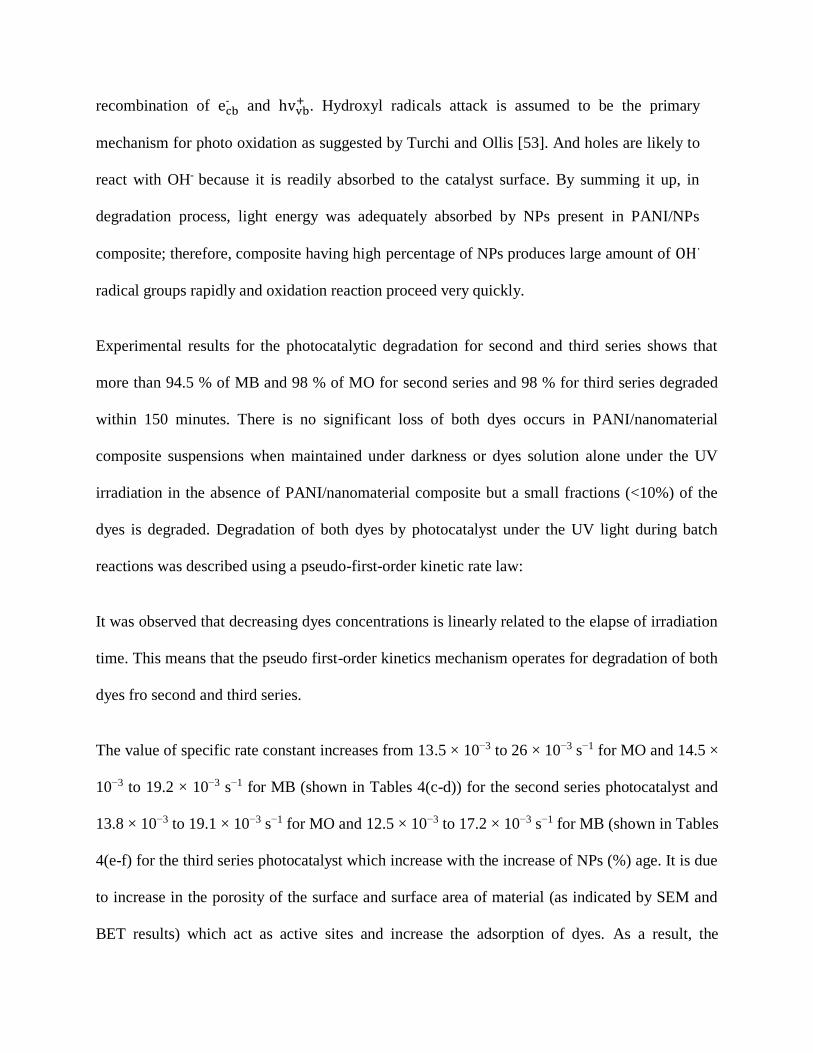
recombination of ecb and hvvb
+ . Hydroxyl radicals attack is assumed to be the primary
mechanism for photo oxidation as suggested by Turchi and Ollis [53]. And holes are likely to
react with OH because it is readily absorbed to the catalyst surface. By summing it up, in
degradation process, light energy was adequately absorbed by NPs present in PANI/NPs
composite; therefore, composite having high percentage of NPs produces large amount of OH∙
radical groups rapidly and oxidation reaction proceed very quickly.
Experimental results for the photocatalytic degradation for second and third series shows that
more than 94.5 % of MB and 98 % of MO for second series and 98 % for third series degraded
within 150 minutes. There is no significant loss of both dyes occurs in PANI/nanomaterial
composite suspensions when maintained under darkness or dyes solution alone under the UV
irradiation in the absence of PANI/nanomaterial composite but a small fractions (<10%) of the
dyes is degraded. Degradation of both dyes by photocatalyst under the UV light during batch
reactions was described using a pseudo-first-order kinetic rate law:
It was observed that decreasing dyes concentrations is linearly related to the elapse of irradiation
time. This means that the pseudo first-order kinetics mechanism operates for degradation of both
dyes fro second and third series.
The value of specific rate constant increases from 13.5 × 10⁻³ to 26 × 10−3 s−1 for MO and 14.5 ×
10−3 to 19.2 × 10⁻³ s−1 for MB (shown in Tables 4(c-d)) for the second series photocatalyst and
13.8 × 10⁻³ to 19.1 × 10⁻³ s−1 for MO and 12.5 × 10⁻³ to 17.2 × 10⁻³ s−1 for MB (shown in Tables
4(e-f) for the third series photocatalyst which increase with the increase of NPs (%) age. It is due
to increase in the porosity of the surface and surface area of material (as indicated by SEM and
BET results) which act as active sites and increase the adsorption of dyes. As a result, the
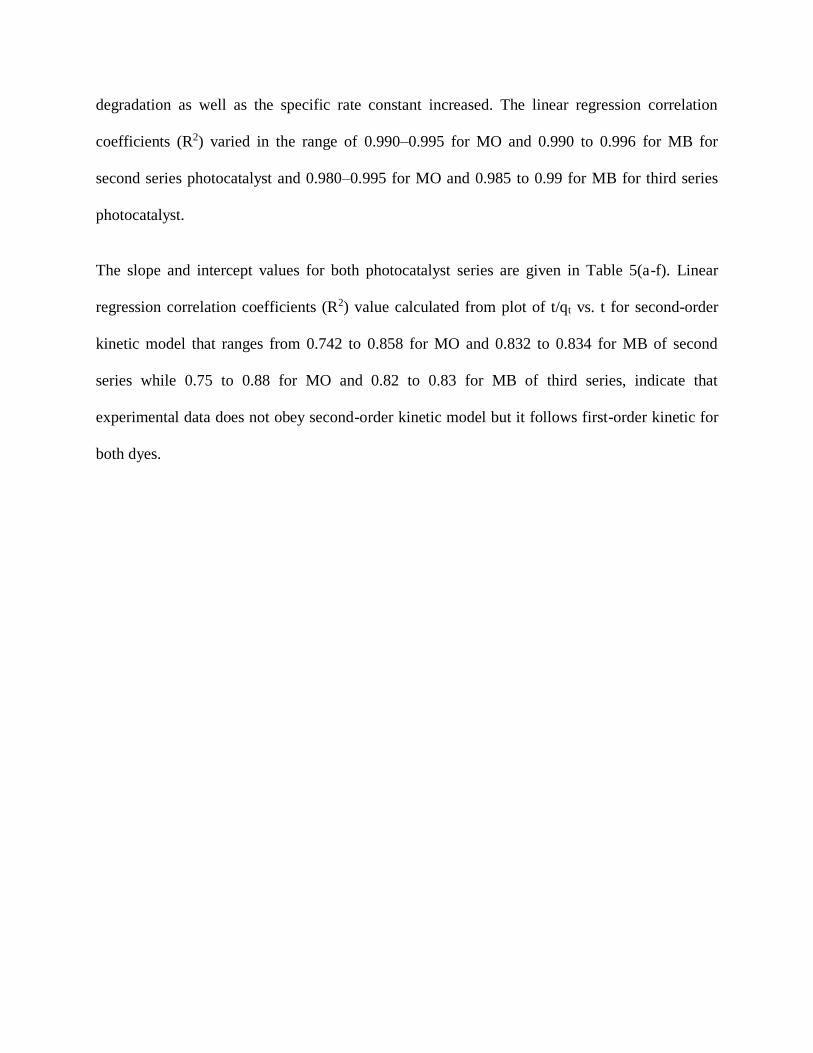
degradation as well as the specific rate constant increased. The linear regression correlation
coefficients (R2) varied in the range of 0.990–0.995 for MO and 0.990 to 0.996 for MB for
second series photocatalyst and 0.980–0.995 for MO and 0.985 to 0.99 for MB for third series
photocatalyst.
The slope and intercept values for both photocatalyst series are given in Table 5(a-f). Linear
regression correlation coefficients (R2) value calculated from plot of t/qt vs. t for second-order
kinetic model that ranges from 0.742 to 0.858 for MO and 0.832 to 0.834 for MB of second
series while 0.75 to 0.88 for MO and 0.82 to 0.83 for MB of third series, indicate that
experimental data does not obey second-order kinetic model but it follows first-order kinetic for
both dyes.
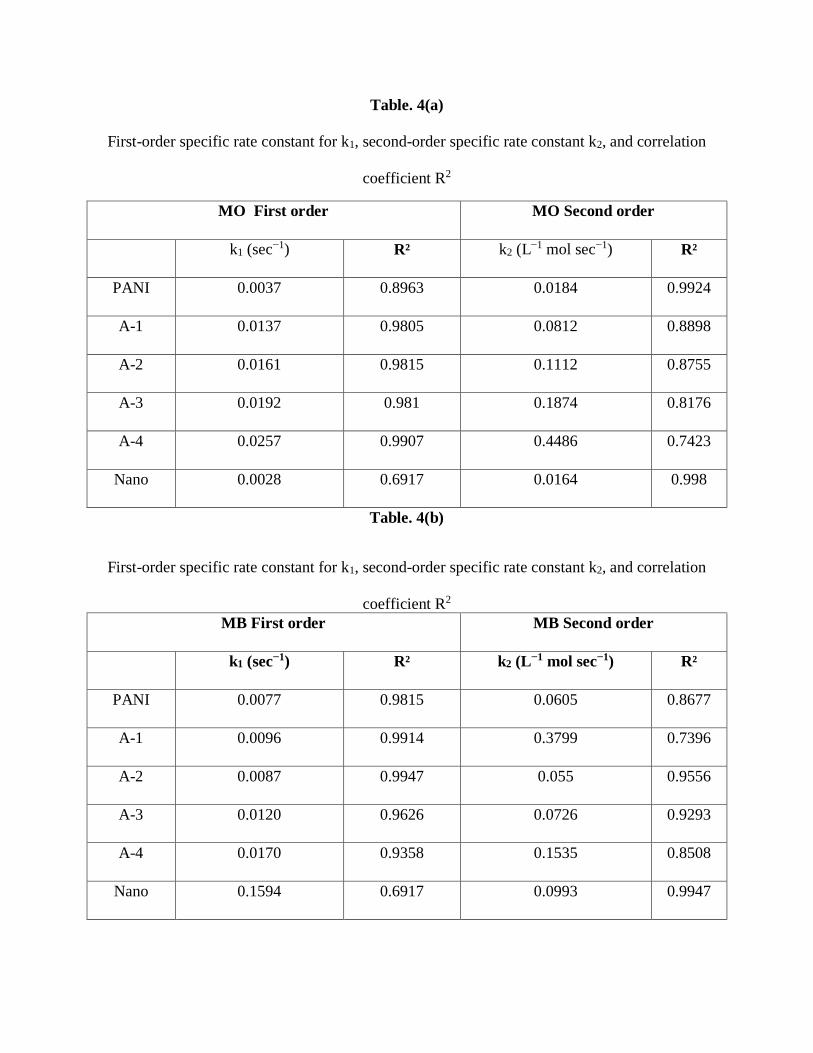
Table. 4(a)
First-order specific rate constant for k1, second-order specific rate constant k2, and correlation
coefficient R2
MO First order MO Second order
k1 (sec−1) R² k2 (L−1 mol sec−1) R²
PANI 0.0037 0.8963 0.0184 0.9924
A-1 0.0137 0.9805 0.0812 0.8898
A-2 0.0161 0.9815 0.1112 0.8755
A-3 0.0192 0.981 0.1874 0.8176
A-4 0.0257 0.9907 0.4486 0.7423
Nano 0.0028 0.6917 0.0164 0.998
Table. 4(b)
First-order specific rate constant for k1, second-order specific rate constant k2, and correlation
coefficient R2
MB First order MB Second order
k1 (sec−1) R² k2 (L−1 mol sec−1) R²
PANI 0.0077 0.9815 0.0605 0.8677
A-1 0.0096 0.9914 0.3799 0.7396
A-2 0.0087 0.9947 0.055 0.9556
A-3 0.0120 0.9626 0.0726 0.9293
A-4 0.0170 0.9358 0.1535 0.8508
Nano 0.1594 0.6917 0.0993 0.9947
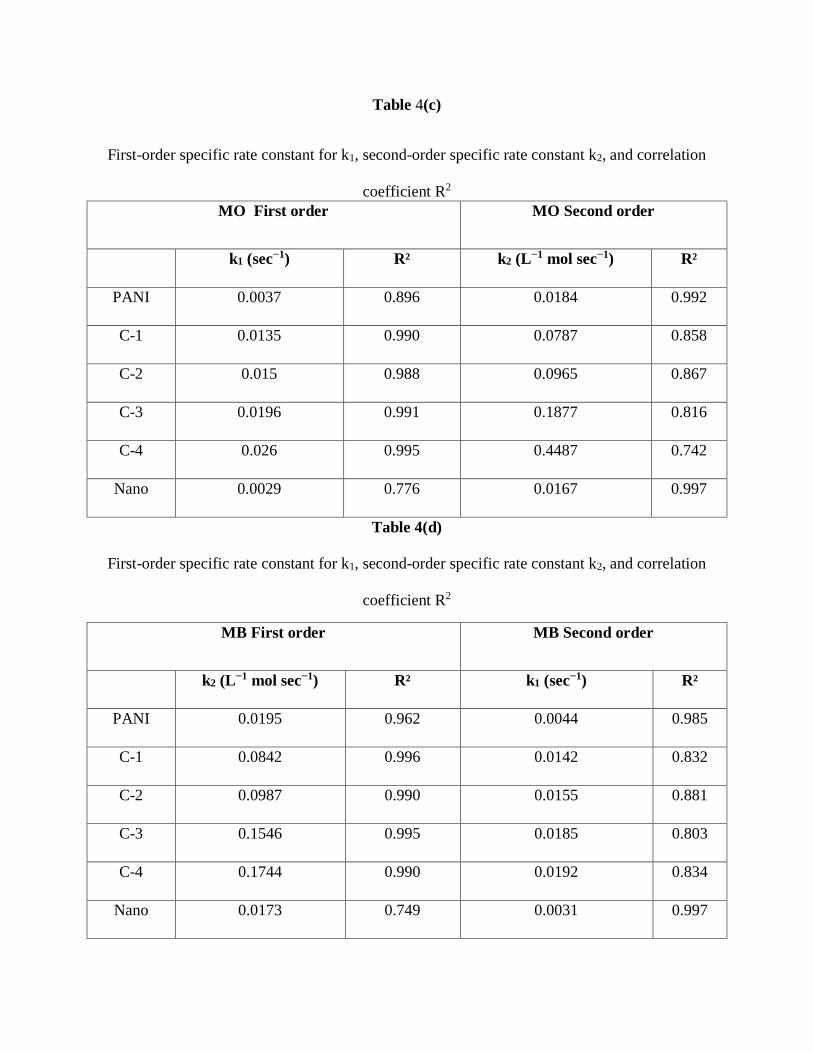
Table 4(c)
First-order specific rate constant for k1, second-order specific rate constant k2, and correlation
coefficient R2
MO First order MO Second order
k1 (sec−1) R² k2 (L−1 mol sec−1) R²
PANI 0.0037 0.896 0.0184 0.992
C-1 0.0135 0.990 0.0787 0.858
C-2 0.015 0.988 0.0965 0.867
C-3 0.0196 0.991 0.1877 0.816
C-4 0.026 0.995 0.4487 0.742
Nano 0.0029 0.776 0.0167 0.997
Table 4(d)
First-order specific rate constant for k1, second-order specific rate constant k2, and correlation
coefficient R2
MB First order MB Second order
k2 (L−1 mol sec−1) R² k1 (sec−1) R²
PANI 0.0195 0.962 0.0044 0.985
C-1 0.0842 0.996 0.0142 0.832
C-2 0.0987 0.990 0.0155 0.881
C-3 0.1546 0.995 0.0185 0.803
C-4 0.1744 0.990 0.0192 0.834
Nano 0.0173 0.749 0.0031 0.997
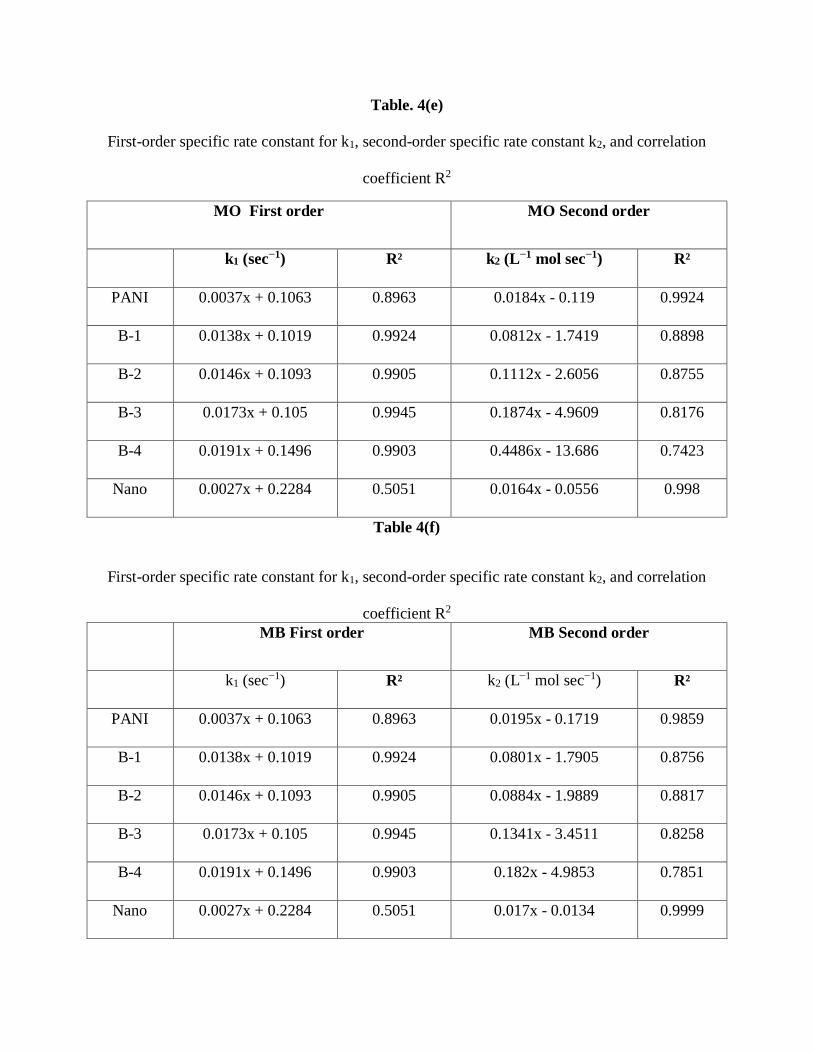
Table. 4(e)
First-order specific rate constant for k1, second-order specific rate constant k2, and correlation
coefficient R2
MO First order MO Second order
k1 (sec−1) R² k2 (L−1 mol sec−1) R²
PANI 0.0037x + 0.1063 0.8963 0.0184x - 0.119 0.9924
B-1 0.0138x + 0.1019 0.9924 0.0812x - 1.7419 0.8898
B-2 0.0146x + 0.1093 0.9905 0.1112x - 2.6056 0.8755
B-3 0.0173x + 0.105 0.9945 0.1874x - 4.9609 0.8176
B-4 0.0191x + 0.1496 0.9903 0.4486x - 13.686 0.7423
Nano 0.0027x + 0.2284 0.5051 0.0164x - 0.0556 0.998
Table 4(f)
First-order specific rate constant for k1, second-order specific rate constant k2, and correlation
coefficient R2
MB First order MB Second order
k1 (sec−1) R² k2 (L−1 mol sec−1) R²
PANI 0.0037x + 0.1063 0.8963 0.0195x - 0.1719 0.9859
B-1 0.0138x + 0.1019 0.9924 0.0801x - 1.7905 0.8756
B-2 0.0146x + 0.1093 0.9905 0.0884x - 1.9889 0.8817
B-3 0.0173x + 0.105 0.9945 0.1341x - 3.4511 0.8258
B-4 0.0191x + 0.1496 0.9903 0.182x - 4.9853 0.7851
Nano 0.0027x + 0.2284 0.5051 0.017x - 0.0134 0.9999
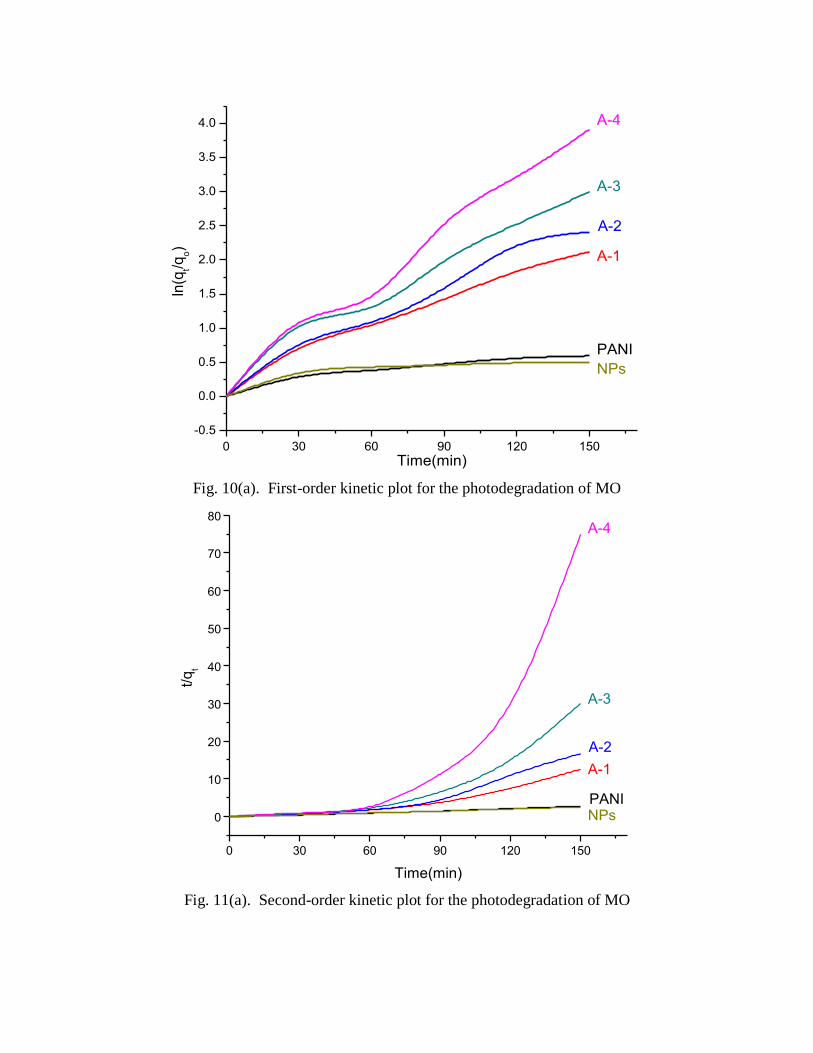
0 30 60 90 120 150
-0.5
0.0
0.5
1.0
1.5
2.0
2.5
3.0
3.5
4.0
ln(q
t/qo)
Time(min)
A-4
A-3
A-2
A-1
PANI
NPs
Fig. 10(a). First-order kinetic plot for the photodegradation of MO
0 30 60 90 120 150
0
10
20
30
40
50
60
70
80
t/q
t
Time(min)
A-4
A-3
A-2
A-1
PANINPs
Fig. 11(a). Second-order kinetic plot for the photodegradation of MO
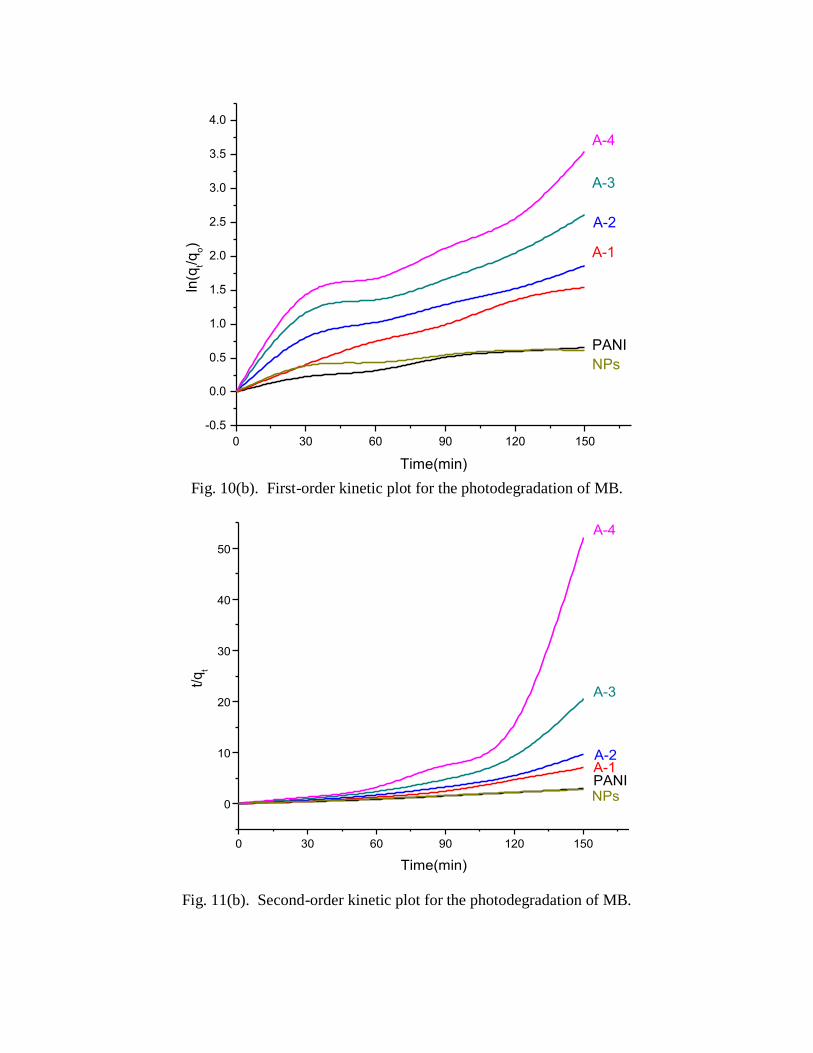
0 30 60 90 120 150
-0.5
0.0
0.5
1.0
1.5
2.0
2.5
3.0
3.5
4.0
ln(q
t/qo)
Time(min)
A-4
A-3
A-2
A-1
PANI
NPs
Fig. 10(b). First-order kinetic plot for the photodegradation of MB.
0 30 60 90 120 150
0
10
20
30
40
50
t/q
t
Time(min)
A-4
A-3
A-2A-1PANINPs
Fig. 11(b). Second-order kinetic plot for the photodegradation of MB.
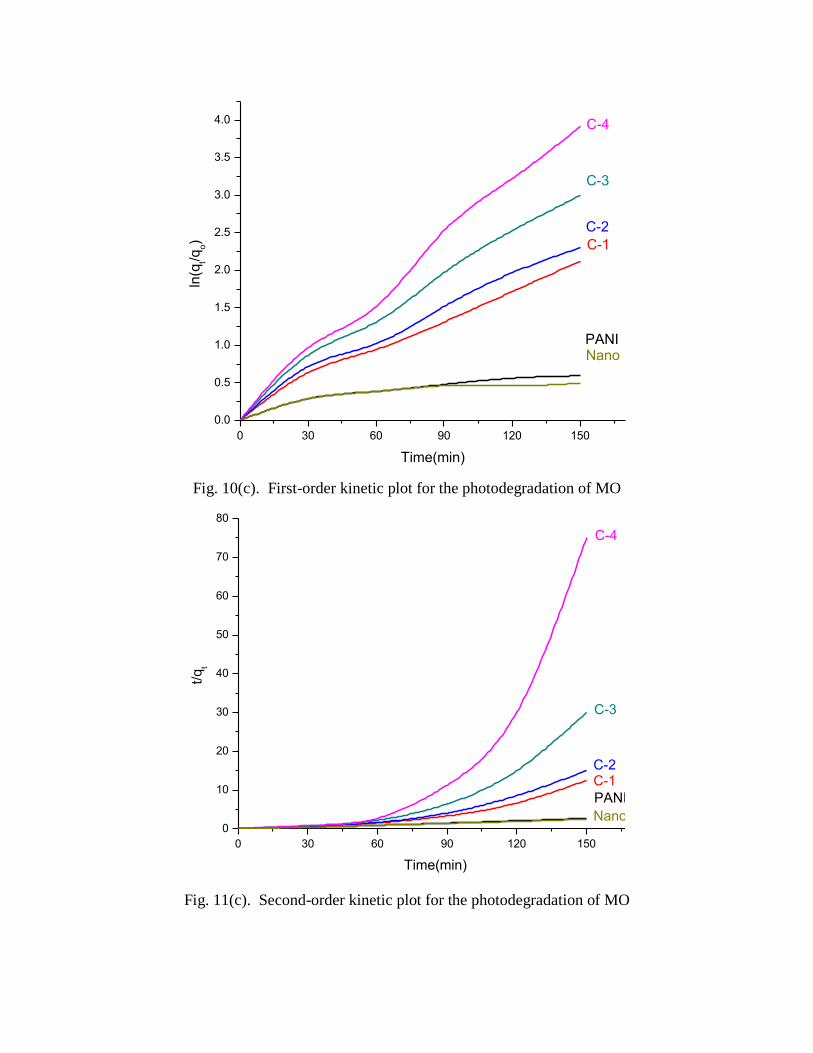
0 30 60 90 120 150
0.0
0.5
1.0
1.5
2.0
2.5
3.0
3.5
4.0
ln(q
t/qo)
Time(min)
C-4
C-3
C-2
C-1
PANINano
Fig. 10(c). First-order kinetic plot for the photodegradation of MO
0 30 60 90 120 150
0
10
20
30
40
50
60
70
80
t/q
t
Time(min)
C-4
C-3
C-2C-1
PANI
Nano
Fig. 11(c). Second-order kinetic plot for the photodegradation of MO
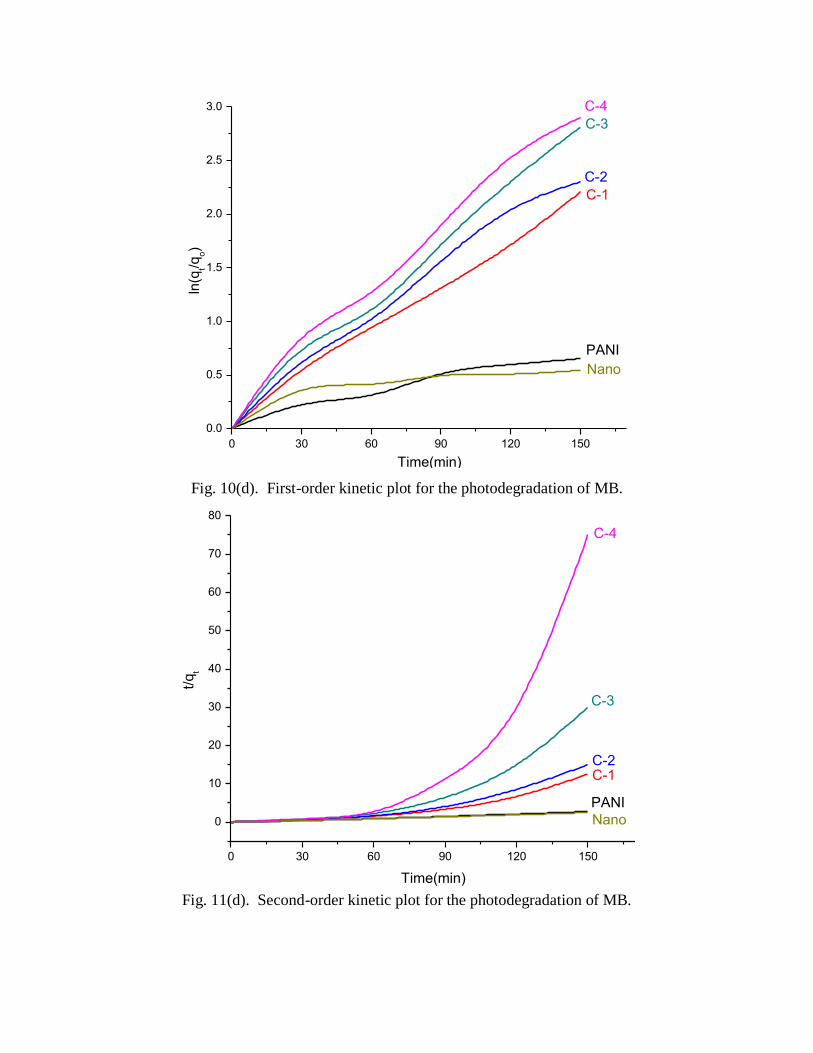
0 30 60 90 120 150
0.0
0.5
1.0
1.5
2.0
2.5
3.0
ln(q
t/qo)
Time(min)
C-4
C-3
C-2
C-1
PANI
Nano
Fig. 10(d). First-order kinetic plot for the photodegradation of MB.
0 30 60 90 120 150
0
10
20
30
40
50
60
70
80
t/q
t
Time(min)
C-4
C-3
C-2C-1
PANI
Nano
Fig. 11(d). Second-order kinetic plot for the photodegradation of MB.
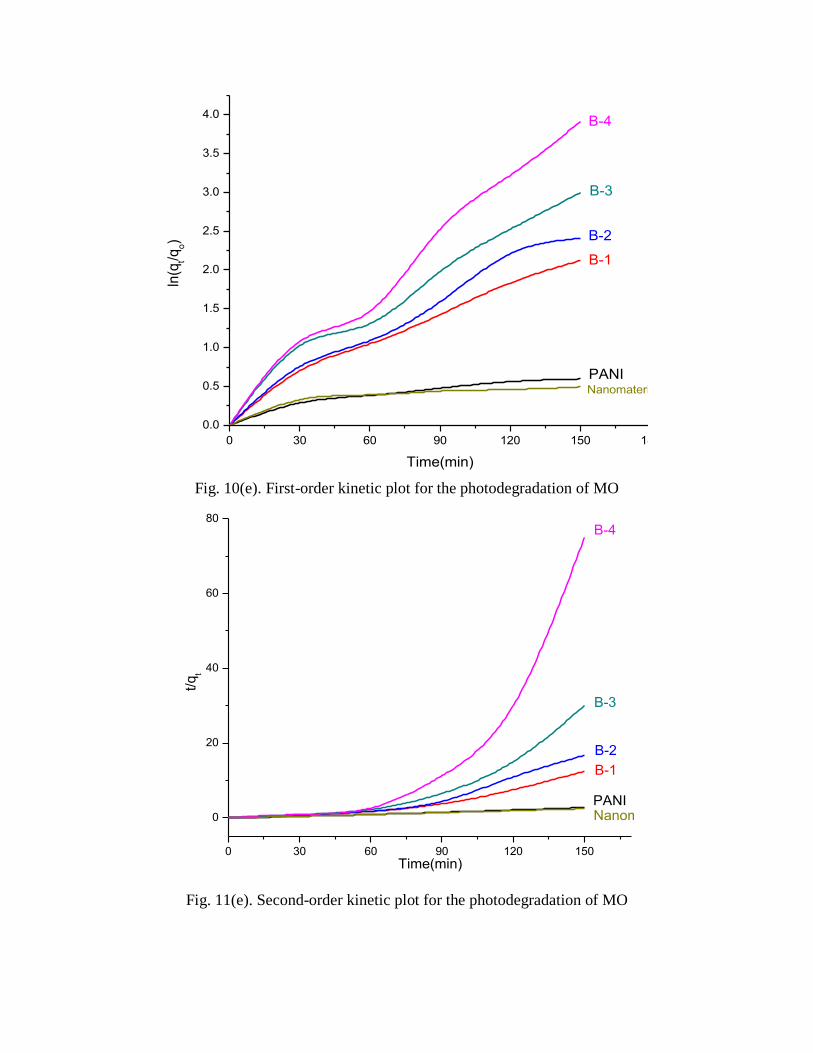
0 30 60 90 120 150 180
0.0
0.5
1.0
1.5
2.0
2.5
3.0
3.5
4.0
ln(q
t/qo)
Time(min)
B-4
B-3
B-2
B-1
PANINanomaterial
Fig. 10(e). First-order kinetic plot for the photodegradation of MO
0 30 60 90 120 150
0
20
40
60
80
t/q
t
Time(min)
B-4
B-3
B-2
B-1
PANINanomaterial
Fig. 11(e). Second-order kinetic plot for the photodegradation of MO
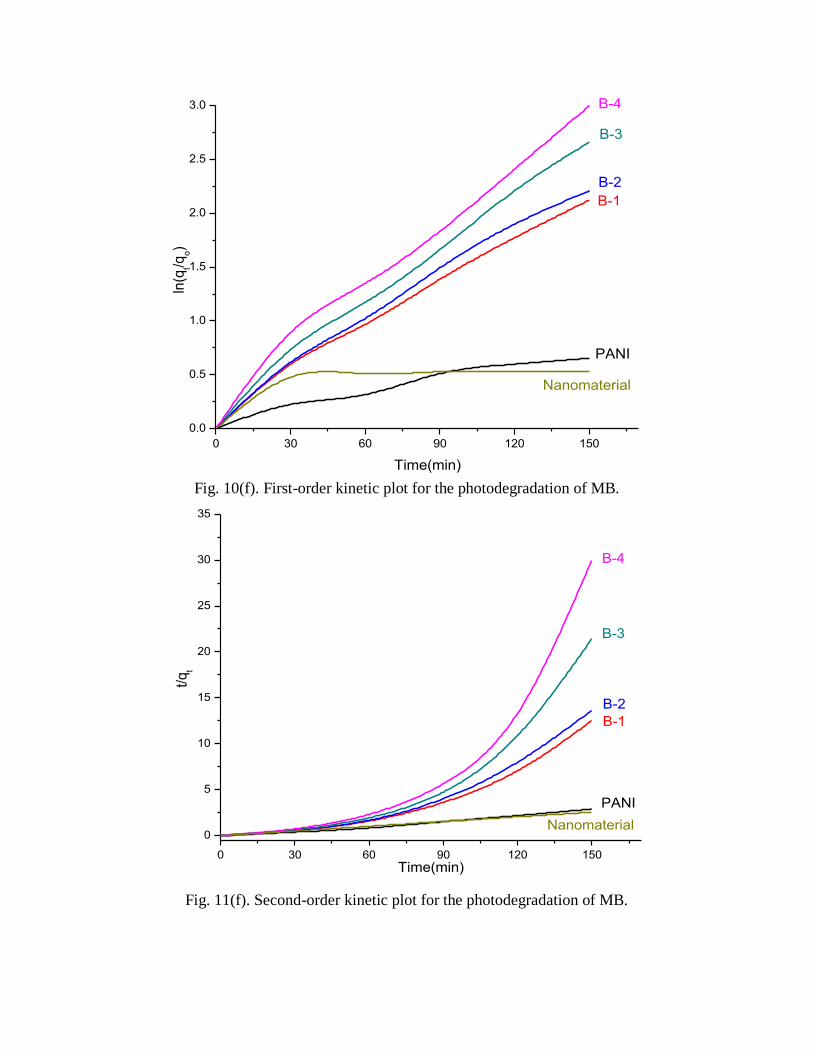
0 30 60 90 120 150
0.0
0.5
1.0
1.5
2.0
2.5
3.0
ln(q
t/qo)
Time(min)
B-4
B-3
B-2
B-1
PANI
Nanomaterial
Fig. 10(f). First-order kinetic plot for the photodegradation of MB.
0 30 60 90 120 150
0
5
10
15
20
25
30
35
t/q
t
Time(min)
B-4
B-3
B-2
B-1
PANI
Nanomaterial
Fig. 11(f). Second-order kinetic plot for the photodegradation of MB.
Conclusion
The two series of PANI/Zr-Co-substituted nickel ferrite composite and a MnAl-substituted
multiferroics was synthesized by adding nanomaterials during polymerization reaction of aniline
chloride by ammonium peroxydisulphate.
The XRD confirmed the formation of PANI/NPs composites. The composites contain the
peaks for the both materials which confirmed that the composite has been prepared
successfully of all three series.
UV-Vis studies reveal the interaction between dopant metal complex and the polyaniline
backbone chains. It is concluded by observing the increase in intensity of π–π* transition
peak and excitonic transition peak as compared to that of pure PANI.
The XPS studies confirmed the oxidation state of different elements in the composite and
NPs.
The FTIR Study also confirms the formation of composites and shifting of peaks towards
higher wave number side which are due to interaction between the polymer and the
nanomaterial molecules in the PANI/composite.
SEM images indicate that nanoparticles decorate the surface of PANI which is in the
form of sheets and increase the porosity on the surface of PANI which act as active sites
for the adsorption and degradation of MB and MO for all three NPs composites.
The BET analysis confirmed that the surface area increases with the increase in ferrite
content in the composite which increases the adsorption sites and make the composite
materials more beneficial for the photodegradation as compared to individual catalyst.

The kinetics studies showed that the degradation process follow the first-order kinetic model.
The photodegradation of MB as well as MO increases with the increase in nanoparticle content
in the composite and maximum for the sample with 50% ferrite nanoparticle composite which is
much higher as compared to other photocatalyst reported in the literature. The high degradation
percentage by present composite indicates that these can be used as photocatalyst for the removal
of MB and MO from water.


![Muhammad Aamir Cheema · ers (Muhammad Omer Cheema, Muhammad Umair Cheema and Muhammad Ammar Cheema) who are my nearest surrounders2 [LLL06] and have provided me with a strong love](https://img.pdfslide.us/doc/110x75/5fb9ea326d6c7a5c8c32d214/muhammad-aamir-ers-muhammad-omer-cheema-muhammad-umair-cheema-and-muhammad-ammar.jpg)