Embed Size (px)
Citation preview
Analysis of Investment Behaviour with Reference to Retail
Investors of Ranchi in Indian Stock Market
Synopsis of Doctoral Thesis submitted
In partial fulfillment of the requirements for the award of the degree of
DOCTOR OF PHILOSOPHY
In
MANAGEMENT
BY
Jyoti Kumari
(13JU11300010)
Under the guidance of
Research Co-Supervisor
Dr. Sanjay Kumar Thakur
Head, Treasury Product Control
The Saudi Investment Bank,
Kingdom of Saudi Arabia
Research Supervisor
Dr. Sukanta Chandra Swain
Professor
ICFAI University Jharkhand,
Ranchi, India
ICFAI UNIVERSITY JHARKHAND
RANCHI
January 2017

Introduction:
Despite the fact that India’s GDP has increased 5.5 times from $414 billion in 2001 to $2263.52
billion in 2016, the development of the capital market has been bumpy and its penetration has
been inadequate. For instance, only 1.7% of Indian population is having Demat Accounts (a
measure of direct participation in the stock market) as against 17.7% in USA, 16.4% in UK, and
9.4% in China. Although there is a surge in the number of Demant Accounts in India in recent
years, the same trend has not been reflected in the number of active Accounts. Also, the total
number of active stock exchanges across India has reduced from 16 at the start of the decade to
four now, including two national exchanges, namely The National Stock Exchange of India
(NSE) and Bombay Stock Exchange (BSE). Moreover, National Stock Exchange’s share of total
turnover across stock exchanges has surged dramatically from 61.53% in 2001-02 to 92.52% in
2014-15. Apart from NSE and BSE, the only two stock exchanges that are active are Calcutta
Stock Exchange and Uttar Pradesh Exchange. Almost 80% of the NSE’s turnover in India
continues to come from the top five cities of Mumbai, Delhi, Kolkata, Ahmadabad and Chennai.
In fact, Mumbai accounts for more than half the total NSE turnover at 55%; whereas Delhi,
contributor of the second largest turnover has a market share of 14.97%. In such context, it
wouldn’t be difficult to ascertain about the contribution of a city like Ranchi. However, India
having one of the highest savings rate in the world, city like Ranchi has potential to increase its
contribution in the Indian capital market. However, it is important to study thought processes and
perceptions, challenges and bottlenecks i.e., investing behavior of the investors of this city. The
Study is confined to the retail investors based at Ranchi (India). Mostly trading houses have
Depository Participant (DP) accounts along with trading accounts. However, some other
organizations like banks too provide DP account facility. Therefore, the study although mostly
considers the retail investors trading through trading houses; it has also been extended to include
retail investors of Indian stock market who don’t trade through trading houses. On the basis of
holistic behavior of the investors, risk tolerant score of each investor has been ascertained,
clustered in three categories - Investors with High Risk Appetite, Investors with Moderate Risk
Appetite and Investors with Low Risk Appetite; and suggestions are given to stretch the depth of
investment. Moreover, in order to elongate the incidence of retail investment in Indian stock
market, non-investors have also been studied to find why they don’t go for investing on equity.
Although from various studies it has been established that percentage of population investing
through shares are very less, but most of the people gets directly or indirectly affected by stock
prices movement. For example, suppose ‘A’ does not prefer investing directly into the stock
market, but he has a private pension fund. His pension fund will get invested into stock market.
And if market is seeing a downtrend from longer period, his pension fund will also get reduced.
A genuine question corps up in anybody’s mind that ‘In spite of having high level of bearings
with all facets of economic activities, why investment in Stock Markets by retail investors of
India is so low?’ It is probably because of risk involved in such investment, ascertaining risk
with no or little information and improper rating of risk tolerance capacity of retail investors.
Each retail investor has his or her own tolerance of and attitude towards risk so that an
investment considered ‘high risk’ by one investor may be considered ‘low risk’ by another
investor. Thus assessing investors to their appropriate risk tolerance category and accordingly
devising the most suitable strategies to them for investment in stock market has been emerged as
the most transparently visible task of the researchers.
A person who purchases securities with the expectation of financial returns is known as an
investor. Purchase of securities by an individual for his or her own personal account rather than
for an organization is known as retail investment. Typically, the retail investors trade in much
smaller amounts than the institutional investors. A retail investor can buy securities directly from
the companies issuing those (Through IPOs in Primary Capital Market) or can buy securities
from the existing investors through the Depositories, i.e., the stock markets (Secondary Capital
Market). The scope of this study is confined to Secondary Capital Market.
An investor may be interpreted as an individual who; a) has purchased securities long back but
not active now, b) has been trading securities regularly and c) has just recently purchased
securities. For this Study, as referral sampling has been followed to pick up the investors, the
respondents selected are active in investment in Indian Stock Market during Study period
irrespective of whether they are first timer or regular investors.
There are four ways through which retail investment takes place. Those are;
Individuals invest of their own
Through retail brokers (act as per the direction of individual investors)
Through Managed Accounts (whereby the account manager makes the buy and sell
decisions for the individual), and
Through Investment Clubs (groups of people who pool their savings to make
investment).
While approaching the respondents of this Study, the first two ways of retail investment have
been considered.
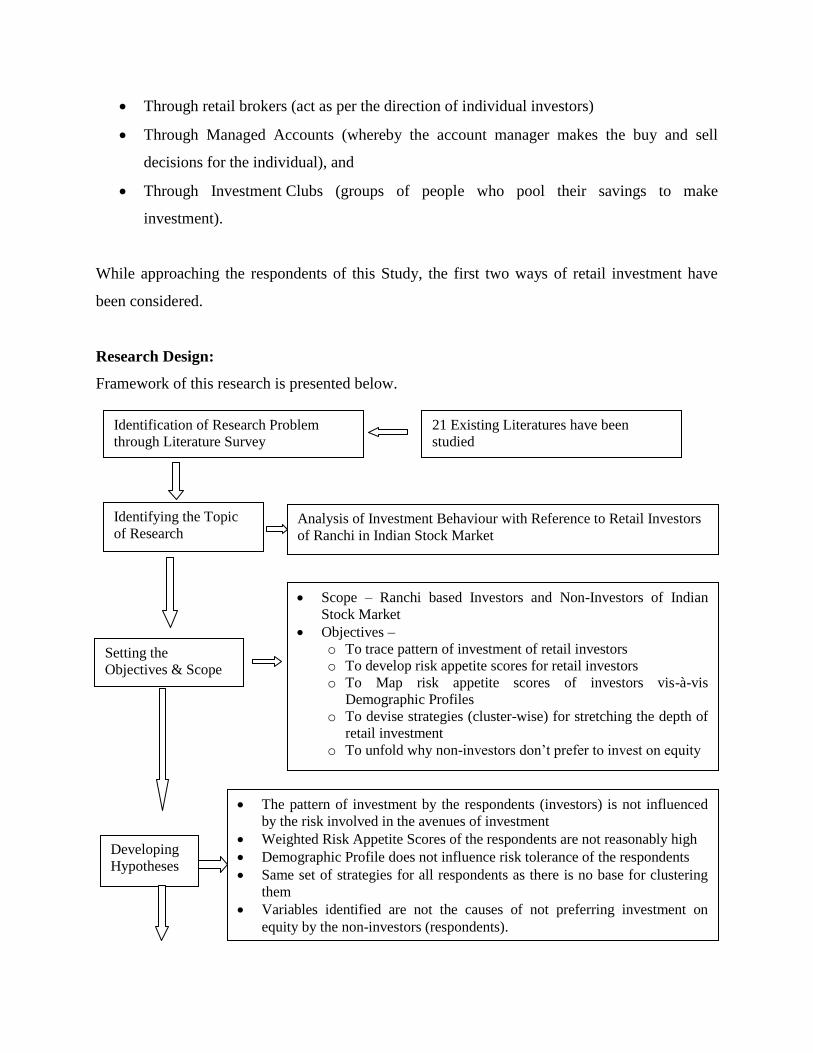
Research Design:
Framework of this research is presented below.
21 Existing Literatures have been
studied
Identification of Research Problem
through Literature Survey
Analysis of Investment Behaviour with Reference to Retail Investors
of Ranchi in Indian Stock Market
Identifying the Topic
of Research
Scope – Ranchi based Investors and Non-Investors of Indian
Stock Market
Objectives –
o To trace pattern of investment of retail investors
o To develop risk appetite scores for retail investors
o To Map risk appetite scores of investors vis-à-vis
Demographic Profiles
o To devise strategies (cluster-wise) for stretching the depth of
retail investment
o To unfold why non-investors don’t prefer to invest on equity
Setting the
Objectives & Scope
The pattern of investment by the respondents (investors) is not influenced
by the risk involved in the avenues of investment
Weighted Risk Appetite Scores of the respondents are not reasonably high
Demographic Profile does not influence risk tolerance of the respondents
Same set of strategies for all respondents as there is no base for clustering
them
Variables identified are not the causes of not preferring investment on
equity by the non-investors (respondents).
Developing
Hypotheses
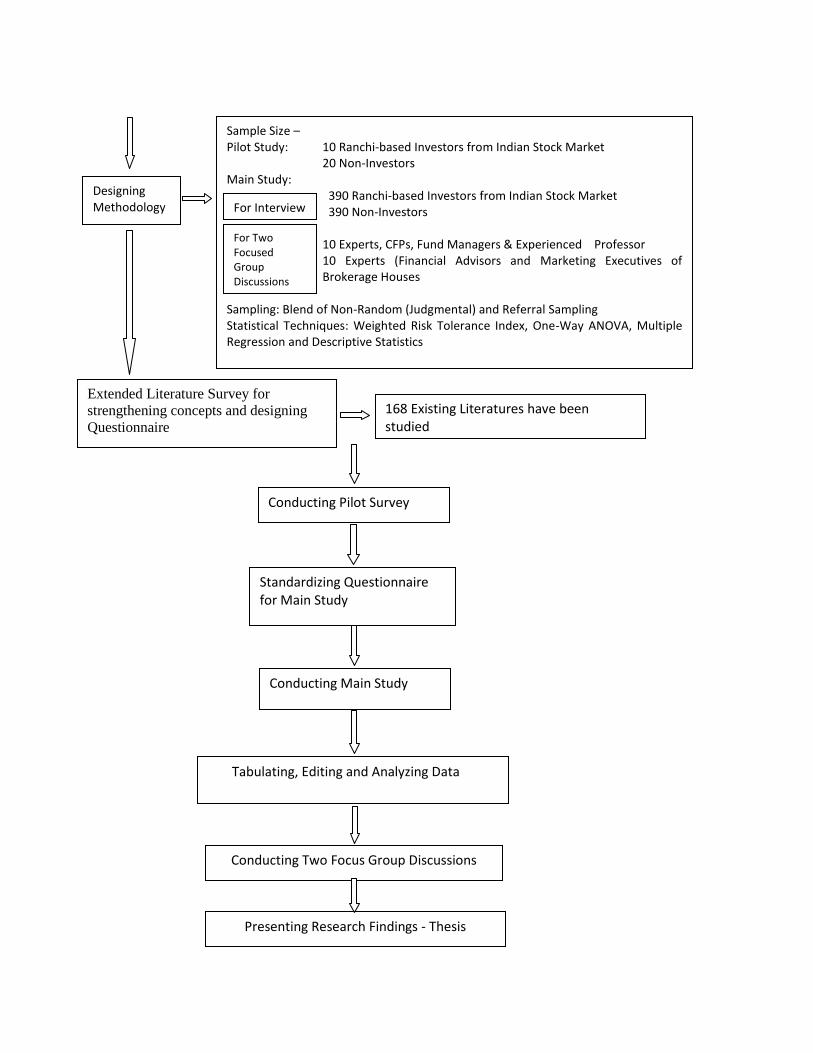
Sample Size – Pilot Study: 10 Ranchi-based Investors from Indian Stock Market 20 Non-Investors Main Study:
390 Ranchi-based Investors from Indian Stock Market 390 Non-Investors
10 Experts, CFPs, Fund Managers & Experienced Professor 10 Experts (Financial Advisors and Marketing Executives of Brokerage Houses
Sampling: Blend of Non-Random (Judgmental) and Referral Sampling Statistical Techniques: Weighted Risk Tolerance Index, One-Way ANOVA, Multiple Regression and Descriptive Statistics
Designing Methodology
168 Existing Literatures have been studied
Extended Literature Survey for
strengthening concepts and designing
Questionnaire
Conducting Pilot Survey
Standardizing Questionnaire for Main Study
Conducting Main Study
Tabulating, Editing and Analyzing Data
Presenting Research Findings - Thesis
For Interview
Conducting Two Focus Group Discussions
For Two Focused Group Discussions
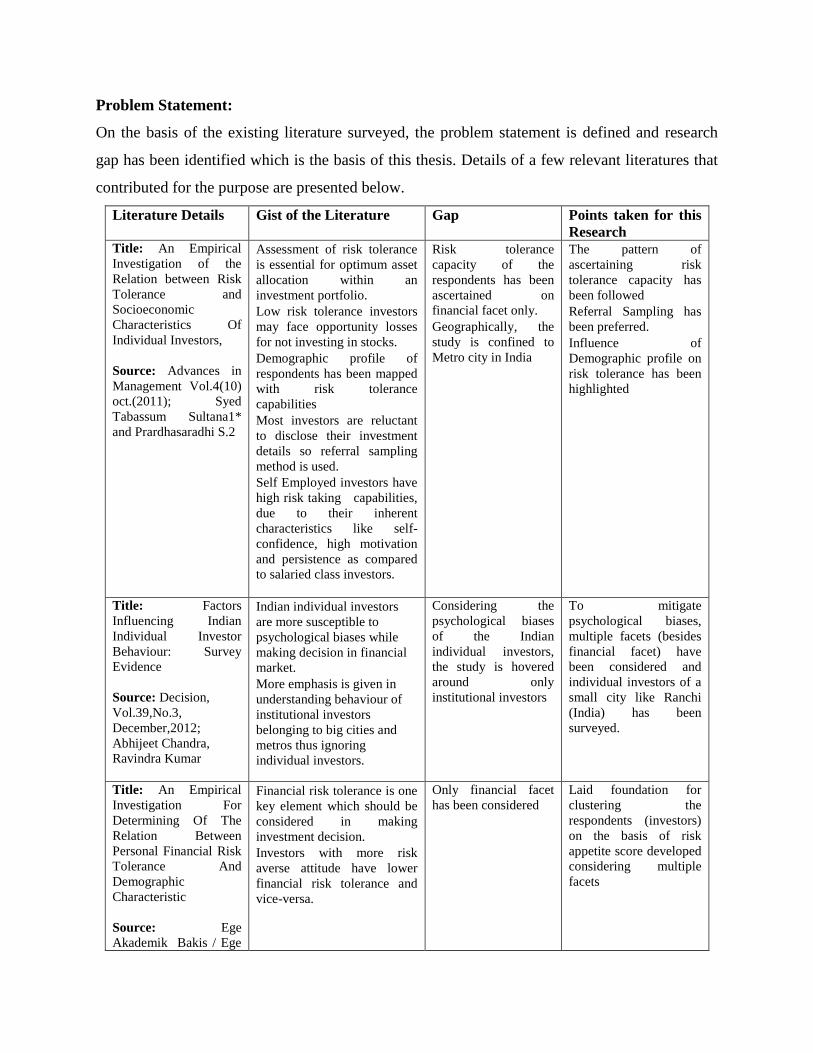
Problem Statement:
On the basis of the existing literature surveyed, the problem statement is defined and research
gap has been identified which is the basis of this thesis. Details of a few relevant literatures that
contributed for the purpose are presented below.
Literature Details Gist of the Literature Gap Points taken for this
Research Title: An Empirical
Investigation of the
Relation between Risk
Tolerance and
Socioeconomic
Characteristics Of
Individual Investors,
Source: Advances in
Management Vol.4(10)
oct.(2011); Syed
Tabassum Sultana1*
and Prardhasaradhi S.2
Assessment of risk tolerance
is essential for optimum asset
allocation within an
investment portfolio.
Low risk tolerance investors
may face opportunity losses
for not investing in stocks.
Demographic profile of
respondents has been mapped
with risk tolerance
capabilities
Most investors are reluctant
to disclose their investment
details so referral sampling
method is used.
Self Employed investors have
high risk taking capabilities,
due to their inherent
characteristics like self-
confidence, high motivation
and persistence as compared
to salaried class investors.
Risk tolerance
capacity of the
respondents has been
ascertained on
financial facet only.
Geographically, the
study is confined to
Metro city in India
The pattern of
ascertaining risk
tolerance capacity has
been followed
Referral Sampling has
been preferred.
Influence of
Demographic profile on
risk tolerance has been
highlighted
Title: Factors
Influencing Indian
Individual Investor
Behaviour: Survey
Evidence
Source: Decision,
Vol.39,No.3,
December,2012;
Abhijeet Chandra,
Ravindra Kumar
Indian individual investors
are more susceptible to
psychological biases while
making decision in financial
market.
More emphasis is given in
understanding behaviour of
institutional investors
belonging to big cities and
metros thus ignoring
individual investors.
Considering the
psychological biases
of the Indian
individual investors,
the study is hovered
around only
institutional investors
To mitigate
psychological biases,
multiple facets (besides
financial facet) have
been considered and
individual investors of a
small city like Ranchi
(India) has been
surveyed.
Title: An Empirical
Investigation For
Determining Of The
Relation Between
Personal Financial Risk
Tolerance And
Demographic
Characteristic
Source: Ege
Akademik Bakis / Ege
Financial risk tolerance is one
key element which should be
considered in making
investment decision.
Investors with more risk
averse attitude have lower
financial risk tolerance and
vice-versa.
Only financial facet
has been considered
Laid foundation for
clustering the
respondents (investors)
on the basis of risk
appetite score developed
considering multiple
facets
Academic Review
10(2) 2010: 503-523;
Adem Anbar and
Melek Eker
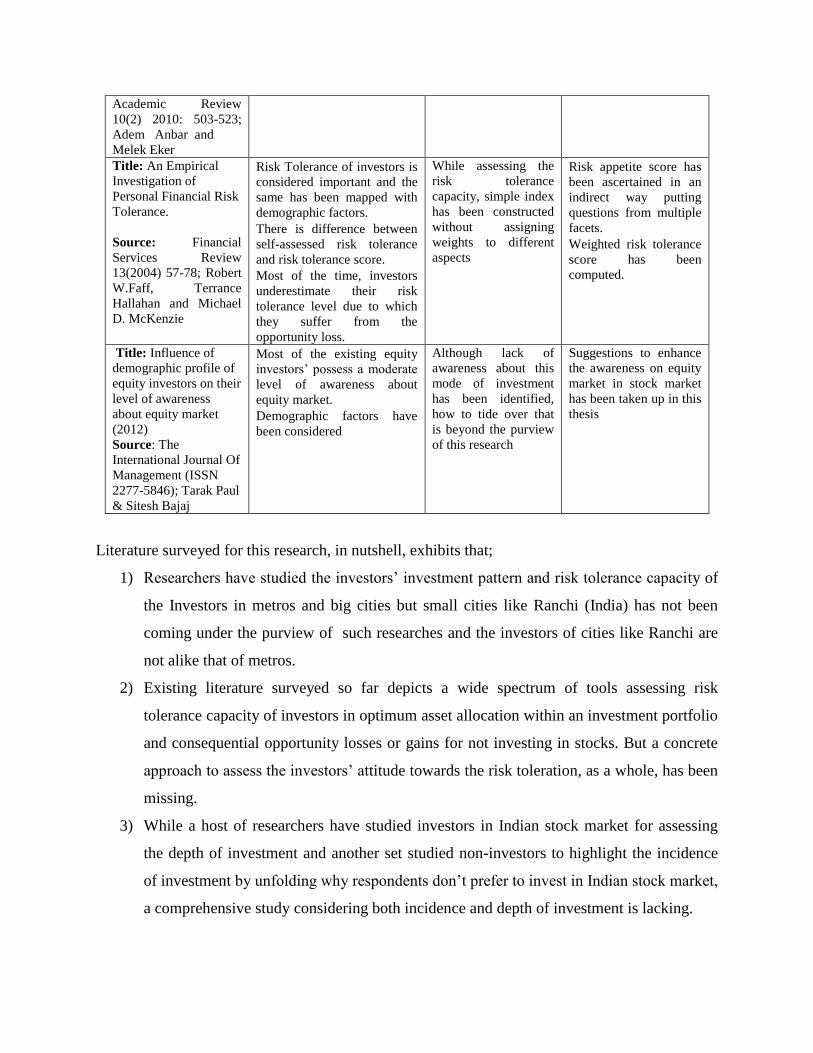
Title: An Empirical
Investigation of
Personal Financial Risk
Tolerance.
Source: Financial
Services Review
13(2004) 57-78; Robert
W.Faff, Terrance
Hallahan and Michael
D. McKenzie
Risk Tolerance of investors is
considered important and the
same has been mapped with
demographic factors.
There is difference between
self-assessed risk tolerance
and risk tolerance score.
Most of the time, investors
underestimate their risk
tolerance level due to which
they suffer from the
opportunity loss.
While assessing the
risk tolerance
capacity, simple index
has been constructed
without assigning
weights to different
aspects
Risk appetite score has
been ascertained in an
indirect way putting
questions from multiple
facets.
Weighted risk tolerance
score has been
computed.
Title: Influence of
demographic profile of
equity investors on their
level of awareness
about equity market
(2012)
Source: The
International Journal Of
Management (ISSN
2277-5846); Tarak Paul
& Sitesh Bajaj
Most of the existing equity
investors’ possess a moderate
level of awareness about
equity market.
Demographic factors have
been considered
Although lack of
awareness about this
mode of investment
has been identified,
how to tide over that
is beyond the purview
of this research
Suggestions to enhance
the awareness on equity
market in stock market
has been taken up in this
thesis
Literature surveyed for this research, in nutshell, exhibits that;
1) Researchers have studied the investors’ investment pattern and risk tolerance capacity of
the Investors in metros and big cities but small cities like Ranchi (India) has not been
coming under the purview of such researches and the investors of cities like Ranchi are
not alike that of metros.
2) Existing literature surveyed so far depicts a wide spectrum of tools assessing risk
tolerance capacity of investors in optimum asset allocation within an investment portfolio
and consequential opportunity losses or gains for not investing in stocks. But a concrete
approach to assess the investors’ attitude towards the risk toleration, as a whole, has been
missing.
3) While a host of researchers have studied investors in Indian stock market for assessing
the depth of investment and another set studied non-investors to highlight the incidence
of investment by unfolding why respondents don’t prefer to invest in Indian stock market,
a comprehensive study considering both incidence and depth of investment is lacking.
4) As filler, this study putting a set of questions from different facet to each investor with
quantified weight attached to every option so as to ascertain wholistic risk tolerating
capacity. After assessing the risk tolerating capacity, the investors studied are clustered
and the strategies are developed accordingly for different clusters.
And for incidence of investment, a set of non-investors of stock market has been surveyed to find
out why they don’t go for investing in Indian stock market.
Objectives:
The Objectives of this study are as follows;
1) To study the pattern of investment (including return expectations) of retail investors’
based at Ranchi
2) To develop risk appetite scores for retail investors of different background and cluster
them in accordance with risk appetite scores.
3) To find out whether risk appetite scores of investors are dependent on their demographic
profiles.
4) To devise strategies for different clusters on the basis of risk appetite score in order to
stretch the depth of investment in Indian stock market.
5) To unfold why non-investors don’t prefer to invest on equity; for stretching the incidence.
Methodology:
The study is an empirical one concerning the depth and incidence of investment in Indian Stock
Market. For the purpose, the primary data is collected from; a) the retail investors on their
trading pattern, risk appetite and behavioural facets that determine the investment decisions and
b) the non-investors on why they don’t prefer to invest on equity . On the backdrop of this, there
has been concrete information about the stock markets of India containing types of market, the
way of functioning, scope and perceptions of investors from secondary sources.
Methodology for studying the trading pattern of retail investors, 390 retail investors are
surveyed for knowing;
a) The investable capacity of the investors
b) Whether the investors are first timer or matured
c) Whether they get actively involved in trading
d) Whether they are traders or investors
e) How frequently they invest
f) Whether they invest for need or take investment as an adventurous move
g) Whether they are well-informed investors or mere speculators
h) Whether they are investors of their own or due to persuasion/moral pressure.
Methodology for developing risk appetite score for retail investors;
A Questionnaire, capturing multiple facets of human behavior in the form of 10 questions with
five options each, has been administered on 390 investors to know their risk tolerance capacity
and quantification is done by assigning a score to them (on the basis of literature surveyed) so as
to know whether their risk appetite is high or low or moderate. Facets identified and put in the
questionnaire are based on the literature surveyed and the same is presented in the Questionnaire
annexed towards the end of the thesis. On each facet, five options are given and each option has
been assigned with a risk tolerance score. Score is zero if the option is risk free; it is 25, if there
is some amount of risk is there in the option; it is 50, if the risk involved in the option is
moderate; it is 75, if the risk involved in the option higher than the moderately riskier and it is
100, if the risk involved in the option is the most. Respondents have ticked an option without
knowing the risk score attached to the options. Each question/facet has also been weighted on the
basis of risk involved in the each facet/question. Question/facet with least level of risk is given
weight 1 and the question/facet with most level of risk is given weight 10 (as 10 facets have been
identified). Weighted Risk Tolerance Score of an individual (respondent) in a facet has been
ascertained by multiplying the risk tolerance score of the option selected with the weight of the
facet (i.e., RTS*W)
Methodology for Mapping Demographic Data vis-à-vis Risk Tolerance Capacity of the
Respondents;
For ascertaining whether demographic factors influence the risk tolerance capacity of the
respondents, the independent variables taken are demographic factors such as; Gender, Age-
Group, Educational Qualification, Number of Family Members, Occupation and Income level.
And the dependent variable taken is the risk tolerance capacity, i.e., Weighted Risk Tolerance
Score (RTSW). RTSW of an individual (respondent) in a facet has been ascertained by
multiplying the risk tolerance score (RTS) of the option selected with the weight of the facet
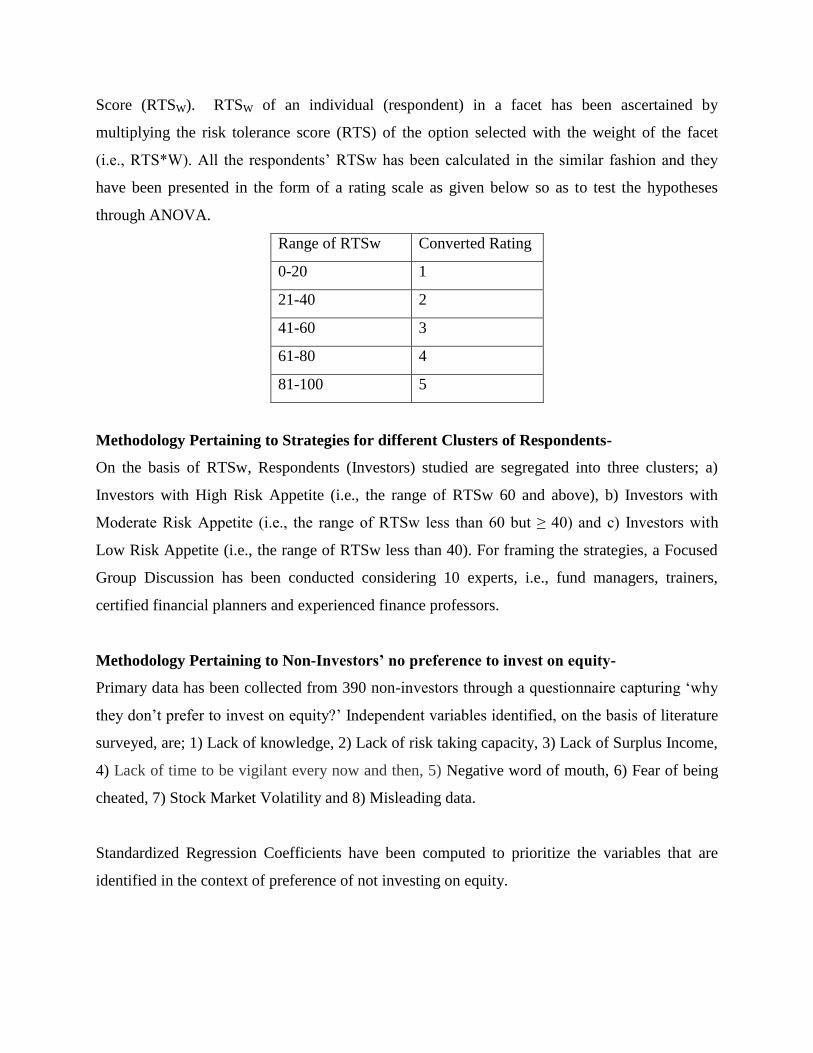
(i.e., RTS*W). All the respondents’ RTSw has been calculated in the similar fashion and they
have been presented in the form of a rating scale as given below so as to test the hypotheses
through ANOVA.
Range of RTSw Converted Rating
0-20 1
21-40 2
41-60 3
61-80 4
81-100 5
Methodology Pertaining to Strategies for different Clusters of Respondents-
On the basis of RTSw, Respondents (Investors) studied are segregated into three clusters; a)
Investors with High Risk Appetite (i.e., the range of RTSw 60 and above), b) Investors with
Moderate Risk Appetite (i.e., the range of RTSw less than 60 but ≥ 40) and c) Investors with
Low Risk Appetite (i.e., the range of RTSw less than 40). For framing the strategies, a Focused
Group Discussion has been conducted considering 10 experts, i.e., fund managers, trainers,
certified financial planners and experienced finance professors.
Methodology Pertaining to Non-Investors’ no preference to invest on equity-
Primary data has been collected from 390 non-investors through a questionnaire capturing ‘why
they don’t prefer to invest on equity?’ Independent variables identified, on the basis of literature
surveyed, are; 1) Lack of knowledge, 2) Lack of risk taking capacity, 3) Lack of Surplus Income,
4) Lack of time to be vigilant every now and then, 5) Negative word of mouth, 6) Fear of being
cheated, 7) Stock Market Volatility and 8) Misleading data.
Standardized Regression Coefficients have been computed to prioritize the variables that are
identified in the context of preference of not investing on equity.
In order to substantiate the findings regarding why people don’t invest in Indian Stock Market,
opinions of 10 experts (financial advisors and marketing executives of different brokerage
houses) who have direct interface with the potential investors and work for stretching the
incidence of retail investment in Indian Stock Market, have been collated through a Focus Group
Discussion (FGD) .
Summary and Conclusion:
A) Pertaining to Pattern of Investment by Investors:
A great chunk of the respondents (i.e., 37%) invest about 20-30% of their income.
Highest percentage of respondents prefers to park their surplus income in Banks in the
form of Fixed Deposits and also average percentage of investible amount (of all who are
parking surplus in banks) is highest in Banks.
‘Major Purchase’ followed by ‘accumulation of funds and preparedness for retirement’ is
Primary goal for the funds in Respondent's Investment Account.
Major objective of the most of the respondents is to ‘generate aggressive capital growth
over the long-term’ followed by ‘generating long-term capital growth’.
A great percentage of respondents prefer a combination of both fixed income and
variable income securities.
A very high percentage of respondents prefer long term investment, i.e., more than five
years of investment term.
Most of the respondents either check the performance and status of the Fund ‘quarterly’
or ‘without any specific time gap’.
Highest percentage of respondents gets the information on Funds from ‘friends and
relatives’ followed by from ‘financial advisors’.
Most of the investors studied prefer less risky avenues and with the expectation of higher
rate of return, they prefer long time period.
Thus the pattern of investment by the respondents (investors) is influenced by the risk involved
in the avenues of investment.
B) Pertaining to Risk Appetite Scores for Retail Investors:
Since maximum number of respondents, i.e., 53.8% are having Weighted Average Risk
Tolerance Score (ARTSw) of 4.55-39.55, Weighted Risk Appetite Scores of the
respondents are not reasonably high.
Demographic factors such as income level, occupation, no. of family members and age-
group of the respondents significantly impact their risk appetite scores but Demographic
Factors such as educational qualification and gender of the respondents do not
significantly impact their risk tolerance scores.
Owing to a huge range (one extreme is as low as 4.55 and another extreme is as high as
90.91) of ARTSw, there is strong base for clustering the investors.
On the basis of ARTSw, Investors studied have been segregated into three clusters –
High, Medium and Low.
The highest percentage of investors (53.8%) is in the cluster of low risk tolerance
capacity.
Thus, different set of strategies for different clusters with demographic variations has been
formulated to stretch the depth of investment.
C) Prioritization of Variables for Non-Investors’ Preference:
Variables such as Lack of knowledge (V1), Lack of risk taking capacity (V2), Lack of
investible surplus (V3), Lack of time to be vigilant every now and then (V4), Negative
word of mouth (V5), Fear of being cheated (V6), Stock Market Volatility (V7), and
Misleading data (V8) are identified that insist the non-investors not to invest on equity.
These eight variables, i.e., the barrier factors, significantly impact the investment on
equity.
On the basis of degree of influencing preference of non-investors not to invest on equity,
the priority list of variables is as follows; V6 , V7, V1 , V2 , V8 , V3 , V5, V4.
As per the experts’ opinion, factors like ‘Stock Market Volatility’ and ‘Misleading Data’
are the bye-product of factors like ‘Lack of knowledge’ and ‘Negative Word of Mouth’.
Similarly, as per the experts, factors like ‘Lack of Surplus Income’ and ‘Lack of time to
be vigilant every now and then’ are the plea for avoiding owing to factors ‘Fear of being
cheated’ and ‘Lack of risk taking capacity’.
D) Societal Contribution of Research Findings:
The findings of this research, besides contributing to the literature base in behavioural finance in
the form of methodology, data analysis and interpretation, it will help in addressing the basic
problem that the Indian Stock Market has been facing. It will act as a foundation for stretching
the depth of investment (business) of any broking firm. If the broking firms take initiatives in
such studies of their investors and suggest in a customized way, depending on the risk appetite
scores of the investors, then investment volume and frequency of trading of the existing investors
may increase. Moreover, findings of study of non-investors will facilitate expanding the
incidence of investment.
E) Limitation of the Study:
The limitation of this study is its scope, i.e., only the investors based at Ranchi
The Referral Sampling used for the purpose may not represent the universe and hence
generalization of inference on the basis of findings of this research may not be
appropriate.
Data used for Risk Appetite could have also been collected in a rating scale so as to do
clustering through cluster analysis and the same might have been mapped with the
clusters created by risk appetite score and a model could have been developed.
F) Scope for Future Research:
It will have interesting result if research takes place in similar fashion with investors and
non-investors based in the outskirt of Ranchi or any sub-urban areas of India where
penetration is almost nil.
With a broadened time frame, stratified random sampling may be thought of doing
research in future.
Research needs to be there in getting data in rating scale on the facets identified so that
the same can be used for cluster analysis and designing a model by mapping the risk
appetite scores with clusters from cluster analysis.


![[XLS]icdsbih.gov.inicdsbih.gov.in/admin/GuidelineDoc/Vaishali District... · Web viewAbita Kumari W/O-Vasant Naik Sharda Devi Dilawarpur North/East Rekha Kumari W/O-Suresh Thakur](https://img.pdfslide.us/doc/110x75/5ad428257f8b9a1a028b7d0a/xls-districtweb-viewabita-kumari-wo-vasant-naik-sharda-devi-dilawarpur-northeast.jpg)


![coenfdd.comcoenfdd.com/images/file/aks.pdf · Kaur Gill, Niti Aggarwal, Jyoti Kumari, Manisha Kumari ... pyrido[3,2-c]quinolines. Chaniyara, R., Thakrar, S., Kakadiya,R., Marvania,B.,](https://img.pdfslide.us/doc/110x75/5ab5220c7f8b9a0f058c7e38/gill-niti-aggarwal-jyoti-kumari-manisha-kumari-pyrido32-cquinolines-chaniyara.jpg)