Embed Size (px)
Citation preview
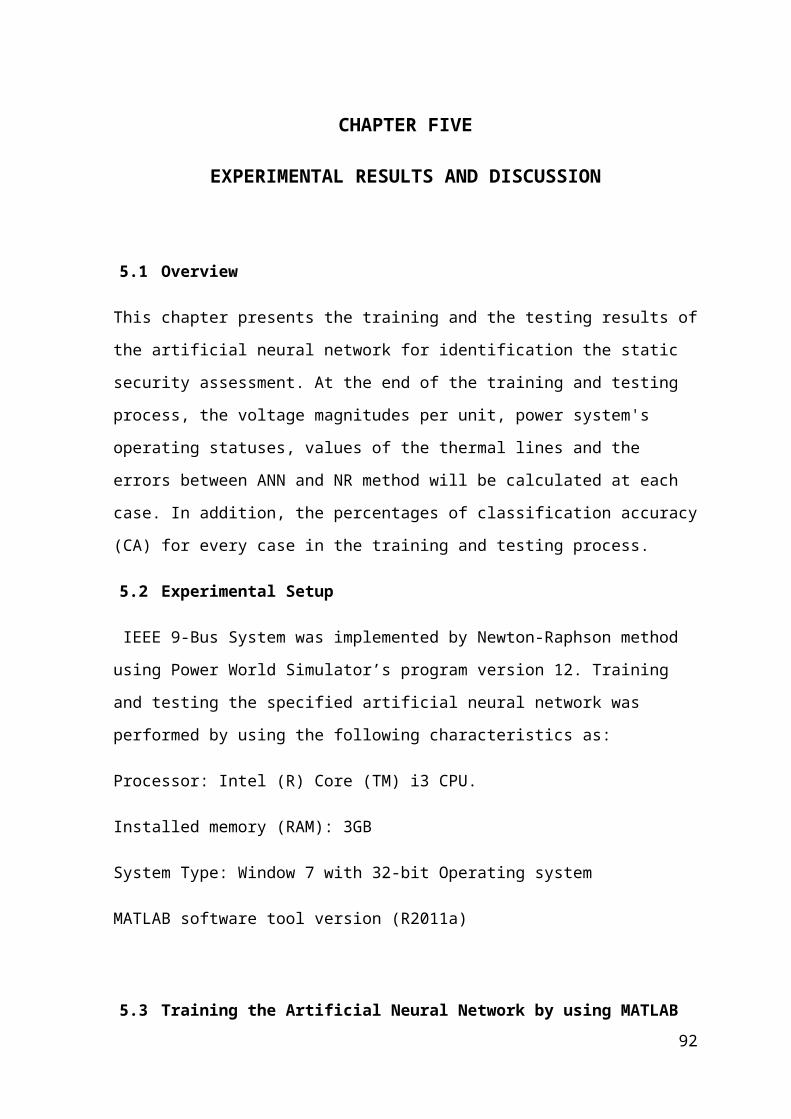
CHAPTER FIVE
EXPERIMENTAL RESULTS AND DISCUSSION
5.1 Overview
This chapter presents the training and the testing results of the artificial neural network for
identification the static security assessment. At the end of the training and testing process,
the voltage magnitudes per unit, power system's operating statuses, values of the thermal
lines and the errors between ANN and NR method will be calculated at each case. In
addition, the percentages of classification accuracy (CA) for every case in the training and
testing process.
5.2 Experimental Setup
IEEE 9-Bus System was implemented by Newton-Raphson method using Power World
Simulator’s program version 12. Training and testing the specified artificial neural network
was performed by using the following characteristics as:
Processor: Intel (R) Core (TM) i3 CPU.
Installed memory (RAM): 3GB
System Type: Window 7 with 32-bit Operating system
MATLAB software tool version (R2011a)
5.3 Training the Artificial Neural Network by using MATLAB
The generated database by the Newton-Raphson method using Power World Simulator’s
program are used in the training process. Enter the inputs (the active and reactive powers
of the first nine cases) and the outputs (the voltage magnitudes and the thermal limits of the
first nine cases) to the artificial neural network by using MATLAB’s program.
an appropriate values of the momentum factor (α), the learning rate coefficient size (η), the
desired Mean Square Error, number of iteration (epochs), transfer function and a number
92
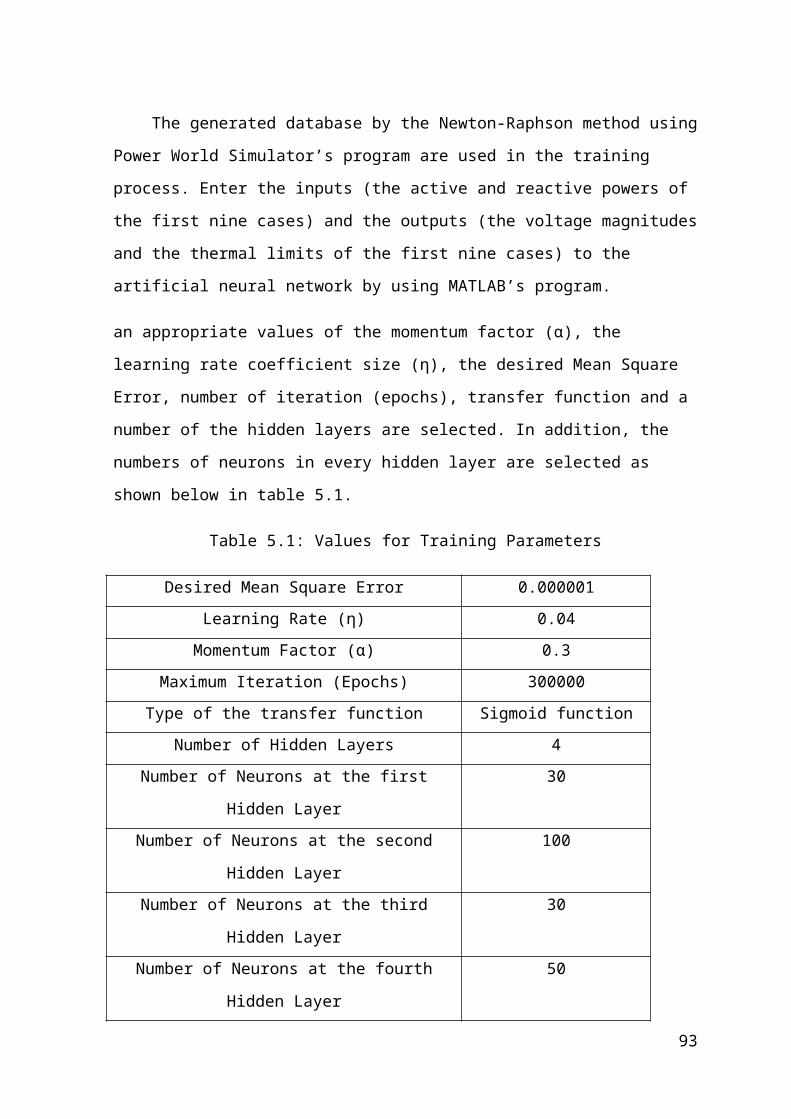
of the hidden layers are selected. In addition, the numbers of neurons in every hidden layer
are selected as shown below in table 5.1.
Table 5.1: Values for Training Parameters
Desired Mean Square Error 0.000001
Learning Rate (η) 0.04
Momentum Factor (α) 0.3
Maximum Iteration (Epochs) 300000
Type of the transfer function Sigmoid function
Number of Hidden Layers 4
Number of Neurons at the first Hidden Layer 30
Number of Neurons at the second Hidden Layer 100
Number of Neurons at the third Hidden Layer 30
Number of Neurons at the fourth Hidden Layer 50
These training parameters were selected because they produced the best mean square error
and the best results. Four hidden layers have been selected with their neurons in each
hidden layer according to the characteristics of data base and the degree of their
complexity where these layers with their neurons provided the best predicted results.
5.4 Results of the Training and the Discussions
At the end of the training process, the training performance of the artificial neural network
was calculated as shown in figure 5.1. In addition, the rest of the parameters were
determined as shown below in table 5.2.
Table 5.2: Results of training
Best Mean Square Error 2.8 * 10 -6 at epoch 300000
Number of Input Neurons 24
Number of Output Neurons 15
Learning Rate 1.0484 at epoch 300000
Number of Iteration to get Best Mean Square Error 300000
93
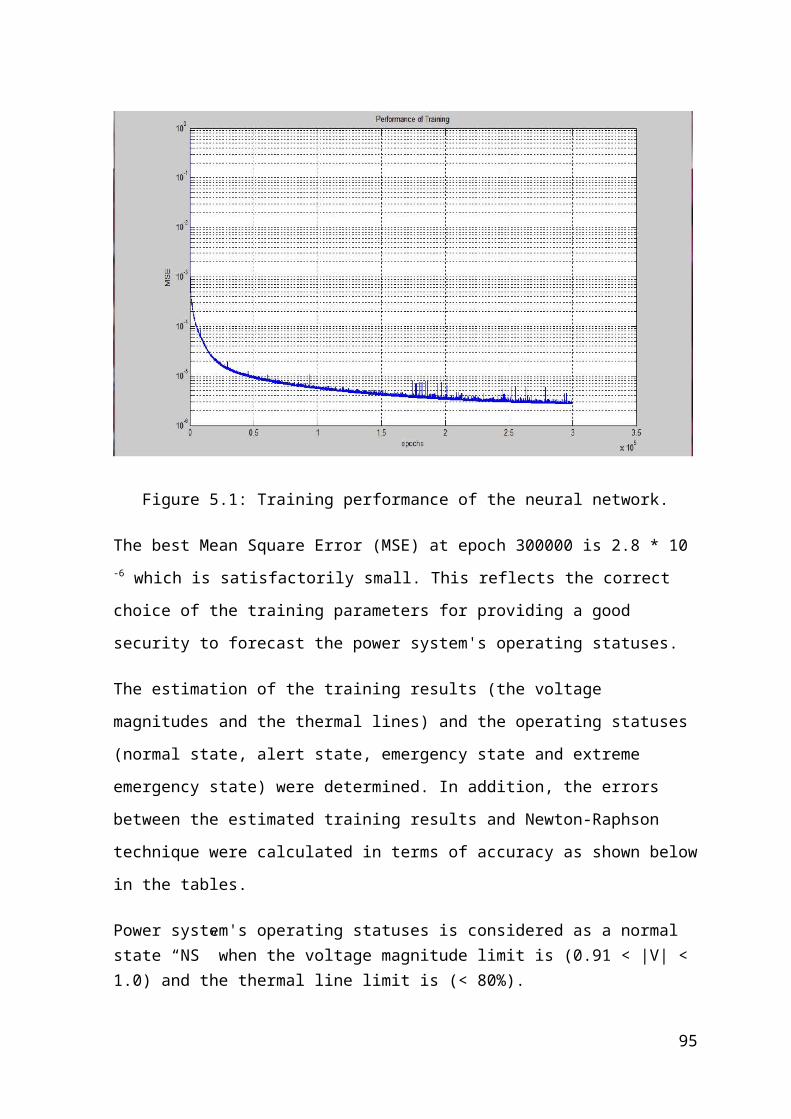
The Mean Square Error (MSE) performance for these layers and the neurones is for the
training process is shown below in figure 5.1.
Figure 5.1: Training performance of the neural network.
The best Mean Square Error (MSE) at epoch 300000 is 2.8 * 10 -6 which is satisfactorily
small. This reflects the correct choice of the training parameters for providing a good
security to forecast the power system's operating statuses.
The estimation of the training results (the voltage magnitudes and the thermal lines) and
the operating statuses (normal state, alert state, emergency state and extreme emergency
state) were determined. In addition, the errors between the estimated training results and
Newton-Raphson technique were calculated in terms of accuracy as shown below in the
tables.
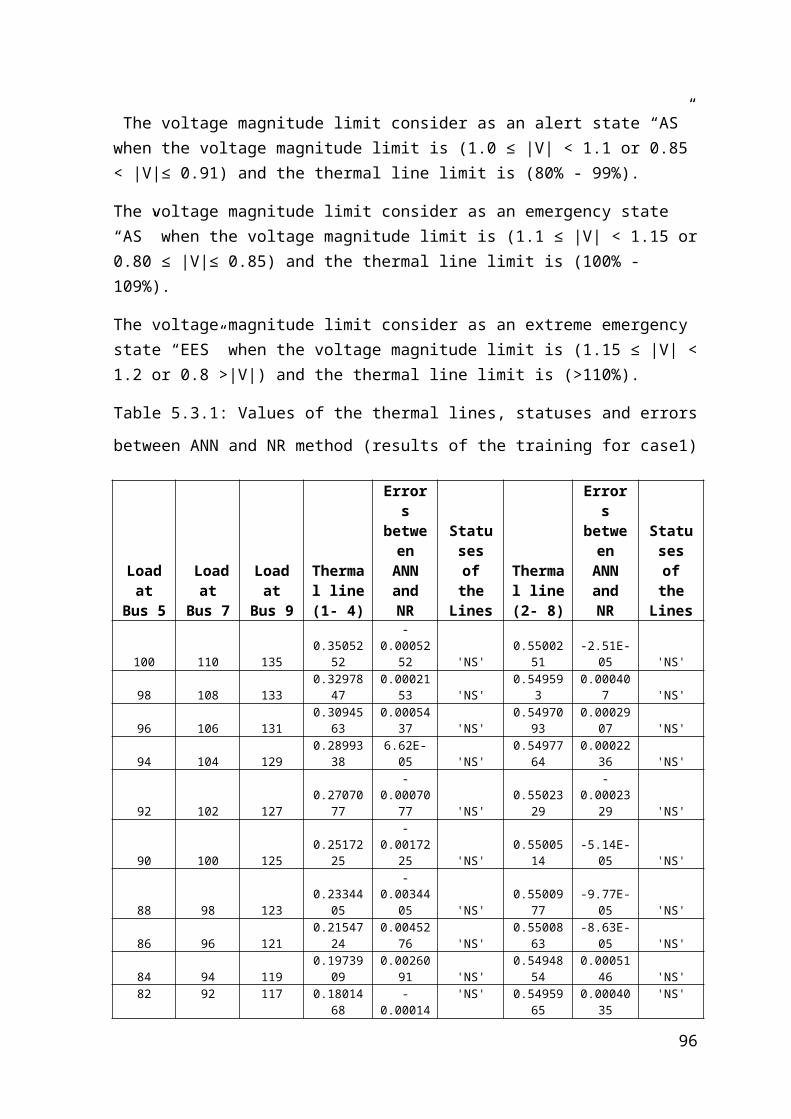
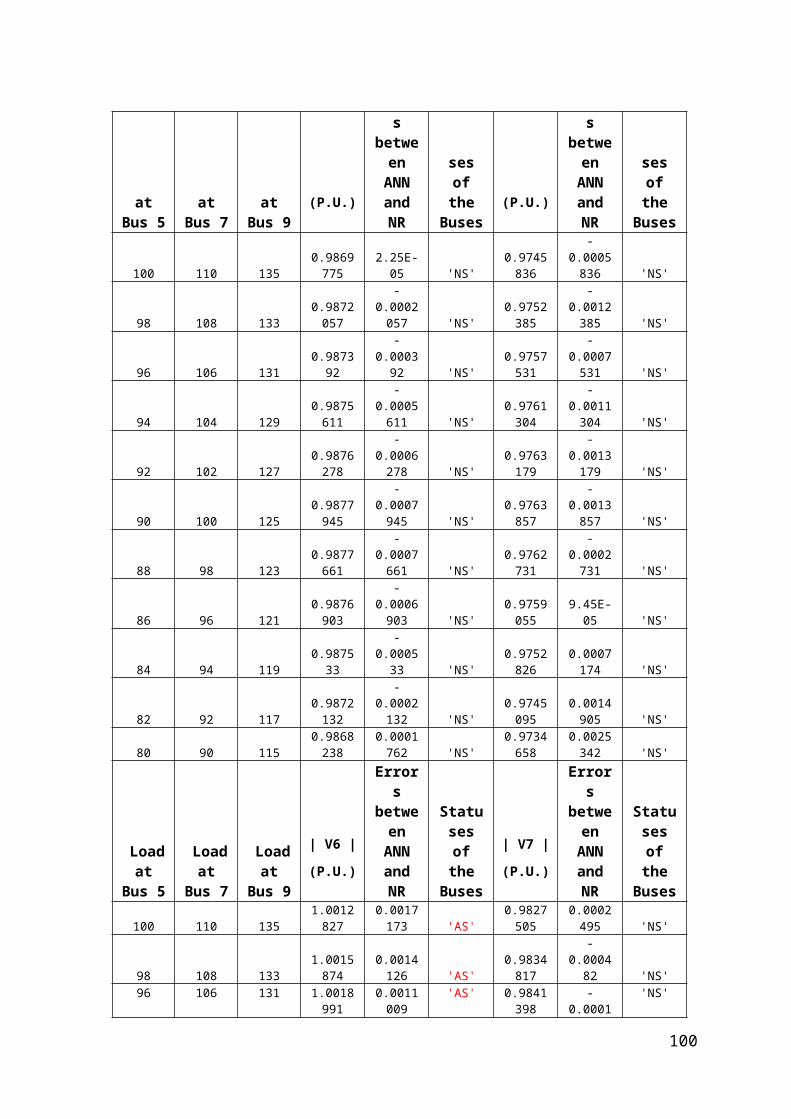
Power system's operating statuses is considered as a normal state “NS” when the voltage magnitude limit is (0.91 < |V| < 1.0) and the thermal line limit is (< 80%).
The voltage magnitude limit consider as an alert state “AS” when the voltage magnitude limit is (1.0 ≤ |V| < 1.1 or 0.85 < |V|≤ 0.91) and the thermal line limit is (80% - 99%).
The voltage magnitude limit consider as an emergency state “AS” when the voltage magnitude limit is (1.1 ≤ |V| < 1.15 or 0.80 ≤ |V|≤ 0.85) and the thermal line limit is (100% - 109%).
94
The voltage magnitude limit consider as an extreme emergency state “EES” when the voltage magnitude limit is (1.15 ≤ |V| < 1.2 or 0.8 >|V|) and the thermal line limit is (>110%).
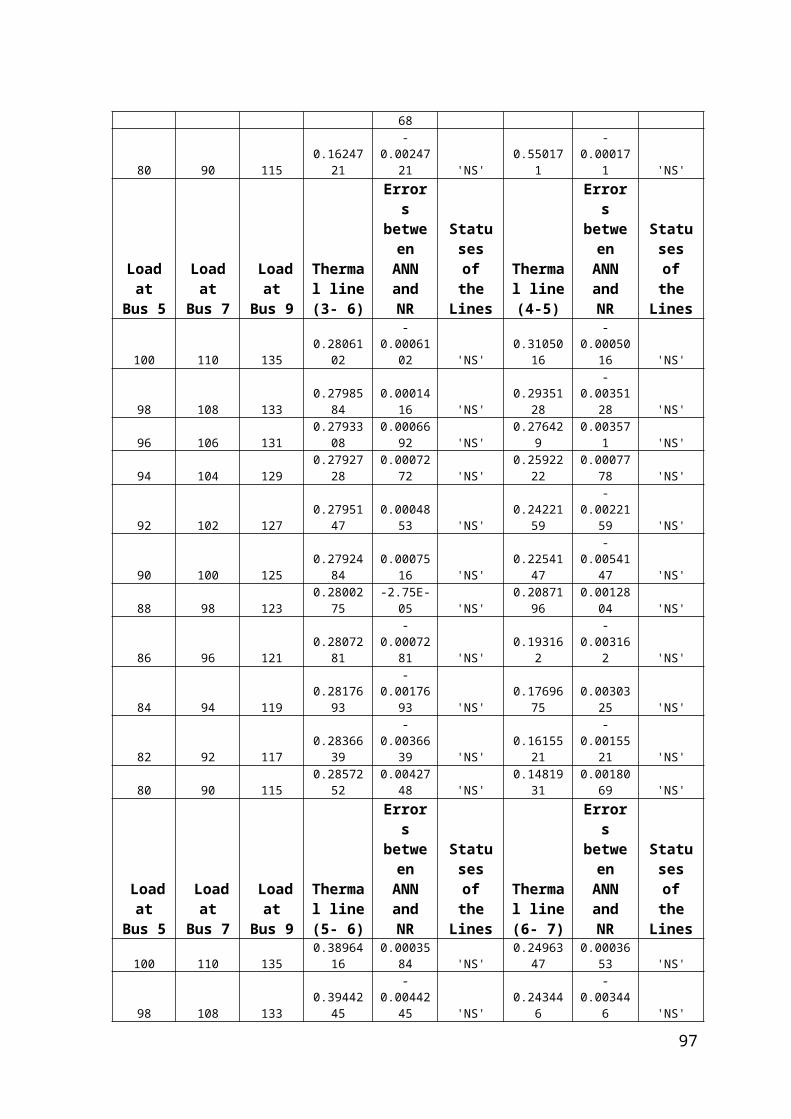
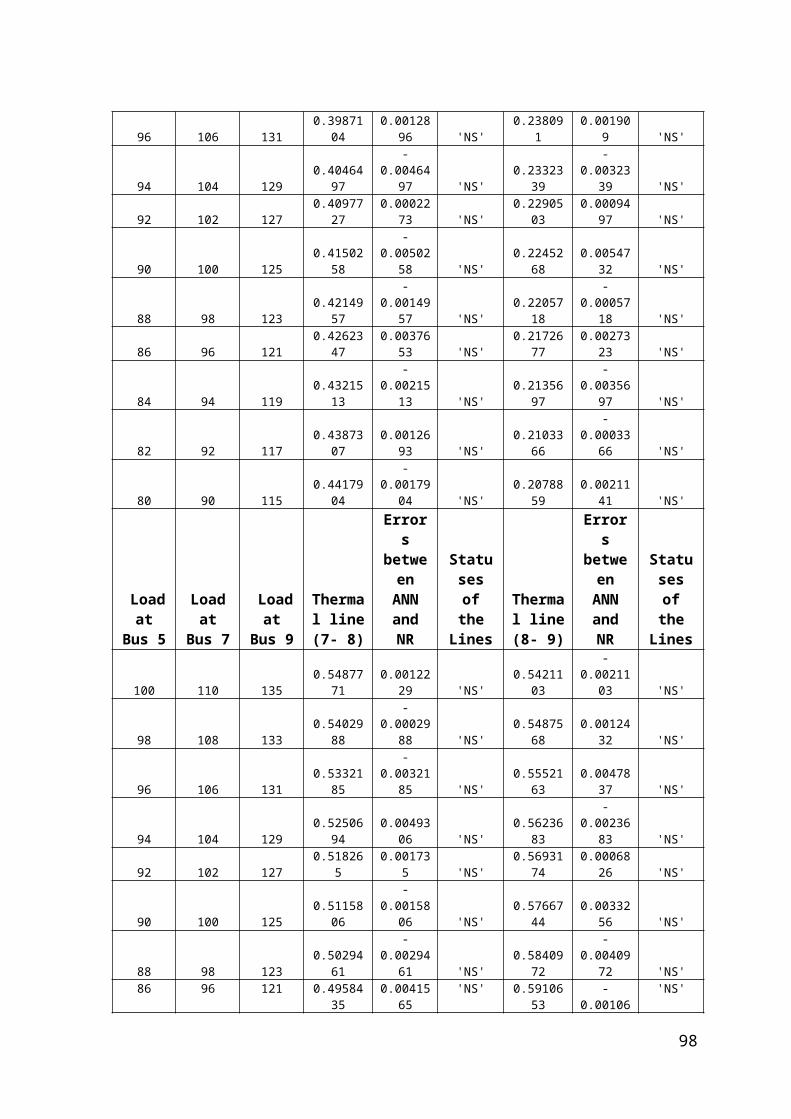
Table 5.3.1: Values of the thermal lines, statuses and errors between ANN and NR method
(results of the training for case1)
Load at Bus
5
Load at Bus
7
Load at Bus
9
Thermal line
(1- 4)
Errors between ANN and NR
Statuses of the Lines
Thermal line (2- 8)
Errors between
ANN and NR
Statuses of the Lines
100 110 135 0.3505252-
0.0005252 'NS' 0.5500251 -2.51E-05 'NS'
98 108 133 0.3297847 0.0002153 'NS' 0.549593 0.000407 'NS'
96 106 131 0.3094563 0.0005437 'NS' 0.5497093 0.0002907 'NS'
94 104 129 0.2899338 6.62E-05 'NS' 0.5497764 0.0002236 'NS'
92 102 127 0.2707077-
0.0007077 'NS' 0.5502329-
0.0002329 'NS'
90 100 125 0.2517225-
0.0017225 'NS' 0.5500514 -5.14E-05 'NS'
88 98 123 0.2334405-
0.0034405 'NS' 0.5500977 -9.77E-05 'NS'
86 96 121 0.2154724 0.0045276 'NS' 0.5500863 -8.63E-05 'NS'
84 94 119 0.1973909 0.0026091 'NS' 0.5494854 0.0005146 'NS'
82 92 117 0.1801468-
0.0001468 'NS' 0.5495965 0.0004035 'NS'
80 90 115 0.1624721-
0.0024721 'NS' 0.550171 -0.000171 'NS'
Load at Bus
5
Load at Bus
7
Load at Bus
9
Thermal line
(3- 6)
Errors between ANN and NR
Statuses of the Lines
Thermal line (4-5)
Errors between
ANN and NR
Statuses of the Lines
100 110 135 0.2806102-
0.0006102 'NS' 0.3105016-
0.0005016 'NS'
98 108 133 0.2798584 0.0001416 'NS' 0.2935128-
0.0035128 'NS'
96 106 131 0.2793308 0.0006692 'NS' 0.276429 0.003571 'NS'
94 104 129 0.2792728 0.0007272 'NS' 0.2592222 0.0007778 'NS'
92 102 127 0.2795147 0.0004853 'NS' 0.2422159-
0.0022159 'NS'
90 100 125 0.2792484 0.0007516 'NS' 0.2254147-
0.0054147 'NS'
88 98 123 0.2800275 -2.75E-05 'NS' 0.2087196 0.0012804 'NS'
86 96 121 0.2807281-
0.0007281 'NS' 0.193162 -0.003162 'NS'
84 94 119 0.2817693-
0.0017693 'NS' 0.1769675 0.0030325 'NS'
82 92 117 0.2836639-
0.0036639 'NS' 0.1615521-
0.0015521 'NS'
80 90 115 0.2857252 0.0042748 'NS' 0.1481931 0.0018069 'NS'
Load at Bus
5
Load at Bus
7
Load at Bus
9
Thermal line
(5- 6)
Errors between ANN and NR
Statuses of the Lines
Thermal line (6- 7)
Errors between
ANN and NR
Statuses of the Lines
95
100 110 135 0.3896416 0.0003584 'NS' 0.2496347 0.0003653 'NS'
98 108 133 0.3944245-
0.0044245 'NS' 0.243446 -0.003446 'NS'
96 106 131 0.3987104 0.0012896 'NS' 0.238091 0.001909 'NS'
94 104 129 0.4046497-
0.0046497 'NS' 0.2332339-
0.0032339 'NS'
92 102 127 0.4097727 0.0002273 'NS' 0.2290503 0.0009497 'NS'
90 100 125 0.4150258-
0.0050258 'NS' 0.2245268 0.0054732 'NS'
88 98 123 0.4214957-
0.0014957 'NS' 0.2205718-
0.0005718 'NS'
86 96 121 0.4262347 0.0037653 'NS' 0.2172677 0.0027323 'NS'
84 94 119 0.4321513-
0.0021513 'NS' 0.2135697-
0.0035697 'NS'
82 92 117 0.4387307 0.0012693 'NS' 0.2103366-
0.0003366 'NS'
80 90 115 0.4417904-
0.0017904 'NS' 0.2078859 0.0021141 'NS'
Load at Bus
5
Load at Bus
7
Load at Bus
9
Thermal line
(7- 8)
Errors between ANN and NR
Statuses of the Lines
Thermal line (8- 9)
Errors between
ANN and NR
Statuses of the Lines
100 110 135 0.5487771 0.0012229 'NS' 0.5421103-
0.0021103 'NS'
98 108 133 0.5402988-
0.0002988 'NS' 0.5487568 0.0012432 'NS'
96 106 131 0.5332185-
0.0032185 'NS' 0.5552163 0.0047837 'NS'
94 104 129 0.5250694 0.0049306 'NS' 0.5623683-
0.0023683 'NS'
92 102 127 0.518265 0.001735 'NS' 0.5693174 0.0006826 'NS'
90 100 125 0.5115806-
0.0015806 'NS' 0.5766744 0.0033256 'NS'
88 98 123 0.5029461-
0.0029461 'NS' 0.5840972-
0.0040972 'NS'
86 96 121 0.4958435 0.0041565 'NS' 0.5910653-
0.0010653 'NS'
84 94 119 0.4891612 0.0008388 'NS' 0.5983824 0.0016176 'NS'
82 92 117 0.4826969-
0.0026969 'NS' 0.6057817 0.0042183 'NS'
80 90 115 0.4773375 0.0026625 'NS' 0.6132913-
0.0032913 'NS'
Load at Bus
5
Load at Bus
7
Load at Bus
9
Thermal line
(4- 9)
Errors between ANN and NR
Statuses of the Lines
100 110 135 0.4396952 0.0003048 'NS'
98 108 133 0.4230675-
0.0030675 'NS'
96 106 131 0.4084687 0.0015313 'NS'
94 104 129 0.3923028-
0.0023028 'NS'
92 102 127 0.3787964 0.0012036 'NS'
96
90 100 125 0.3636223-
0.0036223 'NS'
88 98 123 0.3497343 0.0002657 'NS'
86 96 121 0.3369494 0.0030506 'NS'
84 94 119 0.3233204-
0.0033204 'NS'
82 92 117 0.3110103-
0.0010103 'NS'
80 90 115 0.2978378 0.0021622 'NS'
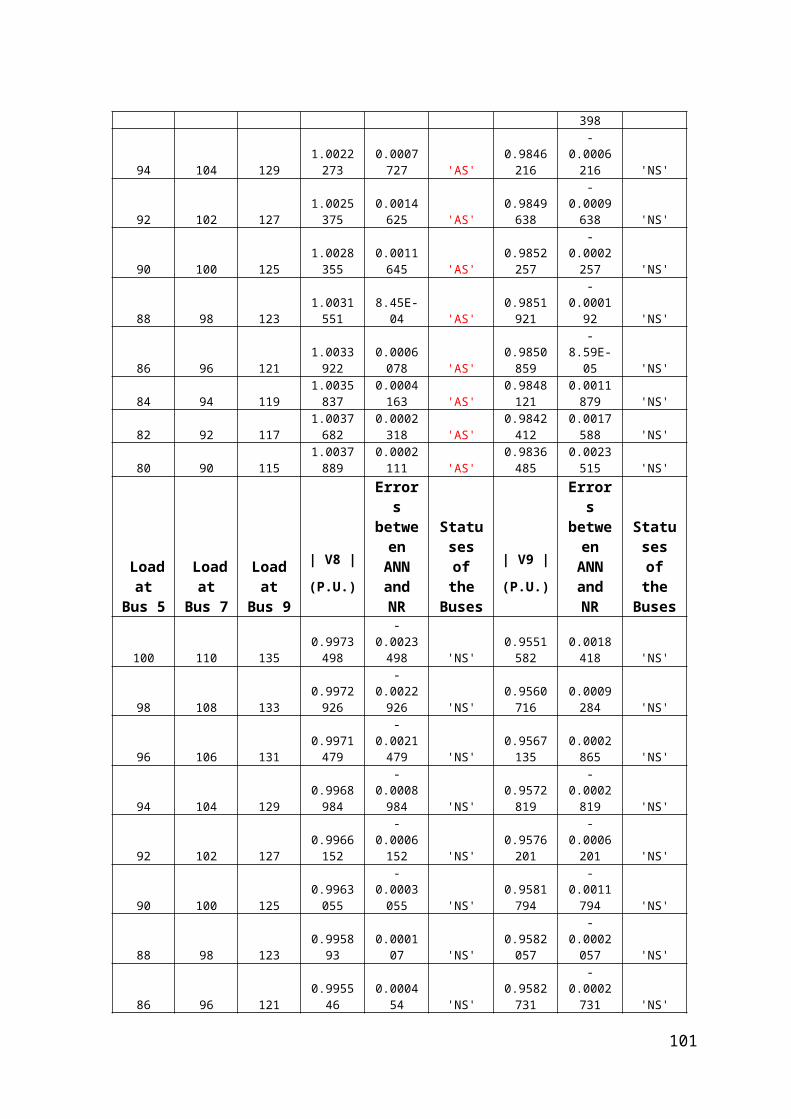
Table 5.3.2: Voltage Magnitudes per unit, statuses and errors between ANN and NR
method (results of the training for case1)
Load at Bus
5
Load at Bus
7
Load at Bus
9
| V4 |
(P.U.)
Errors between ANN and NR
Statuses of the Buses
| V5 |
(P.U.)
Errors between ANN and NR
Statuses of the Buses
100 110 1350.986977
5 2.25E-05 'NS'0.974583
6
-0.000583
6 'NS'
98 108 1330.987205
7
-0.000205
7 'NS'0.975238
5
-0.001238
5 'NS'
96 106 131 0.987392 -0.000392 'NS'0.975753
1
-0.000753
1 'NS'
94 104 1290.987561
1
-0.000561
1 'NS'0.976130
4
-0.001130
4 'NS'
92 102 1270.987627
8
-0.000627
8 'NS'0.976317
9
-0.001317
9 'NS'
90 100 1250.987794
5
-0.000794
5 'NS'0.976385
7
-0.001385
7 'NS'
88 98 1230.987766
1
-0.000766
1 'NS'0.976273
1
-0.000273
1 'NS'
86 96 1210.987690
3
-0.000690
3 'NS'0.975905
5 9.45E-05 'NS'
84 94 119 0.987533 -0.000533 'NS'0.975282
60.000717
4 'NS'
82 92 1170.987213
2
-0.000213
2 'NS'0.974509
50.001490
5 'NS'
80 90 1150.986823
80.000176
2 'NS'0.973465
80.002534
2 'NS'
Load at Bus
5
Load at Bus
7
Load at Bus
9
| V6 |
(P.U.)
Errors between ANN and NR
Statuses of the Buses
| V7 |
(P.U.)
Errors between ANN and NR
Statuses of the Buses
100 110 135 1.001282 0.001717 'AS' 0.982750 0.000249 'NS'
97
7 3 5 5
98 108 1331.001587
40.001412
6 'AS'0.983481
7 -0.000482 'NS'
96 106 1311.001899
10.001100
9 'AS'0.984139
8
-0.000139
8 'NS'
94 104 1291.002227
30.000772
7 'AS'0.984621
6
-0.000621
6 'NS'
92 102 1271.002537
50.001462
5 'AS'0.984963
8
-0.000963
8 'NS'
90 100 1251.002835
50.001164
5 'AS'0.985225
7
-0.000225
7 'NS'
88 98 1231.003155
1 8.45E-04 'AS'0.985192
1 -0.000192 'NS'
86 96 1211.003392
20.000607
8 'AS'0.985085
9 -8.59E-05 'NS'
84 94 1191.003583
70.000416
3 'AS'0.984812
10.001187
9 'NS'
82 92 1171.003768
20.000231
8 'AS'0.984241
20.001758
8 'NS'
80 90 1151.003788
90.000211
1 'AS'0.983648
50.002351
5 'NS'
Load at Bus
5
Load at Bus
7
Load at Bus
9
| V8 |
(P.U.)
Errors between ANN and NR
Statuses of the Buses
| V9 |
(P.U.)
Errors between ANN and NR
Statuses of the Buses
100 110 1350.997349
8
-0.002349
8 'NS'0.955158
20.001841
8 'NS'
98 108 1330.997292
6
-0.002292
6 'NS'0.956071
60.000928
4 'NS'
96 106 1310.997147
9
-0.002147
9 'NS'0.956713
50.000286
5 'NS'
94 104 1290.996898
4
-0.000898
4 'NS'0.957281
9
-0.000281
9 'NS'
92 102 1270.996615
2
-0.000615
2 'NS'0.957620
1
-0.000620
1 'NS'
90 100 1250.996305
5
-0.000305
5 'NS'0.958179
4
-0.001179
4 'NS'
88 98 123 0.995893 0.000107 'NS'0.958205
7
-0.000205
7 'NS'
86 96 121 0.995546 0.000454 'NS'0.958273
1
-0.000273
1 'NS'
84 94 1190.995242
50.000757
5 'NS'0.958392
3
-0.000392
3 'NS'
82 92 1170.994875
50.001124
5 'NS'0.958051
7 -5.17E-05 'NS'
80 90 1150.994670
20.001329
8 'NS'0.958046
1 -4.61E-05 'NS'
98
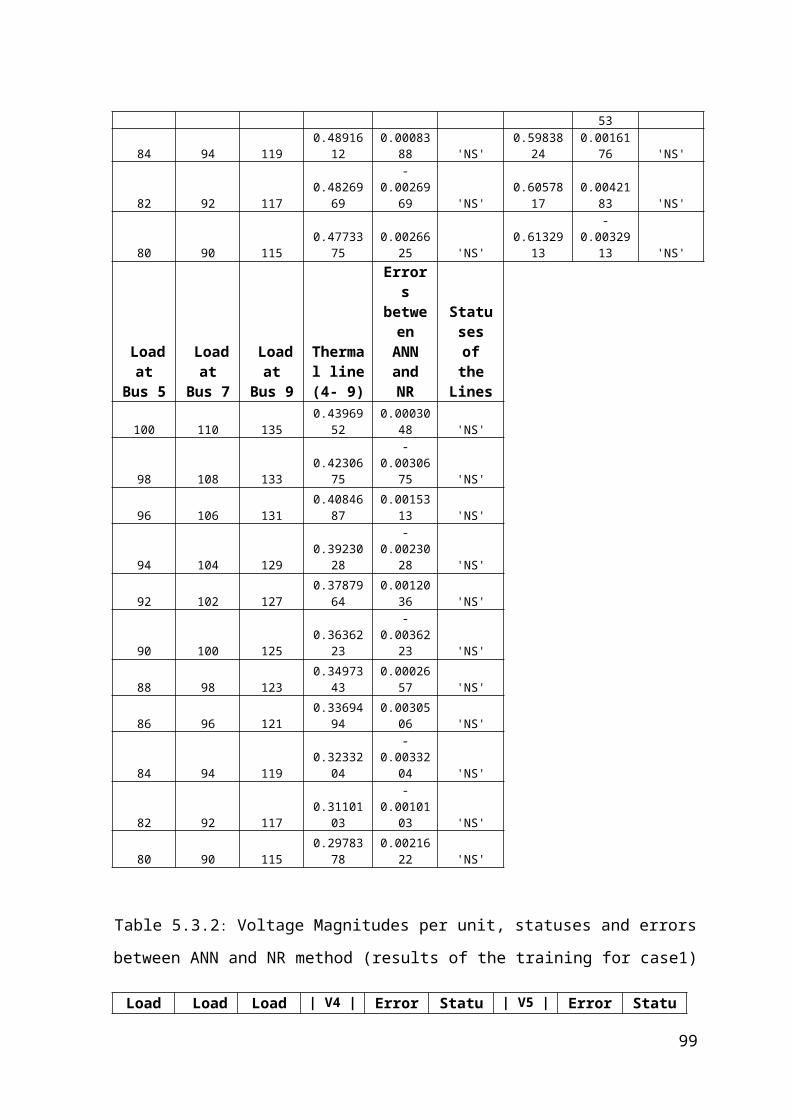
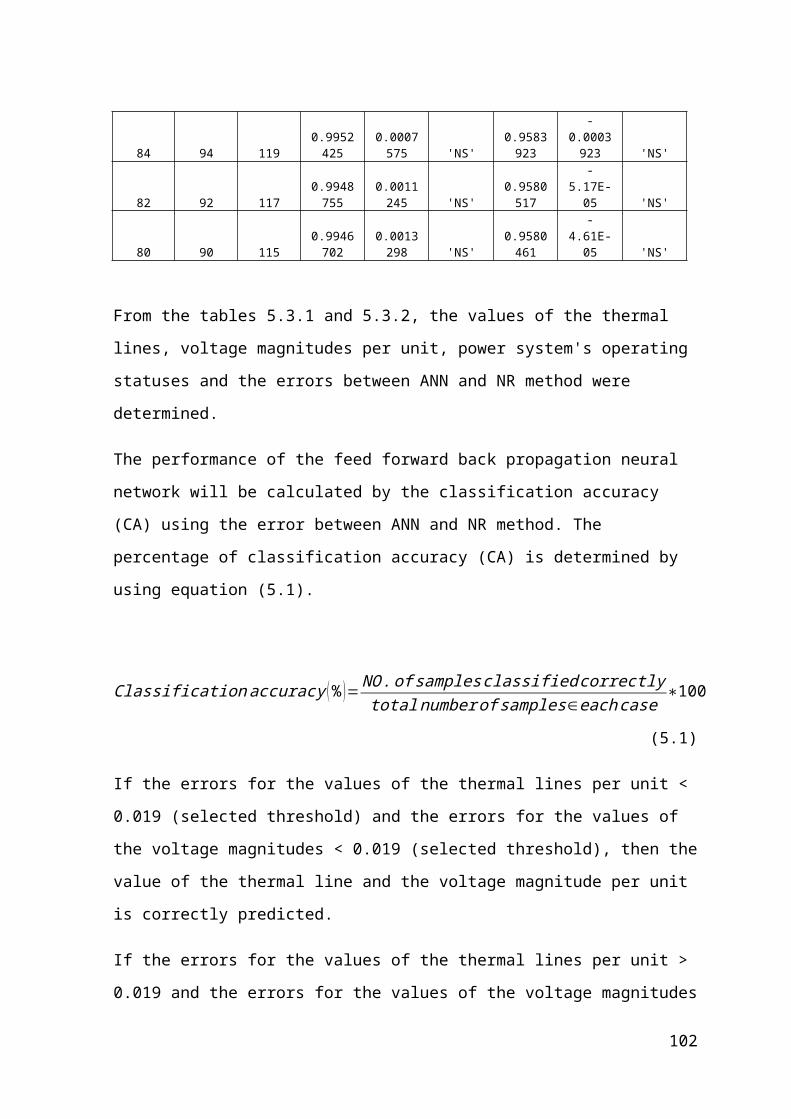
From the tables 5.3.1 and 5.3.2, the values of the thermal lines, voltage magnitudes per
unit, power system's operating statuses and the errors between ANN and NR method were
determined.
The performance of the feed forward back propagation neural network will be calculated
by the classification accuracy (CA) using the error between ANN and NR method. The
percentage of classification accuracy (CA) is determined by using equation (5.1).
Classification accuracy (% )= NO.of samples classified correctlytotal number of samples∈each case
∗100 (5.1)
If the errors for the values of the thermal lines per unit < 0.019 (selected threshold) and the
errors for the values of the voltage magnitudes < 0.019 (selected threshold), then the value
of the thermal line and the voltage magnitude per unit is correctly predicted.
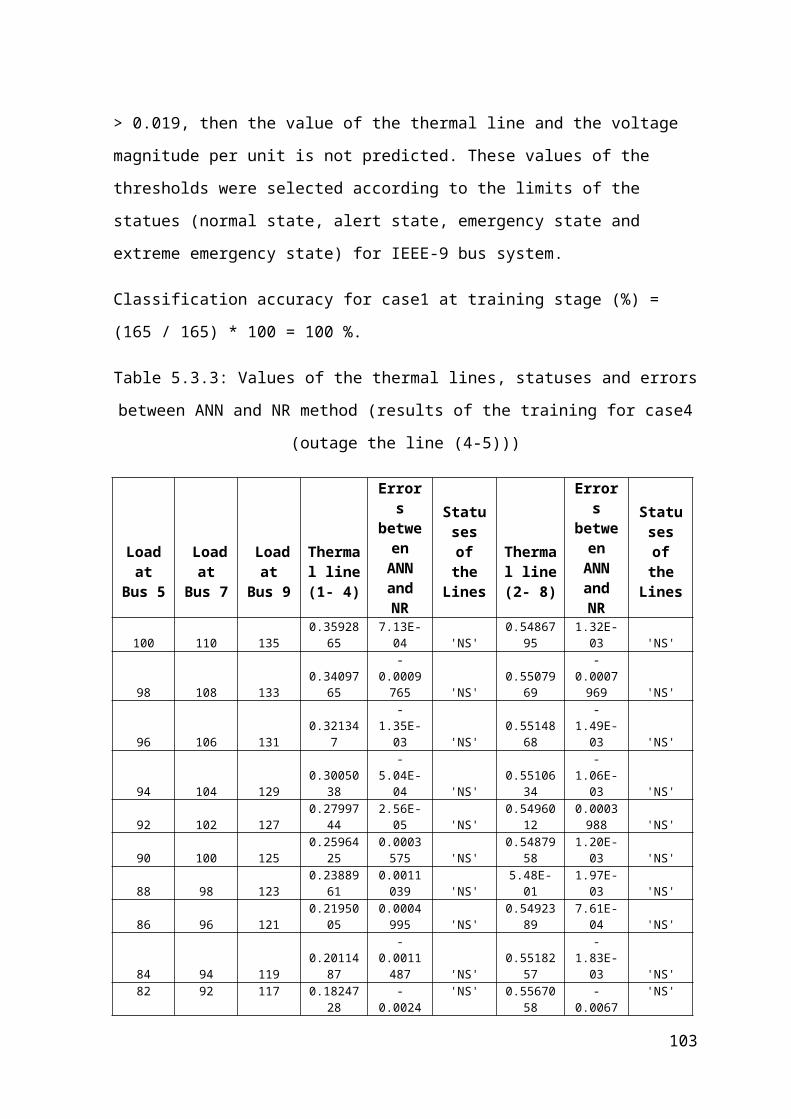
If the errors for the values of the thermal lines per unit > 0.019 and the errors for the values
of the voltage magnitudes > 0.019, then the value of the thermal line and the voltage
magnitude per unit is not predicted. These values of the thresholds were selected according
to the limits of the statues (normal state, alert state, emergency state and extreme
emergency state) for IEEE-9 bus system.
Classification accuracy for case1 at training stage (%) = (165 / 165) * 100 = 100 %.
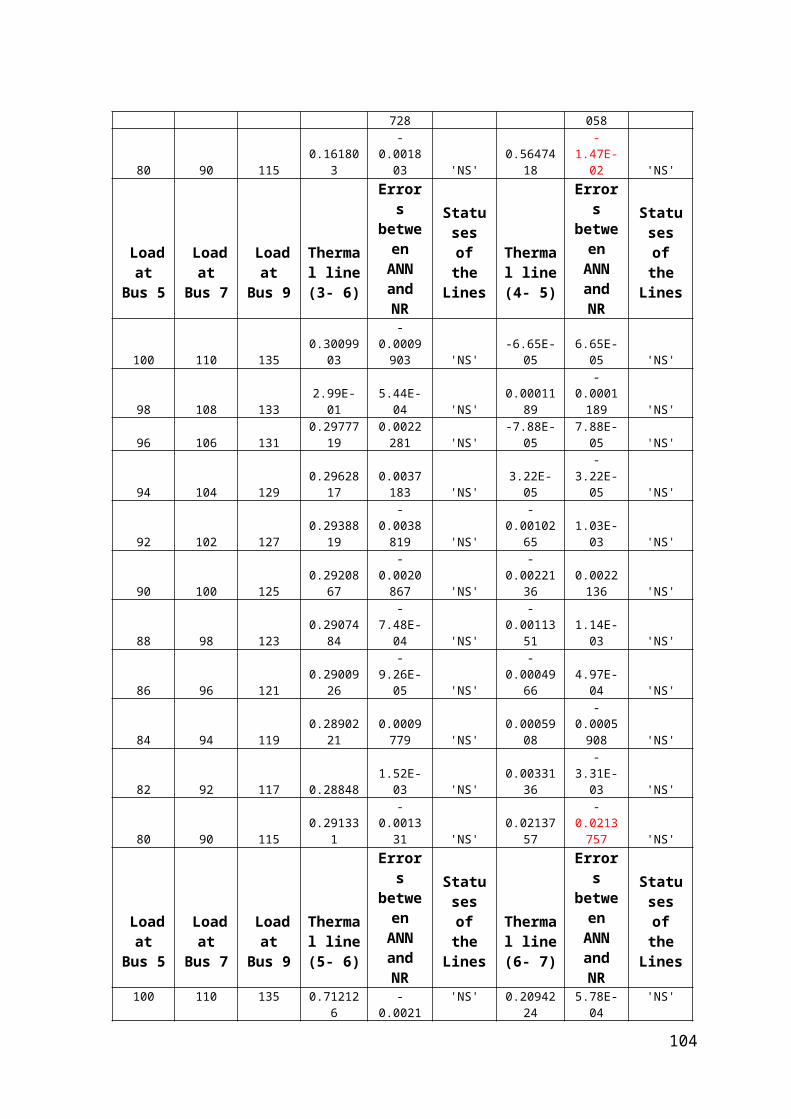
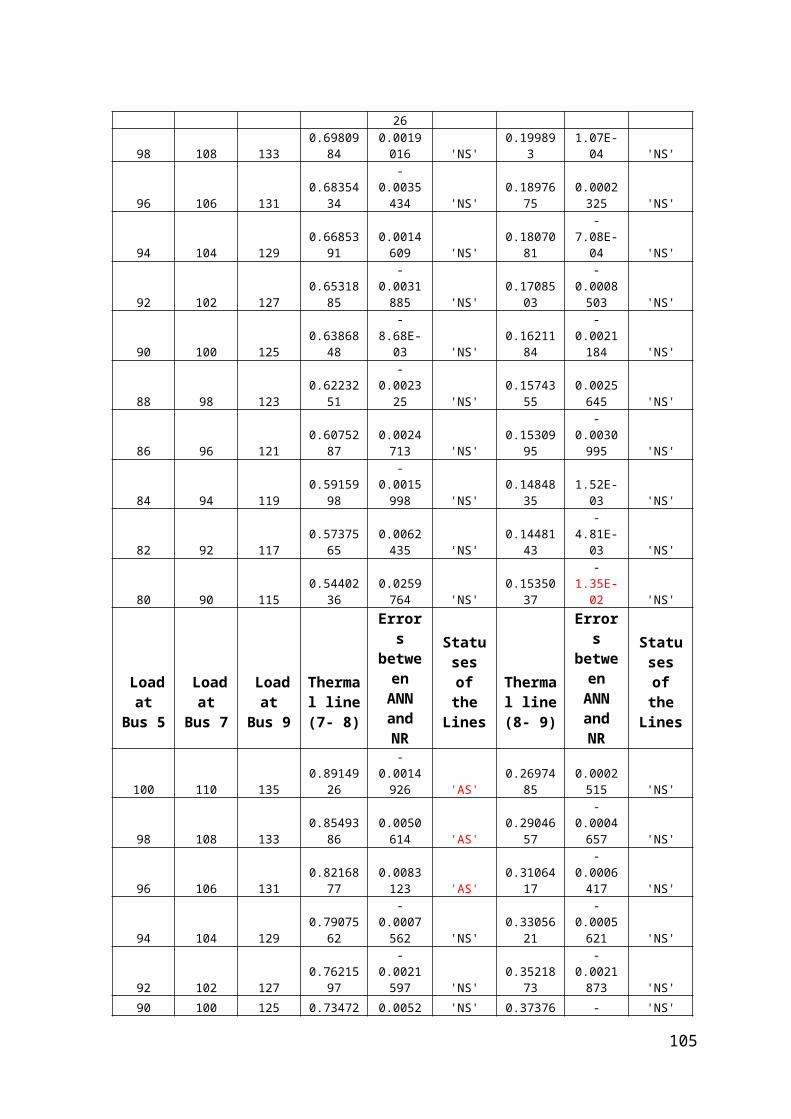
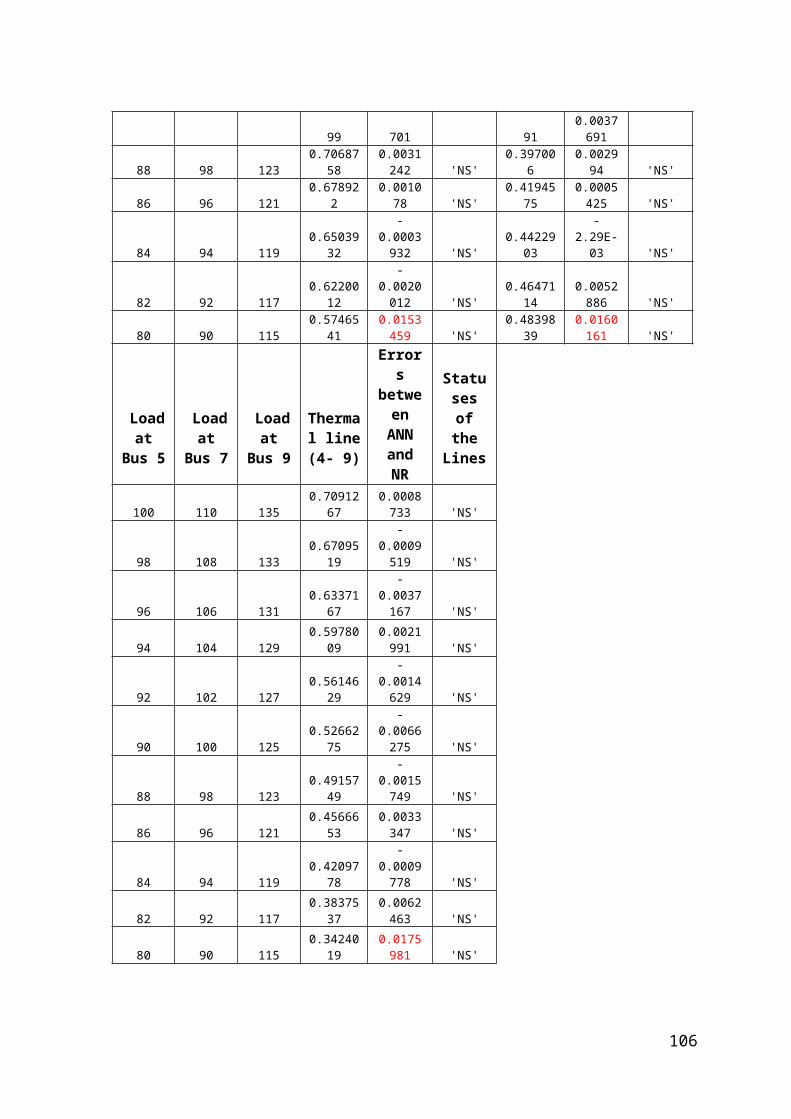
Table 5.3.3: Values of the thermal lines, statuses and errors between ANN and NR method
(results of the training for case4 (outage the line (4-5)))
Load at Bus
5
Load at Bus
7
Load at Bus
9
Thermal line (1- 4)
Errors between ANN and NR
Statuses of the Lines
Thermal line (2- 8)
Errors between ANN and NR
Statuses of the Lines
100 110 135 0.3592865 7.13E-04 'NS' 0.5486795 1.32E-03 'NS'
98 108 133 0.3409765
-0.000976
5 'NS' 0.5507969
-0.000796
9 'NS'
96 106 131 0.321347 -1.35E-03 'NS' 0.5514868 -1.49E-03 'NS'
94 104 129 0.3005038 -5.04E-04 'NS' 0.5510634 -1.06E-03 'NS'
92 102 127 0.2799744 2.56E-05 'NS' 0.54960120.000398
8 'NS'
90 100 125 0.25964250.000357
5 'NS' 0.5487958 1.20E-03 'NS'
88 98 123 0.23889610.001103
9 'NS' 5.48E-01 1.97E-03 'NS'
99
86 96 121 0.21950050.000499
5 'NS' 0.5492389 7.61E-04 'NS'
84 94 119 0.2011487
-0.001148
7 'NS' 0.5518257 -1.83E-03 'NS'
82 92 117 0.1824728
-0.002472
8 'NS' 0.5567058
-0.006705
8 'NS'
80 90 115 0.161803 -0.001803 'NS' 0.5647418 -1.47E-02 'NS'
Load at Bus
5
Load at Bus
7
Load at Bus
9
Thermal line (3- 6)
Errors between ANN and NR
Statuses of the Lines
Thermal line (4- 5)
Errors between ANN and NR
Statuses of the Lines
100 110 135 0.3009903
-0.000990
3 'NS' -6.65E-05 6.65E-05 'NS'
98 108 133 2.99E-01 5.44E-04 'NS' 0.0001189
-0.000118
9 'NS'
96 106 131 0.29777190.002228
1 'NS' -7.88E-05 7.88E-05 'NS'
94 104 129 0.29628170.003718
3 'NS' 3.22E-05 -3.22E-05 'NS'
92 102 127 0.2938819
-0.003881
9 'NS'-
0.0010265 1.03E-03 'NS'
90 100 125 0.2920867
-0.002086
7 'NS'-
0.00221360.002213
6 'NS'
88 98 123 0.2907484 -7.48E-04 'NS'-
0.0011351 1.14E-03 'NS'
86 96 121 0.2900926 -9.26E-05 'NS'-
0.0004966 4.97E-04 'NS'
84 94 119 0.28902210.000977
9 'NS' 0.0005908
-0.000590
8 'NS'
82 92 117 0.28848 1.52E-03 'NS' 0.0033136 -3.31E-03 'NS'
80 90 115 0.291331 -0.001331 'NS' 0.0213757
-0.021375
7 'NS'
Load at Bus
5
Load at Bus
7
Load at Bus
9
Thermal line (5- 6)
Errors between ANN and NR
Statuses of the Lines
Thermal line (6- 7)
Errors between ANN and NR
Statuses of the Lines
100 110 135 0.712126 -0.002126 'NS' 0.2094224 5.78E-04 'NS'
98 108 133 0.69809840.001901
6 'NS' 0.199893 1.07E-04 'NS'
96 106 131 0.6835434
-0.003543
4 'NS' 0.18976750.000232
5 'NS'
94 104 129 0.66853910.001460
9 'NS' 0.1807081 -7.08E-04 'NS'
92 102 127 0.6531885
-0.003188
5 'NS' 0.1708503
-0.000850
3 'NS'
90 100 125 0.6386848 -8.68E-03 'NS' 0.1621184
-0.002118
4 'NS'
88 98 123 0.6223251 -0.002325 'NS' 0.15743550.002564
5 'NS'
86 96 121 0.6075287 0.002471 'NS' 0.1530995 - 'NS'
100
30.003099
5
84 94 119 0.5915998
-0.001599
8 'NS' 0.1484835 1.52E-03 'NS'
82 92 117 0.57375650.006243
5 'NS' 0.1448143 -4.81E-03 'NS'
80 90 115 0.54402360.025976
4 'NS' 0.1535037 -1.35E-02 'NS'
Load at Bus
5
Load at Bus
7
Load at Bus
9
Thermal line (7- 8)
Errors between ANN and NR
Statuses of the Lines
Thermal line (8- 9)
Errors between ANN and NR
Statuses of the Lines
100 110 135 0.8914926
-0.001492
6 'AS' 0.26974850.000251
5 'NS'
98 108 133 0.85493860.005061
4 'AS' 0.2904657
-0.000465
7 'NS'
96 106 131 0.82168770.008312
3 'AS' 0.3106417
-0.000641
7 'NS'
94 104 129 0.7907562
-0.000756
2 'NS' 0.3305621
-0.000562
1 'NS'
92 102 127 0.7621597
-0.002159
7 'NS' 0.3521873
-0.002187
3 'NS'
90 100 125 0.73472990.005270
1 'NS' 0.3737691
-0.003769
1 'NS'
88 98 123 0.70687580.003124
2 'NS' 0.397006 0.002994 'NS'
86 96 121 0.678922 0.001078 'NS' 0.41945750.000542
5 'NS'
84 94 119 0.6503932
-0.000393
2 'NS' 0.4422903 -2.29E-03 'NS'
82 92 117 0.6220012
-0.002001
2 'NS' 0.46471140.005288
6 'NS'
80 90 115 0.57465410.015345
9 'NS' 0.48398390.016016
1 'NS'
Load at Bus
5
Load at Bus
7
Load at Bus
9
Thermal line (4- 9)
Errors between ANN and NR
Statuses of the Lines
100 110 135 0.70912670.000873
3 'NS'
98 108 133 0.6709519
-0.000951
9 'NS'
96 106 131 0.6337167
-0.003716
7 'NS'
94 104 129 0.59780090.002199
1 'NS'
92 102 127 0.5614629
-0.001462
9 'NS'
101
90 100 125 0.5266275
-0.006627
5 'NS'
88 98 123 0.4915749
-0.001574
9 'NS'
86 96 121 0.45666530.003334
7 'NS'
84 94 119 0.4209778
-0.000977
8 'NS'
82 92 117 0.38375370.006246
3 'NS'
80 90 115 0.34240190.017598
1 'NS'
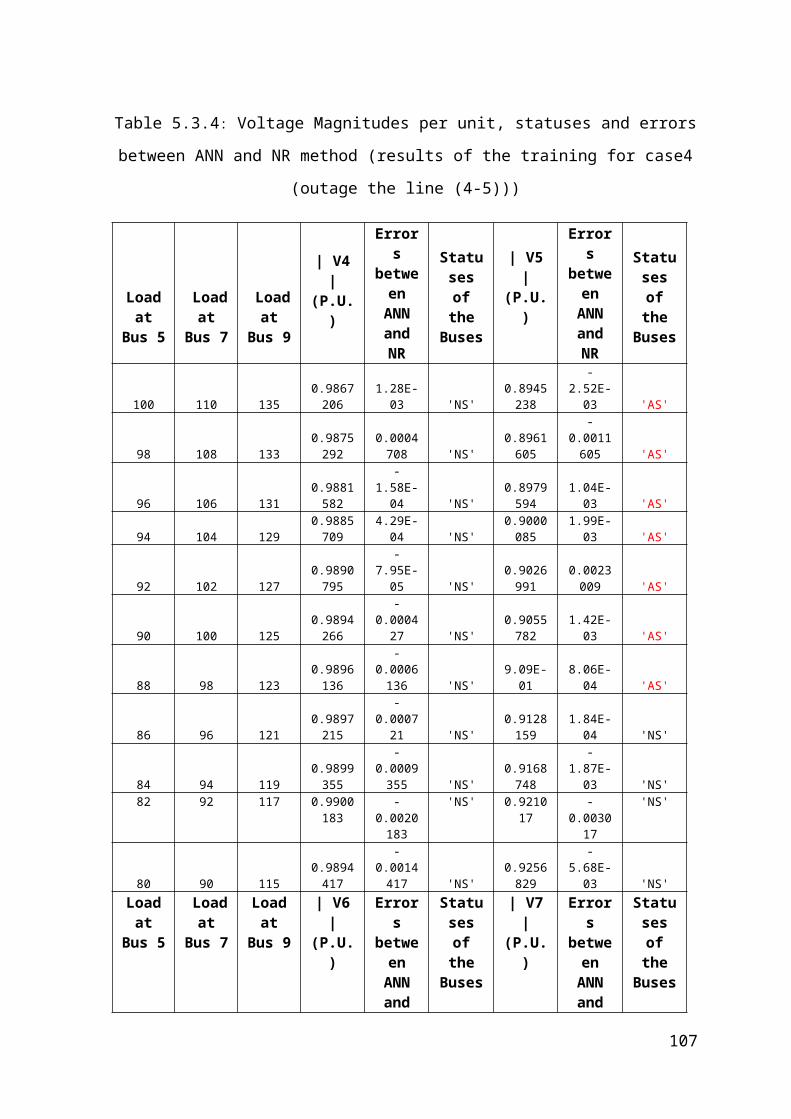
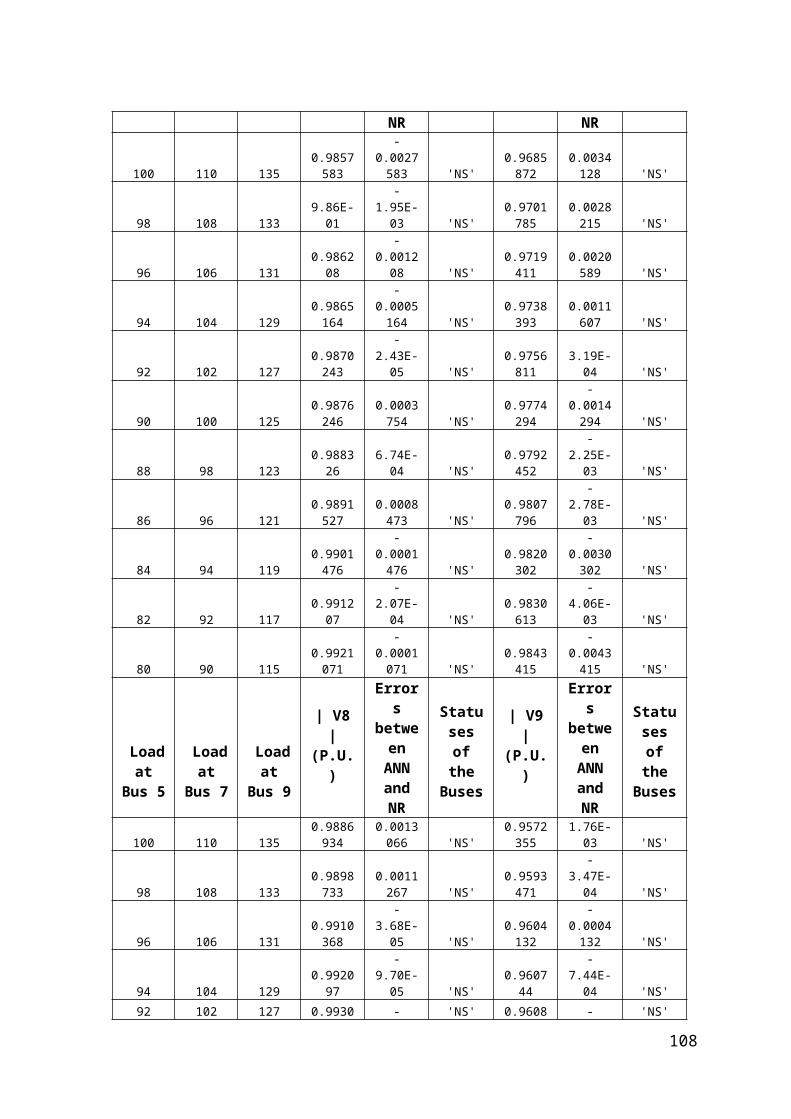
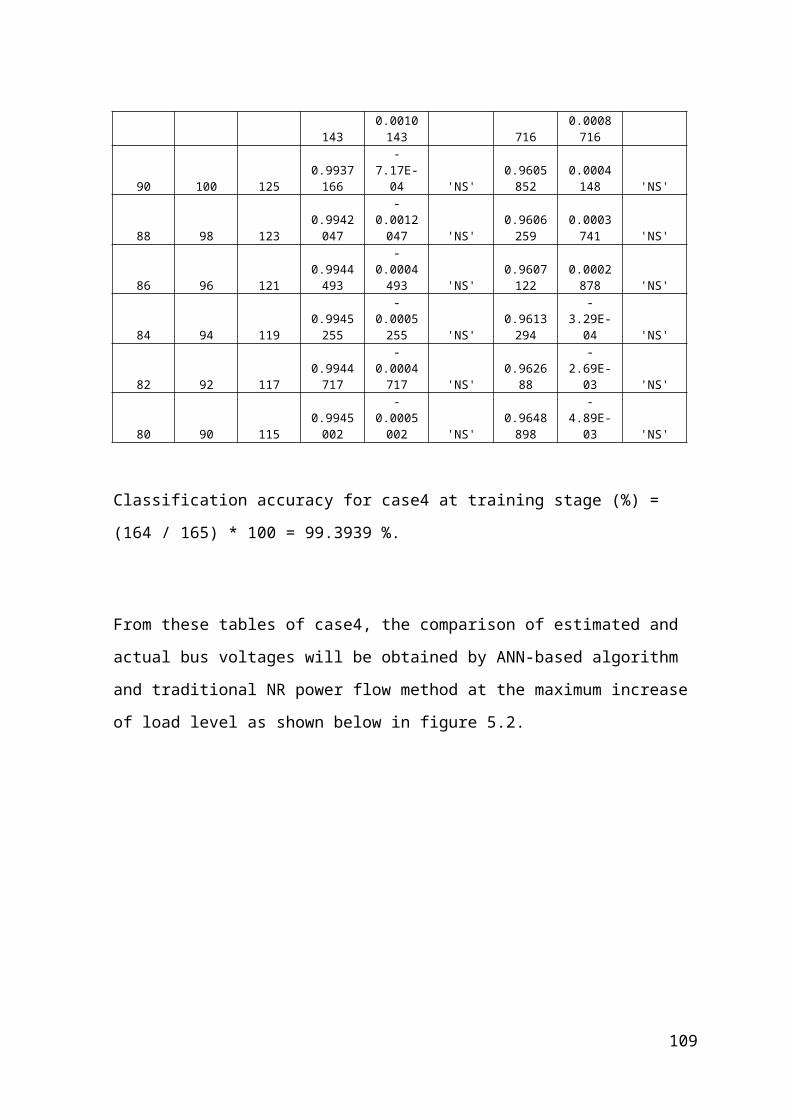
Table 5.3.4: Voltage Magnitudes per unit, statuses and errors between ANN and NR
method (results of the training for case4 (outage the line (4-5)))
Load at Bus
5
Load at Bus
7
Load at Bus
9
| V4 | (P.U.)
Errors between ANN and NR
Statuses of the Buses
| V5 | (P.U.)
Errors between ANN and NR
Statuses of the Buses
100 110 1350.986720
6 1.28E-03 'NS'0.894523
8 -2.52E-03 'AS'
98 108 1330.987529
20.000470
8 'NS'0.896160
5
-0.001160
5 'AS'
96 106 1310.988158
2 -1.58E-04 'NS'0.897959
4 1.04E-03 'AS'
94 104 1290.988570
9 4.29E-04 'NS'0.900008
5 1.99E-03 'AS'
92 102 1270.989079
5 -7.95E-05 'NS'0.902699
10.002300
9 'AS'
90 100 1250.989426
6 -0.000427 'NS'0.905578
2 1.42E-03 'AS'
88 98 1230.989613
6
-0.000613
6 'NS' 9.09E-01 8.06E-04 'AS'
86 96 1210.989721
5 -0.000721 'NS'0.912815
9 1.84E-04 'NS'
84 94 1190.989935
5
-0.000935
5 'NS'0.916874
8 -1.87E-03 'NS'
82 92 1170.990018
3
-0.002018
3 'NS' 0.921017 -0.003017 'NS'
80 90 1150.989441
7
-0.001441
7 'NS'0.925682
9 -5.68E-03 'NS'
Load at Bus
5
Load at Bus
7
Load at Bus
9
| V6 | (P.U.)
Errors between ANN and NR
Statuses of the Buses
| V7 | (P.U.)
Errors between ANN and NR
Statuses of the Buses
100 110 1350.985758
3
-0.002758
3 'NS'0.968587
20.003412
8 'NS'98 108 133 9.86E-01 -1.95E-03 'NS' 0.970178 0.002821 'NS'
102
5 5
96 106 131 0.986208 -0.001208 'NS'0.971941
10.002058
9 'NS'
94 104 1290.986516
4
-0.000516
4 'NS'0.973839
30.001160
7 'NS'
92 102 1270.987024
3 -2.43E-05 'NS'0.975681
1 3.19E-04 'NS'
90 100 1250.987624
60.000375
4 'NS'0.977429
4
-0.001429
4 'NS'
88 98 123 0.988326 6.74E-04 'NS'0.979245
2 -2.25E-03 'NS'
86 96 1210.989152
70.000847
3 'NS'0.980779
6 -2.78E-03 'NS'
84 94 1190.990147
6
-0.000147
6 'NS'0.982030
2
-0.003030
2 'NS'
82 92 117 0.991207 -2.07E-04 'NS'0.983061
3 -4.06E-03 'NS'
80 90 1150.992107
1
-0.000107
1 'NS'0.984341
5
-0.004341
5 'NS'
Load at Bus
5
Load at Bus
7
Load at Bus
9
| V8 | (P.U.)
Errors between ANN and NR
Statuses of the Buses
| V9 | (P.U.)
Errors between ANN and NR
Statuses of the Buses
100 110 1350.988693
40.001306
6 'NS'0.957235
5 1.76E-03 'NS'
98 108 1330.989873
30.001126
7 'NS'0.959347
1 -3.47E-04 'NS'
96 106 1310.991036
8 -3.68E-05 'NS'0.960413
2
-0.000413
2 'NS'
94 104 129 0.992097 -9.70E-05 'NS' 0.960744 -7.44E-04 'NS'
92 102 1270.993014
3
-0.001014
3 'NS'0.960871
6
-0.000871
6 'NS'
90 100 1250.993716
6 -7.17E-04 'NS'0.960585
20.000414
8 'NS'
88 98 1230.994204
7
-0.001204
7 'NS'0.960625
90.000374
1 'NS'
86 96 1210.994449
3
-0.000449
3 'NS'0.960712
20.000287
8 'NS'
84 94 1190.994525
5
-0.000525
5 'NS'0.961329
4 -3.29E-04 'NS'
82 92 1170.994471
7
-0.000471
7 'NS' 0.962688 -2.69E-03 'NS'
80 90 1150.994500
2
-0.000500
2 'NS'0.964889
8 -4.89E-03 'NS'
Classification accuracy for case4 at training stage (%) = (164 / 165) * 100 = 99.3939 %.
103
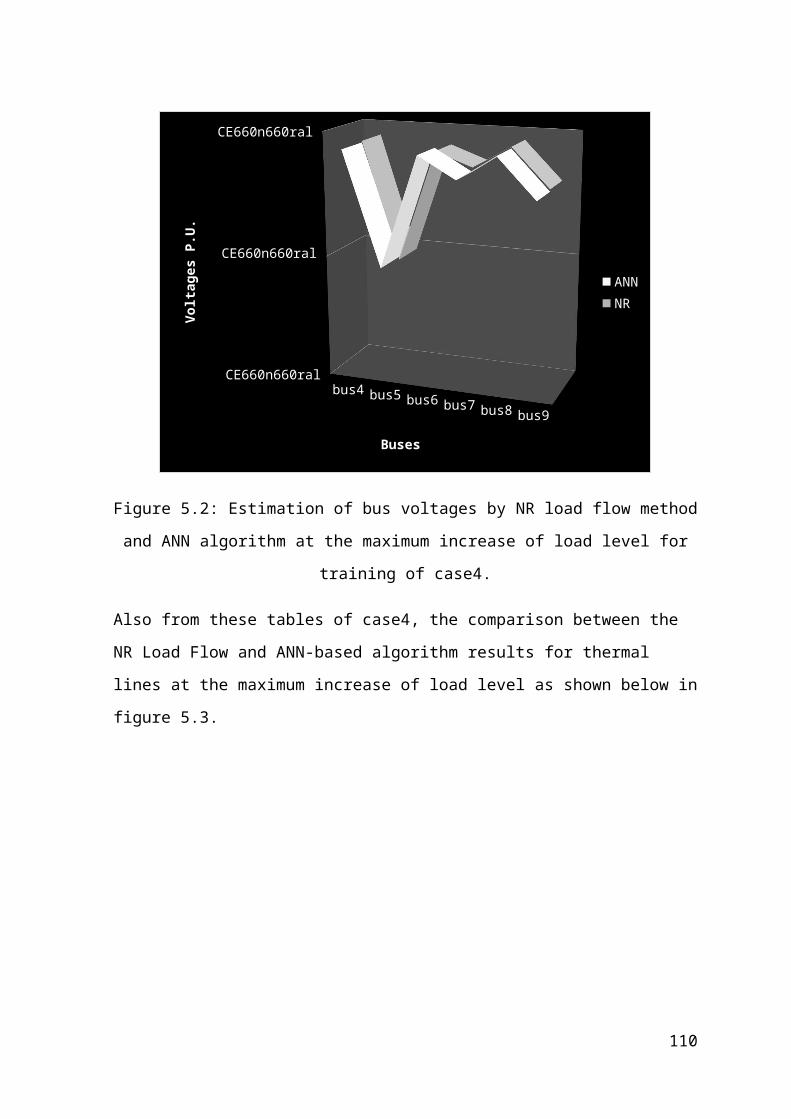
From these tables of case4, the comparison of estimated and actual bus voltages will be
obtained by ANN-based algorithm and traditional NR power flow method at the maximum
increase of load level as shown below in figure 5.2.
bus4 bus5 bus6 bus7 bus8 bus9
CE660n660ral
CE660n660ral
CE660n660ral
ANNNR
Buses
Volta
ges P
.U.
Figure 5.2: Estimation of bus voltages by NR load flow method and ANN algorithm at the
maximum increase of load level for training of case4.
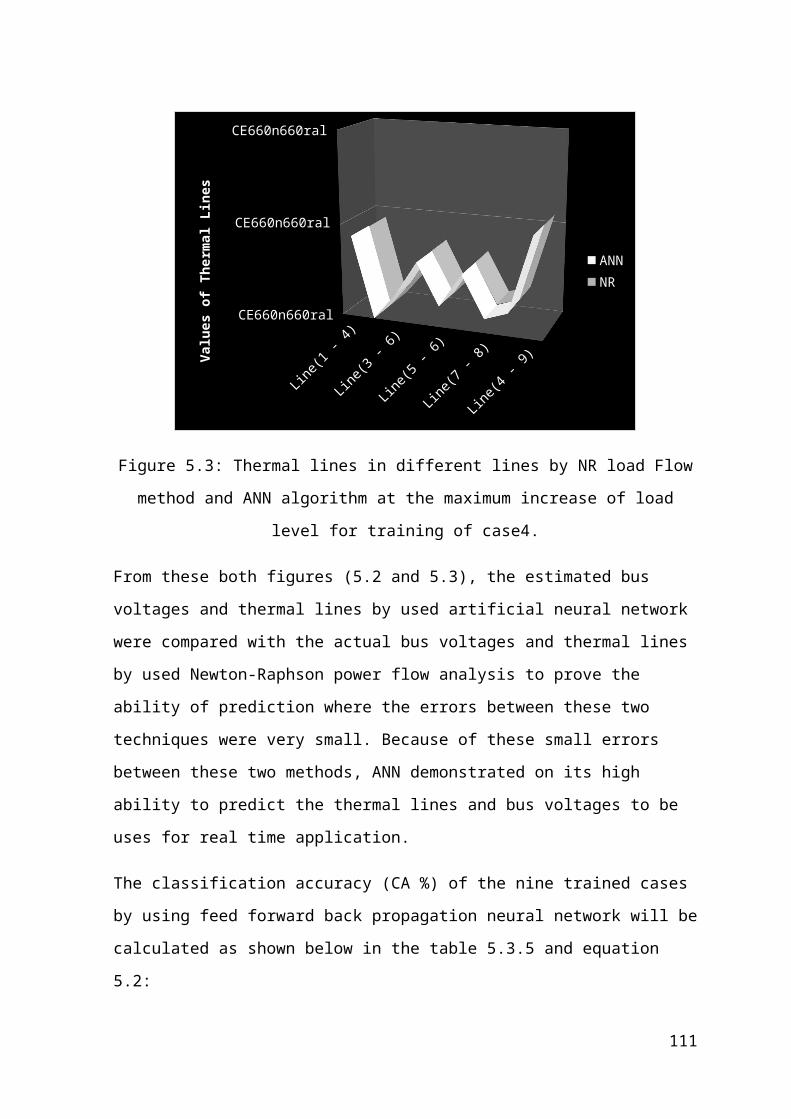
Also from these tables of case4, the comparison between the NR Load Flow and ANN-
based algorithm results for thermal lines at the maximum increase of load level as shown
below in figure 5.3.
104
Line(1 - 4)
Line(2 - 8)
Line(3 - 6)
Line(4 - 5)
Line(5 - 6)
Line(6 - 7)
Line(7 - 8)
Line(8 - 9)
Line(4 - 9)
CE660n660ral
CE660n660ral
CE660n660ral
ANNNR
Valu
es o
f The
rmal
Line
s
Figure 5.3: Thermal lines in different lines by NR load Flow method and ANN algorithm
at the maximum increase of load level for training of case4.
From these both figures (5.2 and 5.3), the estimated bus voltages and thermal lines by used
artificial neural network were compared with the actual bus voltages and thermal lines by
used Newton-Raphson power flow analysis to prove the ability of prediction where the
errors between these two techniques were very small. Because of these small errors
between these two methods, ANN demonstrated on its high ability to predict the thermal
lines and bus voltages to be uses for real time application.
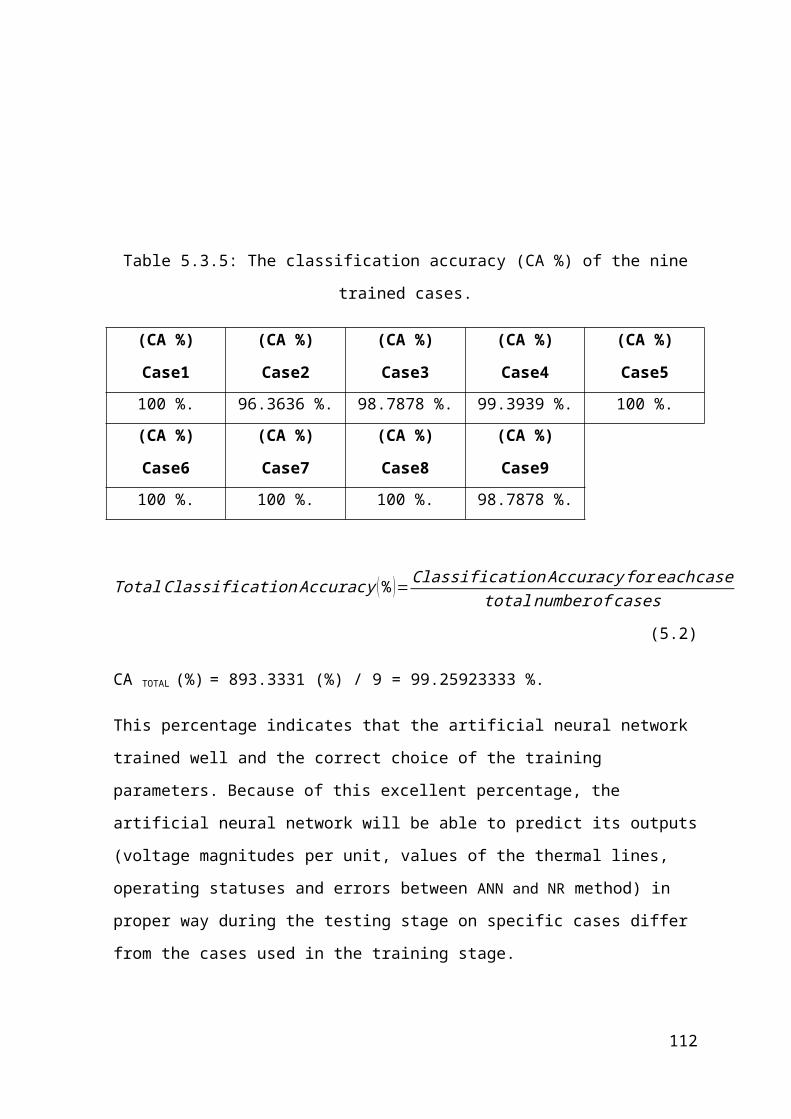
The classification accuracy (CA %) of the nine trained cases by using feed forward back
propagation neural network will be calculated as shown below in the table 5.3.5 and
equation 5.2:
Table 5.3.5: The classification accuracy (CA %) of the nine trained cases.
(CA %) Case1 (CA %) Case2 (CA %) Case3 (CA %) Case4 (CA %) Case5
100 %. 96.3636 %. 98.7878 %. 99.3939 %. 100 %.
105
(CA %) Case6 (CA %) Case7 (CA %) Case8 (CA %) Case9
100 %. 100 %. 100 %. 98.7878 %.
TotalClassification Accuracy (% )=Classification Accuracy for each casetotal number of cases (5.2)
CA TOTAL (%) = 893.3331 (%) / 9 = 99.25923333 %.
This percentage indicates that the artificial neural network trained well and the correct
choice of the training parameters. Because of this excellent percentage, the artificial neural
network will be able to predict its outputs (voltage magnitudes per unit, values of the
thermal lines, operating statuses and errors between ANN and NR method) in proper way
during the testing stage on specific cases differ from the cases used in the training stage.
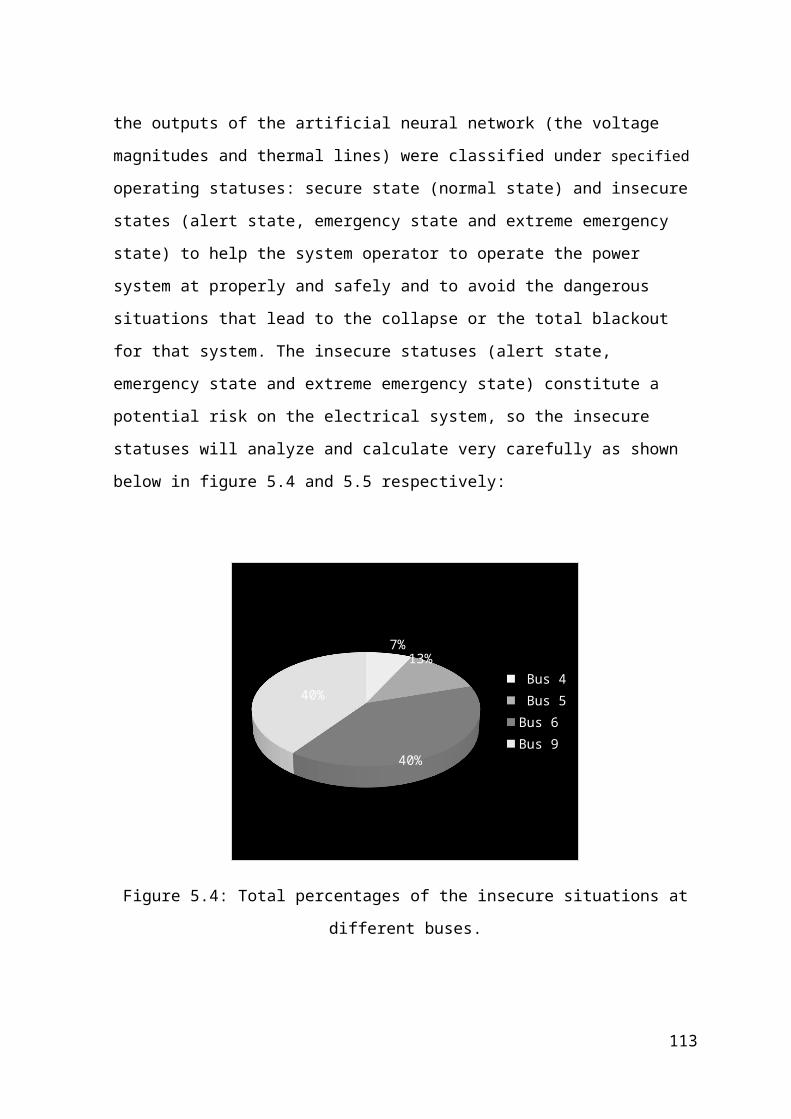
the outputs of the artificial neural network (the voltage magnitudes and thermal lines) were
classified under specified operating statuses: secure state (normal state) and insecure states
(alert state, emergency state and extreme emergency state) to help the system operator to
operate the power system at properly and safely and to avoid the dangerous situations that
lead to the collapse or the total blackout for that system. The insecure statuses (alert state,
emergency state and extreme emergency state) constitute a potential risk on the electrical
system, so the insecure statuses will analyze and calculate very carefully as shown below
in figure 5.4 and 5.5 respectively:
106
7% 13%
40%
40% Bus 4 Bus 5Bus 6Bus 9
Figure 5.4: Total percentages of the insecure situations at different buses.
7% 4%12%
15%
36%
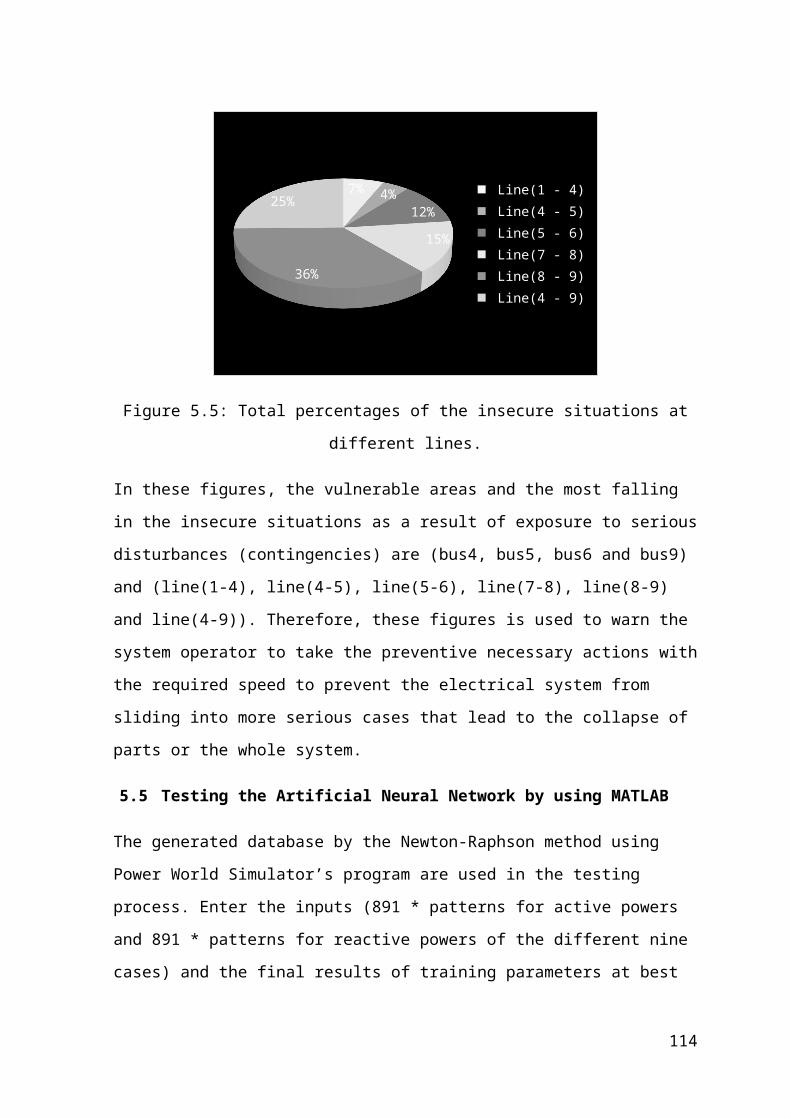
25% Line(1 - 4) Line(4 - 5) Line(5 - 6) Line(7 - 8) Line(8 - 9) Line(4 - 9)
Figure 5.5: Total percentages of the insecure situations at different lines.
In these figures, the vulnerable areas and the most falling in the insecure situations as a
result of exposure to serious disturbances (contingencies) are (bus4, bus5, bus6 and bus9)
and (line(1-4), line(4-5), line(5-6), line(7-8), line(8-9) and line(4-9)). Therefore, these
figures is used to warn the system operator to take the preventive necessary actions with
the required speed to prevent the electrical system from sliding into more serious cases that
lead to the collapse of parts or the whole system.
107
5.5 Testing the Artificial Neural Network by using MATLAB
The generated database by the Newton-Raphson method using Power World Simulator’s
program are used in the testing process. Enter the inputs (891 * patterns for active powers
and 891 * patterns for reactive powers of the different nine cases) and the final results of
training parameters at best mean square error to the artificial neural network by using
commands of the MATLAB’s program.
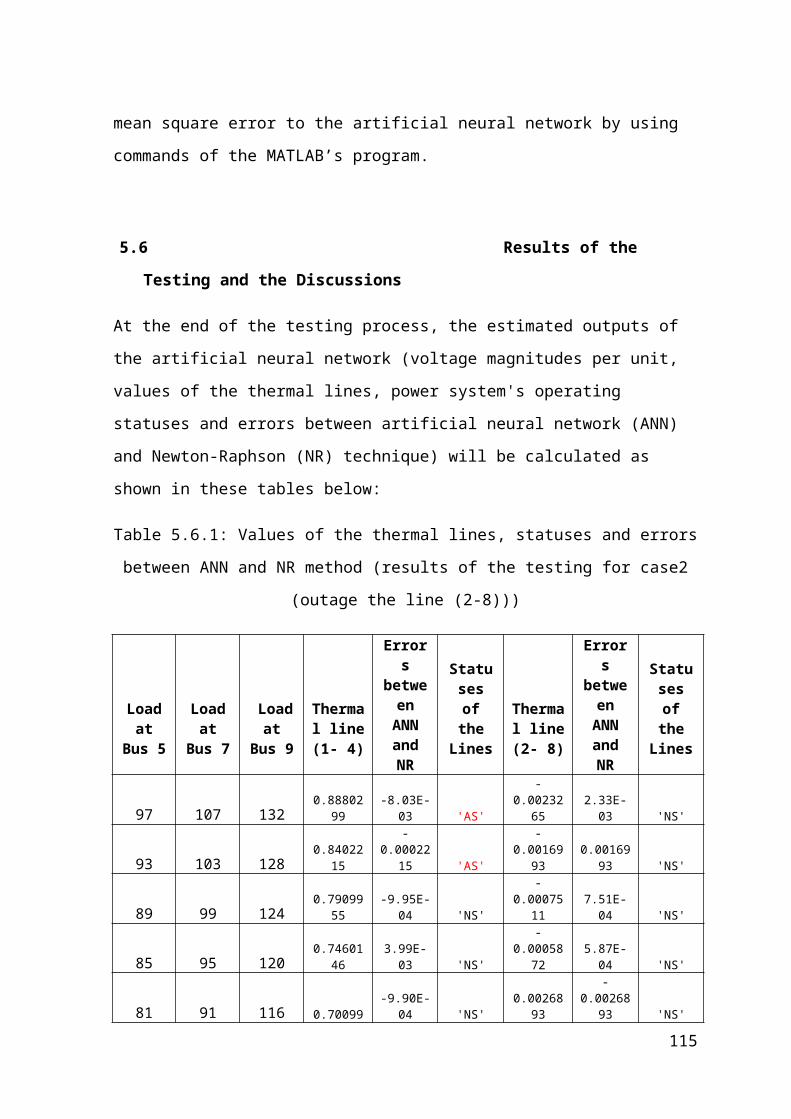
5.6 Results of the Testing and the Discussions
At the end of the testing process, the estimated outputs of the artificial neural network
(voltage magnitudes per unit, values of the thermal lines, power system's operating statuses
and errors between artificial neural network (ANN) and Newton-Raphson (NR) technique)
will be calculated as shown in these tables below:
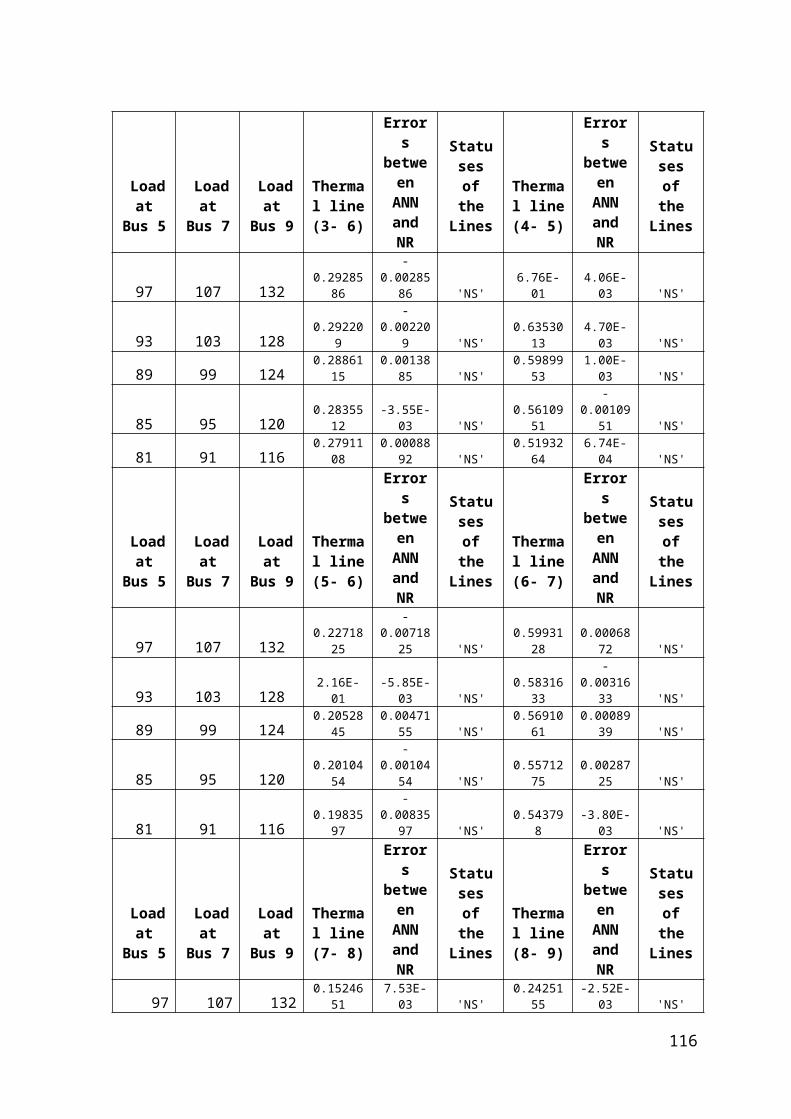
Table 5.6.1: Values of the thermal lines, statuses and errors between ANN and NR method
(results of the testing for case2 (outage the line (2-8)))
Load at Bus
5
Load at Bus
7
Load at Bus
9
Thermal line
(1- 4)
Errors between ANN and NR
Statuses of the Lines
Thermal line (2- 8)
Errors between
ANN and NR
Statuses of the Lines
97 107 132 0.8880299 -8.03E-03 'AS'-
0.0023265 2.33E-03 'NS'
93 103 128 0.8402215-
0.0002215 'AS'-
0.0016993 0.0016993 'NS'
89 99 124 0.7909955 -9.95E-04 'NS'-
0.0007511 7.51E-04 'NS'
85 95 120 0.7460146 3.99E-03 'NS'-
0.0005872 5.87E-04 'NS'
81 91 116 0.70099 -9.90E-04 'NS' 0.0026893-
0.0026893 'NS'
Load at Bus
5
Load at Bus
7
Load at Bus
9
Thermal line
(3- 6)
Errors between ANN and NR
Statuses of the Lines
Thermal line (4- 5)
Errors between
ANN and NR
Statuses of the Lines
97 107 132 0.2928586-
0.0028586 'NS' 6.76E-01 4.06E-03 'NS'93 103 128 0.292209 -0.002209 'NS' 0.6353013 4.70E-03 'NS'89 99 124 0.2886115 0.0013885 'NS' 0.5989953 1.00E-03 'NS'
85 95 120 0.2835512 -3.55E-03 'NS' 0.5610951-
0.0010951 'NS'81 91 116 0.2791108 0.0008892 'NS' 0.5193264 6.74E-04 'NS'
Load at Bus
5
Load at Bus
7
Load at Bus
9
Thermal line
(5- 6)
Errors between ANN
Statuses of the Lines
Thermal line (6- 7)
Errors between
ANN
Statuses of the Lines
108
and NR and NR
97 107 132 0.2271825-
0.0071825 'NS' 0.5993128 0.0006872 'NS'
93 103 128 2.16E-01 -5.85E-03 'NS' 0.5831633-
0.0031633 'NS'89 99 124 0.2052845 0.0047155 'NS' 0.5691061 0.0008939 'NS'
85 95 120 0.2010454-
0.0010454 'NS' 0.5571275 0.0028725 'NS'
81 91 116 0.1983597-
0.0083597 'NS' 0.543798 -3.80E-03 'NS'
Load at Bus
5
Load at Bus
7
Load at Bus
9
Thermal line
(7- 8)
Errors between ANN and NR
Statuses of the Lines
Thermal line (8- 9)
Errors between
ANN and NR
Statuses of the Lines
97 107 132 0.1524651 7.53E-03 'NS' 0.2425155 -2.52E-03 'NS'93 103 128 0.1450814 0.0049186 'NS' 0.2295489 4.51E-04 'NS'
89 99 124 0.1383583 0.0016417 'NS' 0.2223053-
0.0023053 'NS'85 95 120 0.1317602 -1.76E-03 'NS' 0.2124501 -2.45E-03 'NS'81 91 116 0.1156208 0.0043792 'NS' 0.209129 -0.009129 'NS'
Load at Bus
5
Load at Bus
7
Load at Bus
9
Thermal line
(4- 9)
Errors between ANN and NR
Statuses of the Lines
97 107 132 1.0827844-
0.0027844 'ES'
93 103 128 1.0323664-
0.0023664 'ES'
89 99 124 0.9845105 0.0054895 'AS'
85 95 120 0.9401082-
0.0001082 'AS'
81 91 116 0.8859183 0.0040817 'AS'
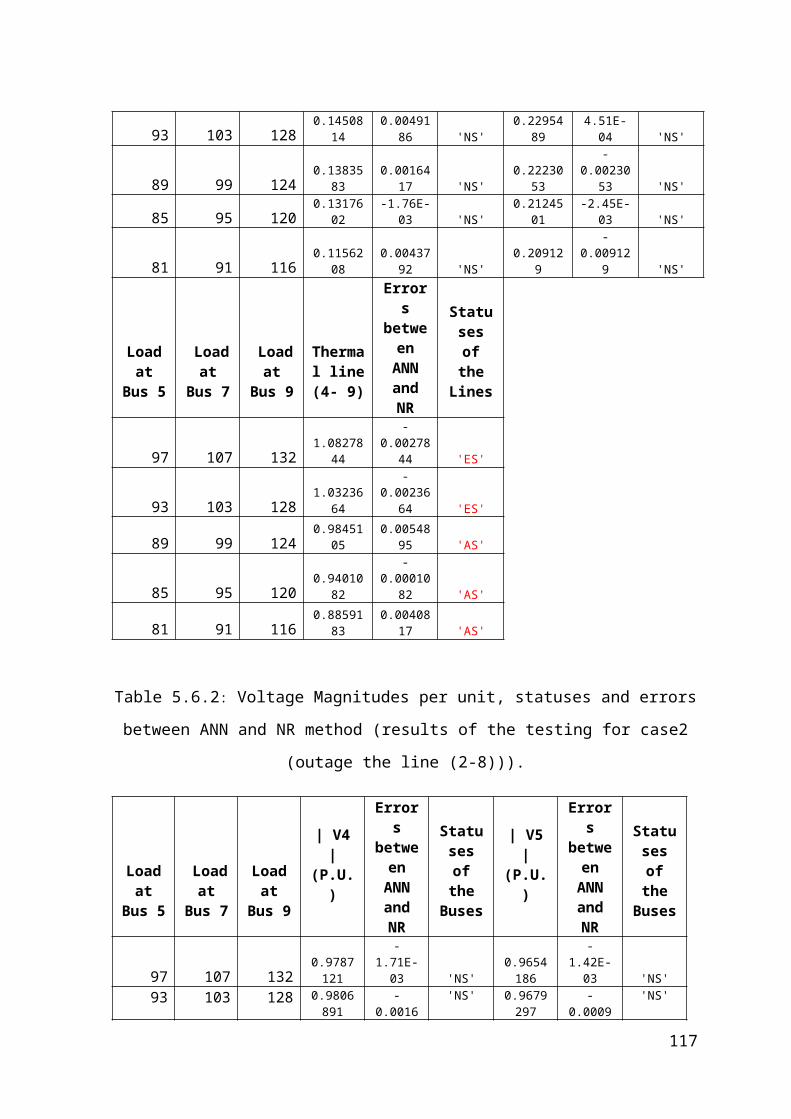
Table 5.6.2: Voltage Magnitudes per unit, statuses and errors between ANN and NR
method (results of the testing for case2 (outage the line (2-8))).
Load at Bus
5
Load at Bus
7
Load at Bus
9
| V4 | (P.U.)
Errors between ANN and NR
Statuses of the Buses
| V5 | (P.U.)
Errors between ANN and NR
Statuses of the Buses
97 107 1320.978712
1 -1.71E-03 'NS'0.965418
6 -1.42E-03 'NS'
93 103 1280.980689
1
-0.001689
1 'NS'0.967929
7
-0.000929
7 'NS'
89 99 1240.982258
5 -1.26E-03 'NS'0.970183
9 -1.84E-04 'NS'
85 95 1200.983040
6 -4.06E-05 'NS'0.971911
1 1.09E-03 'NS'
81 91 1160.983381
7 1.62E-03 'NS'0.973608
60.001391
4 'NS'
109
Load at Bus
5
Load at Bus
7
Load at Bus
9
| V6 | (P.U.)
Errors between ANN and NR
Statuses of the Buses
| V7 | (P.U.)
Errors between ANN and NR
Statuses of the Buses
97 107 1320.995065
1
-0.003065
1 'NS' 9.54E-01 -3.82E-04 'NS'
93 103 128 0.994864 -0.001864 'NS'0.957424
7 -4.25E-04 'NS'
89 99 1240.994364
90.000635
1 'NS'0.960305
7 -3.06E-04 'NS'
85 95 1200.993694
50.002305
5 'NS'0.962974
8 2.52E-05 'NS'
81 91 1160.993012
90.003987
1 'NS'0.965537
4 3.05E-02 'NS'
Load at Bus
5
Load at Bus
7
Load at Bus
9
| V8 | (P.U.)
Errors between ANN and NR
Statuses of the Buses
| V9 | (P.U.)
Errors between ANN and NR
Statuses of the Buses
97 107 1320.960775
8
-0.001775
8 'NS'0.938361
50.000638
5 'NS'
93 103 128 9.63E-01 -1.01E-03 'NS'0.941032
70.000967
3 'NS'
89 99 1240.965533
10.000466
9 'NS'0.944610
50.001389
5 'NS'
85 95 1200.967951
60.001048
4 'NS'0.949034
1 -3.41E-05 'NS'
81 91 1160.970101
3
0.001898
7 'NS'
0.954339
8 -2.34E-03 'NS'
Classification accuracy for case2 at testing stage (%) = (74 / 75) * 100 = 98.66667 %.
From these tables of case2, the comparison of estimated and actual bus voltages will be
obtained by ANN-based algorithm and traditional NR power flow method as well as the
comparison between the NR Load Flow and ANN-based algorithm results for thermal lines
at the maximum increase of load level as shown below in figure 5.6 and 5.7 respectively:
110
Line(1 - 4)
Line(2 - 8)
Line(3 - 6)
Line(4 - 5)
Line(5 - 6)
Line(6 - 7)
Line(7 - 8)
Line(8 - 9)
Line(4 - 9)
CE660n660ral
CE660n660ral
CE660n660ral
ANNNR
Lines
Valu
es o
f The
rmal
Line
s
Figure 5.6: Thermal lines in different lines by NR load Flow method and ANN algorithm
at the maximum increase of load level for testing of case2.
bus4 bus5 bus6 bus7 bus8 bus9
CE660n660ral
CE660n660ral
CE660n660ral
ANNNR
Buses
Volta
ges P
.U.
Figure 5.7: Estimation of bus voltages by NR load flow method and ANN algorithm at the
maximum increase of load level for testing of case2.
The estimated results obtained from the ANN technique was compared with NR power
flow analysis in terms of accuracy. As shown from these figures, the obtained estimated
outcomes from the ANN are approximately matching of the results of NR technique and
111
that demonstrates the reliability of artificial neural network in the field of the static security
assessment.
Table 5.6.3: Values of the thermal lines, statuses and errors between ANN and NR method
(results of the testing for case9 (outage the line (4-9)))
Load at Bus
5
Load at Bus
7
Load at Bus
9
Thermal line (1- 4)
Errors between ANN and NR
Statuses of the Lines
Thermal line (2- 8)
Errors between ANN and NR
Statuses of the Lines
97 107 132 0.3411931 -1.19E-03 'NS' 0.634674 -1.47E-02 'NS'
93 103 128 0.2974166
-0.007416
6 'NS' 0.6156348
-0.005634
8 'NS'89 99 124 0.2520061 -2.01E-03 'NS' 0.605739 4.26E-03 'NS'85 95 120 0.2089985 1.00E-03 'NS' 0.5969542 3.05E-03 'NS'
81 91 116 0.1611838 -1.18E-03 'NS' 0.5904782
-0.000478
2 'NS'
Load at Bus
5
Load at Bus
7
Load at Bus
9
Thermal line (3- 6)
Errors between ANN and NR
Statuses of the Lines
Thermal line (4- 5)
Errors between ANN and NR
Statuses of the Lines
97 107 132 0.2953426
-0.005342
6 'NS' 6.80E-01 2.40E-04 'NS'93 103 128 0.2899816 1.84E-05 'NS' 0.5882053 1.79E-03 'NS'89 99 124 0.2843009 -0.004300 'NS' 0.4976458 2.35E-03 'NS'
85 95 120 0.2806079
-0.000607
9 'NS' 0.40964430.000355
7 'NS'
81 91 116 0.27938250.000617
5 'NS' 0.331319 8.68E-03 'NS'
Load at Bus
5
Load at Bus
7
Load at Bus
9
Thermal line (5- 6)
Errors between ANN and NR
Statuses of the Lines
Thermal line (6- 7)
Errors between ANN and NR
Statuses of the Lines
97 107 132 0.1704014 -4.01E-04 'NS' 0.5916351 1.84E-02 'NS'
93 103 128 1.61E-01 -1.20E-03 'NS' 0.5612823
-0.001282
3 'NS'
89 99 124 0.1731007
-0.003100
7 'NS' 0.50912490.000875
1 'NS'
85 95 120 0.2001142 -1.14E-04 'NS' 0.45430460.005695
4 'NS'
81 91 116 0.24579370.004206
3 'NS' 0.4084279 1.57E-03 'NS'
Load at Bus
5
Load at Bus
7
Load at Bus
9
Thermal line (7- 8)
Errors between ANN and NR
Statuses of the Lines
Thermal line (8- 9)
Errors between ANN and NR
Statuses of the Lines
97 107 132 0.1569826 -6.98E-03 'NS' 1.1254884 1.45E-02 'ES'93 103 128 0.1786647 0.001335 'NS' 1.0916699 -1.67E-03 'ES'
112
3
89 99 124 0.2128286
-0.002828
6 'NS' 1.04586130.004138
7 'ES'85 95 120 0.2421638 -2.16E-03 'NS' 1.0009054 -9.05E-04 'ES'
81 91 116 0.27431410.005685
9 'NS' 0.95850140.001498
6 'AS'
Load at Bus
5
Load at Bus
7
Load at Bus
9
Thermal line (4- 9)
Errors between ANN and NR
Statuses of the Lines
97 107 132 0.0016181
-0.001618
1 'NS'
93 103 128 0.0005793
-0.000579
3 'NS'
89 99 124 0.0002327
-0.000232
7 'NS'
85 95 120 0.0002812
-0.000281
2 'NS'
81 91 116-
0.00117780.001177
8 'NS'
Table 5.6.4: Voltage Magnitudes per unit, statuses and errors between ANN and NR
method (results of the testing for case9 (outage the line (4-9)))
Load at Bus
5
Load at Bus
7
Load at Bus
9
| V4 | (P.U.)
Errors between ANN and NR
Statuses of the Buses
| V5 | (P.U.)
Errors between ANN and NR
Statuses of the Buses
97 107 1320.998886
1 1.14E-04 'NS'0.976920
6 3.08E-03 'NS'
93 103 1280.999617
10.000382
9 'NS' 0.981368 0.000632 'NS'
89 99 1241.000142
1 -1.42E-04 'AS'0.984433
8 -1.43E-03 'NS'
85 95 1201.000236
2 -2.36E-04 'AS'0.984910
7 -9.11E-04 'NS'
81 91 116 0.999822 1.78E-04 'NS'0.983749
10.001250
9 'NS'
Load at Bus
5
Load at Bus
7
Load at Bus
9
| V6 | (P.U.)
Errors between ANN and NR
Statuses of the Buses
| V7 | (P.U.)
Errors between ANN and NR
Statuses of the Buses
97 107 1320.995347
2
-0.002347
2 'NS' 9.51E-01 -3.00E-03 'NS'
93 103 1280.995926
5
-0.001926
5 'NS'0.953075
8 -1.08E-03 'NS'89 99 124 0.996669 -0.000669 'NS' 0.955458 -4.58E-04 'NS'
85 95 1200.997380
8
-0.000380
8 'NS'0.958173
30.000826
7 'NS'
113
81 91 1160.998045
1 -4.51E-05 'NS'0.961211
1 -2.11E-04 'NS'
Load at Bus
5
Load at Bus
7
Load at Bus
9
| V8 | (P.U.)
Errors between ANN and NR
Statuses of the Buses
| V9 | (P.U.)
Errors between ANN and NR
Statuses of the Buses
97 107 1320.951504
1
-0.003504
1 'NS' 0.779472 -0.007472 'EES'
93 103 128 9.53E-01 -9.63E-04 'NS'0.785661
2 -0.001661 'EES'
89 99 1240.955518
4 -0.000518 'NS'0.793798
20.000201
8 'EES'
85 95 1200.958673
5
-0.000673
5 'NS'0.802879
70.000120
3 'ES'
81 91 1160.961450
4
-0.000450
4 'NS'0.812643
9 -6.44E-04 'ES'
Classification accuracy for case9 at testing stage (%) = (75 / 75) * 100 = 100 %.
The classification accuracy (CA %) of the nine tested cases by using feed forward back
propagation neural network will be calculated as shown below in the table 5.6.5:
Table 5.6.5: The classification accuracy of the nine tested cases.
(CA %) Case1 (CA %) Case2 (CA %) Case3 (CA %) Case4 (CA %) Case5
60 %. 98.66667 %. 58.66667 %. 98.66667 %. 98.66667 %.
(CA %) Case6 (CA %) Case7 (CA %) Case8 (CA %) Case9
100 %. 100 %. 100 %. 100 %.
Total Classification Accuracy for testing stage (%) = 860.66668 (%) / 9 = 90.51852 %.
This percentage shows the ability of the artificial neural network to determine the
estimated voltage magnitudes at various buses and the estimated values of the thermal lines
at various transmission lines for different probable disturbances (outage the transmission
lines with changing loads). In addition, the percentage of the Classification Accuracy for
total nine tested cases can be considered as a good percentage when compared with the
other published results of works in this field.
114
The total spent time to carry out the testing process by ANN was 0.013 second while the
spent time by Newton-Raphson power flow analysis was 0.0627 second. Because of these
results, the ANN is faster than NR method in predicting the security level of that system.
This time indicates the ability of the artificial neural network to identify power system's
operating statuses (normal state, alert state, emergency state and extreme emergency state).
The testing time is considered a short period, which can enable the system operator to take
the preventive necessary actions to prevent the electrical system from sliding into more
serious cases that lead to the collapse of parts or the whole system. The most susceptible
areas by dangerous contingencies that lead to the insecure statuses will be analyzed and
presented in figures 5.8 and 5.9 respectively:
AS Bus
4
ES Bus
4
EES Bus
4
AS Bus
5
ES Bus
5
EES Bus
5
AS Bus
6
ES Bus
6
EES Bus
6
AS Bus
7
ES Bus
7
EES Bus
7
AS Bus
8
ES Bus
8
EES Bus 8
AS Bus 9
ES Bus 9
EES Bus 9
CE660n660ral
CE660n660ral
CE660n660ral
CE660n660ral
CE660n660ralCE660n660ral
CE660n660ral
CE660n660ralCE660n660ral
CE660n660ral
CE660n660ralCE660n660ralCE660n660ralCE660n660ralCE660n660ralCE660n660ralCE660n660ralCE660n660ral
CE660n660ral
CE660n660ralCE660n660ral
Statuses of the Buses
Num
ber
of I
Nns
ecur
e S
tatu
ses
Figure 5.8: Number of Insecure Statuses of testing stage for voltage magnitudes at different
buses.
115
CE660n660ral
CE660n660ralCE660n660ralCE660n660ralCE660n660ralCE660n660ralCE660n660ralCE660n660ralCE660n660ralCE660n660ral
CE660n660ralCE660n660ral
CE660n660ralCE660n660ral
CE660n660ralCE660n660ralCE660n660ralCE660n660ral
CE660n660ralCE660n660ral
CE660n660ral
CE660n660ral
CE660n660ral
CE660n660ral
CE660n660ral
CE660n660ral
CE660n660ral
Statuses of Lines
Num
ber
of I
nsec
ure
Sta
tuse
s
Figure 5.9: Number of Insecure Statuses of training stage for values of the thermal lines at
different lines.
In these figures, the numbers of insecure statuses for voltage magnitudes at different buses
and the values of the thermal lines at various lines were calculated to help the system
operator to reveal the most susceptible areas (buses and lines) for unsafe situations. In
addition, to warn the system operator to take rapid and preventive action which it helps to
take the operating system back to the secure position and to avoid remaining the system at
the unsafe situations that lead to the collapse or the shutdown for that system.
Because of the high accuracy prediction of the training process and a good accuracy
prediction of the testing process by using Artificial Neural Network (ANN) technique in
determining the security level of the IEEE 9-bus system. Besides that, the average time
required ANN is faster than the average time required by NR method and this technique
can be utilized for real time application. Therefore, the Artificial Neural Network (ANN)
proved of its high potential in the field of the static security assessment to be like a
protective shield for warning the system operator from the unsafe instances and to operate
the power system at a safe position to ensure arrival of electricity to consumers with high
quality and without interruptions. The prediction of classification accuracy at the testing
process is considered a good percentage according to [4].
116
In [4], six transmission lines separated in all cases while eight transmission lines were
cutting in all scenarios of this thesis. Each outage of these transmission lines contained (11
* 12) values of real powers and (11 * 12) values of reactive powers at the input layer. As
well as, (11 * 12) values of thermal limits and (9 * 11) values of voltage magnitudes at the
output layer where all these values are obtained from the change in the loads of IEEE-9 bus
system. Due to these reasons, the average time required by feed forward back propagation
neural network and the value of mean square error increased in this system. As well as, the
percentage of classification accuracy decreased also.
117