Embed Size (px)
Citation preview
http
://do
c.re
ro.c
h
Structural and optical properties ofMgxAl1−xHy gradient thin films: acombinatorial approach
R. Gremaud1 �, A. Borgschulte1, C. Chacon2, J. L. M. vanMechelen1, H. Schreuders1, A. Zuttel3, B. Hjorvarsson2, B. Dam1,R. Griessen1
1 Department of Physics and Astronomy, Condensed Matter Physics, Vrije Uni-versiteit, De Boelelaan 1081, NL-1081 HV Amsterdam, The Netherlands
2 Department of Physics, Uppsala University, Box 530, S-751 21, Uppsala, Sweden3 Institut de Physique, Universite de Fribourg, Ch. du Musee 3, CH-1700 Fri-
bourg, Switzerland
Received: date / Revised version: date
Abstract The structural, optical and dc electrical properties of MgxAl1−x
(0.2 ≤ x ≤ 0.9) gradient thin films covered with Pd/Mg are investigatedbefore and after exposure to hydrogen. We use Hydrogenography, a novelhigh-throughput optical technique to map simultaneously all the hydrideforming compositions and the kinetics thereof in the gradient thin film.Metallic Mg in the MgxAl1−x layer undergoes a metal-to-semiconductortransition and MgH2 is formed for all Mg fractions x investigated. Thepresence of an amorphous Mg-Al phase in the thin film phase diagram en-hances strongly the kinetics of hydrogenation. In the Al-rich part of the film,a complex H-induced segregation of MgH2 and Al occurs. This uncommonlarge-scale segregation is evidenced by metal and hydrogen profiling us-ing Rutherford backscattering spectrometry and resonant nuclear analysisbased on the reaction 1H(15N,αγ)12C. Besides MgH2, an additional semi-conducting phase is found by electrical conductivity measurements aroundan atomic [Al]/[Mg] ratio of 2 (x = 0.33). This suggests that the film ispartially transformed into Mg(AlH4)2 at around this composition.
PACS: 78.20.-e; 68.55.-a; 64.75.+g
Send offprint requests to: R. Gremaud� Present address: Tel.: +31 20 598 79 26, Fax: +31 20 598 79 92
E-mail: [email protected]
1
Published in "Applied Physics A 84(1-2): 77-85, 2006"which should be cited to refer to this work.
http
://do
c.re
ro.c
h
1 Introduction
The availability of a safe and effective way to store hydrogen reversibly isone of the major issues for its large scale use as an energy carrier [1].
For this purpose, the ideal hydrogen storage material should have thefollowing properties: high gravimetric and volumetric hydrogen density, fastkinetics of (de)hydrogenation near ambient temperature, long term stabilityand good thermal conductivity for removing the reaction heat. The avail-ability and affordable price of the alloy constituents is also of importance.
As the understanding of hydride materials developed and their limi-tations for an application in the automotive sector became clear, attentionshifted away from simple binary or ternary hydride systems to compounds orcomposites consisting of multiple elements. However, the number of possiblecombinations grows factorially, and with all the parameters to be incorpo-rated, a nearly infinite parameter space opens. In the standard approachfollowed so far, the exploratory search for new light-weight hydrogen stor-age materials is very time consuming as a bulk sample is needed for eachcomposition investigated. We present here a new combinatorial method thatis capable of exploring typically 103 samples simultaneously. It is based onthe use of large area thin film samples with controlled chemical compositiongradients of two, three or more metal constituents [2,3].
To monitor the hydrogen absorption, we exploit the fact that most com-plex metal-hydrogen systems undergo a metal-insulator transition upon hy-drogen exposure [4–10]. By following the optical changes during hydrogena-tion [11], we are thus able to map simultaneously all the hydride-formingcompositions of the gradient thin film. We use the term Hydrogenographyfor this direct mapping of the hydrides formed in a large compositional gra-dient sample, enabling the investigation of a full metal-hydrogen ternaryphase diagram with one sample.
In the present work, we exemplify this technique with the Mg-Al phasediagram in thin films and the hydrogenation properties thereof. Pure mag-nesium reacts reversibly with hydrogen to form MgH2. It is thus consideredto be one of the most important candidates for the reversible storage ofhydrogen due to its light weight, low cost and high hydrogen gravimetricdensity (7.6 wt%). However, its hydrogen ab/desorption kinetics is unsat-isfactory due to the very low diffusion of hydrogen in MgH2 [12]. However,preparing nanocrystalline Mg [13] by ball milling and adding transition met-als [14,15] or transition metal oxides [16] as catalysts improves the kineticstremendously. This has initiated many studies on Mg-based hydrides, someof them with Al additions [17–19]. Another promising class of materials forhydrogen storage are the Al-based complex hydrides, since Bogdanovic andSchwickardi showed that the decomposition of sodium alanate, NaAlH4, canbe made reversible by the addition of Ti and Fe compounds as catalysts [20].This stimulated the investigation of many other complex systems [21–24].Among them, magnesium alanate, Mg(AlH4)2 , with 9.3 wt% of hydrogen,is also a potential hydrogen storage material. It was recently synthesized
2
http
://do
c.re
ro.c
h
in bulk form and its decomposition studied [25,26]. Furthermore, theoret-ical calculations predict Mg(AlH4)2 to be a large gap semiconductor [8,9].The potential synthesis of magnesium alanate from the elements as well asthe formation of MgH2 as a function of the Al content triggered thus ourinterest for the Mg-Al-H system in gradient thin films.
In this article, we investigate the kinetics, electrical and optical proper-ties and the segregation phenomena of MgxAl1−x gradient thin films dur-ing hydrogenation. For this we use the Hydrogenography method describedabove. The method is complemented by 15N Nuclear Resonance Analysis(NRA) and Rutherford Backscattering Spectrometry (RBS). We demon-strate that this approach sheds light on the complex hydrogenation processand thereby helps to optimize multi-component hydrogen storage systems.
2 Experimental
The samples consist of a Mg-Al compositional gradient layer of typically100 to 200 nm thickness covered with a 1 nm Mg layer to avoid an Al-terminated surface. The layers are capped with 10 nm of Pd to preventoxidation and promote hydrogen dissociation and absorption. This stack oflayers is sputtered at room temperature on 5 x 70 mm glass substrates byoff-centered dc/rf magnetron sputtering sources. The argon pressure duringdeposition is 3· 10−3 mbar and the background pressure lower than 10−8
mbar. The chemical composition range is adjusted by varying the angle ofboth Mg and Al sources relative to the sample normal. Sputter rates in thecenter of the sample are determined in situ before deposition by a quartzcrystal monitor.
The total thickness is measured every 5 mm by a DEKTAK3 stylus pro-filometer. The dc electrical resistivity is recorded in a Van der Pauw configu-ration [27] on electrically separated zones every 3 mm. In the hydrogenatedstate, the metallic Pd overlayer shunts the semiconducting MgxAl1−xHy .To correct for this effect, the MgxAl1−xHy and Pd layer are treated as twoparallel resistors [28].
The precise chemical compositions and in-depth homogeneity of the filmare determined by Rutherford Backscattering Spectrometry (RBS) using 2Mev He+ ions on simultaneously deposited layers on glassy carbon sub-strates. These substrates do not contribute to the background for ener-gies above approximately 0.5 MeV, allowing a precise determination of theamounts of each element in the sample as a function of depth. Besides themetals (Mg, Al, Pd), the oxygen content is obtained. Moreover, it is alsopossible to distinguish between oxygen adsorbed at the surface, absorbedin the film or adsorbed at the substrate-film interface. The measured RBSdata are analyzed with the RUMP software [29,30]. As Mg and Al havenearly the same atomic number (z = 12 and 13, respectively), RBS fits areused to deconvolute the Mg and Al contributions to the spectra. Furtherdetails about the RBS method can be found elsewhere, see e.g. [31].
3
http
://do
c.re
ro.c
h
The structural characterization is performed in a Bruker D8 DiscoverX-ray diffractometer (Cu-Kα, λ=1.5418 A)
After deposition, metallic films are transferred into an optical cell tomonitor their optical transmission during hydrogenation. The whole cell isplaced in a furnace to control temperature up to 300 ◦C. A 150 W dif-fuse light source illuminates the sample from the substrate side, and a 3-channel (RGB) SONY XC-003 charged-coupled device (CCD) camera mon-itors the transmitted light. Images during hydrogen ab/desorption processesare taken at different time intervals Δt (1 s ≤ Δt ≤ 100 s) depending onthe overall kinetics of the Mg-Al composition under consideration.
Additional reflection and transmission measurements of the hydrogenatedstate are performed in a Perkin Elmer Lambda 900 diffraction grating spec-trometer with an energy range from 0.495 to 6.19 eV (λ = 2500 - 200 nm).
The 15N Nuclear Resonance Analysis (NRA) method is used for hydro-gen depth profiling of the sample, and is performed at the Tandem accelera-tor in Uppsala. The technique is based on the 1H(15N,αγ)12C nuclear reso-nance reaction and provides the depth profile as well as the total amount ofhydrogen per metallic atom [32]. For the profiling, the sample is bombardedwith 15N ions with an energy equal to or above the resonance energy (6.385MeV). Upon penetration, the ions lose energy, and, at the depth where theions have reached the resonance energy, the probability for the reaction isgreatly enhanced. The depth resolution is typically 1 nm close to the surfacebut deteriorates with increasing depth due to energy straggling. The 4.43MeV gamma rays are detected in a BGO detector placed at a distance of3 cm from the sample at an angle of 0 degree with respect to the incidentbeam. The diameter of the beam at the surface of the sample is around 1mm and the ion beam current (N2+) is typically 10-40 nA. The detectionlimit is of some atomic ppm and the precision is determined by the count-ing statistics. The accuracy is governed by the quality of the calibrationstandard and the accuracy of the calculated stopping powers. The valuesused are from Ziegler [33] and the uncertainty is typically of a few percent.Bragg’s rule [34] is used to calculate the stopping cross-sections of the com-pounds. Tantalum hydride (TaH0.47) is used as a calibration sample for theabsolute hydrogen concentration determination [35].
3 As-deposited film
The hydrogenation of metal gradient thin films depends strongly on their(micro)structure and local composition. Therefore, an extensive character-ization of the lateral gradient as well as of the composition as a function ofdepth after deposition is of primary importance.
In the as-deposited state, MgxAl1−x samples are completely opaqueand have shiny metallic surfaces, on the Pd side as well as on the sub-strate side. The results from RBS measurements are illustrated in fig. 1.For each probed composition x on the gradient sample, the RBS spectrum
4
http
://do
c.re
ro.c
h
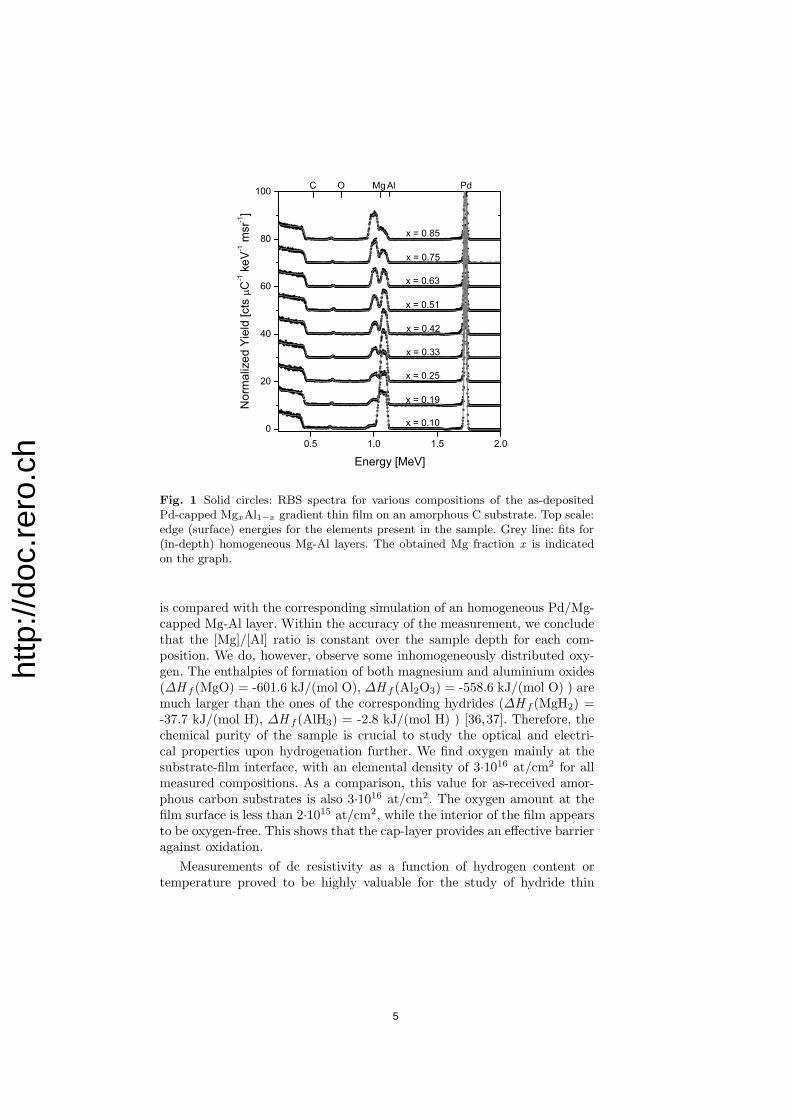
Fig. 1 Solid circles: RBS spectra for various compositions of the as-depositedPd-capped MgxAl1−x gradient thin film on an amorphous C substrate. Top scale:edge (surface) energies for the elements present in the sample. Grey line: fits for(in-depth) homogeneous Mg-Al layers. The obtained Mg fraction x is indicatedon the graph.
is compared with the corresponding simulation of an homogeneous Pd/Mg-capped Mg-Al layer. Within the accuracy of the measurement, we concludethat the [Mg]/[Al] ratio is constant over the sample depth for each com-position. We do, however, observe some inhomogeneously distributed oxy-gen. The enthalpies of formation of both magnesium and aluminium oxides(ΔH f (MgO) = -601.6 kJ/(mol O), ΔH f (Al2O3) = -558.6 kJ/(mol O) ) aremuch larger than the ones of the corresponding hydrides (ΔH f (MgH2) =-37.7 kJ/(mol H), ΔH f (AlH3) = -2.8 kJ/(mol H) ) [36,37]. Therefore, thechemical purity of the sample is crucial to study the optical and electri-cal properties upon hydrogenation further. We find oxygen mainly at thesubstrate-film interface, with an elemental density of 3·1016 at/cm2 for allmeasured compositions. As a comparison, this value for as-received amor-phous carbon substrates is also 3·1016 at/cm2. The oxygen amount at thefilm surface is less than 2·1015 at/cm2, while the interior of the film appearsto be oxygen-free. This shows that the cap-layer provides an effective barrieragainst oxidation.
Measurements of dc resistivity as a function of hydrogen content ortemperature proved to be highly valuable for the study of hydride thin
5
http
://do
c.re
ro.c
h
films [38–40]. At present, our compositional gradient approach also enablesus to measure the resistivity as a function of the metallic composition andthus to gain understanding in the related changes of structure for both theas-deposited and the hydrogenated state.
� ��� ��� ��� ��� ��� �� �� ��� ��� �
�� ���� ����
�ρ [μ
��
]�
�
��
��
��
��
��
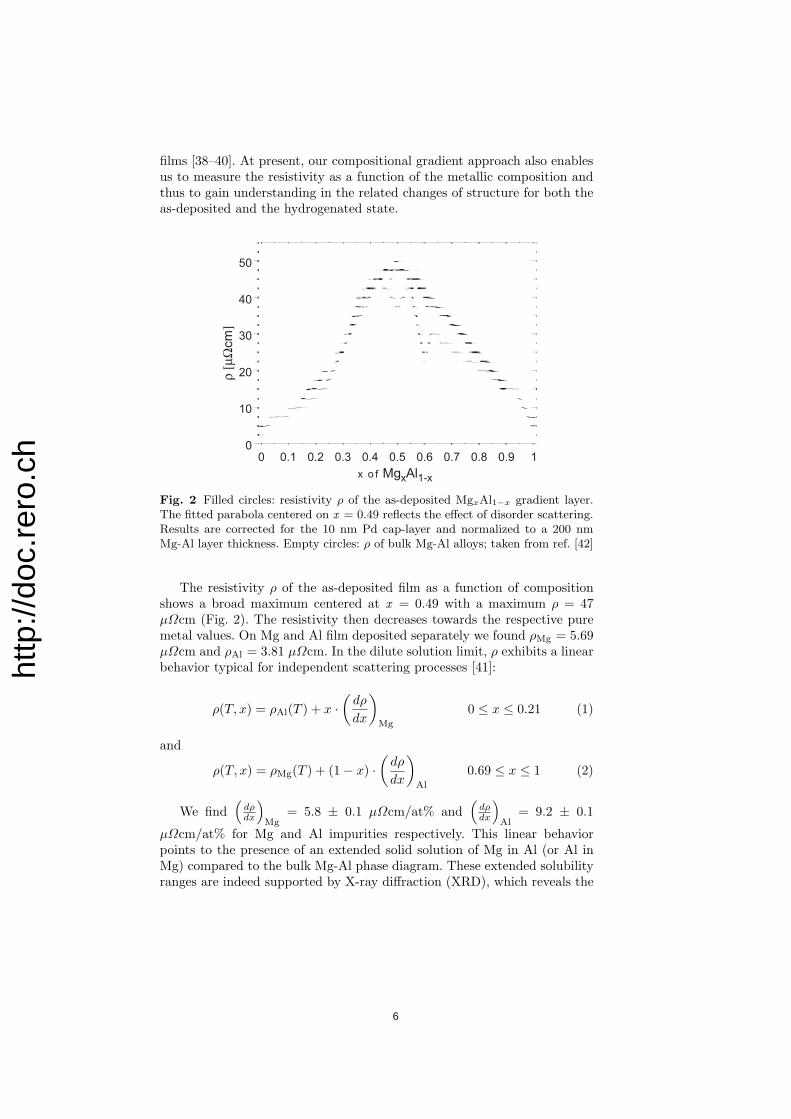
Fig. 2 Filled circles: resistivity ρ of the as-deposited MgxAl1−x gradient layer.The fitted parabola centered on x = 0.49 reflects the effect of disorder scattering.Results are corrected for the 10 nm Pd cap-layer and normalized to a 200 nmMg-Al layer thickness. Empty circles: ρ of bulk Mg-Al alloys; taken from ref. [42]
The resistivity ρ of the as-deposited film as a function of compositionshows a broad maximum centered at x = 0.49 with a maximum ρ = 47μΩcm (Fig. 2). The resistivity then decreases towards the respective puremetal values. On Mg and Al film deposited separately we found ρMg = 5.69μΩcm and ρAl = 3.81 μΩcm. In the dilute solution limit, ρ exhibits a linearbehavior typical for independent scattering processes [41]:
ρ(T, x) = ρAl(T ) + x ·(
dρ
dx
)Mg
0 ≤ x ≤ 0.21 (1)
and
ρ(T, x) = ρMg(T ) + (1 − x) ·(
dρ
dx
)Al
0.69 ≤ x ≤ 1 (2)
We find(
dρdx
)Mg
= 5.8 ± 0.1 μΩcm/at% and(
dρdx
)Al
= 9.2 ± 0.1
μΩcm/at% for Mg and Al impurities respectively. This linear behaviorpoints to the presence of an extended solid solution of Mg in Al (or Al inMg) compared to the bulk Mg-Al phase diagram. These extended solubilityranges are indeed supported by X-ray diffraction (XRD), which reveals the
6
http
://do
c.re
ro.c
h
presence of an hcp Mg phase for Mg atomic fractions x ≥ 0.5 and a fcc Alphase for x ≤ 0.35 [2].
In its central part, the parabolic shape of the resistivity is character-istic for an electron-impurity dominated conduction and reflects disorderin this Mg-Al mixture. There is no indication of the formation of anotheralloy phase at an intermediate composition, neither in the resistivity nor inthe XRD measurements. In comparison, the bulk resistivity (Fig. 2) clearlyshows two dips at approximately x = 0.5 and x = 0.6. This reduced scat-tering is attributed to ordered MgAl and Mg17Al12 phases formed at thesecompositions [42]. The absence of these anomalies in the thin film resistivitysupports our assumption that the MgxAl1−x layer is mainly amorphous inthe 0.5 ≤ x ≤ 0.6 range.
In summary, the resistivity and XRD measurements of the as-depositedfilm reveal highly supersaturated single phase solid solutions of Al in Mg(0.69 ≤ x ≤ 1) and Mg in Al (0 ≤ x ≤ 0.21) and an amorphous or micro-crystalline glassy metal for 0.5 ≤ x ≤ 0.6. For the unspecified regions, weassume a coexistence of the limiting phases. This is consistent with other mi-crostructural studies of Mg-Al coatings deposited by magnetron sputtering[43].
4 Hydrided state
When the as-deposited MgxAl1−x metallic gradient thin film is exposed tohydrogen gas, the hydrides which are likely to form are MgH2 for the Mg-rich part of the gradient and magnesium alanate, Mg(AlH4)2 , at around thecomposition x = 0.33. Indeed, we found indications of the formation of the-ses two phases [2]. However, the distribution of these hydrides as a functionof depth in the film, and hence the segregation occurring between them andthe remaining metallic fraction of the film has not been characterized yet.Nuclear Resonance Analysis (NRA) combined with spectral optical trans-mission measurements give a good understanding of the hydrided part ofthe active layer. Complementary to this, Rutherford Backscattering Spec-trometry (RBS), X-Ray Diffraction (XRD) and conductivity measurementsare used to study the metallic fraction after hydrogenation.
4.1 H-induced segregation
The as-sputtered samples consist of Mg and Al homogenously dissolved inAl and Mg, respectively. As already discussed in section 3, the solubilityrange is larger in thin films than in bulk samples due to the growth process.For most of the compositions, hydrogenation at T = 110 ◦C and pH2
= 1bar forces the system to segregate into the thermodynamically most stablephases MgH2 and Al [18,19].
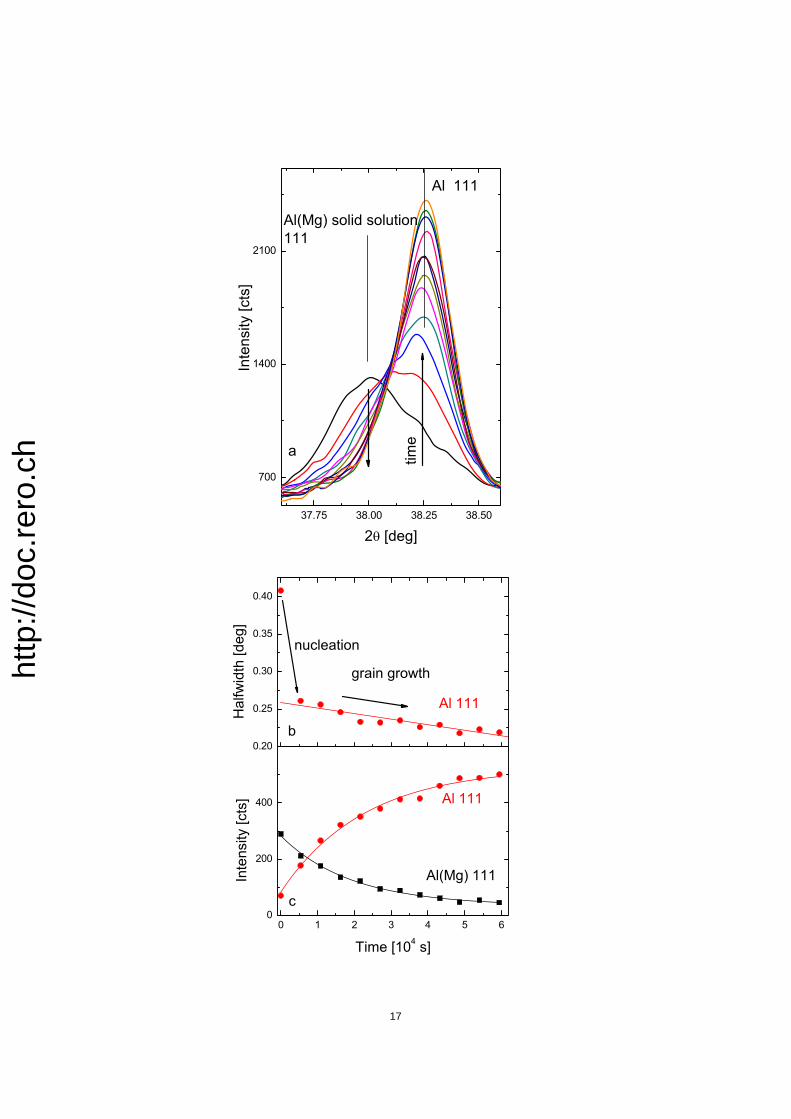
This process is investigated by X-ray diffraction. Figure 3 shows X-raypatterns of a Mg0.2Al0.8 film during hydrogenation. The initial spectrum
7
http
://do
c.re
ro.c
h
Layer Elemental density MgxAl1−x [H]/[M][1015at · cm−2]
Pd Mg Al H x y
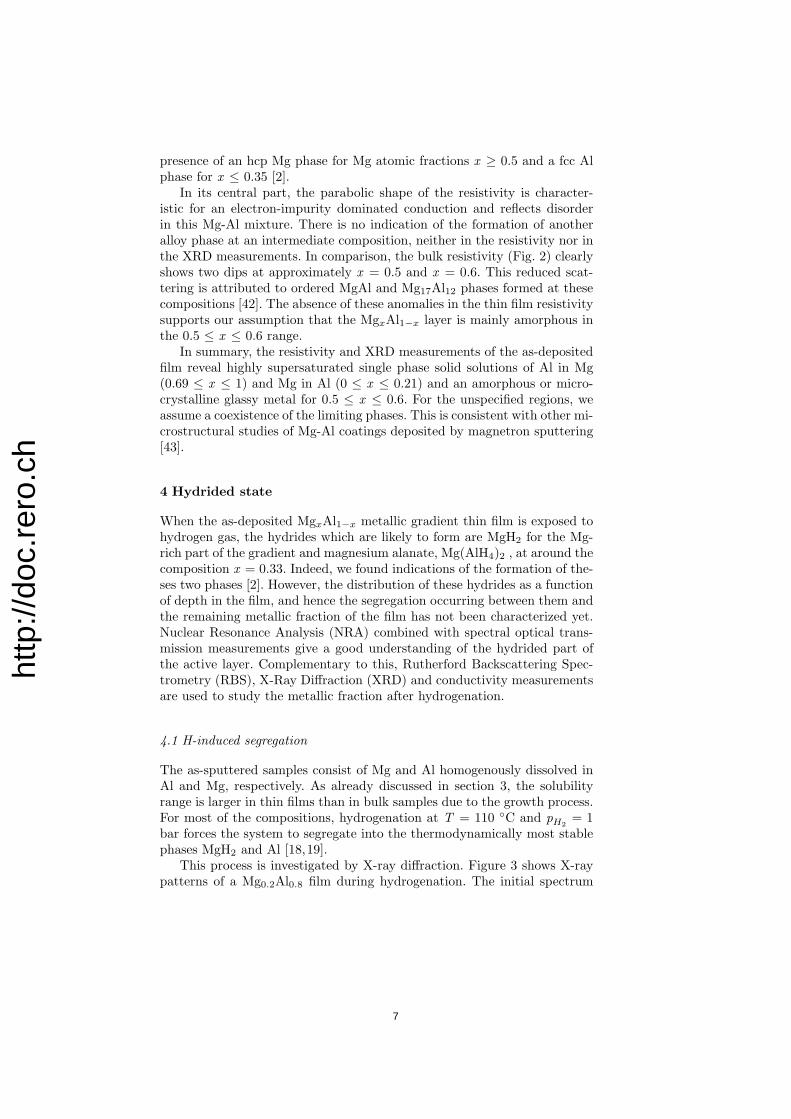
1 68 - - - - -2 1 28 275 41 0.09 0.143 1 36 250 54 0.13 0.194 - 22 110 30 0.17 0.235 - 61 36 73 0.63 0.75
Table 1 Mg0.2Al0.8 after hydrogenation: result of the RUMP modeling of theRBS measurement. Layer 1 represents the Pd cap-layer and 5 the layer closest tothe substrate.
is attributed to a single Al 111 reflection originating from a homogenousAl-phase with a slightly increased lattice parameter due to dissolved Mg.During in situ hydrogenation a second peak evolves, which quickly grows,while the original one disappears (see Fig. 3)). The corresponding latticeparameter of the evolving peak is that of pure aluminium. Thus, we havefollowed the decomposition of Al(Mg) into pure Al and probably MgH2.X-ray peaks of MgH2 have not been detected, presumably due to too smalla grain size of the precipitates.
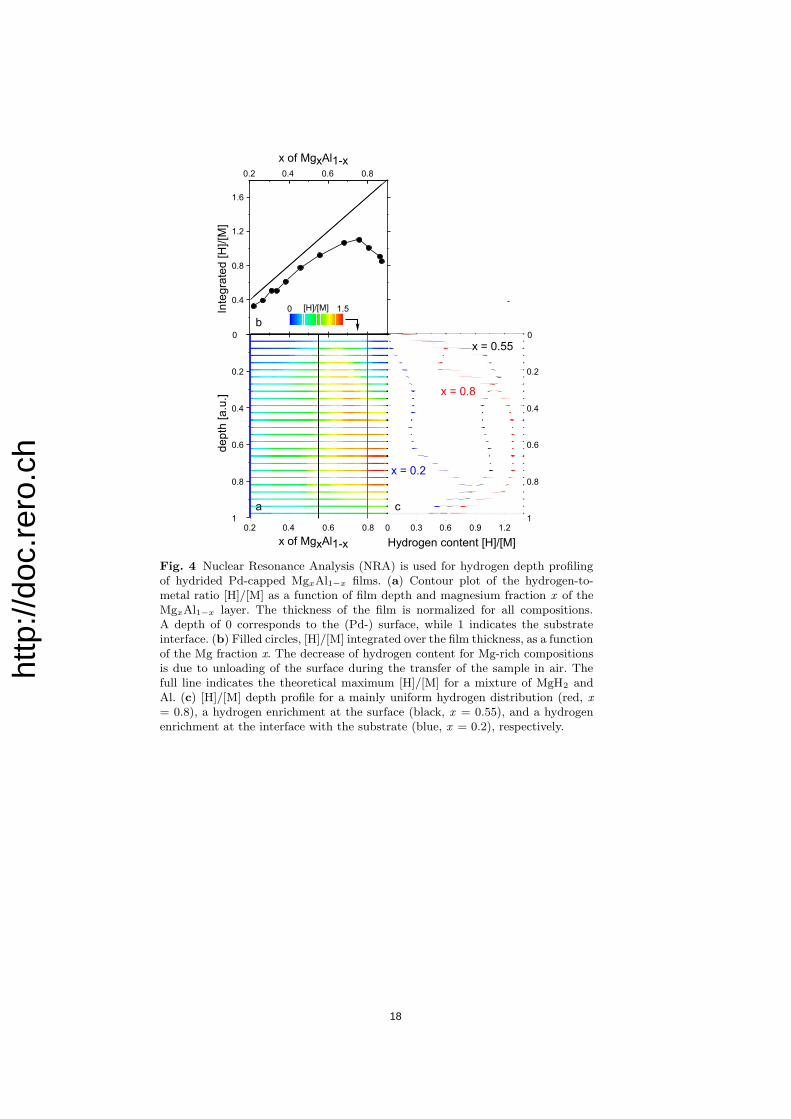
To measure the hydrogen content directly, the hydrogenated MgxAl1−x gra-dient film is probed by NRA. In fig. 4, the data have been compiled into ahydrogen depth profile as a function of the Mg-Al content. It demonstratesthat the hydrogen distribution in the film depends markedly on the alloycomposition x.
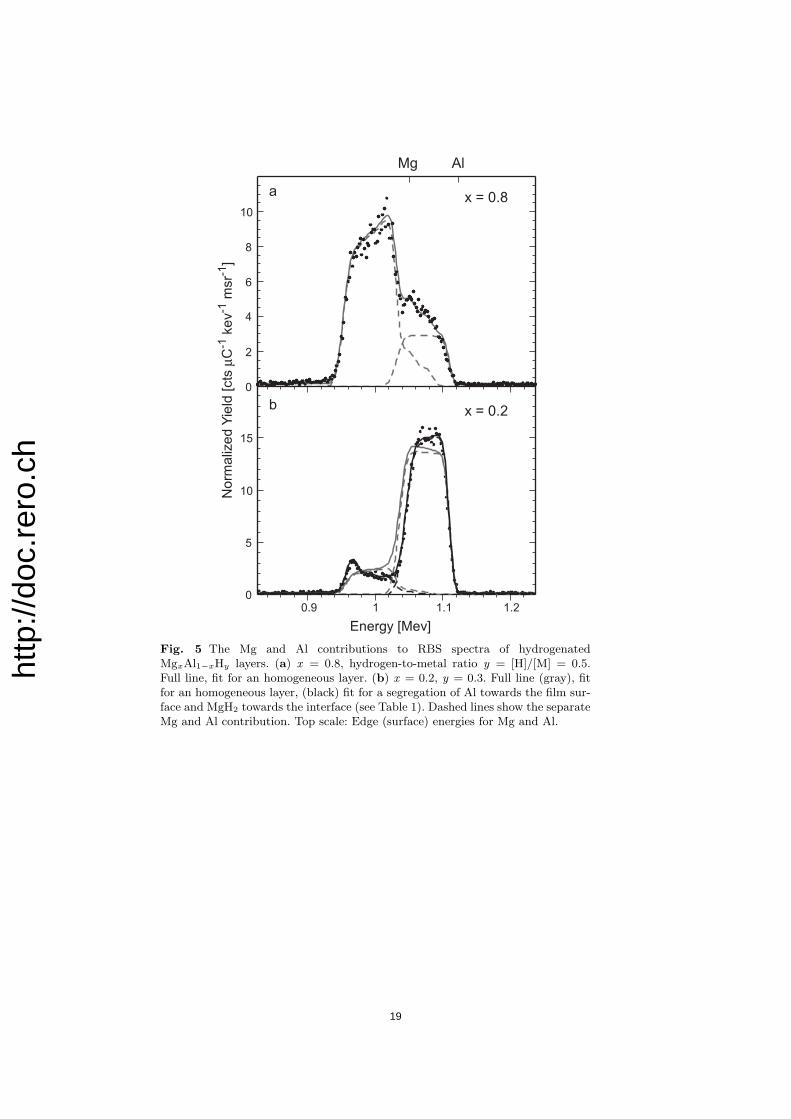
However, without the information of the metal distribution inside thefilm, a distinct proof for the formation of a particular hydride is difficult.RBS can deliver the elemental depth profile of a thin film. For this, we fittedthe RBS spectrum of the hydrogenated film, keeping the total number of Mgand Al atoms as determined in the as-deposited state constant. Furthermore,we implement the hydrogen content determined by NRA in the fit to accountfor the reduction of the (planar) density after hydrogenation. The RBSspectra of a Mg-rich and an Al-rich Mg-Al film after hydrogenation areshown in fig. 5. Mg-rich films with x ≥ 0.5 show a uniform distributionof Mg and Al, while it is clearly evident that Al-rich films (x ≤ 0.2) areenriched in Mg at the interface.
With these two pieces of information we can draw a detailed descrip-tion of the segregation phenomenon in Mg-Al films during hydrogenation.Mg-rich films (x ≥ 0.5) show a uniform distribution of hydrogen and metalatoms. Here, the hydrogen depletion at the surface is due to a partial un-loading of the film during measurement. At these low Al-concentrations, Alis dissolved in the Mg-matrix. During magnesium hydride formation smallAl-clusters are formed (see section 4.2), which are uniformly dispersed in
8
http
://do
c.re
ro.c
h
the MgH2-matrix. The small Al clusters impede the formation of a MgH2-blocking layer [44], and indeed, the kinetics of Al-doped Mg-films is en-hanced compared to pure magnesium. This qualitative explanation is inagreement with the optical and kinetics measurements reported in the nextsection.
At higher Al-concentrations (x < 0.5), the transport of metal atomsbecomes rate-limiting, and the rate constant of the kinetics is of the orderof the diffusion constant of Al in Mg [45]. This explains the slower kinetics atthese Al-contents, since for the nucleation and growth of the hydride moreAl has to be (re)moved. Furthermore, as in similar fcc metals, hydrogendiffusion is very slow in Al [46]. This implies that the observed percolation(see section 4.4) of the top metallic layers hinders further hydrogenation.This would explain the hydrogen enrichment at the surface of Mg-Al filmsfor 0.4 < x < 0.5 (Fig. 4).
However, this explanation does not hold anymore for Al-rich MgxAl1−x films(x < 0.25). Here, a strong hydrogen enrichment at the interface is evident.RBS combined with NRA results clearly indicate a segregation of Al andMgH2 followed by a migration of Al towards the surface and of MgH2 to-wards the interface. Why these phases migrate to different interfaces is notclear yet.
It is worthwhile to note that the reported segregation is purely H-induced. Annealing the as-deposited samples in vacuum at 110 ◦C doesnot produce such compositional inhomogeneities.
Finally, no segregation, and a slightly higher hydrogen content is foundaround the [Mg]/[Al] = 2 ratio (Fig. 4b). This is also corroborated by opticaland electrical measurements (Fig. 6 and 9 ). Interestingly, it is the right ratioto form Mg(AlH4))2, and probably a small amount of it is present in thefilm (see section 6).
4.2 Hydrogenography
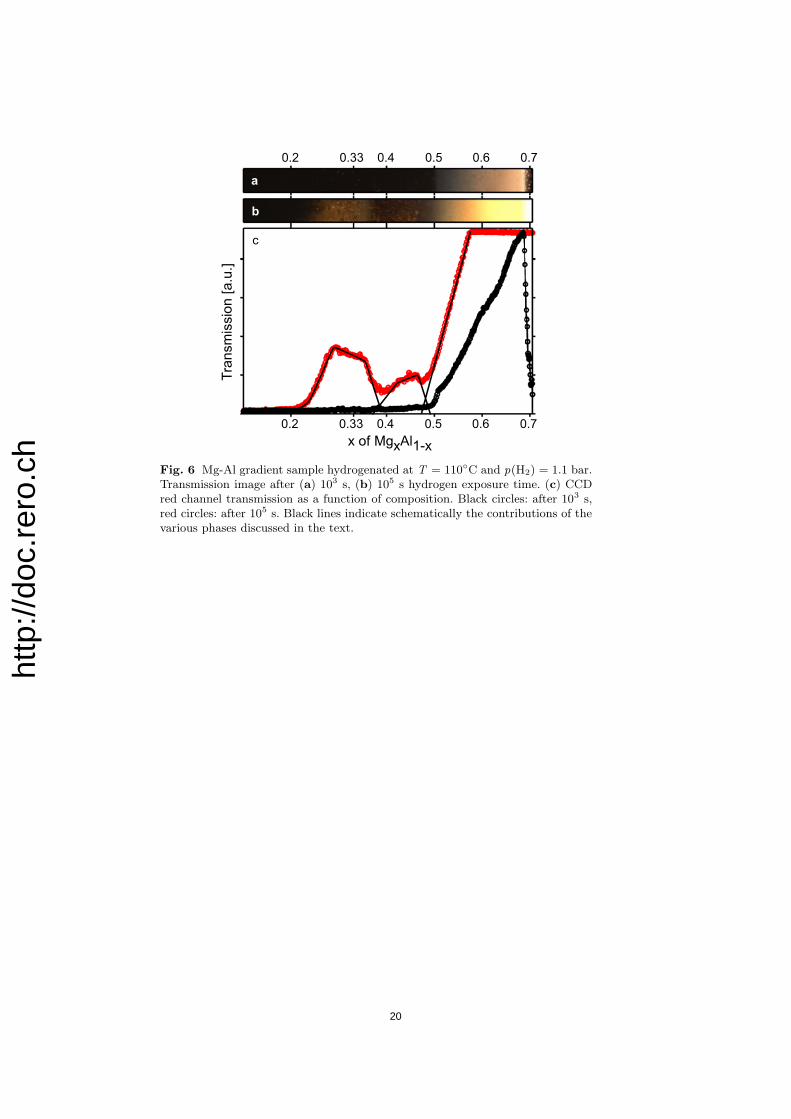
By applying 1.1 bar hydrogen pressure at 110◦C, some regions of the samplebecome transmissive (Fig. 6). After 103 s of hydrogen exposure, MgxAl1−x
with 0.5 < x < 0.69 displays a color neutral transmission (Fig. 6a). It isimportant to note that the segregation processes reported in section 4.1have hardly started yet at this time (see Fig. 3). We assume therefore thatthe film is still homogeneous over its entire thickness. The intensity, which ishighest at x = 0.69, decreases linearly with decreasing Mg content, and hasa cutoff at x = 0.5 (Fig. 6c). We attribute this behavior to the formationof MgH2, which is a colorless insulator with a band gap of 5.6 eV [47].From NRA measurements, the in-depth integrated [H]/[Mg] ratio at thesecompositions is between 1.7 and 1.5. This means that 75% to 85% of theMg is transformed into MgH2. This is in good agreement with Johansson etal., who found similar unreacted Mg fractions in thin hydrogenated Mg-Niwedged films [48].
9
http
://do
c.re
ro.c
h
From the low transmission in fig. 6, we notice that our film is still in-completely hydrogenated for 0.69 ≤ x ≤ 1. In this composition range, itexhibits a hydrogenation behavior similar to that in pure Mg films, whosehydrogen uptake is kinetically hindered by a dense surface layer of MgH2
[49]. This is not astonishing if we consider that in the as-deposited state,our film consists of an extended solid solution of Al in Mg in this range.
For 0.5 < x < 0.69, hydrogenation occurs already within 103 s. Thereare two factors explaining a faster kinetics at these Al-richer compositions:Firstly, Mg crystallinity is decreased due to the presence of the Mg-Al amor-phous phase [50]. Secondly, the presence of Al at the surface of Mg grainswill speed up the hydrogen uptake, as it is the case for surface Ni [5,44,51]or MgOx [52].
Finally, Al-rich compositions (x < 0.5) have not absorbed enough hy-drogen at t = 103 s to exhibit a significant transmission.
After 105 s of hydrogen exposure, Mg fractions above x = 0.69 havehydrided. Furthermore, an additional feature has appeared in transmissionin the Al-rich region (Fig. 6b): a broad peak is present for 0.26 ≤ x ≤ 0.36.This transmission is centered around an [Al]/[Mg] ratio of 2 (x = 0.33),suggesting the formation of Mg(AlH4)2.
4.3 Optical spectra
To clarify the nature of the optical features present in the Al-rich part ofthe sample after 105 s of hydrogen exposure, we measure the transmissionof hydrogenated films from 0.5 to 6 eV. To maximize the transmission, theMg-Al layer is only 40 nm thick, capped with 8 nm of Pd. The samples aredeposited on quartz substrates. The measured spectra are compared withcalculations based on two extreme cases :
1. Homogeneous mixture:For a given composition x, the MgxAl1−xHy sample is an homogeneousmixture of MgH2 and Al. Its dielectric function 〈ε〉 is described by aneffective medium theory if the grain size of the respective particles issmaller than the wavelength of light. We use Bruggeman’s approximationfor spherical particles. 〈ε〉 is then implicitly given by [53]:
fAεA − 〈ε〉εA + 2〈ε〉 + fB
εB − 〈ε〉εB + 2〈ε〉 = 0 (3)
fA,B and εA,B are the volume fractions and the complex dielectric func-tions of the phase A (MgH2) and B (Al), respectively. The transmissionof the Pd-capped Mg-Al layer is then calculated.
2. Layered segregation:The H-induced segregation is fully reached and the sample consists of aPd/MgH2/Al stack.
10
http
://do
c.re
ro.c
h
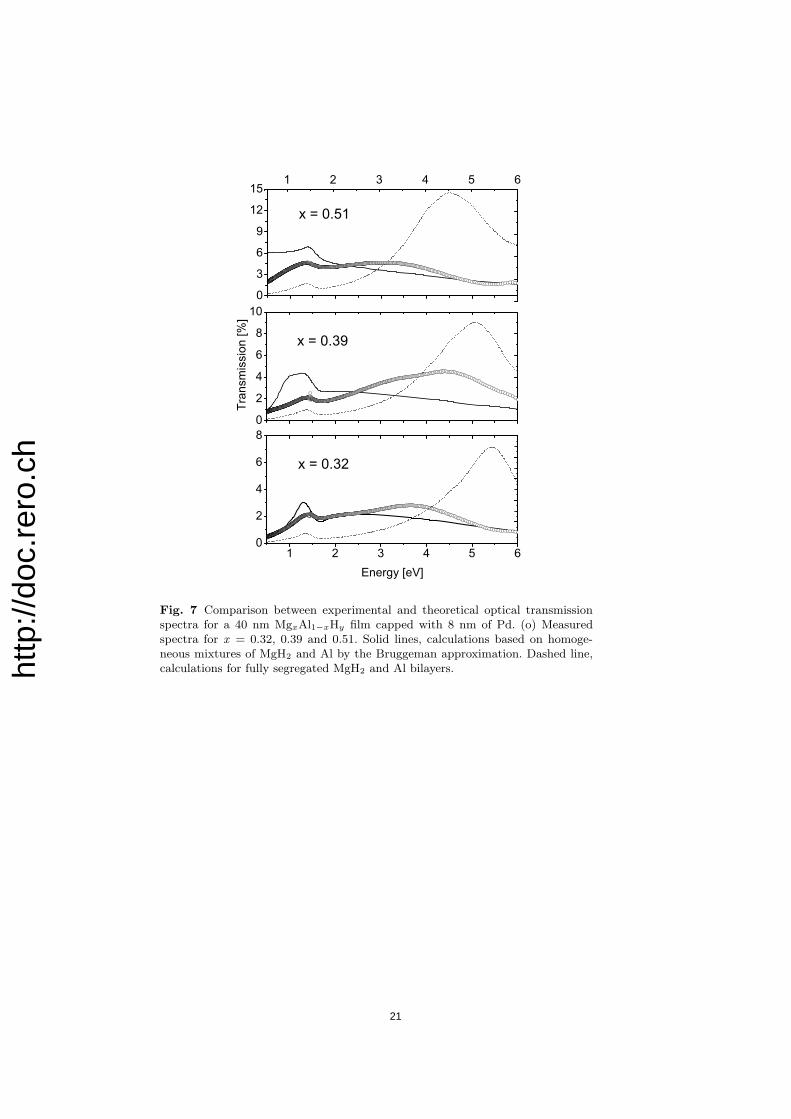
Figure 7 displays the measured and calculated transmission for the com-positions x = 0.32, 0.39 and 0.51. For x = 0.51 and 0.32, the measured spec-trum fits reasonably well with the one calculated for an homogeneous Mg-Al layer. Moreover, calculations of a segregated layer predict a broad peakaround 4.5, or, respectively 5.5 eV, which is not observed experimentally.At an intermediate composition (x = 0.39), we do observe an additionalpeak at high energies (4.5 eV) which can be related to segregation. Notethat the calculations for an homogeneous MgH2-Al mixture yield always alarger transmission than the segregated ones in the visible range (from 1.2to 3 eV), which we use for hydrogen mapping with our CCD. Partly segre-gated MgH2 could then account for the low intensity observed in the 0.39≤ x ≤ 0.5 range (see Fig. 6), while the higher intensity observed around x =0.33 is well fitted by an homogeneous mixture of MgH2 and Al. For higherAl contents (x ≤ 0.2), RBS and NRA measurements (see section 4.1) showthat MgH2 segregates strongly towards the quartz substrate. However, theintensity is too low (< 1%) for an optical analysis.
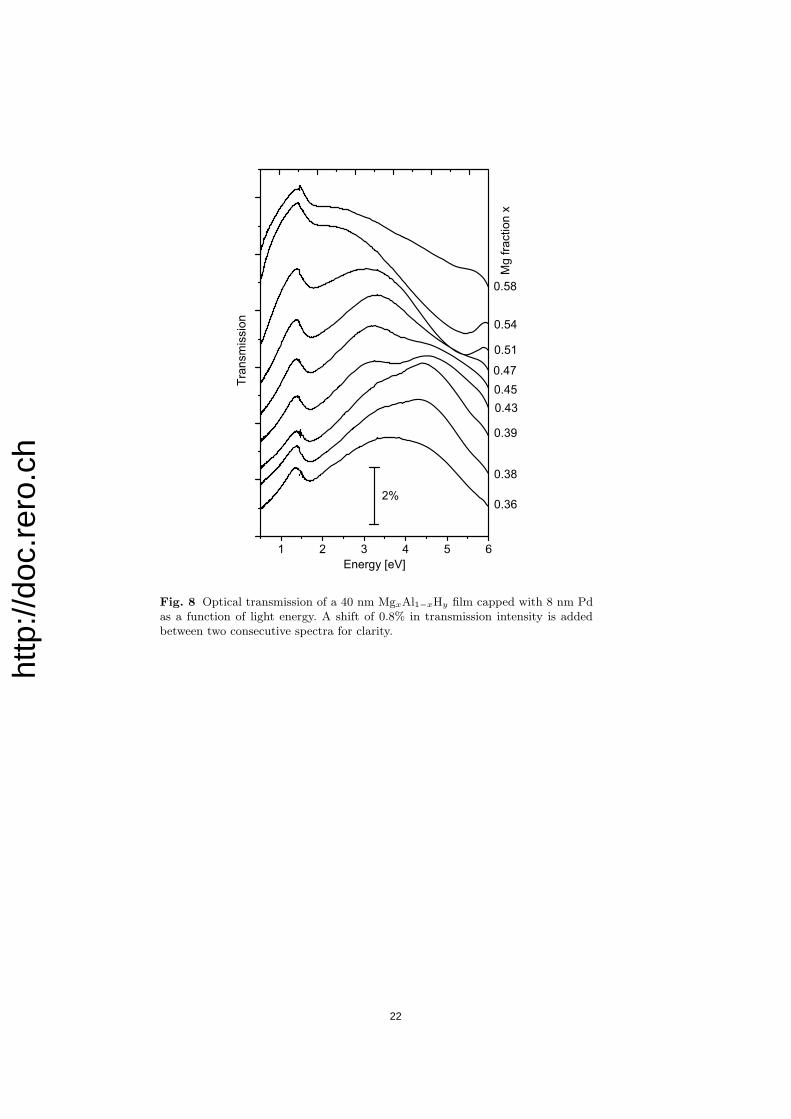
As complex segregation phenomena occur while hydrogenating the Mg-Al gradient, it is difficult to model the exact shape of a transmission spec-trum at a given composition. However, the (non)-occurrence and respectiveposition in energy of the different transmission peaks are characteristic foreach composition. Moreover, for 40 nm films, the interference maxima due tothe layer thickness are approximately 15 eV apart and do not contribute sig-nificantly to the shape of the transmission spectrum. Therefore, each spec-trum becomes a ”fingerprint” of the corresponding composition and givesa qualitative understanding of the process contributing most to the optics.To illustrate this, the transmission spectra in the range 0.36 ≤ x ≤ 0.58 aredisplayed in Figure 8. They can be schematically assigned to three groups:from x = 0.58 to 0.51, the film is homogeneous over its thickness, the peakaround 6 eV for x = 0.51 and 0.54 being the signature for the unreactedMg fraction mixed with MgH2 and Al. From x = 0.47 to 0.38, the peakaround 4.5 eV accounts for the MgH2/Al segregation in the sample. Finallythe sample becomes homogeneous again for a composition x = 0.36.
4.4 Conductivity
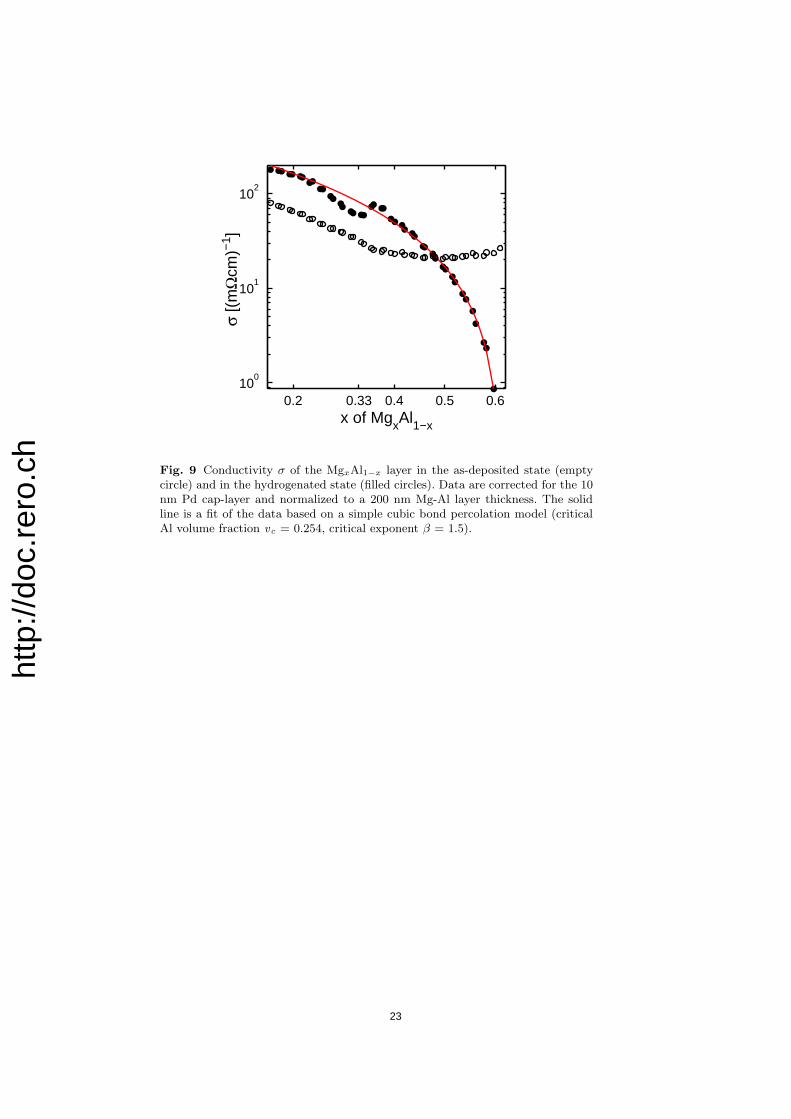
For a characterization of the metallic fraction present in the gradient thinfilm, we study the dc conductivity σ as a function of composition. Figure9 displays σ before and after hydrogenation for 3·105 s at p = 1.1 bar H2
and T = 110 ◦C. As previously mentioned, conductivity variations in theas-deposited state are small because of the metallic nature of the film. Inthe hydrogenated state, it changes drastically: The Mg-rich part becomessemiconducting, with a conductivity below 1 (m Ω cm)−1. A striking fea-ture is the positive conductivity shift in the Al-rich part (0.15 < x < 0.5)after hydrogenation. An increase of the Al grain size would account for thiseffect by shortening the current paths and reducing the intergrain contact
11
http
://do
c.re
ro.c
h
resistances. From XRD measurements we indeed find an increase of the Al111 reflection and a shift of the lattice parameter toward the bulk valueduring hydrogenation (See Fig. 3).
For all Mg compositions x ≤ 0.61, the overall behavior of σ is welldescribed by a power law:
σ ∝ (v − vc)β ∝ (xc − x)β (4)
with a critical volume fraction of Al metal v c = 0.25 ± 0.01 correspond-ing to an atomic Mg fraction x c = 0.61 ± 0.01 and a critical exponentβ = 1.5 ± 0.1. These values are in agreement with a simple cubic bondpercolation model that predicts vc = 0.25 and β = 1.6 ± 0.1 [54,55]. This isconsistent with the conclusion that the sample consists of MgH2 inclusionsin Al.
However, the lower conductivity observed for 0.26 ≤ x ≤ 0.36 is notreproduced by the model of Al percolation in MgH2. The compositionalrange of the conductivity deviation corresponds well to that of the opti-cal transmission feature observed in section 4.2. This indicates that less Alcontributes to the conduction and may be involved in the formation of asmall amount of insulating Mg(AlH4)2 phase. However, no deviation fromthe model is found for 0.4 < x < 0.5. This suggests that the slightly higher,inhomogeneous transmission observed in this range (see Fig. 6) does notinvolve any Mg-Al-H compound and is due to MgH2 which is formed fromthe purely amorphous Mg-Al phase [43]. Theoretical calculations predictMg(AlH4)2 to be a large band gap semiconductor [8,9]. However, the devi-ation in conductivity measured for 0.25 < x < 0.35 is small compared tothe contribution of the MgH2-Al mixture. From measurements of the filmexpansion after hydrogenation, we estimate that less than 5% of the film istransformed into Mg(AlH4)2 .
5 Kinetics
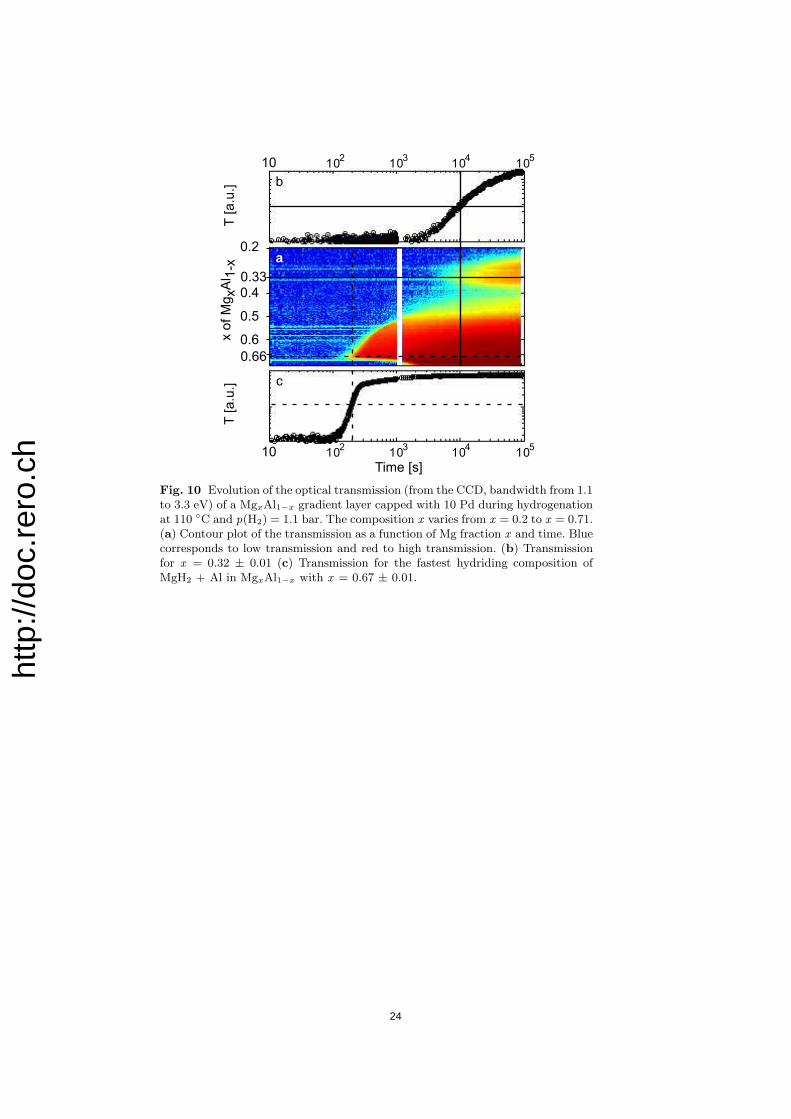
Hydrogenography makes it also possible to follow in detail the kinetics ofhydrogen uptake of MgxAl1−x. Figure 10 (b) gives the temporal evolutionof the transmission upon hydrogenation for 0.2 ≤ x ≤ 0.71. Hydrogenationstarts first at around a nominal composition of Mg2Al after 102 s (Fig. 10c).The transmission extends gradually towards the MgAl nominal compositionbefore 103 s. By comparison with Fig. 6c, we conclude that this transmis-sion lobe is induced by MgH2, with a loading time τ = 200 s for the fastestcomposition at around x = 0.67 (Fig. 10c). Here τ is defined as the timewhere log T = 1/2 log(Tmax), taking the final transmission level Tmax asfully loaded. For Mg fractions higher than x = 0.68, the formation of aMgH2 blocking layer reduces the hydrogenation kinetics substantially andincreases τ to 1.5 · 103 s for x = 0.7. As this change in uptake rate isoccurring at the limit of the Al solubility in Mg, we conclude that an ad-mixture of the amorphous Mg-Al phase to the Mg(Al) phase improves thehydrogenation kinetics dramatically.
12
http
://do
c.re
ro.c
h
As discussed in section 4.1 previously, compositions between x = 0.5 and0.38 still exhibit a low transmission after 103 s because of the H-inducedsegregation of MgxAl1−x into MgH2 and Al. For Al-richer compositions,a second transmission lobe develops at around a nominal composition ofMgAl2 (x � 0.33) (Fig. 10b) with a loading time of 104 s.
We attribute this rise in transmission to an homogeneous mixture ofMgH2, Al and possibly Mg(AlH4)2 (at most 5%). Its slower kinetics is re-lated to the slow diffusion of the metal atoms.
Finally, for composition of x ≤ 0.2, no significant rise in transmissionoccurs. Although MgH2 present in the sample segregates towards the sub-strate (see section 4.1), the thick Al layer on top prevents transmission.
6 Conclusions
Hydrogenography, i.e. the thin film analysis techniques combined with theuse of compositional gradient samples, enables us a detailed understandingof the hydrogenation of MgxAl1−x alloys:
The first important result is that hydrogenation of MgxAl1−x thin filmsoccurs at much milder conditions (p(H2) = 1.1 bar and T = 110◦C) thanin the corresponding bulk samples. Another advantage is that the mappingby optical transmission of the hydrides and the kinetics of the formationthereof is possible throughout the entire film simultaneously. Under theseconditions, MgH2 is found to form at all alloy compositions investigated(0.2 ≤ x ≤ 0.9). An extrapolation of the integrated hydrogen content to-wards Al-richer compositions (see Fig. 4b) shows that MgH2 would formeven in Mg-Al alloys containing a Mg fraction as low as 5%.
However, a comprehensive characterization of the as-deposited film, aswell as the knowledge of the structural changes occurring during hydro-genation are essential for the analysis of the optical measurements. Resis-tivity and XRD measurements as a function of the Mg fraction x in theas-deposited metallic state show that Mg-Al alloys in thin film form donot follow the bulk phase diagram. The extended metallic solubility rangesand the absence of ordered phases in the as-deposited state determine theoverall behavior of the kinetics. The ability to probe an almost continuousset of compositions shows that the best kinetics of hydrogen absorption isachieved for the Mg-richer composition (x = 0.68) containing the amorphous(or nanocrystalline) Mg-Al alloy. This also points out the importance of thinsputtered films as an alternative to ball-milling to obtain glassy metastablephases and therefore to optimize the hydrogenation kinetics.
Although the morphology of the as-deposited film clarifies the kineticsof the Mg-rich part of the sample, it does not explain the complex patternbehavior of the optical transmission observed for Al-rich compositions in thehydrogenated state. Joined NRA, RBS and optical spectra measurementsprovide complementary information on the large-scale hydrogen-inducedsegregation that occurrs at these compositions. The occurrence and direc-tion of the MgH2 migration is found to depend strongly on the Mg fraction
13
http
://do
c.re
ro.c
h
x. For Mg dissolved in the Al lattice (x ≤ 0.21), RBS and NRA measure-ments show clearly that MgH2 strongly segregates towards the substrate. Itis as yet unclear which process triggers the direction of the MgH2 (and Al)migration.
Unreacted Mg, as well as the degree of (in)homogeneity of the wholeMgxAl1−x layer are also detected by an optical transmission-energy spec-trum, even for Mg fractions (0.36 < x < 0.5) for which the segregation ishappening on a smaller scale, and thus is difficult to resolve by NRA. Thisshows the complementarity of optical transmission, that probes directly thefull stack of layers, with depth sensitive ion beam techniques like NRA andRBS. The comparison between measured optical spectra and the simulatedones also explains the low transmission intensity observed during kineticsexperiments for this compositional range. In this case, the starting alloy isan amorphous Mg-Al alloy, and the MgH2 forms preferentially towards thePd surface.
The two above examples show the variety of possible segregation phe-nomena in a single metal-hydride system and the potential of thin filmrelated techniques to study these in relation to the hydrogenation process.
For Mg fractions 0.25 ≤ x ≤ 0.36, the film is found to be homogeneousin depth for both NRA and optical measurements. The observed opticaltransmission would account for a mixture of MgH2 and Al. However, the[Al]/[Mg] ratio of 2, together with the following experimental facts indicatethat a fraction of the whole layer has transformed into Mg(AlH4)2 :
1. The integrated hydrogen content is slightly higher than the normal linearincrease as a function of Mg fraction.
2. An anomalous conductivity behavior points to the presence of an addi-tional semiconducting phase in the layer around x = 0.33.
This investigation of the Mg-Al-H system demonstrates the great potentialof our compositional thin film approach for the search for new light-weightmetal hydride storage materials. The ability to investigate hundreds of alloycompositions in a single thin film, the characterization of their microstruc-ture before and after hydrogen loading and the determination of the mostfavorable kinetics enables us to optimize efficiently complex metal-hydridesystems whose hydrogenation depends on a subtle interplay of thermody-namic stability, atomic diffusion of all constituents and surface catalysis.
Acknowledgements Financial support by the Dutch Foundation for FundamentalResearch on Matter (Stichting voor Fundamenteel Onderzoek der Materie, FOM)through the ACTS ”Sustainable Hydrogen” program and the Swiss Federal Officefor Energy (Bundesamt fur Energie, BfE) is gratefully acknowledged.
References
1. L. Schlapbach, A. Zuttel: Nature 414, 353 (2001)
14
http
://do
c.re
ro.c
h
2. R. Gremaud, A. Borgschulte, W. Lohstroh, H. Schreuders, A. Zuttel, B. Dam,R. Griessen: J. Alloys Compd. 404-406, 775 (2005)
3. M. Pasturel, M. Slaman, H. Schreuders, J. H. Rector, D. M. Borsa, B. Dam,R. Griessen: submitted to J. App. Phys.
4. A. Peles, J. A. Alford, Zhu Ma, Li Yang, M. Y. Chou: Phys. Rev. B 70, 165105(2004)
5. T. J. Richardson, J. L. Slack, R. D. Armitage, R. Kostecki, B. Farangis,M. D. Rubin: Appl. Phys. Lett. 78, 1 (2001)
6. J. L. M. van Mechelen, B. Noheda, W. Lohstroh, R. J. Westerwaal, J. H. Rector,B. Dam, R. Griessen: Appl. Phys. Lett. 84, 3653 (2004)
7. W. Lohstroh, R. J. Westerwaal, B. Noheda, S. Enache, I. A. M. E. Giebels,B. Dam, R. Griessen: Phys. Rev. Lett. 93, 197404 (2004)
8. M. J. van Setten, G. A. de Wijs, V. A. Popa, G. Brocks: Phys. Rev. B 72,073107 (2005)
9. O. M. Løvvik, P. N. Nolin: Phys. Rev. B 72, 073201 (2005)
10. O. M. Løvvik: Phys. Rev. B 71, 144111 (2005)
11. A. Borgschulte, R. J. Westerwaal, J. H. Rector, B. Dam, R. Griessen: App.Phys. Lett. 85, 4884 (2004)
12. A. Krozer, B. Kasemo: J. Less-Common Met. 160, 323 (1990)
13. A. Zaluska, L. Zaluski, J. O. Strom-Olsen: J. Alloys Compd. 288, 217 (1999)
14. G. Liang, J. Huot, S. Boily, A. van Neste, R. Schulz: J. Alloys Compd. 292,247 (1999)
15. J. F. Pelletier, J. Huot, M. Sutton, R. Schulz, A. R. Sandy, L. B. Lurio,S. G. J. Mochrie: Phys. Rev. B 63, 052103 (2001)
16. W. Oelerich, T. Klassen, R. Bormann: J. Alloys Compd. 315, 237, (2001)
17. Y. Song, X. Guo, R. Yang: Phys. Rev. B 69, 094205 (2004)
18. A. Zaluska, L. Zaluski, J. O. Strom-Olsen: Appl. Phys. A 72, 157 (2001)
19. S. Bouaricha, J. P. Dodelet, D. Guay, J. Huot, S. Boily, R. Schulz: J. AlloysCompd. 297, 282 (2000)
20. B. Bogdanovic, R. A. Brand, A. Marjanovic, M. Schwickardi: J. Alloys Compd.302, 36 (2000)
21. A. Zuttel, P. Wenger, S. Rentsch, P. Sudan, Ph. Mauron, Ch. Emmenneger:J. Power Sources 118 1 (2003)
22. B. C. Hauback, H. W. Brinks, H. Fjellvag: J. Alloys Compd. 346 184 (2002)
23. H. W. Brinks, B. C. Hauback: J. Alloys Compd. 354 143 (2003)
24. H. Morioka, K. Kakizaki, S. Chung, A. Yamada: J. Alloys Compd. 353 310(2003)
25. M. Fichtner, O. Fuhr: J. Alloys Compd. 345, 286 (2002)
26. M. Fichtner, J. Engel, O. Fuhr, A. Gloess, O. Rubner, R. Ahlrich: Inorg.Chem. 42, 7060 (2003)
27. L. J. Van der Pauw: Philips Res. Rep. 13, 1 (1958)
28. A. T. M. van Gogh, D. G. Nagengast, E. S. Kooij, N. J. Koeman, J. H. Rector,R. Griessen: Phys. Rev. B 63, 195105 (2001)
29. L. R. Doolittle: Nucl. Instr. Meth. Phys. Res. B15, 227 (1985)
30. http://www.genplot.com
31. L. C. Feldman, J. W. Mayer: Fundamentals of surface and thin film analysis,(Elsevier, New York 1986)
32. W. Lanford, H. Trautvetter, J. Ziegler, J. Keller: Appl. Phys. Lett. 28, 566(1976)
15
http
://do
c.re
ro.c
h
33. J. F. Ziegler: The stopping and ranges of ions in matter, in Handbook ofStopping Cross-Sections for Energetics Ions in all Elements, Vol. 5, (PergamonPress, New York 1980)
34. W. K. Chu, J. W. Mayer, M. A. Nicolet: Backscattering Spectrometry, (Aca-demic Press, New York 1978)
35. B. Hjorvarsson, H. Ryden, T. Ericsson, E. Karlsson: Nucl. Instr. Meth. Phys.Res. B42, 257 (1989)
36. D. R. Lide: CRC handbook of chemistry and physics, (CRC press, 2005)37. P. Claudy , B. Bonnetot, J. M. Letoffe: Thermochim. Acta 27, 205 (1978)38. J. N. Huiberts, R. Griessen, J. H. Rector, R. J. Wijngaarden, J. P. Dekker,
D. G. de Groot, N. J. Koeman: Nature 380 (1996) 23139. I. A. M. E. Giebels, J. Isidorsson, R. Griessen: Phys. Rev. B 69, 205111
(2004)40. S. Enache, W. Lohstroh, R. Griessen: Phys. Rev. B 69, 115326 (2004)41. N. F. Mott, H. Jones: The theory of the properties of metals and alloys,
(Dover Pub, London 1936)42. R. W. Klaffky, N. S. Mohan, D. H. Damon: J. Phys. Chem. Solids, 36 (10),
1147 (1975)43. R. D. Arnell, R. I. Bates: Vacuum 43, 105 (1992)44. G. Friedlmeier, M. Groll: J. Alloys Compd. 253, 550 (1997)45. C. J. Smithells: Smithells Metals Reference Book (7th Ed.), (Butterworth-
Heinemann, Oxford 1992)46. Y. Adda, J. Philibert: La diffusion dans les solides (Presses universitaires de
France, Paris 1966)47. J. Isidorsson, I. A. M. E. Giebels, H. Arwin, R. Griessen: Phys. Rev. B 68,
115112 (2003)48. E. Johansson: Synthesis and characterization of potential hydrogen storage
materials, (Acta Universitatis Upsaliensis, Uppsala 2004)49. J. Ryden, B. Horvarsson, T. Ericsson, E. Karlsson, A. Krozer, B. Kasemo:
J. Less-Common Met. 152, 295 (1989)50. K. Higuchi, H. Kajioka , K. Toiyama , H. Fujii , S. Orimo, Y. Kikuchi: J.
Alloys Compd. 293-295, 484 (1996)51. F. G. Heisenberg, D. A. Zagnoli, J. J. Sheridan: J.Less-Common Met. 74, 323
(1980)52. P. Hjort, A. Krozer, B. Kasemo: J. Alloys Compd. 237, 74 (1996)53. G. A. Niklasson, C. G. Granqvist: J. App. Phys 55, 3382, (1984)54. D. Stauffer, A. Aharony: Introduction to percolation theory, (Taylor and Fran-
cis, London 1994)55. S. Kirkpatrick: Rev. Mod. Phys. 45, 574 (1973)
16
http
://do
c.re
ro.c
h
17
http
://do
c.re
ro.c
h
������
������
�������
����������������� �!" �!
��� ��� ������
� ��� �!" �!
������ ����
���
#�$
� %
�&�!
�
��
���
���
���
���� ��������
��� ��������
���
���
��
���'�
����%
���
� �
!" �
!
������ ����
�
��
���
���
���
�
(
% �
Fig. 4 Nuclear Resonance Analysis (NRA) is used for hydrogen depth profilingof hydrided Pd-capped MgxAl1−x films. (a) Contour plot of the hydrogen-to-metal ratio [H]/[M] as a function of film depth and magnesium fraction x of theMgxAl1−x layer. The thickness of the film is normalized for all compositions.A depth of 0 corresponds to the (Pd-) surface, while 1 indicates the substrateinterface. (b) Filled circles, [H]/[M] integrated over the film thickness, as a functionof the Mg fraction x. The decrease of hydrogen content for Mg-rich compositionsis due to unloading of the surface during the transfer of the sample in air. Thefull line indicates the theoretical maximum [H]/[M] for a mixture of MgH2 andAl. (c) [H]/[M] depth profile for a mainly uniform hydrogen distribution (red, x= 0.8), a hydrogen enrichment at the surface (black, x = 0.55), and a hydrogenenrichment at the interface with the substrate (blue, x = 0.2), respectively.
18
http
://do
c.re
ro.c
h
)������ ��*!
+�
��%
�,-�
��.
,���
� ��/
�μ0
���1
�*
����
/���
!
��� � ��� ����
�
��
��
�
�
�
�
��
�� ��
������
������
%
(
Fig. 5 The Mg and Al contributions to RBS spectra of hydrogenatedMgxAl1−xHy layers. (a) x = 0.8, hydrogen-to-metal ratio y = [H]/[M] = 0.5.Full line, fit for an homogeneous layer. (b) x = 0.2, y = 0.3. Full line (gray), fitfor an homogeneous layer, (black) fit for a segregation of Al towards the film sur-face and MgH2 towards the interface (see Table 1). Dashed lines show the separateMg and Al contribution. Top scale: Edge (surface) energies for Mg and Al.
19
http
://do
c.re
ro.c
h
��� ���� ��� ��� �� ��
��� ���� ��� ��� �� ��
2�%
�/�
,//,�
��
%�&
�!
�
�
�
������ ����
Fig. 6 Mg-Al gradient sample hydrogenated at T = 110◦C and p(H2) = 1.1 bar.Transmission image after (a) 103 s, (b) 105 s hydrogen exposure time. (c) CCDred channel transmission as a function of composition. Black circles: after 103 s,red circles: after 105 s. Black lines indicate schematically the contributions of thevarious phases discussed in the text.
20
http
://do
c.re
ro.c
h
Fig. 7 Comparison between experimental and theoretical optical transmissionspectra for a 40 nm MgxAl1−xHy film capped with 8 nm of Pd. (o) Measuredspectra for x = 0.32, 0.39 and 0.51. Solid lines, calculations based on homoge-neous mixtures of MgH2 and Al by the Bruggeman approximation. Dashed line,calculations for fully segregated MgH2 and Al bilayers.
21
http
://do
c.re
ro.c
h
Fig. 8 Optical transmission of a 40 nm MgxAl1−xHy film capped with 8 nm Pdas a function of light energy. A shift of 0.8% in transmission intensity is addedbetween two consecutive spectra for clarity.
22
http
://do
c.re
ro.c
h
0.2 0.33 0.4 0.5 0.610
0
101
102
σ [(
mΩ
cm)−
1 ]
x of MgxAl1−x
Fig. 9 Conductivity σ of the MgxAl1−x layer in the as-deposited state (emptycircle) and in the hydrogenated state (filled circles). Data are corrected for the 10nm Pd cap-layer and normalized to a 200 nm Mg-Al layer thickness. The solidline is a fit of the data based on a simple cubic bond percolation model (criticalAl volume fraction vc = 0.254, critical exponent β = 1.5).
23
http
://do
c.re
ro.c
h
2,��� /!��
���
���
���
���
���
�������
���
��
��
��
���
� �
� ��
2�
%�&
�!2
� %
�&�!
���
���
���
�����
(
�
�
Fig. 10 Evolution of the optical transmission (from the CCD, bandwidth from 1.1to 3.3 eV) of a MgxAl1−x gradient layer capped with 10 Pd during hydrogenationat 110 ◦C and p(H2) = 1.1 bar. The composition x varies from x = 0.2 to x = 0.71.(a) Contour plot of the transmission as a function of Mg fraction x and time. Bluecorresponds to low transmission and red to high transmission. (b) Transmissionfor x = 0.32 ± 0.01 (c) Transmission for the fastest hydriding composition ofMgH2 + Al in MgxAl1−x with x = 0.67 ± 0.01.
24


![[XLS] · Web view79 0 79 79000 79 79332 79 79085 79 79005 79 10051 79 79328 79 79148 79 10061 79 79476 79 79971 79 79045 79 79772 79 79301 79 79333 79 79154 79 10018 79 79101 79 79335](https://img.pdfslide.us/doc/110x75/5adf13517f8b9a6e5c8bad58/xls-view79-0-79-79000-79-79332-79-79085-79-79005-79-10051-79-79328-79-79148-79.jpg)


![Naruto 598 [manga-worldjap.com]](https://img.pdfslide.us/doc/110x75/568c2c2a1a28abd8328c92de/naruto-598-manga-worldjapcom.jpg)