Embed Size (px)
Citation preview
T 123.072
AUTBORITLE'
INSTITUTION
PUS prtzNOTE
AVII4ABLE
EBBS PRIC.T.,DESCRIPTORS
IDERTIEIEPS
ABST?-1CT
. DOCOEUT 4ESUN3
SE 020-t16
_Cosler,*Norma, E8.Individualized Bath Problems in Graphs'and Tables..Oregon VozTech-Bathematics Problem Sets.-Oregon Bath Education Council, Salem.; .Oregon StateDept. of Education, Sales-. Career and VocationalEducatioi Section.
119p.; Por related documents, see SE 020 628-848;'Occasional Barginal LegibilityContnuing _Education Publications, P.01"3oz 1491,Portland,,:Oregon 97207
.
BP-S0.83 Plus Postage. le Not Available froa_pRS_AlGraphs; Individualized Instruction; *InstructionalBaterials; Bathematical Applications: flatheaaticsEducation; *Problem Sets: Secondary Education;*Secondary School.Bathematics: Tables (Data);*Vocational Education r
*oregOn To Tech Bath Project
This is one of eighteen sets of individual4iedmatheiatics problems developed by the Oregon To-fech lath Project.
. Each of these problem packages is organized around A mathematicaltopic and contains prohlems_relateeto diverse .vocations. Sotutionsape provided for all Orobleas: Problemi involving the constructionand interpretation of graphs and tables are presented in this volume.These:prbblems are dravt,from five'vocational areas: forestry,Aarketing, clerical work, diesel mechanicsr,and food processing.Cm) / .
1 .1
1
*0******************************************************************0* Documents acquired by ERIC include many informal unpublished *
* materials not available from other sources. ERIC makes everyieffort lr. * to obtain the best aopy available. Nevertheless, items of marginal t
* reprodpcibilityare often encountered and this affects the quality* of the microfiche and hardcopy reproductions ERIC sakes available ** via the ERIC Document Reproduction Service (EDRS) . EDRS is not cl.
* respongible for. the quality of the original document. Reproductions(** supplied by ORS Are the best that can be made fro's the otiginai. ::*
********************,*******Ilm*****************************************
.. , . .
. 467.07$9744 op .3
..i
' . .41 s eg***14AtirtOr sLAsir
I OW-M* A wit* ..* I19910014. oftEratrrE Or
LOOCASION
*S 001:40 ksEo sat EE Eft AE IMO.
lltrirrwrOorOlt011*,0*-00.4r---... At..--060E10 E*.AC 1. AS *EEC "AO 60V yrh v ipt, v? IINCOOdtt Of Vs( WO* OPV.044. 9.0si }'Ors .csti. lb.:17001u .041 or OE 01E Owt A 04 *OS. 00. 0* 0. S' .
..tt.....10;St* TE 0 00 * *E< I S$A0.. V *E**E-
filiktl"
rr-r-r.-''i
----
L INDIVIDUALIZED
sLEARNIN-6
SYSTEMS
4
6 .
Individualized Math Problems in
Graphs & Tables. I.
Oregon Vo-"ach Mathematics Problem Sets
t
...
4E V1 St .:. '; 2EPZ::.E .. I':',:4S :.:E r.: VA.EB 4. BY 44,CRO6 6C4SE CALY .4, ef f A S>4 -E'. 9
. -.3.1.:0- Hargis -
....: EP t .,:.: P.t.pi.r.I776---,1*p7.4...:4s, :4.* E foe* N's * -.. E .44' ^ ra, %:' .. E o E*.:4- C.-t,..E* *E***V.E*% ...;'S *E
t E EEL sS-E Rec..RES PEENS':,.. Cr E ts*.* *0...E *
We
t
...
alit DerwerireCo 10.i Scribe'4' Laiwrow tow ratLoam tram V =asst
Syor...rdehOrVberic 1011VIgn
t Project °nett Or-0ell"twelringentonnBenton Community College
E.sDireCtOeaten NielsenLonBenton COmminit College
Wr.serS -_tenet AndersonSouthwestern Oregon College
Ted BoyTreasure Valley Community College
Richard ClaudsonTreasure Valley Community College
Bud CookLane Community College
Kay EltingChemeketa Community College
Gene EnfieldSprague 1:irgh School
Bobby FonneriPortland Community College
Don GallagherCentral Oregon Community College
Harold HauserBlue Mountain Community College.
Al HendricksenMarshield High School
EditorNorma Cosier
ConsultantJerry LudlowState Department of EatCation
WritersFran, haolirdapRogue Community CollegeWoody LaSrueurCanby High SthooHenri LindPortland Communit ColiegefArke MorganLann.Benton Community College
Harrison PlattClackamas Community CollegeBill RenoRoseburg High Salo 01
Merlin SatterChemeketa Community CollegeKen ThomasonUmpqua Community CollegeFrank WeeksNtt Ho Od Community College
Assistant EditorsBob MackMike Long
Graphic ArtistRo Se Davis
Typo SlsTina HaleShelley Mack
ff
Individualized Learning Systems
MATHEMATICSGraphs Si TablesCopyright Pending - 1974
' State Department of Education
I
The 110S3 SCh001 tOr ih,s project pas Linn-Benton CornrnuPity,Cot lege Albany Dreg/6n Thtrr0 }eit has fun edDi t.rorr sources me Oregon Math Education Council ialEti and mrough Part Si FWeral Feeds Older contractf)r the Division of instructional SupoortCareer Education Oregon State DeciartrVent ol Edi.scaiion under theauthority 01 the vocational Education Act of 1963 as amended in 1968 oz,esi.ons fhgarci^g use freor.-Muct ion ofdual ablllty of these materials should;ke addressed to me Curricu:urn Cooidinator State Qepartmen! cfEducation 942 Lancaster Drive NE Salem Oregon 97310
3
GRAPHINGLevel /I
A. Problems with complete solutions.
rorestry
).4
Iv
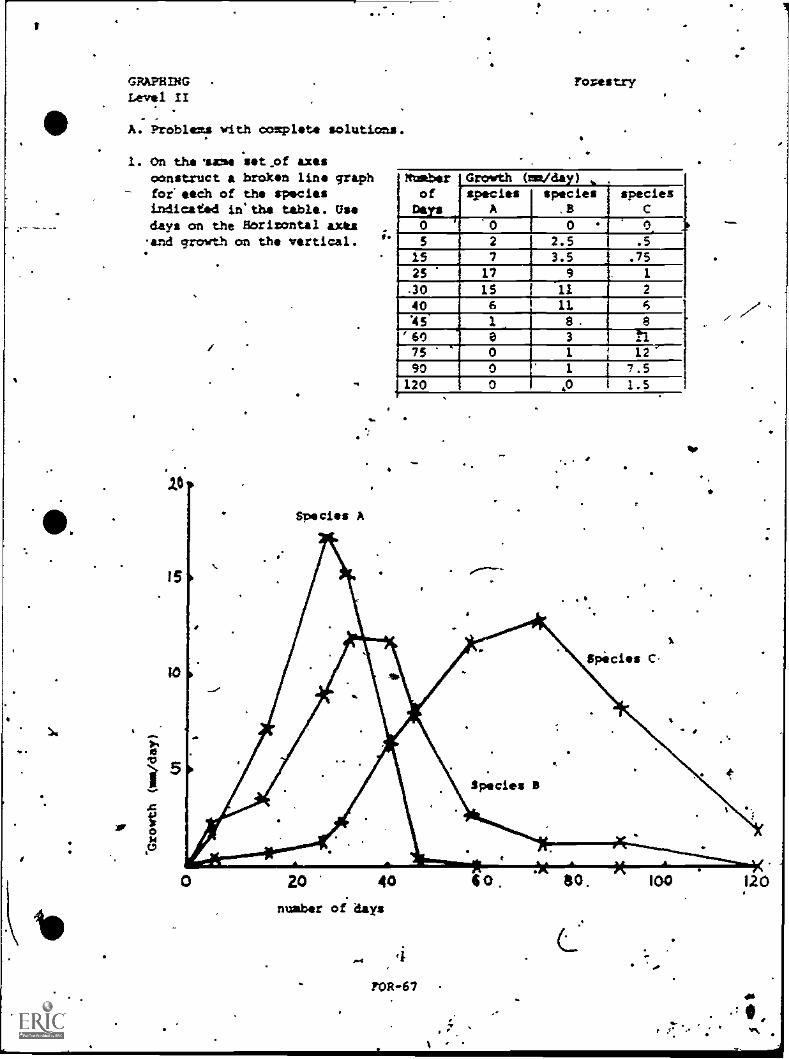
1. On the A44 set of axesconstruct a broken line graphfor each of the speciesindicated in' the table. Usedays on the Sorisontal axlesand growth on the vertical. g'
Species A
Numberof
Days
Growth (ma/day) , .
speciesA
species.1
speciesC
0 i 0 0 0,
5 2 2.5 .5
15 7 3.5 .75
25 17 9 1
30 15 11 2
40 6 11'45 1_ 8. 8
-----I1' so a 3 1
75 0 1 I 12--
90 0 1 I 7.51 120 0 40 1 l -5
20 40 60. 40. 100 120
nuabar of days
TOR -67
GRAPHING ForestryLevel II .
B. Problems AdthoUt solutions:
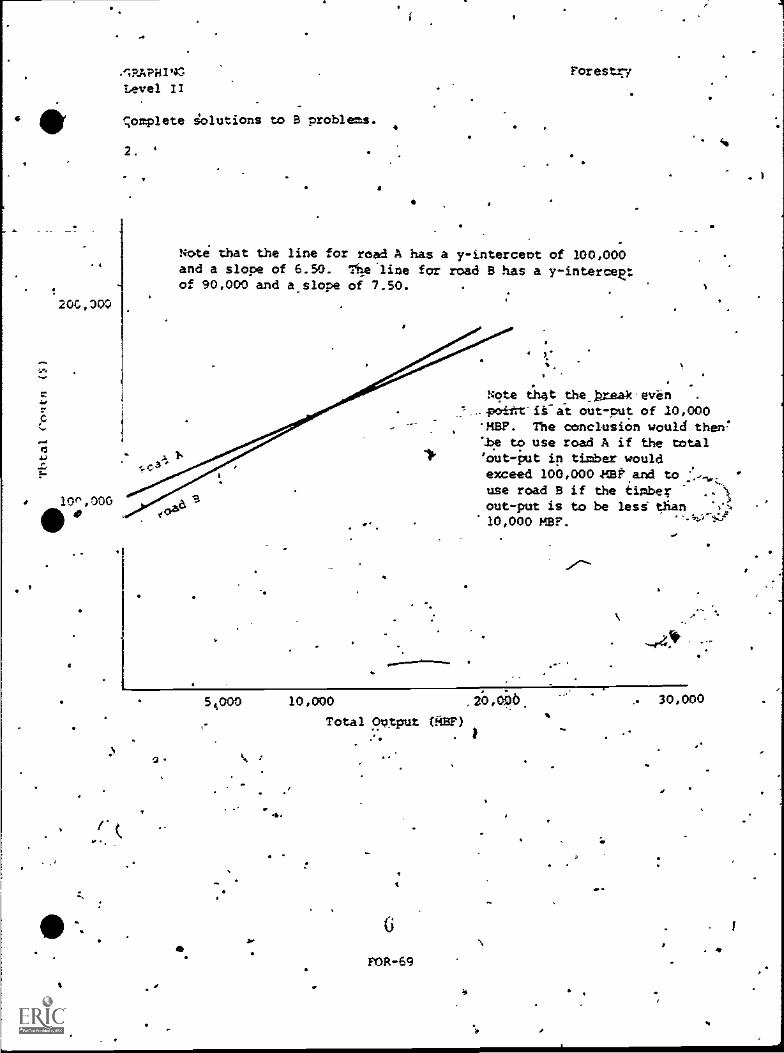
2. Qften, in a timber sale, to reach the timber it 'is necessary toconstruct a Logging road. There are two types of roads to consider:type A which has an initial cost of $100,000 and type B which costs$90,000. Since type A is a better road, hauling costs are onlyS6.50/M Bdft as compared with S7.50 fit. Belft on the type B road.Determine the break even point (in M Sdft hauled) on the two roadsby craphinq a straight line for each road, usimestotal cost op thevertical axis and total output (M Belft) on the.horizontala.mis.
I
POP 6/i
I
5f
4
I
a
20C,300
10r*, 000
S.
.;RAPHI4S
Level II
Complete solutions to 3 problems.
2.
Forestry
Note that the line for read A has a y-intercept of 100,000and a slope of 6.50. he line for road B has a y-interceRtof 90,000 and aslope of 7.50.
Note that thebzeak even_.7._...poiltriiat out-tut of 10,000
'HEW. The conclusion would therwl.
'be to use road A if the totalA Is 111" 'out-put in timber would
1,3- .
exceed 100,000 and to .......,...
use road B if the tiober .. \
out-put is to be lesi tfian "1!_;-
10,000 MB?. -..4:,-1:-F
,.,g
51000 10,000 ,2b,opo.
Total Output (RBF)
FOR -69
a-
30,000
1
I.
GRAPHS.
1
atpacAL FOR GRAPH PPOBLES
7
Marketing
1
7
PAR-62
1,1
or
r--11
GRAPHS 4
'Level 1
A. Proble:A vith SolutionsQ - .
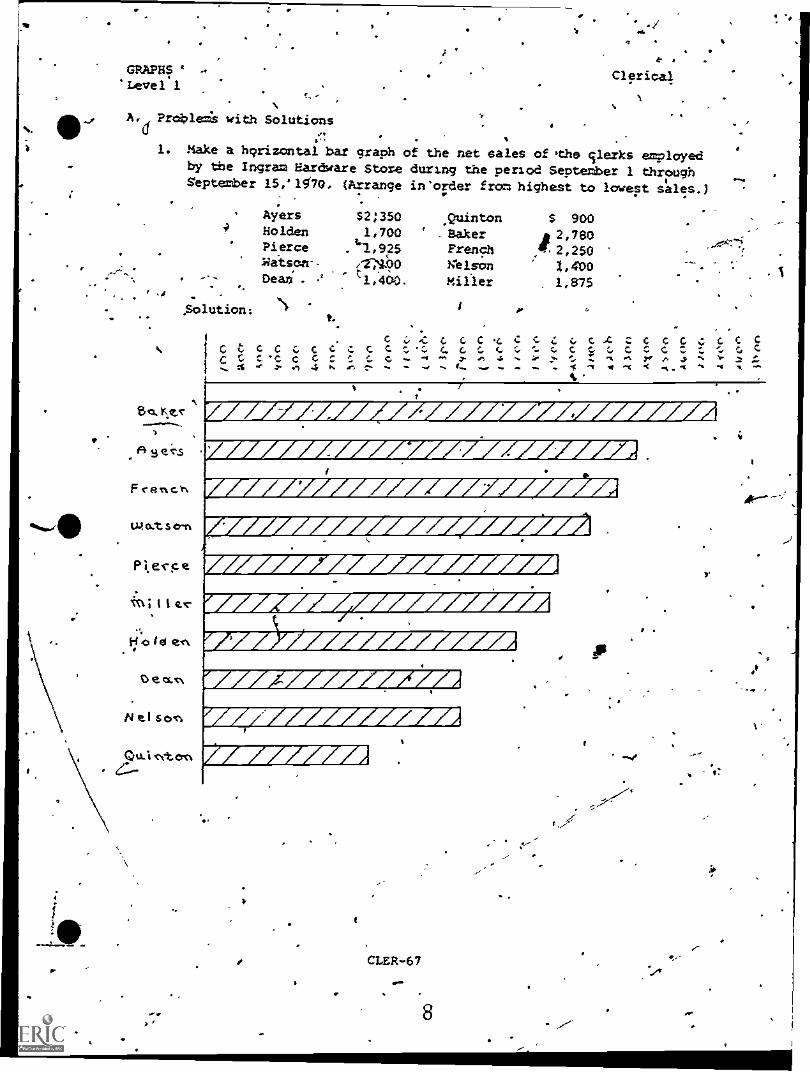
1. Make a horizontal bat graph of the net sales of 'the clerks employedby the Ingram Hardware Store during the period SepteMber 1 throughSeptember 15,'1940. (Arrange in'order from highest to lowest sales.}
Ayers S2;350 ,Quinton $ 900Holden 1,700 ,
_Baker Al2,780Pierce . /1..925 French "11.2,250liatsen-- /2-3130 gels= 3.4'00Dean . t
1,400, Milder 1,875
r .
Clerical
Solution; -
a. lytv----
Ryes
F e%c
IA at ers%
Pkel-ce
NNi I t tr
1;1 .o lel e..
t.
CC Cel $ I'C t'C
.P
C C CC C C4 c
C C L CC
4C C
,
Wd FA WA g r1//Ag ILA V. A 0!
r UP/ /L//iWrA/
ir/rMAI AKWAV Ar /A I PI P2
I/A I A
p
CLER -67
8
F
GRAPHSLevel 1
^
1.
noble= '41th Solution s (continued).
Clerical
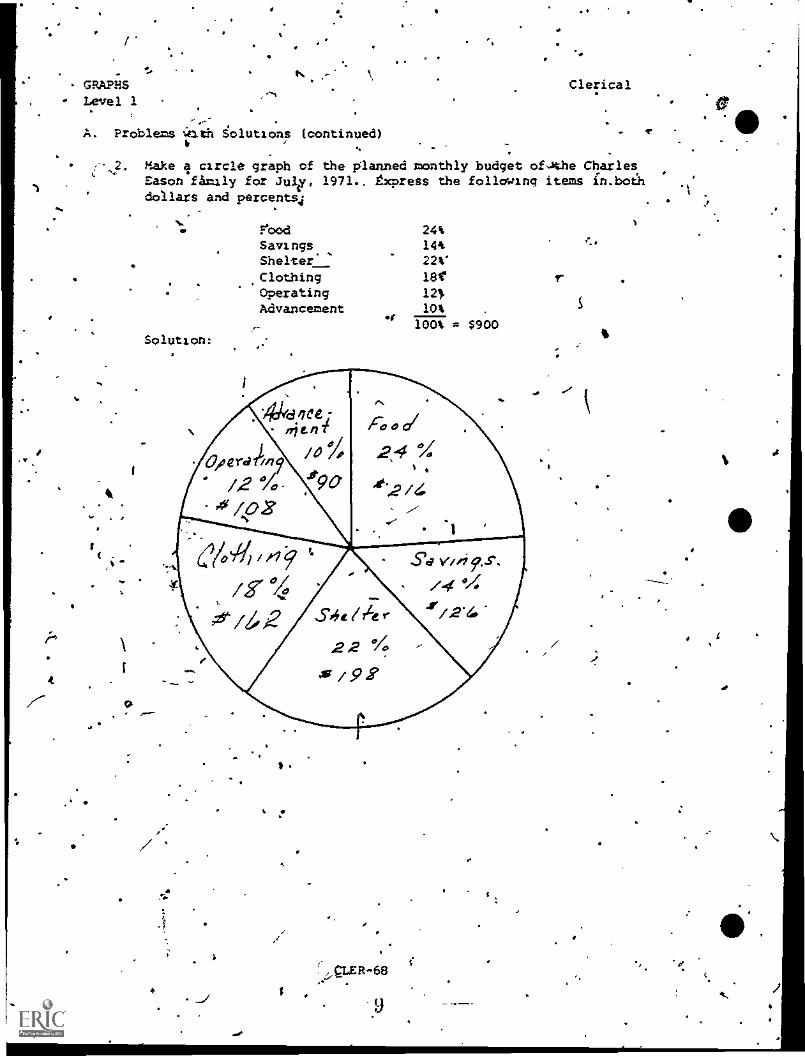
,- 2. Make a circle graph of the planned monthly budget ofJthe CharlesEason famaly for July, 1971.. txpress the following items inbothdollars and percents4
rood 24%Savings 14%Shelter" 22%'
Clothing letOperating 121.
Advancement 10%
9
Solution:
.$100% = $900
rS
41)
I
.4
CIE R -68
9
ie
fop
1,,
GRAPHS '4
Leve11 4
A. Problems with Solutions (continued)
-Clerical
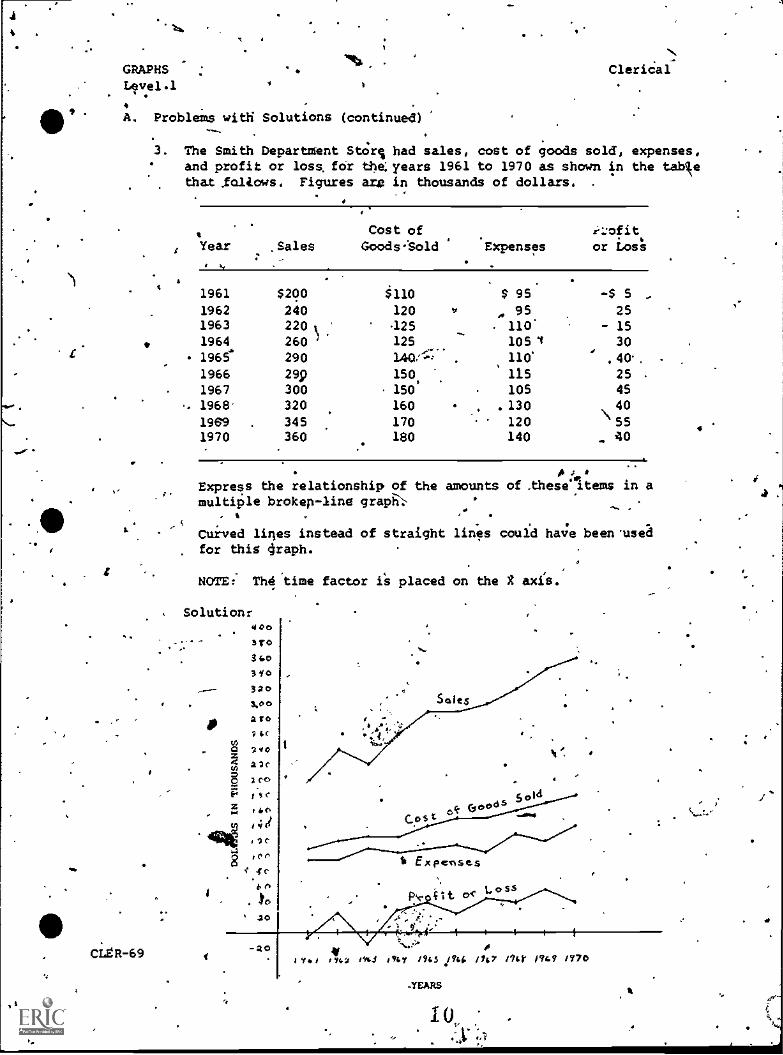
3, The Smith Department StOr% had sales, cost of goods sold, expenses,and profit or loss, for the:years 1961 to 1970 as shown in the tablethat Ibliows. Figures are in thousands of dollars. .
Year ,Sales
Cost ofGoods'Sold Expenses
izofit,
or Loss
1961 $200 110 S 95 -$ 5
1962 240 120 , 95 251963 220 4 25 110 - 151964 260 1 125
-105 1 30
1965 290 3,40,:::' 110'.
.40..
1966 299 150, 115 25 .
1967 300 . 150 105 45
, 1968 320 160 .130 40
1969 345 170 120\
SS 41970 360 180 140 40
CLER-69
Express the relationship of the amounts of _these Items in amultiple brokep-line grapes '
. 4 , .
Curved lines instead of straight lines could have been usedfor this 4raph.
NOTEi Th4 time factor placed on the axi's.
Solution:400
srodSim31*
32*3,00
a TO
2 ifNO 240
a2c
o 2c0
pi0
41141
441olf
8icy
yin. to
2*
Soles
t ExPes15"
LoS5
20I 94.4 *Yile 494J inn /Us int. 047 //or 1949 1770
.YEARS
4 3
GRAPtSLevel 1
A!. Problems with SolutionsAcontinu4Le ""
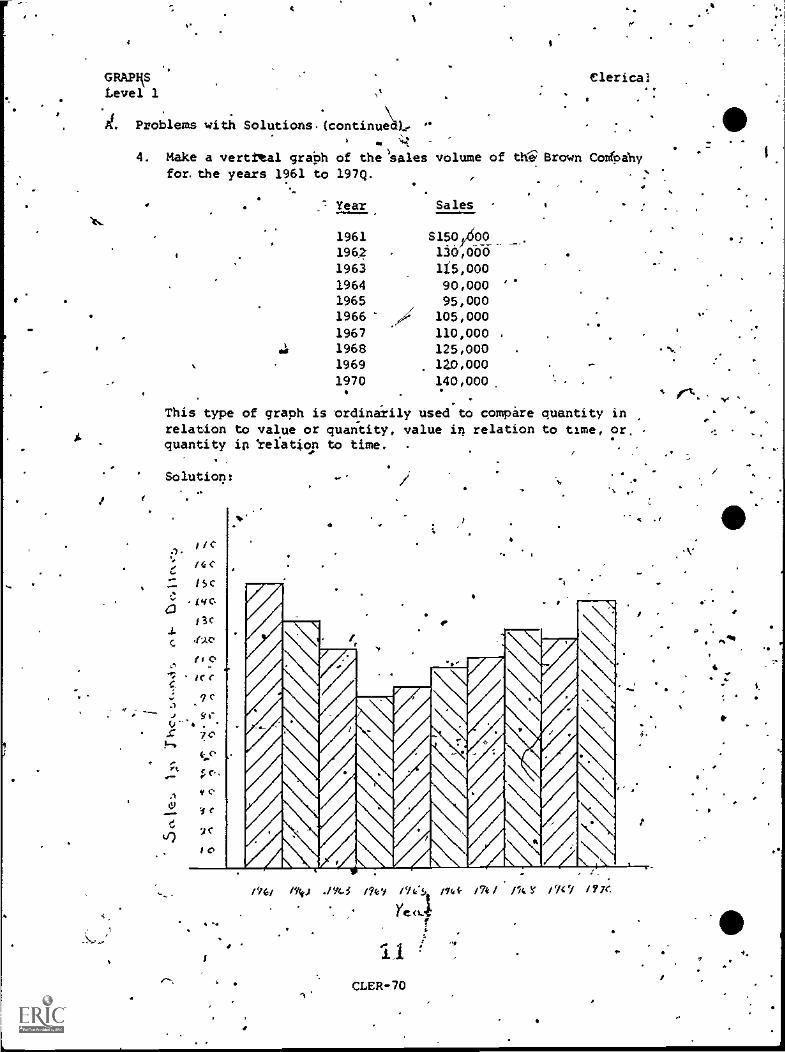
4. Make a vertical graph of the'sales volume of th Brownfor the years 1961 to 197Q.
1 Year Sales
1961
196.
1963
$150,400130,000
ll5,0001964 r90,0001965 95,0001966 105,000
1967 110,000 .
125,0001969 120,000
1970 140,000.
Clerical
Con(pahy
This type of graph is ordinarily used to compare quantity inrelation to value or quantity, value in relation to time, or,quantity ip tefatiop to time.
Solution:
- <
./741 /Stej . /%. / 7 c'&1
Ye 0.4
f
CLER-70
4
-
o
.
t.
.
GRAPHS
Level 1I
A. Problems with Solutions (continuL):
-
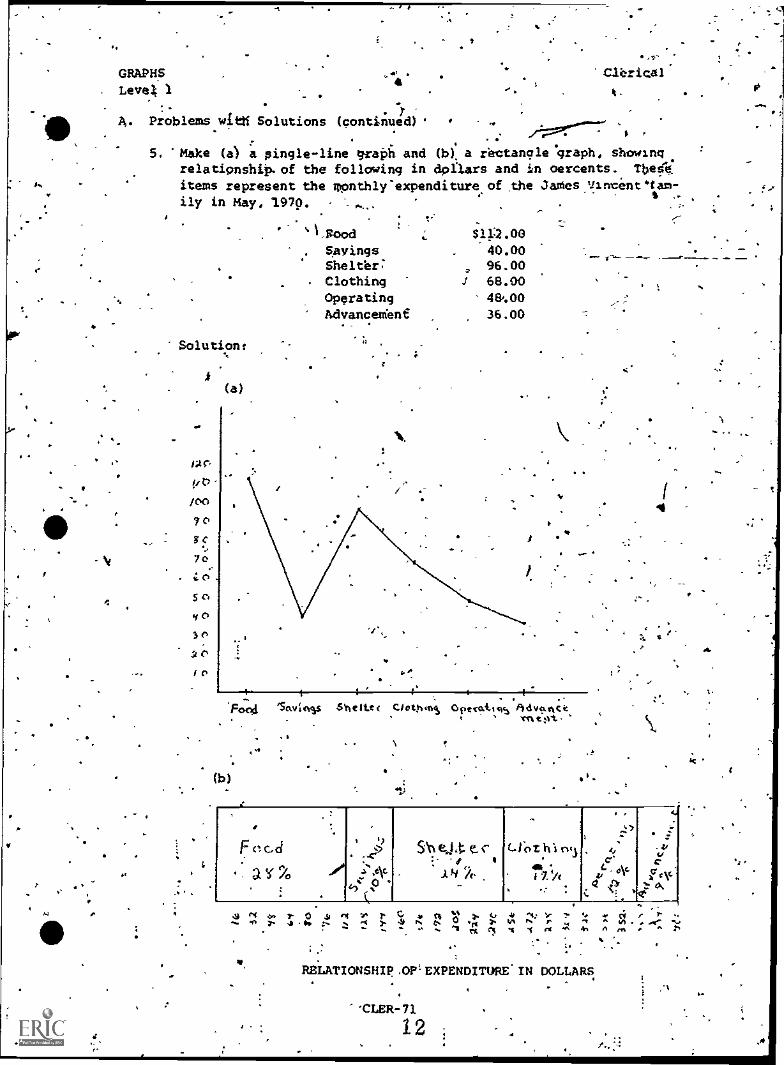
5. Make (a) a pingle-line weal and (bi a rectangle graph, showingrelationship. of the following in dollars and in oercents. Tbe6:items represent the monthly-expenditure of the JainesVincentnt am-ily in May, 1979. , . ,'
1.Food
SavingsShelterClothingOperatingAdvancedeni
Solutions
J(a)
or
1.
$142.0040.0096.00
J 68.0048,.00
36.00
it
'pool `Say e.ss Sh cite cloth', Open:J.14)y Pi d$142AckMtfAt,"
(b) '
r
,
'
.. .
F Ct C,ci
, a' /0. .
.4if
1.1(
?
..)c,41C0 ..
SV ej,t e, r- e
. A 4 2.
I
-
(-lot hi n4seli 7. `A
......z
is,-
1. 4AGs i4 0 ...._ .
z. s(.
0), cv
I.; 0,%- -I
4 ar4Y1-0 r4 c st, ''.c; 4., -» ,4g ). 4 P. 4. N 4,4
^I rit 1 1 rg 4, A eft
RELATIONSHIp.OPEXPENDITUREIN DOLLARS
'-CLER-71
12
.
,ti
AC
;
GRAPMSLevel 1
B. . Problems Without .Solu;ions
Clerical
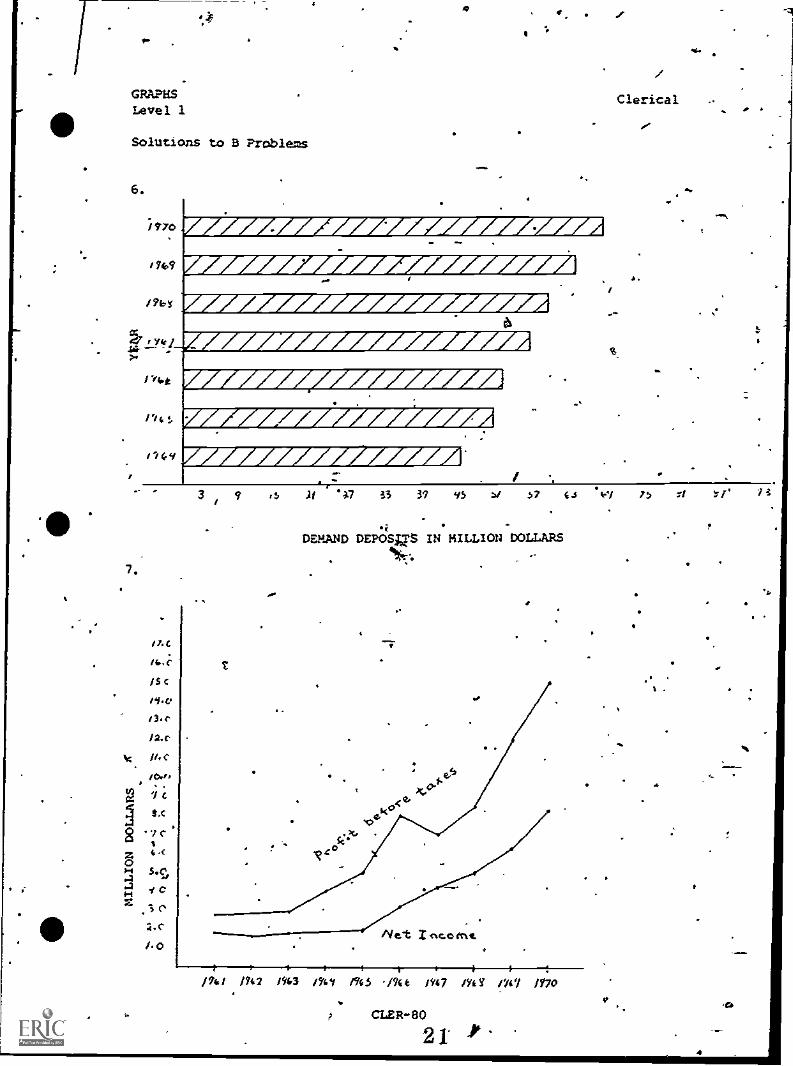
6. A bank has had yearly increases in.
4its diMamd deposits since 1964.Show the demand deposits in.horizontal form. The deposits were$45 million -1964, $56 million-1965, $52 tdilian-1966, $61967, $59 million-1968, $64 pillion-1969. and'S68
Solution:
7.
,
. ..
A hotel company that has expanded rapidly Wishes to p t its profitbefore taxes and'net profit on a line graph for the annual stock-holders' report. Profits before taxes in the millions for .1961
through 1970 were: 2.75, 2.8, 2.95, 4, 5, 8, 7, 8.5, 12 and 15.Net incomesin the millions for 1961 through 1970 were: 1.75, 4.6n,
1.75', 1.85, 1.9, 3.1, 4.2, 5., 6.25, and 8:25. Plot the profits.
Solution:
. .
...
.c % :i. 3
,; , %
CELR-72
t
4
4.
.
4:
GRAPHSLevel 1
8. Problems Without Solutions 4continued,
Clerical
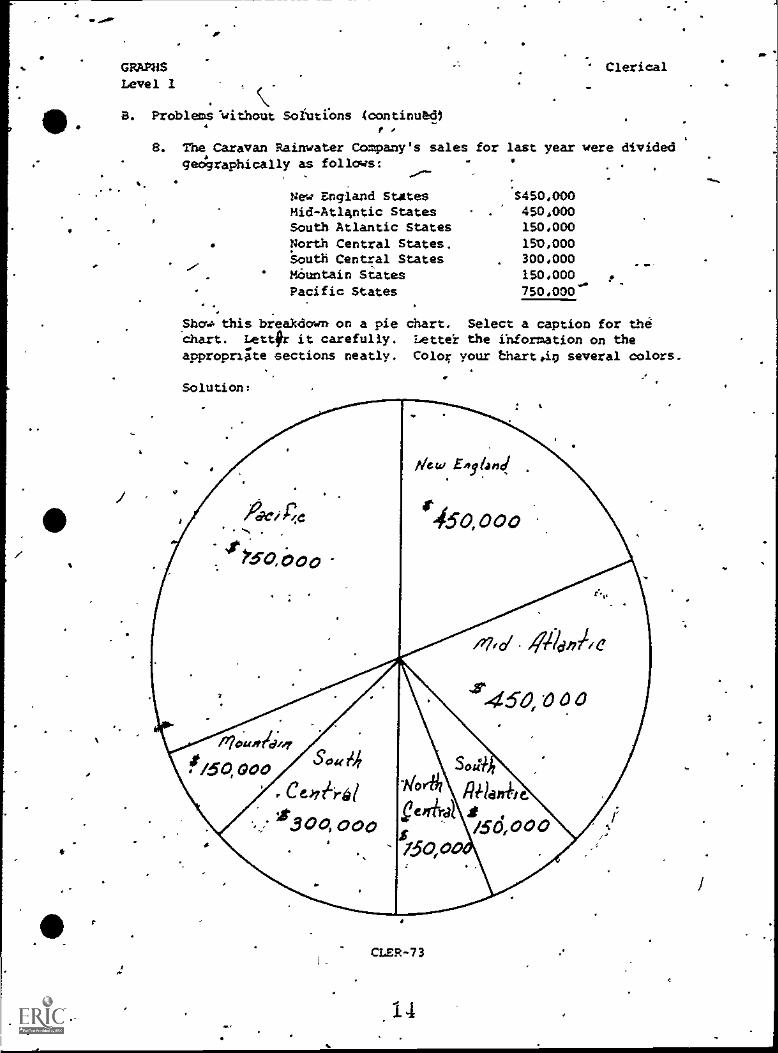
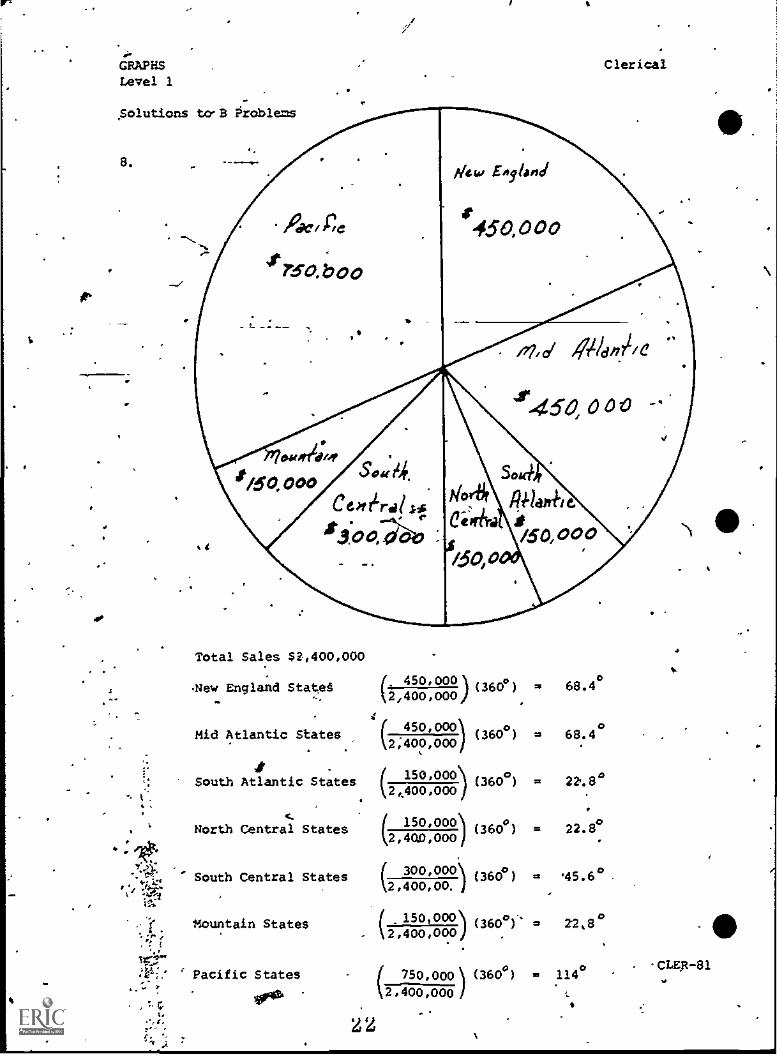
8. The Caravan Rainwater Company's sales for last year were divided. geographically as follows: .
....--
New England States .S450,000
Mid-Atlantic States . 450,000
,
e
South Atlantic States 150,000
. North Central States, 150,000South Central States 300,000.
Mountain States 150,000
Pacific States 750,000.°
4
I
Show% this breakdown on a pie chart. Select a caption for thechart. Letter it carefully. Letter the ihtormation on theappropriate sections neatly. Color, your Ehart,ig several colors.
Solution:
CLER -73
/15
GRAPHSLevel 1
Clerical
8, Problems without Solutions (continued) -
=Jr
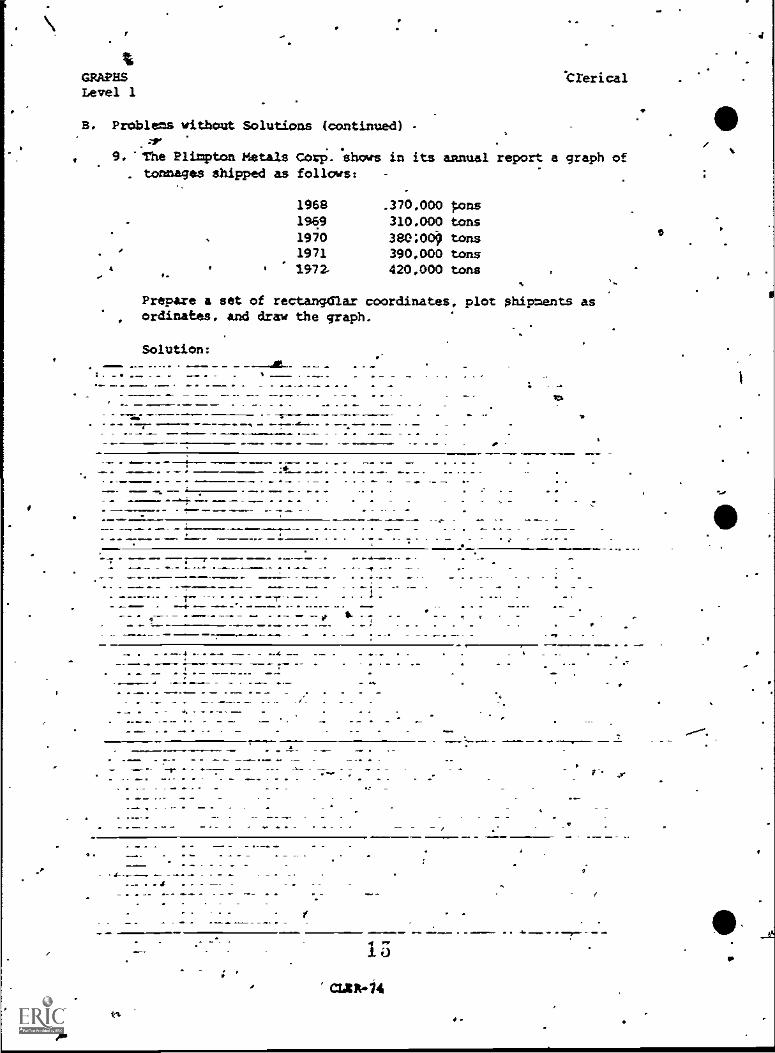
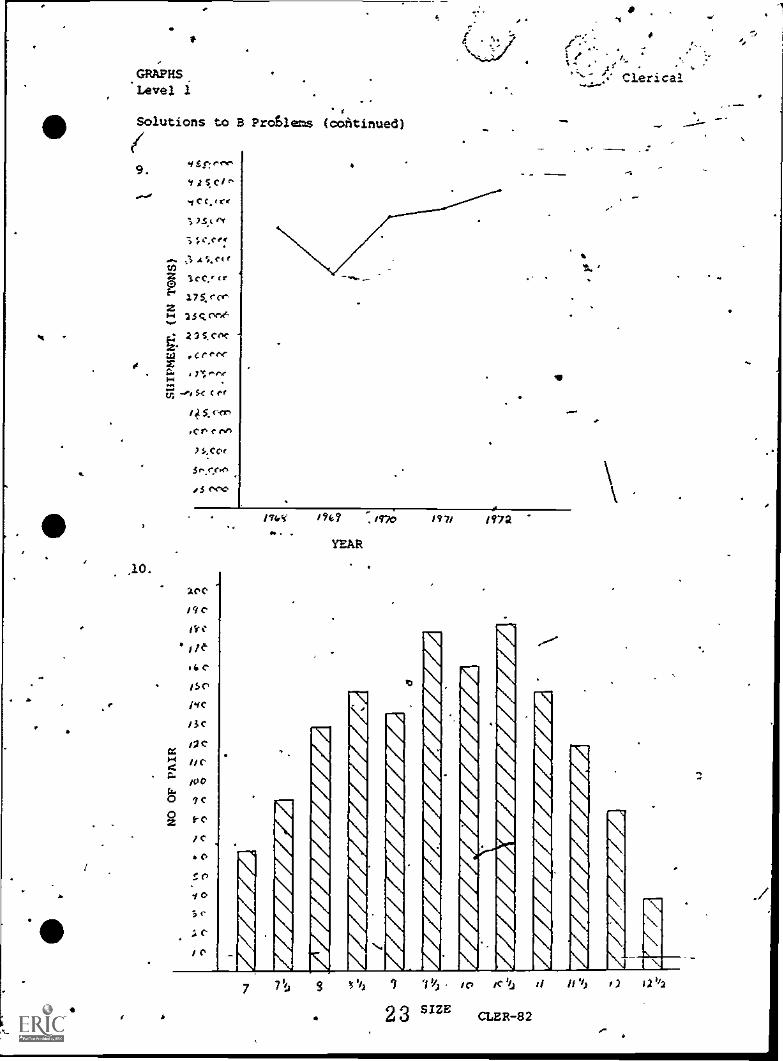
9. "The Plimpton Metals CorP.'shows in its =mat report a graph of. tonnages shipped as follows: -
1968 .370,000 boas1969 310,000 tons1970 380:00 tons1971 390,000 tons
4 1972- 420,000 tons
Prepare a set of rectangdlar coordinates, plot shipments asordinates, and draw the graph.
Solution:
...
- - -
ea. "mum.- - .-
- . 4
-ra -d- ,-
15
cum-14
.06
-Ow
GRAPHSLevel 1
B. -Proble=s without Solutions (continued)
41
Clerical
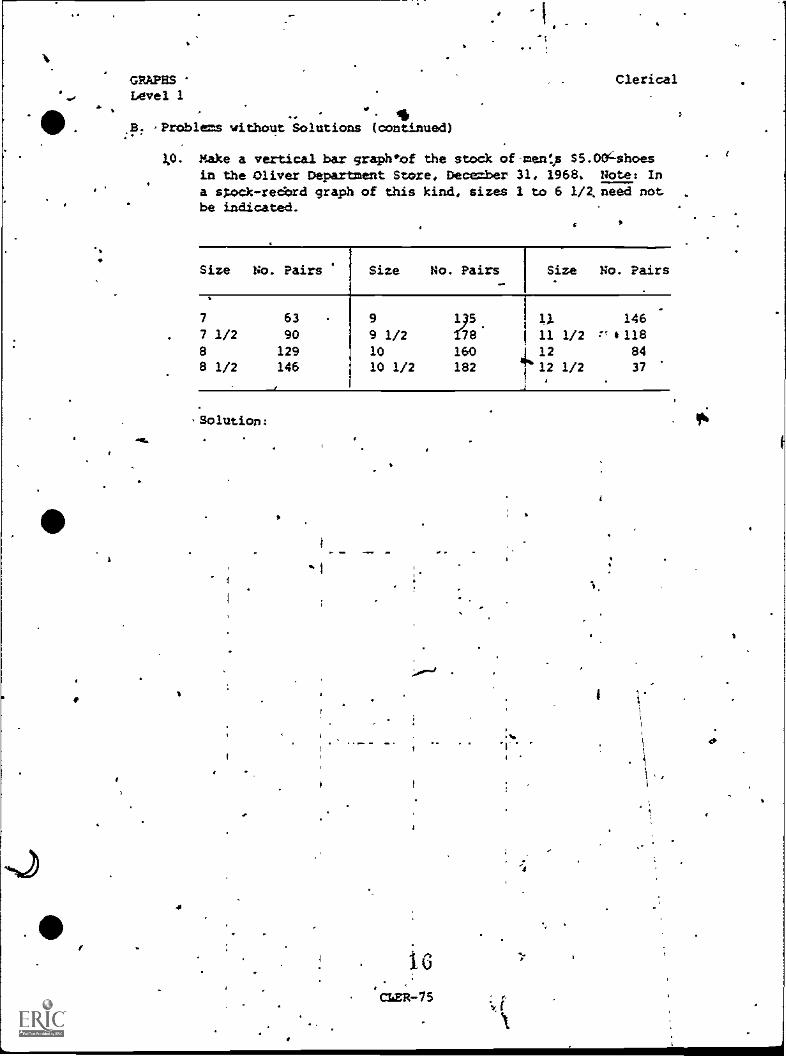
Make a vertical bar graphJof the stock of-mentA 55.00=shoesin the Oliver Department Store, December 31, 1968. Note: Ina sXock-redord graph of this kind, sizes 1 to 6 1/2. need notbe indicated.
Size No. Pairs ' Size No. Pairs Size No. Pairs
7 63
7 1/2 90
8 129
8 1/2 146
9 115 1). 146
9 1/2 l78 11 1/2 f' .118
10 160 1 12 84
10 1/2 182 "T 12 1/2 37
1
-solution:
iG
cLER-isyf

GRAPHSLevel ls
11. strohle= without Solutions (continued)
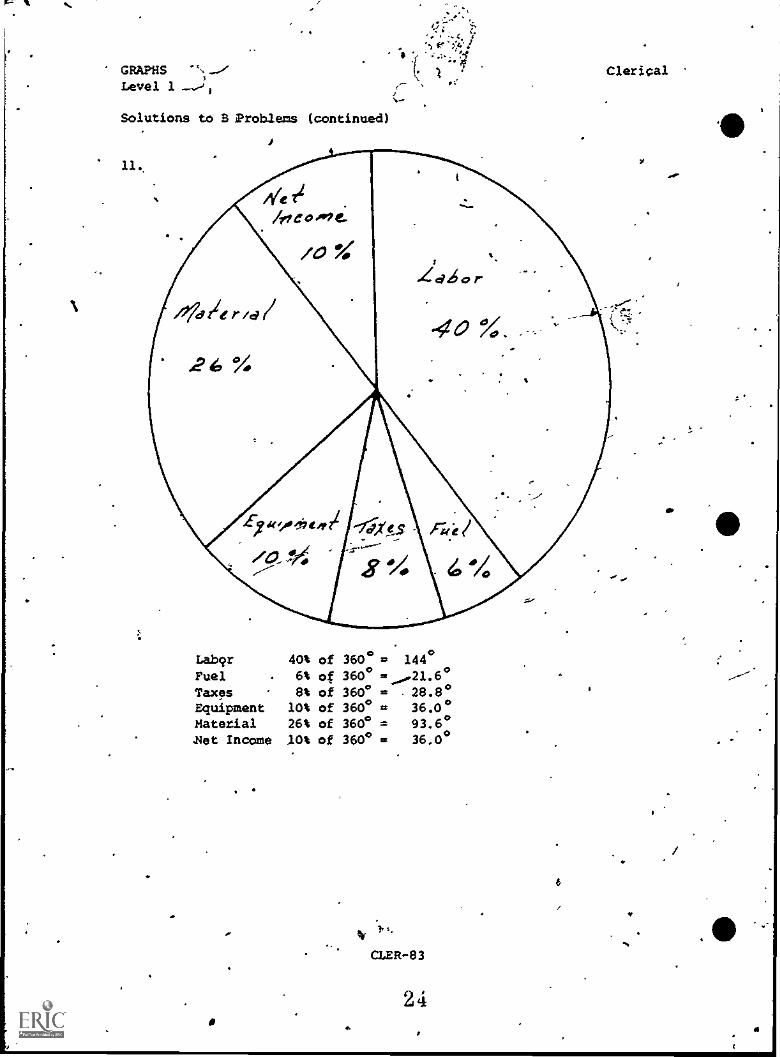
11. Construct a pte chart for the following sicAlar costs of the X?Zcorporatioh. ;
.
Labor4 40%1Fuel ' 6%Taxes St
Solution:
sf
i /
Scuipxent 10%A
Xaterials' 26%Net incoee 10%
4174
4,
al1R-'76
4.
/
, -, ..
. ..
I
MARKS Clerical
Level 1
Problins without Solutions (coptinued/ .
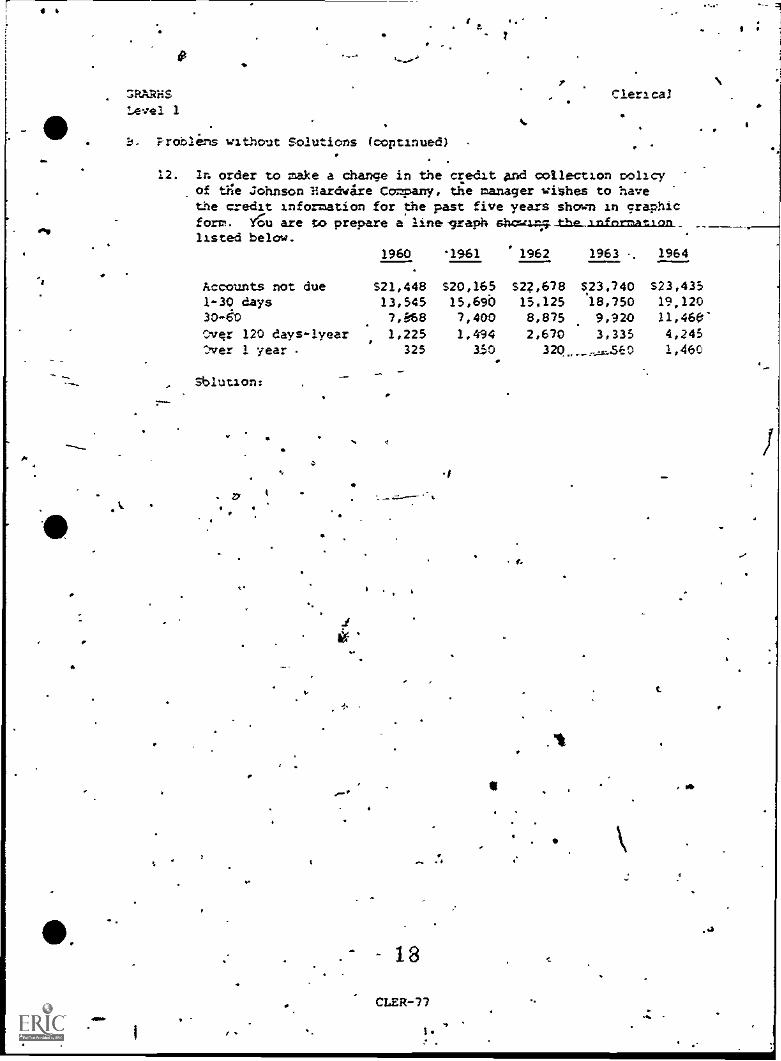
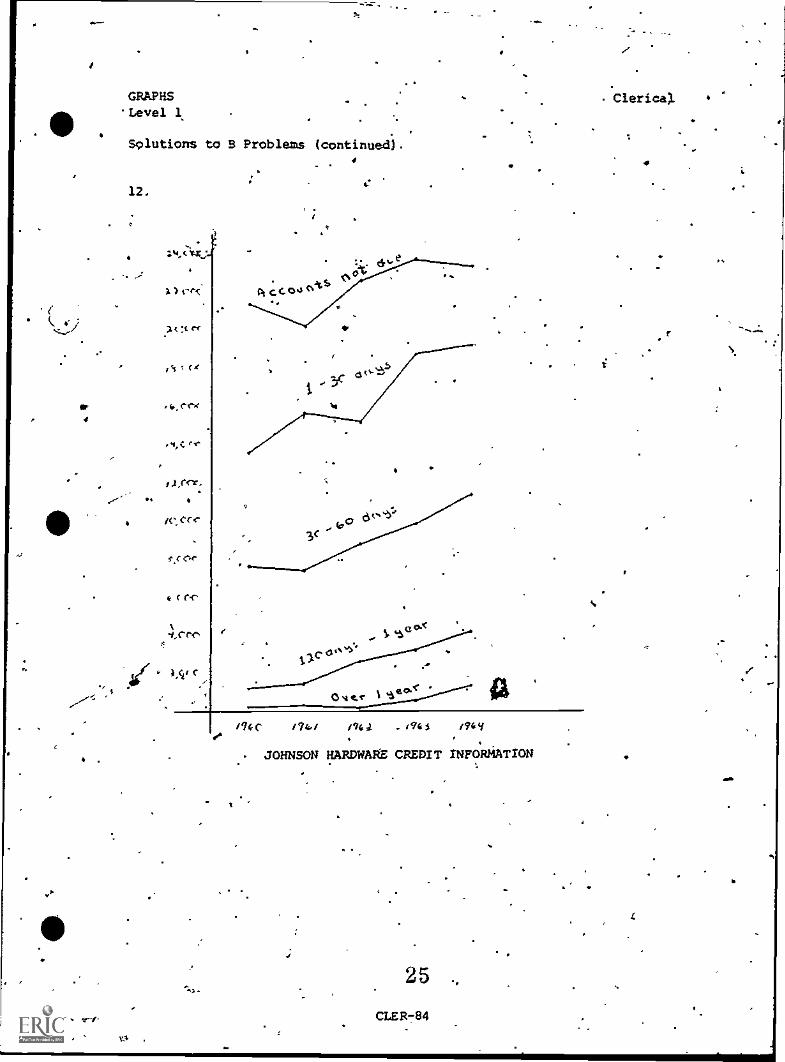
412. In order to make a change in the credit and collection molicy
of 'ale Johnson Hardwire Company, the manager wishes to havethe credit information for the past five years shown in graphicform. &u are to prepare a line-graph shadzmg_the_lr,fewmatIonlisted below.
1960
Accounts not due 521,4481-30 days 13,54530-60 7,&58
Over 120 days-lyear 1,225'ver 1 year 325
Sblution:
e
t
-1961 '1962 1963 1964
520,165 522,678 $23.740 523,435
15,690 15.125 18,750 19.1207,400 8,875 9,920 11,460'
1,494 2,670 3,335 4,245350 320,_,..-560 1,460
.0
f
18
CLER -77
I
111
.%
1.
GRAPHSLevel 1
B. Problems without Solutions (continued)
9
Clerical
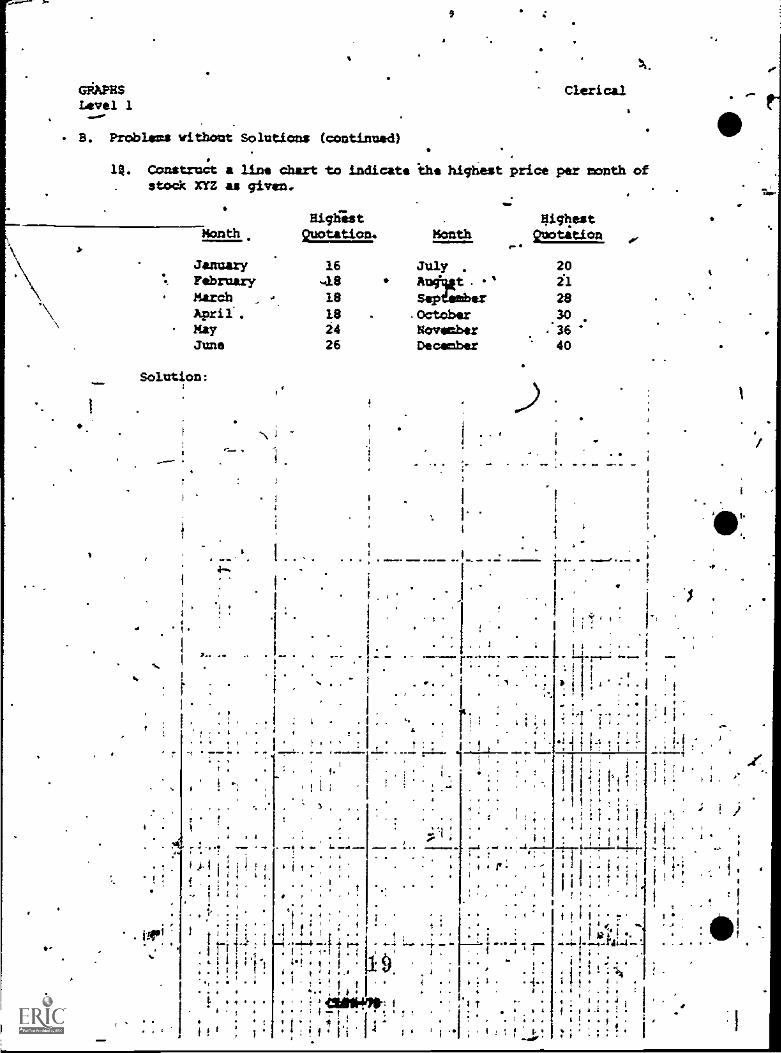
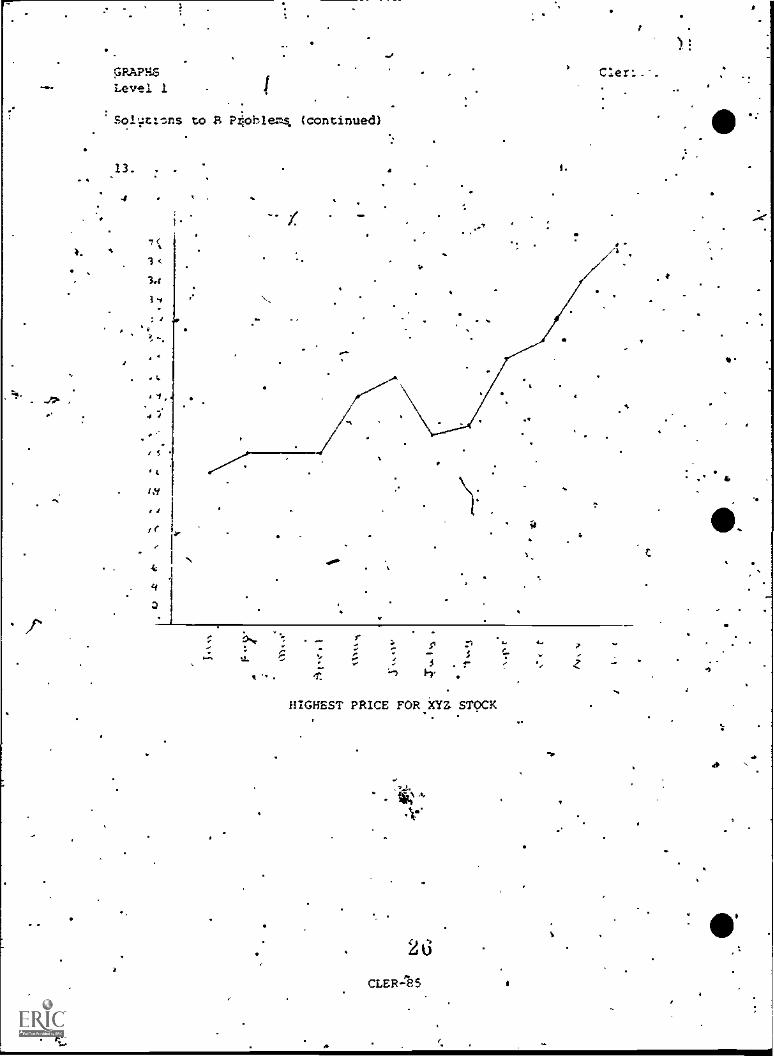
19. Construct a line chart to indicate the highest price per month ofstock XTZ as given.
MonthBighlst 9igilest
Month 9uotation4-
January 16 July . 20February 49 Augtab..; ' 21March _ 18 Sap 28April" . 19 . -October 30Kay 24 November . 36June 26 December 40
Solution:
I
/4..
4. 4
1
1
.
I
) II
...
. .. . I I i i 4!' .
. - I
_. .. . , 4 i 1 1
1 3
. /I ....
%..
.!,. . .. ....... --...I
V
r
!
, . . *1. i17.
:
! : If.
I.
I..,.
I
.
/1
.W.
.
10
6 t 1
ri ; 4 1; '
6
t
;4.
tI
...16 . l L
I.
.. -:.. : i
. :1 4
....I . 1 .4 .............., I , 1 :14.. 1 i 6I
; . : t / 1 ; . : / 1 .
* f ft: ... 41:..ii, I:4r; .14I
1 1tt11Ir. t 1
' A 14, .4 Oi.
....i........r..4_.. .....1... .,1 t. ; i -:
4 . 1 t 6 ; 3,*4 '1 6 .
I1 . . I 6 .
**** ; I 11_ I I .
I6 1 1
if : ; ; ! . I
.4 I a .430 I . , 1I 1 . 1 l ,! 0 t 8 I . 1:
j ,
I
6I11 t * 6.6;1.44 ,14.1 4
. i .11 Cialkliti'l i
1 i 7. t . . 4
1 I . i .1 .1: f 1 11 ; 6 ; I t j 4, :
.
lit t. ; .
! '
GRAPES
Level I
B. ' Problems without Solutions (continued)
Clerical
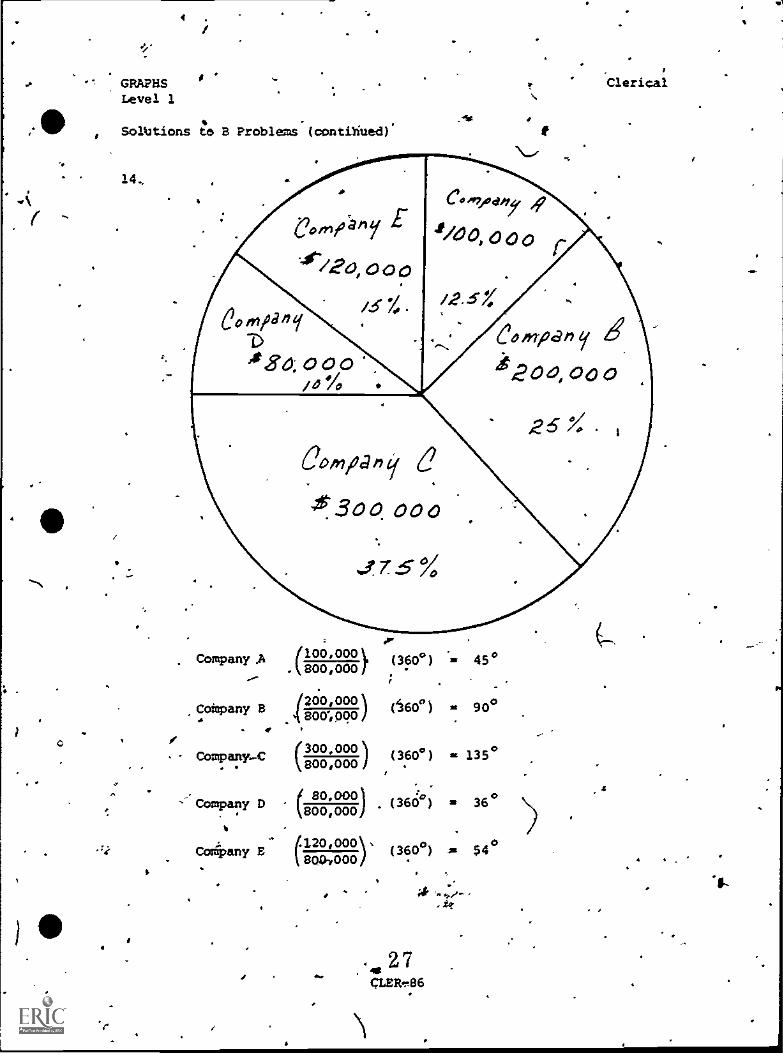
14, STV, a rd.ni-conelonerati, derived $830,000 in revenue from fivevhollY owned a'nbsidieries. Ths,sublidiaxies sales wereCompany A-S100,000; Ccopany,-6200,000:-Carapany 04300,000pCompany D-880,000; Company E-$120,000. Draw a Circle graph.showing sass .#1 percents.
. .1
.v
I
4'
LO
CLER-79
pi
o
4.
4
I
4
1.
GRAPHSLevel 1
Solutions to B Problems
7.
I /4591. /NW /MAEA r A
AC
/A Ar
.14^
Clerical
t-
iLt
IS c
I. c13.E
ii,clowp
2 1 c
*.c
8 7 C
0Ar-r
A c.e. .1 C
1.0
3 I 9 fs 1! X17 43 37 415 57 4s c-v 7y rI I
DEMAND DEPOSITS IN MILLION DOLLARS
/941 /9 2 /943 'fly /943 -/nt /947 194Y /747 197o
CLER-80
2
9Aro
GRAPHSLevel 1
Solutions to-B Problems
8.
4.
Ale/
Zfaboo
450,000
Clerical
"o( iii/d/771/e
.°450, D D
Total Sales $2,400,000
.New England Stated
Mid Atlantic States
South Atlantic States
North Central States
South Central States
Mountain States
Pacific States
Or.
( 450,000){360°), =
=
i=
=
=
=
68.4o
68.40
22.8°
22.8°
15.6°
22,8°
114°
$
-CLBB -81
k2,400,000
4450,000
(360°)(2,400,000
)
150,000)(3600)
(
24400,000
(150,000)(360°)2,4Q0,000
(2,300,000)(36e)
2,400,00.
( .150,000) (3600)**1,,400,0002
(750,000) (360°)
2,400,000
22
I
GRAPHSLevel 1
Solutions
P/
4rto 3 Problems (continued)
.10.
11MM
V5 St c Pt
14 5,e-er
'tree"15:Cor
Se..rpft,
15 er.c.
.'1
1:`- ,
Clerical
2.00
/9e
/Ye
si C
0$C
ive
/3C
/2C
//e.
9C
/e
4,0
Sn
/0
.1e
/O
19i,v /969 ,1470 0971 /972
YEAR
7 71:I 5./2 ? V.3 ic,
23 SIZEit sij
CLER-82
f1 11 'Ij
I-
I)
F--7 ..
N
/
GRAPHS ")-..."Level 1 --,1
Solutions to B Problems (continued)I
Clerical
e
s
OS
LabqrFuel .
TaxesEquipmentMaterialNet Income
40% of 360° ID 144°6% of 360° ........21.6°8% of 360° st 28.8°
10% of 360° g2 36.0°26% of 360° --2 93.6°10% of 360° = 36 0*
-..
.
6
/
. . 1,.
CLER-83
24
/
.
GRAPHS
"Level k
Solutions to B Problems (continued).4
12.
40Ilc 041 eki - ens moi
JOHNSON HARDWARE CREDIT INFORMATION
25
=R-84
Clerica1
ti
4
GRAPHS
Level 1. I
Sol.iticns to A Piohlems (continued)
13.
4
(I
3
3.4
A'
44
.41
I
f.
I
Clan.
it
4.0*
3
a
:....
r a r,
,, . ...
,, s . 1-
h
HIGHEST PRICE FOR XYZ STOCK
2G
CLER-13S
:
16
98-4131.)
L Z '
0004008 (009E) (000'0Zi)
(0090
(009E)
(009c)
( 08
1 000'008 000'00£
tooci'.008 k 'ooz/
g Augdyso3
Auvdiao3.
. . 3-AuedWo3
- 9 Ar.tedup3
004E; jaw Auvenam 001J
000 OoEi weiv100
000fooef 9 hgied4.0.7,2
11T4T28T3,
J 0 0 0 tOOY,
hiegie...00
A
7,p/ 000.Vgir
hueiwo
PT
(pengIvico) soiletwad 2 ol suollgto2
I Tana/
0
-+
.0
GRAPHS AHD (ARTSLevel 1 t
A. Problems with Solutions
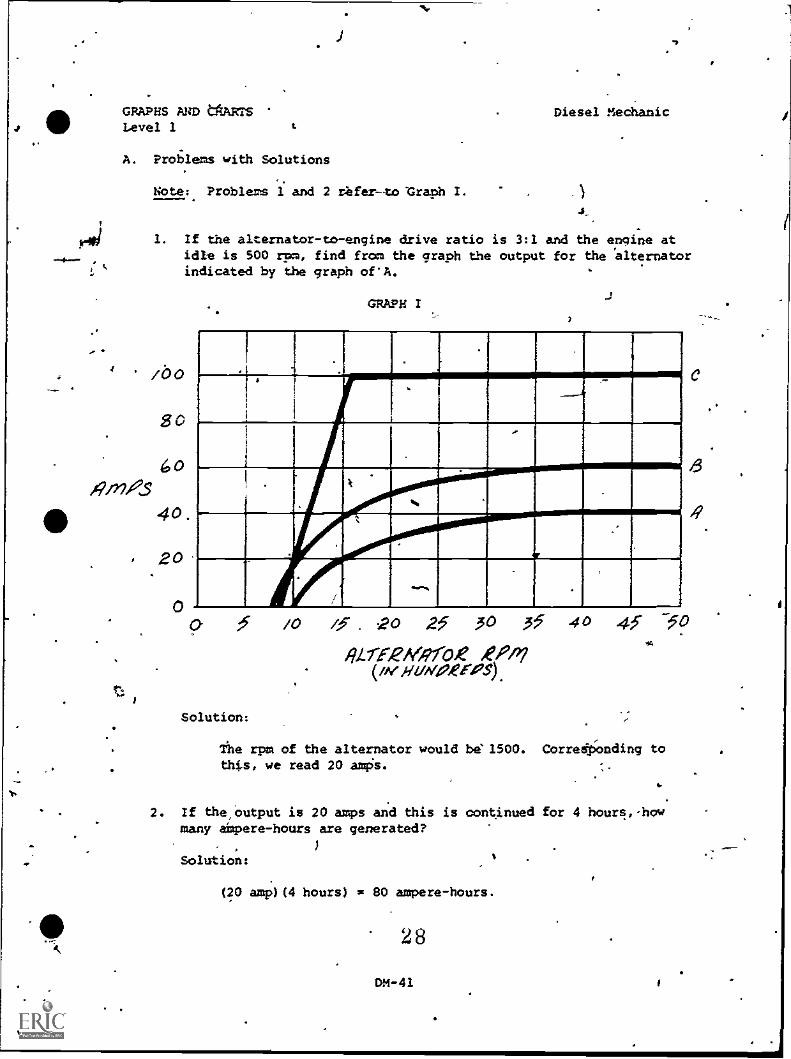
Note: Problems 1 and 2 refer -to 'Graph I.
Diesel Mechanic
1. If the alternator-to-engine drive ratio is 3:1 and the engine atidle is 500 rpm, find from the graph the output for the alternatorindicated by the graph of*A.
/lb°
SO
60Afr71,3
40.
, 20
0
GRAPH I
I
9 5 /0 . 240 25 30 35
RI-TERA,RiOt EPA?(memine,944-08).
Solution:
40 45 -50
The rpm of the alternator would be' 1500. Corre6Onding tothis, we read 20 amps.
2. If the,output is 20 amps and this is continued for 4 hours,howmany mere -hours are generated?
1
Solution:
(20 amP)(4 hours) m 80 ampere-hours.
28
C
6
......
.....1
.....
Il
E...
...,..
..9.
.,I.
mows
mmim19 I'm
IMAINININN NIN
1NI
'
INNIANIMMEUNIMIN
'MIN
mon6mmummumme
_mal
mgmummilimm
INN
ImIIINNaltNNININN
-INN
1111111111211111111111
NIIIININNIMINIZINNINIM
INININIIIINUISIZIMINN
INIIININIBINNOANIMION
MNIIININN IIIRSW4
MMIONINININIINIM
'111111111MILIIIIIMINIII
INIIIIINININIIIIIENI
1 1 111 6 I
i 1 1
rI
NI
mgimmillggiumgmmik
g
limm
milimmiamell
mmommlImmplym INNIi
BONNEINENEINIWINR
Ili
IMPORMINimiller.
NI
MINEWINN
I1111114,
II
ININTmamin
pm
1111111
mlarinlill
11
1111111 imm.siton
MINN NOOM.1001111
11
immisiiimmulzOom
ININNINNIMMIMMON.,
ommimimminimmiNg
1111201111MMIMMINIMMill
11111.11111111111111111
GRAPES AND capTs Diesel MechanicLevel 1
A. Problems with Solutions-(continued)
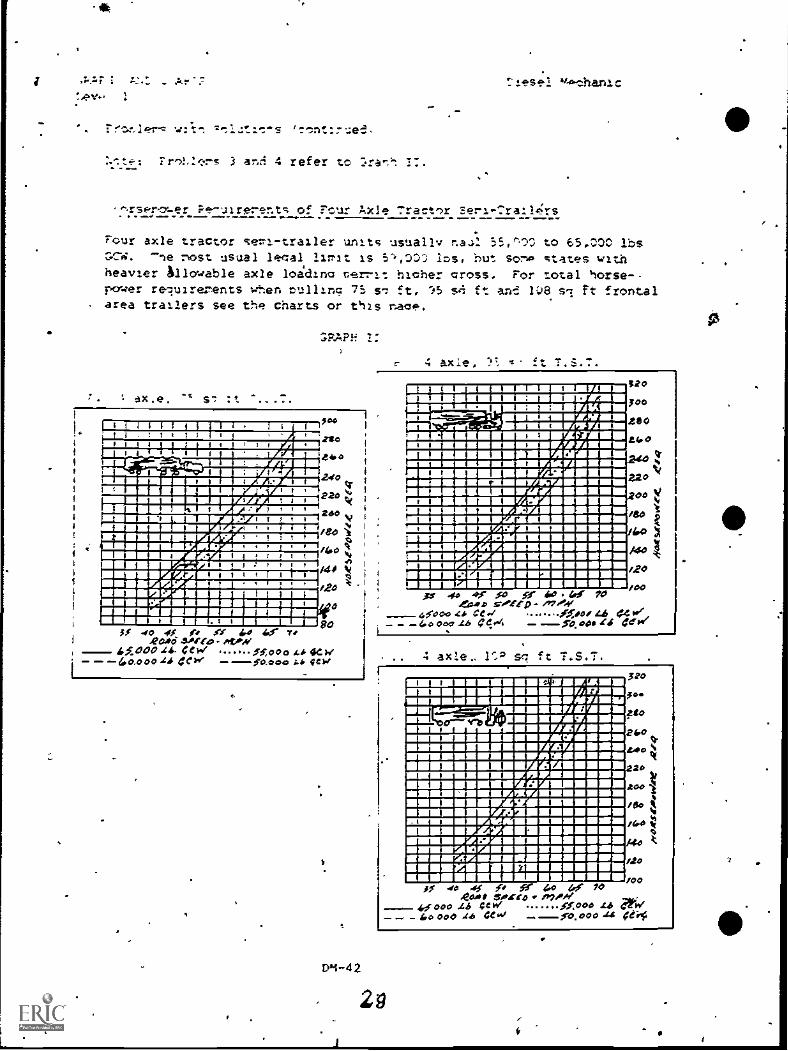
3. From the graph? (Graph what would be the required horsepowerfor a 4 axle, 75 sq ft frontal area truck hauling 55,000 lbs at '55 nph?
Solution:
Looking at graph A, and going up the 55 mph line untbl wecross the line of dots we see this correqponds with 170 hp.
4. What road speed could be expecieefrom a 4 axle, 108 sq ft frontalarea truck hauling 55,000 lbs with rated horsepower of 250?
Solution:
Approximately 62.5 mph using graph C.
DM -43
°
ti
4
GRAPES %AND CIUMS,. Level. 1
I
Diesel Mechanic
A. Problems with Solutions (mirtLnued)
. Note: Problem 5 refers to Chest III.
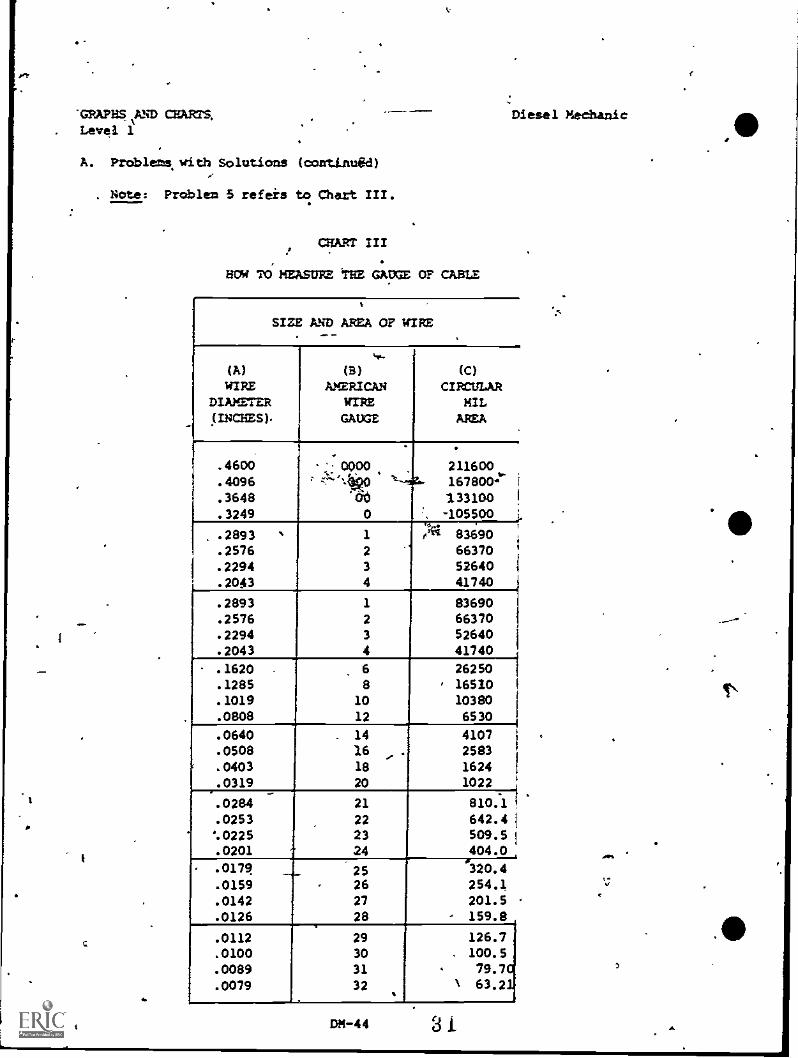
CURT III
HOW TOMEASURE TUE GAUGE OF CABLE
SIZE AND AREA OF WIRE
4..
(A) (3) (C)
WIRE AMERICAN CIRCULARDIAMETER WIRE MIL(INCHES). GAUGE AREA
.4600 -01000 211600
.4096 ''="-AiplO' -t---4.- 167800"
.3648 60 133100
.3249 0 -105500
.2893 1 ' 83690
.2576 2 66370
.2294 3 52640
.2043 4 41740
.2893 1 83690
.2576 2 66370
.2294 3 52640
.2043 4 41740
.1620 6 26250
.1285 8 ' 16520
.1019 10 10380
.0808 12 6530
.0640 14 4107
.0508 16 2583
.0403 18 1624
.0319 20 1022
.0284 21 810.1
.0253 22 642.4%0225 23 509.5.0201 24 404.0
.0179 25 320.4
.0159 26 254.1
.0142 27 201.5
.0126 28 - 159.8
.0112 29 126.7
.0100 30 100.5
.0089 31 79.7
.0079 32 ' 63.2
DM-44

GRAPHS AND CHAR'SIlvel 1
A.
B.
Problems with Solutions (continued)
CHART III: How to Measure The Gauge of Cable
M
DieselllIchaniC
To deteIpine the gauge of a cable, using the table, proceed as follows:
(1) Count the number of strands of wire.
(2) MieaSuxe the diameter of a single strand in thousandths of an inch,using a micrometer.
(3) In column A of the table, find the diameter of the wire you havemeasured, and on the same line, in column C, find its area.
(4) Multiply the area of a single wire by the number of strands, to.get the total area.
(5) In 41uMn C, find the figure that is closest to the total areaobtained by step 4, and on the same line, in column B, note thegauge ndMbcr of a single wire having that area. This number isthe gauge of the cable.
- .. - .
5. A cable is found to have 19 strands of wire, the individual strands.(measured by micrometer) are 0.0112 inches in diameter.. find the . .gauge of the cable.
Solution:
The table (column C) shows the circular mil area of eachstrand to be 127. Multiplying this by the number of strands,19, results in 2413 total circular mils. The closest figurein Column C is 2583, and on the same line, in Column B, wefind that 16 is the nearest cable gauge.
0
Problems without Solutions
6. Refering to Graph I (for problem 1), if the engine idles at 500 rpmfor 4 hours and runs at 35 mph for 4 hours assuming engine rpm tobe 50 rpm for each mph, what are the ampere-hours generated ifthealternator -to- engine drive ratio is 2:17 (Assumewe are using al-
ternator "Bs.)
32
tj -45
GRXIMS AND CHARTS Diesel MechanicLevel 1
B. Problems without Solutioni rcontinued)
7. Continuing with the above problem, would the alternator 3 (outRilt304) be the correct choice inbbssystem in which the dray would be280 ampere-hours? (Would it be adequate?) Remember that 280 ampere-hours must represent no more than 80% of total output.
1
8. Refer to Graph II to find the required horsepower for a 4 axle,95 sq ft frontal area truck hauling 65,000 lbs at 60 mph.
9. A four axle 951.sq ft frontalel.ing_ at 60 mph", could expect
.
4
area truck with 220 horsepower tray-to haul how much? (Refer to Graph II)
10, A 220 hp truck ca47ing 50,000 lbs and traveling at 65 mph wouldprobably have what frontal area (Refer to Graph II)
11 A 170 hp 4 axle truck with 95 sq ft frOntal area carrying 50,000lbs could expect to travel at what road speed? (Refer Graph II)
33
. DM-46
GRAPHS AHD CHARTSLevel 1
B. Problems without Solutions (continued)
Diesel Mechanic
12. From information on Chart rrr, find the gauge of cable requiredif it has 37 strands and the diameter of each is 0.0126 inches.
a
.13.. Find the gauge for 61 strands if the diameter of each is 0.0142inches. (See Chart rrr)
Refer to the Grade Horsepower Table (and posiibly the previous graphs) toanswer the next four problems.
14. Hauling 76,800 lbs on a level road at 30 mph requires whathorsepower?.
15. Hauling 76,800 lb. on a one degree grade at 30 mph requires whathorsepower?
16. .1Dmaii4 73,280 lbs on a three degree grade at 20 mph requitalwhat horsepower?
17. If the frontal area of'the.truck is 95 sq ft, hauling 65,000,1lnon a two degree grade at 40 mph requires what horsepower? (Also
see graph)
. .
34DM-47
GRAPHS AND CHARTSLevel 1
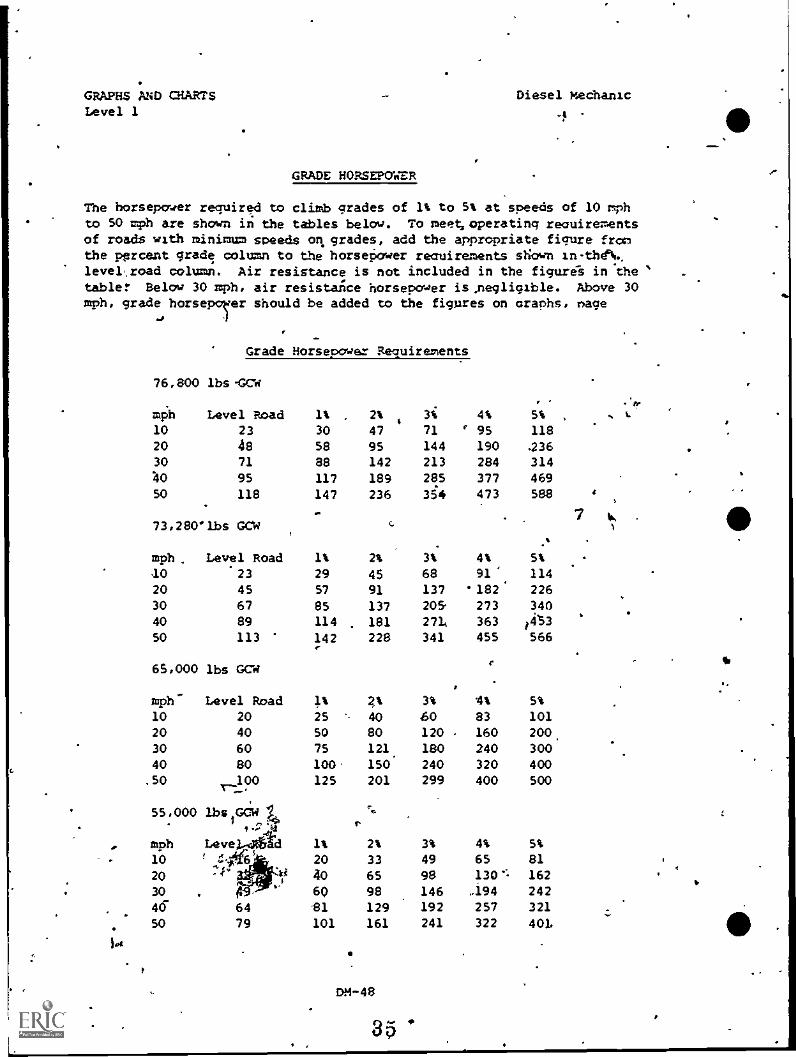
GRADE HORSEPOWER
Diesel Mechanic
The horsepower required to climb grades of 1% to 5% at speeds of 10 mphto 50 mph are shown in the tables below. To meet, operating reouirementsof roads with minimum speeds on grades, add the appropriate figure fromthe pprcent grads column to the horsepower recuirements sNaan inthe$1.level%road column. Air resistance is not included in the figures in thetable? Below 30 mph, air resistance horsepower is negligible. Above 30mph, grade horsepoTer should be added to the figures on Graphs, nage
J
Grade Horsepower Requirements
76,800 lbs -GCh
,
mih Level Road 1% 2%4
3i 4% 5%
10 23 30 47 71 ' 95 118
20 4a 58 95 144 190 .236
30 71 88 142 213 284 31440 95 117 189 285 377 469
50 118 147 236 354 473 588
773,280#1bs GCW
mph Level Road 1% 2% 3% 4% 5%
-10 23 29 45 68 91' 11420 45 57 91 137 '182' 226
30 67 85 137 205 273 340
40 89 114 181 2714 363 1453
50 113 142 228 341 455 566
65,000 lbs GCW
mph- Level Road 1% 3% 4% 5%
10 20 25 40 60 83 101
20 40 50 80 120 160 200.
30 60 75 121. 180 240 30040 80 100 150 240 320 40050
r--100 125 201 299 400 500
55,000 IbsIGOW t41 ..V.a...}4
r
.-.
mph Leve1.46id 1% 2% 3% 4% 5%
10 f A..`,A
5 20 33 49 65 81
20 -r" i 40 65 98 130 '. 162A.
.30 60 98 146 194 242
46 64 81 129 192 257 321
50 79 101 161 241 322 401.
1.4
L.
DM-48
GRAPHS iND CHARTSLevel 1;
8. Problems without Solutions (continued)
Diesel Mechanic
.
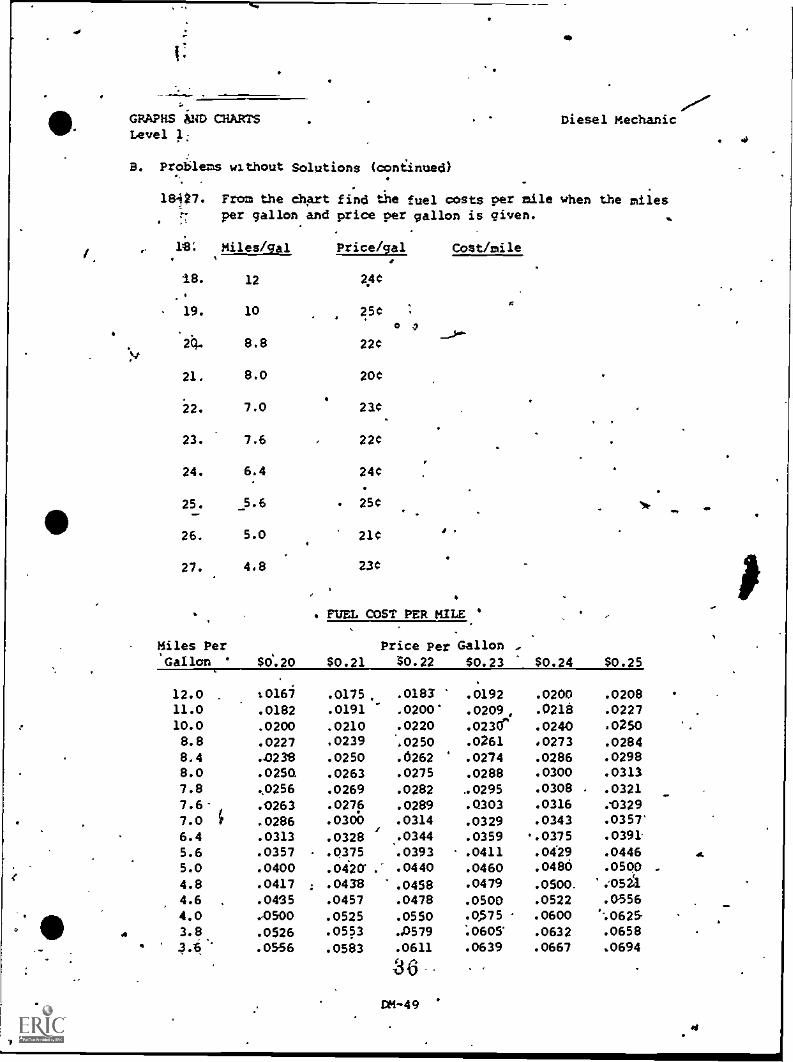
18427. From the chart find the fuel costs per mile when the milesper gallon and price per gallon is given.
lit; Miles/gal Price /gal Cost /mile
18. 12 A:".
19. 10 25C,7
8.8 22C
21. 8.0 20C
22. 7.0 210.
23. 7.6 220
24. 6.4 24C
.
25. 5.6 25C._. .
26. 5.0 210 . .
..
27. 4.8 230
. FUEL COST PER MILE . ..
...
11/1'
.
' -
Miles Per Price Per GallonGallon $0.20 $0.21 $0.22 $0.23 $0.24 $0.25
12.0 :0167 .0175 .0183 .0192 .0200 .0208
11.0 .0182 .0191 .0200' .0209, .0218 .0227
10.0 .0200 .0210 .0220 .0230' .0240 .0250
8.8 .0227 .0239 .0250 .0261 .0273 .02848.4 .0238 .0250 .0262 .0274 .0286 .0298
8.0 .0250. .0263 .0275 .0288 .0300 .0313
7.8 .0256 .0269 .0282 .0295 .0308 .0321
7.6 .0263 .0276 .0289 .Q303 .0316 .0329
7.0 .0286 .0300 .0314 .0329 .0343 .0357'
6.4 .0313 .0328 .0344 .0359 .0375 .0391
5.6 .0357 .0375 .0393 .0411 .0429 .0446
5.0 .0400 .0420'. .0440 .0460 .0480 .0500
4.8 .0417 : .0438 .0458 .0479 .0500. '.052.4.6 .0435 .0457 .0478 .0500 .0522 .0556
4.0 .0500 .0525 .0550 .0.575 .0600 %06253.8 .0526 .0553 .A579 :0605 .0632 .0658
-M .0556 .0583 .0611 .0639 .0667 .0694
.1111N
36DM -49
GRAPHS AND CHARTSLevel 1
Complete Solutions to B Problems
Diesel Mechanic
6. At engine idle, the alternator turns at (2)(500 rpm) = 1000 rpm.From the graph of B, corresponding to 1000, we read approximately18 amps. 8 amps)(4 hours) a 72 amp-hours.
4111m.
For the engine running at 35 mph, (50 rpm/m-0)(15 gpfi) = 1750 rpm,So the alternator runs at (2)(1750 rpm) or 3500 rpm. Correspond-ing to this on the graph of U, we have approximately 58 amps.(58 amp)(4 hours) = 232 amp-hrs. Total ampere -hours generated:
72 amp-hrs 232 amp-hrs = 304 amp-hrs.4
,7. No. Remember that the 280 ampere-hours should represent no morethan 80% of the total desired.
\--280 amp-hrs = 350 amp-hrs required for adequate operation.
0.8Q
8.
A 9.
.44
240 hp.
55,000 lbs.
10. 75 square feet.
'41
V
11. Approximately 57 mph.
12. The circular mil area is 159.8 for each strand.
37 strands: (37 stradds) (159.8 air mil/stip-4nd) a 5912.6 cir Mils. ,
The closest numbei to this in column C is 6530. Across from it,
in column B, we read 12, therefore, gauge 12. a..
13. . (201.5 cir miles/strend)(61 stv'ead) = 12,i91.5 cir mils:the closest number to 10380, so gauge 10 should serve.
3DK -50
this is
ri
:40
lb
GRAPHS AND CHARTS Diesel MechanicLevel I
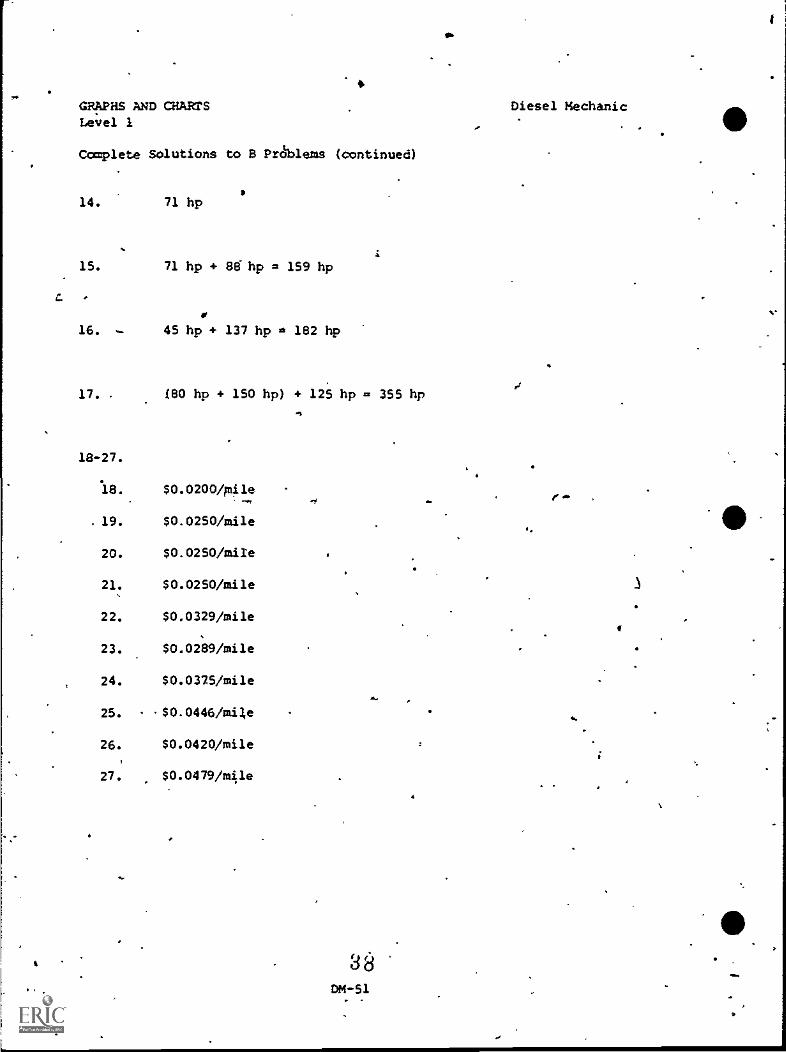
Complete Solutions to B Problems (continued)
14. 71 hp
15. 71 hp + 88 hp = 159 hp
C.
16. - 45 hp + 137 hp it 182 hp
17. . £80 hp + 150 hp) + 125 hp = 355 hp
18-27.
18. $0.0200/mile-0 .
. 19. $0.0250/mile
20. $0.0250 /mite
21. $0.0250/mile
22. $0.0329/mile
23. $0.0289/mile
24. $0.0375/mile
25. .$0.0446/m4e
26. $0.0420/mile
27. $0.0479/m4le
DM-51-
OP'
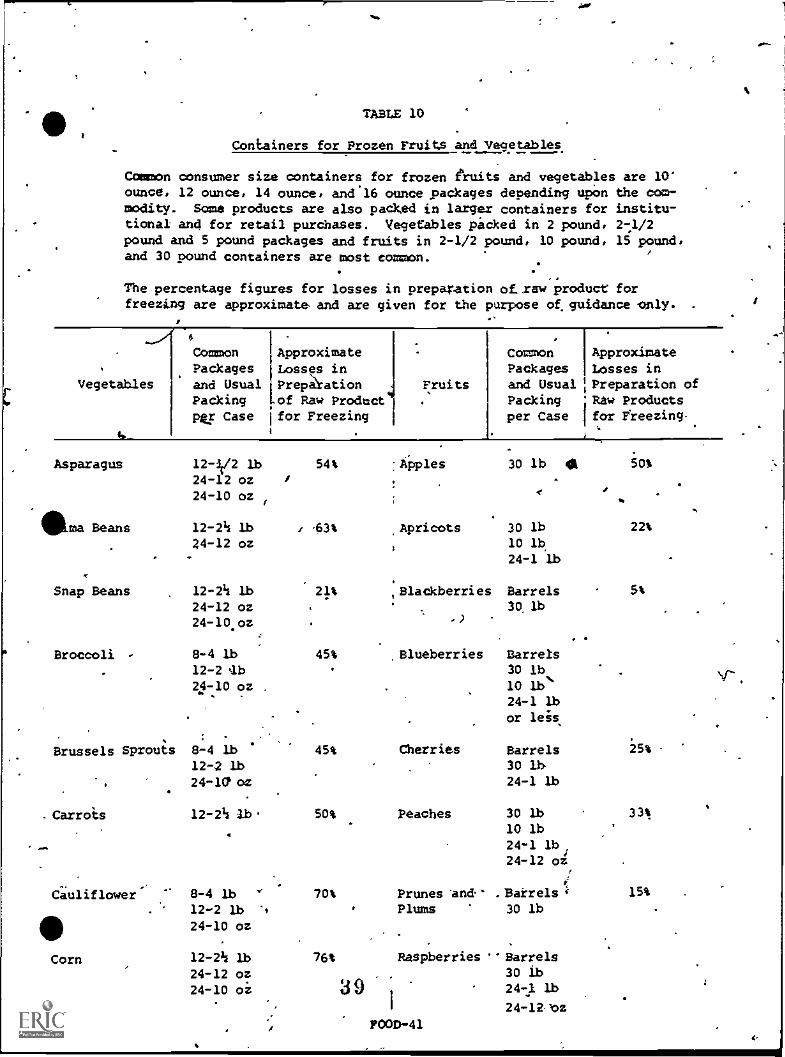
TABLE 10
Containers for Prozen Fruits and Vegetables
Common consumer size containers for frozen fruits and vegetables are 10'ounce, 12 ounce, 14 ounce, and16 ounce packages depending upon the com-modity. Some products are also packed in larger containers for institu-tional- and for retail purchases. Vegetables pizked in 2 pound, 2-1/2pound and 5 pound packages and fruits in 2-1/2 pound, 10 pound, 15 pound,and 30 pound containers are most common.
The percentage figures for losses in preparation of:.raw product forfreezing are approximate and are given for the purpose of guidance only.
Vegetables
CommonPackagesand UsuaiPackingper Case
ApproximateLosses inPreparation Fruitsof Raw Productfor Freezing
Common ApproximatePackages Losses inand Usuai 1 Preparation ofPacking 'Paw Productsper Case for Freezing-
Asparagus
ema Beans
Snap Beans
Broccoli
Brussels Sprouts
.Carrois
Cauliflower
Corn
12-31/2 lb
24-12 oz24-10 oz
12-2h lb/4-12 oz
12-2h lb24-12 oz24 -10 oz
8-4 lb12-2 ab24 -10 oz .
8-4 lb12-2 lb24-la oz
12-2's lb
8-4 lb12-2 lb24-10 oz
12-23/4 lb
24-12 oz24-10 of
I
54% :Apples
4-'03%
21%
45%
45%
50%
70%
,Apricots
30 lb 41
30 lb10 lb24-1 lb
,Blackberries Barrels301b
.Blueberries
Cherries
Peaches
Prunes and *Plums
Barrels30 ib10 lb'24-1 lb
or leis
Barrels30 lb24-1 lb
30 lb10 lb24-1 lb,24-12 o4,
Barrels30 lb
761 Raspberries Barrels30 lb241 lb24-12,1oz
39POOR -41
22%
5%
25% -
331
15%
a
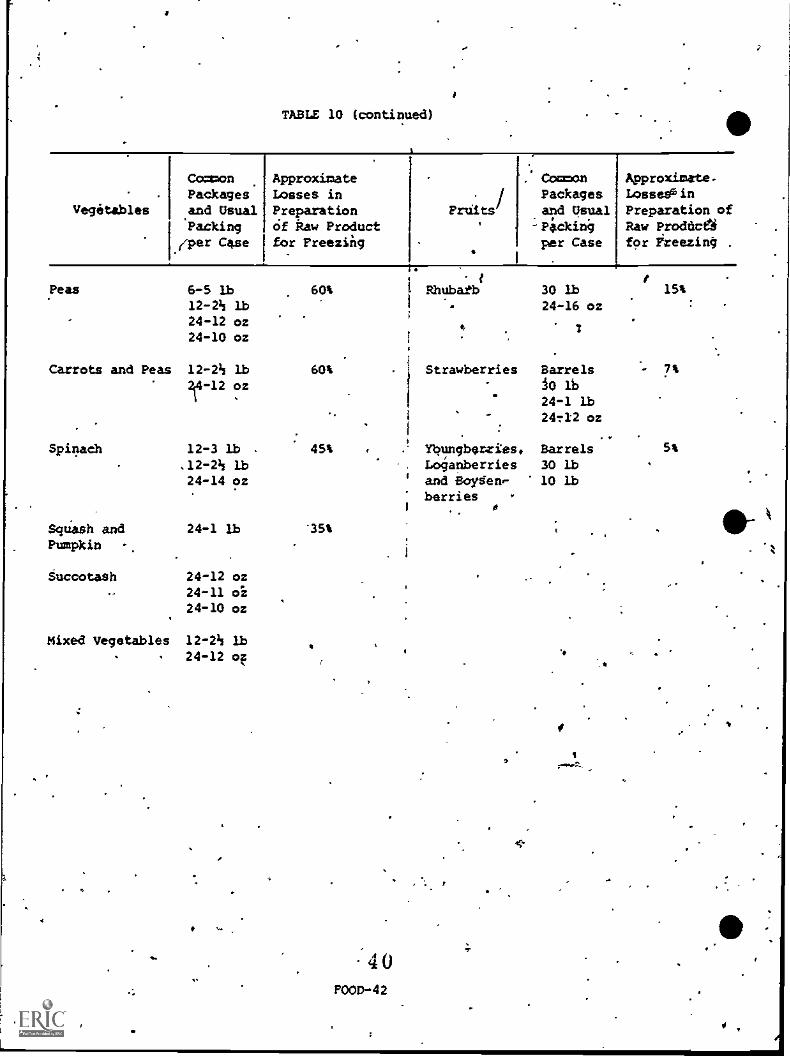
TABLE 10 (continued)
.
vegetables
.
CommonPackages,and UsualPackingper Case
.
ApproximateLosses inPreparationOf Raw Productfor Freezing
. /
Fruits'
.
.' Common
Packagesand Usual
-Pickin4per Case
.
Approximate.Lossea6inPreparation ofRaw Prodecegfor Freezing .
Peas 6-5 lb12-21/2 Lb
24-12 oz24-10 oz
Carrots and Peas 12-21/2 Lb
2,-12 oz
Spinach
Squash andPumpkin
Succotash
60%
60%
12-3 Lb . 45%
.12-21/2 Lb
24-14 oz
24-1 lb
24-12 oz24-11 oz24-10 oz
Mixed vegetables 12-21/2 lb
24-12 oz
4
'35%
"40FOOD-42
Rhubatb
Strawberries
Ybungbenries.Loganberriesand Boygen,berries
30 lb24-16 oz
15%
Barrels 7%
10 lb24-1 lb24T12 oz
Barrels 5%
30 lb10 Lb
0

t
ORM
GRAPHS AND TABLES /Level 1.
A. Problems with Solutioms411.,
dOW
4
11. Condition of container inspection.
ast
Food Processing
Before the,government will accept a shipment, the packer oustsubmit a condition of container report. This report is basedon a statistical sampling technique.
1
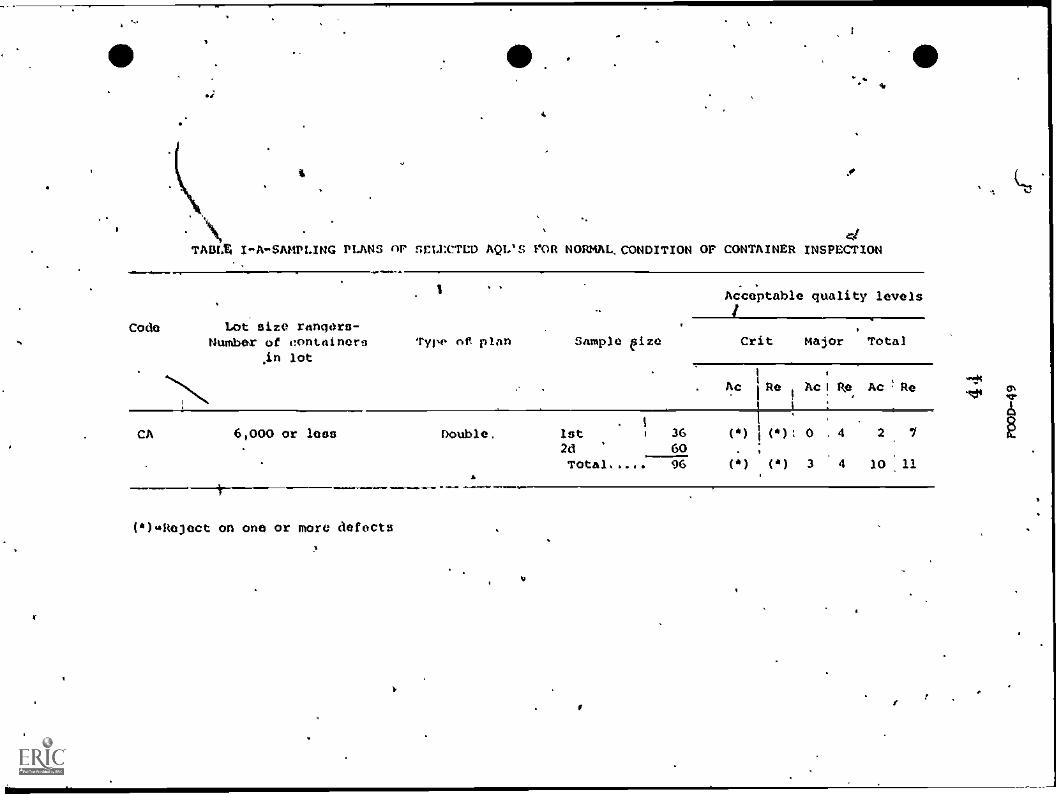
Refer.to 42.109 Table 1 -A and assume that the number of contain-ers is 5,540 and a double sampling plan is Lo be used.
From g random sample of 36 containers you find: 3 minordefects12.major defects and no critical defect.
Wbuld you accept, reject or move on to the second sample size,which would be a sample of 60 containers?
DEFINITIONS: In general terms, the minor defects in cans aresmall dents and scratches, major defects are large dents that
...make the cans difficult to open and critical defects Are health
hazards. , .
Solution:.
Since the minor pluS major plus the critical equal five,the total falls between the 2 acceptance level and theseven rejection level; you must proceed to randomly sample
60 containers.
2. Refer to Table 3:
(a) Theb strawberi4es are under a 45% level. You have counted30, 40, 50 fields and the positive fields have been between
'the acceptance or rejection numbers on Table 3. upon count-
., ing 60 fields you have marked 26 positive. Do you accept orreject this sample?
(b) These caneberries come under a 20% level you have counted 50fields and fdand 9 positive for mold. Do you accept, reject
or count 60 fieldaZ.-
Solutiop:
(a) Accept.
(h) Count 60 fields.
41.*
FOOD46
.00
GRAPHS AND TABLESLevel 1
-B. Problem without Solutions
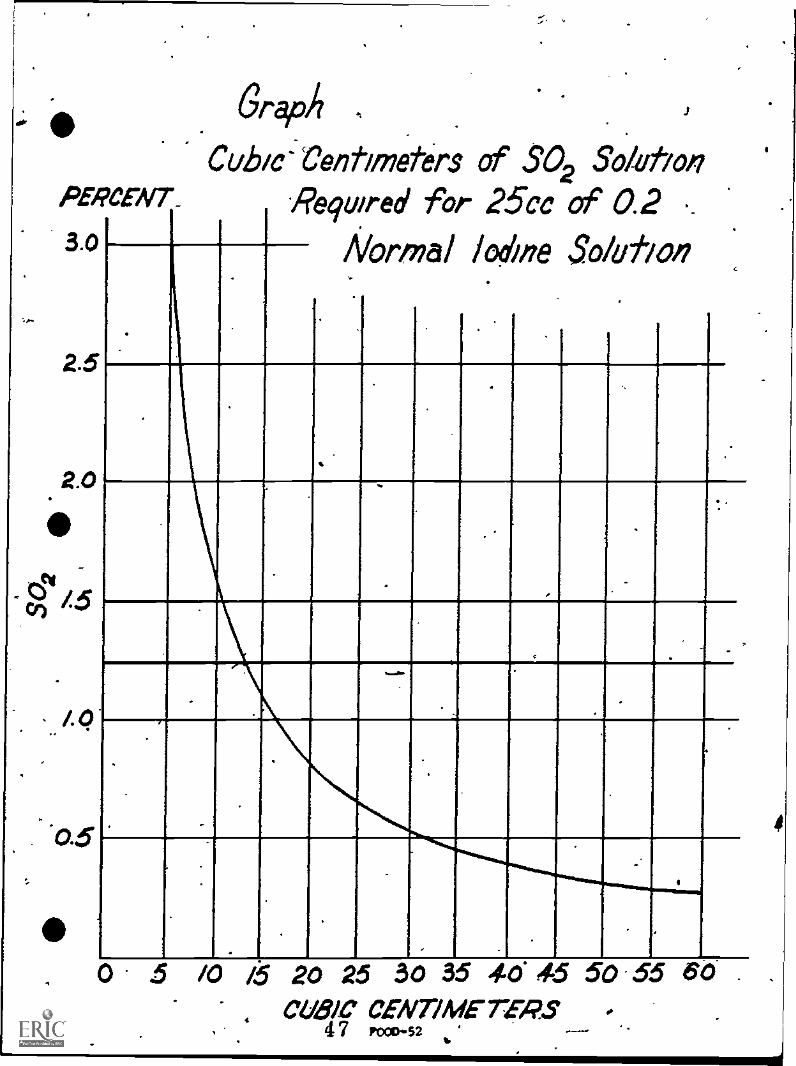
3. Determining SO2 solution from a graph.
Food Processing
S
(a) The amount of solaton:recruired to turn a 4.2 Normalsolution. of Iodine burple was found to tat. 12 cubic centi-
.
neters. Was the Sot solution accentaltIe?
(b) Tne amount of Sr2 solution reguired tr turn a 0.2 Normalsolution of Iodine purnle was founo tc rx 1, cubic cgiti-meters. Was the SO2 solution accortahlc?
4. laeterranlreb02 solution from a orabh.
Refer to the sore grath as pkoV.em 3.
If 30 cubic centimeters.of SO2
solution are reouired to turn
25 c.c. of i..2 :.ormal Iodine Solution rrple. what is .the nor-cent of SO2 in :olutionn?
DFFIN/TION: Estimation of Fruit-Sugar vatio by use of a Table.
Exorable: Follow the horizontal line across the chart to the BrixValue of the finishe4 t:roduct (28.5) . tollrer this vertical COIUMM
downward to the ratiol4Rposite Brix of fruit value of 8.0. Thevalue at the intersertion of the two lines is the theoretical ratio.By 'referring to the tablq,and internolating to the nearest value
shown in the to:4e, a fruit Brix of 8.e ann a finished praeuctBrix of 28.4 in ;.51. 'et
14
pR-
5. (a) If the Brix of tne sweetened product is'22.5 and the Brixof the fruit' was 8.0, what it the ratio of fruit to sugar?
(h) If the Brix of the sweetened product is to he 28.00 and 4parts fruit, one cart sugar. what must the Brix of the fruit,
be?
42
FOOD-47
*
WI*
GRAPHS AND TABLESLevel 1
Ccaplete Solutions to B Problems
A. (a) Acceptable.
(b) Not acceptable.
'Solution = 0.5%
5. (a) Ratio of fruit to sugar = 5.34
(b) Brix of the fruit = 10.n0
t
4 3
Pi00-48
I.
Food Processing
4
--
.1Irmn,
4
TABLE I-A-SAMPLING PLANS or sELLCTE0 AQL'S FOR NORMAL, CONDITION OF CONTAxNER DisPECTIoN
. .
Acceptable quality levelsI
Code Lot Size rangers-Number of vontainern Type of plan Sample eize Crit Major Total
,in lot
''.....i.N.'
Ac Re Ac I Re Ac 1 Re at
. iCA 6,000 or loss Double. 1st 36 (*) I (a): 0 . 4 2 7 E
2d 60Total 96 (;') (a) 3 A 10 : 11
(*),*Reject on ono or more defects

TABLE 2
RATIO PARTS OF FRUIT TO ONE PART SUGAR BY WEIGHT
Brix ofFruit
.Brix of Sweet-ened Product
Brix ofFruit
Brix of Sweet-ened Product
22.5 23.0 27.5 28.0
0.0 . . . . 3.44 3.35 0.0 . . 2.64 12.57
0.5 . . . . 3.52 3.42 0.5 . . 2.69 2.62
1.0 . . . . 3.60 3.50 I.0 . . 2.74 2.671.5 . . . . 3.69 3.58 1.5 . . 2.79 2.72
2.0 . . A,. 3.78 3.67 2.0 . . 2.84 2.772.5 . . . . 3.88 3.70 2.5 . . 2.90 2.82
3.0 . . . 3.97 3.85, 3.0 . . 2.96 2.883.5 . . 4.08 3.95 3.5 . . 3.02 2.94
4.0 . ; . . 4.19 4.05 4.0 . . 3.09 3.004.5 . . . . 4.31 4.16 4.5 . . 3.15 3.06
5.0 . . . . 4.43 4.28 5.0 . . 3.22 3.135.5 . . . . 4.56 4.40 5.5 . . 3.30 3.20
6.0 . . . . 4.70 4.53 6.0 . . 3.37 3.276.5 . . . . 4.84 4.67 . . 3.45 3.35
7.0 . . . . 5.00 4.81 7.0 . . 3.54 3.467.5 . . . . 5.17 4.97 7.5 . . 3.63 3.51
8.0 . . . . 5.34 5.13 8.0 . 3.72 3.608.5 . . 5.54 5.31 8.5 . . 3.82 3.69
9.0 . . . . 5.74 5.50 9.0 . 3.92 3.799.5 . . . .,5.96 5.70 . 9.5 . 4.03 3.89
10 0 6.20 t.92 10.0 . . 4.14 4.0010 5 6.46 6.16 10.5 . . 4.26 4.11
11.0. . . . 6.74 6.447.- 11.0 . . 4.39 4.247.05 6.70 11.5 . . 4.53 4.36
7.38 7.00 12.0 . . 4.68 4.507.75 7.33 12.5 . . 4.83 4.65
45
F001370
.
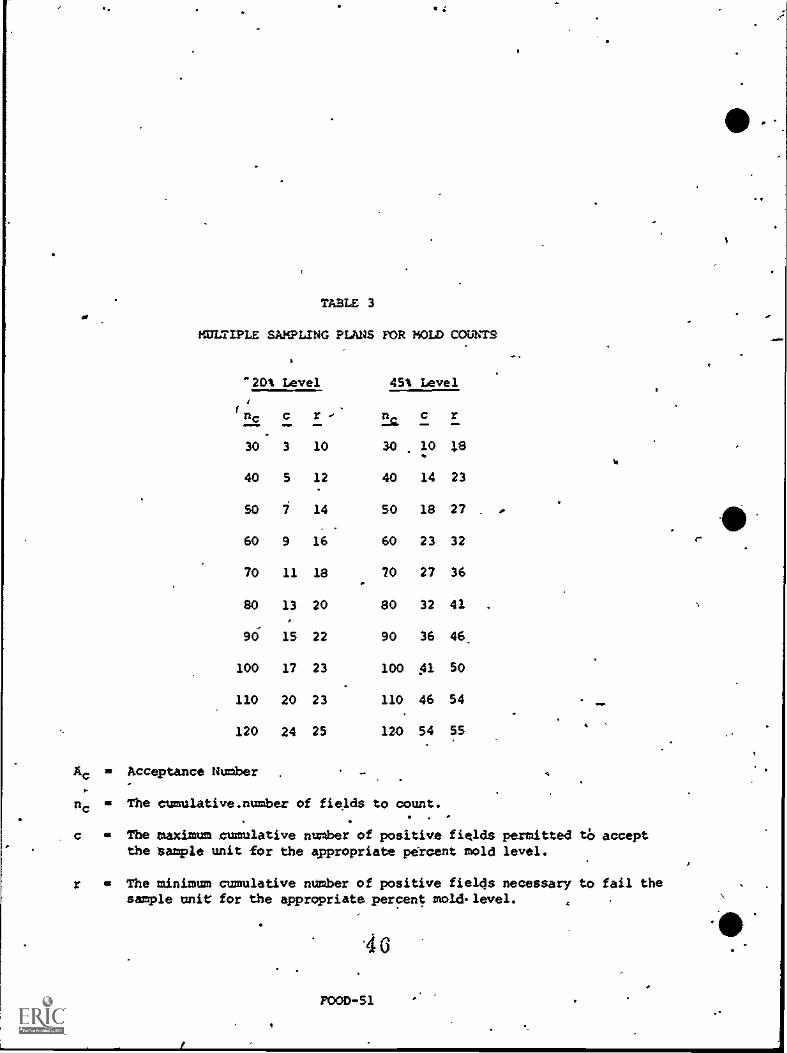
TABLE 3
HULTIPLE SAMPLING PLANS FOR MOLL COUNTS
"20% Level 45% Level
me c r n c r
30 3 10 30 10 16
40 5 12 40 14 23
50 7 14 50 18 27 .
60 9 16 60 23 32 r
70 11 18 70 27 36
80 13 20 80 32 41 .
90 15 22 90 36 46,
100 17 23 100 Ai 50
110 20 23 110 46 54 me.
120 24 25 120 54 55
Ac
nc
=
=
Acceptance Number
The cumulative.nuMber of fields to count.
The maximum cumulative number of positive fields permitted to acceptthe sample unit for the Appropriate percent mold level.
The minimum cumulative nUmber of positive fields necessary to fail thesample unit for the appropriate percent mold level.
46
FOOD -51
C
; 0. .
Cubic-Centimeters of SO2 SolutionPERCENT_ Required for 25cc of 0.2 .3.0 Normal iodine Sokhon
2.5
/.0
0.5
.
4
AL
Nib
II,
4
16
4 0 5 /0 /5 20 25 3o 35 40. 45 50 55 6oCUBIC CENT /METERS
4 7 POCO. 52

L
a
TABLE 10
Containers for Frozen Fruits and Vegetables
Common consumer sizecontainers for frozen fruits and vegetables are 10ounce, 12 ounce, 14 ounce, and 16 ounce packages depending upon the com-modity. Some products are also packed in larger containers for institu-tional and for retail purchases. Vegetables packed,in 2 pound, 2-1/2pound and 5 pound packages and fruits in 2-1/2 pound, 10 pound, 15 pound,and 30 pound containers are most common.
":
The percentage figures for losses in preparation of raw product for freezingare approximate and are given for the purpose of guidance cozily.
Common tApproxinatePackages" Losses in
Vegetables and Usual 'PreparationPacking of Raw Productper ease for Freezing
Cocoon lApproximatePackages .Losses in
Fruits and Usual ; Preparation of'Packing Raw Productsper Case, for Freezing
Asparagus 12-1/2 lb "54% Apples 30 lb 50%.
24-12 oz.
24-10 oz .
Lima Beans 12-2h lb 63% Apricots 30 lb 22%*
24-12 oz 10 lb. 24-1 lbPo
..2.-
k .
' Snap Beins 12-2h lb 21% Blackberries. Barrels 5%24-12 oz 30 lb24-10 oz .
Broccoli 8-4 lb 45% Blueberries Barrels
. 12-2 lb 30 lb
24-10 oz 10 lbI
. 24-1 lb
or less.. ,
Brussels.Sprouts 8-4 lb 45% Cherries6
Barrels 25%12-2 lb 30 lb
24-10 oz 24-1 lb
Carrots 12-2 h lb 50% Peaches 30 lb 33%
101b24-1 lb
P. 4 X44-12 oz
Cauliflower 8-4 lb 70% Prunes and Barrels 15%
11112-2 lb24 -1Q ox
Plums 30 lb
Corn 12-2h lb 76% ..Raspberries Barrels
24-12 oz 30 lb24-1 lb
24-10 of
424-12 oz
P00074'8, --
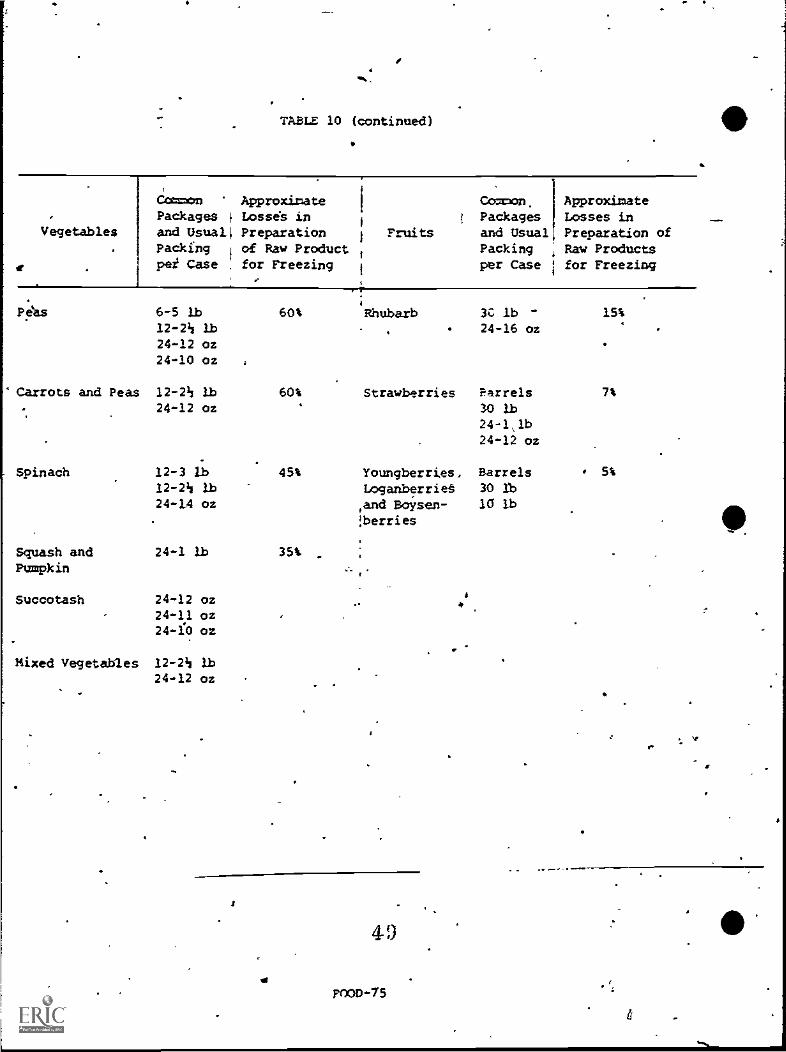
TABLE 10 (continued)
Vegetables
Common Approximate 1
Packages I Losses inand Usuali PreparationPacking of Raw Productpei Case . for Freezing I
Fruits
Common, ApproximatePackages Losses inand Usual Preparation ofPacking Raw Productsper Case for Freezing
Peas 6-5 lb12-231 Lb
24-12 oz24-10 oz
Carrots and Peas 12-211 Lb
24-12 oz
Spinach
Squash andPumpkin
12-3 Lb12-231 Lb
24-14 oz
24-1 Lb
Succotash 24-12 oz24-11 oz24 -1:0 oz
Mixed Vegetables 12-231 lb
24-12 oz
60% Rhubarb 3C lb -24-16 oz
60%
45%
35%
Strawberries
Youngberries,Loganberriet,and Boysen-berries
Barrels
30 Lb24-1,1b24-12 oz
Barrels
30 lb10 lb
15%
7%
5%
49
FOOD-15


![ML 160W E27 220-230V SG 1CT/24 - ML | PHILIPS · ML ML 160W E27 220-230V SG 1CT/24 Mixed Light lamps Product data General Information Cap base E27 [ E27] Burning Position VBU/VBD30](https://img.pdfslide.us/doc/110x75/5fc775ab12d4d65b575cb025/ml-160w-e27-220-230v-sg-1ct24-ml-philips-ml-ml-160w-e27-220-230v-sg-1ct24.jpg)