Embed Size (px)
Citation preview

DOCKETED
Docket Number:
09-AFC-08C
Project Title: Genesis Solar Energy Project
TN #: 211676
Document Title: Spring 2015 Post-Construction Monitoring Report
Description: Quarterly Post-Construction Monitoring Report according to the Bird and Bat Conservation Strategy (BBCS)
Filer: Anwar Ali
Organization: California Energy Commission
Submitter Role: Commission Staff
Submission Date:
5/31/2016 12:34:59 PM
Docketed Date: 5/31/2016

Post-Construction Monitoring at the
Genesis Solar Energy Project
Riverside County, California
2015 Spring Report
Prepared for:
Genesis Solar LLC
700 Universe Blvd.,
Juno Beach, Florida 33408
Prepared by:
Western EcoSystems Technology, Inc.
415 West 17th Street, Suite 2000
Cheyenne, Wyoming
December 9, 2015

Genesis Avian and Bat Monitoring 2015 Spring Report
WEST, Inc. i December 9, 2015
EXECUTIVE SUMMARY
Avian and bat monitoring surveys were conducted from March 05 to May 31, 2015 (the spring
season) at Genesis Solar Energy Project (Project) in accordance with the Project’s Bird and Bat
Conservation Strategy (BBCS). Specifically, standardized carcass searches, searcher efficiency
trials, and carcass persistence trials were conducted. This report represents the first seasonal
report for the first year of monitoring, and summarizes monitoring methods and results for those
surveys based on the procedures and requirements specified in the BBCS.
Standardized carcass searches were conducted 1) in the solar field, consisting of a random
stratified 30% sample of solar troughs of both Project units, 2) at each evaporation pond, 3)
along the perimeter of each power block and beneath each air condensed cooling (ACC) unit, 4)
along inner and outer portions of the “fenceline”, resulting in the equivalent of 100% of the
length of the perimeter fence surveyed, and 5) along 25% of the total length of generation-tie
(gen-tie) and distribution lines from the southernmost Project fence to Wiley’s Well reststop,
which co-occur with the Project access road. Searches were conducted within the spring
season at intervals of approximately seven days.
All bird and bat fatalities and injuries that were discovered by observers, referred to as
“detections” in this report, including those found incidentally and during standardized carcass
searches, were documented. During the reporting period, 53 avian detections (including 2
stranded birds) were made, while there were no detections of bats.
According to specifications of the BBCS, avian detections were categorized by likely diurnal or
nocturnal migration behavior, ecological guild (e.g., raptors, songbirds, etc.), facility component,
and suspected cause of death. These standardized carcass search results, along with searcher
efficiency and carcass persistence rates from bias trials conducted on site, were input into a
fatality estimator model (Huso 2010) to provide a preliminary estimate of the number of fatalities
that occurred at the Project during the reporting period adjusted for sources of bias. The
estimate is considered preliminary because the annual report may pool information from bias
trials and other data across seasons which could affect seasonal estimates.
Carcass persistence was influenced by carcass size. Small carcasses (0-100 g) had a 42.4%
chance of persisting through the 7-day search interval, medium carcasses (101 – 999 g) had a
72.4% chance, and large carcasses (1000+ g) had an 84.5% chance. Mean removal time for
small, medium, and large carcasses was 2.0, 7.3 and 14.6 days, respectively. In the solar field
searcher efficiency was 92.3% over all carcass size classes. Along the gen-tie and distribution
lines, searcher efficiency was influenced by carcass size: 42.9% for small birds, 100% for
medium birds, and 100% for large birds.
Using the Huso (2010) fatality estimator model, during the spring period 2015, there were an
estimated total 234 fatalities (90% confidence interval [CI]: 124 - 430) at the Project. Of these,
55 fatalities (23.4%) were estimated for the SCAs, 44 fatalities (18.6%) were estimated for the
Genesis Avian and Bat Monitoring 2015 Spring Report
WEST, Inc. ii December 9, 2015
fence, 9 fatalities (4.0%) were estimated for evaporation ponds, 5 fatalities (2.2%) were
estimated for power blocks, and 121 fatalities (51.8%; 90% CI: 32 - 307) were estimated for the
gen-tie and distribution lines and project road. An estimated 113 (90% CI: 60 – 188) fatalities
(0.065/acre, 0.434/nameplate MW) occurred for all components associated with both solar units
(SCAs, power block, evaporation ponds, and along the perimeter fence, combined).
Genesis Avian and Bat Monitoring 2015 Spring Report
WEST, Inc. iii December 9, 2015
STUDY PARTICIPANTS
Western EcoSystems TechnologyWallace Erickson Project Manager/Senior StatisticianTracey Johnson Research BiologistPaul Rabie StatisticianAndrea Polachek Technical EditorTracey Johnson Field SupervisorPamela Bullard Designated Biologist
REPORT REFERENCE
Western Ecosystems Technology, Inc. (WEST). 2015. Post-construction monitoring at the
Genesis Solar Energy Project, Riverside County, California. 2015 Spring Report. 31 pp.

Genesis Avian and Bat Monitoring 2015 Spring Report
WEST, Inc. 1 December 9, 2015
TABLE OF CONTENTS
EXECUTIVE SUMMARY .............................................................................................................i
1.0 INTRODUCTION ............................................................................................................. 4
1.1 Project Background...................................................................................................... 4
1.2 Monitoring Plan Overview and Goals ........................................................................... 4
1.3 Purpose of This Report ................................................................................................ 4
2.0 METHODS....................................................................................................................... 7
2.1 Standardized Carcass Searches.................................................................................. 7
2.1.1 Areas Surveyed .................................................................................................... 7
2.1.2 Search Frequency and Timing .............................................................................. 7
2.1.3 Search Methods...................................................................................................12
2.2 Carcass Persistence Trials .........................................................................................13
2.2.1 Carcass Persistence Data Collection ...................................................................13
2.2.2 Estimating Carcass Persistence Times................................................................14
2.3 Searcher Efficiency Trials ...........................................................................................14
2.3.1 Searcher Efficiency Data Collection .....................................................................14
2.3.2 Estimating Searcher Efficiency ............................................................................15
2.4 Fatality Estimator ........................................................................................................15
2.5 Incidental Reporting ....................................................................................................16
3.0 MONITORING RESULTS ...............................................................................................17
3.1 Summary of Avian Detections.....................................................................................17
3.2 Temporal Patterns of Avian Detections .......................................................................21
3.3 Spatial Distribution of Avian Detections.......................................................................21
3.3.1 Detections by Project Component........................................................................21
3.3.2 Feather Spot Detections ......................................................................................22
3.4 Detections of Stranded Birds ......................................................................................23
3.5 Summary of Bat Detections ........................................................................................23
3.6 Carcass Persistence Trials .........................................................................................24
3.7 Searcher Efficiency Trials ...........................................................................................24
3.8 Fatality Estimates........................................................................................................26
4.0 DISCUSSION..................................................................................................................26
4.1 Carcass Persistence and Searcher Efficiency Trials ...................................................27
4.2 Distribution of Fatalities and Fatality Estimates ...........................................................27
5.0 LITERATURE CITED......................................................................................................29
Genesis Avian and Bat Monitoring 2015 Spring Report
WEST, Inc. 2 December 9, 2015
LIST OF TABLES
Table 1. Areas included in standardized carcass searches at the Genesis Solar Energy
Project during spring 2015..........................................................................................10
Table 2. Number of individual bird detections, by species, during spring 2015 at the
Genesis Solar Energy Project, Riverside County, California. ......................................18
Table 3. Total avian detections by Project component and detection category during
spring 2015 at the Genesis Solar Energy Project, Riverside County, California..........22
Table 4. Total avian detections (including incidentals) by Project component and
suspected cause of death during spring 2015 at the Genesis Solar Energy Project,
Riverside County, California. ......................................................................................22
LIST OF FIGURES
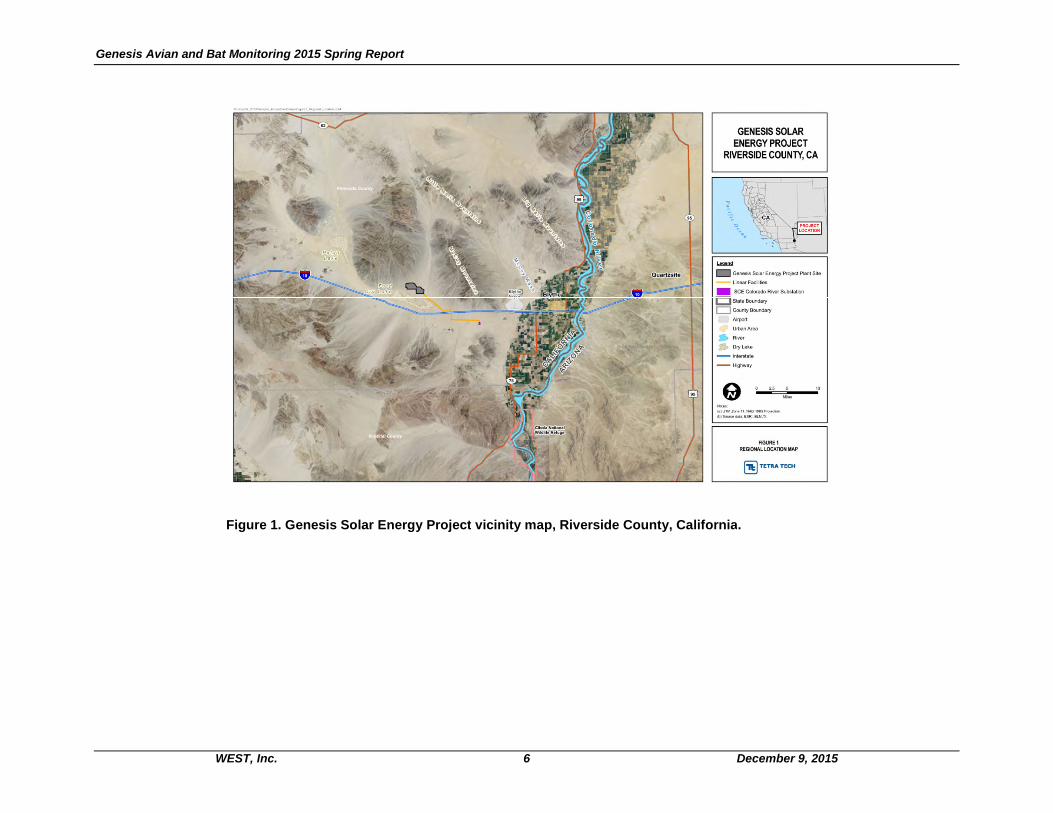
Figure 1. Genesis Solar Energy Project vicinity map, Riverside County, California. ................ 6
Figure 2. Areas of standardized searches and detections (those made during searches
and those made incidental to operations and maintenance) at Unit 1 of the
Genesis Solar Energy Project spring 2015. ................................................................. 8
Figure 3. Areas of standardized searches and detections (those made during searches
and those made incidental to operations and maintenance) at Unit 2 of the
Genesis Solar Energy Project during spring 2015. ...................................................... 9
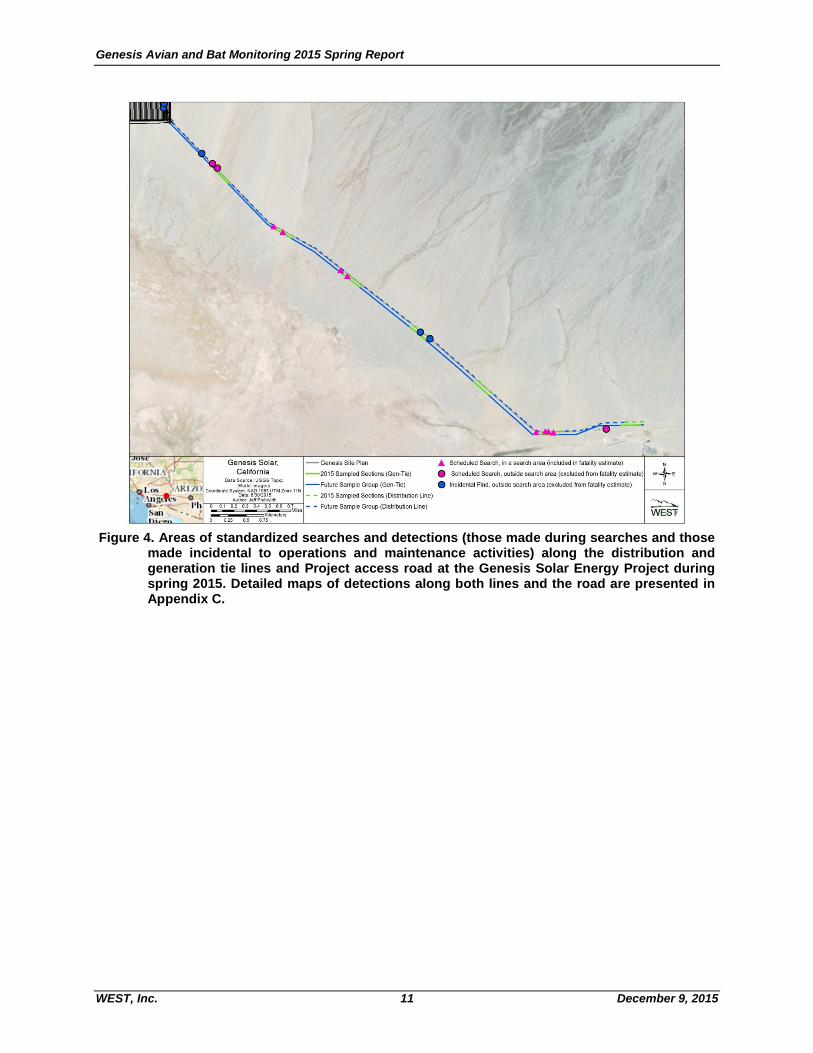
Figure 4. Areas of standardized searches and detections (those made during searches
and those made incidental to operations and maintenance activities) along the
distribution and generation tie lines and Project access road at the Genesis Solar
Energy Project during spring 2015. Detailed maps of detections along both lines
and the road are presented in Appendix C. ................................................................11
Figure 5. Total number of detections by date during spring 2015 at the Genesis Solar
Energy Project, Riverside County, California. .............................................................21
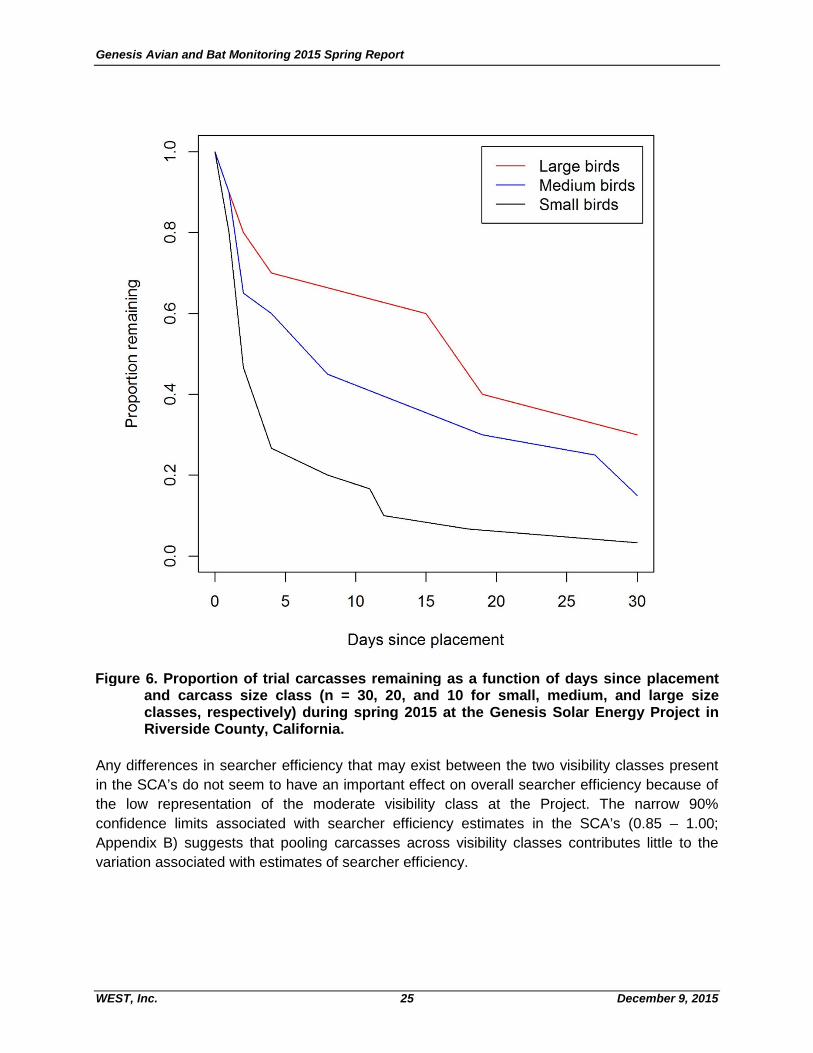
Figure 6. Proportion of trial carcasses remaining as a function of days since placement
and carcass size class (n = 30, 20, and 10 for small, medium, and large size
classes, respectively) during spring 2015 at the Genesis Solar Energy Project in
Riverside County, California. ......................................................................................25
LIST OF APPENDICES
Appendix A. Weather Conditions and Body Weights Associated with Avian Detections
Estimated to be Less Than 24 Hours Old during spring 2015

Genesis Avian and Bat Monitoring 2015 Spring Report
WEST, Inc. 3 December 9, 2015
Appendix B. Correction Factors and Bird Fatality Rates at the Genesis Solar Energy
Project during spring of 2015.
Appendix C. Detailed Areas of Standardized Searches and Carcass Locations along the
Distribution and Generation Tie Lines of the Genesis Solar Energy Project during
spring 2015.

Genesis Avian and Bat Monitoring 2015 Spring Report
WEST, Inc. 4 December 9, 2015
1.0 INTRODUCTION
1.1 Project Background
The Genesis Solar Energy Project (referred to in this report as "Project") consists of two solar
power electrical generating facilities (Units 1 and 2) with a combined net capacity of 250
megawatts. The Project facility consists collectively of two power blocks, power generating
equipment (solar collector assemblies [SCAs] of mirrored parabolic troughs [solar troughs or
troughs]), support facilities, and evaporation ponds. Linear facilities include a transmission line,
distribution line, natural gas pipeline, and a main access road that are mostly co-located for
approximately 10.5 km (6.5 miles). The Project comprises approximately 1,800 acres (728
hectares [ha]). The solar field and associated structures comprise 1,727 acres (699 ha) and
linear facilities comprise 93 acres (38 ha). The Project is located on land managed by the
Bureau of Land Management (BLM) 25 miles (40 kilometers [km]) west of Blythe, in Riverside
County, California (Figure 1).
1.2 Monitoring Plan Overview and Goals
A Bird and Bat Conservation Strategy (2015; “BBCS”) was prepared by the Project proponent in
collaboration with the U.S. Fish and Wildlife Service (USFWS), California Department of Fish
and Wildlife (CDFW), California Energy Commission (CEC), and Bureau of Land Management
(BLM) to guide comprehensive monitoring of impacts to birds and bats associated with
operation of the Project. Final agency acceptance of the BBCS occurred in March 2015.
The BBCS details post-construction monitoring to be conducted and the data analysis and
reporting processes that will be implemented by Genesis Solar in collaboration with the
USFWS, CDFW, CEC, and BLM. As identified in the BBCS, they are:
1. Estimate overall annual avian fatality rate and species composition associated with the
Project infrastructure. This estimate will include mortality associated with SCAs,
overhead lines including the generation (gen-tie) line, perimeter fence and other features
of the Project that may result in injury and fatality.
2. Determine whether there are spatial and temporal/seasonal patterns of mortality
associated with project infrastructure (e.g., different fatality rates near SCAs on the edge
of the solar field versus the interior area of the solar field).
3. Provide information that will assist the CEC and BLM, in consultation with the USFWS
and the CDFW, in understanding which species and potentially which regional
populations are at risk.
4. Collect data in such a way that the CEC and BLM, in consultation with the USFWS and
CDFW, may make comparisons with other solar sites.
1.3 Purpose of This Report
This report represents the first seasonal report for the first year of monitoring summarizing
monitoring methods and results for avian and bat fatalities and injuries based on the procedures

Genesis Avian and Bat Monitoring 2015 Spring Report
WEST, Inc. 5 December 9, 2015
and requirements specified in the approved BBCS and as required by CEC Condition of
Certification BIO-16. This report covers the 2015 spring season, which includes the period from
March 01 to May 31, 2015. As stated in the approved BBCS, this seasonal report includes the
observed fatality rates broken out by likely diurnal, and likely nocturnal species, and for
ecological guilds of interest (e.g., raptors, water-associated birds, passerines), for each of the
facility types and suspected causes of death. Species composition of carcasses and the results
of the bias trials are also reported. This report presents information related to the spatial
distribution of carcasses, but no formal statistical analysis will be conducted until the end of the
monitoring year, given the limited data presently available.
Genesis Avian and Bat Monitoring 2015 Spring Report
WEST, Inc. 6 December 9, 2015
Figure 1. Genesis Solar Energy Project vicinity map, Riverside County, California.
Genesis Avian and Bat Monitoring 2015 Spring Report
WEST, Inc. 7 December 9, 2015
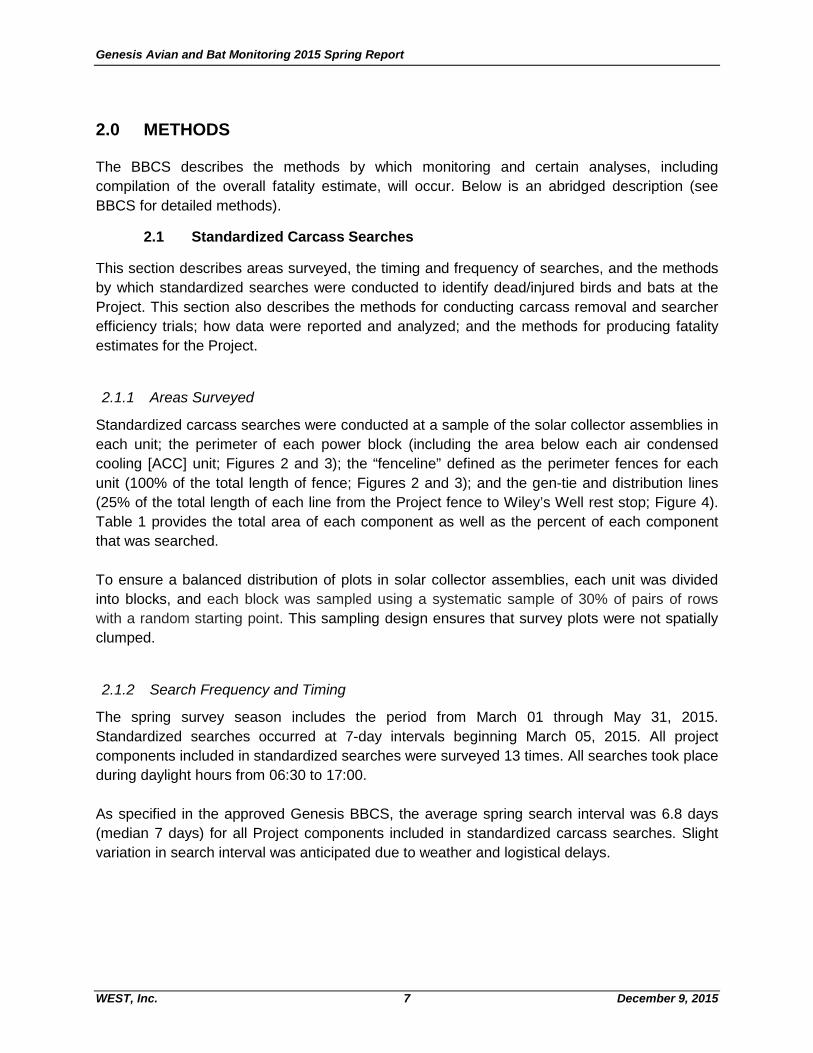
2.0 METHODS
The BBCS describes the methods by which monitoring and certain analyses, including
compilation of the overall fatality estimate, will occur. Below is an abridged description (see
BBCS for detailed methods).
2.1 Standardized Carcass Searches
This section describes areas surveyed, the timing and frequency of searches, and the methods
by which standardized searches were conducted to identify dead/injured birds and bats at the
Project. This section also describes the methods for conducting carcass removal and searcher
efficiency trials; how data were reported and analyzed; and the methods for producing fatality
estimates for the Project.
2.1.1 Areas Surveyed
Standardized carcass searches were conducted at a sample of the solar collector assemblies in
each unit; the perimeter of each power block (including the area below each air condensed
cooling [ACC] unit; Figures 2 and 3); the “fenceline” defined as the perimeter fences for each
unit (100% of the total length of fence; Figures 2 and 3); and the gen-tie and distribution lines
(25% of the total length of each line from the Project fence to Wiley’s Well rest stop; Figure 4).
Table 1 provides the total area of each component as well as the percent of each component
that was searched.
To ensure a balanced distribution of plots in solar collector assemblies, each unit was divided
into blocks, and each block was sampled using a systematic sample of 30% of pairs of rows
with a random starting point. This sampling design ensures that survey plots were not spatially
clumped.
2.1.2 Search Frequency and Timing
The spring survey season includes the period from March 01 through May 31, 2015.
Standardized searches occurred at 7-day intervals beginning March 05, 2015. All project
components included in standardized searches were surveyed 13 times. All searches took place
during daylight hours from 06:30 to 17:00.
As specified in the approved Genesis BBCS, the average spring search interval was 6.8 days
(median 7 days) for all Project components included in standardized carcass searches. Slight
variation in search interval was anticipated due to weather and logistical delays.
Genesis Avian and Bat Monitoring 2015 Spring Report
WEST, Inc. 8 December 9, 2015
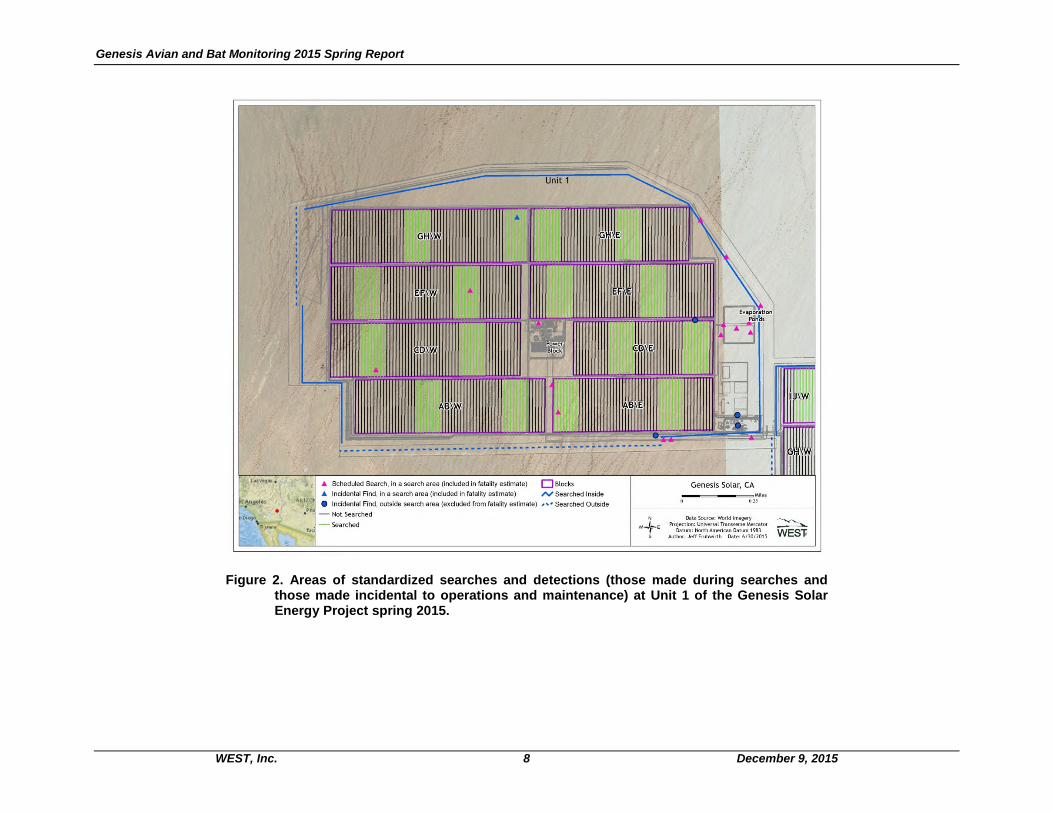
Figure 2. Areas of standardized searches and detections (those made during searches andthose made incidental to operations and maintenance) at Unit 1 of the Genesis SolarEnergy Project spring 2015.
Genesis Avian and Bat Monitoring 2015 Spring Report
WEST, Inc. 9 December 9, 2015
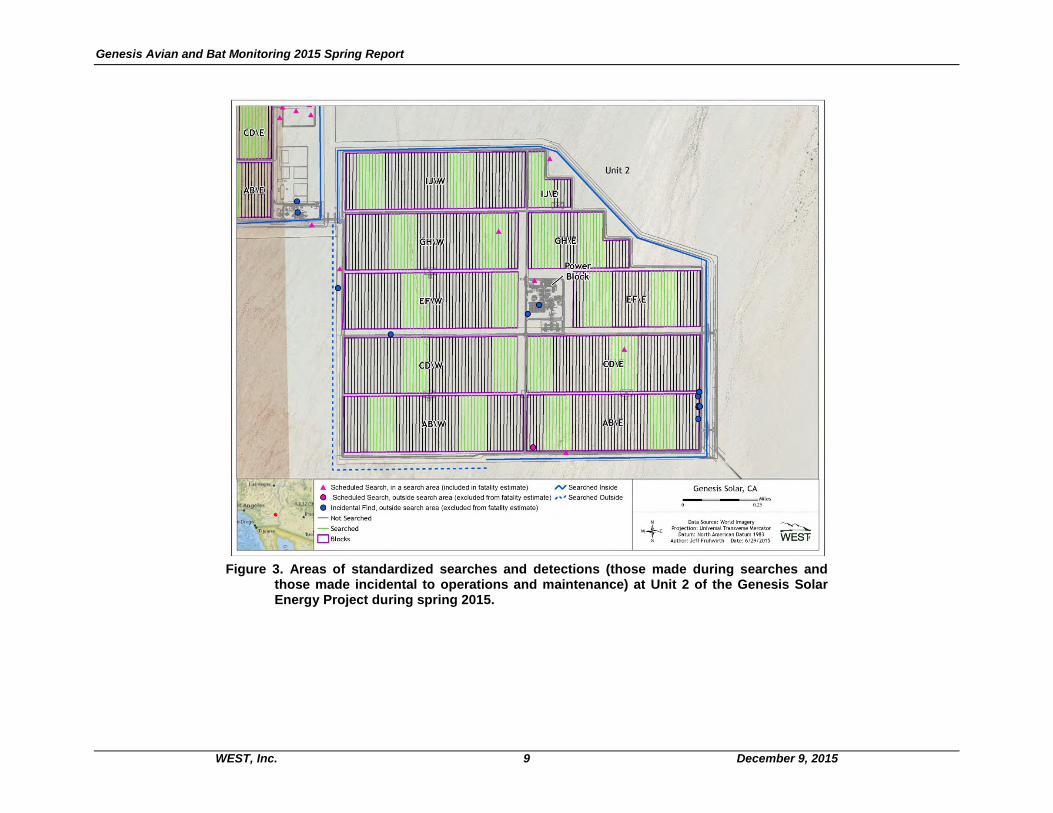
Figure 3. Areas of standardized searches and detections (those made during searches andthose made incidental to operations and maintenance) at Unit 2 of the Genesis SolarEnergy Project during spring 2015.
Genesis Avian and Bat Monitoring 2015 Spring Report
WEST, Inc. 10 December 9, 2015
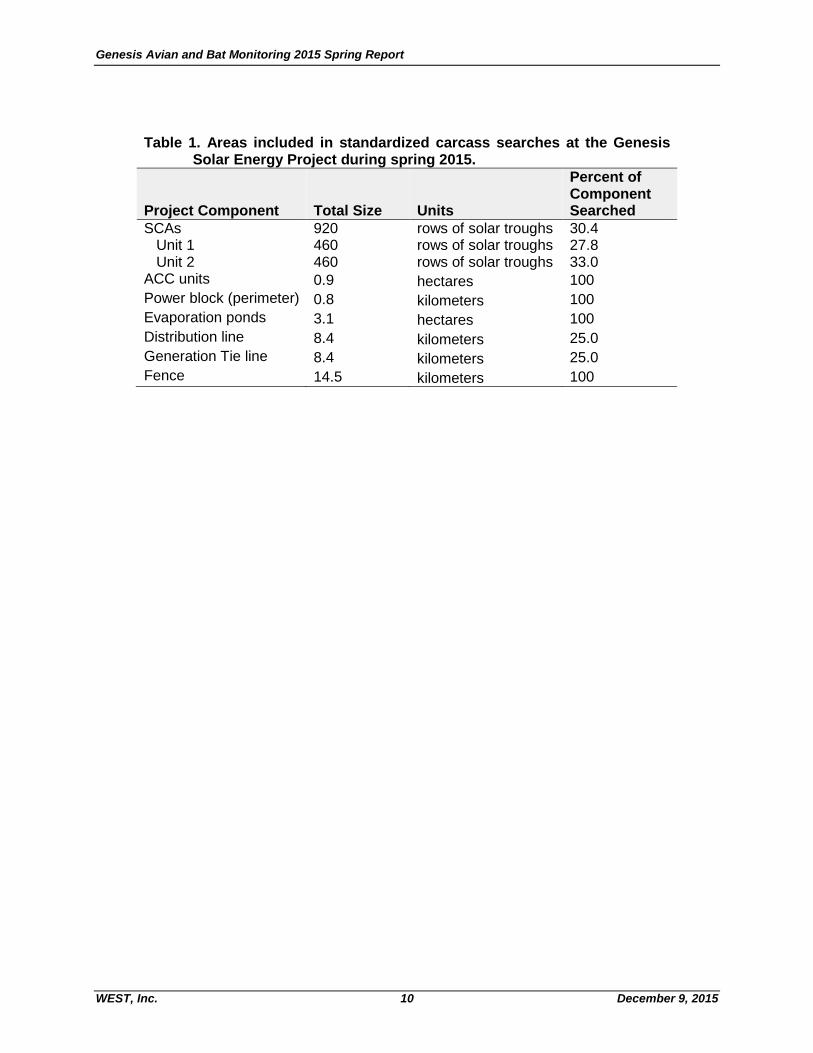
Table 1. Areas included in standardized carcass searches at the GenesisSolar Energy Project during spring 2015.
Project Component Total Size Units
Percent ofComponentSearched
SCAs 920 rows of solar troughs 30.4Unit 1 460 rows of solar troughs 27.8Unit 2 460 rows of solar troughs 33.0
ACC units 0.9 hectares 100Power block (perimeter) 0.8 kilometers 100Evaporation ponds 3.1 hectares 100Distribution line 8.4 kilometers 25.0Generation Tie line 8.4 kilometers 25.0Fence 14.5 kilometers 100
Genesis Avian and Bat Monitoring 2015 Spring Report
WEST, Inc. 11 December 9, 2015
Figure 4. Areas of standardized searches and detections (those made during searches and thosemade incidental to operations and maintenance activities) along the distribution andgeneration tie lines and Project access road at the Genesis Solar Energy Project duringspring 2015. Detailed maps of detections along both lines and the road are presented inAppendix C.
Genesis Avian and Bat Monitoring 2015 Spring Report
WEST, Inc. 12 December 9, 2015
2.1.3 Search Methods
Standardized carcass searches were performed by CEC and BLM-approved biologists, in
accordance with methods outlined in the BBCS.
Within the solar collector assemblies, 280 solar troughs (30.4% of the total number of troughs)
were surveyed by vehicle. Biologists slowly drove (≤5 mph) parallel to troughs and centered
between rows, searching ahead and to the driver’s side of the vehicle for bird and bat
carcasses. Biologists scanned out to a perpendicular distance of approximately 30 m, or the
ground area encompassing two rows of solar troughs.
At each power block, biologists slowly walked around the entire perimeter looking for dead and
injured birds and bats, and used binoculars to scan interior portions of the powerblock. Beneath
ACC units, biologists walked four evenly-spaced transects through the gravel. The search area
for the power block is defined as the 0.8 km of perimeter of each power block, and the area of
the interior power block that was available for visual inspection from the periphery.
At each evaporation pond, biologists walked the entire perimeter looking for dead and injured
birds and bats on the ground, in the netting, and in the pond below the netting. Binoculars or a
spotting scope were used to scan across the top of the netting and the surface of each pond.
An area equivalent to the entire length of fenceline (approximately 12 miles) was searched by
vehicle. Biologists searched an approximately 1.5 to 2.5 miles (2.4 km) along drivable sections
of the outside of the fence, and the remaining 9.5 to 10.5 miles (16.9 km) were surveyed from
the inside of the fence (Figures 2 and 3). Travel speed was below five mph while searching.
The gen-tie and distribution lines were surveyed using a 15-m wide strip transect (i.e., 7.5 m of
ground on either side of the overhead line). A 25% sample of both lines from the Project fence
to the Project outer gate located near the Wiley’s Well Road rest stop were searched for
carcasses. Biologists slowly walked every fourth 300-ft segment of each line, scanning for dead
or injured birds or bats within 7.5 m (24.6 ft) of the transect line. Given the location of the lines
relative to the road, detections found in the strip transects below overhead lines could be
caused by collision with an overhead line, vehicles along the road, predation, or some
combination thereof.
Once a carcass was detected, it was then photographed, and data were recorded according to
specifications outlined in section 6.0 of the approved Genesis BBCS. Carcasses detected
before amendment of the WEST California Scientific Collecting Permit (Permit # 3790) were
covered and secured in place until permission was granted from California Department of Fish
and Wildlife to handle carcasses on April 21, 2015. Since that date, all carcasses have been
retrieved from their location on the ground, labeled, and placed in a freezer on site.
Genesis Avian and Bat Monitoring 2015 Spring Report
WEST, Inc. 13 December 9, 2015
For each detection, suspected cause of death was assigned based on evidence available from
the detection, evidence available on Project infrastructure, and proximity of the detection to
Project infrastructure. Detections that had evidence of scavenging and lacked evidence on
Project infrastructure were assigned as “unknown” because it can’t be determined whether the
event was caused by predation or interaction with project infrastructure. Detections that were
intact (i.e., no evidence of scavenging) and located in close proximity to Project infrastructure
(e.g., found directly beneath overhead lines) had a suspected cause of death attributed to the
respective Project component. However, it should be noted that there is substantial uncertainty
associated with cause of death assignments because no events were directly observed.
Detections assigned to the “unknown” category were included in fatality estimates if they were
located within standardized carcass search areas.
2.2 Carcass Persistence Trials
Carcass persistence trials were conducted throughout the spring period. Carcasses from three
size classes (small [0-100 g], medium [101-999], and large [1000+ g]) were used for trials. The
small size class comprised house sparrows (Passer domesticus) and 2-3 week old coturnix
quail (Coturnix coturnix), the medium size class comprised rock pigeons (Columba livia), and
the large size class comprised hen mallard (Anas platyrhynchos) and hen ring-necked pheasant
(Phasianus colchicus).
2.2.1 Carcass Persistence Data Collection
To quantify carcass persistence rates, 15 small, 10 medium, and five large carcasses were
randomly placed and monitored within the SCAs (including the fence line), and the same
number of each size class were placed along the gen-tie and distribution lines, for a total of 60
carcass persistence trials at Genesis during the spring 2015 season, as specified in the
approved Genesis BBCS. Fifteen carcasses within the Project fence (within SCAs and along the
fence and perimeter of power blocks) and four carcasses along the gen-tie and distribution lines
were monitored using motion-triggered digital trail cameras, while the remaining carcasses were
visited on foot, for 30 days or until the carcass had deteriorated to a condition at which it would
no longer qualify as a documentable fatality. Fewer carcasses along the gen-tie and distribution
lines were monitored with cameras because of theft and vandalism concerns. Carcasses
without trail cameras were visited and photographed once per day for the first four days, and
then every three to five days until the end of the monitoring period. To avoid training scavengers
to recognize cameras as “feeding stations”, trail cameras were installed five days before
specimens were placed, and fake cameras without bias trial carcasses were also placed (eight
within the Project fence, and four along the gen-tie and distribution lines). Periodic ground-
based checking of carcasses with trail cameras also occured to guard against misleading
indicators of carcass removal, such as wind blowing the carcass out of the camera’s field of
view. To minimize potential bias caused by scavenger swamping (Smallwood 2007, Smallwood
et al. 2010), carcass-persistence specimens were distributed across the entire Project, not just
Genesis Avian and Bat Monitoring 2015 Spring Report
WEST, Inc. 14 December 9, 2015
in areas subject to standard searches, and trials were initiated in small numbers on four different
dates throughout the spring season.
2.2.2 Estimating Carcass Persistence Times
Measurements of carcass persistence rates were subject to censoring. In this context,
censoring refers to the instance when a value (e.g. days a carcass is present before being
removed) may not be known exactly, but is known to be within a finite range. For example,
suppose a carcass was checked on day 7 and was present, and was checked again on day 10,
but was found to be missing. The exact time until removal is unknown; however, it is known that
the carcass became unavailable at some point between 7 and 10 days. This carcass would be
considered “interval censored”. Similarly, if a carcass lasts the entire 30-day trial period, that
carcass is “right censored”— it is known that the carcass lasted at least 30 days, but it may
have persisted longer. Because carcass persistence data were censored, persistence was
analyzed using methods that can accommodate censored data and still produce unbiased
estimates of the probability of persistence (Therneau 2015, Therneau and Grambsch 2000).
USGS-developed fatality estimator software (Huso et al 2012) was used to fit survival models to
the censored carcass persistence data. There were four distributions implemented in survival
models used to estimate the probability a carcass is unscavenged and available to be found at
the end of the search interval (r): exponential, Weibull, loglogistic, and lognormal. These four
distributions exhibit varying degrees of flexibility in order to model a wide variety of distributions
of persistence time. Akaike’s Information Criterion adjusted for sample size (AICc; Akaike 1973)
was used to rank the fit of each survival model to observed carcass persistence data.
2.3 Searcher Efficiency Trials
Searcher efficiency trials were conducted throughout the spring period. Carcasses from three
size classes (small, medium, and large) were used for trials. The small size class comprised
house sparrows and 2-3 week old coturnix quail, the medium size class comprised rock
pigeons, and the large size class comprised hen mallards and hen ring-necked pheasants.
2.3.1 Searcher Efficiency Data Collection
A total of 60 searcher efficiency trial carcasses (i.e., 15 small birds, 10 medium birds, and five
large birds within SCAs, power blocks, and along the perimeter fence, and the same number of
each size class along the gen-tie and distribution lines) were placed at the Project during the
2015 spring season, as agreed upon in section 6.4 of the approved Genesis BBCS. Locations
for trials were chosen by taking a randomized sample of all locations included in standardized
carcass searches. Trials were placed in various vegetation heights and in areas that had
different soil and vegetation colors and values to represent the range of conditions under which
searches occur. They were placed in all areas where standardized searches occur except the
evaporation ponds.
Genesis Avian and Bat Monitoring 2015 Spring Report
WEST, Inc. 15 December 9, 2015
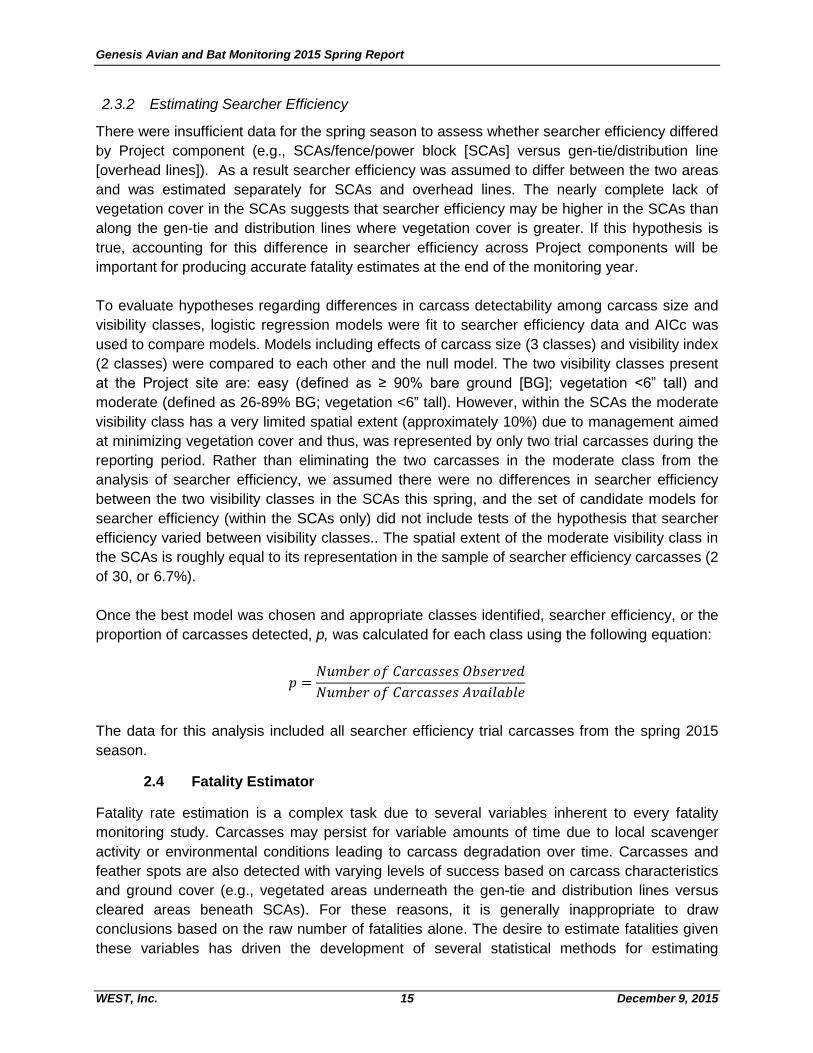
2.3.2 Estimating Searcher Efficiency
There were insufficient data for the spring season to assess whether searcher efficiency differed
by Project component (e.g., SCAs/fence/power block [SCAs] versus gen-tie/distribution line
[overhead lines]). As a result searcher efficiency was assumed to differ between the two areas
and was estimated separately for SCAs and overhead lines. The nearly complete lack of
vegetation cover in the SCAs suggests that searcher efficiency may be higher in the SCAs than
along the gen-tie and distribution lines where vegetation cover is greater. If this hypothesis is
true, accounting for this difference in searcher efficiency across Project components will be
important for producing accurate fatality estimates at the end of the monitoring year.
To evaluate hypotheses regarding differences in carcass detectability among carcass size and
visibility classes, logistic regression models were fit to searcher efficiency data and AICc was
used to compare models. Models including effects of carcass size (3 classes) and visibility index
(2 classes) were compared to each other and the null model. The two visibility classes present
at the Project site are: easy (defined as ≥ 90% bare ground [BG]; vegetation <6” tall) and
moderate (defined as 26-89% BG; vegetation <6” tall). However, within the SCAs the moderate
visibility class has a very limited spatial extent (approximately 10%) due to management aimed
at minimizing vegetation cover and thus, was represented by only two trial carcasses during the
reporting period. Rather than eliminating the two carcasses in the moderate class from the
analysis of searcher efficiency, we assumed there were no differences in searcher efficiency
between the two visibility classes in the SCAs this spring, and the set of candidate models for
searcher efficiency (within the SCAs only) did not include tests of the hypothesis that searcher
efficiency varied between visibility classes.. The spatial extent of the moderate visibility class in
the SCAs is roughly equal to its representation in the sample of searcher efficiency carcasses (2
of 30, or 6.7%).
Once the best model was chosen and appropriate classes identified, searcher efficiency, or the
proportion of carcasses detected, p, was calculated for each class using the following equation:
� =������ �� ��������� ��������
������ �� ��������� ���������
The data for this analysis included all searcher efficiency trial carcasses from the spring 2015
season.
2.4 Fatality Estimator
Fatality rate estimation is a complex task due to several variables inherent to every fatality
monitoring study. Carcasses may persist for variable amounts of time due to local scavenger
activity or environmental conditions leading to carcass degradation over time. Carcasses and
feather spots are also detected with varying levels of success based on carcass characteristics
and ground cover (e.g., vegetated areas underneath the gen-tie and distribution lines versus
cleared areas beneath SCAs). For these reasons, it is generally inappropriate to draw
conclusions based on the raw number of fatalities alone. The desire to estimate fatalities given
these variables has driven the development of several statistical methods for estimating
Genesis Avian and Bat Monitoring 2015 Spring Report
WEST, Inc. 16 December 9, 2015
fatalities (e.g., Smallwood 2007, Huso 2010, Korner-Nievergelt 2011). All of these fatality
estimation methods share a similar underlying model. Generally, the fatality estimation for a
given site may be written as:
F=C/rp,
where F is the total number of fatalities, C is the number fatalities detected and included in
fatality estimation, r is the probability a carcass is unscavenged and available to be found at the
end of the search interval, and p is the probability of detecting a carcass (Huso 2010).
All fatality estimates were calculated using the Huso estimator, as well as 90% confidence using
bootstrapping (Manly 1997). Bootstrapping is a computer simulation technique that is useful for
calculating point estimates, variances, and confidence intervals for complicated test statistics. A
total of 1,000 bootstrap replicates were used. The lower 5th and upper 95th percentiles of the
1,000 bootstrap estimates provide estimates of the lower limit and upper limit of an approximate
90% confidence interval on all estimates.
2.5 Incidental Reporting
Some detections were outside standardized search areas, or were within search areas but not
observed during standardized searches. Such detections were found by WEST avian biologists
and operational personnel and were considered “incidental” detections. When found by
operational personnel, these detections were reported to WEST avian biologists for
documentation. Data on incidental detections are reported here, as well as in the SPUT Avian
Injury and Mortality Report Forms March – May 2015. All detections made in search areas were
included in fatality estimates, regardless of whether they were detected incidentally or during
searches.
Genesis Avian and Bat Monitoring 2015 Spring Report
WEST, Inc. 17 December 9, 2015
3.0 MONITORING RESULTS
3.1 Summary of Avian Detections
During spring 2015, a total of 53 avian detections (including stranded birds and incidentals) of
23 identified species were recorded (Table 2). The most numerous detection of an identified
species was Wilson’s warbler (Cardellina pusilla), but with only three detections. Most
detections (n = 22, or 41.5% of total detections) occurred beneath overhead lines (Figures 2, 3,
and 4; Tables 2, 3, and 4), but those detections along the gen-tie and distribution lines are co-
located with the road. Additionally, of the 22 detections beneath the overhead lines, 27.3% (or 6
detections) were feather spots. Thirty-five (66.0%) detections were made during standardized
carcass searches and 18 (34.0%) were documented as incidentals.
Genesis Avian and Bat Monitoring 2015 Spring Report
WEST, Inc. 18 December 9, 2015
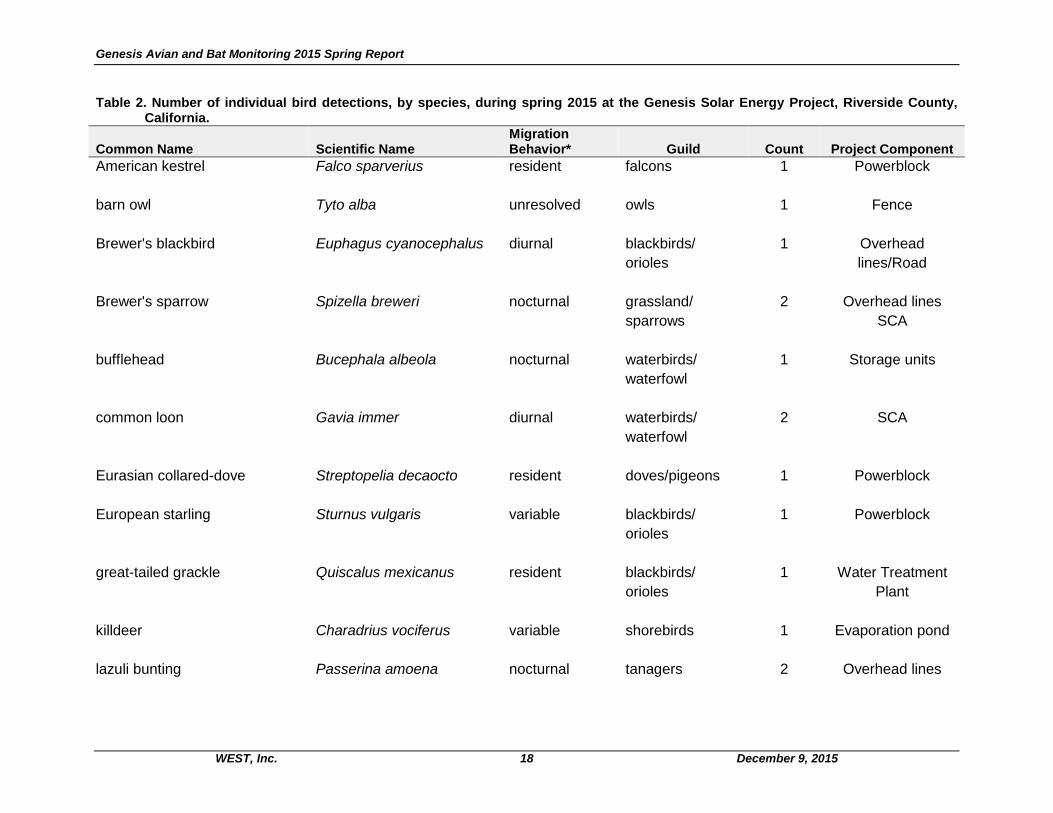
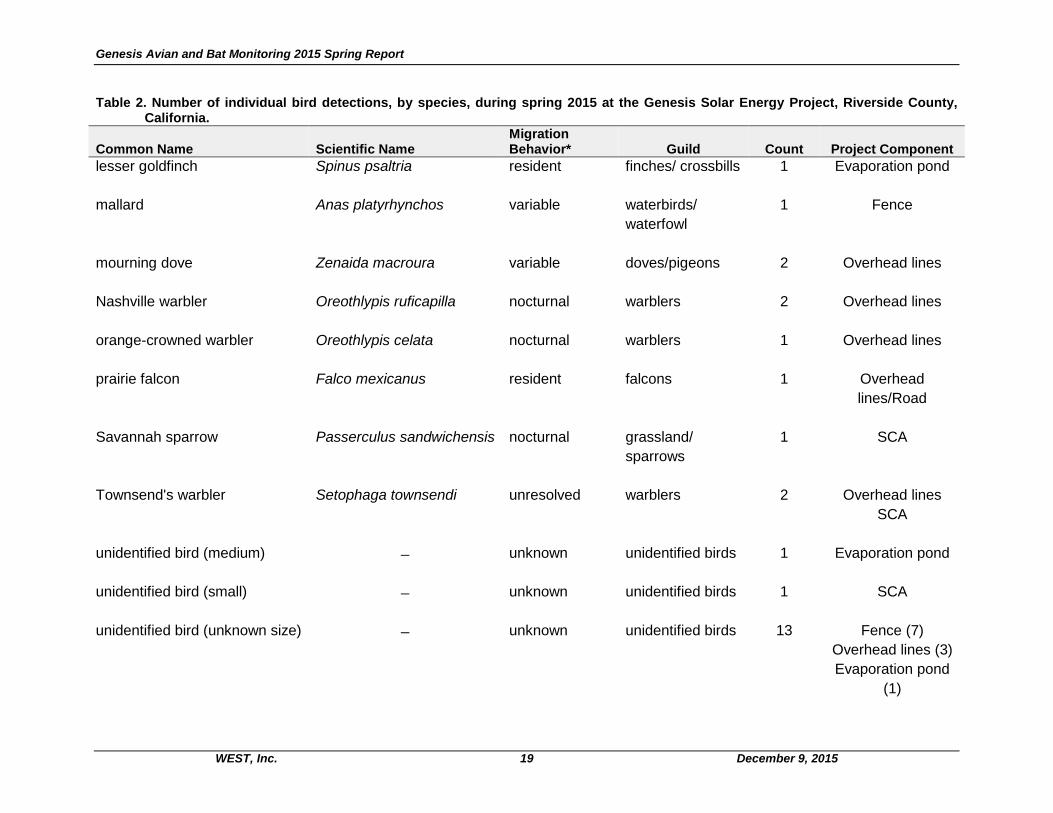
Table 2. Number of individual bird detections, by species, during spring 2015 at the Genesis Solar Energy Project, Riverside County,California.
Common Name Scientific NameMigrationBehavior* Guild Count Project Component
American kestrel Falco sparverius resident falcons 1 Powerblock
barn owl Tyto alba unresolved owls 1 Fence
Brewer's blackbird Euphagus cyanocephalus diurnal blackbirds/
orioles
1 Overhead
lines/Road
Brewer's sparrow Spizella breweri nocturnal grassland/
sparrows
2 Overhead lines
SCA
bufflehead Bucephala albeola nocturnal waterbirds/
waterfowl
1 Storage units
common loon Gavia immer diurnal waterbirds/
waterfowl
2 SCA
Eurasian collared-dove Streptopelia decaocto resident doves/pigeons 1 Powerblock
European starling Sturnus vulgaris variable blackbirds/
orioles
1 Powerblock
great-tailed grackle Quiscalus mexicanus resident blackbirds/
orioles
1 Water Treatment
Plant
killdeer Charadrius vociferus variable shorebirds 1 Evaporation pond
lazuli bunting Passerina amoena nocturnal tanagers 2 Overhead lines
Genesis Avian and Bat Monitoring 2015 Spring Report
WEST, Inc. 19 December 9, 2015
Table 2. Number of individual bird detections, by species, during spring 2015 at the Genesis Solar Energy Project, Riverside County,California.
Common Name Scientific NameMigrationBehavior* Guild Count Project Component
lesser goldfinch Spinus psaltria resident finches/ crossbills 1 Evaporation pond
mallard Anas platyrhynchos variable waterbirds/
waterfowl
1 Fence
mourning dove Zenaida macroura variable doves/pigeons 2 Overhead lines
Nashville warbler Oreothlypis ruficapilla nocturnal warblers 2 Overhead lines
orange-crowned warbler Oreothlypis celata nocturnal warblers 1 Overhead lines
prairie falcon Falco mexicanus resident falcons 1 Overhead
lines/Road
Savannah sparrow Passerculus sandwichensis nocturnal grassland/
sparrows
1 SCA
Townsend's warbler Setophaga townsendi unresolved warblers 2 Overhead lines
SCA
unidentified bird (medium) ̶ unknown unidentified birds 1 Evaporation pond
unidentified bird (small) ̶ unknown unidentified birds 1 SCA
unidentified bird (unknown size) ̶ unknown unidentified birds 13 Fence (7)
Overhead lines (3)
Evaporation pond
(1)
Genesis Avian and Bat Monitoring 2015 Spring Report
WEST, Inc. 20 December 9, 2015
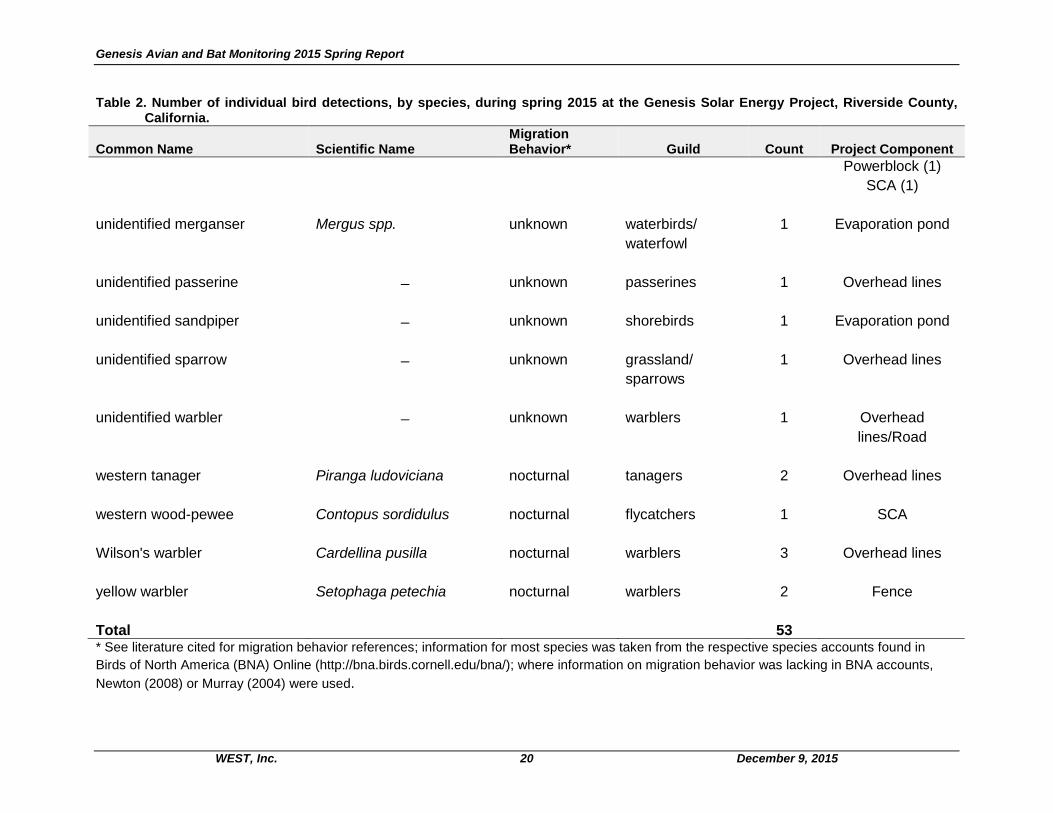
Table 2. Number of individual bird detections, by species, during spring 2015 at the Genesis Solar Energy Project, Riverside County,California.
Common Name Scientific NameMigrationBehavior* Guild Count Project Component
Powerblock (1)
SCA (1)
unidentified merganser Mergus spp. unknown waterbirds/
waterfowl
1 Evaporation pond
unidentified passerine ̶ unknown passerines 1 Overhead lines
unidentified sandpiper ̶ unknown shorebirds 1 Evaporation pond
unidentified sparrow ̶ unknown grassland/
sparrows
1 Overhead lines
unidentified warbler ̶ unknown warblers 1 Overhead
lines/Road
western tanager Piranga ludoviciana nocturnal tanagers 2 Overhead lines
western wood-pewee Contopus sordidulus nocturnal flycatchers 1 SCA
Wilson's warbler Cardellina pusilla nocturnal warblers 3 Overhead lines
yellow warbler Setophaga petechia nocturnal warblers 2 Fence
Total 53* See literature cited for migration behavior references; information for most species was taken from the respective species accounts found in
Birds of North America (BNA) Online (http://bna.birds.cornell.edu/bna/); where information on migration behavior was lacking in BNA accounts,
Newton (2008) or Murray (2004) were used.
Genesis Avian and Bat Monitoring 2015 Spring Report
WEST, Inc. 21 December 9, 2015
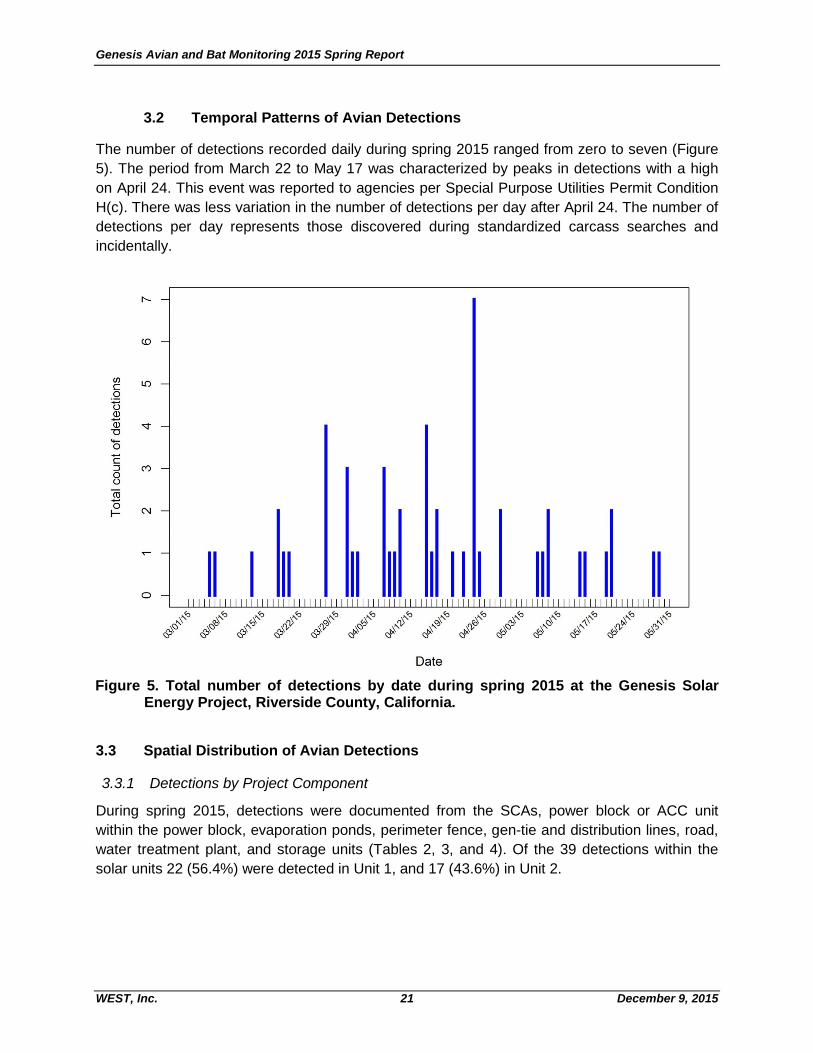
3.2 Temporal Patterns of Avian Detections
The number of detections recorded daily during spring 2015 ranged from zero to seven (Figure
5). The period from March 22 to May 17 was characterized by peaks in detections with a high
on April 24. This event was reported to agencies per Special Purpose Utilities Permit Condition
H(c). There was less variation in the number of detections per day after April 24. The number of
detections per day represents those discovered during standardized carcass searches and
incidentally.
Figure 5. Total number of detections by date during spring 2015 at the Genesis SolarEnergy Project, Riverside County, California.
3.3 Spatial Distribution of Avian Detections
3.3.1 Detections by Project Component
During spring 2015, detections were documented from the SCAs, power block or ACC unit
within the power block, evaporation ponds, perimeter fence, gen-tie and distribution lines, road,
water treatment plant, and storage units (Tables 2, 3, and 4). Of the 39 detections within the
solar units 22 (56.4%) were detected in Unit 1, and 17 (43.6%) in Unit 2.
Genesis Avian and Bat Monitoring 2015 Spring Report
WEST, Inc. 22 December 9, 2015
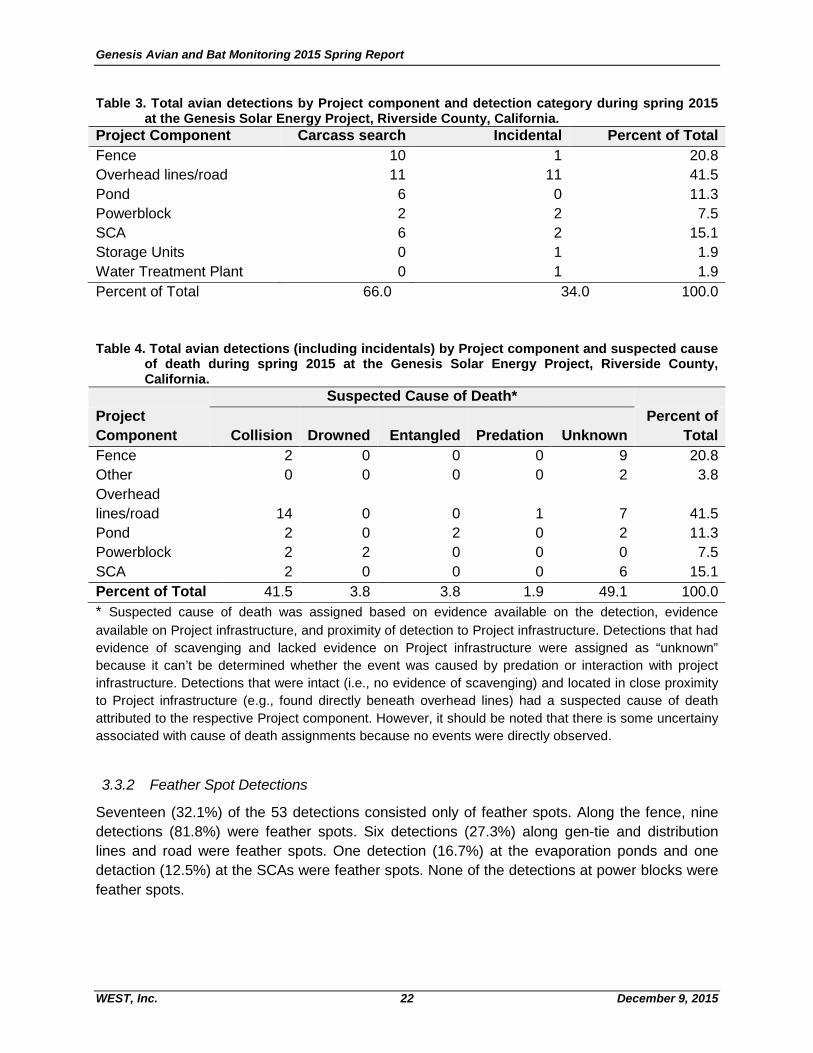
Table 3. Total avian detections by Project component and detection category during spring 2015at the Genesis Solar Energy Project, Riverside County, California.
Project Component Carcass search Incidental Percent of Total
Fence 10 1 20.8
Overhead lines/road 11 11 41.5
Pond 6 0 11.3
Powerblock 2 2 7.5
SCA 6 2 15.1
Storage Units 0 1 1.9
Water Treatment Plant 0 1 1.9
Percent of Total 66.0 34.0 100.0
Table 4. Total avian detections (including incidentals) by Project component and suspected causeof death during spring 2015 at the Genesis Solar Energy Project, Riverside County,California.
Suspected Cause of Death*
Project
Component Collision Drowned Entangled Predation Unknown
Percent of
Total
Fence 2 0 0 0 9 20.8
Other 0 0 0 0 2 3.8
Overhead
lines/road 14 0 0 1 7 41.5
Pond 2 0 2 0 2 11.3
Powerblock 2 2 0 0 0 7.5
SCA 2 0 0 0 6 15.1
Percent of Total 41.5 3.8 3.8 1.9 49.1 100.0
* Suspected cause of death was assigned based on evidence available on the detection, evidence
available on Project infrastructure, and proximity of detection to Project infrastructure. Detections that had
evidence of scavenging and lacked evidence on Project infrastructure were assigned as “unknown”
because it can’t be determined whether the event was caused by predation or interaction with project
infrastructure. Detections that were intact (i.e., no evidence of scavenging) and located in close proximity
to Project infrastructure (e.g., found directly beneath overhead lines) had a suspected cause of death
attributed to the respective Project component. However, it should be noted that there is some uncertainy
associated with cause of death assignments because no events were directly observed.
3.3.2 Feather Spot Detections
Seventeen (32.1%) of the 53 detections consisted only of feather spots. Along the fence, nine
detections (81.8%) were feather spots. Six detections (27.3%) along gen-tie and distribution
lines and road were feather spots. One detection (16.7%) at the evaporation ponds and one
detaction (12.5%) at the SCAs were feather spots. None of the detections at power blocks were
feather spots.
Genesis Avian and Bat Monitoring 2015 Spring Report
WEST, Inc. 23 December 9, 2015
3.4 Detections of Stranded Birds
Two birds were detected during the reporting period that were alive and uninjured but unable to
take flight. A common loon was discovered by WEST field lead Pam Bullard on March 31
beneath the SCAs on the east side of Unit 1 near the evaporation ponds. A second common
loon was detected by Genesis operations personnel on April 20 beneath the SCAs on the west
side of Unit 1, north of the power block. Both of these birds were examined for injuries and when
none were observed, were successfully released at Lake Tamarisk. Both individuals are
included in this report (including the fatality analysis) as detections, resulting in a conservative
estimate of fatalities.
3.5 Summary of Bat Detections
No bats were detected during the spring 2015 season.
Genesis Avian and Bat Monitoring 2015 Spring Report
WEST, Inc. 24 December 9, 2015
3.6 Carcass Persistence Trials
Based on carcass persistence data from the spring 2015 season, 64 survival models were
compared for relative quality using the corrected AICc score, as suggested in Huso (2010). The
AICc score provides a relative measure of model fit and parsimony among a selection of
candidate models, and provides a framework for testing hypotheses regarding which factors
contribute to carcass persistence rates. Carcass size was tested as a potentially important
variable, as larger carcasses tend to persist longer and may be more likely to leave feather
spots which persist for long durations, whereas smaller carcasses may be more likely to be
completely removed. Project component (SCAs/fence, generation-tie line) was also included as
a potentially important variable.
The model with lowest AICc is typically chosen as the “best” model relative to other models
tested; however, any model within two AICc points of the best model is considered competitive
with the best model (Burnham and Anderson 2004). The top six models had ∆AICc values <2.
Ultimately, the loglogistic model that included an effect of carcass size but no effect of
component was chosen as the most parsimonious of the top models (Appendix B). The chosen
model predicted that 42.4% of small carcasses, 72.4% of medium carcasses, and 84.5% of
large carcasses persisted for a standard 7-day search interval. Mean removal time for small
carcasses was 2.0 days, for medium carcasses was 7.3 days, and for large carcasses was 14.6
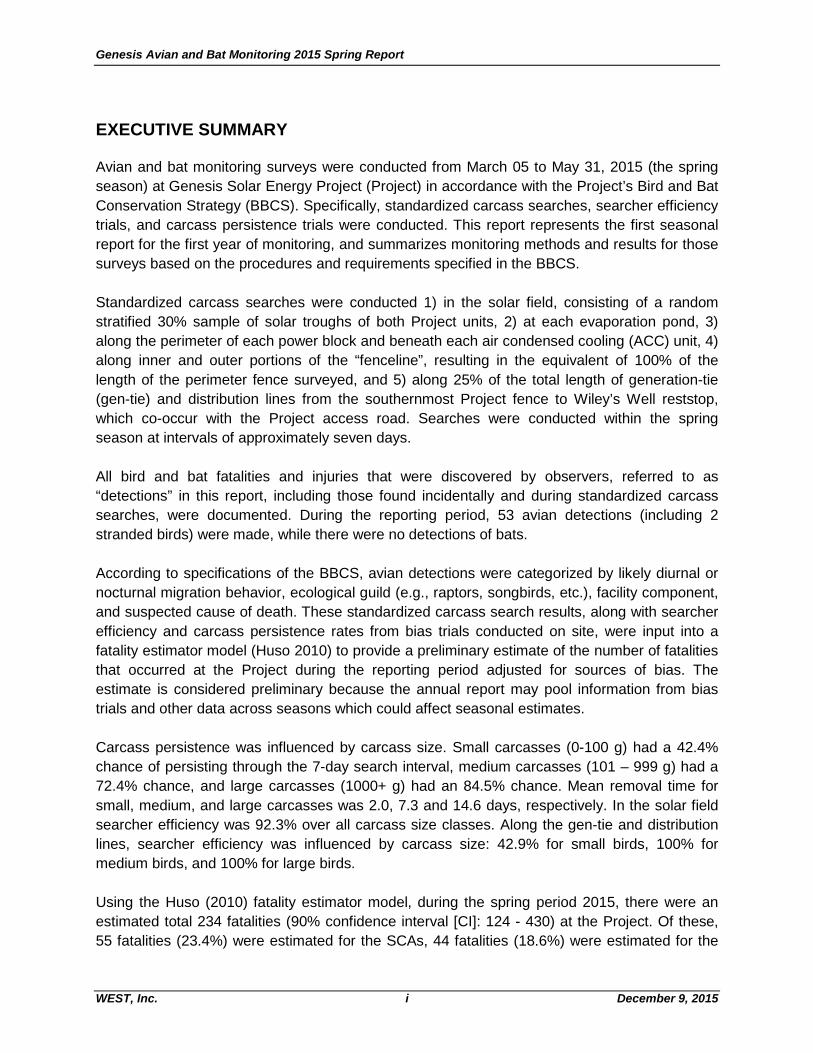
days (Appendix B). Estimates of proportion of carcasses remaining as a function of days since
carcass placement are provided in Figure 6.
3.7 Searcher Efficiency Trials
During the 2015 spring season, a total of 60 searcher efficiency trials (30 small, 20 medium, and
10 large birds) were placed at the Project. Overall, 19 trials were placed in the SCAs, eight trials
were placed along perimeter fences (inner and outer perimeters), and three trials were placed at
power blocks (along perimeter and beneath ACC units). Thirteen trials were placed along the
gen-tie and 17 were placed along the distribution lines. Fifty-five trials were available to be
found, and five trials disappeared before the searcher efficiency trial began (two in the SCAs,
two along the fence, and one along the gen-tie line). Two observers conducted searches at the
Project during spring. Searcher efficiency trials were conducted on each observer in
approximate proportion to the number of searches they conducted at the Project, as follows:
Sarah Nichols (number of trials available to be found: 24) and Anika Mahoney (31). All trials
were included in estimation of searcher efficiency.
In the SCAs, the null model was chosen as the best model to estimate searcher efficiency.
Searcher efficiency rate in the SCAs was 92.3% (24 found of 26 available to be found) and was
similar across carcass size classes. Along overhead lines searcher effiency was 42.9% for small
birds, 100% for medium birds, and 100% for large birds (21 found of 29 available to be found).
Genesis Avian and Bat Monitoring 2015 Spring Report
WEST, Inc. 25 December 9, 2015
Figure 6. Proportion of trial carcasses remaining as a function of days since placementand carcass size class (n = 30, 20, and 10 for small, medium, and large sizeclasses, respectively) during spring 2015 at the Genesis Solar Energy Project inRiverside County, California.
Any differences in searcher efficiency that may exist between the two visibility classes present
in the SCA’s do not seem to have an important effect on overall searcher efficiency because of
the low representation of the moderate visibility class at the Project. The narrow 90%
confidence limits associated with searcher efficiency estimates in the SCA’s (0.85 – 1.00;
Appendix B) suggests that pooling carcasses across visibility classes contributes little to the
variation associated with estimates of searcher efficiency.
Genesis Avian and Bat Monitoring 2015 Spring Report
WEST, Inc. 26 December 9, 2015
3.8 Fatality Estimates
Fatality estimates were calculated separately for each component (SCAs, power blocks, fence,
evaporation ponds, and overhead lines/road). Ultimately, one detection was excluded from the
fatality analysis because it was mummified and estimated to be older than the 7-day search
interval (Huso 2010), and five detections were excluded because they were found outside
standardized search areas. Only one of the 18 detections that were found incidentally was in a
standardized search area, consequently, 17 incidental detections were excluded from the
fatality analysis.
During spring 2015, there were an estimated total 234 fatalities (90% confidence interval [CI]:
124 – 430) at the Project (Appendix B). Of these, 55 fatalities (23.4%) were estimated for the
SCAs, 44 fatalities (18.6%) were estimated for the fence, 9 fatalities (4.0%) were estimated for
evaporation ponds, 5 fatalities (2.2%) were estimated for power blocks, and 121 fatalities
(51.8%; 90% CI: 32 - 307) were estimated for the gen-tie and distribution lines and project road
(Appendix B). An estimated 113 (90% CI: 60 – 188) fatalities (0.065/acre, 0.434/MW) occurred
for all components associated with each solar unit (SCAs, power block, evaporation ponds, and
along the perimeter fence, combined). Estimates made for components where fewer than 5
carcasses were observed should be interpreted with caution because variance of the estimate is
unreliable with small sample sizes. Other projects (e.g., Ivanpah) are not reporting estimates
when carcass counts are low. However, the TAG has asked for both the estimates and
confidence intervals for this project with the appropriate caveat added. A complete list of
estimates for each Project component and carcass size class with confidence intervals is
presented in Appendix B.
4.0 DISCUSSION
The 2015 spring season represented the first season of standardized monitoring at Genesis per
the BBCS. Searcher efficiency trials and carcass removal trials were conducted concurrently at
the SCAs, power blocks, fencelines, and along the gen-tie and distribution lines. Data from
these trials were used to produce fatality estimates adjusted for searcher efficiency and carcass
persistence bias. Although these estimates were produced from a statistically robust sample,
only limited inference may be drawn from a single season of data. These results should be
considered preliminary because estimating carcass persistence, searcher efficiency, and
adjusted numbers of fatalities within each season represents information based on a limited
sample size. As more data are collected throughout the monitoring year (and additional quality
assurance/quality control measures occur, for example characterizing feather spots to species
or size class), data from all seasons may be pooled. At that time, an information-theoretic
approach will be used to test data for seasonal effects retrospectively. This approach will
include a test of multiple competing hypotheses (e.g., that there is a single estimate of searcher
efficiency for all seasons; that there are estimates of searcher efficiency specific to each
season; or that there are additive or interactive effects of season and project component), By
using all of the data collected up to the point at which the analysis occurs, estimates of searcher

Genesis Avian and Bat Monitoring 2015 Spring Report
WEST, Inc. 27 December 9, 2015
efficiency and carcass persistence will be based on a larger, more informative sample, and
patterns in the data can be teased apart by comparing the fit of models with different effects to
the data. By using a larger sample, variance estimates will likely be reduced , , but because
seasonal estimates will be produced from the much larger annual data set, they may differ from
what is reported here.
4.1 Carcass Persistence and Searcher Efficiency Trials
The degree to which carcasses persist on the landscape depends on a variety of factors
reflecting seasonal and inter-annual variation in habitat, climate, and the scavenger community.
The composition and activity patterns of the scavenger community often vary seasonally as
birds migrate, new juvenile birds and mammals join the local population, and mammalian
scavengers variably hibernate or estivate. The scavenger community may also vary
substantially from year to year because of variation in annual reproduction and survival related
to changes in landscape condition. Climatic conditions that vary seasonally and annually also
may contribute to variation in carcass decay and removal rates due to variation in temperatures,
solar insolation, wind patterns, and the frequency of flooding events. Thus, rates of carcass
persistence reported here should be interpreted cautiously as they may change over the coming
months.
Searcher efficiency was influenced by carcass size, but it is not yet clear if there may be an
effect of habitat visibility class due to limited sample sizes. In the SCAs, searcher efficiency was
high regardless of carcass size and this is likely influenced by the limited vegetation cover
beneath solar troughs. Beneath overhead lines outside the Project fence vegetation cover is
higher, but our analysis did not support the hypothesis that visibility class is a factor in searcher
efficiency along the lines. Carcass size influenced searcher efficiency, but was relatively high
over all carcass size classes (72.4%).
Searcher efficiency trials for this Project will be repeated seasonally. The desert landscape in
which this Project is located generally changes little with the seasons, save for brief periods
following winter and spring rains when floods may occur and blooming plants may flourish. A
recent meta-analysis involving data from more than 70 wind-energy projects suggested that
including habitat visibility class as a predictive variable generally eliminated any otherwise
apparent seasonal effects on searcher efficiency (Smallwood 2013). Further, the possibility
exists that searcher efficiency varies seasonally in some cover types but not others. Data from
searcher efficiency trials conducted over the coming seasons will therefore continue to be tested
for effects of habitat visibility class rather than effects of season.
4.2 Distribution of Fatalities and Fatality Estimates
The number of detections was highest during the middle of the spring monitoring period, and
decreased at the end of May. The peak in number of detections on April 24 may have been
influenced by weather conditions the preceding night. Winds were recorded from the southwest
ranging from 20-30 mph from approximately 2000 hrs on April 23 to 1600 hrs on April 24, and
were associated with changing cloud cover (Weather Underground, Blythe, CA).
Genesis Avian and Bat Monitoring 2015 Spring Report
WEST, Inc. 28 December 9, 2015
Detections attributed to an unknown cause accounted for approximately 50% of all detections
during the 2015 spring season, and the distribution of the unknown cause detections varied by
project component with 34.6% occurring in association with the perimeter fence. Of the 11
detections made along the fence, 81.8% were feather spots. Determining a cause of mortality
from a feather spot is challenging because there is rarely visible evidence available on which to
determine a cause of death. Thus, feather spots with an unknown cause of mortality could be
encountered anywhere birds occur, and an unknown cause of a sizeable proportion of the
carcasses is not unique to the Project. Further, game cameras trained on carcasses for carcass
persistence trials at the Project have documented multiple feather spots originating from a
single trial carcass. Ravens and turkey vultures, and possibly roadrunners, dislodge feathers
from their attachment to the skin during the scavenging process. There are a very large number
of potential feather spots present on a single bird carcass (because a feather spot is defined as
at least two or more primary flight feathers, at least five or more tail feathers, or two primaries
within five meters (16.4 ft) or less of each other, or a total of 10 or more feathers of any type
concentrated together in an area of three square meter). The large proportion of feather spots
(32%) among the detections for the Project as a whole may inflate the fatality estimate when
unknown cause detections are included based on the potential for multiple feather spots
resulting from one fatality, feather spots resulting from predation not associated with the facility,
or other causes.
Genesis Avian and Bat Monitoring 2015 Spring Report
WEST, Inc. 29 December 9, 2015
5.0 LITERATURE CITED
Akaike, H., 1973. Information theory and an extension of the maximum likelihood principle.
Pages 267–281 in 2nd International Symposium on Information Theory (B. N. Petran
and F. Csaki, Eds.). Akademiai Kiado, Budapest, Hungary.
Ammon, Elisabeth M. and William M. Gilbert. 1999. Wilson's Warbler (Cardellina pusilla), The
Birds of North America Online (A. Poole, Ed.). Ithaca: Cornell Lab of Ornithology;
Retrieved from the Birds of North America
Online: http://bna.birds.cornell.edu/bna/species/478
Burnham, K.P., and D.R. Anderson. 2004. Multimodel inference: understanding AIC and BIC
in model selection. Sociological Methods & Research 33: 261-304.
Cabe, Paul R. 1993. European Starling (Sturnus vulgaris), The Birds of North America Online
(A. Poole, Ed.). Ithaca: Cornell Lab of Ornithology; Retrieved from the Birds of North
America Online:http://bna.birds.cornell.edu/bna/species/048 doi:10.2173/bna.48
Evers, David C., James D. Paruk, Judith W. Mcintyre and Jack F. Barr. 2010. Common Loon
(Gavia immer), The Birds of North America Online (A. Poole, Ed.). Ithaca: Cornell Lab of
Ornithology; Retrieved from the Birds of North America
Online: http://bna.birds.cornell.edu/bna/species/313 doi:10.2173/bna.313
Gauthier, Gilles. 2014. Bufflehead (Bucephala albeola), The Birds of North America Online (A.
Poole, Ed.). Ithaca: Cornell Lab of Ornithology; Retrieved from the Birds of North
America Online:http://bna.birds.cornell.edu/bna/species/067 doi:10.2173/bna.67
Gilbert, W. M., M. K. Sogge and C. Van Riper III. 2010. Orange-crowned Warbler (Oreothlypis
celata), The Birds of North America Online (A. Poole, Ed.). Ithaca: Cornell Lab of
Ornithology; Retrieved from the Birds of North America
Online: http://bna.birds.cornell.edu/bna/species/101 doi:10.2173/bna.101
Greene, Erick, Vincent R. Muehter and William Davison. 2014. Lazuli Bunting
(Passerina amoena), The Birds of North America Online (A. Poole, Ed.). Ithaca: Cornell
Lab of Ornithology; Retrieved from the Birds of North America
Online: http://bna.birds.cornell.edu/bna/species/232 doi:10.2173/bna.232
Jackson, Bette J. and Jerome A. Jackson. 2000. Killdeer (Charadrius vociferus), The Birds of
North America Online (A. Poole, Ed.). Ithaca: Cornell Lab of Ornithology; Retrieved from
the Birds of North America Online: http://bna.birds.cornell.edu/bna/species/517
doi:10.2173/bna.517
Johnson, Kristine and Brian D. Peer. 2001. Great-tailed Grackle (Quiscalus mexicanus), The
Birds of North America Online (A. Poole, Ed.). Ithaca: Cornell Lab of Ornithology;
Retrieved from the Birds of North America
Online: http://bna.birds.cornell.edu/bna/species/576 doi:10.2173/bna.576
Genesis Avian and Bat Monitoring 2015 Spring Report
WEST, Inc. 30 December 9, 2015
Hudon, Jocelyn. 1999. Western Tanager (Piranga ludoviciana), The Birds of North America
Online (A. Poole, Ed.). Ithaca: Cornell Lab of Ornithology; Retrieved from the Birds of
North America Online: http://bna.birds.cornell.edu/bna/species/432 doi:10.2173/bna.432
Huso, M. 2010. An estimator of wildlife fatality from observed carcasses. Environmetrics
22(3):318–329. doi: 10.1002/env.1052
Huso, Manuela, Som, Nicholas, and Ladd, Lew. 2012. Fatality estimator user’s guide: U.S.
Geological Survey Data Series 729, 22 p.
Korner-Nievergelt, F., P. Korner-Nievergelt, O. Behr, I. Niermann, R. Brinkmann, and B.
Hellriegel. 2011. A New Method to Determine Bird and Bat Fatality at Wind Energy
Turbines from Carcass Searches. Wildlife Biology 17: 350-363.
Lowther, P. E., C. Celada, N. K. Klein, C. C. Rimmer and D. A. Spector. 1999. Yellow Warbler
(Setophaga petechia), The Birds of North America Online (A. Poole, Ed.). Ithaca: Cornell
Lab of Ornithology; Retrieved from the Birds of North America
Online:http://bna.birds.cornell.edu/bna/species/454 doi:10.2173/bna.454
Lowther, Peter E. and Janet McI. Williams. 2011. Nashville Warbler (Oreothlypis ruficapilla),
The Birds of North America Online (A. Poole, Ed.). Ithaca: Cornell Lab of Ornithology;
Retrieved from the Birds of North America
Online: http://bna.birds.cornell.edu/bna/species/205 doi:10.2173/bna.205
Manly, B.F.J.1997. Randomization, Bootstrap and Monte Carlo Methods in Biology. Second
Edition. CRC Press, LLC, Boca Raton, FL., 455 pp.
Marti, Carl D., Alan F. Poole and L. R. Bevier. 2005. Barn Owl (Tyto alba), The Birds of North
America Online (A. Poole, Ed.). Ithaca: Cornell Lab of Ornithology; Retrieved from the
Birds of North America Online: http://bna.birds.cornell.edu/bna/species/001
doi:10.2173/bna.1
Martin, Stephen G. 2002. Brewer's Blackbird (Euphagus cyanocephalus), The Birds of North
America Online (A. Poole, Ed.). Ithaca: Cornell Lab of Ornithology; Retrieved from the
Birds of North America Online: http://bna.birds.cornell.edu/bna/species/616
doi:10.2173/bna.616
Murray, J. 2004. Nocturnal flight call analysis as a method for monitoring density and species
composition of migratory songbirds (Order Passeriformes) across southern Vancouver
Island, British Columbia in 2004. Rocky Point Bird Observatory, 16 pp.
Newton, I. 2008. The Migration Ecology of Birds. Academic Press, London.
Otis, David L., John H. Schulz, David Miller, R. E. Mirarchi and T. S. Baskett. 2008. Mourning
Dove (Zenaida macroura), The Birds of North America Online (A. Poole, Ed.). Ithaca:
Cornell Lab of Ornithology; Retrieved from the Birds of North America
Online:http://bna.birds.cornell.edu/bna/species/117 doi:10.2173/bna.117
Genesis Avian and Bat Monitoring 2015 Spring Report
WEST, Inc. 31 December 9, 2015
Romagosa, Christina Margarita. 2012. Eurasian Collared-Dove (Streptopelia decaocto), The
Birds of North America Online (A. Poole, Ed.). Ithaca: Cornell Lab of Ornithology;
Retrieved from the Birds of North America
Online: http://bna.birds.cornell.edu/bna/species/630 doi:10.2173/bna.630
Rotenberry, J. T., M. A. Patten and K. L. Preston. 1999. Brewer's Sparrow (Spizella breweri),
The Birds of North America Online (A. Poole, Ed.). Ithaca: Cornell Lab of Ornithology;
Retrieved from the Birds of North America
Online: http://bna.birds.cornell.edu/bna/species/390 doi:10.2173/bna.390
Smallwood, John A. and David M. Bird. 2002. American Kestrel (Falco sparverius), The Birds
of North America Online (A. Poole, Ed.). Ithaca: Cornell Lab of Ornithology; Retrieved
from the Birds of North America Online: http://bna.birds.cornell.edu/bna/species/602
doi:10.2173/bna.602
Smallwood, K.S. 2007. Estimating wind turbine-caused bird mortality. Journal of Wildlife
Management 71: 2781-2791.
Smallwood, K.S., D.A. Bell, S.A. Snyder, and J.E. DiDonato. 2010. Novel scavenger removal
trials increase wind turbine-cause avian fatality estimates. Journal of Wildlife
Management 74(5): 1089-1096.
Smallwood, K. S. 2013. Comparing bird and bat ratality-rate Estimates among North American
wind-energy projects. Wildlife Society Bulletin 37(1): 19-33.
Steenhof, Karen. 2013. Prairie Falcon (Falco mexicanus), The Birds of North America Online
(A. Poole, Ed.). Ithaca: Cornell Lab of Ornithology; Retrieved from the Birds of North
America Online:http://bna.birds.cornell.edu/bna/species/346 doi:10.2173/bna.346
Therneau, T. 2015. _A Package for Survival Analysis in S. version 2.38, <URL:
http://CRAN.R-project.org/package=survival>.
Therneau, T.M. and P. M. Grambsch 2000. Modeling Survival Data: Extending the Cox Model.
Springer, New York. ISBN 0-387-98784-3.
Watt, Doris J. and Ernest J. Willoughby. 2014. Lesser Goldfinch (Spinus psaltria), The Birds of
North America Online (A. Poole, Ed.). Ithaca: Cornell Lab of Ornithology; Retrieved from
the Birds of North America Online: http://bna.birds.cornell.edu/bna/species/392
doi:10.2173/bna.392
Wheelwright, N. T. and J. D. Rising. 2008. Savannah Sparrow (Passerculus sandwichensis),
The Birds of North America Online (A. Poole, Ed.). Ithaca: Cornell Lab of Ornithology;
Retrieved from the Birds of North America
Online: http://bna.birds.cornell.edu/bna/species/045 doi:10.2173/bna.45

Genesis Avian and Bat Monitoring 2015 Spring Report
Appendix A. Weather Conditions and Body Weights Associated with Avian Detections
Estimated to be Less Than 24 Hours Old during spring 2015
Genesis Avian and Bat Monitoring 2015 Spring Report
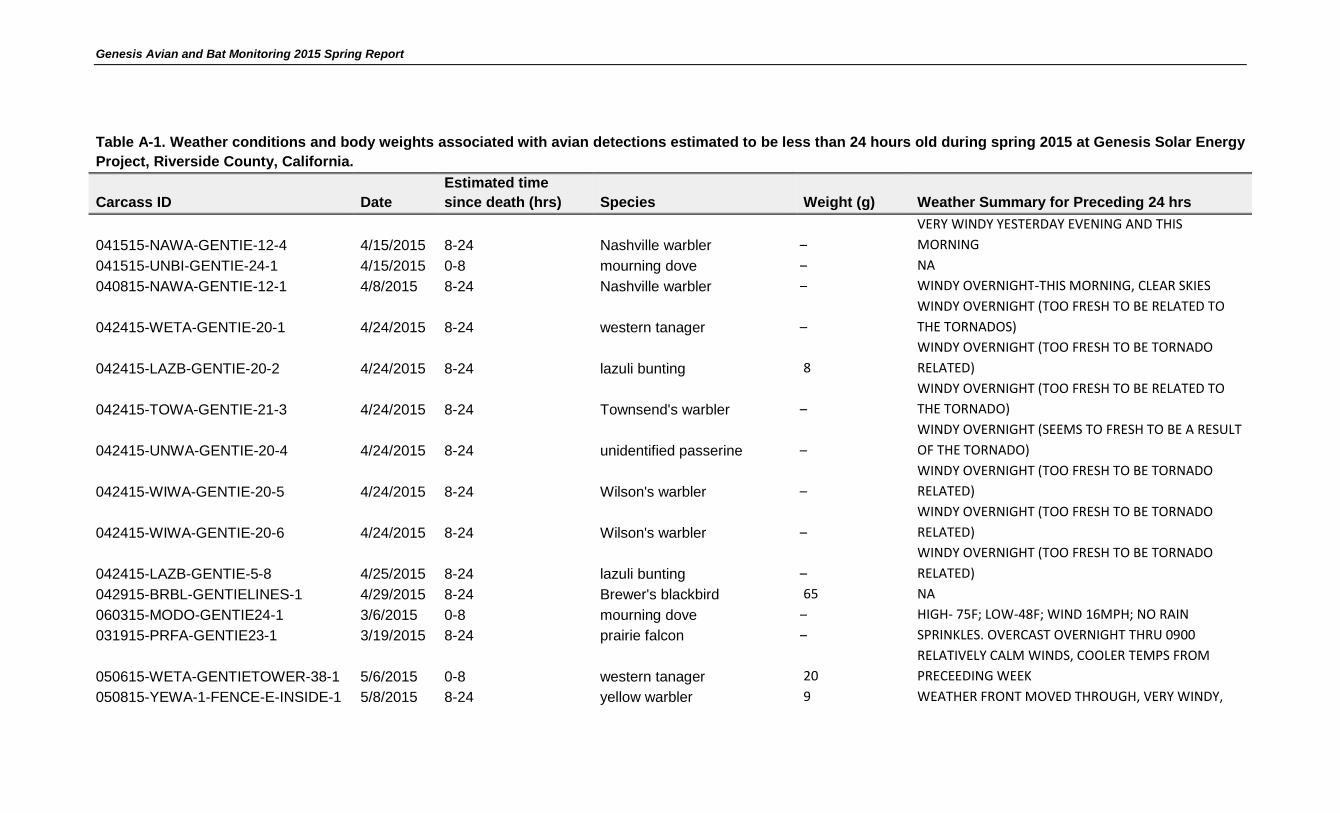
Table A-1. Weather conditions and body weights associated with avian detections estimated to be less than 24 hours old during spring 2015 at Genesis Solar Energy
Project, Riverside County, California.
Carcass ID Date
Estimated time
since death (hrs) Species Weight (g) Weather Summary for Preceding 24 hrs
041515-NAWA-GENTIE-12-4 4/15/2015 8-24 Nashville warbler ̶
VERY WINDY YESTERDAY EVENING AND THIS
MORNING
041515-UNBI-GENTIE-24-1 4/15/2015 0-8 mourning dove ̶ NA
040815-NAWA-GENTIE-12-1 4/8/2015 8-24 Nashville warbler ̶ WINDY OVERNIGHT-THIS MORNING, CLEAR SKIES
042415-WETA-GENTIE-20-1 4/24/2015 8-24 western tanager ̶
WINDY OVERNIGHT (TOO FRESH TO BE RELATED TO
THE TORNADOS)
042415-LAZB-GENTIE-20-2 4/24/2015 8-24 lazuli bunting 8
WINDY OVERNIGHT (TOO FRESH TO BE TORNADO
RELATED)
042415-TOWA-GENTIE-21-3 4/24/2015 8-24 Townsend's warbler ̶
WINDY OVERNIGHT (TOO FRESH TO BE RELATED TO
THE TORNADO)
042415-UNWA-GENTIE-20-4 4/24/2015 8-24 unidentified passerine ̶
WINDY OVERNIGHT (SEEMS TO FRESH TO BE A RESULT
OF THE TORNADO)
042415-WIWA-GENTIE-20-5 4/24/2015 8-24 Wilson's warbler ̶
WINDY OVERNIGHT (TOO FRESH TO BE TORNADO
RELATED)
042415-WIWA-GENTIE-20-6 4/24/2015 8-24 Wilson's warbler ̶
WINDY OVERNIGHT (TOO FRESH TO BE TORNADO
RELATED)
042415-LAZB-GENTIE-5-8 4/25/2015 8-24 lazuli bunting ̶
WINDY OVERNIGHT (TOO FRESH TO BE TORNADO
RELATED)
042915-BRBL-GENTIELINES-1 4/29/2015 8-24 Brewer's blackbird 65 NA
060315-MODO-GENTIE24-1 3/6/2015 0-8 mourning dove ̶ HIGH- 75F; LOW-48F; WIND 16MPH; NO RAIN
031915-PRFA-GENTIE23-1 3/19/2015 8-24 prairie falcon ̶ SPRINKLES. OVERCAST OVERNIGHT THRU 0900
050615-WETA-GENTIETOWER-38-1 5/6/2015 0-8 western tanager 20
RELATIVELY CALM WINDS, COOLER TEMPS FROM
PRECEEDING WEEK
050815-YEWA-1-FENCE-E-INSIDE-1 5/8/2015 8-24 yellow warbler 9 WEATHER FRONT MOVED THROUGH, VERY WINDY,
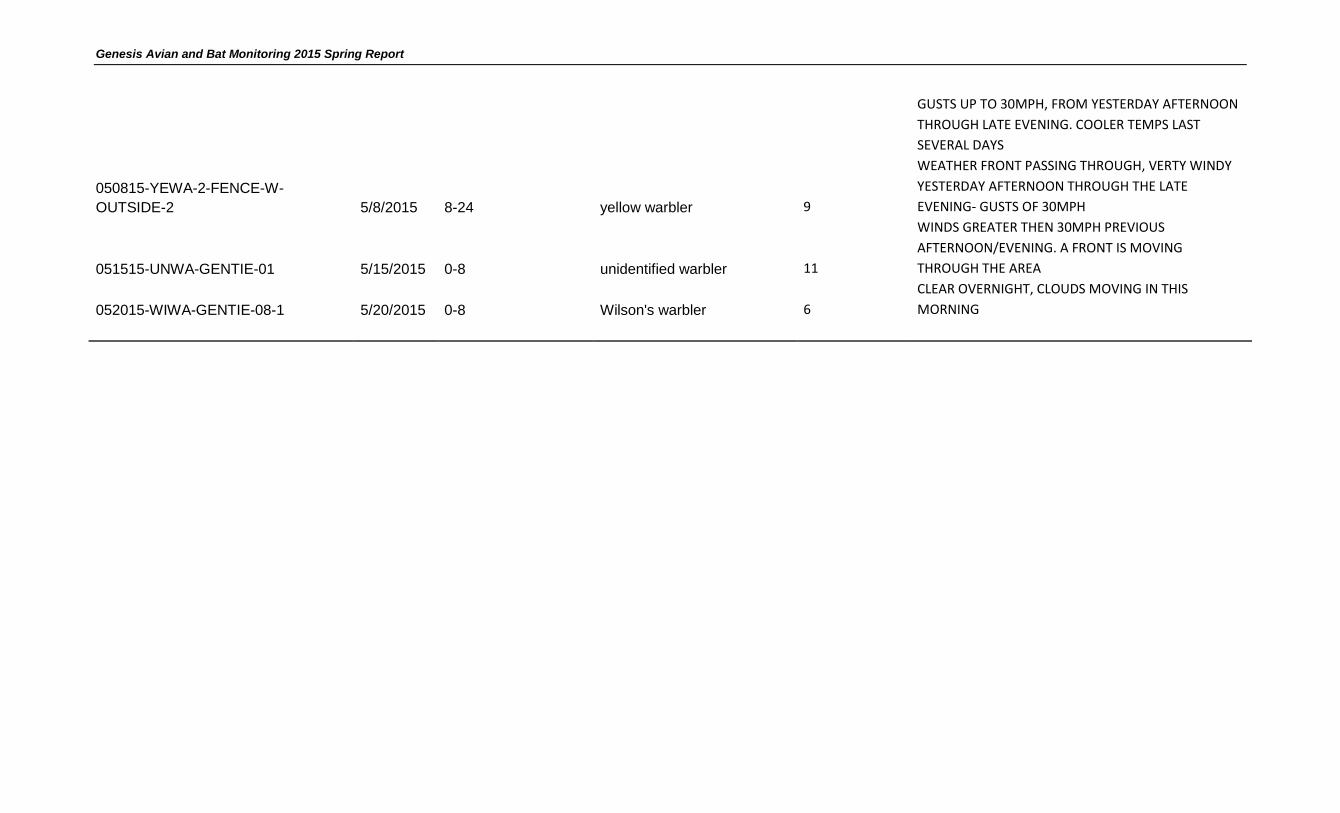
Genesis Avian and Bat Monitoring 2015 Spring Report
GUSTS UP TO 30MPH, FROM YESTERDAY AFTERNOON
THROUGH LATE EVENING. COOLER TEMPS LAST
SEVERAL DAYS
050815-YEWA-2-FENCE-W-
OUTSIDE-2 5/8/2015 8-24 yellow warbler 9
WEATHER FRONT PASSING THROUGH, VERTY WINDY
YESTERDAY AFTERNOON THROUGH THE LATE
EVENING- GUSTS OF 30MPH
051515-UNWA-GENTIE-01 5/15/2015 0-8 unidentified warbler 11
WINDS GREATER THEN 30MPH PREVIOUS
AFTERNOON/EVENING. A FRONT IS MOVING
THROUGH THE AREA
052015-WIWA-GENTIE-08-1 5/20/2015 0-8 Wilson's warbler 6
CLEAR OVERNIGHT, CLOUDS MOVING IN THIS
MORNING

Genesis Avian and Bat Monitoring 2015 Spring Report
Appendix B. Correction Factors and Bird Fatality Rates at the Genesis Solar Energy
Project during spring of 2015.
Genesis Avian and Bat Monitoring 2015 Spring Report
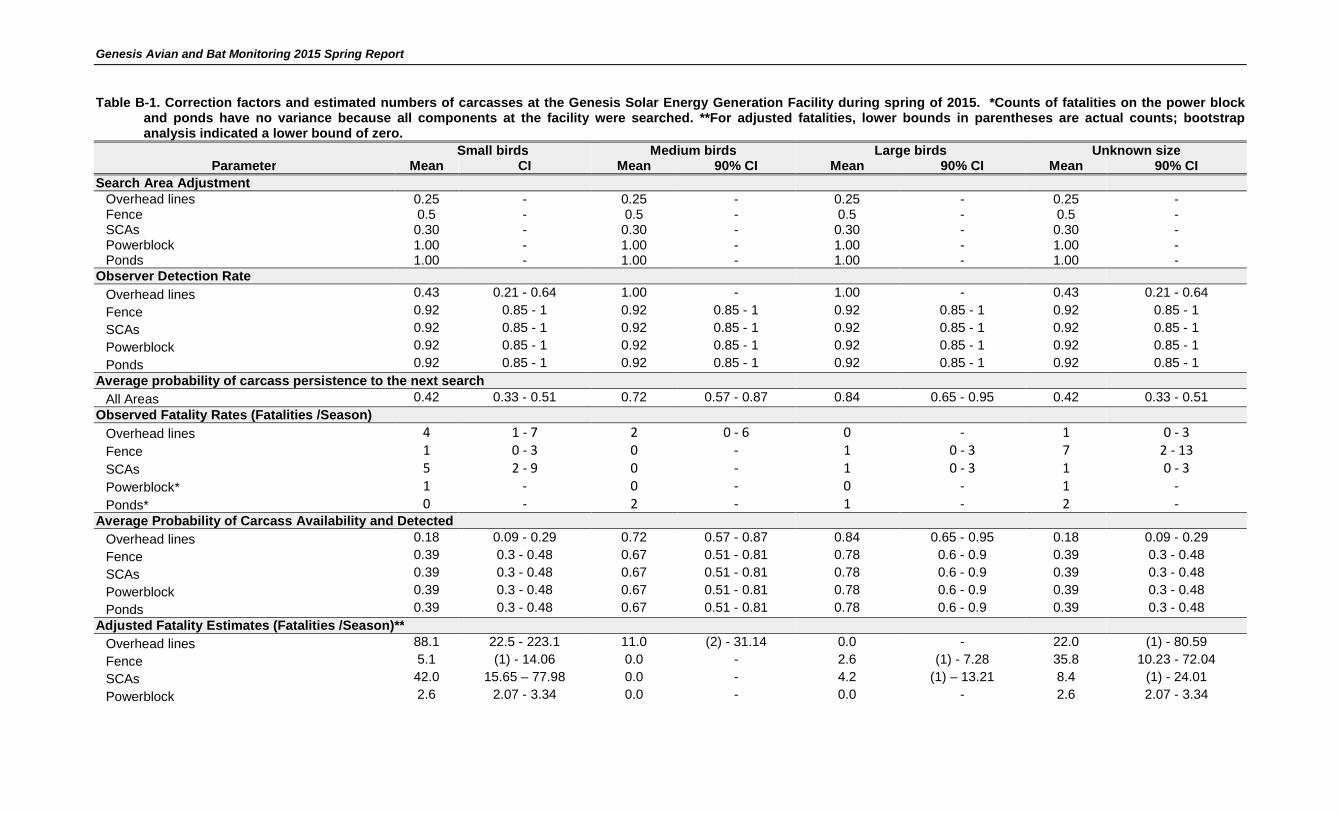
Table B-1. Correction factors and estimated numbers of carcasses at the Genesis Solar Energy Generation Facility during spring of 2015. *Counts of fatalities on the power blockand ponds have no variance because all components at the facility were searched. **For adjusted fatalities, lower bounds in parentheses are actual counts; bootstrapanalysis indicated a lower bound of zero.
Small birds Medium birds Large birds Unknown sizeParameter Mean CI Mean 90% CI Mean 90% CI Mean 90% CI
Search Area AdjustmentOverhead lines 0.25 - 0.25 - 0.25 - 0.25 -Fence 0.5 - 0.5 - 0.5 - 0.5 -SCAs 0.30 - 0.30 - 0.30 - 0.30 -Powerblock 1.00 - 1.00 - 1.00 - 1.00 -Ponds 1.00 - 1.00 - 1.00 - 1.00 -
Observer Detection Rate
Overhead lines 0.43 0.21 - 0.64 1.00 - 1.00 - 0.43 0.21 - 0.64
Fence 0.92 0.85 - 1 0.92 0.85 - 1 0.92 0.85 - 1 0.92 0.85 - 1
SCAs 0.92 0.85 - 1 0.92 0.85 - 1 0.92 0.85 - 1 0.92 0.85 - 1
Powerblock 0.92 0.85 - 1 0.92 0.85 - 1 0.92 0.85 - 1 0.92 0.85 - 1
Ponds 0.92 0.85 - 1 0.92 0.85 - 1 0.92 0.85 - 1 0.92 0.85 - 1
Average probability of carcass persistence to the next search
All Areas 0.42 0.33 - 0.51 0.72 0.57 - 0.87 0.84 0.65 - 0.95 0.42 0.33 - 0.51
Observed Fatality Rates (Fatalities /Season)
Overhead lines 4 1 - 7 2 0 - 6 0 - 1 0 - 3
Fence 1 0 - 3 0 - 1 0 - 3 7 2 - 13
SCAs 5 2 - 9 0 - 1 0 - 3 1 0 - 3
Powerblock* 1 - 0 - 0 - 1 -
Ponds* 0 - 2 - 1 - 2 -Average Probability of Carcass Availability and Detected
Overhead lines 0.18 0.09 - 0.29 0.72 0.57 - 0.87 0.84 0.65 - 0.95 0.18 0.09 - 0.29
Fence 0.39 0.3 - 0.48 0.67 0.51 - 0.81 0.78 0.6 - 0.9 0.39 0.3 - 0.48
SCAs 0.39 0.3 - 0.48 0.67 0.51 - 0.81 0.78 0.6 - 0.9 0.39 0.3 - 0.48
Powerblock 0.39 0.3 - 0.48 0.67 0.51 - 0.81 0.78 0.6 - 0.9 0.39 0.3 - 0.48
Ponds 0.39 0.3 - 0.48 0.67 0.51 - 0.81 0.78 0.6 - 0.9 0.39 0.3 - 0.48
Adjusted Fatality Estimates (Fatalities /Season)**
Overhead lines 88.1 22.5 - 223.1 11.0 (2) - 31.14 0.0 - 22.0 (1) - 80.59
Fence 5.1 (1) - 14.06 0.0 - 2.6 (1) - 7.28 35.8 10.23 - 72.04
SCAs 42.0 15.65 – 77.98 0.0 - 4.2 (1) – 13.21 8.4 (1) - 24.01
Powerblock 2.6 2.07 - 3.34 0.0 - 0.0 - 2.6 2.07 - 3.34
Genesis Avian and Bat Monitoring 2015 Spring Report
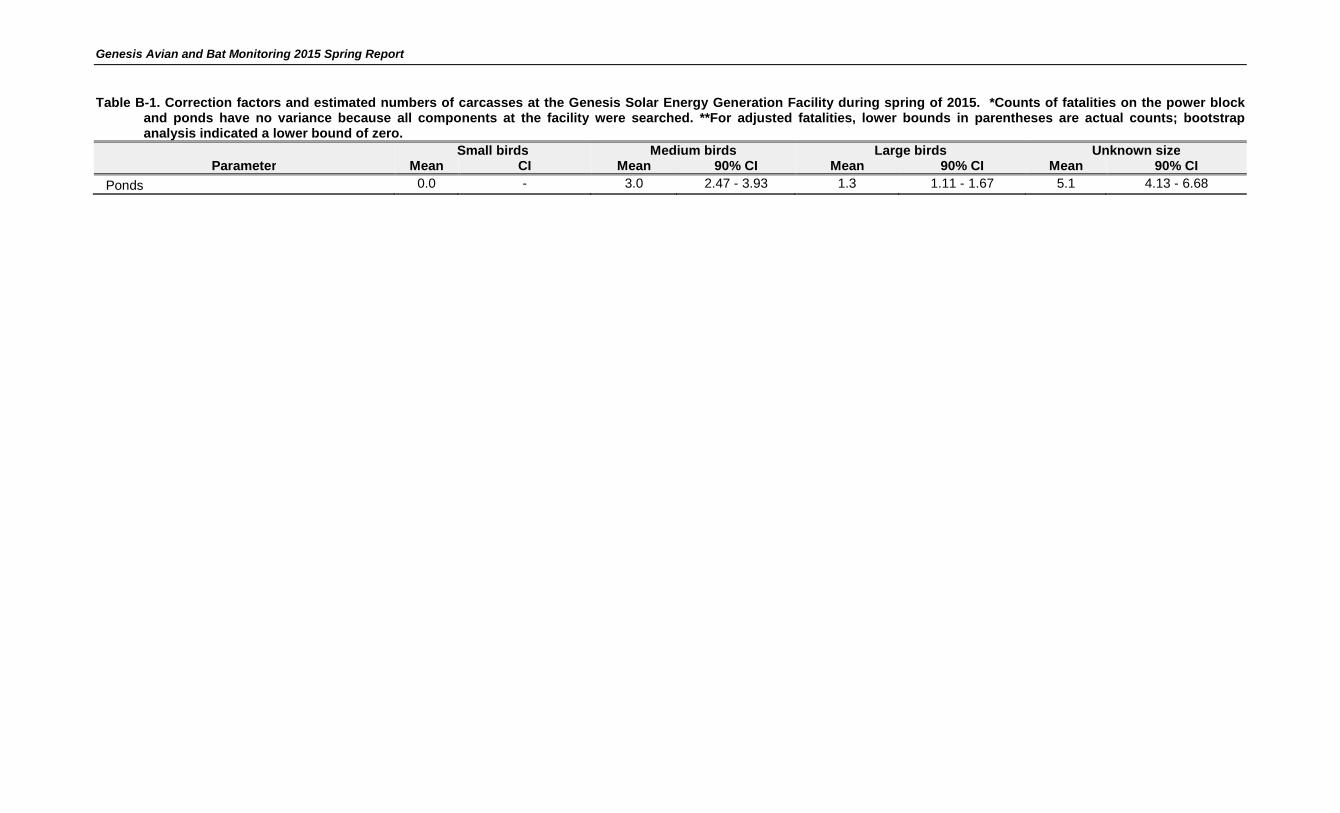
Table B-1. Correction factors and estimated numbers of carcasses at the Genesis Solar Energy Generation Facility during spring of 2015. *Counts of fatalities on the power blockand ponds have no variance because all components at the facility were searched. **For adjusted fatalities, lower bounds in parentheses are actual counts; bootstrapanalysis indicated a lower bound of zero.
Small birds Medium birds Large birds Unknown sizeParameter Mean CI Mean 90% CI Mean 90% CI Mean 90% CI
Ponds 0.0 - 3.0 2.47 - 3.93 1.3 1.11 - 1.67 5.1 4.13 - 6.68

Genesis Avian and Bat Monitoring 2015 Spring Report
Appendix C. Detailed Areas of Standardized Searches and Carcass Locations along the
Distribution and Generation Tie Lines of the Genesis Solar Energy Project during spring
2015.
Genesis Avian and Bat Monitoring 2015 Spring Report
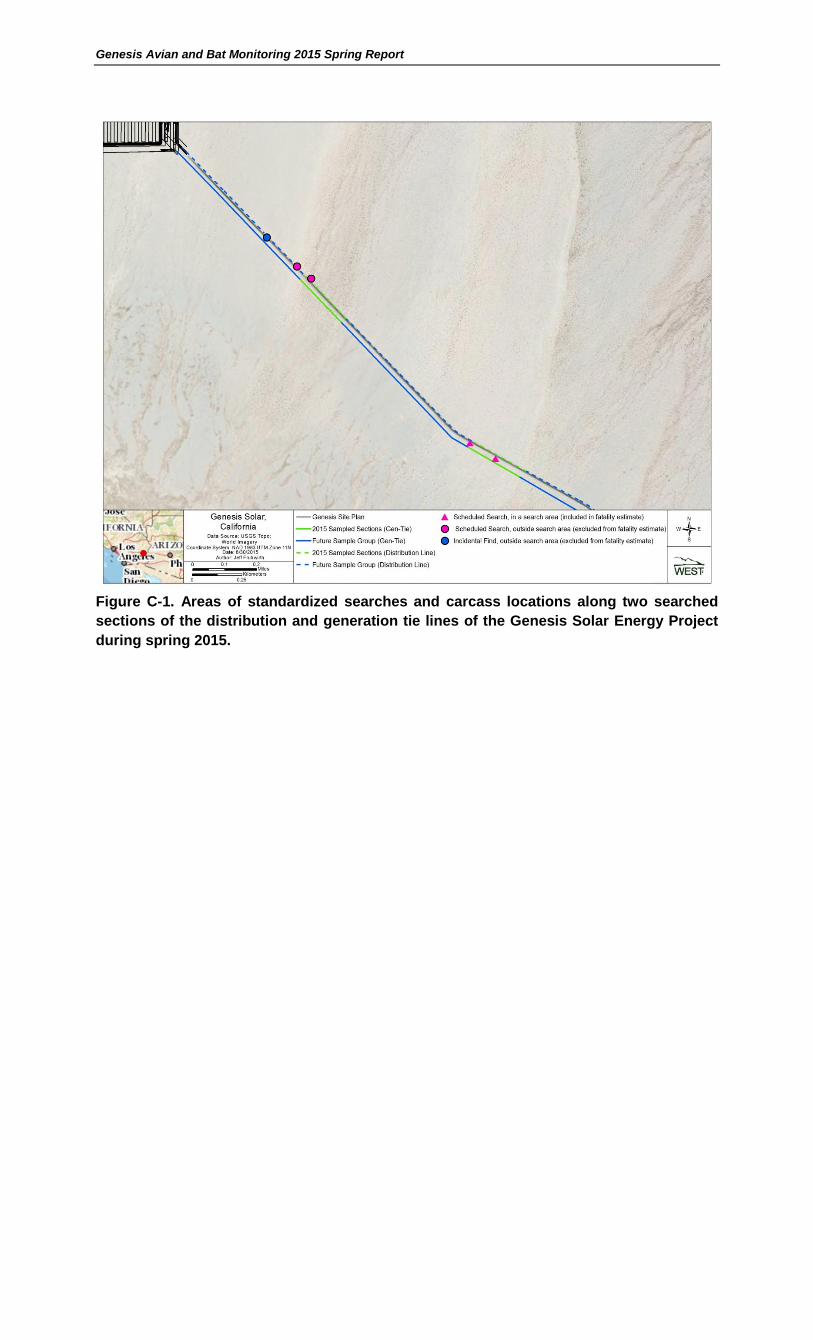
Figure C-1. Areas of standardized searches and carcass locations along two searched
sections of the distribution and generation tie lines of the Genesis Solar Energy Project
during spring 2015.
Genesis Avian and Bat Monitoring 2015 Spring Report
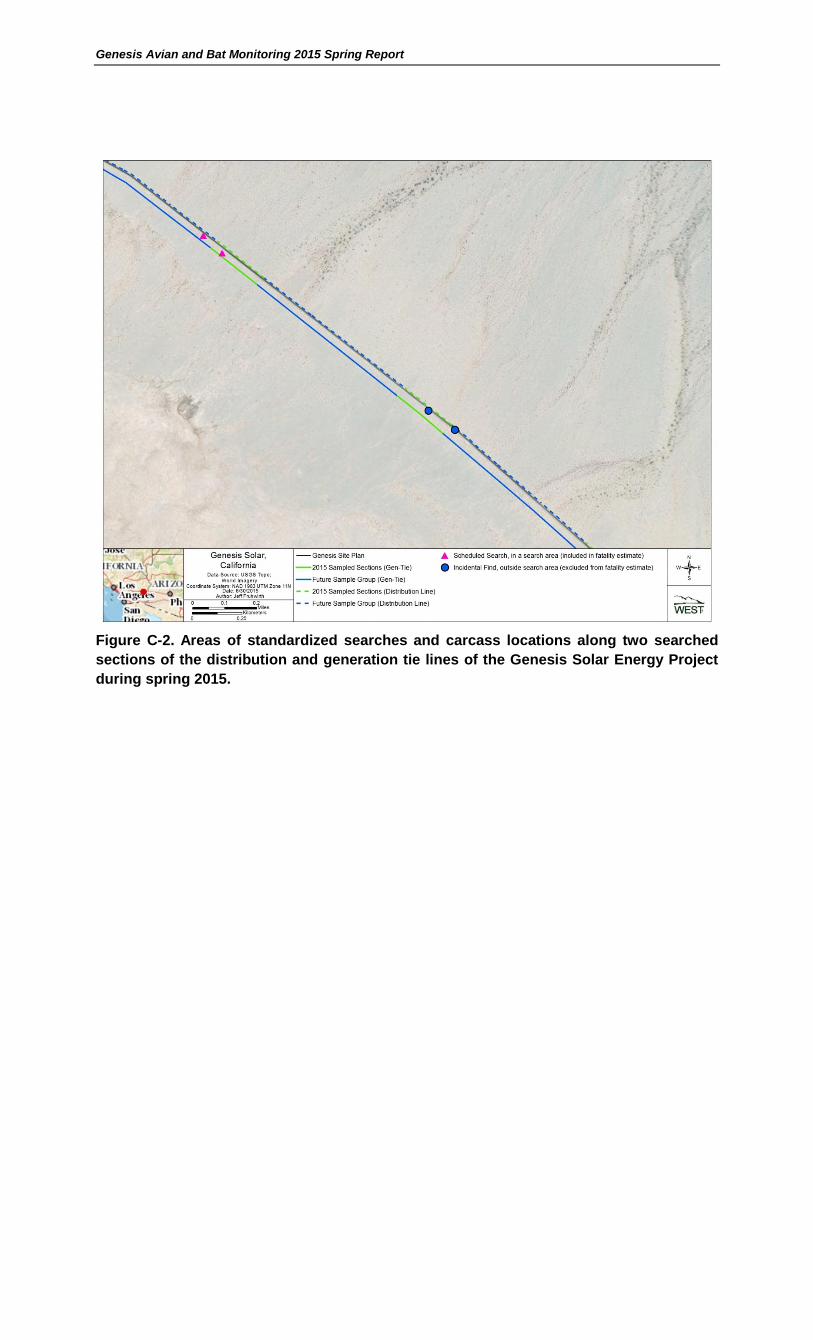
Figure C-2. Areas of standardized searches and carcass locations along two searched
sections of the distribution and generation tie lines of the Genesis Solar Energy Project
during spring 2015.
Genesis Avian and Bat Monitoring 2015 Spring Report
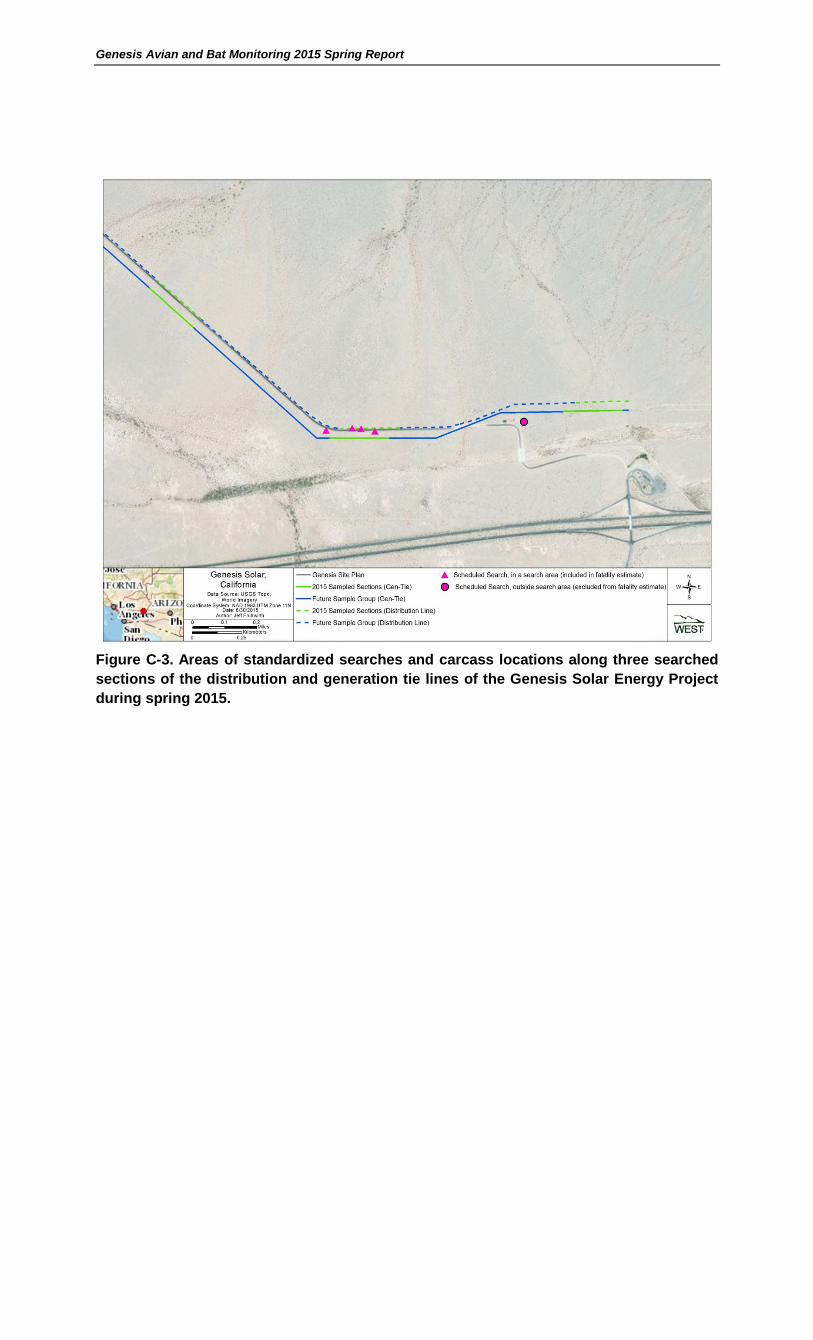
Figure C-3. Areas of standardized searches and carcass locations along three searched
sections of the distribution and generation tie lines of the Genesis Solar Energy Project
during spring 2015.