Embed Size (px)
Citation preview
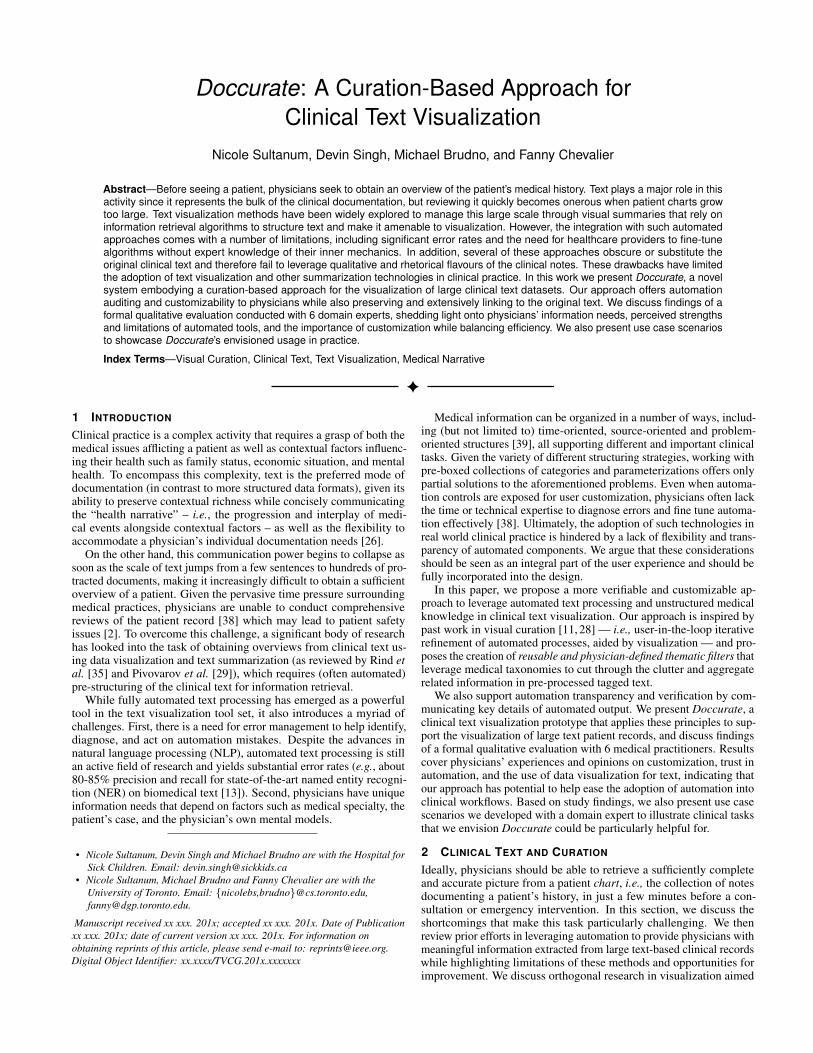
Doccurate: A Curation-Based Approach forClinical Text Visualization
Nicole Sultanum, Devin Singh, Michael Brudno, and Fanny Chevalier
Abstract—Before seeing a patient, physicians seek to obtain an overview of the patient’s medical history. Text plays a major role in thisactivity since it represents the bulk of the clinical documentation, but reviewing it quickly becomes onerous when patient charts growtoo large. Text visualization methods have been widely explored to manage this large scale through visual summaries that rely oninformation retrieval algorithms to structure text and make it amenable to visualization. However, the integration with such automatedapproaches comes with a number of limitations, including significant error rates and the need for healthcare providers to fine-tunealgorithms without expert knowledge of their inner mechanics. In addition, several of these approaches obscure or substitute theoriginal clinical text and therefore fail to leverage qualitative and rhetorical flavours of the clinical notes. These drawbacks have limitedthe adoption of text visualization and other summarization technologies in clinical practice. In this work we present Doccurate, a novelsystem embodying a curation-based approach for the visualization of large clinical text datasets. Our approach offers automationauditing and customizability to physicians while also preserving and extensively linking to the original text. We discuss findings of aformal qualitative evaluation conducted with 6 domain experts, shedding light onto physicians’ information needs, perceived strengthsand limitations of automated tools, and the importance of customization while balancing efficiency. We also present use case scenariosto showcase Doccurate’s envisioned usage in practice.
Index Terms—Visual Curation, Clinical Text, Text Visualization, Medical Narrative
1 INTRODUCTION
Clinical practice is a complex activity that requires a grasp of both themedical issues afflicting a patient as well as contextual factors influenc-ing their health such as family status, economic situation, and mentalhealth. To encompass this complexity, text is the preferred mode ofdocumentation (in contrast to more structured data formats), given itsability to preserve contextual richness while concisely communicatingthe “health narrative” – i.e., the progression and interplay of medi-cal events alongside contextual factors – as well as the flexibility toaccommodate a physician’s individual documentation needs [26].
On the other hand, this communication power begins to collapse assoon as the scale of text jumps from a few sentences to hundreds of pro-tracted documents, making it increasingly difficult to obtain a sufficientoverview of a patient. Given the pervasive time pressure surroundingmedical practices, physicians are unable to conduct comprehensivereviews of the patient record [38] which may lead to patient safetyissues [2]. To overcome this challenge, a significant body of researchhas looked into the task of obtaining overviews from clinical text us-ing data visualization and text summarization (as reviewed by Rind etal. [35] and Pivovarov et al. [29]), which requires (often automated)pre-structuring of the clinical text for information retrieval.
While fully automated text processing has emerged as a powerfultool in the text visualization tool set, it also introduces a myriad ofchallenges. First, there is a need for error management to help identify,diagnose, and act on automation mistakes. Despite the advances innatural language processing (NLP), automated text processing is stillan active field of research and yields substantial error rates (e.g., about80-85% precision and recall for state-of-the-art named entity recogni-tion (NER) on biomedical text [13]). Second, physicians have uniqueinformation needs that depend on factors such as medical specialty, thepatient’s case, and the physician’s own mental models.
• Nicole Sultanum, Devin Singh and Michael Brudno are with the Hospital forSick Children. Email: [email protected]
• Nicole Sultanum, Michael Brudno and Fanny Chevalier are with theUniversity of Toronto. Email: {nicolebs,brudno}@cs.toronto.edu,[email protected].
Manuscript received xx xxx. 201x; accepted xx xxx. 201x. Date of Publicationxx xxx. 201x; date of current version xx xxx. 201x. For information onobtaining reprints of this article, please send e-mail to: [email protected] Object Identifier: xx.xxxx/TVCG.201x.xxxxxxx
Medical information can be organized in a number of ways, includ-ing (but not limited to) time-oriented, source-oriented and problem-oriented structures [39], all supporting different and important clinicaltasks. Given the variety of different structuring strategies, working withpre-boxed collections of categories and parameterizations offers onlypartial solutions to the aforementioned problems. Even when automa-tion controls are exposed for user customization, physicians often lackthe time or technical expertise to diagnose errors and fine tune automa-tion effectively [38]. Ultimately, the adoption of such technologies inreal world clinical practice is hindered by a lack of flexibility and trans-parency of automated components. We argue that these considerationsshould be seen as an integral part of the user experience and should befully incorporated into the design.
In this paper, we propose a more verifiable and customizable ap-proach to leverage automated text processing and unstructured medicalknowledge in clinical text visualization. Our approach is inspired bypast work in visual curation [11, 28] — i.e., user-in-the-loop iterativerefinement of automated processes, aided by visualization — and pro-poses the creation of reusable and physician-defined thematic filters thatleverage medical taxonomies to cut through the clutter and aggregaterelated information in pre-processed tagged text.
We also support automation transparency and verification by com-municating key details of automated output. We present Doccurate, aclinical text visualization prototype that applies these principles to sup-port the visualization of large text patient records, and discuss findingsof a formal qualitative evaluation with 6 medical practitioners. Resultscover physicians’ experiences and opinions on customization, trust inautomation, and the use of data visualization for text, indicating thatour approach has potential to help ease the adoption of automation intoclinical workflows. Based on study findings, we also present use casescenarios we developed with a domain expert to illustrate clinical tasksthat we envision Doccurate could be particularly helpful for.
2 CLINICAL TEXT AND CURATION
Ideally, physicians should be able to retrieve a sufficiently completeand accurate picture from a patient chart, i.e., the collection of notesdocumenting a patient’s history, in just a few minutes before a con-sultation or emergency intervention. In this section, we discuss theshortcomings that make this task particularly challenging. We thenreview prior efforts in leveraging automation to provide physicians withmeaningful information extracted from large text-based clinical recordswhile highlighting limitations of these methods and opportunities forimprovement. We discuss orthogonal research in visualization aimed
at providing visual summaries of large text corpora (with varied levelsof automation) in other domains. Finally, we introduce our proposedapproach aiming to reconcile the power of automation and physician-defined customization to support individual information needs.
2.1 Challenges of Clinical TextPrior to seeing a patient, physicians seek to obtain sufficient overviewof the patient’s history to guide the consultation by reviewing the patientchart [4,25]. They focus on trying to capture the key medical issues intoa problems list and put together a proto-narrative (mental or drafted)of the patient’s history encompassing known and probable causes to bethen reassessed with the patient [25]. However, because clinicians havelimited time to achieve sufficient overview [4], they adopt strategiesto optimize their study, such as skimming notes for medical issues,focusing on recent information, and directly asking the patient fordetails [38]. These strategies usually cover most crucial information,but provide limited coverage of details buried in the patient record orthe patient’s memory that may be relevant. This represents a patientsafety concern [2], and risks escalate further when physicians reviewlonger patient charts with hundreds of documents [29]. Skimming notes,in particular, is further complicated by non-standardized formatting,content redundancy and information scatter.
2.2 Physicians & AutomationIn view of this information overload, automated strategies have beenproposed to facilitate physician access to text content in patient charts,including text summarization and visual summaries [29]. However,these strategies require significant oversight of text structuring pro-cesses before their output can be conveyed to the physician.
Early seminal work such as Lifelines [30–32] and Powsner & Tufte’sGraphical Summary [33] required content to be manually extractedfrom text before it could be visualized. In later research, automation wasgradually introduced to reorganize documents in a patient chart accord-ing to medical problems [5], generate chronicles from events extractedfrom clinical text and regenerate standardized text summaries [14, 15],extract medical issues to generate problem-based timelines [14, 15, 18]and problem-based word clouds [17], and leverage disease graphicalmodels to infer causality [18]. These works either operate on the as-sumption that the structured data is correct or acknowledge the need ofa human annotator to oversee the process. MedStory [38], our previousinvestigation to leverage medical text alongside visualization, relies onnamed entity recognition (NER) to identify concepts in the text and pro-vides extensive linking to the originating documents, but does not offermechanisms to correct or improve the outcomes of the automation.
Arguably, the lack of comprehensive validation of automated out-comes is a significant obstacle to NLP adoption [29], which in turndeters in the wild evaluations. Most validation efforts so far have fo-cused on assessing accuracy of automated tools and few works havelooked into how NLP-based technologies can be better integrated intoclinical practice. A few notable exceptions include expert validationof automated output, such as a recent study comparing physicians’perceived usefulness of manually created problem lists, automatic listsgenerated by IBM Watson, and a physician’s own list [7]. They foundphysicians rated the automatic list higher than the generic manualproblem list, but still consistently rated their own lists higher than theautomated ones; this may suggest a need to leverage some physicianagency and sense of ownership over fully automated approaches.
Another trend is investigating human-in-the-loop strategies to under-stand and customize automation tools. An evaluation of NLPReVis [40],a system designed for physicians to refine their own NLP models, foundthat participants were able to improve the models from a small initialtraining set, but still involved a lengthy hour long process of dedicatedwork that did not integrate into a physician’s standard chart reviewworkflow. Overall, a number of challenges that deter NLP adoption inclinical practice still persist, including lack of generalizability (requir-ing NLP models to be rebuilt and retrained for different tasks), lack ofcustomization features for end users, and lack of understanding of howthese NLP tools can effectively fit into user workflows [6].
2.3 Text Visualization in Other DomainsText visualization is a complex and multifaceted problem with a signifi-cant research history. Of relevance to our target problem, we highlightworks that aim to (a) summarize large temporally-oriented text col-lections, (b) visually support text navigation, and (c) mediate use ofautomated text processing components.
Relating to text summarization, word clouds are a popular visual-ization strategy that have been frequently used with streamgraphs tovisualize overarching themes in the text along their evolving prevalenceover time. After ThemeRiver [16] pioneered the representation, sev-eral others leveraged it to summarize microblog streams [3, 8], emailcommunication [24], news media [9] and academic documents [23].To better emphasize individual theme prevalence, some works evolvedfrom the original stacked layout and instead separate individual streamsinto dedicated tracks [9,23] . Although useful at providing high-level at-a-glance overview, word cloud-based approaches are arguably limitedfor tasks that requires deeper narrative understanding of the underlyingtext, e.g., relationships between entities, motives, and rationale.
Fewer works undertake the problem of navigating text collectionsto support low-level reading tasks such as highlighting locations ofinterest and supporting direct navigation to any segment of text. Notableinstances include VarifocalReader [22] that provides a multi-level visualindex of a large text document to conciliate overview and details ina single view, and Belmonte’s Twitter visualization of Obama’s 2014State of the Union (SOTU) address [3] that complements a speechtranscript with graphical views showing concurrent Twitter activityat each segment of the speech. While these works inform valuablestrategies to support text through visualization, none have been designedto consider the unique characteristics of the medical domain.
Most of the works above employ some form of automated text pro-cessing (e.g., topic models [24]) but do not provide mechanisms toverify automation performance. To tackle this issue, recent works re-consider traditional visualization workflows that assume the correctnessof automated text processing to instead acknowledge the limitationsof automation and enable user interventions over automated input asan integral part of the process. TimelineCurator [11] proposes a semi-automatic approach to creating timelines that leverages an averageperforming temporal extraction algorithm to identify events, and offerstools to both verify the output and to curate events to be shown. Con-ceptVector [28], on the other hand, supports the creation of lexicons viaword embedding techniques that are driven by user-defined keywordconcepts. Both strategies propose to seamlessly integrate into existingworkflows—i.e., creating timelines [11] and building lexicons while an-alyzing document sets [28]—and include an iterative refinement loop toprogressively improve the underlying semantic structures representingknowledge from text. Naturally, none of these applications are suitedor relevant for medical applications as-is, and although they are muchfaster than manual labour they still require significant time investmentbefore user efforts are rewarded.
2.4 Our approach: Visual Curation meets Medical NLPWe take inspiration from TimelineCurator [11], ConceptVector [28],and their semi-automatic visual curation models to inform the desirablecharacteristics of our proposed approach. We argue that the use ofNLP in clinical practice should be framed in a more physician-centeredmanner that (a) allows for a continued adaptation of automation topersonal and evolving information needs, (b) fosters a more verifiableand adequate reliance on automated tools, (c) integrates into existingclinical workflows, and (d) supports efficiency. To fulfill this vision,we propose a new interaction model supported by data visualization toallow physicians more agency over automated processes, by:
Empowering user oversight. Automated NLP tools are efficient atextracting structure from large collections of plain text, but also failoften. Both the visualization and the original underlying text supportusers in detecting and correcting errors themselves, providing autonomyand encouraging proper, balanced reliance on automation.
User-defined structures. The equivalent of an authoring tool forphysicians would be to provide the ability to define customizable facets
of the medical narrative to represent perspectives the physician is inter-ested in conveying at any given time. Flexibility is crucial to supporttheir varied and complex information needs.
Considering the unique requirements of the medical domain, we alsoaccount for the following complementary aspects:
Integration into clinical workflows. Instead of seeing curationas a standalone activity separate from the patient care process (e.g.,retraining NLP models on one’s spare time), curation should seamlesslyintegrate into daily clinical workflows and activities such as patientchart reviews.
Efficiency and Reusability. If curation activities are to be seenas integral and continued effort within clinical workflow, its burdenshould be minimized and it should ideally help save time in the longrun. Individual curation actions should be efficient and leverage pastcuration efforts as much as possible.
3 DoccurateWe designed Doccurate as a data visualization tool to support overviewof large patient charts. In addition to the overarching goals definedin the previous section, we also leverage design considerations fromprior work to support clinical text overview (the result of formativeand summative assessments with 22 physicians) [38] and physicianinteraction with NLP automation [40]. Our design goals are as follows:
(G1) Preserve the original text. Apart from text being a familiarmedium, clinical notes are regarded as “medical evidence” [38] andshould be available in their original form (instead of being replacedwith other forms of summarization or only in smaller parts).
(G2) Foster suitable trust over automated output. Physiciansshould be offered means to assess the extent to which they can rely onautomation. We support this by selectively exposing internal aspects ofthe automation and providing extensive linkage to the original text.
(G3) Provide information in different levels of granularity. Sup-port both information in-a-glance for high-level overview as well astools for content exploration and information seeking.
(G4) Support user-driven customization. Physicians’ informationrequirements and personal preferences are diverse, so it is important tosupport some level of interface tailoring to suit these needs.
(G5) Convey time and progression. Understanding how medicalproblems evolved over time is an important aspect of clinical overviewand, therefore, temporal references should be thoroughly supported.
(G6) Support content faceting. The patient chart is structured likea chronicle, with medical notes representing localized snapshots ofthe patient’s health status and thus may encompass information onseveral issues. When the focus is on one particular medical problem,physicians should have the ability to cross-cut the record to get a morecoherent picture of that issue.
3.1 Filter Collections (FCs) as Curated Content FacetsFollowing our established emphasis on customization and reusability,we propose Filter Collections (or FCs for short) as our curation build-ing blocks, consisting of physician-defined semantic filters to createfaceted views of clinical content. FCs leverage text tagged by automatedentity recognition algorithms and their mappings to medical taxonomiessuch as SNOMED-CT [19]. These taxonomies provide thorough en-codings of domain specific knowledge that can be used to improve textprocessing outcomes, e.g., topic models of medical record data [12]. Inthis work we make use of the hierarchical structure of taxonomies todefine semantic scopes of interest. As follows, an FC basically definesa set of related umbrella concepts pertaining to a shared meaning; byleveraging parent-child relationships in taxonomies, we can extend thismeaning to a large collection of children concepts covered under theumbrella and rapidly group related concepts together.
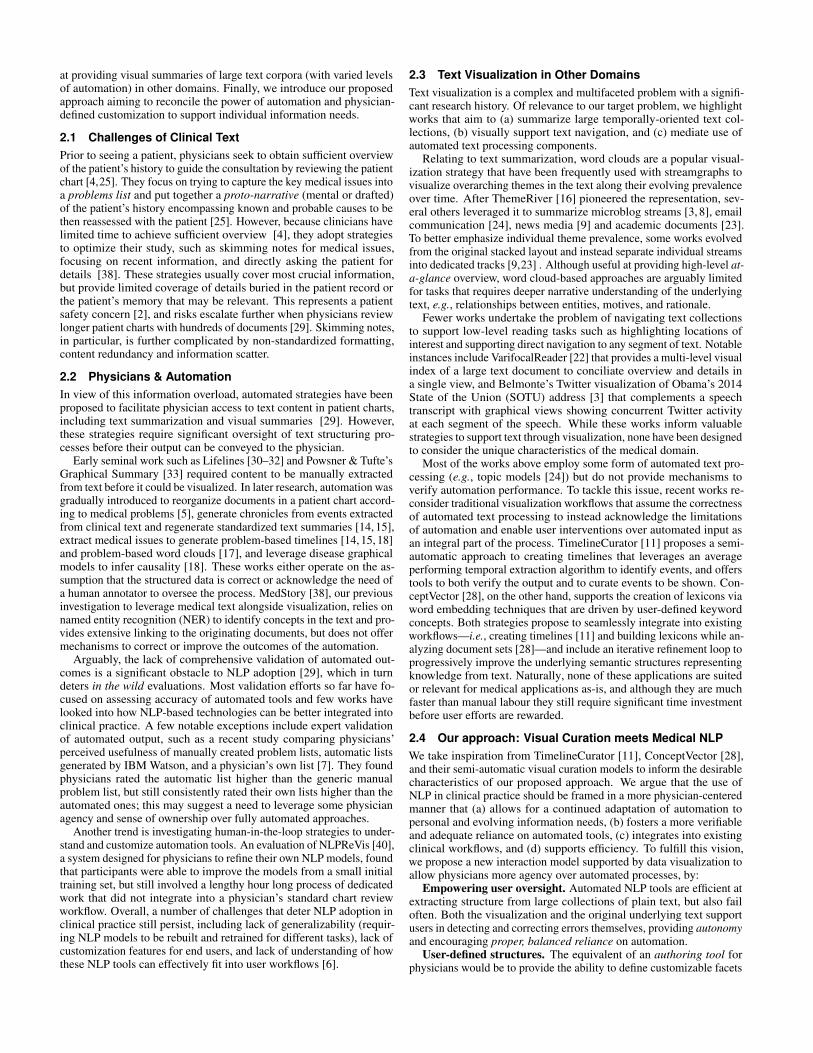
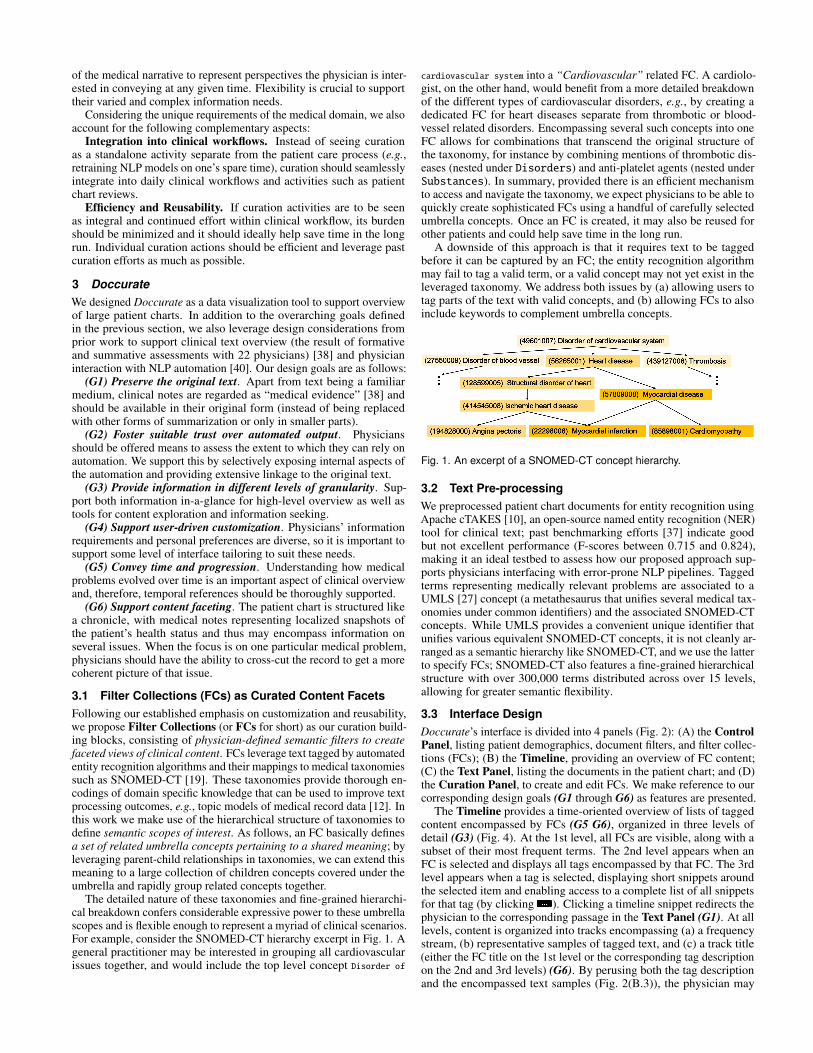
The detailed nature of these taxonomies and fine-grained hierarchi-cal breakdown confers considerable expressive power to these umbrellascopes and is flexible enough to represent a myriad of clinical scenarios.For example, consider the SNOMED-CT hierarchy excerpt in Fig. 1. Ageneral practitioner may be interested in grouping all cardiovascularissues together, and would include the top level concept Disorder of
cardiovascular system into a “Cardiovascular” related FC. A cardiolo-gist, on the other hand, would benefit from a more detailed breakdownof the different types of cardiovascular disorders, e.g., by creating adedicated FC for heart diseases separate from thrombotic or blood-vessel related disorders. Encompassing several such concepts into oneFC allows for combinations that transcend the original structure ofthe taxonomy, for instance by combining mentions of thrombotic dis-eases (nested under Disorders) and anti-platelet agents (nested underSubstances). In summary, provided there is an efficient mechanismto access and navigate the taxonomy, we expect physicians to be able toquickly create sophisticated FCs using a handful of carefully selectedumbrella concepts. Once an FC is created, it may also be reused forother patients and could help save time in the long run.
A downside of this approach is that it requires text to be taggedbefore it can be captured by an FC; the entity recognition algorithmmay fail to tag a valid term, or a valid concept may not yet exist in theleveraged taxonomy. We address both issues by (a) allowing users totag parts of the text with valid concepts, and (b) allowing FCs to alsoinclude keywords to complement umbrella concepts.
Fig. 1. An excerpt of a SNOMED-CT concept hierarchy.
3.2 Text Pre-processingWe preprocessed patient chart documents for entity recognition usingApache cTAKES [10], an open-source named entity recognition (NER)tool for clinical text; past benchmarking efforts [37] indicate goodbut not excellent performance (F-scores between 0.715 and 0.824),making it an ideal testbed to assess how our proposed approach sup-ports physicians interfacing with error-prone NLP pipelines. Taggedterms representing medically relevant problems are associated to aUMLS [27] concept (a metathesaurus that unifies several medical tax-onomies under common identifiers) and the associated SNOMED-CTconcepts. While UMLS provides a convenient unique identifier thatunifies various equivalent SNOMED-CT concepts, it is not cleanly ar-ranged as a semantic hierarchy like SNOMED-CT, and we use the latterto specify FCs; SNOMED-CT also features a fine-grained hierarchicalstructure with over 300,000 terms distributed across over 15 levels,allowing for greater semantic flexibility.
3.3 Interface DesignDoccurate’s interface is divided into 4 panels (Fig. 2): (A) the ControlPanel, listing patient demographics, document filters, and filter collec-tions (FCs); (B) the Timeline, providing an overview of FC content;(C) the Text Panel, listing the documents in the patient chart; and (D)the Curation Panel, to create and edit FCs. We make reference to ourcorresponding design goals (G1 through G6) as features are presented.
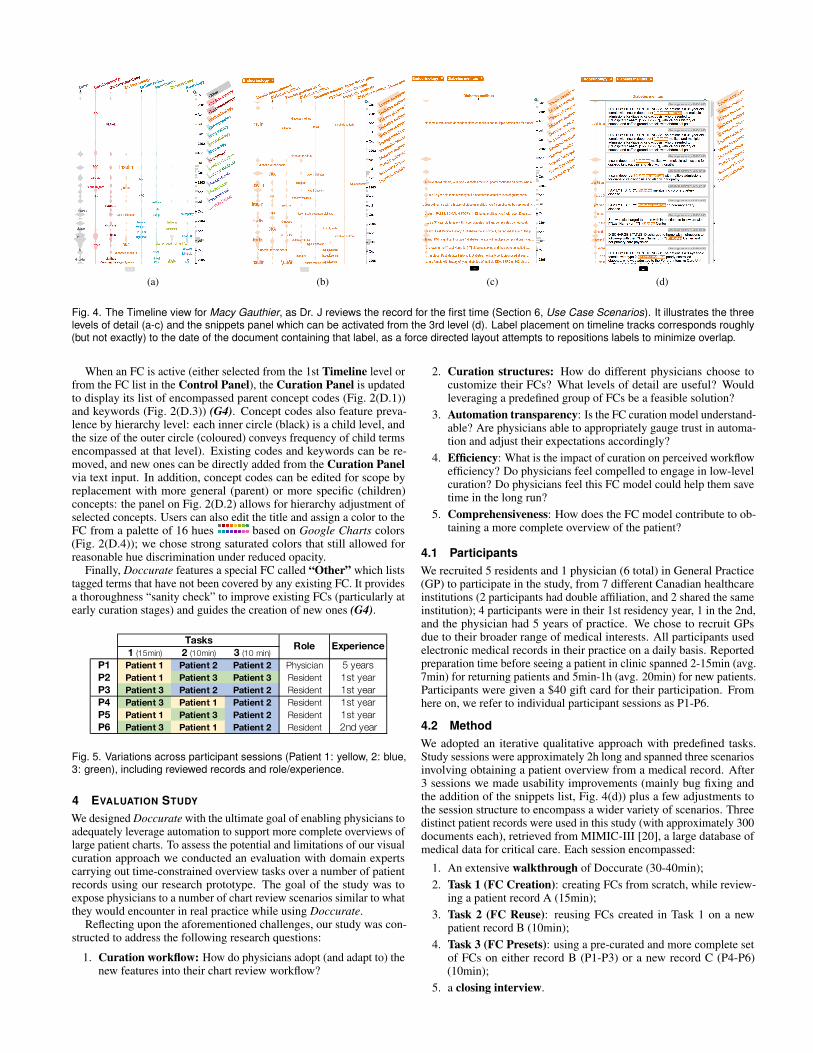
The Timeline provides a time-oriented overview of lists of taggedcontent encompassed by FCs (G5 G6), organized in three levels ofdetail (G3) (Fig. 4). At the 1st level, all FCs are visible, along with asubset of their most frequent terms. The 2nd level appears when anFC is selected and displays all tags encompassed by that FC. The 3rdlevel appears when a tag is selected, displaying short snippets aroundthe selected item and enabling access to a complete list of all snippetsfor that tag (by clicking ). Clicking a timeline snippet redirects thephysician to the corresponding passage in the Text Panel (G1). At alllevels, content is organized into tracks encompassing (a) a frequencystream, (b) representative samples of tagged text, and (c) a track title(either the FC title on the 1st level or the corresponding tag descriptionon the 2nd and 3rd levels) (G6). By perusing both the tag descriptionand the encompassed text samples (Fig. 2(B.3)), the physician may

Fig. 2. Doccurate’s interface: (A) Control Panel with Demographics (A.1), options to adjust the Timeline’s binning interval and the visible documentstypes in the Text Panel (A.2), and the complete list of FCs sorted by frequency (A.3); (B) Timeline with breadcrumbs indicating level of detail (B.1),scrollable list of items encompassed by the current level (B.3); items tracks with frequency streams and representative labels (B.5), a dark linemarker indicating time of current visible document (B.2) and time axis, featuring a document histogram (B.4); (C) Text Panel, with the double textoverview bar and respectivedocument counts at the bottom (C.1), and all visible chart documents (C.2); (D) Curation Panel for a selected FC, withsubpanels for the list of codes (D.1), hierarchy adjustment for a selected code (D.2), list of keywords (D.3) and colour/title editing (D.4).
Fig. 3. The curation information panel, displayed when text is selected inthe Text Panel. It lists (A) the selected term, (B) its associated FCs andconcept codes, and (C) valid curation actions for the term.
be able to identify tagging mistakes on the go (G2). All items in alevel are listed on the right (Fig. 2(B.5)), sorted by frequency (mostfrequent first), and can be scrolled through to access other items in thatlevel (visible items are bolded). Behind the time axis (Fig. 2(B.4)), adocument histogram shows the number of documents at specified timeintervals. The interval can be adjusted in the Control Panel (Fig. 2(A))and updates both the document histogram and the track streams.
The Text Panel contains all chart documents, concatenated in a longscrolling list and chronologically sorted (G1, G5). A text overview bar(Fig. 2(C.1)) indicates the length and position of chart documents (andcurrent viewport, Fig. 2(C.3)) relative to the entire chart. The Timelinealso features horizontal markers indicating the creation date of current
visible documents (Fig. 2(B.2)) (G5). From the Control Panel, specificdocument types can be selected for viewing (G6): on Fig. 2(A.2), onlydischarge summaries (Disch.) are selected for viewing, which alsoupdates the right half of the text overview bar to list only the visibledocuments (Fig. 2(C.1)) and document counts for total and filtereddocuments (at the bottom). When an FC is active, the text overviewbar displays the location of all tagged text in that FC as coloured linesto convey density and highlight tag clusters; users can navigate to anypart of the visible chart (e.g., to inspect tag clusters) by clicking on thecorresponding location in the text overview bar. Tagged text is alsohighlighted in the document view (Fig. 2(C.2)).
Users can perform a number of curation-related activities directlyfrom the text. If a tagged term is clicked, an information panel appears(Fig. 3) indicating FCs that encompass that term, all SNOMED-CT con-cepts associated to it, and parent concepts that triggered FC inclusion(following “>>>”). This information allows the troubleshooting ofwrong or dubious FC inclusion, either due to incorrect code assignmentor parent-concept over/under scoping (G2). Relevant curation actionsare also available, including adding the selected term to an existingFC, creating a new FC including that term, and removing assignedcodes (Fig. 3(C)). For non-tagged text, drag-selecting a text snippetwill display the same information panel, with for the first two FC cura-tion actions being performed with the term as a keyword instead, andthe third action changed to add a concept code instead of removing.This way, curation actions and error corrections (that propagate to allmentions of the same concept/term) can be performed in context whilethe physician is reading the note (G1 G2 G4).
New Version
(a) (b) (c) (d)
Fig. 4. The Timeline view for Macy Gauthier, as Dr. J reviews the record for the first time (Section 6, Use Case Scenarios). It illustrates the threelevels of detail (a-c) and the snippets panel which can be activated from the 3rd level (d). Label placement on timeline tracks corresponds roughly(but not exactly) to the date of the document containing that label, as a force directed layout attempts to repositions labels to minimize overlap.
When an FC is active (either selected from the 1st Timeline level orfrom the FC list in the Control Panel), the Curation Panel is updatedto display its list of encompassed parent concept codes (Fig. 2(D.1))and keywords (Fig. 2(D.3)) (G4). Concept codes also feature preva-lence by hierarchy level: each inner circle (black) is a child level, andthe size of the outer circle (coloured) conveys frequency of child termsencompassed at that level). Existing codes and keywords can be re-moved, and new ones can be directly added from the Curation Panelvia text input. In addition, concept codes can be edited for scope byreplacement with more general (parent) or more specific (children)concepts: the panel on Fig. 2(D.2) allows for hierarchy adjustment ofselected concepts. Users can also edit the title and assign a color to theFC from a palette of 16 hues based on Google Charts colors(Fig. 2(D.4)); we chose strong saturated colors that still allowed forreasonable hue discrimination under reduced opacity.
Finally, Doccurate features a special FC called “Other” which liststagged terms that have not been covered by any existing FC. It providesa thoroughness “sanity check” to improve existing FCs (particularly atearly curation stages) and guides the creation of new ones (G4).
1 (15min) 2 (10min) 3 (10 min)P1 Patient 1 Patient 2 Patient 2 Physician 5 yearsP2 Patient 1 Patient 3 Patient 3 Resident 1st yearP3 Patient 3 Patient 2 Patient 2 Resident 1st yearP4 Patient 3 Patient 1 Patient 2 Resident 1st yearP5 Patient 1 Patient 3 Patient 2 Resident 1st yearP6 Patient 3 Patient 1 Patient 2 Resident 2nd year
Role ExperienceTasks
Fig. 5. Variations across participant sessions (Patient 1: yellow, 2: blue,3: green), including reviewed records and role/experience.
4 EVALUATION STUDY
We designed Doccurate with the ultimate goal of enabling physicians toadequately leverage automation to support more complete overviews oflarge patient charts. To assess the potential and limitations of our visualcuration approach we conducted an evaluation with domain expertscarrying out time-constrained overview tasks over a number of patientrecords using our research prototype. The goal of the study was toexpose physicians to a number of chart review scenarios similar to whatthey would encounter in real practice while using Doccurate.
Reflecting upon the aforementioned challenges, our study was con-structed to address the following research questions:
1. Curation workflow: How do physicians adopt (and adapt to) thenew features into their chart review workflow?
2. Curation structures: How do different physicians choose tocustomize their FCs? What levels of detail are useful? Wouldleveraging a predefined group of FCs be a feasible solution?
3. Automation transparency: Is the FC curation model understand-able? Are physicians able to appropriately gauge trust in automa-tion and adjust their expectations accordingly?
4. Efficiency: What is the impact of curation on perceived workflowefficiency? Do physicians feel compelled to engage in low-levelcuration? Do physicians feel this FC model could help them savetime in the long run?
5. Comprehensiveness: How does the FC model contribute to ob-taining a more complete overview of the patient?
4.1 ParticipantsWe recruited 5 residents and 1 physician (6 total) in General Practice(GP) to participate in the study, from 7 different Canadian healthcareinstitutions (2 participants had double affiliation, and 2 shared the sameinstitution); 4 participants were in their 1st residency year, 1 in the 2nd,and the physician had 5 years of practice. We chose to recruit GPsdue to their broader range of medical interests. All participants usedelectronic medical records in their practice on a daily basis. Reportedpreparation time before seeing a patient in clinic spanned 2-15min (avg.7min) for returning patients and 5min-1h (avg. 20min) for new patients.Participants were given a $40 gift card for their participation. Fromhere on, we refer to individual participant sessions as P1-P6.
4.2 MethodWe adopted an iterative qualitative approach with predefined tasks.Study sessions were approximately 2h long and spanned three scenariosinvolving obtaining a patient overview from a medical record. After3 sessions we made usability improvements (mainly bug fixing andthe addition of the snippets list, Fig. 4(d)) plus a few adjustments tothe session structure to encompass a wider variety of scenarios. Threedistinct patient records were used in this study (with approximately 300documents each), retrieved from MIMIC-III [20], a large database ofmedical data for critical care. Each session encompassed:
1. An extensive walkthrough of Doccurate (30-40min);2. Task 1 (FC Creation): creating FCs from scratch, while review-
ing a patient record A (15min);3. Task 2 (FC Reuse): reusing FCs created in Task 1 on a new
patient record B (10min);4. Task 3 (FC Presets): using a pre-curated and more complete set
of FCs on either record B (P1-P3) or a new record C (P4-P6)(10min);
5. a closing interview.
Participants ModeTasks 1 2 3 1 2 3 1 2 3 1 2 3 1 2 3 1 2 3 1 2 3 All 1 2 3 All All
1 I felt confident that I was not missing anything important 1 1 2 5 5 5 5 5 5 2 2 2 6 5 6 2 4 3 7 is better 3.50 3.67 3.75 3.64 3.5 4.5 4 4.5 5
2 I felt overwhelmed by the amount of features in this system 6 2 2 6 4 2 7 5 5 6 6 5 6 6 4 6 6 6 1 is better 6.08 4.83 4.00 4.97 6 5.5 5 5.75 6
3 Despite the mistakes in NLP , I felt the system provided me with useful information
5 6 6 6 4 6 3 5 5 6 6 5 3 4 6 4 4 5 7 is better 4.50 4.83 5.50 4.94 4.5 4.5 6 5 6
4 I felt the taxonomy based system was too confusing 4 2 2 6 2 4 7 4 5 6 5 5 2 4 3 3 4 4 1 is better 4.67 3.50 3.83 4.00 5 4 4 4 4
5I felt this system could help me be more
efficient in the long run 6 6 5 6 6 5 3 4 3 3 3 3 2 2 6 3 2 3 7 is better 3.83 3.83 4.17 3.94 3 3.5 4 3 3
1 2 3 4 5 6 7 1 2 3 4 5 6 7Strongly Disagree Strongly Agree Strongly Disagree Strongly Agree
1 is better
Mean MedianP1 P2 P3 P4 P5 P6
7 is better
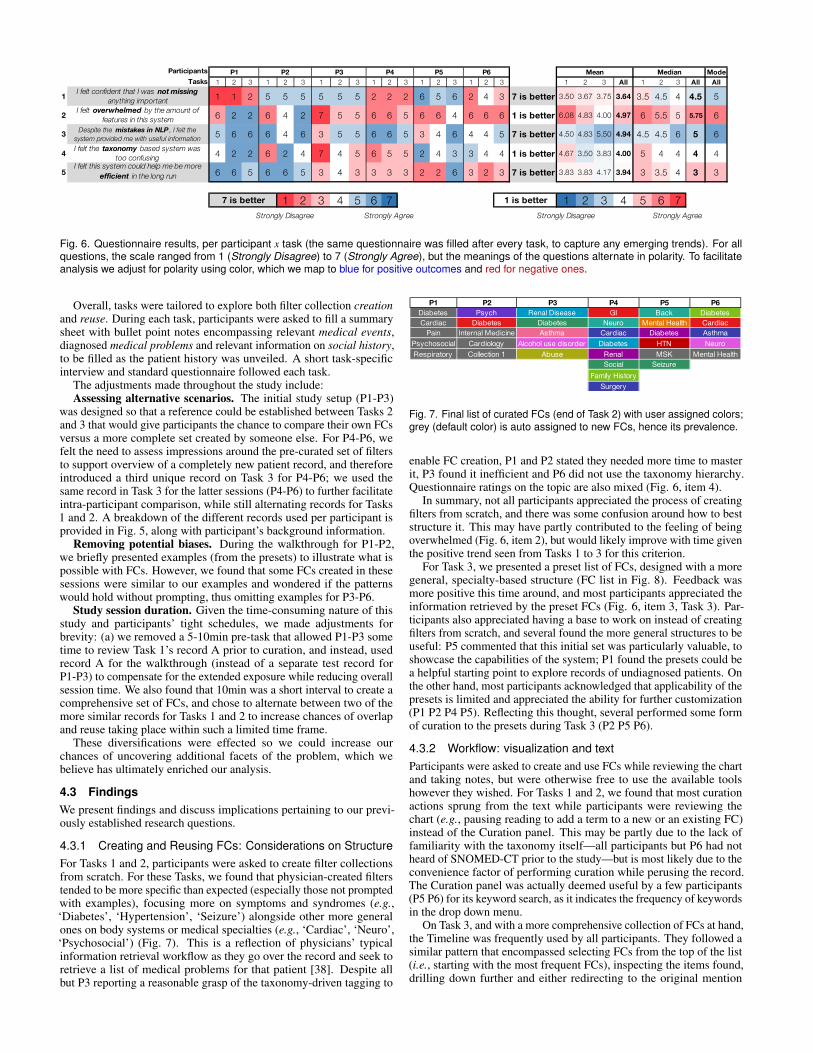
Fig. 6. Questionnaire results, per participant x task (the same questionnaire was filled after every task, to capture any emerging trends). For allquestions, the scale ranged from 1 (Strongly Disagree) to 7 (Strongly Agree), but the meanings of the questions alternate in polarity. To facilitateanalysis we adjust for polarity using color, which we map to blue for positive outcomes and red for negative ones.
Overall, tasks were tailored to explore both filter collection creationand reuse. During each task, participants were asked to fill a summarysheet with bullet point notes encompassing relevant medical events,diagnosed medical problems and relevant information on social history,to be filled as the patient history was unveiled. A short task-specificinterview and standard questionnaire followed each task.
The adjustments made throughout the study include:Assessing alternative scenarios. The initial study setup (P1-P3)
was designed so that a reference could be established between Tasks 2and 3 that would give participants the chance to compare their own FCsversus a more complete set created by someone else. For P4-P6, wefelt the need to assess impressions around the pre-curated set of filtersto support overview of a completely new patient record, and thereforeintroduced a third unique record on Task 3 for P4-P6; we used thesame record in Task 3 for the latter sessions (P4-P6) to further facilitateintra-participant comparison, while still alternating records for Tasks1 and 2. A breakdown of the different records used per participant isprovided in Fig. 5, along with participant’s background information.
Removing potential biases. During the walkthrough for P1-P2,we briefly presented examples (from the presets) to illustrate what ispossible with FCs. However, we found that some FCs created in thesesessions were similar to our examples and wondered if the patternswould hold without prompting, thus omitting examples for P3-P6.
Study session duration. Given the time-consuming nature of thisstudy and participants’ tight schedules, we made adjustments forbrevity: (a) we removed a 5-10min pre-task that allowed P1-P3 sometime to review Task 1’s record A prior to curation, and instead, usedrecord A for the walkthrough (instead of a separate test record forP1-P3) to compensate for the extended exposure while reducing overallsession time. We also found that 10min was a short interval to create acomprehensive set of FCs, and chose to alternate between two of themore similar records for Tasks 1 and 2 to increase chances of overlapand reuse taking place within such a limited time frame.
These diversifications were effected so we could increase ourchances of uncovering additional facets of the problem, which webelieve has ultimately enriched our analysis.
4.3 FindingsWe present findings and discuss implications pertaining to our previ-ously established research questions.
4.3.1 Creating and Reusing FCs: Considerations on StructureFor Tasks 1 and 2, participants were asked to create filter collectionsfrom scratch. For these Tasks, we found that physician-created filterstended to be more specific than expected (especially those not promptedwith examples), focusing more on symptoms and syndromes (e.g.,‘Diabetes’, ‘Hypertension’, ‘Seizure’) alongside other more generalones on body systems or medical specialties (e.g., ‘Cardiac’, ‘Neuro’,‘Psychosocial’) (Fig. 7). This is a reflection of physicians’ typicalinformation retrieval workflow as they go over the record and seek toretrieve a list of medical problems for that patient [38]. Despite allbut P3 reporting a reasonable grasp of the taxonomy-driven tagging to
P1 P2 P3 P4 P5 P6Diabetes Psych Renal Disease GI Back DiabetesCardiac Diabetes Diabetes Neuro Mental Health Cardiac
Pain Internal Medicine Asthma Cardiac Diabetes AsthmaPsychosocial Cardiology Alcohol use disorder Diabetes HTN NeuroRespiratory Collection 1 Abuse Renal MSK Mental Health
Social SeizureFamily History
Surgery
Fig. 7. Final list of curated FCs (end of Task 2) with user assigned colors;grey (default color) is auto assigned to new FCs, hence its prevalence.
enable FC creation, P1 and P2 stated they needed more time to masterit, P3 found it inefficient and P6 did not use the taxonomy hierarchy.Questionnaire ratings on the topic are also mixed (Fig. 6, item 4).
In summary, not all participants appreciated the process of creatingfilters from scratch, and there was some confusion around how to beststructure it. This may have partly contributed to the feeling of beingoverwhelmed (Fig. 6, item 2), but would likely improve with time giventhe positive trend seen from Tasks 1 to 3 for this criterion.
For Task 3, we presented a preset list of FCs, designed with a moregeneral, specialty-based structure (FC list in Fig. 8). Feedback wasmore positive this time around, and most participants appreciated theinformation retrieved by the preset FCs (Fig. 6, item 3, Task 3). Par-ticipants also appreciated having a base to work on instead of creatingfilters from scratch, and several found the more general structures to beuseful: P5 commented that this initial set was particularly valuable, toshowcase the capabilities of the system; P1 found the presets could bea helpful starting point to explore records of undiagnosed patients. Onthe other hand, most participants acknowledged that applicability of thepresets is limited and appreciated the ability for further customization(P1 P2 P4 P5). Reflecting this thought, several performed some formof curation to the presets during Task 3 (P2 P5 P6).
4.3.2 Workflow: visualization and textParticipants were asked to create and use FCs while reviewing the chartand taking notes, but were otherwise free to use the available toolshowever they wished. For Tasks 1 and 2, we found that most curationactions sprung from the text while participants were reviewing thechart (e.g., pausing reading to add a term to a new or an existing FC)instead of the Curation panel. This may be partly due to the lack offamiliarity with the taxonomy itself—all participants but P6 had notheard of SNOMED-CT prior to the study—but is most likely due to theconvenience factor of performing curation while perusing the record.The Curation panel was actually deemed useful by a few participants(P5 P6) for its keyword search, as it indicates the frequency of keywordsin the drop down menu.
On Task 3, and with a more comprehensive collection of FCs at hand,the Timeline was frequently used by all participants. They followed asimilar pattern that encompassed selecting FCs from the top of the list(i.e., starting with the most frequent FCs), inspecting the items found,drilling down further and either redirecting to the original mention
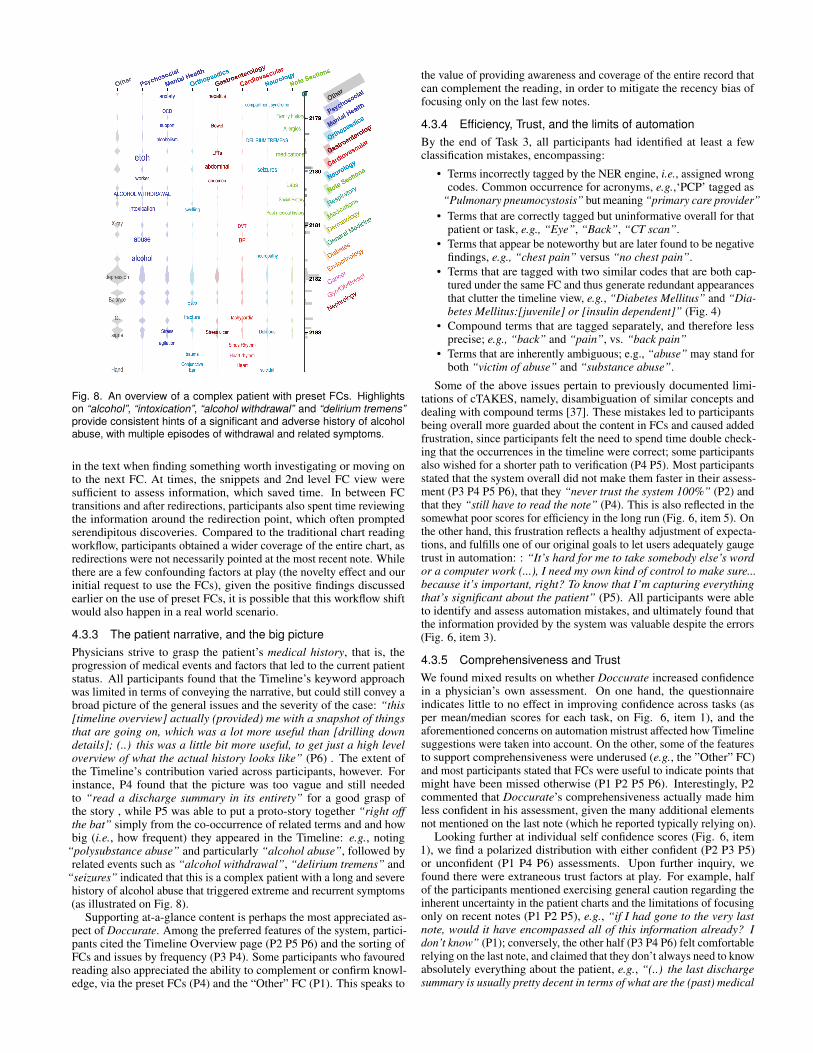
Fig. 8. An overview of a complex patient with preset FCs. Highlightson “alcohol”, “intoxication”, “alcohol withdrawal” and “delirium tremens”provide consistent hints of a significant and adverse history of alcoholabuse, with multiple episodes of withdrawal and related symptoms.
in the text when finding something worth investigating or moving onto the next FC. At times, the snippets and 2nd level FC view weresufficient to assess information, which saved time. In between FCtransitions and after redirections, participants also spent time reviewingthe information around the redirection point, which often promptedserendipitous discoveries. Compared to the traditional chart readingworkflow, participants obtained a wider coverage of the entire chart, asredirections were not necessarily pointed at the most recent note. Whilethere are a few confounding factors at play (the novelty effect and ourinitial request to use the FCs), given the positive findings discussedearlier on the use of preset FCs, it is possible that this workflow shiftwould also happen in a real world scenario.
4.3.3 The patient narrative, and the big picturePhysicians strive to grasp the patient’s medical history, that is, theprogression of medical events and factors that led to the current patientstatus. All participants found that the Timeline’s keyword approachwas limited in terms of conveying the narrative, but could still convey abroad picture of the general issues and the severity of the case: “this[timeline overview] actually (provided) me with a snapshot of thingsthat are going on, which was a lot more useful than [drilling downdetails]; (..) this was a little bit more useful, to get just a high leveloverview of what the actual history looks like” (P6) . The extent ofthe Timeline’s contribution varied across participants, however. Forinstance, P4 found that the picture was too vague and still neededto “read a discharge summary in its entirety” for a good grasp ofthe story , while P5 was able to put a proto-story together “right offthe bat” simply from the co-occurrence of related terms and and howbig (i.e., how frequent) they appeared in the Timeline: e.g., noting
“polysubstance abuse” and particularly “alcohol abuse”, followed byrelated events such as “alcohol withdrawal”, “delirium tremens” and
“seizures” indicated that this is a complex patient with a long and severehistory of alcohol abuse that triggered extreme and recurrent symptoms(as illustrated on Fig. 8).
Supporting at-a-glance content is perhaps the most appreciated as-pect of Doccurate. Among the preferred features of the system, partici-pants cited the Timeline Overview page (P2 P5 P6) and the sorting ofFCs and issues by frequency (P3 P4). Some participants who favouredreading also appreciated the ability to complement or confirm knowl-edge, via the preset FCs (P4) and the “Other” FC (P1). This speaks to
the value of providing awareness and coverage of the entire record thatcan complement the reading, in order to mitigate the recency bias offocusing only on the last few notes.
4.3.4 Efficiency, Trust, and the limits of automationBy the end of Task 3, all participants had identified at least a fewclassification mistakes, encompassing:
• Terms incorrectly tagged by the NER engine, i.e., assigned wrongcodes. Common occurrence for acronyms, e.g.,‘PCP’ tagged as
“Pulmonary pneumocystosis” but meaning “primary care provider”• Terms that are correctly tagged but uninformative overall for that
patient or task, e.g., “Eye”, “Back”, “CT scan”.• Terms that appear be noteworthy but are later found to be negative
findings, e.g., “chest pain” versus “no chest pain”.• Terms that are tagged with two similar codes that are both cap-
tured under the same FC and thus generate redundant appearancesthat clutter the timeline view, e.g., “Diabetes Mellitus” and “Dia-betes Mellitus:[juvenile] or [insulin dependent]” (Fig. 4)
• Compound terms that are tagged separately, and therefore lessprecise; e.g., “back” and “pain”, vs. “back pain”
• Terms that are inherently ambiguous; e.g., “abuse” may stand forboth “victim of abuse” and “substance abuse”.
Some of the above issues pertain to previously documented limi-tations of cTAKES, namely, disambiguation of similar concepts anddealing with compound terms [37]. These mistakes led to participantsbeing overall more guarded about the content in FCs and caused addedfrustration, since participants felt the need to spend time double check-ing that the occurrences in the timeline were correct; some participantsalso wished for a shorter path to verification (P4 P5). Most participantsstated that the system overall did not make them faster in their assess-ment (P3 P4 P5 P6), that they “never trust the system 100%” (P2) andthat they “still have to read the note” (P4). This is also reflected in thesomewhat poor scores for efficiency in the long run (Fig. 6, item 5). Onthe other hand, this frustration reflects a healthy adjustment of expecta-tions, and fulfills one of our original goals to let users adequately gaugetrust in automation: : “It’s hard for me to take somebody else’s wordor a computer work (...), I need my own kind of control to make sure...because it’s important, right? To know that I’m capturing everythingthat’s significant about the patient” (P5). All participants were ableto identify and assess automation mistakes, and ultimately found thatthe information provided by the system was valuable despite the errors(Fig. 6, item 3).
4.3.5 Comprehensiveness and TrustWe found mixed results on whether Doccurate increased confidencein a physician’s own assessment. On one hand, the questionnaireindicates little to no effect in improving confidence across tasks (asper mean/median scores for each task, on Fig. 6, item 1), and theaforementioned concerns on automation mistrust affected how Timelinesuggestions were taken into account. On the other, some of the featuresto support comprehensiveness were underused (e.g., the ”Other” FC)and most participants stated that FCs were useful to indicate points thatmight have been missed otherwise (P1 P2 P5 P6). Interestingly, P2commented that Doccurate’s comprehensiveness actually made himless confident in his assessment, given the many additional elementsnot mentioned on the last note (which he reported typically relying on).
Looking further at individual self confidence scores (Fig. 6, item1), we find a polarized distribution with either confident (P2 P3 P5)or unconfident (P1 P4 P6) assessments. Upon further inquiry, wefound there were extraneous trust factors at play. For example, halfof the participants mentioned exercising general caution regarding theinherent uncertainty in the patient charts and the limitations of focusingonly on recent notes (P1 P2 P5), e.g., “if I had gone to the very lastnote, would it have encompassed all of this information already? Idon’t know” (P1); conversely, the other half (P3 P4 P6) felt comfortablerelying on the last note, and claimed that they don’t always need to knowabsolutely everything about the patient, e.g., “(..) the last dischargesummary is usually pretty decent in terms of what are the (past) medical
history issues so far (..)”. Other participants commented on the qualityof the notes themselves, that they were poorly structured and thereforehard to read (P2), and not amenable to automation (P5). This speaksto the complexity of the space, which warrants further investigationoverall, but also touches on the variety of information needs and theimportance of providing enough flexibility to support such needs, whichwe sought to achieve via customization.
4.3.6 Suitable Application ScenariosWhile we found no clear consensus on what medical contexts partici-pants judged Doccurate would be more useful for in their practice, therewas a general trend towards scenarios that benefit from comprehensive-ness. This included roles such as general practice (P1 P4), nursing (P6),social work and other psychosocial-driven specialties (e.g., psychiatry)(P3 P6), and activities such as seeing a patient for the first time (P2P5) and reviewing undiagnosed patients (P1). On the other hand, twoparticipants also commented that it was useful for directed searches(P2 P4), therefore potentially supporting both ends of the spectrum.
5 DISCUSSION
Despite the limited nature of our study with its qualitative focus andsmall participant pool, we found compelling evidence that our curation-based approach can bring value to clinical practice. In particular, wewere happy to observe that physicians were able to easily identifyautomation errors, that curation actions (including FC creation and errormanagement) were wholly integrated into the chart review process, andthat physicians found value in the information collected by the FCs.
The study also shed light on how Doccurate may be best leveraged inpractice and further improved. We found that while some participantsstruggled with creating FCs from scratch, they appreciated the presetcollection of filters. We posit that an initial setup with general, systems-based presets along with other general purpose FCs (e.g., providingpointers to section headers such as “Social History” and “Allergies”)could be offered as a base, a set which physicians can progressivelytailor to suit their individual needs. In this case, it would be useful tovisually differentiate preset filters from physician-defined filters.
Customization is still essential, as we envision physicians wouldcreate a potentially large collection of problem-based FCs, e.g., to coverchronic conditions (such as Diabetes) or correlated effects (such asCardio Risk Factors). That said, the FC creation and customizationprocess should be more efficient and scalable. One strategy would beto leverage physician-defined FCs towards the creation of a sharedFC library and to suggest “community” FCs that are relevant to apatient. This could facilitate FC uptake and potentially speed up chartreview workflows, but may also introduce additional overhead giventhe uncertainty involved in dealing with someone else’s FCs. Anotheridea is to suggest FCs by clustering related non-tagged items (i.e.,terms under the “Other” FC), possibly using topic models. Whileprior work found that physicians can judge pertinence and relevanceof topic items [1], additional information to assess suggestions suchas quantifying and conveying uncertainty would increase confidence.On the topic of automation support, providing more active user supportfor error correction is also important; despite being able to pinpointerrors, participants were often not sure how to best address them.
Regarding cognitive burden, participants did find the experienceoverwhelming. While extended usage would likely mitigate this effect,a few improvements could be beneficial, such as hiding the curationpanel when not in use to make up more space for content and provid-ing a visual representation for the concept codes hierarchy.
Finally, we also identified areas for further investigation, particularlyaround the trade-off between efficiency and trust, as well as the practi-cal limits of automation. While several of the classification mistakesencompass solvable problems (e.g., negation detection), many othersspring from task-, preference- and intent-specific contextual factorsthat are challenging to predict and are unlikely to be solved simplywith “better automation”. Ultimately, one should consider that no sys-tem will be 100% accurate and that providing adequate mechanismsfor inspection is essential to NLP-powered visualizations. Anotherchallenge lies in defining ground truth and accuracy measures prior to
deployment in real practice, since it is difficult to predict all relevantin-the-wild contextual factors [29]. We posit that our curation strategycould serve both as a transition technology and as a means to collecttraining data for active learning [21]. This trade-off could have thepotential to break the dependency in the NLP non-adoption cycle ofwhich (a) automation cannot be integrated into practice due to lack ofcomprehensive validations, but (b) comprehensive validations cannotbe fully performed without deployment “in the wild” [29]. These areinteresting questions to pursue further, possibly in a longitudinal study.
6 USE CASE SCENARIOS
Following our reflections in the Discussion, we present use case sce-narios to demonstrate how we envision Doccurate could be used inpractice. These scenarios were created in collaboration with a clinicalpractitioner (the 2nd author of this work) so as to be representative ofreal clinical decision-making workflows. We created a fictional patientidentity and context around a real patient chart (anonymized for dates,names and places), chosen among the three charts we used in the evalu-ation study. We highlight references to text snippets in italicized form,FC keywords or taxonomy codes in typewriter font, and FCs inbold face.
6.1 FC Curation for Chart ReviewMacy Gauthier is a 37 year old lady with a history of severe and poorlycontrolled diabetes, and a number of consequent hospital admissions.She has recently moved into town, and found herself a new local familydoctor (i.e., general practitioner), Dr. J, to follow-up on her case. Dr. Jjust received a copy of Macy’s medical chart, and takes a few minutesto review it with Doccurate prior to their consultation; it is June 2206.
Macy’s chart is initially loaded with a set of general, systems-basedFCs (as listed on Fig. 2). On the Timeline, mentions of type 1 diabetesand DKA (Diabetic Ketoacidosis, an acute life-threatening compli-cation of type 1 diabetes) are immediately noted. Drilling into theEndocrinology FC and quickly reviewing associated snippets, Dr. Jnotes the prevalence of a diabetes-related history and decides to createa dedicated FC, Diabetes, to facilitate follow-up of this chronic con-dition. Relevant Endocrinology-highlighted mentions on the currentvisible note were added to this new FC, including insulin, hypoglycemiaand all mentions of diabetes mellitus (by adjusting the hierarchy ofthe Diabetes Mellitus type 1 tag to its parent node, DiabetesMellitus). Given the prevalence of these issues, Dr. J suspects thatthere might be other diabetes-related complications in the record nestedunder other FCs that could be added to Diabetes, and makes a mentalnote to keep an eye on them while reviewing other issues.
The following stop is Cardiovascular, since (a) diabetes is a sig-nificant risk factor for heart disease, and (b) it figures as a prevalentFC. However, a quick glance of the items encompassed in the Timelinedoesn’t appear to include any serious manifestations, and an inspectionover myocardial infarction (i.e., heart attack) reveals no positivementions. Dr. J decides that the few positive cardiac events are notsignificant enough to establish a significant link to diabetes, and decidesnot to add any cardiac issue to Diabetes at this time. Before movingon, one quick inspection on cath mentions, which was expected torefer to cardiac catheterization procedures, was found to actually referto foley cath, which is a urinaty catheter intervention. Noticing theautomation failed to distinguish this nuance, Dr. J decides to removesthe code tags on cath mentions to avoid further false positives and addsthe compound keyword foley cath to Nephrology instead.
This last intervention led Dr. J to check the Nephrology FC. There,Dr. J finds mentions of nephropathy, and upon snippet inspection findsout that this issue is caused by her diabetes, along with neuropathy andretinopathy (which were mentioned in the same paragraph). All threeterms are added to Diabetes. Still under Nephrology, several recentmentions of ESRD (End Stage Renal Disease, a very significant findingwhich could be linked to diabetic nephropathy) and hemodialysis werefound in the latter history (from July 2203 onwards). Dr. J decides thishistory is significant enough to warrant the creation of a Renal DialysisFC to keep track of the dialysis interventions, and proceeds to add thecorresponding terms as well as related creatinine measurements to it.
Following the earlier mentions of neuropathy, Dr. J decides toquickly check the Neurology FC for related findings, and seizuresemerges as the most frequent item. It appears with a high but relativelynarrow frequency burst mid 2204 (that is, two years prior), indicatingthe issue was significant but appears to have been stabilized. Thebinning interval was adjusted from 3 weeks to 1 week to provide moreresolution, and shows the term was consistently mentioned for a fewweeks around June 2204. Dr. J quickly reviews the related seizurehistory directly from the notes to learn more, and confirms that the moreserious episodes indeed happened during that time, but there were alsoother suspected “seizure-like” events later on that should be monitored.Knowing that severe diabetes can trigger such episodes, Dr. J wondersif seizures should be added to Diabetes. Upon further inspection itwas found that the etiology for seizures was uncertain given Macy’snumerous health issues, and so another FC, Seizure, was created tokeep track of this issue separately. At this time, the front desk clerkcalls to inform the patient has arrived. By now, Dr. J has identified anumber of chronic conditions to guide this first patient visit, and hopesto establish good rapport with the patient by showing preparedness.
6.2 Follow up and for Ongoing CareDr. J has a productive first visit with Macy and is able to rapidly form alist of key medical issues. A plan is made to follow-up in 4-weeks timewith Macy scheduled to continue with her ongoing dialysis with herNephrologist and complete bloodwork prior to her next appointment.At the end of the visit, Dr. J adds a Laboratory FC to facilitateeasier tracking of her bloodwork results. Dr. J, now has a customcurated Doccurate chart for Macy, highlighting her key medical issueswhich will streamline review of her chart prior to the next follow-upappointment. In addition, if Dr. J, is away from clinic and a physiciancolleague is covering his patients, they will have access to an alreadycurated Doccurate chart highlighting Dr. J’s medical priorities for Macythus facilitating a rapid chart review as needed.
6.3 Overview for Emergency CareTwo weeks after Macy’s appointment with her new family doctor,she is found by her partner to be unresponsive on the floor of herbedroom. He calls for emergency medical services and is instructedto begin CPR. An ambulance arrives and she is brought to the nearestcommunity Emergency Department. Upon arrival she is taken to aresuscitation room with multiple physicians and nurses. Macy’s partnerhas not yet arrived to the hospital and there are no other relativespresent to provide the team with a medical history. Dr. D is one ofthe emergency physicians and is tasked with searching through Macy’sextensive medical chart. She opens Macy’s Doccurate chart and seesthe Timeline (1st level) featuring the FCs curated by Dr. J.
At first glance Dr. D immediately notices Insulin in large font repre-senting a relative increased frequency of mention throughout Macy’schart. She also sees the curated Diabetes FC that was previously cre-ated by Macy’s family doctor. Knowing that Macy has Type 1 DiabetesMellitus prompts Dr. D to call this piece of information out to the teamas Macy’s loss of consciousness (LOC) may be related to hypoglycemia.Opening the Diabetes FC reveals that Macy has an array of complica-tions related to her diabetes that may be contributing to her LOC. Dr. Dnotes that Macy has had DKA in the past, which is a condition of severehyperglycemia that can cause cerebral edema and acidosis leading toLOC. Dr. D also notes unexpectedly that Macy at a young age of 37 hasend stage renal disease and is on dialysis as a complication related toher diabetes. This can lead to severe electrolyte disturbances and LOC.Lastly, Dr. D. notes that Macy has a chronic foot ulcer, which may be apotential source of infection and sepsis leading to LOC. Given Macy’sclinical status, Dr. D worries that Macy may be having a cardiovascularemergency. She quickly explores the Cardiovascular FC and reviewsthe associated snippets to discover that Macy does not have any knownlife-threatening cardiovascular disease on history. Dr. D gathers thisinformation rapidly from the Doccurate visualizations and informs herfellow Emergency Physicians at Macy’s bedside resuscitating her.
This information related to Macy’s complex medical history is vitalfor the emergency medicine team as it provides a framework for gener-
ating differential diagnoses as to why Macy has LOC and helps guiderapid decision-making. Using this information the team realizes thatMacy may be in DKA given the history seen on her Doccurate visual-ization. Administering routine volumes of IV fluids will be dangerousfor her as it can worsen her cerebral edema and the team changes theirresuscitation approach. Bloodwork is rapidly completed demonstratinga dangerously high blood sugar with an acidosis and the diagnosis ofDKA confirmed. The appropriate life saving treatment of an insulininfusion is started and Macy slowly recovers over the upcoming days.
7 LIMITATIONS
One limitation of this work is the small scope and duration of the study;with our focus on user experience, we did not conduct a fully fledgedquantitative analysis, nor assessed participant’s performance with thetool. While findings are promising, questions such as whether thismodel could be efficient in the long run are difficult to answer withouta larger cohort and a longitudinal study setup.
Another criticism of Doccurate was that some participants felt itdid not easily convey the patient “narrative”. While supporting patientnarratives was not the primary focus of this work, it is an importantaspect to deliver as part of the overall solution for physicians. Webelieve curation could help support that goal, for instance by allowingphysicians to specify highlights in the text that could be presented in astorytelling manner.
Finally, since Doccurate’s curation operations dynamically operateon a large collection of documents and tags, several of them appearedlaggy to users. This negatively affected satisfaction and how partici-pants perceived efficiency. Adjustments on this front should lead tosignificant improvement in perceived value.
8 CONCLUSION AND FUTURE WORK
In this paper we propose and assess the value of curation-based ap-proaches for physicians to visualize and peruse clinical text. We presentDoccurate, a semi-automatic approach that uses NER-structured textand allows for the creation of semantic filters based on structured knowl-edge encoded in medical taxonomies. An evaluation of Doccurate with6 domain experts revealed that the approach has potential to leveragetext via a flexible and conscientious use of automation that seamlesslyintegrates into clinical tasks.
To our knowledge, this is the first exploration of its kind for themedical space and as such represents but an initial step towards moreefficient and flexible access to clinical text. We propose a few av-enues for future work. First, we debate on the value of extendingFC expressive power by leveraging multiple taxonomies at a time oreven ontologies (i.e., encompassing arbitrary relationships, not justparent/child). While this may seem like a straightforward improvement,we argue that one of the strengths of current FCs is their simplicity andposit that the added power of leveraging multiple relationships may notoutweigh the burden of added complexity.
Second, we argue there is room to better support trust over automatedprocesses, especially if additional components are added to the pipeline,e.g., FC suggestions and negation detection. Possibilities could includequantifying and conveying uncertainty of automated processes [36] andproviding explanations of automated decisions [34] that weigh curationinput into their reasoning models. User-centered research leading toa better understanding of how physicians perceive and correct errorsshould also be leveraged to improve NLP automation. Finally, webelieve our proposed curation-based approach for text exploration couldbe useful to other domains that require perusing large collections ofnarrative text, such as journalistic inquiry and intelligence analysis.
ACKNOWLEDGMENTS
We would like to thank Juliana de la Vega for her assistance withthe user studies, V. Bilbily and M. Tao for their contributions to themanuscript, and the DGP lab as a whole for the helpful discussionsand ideas. We also thank the anonymous reviewers for their thoughtfulcomments. This work was partly funded by a Natural Sciences andEngineering Research Council (NSERC) Discovery Grant.
REFERENCES
[1] C. W. Arnold, A. Oh, S. Chen, and W. Speier. Evaluating topic modelinterpretability from a primary care physician perspective. Computermethods and programs in biomedicine, 124:67–75, 2016.
[2] J. W. Beasley, T. B. Wetterneck, J. Temte, J. A. Lapin, P. Smith, A. J.Rivera-Rodriguez, and B.-T. Karsh. Information chaos in primary care:implications for physician performance and patient safety. The Journal ofthe American Board of Family Medicine, 24(6):745–751, 2011.
[3] N. G. Belmonte. Extracting and visualizing insights from real-time con-versations around public presentations. In Visual Analytics Science andTechnology (VAST), 2014 IEEE Conference on, pp. 225–226. IEEE, 2014.
[4] C. Bossen and L. G. Jensen. How physicians ‘achieve overview’: acase-based study in a hospital ward. In Proceedings of the 17th ACMconference on Computer supported cooperative work & social computing,pp. 257–268. ACM, 2014. doi: 10.1145/2531602.2531620
[5] A. A. Bui, D. R. Aberle, and H. Kangarloo. Timeline: visualizing inte-grated patient records. IEEE Transactions on Information Technology inBiomedicine, 11(4):462–473, 2007. doi: 10.1109/titb.2006.884365
[6] W. W. Chapman, P. M. Nadkarni, L. Hirschman, L. W. D’avolio, G. K.Savova, and O. Uzuner. Overcoming barriers to NLP for clinical text: therole of shared tasks and the need for additional creative solutions, 2011.
[7] M. V. Devarakonda, N. Mehta, C.-H. Tsou, J. L. Liang, A. S. Nowacki, andJ. E. Jelovsek. Physicians assessment of IBM Watson generated problemlist. Technical report, IBM Research, 2016.
[8] M. Dork, D. Gruen, C. Williamson, and S. Carpendale. A visual backchan-nel for large-scale events. Visualization and Computer Graphics, IEEETransactions on, 16(6):1129–1138, 2010.
[9] W. Dou, X. Wang, D. Skau, W. Ribarsky, and M. X. Zhou. LeadLine:Interactive visual analysis of text data through event identification andexploration. In Visual Analytics Science and Technology (VAST), 2012IEEE Conference on, pp. 93–102. IEEE, 2012.
[10] T. A. S. Foundation. Apache cTAKES, 2013.[11] J. Fulda, M. Brehmel, and T. Munzner. TimelineCurator: Interactive
authoring of visual timelines from unstructured text. IEEE transactionson visualization and computer graphics, 22(1):300–309, 2016. doi: 10.1109/TVCG.2015.2467531
[12] M. Glueck, M. P. Naeini, F. Doshi-Velez, F. Chevalier, A. Khan, D. Wigdor,and M. Brudno. Phenolines: Phenotype comparison visualizations fordisease subtyping via topic models. IEEE Transactions on Visualization& Computer Graphics, (1):1–1.
[13] M. Habibi, L. Weber, M. Neves, D. L. Wiegandt, and U. Leser. Deep learn-ing with word embeddings improves biomedical named entity recognition.Bioinformatics, 33(14):i37–i48, 2017.
[14] C. Hallett. Multi-modal presentation of medical histories. In Proceedingsof the 13th international conference on Intelligent user interfaces, pp.80–89. ACM, 2008. doi: 10.1145/1378773.1378785
[15] C. Hallett, R. Power, and D. Scott. Summarisation and visualisation ofe-health data repositories. In UK E-Science All-Hands Meeting, 18-21Sept 2006, Nottingham, UK, 2006.
[16] S. Havre, B. Hetzler, and L. Nowell. Themeriver: Visualizing themechanges over time. In Information Visualization, 2000. InfoVis 2000. IEEESymposium on, pp. 115–123. IEEE, 2000.
[17] J. S. Hirsch, J. S. Tanenbaum, S. L. Gorman, C. Liu, E. Schmitz,D. Hashorva, A. Ervits, D. Vawdrey, M. Sturm, and N. Elhadad. Harvest, alongitudinal patient record summarizer. Journal of the American MedicalInformatics Association, pp. amiajnl–2014, 2014. doi: 10.1136/amiajnl-2014-002945
[18] W. Hsu, R. K. Taira, S. El-Saden, H. Kangarloo, and A. A. Bui. Context-based electronic health record: toward patient specific healthcare. IEEETransactions on information technology in biomedicine, 16(2):228–234,2012. doi: 10.1109/titb.2012.2186149
[19] S. International. SNOMED-CT, 2002.[20] A. E. Johnson, T. J. Pollard, L. Shen, H. L. Li-wei, M. Feng, M. Ghassemi,
B. Moody, P. Szolovits, L. A. Celi, and R. G. Mark. MIMIC-III, a freelyaccessible critical care database. Scientific data, 3:160035, 2016.
[21] M. Kholghi, L. Sitbon, G. Zuccon, and A. Nguyen. Active learning: a steptowards automating medical concept extraction. Journal of the AmericanMedical Informatics Association, 23(2):289–296, 2015.
[22] S. Koch, M. John, M. Worner, A. Muller, and T. Ertl. VarifocalReader—in-depth visual analysis of large text documents. Visualization and ComputerGraphics, IEEE Transactions on, 20(12):1723–1732, 2014.
[23] S. Liu, Y. Chen, H. Wei, J. Yang, K. Zhou, and S. M. Drucker. Exploringtopical lead-lag across corpora. Knowledge and Data Engineering, IEEETransactions on, 27(1):115–129, 2015.
[24] S. Liu, M. X. Zhou, S. Pan, Y. Song, W. Qian, W. Cai, and X. Lian. Tiara:Interactive, topic-based visual text summarization and analysis. ACMTransactions on Intelligent Systems and Technology (TIST), 3(2):25, 2012.
[25] T. Mønsted, M. C. Reddy, and J. P. Bansler. The use of narratives in medi-cal work: a field study of physician-patient consultations. In ECSCW 2011:Proceedings of the 12th European Conference on Computer SupportedCooperative Work, 24-28 September 2011, Aarhus Denmark, pp. 81–100.Springer, 2011. doi: 10.1007/978-0-85729-913-0 5
[26] Z. Morrison, B. Fernando, D. Kalra, K. Cresswell, A. Robertson,A. Hemmi, and A. Sheikh. An evaluation of different levels of struc-turing within the clinical record:final report for the NHS Connecting forHealth evaluation programme. Technical report, 2012.
[27] U. N. L. of Medicine. Unified Medical Language System (UMLS), 2009.[28] D. Park, S. Kim, J. Lee, J. Choo, N. Diakopoulos, and N. Elmqvist. Con-
ceptvector: text visual analytics via interactive lexicon building using wordembedding. IEEE transactions on visualization and computer graphics,24(1):361–370, 2018.
[29] R. Pivovarov and N. Elhadad. Automated methods for the summarizationof electronic health records. Journal of the American Medical InformaticsAssociation, 22(5):938–947, 2015. doi: 10.1093/jamia/ocv032
[30] C. Plaisant, D. Heller, J. Li, B. Shneiderman, R. Mushlin, and J. Karat. Vi-sualizing medical records with lifelines. In CHI 98 Cconference Summaryon Human Factors in Computing Systems, pp. 28–29. ACM, 1998. doi: 10.1145/286498.286513
[31] C. Plaisant, B. Milash, A. Rose, S. Widoff, and B. Shneiderman. Lifelines:visualizing personal histories. In Proceedings of the SIGCHI conferenceon Human factors in computing systems, pp. 221–227. ACM, 1996. doi:10.1145/238386.238493
[32] C. Plaisant, R. Mushlin, A. Snyder, J. Li, D. Heller, and B. Shneiderman.Lifelines: using visualization to enhance navigation and analysis of patientrecords. In Proceedings of the AMIA Symposium, p. 76. American MedicalInformatics Association, 1998. doi: 10.1016/b978-155860915-0/50038-x
[33] S. M. Powsner and E. R. Tufte. Graphical summary of patient status. TheLancet, 344(8919):386–389, 1994.
[34] M. T. Ribeiro, S. Singh, and C. Guestrin. Why should I trust you?:Explaining the predictions of any classifier. In Proceedings of the 22ndACM SIGKDD International Conference on Knowledge Discovery andData Mining, pp. 1135–1144. ACM, 2016.
[35] A. Rind, T. D. Wang, W. Aigner, S. Miksch, K. Wongsuphasawat,C. Plaisant, B. Shneiderman, et al. Interactive information visualiza-tion to explore and query electronic health records. Foundations andTrends® in Human–Computer Interaction, 5(3):207–298, 2013.
[36] D. Sacha, H. Senaratne, B. C. Kwon, G. Ellis, and D. A. Keim. The roleof uncertainty, awareness, and trust in visual analytics. IEEE transactionson visualization and computer graphics, 22(1):240–249, 2016.
[37] G. K. Savova, J. J. Masanz, P. V. Ogren, J. Zheng, S. Sohn, K. C. Kipper-Schuler, and C. G. Chute. Mayo clinical text analysis and knowledgeextraction system (ctakes): architecture, component evaluation and ap-plications. Journal of the American Medical Informatics Association,17(5):507–513, 2010.
[38] N. Sultanum, M. Brudno, D. Wigdor, and F. Chevalier. More text please!understanding and supporting the use of visualization for clinical textoverview. In Proceedings of the SIGCHI conference on human factors incomputing systems. ACM, 2018. doi: 10.1145/3173574.3173996
[39] H. Tange. How to approach the structuring of the medical record? towardsa model for flexible access to free text medical data. International journalof bio-medical computing, 42(1):27–34, 1996.
[40] G. Trivedi, P. Pham, W. W. Chapman, R. Hwa, J. Wiebe, and H. Hochheiser.NLPReViz: an interactive tool for natural language processing on clinicaltext. Journal of the American Medical Informatics Association, 25(1):81–87, 2017.