Embed Size (px)
Citation preview
,...,
• •
.. ,~ J'Thi~paper is not to be cited without prior,reference to the authors
• j-er
International Council of 'the
Exploration of the Sea
C.~1.1976/N:15
Marine Mammals Committee
B 1b 1I 0 t h ., k
{Q, F/ . t..~t""lehr.i, tl.ll1l •
A STOCHASTIC MODEL FOR THE MANAGEMENT OF THE NORTHWESTERN
_~ ATLANTIC HARP SEAL Pagophilus groenlandicus POPULATION
Terje 8enjaminsen
Institute of Marine Research
Oirectorate of Fisheries
N-5011 Bergen - Nordnes
Norway
. and
Patrick FLettMarine Fish Division
8edford Institute of Oceanography
Dartmouth l Nova ScotiaCanada
...
.... - 2 -
t d t " 11 l )In ro uc Ion +t~'\'l"
. ~he exploitation of the northwestern Atlantic harp seal has
~. been weIl documented, especially in recent years. Nearly 10
million harp seals are known to have been harvested from this
population betwesn 1895 and 1946 (Fisher 1955) and another
5.3 million were taken between 1947 and 1964 (Oepartment of
Fisheries of Canada 1968; 0ritsland 1967)." From 1965 to 1974,
another 2.3 million seals were slaughtered in the northwestern
Atlantic. This gives an average annual kill over the period of
4t 220,000 seals; a figure which has sustained the fishery for 80
years. Recent regulations have set a quota for seals at 150,000
animals between 1972 and 1975, (ICNAF 1972) with a low quota
restriction in 1976 only permitting the take of 127,000 seals.
These quotas do not included the high Arctic or Gre8nland catches,
which can be considered to be approximately 10,000 animals. How
ever, despite the low quota for 1976, *174,000 seals were killed.~·;"
/,/f4/
Conflicting views as to the present status of the northwester~
Atlantic harp seal have recently generated much controversy.
These divergent opinions resulted from the interpretation of
incomplete data sets, and pOOl' communication among participating
scientists. However, there are methods such as ultra-violet
aerial sensing, which it is thought can be used independent of
supportive biological information, and do not rely on current
scientific opinion. Unfortunately, to date this method produces
a "best estimate" of pup production in 1975 which is approximately
15,000 animals less than the catch (Lavigne et ~ 1975).
Oue to large discrepancies in estimation of production and natural
mortality, it has been necessary to revise the basic data to incor
porate theeffects of the diverse fisheries, in addition to US8
advanced statistical and computer techniques to assess the dataj.,thus producing a reliable assessment of the northwestern Atlantic
harp seal stock.
This number is subject to slight alterations.
- 3 -....
1
Amalgamation of Data
The assessment of an animal population requires the estimation
of certain vital rutes. The estimation of these rates~ to a
large extent, consists of the analysis of age frequencies which
either represent the population or the catch structure. In same
populations the c~tch and population age structures are assumed
synonymaus, however, this assumption can lead to grave errors in
the instance of the northwestern Atlantic harp seal population
(Benjaminsen and 0ritsland MS 1975).
Initially, the problem consists of producing an age frequency of ~~
the total annual catch fGr one year old and older seals (1+),
which amalgamates the catch frequencies from the individual fish-
eries in their proper proportions. In this fishery the age distri
bution for the different fisheries is indeed diverse.
Shot sampies from Notre Dame Bay, Newfoundland, consist primariIy.
of bedlamers. The La Tabati~re, Que., and Labrador net fisheries
usually resuit in a sample with a preponderance of mature animals,
while the St.Anthony, Nfld., shot samples seem to be more repre
sentative for the population structure. It is assumed that on .
average each of these fisheries tend to be roughly equivalent to
each other in overall catch and can be summed to represent the lands
men catch without producing serious errors. The iarge ships catch ~from the moulting Iairs, however, is quite different in structure
from the overall landsmen's and must be treated separately. One
of the primary problems is the fraction of one year old seals in
the sampie. This age group is usually segregated from the remain-
ing age groups and is only randomly encountered when sampling the
moulting lairs (Benjaminsen and 0ritsland MS 1975). Furthermore,
the closing date also effects the large vessel sample since the
earlier the hunt in the moulting lairs is terminated, the less
females are represented in the catch (S8rge~nt 1965, 0ritsland
1971). Thus is mature composite age frequencies vary depending onthe length of the hunt, and consists mainly of males (Fig. 1).
......
..
'.....
I: - 4 -
,,·e
Samp~es of the Greenland and the high Arctic hunt~ representing.
B% of the total catch on average~ are excluded from this analysis
from 1952 to 1975~ since no consistent sampling and catch records
are available.
Between 1952 and 1"960 jaws were collected on a regular basis from
the landsmen's catch and this sector of th~ hunt' can 'be considered
to be weIl represented' (Sergeant ·1953 ~ personal communication) and
are presented in Table 1. 1 Ouring the years 1952-54 and 1957-58
sampIes were also collected from the large vessels. However~ the
1957-58samples are sparce and it is unlikely that they accurately
represent the catch,(Tabef 1). For this reason the years 1955 to
1960 were .replaced by an average catch frequency for large vessels.
The attendent errors are possibly serious since during this period
the large ves~el ~unt on 1+ animals represented between 87.5-95.5%
of the total catch (Tabel 2);
In 1961 sampling began to steadily improve with both the large
vessel catch from the moulting lairs and the landsmen catch being
weIl represented (Tabel 1). Annual catch at age sampIes from
1961 on came from a number of sources (Sergeant 1971~ 1972~ perso-
nal communication; 0ritsland 1971; Benjaminsen and 0ritsland
MS 1975). Unfortunately~ there was not a good sampIe taken for
either the landsmen or the large vessel catch in 1972, but the
available data were included i~ the ensui~g analysis~ In 1973'
the,landsmen sampIe was again lacking and may not sufficiently
represent the fishery. In both 1972 and 1973 there was, no, basis
for using'an average. sampIe to represent either fishery~ especially
since the landsmoen and large vessel· catches are nearly· equivalent
to one another. In general~ the sampIes from large. v8ssels seemed
to improve from 1967 on, excluding 1972.
The sampIes from the landsmen hunt and large vessel hunt were first
summed for. each year~ then reduced to their respective percentage
compositions. These compositions were then weighted in accordance
with the.numbers of animals killed in the landsmen and large vessel
5 - .."
hunt (summsd across ages) and subsequently divided by the sum
·of weighting factars. In this way then l the age composition
data gave the best ·possible representation of the catch
distribution as the hunt has shifted from large vessels to
landsmen (Fig. 2). Using this catch distribution the total
catch was broken 'out into catch at age (Table 3).
Calculation of Natural Mortality
Ths instantaneous rate of natural mortality is possibly the most
elusive parameter in population dynamics to estimate. Further
more. for the harp seal population it is the most important due'
to the rather low exploitation rate experienced by 1+ animals.
e- -
The only representative ~ample'of the population age distribu
tion comes from males of age two and older in the moulting lairs
(Benjaminsen and 0ritsland MS 1975). Furthermore. it is assumed
that there is no difference between natural mortalities rates of
male and female harp seals. This is a valid assumption since male
and female harp seals sesm to experience similar growth rates and
achieve equivalent maximum weight~ (Sergeant 1973a). The metabo
lic rate and body size of seals is weIl correlated (Lavigne et ~
1976); and since the mortality and metabolic rates of animals
are related (Simms et ~ 1959) it is unlikely that male or female ~harp seals experience divergent natural mortalities.
Male age sampIes of moulting seals were taken from Benjaminsen
and 0ritsland (MS 1975) for 1969. 1970. 1971. 1973 and 1974. In
1968. 1970 and 1973 there were also combined (male and female)
sampIes which were corrected. (Fig. 1). for the fraction of males.
These corrected sampIes were added to the appropriate sexed male
sampIe to produce a total male sampIe. The age frequencies ware
then reduced to percentage age compositions so the total instantan,eous mortality rates (Z) could be calculated.
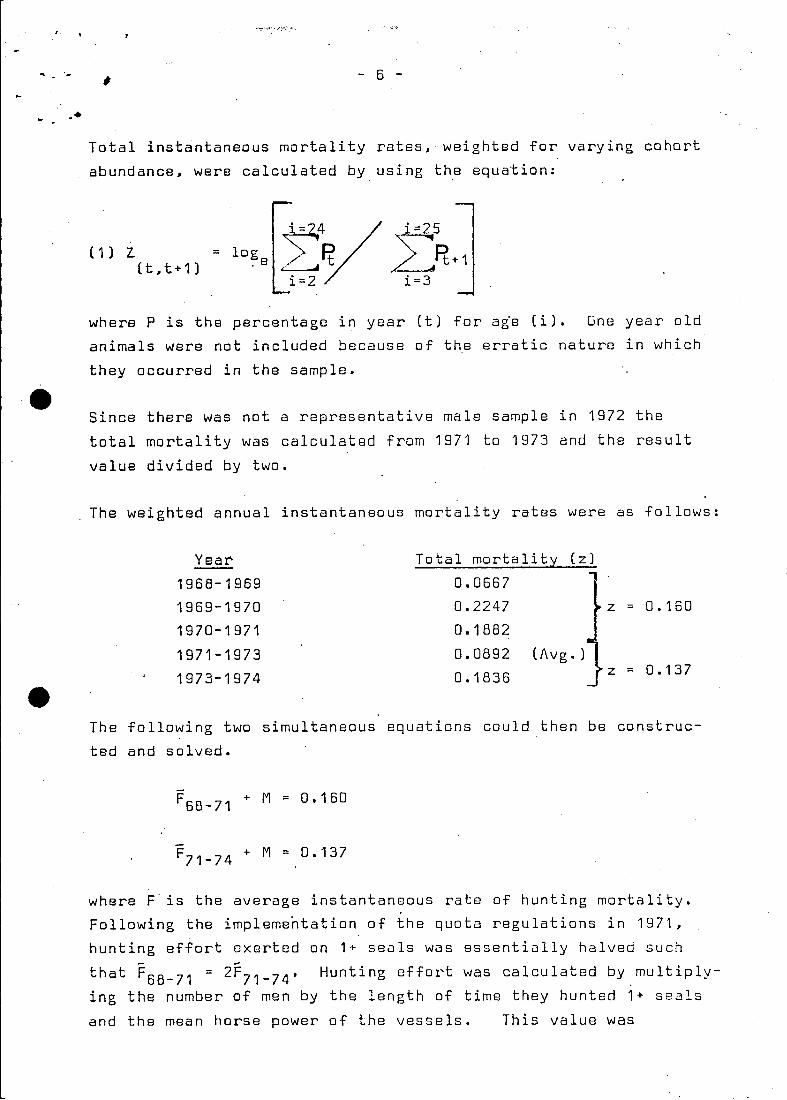
- 6 -
••
Total instantaneous mortality rates, weighted for varying cohort
abundance, were calculated by using the equation:
(1)l(t,t+1)
where P is the percentage in year (t) for age (i). One year old
animals were not included because of the erratic nature in which
they occurred in the sampIe.
Since there was not a re~resentative male sampIe in 1972 the
total mortality was calculated from 1971 to 1973 and the result
value divided by two.
The weighted annual instantaneous mortality rates were as follows:
0.137
0.160
z =
z =
(Avg. )
0.0667
0.2247
0.1882
0.0892
0.1836
Total mortality (z),Yea:r
1968-1969
1969-1970
1970-1971
1971-1973
1973-1974• The following two simultaneaus equations could then be construc
ted and solved.
F68 - 71 + M = 0.160
F71 - 74 + M = 0.137
where F is the average instantaneous rate of hunting mortality.
Following the implementation of the quota regulations in 1971,
hunting effort exerted on 1+ seals was essentially halved such- -that F68 - 71 = 2F 71 - 74 • Hunting effort was calculated by.multiply-
ing the number of men by the length of time they hunted 1+ seals
and the mean horse power of the vessels. This value was
••
- 7 -
then divided by the mean tonnage of the vessels the number of
days was calculated according to the closing dates of the hunt
and the other values are taken from ICNAF statiscal yearbooks.
Ice condition is not .considered in the calculation because of
the .lack of data, however, its inclusion would presumably great
ly improved the calculation of effective effort. The hunting
effort, which varies little from year to year was 120,000 man,
day, hp, ton- 1 between 1961 and 1970, and 56,000 between 1972 and
1975. In both cases the standard deviation was only 8900 man hp-1 ' ,
ton . Thus the change in effort is 2.07 and the assumption of a
halving of effort between the tw6 periods seems quite valid. The
two equations then give the following values:
1
M = 0.114 and F68 - 71 ·= -0.046 and F71 - 74 0.023.
By subtracting the appropriate F value from the z values a stan
dard deviation of 0.0677 and standard error of 0.0302 were calcu
~ated. From this limited sampie set the variance was indeed
great and it is assumed that the standard error more closely re
flects the real biological deviation in natural mortality. Other
calculations of mortality are somewhat lower, near 8% per year
(Ricker 1971, Ulltang 1971).
Lavigne ~ ~. (1976) present an age specific natural mortality
schedue which declines from 0.2 for O-group seals to 0.095 for 4t5 to 6 years olds. Following this, mortality rises to 0.109 for
adults and remains constant. This sohedule, although assumed,
makes good biological sense since mortality and growth are usually
coupled (Simms et ~ 1959, Bourliere 1959). For harp seals the
growth rate begins to become constant at the onset of maturity.
According to an analysis of Lavignds ~ ~ (1976) data the instan
taneous growth rate of mature seals is 0.12, not far from our es~i
mated mortality of 0.114. However, at some point the mortality
rate munt 8xceed growth rate or the biomass of seals would ccntirus
to increase forever. Senescent death in harp seals may begin at
approximately age 18, if one speculßtes ßS to the reason aboutinflection in t.he survivorship curV8 ut this time. Thus the criti
:al aga for ß cohort of senls probably i5 near 18 years of a~e.
I -I , - 8 -
·e
. In o~r analysis we could find no."evidence of an age dependent
natural mortality rate, which is "not surprising considering the
crudity of catch data and the delicate changes in the parameter
as suggestod by Lavigne ~ al 1976. However, the analysis was
on 2~ seal and a different mortality rate may be experienced by
the younger animals.
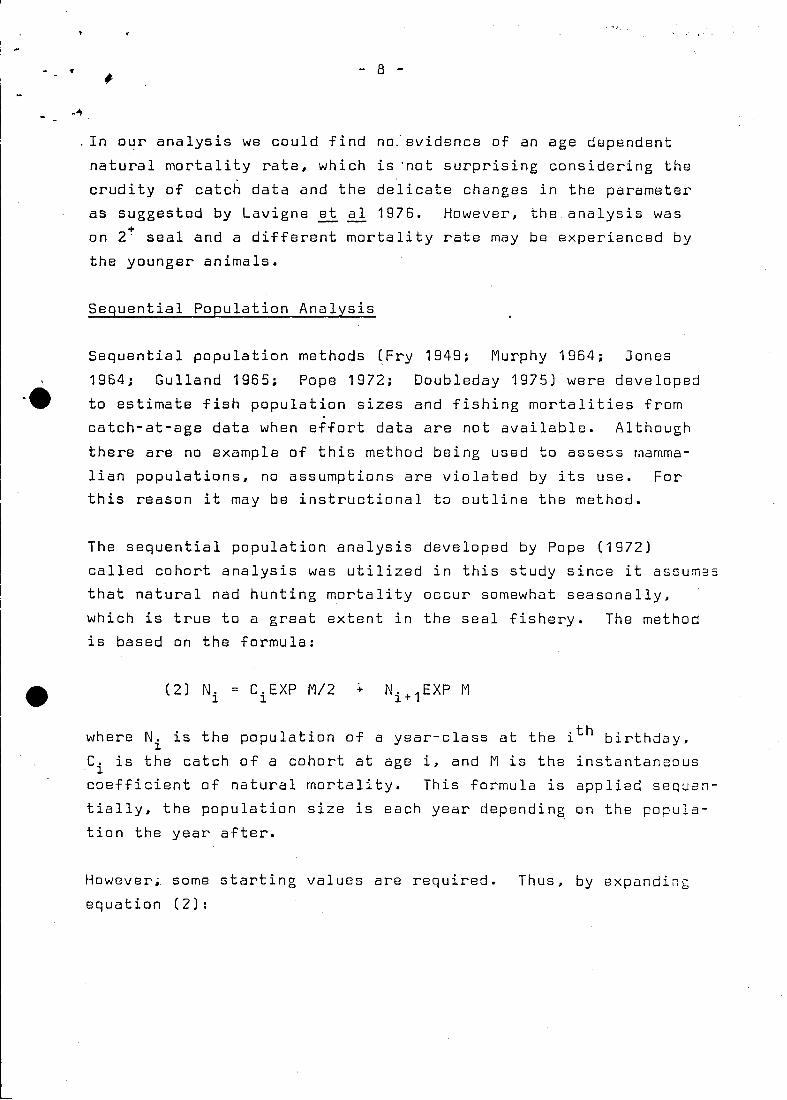
Sequential Population Analysis
Sequential population methods (Fry 1949; Murphy 1964; Jones
1964; Gulland 1965; Pope 1972; Doubleday 1975) were developed
to estimate fish population sizes and fishing mortalities from
catch-at-age data when effort data are not available. Although
there are no example of this method being used to assess rnamma
lian populations, no assumptions are violated by its use. For
this reason it may be instructional to outline the method.
The sequential population analysis developed by Pope (1972)
called cohort analysis was utilized in this study since it assumas
that natural nad hunting mortality occur somewhat seasonally,
which is true to a great extent in the seal fishery. The method
is based on the formula:
(2) N.~
C.EXP M/2~
where N. is the population of a year-class at the i th birthday,~
C. is the catch of a cohort at age i, and M is the instantaneous. ~
coefficient of natural mortality. This formula is applied sequen-
tially, the population size is each year dependin~ on the popula
tion the year after.
However~ some starting values are required. Thus, by expandin~
equation (2):
- 9 -
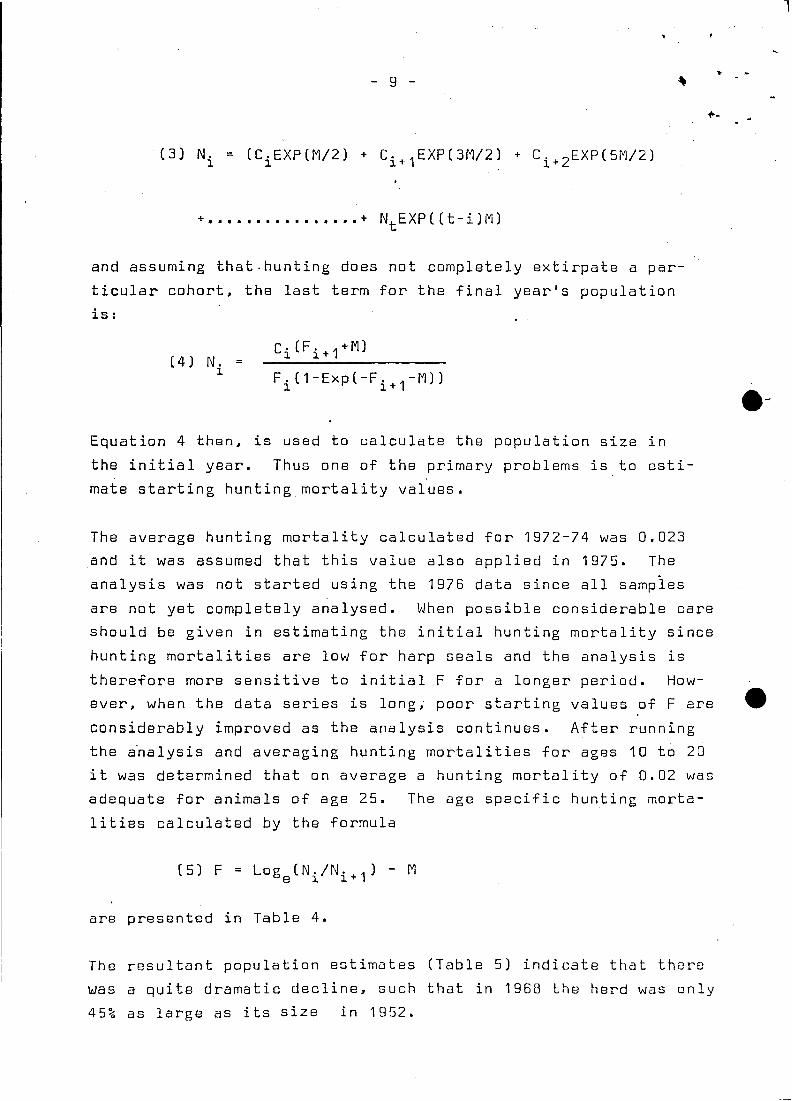
+-.
+ •••••••••••••••• + NtEXP((t-iJM)
and assuming that.hunting does not completely extirpate a par
ticular cohort~ the last term for the final year's population
is:
l
(4) N.~
C·(F. 1+ M)~ ~+
F.(1-Exp(-F. -M))1 ~+1 e-
Equation 4 then~ is used to calculate the population size in
the initial year. Thus one of the primary problems is to esti
mate starting hunting mortality values.
The average hunting mortality calculated for 1972-74 was 0.023
end it was assumed that this value also applied in 1975. The
analysis was not started using the 1976 data since all sampies
are not yet completely analysed. When possible considerable care
should be given in estimating the initial hunting mortality since
hunting mortalities are low for harp seals and the analysis is
therefore more sensitive to initial F for a longer period. How
ever~ when the data series is long; poor starting values of F are
considerably improved as the analysis continues. After running
the a~alysis and averaging hunting mortalities for ages 10 t6 20
it was determined that on average a hunting mortality of 0.02 was
adequate for animals of age 25. The age specific hunting morta
lities calculated by the formula
( 5) F
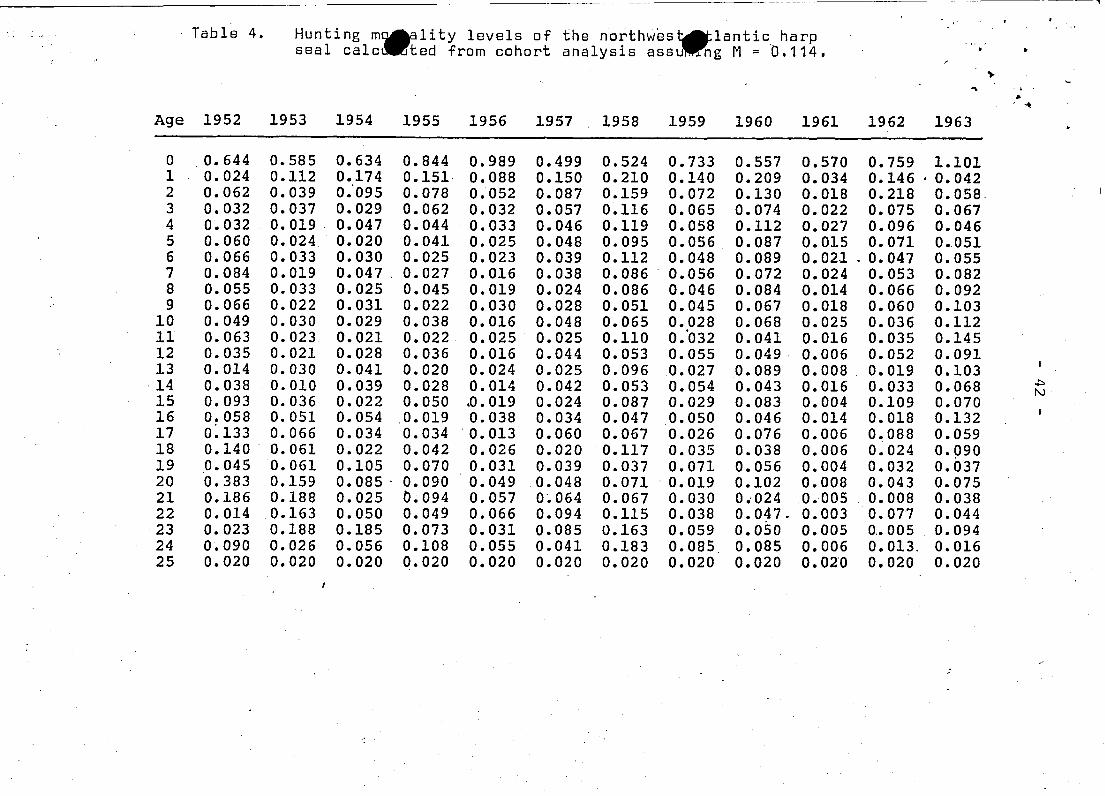
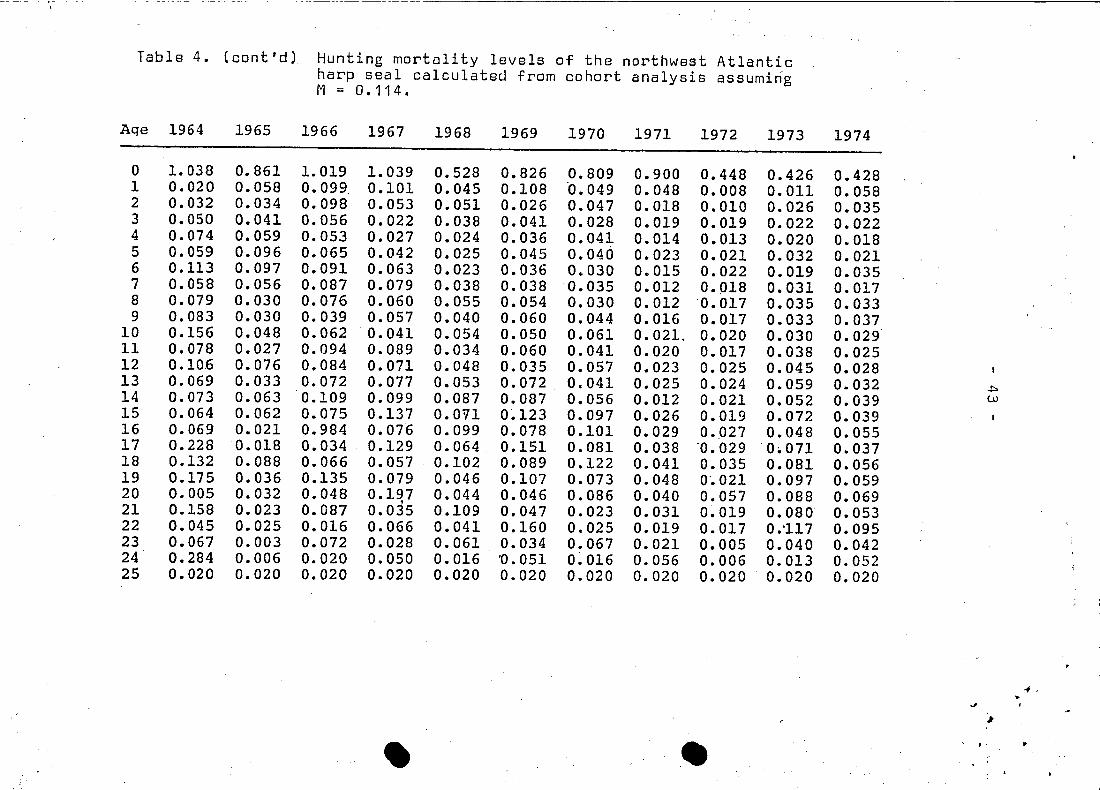
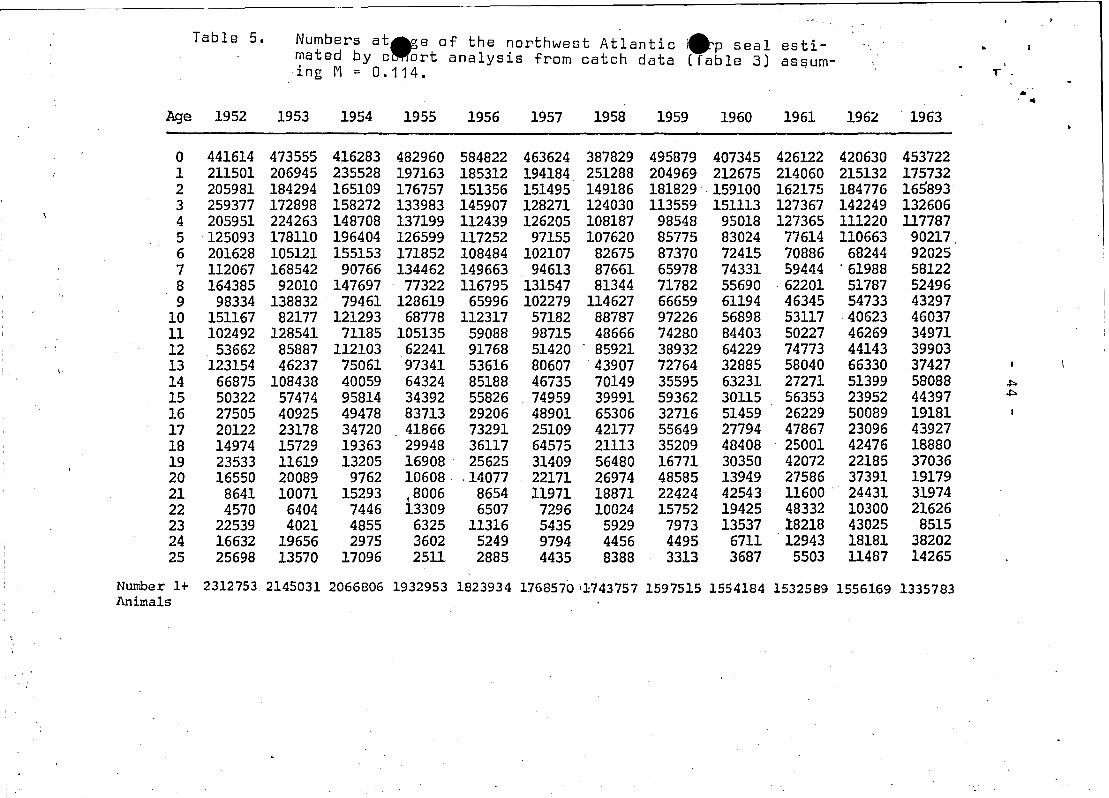
are presented in Table 4.
The resultant population estimates (Table 5) indicate that there
was a quite dramatic decline~ such that in 1968 the herd was only
45% as large as its size in 1952.
rI
, - 10 -
Pup productions .estimated by cohort analysis are somewhat
erratic, indeed more than would be expected for a mammalian
population. This inconsistency can perhaps be attributed to
a natural mortality rate among pups which responds in some
way to the exploitation rate. Furthermore interspecific com
petition may be a .factor indetermining resultant natural mor
tality rates.
Density Dependent Pregnancy and Whelping Age
It has been proposed by Sergeant (1966, 1973b) that the mean age
of whelping for harp seals is a density dependent function rely-
ing on population size. This phenomenon is weIl noted in some
other marine mammals (Gambell 1973). Indeed, some sort of mech
anism is necessary to equilibrate the population with the carry-
ing capacity of its environment (McLaren 1967). Sergeant (MS
1976) has. presented further evidence that the mean age of whelping
has shifted to an extremely low level of 4.8 years in 1976. a
figura weIl below the 6.5 years calculated in 1953. However, the
reason for this most recent shift from 1968-1976. is not clear
since the population has stabilized and seems to be slightly
increasing. Furthermore, it will not become lucid until some
information on the growth rate of individuals within cohorts
becomes available. Sergeant (personal com~unication) has suggested
that the maturity schedule of seals is determined by their growth
rate as juveniles since growthapproaches an asymptote at about age
5 (Sergeant 1973a). Lavigne et al's(1976) data would also suggest an
age of 5. In both examples. the data are extremely variable. The
harp seal population did reach it's minimum level between 1966 and
1973 of 1.07 million 1+ seals (Table 5). Assuming that the growth
rate of juvenile seals is stock dependent,this would suggest that
Sergeant~s hypothesis is possibly correct. Until more conclusive
evidence concerning the reproductiv8 biology of harp seals is prs
sented, we assume that the maturity schedule of harp seals is dBD8:
dent on the coincident population 8ize of 1+ animals. Thora i5little evidence to suggest that the Front 3nd Gulf h8I'ds ,~xptT.ia~,~s
- 11 - ,
a different maturity schedule,·.~lthough thi~ point ma~ be arg~ed
by Sergeant (1973b), thus the data utilized frorn these two areas. .was not weighted in rel~tion to. population size.
The ogive were .plotted on "probit" paper and lines were fitted
by ey~, giving mor~ w~ight to points closer to the 50% maturity
level. Values were then interpolated for each age from these
line5, under the assumption that they represe~ted the best fit
of the data. The interpolated values were used to determine the
following equation (Fig. 4):
( 6 ) ARC sine iEt = 1S.S22A - 2.245 x 10- SNt - 16.017
where iEt is the fraction of the population whelping, assuming
100% pregnancy for a particular age i, Nt is the population num-
ber of 1+ seals in the year t, and A is the age in years.
The shift in maturity in respons~ to population size is assumed
to be linear since the best fit of the mean age of whelping over
the data series was linear, although again the dqta are not con
clusive," Capstick and Ronald (1976) fit an exponential relation-
ship to two data points, where there seems to be some confusion
concerning the independent and dependent variables (see Fig. 4.
Capstick and Ronald 1976). In fact, the curve has doubtful bio- 4tlogical meaning since according to their hypothesis the mean age
of maturity approaches zero at population sizes less than 1 mil-
lion, a result which they previously speculate as being impossible.
In addition. maturity reaches an asymptote at larger herd sizes.
such that the population can increase ad infinitum. Surely the
opposite effect is expected if it is indeed non-linear. since the
biological basis for a shifting maturity ogive would be to constr3:~
thepopulation within the environmental carrying capacity.
Oensity dependent, age specific maturity would be enough to limit
the population. but this is only one of a multitude of facturs.
Others responding to population siz8 could be natural mortality
J
.-"
- 12 -
~nd fertility rate. Although we have no evidenoe for density
dependent .mortality. there does seem to be some data supporting
a varying fertility rate (Fig. 5). Fertility rates were deter
mined from a number of sources (Fisher 1952; Sergeant. 1966, 1969,
1970, MS 1976; 0ritsland 1971). The response seems to be a line
arly decreasing function of population size, however, the data are
variable and the structure of the relationship is not clear. The
data were plot ted against the 2+ population slze sinee the younge~
animals remain segregated from the herd and would not compete. A
fluctuating fertility rate is a weIl noted phenomenon and has been.
observed in at least three populations of whales (Gambell 1973).
In addition,the unexploited population of Antaretic erabeater seals
(Lobodon carcinophagus) whieh like harp seals, also enjoy an unli
mi ted iee substrate on which to whelp, has a low pregnaney rate of
0.76 (0ritsland 1970). Markgren (.1969) found that the ovulation
rate in moose (Alees alees) was' related to a number of faetors such
as age,body size, nutrition, elimate and population density.
Effeets of Changing Sex Ratio on Population Projection
The pup production estimates resulting from sequential population
analysis are quite erratie (Fig. 3), possibly as a result of. unac
eountable fluetuations in natural mortality. In addition, the pre
pondenrance of males in the kill from the moulting seals would re
sult in a sex ratio favouring females. This eould increase the
estimates of pup produetion by 15,000 or 20,000 animals.
It i5 unlikely that there are serious errors in the cateh distri
butions for seals 1 to 6 (Tables 3), since 8% of the variation
of this da ta is unexplained when eompared with the actual catch
of bedlamers (see Table 2 0ritsland and Benjaminsen MS 1975).
This comparison i8 made by plotting the addition of the eateh of
1 toB year aIds (Tabla 3) against the eateh of bedlamers from
1952 to 1975 as ealculatud by 0ritsland ~nd Benjaminssn (MS 1975).The functional regression (Ricker 1973) through these points has
a slope not significantly different from unity and a position not
signifi=antly different from the origin.
,' ••• ; • '.•• ~, ~.,' • ",'!
- 13 -
; As previously noted, the best estimates fram eohort analysis
are between 1961 ~nd 1975 sinee during this peria~ the eateh
data are more eansistent .. Baeause :the estimates 'of population
improveas the analysis proeeeds (Pope 1972), 1961 should then
give the most reliable abundanee level. With ·this in mind, a
projection startin~ in 1961, subtracting the aga speeifie eateh
of the various fisheries should give the most reliable pup· pro-. .
duetion, following the applieation of a maturity ogive. These
pupproduetions, resulting from'determining the breeding popula~
tian, are prabably more reliable ~han those predieted from sequ~
ential analysis. However, the number of animals in age groups
older than one shauld be e~uivalent to the sequential analysis
estimates. Reeruitments to the 2+ populations were the eohort
analysis abundanee estimates for one year aIds.
The sex ratio of the eateh was distributed over agesin aeeor
danee wit~ the asymptotie funetion appearing in Figure 1. The
value of the asymptote is represented by the fraetion of males
in the eateh (Table 6). For two-year-olds, the pereent of females
remained 52.8% females, however, the asymptotie patio varied in
relation to the elosing dates of the seal hunt.
In 1961 the sex ratio was assumed to be 50:50 in the population;
ehanging thereafter in response to tho sex ratio of the hunt on 4tthe moulting lairs and the eantribution of this hunt to the total
eateh of 1+ seals (Table 5). This assumption is reasonable sinee
the number of adult females taken by large vessels in the breeding
lairs during the postwar period was small beeause the value of
whitecoat pelts was 2 ta 6 times that of an adult pelt. Annual
priees for the Norwegian fishery are given by Fiskeridirektß~en
(1951-1965). Prior to this time Coleman (1938) suggests that fe~
adult females were taken in the steambaat fishery sinee the cast
of powder and shot was in oxcess of tho value of the palt. During
the periad frorn 1895 to 1923 adult seals only corrprise:i 2.7'~ cfthetotal steamboat catchCChafe et ~ 1923).Even less of this would C~
famales. Fram 1953 to 1960 white-boats were worth from 1.3 t~ 2
times as much as the adults, howover, this doclinod to 0.7 by 136~.
.. : ....'-:", ~-.
- 14 -
Furthermors l due to the labour associated with skinning and
transporting the adult pelts it is unreasonable to assume that
there was excessive killing of breeding females when white-coats
were available..',
" '.~.
To protect the mature females a closing date
blished in the Gulf and on the Front in 1961.
of May 5 was esta
At this time we
•
assume the sex ratio in the large vessel catch was 55% adult
males since the sex ratio in the population would probably be
altered in favour of females. Since the proportion of moulting
females on the ice would be less than males l the fraction of
females in the catch would also have been somewhat smaller than
the fraction of males. In 1963 the closing date was changed to
April 30. The closing date in 1965 in the Gulf was alter.ed to
April 25 1 and this date was also established on the front in
1968. In 1970 the closing date was April 29 and since 1971 it has
been April 24. An agreement was made in 1965 that no females could
be killed while breeding.
These regulations obviously decrea'sed the percentage of mature
females in the catches. The total Norwegian sampie of moulting
harps taken from 1969 to 1974 (Benjaminsen and 0ritsland l MS 1975)
showed a marked surplus of males. In age groups one and two the
sex ratio is approximately 50:50 and there after increases to 86%
males for mature animals (Fig. 1).
The projection is broken out into males and females and each com
ponent is handled separately in the simulation (Table 6). The
fertility rate was assumed to be about 94% during this period.
and 6% of the breeding population was assumed to be ovar the ab 8
of 25 (Benjaminsen and 0ritsland MS 1975). A constant. conserva
tive maturity ogive. calculated from Sergeant's (1966 1 1976) d3ta
was applied to tho br80ding population using thB following schedu:~:
...~' ".~ , '\ .'
2 3 4
- 15 -
5 6 . 7 8 9
....
10
Fraction 0 0.075 0.220· 0.450 0.700 0.850 0.970 0.390. I.JJCwhelping
which was considered average for the period.
The sex ratio in the breeding population became as high as 54.9%. .
in favour of females in 1971. and has continually dropped since
then to 52.9% in 1976 (Table 6). as a result of a much reduced
hunt for moulting animal~ (Table 2). Age specific sex ratios
r'i"se as seals get older due to the accumulated effect of selec- _ ..
tive hunting. In fact, ih more recent years this ratib hash
exceeded 70% females for animals over 20 years.
The change in the sex ratio provides for more pups than would be
calculated by applying a 50:50 ratio. Indeed. it is assumed that
pup production calculated in this manner is more reliable than
estimeted from sequential analysis (Fig. 3). Production reached
a minimum in 1972 of 294.071 animals. down from 424.561 produced
in1962. Since 1972 the production has slowly increased. primarily
due to the entry of the 1968 year--class and the quota regulations,
so that currently production would be 311.502. Using Sergeant's
(MS 1976) la test maturity estimates. production would now be apDr2x- 4timately 330.000.
Oirect Survey Methods
Ultraviolet sensing method
Ultraviolet photography has been used for detecting certain whit2
animals against a white background of iee or snow (Lavigne and
or i t s 1a nd' 1974 ) • I t isa nti ci pa ted t hat t his met h 0 deo u 1d s i g:' ~
ficantly improve estimates of harp seal pup production.
\
·e
..:,.
16
Details of this method have been outlined by Lavigne ~ ~ (1975L
as it was.applied to the northwestern Atlantic harp seal. It i~
stated that using a direct statiscal method i.e. applying a mean
density estimate to the total herd area, results in confidence
limits much too large to suggest the method is useful. In addi
tion the patchiness of seals on the ice results in a skewed distri
bution from subplot estimates such that themodal value is indied
much less than the msan.
Lavigne et al (1975) have suggested that a ratio estimate should
be used to reduce the confidence limits of the estimqte. This
methods requires additiona) information over that needed for a
direct estimate. Furthermore.the assumptions concerning these
supplement data are critical to the estimate. In order for this
method to improve upon the direct estimate the correlation of the
number of adults to pups in the subplots must be greater than the
ratio of the covariance of adults among the subplots divided by
2 times the covariance of the number of pups among subplots.
Lavigne et ~ (1975) count the number of adults from 1220 m to get
an estimate of the total herd size and determined ratio estimates
at 305 m.
It is suggested that their sample size of 6~ subplots was to small.
However. this only required a correlation coefficient, rAP, of
0.232 between pups and adults for the method to be valid. Thus
the minimum assumption required for the method to be valid is
:-; "::~"'" -} ~ '-. ',~ ~
a ,2 .. pPI - 0.232
where a2 is the variance among subplots uf pup abundance. P
and adult abundance. A. This of course is a minimum U55umption
end is subject to change depending on how good the actual agree
~ent between the number of pups and adults. This mcthod althou~~
~8rhaps the most promising of all. requires good ground tr~thi~~
·~r.d a More thorough knowledge of thc fr,J~~ti(1n of m:dcei ['n's"': ::-,
- 17 -
tha breeding lairs. Until these objeetives are aehieved it eanndt
be considered an adequate method useful in the evalution of status
of the harp seal stock.
Curran's Survey Method
Currently there i5 only one method of direet estimation of pup
production which a majority of scientists agr~e upon. as being
reliable (Fig. 3). Perhaps it is more because of the man. and
his long years of experience with seal management. than with the
technique.
.The following is abrief description of the method. On Mareh 8th
and 9th a grid is flown from northern Labrador to Notre Dame Bay.
Newfoundland to loeate the herd. At this time. the younger females
whieh have less control of parturation than older seals. hau 1 up on
the ice to give birth. The sighting of these younger animals gives
the herd's loeation. Approximately two days later the older fema
les will begin to whelp in a somewhat more southerly loeation.
This usually gives the appearanee of two herds. The majority of
the front herd have whelped by March 12th (Curran personal commu
nication) .
Each of these two herds are surveyed separ~tely. First, the exten- 4tsivness of a herd is "determined by eircling it and dra~jing a paral-
lel grid lines. This grid is followed by aircraft and X's are
marked on it where there are no seals so the total area of seal
density ean be calculated.
The pups in specific subpatches are then sometimes eounted by
Curran and his crew for at least 20 acres. Each subpatch i5
about 1 acre in size and randomly distributed. In some areas
the seals are scattered and in others dense, such that a msan
number/acre and an associatod variance can bo calculated. This
density i5 now applied to tho subhord, for which lhe total 3rea
has beBn dotermined to give tho pupulation 8izo. This pxercis8
then allaws far visual estim.::ltos from the aircri3Ft f.Jr tho re:'"3ir-,-
i ng herd.
..: '. ','"
- 1B -
Norwegian and Canadian sealers will hunt off particular areas.
and Curranreceives daily counts of their take. When the hunters
move out he will count the remaining seals and addthis to the
catch~ thus arriving at total figures for different areas. By
relating these figures to his own estimates he can get an idea
of how accurate his original estimatßs were. In addition to soon
learning what a specific number of pups looks like from the air.
he claims his,method of estimation is always Qonservative by at '
least 10%~ this i5 pos5ibly an overstatement.
There i5 no doubt the method i5 crude and could be improved by
,tt good aerial photography. However. because of his efforts in-' ;
ground truthing his direct e5timates are perhaps the most
accurate available.
•
It has been proposed that 1/3 of the seal herd whelp in the
Gulf and 2/3 whelp on the Front Sergeant (1976). According to
Curran's estimate5 from 1971 to date. the breeding population on
the Front is about the same size as that in the Gulf. Al~hough
Curran's estimate5 are conservative. the implicat~ons of this
fact are quite serious. It means that with the Gulf closed to
hunting from large vessels. the Front could become severely over
exploited. Apparentli. the juvenile seals intermix between the
two areas (Sergeant MS 1976) but adults do rot. and therefore
there is a possibility the assumption of the two herds may be
one (Sergeant 1965) is wrong.
Construction of the Simulation
It is our opinion that some further insights can be gained into
the population dynamics of harp seals by the construction of a
stochastic simulation. 8y stochastic it is meant that the distri
bution and variance of certain parametars and state variables 15
taken into account. Another assumption is that the Front and
Gulf herds are indeed one population sinee they spend the summer,
_n __ n n ..
.'
- 19 -
together in the Arctic (Sergeant 1965)1 and intermix as
juveniles (Sergeant 1975). Of the two assumptions possible l
more evidence supports the one herd hypothesis.
The simulations written in APL (Fig. 6) are represented by the
schematic flow chart (Fig. 7). The program presented in Figure
6 requires specific large vessel catch of 1+ seals and pups to
be entered l however l the alternative program is slightly changed
so fishing mortality rates rather than large vessel catches are
entered.
To initiate the program a ~tarting population of animals aged 1
to 25 is entered, then the number of years the program is to run,
and thestarting date. A quota can then set by entering in a
large vessel catch of 1+ seals and pups. An option is also avail
able whereby the catch of 1+ seals and pups by the Magdellanot can
be fixed.
The simulation has two options related to its printout. If the
number of runs is deemed as one, it will print out the breeding
and total population size, the annual sex ratio of the total and
breeding population, the total catch of 1+ seals and pups. How
ever, since the model is stochastic, each run will give different
answers since the "seed" in the random number generator is not
fixed for each iteration. Thus, when the number of ,runs is great
er than one, matrices of total annual and breeding population 1 in
addition to the catch of 1+ seals and pups is printed out. The
right hand two columns in each of the matrices is the mean and
standard deviation for that year.
The starting population is now broken up into the male and female
fractions present in 1977 (Fig. 6, D4J t). One of the problems
with this fishery which does not allow it to be interpreted accu
rately using conventiona1 fisheries models is that the frequency
distribution of the catch bears little relationship to the fre-"
quency distribution, of t~e population. Therefore the catch cannot
be distributed in a similar structure to the population.
* '[~ represents the 1ine in the program in (Fig. 6).
•
- 20 -
7he frequeney distributions of four distriet fisheries (Fig.8J
are used'; the high Aretie. Greenland. landsmen and large vessel
catches. These distributions are averages over a number of ran
domly chosen years between 1952 and 1975 so that baises due to
trends in reeruitment and effort are redueed. The interpolated
values from thecurves of bestfitwere entered into the simula
tion as average eonstant values representing the eateh ~requen-
ci es ( Fi g. 6 [4 5J - es 2J ).
All the uneontrolled eatches. i.e. those exeluding large vessels,
had a normally distributed random eomponent. The means and stan
e dard deviations for these fisheries were as folIows:
Cateh of 1 + seals
Landsmen cateh 13026 :!: 5048 ISO
Greenland 3784 ± 1040 (Kapel 1975)
High Aretie 1294 + 729 (Sergeant 1.971)-
Cateh of O-group seals
Landsmen 36949 ± 14442 ISO
Greenland 3784 + 1040-
In each ease the eateh was broken into the frequeney distribution
through multiplying it by the average eateh distribution. It was
then fractioned into males and females by (1) assuming that eaeh
uneontrolled cateh had the same sex ratio as the current population
and (2) that the large vessel eateh had the same aga dependent sex
ratio as that in Figure one sinee the elosing dates are to remain
fixed.
The next step in the program is to calculate the SiZ8 of the
breeding population (ffi~ ) and for this two funetions must be
evaluated. First density-dependent age speeific whelping ages
are caleulated using the equation (D~):
- 21 -
...
where iEt is the fraction of the population whelping assuming
100% pregnancy for a particular age i and population number of
1+ seals Nt in the year t, and A is the age in years. The AResine of iEt is constrained such that it cannot be 90 or O.
A density-dependent fertility rate is calculafed using the
following equation ((73]):
(11) P = 1.048 - 9.746 x 10- 8 N2
where P is the pregnancy rate and N2 is the number of harp seals
between the ages 2 and 25. These two equations act together to
constrain the pup production with the carrying capacity of the
environment in addition to augmenting the production at lower
population levels. They make the birth rate apower function of
population size. The summation of the breeding population vector
is multiplied by 1.06 since it was determined that on average 6%
of the breeding population is over the age of 25.
Equation land 11 represent the feedback within the simulation
which changes its nature from linear to non linear. this provi- ~
ding some additional ~ealism.
Following the calculation of pup production the catches of 1+
males and females are subtracted from the total number( [86J
[8~ ). Similarly. the pup catch is subtracted from the total
ca t ch ( [94] ).
Natural mortality is also considered a stochastic. normally
distributed parameter of 0.114 ± 0.0302 which means that it can
vary as widely as fram 0.174 to 0.0536, less than 5% of the time.
Natural mortality is applied using the following equation ([97 -
99J) :
•
,,.,1,: ~... \,
"
- 22 -
Natural mortality .isapplied to the population after .thecatch
has been subtracted offl since the hunt primarilY occurs during
the spring and natural mortality and hunting mortality ,occur
qui te separately. '.
The surviving pups after exploitation and nat~ral mortality are
assumed to have a 0.50:0.50 sex ratio. The numbers of males and
females at age are now updated and the 0 group cohort is catenated
into the vector for 1-year-olds and the remaining 25-year-old ,seals
are dropped from the vector ( l) 01 1 102] ). Annual sex ratios of
the total and breeding populations are calculated. A test is made
to determine if the simulated time period has expired and if more
iterations are to occur. If the simulation time has elapsed the
remnining portion of the program dealing with the calculation of
means and variances and formating executes.
Results and Discussion of the Simulation
Allen (1975) has pointed out that his linear model allows the
population to increase ad infinitum which restricts its useful
ness for making long term predictions. Thus the initial .use of
the simulation was to investigate wh at the implications of different
8ssumption concerning the pregnancy rates and maturityrates had on
the population l when there was no fishery other than the uncontrol
led landsmen and aboriginal hunt.
Many mammalian populations show a varying fertility rate (Gambel1
1973 1 Markgreen 1969) in response to space and food availabilitYI
and indeed there i5 evidence to indicatethat the pregnancy rate
for harp seals can also be altered in response to changes in densi
ty (Fig. 5). When this relationship was incorporated into the
simulation, it limits the population (Fig. 9) to about 6.5 mil
lion animals. At this time the fertility rate was approximately0.4 which brought the population into oquilibrium with tho uncon-
trolled landsmen and aboriginal hunt. Howover l thereproductivepotential of the stock was unrealistic. sinco whon MSY (maximum
.. ~'.
- 23 -
sustainable yield), to be discussed later, was determined, catch
levels could be sustained which were in excess of those which
have led to a decline in the herd.
It was apparent from this exercise that an ddditional mechanism
was necessary to constrain the reproductive potential of the
population. For this reason, a density-dependent maturity ogive
was added into the simulation. The effect was to produce a po
pulation size which was in equilibrium with the landsmen and
aboriginal catch levels at an abundance of 3.7 million seals.
The sequentia; analysis estimate for 1952 (Table 5) was - 2.3
~illion_seals, which Sergeant (1975) concluded was near the maxi
mum popuolation size. Evidence from this analysis do not agree
with Sergeant's.conclusions.
A simulated "necruitment" curve (Fig. 10) was compared with values
from the sequential population analysis. The line passed through
the axis of the data, but the scatter in the pup production values
was too great to suggest if the two techniques confirmed one another.
However, one apparent fact was that pup production had t~ be in
excess of the 1952 production level, to sustain the high catches
between 1830 and 1923 (Chafe 1923).
The curve (Fig. 10) is apower function of population size. ..
Allen (1975) speculaies as to the possible shape of the recruit-
ment curve and concludes that if reproduction is a linear function
of stock size, the Beverton and Holt (1957) recruitment curve is
indeed the best rspresentation of the recruitment process of seals.
In addition, to the linear shift fn maturity our model allows for
a linear shift in the pregnancy rate which adds more curvature to
the relationship. Ricker (1954) recruitment is not realistic for
a stock as undynamic as harp seals, since the declining portion
of this curve. results from a population being much further out of
equilibrium with the carrying capa city of the environmeny.' than
it is possible for seals to get. At the point of maximum popula
tion size then, the reproductive rate is equivalent to the mortality
rate.
•
- 24
It was· necessary., to determine the MSY population love'l as a
reference point for harp seal management. Ihis could not be
determined . from the simulation if only catch was controlled,
since, under these conditions the population could only come
into someequilibrium or collapse. Thorefore, the alternate
program was utilizad such that catch would vary in response
to pop~lation size, by controlling tho hunting morality rate.
This allows for a Shaefer type curve (Fig~ 11} ~o be generated.
~unting mortality by large vessels was calculated under present
conditions to be approximately 0.01 on 1+ seals. Holding this
mortality constant, the hunting level on pups was allowed to
vary. Ihe predicted value.for maximum sustainable yield approxi
mately 200,000 pups and 40,000 1+ seals, with rospect to the
present .pup to 1+ seals kill ratio. The MSY population size is
near 1.6 million 1+ seals, or a breeding stock of 375,000 females.
The variance in catch becomes grea~r on the left hand side of
the Shaefer type curve (Fig. 11). This fact has been speculated
on by Ooubleday (1976), but here the biological basis is apparent.
At stock sizes less than 1.2 million the maturity ogive can no
langer shift to the left thus the population loses much of its
density dependent control to maintain stability. This same result
was shown by Lett and Kohler (1976) for an Atlantic herring stock.
Using the 1977 age specific abundance levels (Table 5) the popu
lation was projected ahead with fixed large vessel catches ofpups
and 1+ seals (Fig. 12). When the large vessels removed 10,000 1+
seals and 80,000 pups the mean population size increased, reaching,
the MSY breeding stock size by 1989, however, there is a 66% chance
MSY could be reached by 1983. The total average catch includinglandsmen, large vessels, Canadian native and Greenland is --150,000
seals. When the large vessels take 10,000 1+ seals and 100,00u
pups the mean population size reaches MSY in 1991, a date which is
not much different than that for the projected 1971-1974 management
strategy. In all iterations the population increased at this levelof exploitation.
.. i,'.
- 25 -
When the large vessel catch was 10,000 1+ seals and 120,000
pups for a total average catch of 190,000, the population did
not change in size. However, 20% of the time the population
declined and 80% of the time it stayed the same or increased.
When 10,000 more 1+ seals were removed by large vessels (Fig.
12D) the population declined in all cases.
In conclusion, this study would indicate that.the catch should
not exceed 170.000 seals to allow the population to increase
to MSY, assuming kill ratio of 20% 1+ seals to 80% pups and
keeping in mind this includes the high Arctic and Greenland hunt.
Furthermore, because of th~ growing uncertainties of prediction
encountered as one moves away from the current population size
(Fig. 12) quotas should not be set more than 3-5 years in advance ..A complete re-examination of the population dynamics and herd
assessment is necessary at .least every 5 year.
Sampling of the landsmen and large vessel catch must be continued
at an accelerated level in the interim, in addition to sampIes
collected from the moulting lairs for estimates of natural morta-
lity. In addition, sampIes of ovaries should be collected from
the breeding to detect shifts in the maturity ogive. Ultraviolet
aerial sensing of the herd, with adequate ground truthing, must oe
persued until a direct estimate of the population size is available ...
We believe that the model presented in this paper is quite complets
as far as the population dynamics is concerned, and for this reason
a logical extension of the simulation could incorporate some commu
nity structure, and bioenergetic submodels.
Aknowlegement
",,,...... :" '. ".. '~~ .', .
- 26 -
."
REFERENCES.
Allen, R. L. 1975. A life table for harp seals Pagophilus
groenlandicus (Er~leben).. Symposium on the Biology of
the Seal, Guelph, Canada, August ~972. Rapp. P-v Raun.
Cons. per. int. Explor. Mer. 169:303-311.
Benjaminsen, T. and T. 0ritsland. MS 1975. Adjusted estiamtes
of year-class surviva1 and production with estimates
of morta1ity for Northwestern At1antic harp seals.
lnt. Comm. Northwest Atl. Fish. Working Pap., 1975(XI/3):
38 p.
Beverton, R. J. H., and S. J. Holt. 1957. On the dynamics of
exp10ited fish populations. Fishery Investigations,
Sero 11, Val. 19, 533 p.
Bourli~re, F. 1959. Lifespans of mammalian and bird populations
in nature. In G.E.W. Wolstenholme and Maeve O'Connor
[e dJ Co 110 gui a 0n Ag eing . J. andA. Chur chi 11 Lt d •,
Landon.
.. Capstick, C.K., and K. Ronald. 1976. Modelling seal populations
for herd management. FAD Scientific Consultation on
Marine Mammals, Bergen, Norway. ACMRR/MM/SC/77. 19 p.
Chafe, L.G., W.A. Mann, and H. M. Mosdell. 1923. Chafe's Sea1ing
Book, a history of the Newfoundland sealfishery from
the earliest available records down to and including
the vouage of 1923. The Trade Printers and Publishers
Ltd. 10B p.
Coleman, J. 1938. The Newfoundland seal-fishery and its possible
influence on the Greenlanders.Polar Record, 2(16):99-103.
· ...-,'
- 27 -
~'.
Department cf Fisheries cf C~nada. 1968. Canadian Atlantic
ccast harp and hcad seal catch statistics: an histo-. .ricai series by regions l methods of capture, types cf
pelts l areas of catch l 1946-1967. Economic Service l
Department cf Fisheries cf Canada l ottawa.
DoubledaYI W. G. 1975. The least squares approach to analysing
catch at age data. Int. Comm. Northwest Atl. Fish. Re~.
Ooc. 75/35.
Dcubleday, W. G. 1976. Environmental fluctations and fisheries
management. <Int. Comm. Northwest. Atl. Fish. SeI. Papa,'1.1:141-150.
Fisher, H. D. 1952. Harp seals of the Northwest Atlantic. Fish.
Res. Board Can. General Sero No. 20, 4 p.
Fisher, H. D. 1955. Utilization of Atlantic harp seal populations.
Trans. 20 North Ameriean Wildlife Conferenee: 507-518 ..
Fiskeridirektßren, 1951- 1965. Selfangsten •.•..• Arsbertn.
~org. Fisk. 1946-1964.
Fry, F. E. J. 1949 • Stat ist i es 0 f a la ke t ro ut fis hery. Bio metr i es e~ 27-67.
GambelI, R. 1973. Same effects of exploitation on reproduction
in whales. J. Reprod. Fert., Suppl. 19: 533-553.
Gulland, J. A. 1965. Estimation of mortality rates. ~nnex tc
Aretic Fisheries Working Group Report.._!_~~?~_~~l. 1965
( 3).
International Commission for the Northwest Atlantic Fisheries 1972.
Int. Lomm. Northwest Atl. Fish. Sumo Ooe 72/6.
"<;- ",', \-" .
"..'
, . . "," ". ':, • ,'. I ~
, - 28 -
Jones, R., 1964. Estimating population size from eommereial
statistics when fishing mortality varies with age~
Rapp. P.v. Cons.perm. int. explor. Me~ 155.38~210-214.
Kape~, F.D. 1975. Oata on the eateh of harp and hooded seals
1954-1974', and lang-term fluetuations in sealing .in
Greenland. Int. Comm. Northwest. Atl. Fish. Res Ooe
75/XII/9 •.
Lavigne, D.M., and N.A. 0ritsland. 1974. Ultraviolet photography:
A new metod for remote sensing of mammals~ Can. J~ Zool~
.52: 939-941.
Lavigne, D. M•• S. Innes, K. Kalpakis and K. Ranald. 1975. An
aerial senSU5 of western Atlantie harp seals ePagophilus
groenlandieus) using ultraviolet photography,.Int. Comm.
Northwest Atl~ Fish. Res. Ooc. 75/XII/144.
Lavigne, D. M., W. Barchard. S. 1nnes, and N.A. 0ritsland 1976.
Pinniped bioenergetics. FAD. Scientific Consultation on
.~Mar,ine Mammals. Bergen, Norway. ACMRR/MM/SC/112.
Lett, P. F. and A. C. Kohler. Recruitment: a problem of mu~ti~
species interaction and environmental pertenbations, with
special .reference to Gulfof st. Lawrence Atlantic herring
eClupea Larsngu5 harengus). J. Fish. Res. Board Can 33:
1353-1371.
Markgren, G. 1969. Reproduction of moose in Sweden. Viltrevy,~ 6
(3): 125-299.
McLaren. I. A. 1957. Seals and group selection. Ecology48(1J:
104-110.
Murphy, G. I. 1964. A solution of the catch 8quation.
Res. Board Can. 22: 191-201.
J .• Fish.
, ,: ~ .. '}',';;.' :. '~}~.~. :\ .,...."'...
.,
29
0iitsland, T. 1967. Revisedeateh and ~ffort"st~tisticafor
the Norwegian seal hunt in ,the Front a"nd Gulf areas
off Newfoundland, 1937-1967. Int. Comm. Northwest
Atl. Fish. Serial Na. 1959 •
0ritsland," T. 1970 •. Sealing and seal research in the south
west Atlantie paek iee, Sept.-oet. 19ß4, p. 367-376.
In Antaretic eeology ~dJ M. W. Hallgate Vo 1. Aeademie
Press, London.
0ritsland, T. 1971. Catch and effort statisties for Norwegian
sealing in Front area, Newfoundland, 1971. Int. Comm.
Northwest Atl. Fish. Res. ooe. 71/132.
Pope, J. G. 1972. An investigation of the aeeuraey of virtual
population analysis using eohort analysis. fnt. Comm.
Northwest Atl. Fish. Res. Bull. 9: 65-74.
Rieker, W. E. 1971. Comments on the West Atlantie harp seal
herd and proposals for the 1972 harves~ Int. Comm.North
west. Atl. Fish.Res. Ooe 75/IXX/143 (Appendix).
Rieker, W. E. 1975. Computation and interpretation of biologieal
statisties of fish populations. ~ull. Fish. Res. Board
Ca n • 19, 382 p.
Sergeant, D. E. 1965. Migration of harp seals Pagophilus groen
landieus in the northwest Atlantie. J. Fish. Res. Board.Can. "22: 433-464.
Sergeant, O. E. 1966. Reproductive rates of harp';eai~,:Pagophilus. ~ .. . .groenlandieus (Erxleben). J. Fish. Res.~Bo~rd Can. 23:
757-766.
Sergeant, D.E. 1971. Caleulation of produetion of harp seals in
the western north Atlantic. Int. [omm. Northwest Atl.
Fish. Redbook 1971, Part 111: 157-184.
".'"
- 30 - .
Sergeant, O. E•. 1972. Canadian studies onharp seals in 1971.
Int. Comm. Northwest, Atl. Fish. Res. Ooe. 72/59.
Sergeant, O. E. 1973a. Feeding, growth, and' produetivity ofnorthes t .At lantic. harp 'sea ls (Pag~phi1us gro en landi cus) •
J.Fish. RBs. Bd. Can. 30:f7-29.« ".'
Sergeant, O. E. 1973b. Environment and reproduetion in seals.
J. Reprod. Fert., SuppL 19: 555- 561.
Sergeant, O. E. 1975. Results of research on harp seals in 1975
with an estimate.of produetion. Int. Comm. Northwest.
Atl. Fish. Res. ooe. 75/XII/142.
Sergeant, O. E. 1976. Studies on harp seals of the western north
Atlantie populations' in 1976. Int. Comm. Northwest. Atl.
Fish Res. ODe. 76/X/124.
Simms, H.S., B.N. Berg, and O. F. Davies. 1959. Onset of disease
and the longevity of rat and man. In G~ E. W. Wolstenholme
~nd Maeve O'Connor [e~ Solloguia on Ageing. J. and A.Churehill Ltd. London.
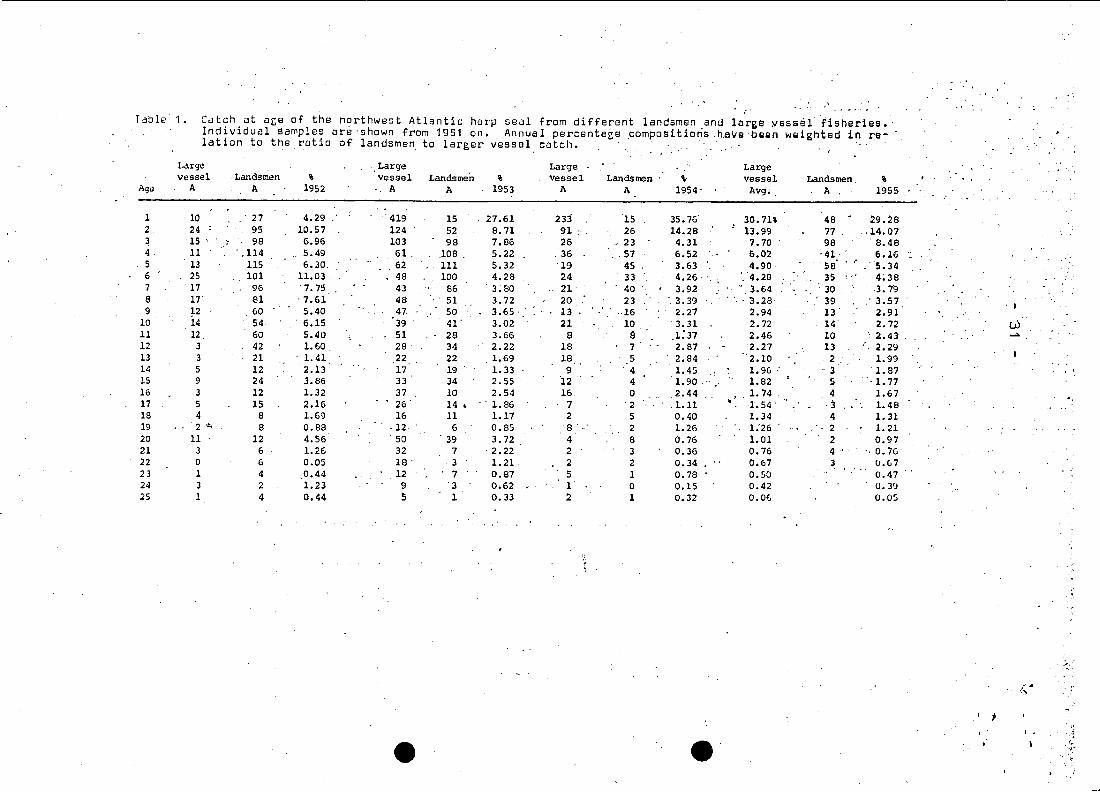
.Teble 1 • Cd tch at agB of the northwest Atlantic harp seal from different landsmen and large yessdl"iisheries. '
Individual samples are 'shown from 1961 on. Annua 1 percentage ,compositioris ,h,ai/ebeen weighted in re-lation to the ratio of landsmen to larger vessel catch.
"
Large " Large Large Largevesse1 Landsmen \ Vesse1 Landsmen \ vesse1 Landsmen \' vesse1 Landsmen ,
Age A A 1952 A A 1953 A A 1954' Avg~ , A 1955
1 10 ' 27 4.29 ' 419 15 27.61 233 15 35.76' 30. n% 48.
29.282 24 95 10.57 124 52 8. n 91 ;' 26 14.28 13.99 77. .. 14.07~ 15 ' , 98 6.96 103 98 7.86 26 " 23 4.31 7.70 98 ' 8.484 11 ' ,114 5.49 ,61, ,108 . 5.22 ,'36 ,57 6.52 6.02 '41, 6.165 13 115 6.30, 62 111 5.32 19 45 3.63 4.90 'SB ,"5.346 25 101 11.03, 48 100 4.28 24 33 4.26 ',4.2G 35 4;387 ' 17 96 '7.75 43 86 3.80 21 40 3.92 " 3.64 30 , 3.798 17 81 7.61 48 51 3.72 20 23 ' 3.39 . ,
, ' 3.28 39 ' 3.57 , I9 P 60 5.40 47, 50 3.65, 13 ,16 2.21 2.94 '13' 2.91
10 14 54 ' 6.15 39 41' 3.02 21 10 ' 3.31 2.72 14 2.72 W11 12 60 5.40 51 28 3.66 8 a 1:37 2.46 10 ' 2.43 .....12 3 42 1.60 28 34 2.22 18 7 2.87 2.27 13 2.2913 3 21 1. 41 22 22 1.69 18 5 2.84 2.10 2. 1.9914 5 12 2.13 17 19 1. 33 9 '4 1.45 1.96 ;' '3 1.8715 9 24 3.86 33 34 2.55 12 4 1.90 . 1.82 5 '1. 7716 3 12 1.32 37 10 2.54 16 0 2.44 1. 74 4 1.6717 5 15 2.16 26' 14 I .' 1.86 7 '2 .1.11 1. 54' ,) 1.4818 4 8 1.69 16 11 1.17 2 5 0.40 1.34 4 1.3119 2 ... 8 0.88 ·12 6 0.85, 8' 2 1.'26 1.'26 . 2 1.2120 11 12 4.56 ' 50 39 3.72 4 8 0.76 1.01 2 0.9721 3 6 1. 26 32 7 ' 2.22 2 3 0.36 0.76 4' , " 0.7622 0 6 0.05 18 ' 3 1.21 2 2 0.34 0.67 3 U.6723 1 4 0.44 12 7 0.87 5 1 0.78 0.50 0.4724 3 2 1.23 9 '3 0.62 1 0 0.15 0.42 U.392S 1 4 0.44 !i 1 0.33 2 1 0.32 0.06 0.05
;,
"
I 1
' ..
:
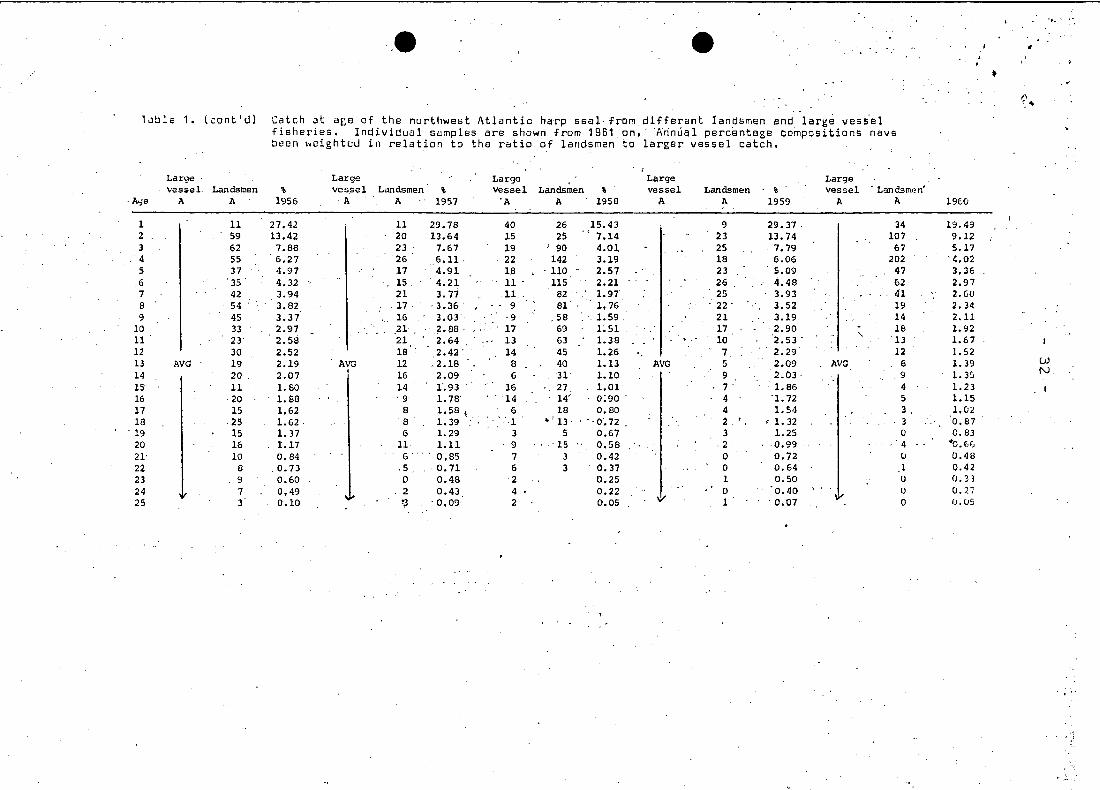
Tilble 1 • (cont'dJ Cateh dt age of the northwest At1antie harp seal from different landsmen and large vesse1fisheries. Individual samples are shown from 1951 on. Annua~ ~ercentage,eqmpositions, ha~e
, beeil weighted in relation to the ratio of landsmen to largsr vessel cateh.
!.arge Large -Large , Largevessel Landsman % vessel Lan:lsman Total % vessel Landsman Total' % vesse1 Landsrran Total %
Age A A 1961 A A B Landsman 1962 A A B Iandsman 1963 A A, B, I.andsman 1964
1 122 16 26.35 201 20 6 26 23.55 111 " 18 26, 44 7.93 3 10 43 53 3.132 34 65 10.39 245 50 15 65 29.17 121 52 83 135 ' 10.28 6 31 42 73 5.533 25 100 10.27 61 74 16 90 8.25 " 106 " 86 54 140 '9.42 8, 74 SO" ' .124, 7.974 30 126 12.62 56 95' 30 125 8.15 55 90 33 ,,123 5.83 ' 11' 64 32 ,'96 ' 9.305 11 39 4.27 , 39 95' 21 116 6.07" ,46 80 ,26 '106 , ,4.93 7 65 32 97 6.726 ' 13 52 5.34 , 17 33, 7 40 2.60 '61 56, '21 ' 77 " 5.35 12 40 42 ' 82 9.65 w
.7, ' 15 , 43, 5.30 15 46 14 60 ' , " 2.54 67, .32 : ,8 40 '5.04 ' 6 ' 27 29 56 5.15 w8 9 27 3.24 ' 16 42 16 58 2.63 ' 66 36' 10 46 5.09 5' 11 35 46 4.289 8 28 3.08 17 29 13 42 2.53 63 22 " 12 :' . 34 ' • 4.67 5 '10 23, 33 '4.00
10 17' 24 4.76 6 ,18 16 34 1.15 72 25 ',15 40 5.36 8 ,6 27 ' 33 5.9511 10 15 2.84 8 14 10 24 1.24 70 ,24 14 ,38 ' 5.20 ,4 11 18 29 3.2512 ' 3 20 1.63 13 17 3" ' 20 1. 77 ' 51 20 10 30 " ' 3.83 " , 4' " .. 5 21 26 . ' 3.1913 4 16 1.64 ' 6 ' 11 ;' 11 22 0.99 ' 57 11 9 20 4.03 3 6 20 26 2.5314 6 7 1.61 9 13 8 21 1.32 56 17 14 31 4.17 3 3 21 24 2.48
, 15 1 12 0.81 '12 21 " 23, " 44 ' ' .. 1. 98 ' 42 22 ' , ,11 33 3.31 5 4 " ' 7' '11. ',3.5016 5 5 1.29 4 7 10 17 0.69 54 15 9 24 3.91 4 2 11 13 " 2.9017 .4 3 0.98 12 . 9 .. 4 . ,,13 . 1.56 36 13 . 11. ,,24 , 2.76 5 4 12 16 . 3.6218 2 2 0.52 5 '11 4 15 . 0.78 24 9 4 13 1. 78 8 1 6 7' '5.37
,19 3 0 0.63 4 1 6 7 ,0.56 '. .. 18 .' 4 12. 16 1.45 4 0 14 14 2.9220 2 7 0.77 9 4 12 16 1.26 18 '10 10 20 1.53 0 2 6 B 0.1821 0 0 0.21 I, 1 2 3 '0.16 '17 5 " '6· ' ·11 'l. 30 4 0 6 6 2.7422 2 0 0.42 4 6 5 11 0.61 12 5 8 13 1.01 2 2 3 .5 1'.4223 ' 1 2 0.31 0 1 3, 4 0.17 9 4 10 14 0.84 2 0 5 5 1.4224 0 1 0.26 1 1 2 3 0.16 8 2 6 8 0.66 3 1 2 3 2.0225 1 4 0.41 1 2 3 '5 . 0.18 4 1 2 3 0.31 1 • 0 6 6 0.79
,)
lI
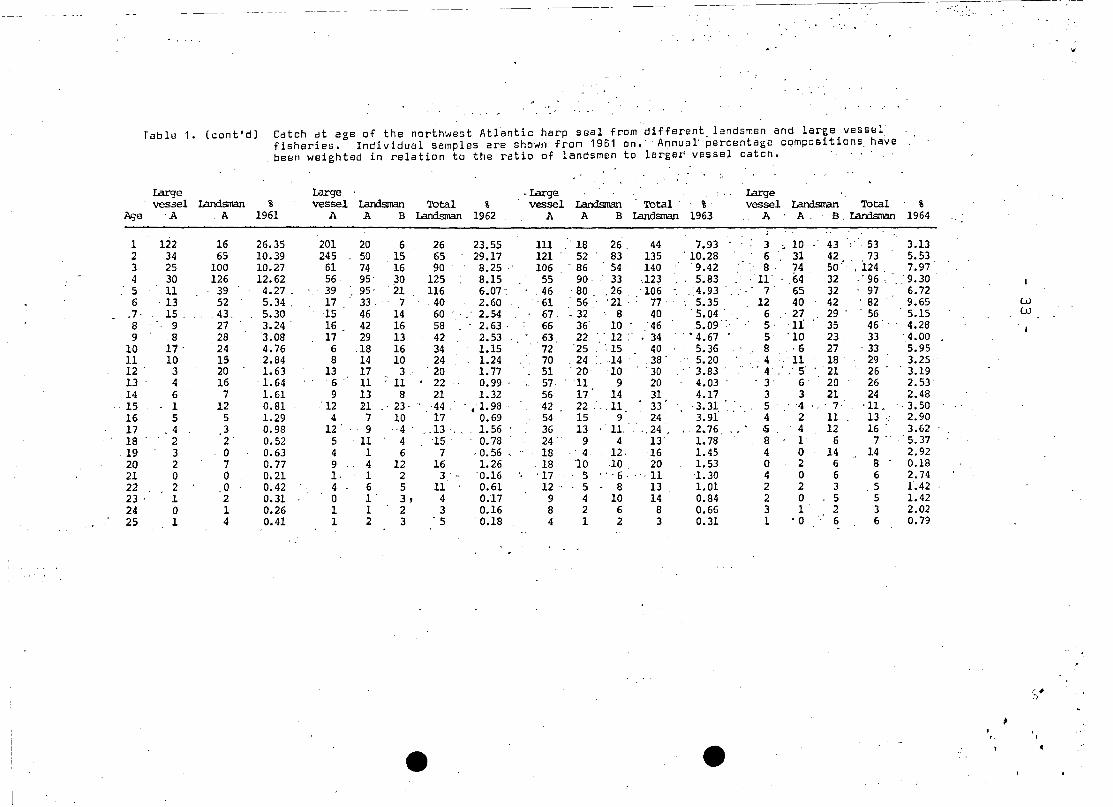
-- --Table 1. (cont'd) Catch at northwest~Atlanticharp'seal •age of the from different landsmen and large vesselfiGheries. Individual sampies are shown from 1961.on. Annual percentage compositions have ';~been weighted in relation to the ratio of landsmen to larger vessel catch.
Iarge large Totalvesse1 Iandsnan Total % vesse1 Iandsman Total % large vesse1 large Iandsrnan Total %Age A Tl. B Ianlsman 1965 A 'A B Iandsrnan '1966. A B vesse1 A B .c Landsman . 1967
1 32 4 4 8 13'.21 120 10 1 11' 15.30 176 55 ' 231 17 12 6 35, 18.532 13 17 10 27 6.58 . 100 ' 29 2 , 31: ' ,13.75 61 31 92 14, 42 11 67 8.683 13 45 24 69 8.72 39 42 ,3 45 6.86 ': 18 5 23 1 46 17 64 3.34 '4 15 72 34 106 11.42 40 . .- 44 ,5 49 7.17 18 6 24 9 37 24 70 3.565 23 71 24 95 14.06 i15 42.- : 7 49 7.79 29 19 48 11 58 30 99 6.116 22 66 18 84 ' 13.09 45 ' 50 5 55" , '8.06 46 22 68 21 72 25 118 '8~117 7 39 15 54 ,5.56 44 33 . '4 ' 37 7.15 40 19 59 26 64 27 117 7.398 2 32 16 48 '3.25 31 19 .. 0 19 4.69 ., ',30' , . 13 43 21 43 14 78 5.21 '9 2 18 4 22 1.92 15 14 4 .- .18 . 2.67 ',23, 5 28 ' 26 31 10 67 . 3.79, w
.j:>o10 5 9 5 14 2.72 17 8 2 10 " ,2.55 ' . 16' '" 8 24 16 27 , 9 52 , 3.1211 1 10 5 15 ' 1.17 23 ' 10 1 ,11 ' 3.34' - " 34 ~ , ' '13' 36 ", 21 -14 '11' , 46 .. 3.8912 7 12 6 18 3.72 17 5 0 5 2.32 18 6 24 14 15 5 ' 34 2.6713 1 16 7 23 1.18 15 7 0 , 7- 2.17 '14 5 19 ' 16 10 6 32 2.2414 5 8 7 15 2.76 17 7 ' 0 7 2.42 19 ' 10 29 15 16 7 38 3.1515 4 8 10 18 2.52 14 7 .. 0 1 , 2.05 ' , 20 10 30 13 12 7 32 3.0816 2 6 6 12 1.41 14 7, 1 8 .'2.09 , 14 6 20 17 .4 6 27 .. ' 2.19'17 1 5 5 10 0.91 10 3 2 5 1.46 18 8 26 12 9 3 24 3.3418 3 2 4 6 1.51 ,17 1 0 1 2.14 20 9 29 9 7 4 20 ,2.7119 3 6 4 10 1.71, ' 10 1- '2 ' j 1.37 21 9 30 8 4 6' 18 ' , , '2.7420 1 3 1 4 0.60. 11 2 0 2 .1.45 15 4 19 11 5 4 20 1.9521 2 ' 3 2 5 1.06 '" 8 'I 0 I, 1.03 ' 8 4, 12 '3 ' 3 4 10 1.1622 1 1 1 2 0.50 3 1 1 2 0.46 8 1 ,9 2 4 0 6 0.8423 0 2 0 2 0.10 7 1 0 1 0.91 8' 3 11 3 0 1 4' 0.9424 0 1 2 3 0.15 4 0 0 0 0.49 4 2 6 5 2 2 9 0.6825 0 1 2 3 0.15 2 0 2 2 0.34 '4 2 6 .1 3 1 '5 0.58
Tab le 1 • (eont'd) Cateh at age of the northwest Atlantic harp seal from different, landsmen end large vesselfisheries. Individual samples are shown from 1961 on. ' Annual percentage ccmpositions ,havabeen weighted in relation .to the ratio of landsmen 'ta larger vessel catch.
',',~
Total TotalL3.rge vessel large Landsman Total % !.arge vessel large I.ilndsman . Total % ' .
Aga A B vessel A B Landsnan 1968 .A B vessel ,A B C D Landsman 1969
1 84 142 226 '7 11' 18 15.04 62 . 396 , 458 87 37 9 5 138 35.77.,77 78 155 8 48 56 11.37 2 56 ,58 13 14 20 4 51 5.10 '""3 48 43. 91 ' 8 68 76 7.71 . 6 40 46 ,'13 21 49 29 112 5.26
4 20 27 47 ·8 56 64 4.58 1 32 33 13 10 69 18 110 4.285 17 32 . 49 5 ,39 44 4.23 2 43 ~45 11 11 71 11 104 5.05 W6 23 20 43 9 54 63· 4.30 4 30 34 :. 10 ,2'· 49 6 67 3.62 U1
7 27 48 75 12 41 53 6.13 1 38 :39 ,.5, 5,60 11' .81 4.22 "8 39 38 77 15 39 '54 ·6.28 - 6 45 51 7 ,4 59 . 10 80 5.089 23 31 54 16 17 33 4.29 2 39 41 1 2 43 11 57 3.96
10 26 30 56 ' 15 18 33 4.42 0 29 ,29 6 11 40 2. 59 3.1211 19 23 42 10 14 24 3.30 3 . 24 . 27 4 6· ,38 ' 3 51 ' 2.8412 18 12 30 13 14 27 2.59 1 18 . , 19 , 4 2 22 ' 6 ,34 1.9713 16 16 32 9 7 16 2.46 2 ·21 23 5· 5 ,20 1 ' 31 2.2114 24 18 42 7 9 16 3.10 2 24 26 3 2 16 1 22 2.2715 20 15, 35 9 10 19 2.72 2 24 26 ,,3 1 24 .0 ,28., ' 2.37 .16 20 . 14 34 11 6 17 2.61' 2 16 18 2 I' 18 1 22 1.6917 11 17 28 ,10 9 19 2.27 ' 0 24 24 6 5 11 0 22, 2.1318 ,17 . '27 44 7 4 '11 3.11 0' 21 21 2 0 11 '1 14 1.7719 16 22 38 5 5 10 . 2.70 0 22 22 3 2 5 0 10 1.78. '20 11 16 27 3 2 5 1.87 0 20 20 2 0 4 ' 1 7 1.5821 6 11 ,17 ' 4 1 5, " 1.22 1 13 14 2 0 5 ·1 .8 1.1622 5 19 24 4 3 7 1.72 2 10 12 1 1 2 0' 4 0.9423 4 10 14 2 0 ~ 0.95 2 9 11 2 0 0 0 2 0.84 ,24 2 8 10 1 0 1 0.67 1 5 6 0 0 1 0 1 0.4525 1 4 5 0 1 1 0.35 0 7 7 0 1 0 0 1 "0.53
-- -- .,ldble 1. (cont'd) CdlL:h dt iJgu of the northwest Atlanti6 harp seal from different landsmen and large v8ss'r,,1
fisheri8s. Individualsamples are shown from 1961 on •. Annual percentage eompos1tions ha.s .besn weighted in relation tu the ratio of landsmen to ~arger. vesB!31 eateh.
' ..
TotalLarge vesse1 largo Landsman Total % 'Large Landsnan Total % Large Landsman Total %
Age A B vesse1 J\ B C 0 Landsnan 1970 \'essei A B " 'n .Landsnan 1971 vesse1' A B C I.andsiran 1972.
1 105 134 239 41 31 5 21 98 18.17 239 3 4 17 39 63 31.59 12 11 1 0 12' 6.212 98 112 210 41 69 12 60 182 17.46 . 66 18 15 29 27 89 10.72 9 19 6 3 28 8.103- 11 34 45 15 89 32 67 203. 6.29 53 35 51 45 33 164 11.19 9 17 2 1 20 14.274 17 29 . 46 . 25 45 55 63 188 6.13 19' .34 30 17 14 95 5.02 24 26 3 3 32 9.885 : 18 . 15 33 23 40 77 68 208 5.53 18. .45 32 '31 5 113 5.37 9 10 .1 6 17 10.076 12 18 30 19 16 38 44 117 3.91 11 30 ..9 9 21 69 3.30 10 15 0 3 18 6.547 ' 15 26 41 14 8 35 24 81 4.12 10 .16 9 6 18 .49 . 2.61 13 .5 0 4 9 5.158 8 15 23 43 12 64 22 141 3.79 8 23 4 6 15 48 2.34 ' 9 . 8 '. 0 '3 11 4.729 . 13 22 35 49 8 66' 25. .148 4.74 17 21 7. 3 13 .. ,44 '3.35 '6 :. 5' 1 0 6 4.14
10 18 13 31 49 8 82 .24 ". 153 4.54 , 16 30 '3 4 31- . 58 3.61 6' 6 0 1 7 5.2911 13 7 20 24 4 61 13 102 2.97 10 9 2 10 20' ' -·41 2.39 4 13 0 2 15 3.7212 20 6 26 28 4 42 . 8 82 3.09 " , 12· 6 6 ,2 26 ... ,' 40 2.61 5. 7,' 0 6 13 3.72 . UJ
13 12 11 23 26 1 37 8 72 2.72 8 8 , 6 4. 22 40 2.11 2 5 . o· 2 7 3.46 C1l
14 6 10 16 19 0 30 5 54 1.95 4 9 3 0, 13 "25 1.20 2 15 0 0 15 2~23
15 11 13 24 29 2 32 10 73 2.81 6 4 ·3 o -18 25 1.45 6 6 0 2 8 2.5716 13 4 17 30 1 27 2 60 2.12 6 3 5- 0 11 19 . 1.28 4 3 1 0 4 1.9117 7 8 15 20 0 30 9 59 1.96 . 6 5 3 l' 8 '17, 1.22 3 a 0 0 8 1.66
18 7 10 17 12 l' 21 6 40 1.81· 9 '4 1 0 10' . 15 1:54 2 7 0 3 10 1.41
19 7 7 14 18 1 17 6 42 1.63 6 3 2 0 7 12 1.08 0 5 0 0 5 0.99
20 6 6 12 22 3 16 '6 47 • '1.56 8 2 0 1.11· .... ·14 •. 1.39'- 5 '13 .0 1 14 1. 58
21 4 4 8 10 1 10 1 22 0.90 5 0 0 2 7 9 0.87 1 7 1 1 9 0.83
22 '" '5 2 7 5 0 9 .1 15 0.72. 9 0 0 0 4 4 1.23 3 3 0 2 5 0.59
23 3 0 3 7 0 4 3.. . 14 0.43 7 0 O. 0 4 4 0~99 1 2 0 2 2 0.41
24 3 .1 4 5 0 5 1 11 ·0.45 4 1 0 0 ·1 2 0.56 2 3 0 0 3 0.34
25 0 1 1 3 0 6 0 9 0.21. 7 1 .0 0 2 3 0.96 o· 0 0 0 0 0.25
Tuble 1 • (cont'J) Catch at aga of the northwest Atlantic harp seal from different lanosmen'and large vesselfisheries. Individual sampies are shown from 1961 .on. Annual percentage compositions have·been weighted in relation to the ratio o~ 1and~m~n to larger vesssl catch. ' ,
Total Large LargeLarge vesse1 large Iandsman % vessel Landsman . Total % vesse1 Landsman Total %
Age A B vessel A 1973 A A·B ~ D Landsman 1974 A A .B C ·n 'E Landsman 1975
1 171 4 175 6 6.52 360 0 8 46 ' 106 160 26.66 464 20 o 157 146 55 378 28.802 232 5 237 14 9.61 227 0 18 33 22 73 15.62 223 55 1 123 30 47 256 17.103 188 0 188 16 8.40 86 2 7 11 7 27 5.89 102 56 12 61 13 20 162 9.794 173 5 178 9 6.98 65 5 10 10 5 30 4.86 67 . 19 26 40 1 10 96 5.985 293 6 299 11 11.26 67 17 12 ,5 6 40 5.40 57 8 62 29 4 4 107 6.206 81 0 81 11 4.16 88 61 19 7 4 91 8.73 57 4 57 25 2 5 93 5.587 67 1 68 16 4.34 . 21 20 13 3 1 37 . 2.73 28 5 71 22 1 9 108 5.488 79 6 85 15 4.61 21 30 18 3 0 51 3.33 23 4 50 11 0 2 . 67 3.559 42 o . 42 . 21 4.16 36 19 17 1 O' . 37 3.56 29 3 21 '7 0 2 33 2.21 .
10 37 4 41 17 3.47 . 21 ·15 20 . 0 0 ·35 2.65 17 . 0 19 18 '0 10 47 2.07 . ·111 45 3 48 24 . 4.65 . 16 8 18 ' 0 1 27 2.03 28 0 14 14 0 1 29 2.01.12 30 0 '30 27 4.54 24 11 14 .2 0 27 2.47 17. 2 14 11 0 4 31 . L81 LU13 36 0 36 22 4.09 23 6 17 1 0 24 2.29 20 0 10 . 20 1 1 32 1.93 'J14 24 0 24 21 3.56 19 2 17 1 .0 20 1.90 15 0 9 18 0 0 27 1.5815 36 1 37 18 3.56 30 2· 16 0 0 18 1.86 15 0 5 10 0 0 15 1.0516 32 1 33 15 3.04 . 16 '2 21 0 1 24 1.90 13 0 7 7 0 2 16 1.0417 25 1 26 11 2.28· 16 4 13 1 0 .~ 18 1.65 13 0 1 7 0 1 9 0.7418 23 1 24 10 2.08 14 1 10 0 0 11 1.24 10 0 7 9 0 O. 16 0.9719 29. 1 30 6 1.76 12. 2' '7.. 0 -0 9, ·1.04 . 8 0 2 '4 0 0 6. 0.4720 33 0 33 . 6 1.89 10 1 6 0 0 7 0.85 6 0 0 4 0 1 5 0.3821 18 0 18 3 0.99 8 0 8 0 ··0 8 '. 0.78 5 0 0 3 0 0 3 '0.26 '22 18 0 18 13 . 0.23 9 0 7 0 0 7 0.79 7 0 1 2 0 0 3 0.3223 20 0 20 0 0.67 , 7 0 4 0 0 4 . 0.56 5 0 0 0 0 ·1 1 0'.1824 15 0 15 0 0.50 11 0 0 0 0 0 0.61 6 0 1 2 0 0 3 0.2925 17 0 17, 0 0.56 9 1 1 0 0 2 0.58 5 0 0 2 '0 0 2 0.22
t
( .." ~
Table 1- (cont'd). ,Catc.h at ,a~oLthe northwBst ·Atlantic· ha.seal from different '--'.., _..... , '.' " . ~ ~ "'" ...,"_ v _.' , ... , ' , .',' .....,:.-.-.-. , .
landsmen a large vessel fisheries. Ind dual sampIes areshown from 961 on. Annual percentage compositions have been ..weighted in relation to the ratio of landsmen to larger vesselcatch.
"(~Largevesse1 Landsman 'Ibta1 %
Age A A B " D E Landsrnan 1976...
1 292 0 7 88 75 113 283 33.202 112 0 18 57 34 58 167 18.963 60 1 26 45 20 25 117 12.084 35 13 9 37 11 17 87 8.735 24 16 4 22 2 2 46 4.766 13 15 3 20 1 0 39 3.847 18 19 1 10 1 0 31 3.268 13 13 0 16 2 0 31 3.129 11 9 1 3 0 0 13 1.46
10 6 14 1 9 0 0 24 2.3011 6 8 0 6 2 0 16 1.5912 5 4 0 5 2 0 11 1.12 w8 5 0 3 0 0 8 0.93 OJ1314 5 4 0 4 1 0 9 • 0.9415 5· 3 0 13 0 0 16 1.5716 5 1 0 4 0 0 5 0.5817 5 1 0 5 0 0 6 0.6718 3 0 0 4 0 0 4 0.4419 2 0 0 4 0 0 4 0.4120 1 0 0 5 0 0 5 0.4721 1 0 0 1 0 0 1 0.1222 2 0 0 1 0 0 1 0.1423 1 0 0 1 0 0 1 Ö.1624 0 0 0 1 0 0 1 0.0925 0 0 0 1 0 0 1 0.09
Table 2.
- 39 -
The total catch of 1+ northwest Atlantic harpseals by landsmen and large vessels from 1952to 1975.
YEAR LANDSMEN LARGE VESSEL , % LANDSMEN % LARGE VESSEL1952 10667 98378 9.8 90.2
53 ·8100 . 66811 10.8 89.254 5443 83939 6.1 93.9
1955 5401 75671 6.7 93.356 5428 42585 11.3 88.757 3605 76437 4.,5 95.558 19563 137227 12.5 87.559 3998 77304 4.9 95.1
1960 6648 114534 5.5 94.561 5877 13170 30.9 69.162 13388 99513 11.9 88.1
I 63 14529 57094 20.3 79.764 14933 60348 19.8 80.2
1965 17738 33757 34.4 65.666 12647 59364. 17.6 82.467 15245 41361 26.9 73.168 5910 30328 16.3 83.769 10532 44940 19.0 81.0
1970 13839 26225 34.5 65.571 6044 14343 29.6 70.4 •~ 72 11427 ·1646 87.4 12.673 10416 15081 40.9 59.174 10982 21828 33.5 66.5
1975 22733 10992 67.4 32.6
. ,..~.,~. . ' -. ~.
Table 3. Catch at age4l'ta of the n'Orthwest Atlantic~rp' •seals rssulting from ths weighting of sampIes and ..application to the total catch.
~
.., ",..--... ..
Age 1952 1953 1954 1955 1956 1957 1958 1959 1960 1961 1962 1963 . . ,
;
0 198063 197975 184491 260020 346846 171909 ·149350 243255 164158 174762, 211285 2859941 4679 20685 35353 26005 14664 25488 44871 25180 37848 6586 27588 67802 11529 6527 14119 12499 7175 11796 20701 11778 18220 2597 34154 8785·3 7589 5888 4257 7526 4215 6631 12830 6675 10108 2566 9762 80444 5983 3913 6444 5467 3355 5280 11387 5194 9486 3155 9549 49805 6875 3988 3590 4738 2660 4248 9163 4360 6478 1067 .7108 42156 12029 3207 4207 3889 2310 3647 8247 3838 5783 ' ,1335 2932 45727 8451 2843 3879 3367 2108 3256 6812 3365 4877 1326 2978 4308 ',:
8 8302 2790 3351 3171 2045 2908 6268 3021 4200 ' 811 3081 43499 5889 2732 2246 2588 1804 2618 5347 2731 3737 771 2963 3993
10 6711 2263 3271 2414 1588 2493 5231 2485' 3506 1192 1350 4582 .11 5889 2741 1350 2159 1378 2285 4754 2168 3145 712 1462 444012 1740 1664 2841 2031 1349 2088 4129 1961 2896 409 ,2075 3272
~,
13 1532 1267 2806 1763 1169 1877 3792 1792 2627 411 1160 3440 0
14 2325 996 1430 1659 ~112 1809 3419 1741 2488 403 1550 3562 ' ;
15 4208 1909 1882 1567 964 1670 3141 1595 2264 204 2319 282816 1443 1901 ' 2415 1485 1006 1541 2774 1479 2172 325 810 224017 2355 1395 1092 1311 867 1367 2566 1319 1912 248 1829 2355 ,18 1844 879 391 1161 ,865 1205 2188 1128 1673 130 914 152219 962 640 1243 1068 ' 734 1112 1916' 1075 1538 157 652 124220 4971 2786 746 '859 624 964 1741 854 1273 193. 1470 130621 1383 1630 356 674 450 696 1150 617 923 .53 183 110722 60 909 338 592 392 615 1028 548 831 105 715 865 ,23 ,481 649 773 418 321 • 417 842 427 616 78 199 717
,,'
24 1344 468 151 348 263 371 702 343 513 65 183 566 ' ,
25 481 254 320 47 54 83 157 62 69 103 215 267 ,.
".,
",":.,-,
,:,~~·j4., ..
- -- - - - - - - - - -- - - ---- --- -----~
,j'
Table 3. (cont'd) Catch. at age data of the northwest Atlanticharp seal resulting from the weighting ofs~mples and application to the total catch.
Aga 1964 1965 1966 1967 1968 1969 1970 1971 - 1972 1973 1974 1975
0 270952 187284 225250 279858 159971 236532 220520 213349 119658 102744 118036 . 1406291 2502 7413 11558 10877 5980 20985 7844 7315 1990 1949 9604 96292 4418 3693 10383 5100 4521 2993 7535 2483 1289 2874 5629 57193 6364 4898 5183 1959 3069 3088 2714 2591 2272 2511 2123 32754 7429 6408 5414 2090 1823 2512 2644 1163 1573 2087 1752 19995 5364 7889 5880 3587 1682 2966 2387 1250 1604 3367 1945 20726 7702 7349 6086 4760 1711 2125 1687 764 . 1041 1243 '31114 1867 ..,7 4117 3121 5373 ·4341 2437 2479 1776 606 820 1299 985 1832 ,8 3419 1826 3543 3059 2498 2983 1637 542 752 1380 1200 11869 3189 1081 2018 2227 1705 2325 2045 776 659 1245 1283 740
10 4751 1524. 1928 1830 1757 1831 1958 837. 842 1038 954 . 69311 2597 655 2522 2282 1310 1666 1286 554 592 1392 732 67212 2544 2088 1756 1570 1031 1153 1332 606 593 1360 891 60513 2023 660 1639 1316 976 1295 1175 490 552 1224 825 646· ~
14 1988 1553 1825 1852 1233 1333 844 277 355 1064 685 529 ~
15 2799 1415 1548 1810 1082 1393 1211 335 410 1067 ·674 35316 2314 794 1580 1289 1037 991 914 297 304 909 686 35017 . 2887 512 1104 1964 903 1248 847 284 264 682 594 24718 4290 846 1619 1592 1237 1039 780 357 224 . 623 ·447 .32319 2331 961 1035 1608 1073 1042 703 251 158 . 526. 377 15920 142 340 1094 ~143 742 927 676 322 252 566 306 12721 2189 593 780 684 485 680 389 203 132 298 . 282 8822 1130 282 349 491 684 554 312 286 94 690 . 287 10623 1130 58 687 552 379 491 185 229 67 201 201 5924 1616 87 373 400 267 • 267 195 129 54· 151 219 9725 628 .. 87 256 342 139 310 91 222 ·40 171 210 74
··t
.:,'<
'. "~:
, I .. ~~
..... ..l'
~
. '..'
~~~~..
··<:i~e· '. . ,', ....-,"1,
----.,
. Table 4. Hunting m~ality levels of ths northweS~lantic harp . ,- ,"
ssal calc ted from cohort analysis assu ~ng M = 0.114. • •~
.." I..~
Age 1952 1953 1954 1955 1956 1957 1958 1959 1960 1961 1962 1963
0 0.644 0.585 0.634 0.844 0.989 0.499 0.524 0.733 0.557 0.570 0.759 1.1011 0.024 0.112 0.174 0.151· 0.088 0.150 0.210 0.140 0.209 0.034 0.146 . 0.0422 0.062 0.039 0.'095 0.078 0.052 0.087 0.159 0.072 0.130 0.018 0.218 0.0583 0.032 0.037 0.029 0.062 0.032 0.057 0.116 0.065 0.074 0.022 0.075 0.0674 0.032 0.019 0.047 0.044 0.033 0.046 0.119 0.058 0.112 0.027 0.096 0.0465 0.060 0.024 0.020 0.041 0.025 0.048 0.095 0.056 0.087 0.015 0.071 0.0516 0.066 0.033 0.030 0.025 0.023 0.039 0.112 0.048 0.089 0.021 ' 0.047 0.0557 0.084 0.019 0.047 . 0.027 0.016 0.038 0.086 . 0.056 0.072 0.024 0.053 0.0828 0.055 0.033 0.025 0.045 0.019 0.024 0.086 0.046 0.084 0.014 0.066 0.0929 0.066 0.022 0.031 0.022 0.030 0.028 0.051 0.045 0.067 0.018 0.060 0.103
10 0.049 0.030 0.029 0.038 0.016 0.048 0.065 0.028 0.068 0.025 0.036 0.11211 0.063 0.023 0.021 0.022 0.025 0.025 0.110 0.'032 0.041 0.016 0.035 0.14512 0.035 0.021 0.028 0.036 0.016 0.044 0.053 0.055 0.049 0.006 0.052 0.09113 0.014 0.030 0.041 0.020 0.024 0.025 0.096 0.027 0.089 0.008 _ 0.019 0.10314 0.038 0.010 0.039 0.028 0.014 0.042 0.053 0.054 0.043 0.016 0.033 0.068 .t:>
N15 0.093 0.036 0.022 0.050 .0.019 0.024 0.087 0.029 0.083 0.004 0.109 0.07016 0.058 0.051 0.054 0.019 0.038 0.034 0.047 0.050 0.046 0.014 0.018 0.13217 0~133 0.066 0.034 0.034 . 0.013 0.060 0.067 0.026 0.076 0.006 0.088 0.05918 0.140 0.061 0.022 0.042 0.026 0.020 0.117 0.035 0.038 0.006 0.024 0.09019 0.045 0.061 0.105 0.070 0.031 0.039 0.037 0.071 0.056 0.004 0.032 0.03720 0.383 0.159 0.085 . 0.090 0.049 0.048 0.071 0.019 0.102 0.008 0.043 0.07521 0.186 0.188 0.025 0.094 0.057 0.064 0.067 0.030 0 .. 024 0.-005 0.008 0.03822 0.014 0.163 0.050 0.049 0.066 0.094 0.115 0.038 0.047. 0.003 0.077 0.04423 0.023 0.188 0.185 0.073 0.031 0.085 0.163 0.059 0.050 0.005 0.• 005 0.09424 0.090 0.026 0.056 0.108 0.055 0.041 0.183 0.085 0.085 0.006 0.013. 0.01625 0.020 0.020 0.020 0.020 0.020 0.020 0.020 0.020 0.020 0.020 0.020 0.020
.- - - - --- --------~--_._--,
lable 4. (cont'd) Hunting mortality levels of the northwest Atlanticharp seal calculated from cohort analysis ' /assumlngM = 0.114.
Aqe 1964 1965 1966 1967 1968 1969 1970 1971 1972 1973 1974
0 1. 038 0.861 1. 019 1.039 0.528 0.826 0.809 0.900 0.448 0.426 0.4281 0.020 0.058 0.099. 0.101 0.045 0.108 '0.049 0.048 0.008 0.011 0.0582 0.032 0.034 0.098 0.053 0.051 0.026 0.047 0.018 0.010 0.026 0.0353 0.050 0.041 0.056 0.022 0.038 0.041 0.028 0.019 0.019 0.022 0.0224 0.074 0.059 0.053 0.027 0.024 0.036 0.041 0.014 0.013 0.020 0.0185 0.059 0.096 0.065 0.042 0.025 0.045 0.040 0.023 0.021 0.032 0.0216 0.113 0.097 0.091 0.063 0.023 0.036 0.030 0.015 0.022 0.019 0.0357 0.058 0.056 0.087 0.079 0.038 0.038 0.035 0.012 0.018 0.031 0.0178 0.079 0.030 0.076 0.060 0.055 0.054 0.030 0.012 '0.017 0.035 0.0339 0.083 0.030 0.039 0.057 0.040 0.060 0.044 0.016 0.017 0.033 0.037
10 0.156 0.048 0.062 0.041 0.054 0.050 0.061 0.02l. 0.020 0.030 0.02911 0.078 0.027 0.094 0.089 0.034 0.060 0.041 0.020 0.017 0.038 0.02512 0.10.6 0.076 0.084 0.071 0.048 0.035 0.057 0.023 0.025 0.045 0.02813 0.069 0.033 0.072 0.077 0.053 0.072 0.041 0.025 0.024 0.059 0.032 .t>14 0.073 0.063 0.109 0.099 0.087 0.087 0.056 0.012 0.021 0.052 0.039 w15 0.064 0.062 0.075 0.137 0.0"11 0~123 0.097 0.026 0.019 0.072 0.03916 0.069 0.021 0.984 0.076 0.099 0.078 0.101 0.029 0 •.027 0.048 0.05517 0.228 0.018 0.034 0.129 0.064 0.151 0.081 0.038 -0.029 '0;,071 0.03718 0.132 0.088 0.066 0.057 0.102 0.089 0.122 0.041 0.035 0.081 0.05619 0.175 0.036 0.135 0.079 0.046 0.107 0.073 0.048 0'.021 0.097 0.05920 0.005 0.032 0.048 0.197 0.044 0.046 0.086 0.040 0.057 0.088 0.069,
0.05321 0.158 0.023 0.087 0.035 0.109 0.047 0.023 0.031 0.019 0.080'22 0.045 0.025 0.016 0.066 0.041 0.160 0.025 0.019 0.017 0.'117 0.09523 0.067 0.003 0.072 0.028 0.061 0.034 0.067 0.021 0.005 0.040 0.04224 0.284 0.006 0.020 0.050 0.016 '0.051 0.016 0.056 0.006 0.013 0.05225 0.020 0.020 0.020 0.020 0.020 0.020 0.020 0.020 0.020 0.020 0.020
••
J ,
, 1iI;
-+ .
, '
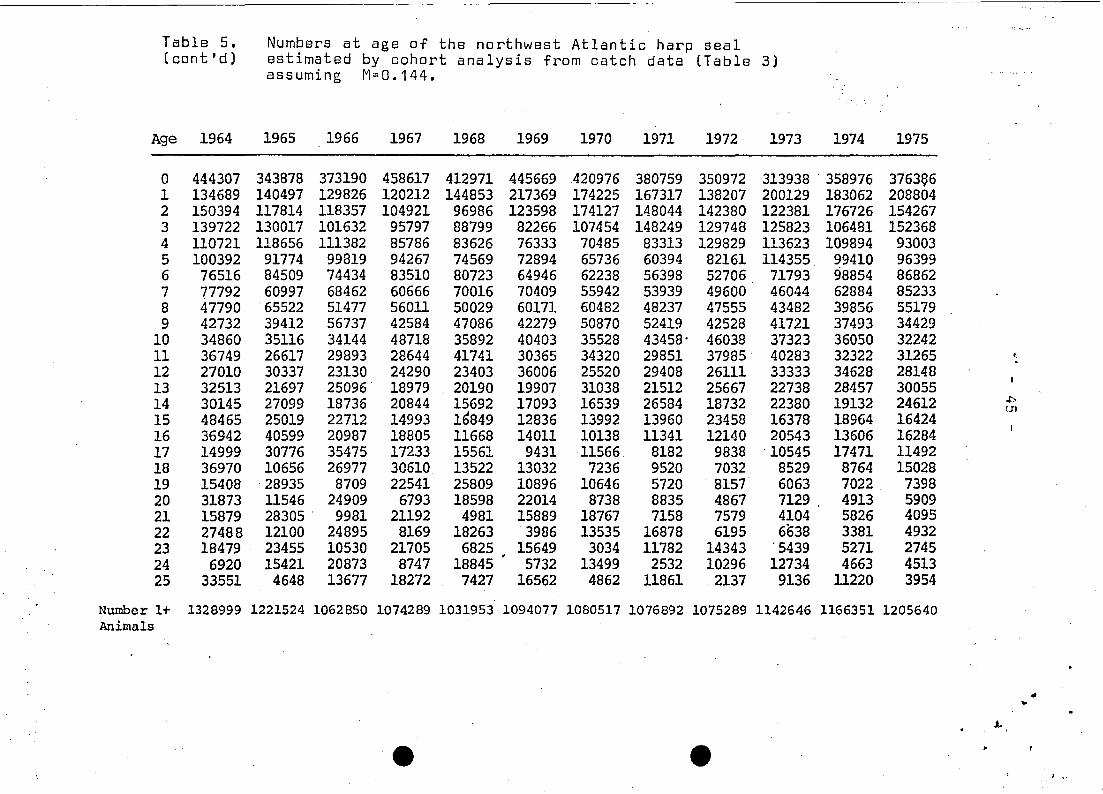
Table 5. Numbers at age of the northwest Atlantic harp seal(cont'd) estimated by cohort analysis from catch data (Table 3)
assuming M=O.144.
Age 1964 1965 1966 1967 1968 1969 1970 1971 1972 1973 1974 1975
0 444307 343878 373190 458617 412971 445669 420976 380759 350972 313938 . 358976 3763e61 134689 140497 129826 120212 144853 217369 174225 167317 138207 200129 183062 2088042 150394 117814 118357 104921 96986 123598 174127 148044 142380 122381 176726 1542673 139722 130017 101632 95797 88799 82266 107454 148249 129748 125823 106481 1523684 110721 118656 111382 85786 83626 76333 70485 83313 129829 113623 109894 930035 100392 91774 99819 94267 74569 72894 65736 60394 82161 114355 99410 963996 76516 84509 74434 83510 80723 64946 62238 56398 52706 71793 98854 868627 77792 60997 68462 60666 70016 70409 55942 53939 49600 46044 62884 852338 47790 65522 51477 56011 50029 60171 60482 48237 47555 43482 39856 551799 42732 39412 56737 42584 47086 42279 50870 52419 42528 41721 37493 34429
10 34860 35116 34144 48718 35892 40403 35528 43458- 46038 37323 36050 3224211 36749 26617 29893 28644 41741 30365 34320 29851 37985· 40283 32322 31265 0,
12 27010 30337 23130 24290 23403 36006 25520 29408 26111 33333 34628 2814813 32513 21697 25096 18979 20190 19907 31038 21512 25667 22738 28457 3005514 30145 27099 18736 20844 15692 17093 16539 26584 18732 22380 19132 24612 ~
I.JJ
15 48465 25019 22712 14993 16849 12836 13992 13960 23458 16378 18964 1642416 36942 40599 20987 18805 11668 14011 10138 11341 12140 20543 13606 1628417 14999 30776 35475 17233 15561 9431 11566 8182 9838 ·10545 17471 1149218 36970 10656 26977 30610 13522 13032 7236 9520 7032 8529 8764 1502819 15408 ·28935 8709 22541 25809 10896 10646 5720 8157· 6063 7022 739820 31873 11546 24909 6793 18598 22014 8738 8835 4867 7129 4913 590921 15879 28305 . 9981 21192 4981 15889 18767 7158 7579 4104 5826 409522 27488 12100 24895 8169 18263 3986 13535 16878 6195 6638 3381 493223 18479 23455 10530 21705 6825 15649 3034 11782 14343 '5439 5271 274524 6920 15421 20873 8747 18845 5732 13499 2532 10296 12734 4663 451325 33551 4648 13677 18272 7427 16562 4862 11861 2137 9136 11220 3954
Number 1+ 1328999 1221524 1062850 1074289 1031953 1094077 1080517 1076892 1075289 1142646 1166351 1205640Anima1s
-....
e e •! .J;'; le 6". ' l'roJected papulations of' mallJ tll,U rerl'a1e northwest At1antic harp s ea ls, and ag~ ~pecific sex ratlos
,.,,~
starting from 1Q61. The sex ratio of the 1arge vesse1 catch was determined empirical1y, whi1e thesex ratio of the landsmen catch was considered to be that of the population; ,A maturit.Y ogive was ...applied to calcu1ate the breedin~ stock size. •
Age 1962 1963 1964" 1965. 1966 ' 1967~llles FE'.J:U1es % F Males Fcmu1es% F' Males Fernales % F Males Ferna1es % F Males Fema1es % F Males Fenu1es % F
1 107566 107566 50.00 87866 87866 50.00 67345 67345 50.00 70249 70249 50.00 64913 64913 50.00 60106 60106 50.002 93245 93245 50.00 84090 84090 49.~9 75864 75864 49.99 59040 59033 50.00 . 59649 59646 50.00 ' 53005 52998 50.003 71465 71465 50.00 68484 68484 49.99 71746 71743 49.99 65837 65826 ·50.00 51174 51156 50.00 48815 48792. ,49.994 55941 55956 50.01 59542 59660 50.05 57990 58204 50.09 . 61260 61415 . 50.06 56654 56813 ' 50.07 43342 43554 50.125 55729 55765 50.02 45695 45925 50.13 51154 51482 50.16 ' 48383 49042 50.34 51829 52381 50.26 47999 48638 50.336 34253 34273 50.01' 46552 46811 50.14 39055 -, 39541 ,50.31, .'43162 43901 ,50.42 '39434 41037 51.00 ' 43315 44667 50.777 31154 31185 50.02 29235 29384 50.13 39578 40307 50.46 31089 32562 51.16 34849 36819 .. 51.37 ,32020 34604 51.948' 26045 26090 50.04 26444 26617 50.16 ,24131 '24950 50.83 33258 34557 50.96 , 26205 28032 51.68 28084 31281 52.689 27458 27490 50.03 21821 22047 50.26 21564 22528 , 51.09 19768 21149 51.69 ' 28845 3016751.12 21267 24113 53.14
10 20400 20429 50.04 23125 23352 50.24 ' 17590 18565 51.35 17573 19086 52.06 17109 ' 18515 ' 51.97 . 24588 27351 51.7311 23260 23321 50.07, 17587 ' 17682 50.14 18479 19564' 51.43 13174 15090 53.39 14830 16632 52.86 14112 16034 53.1912 22148 ' 22183 ,50.04 20079 ,20227 50.18 ' 13602 14546 51.68 15135 16625 52.35 11444 13239 53.64 11707 14220 54.8513 33214 33226 50.01 18793 18976 ' 50.24 16379,17136,51.13 10806, 12170,52.97 ,12332 14297 53.69 9128 11401 55.5314 25747 ' 25761 50.01 " 29103, 29182 '50.07 ·15131 15995 51.39 13568 14635 , 51.89 ' 9376 10583 53.02 10012 12355 55.2415 12019 12041 50.04 . 22254 '22371 50.13 24291 25049 50.77 ' 12470 13631 52.22 11245 12649 52.94, 7255 9002 55.3716 25071 25074 '50.00 9657 9816 ,50.41 18541 19161 50.82 20170 21502 5;1.60
"10368 11763 ,,53.15 9101 10904 54.51
17' 11583 ' 11601 50.04 21998 22048 50.05 7036 7840 52.71 15309 16386 51:70 17583 '18950 51.87 8804 100'39 54.68 -t:>18 21264 21279 50.02 9478 ' 9633 50.41 18526 19012 50.65 ,4737 6109 56.33 13406 '14455 51.88 15022 16635 '52.55 n19 11107 11114 50.02 18551 18622 50.10 7740 8174 51. 36 14202 1568652.48 " 3744 ~ 5241 58.33 10937 12546 53.4320 18711 18722 50.01 9606, 9659 50.14 15978 16262 50.44 , 5664 6575 53.72 12143 13738 53.08 2703, 4434 62.1321 ' 12238 12245 50.00 16010 16124 50.18 7973 8241 50.83 14197 14449' 50.44 4870 ,5772 54.24 10152 12010 54.1922 5176 5176 50.00 ' 10835 10853 50.04 " 13767 14077 50.56 5931 6695 53.02 ,12334 12741 50.81 3855' 4977 56.3523 21523 21531 50.01 4287 4334 50.27 I 9271 9434 50.44 11677 12217 51.13 , 5131 5904 53.50 ,10798 11279 51.0924 8100 , 8103 50.01 19177 ,19184 50.01 '3502 3654 ,51.06 76f.6' , ' 8073. 51.29 ,10396 10876 51.13 . 4148 . 5114 55.222S 5771 5771 50.00 7143 7158 50.05 16850 16954 50.15 ' 2249 2778 55.26 6805 7168 51.30 9038 9625 51.57
',' . - ...Fraction
,NIes in catch 0.550 0.550 0.65 ' , 0.65 0.75 0.75
Fr<lcti~nfcr.-.:l1es'" 0.500 0.501 0.505 ' 0.509 0.511 0.517
Fraction, fe.lna1es inbreedin<;r population 0.500 0.502 0.508 0.516 0.519, ' 0.528
Breedinq populationsize 424561 404631. '384887 356267 350906 338231
Table 6. Projected population:3 cf male and 'femölle northwest Atlantic h'arp seals, and age specific sex ratioslcont.'d) , starting from 1961. The sex ratip of the large 'yessel:catch was determined empirically, while tne,
sex ratio of the landsmen catch was con~fdered to be that of the population. A maturity ogive wasdpplied to calculate the breeding stock size.
, .Age 1968 , 1969 ' 1970 1971 ' 1972 ' 1973
HaIes Feffi3.les % F Males Fema1es % F Males Fema1es %F Males Ferra1es %F Males Ferra1es % F HaIes Fema1es %F
1 72427 72427 50.00 ,108685 108685 50.00 87113 87113 50.00 83659 83659 50:00 69104 69104 50.00 100065 100065 50.002 48961 ,48947 50.00 ' ',62195, 62189 50.00 88146 ,88097 49.99 74493 74467'49.99 71782 71766 49.99 61388 61369 49.993 45115 45081 49.98 41856 . 41826 49.98 54241 54217 ,49.99 75554 . 75461 49.97 65503 65458 49.98 63512 63453 ,49.984 42689 42716 50.02 38904 39078,' 50.1I . '35964 ' 36097 '50.09 ' 47232 47291 50.03 65344 66365 50.01, 58045 .57983 49.975 37710 38025 50.21 37241 ' 37480,' 50.16" 33530 '.. 33932 50.30 30882 ,31225 ,50.28 41646 ,41780 50.08 58486 58512 , 50.016 41074 42066 50.60 32786 " '33422 50;48' 31703 32466 50.59 28808 29407 50.51 27004 27429 50.39 36800 36924, 50.087 36187 38221 51.37 35747' 37044 50.89 , 28074 2n08 50.99 27426 ' 28433 ' 50.90 25353 25990 50.62, ,23704 '24104 50.428 26253 29459 52.88, 30835 33574 ' 52~L3 ,30442 ' 32416 51.57 ,24019 25621 51.61 24171 25194 51.04 : 22360 : 22992 50.709 23353 26994, 53.62: 21837, . 25840 " 54.20 ,:25606', : 29348' 53.40 ,,26296 28432 51.95 21159 22707. 51.76 ' '21296 22256 51.10
10 17761 20814 53.96 19742 '" 23794 54.65 "17981, 22599 55:69 '21707 25632 ' 54.15 '23025 25198 52.25 :' '18723 ' 20137 ,51. 8211 20931 22946 52.30 14717 18273 55.39 ,16476 20825 ,.55.83 14976 , ,19610 56.70 18916 22666 54.51 20370 22341, 52.3112 11272 13663 54.79 17831 ' 20253 53:18' 12087 15944 56.88~~14003 ,18214 56.54 '13068 "17356 '57.05' 16580 19931 54.5913 9546 12238 56.18 ' 9417 11993 ,56.02 . 15182' 17826' 54.00 10012 ' 13897 58.13 12164 ' .16107 56.97 ',11389 15231, 57.2214 7402 9783 56.93 ' 7882 ,10761 57.72- 7563 '10449 ,58.01 12864 15615 54.83 8680 12268 58.56, ' 10713 14235 57.06 .t>15 7864 10499 57.17 5790 8541 59.60 6137 9373 60.43, 6263 9110 59.26 11339 13854 54.99 7465 :' 10656 58.81 ' 'J
16 5412 7536 58.20 6317 9188 59.26 '4245' 7367 63.44,' '4769 8067 ,62.85 5411 8043 59.78 ' 9926 12199 55.1417 7378 9362 ' 55.93 4154 6556 61.2i 4988 ' '8011 61.63 3265 " , 6339 66.00 4092 7128 63.53 4723 : 7094 60.,0318 6222 8509 57.76 .' 6009 ' 8195 57.69 ' 2872 ' 5632 66.23 3974 ' 6924 63.54 2755 5592 66.99 3485 ' ' 6203 64.0319 12444 14434 53.70 4720 7419 61.12 4653 7144 60.56 2093 4849 69.85 3334 6109 64.70 .. ,2266 ,4795 67.9120 8781 10783 55.13 10383 ' 1272755.07 '3488 6464 '64.96 3741 6203 , 62.38 1722 4276' 71.30 .. , ' 2887 • ,5355 64.9B21 1741 3644 67.67 7331 9527 56.51 8615 11224 56.58 2731 55B9 67.18 3148 5472 63.48 1248 3540 73.9522 8651 10536 54.91 ,1229 ~ ,3181 72.13 6074 8395' 58.02 .. ,
7457 9923 57.09' ' 2317 4947 68.10 ' 2642 '4709 ,64.0623 3143 4315 57.86 7261 9302' 56.16 708 2760 79.59 5230 7422 58.66 6468 8815 57.68 1954 4314 68.8324 9292 9932 51.66 2546 3801 59.89 6129 8236 57.33 531 2412 81.98 4521 6590 59.31 5728 7825 57.7425 3473 4447 56.15 8108 8829 52.13 2081 3357 6~.74 5354 7302 ' 57.70 391 2134 84.54 3964 ' 5819 59.48
, Fractionre1es in catch 0.75 0.86 0.86 0.86 O~86 0.86
Fraction,ferra1es ' 0.520 0.521 0.524 0.524 0.522 0.518
Ftaction fcma1es i.I",
brecdinq population .. 0.534 0.541' 0.549, 0.549 , 0.545' 0.538
Breeding papulatiansize 321977 315332 302092 296103 ' 294071 299838,
t1..J-
•
e e •T.3bls G. Projscted popul.3tions of male and femals northwest Atlantic harp seals,
" ..'
(cont'd)and age 'specific, sex
ratios starting from 1961. The sex ratio of the large 'vessel ,catch, was determined empiricalley. " ...whils the sex ratio of the landsmen catch was considered,tp be that of the popula~ion.' A matu· ~
rity ogive was applied to calculate the breeding stock'size. ..']\ge 1974 1'175 . 1976 1977
lules Ferrales % F l1a1es I"ema1es % F Males Fema1es '% F Males Fema1es % F
1 91531 91531. 50.00 104402 104402 50.00 73598 "73598 50.00 79888 79877 '50.002 88545 88539 50.00 77800 77733 49.98 88916 ' 88760 49.96 61790 . 61619 49.933 53788 53656 ,49.99 76733 ·76697 49.99 66909 66743 49.94 77242 77002 49.924 55636 55739' 50.05 46964 47090 50.07 66984 66982 50.00 58269 58097 49.935 50844 51096 50.12 48811 49142 50.17 40965 41165 '50.12 '58725 58724 50.006 50507 51322 50.40 44389 44987 50.33 42565 ' 42978 :50.24 : 35969 36176 50.147 "32220 32616 50.30 ' 43466 44838 50.78 38682 : 39393.50.46 ,37512 37898 50.268 20512 21158 50.77 28255 28796 50.47 37919 39231" 50.85 34100 34785 50.509 19217 20199 51.25, 17704 18502 51.10 '. 24628 25214 . 50'.59 : 33440 34653 50;89' •
10 18425 19489 51.40 16424 17703 51.87 15390 16253 ' 51. 37 21779 22345 50.6411 16219 17666 '52.14 15938 17117 51.78 . 14240 . 15459 52.05 13449 14233 51.42 :12 17536 19515' 52.67 14087 15553 52.47 13846' 15045 52.08, 12507 13612 52.12
. 13 14209 17335, 54.95 15151 17185 53.15 12256 ' 13648 52.69 ' ,12212 13299 '52.1314 9610 13212 57.89 12215 15261 55.54 13179 15095 53;39
, . 10808 12083 ' 52.7815 9100 12352 57.58 8190 11617 58.65 10625 13417 55.81 11638 13365 53.45 ~
16 6166 9192 59.85 7734 '10860 58.41 7111 10247 59.04 .9287 11792 55.94'Ql
17 8431 10620 . 55.74 5135 8011 60.94. 6710 9567 58.78 ' ' .6265 9084 59.1818 3892 6134 61.18 7192 9323 . 56.45 " 4436 7073.' 61.46 5897 8466 58.94 .19 2815 5356 65.55 3212. 5370 62.57 ,6248 8200 56.76 . 3900 6264 61.6320 1746 ' 4155 70.42 2291 4(j94 67.20 2774 4742 63.10 5522 7270 56.8321 2273 4651 67.17 1377 3640 72.56 . 1972 .. 4148 67.78 2418· 4176 63.3322 952 3093 76.47 1869 4080 68.58 1175 ' '3222 73.28 1743 3689 67.9123 2053 3982 65.99 682 2695 79.80 1601 ' 361.2 69.29 1027 2862 73;59.24 1612 3828 70.37 : 1710 3511" 67.25 569 2392 80.80 1413 3211 69.4525 5012 6966 58.16 1286 3391 72.51 1466 3106 67.94 497 2123 81.04
Fractionmales in catc:h ' 0.86 '1. 86 0.86 0.86
FracHonfemales 0.517 0.516 0.514 0.512
fracHon females inbreeding population 0•.536 " 0.534 0.529 , 0.524
" ..Breeding populationsize 302165 305609 311502 319914
- 49 -
1.0.r::...Ö •Q. 0.9 • •ao ?e-. --. • •c • .-~ 0.8 •0 • •:=E
g 0.7 /.onca> 0.6;; •:=E .{ •-0c.~-...~u.
0 2 4 6 8 10 12 14 16 18 20 22 24Age (Yeors)
Figure 1. The fractian af males in the Narwegiancatch af maulting narthwest Atlanticharp seals fram 1969 ta 1974 (fram Benjaminsen and 0ritsland MS 1975)
•
•• •
- 50 -
100
•
•
I••
1952OI...-'L-.I.--L.--'--J--L.......L-.L..-L-.l.--L.--1--J--L-...L-.L..-L.-L---'---'---'-....L.-...........
155 '60 165 170 175Yeor
" '~'...-~~ - .~, '~.',; <' •• ,. ~ .•
Figure 2. The percentage landsmen hunt of ane year andand older harp seals from 1952 to 1975.
. .
~' -• •
•
-: 51 -
,., .
,,' .\.'~', ..e-"./. ......, .......
Curran's Survey EstimateFor Front Herd ,Only
I .f\ Estimates Based on .(\ ./ Virt~ol· Populotion Aoo)y",
/lVA l\/\ Al .. I" I 1977 Estimates UsingV'<-'~ 1\;'\ Sergeants Lotest Moturity0, " / Data
'JA , ' I,' A",l'ro,o"';' . \1 '.
/
0-0 °.....0 0-0........
Projected Estimotes Using ~_--Sex Ratio Dato a 0 FiledMaturity Schedule MeonAge 5.5
c:o
6
~2Cl.
52...lt),
'7517019550l.-l--L.-L.....L..-1-.J.--..L....J.......L-I1-.L--..L....J......l-J:.......L..:-..L....L....L..J.--L.-L.....L...1-.L-l
160 '65 ~.
Figure 3. A. comparison of'three diffe~ent methodsof estimating pupproduction.
•
•
•
..
- 52 -
1.0
Cf)CI)
c:IIe 0.8CI)
LL.
>. .-
.5!-c~ 0.4oQ.Cl
.g 0.2;uc:II-LL.
Age
Figure 4. A shifting maturity ogive in relation topopulation size. The ogive is constrainedin the model so it cannot shift further tothe 1eft than the 1.2 x 10- 6 ogive althoughthe population may continue to decline.
.. ••
't' •~
53 .oe.- - •
12Population Size 2+ Seals x10-6
Figure 5. The decline in reproductive successfulnorthwest Atlantic female harp seals inrelation to population size.
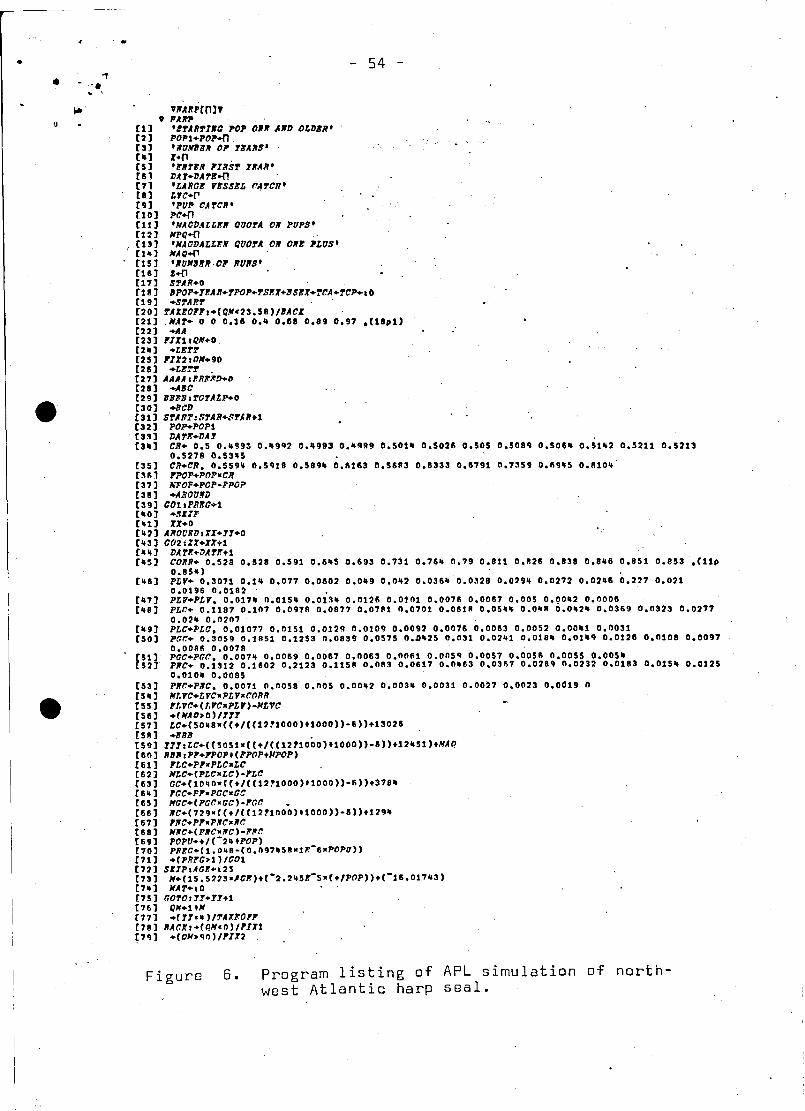
•
• l'---.
~ ,
54 -
VIrARl'[O]VV PARI'
[1] '8~AR~r.(J POP Olltt AIID OLD8R'[2] 1'01'1.1'01"+0 ,(S] 'IIUN3BR 0' 78ARS'('] l~ .(5] 'KlrfKR prRS~ 71tAR'(61 DA 7+DA re+n(11 'URCB rBSSBL "-,"CR'(I] Lrc+r(9] 'PUP CA~CR'
[10] PC.n(11 J 'NA(;DALL1t1l QUOrA Oll PUPS'(12J "PQ+O(13] 'NAGDALLBR QUOtA OR OIlB PLUS'(1'1] ....AQ+f'I(15] 'IIUMBER,C' RURS'(16] 1+0[17] S'J'AR+O[18] !POp.71:AlI."pop.rSKX.BsrrX.,/CA.rcp., 0(19] .S'/AR'r[20] tAXBO".+(QN423.5R)/!ACX[21] ,NAr. 0 0 0.16 0 •• 0.68 0.89 0.97 .(18pl)[22J .AA[23] UXllQN.O[211] .r.Bf'V(25] UX2.tlN.90[26] .LBrt .[27] AAAA.BR1t~D+O
(28] .ABC[29] BBlJB.rOf'ALP+O[30] .BCD(31J SrART:S'/AR+S'rloRtl[32] 1'01'.1'01'1[33] DArrr.DA7[311] CR. 0.5 0.11993 0.1I9~2 0.11993 0.11999 0.50111 0.5025 0.505 0.508~ 0.50611 0.51112 0.5211 0.5213
0.527R 0.53115[35] CR.CR. 0.55911 0.5~18 0.58911 0.5163 0.5683 0.6333 0.6791 0.7359 0.69115 0.Rl011[351 PPOP.POP-CR[37] KPOF.POp-,POP[38] .AllOUltD(39] G01.PDrrC.l[110] +SXI1'[111] XX+O[112] AROURD.xr.77+0[113] C02iZl.ll+1[1111] DA 2"1l'+ZlA rJrt 1[115] CORR. 0.528 0.528 0.591 0.6115 0.693 0.731 0.7611 0.79 0.811 0.826 0.838 0.8116 0.851 0.853 .(11p
0.85.)[.6] PLY. 0.3071 0.111 0.077 0.0602 0.0119 0.0112 0.03611 '0.0328 0.02911 0.0272 0.02116 0.227 0.021
0.0196 0.0182 •[117] PLV.PLr. 0.01711 0.01511 0.01311 0.0128 0.0101 0.0076 0.0067 0.005 0.00112 0.0006[118] PLr.. 0.1187 0.107 0.0978 0.0877 0.0781 0.0701 0.0618 0.051111 O.OIlR 0.011211 0.0369 0.0323 0.0277
0.0211 0.0207[119] PLC.PLC. 0.01077 0.0151 0.0129 0.0109 0.0092 0.0076 0.0063 0.0052 0.00111 0.0031[50] pcr.. 0.3059 0.1851 0.1253 0.0839 0,0575 0.D1I25 0.031 0.02111 0.01811 0.0111~ 0.0126 0,0108 0.0097
0.00116 0.0078
f51] PCC+PCC. 0.007. 0.0069 0.0067 0.0063 0.0061 0.005~ 0.0057 0.0058 0.0055 0.0051152]' PIrC+ 0.1312 0.1602 0.2123 0.1158 0.083 0.0617 0.01163 0.0367 0.0289 0.0232 0.0183 0.01511 0.0125
0.010. 0.0085[53] PIlr.+PlIC. 0.0071 0,0058 0.005 0.00112 0.003110.0031 0.0027 0.0023 0.0019 0[SII] Nr.rC+LYC-PLY-CtlRR[55] pr.rc+(~YC-pLr)-NLVC
[56] +(NAtl»0)/711 ,[57] LC+(501l8_«t/«1211000)fl000»-6»t13026[58] .BBB .[59] 717.LC+«5051-«t/«1211000)fl000»-6»t121151).MAtl[60] RBB.PP+PPOpf(FPOPtNPOp)[61] ,r,C.pF-PLC-LC[62] NLC+(PLC-LC)-PLC[63] CC+(10~0-{{t/«1211000)fl000»-5»t37811
[611] FCC.PP-FCC-CC[65] MCC+(PCC-CC)-,CC •[66] IIC+(729-«t/«1211000)f,000»-6».,29[67] P~C.PF-P~C-W~
[68] NWC+{PIrC-NC)-'Nr.[69] PopU.t/(-2~tPOP)[70J PREC+(1,O~8-(0.0971158-1r.-6.POPU»
[71J +(PREC>I)/COl[72] sxrp:Acr.+,25[73] N.(15.5'-'3.ACE)t{-2.2.5rr-5-(+/Ptlp»t(-16.017~3)
[711] "A'/+'O[75] GOro.ll+17tl[76] QN.1tflf[77] .(II.~)/rAX'OF'
[78] BACX •• (QNcO)/prXl~7~1 .(DH»~0)/prX2
Figure 6. Program listing of APL simulation of northwest Atlantic harp seal.
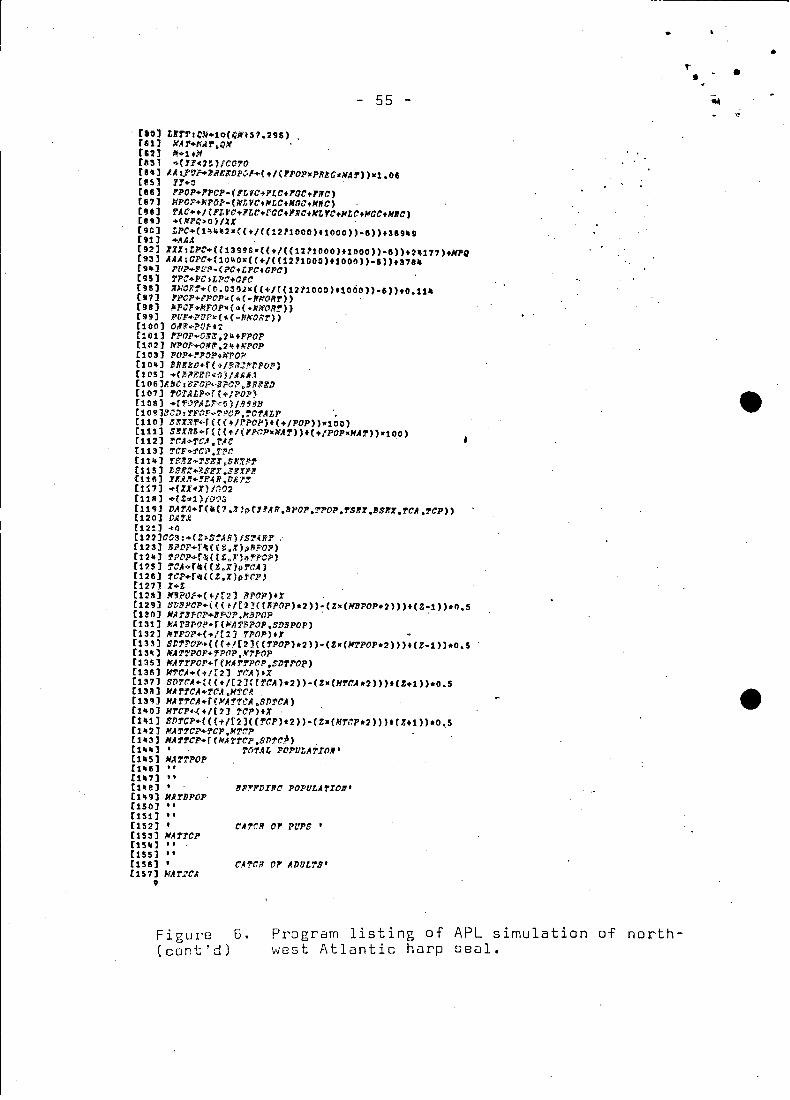
55
[80] tKr~ICM+1Q(Q~t51.29S) .fell N.4J'+h·/if'.Ql'f[12] 1if~1+#
[8s1 4(IT<2~)/C010
Ce,] AAv~Ur+JRF.~OP('P+(+/('POP.PR~CxNAf'».l.oe[es1 lY+O .[es] rpop+rpOP-(~LVC+?LC+'CC+'WC)[67] MPOP~NPO~-(Nr.VC+~LC+MaC+NRC)
(ee] f'AC+./(,r.rC+PLC+PCC+'NC+NLrC+MLC+~CC+NWC)[89] +(~P~>O)/XX
[ge] LPC+(1~__ 2.«+/«1211000)'10CO»-&»+3S9_9[91] +AA..t[92] XXIILPC+«139gSx«f/«1211000)t1000»-S»+2'177),NPQ[93] AAAICPC+(10_0X«f/«1211DOO)'1000»_S»+37e,[9_J PU~+P8~-(?C+LPC+CPC)
[95] ~PC+PCtL7'~+GPC
[98] RMON~+(O.03~lx«'/«12fl0CO)'1000»_&»+0.11'[97J ~PCP+?PCP~(~(-'NORf'»
[98] ~POF+NFOP.(~(-NNOR~»[99] p~p+PU?r(~(-NKORf'})
[100] OIl'!:...P<]?':.[101] FPOP+vN~.2-tFPOP[102] MPO?+ON~.2_t~POP
[103] POP+PPOPt~POP
[10_] BREED.f(+/p.N~rrpOP)
[105] +(lJftEE[)~G"AfjA.~
[10S]I.BCIBFaF~E?O?SRgED
[107J rOTALP~r(+IPO~~[1011] +{f'OT'Ar,T'<:!J)f,H.~B
[10~JBCDITPapY~FCP.~OfALP •[UO] SU.~f.·r« (+/J'l"Oi"j f (+/1'OP».100)[111] S~XHS+i{({'/(,pap'HAf»f(+:POP.HAf'}).100)[U2J 1'CA+'!'O .'!'.CC[113J TCF+TCP.TPr.[11~] re~X~TS~X.S~X~~[115J ESE~+~$EX.SKXPECl 141] YT.Jlll+!l:.'(R .e,,!:![117J +(lX<X}/~'2[UR] ... ( Z"1 )Ia~l';
(119) DAfA.r(~(1.X~p(ltAR.BPOP.fPOP.TSKX.BSKr.TCA.TCP»[120J DJIf.tfun -..,1[122]C031+(Z'S!ARjIS~4RP
[123J BPOF+r~«t.X)p8PO?)
[12~] fPCpyr~«~.X}~~FOP)
[1'5] ~CA.rG({t.K'pfr.A)[126] 1'cp.r*{(Z.X)pfrp)[127J 1'+%[1211] .~Pop+(+/r2J BPOP).X[129] 5[;'81'OP+( « '~l[2 H (lIJ1'OP) *2»· (Zx (HBPOP*2)})f (Z-l) )*1). 5[130] N.4r'8POl'+1!'N!P.Hlil'OP· .[131] kATBPOP.fCMATEPOP.SDBPOP)[132] Nrpop+(+:r~) TPOP)+X[133] SC'J'F'OP·.{ ({ ./[2 J( (1'POP) *2 ) )-( Zx{NTP01'*2» )t( Z-l) )*0. 5[13~] NATTPOP+TPOP.M'J'POP[1351 KA'J'TPoP+rCMA'J'TPOP.SDTPOp)(13~] MTCA+(+/[2] YCA)tX(137] SDrCA+{«+/[2]«fCA).2»-(Z.(Nf'CA*2»).{Z+1»*0.5[13I1J MA'!'fCA+'U:A .M'i'CA[13q] HA r1'CA.r(M"'f'1'CA .SM.'CA)[1'0] fif1'CP-.J..+/[2] rCP)f]f[1'1] snTe!'+ ( ({ +/[2]( CTCP)t2»- (Z. (HrCP*2») t (ZU» *0,5[1' 2] HA TTCP-·TCP .M'!CP •[1_3] NATTCP+f(MA1'!CP.SDTCP}[1_~] , TOTAL POPULA'J'I06'[H5] NATTPOP(1_11] oe
[1'7] "[1_8] , ~PFFDI~C POPULATI06'[1'9] IIA1'B1'01'[150J "[151] ..[152] • CA1'r.lI 01' pt/ps '(153] lIAT'fCP[15_] "(155] ..[1511] • C'A'J'ClI 01' ADULTS'[157] MA'!:CA,
TI •
•
Figure 6.(cont'd)
Program listing of APL simulation of northwest Atlantic harp seal.
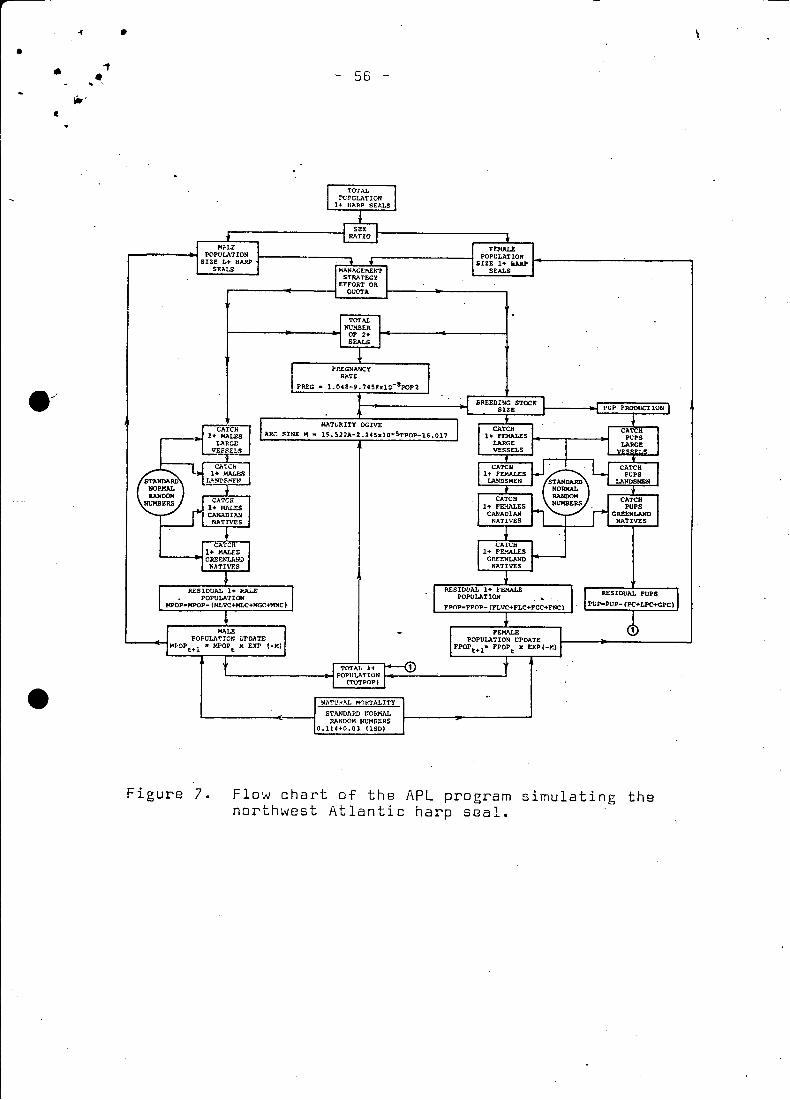
NATt'R.:..L MORTALITY
STANDARD nORMALRANDOH NUMBERS
0.114"'0.03 USD)
MAT1,JRITY OGIVE
M - lS.522,A-2.24SxlO-STPOP-16.017
Flow chart of the APL pro gram simulating thenorthwest Atlantic harp seal.
Figure 7.
.. ••
• ..,56•..
jip'
c
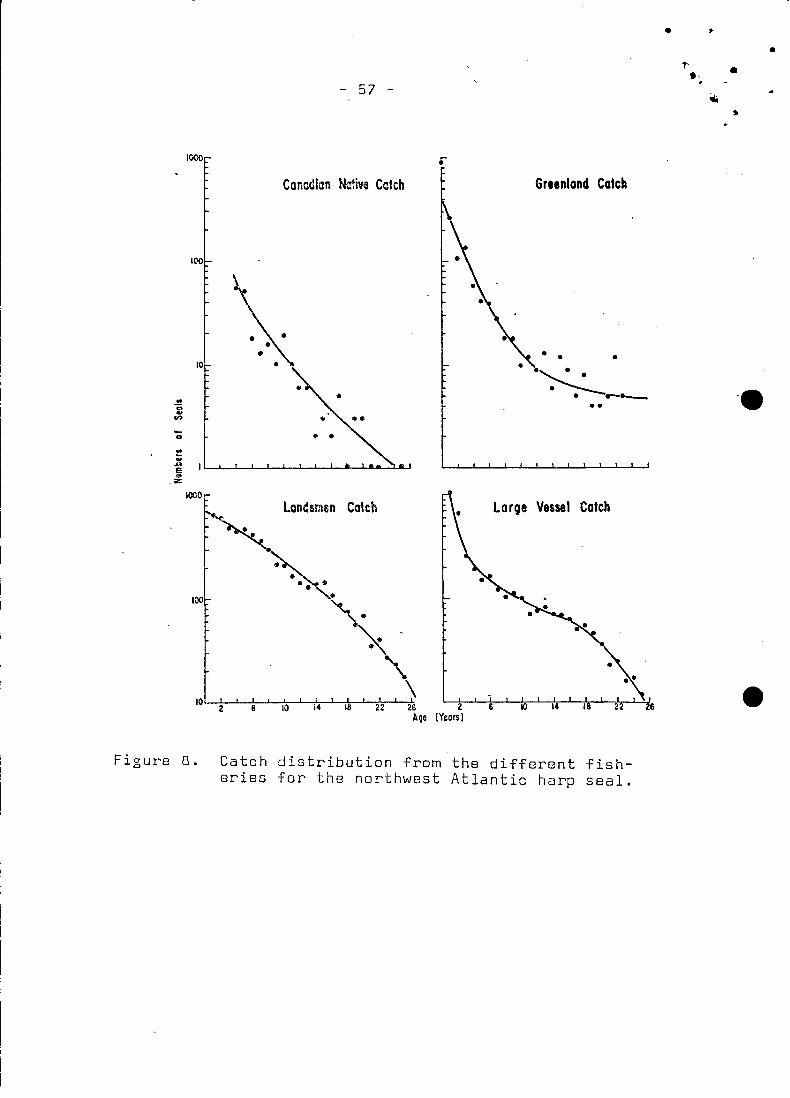
1000
• ~
•T- •.'.- 57 -
~
s
Canocllan Nctive Catch Greenlond Colch
...............~--••
100
10
..~CI>
o~..,.E..
. Z
• • •
·e
"-\10 I I I ! I I I
I)2 I) 10 i4 18 22 26 2Age (Yeors)
IOOO~
100
lcndsmsn Cotcb Large Vessel Cotch
Figure 8. Catch distribution from the different fisheries for the northw8st Atlantic harp seal.
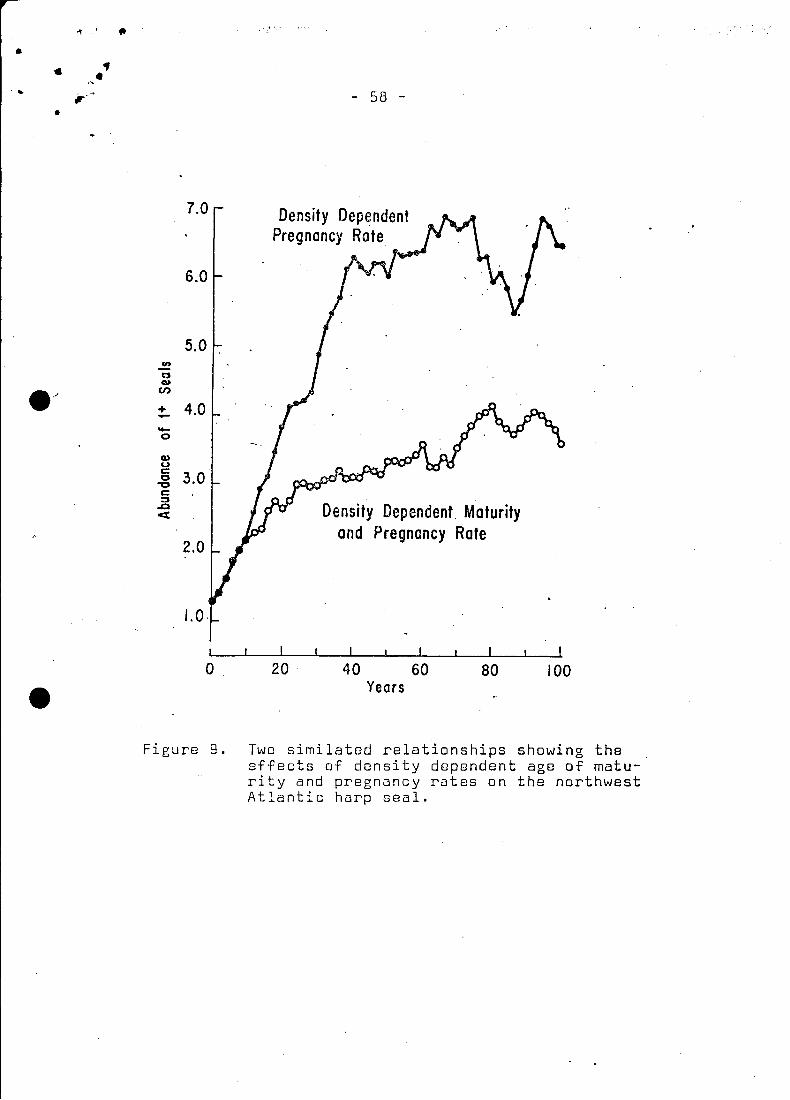
..,. ft
• .. ••.-.....,.~
•- 58 -
Density DependentPregnancy Rate
7.0
6.0
5.0CI)
0G.J
e·' V>
+ 4.0--0cuuc: 3.00
"l;Jc:~
..c Density Dependent. Moturity<C
2.0ond Pregnancy Rate
I. o·
o 20 40 60Years
80 100
Figura 9. Two similated relationships showing theaffects of density depsndent age of maturity and pregnancy rates on the northwestAtlantic harp saal.
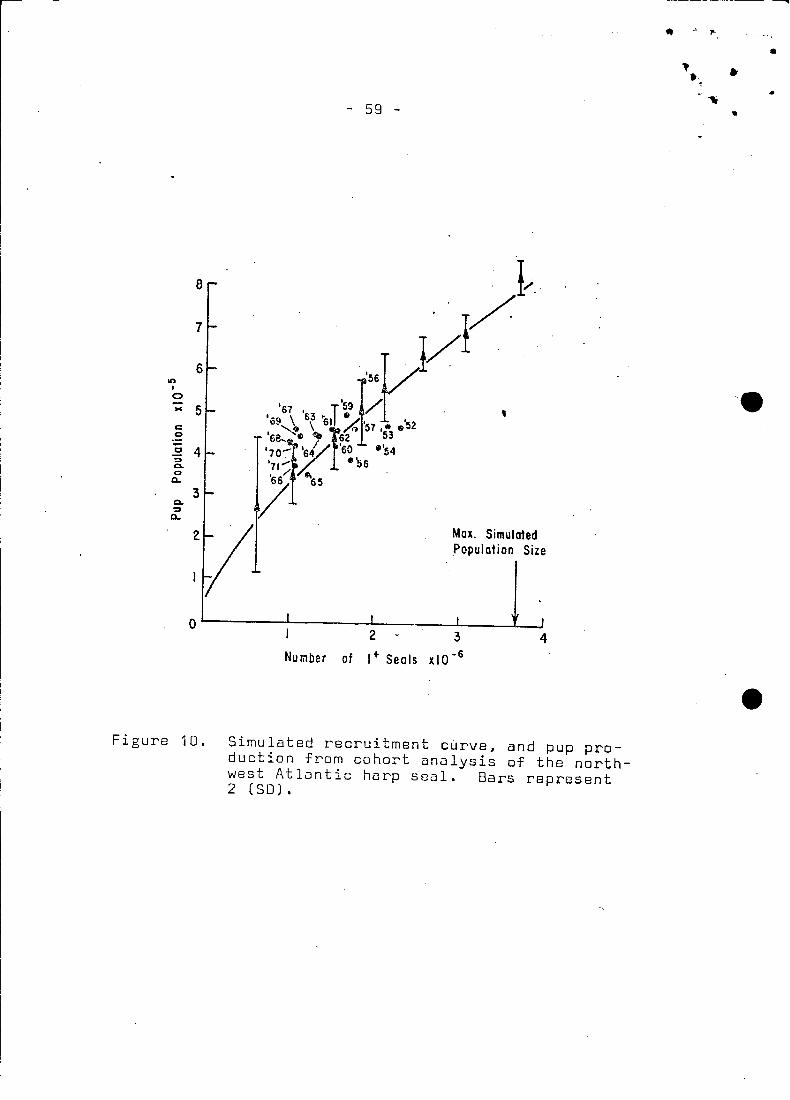
O~--_---I_----'------L-__......r...---J
2 3 4
Number of 1+ Seals 1l10-6
Figure 10. Simulated recruitment curv8, and pup production from cohort analysis of the northwest Atlantic harp seal. Bars represent2 (SO).
..,
~.. ,..
•l' •.'
~
."•
,
Mall. SimulatedPopulation Size
3
co-~ 40o
Q..
- 59 -
M 5
6
7
8
onI
o
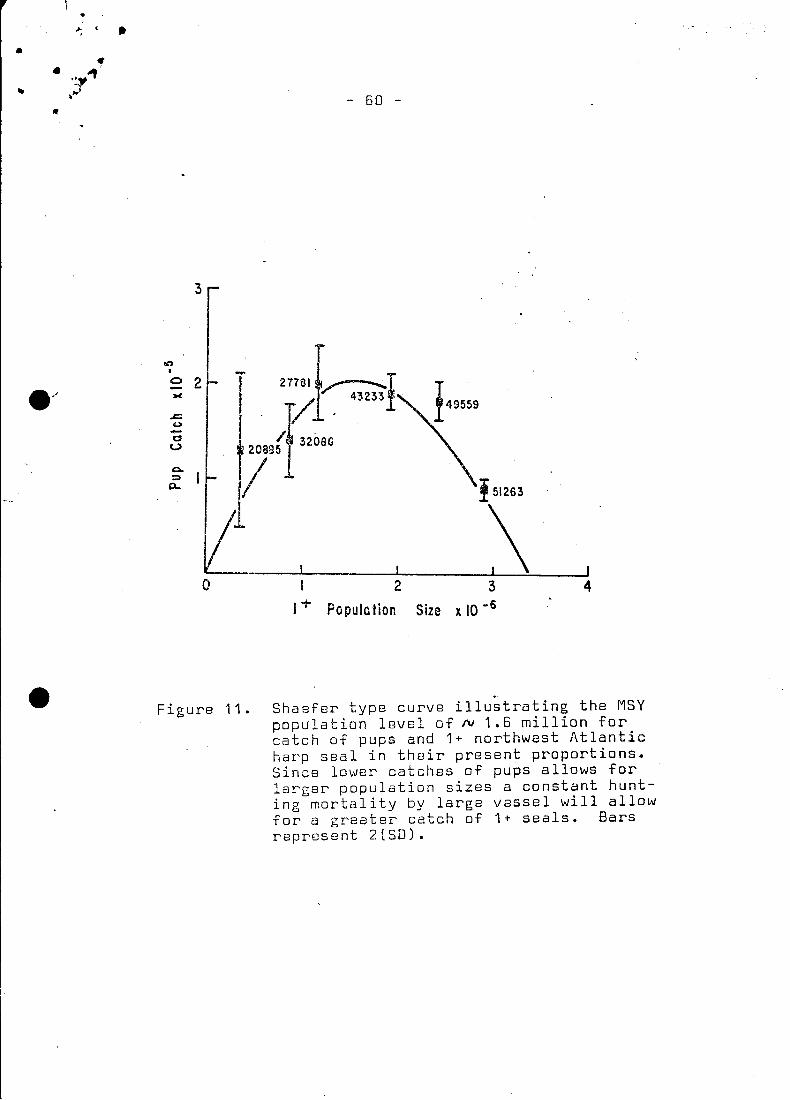
•.... ..
- 60 -
3
In
• -0 2 I 277·'~Ie·; K. .~. 43233
.s:::. /Iu-10u iQ5132OaoQ.
:::I0- 151263
\0 I 2 3 4
1+ Population Size x10-6
Figure 11. Shaefer type curve illustrating the MSYpopulation level of N 1.6 million forcatch of pups and 1+ northwest Atlanticharp seal in their present proportions.Since lower catches of pups allows forlarger population sizes a constant hunting mortality by large vessel will allowfor a greater catch of 1+ seals. Barsrepresent 2(50).
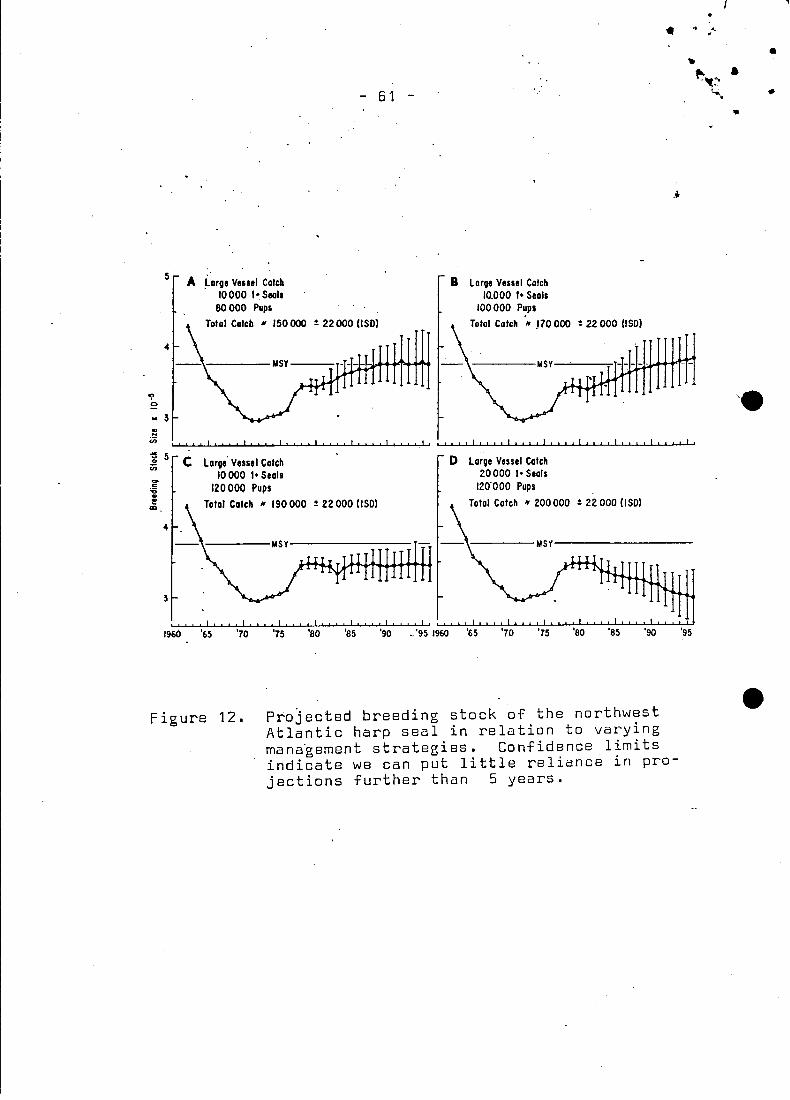
5
4
on,~
oe 3..N
C;;
- 61 -
A Larve Venel Caleb, 10000 ,- Seals
80000 PupsTalal Caleb Jt 150000 ! 22000 (ISO)
~-----MSY---T
B Larve Vessel CalchIQOOO I- Seals
100000 Pups
Tolal Colcb " ,170000 ! 22000 USO)
,-----MSY~~-~T,
r
• . :'
•..~~~
a
~ ••
4
3
C Large' Vessel Caleh10000 ,- Seals
120000 Pups
Talal Caleb N 190000 ! 22000 (ISO)
'-----MSY--------
D Large Vessel Calch20000 I- Seals
120'000 Pups
Talal Calch "200000 ! 22 000 (I SO)
,'-----MSY---------
"'" I"" '""1",, I"" I", ,I"" I ,~ww~~~~~~~~~~LL~~~~ü1960 '65 '70 '75 '80 '85 '90 _ '95 1960 '65 '70 '75 '80 '85 '90 '95
Figure 12. ProJected breeding stock of the northwestAtlantic harp seal in relation to varyingmana'gement strategiss. Confidencs limitsindicate ws can put littls rsliancs in projections furthsr than 5 ysars.
.. .,• ,. - 62 -.'" \• Y"..
Additional References
Ricker, W. E. 1954. stock and recruitment. J. Fish. Res.
Board Can.11:559-623.
Ricker~ W. E.· 1973. Linear regressions in ,fishery research.
J. Fish. Res. Bd Can •• 30:409-434.
Sergeant, o. E. 1969. On the population dynamics and size
e'i of stocks of harp seals in the north\rJest Atlantic.
Int. Comm. Northwest Atl. Fish. Res. Ooc. 69/31:1-25.
Results of.research on harp seals in
Comm. Northwest Atl. Fish. Res. Ooc.
Sergeant, O. E•. 1970.
1969-70. Int.~~---.;.--;..;.;......;.;.....;..;....~...;.;.;.~;..;;....;.;......;..;;;..;.;......;...;:;.~--....:...;..;;..;;....;.;.....~.;;....
70/61:1-15.
0ritsland,' T., and Benjaminsen. T.MS 1975~ Further documentation
of comments of Canadian harp seal est~mates. Int. Comm
NW. Atlant. Fish. Working Pap .• 1975(XII/7):1-9.
Ulltang, 0.MS 1B71. Estimates of mortality and production of
.harp seals at Newfoundland. Working Pap. int. Commn
NW. Atlant Fish~ Special Meet. Panel A Experts. Char
lottenlund, Denmark. 23-24 Sept. 1971. 13 p.


![Pertemuan Ke-3 (HTML Lanjut [1]) · Tabel § Membuat tabel sederhana § Menambahkan judul tabel § Mengatur lebar dan tinggi suatu tabel § Perataan dalam tabel § Membuat warna pada](https://img.pdfslide.us/doc/110x75/5b80df037f8b9aca778e3e28/pertemuan-ke-3-html-lanjut-1-tabel-membuat-tabel-sederhana-menambahkan.jpg)