Embed Size (px)
Citation preview
INDEX
1
S.No. Particular Page No. 1. Introdution 3-82. Chapter 1.1 :- General Information of the District Ratlam 9-123. Chapter 1.2 :- Demography of the District Ratlam 13-164. Chapter 1.3 :- Biomass and livestock of the District Ratlam 17-185. Chapter 1.4 :- Biomass and livestock of the District Ratlam 19-266. Chapter 1.5 :- Soil Profile of the District Ratlam 27-327. Chapter 1.6 :- Soil erosion and run off status profile of the District Ratlam 338. Chapter 1.7 :- Land use pattern of the District Ratlam 33-359. Chapter 2.1 :- Area wise, crop wise irrigation status of the District Ratlam 36-3810. Chapter 2.2 :- Production of productivity of the District Ratlam 39-4211. Chapter 2.3 :- Irrigation based classification of the District Ratlam 4712. Chapter 3.1 :- Surface of water availability of the District Ratlam 48-5013. Chapter 3.2 :- Status of ground water availability of the District Ratlam 51-5214. Chapter 3.3 :- Status of command area of the District Ratlam 5315. Chapter 3.4 :- Existing type of irrigation of the District Ratlam 5316. Chapter 4.1 :- Domestic water demand of the District Ratlam 5417. Chapter 4.2 :- Crop water requirement of the District Ratlam 55-5818. Chapter 4.3 :- Livestock water demand of the District Ratlam 59-6019. Chapter 4.4 :- Industrial water demand of the District Ratlam 6220. Chapter 4.5 :- Water demand for power generation of the District Ratlam 6321. Chapter 4.5 :- Total water demand of the District for various sectors of the District Ratlam 6322. Chapter 4.7 :- Water budget of the District Ratlam 6423. Chapter 5 :- Strategic Action Plan of the District Ratlam 6525. Chapter 5.2 :- Prioritization of the blocks and activity for strategic planning 6626. Chapter 6 :- Percentage of irrigation area to total cropped area 67-6927. Annexure 1:- Year wise strategic of DIP Ratlam District (Village irrigation plan of all 6 blocks Annexure 1) 70-97

2

INTRODUCTION:-
Hon’ble president in his address to the joint session of the parliament of 16 th Lok sabha indicated that “Each drop of water is precious. Government is committed to giving high
priority to water security. It will complete the long pending irrigation projects on priority and launch the ‘ Pradhan Mantri Krishi Sinchayee Yojna’ with the motto of ‘Har Khet
ko paani’. There is a need for seriously considering all options including linking of rivers, where feasible; for ensuring optimal use of our water resources to prevent the
recurrence of floods and drought. By harnessing rain water through ‘ Jal Sanchay ’ and ‘Jal Sinchan’, we will nurture water conservation and ground water recharge. Micro
irrigation will be popularized to ensure ‘ Per Drop-More crop’.
Out of about 141m.Ha of net area sown in the country, about 65 million hectare (or 45%) is presently covered under irrigation. Substantial dependency on rainfall makes
cultivation in unirrigated areas a high risk, less productive profession. Empirical evidences suggest that assured or protective irrigation encourages farmers to invest more in
farming technology and inputs leading to productivity enhancement and increased farm income.
The overreaching vision of Pradhan Mantri Krishi Sinchayee Yojna (PMKSY) will be to ensure access to some means of protective irrigation to all agricultural farms in the
country, to produce ‘ per drop more crop’, thus bringing much desired rural prosperity.
OBJECTIVES:-
The board objectives of PMKSY will be:-
a) Achieve Convergence of investments investment in irrigation at the field level (preparation of district level and, if required, sub district level water use plans).
b) Enhance the physical access of water on the farm and expand cultivable area under assured irrigation (Har Khet ko Pani),
c) Integration of water source, distribution and its efficient use, to make best use of water through appropriate technologies and practices.
d) Improve on-farm water use efficiency to reduce wastage and increase availability both in duration and extent,
e) Enhance the adoption of precision-irrigation and other water saving technologies (More crop per drop).
f) Enhance recharge of aquifers and introduce sustainable water conservation practices.
3

g) Ensure the integrated development of rained areas using the watershed approach towards soil and water conservation, regeneration of ground water, arresting runoff,
providing livelihood option and other NRM activities.
h) Promote extension activities relating to water harvesting, water management and crop alignment for farmers and grass root level field functionaries.
i) Explore the feasibility of reusing treated municipal waste water for peri-urban agriculture, and
j) Attract greater private investments in irrigation.
This will in turn increase agriculture production and productivity and enhance farm income.
STRATEGY & FOCUS AREAS:-
To achieve above objectives, PMKSY will strategize by focusing on end-to end solution in irrigation supply chain, viz. water sources, distribution network, efficient farm level
applications, extension services on new technologies & information etc. Broadly, PMKSY will focus on:-
a) Creation of new water sources; repair, restoration and renovation of defunct water sources; construction of water harvesting structures, secondary & micro storage,
groundwater development, enhancing potentials of traditional water bodies at village level like Jal Mandir (Gujarat); Khatri, Kuhl (H.P.); Zabo (Nagaland); Eri, Ooranis (T.N.);
Dongs (Assam); Katas, Bandhas (Odisha and M.P.) etc.
b) Developing/augmenting distribution network where irrigation sources (both assured and protective) are available or created;
c) Promotion of scientific moisture conservation and run off control measures to improve ground water recharge so as to create opportunities for farmer to access recharged
water through shallow tube/dug wells;
d) Promoting efficient water conveyance and field application devices within the farm viz, underground piping system, Drip & Sprinklers, pivots, rain-guns and other application
devices etc.;
e) Encouraging community irrigation through registered user groups/farmer producers’ organization/NGOs; and
f) Farmer oriented activities like capacity building, training and exposure visits, demonstrations, farm schools, skill development in efficient water and crop management practices
(crop alignment) including large scale awareness on more crop per drop of water through mass media campaign, exhibitions, field days, and extension activities through short
animation films etc. The aforesaid areas only outline the broad contours of PMKSY; combination of interventions may be required depending on location specific conditions and
4

requirements, which will be identified through District and State Irrigation Plans. More focus on irrigation development will be given to deficient states in terms of irrigation
coverage.
PROGRAMME COMPONENTS PMKSY will have following program components:
A. ACCELERATED IRRIGATION BENEFIT PROGRAMME(AIBP) a) To focus on faster completion of on going Major and Medium Irrigation including National Projects.
B. PMKSY (HAR KHET KO PANI) a) Creation of new water sources through Minor Irrigation (both surface and ground water)
b) Repair, restoration and renovation of water bodies; strengthening carrying capacity of traditional water sources, construction rain water harvesting structures (Jal Sanchay);
c) Command area development, strengthening and creation of distribution network from source to the farm;
d) Ground water development in the areas where it is abundant, so that sink is created to store runoff/ flood water during peak rainy season.
e) Improvement in water management and distribution system for water bodies to take advantage of the available source which is not tapped to its fullest capacity (deriving
benefits from low hanging fruits). At least 10% of the command area to be covered under micro/precision irrigation.
f) Diversion of water from source of different location where it is plenty to nearby water scarce areas, lift irrigation from water bodies/rivers at lower elevation to supplement
requirements beyond IWMP and MGNREGS irrespective of irrigation command.
g) Creating and rejuvenating traditional water storage systems like Jal Mandir (Gujarat); Khatri, Kuhl (H.P.); Zabo (Nagaland); Eri, Ooranis (T.N.); Dongs (Assam); Katas,
Bandhas (Odisha and M.P.) etc. at feasible locations.
5

C. PMKSY (PER DROP MORE CROP) a) Programme management, preparation of State/District Irrigation Plan, approval of annual action plan, Monitoring etc.
b) Promoting efficient water conveyance and precision water application devices like drips, sprinklers, pivots, rain-guns in the farm (Jal Sinchan);
c) Topping up of input cost particularly under civil construction beyond permissible limit (40%), under MGNREGS for activities like lining inlet, outlet, silt traps, distribution
system etc.
d) Construction of micro irrigation structures to supplement source creation activities including tube wells and dug wells (in areas where ground water is available and not under
semi critical /critical /over exploited category of development) which are not supported under AIBP, PMKSY (Har Khet ko Pani), PMKSY (Watershed) and MGNREGS as per
block/district irrigation plan.
e) Secondary storage structures at tail end of canal system to store water when available in abundance (rainy season) or from perennial sources like streams for use during dry
periods through effective on-farm water management;
f) Water lifting devices like diesel/ electric/ solar pump sets including water carriage pipes, underground piping system.
g) Extension activities for promotion of scientific moisture conservation and agronomic measures including cropping alignment to maximize use of available water including
rainfall and minimize irrigation requirement (Jal sarankchan);
h) Capacity building, training and awareness campaign including low cost publications, use of pico projectors and low cost films for encouraging potential use water source
through technological, agronomic and management practices including community irrigation.
i) The extension workers will be empowered to disseminate relevant technologies under PMKSY only after requisite training is provided to them especially in the area of
promotion of scientific moisture conservation and agronomic measures, improved/ innovative distribution system like pipe and box outlet system, etc. Appropriate Domain Experts
will act as Master Trainers.
j) Information Communication Technology (ICT) interventions through NeGP-A to be made use in the field of water use efficiency, precision irrigation technologies, on farm water
management, crop alignment etc. and also to do intensive monitoring of the Scheme.
6

D. PMKSY (WATERSHED DEVELOPMENT) a) Effective management of runoff water and improved soil & moisture conservation activities such as ridge area treatment, drainage line treatment, rain water harvesting, in-situ
moisture conservation and other allied activities on watershed basis.
b) Converging with MGNREGS for creation of water source to full potential in identified backward rainfed blocks including renovation of traditional water bodies.
METHODLOGY:-The preparation of District irrigation plan is an integration of geospatial technology, Space application technologies and spatial and non-spatial data.
a) honorable district collector district Ratlam had run The Sadhikar Abhiyan for every village last year in our district. For preferring DIP that village level team of Sadhikar
Abhiyan has been appointed as a VIP (Village irrigation plan) team.
b) The all team have been trained for the preparation of village irrigation plan by District collector honorable B. Chandrashekhar (IAS) and District jila panchayat CEO
Honorable Harjindarsingh (IAS).
c) To collect village data a team of sub engineers, watershed expert, Gram panchayat Sachiv, Patvari, Mahila Anganvadi Karykarta, Rojgar Sahayak Manrega has been
appointed.
d) Ratlam district has six Block (Sailana, Bajana, Ratlam Gramin,Alote,Jaora,Piploda) for every block six master trainers of senior level officers Class two and Class one
allied departments a rural of developments such as EE, SDO, ADA, ASCO, KVK SCIENTIST, PO JILA PANCHAYAT Etc..
e) These master trainers acted as a observer for particular Gram panchayat to conduct special gram sabha for DIP.
f) For every VIP the Participatory rural appraisal.(PRA) Exercise has been organize for each and every village.
g) For every village after PRA the VIP team has done transit walk of the whole village area.
h) A five page modal format according to DIP data destined as per the guideline PMKSY.
i) The all the data collect in that format and certified by the VIP team these information also has been entered in the Gram Sabha Thahrav Prastav Ragister.
j) These VIP data collected at senior agriculture development officer of that block. SADO submitted this data the nodel officer collection center.
k) At the nodal officer level the data of VIP has been process and re conceal with the ICR information ATLS
7

Available thematic information for water resource development plan.
1- Landuse / Land cover Map
2- Groundwater Potential Map
3- Soil map-depth, texture, erosion and capability
4- Slope map.
5- High resolution satellite mage through Bhuvan portal.
6- Litho logy.
7- Hydro geomorphology.
Area for development of water resource structure geospatial technology has been used in this process friest identify the area of crop land based on high resolution satellite
data and then identify the irrigated area by different source of irrigation methods. To identify the un irrigated area an overlay method is used. Dristrict irrigation plan covers the
following planning component of the district in sustainable development approach:
1- Increase in vegetation / biomass in the district.
2- More Number of surface water bodies in district.
3- Shift from annual crop to perennial.
4- Increase in the extent to crop area.
5- Improvement in the soil moisture availability.
6- Reclamation of waste lands.
7- Convergence of investments in irrigation at the field level.
8- Enhance the physical access of water on the farm and expand cultivable area under assured irrigation (Har Khet Ko Pani)
9- Best use of water through appropriate technologies and practices.
8

CHAPTER- 1 GENERAL INFORMATION OF THE DISTRICT
1.1. DISTRICT PROFILE
Ratlam is located between four directions as : North Lat : 230 91' 55'' N Lon 750 46' 10'' E, East Lat : 230 71' 83'' N, Lon : 750 69' 17'' E, West Lat : 230 32' 04'' N, Lon :
750 51' 34'' E and South Lat : 230 08' 81'' N, Lon : 750 23' 44'' E and head quarter is located on latitude 230 20' 30'' N and longitude 750 02' 16'' E District headquarter is situated
at a distance of 332 km from Bhopal in northwest direction. Ratlam is a main Railway Junction Western Railway , Ratlam consists of Six developmental Blocks: Ratlam, Jaora,
Sailana, Bajna, Piploda and Alote . Number of Tehsils in the district are Eight Ratlam , Raoti, Piploda, Taal. Bajna, Sailana, Jaora , Alote There are 1074 villages out of which
1064 are inhabited villages and 10 uninhabited villages in the district. The district has a total population of 1198759 out of which the Schedule casts comprise 191163 (15.95%),
Schedule Tribes 389593 (32.49%), other backward and general castes 450457. According to census 2011 of the total population, there are 522289 males and 50893 females. The
total electrified villages are 1064; the literacy percentage of the district is about 74.57%.
District has 1 Nagar Nigam ( Ratlam ), 1 Nagar Palika ( Jaora) and 7 nagar Parishad Named Sailana, Namli, Dhamnod, , Piploda, Taal ,Alote, Barawda . There are Five
assembly constituencies Ratlam City, Ratlam Gramin, Sailana, Jaora and Alote Parliamentary constituency in 3 parts divided in Ratlam Dist.(Jhabua-Ratlam, Mandsaur- Jaora,
Ujjain- Alote) . Six Janpad Panchayat are Ratlam, Bajana, Piploda, Sailana , Jaora and Alote 418 Gram Panchayats.
Total geographical area of the district is 487007 Ha., out of which 34293 Ha. is
forest area including. Average annual rainfall of district is 895.6 mm. District Location Map is given is below.
9

TABLE 1-1-1 DISTRICT PROFILE
District ProfileDistrict Code 10Geographical Area 487007 HaLatitude and Longitude 230 91' 55'' N and 230'08' 81'' N , 750 46' 10'' E and 750 23' 44'' EArea under Forest 34293 HaArea under Agriculture use 325360 HaNet Sown Area 325360 HaGross Cropped Area 360216 HaNet Irrigated(Rabi/ kharif) 166711 HaNet Rain fed 313080 HaTotal Number of block 06Total Number of Panchayat 418Total Number of unhabitad Villages 10Total Number of habited Villages 1064
Total Number of Villages 1074Total Population 1198759Population Growth Rate(Decadal) 19.72 %Total Male Population 522289Total Female Population 508893Total Child Population 167577Total Population ST 389593Total Population SC 191163Total Population GEN 450457Total livestock 854174Poultry 134150Stored Surface water 2.0766 BCMStored Ground water 0.66638 BCM
10

CHAPTER 1.1 : GENERAL INFORMATION OF THE DISTRICT : RATLAM
1.1 District profile source: Gazetteer, census Report any other source of Government
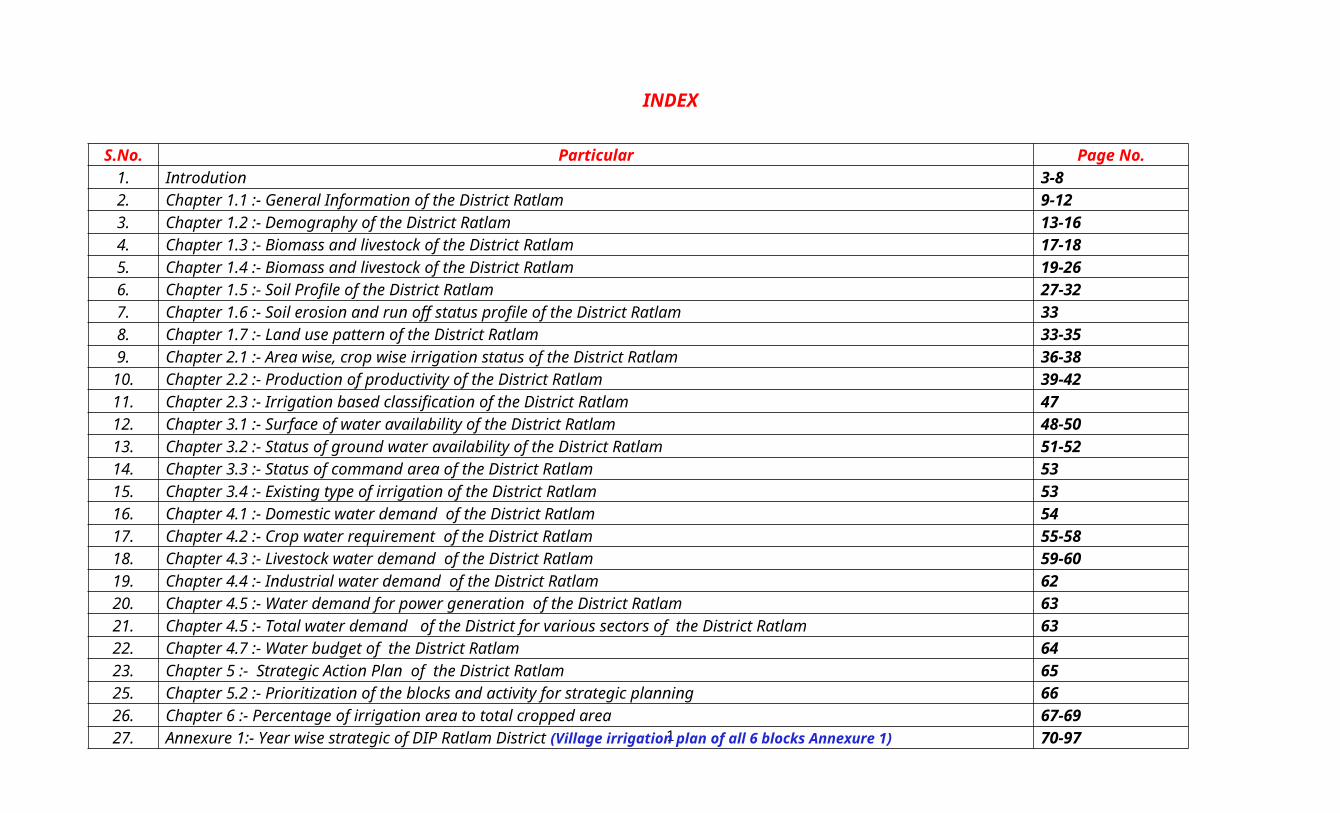
S. No. Block Name of the District District Code Latitude Longitude
1 SAILANA RATLAM 10 23º27'43"N 74º55'24"E
2 RATLAM RATLAM 10 23º20'3"N 75º02'16"E
3 BAJANA RATLAM 10 23º18'46"N 74º38'8"E
4 JAORA RATLAM 10 23º38'16"N 75º7'34"E
5 PIPLODA RATLAM 10 23º21'52"N 75º25'40"E
6 ALOTE RATLAM 10 23º45'45"N 75º33'19"E
The district Ratlam is a western part of the state MP on malwa plateau with the district Headquarter at Ratlam city falling Ujjain division. It is bounded by Mandsour in the north
is by Ujjain district, in the east by Jhabua and in the south and by Dhar District and in the west by Rajasthan state. The total geographical area district is 486474 Hact. and is
located longitude latitude in about table.
This district further divided six block VIZ Ratlam, Bajana, Sailana, Piploda,Alote,Jaora With 10 towns and 1051 villages.
11

12
CHAPTER 1.2: DEMOGRAPHY OF THE DISTRICT: RATLAM
Block
No. of the
Gram
Panchayat
Name
of the
Villages
Covered
Code of
Villages
Covered
POPULATION SC ST GENERAL TOTAL
M F CH* TotalNo. of
household
No. of
Members
No. of
household
No. of
Member
s
No. of
household
No. of
Members
No. of
household
No. of
Members
SAILANA 47 238 0 67880 67079 26501 134959 754 3773 22071 110355 4166 20831 26991 134959
BAJANA 65 220 0 RATLAM 96 172 0 282488 272771 73428 555259 13554 67771 22694.8 113474 111051
JAORA 68 147 0 12384311922
733501 243070 10589 52947 1929.2 9646 36095 180477 48614 243070
PIPLOD
A52 90 0 70156 68206 18336 138362 5033 25167 4130.8 20654 18508 92541 27672 138362
ALOTE 90 197 0 11162010733
832200 218958 9418 47094 290 1450 34082 170414 43791 218958
TOTAL 418 1064 0 738241 71682 218354 1455069 39702 198513 81973 409865 169338 846691 291013 1455069
13

8
Source: Census of India (2011),
DISTRICT POPULATION
SAILANA RATLAM BAJANA JAORA PIPLODA ALOTE0
50000
100000
150000
200000
250000
300000
MFCH
14

SAILANA RATLAM BAJANA JAORA0
50000
100000
150000
200000
250000
300000
350000
400000
ScSTGeneral
15

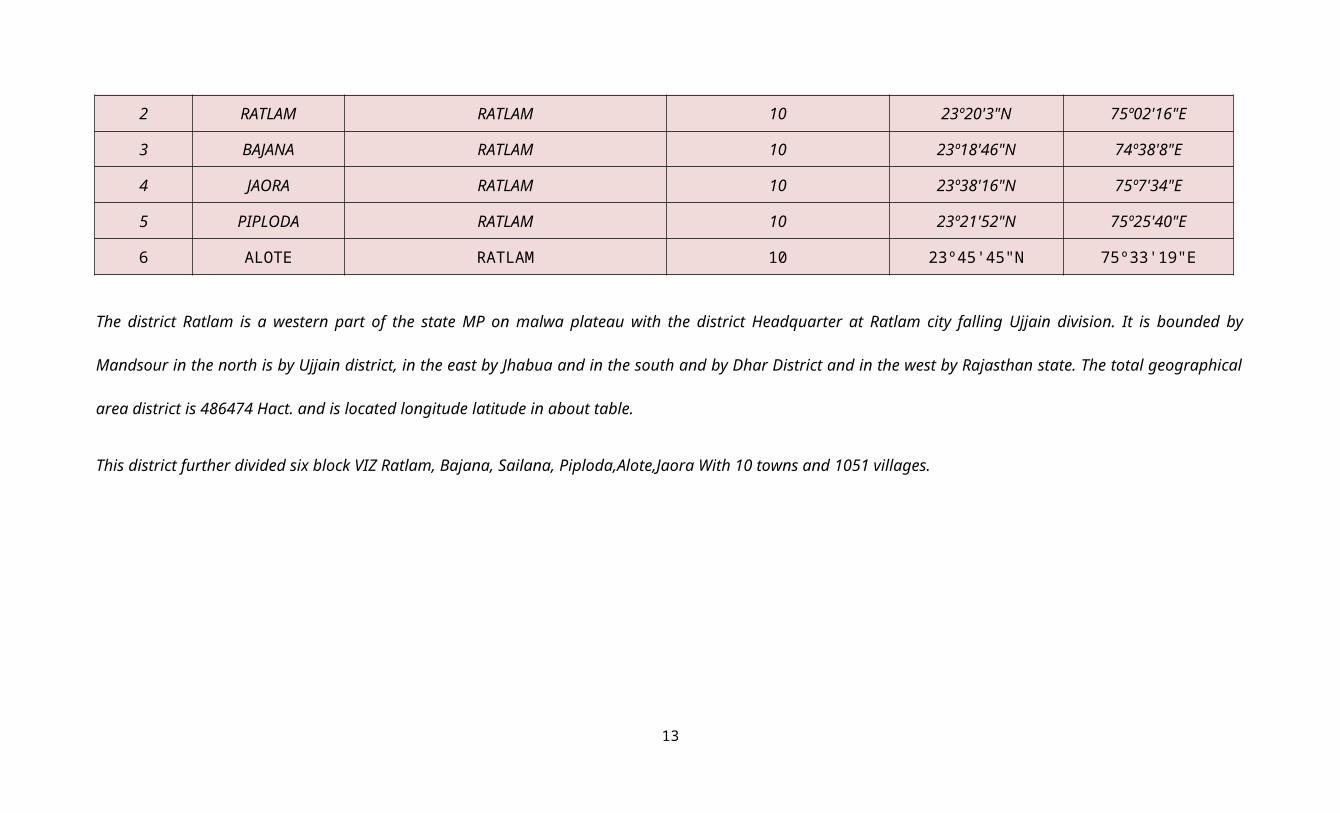
POPULATION:
The distribution of rural population is directly related to the availability of resource of an area, natural potentiality and development measures. The total population is always higher in the fertile plain, and is therefore an indirect indicator showing the quality of nature resources of a given region. The population of the district is spread in 1051 inhabited villages and 9 towns.
For generalization, the villages have further been grouped in to small size(<200population), medium size(201-499 population), large size (500-1999 population) and very large (2000-4999 population) and > Ext. large(>5000 population) size categories.
Accordingly out of 1051 villages, 2 villages falls under small;270 villages under medium, 343 villages under large and 43 villages under very large to extremely large village category. Only 1 village have population more than 5000. The other villages are either un inhabited or data in not available. Therefore, the plan resource allocation need to be diverted to medium and large category villages for over all development. The population distribution has been shown village wise for ratlam distric
DEMOGRAPHY OF DISTRICT RATLAM AS PER THE REQUIREMENT OF PMKSY, PROJECTED POPULATION 2020
Level Name population 2011
population 2015 population
2020
SC Population
2011
SC population
2015
SC population
2020
ST Population
2011
ST population
2015
ST population
2020DISTRICT RATLAM 1455069 1583115 1858909 198612 216090 239861 409865 445934 588905
SUB-DISTRICT PIPLODA 138362 150538 167097 25167 27382 30394 20454 22472 24943
SUB-DISTRICT JAORA 243070 264460 293551 52947 57606 63943 9646 10495 11649
SUB-DISTRICT ALOTE 218958 238226 264431 47193 51346 56994 1450 1578 1751
SUB-DISTRICT BAJANA 164461 178934 300268 1761 1916 2127 154286 167863 280248
SUB-DISTRICT SAILANA 134959 146835 162987 3773 4105 4557 110355 120066 133274
SUB-DISTRICT RATLAM 555259 604122 670575 67771 73735 81846 113474 123460 137040
As we know that all the Schemes and Plans are directly influenced by the population, so the present population & Future population are very important for the schemes & Plans, and the growth, rate is important at the same time.
The above Table showing the population of Ratlam district of the year 2011, 2015 & 2020. After studying the records of census of 1991, 2001 & 2011. We come to the conclusion that the growth rate of the district is 2.2/year.
16

RATLAM DISTRICT POPULATION MAP
17
1.3. BIOMASS AND LIVESTOCK
Water plays an important role in livestock productivity. Livestock productivity in pastoral areas depends greatly on the availability of water. There are several factors,
which determine water balance, water turn over and functions of the animal. Assessment of livestock and water requirement is helpful in modeling water and livestock
relationships. The demand for meat, dairy products and eggs rises faster than the demand for crops; thus both scenarios call for livestock production to increase relatively more
rapidly than crops. The world livestock system is broadly divided into pastoral grazing, mixed farming and industrial systems (Sere and Stienfeld 1996). Estimate of the current
demand of 1.7 billion
tons of cereals and 206 million tones of meat in developing countries could rise by 2020 to 2.5 to 2.8 billion tones of cereals and to 310 millions of tons of meat (IFPRI
2000). Water is used by the herbivore as a medium for physical and chemical energy transfer, namely for evaporative cooling and intermediary metabolism (Konandreas and
Anderson; King 1983; Kirda and iechardt 1986). Livestock and poultry water consumption depend on a number of physiological and environmental conditions such as:
• Type and size of animal or bird.
• Physiological state (lactating, pregnant or growing)
• Activity level.
• Type of diet-dry hay, silage or lush pasture.
• Temperature-hot summer days above … 0C can sometimes double the water
consumption of animals.
• Water quality - palatability and salt content.
18

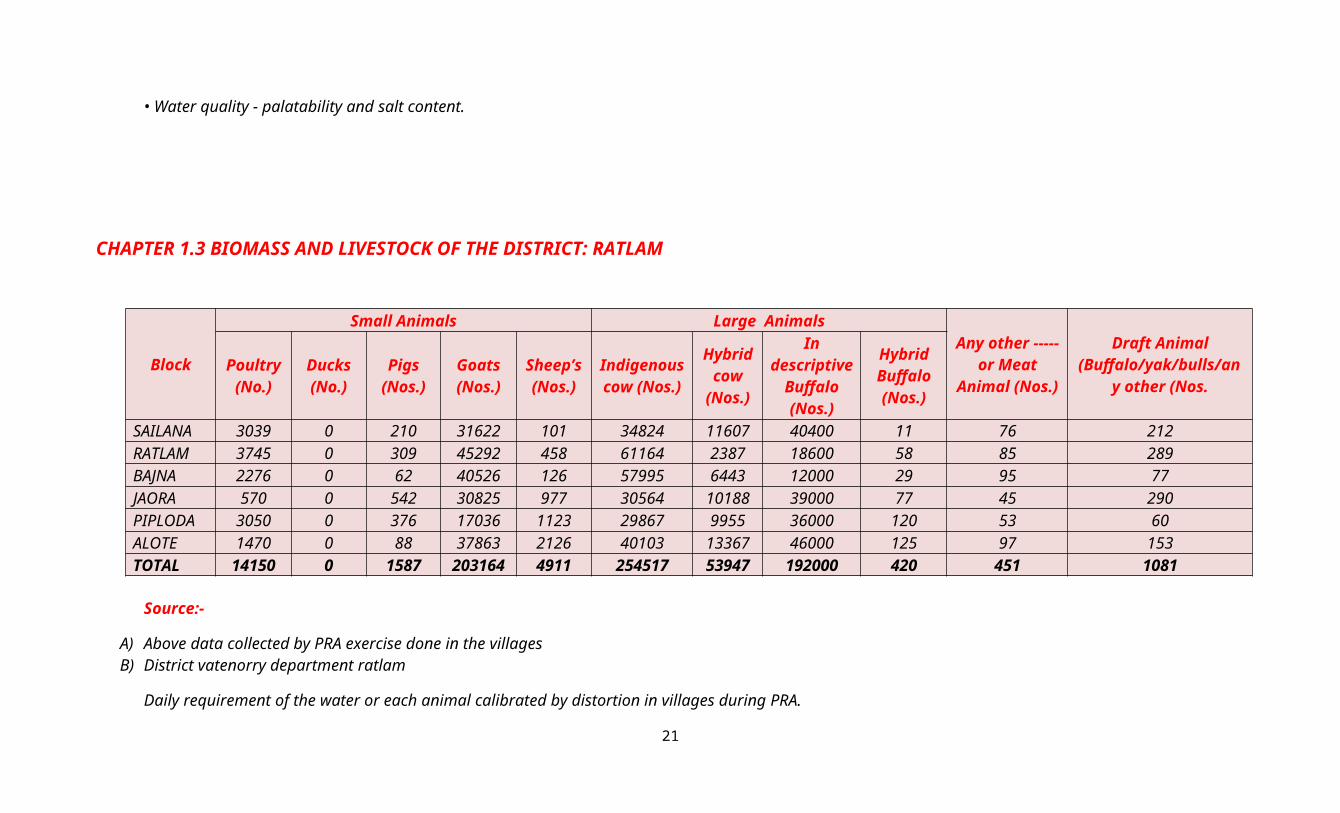
CHAPTER 1.3 BIOMASS AND LIVESTOCK OF THE DISTRICT: RATLAM
Block
Small Animals Large AnimalsAny other -----
or Meat Animal (Nos.)
Draft Animal (Buffalo/yak/bulls/any
other (Nos.Poultry (No.)
Ducks (No.)
Pigs (Nos.)
Goats (Nos.)
Sheep’s (Nos.)
Indigenous cow (Nos.)
Hybrid cow
(Nos.)
In descriptive
Buffalo (Nos.)
Hybrid Buffalo (Nos.)
SAILANA 3039 0 210 31622 101 34824 11607 40400 11 76 212RATLAM 3745 0 309 45292 458 61164 2387 18600 58 85 289BAJNA 2276 0 62 40526 126 57995 6443 12000 29 95 77JAORA 570 0 542 30825 977 30564 10188 39000 77 45 290PIPLODA 3050 0 376 17036 1123 29867 9955 36000 120 53 60ALOTE 1470 0 88 37863 2126 40103 13367 46000 125 97 153TOTAL 14150 0 1587 203164 4911 254517 53947 192000 420 451 1081
Source:-
A) Above data collected by PRA exercise done in the villages B) District vatenorry department ratlam
Daily requirement of the water or each animal calibrated by distortion in villages during PRA.
A) Poultry : 1 Ltr/DayB) Pigs : 10 Ltr/DayC) Goats : 15 Ltr/DayD) Sheep’s : 15 Lte/DayE) Indigenous Cow :85 Ltr/DayF) Hybrid Cow : 112 Ltr/DayG) Indigenous Buffalo : 160 Ltr/DayH) Hybrid Buffalo : 200 Ltr/DayI) Other meat animal : 60 Ltr/Day
19

1.4. AGRO-ECOLOGY, CLIMATE, HYDROLOGY AND TOPOGRAPHY:
Agro-ecology is the study of ecological processes that operate in agricultural production systems. The prefix agro- refers to agriculture. Bringing ecological principles to
bear in agro-ecosystems can suggest novel management approaches that would not otherwise be considered. Agro-ecology is the application of ecological concepts and
methodological design for long-term enhancement and management of soil fertility and agriculture productivity. It provides a strategy to increase diversified agro-ecosystem. So it
is benefiting the effect of the incorporation of plant and animal biodiversity, nutrient recycling; biomass creation and growth through the use of natural resource systems based on
legumes, trees, and incorporation of livestock. These all make the basis of a sustainable agriculture and aim to improve the food system and societal sustainability. The agro-
ecology supports production of both a huge quantity and diversity of good quality of food, thread and medicinal crops, together with family utilization and the market for economic
and nutritionally at risk populations. Sustainable agricultural practices have to tackle the conservation of biodiversity, enhanced ecological functions, social tolerance, self-
reliance, fairness, improved quality of life and economic productivity of crops and live- stock. Sustainability of agriculture is viewed critically from the point of food and
ecological security at the regional scale.
Creation and growth through the use of natural resource systems based on legumes, trees, and incorporation of livestock. These all make the basis of a sustainable
agriculture and aim to improve the food system and societal sustainability. The agro ecology supports production of both a huge quantity and diversity of good quality of food,
thread and medicinal crops, together with family utilization and the market for economic and nutritionally at risk populations. Sustainable agricultural practices have to tackle
the conservation of biodiversity, enhanced ecological functions, social tolerance, self-reliance, fairness, improved quality of life and economic productivity of crops and live- stock.
Sustainability of agriculture is viewed critically from the point of food and ecological security at the regional scale.
20
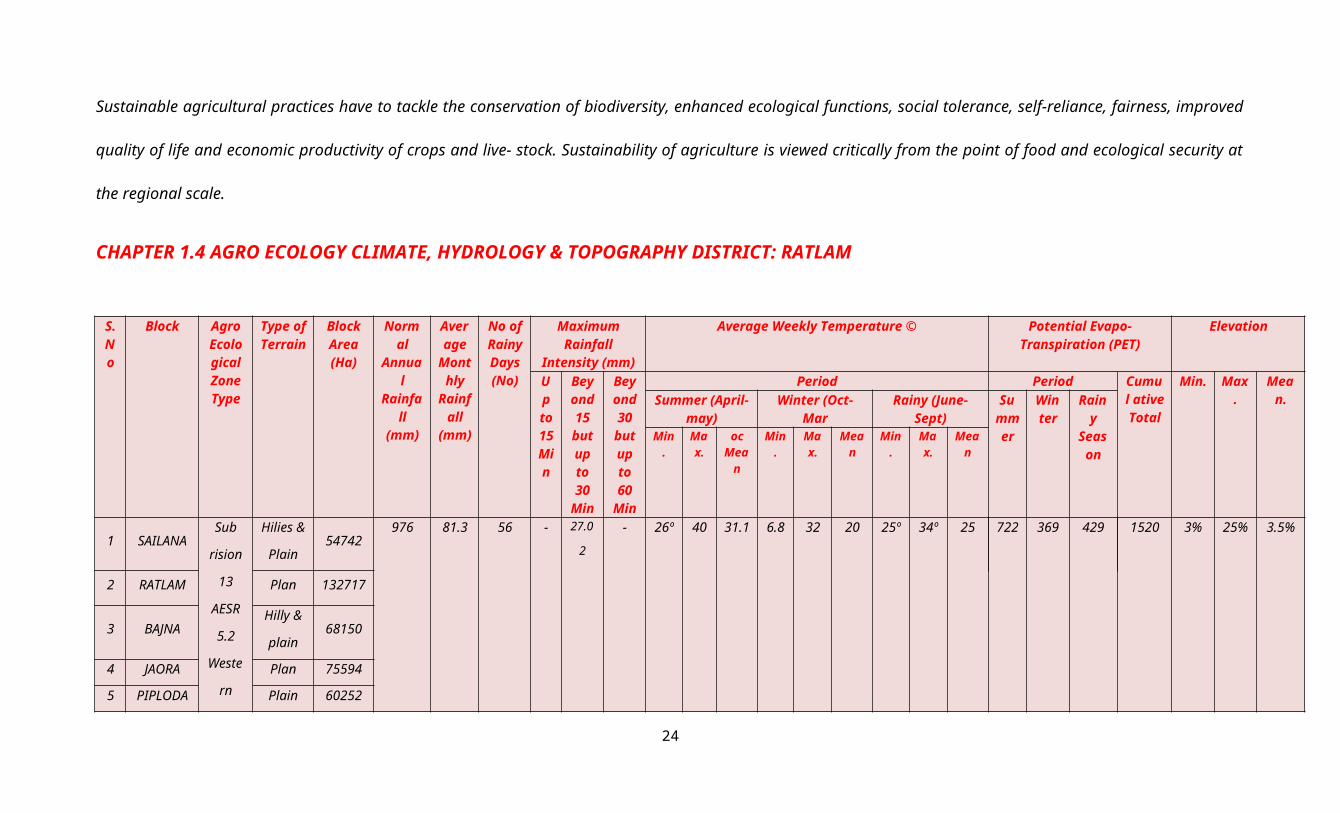
CHAPTER 1.4 AGRO ECOLOGY CLIMATE, HYDROLOGY & TOPOGRAPHY DISTRICT: RATLAM
S. No
Block Agro Ecolo gical Zone Type
Type of Terrain
Block Area (Ha)
Normal Annual Rainfall (mm)
Average
Monthly
Rainfall
(mm)
No of Rainy Days (No)
Maximum Rainfall Intensity
(mm)
Average Weekly Temperature © Potential Evapo-Transpiration (PET)
Elevation
Up to 15 Min
Bey ond 15 but
up to 30
Min
Bey ond 30 but
up to 60
Min
Period Period Cumul ative Total
Min. Max.
Mean.Summer (April-
may)Winter (Oct-Mar Rainy (June-Sept) Su
mmer
Winter
Rainy Seaso
nMin.
Max.
oc Mea
n
Min.
Max.
Mean
Min.
Max.
Mean
1 SAILANASub
rision
13
AESR
5.2
Wester
n
malwa
pletu
Hilies &
Plain54742
976 81.3 56 - 27.02 - 26º 40 31.1 6.8 32 20 25º 34º 25 722 369 429 1520 3% 25% 3.5%
2 RATLAM Plan 132717
3 BAJNAHilly &
plain68150
4 JAORA Plan 75594
5 PIPLODA Plain 60252
6ALOTE Plain 94552
TOTAL 486007
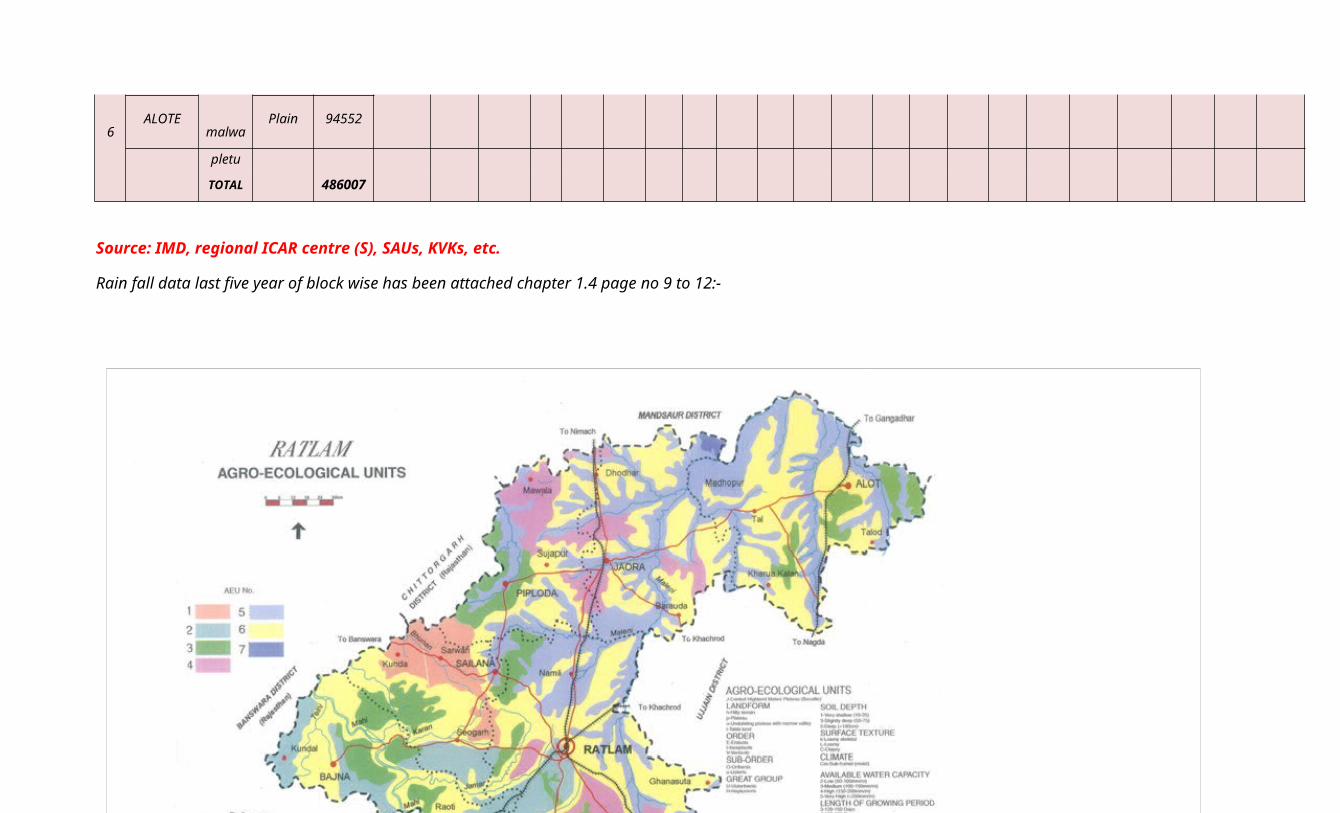
Source: IMD, regional ICAR centre (S), SAUs, KVKs, etc.
Rain fall data last five year of block wise has been attached chapter 1.4 page no 9 to 12:-
21

22

23
Name of the Animals No. of the Animals Water Requirement/ Day/Animal Water Requirement 2020 Water Requirement In BCM For 2020
Poultry 14150 1 5164750 0.05 0.00005Ducks 0 0 0 0.00 0.00000Pigs 1587 10 5792550 0.06 0.00006
Goats 203164 15 1112322900 11.12 0.01112Sheep’s 4911 15 26887725 0.27 0.00027
Indigenous cow 254517 85 7896389925 78.96 0.07896Hybrid cow 53947 112 2205353360 22.05 0.02205
In descriptive Buffalo 4491 160 262274400 2.62 0.00262Hybrid Buffalo 420 200 30660000 0.31 0.00031
Any other -----or Meat Animal 451 60 9876900 0.10 0.00010Draft Animal (Buffalo/yak/bulls/any
other 1081 60 23673900 0.24 0.00024
TOTAL 115.78 0.11578
24
Year 2010
Block June July August September Octmber Total Cost
Rainy Day’s
Rain ¼mm½
Rainy Day’s
Rain ¼mm½
Rainy Day’s
Rain ¼mm½
Rainy Day’s
Rain ¼mm½
Rainy Day’s
Rain ¼mm½
Rainy Day’s
Rain ¼mm½
RATLAM 2 77 8 350 22 288 4 86 - - 36 801SAILANA 2 48 11 193.2 18 384 8 62 - - 39 687.2BAJNA 2 47.6 11 217.8 23 575 8 153 - - 44 993.4JAORA 2 24.2 10 272.8 15 118.2 6 82 - - 33 497.2
PIPLODA 1 26 8 117 14 307 4 63 - - 27 513ALOTE 2 61 12 170 14 161 7 215 - - 35 607
DISTRICT 2 47.1 13 206.5 20 319 9 111 - - 44 683.6
Year 2011
Block June July August September Octmber Total Cost
Rainy Day’s
Rain ¼mm½
Rainy Day’s
Rain ¼mm½
Rainy Day’s
Rain ¼mm½
Rainy Day’s
Rain ¼mm½
Rainy Day’s
Rain ¼mm½
Rainy Day’s
Rain ¼mm½
RATLAM 2 86 18 455 24 588 12 200 - - 56 1329SAILANA 2 106 15 327 21 606 10 210 - - 48 1249BAJNA 4 95 16 229 26 682 10 153 - - 56 1159JAORA 3 78 14 296 20 603 6 114 - - 43 1091
PIPLODA 2 103 14 325 20 518 8 152 - - 44 1098ALOTE 5 75 13 313 19 559 7 188 - - 44 1135
DISTRICT 3 91 17 323 25 593 10 161 - - 55 1168
25

Year 2012
BlockJune July August September Octmber Total Cost
Rainy Day’s
Rain ¼mm½
Rainy Day’s
Rain ¼mm½
Rainy Day’s
Rain ¼mm½
Rainy Day’s
Rain ¼mm½
Rainy Day’s
Rain ¼mm½
Rainy Day’s
Rain ¼mm½
RATLAM - - 14 393 13 441 10 380 - - 37 1214SAILANA - - 15 354 14 503 9 228 - - 38 1085BAJNA - - 14 305 14 420 8 283 - - 36 1008JAORA - - 10 370 9 316 8 120 - - 27 806
PIPLODA - - 13 339 13 346 10 128 - - 36 813ALOTE - - 13 348 15 356 9 255 - - 37 959
DISTRICT - - 14 352 15 396 10 233 - - 39 981
Year 2013
BlockJune July August September Octmber Total Cost
Rainy Day’s
Rain ¼mm½
Rainy Day’s
Rain ¼mm½
Rainy Day’s
Rain ¼mm½
Rainy Day’s
Rain ¼mm½
Rainy Day’s
Rain ¼mm½
Rainy Day’s
Rain ¼mm½
RATLAM 9 217 25 640 12 378 5 217 4 153 55 1605SAILANA 8 177 19 666 16 282 5 220 3 25 51 1370BAJNA 11 146 22 547 17 284 5 298 4 34 59 1309JAORA 9 151 18 359 14 323 5 95 4 93 50 1021
PIPLODA 9 151 21 477 13 329 5 126 5 45 53 1128ALOTE 6 162 21 446 14 372 5 88 2 30 48 1098
DISTRICT 11 168 25 522 15 328 5 174 5 63 61 1255
26

Year 2014
BlockJune July August September Octmber Total Cost
Rainy Day’s
Rain ¼mm½
Rainy Day’s
Rain ¼mm½
Rainy Day’s
Rain ¼mm½
Rainy Day’s
Rain ¼mm½
Rainy Day’s
Rain ¼mm½
Rainy Day’s
Rain ¼mm½
RATLAM - - 11 257 10 134 5 191 2 20 28 602SAILANA - - 12 240 11 158 8 136 1 13 32 547BAJNA - - 14 323 12 187 8 250 2 56 36 816JAORA - - 13 258 10 190 7 132 0 0 30 580
PIPLODA - - 10 217 11 183 9 151 2 11 32 562ALOTE - - 14 195 10 169 5 138 1 19 30 521
DISTRICT - - 16 248 13 170 8 167 3 20 40 605
Year 2015
BlockJune July August September Octmber Total Cost
Rainy Day’s
Rain ¼mm½
Rainy Day’s
Rain ¼mm½
Rainy Day’s
Rain ¼mm½
Rainy Day’s
Rain ¼mm½
Rainy Day’s
Rain ¼mm½
Rainy Day’s
Rain ¼mm½
RATLAM 9 194 11 785 3 112 2 12 - - 25 1103SAILANA 9 231 11 857 5 133 1 3 - - 26 1224BAJNA 9 235 10 578 3 65 2 23 - - 24 901JAORA 10 235 11 777 4 65 1 5 - - 26 1082
PIPLODA 11 331 12 628 3 71 0 2 - - 26 1032ALOTE 6 194 10 645 6 163 2 14 - - 24 1016
DISTRICT 13 236 12 712 5 102 0 7 - - 30 1057
27

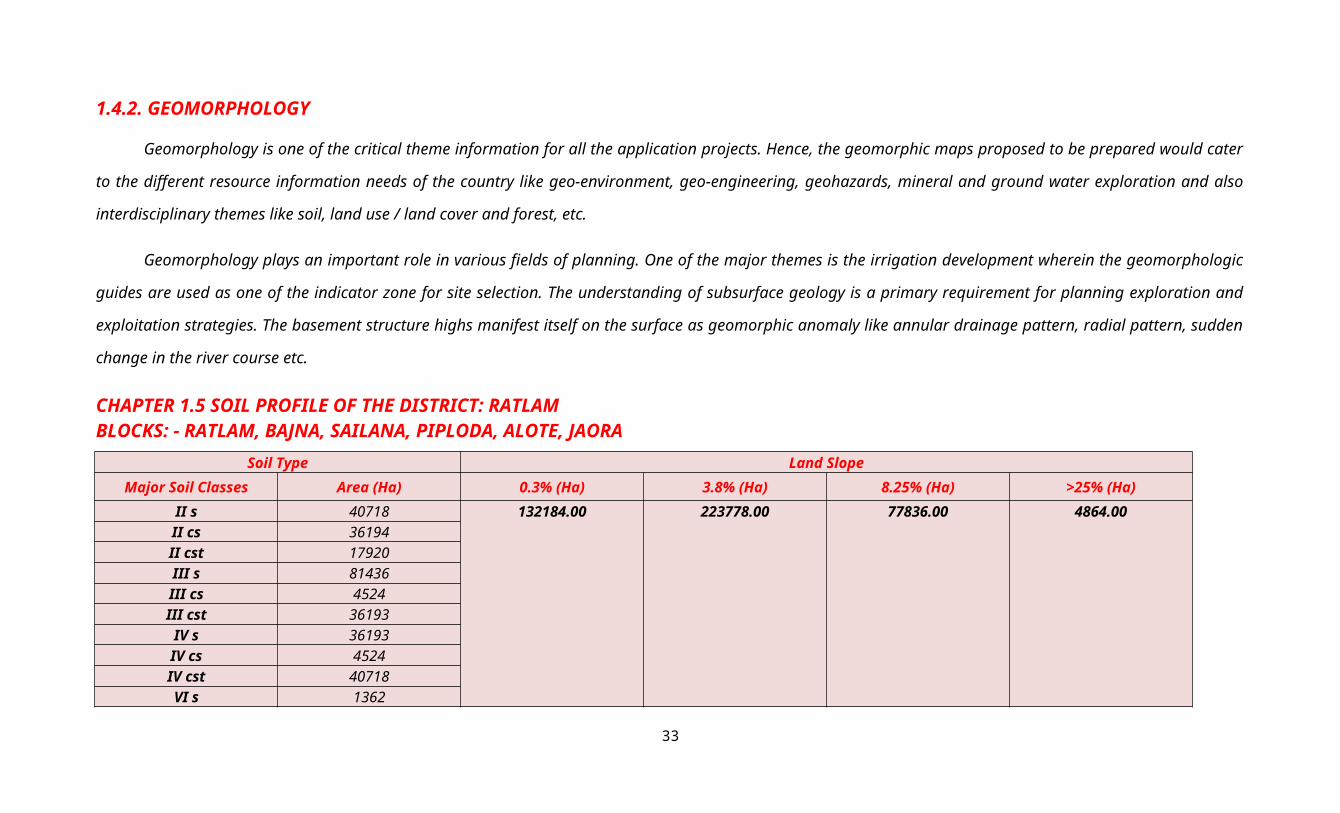
1.4.2. GEOMORPHOLOGY
Geomorphology is one of the critical theme information for all the application projects. Hence, the geomorphic maps proposed to be prepared would cater to the different
resource information needs of the country like geo-environment, geo-engineering, geohazards, mineral and ground water exploration and also interdisciplinary themes like soil,
land use / land cover and forest, etc.
Geomorphology plays an important role in various fields of planning. One of the major themes is the irrigation development wherein the geomorphologic guides are used
as one of the indicator zone for site selection. The understanding of subsurface geology is a primary requirement for planning exploration and exploitation strategies. The
basement structure highs manifest itself on the surface as geomorphic anomaly like annular drainage pattern, radial pattern, sudden change in the river course etc.
CHAPTER 1.5 SOIL PROFILE OF THE DISTRICT: RATLAMBLOCKS: - RATLAM, BAJNA, SAILANA, PIPLODA, ALOTE, JAORA
Soil Type Land SlopeMajor Soil Classes Area (Ha) 0.3% (Ha) 3.8% (Ha) 8.25% (Ha) >25% (Ha)
II s 40718
132184.00 223778.00 77836.00 4864.00
II cs 36194II cst 17920III s 81436III cs 4524III cst 36193IV s 36193IV cs 4524IV cst 40718VI s 1362VI cs 1022VI cst 21112VIII s 3065VIII cs 493
Source: SLUSI, NBSS, Institute of Soil Science, Department of Land Resources
28

29

SLOPE :-
The slope has two geomorphic applications. In general sense “ Slope” refers to any geomorphic elements of the earth’s surface in the restricted sense,” slope” refers to the
angle that any part of the earth’s surface forms with the horizontal datum. The inclination of the terrain is the results of several factor viz. relief, drainage, climate and geology
operating in the area. Slope tends to modify the energy exchange from earth surface to atmosphere thereby modifying a micro climate of the area.
Slope characteristics help in understanding the soil genesis, land use and the relation among the litho logy, landform and land use. Climate play an important role in slope
evolution and it is generally found that slope in humid climate are relatively gentle with soil and vegetation. Depending on the ruggedness of the terrain following slope classes
have been determined.
The data indicated that a major part of the district falls under gently sloping class which accounts for 46% area in this district. About 38% of the land in the district have
very gently sloping land moderately sloping occupies about 15% area. Higher sloping areas are associated with severe to very sever soil erosion, rendering the land less
productive and more susceptible to erosion.
30

31

1.5.1 SOIL DEPTH
The mean depth of the soil layer within the sampling area is assessed by studying conditions in the terrain, both on the test area and in its immediate vicinity. The soil depth
on the test area (humus layer + mineral soil) is specified as one of the following four classes:
Deep soil Mean soil depth greater than 70 cm. Bedrock outcrop lacking in both the testarea and its immediate vicinity with similar topography.
Fairlyshallow soil
Mean soil depth 20-70 cm. Occasional visible bedrock outcrop present. If there is only one bedrock outcrop it must lie wholly or partly within the test area.
Veryshallow soil
Mean soil depth less than 20 cm. Frequent occurrence of bedrock outcrop. Atleast one bedrock outcrop within the test area. The soil may be deep withinsmall fissures in the bedrock.
Varying soildepth
Wide variation in soil depth within the test area due to broad crevasses in thebedrock, which occasionally emerges as outcrop at the surface.
32
33

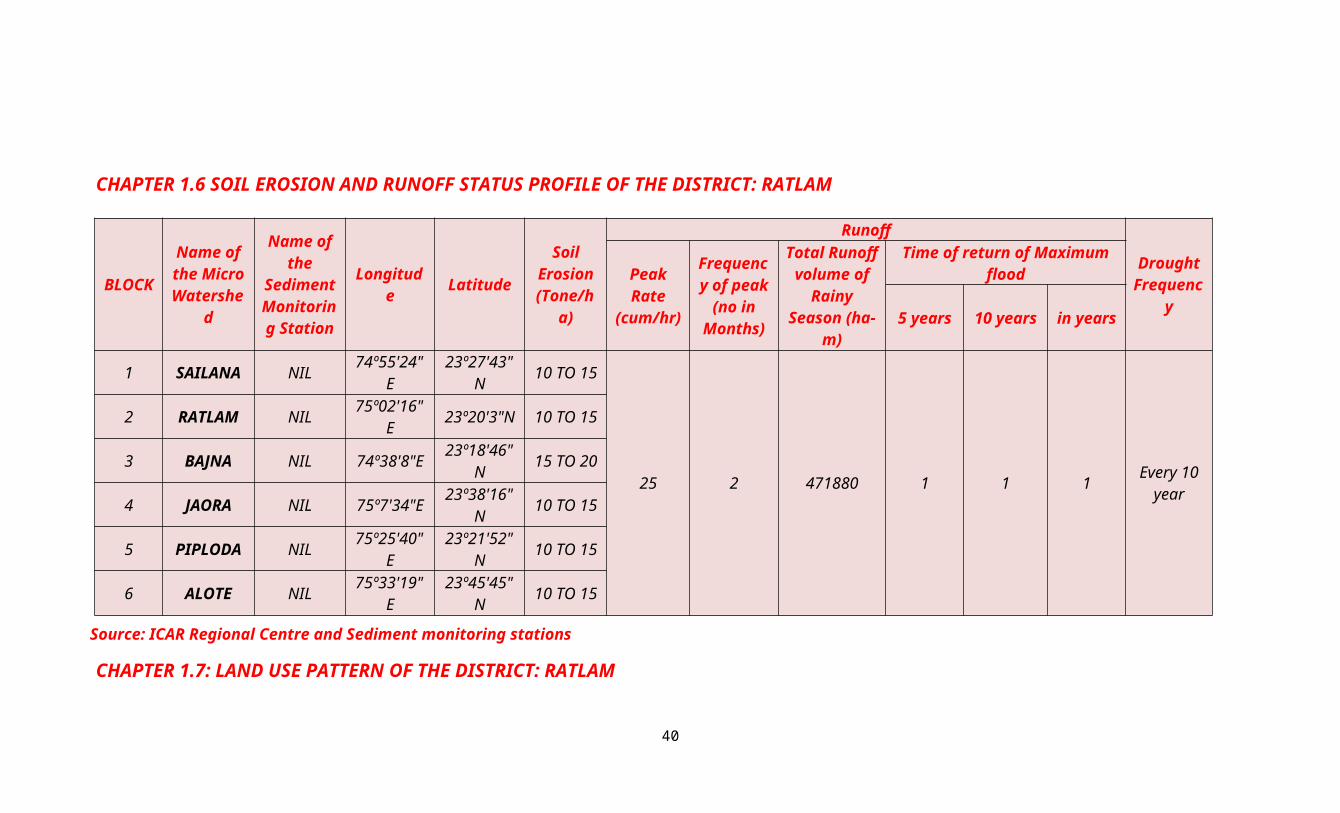
CHAPTER 1.6 SOIL EROSION AND RUNOFF STATUS PROFILE OF THE DISTRICT: RATLAM
BLOCKName of the Micro Watershed
Name of the
Sediment Monitoring
Station
Longitude LatitudeSoil
Erosion (Tone/ha)
Runoff
Drought FrequencyPeak Rate
(cum/hr)
Frequency of peak (no in
Months)
Total Runoff volume of
Rainy Season (ha-m)
Time of return of Maximum flood
5 years 10 years in years
1 SAILANA NIL 74º55'24"E 23º27'43"N 10 TO 15
25 2 471880 1 1 1 Every 10 year
2 RATLAM NIL 75º02'16"E 23º20'3"N 10 TO 153 BAJNA NIL 74º38'8"E 23º18'46"N 15 TO 204 JAORA NIL 75º7'34"E 23º38'16"N 10 TO 155 PIPLODA NIL 75º25'40"E 23º21'52"N 10 TO 156 ALOTE NIL 75º33'19"E 23º45'45"N 10 TO 15
Source: ICAR Regional Centre and Sediment monitoring stations
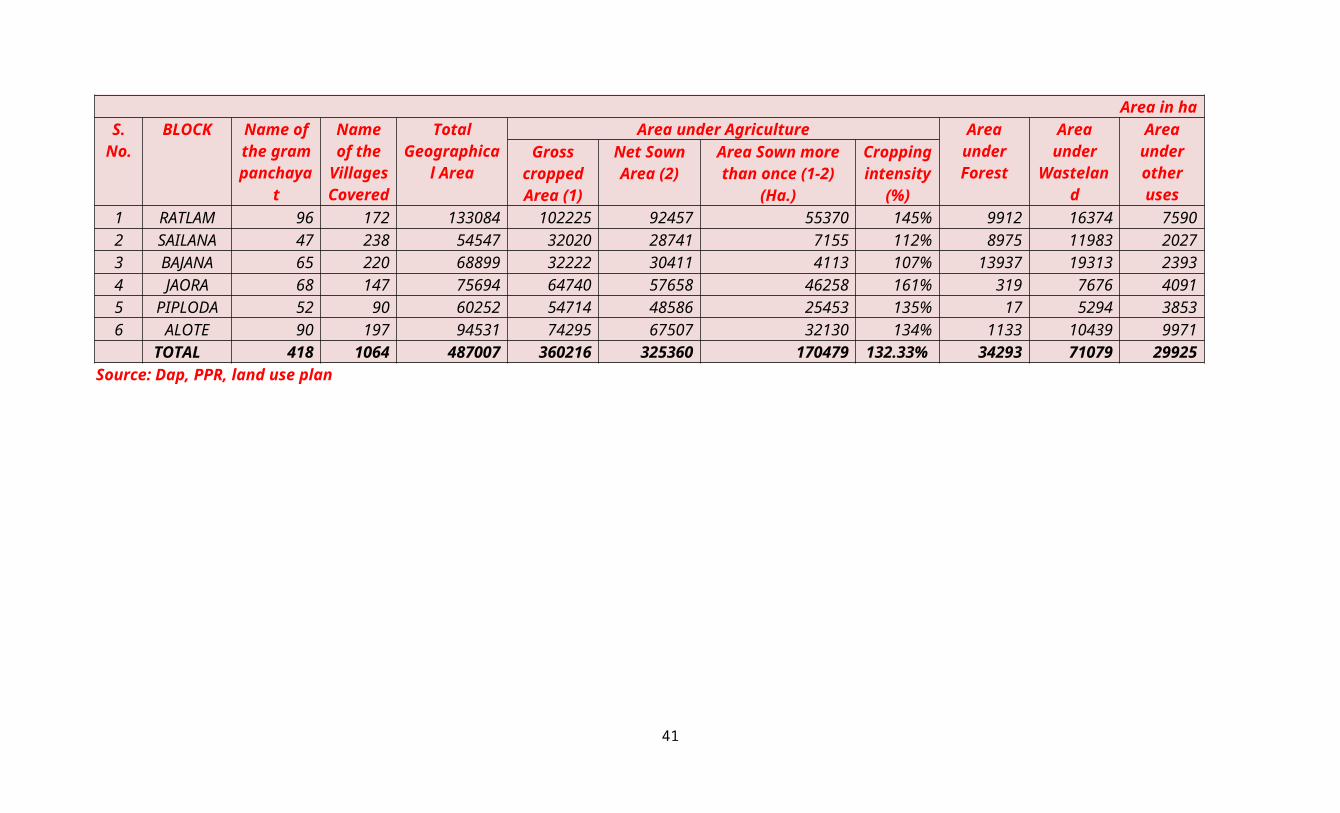
CHAPTER 1.7: LAND USE PATTERN OF THE DISTRICT: RATLAM
Area in haS.
No.BLOCK Name of
the gram panchayat
Name of the
Villages Covered
Total Geographical
Area
Area under Agriculture Area under Forest
Area under Wasteland
Area under other uses
Gross cropped Area (1)
Net Sown Area (2)
Area Sown more than once (1-2) (Ha.)
Cropping intensity
(%)1 RATLAM 96 172 133084 102225 92457 55370 145% 9912 16374 75902 SAILANA 47 238 54547 32020 28741 7155 112% 8975 11983 20273 BAJANA 65 220 68899 32222 30411 4113 107% 13937 19313 23934 JAORA 68 147 75694 64740 57658 46258 161% 319 7676 40915 PIPLODA 52 90 60252 54714 48586 25453 135% 17 5294 38536 ALOTE 90 197 94531 74295 67507 32130 134% 1133 10439 9971
TOTAL 418 1064 487007 360216 325360 170479 132.33% 34293 71079 29925Source: Dap, PPR, land use plan
34

35

36

CHAPTER - 2 DISTRICT WATER PROFILE
Irrigation is the artificial application of water to the land or soil. It is used to assist in the growing of agricultural crops, maintenance of landscapes, and revegetation of
disturbed soils in dry areas and during periods of inadequate rainfall. There is a great necessity of irrigation in Indian agriculture. India has a great diversity and variety of
climate and weather conditions. These conditions range from extreme of heat to extreme of cold and from extreme dryness to excessive rainfall. Due to some reasons irrigation is
needed in Indian agriculture.
Uncertainty of Monsoon rainfall both in time and place.
Irregularity in distribution of rainfall throughout the year.
Excessive rainfall causing flood.
Draught is an annual event in some areas.
India is a land of Rabi Crops. But there is not rainfall in winter months.
Some soils need more water.
Introduction of H.Y.V seeds and multiple cropping need water throughout the year.
The types of Irrigation mainly practiced in India are:
Tanks(a) Irrigation tanks (b) Perolation tanks
Well(a) Dug Well (b) Tube Well: (i) Shallow. (ii) Deep.
Canal(a) Perennial (b) Non-Perennial
37

2.1. CROP WATER REQUIREMENT
Crop water requirement is the water required by the plants for its survival, growth, development and to produce economic parts. This requirement is applied either
naturally by precipitation or artificially by irrigation. Hence the crop water requirement includes all losses like:
a) Transpiration loss through leaves (T)
b) Evaporation loss through soil surface in cropped area (E)
c) Amount of water used by plants (WP) for its metabolic activities which is estimated as less than 1% of the total water absorption. These three components cannot be
separated so easily. Hence the ET loss is taken as crop water use or crop water consumptive use.
d) Other application losses are conveyance loss, percolation loss, runoff loss, etc., (WL).
e) The water required for special purposes (WSP) like pudding operation, plugging operation, land preparation, leaching, requirement, for the purpose of weeding, for
dissolving fertilizer and chemical, etc. Hence the water requirement is symbolically represented as:
WR = T + E + WP + WL + WSP
(The other application losses and special purposes are mostly indented for wet land cultivation. Hence for irrigated dry land crop the ET loss alone is accounted for crop
water requirement). The estimations of the water requirement of crop are one of the basic needs for crop planning on the farm and for the planning of any irrigation project.
38

39
CHAPTER 2.1: AREA-WISE, CROP-WISE IRRIGATION STATUS OF THE DISTRICT: RATLAMName of District – RATLAMName of the Block : SAILANA
Crop Type Kharif (Area in ha) Rabi (Area in ha) Summer Crop (Area in
ha) Total (Area in ha) Horticulture & Plantation Crops (Area in ha)
Irrigated Rainfed Total Irrigated Rainfed Total Irrigated Rainfed Total Irrigated Rainfed Total Irrigated Rainfed TotalA) Cereals 0 8805 8805 4510 0 4510 12 0 12 4522 8805 13327 0 0 0B) Coarse Cereals 0 0 0 0 0 0 0 0 0 0 0 0 0 0 0C) Pulses 0 1210 1210 1995 0 1995 18 0 18 2013 1210 3223 0 0 0D) Oil Seeds 0 9450 9450 650 0 650 0 0 0 650 9450 10100 0 0 0E) Fiber 0 5400 5400 0 0 0 0 0 0 0 5400 5400 0 0 0F) Any other Crops…… 0 0 0 0 0 0 0 0 0 0 0 0 725 180 905
Total 0 24865 24865 7155 0 7155 30 0 30 7185 24865 32050 725 180 905SOURCE: DEPARTMENT OF AGRICULTURE, AGRICULTURE STATISTIC OF STATE AGRISTAT
Name of District – RATLAMName of the Block : BAJANA
Crop Type Kharif (Area in ha) Rabi (Area in ha) Summer Crop (Area in ha) Total (Area in ha) Horticulture & Plantation
Crops (Area in ha)Irrigated Rainfed Total Irrigated Rainfed Total Irrigated Rainfed Total Irrigated Rainfed Total Irrigated Rainfed Total
A) Cereals 0 8305 8305 2520 0 2520 14 0 14 2534 8305 10839 0 0 0
B) Coarse Cereals 0 0 0 0 0 0 0 0 0 0 0 0 0 0 0
C) Pulses 0 980 980 943 0 943 17 0 17 960 980 1940 0 0 0
D) Oil Seeds 0 11920 11920 650 0 650 0 0 0 650 11920 12570 0 0 0
E) Fiber 0 7000 7000 0 0 0 0 0 0 0 7000 7000 0 0 0F) Any other Crops…… 0 0 0 0 0 0 0 0 0 0 0 0 554 135 689
Total 0 28109 28109 4113 0 4113 31 0 31 4144 28205 32349 554 135 689
40
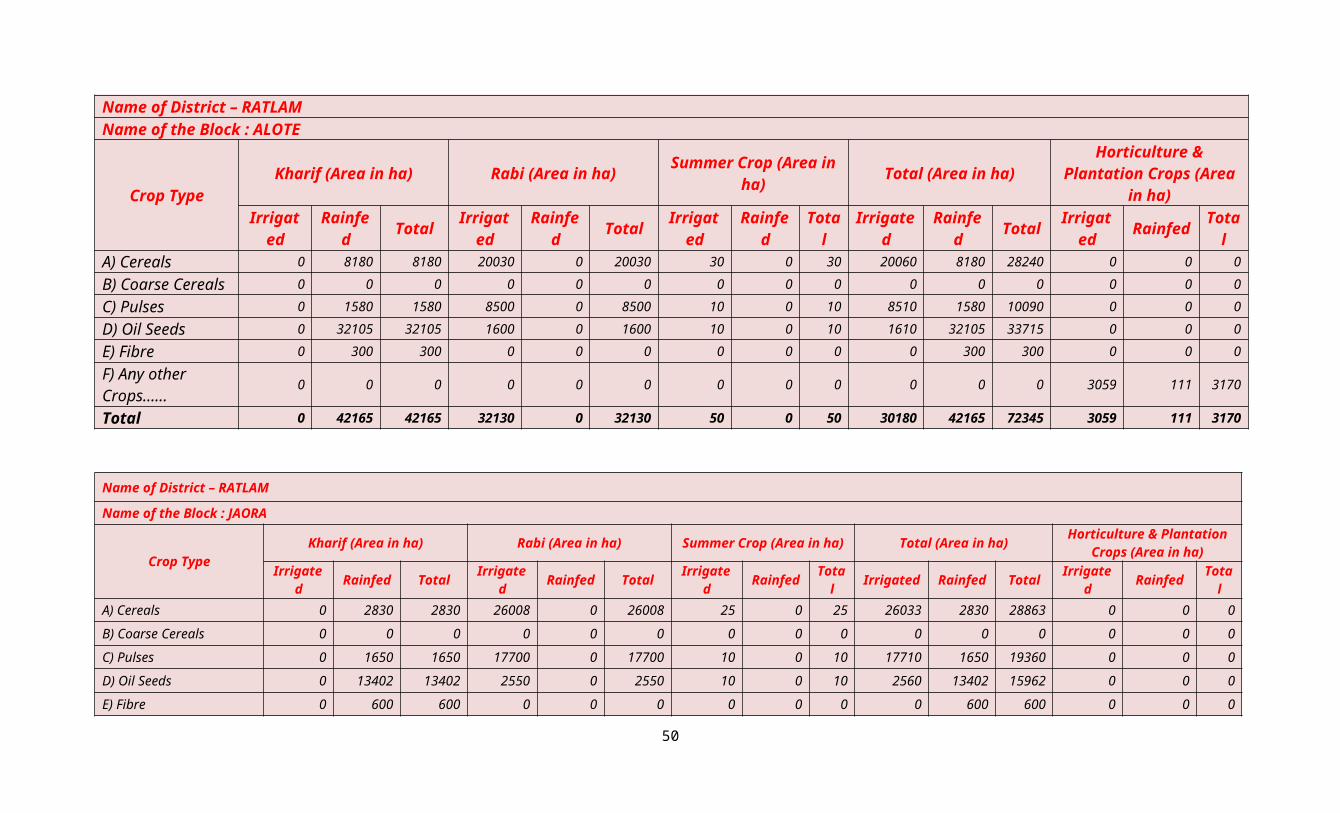
Name of District – RATLAMName of the Block : ALOTE
Crop Type Kharif (Area in ha) Rabi (Area in ha) Summer Crop (Area in
ha) Total (Area in ha) Horticulture & Plantation Crops (Area in ha)
Irrigated Rainfed Total Irrigated Rainfed Total Irrigated Rainfed Total Irrigated Rainfed Total Irrigated Rainfed Total
A) Cereals 0 8180 8180 20030 0 20030 30 0 30 20060 8180 28240 0 0 0
B) Coarse Cereals 0 0 0 0 0 0 0 0 0 0 0 0 0 0 0
C) Pulses 0 1580 1580 8500 0 8500 10 0 10 8510 1580 10090 0 0 0
D) Oil Seeds 0 32105 32105 1600 0 1600 10 0 10 1610 32105 33715 0 0 0
E) Fibre 0 300 300 0 0 0 0 0 0 0 300 300 0 0 0
F) Any other Crops……
0 0 0 0 0 0 0 0 0 0 0 0 3059 111 3170
Total 0 42165 42165 32130 0 32130 50 0 50 30180 42165 72345 3059 111 3170
Name of District – RATLAM
Name of the Block : JAORA
Crop Type Kharif (Area in ha) Rabi (Area in ha) Summer Crop (Area in ha) Total (Area in ha) Horticulture & Plantation
Crops (Area in ha)Irrigated Rainfed Total Irrigated Rainfed Total Irrigated Rainfed Total Irrigated Rainfed Total Irrigated Rainfed Total
A) Cereals 0 2830 2830 26008 0 26008 25 0 25 26033 2830 28863 0 0 0
B) Coarse Cereals 0 0 0 0 0 0 0 0 0 0 0 0 0 0 0
C) Pulses 0 1650 1650 17700 0 17700 10 0 10 17710 1650 19360 0 0 0
D) Oil Seeds 0 13402 13402 2550 0 2550 10 0 10 2560 13402 15962 0 0 0
E) Fibre 0 600 600 0 0 0 0 0 0 0 600 600 0 0 0
F) Any other Crops…… 0 0 0 0 0 0 0 0 0 0 0 0 1374 128 1502
Total 0 18482 18482 46258 0 46258 45 0 45 46303 18482 64785 1374 128 1502
41

Name of District – RATLAMName of the Block : RATLAM
Crop Type Kharif (Area in ha) Rabi (Area in ha) Summer Crop (Area in
ha) Total (Area in ha) Horticulture & Plantation Crops (Area in ha)
Irrigated Rainfed Total Irrigated Rainfed Total Irrigated Rainfed Total Irrigated Rainfed Total Irrigated Rainfed Total
A) Cereals 0 9250 9250 31040 0 31040 35 0 35 31075 9250 40325 0 0 0
B) Coarse Cereals 0 0 0 0 0 0 0 0 0 0 0 0 0 0 0
C) Pulses 0 2150 2150 22580 0 22580 20 0 20 22600 2150 24750 0 0 0
D) Oil Seeds 0 29453 29453 1750 0 1750 15 0 15 1765 29453 31218 0 0 0
E) Fibre 0 6000 6000 0 0 0 0 0 0 0 6000 6000 0 0 0
F) Any other Crops……
0 0 0 0 0 0 0 0 0 0 0 0 2664 310 2974
Total 0 46855 46855 55370 0 55370 70 0 70 55440 46853 102293 2664 310 2974
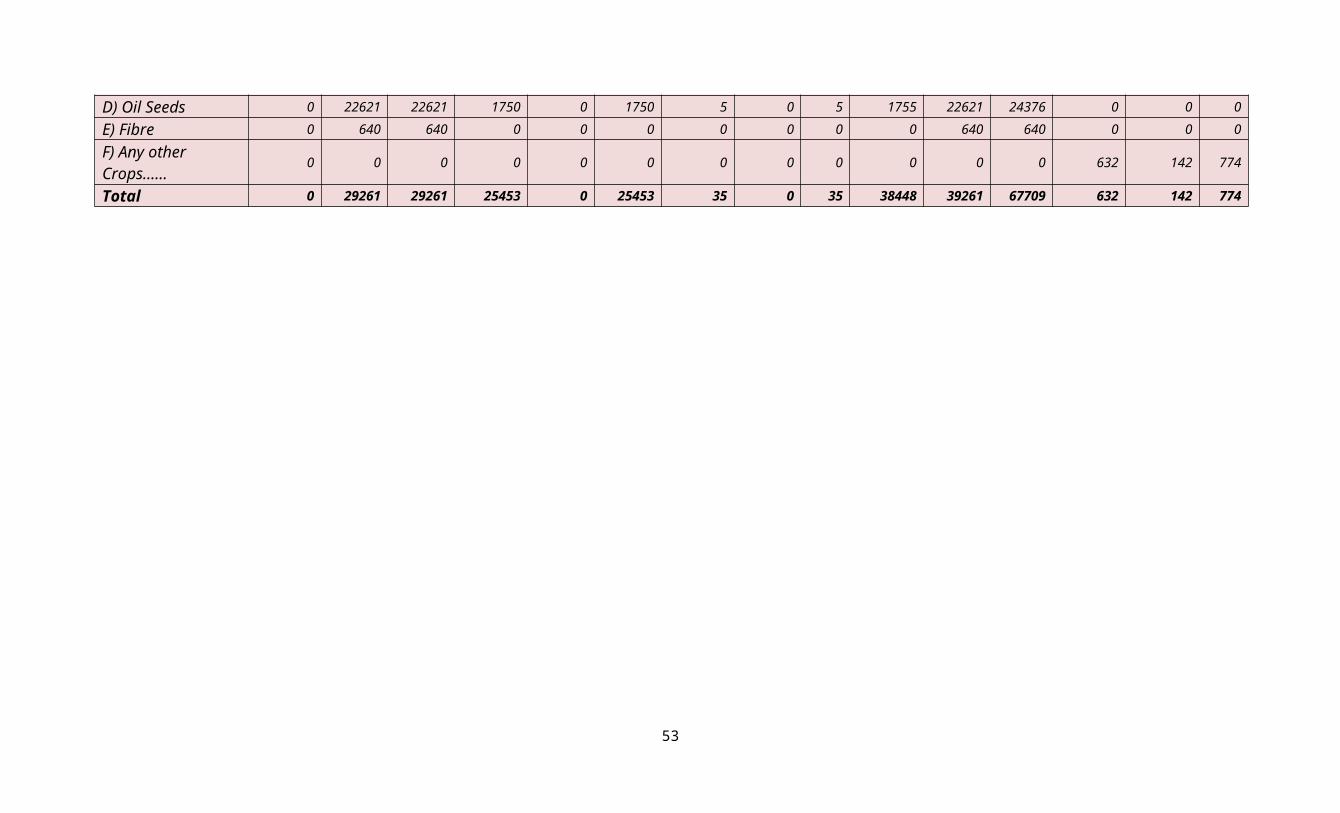
Name of District – RATLAMName of the Block : PIPLODA
Crop Type Kharif (Area in ha) Rabi (Area in ha) Summer Crop (Area in
ha) Total (Area in ha) Horticulture & Plantation Crops (Area in ha)
Irrigated Rainfed Total Irrigated Rainfed Total Irrigated Rainfed Total Irrigated Rainfed Total Irrigated Rainfed Total
A) Cereals 0 3770 3770 22000 0 22000 15 0 15 22015 3770 25785 0 0 0
B) Coarse Cereals 0 0 0 0 0 0 0 0 0 0 0 0 0 0 0
C) Pulses 0 2230 2230 14663 0 14663 15 0 15 14678 2230 16908 0 0 0
D) Oil Seeds 0 22621 22621 1750 0 1750 5 0 5 1755 22621 24376 0 0 0
E) Fibre 0 640 640 0 0 0 0 0 0 0 640 640 0 0 0
F) Any other Crops……
0 0 0 0 0 0 0 0 0 0 0 0 632 142 774
42

Total 0 29261 29261 25453 0 25453 35 0 35 38448 39261 67709 632 142 774
43

44

CHAPTER 2.2: PRODUCTION OF PRODUCTIVITY OF THE DISTRICT: RATLAMName of District: RATLAM
Name of the Block : SAILANA
Season
crop sown
Area (ha)
Rainfed Irrigated Total
cereals coarse cereals pulses oil
seedsFiber Crops
Any other Crops
Production (qtn/yr)
Productivity or yield (kgs/ha)
Cost of Cultivate
on (Rs.ha)
Production (qtn/yr)
Productivity (kgs/ha)
Cost of Cultivate
on (Rs./ha)
Production (qtn/yr)
Productivity (kgs/ha)
Cost of Cultivate
on (Rs./ha)
A. Kharif 8805 0 1210 14450 6300 0 30765 707595 3200 17000 0 0 0 707595 3200 17000
B. Rabi 7510 0 5350 650 0 0 13510 0 0 0 337750 2500 19000 337750 2500 19000
Summer 12 0 18 0 0 0 30 0 0 0 450 18000 18000 450 18000 18000Horticultural& Plantation 0 0 0 0 0 0 0 0 0 0 0 0 0 0 0 0
Total 16327 0 6578 15100 6300 0 44305 707595 3200 17000 338200 20500 37000 1045795 23700 54000SOURCE: DEPARTMENT OF AGRICULTURE, AGRICULTURE STATISTIC
Name of District: RATLAM
Name of the Block : BAJNA
Season
crop sown
Area (ha)
Rainfed Irrigated Total
cereals coarse cereals pulses oil
seedsFiber Crops
Any other Crops
Production (qtn/yr)
Productivity or yield (kgs/ha)
Cost of Cultivate
on (Rs.ha)
Production (qtn/yr)
Productivity (kgs/ha)
Cost of Cultivate
on (Rs./ha)
Production (qtn/yr)
Productivity (kgs/ha)
Cost of Cultivate
on (Rs./ha)
A. Kharif 8305 0 980 13620 7000 0 29905 687815 3200 17000 0 0 0 687815 3200 17000
B. Rabi 6520 0 4050 650 0 0 11520 0 0 0 288000 2500 19000 288000 2500 19000
Summer 14 0 17 0 0 0 31 0 0 0 465 18000 18000 465 18000 18000Horticultural& Plantation 0 0 0 0 0 0 0 0 0 0 0 0 0 0 0 0
Total 14839 0 5047 14270 7000 0 41456 687815 3200 17000 288465 20500 37000 976280 23700 54000
45

Name of District: RATLAM
Name of the Block : RATLAM
Season
crop sown
Area (ha)
Rainfed Irrigated Total
cereals coarse cereals pulses oil
seedsFiber Crops
Any other Crops
Production (qtn/yr)
Productivity or yield (kgs/ha)
Cost of Cultivate
on (Rs.ha)
Production (qtn/yr)
Productivity (kgs/ha)
Cost of Cultivate
on (Rs./ha)
Production (qtn/yr)
Productivity (kgs/ha)
Cost of Cultivate
on (Rs./ha)
A. Kharif 9250 0 2150 67905 6000 0 85305 2132625 2500 17000 0 0 0 2132625 2500 17000
B. Rabi 31040 0 24825 1750 0 0 55590 0 0 0 1445340 2600 19000 1445340 2600 19000
Summer 35 0 20 15 0 0 70 0 0 0 1050 1500 18000 1050 1500 18000Horticultural& Plantation 0 0 0 0 0 0 0 0 0 0 0 0 0 0 0 0
Total 40325 0 26995 69670 6000 0 140965 2132625 2500 17000 1446390 4100 37000 3579015 6600 54000
Name of District: RATLAM
Name of the Block : ALOTE
Season
crop sown
Area (ha)
Rainfed Irrigated Total
cereals coarse cereals pulses oil
seedsFiber Crops
Any other Crops
Production (qtn/yr)
Productivity or yield (kgs/ha)
Cost of Cultivate
on (Rs.ha)
Production (qtn/yr)
Productivity (kgs/ha)
Cost of Cultivate
on (Rs./ha)
Production (qtn/yr)
Productivity (kgs/ha)
Cost of Cultivate
on (Rs./ha)
A. Kharif 8180 0 1580 51465 300 0 61525 1538125 2500 17000 0 0 0 1538125 2500 17000
B. Rabi 22030 0 13150 1600 0 0 36780 0 0 0 956280 2600 19000 956280 2600 19000
Summer 30 0 10 10 0 0 50 0 0 0 750 1500 18000 750 1500 18000Horticultural& Plantation 0 0 0 0 0 0 0 0 0 0 0 0 0 0 0 0
Total 30240 0 14740 53075 300 0 98355 1538125 2500 17000 957030 4100 37000 2495155 6600 54000
46

Name of District: RATLAM
Name of the Block : JAORA
Season
crop sown
Area (ha)
Rainfed Irrigated Total
cereals coarse cereals pulses oil
seedsFiber Crops
Any other Crops
Production (qtn/yr)
Productivity or yield (kgs/ha)
Cost of Cultivate
on (Rs.ha)
Production (qtn/yr)
Productivity (kgs/ha)
Cost of Cultivate
on (Rs./ha)
Production (qtn/yr)
Productivity (kgs/ha)
Cost of Cultivate
on (Rs./ha)
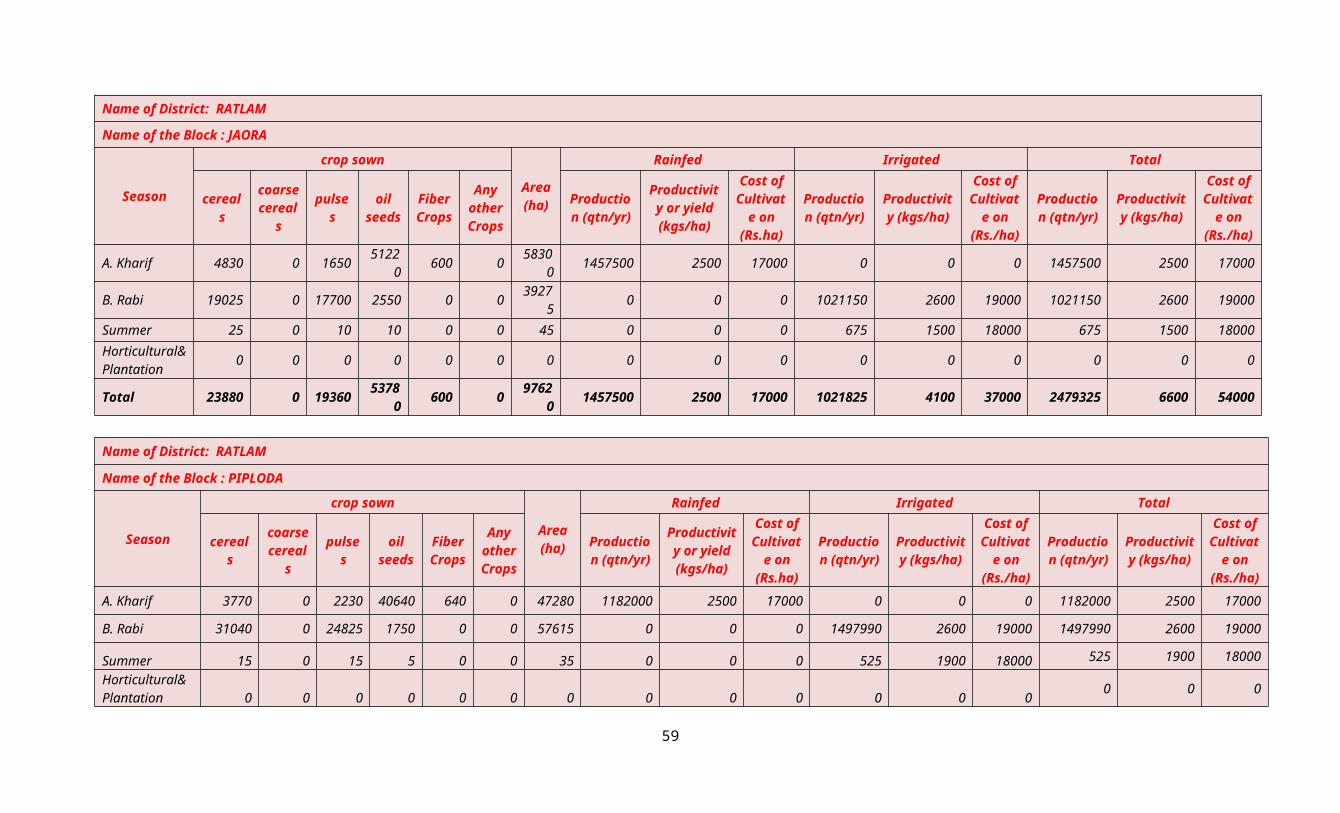
A. Kharif 4830 0 1650 51220 600 0 58300 1457500 2500 17000 0 0 0 1457500 2500 17000
B. Rabi 19025 0 17700 2550 0 0 39275 0 0 0 1021150 2600 19000 1021150 2600 19000
Summer 25 0 10 10 0 0 45 0 0 0 675 1500 18000 675 1500 18000Horticultural& Plantation 0 0 0 0 0 0 0 0 0 0 0 0 0 0 0 0
Total 23880 0 19360 53780 600 0 97620 1457500 2500 17000 1021825 4100 37000 2479325 6600 54000
Name of District: RATLAM
Name of the Block : PIPLODA
Season
crop sown
Area (ha)
Rainfed Irrigated Total
cereals coarse cereals pulses oil
seedsFiber Crops
Any other Crops
Production (qtn/yr)
Productivity or yield (kgs/ha)
Cost of Cultivate
on (Rs.ha)
Production (qtn/yr)
Productivity (kgs/ha)
Cost of Cultivate
on (Rs./ha)
Production (qtn/yr)
Productivity (kgs/ha)
Cost of Cultivate
on (Rs./ha)
A. Kharif 3770 0 2230 40640 640 0 47280 1182000 2500 17000 0 0 0 1182000 2500 17000
B. Rabi 31040 0 24825 1750 0 0 57615 0 0 0 1497990 2600 19000 1497990 2600 19000
Summer 15 0 15 5 0 0 35 0 0 0 525 1900 18000 525 1900 18000
Horticultural& Plantation 0 0 0 0 0 0 0 0 0 0 0 0 0 0 0 0
Total 34825 0 27070 42395 640 0 104930 1182000 2500 17000 1498515 4500 37000 2680515 7000 54000
47

48

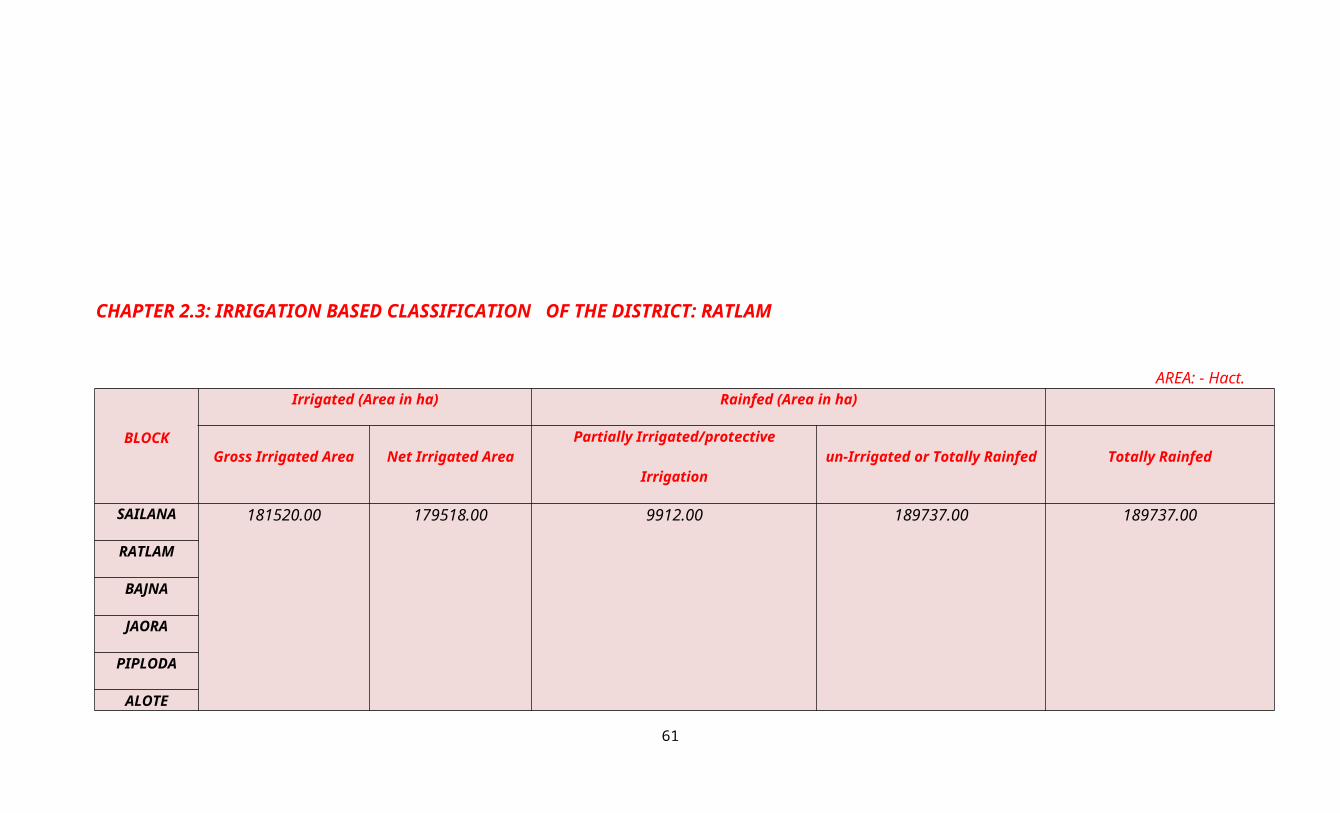
CHAPTER 2.3: IRRIGATION BASED CLASSIFICATION OF THE DISTRICT: RATLAM
AREA: - Hact.
BLOCKIrrigated (Area in ha) Rainfed (Area in ha)
Gross Irrigated Area Net Irrigated Area Partially Irrigated/protective Irrigation un-Irrigated or Totally Rainfed Totally Rainfed
SAILANA
181520.00 179518.00 9912.00 189737.00 189737.00
RATLAM
BAJNA
JAORA
PIPLODA
ALOTE
SOURCE: AGRICULTURE STATISTIC, IRRIGATION STATISTIC OF CWC, INDIAN, OPEN GOVERNMENT DATA
49
CHAPTER - 3 WATER AVAILABILITY
3.1. STATUS OF WATER AVAILABILITY
Estimation of Ground Water Resources has been carried out based on the methodology recommended by the Groundwater Estimation Committee (GEC’97). A ground water resource of the entire state has been computed by CGWB (CGWB, NCCR, 2011) for the year 2008-2009. Salient features of the estimation of ground water resources are described below.
The present computations pertain to the ground water year 2008-09. The resources have been computed block wise. Areas having slope more than 20 % were excluded from recharge computations. Ground water recharge and draft were computed separately for command and non-command areas. The present Ground Water Development in the district has been calculated for command area and non-command area separately for each block. All the blocks in the study area have been categorized as safe from ground water abstraction point of view.
The overall ground water development in the district is moderate except for the Ratlam block which has a higher stage of development. This may be attributed to the high stage of development in the urban area.
The ground water development in the district is being done by dug wells and bore-wells. The dug well depth varies from 5 to 20 m and the diameter varies from 2 to 4 m. The bore wells drilled in the area are 60 to 200 m deep with diameter of 100 to 150 mm.
Ground water is the main source of drinking in the district covering 906 no. of villages. The contribution of ground water for irrigation comes to nearly 59% of the net sown area. The use of ground water for irrigation purpose in non-command area is maximum. The ground water development in the district is mainly for domestic and irrigation purposes. Nearly 79% of the population is living in the rural areas.
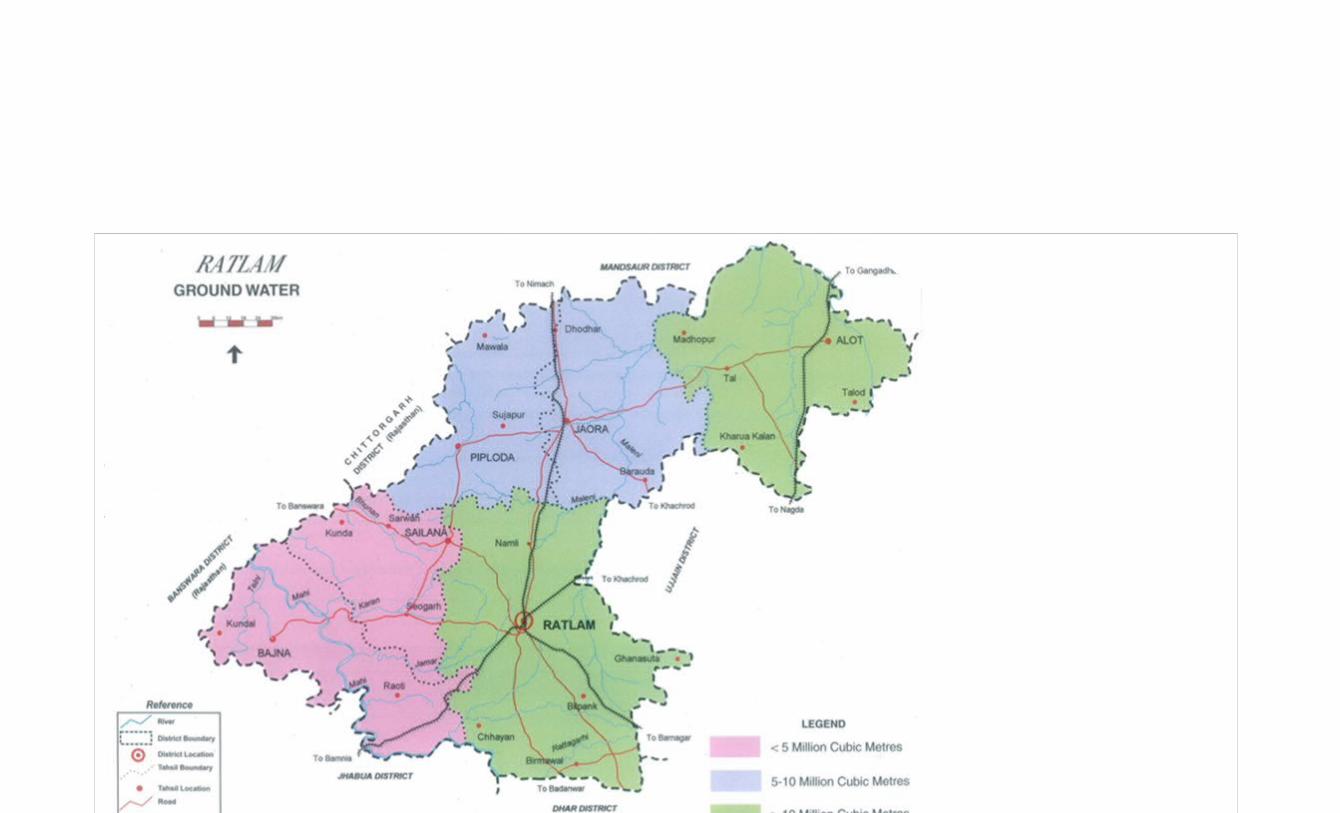
The stage of the ground water development estimated for Ratlam block 28%, Bajna block 19%, Piploda block 22%, Jaora block 24%, Sailana block 07% . The ground water development is maximum in Ratlam block.
Surface water is water on the surface of the planet such as in a stream, river, lake, wetland, or pond/tank. It can be contrasted with groundwater and atmospheric water. No saline surface water is replenished by precipitation and by recruitment from ground-water. It is lost through evaporation, seepage into the ground where it becomes ground-water, used by plants for transpiration, extracted by mankind for agriculture, living, industry etc. or discharged to the sea where it becomes saline.
To derive Surface Water volume basically, we measure volumes and surface areas of a set of farm ponds and tanks, then develop a relationships between surface areas and volumes. After that using these relationships clouted volumes of the whole study region surface water bodies based on our remote-sensing surface area.
50

CHAPTER 3.1: SURFACE OF WATER AVAILABILITY OF THE DISTRICT: RATLAM
Name of the Block : SAILANA, BAJNA, RATLAM, PIPLODA, JAORA,ALOTE3.1 Status of Water Availability
BCM Per Ha
S. No. Sources Kharif Rabi Summer Total1 Surface Irrigation (i) Canal (Major&Medium Irrigation) 1399 5121 0 0.02355(ii) Minor Irrigation tanks 3330 13100 0 0.06026(iii) Lift Irrigation/Diversion 0 0 0 0(iv) Various Water Bodies including Rain Water Harvesting 0 0 0 0(v) Treated Effluent Received from STD 0 0 0 0(vi) Untreated Effluent 0 0 0 0(vii) Perennial Sources of Water 0 0 0 0
2 Ground water 0 0 0 0(i) Open Well 0 0 0 0(ii) Deep Tube Well 0 0 0 0(iii) Medium Tube Well 0 0 0 0(iv) Shallow Tube Well 0 0 0 0
Total 4729 18221 0 0.08381
SOURCE: CWC, CGWB, DISTRICT IRRIGATION AND AGRICULTURE OFFICE RECODES
51

52
CHAPTER 3.2: STATUS OF GROUND WATER AVAILABILITY OF THE DISTRICT: RATLAM
BLOCK Status of Block as Central Ground Water Board Notification Ground Water (BCM)
Over exploited Critical Semi-Critical Safe Draught Recharge Gap
SAILANA NO NO YES NO NO NO -
RATLAM YES NO NO NO YES - -
BAJANA NO NO NO YES NO NO NO
JAORA YES NO NO NO YES - -
PIPLODA YES NO NO NO YES - -
ALOTE YES NO NO NO YES - -
Source: MINISTORY OF WATER RESOURES (GOVT. OF INDIA)
53

54

CHAPTER 3.3: STATUS OF COMMAND AREA OF THE DISTRICT: RATLAMBLOCK: - SAILANA, BAJNA, RATLAM, ALOTE, JAORA, PIPLODA
S. No. Name of the
Village
Information of Canal Command Information of the other services Command Total Area
Total Area Developed Area undeveloped Area Total AreaDeveloped
Area
undeveloped
Area
Developed
Command
undeveloped
Command
1 2 3 4 5 6 7 8 4+7 5+8
1 Dholawad Tank 5121 5121 0 0 0 0 5121 0
2 Minor (75 Nos.) 17150 17150 0 0 0 0 17150 0
Total 22271 22271 0 0 0 0 22271 0
Source: CADA, CGWB
CHAPTER 3.4: EXISTING TYPE OF IRRIGATION OF THE DISTRICT: RATLAMBLOCK: - SAILANA, BAJNA, RATLAM, ALOTE, JAORA, PIPLODA
Source of Irrigation Surface Irrigation (1) Ground Water (2) other
sources Including
Tradit ional
WHS (3)
Treated effuent
discharged from
STD
Water extraction devices/Lift Total
Canal Based Tanks/Ponds/Reservoirs Tube Wells Open Wells Bore Well Electricity Pump
(4)
Diesel
Pump (5)
Others (6)
Irrigation
Sources (1+2+3)
Water extracting units (4+5+6)
Govt. canal
Commumity/
pvt. Canal
Community Ponds
Including Small
Individual/pvt. Ponds
Govt. Reservoir/Da
ms
Govt.
Pvt.
Community /Govt.
Pvt.
Govt.
Pvt.
1 2 3 4 5 6 7 8 9 10 11 12 13 14 15 16 17 18 19
By Tank175.38 0 0 0 75 0 0 0 0 0 0 0 0 0 0 0 75 0
149.67 0 1 0 1 0 0 0 0 0 0 0 0 0 0 0 1 0
Total 325.05 0 1 0 76 0 0 0 0 0 0 0 0 0 0 0 76 0
Command Area (Ha.) 22950 0 0 0 0 0 0 0 0 0 0 0 0 0 0 0 76 0
Source: NWDA, CGG
55

CHAPTER- 4 -WATER REQUIREMENT/ DEMAND:
4.1. DOMESTIC WATER DEMAND
According to Froukh the term ‘domestic water demand’ is the amount of water required for domestic uses. Water demand forecasting is essential to water utilities, both for
day-to-day operations and for long-term planning. A number of factors like climate, culture, food habits, work and working conditions, level and type of development, and
physiology determine the requirement of water. As per the Bureau of Indian Standards, a minimum water supply of 200 litres per capita per day (lpcd) should be provided for
domestic consumption in cities with full flushing systems. It also mentions that the amount of water supply may be reduced to 135 lpcd for the LIG and the economically weaker
sections (EWS) of the society and in small towns.
Domestic Water Requirement/Demand
Domestic Water Demand Source: CWC, Department of Water Resources in District and Status Report
Blocks 2011 Population in 2015 Projected Population in 2020 Gross Water Demand (BCM)
SAILANA 148155 229640 332975 0.085075
BAJNA 198849 208214 446909 0.114185
ALOTE 206653 320308 464443 0.118665
RATLAM 313640 486140 704900 0.180101
PIPLODA 147286 228291 331021 0.084575
JAORA 184176 285471 413931 0.105759
Total 1198759 1758064 2694179 0.68836
56

4.2. CROP WATER DEMAND:
It is essential to know the water requirement of a crop which isthe total quantity of water required from its sowing time up to harvest. Naturally different crops may have different water requirements at different places of the same country, depending upon the climate, type of soil, method of cultivation, effective rain etc. The total water required for crop growth isnot uniformly distributed over its entire life span which is also called crop period. Actually, the watering stops same time before harvest and the time duration from the first irrigation during sowing up to the last before harvest is called base period. Though crop period is slightly more than the base period, they do not differ from practical purposes. The total depth of water required to raise a crop over a unit area of land is usually called delta. Some typical values of delta for common crops in some regions of India are as follows:
Wheat• 450 mm in northern India• 500 mm to 600 mm in Central India
Maize•100mm during rainy season•Cotton: 900 mm
Pulses• 430 mm
Oil Seed•365mm
Sugarcane•2200mm to 2400mm in Madhya Pradesh
Horticulture Crops• 600 mm
This information is based on Handbook of Agriculture (fifth edition, 2000) published by the Indian Council of Agricultural Research.
Crop water requirement is calculated based on water depth required for each crop and area sown given in table 4.2. 45% percent of whole crop water is consumed by paddy crop only. Total crop water demand for 2015 is 1.075731 BCM. Existing water availability is 0.943329 BCM. Hence 0.132402 BCM potential has to be created for 2015.
Additional projected irrigated one up year 2020 in estimated 155932 Hact, for this additional Area, Irrigation facility need 0.0935952 BCM water potential to be created Hence total water potential in to be created in 1.068354 BCM
57

CHAPTER 4.2: CROP WATER REQUIREMENT DISTRICT: RATLAMPIPLODA, SAILANA, BAJANA, RATLAM, A LOTE, JAORA
Crops Area sown (ha)
Irrigated area (ha)
Crop water
demand (mm)
Water potential required (BCM)
Existing water Potential (BCM)
Water potential to be created (BCM)
Additional projected irrigated area upto
2020
Water potential required (BCM)
Total Water potential to be created (BCM)
1 2 3 4 5 6 7 8 9 10A) Cereals Wheat 139946 96675 450 0.4350375 0.394532 0.0405055 71580 0.32211 0.3626155B) Coarse Cereals Maize 0 0 0 0 0 0 0 0 0C) Pulses (Tuar + Gram 73515 63625 430 0.2735835 0.2024561 0.0711274 40039 0.172168 0.2432951D) Oil Seeds 245490 6150 365 0.0224475 0.01624561 0.00620189 10500 0.038325 0.04452689E) Fiber 20840 5000 900 0.45 0.3804572 0.0695428 5000 0.045 0.1145428F) Horticulture Crop 10014 9008 600 0.054048 0.0423641 0.0116839 5500 0.033 0.0446839Total 489805 180458 1.235117 1.036055 0.19906149 132619 0.6106 0.80966419
Block Crops Area Sown (ha) Irrigated area (ha) Crop water demand (mm)
Water Potential Requirement (BCM)
Existing water potential (BCM)
Water potential to be created (BCM)
SAILANA All Crops 28741 13510 2251 0.160126 0.00355835555 0.076226BAJANA All Crops 30411 11220 2251 0.1153395 0.051902775 0.53397885ALOTE All Crops 67507 36780 2251 0.15474175 0.069636375 0.18506332
RATLAM All Crops 92457 57615 2251 0.00576 0.002592 0.2913109375PIPLODA All Crops 48586 36778 2251 0.0001 0.000045 0.3054873
JAORA All Crops 57758 29475 2251 0.2167308Total 325460 185378 2251 0.43606725 0.127734506 1.6087972075
A) Cereals Wheat 460 mm B) Pulses (Tuar + Gram) 426mm D) Oil Seeds 326mm E) Fibre 900mm F) Any Other 100mm
58
Block Crops Area Sown (ha) Irrigated area (ha) Crop water demand (mm)
Water Potential Requirement (BCM)
Existing water potential (BCM)
Water potential to be created (BCM)
JAORA Cerals 23880 23880 460 0.109848 0.04943168 0.06041632Pulses 19350 19350 426 0.082431 0.03709395 0.04533705Oil Seeds 53780 53780 365 0.196297 0.08833365 0.10796335Fiber 600 600 900 0.0054 0.00243 0.00297Any Other 80 80 100 0.00008 0.000036 0.000044
Total 97690 97690 2251 0.394056 0.17732528 0.21673072
Block Crops Area Sown (ha) Irrigated area (ha) Crop water demand (mm)
Water Potential Requirement (BCM)
Existing water potential (BCM)
Water potential to be created (BCM)
ALOTE Cerals 30240 30240 460 0.139104 0.0625968 0.0765072Pulses 1580 1580 426 0.0067308 0.00302886 0.00370194Oil Seeds 51465 51465 365 0.1878473 0.08453126 0.10331604Fiber 380 380 900 0.0038 0.000171 0.003629Any Other 300 300 100 0.0027 0.001215 0.001485
Total 83965 83965 2151 0.3374821 0.15032792 0.18863918
Block Crops Area Sown (ha) Irrigated area (ha) Crop water demand (mm)
Water Potential Requirement (BCM)
Existing water potential (BCM)
Water potential to be created (BCM)
RATLAM Cerals 20290 20290 460 0.185334 0.0834003 0.1019337Coarse Cerals 250 250 100 0.00025 0.0001125 0.0001375Pulses 2150 2150 426 0.009159 0.00412155 0.00503745Oil Seeds 76905 76905 365 0.2807033 0.12631646 0.15438684Fiber 6000 6000 900 0.054 0.0243 0.0297Any Other 210 210 100 0.00021 0.0000945 0.0001155
Total 125805 125805 2351 0.5296563 0.23834531 0.29131099
59

Block Crops Area Sown (ha) Irrigated area (ha) Crop water demand (mm)
Water Potential Requirement (BCM)
Existing water potential (BCM)
Water potential to be created (BCM)
BAJANA Cerals 6520 6520 460 0.029992 0.005998 0.023994Coarse Cerals 8305 8305 100 0.008305 0.00041525 0.00788975Pulses 980 980 426 0.0041748 0.00020874 0.00396606Oil Seeds 8305 8305 365 0.0156585 0.00078293 0.01487557Fiber 310 310 900 0.00279 0.0001395 0.0026505Any Other 15 15 100 0.000015 0.00000015 0.00001485
Total 24435 24435 2351 0.0609353 0.00754457 0.053390730
Block Crops Area Sown (ha) Irrigated area (ha) Crop water demand (mm)
Water Potential Requirement (BCM)
Existing water potential (BCM)
Water potential to be created (BCM)
SAILANA Cerals 6590 6590 460 0.02965 0.014825 0.014825Coarse Cerals 8805 8805 100 0.00435 0.0010875 0.0032625Pulses 1210 1210 426 0.0051546 0.0000515 0.0051031Oil Seeds 1510 1510 365 0.0266815 0.01462 0.0120615Fiber 6300 6300 900 0.0567 0.01575 0.04095Any Other 30 30 100 0.00003 0.00001 0.00002
Total 6590 6590 2351 0.1225661 0.046344 0.0762221
60
CHAPTER 4.3: LIVESTOCK WATER DEMAND:
Global trend in animal production indicates a rapid and massive increase in the consumption of livestock products. It is predicted that meat and milk consumption will grow at 2.8 and 3.3% per annum, respectively, in developing countries like India where the whole system of rural economy has revolved around livestock production. Providing enough quality water is essential for good husbandry. Water makes up 80% of the blood, regulates body temperature and is vital for organ functions such as digestion, waste removal and the absorption of nutrients. Understanding daily livestock watering needs is key when designing a livestock watering system.
The daily water requirement of livestock varies significantly among animal species. The animal's size and growth stage will have a strong influence on daily water intake. Consumption rates can be affected by environmental and management factors. Air temperature, relative humidity and the level of animal exertion or production level are examples of these factors. The quality of the water, which includes temperature, salinity and impurities affecting taste and odors, will also have an effect. The water content of the animal's diet will influence its drinking habits. Feed with a relatively high moisture content decreases the quantity of drinking water required.
Given that drinking water needs are species-, farm- and management-specific, many producers today are opting to install water- etering equipment to obtain accurate measurements of water use. If medication is ever provided through the livestock's watering system, the meter can be used to ensure proper dose rates.
Table 4.3 gives block water demand for livestock for current year and for 2020. Number of livestock as per 2011 census is 728811. Estimation is done based on livestock water demand which is different for types of animals. There is no additional water requirement as stored water is more than water requirement. 25% of water is reserved for this purpose in all current and future structures.
LIVESTOCK WATER DEMAND
Small Animals / Poultry
Block Total nuber of live stock Present Water demand (BCM) Water demand in 2020 (BCM) Existing Water
potential (BCM)Water potential to be created (BCM)
SAILANA 31933 0.001748332 0.001940648 0.001590982 0.000349666RATLAM 46059 0.00252173 0.002799121 0.002269557 0.000529563BAJNA 40714 0.002229092 0.002474292 0.001983891 0.0004904JAORA 32344 0.001770834 0.001965626 0.001593751 0.000371875
PIPLODA 18535 0.001014791 0.001126418 0.000882868 0.00024355ALOTE 40077 0.002194216 0.002435579 0.00193091 0.00050467
Total 209662 0.011478995 0.012741684 0.010251959 0.002489724Water required 15 Lt. per day per animal
61

Large Animals
Block Total nuber of live stock Present Water demand (BCM) Water demand in 2020
(BCM)Existing Water potential
(BCM)Water potential to be
created (BCM)
SAILANA 65330 0.021460905 0.023821605 0.019529424 0.004292181
RATLAM 104383 0.034289816 0.038061695 0.030860834 0.007200861
BAJNA 76639 0.025175912 0.027945262 0.022406561 0.005538701
JAORA 80164 0.026333874 0.0292306 0.023700487 0.005530114
PIPLODA 76055 0.024984068 0.027732315 0.021736139 0.005996176
ALOTE 99845 0.032799083 0.036406982 0.028863193 0.007543789
Total 502416 0.165043656 0.183198458 0.147096637 0.036101822
Water required 90 Lt. per day per animal
62
TABLE 4-4 WATER CONSUMPTIONS BY ANIMALS / BIRDS
Water Consumptions by Animals / Birds
S. N. Livestock Category Water requirement
Range
Average Water Use L/
Day
1 Poultry 0.16-0.24 0.2
2 Small Animals 10-20 15
3 Large Animals 70-110 90
Source: Adapted from Nutrient requirements of poultry, Sheep, Cattles. 9th edition.
Washington, D.C.: National Research Council, 1994,
TABLE 4-5 WATER CONSUMPTIONS BY WILD LIFE
Water Consumptions by Animals / Birds
S. N. Livestock Category Water requirement
Range
Average Water Use L/
Day
1 Small Animals 0-20 10
2 Medium Animals 20-30 25
3 Large Animals 30-60 45
Source: Adapted from Nutrient requirements of poultry, Sheep, Cattles. 9th edition.
Washington, D.C.: National Research Council, 1994,
63

CHAPTER 4.4: INDUSTRIAL WATER DEMAND
In Madhya Pradesh, industry is the second highest consumer of water. The main sources of water for the industrial sector are groundwater and surface water.
Groundwater has emerged as an important source to meet the water requirements of industries. Choice of source of water depends on the availability of sufficient and regular
supply of water and the cost of water from the source. While the running cost of surface water is mainly the price paid to the supplier—the municipal bodies; the cost of
groundwater is the extraction cost—energy used (electricity/diesel). Since the prices of all the inputs, water, electricity, and diesel are administered or regulated by the
government, the inefficient use of water remains a normal practice. Since the surface water supply from municipal sources is not sufficiently guaranteed, industrial units tend to
depend on groundwater.
Net water demand for industries in the current year is 0.00682942 BCM. Industrial water demand for the year 2020 is estimated at 0.00695385 BCM. Data is obtained from CGWB and district industries department.
INDUSTRIAL WATER DEMAND
Block Name of the industry Water demand (BCM) Water demand in
2020 (BCM)
Existing Water
potential (BCM)
Water Potential to be created
(BCM)
RATLAM 213 0.000048 0.00024 0.000048 0.000192
SAILANA 3 0.000012 0.000060 0.000012 0.000048
BAJANA 0 0 0 0 0
JAORA 40 0.000024 0.00012 0.000024 0.000096
PIPLODA 0 0 0 0 0
ALOTE 0 0 0 0 0
Total 256 0.000084 0.00042 0.000084 0.000336
64

CHAPTER 4.5: WATER DEMAND FOR POWER GENERATION OF THE DISTRICT: RATLAM
Block Power requirement MW Water demand (BCM) Water demand in 2020 (BCM) Existing Water potential (BCM)
Water potential to be created (BCM)
RATLAM Nil Nil Nil Nil NilSAILANA Nil Nil Nil Nil Nil
BAJNA Nil Nil Nil Nil NilJAORA Nil Nil Nil Nil Nil
PIPLODA Nil Nil Nil Nil NilALOTE Nil Nil Nil Nil Nil
Total Nil Nil Nil Nil Nil
Source: NWDA, CGG
CHAPTER 4.6: TOTAL WATER DEMAND OF THE DISTRICT FOR VARIOUS SECTORS OF THE DISTRICT: RATLAM
S. No. Block Components Total, BCMDomestic (Mcm) Crop Livestock Industrial Power Generation1 SAILANA 0.085075 0.076226 0.000349660 0 0 0.161650662 BAJNA 0.114185 0.53397885 0.0004904 0 0 0.648654253 ALOTE 0.118665 0.18506332 0.00050467 0.000096 0 0.304328994 RATLAM 0.180101 0.2913109375 0.000529563 0.000048 0 0.4719895015 PIPLODA 0.084575 0.3054873 0.00024355 0 0 0.390305856 JAORA 0.105759 0.2167308 0.000371875 0.000192 0 0.323053675
TOTAL 0.68836 1.6087972075 0.002489718 0.000336 0 2.299982926
NOTE :- ACTUAL IRRIGATION YEAR 2015-16
65

CHAPTER 4.7: WATER BUDGET OF THE DISTRICT: RATLAM
Name of
Block
Existing Water availability (BCM)
Total (BCM)
Water Demand (BCM) Water Gap (BCM)
Surface Water Ground Water Pressent Projected (2020) Present Projected (2020)
1 2 3 4 5 6 7 8
RATLAM 0.0766 0.66638 0.7404 1.0518 3.5896 0.3114 2.8492
Total 2.0766 0.66638 0.7404 1.0518 3.5896 0.3114 2.8492
To full fill the Water Gap in the District Irrigation Plan following Proposal has been taken :-
1- Major & Minor Irrigation Tanks - 11120 hec. irrigated area develop- 1.834 BCM water arability.
2- Renovation of old Tanks & Repairing Cannel System- 5349 hec. irrigated area develop- 0.3261 BCM water arability.
3- Micro Tanks upto 40 hec.-16750 hec. irrigated area develop- 1.25 BCM water arability.
4- Stop dam/ Hydraulic Check Dam- 14470 hec. irrigated area develop- 1.08 BCM water arability.
Total water arability in the Projected Year 2020- 4.470 BCM Which is sufficient to water requirement.
66

CHAPTER -5 STRATEGIC ACTION PLAN
Water is essential for sustaining life and at the same time, it is an important component for almost all developmental plans. Obviously the schemes for development of water resources for beneficial use of the society have been taken up since the time immemorial. Considerable progress has been made in respect of water resources development in India after independence through various Plans and such developments have helped in almost five fold increase in creation of irrigation potential. Total created irrigation potential at pre-Plan period was about 22.6 million hectares (Mha) which at present is about 108.20 Mha. There has also been appreciable development in the areas of drinking water supply and other uses. However, increasing population, urbanization and industrialization has led to considerable increase in demand of water for various purposes e.g., irrigation, domestic needs, industrial requirements etc.
In this regard, it may be mentioned that the water sector has very strong linkages with all other developmental activities. In view of fast changing development scenario, it is emphasized that the key priorities and identified strategies cannot be considered as static and firm. These need to be reviewed and improved upon from time to time. In this regard a comprehensive “Strategic Plan for District Irrigation” has been prepared through geospatial approach:
METHODOLOGY
Diverse research methodologies using RS and GIS have been applied by different authors to identify potential rainwater harvestings in remote and data scarce areas; in most of these methods, thematic maps are derived from remote sensing data and integrated in GI S to evaluate suitable sites for rainwater harvesting. Remote sensing is of immense use for natural resources mapping and generating necessary spatial database required as an input for GIS analysis. GIS is a tool for collecting, storing and analyzing spatial and non - spatial data, and developing a model based on local factors can be used to evaluate appropriate natural resources development and management action plans. Both these techniques can complement each other to be used as an effective tool for selecting suitable sites for water harvesting structures.
In assessment of proposed rainwater harvesting structures potential using GIS and RS, outlines six key factors that require to be integrated into a GIS framework in order to successfully develop a suitable model for RWH. This include; rainfall, hydrology (rainfallrunoff relationships), slope, land cover, soils (texture, structure, depth) and socio-economicsof the area under consideration.
The following criteria have been followed for making decision on selecting suitable site for various water harvesting structures as per Integrated Mission for SustainableDevelopment (IMSD) guidelines.
67
Check dams
The slope should be less than 15 per cent. The land use may be barren, shrub land and riverbed. The infiltration rate of the soil should be less. The type of soil should be sandy clay loam.
Percolation tanks and nala bunds
The slope should be less than 10 per cent. The infiltration rate of the soil should be moderately high. The land use / cover may be barren or scrub land. The type of soil should be silt loam.
The suitability of WHS sites can be confirmed as the site is located on second and third order drainage and satisfies the conditions of land use, soil type and slope as per IMSD guidelines.Water harvesting structures are extremely important to conserve precious natural resources like, soil and water, which is depleting day by day at alarming rate. The following table provide strategic action plan for irrigation for each block as well as for whole district and estimated costs and period of implementation.
5.2. PRIORITIZATION OF BLOCKS AND ACTIVITY FOR STRATEGIC PLANNING
The prioritization is the heart of the programme in which any programme will be implemented. Some of the important activities to be included in first phase or first year and some of the activity included in last year or last phase. For prioritization of the activity and block following criteria has been adopted.
1. Map the present situation.2. Talk to local peoples and public representatives.3. Availability of Resources.4. Socio - economic survey.5. Percentage of SC & ST Population.6. Percentage of Formers .7. Cropping Intensity.8. Ground Water Situation.9. Available of Degraded Land.10. Land Capability Status.
68

11. Percentage of Irrigated area to total cropped area.WATER SHED ACTION PLAN- DIP- PMKSY- FROM 2016-22
Name of Head Name of Activity Name of Subactivity
IWMP 5 IWMP 6 IWMP 7 IWMP 8 IWMP 9 IWMP 10 IWMP 11 IWMP 12
PHYSICAL FINANCIAL PHYSICAL FINANCIAL PHYSICAL FINANCIAL PHYSIC
AL FINANCIAL PHYSICAL FINANCIAL PHYSICAL FINANCIAL PHYSICAL FINANCIAL PHYSICAL FINANCIAL
1.Watershed Development Works
1.1 Land Development (Productive use)
1.1.1 Afforestation 30 5.25
2 0.30
1.1.2 Horticulture5 1 0 0
10 1.60
1.1.3 Any Land Development Activity for Agriculture Purpose Like land Levelling 100 10 0 0
1.1.4 Pasture
5 5.00
1.1.5 Others
1.2 Soil & Moisture Conservation
1.2.1 Staggered trecnching & Continous contour trenching 10 26.25
35750 5.00
1.2.2 Countour Bunding/ Contour Boulder Wall
60 1.80 4 2
1.2.3 Graded Bunding/Field Bunding 5000 5 0 0
20000 31.5
305 60.00 10000 10
1.2.4 Bench Terracing
1.2.5 Others
1.3 Vegetative and Engineering Structure
1.3.3 Gully plugs200 1.2 0 0
125 5
1.3.4 Loose bolder Check150 3 235 20.98
65036.97
110.55 50 3
1.3.5 Gabian structure
1.3.6 Others ( etc.)
1.4 Water Harvesting
1.4.1 Farm ponds 4 4 0 0 7 20.93 10 15.8 20 140.00 5 15
69

Structure (New Created)
1.4.2 Check dams/Stop Dam20 200 10 50 10 60 35 262.5
36180.00
58322.00 50 400
1.4.3 Nallah Bandhan (Earthen/Boulder)2 10
808.00
818.66 30 75
1.4.4 Percolation tanks10 80 20 157
1.4.5 Ground Water recharge structure
1.4.6 Others (Incuding Tank) 5.00 50.00 31.00 263.00 20.00 120.00
10 80
1.5 Water Harvesting Structure (Renovated)
1.5.1 Farm ponds
1.5.2 Check dams/Stop Dam2 10 0 0 28 172.5
1.5.3 Nallah Bandhan (Earthen/Boulder)
1.5.4 Percolation tanks
1.5.5 Ground Water recharge structure
1.5.6 Others (Incuding Tank)2 20 0 0 15 97.38
6 28.00
2.Administrative Cost
2.1 Salary (WDT & WC Secretary) 21.8 5 35 5 13 8 22.48 8 61.44
1052.29
850.18 12 65
2.2 Others ( Office Expenses) 5.75 7.97 1.68 3.8 5 32.23
19.90
16.98 29
70

Name of Head Name of Activity
Name
of
Suba
ctivity
IWMP 5IWMP
6IWMP 7
IWMP
8IWMP 9
IWM
P 10
IWMP
11
IWMP
12
Name of
Head
Name
of
Activity
Name of
Subactivi
ty
IWMP
5IWMP 6 IWMP 7 IWMP 8
3.Monitoring 3.1 Monitoring & Evaluation of Projects 12 12.84 3.5 24 2.4 18.73 15.76 13.43 20.96
4.Entry Point
Activity4.1 Plan for EPA
5.Institution &
Capacity
Building
5.1 SHG Formation 20 0 156 0 86 160 21 130 5.50 95 4.75 216 10.8
5.2 UG Formation 25 0.1 41 0 20 55 5.84 56 3.45 64 3.20 60 3
5.3 Formation of Federation 2 2 1 8 4.00
5.4 Training, Capacity Building and Exposure Visits 45 23.5 120 29.03 30 20.53 200 30 25 20 250 25.00 24 21.60 30 15
5.5 Others 2 0 0 2 15
6.DPR 6.1 Preparation Of DPR 0 0 5 9.37 7 7.88 6 6.71 10 10.48
7.Livelihood
activities 7.1 Livelihood activities 150 60 5 42.75 100 50 84.31
4
60.44 94.4
8.Production
system & micro-
enterprises
8.1 Sericulture 0 0
8.2 Beekeeping 0 0
8.3 Poultry 80 30 6 2.4 60 24.00
8.4 Fisheries 0 0 4 1.60
8.5 Bio-fuel Plantation 0 0 10 4.00
8.6 Others (Including Agriculture productivity enhancement, dairy
etc) 50 25 150 69.1 6 51.06 4 56 775 93.67 5622.40
667.16 35
9 CONSOLIDATION 1 8 23.01 15 28.1 2.36 20.14
Grand Total 524.35 552.35 350.45 434.59 894.00 604.91 645.70 888.64
71

CHAPTER 6: DISTRICT IRRIGATION PLAN- RATLAM (Village irrigation plan of all 6 blocks Annexure 1) 72
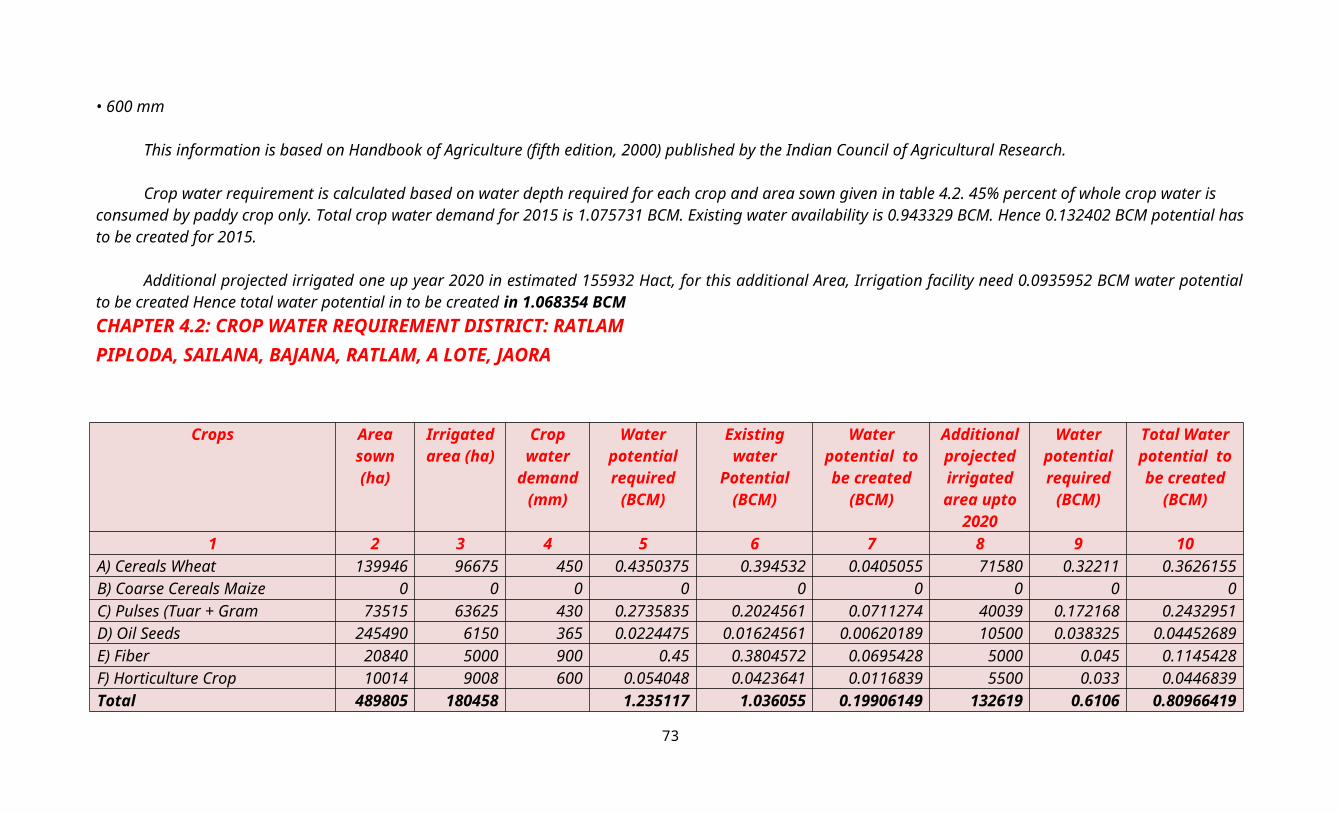
DEPARTMENT, COMPONENT, YEAR WISE STRATEGIC OF DIP RATLAM DISTRICT
Department ComponentSub
Component
Year wise Action PlanTotal
1St Year 2016-17 2nd Year 2017-18 3rdYear 2018-19 4thYear 2019-20 5thYear 2020-2021 6thYear 2021-2022Fin. In lac Fin. In lac Fin. In lac Fin. In lac Fin. In lac Fin. In lac Fin. In lac
RD
IWMP (PMKSY Watershed Development) 750.006 600.0048 450.0036 450.0036 450.0036 300.0024 3000
IWMP (Other Interventions) 495.015 396.012 297.009 297.009 297.009 198.006 1980.1MGNREGA (Other Interventions) 2046 12223.33 12206.66 12190 12190 12190.0004 12173.336 73173
Sub Total 13468.351 13202.677 12937.013 12937.013 12937.013 12671.3444 78153
WR
RRR1595 323.725 258.98 194.235 194.235 194.235 129.49 1294.9587 567.75 454.2 340.65 340.65 340.65 227 2270.9
CAD 0 0 0 0 0 0 0 0AIBP 435 834 667.2 500.4 500.4 500.4 333.6 3336
Har Khet Ko Pani 1447 685.975 548.78 411.585 411.585 411.585 274.39 2743.9Sub Total 4064 2411.45 1929.16 1446.87 1446.87 1446.87 964.48 9645.7
Agriculture
55999 6576.75 5175.4 3774.05 3774.05 3774.05 2373.7 25448
Micro Irrigation (Per Drop More Crop) 83974 3775 3020 2265 2265 2265 1510 15100
ATMA TRg. 16200 607.5 486 364.5 364.5 364.5 243 2430Sub Total 156173 10959.25 8681.4 6403.55 6403.55 6403.55 4126.7 42978
Micro Irrigation 9000 555 444 333 333 333 222 2220Horticulture (Per Drop More Crop) 3000 430 430 430 430 430 430 2580
Sub Total 9000 555 444 333 333 333 222 2220 New Well 9047 6065.75 4852.6 3639.45 3639.45 3639.45 2426.3 24263
OTHER MAGANREGA Old Well Reno. 0 0 0 0 0 0 0 0 Bounding 29660 1299 1039.2 779.4 779.4 779.4 519.6 5196Grand Total 209996 35188.801 30579.037 25969.283 25969.283 25969.283 21360.4244 165036
mi lapkyd d`f"k eq[; dk;Zikyu vf/kdkjh] dysDVj izHkkjh ea=h
73

ftyk jryke ftyk iapk;r jryke ftyk jryke ftyk jryke
PMKSY ACCORDING TO VILLAGE IRRIGATION PLAN BLOCK WISE ABSTRACT SHEET (OUTCOME FROM PRA)
fodkl [k.M okj ftyk flapkbZ ;kstukarxZr izLrkfor dk;Z
Ø-
fodkl
[k.M
uohu izLrkfor dk;Z ft.kksZ)kj ft.kksZ)kj flapkbZ ;a=ksa dh ekax
NksVs rkykc
cMs rkykc
LVki Mse dqa, esM
cka/kuk rkykc LVki Mse
QkeZ iks.M
ft.kksZ)kj dq,a
Mªhi
fLaizdyj
ikbZi
ykbZu
Mhty iai
fo|qr eksVj
lksyj iai
dqy jkf'k
la[;k
jkf'k
cMs rkykc
jkf'k
la[;k
jkf'k
la[;k
jkf'k
la[;k
jkf'k
la[;k
jkf'k
la[;k
jkf'k
la[;k
jkf'k
la[;k
jkf'k
la[;k
jkf'k
la[;k
jkf'k
la[;k
jkf'k
la[;k
jkf'k
la[;k
jkf'k
la[;k
jkf'k
1 2 5 6 8 9 11 12 1
4 15 17 18 20 21 23 24 26 27 29 30 32 33 34 35 36 37 38 39 40 41 42 43 44
1 lSykuk 130 2561 132 14090 361 6421 2373 6718 10507 1282 333 2937 38 204 844 2356 458 771 1607 935 3866 518 2971 446 2844 284 445 45 82 328 39895
2 cktuk 262 4508 173 15447 438 10983 4053 10829 10108 1370 341 2598 23 271 408 948 1562 1122 3360 1955 5779 774 7197 1080 6631 663 888 89 203 812 53449
3 tkojk 54 793 8 725 192 2670 734 2146 5747 709 151 1341 238 85 282 599 64 387 1071 623 1854 248 2190 329 1474 147 0 0 0 0 10802
74
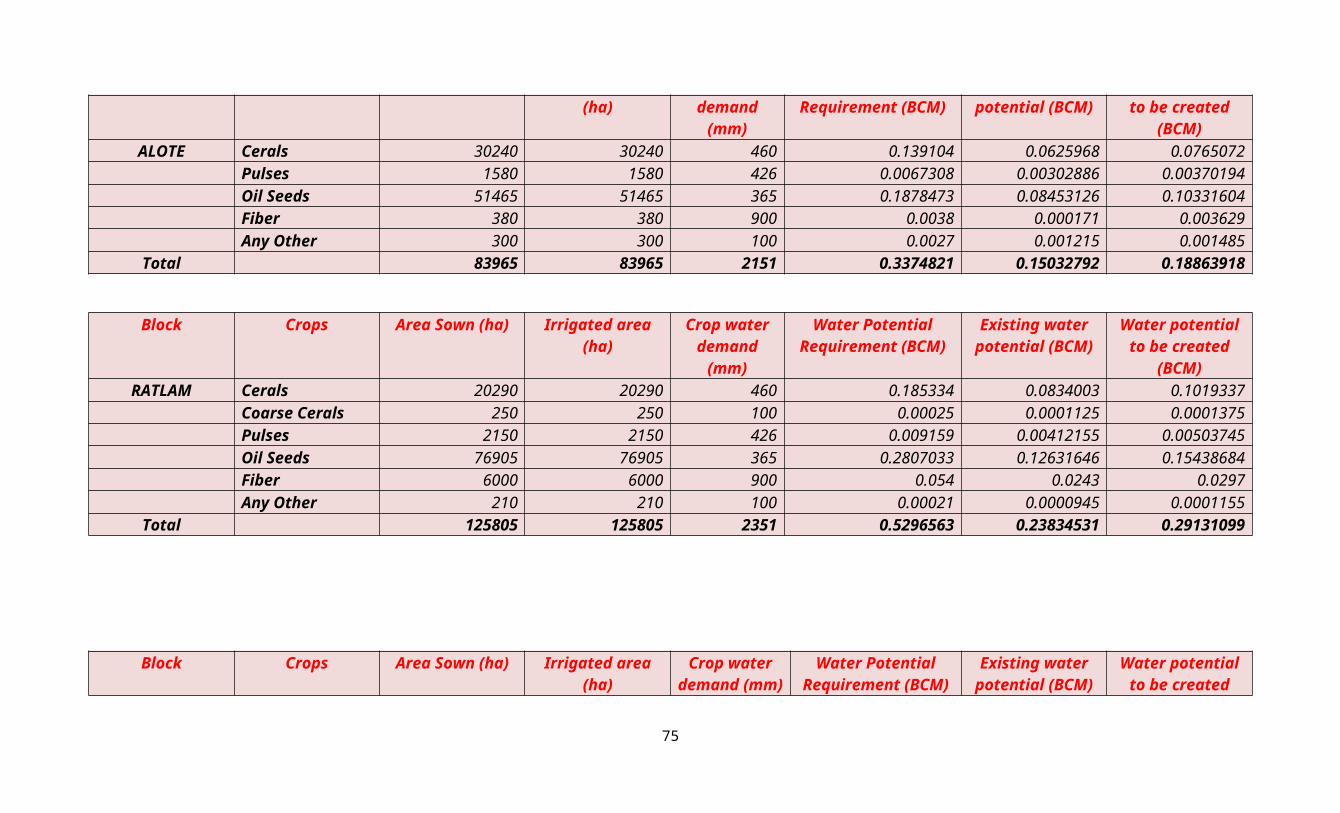
4 jryke 82 365 92 4883 413 6173 1922 3895 5207 2061 259 3116 87 503 1114 1994 44 95 7951 4627 11657 1562 15664 2350 5938 594 944 94 20 80 32390
5 vkyksV 180 683 48 948 347 4555 1177 3490 1565 1238 324 1612 6 26 192 421 43 6 1659 966 3224 432 4305 646 3207 321 731 73 0 0 15414
6 fiiykSnk 49 947 13 247 274 3431 320 1096 945 691 154 876 55 356 162 432 0 0 3014 1754 9423 1263 10236 1535 1354 135 2601 260 15 60 13083
dqy ;ksx 757 9856 466 36340 2025 34233 10579 28173 34079 7350 1562 12479 447 1444 3002 6749 2171 2382 18662 10861 3580
3 4798 42563 6384 21448 2145 5609 561 320 1280 165035
75


![· Web viewNA function also influences hemagglutination activity because of a functional balance between the hemagglutinin and NA protein[25]. Similarly, more than 60% of NA activity](https://img.pdfslide.us/doc/110x75/5e4db0ea17d75c74a779d11e/web-view-na-function-also-influences-hemagglutination-activity-because-of-a-functional.jpg)