Embed Size (px)
Citation preview

doc.: IEEE 802.15-10-0087-00-0006
Project: IEEE P802.15 Working Group for Wireless Personal Area Networks (WPANs)Project: IEEE P802.15 Working Group for Wireless Personal Area Networks (WPANs)Jan. 2010
Project: IEEE P802.15 Working Group for Wireless Personal Area Networks (WPANs)Project: IEEE P802.15 Working Group for Wireless Personal Area Networks (WPANs)
Submission Title: [PSSK and Regulatory information for ETRI’s proposal]Date Submitted: [ Jan 2009]Source: [Jaehwan Kim, Jeong-Yeol Oh, Cheolhyo Lee, HyungSoo Lee, Jae-Young Kim]Company: [ETRI]Address: [ETRI, 138 Gajeong-ro, Yuseong-gu, Deajeon, 305-700, South Korea]Voice: [+82-42-860-5338], FAX: [+82-42-823-5218] E-Mail: [[email protected], [email protected], [email protected], [email protected], [email protected]]R []Re: []
Abstract: PSSK and Regulatory information for ETRI’s proposal .
Purpose: This document is intended as a proposal for addressing the requirements of the TG6 standard.
Notice: This document has been prepared to assist the IEEE P802.15. It is offered as a basis for discussion and is not binding on the contributing individual(s) or organization(s). The material in this document is subject to change in form and content after further study. The contributor(s) reserve(s) the right to add, amend or withdraw material contained herein.Release: The contributor acknowledges and accepts that this contribution becomes the property of IEEE and may beRelease: The contributor acknowledges and accepts that this contribution becomes the property of IEEE and may be made publicly available by P802.15.
Submission Slide 1
doc.: IEEE 802.15-10-0087-00-0006Jan. 2010
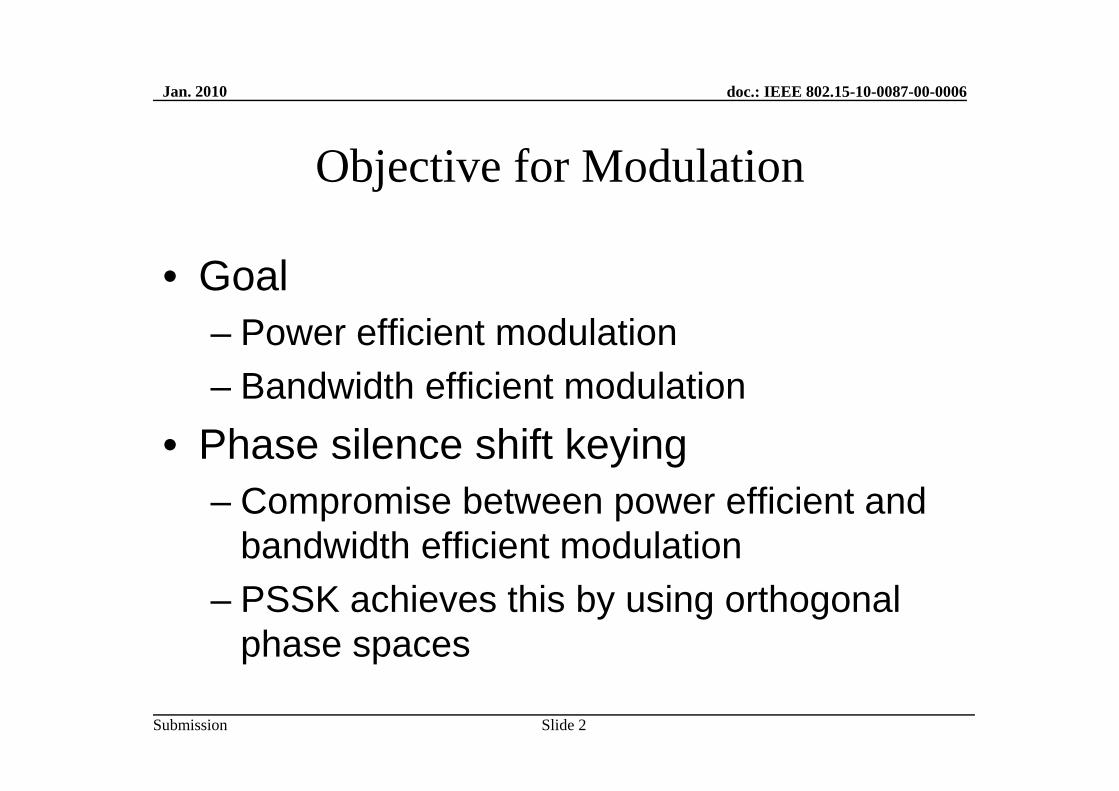
Objective for Modulation
• Goal– Power efficient modulation– Bandwidth efficient modulationBandwidth efficient modulation
• Phase silence shift keying– Compromise between power efficient and
bandwidth efficient modulation– PSSK achieves this by using orthogonal
phase spaces
Submission Slide 2
doc.: IEEE 802.15-10-0087-00-0006Jan. 2010
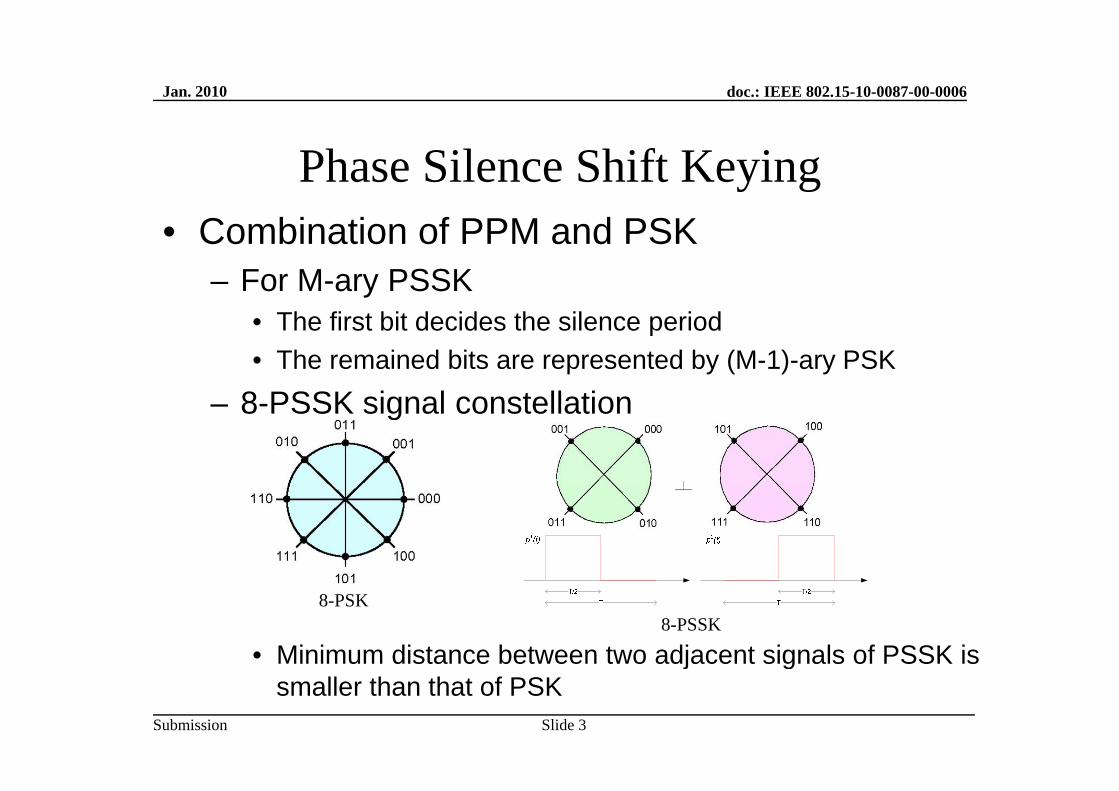
Phase Silence Shift Keying• Combination of PPM and PSK
– For M-ary PSSK• The first bit decides the silence period• The remained bits are represented by (M-1)-ary PSK
8 PSSK i l t ll ti– 8-PSSK signal constellation
• Minimum distance between two adjacent signals of PSSK is
8-PSK8-PSSK
Submission
j gsmaller than that of PSK
Slide 3

doc.: IEEE 802.15-10-0087-00-0006Jan. 2010
Performances (1)
1.5 dB
5 dB
Submission Slide 4

doc.: IEEE 802.15-10-0087-00-0006Jan. 2010
Performances (2)
10-1
100
BW(bps/Hz)
BER(10^-6)
Receciver
8PSSK 0.75 9 dB Coh.10-2
10
QPSK 1 10.5 dB Coh.
BPSK 0.5 10.5 dB Coh.
2FSK 0.4 13.5 dB Coh.10-4
10-3
BE
R
8PSSK-theory8PSSK-sim
MSK 0.75 10.5 dB Coh
GMSK 0.88 12.2 dB Coh.10-5
10QPSKMSK-cohDBPSKDQPSKBFSK OOK
10-7
10-6
BFSK,OOKBFSK-ncohMSK-ncohD8PSK
Submission Slide 5
0 5 10 1510
EbNo[dB]
doc.: IEEE 802.15-10-0087-00-0006Jan. 2010
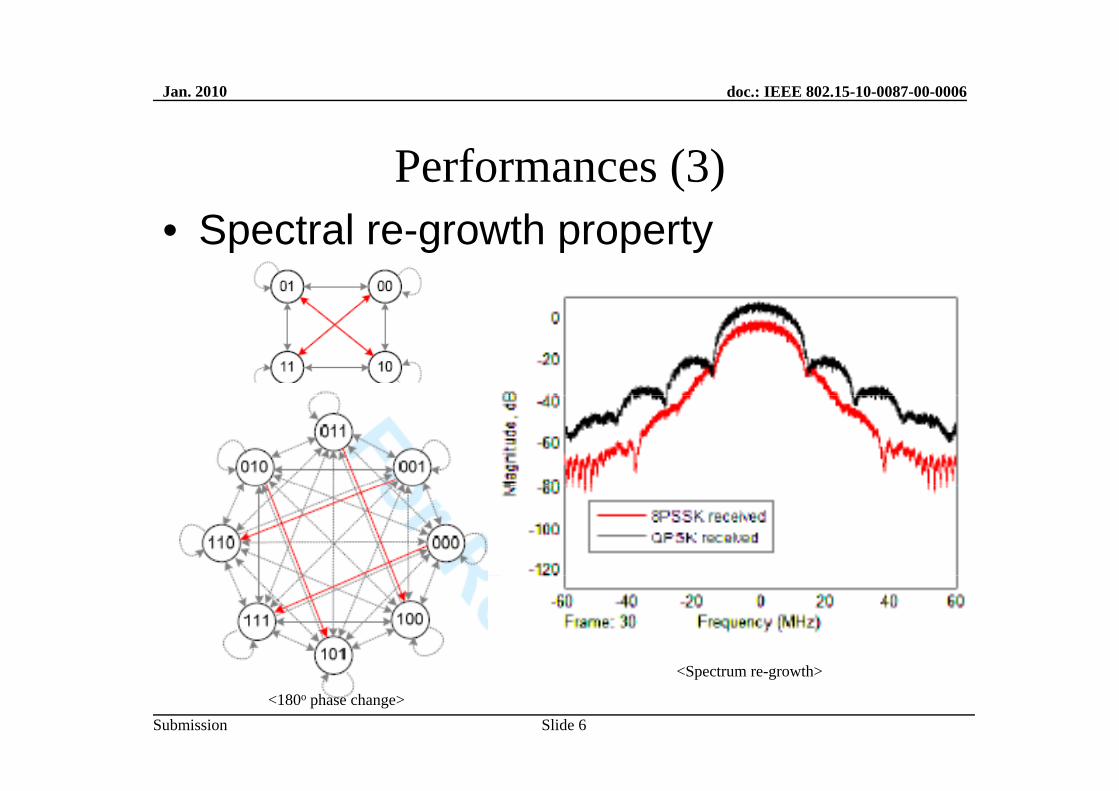
Performances (3)S t l th t• Spectral re-growth property
Submission Slide 6<180o phase change>
<Spectrum re-growth>

doc.: IEEE 802.15-10-0087-00-0006Jan. 2010
Performance Comparison• Comparison between 8PSSK and conventional modulations
Modulations 8PSK QPSK OQPSK (G)MSKBack-off gain (r=0.3) 1.5 dB 1.5 dB 0 dB -1.5 dB
Power gain 3 dB 3 dB 3 dB 3 dBBandwidth gain -3 dB -1.25 dB -1.25 dB 0 dB
Performance gain 5.4 dB 1.5 dB 1.5 dB 1.5 dBTotal gain 6 9 dB 4 75 dB 3 25 dB 3 dBTotal gain 6.9 dB 4.75 dB 3.25 dB 3 dB
GMSK 8-PSSKQPSKBT=0.3 r =0.3 r =0.3 GMSKQPSK8-PSSK
Submission Slide 7

doc.: IEEE 802.15-10-0087-00-0006Jan. 2010
Link Budget (1)
• Receiver sensitivity– For 100 kbps
• N0 = -174 dBm/Hz• Required Eb/No = 10 dB• Noise figure = 10 dBg• -174+10+10log(10*10^4)+10 = -104 dBm
– For 10 MbpsFor 10 Mbps• -174+10+10lig(10*10^6)+10 = -84 dBm
Submission Slide 8

doc.: IEEE 802.15-10-0087-00-0006Jan. 2010
Link Budget (2)
• Transmit power– Adopt maximum transmit power of MICS
band• Consider the influence to human body• Avoid interference to other systemsy• Follow the power limitation of 25 uW (-16 dBm)
Submission Slide 9
doc.: IEEE 802.15-10-0087-00-0006Jan. 2010
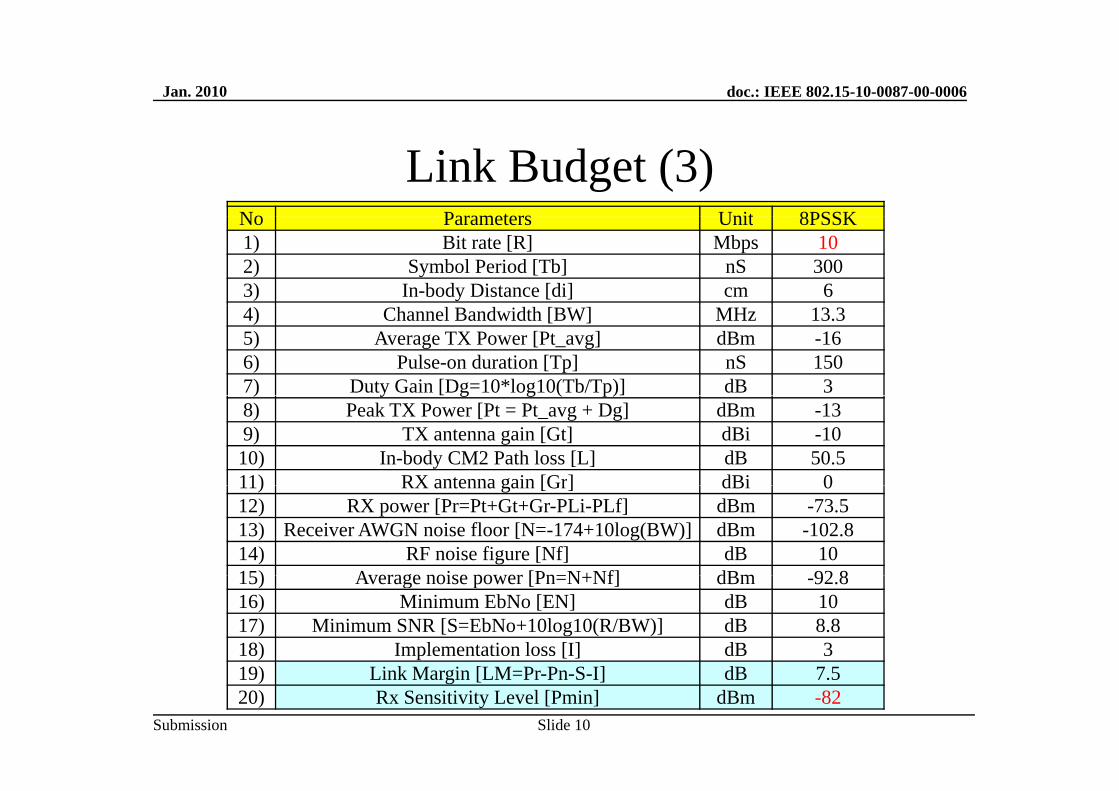
Link Budget (3)No Parameters Unit 8PSSKNo Parameters Unit 8PSSK1) Bit rate [R] Mbps 102) Symbol Period [Tb] nS 3003) In-body Distance [di] cm 64) Channel Bandwidth [BW] MHz 13.35) Average TX Power [Pt_avg] dBm -166) Pulse-on duration [Tp] nS 1507) Duty Gain [Dg=10*log10(Tb/Tp)] dB 3) y [ g g ( p)]8) Peak TX Power [Pt = Pt_avg + Dg] dBm -139) TX antenna gain [Gt] dBi -1010) In-body CM2 Path loss [L] dB 50.511) RX antenna gain [Gr] dBi 011) RX antenna gain [Gr] dBi 012) RX power [Pr=Pt+Gt+Gr-PLi-PLf] dBm -73.513) Receiver AWGN noise floor [N=-174+10log(BW)] dBm -102.814) RF noise figure [Nf] dB 1015) Average noise power [Pn N+Nf] dBm 92 815) Average noise power [Pn=N+Nf] dBm -92.816) Minimum EbNo [EN] dB 1017) Minimum SNR [S=EbNo+10log10(R/BW)] dB 8.818) Implementation loss [I] dB 3
Submission Slide 10
19) Link Margin [LM=Pr-Pn-S-I] dB 7.520) Rx Sensitivity Level [Pmin] dBm -82
doc.: IEEE 802.15-10-0087-00-0006Jan. 2010
More information about PSSK
Submission Slide 11
doc.: IEEE 802.15-10-0087-00-0006Jan. 2010
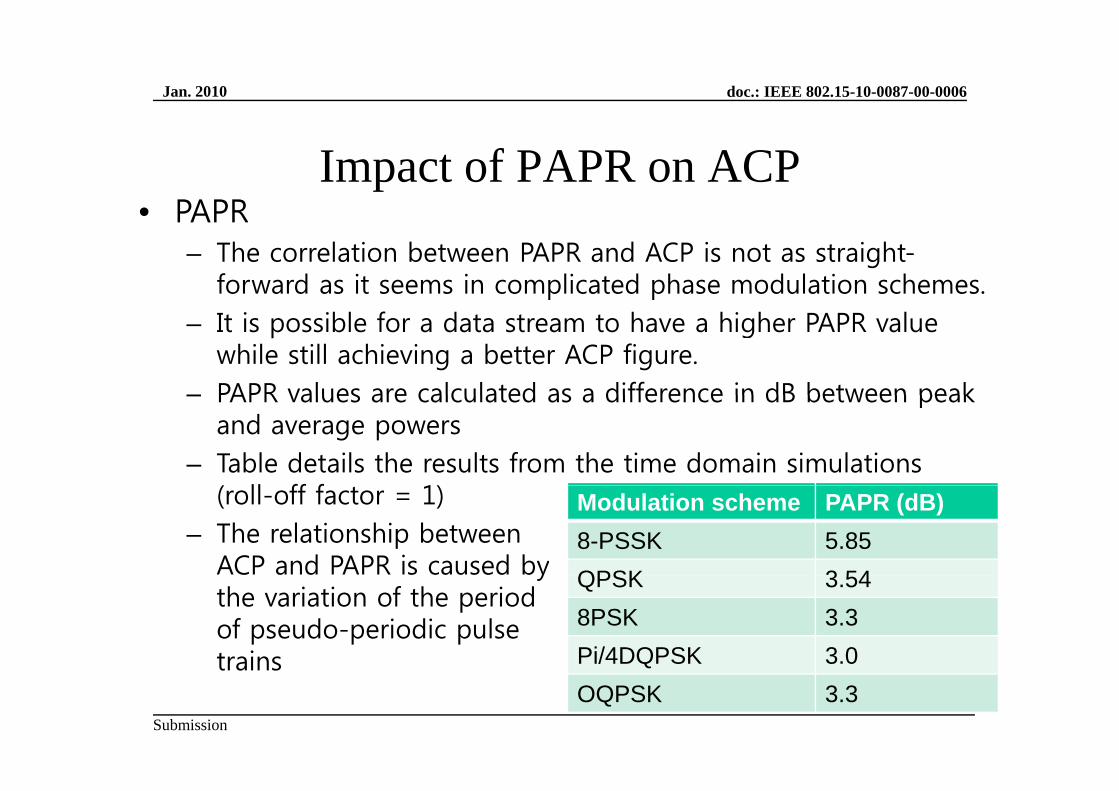
Impact of PAPR on ACP• PAPRPAPR
– The correlation between PAPR and ACP is not as straight-forward as it seems in complicated phase modulation schemes.
– It is possible for a data stream to have a higher PAPR value while still achieving a better ACP figure.
– PAPR values are calculated as a difference in dB between peak– PAPR values are calculated as a difference in dB between peak and average powers
– Table details the results from the time domain simulations( ll ff f 1) Modulation scheme PAPR (dB)
8-PSSK 5.85QPSK 3 54
(roll-off factor = 1)– The relationship between
ACP and PAPR is caused by QPSK 3.548PSK 3.3Pi/4DQPSK 3.0
ythe variation of the periodof pseudo-periodic pulsetrains
Submission
QOQPSK 3.3
trains
doc.: IEEE 802.15-10-0087-00-0006Jan. 2010
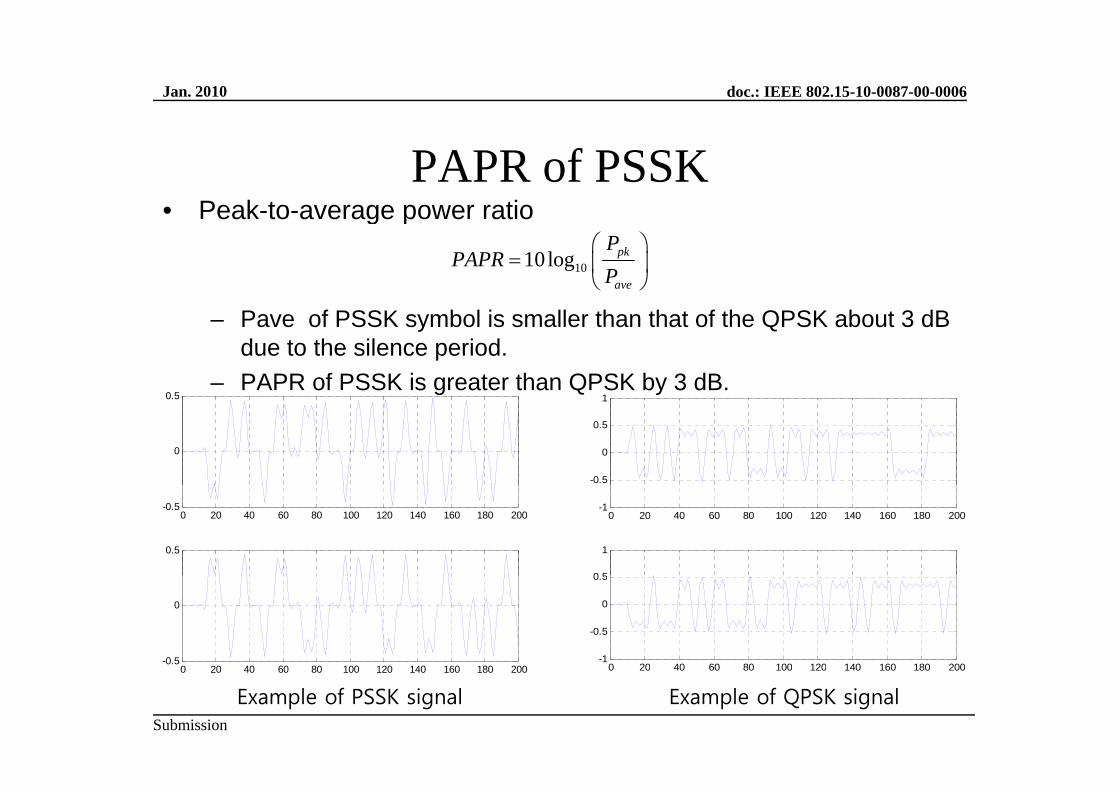
PAPR of PSSK• Peak-to-average power ratioPeak to average power ratio
1010 log pk
ave
PPAPR
P⎛ ⎞
= ⎜ ⎟⎝ ⎠
10 5
– Pave of PSSK symbol is smaller than that of the QPSK about 3 dB due to the silence period.
– PAPR of PSSK is greater than QPSK by 3 dB.
-0.5
0
0.5
1
0
0.5
0 20 40 60 80 100 120 140 160 180 200-1
0 5
1
0 20 40 60 80 100 120 140 160 180 200-0.5
0.5
0 20 40 60 80 100 120 140 160 180 200-1
-0.5
0
0.5
-0.5
0
Submission
0 20 40 60 80 100 120 140 160 180 2000 20 40 60 80 100 120 140 160 180 200
Example of PSSK signal Example of QPSK signal

doc.: IEEE 802.15-10-0087-00-0006
li d lJan. 2010
Nonlinear model• TWTA (Travelling Wave Tube Amplifier) model
S l h d l– Saleh model• Saleh, A.A.M., "Frequency-independent and frequency-dependent nonlinear models of TWT
amplifiers," IEEE Trans. Communications, vol. COM-29, pp.1715-1720, November 1981.
– Multiply the signal by a gain factor. Split the complex signal into its its magnitude p y g y g p p g gand angle components.
– Apply an AM/AM conversion to the magnitude of the signal, according to the Saleh model , to produce the magnitude of the output signal.
– Apply an AM/PM conversion to the phase of the signal, according to the Saleh model, and adds the result to the angle of the signal to produce the angle of the output signal. Combine the new magnitude and angle components into a complex signal and multiply the result by a gain factor which is controlled by thecomplex signal and multiply the result by a gain factor, which is controlled by the Linear gain parameter.
Submission

doc.: IEEE 802.15-10-0087-00-0006Jan. 2010
Saleh model• Saleh mothodSaleh mothod
– Output voltage against input voltage for AM/AM
– Output phase against input voltage for AM/PM
– Amplitude gain for AM/AM– Amplitude gain for AM/AM
( )/ 21 *AM AMuF uu
αβ×
=+
– Phase change for AM/PM
( )2uF α ×( )/ 21 *AM PMF uuβ
=+
Submission
doc.: IEEE 802.15-10-0087-00-0006Jan. 2010
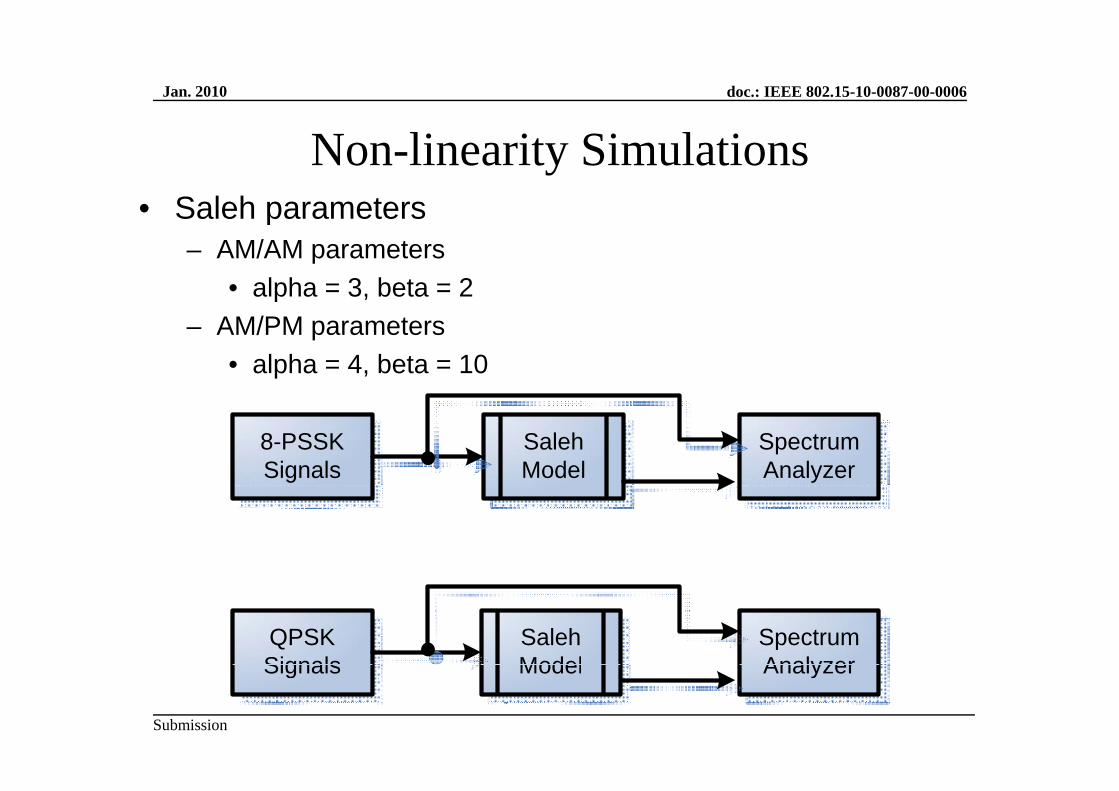
Non-linearity Simulations • Saleh parametersSaleh parameters
– AM/AM parameters • alpha = 3, beta = 2
– AM/PM parameters • alpha = 4, beta = 10
8-PSSKSignals
SalehModel
SpectrumAnalyzer
QPSKSignals
SalehModel
SpectrumAnalyzer
Submission
Signals Model Analyzer
doc.: IEEE 802.15-10-0087-00-0006Jan. 2010
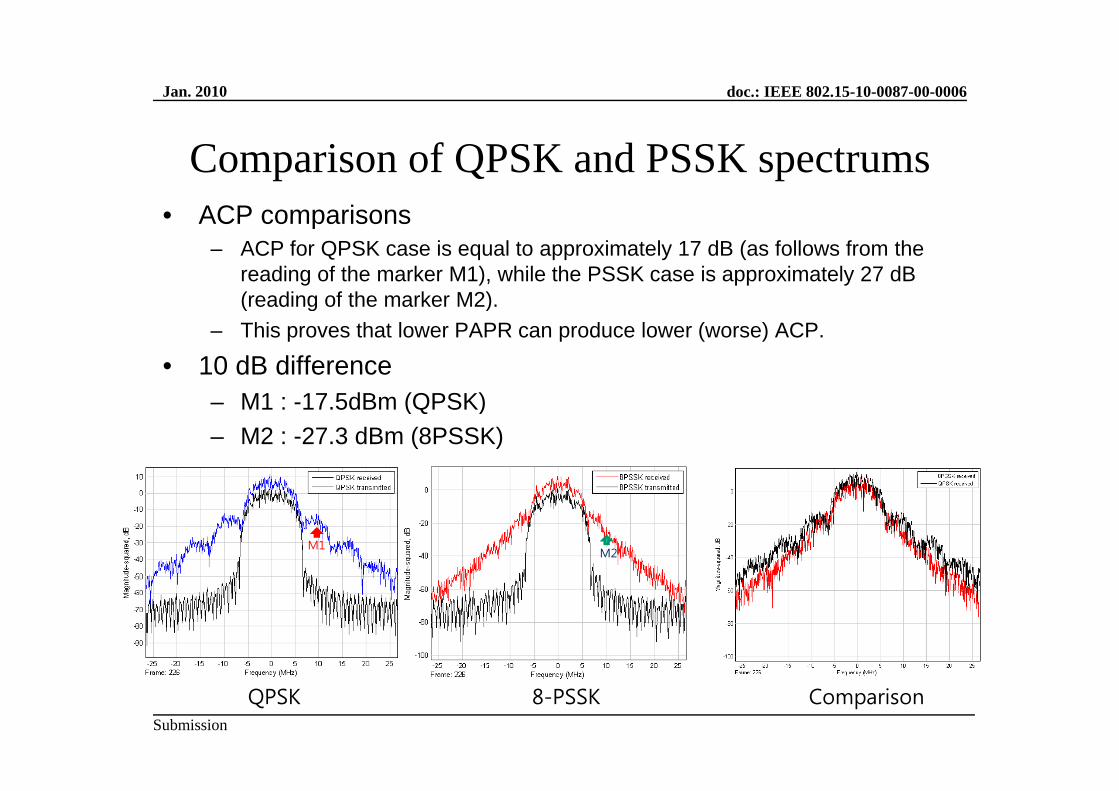
Comparison of QPSK and PSSK spectrums• ACP comparisons• ACP comparisons
– ACP for QPSK case is equal to approximately 17 dB (as follows from the reading of the marker M1), while the PSSK case is approximately 27 dB (reading of the marker M2).(reading of the marker M2).
– This proves that lower PAPR can produce lower (worse) ACP.
• 10 dB differenceM1 17 5dB (QPSK)– M1 : -17.5dBm (QPSK)
– M2 : -27.3 dBm (8PSSK)
M1M2
SubmissionQPSK 8-PSSK Comparison

doc.: IEEE 802.15-10-0087-00-0006Jan. 2010
Implementation Results• ACP comparison of baseband analog signals
– Improvement for 10 dB of Non-linearity Amp. ACP
15 dB Spectral regrowthp g
25 dB Spectral regrowth
SubmissionQPSK 8-PSSK

doc.: IEEE 802.15-10-0087-00-0006Jan. 2010
Regulatory Information
Submission Slide 19
doc.: IEEE 802.15-10-0087-00-0006
N li d F B d dJan. 2010
Non-licensed Frequency Bands and Requirementsq
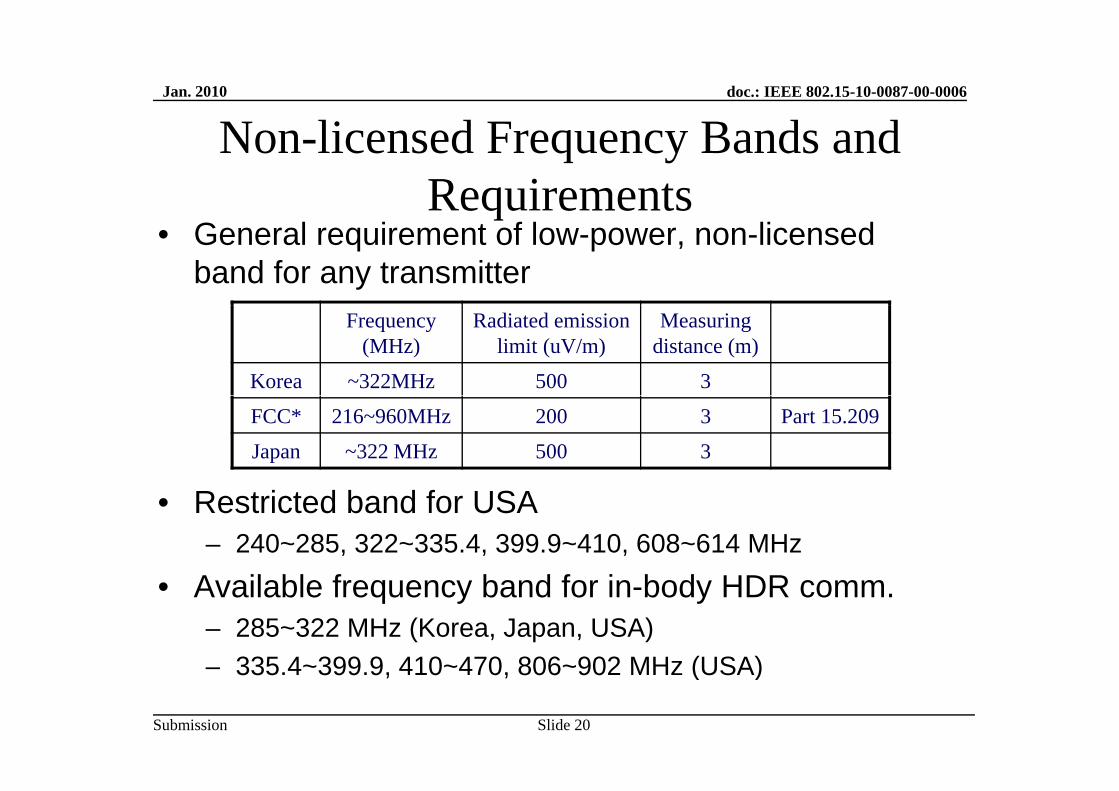
• General requirement of low-power, non-licensed band for any transmitter
Frequency(MHz)
Radiated emission limit (uV/m)
Measuring distance (m)
Korea ~322MHz 500 3
FCC* 216~960MHz 200 3 Part 15.209
Japan ~322 MHz 500 3
• Restricted band for USA– 240~285, 322~335.4, 399.9~410, 608~614 MHz
A il bl f b d f i b d HDR• Available frequency band for in-body HDR comm.– 285~322 MHz (Korea, Japan, USA)
335 4~399 9 410~470 806~902 MHz (USA)
Submission Slide 20
– 335.4~399.9, 410~470, 806~902 MHz (USA)
doc.: IEEE 802.15-10-0087-00-0006Jan. 2010
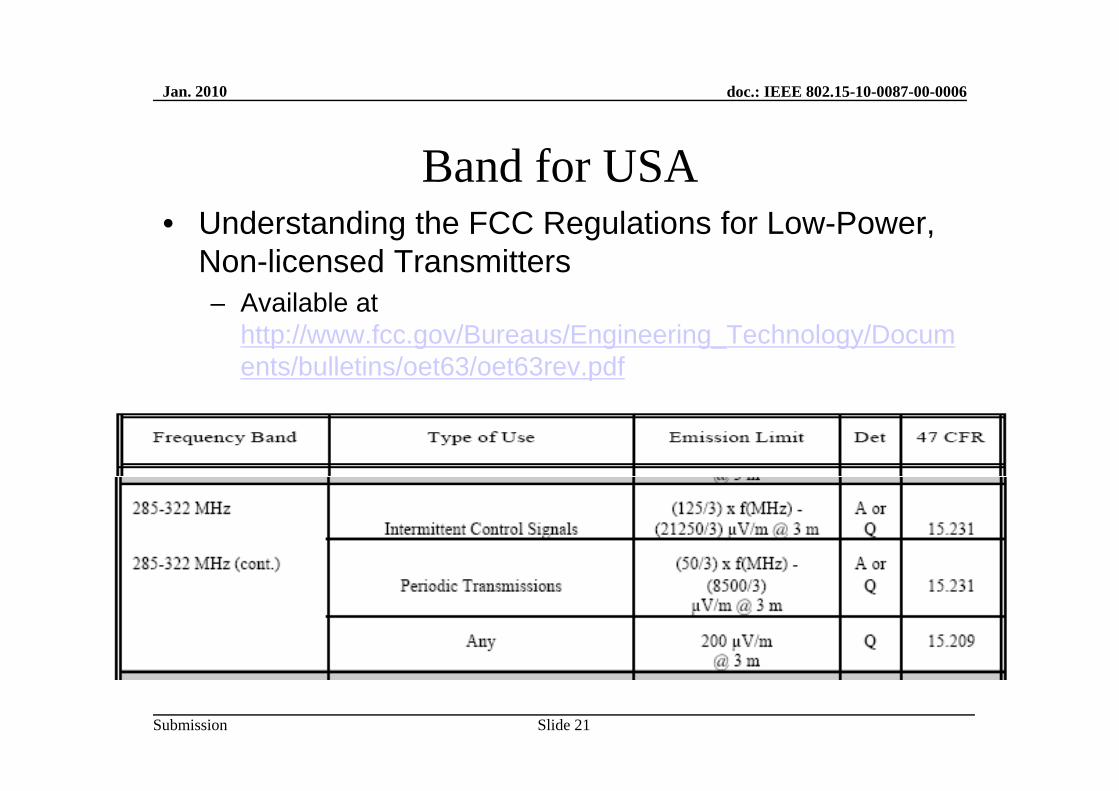
Band for USAU d t di th FCC R l ti f L P• Understanding the FCC Regulations for Low-Power, Non-licensed Transmitters– Available atAvailable at
http://www.fcc.gov/Bureaus/Engineering_Technology/Documents/bulletins/oet63/oet63rev.pdf
Submission Slide 21

doc.: IEEE 802.15-10-0087-00-0006Jan. 2010
Band for Japan• Regulation of the Extremely Low Power Radio g y
Station – Available at
htt // t l j / / f/ t i l/ l /i d hthttp://www.tele.soumu.go.jp/e/ref/material/rule/index.htm
Submission Slide 22
doc.: IEEE 802.15-10-0087-00-0006Jan. 2010
How can we satisfy the regulation?
Submission Slide 23
doc.: IEEE 802.15-10-0087-00-0006Jan. 2010
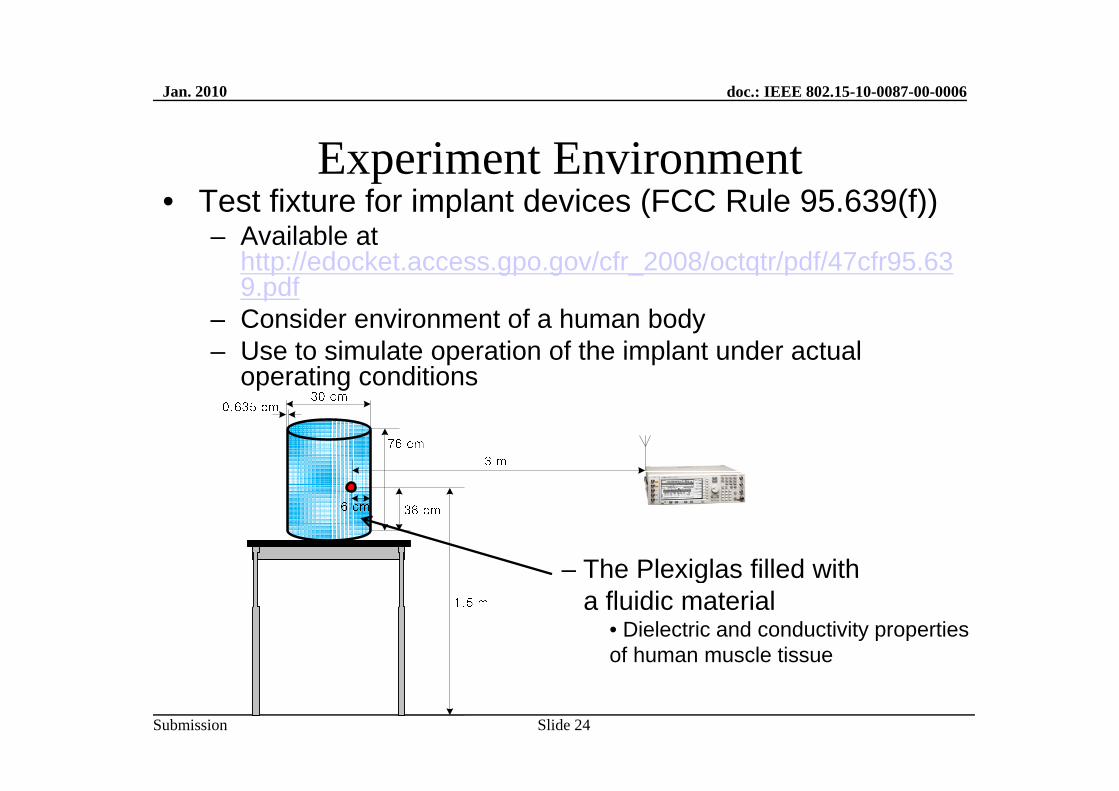
Experiment Environment• Test fixture for implant devices (FCC Rule 95.639(f))p ( ( ))
– Available at http://edocket.access.gpo.gov/cfr_2008/octqtr/pdf/47cfr95.639.pdf
– Consider environment of a human body– Use to simulate operation of the implant under actual
operating conditions
– The Plexiglas filled withThe Plexiglas filled with a fluidic material
• Dielectric and conductivity properties of human muscle tissue
Submission Slide 24
doc.: IEEE 802.15-10-0087-00-0006Jan. 2010
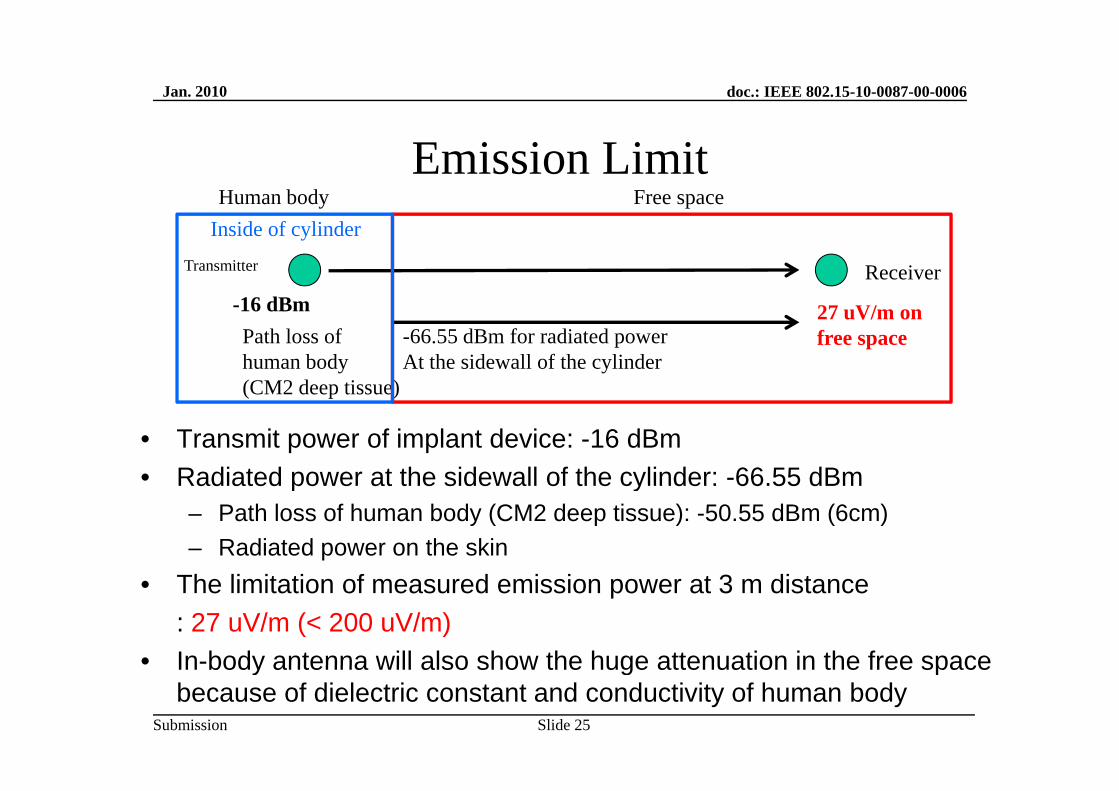
Emission LimitHuman body Free space
Transmitter Receiver-16 dBm 27 V/
Inside of cylinder
-16 dBm 27 uV/m on free spacePath loss of
human body (CM2 deep tissue)
-66.55 dBm for radiated powerAt the sidewall of the cylinder
• Transmit power of implant device: -16 dBm• Radiated power at the sidewall of the cylinder: -66.55 dBm
( p )
Radiated power at the sidewall of the cylinder: 66.55 dBm– Path loss of human body (CM2 deep tissue): -50.55 dBm (6cm)– Radiated power on the skin
Th li it ti f d i i t 3 di t• The limitation of measured emission power at 3 m distance: 27 uV/m (< 200 uV/m)
• In-body antenna will also show the huge attenuation in the free space
Submission
In body antenna will also show the huge attenuation in the free space because of dielectric constant and conductivity of human body
Slide 25
doc.: IEEE 802.15-10-0087-00-0006Jan. 2010
Conclusions• Phase silence shift keying
– Combination of PPM and PSKT it ffi i t f 3 dB d t il d ti– Transmit power efficient for 3 dB due to silence duration
– Performance enhancement from enlarged minimum distance– Back-off gain for usage of non-linear deviceBack off gain for usage of non linear device
• Frequency band allocation for in-body high data rate (HDR)Frequency band allocation for in body high data rate (HDR)– Low power, non-licensed band for any transmitter
• Method for satisfaction of the regulation– Use test fixture of implant transmitter (FCC Rule 95.639(f))
Submission
– Emission power at 3 m is under 200 uWSlide 26

doc.: IEEE 802.15-10-0087-00-0006Jan. 2010
How can we satisfy the regulation?
Submission Slide 27
doc.: IEEE 802.15-10-0087-00-0006Jan. 2010
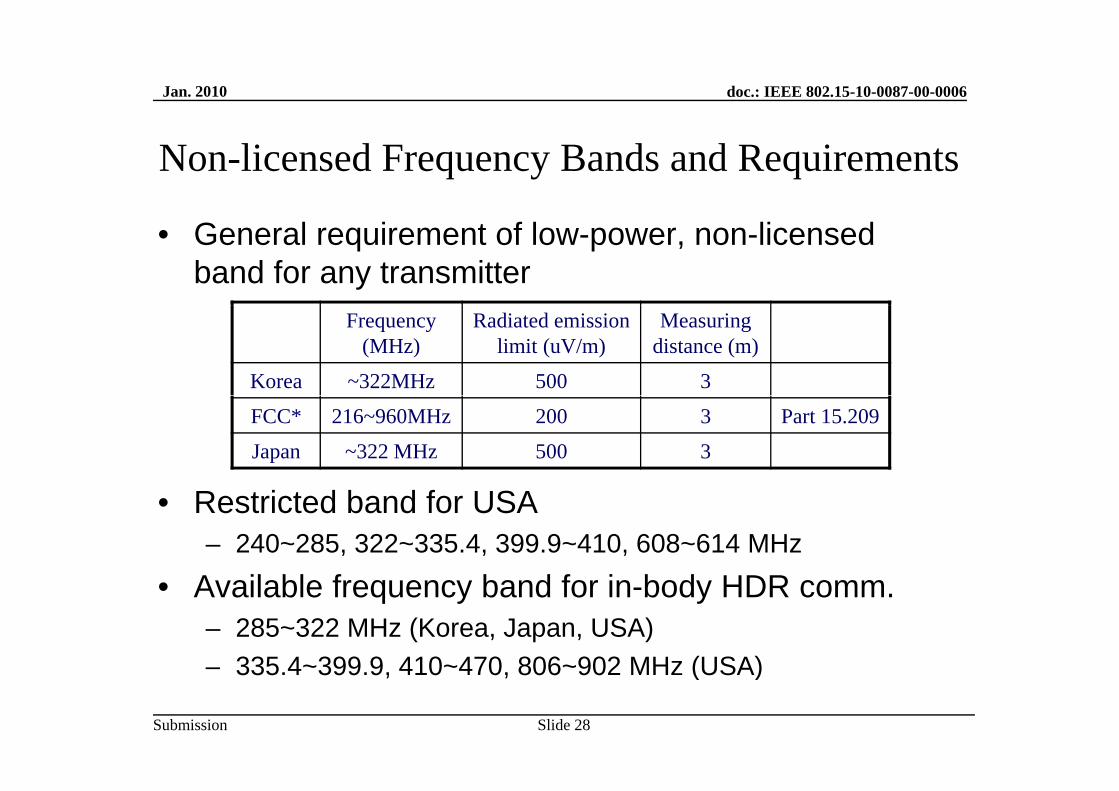
Non-licensed Frequency Bands and Requirements
• General requirement of low-power, non-licensed band for any transmitter
Frequency(MHz)
Radiated emission limit (uV/m)
Measuring distance (m)
Korea ~322MHz 500 3
FCC* 216~960MHz 200 3 Part 15.209
Japan ~322 MHz 500 3
• Restricted band for USA– 240~285, 322~335.4, 399.9~410, 608~614 MHz
A il bl f b d f i b d HDR• Available frequency band for in-body HDR comm.– 285~322 MHz (Korea, Japan, USA)
335 4~399 9 410~470 806~902 MHz (USA)
Submission
– 335.4~399.9, 410~470, 806~902 MHz (USA)
Slide 28
doc.: IEEE 802.15-10-0087-00-0006Jan. 2010
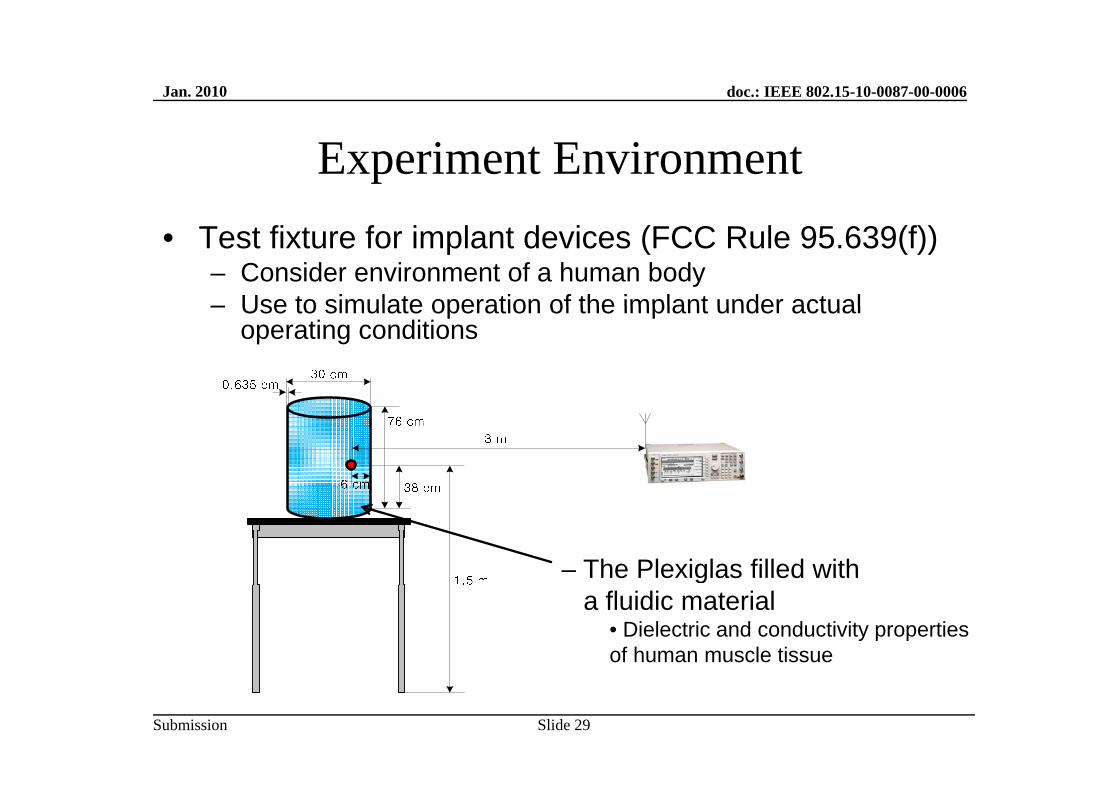
Experiment Environment• Test fixture for implant devices (FCC Rule 95.639(f))
– Consider environment of a human body– Use to simulate operation of the implant under actual– Use to simulate operation of the implant under actual
operating conditions
– The Plexiglas filled withThe Plexiglas filled with a fluidic material
• Dielectric and conductivity properties of human muscle tissue
Submission Slide 29

doc.: IEEE 802.15-10-0087-00-0006Jan. 2010
Emission LimitHuman body Free space
Transmitter Receiver-16 dBm 27 V/
Inside of cylinder
-16 dBm 27 uV/m on free spacePath loss of
human body (CM2 deep tissue)
-66.55 dBm for radiated powerAt the sidewall of the cylinder
• Transmit power of implant device: -16 dBm• Radiated power at the sidewall of the cylinder: -66.55 dBm
( p )
Radiated power at the sidewall of the cylinder: 66.55 dBm– Path loss of human body (CM2 deep tissue): -50.55 dBm (6cm)– Radiated power on the skin
Th li it ti f d i i t 3 di t• The limitation of measured emission power at 3 m distance: 27 uV/m (< 200 uV/m)
• In-body antenna will also show the huge attenuation in the free space
Submission
In body antenna will also show the huge attenuation in the free space because of dielectric constant and conductivity of human body
Slide 30
doc.: IEEE 802.15-10-0087-00-0006Jan. 2010
Conclusions• Phase silence shift keying
– Combination of PPM and PSKT it ffi i t f 3 dB d t il d ti– Transmit power efficient for 3 dB due to silence duration
– Performance enhancement from enlarged minimum distance– Back-off gain for usage of non-linear deviceBack off gain for usage of non linear device
• Frequency band allocation for in-body high data rate (HDR)– Low power, non-licensed band for any transmitterp , y
• Method for satisfaction of the regulation– Use test fixture of implant transmitter (FCC Rule 95.639(f))– Emission power at 3 m is under 200 uW
• More information will be provided by Feb. 15.
Submission Slide 31