Embed Size (px)
Citation preview
doc.: IEEE 802.11-15/0320r1
Submission
March 2015
Yusuke Tanaka, Sony CorporationSlide 1
GCR-BA Performance with Measurement Report in OBSS
Date: 2015/03/09
Authors:
Name Affiliations Address Phone email Yusuke Tanaka Sony Corp. [email protected]
Eisuke Sakai Sony Corp [email protected]
Yuichi Morioka Sony Corp [email protected]
Masahito Mori Sony Corp [email protected]
William Carney Sony Corp [email protected]
doc.: IEEE 802.11-15/0320r1
Submission
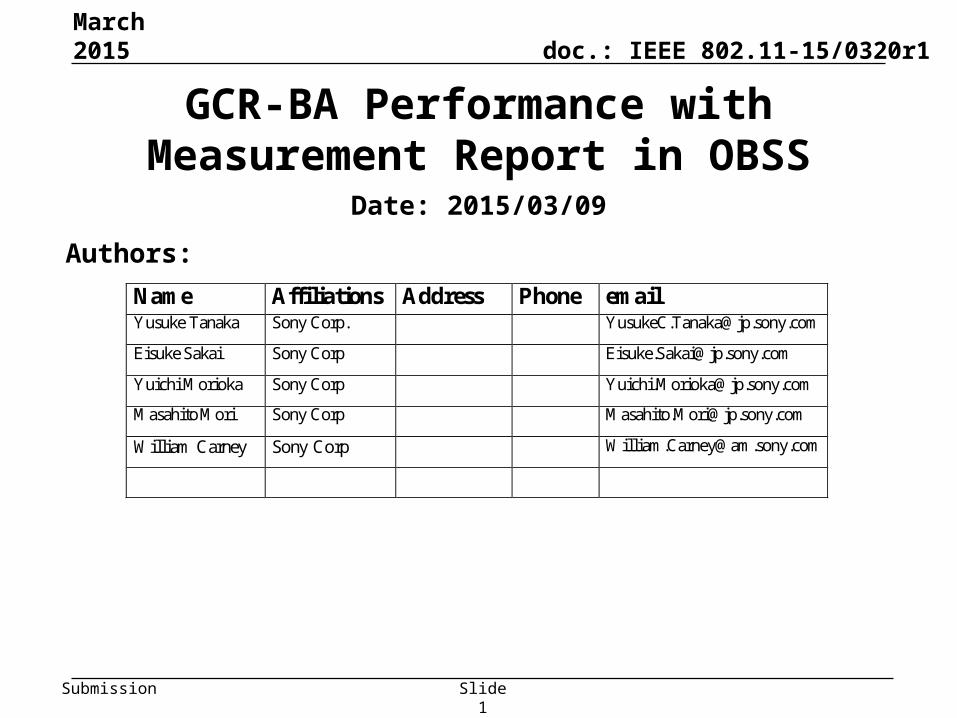
Abstract• Previous submission[1] showed that if the BAR(Block Ack
Request) Destination is selected appropriately by throughput characteristics, the multicast performance improves.– It also suggested that the number of BAR Destinations should be
optimized.
• This submission shows that the use of existing frames to identify the optimal BAR Destinations will degrade the overall performance due to significant overhead.
• This submission concludes that a more efficient mechanism is necessary to ensure the reliability for multicast applications.
March 2015
Yusuke Tanaka, Sony CorporationSlide 2
doc.: IEEE 802.11-15/0320r1
Submission Yusuke Tanaka, Sony Corporation
Recap [1]
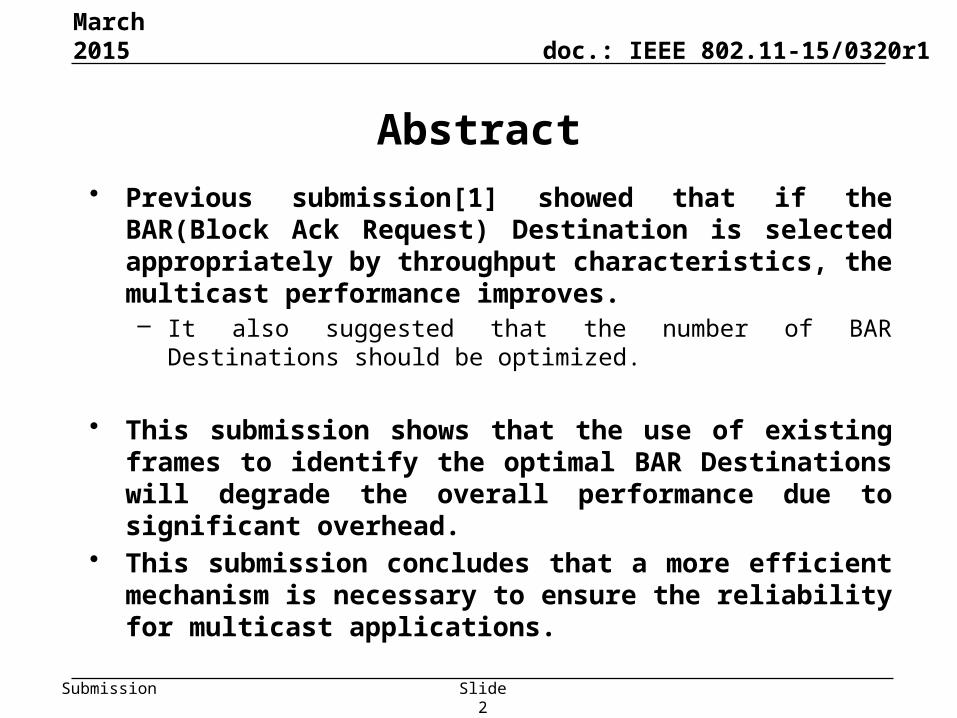
• Worst TP selection outperforms Random selection when appropriate number of BAR Destinations are selected.
• AP needs a mechanism to identify underperforming STAs to determine BAR Destinations.
March 2015
Slide 3
Performance improvesdue to proper retransmission
Performance degradesdue to too much retransmission
Target PLR for video applications
Random selection
Worst TP selection
doc.: IEEE 802.11-15/0320r1
Submission Yusuke Tanaka, Sony Corporation
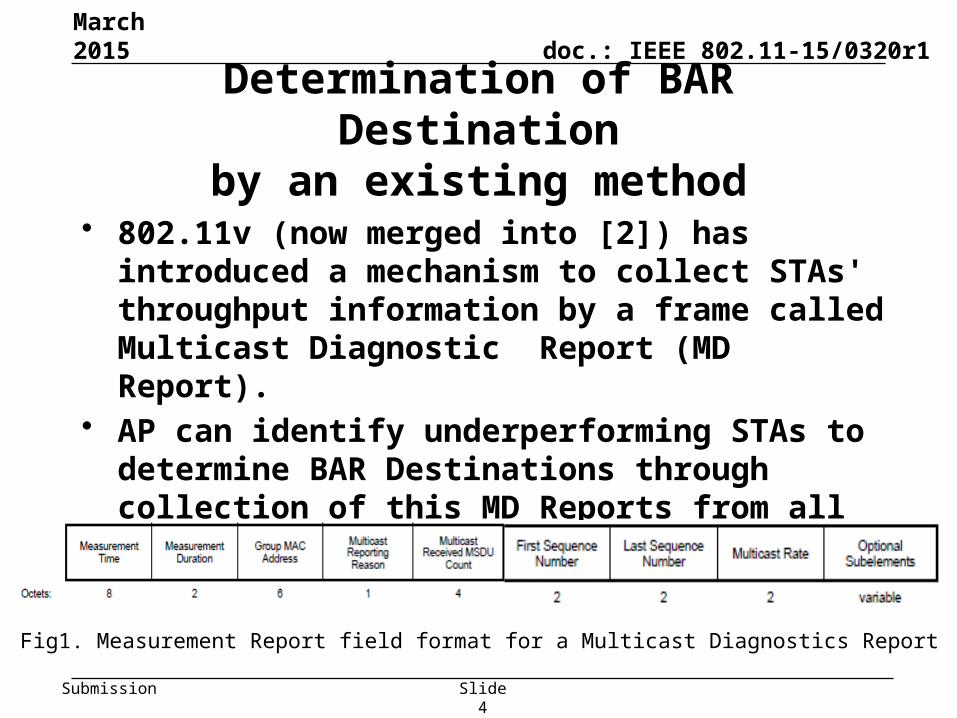
Determination of BAR Destinationby an existing method
• 802.11v (now merged into [2]) has introduced a mechanism to collect STAs' throughput information by a frame called Multicast Diagnostic Report (MD Report).
• AP can identify underperforming STAs to determine BAR Destinations through collection of this MD Reports from all STAs.
March 2015
Slide 4
Fig1. Measurement Report field format for a Multicast Diagnostics Report
doc.: IEEE 802.11-15/0320r1
Submission Yusuke Tanaka, Sony Corporation
Frequency of Reporting
• For optimal BAR Destination (re-)selection, MD report is preferable to be sent no more than BAR interval.
• When multicast traffic is transmitted at 3 Mbps, BAR would be transmitted at least every 250 msec in this scenario.(1500 [byte/packet] * 8 [bit/byte]) * 64 [packet] / 3 [Mbit /sec]
= 256 [msec]• BAR should be sent at least once out of 64packets.
→System performance using MD Report to identify BAR Destination is simulated.
March 2015
Slide 5

doc.: IEEE 802.11-15/0320r1
Submission Yusuke Tanaka, Sony Corporation
Simulation Conditions• Scenario-3
– 19-cell model with wrap-around (Reuse=3)• Traffic model
– Multicast downlink UDP Flow (3Mbps)/BSS• All APs broadcast same contents• 30 STAs/BSS are receiving multicast
– 10 uplink UDP Flows(300kbps)/BSS • # of BAR Destinations /BSS
– 0, 1, 2, 3, 4, 5, 10, 20, 30 (all STAs receives BAR)• Selection of BAR Destinations
– In order of bad throughput
• Overhead– With MD report overhead per 250 msec from All STAs– Without MD report overhead, but optimal selection
• PHY rate – Data frames = 585Mbps (MCS = 7, 80MHz, 2SS)– BAR/BA/MD report = 6Mbps (MCS = 0, with legacy format)
• More details are shown in appendix. Slide 6
March 2015
doc.: IEEE 802.11-15/0320r1
Submission Yusuke Tanaka, Sony Corporation
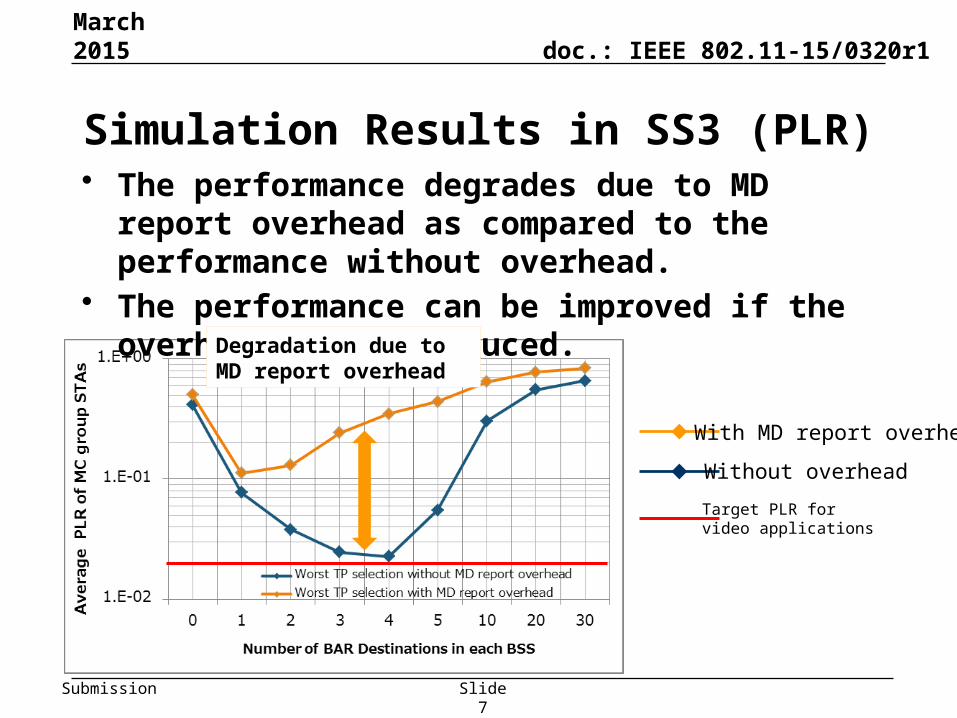
Simulation Results in SS3 (PLR)• The performance degrades due to MD report overhead
as compared to the performance without overhead.• The performance can be improved if the overhead can
be reduced.
March 2015
Slide 7
Degradation due to MD report overhead
Target PLR for video applications
With MD report overhead
Without overhead
doc.: IEEE 802.11-15/0320r1
Submission Yusuke Tanaka, Sony Corporation
Conclusions
• This submission showed GCR-BA performance with throughput selection by MD report from all STAs.
• The overhead of the MD report is not negligible, therefore the entire performance degrades as compared to the performance without such overhead.
• To improve the performance of GCR BA, an effective mechanism is needed to reduce the overhead in selection of proper STAs.
March 2015
Slide 8
doc.: IEEE 802.11-15/0320r1
Submission Yusuke Tanaka, Sony Corporation
References
1. Eisuke Sakai, Sony, 11-15-0046-00 11aa GCR-BA Performance in OBSS
2. IEEE Std. 802.11-2012
3. Simone Merlin, Qualcomm, 11-14-0980-06 TGax Simulation Scenarios
4. IEEE Std. 802.11aa
March 2015
Slide 9

doc.: IEEE 802.11-15/0320r1
Submission
BACKUP
March 2015
Yusuke Tanaka, Sony CorporationSlide 10

doc.: IEEE 802.11-15/0320r1
Submission
Simulation Setup details
Yusuke Tanaka, Sony Corporation
Slide 11
Node (AP x 1, STA x 40) x 19
Num of Drops [times] 1
Traffic Model & Load Downlink CBR UDP 3 Mbps (from all AP)Uplink CBR UDP 300 kbps (from 10 of 40 STAs, not multicast receiving STAs)
Traffic Duration [sec] 39
Access Category AC_BE CWmin=15, CWmax=1023, AIFSN=3, TXOP limit=0
Tx Power [dBm] AP:+23dBm (2 antennas), STA:+15dBm (Single antenna)
MCS Selection Fixed (Legacy 6Mbps for BAR/BA/MD Report, MCS7, with HT80 and 2SS, for data frames)
Packet Length [byte] (MPDU, MSDU, APP)=(1530, 1500, 1464) Fixed
L2 Retry 10
Ack Rate Legacy 6.0Mbps
RTS/CTS OFF
Max Aggregation Size A-MPDU, A-MSDU)=(64KB, NA)
NF [dB] 7
Channel TGn Channel D (pathloss, shadowing, fading)
Channel Setting [MHz] (CenterFreq, BW)=(5180, 80)
Det. Cancel on PLCP err Enable (Error performance is shown in next slide)
Antenna settings(Gain [dBi, Height [m] (0, 3) for AP, (-2, 1.5) for STA
Tx buffer size [kB] 375
TTL [sec] 1
BAR receiving STAs selction Worst TP
Multicast Diagnostic Report Overhead (None, transmitted every 250msec from each STA)
Wraparound Enabled
Sensitivity level [dBm] (CCA-SD, CCA-ED) = (-82, -62) [NOTE] The term “CCA-ED” represents “20 dB above the minimum modulation and coding rate sensitivity” in this material.
March 2015

doc.: IEEE 802.11-15/0320r1
Submission Yusuke Tanaka, Sony Corporation
Prob. of PLCP Success
Slide 12
March 2015
doc.: IEEE 802.11-15/0320r1
Submission Yusuke Tanaka, Sony Corporation
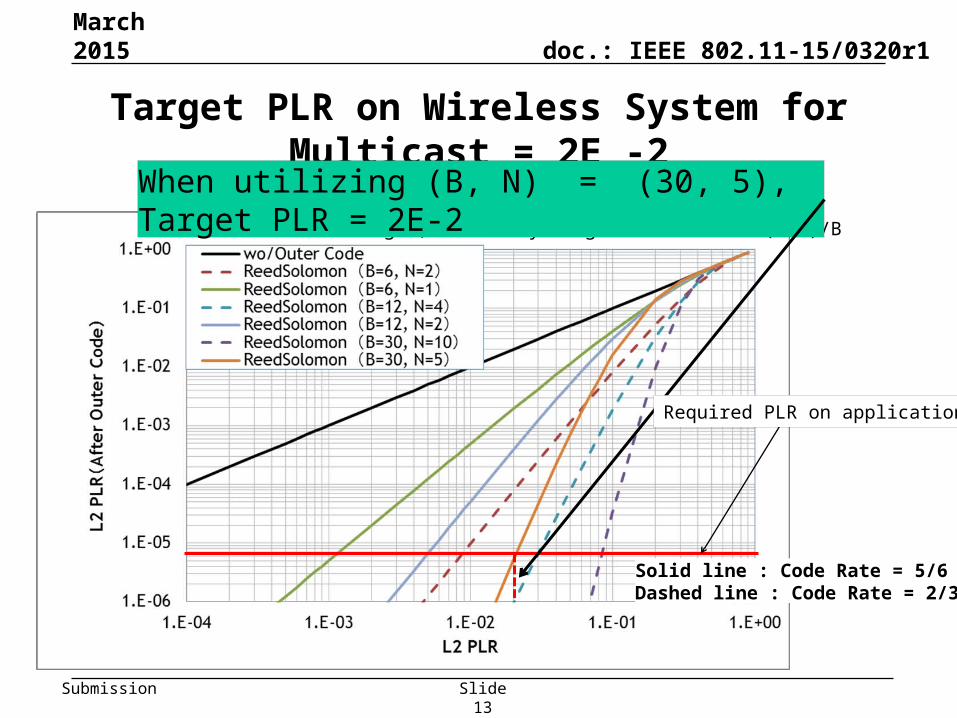
Target PLR on Wireless System for Multicast = 2E -2
March 2015
Slide 13
B :Block length, N: Parity length Code rate = (B-N)/B
Solid line : Code Rate = 5/6Dashed line : Code Rate = 2/3
When utilizing (B, N) = (30, 5), Target PLR = 2E-2
Required PLR on application