Embed Size (px)
Citation preview
doc.: IEEE 802.11-09/1011r0
Submission
September 2009
Alexander Maltsev, IntelSlide 1
Verification of Polarization Impact Model by Experimental Data
Date: 2009-09-21
Authors:Name Affiliations Address Phone email
Alexander Maltsev Intel Corporation Turgeneva str., 30, Nizhny Novgorod, 603024, Russia
+78314969461 [email protected]
Roman Maslennikov
University of Nizhny Novgorod
Gagarin ave., 23, Nizhny Novgorod, 603950, Russia
+79047855055 [email protected]
Artyom Lomayev Intel Corporation Turgeneva str., 30, Nizhny Novgorod, 603024, Russia
+78314969461 [email protected]
Alexey Sevastyanov
Intel Corporation Turgeneva str., 30, Nizhny Novgorod, 603024, Russia
+78314969461 [email protected]
doc.: IEEE 802.11-09/1011r0
Submission
September 2009
Alexander Maltsev, IntelSlide 2
Abstract
• This contribution presents results of experimental verification of the polarization impact model proposed in [1] - [3]. Using measurements results presented in [4], it is demonstrated that the proposed polarization impact model is well matched to actual experimental data obtained in a conference room environment.
doc.: IEEE 802.11-09/1011r0
Submission
September 2009
Alexander Maltsev, IntelSlide 3
Introduction
• Accurate modeling of polarization characteristics is important for 60 GHz wireless systems where impact due to polarization mismatch can be very strong for both LOS and NLOS environments.
• Experimental data for the polarization impact was presented in [4] demonstrating that mismatch of polarization characteristics of the transmit and receive antennas can result in large degradations of the received signal power by 10-20 dB.
• The model for the polarization impact was proposed in [1] - [3].
• This contribution presents results of verification of the polarization model [1] - [3] with the experimental results from [4].
doc.: IEEE 802.11-09/1011r0
Submission
Polarization Impact Model (1 of 3)
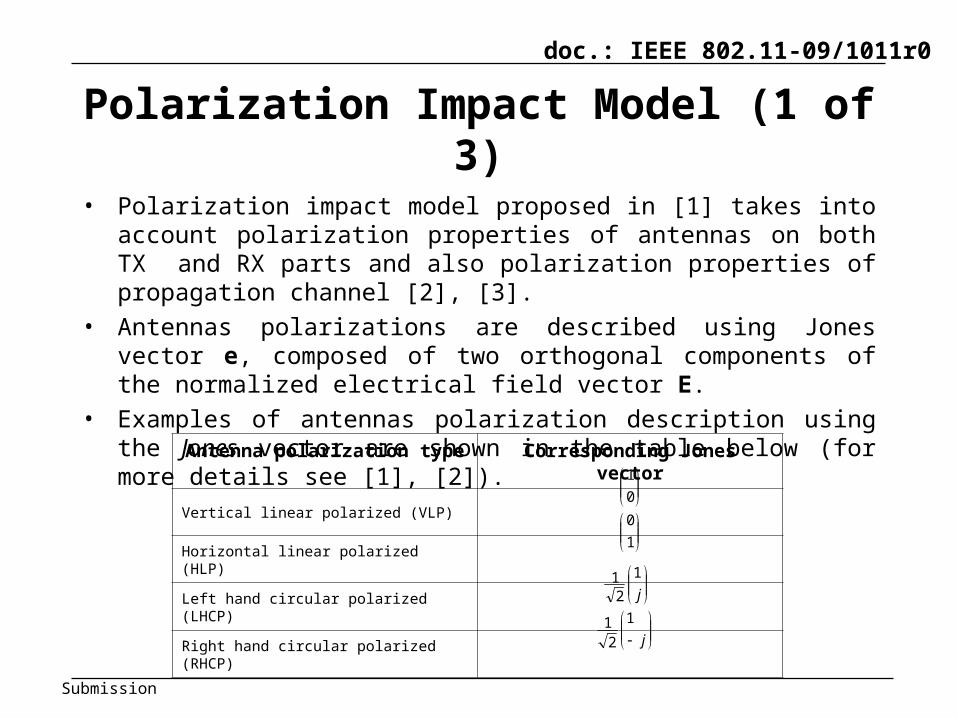
• Polarization impact model proposed in [1] takes into account polarization properties of antennas on both TX and RX parts and also polarization properties of propagation channel [2], [3].
• Antennas polarizations are described using Jones vector e, composed of two orthogonal components of the normalized electrical field vector E.
• Examples of antennas polarization description using the Jones vector are shown in the table below (for more details see [1], [2]).
Antenna polarization type Corresponding Jones vector
Vertical linear polarized (VLP)
Horizontal linear polarized (HLP)
Left hand circular polarized (LHCP)
Right hand circular polarized (RHCP)
0
1
1
0
j
1
21
j
1
21
doc.: IEEE 802.11-09/1011r0
Submission
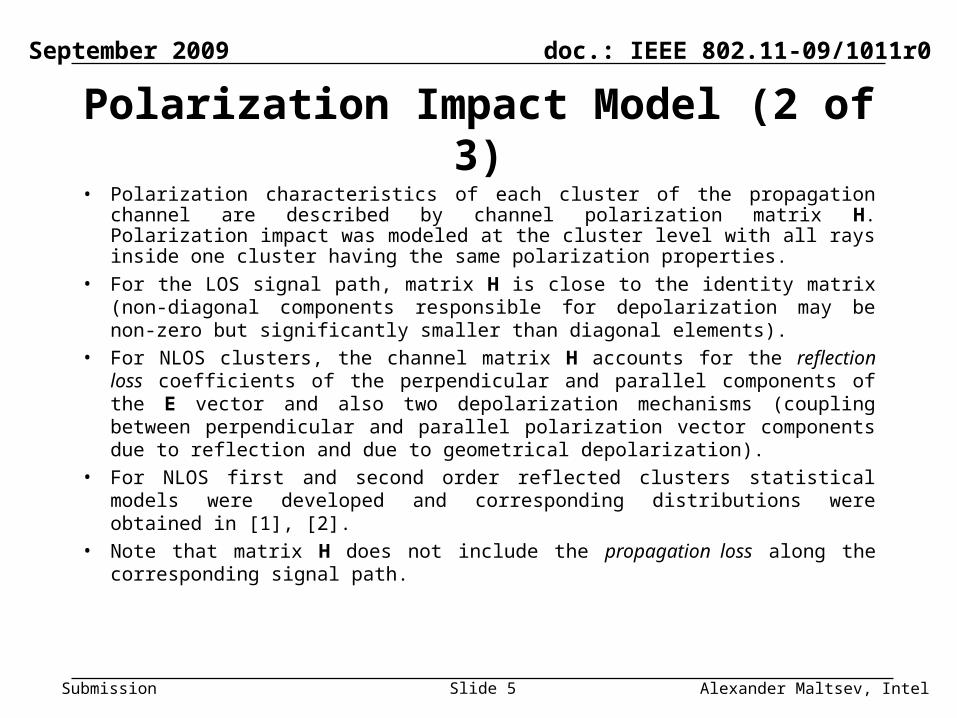
Polarization Impact Model (2 of 3)• Polarization characteristics of each cluster of the propagation channel are
described by channel polarization matrix H. Polarization impact was modeled at the cluster level with all rays inside one cluster having the same polarization properties.
• For the LOS signal path, matrix H is close to the identity matrix (non-diagonal components responsible for depolarization may be non-zero but significantly smaller than diagonal elements).
• For NLOS clusters, the channel matrix H accounts for the reflection loss coefficients of the perpendicular and parallel components of the E vector and also two depolarization mechanisms (coupling between perpendicular and parallel polarization vector components due to reflection and due to geometrical depolarization).
• For NLOS first and second order reflected clusters statistical models were developed and corresponding distributions were obtained in [1], [2].
• Note that matrix H does not include the propagation loss along the corresponding signal path.
September 2009
Alexander Maltsev, IntelSlide 5
doc.: IEEE 802.11-09/1011r0
Submission
Polarization Impact Model (3 of 3)
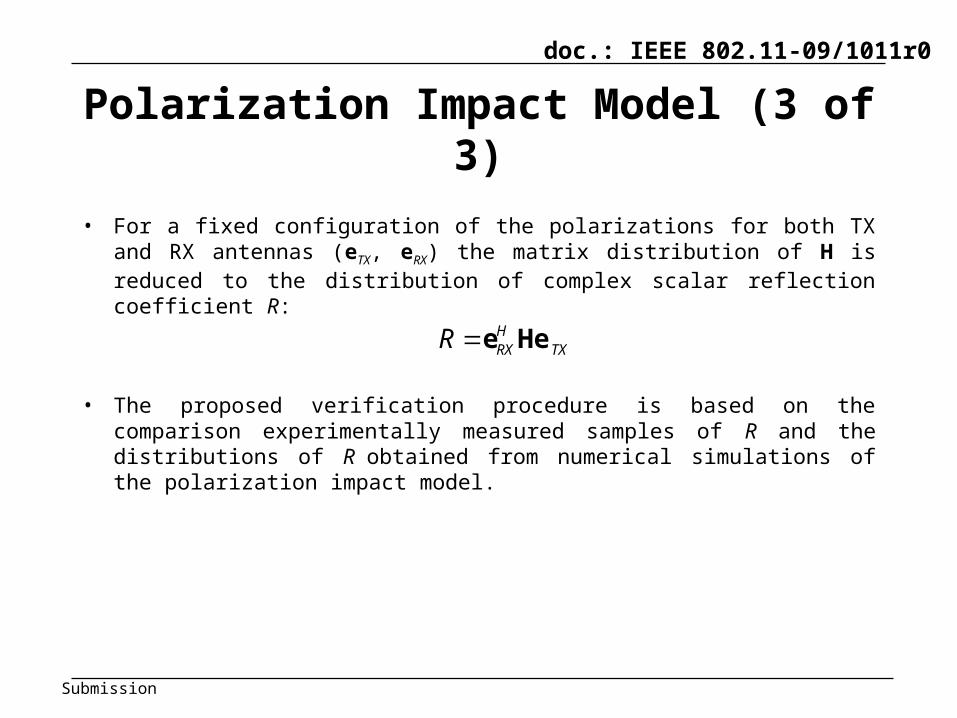
• For a fixed configuration of the polarizations for both TX and RX antennas (eTX, eRX) the matrix distribution of H is reduced to the distribution of complex scalar reflection coefficient R:
• The proposed verification procedure is based on the comparison experimentally measured samples of R and the distributions of R obtained from numerical simulations of the polarization impact model.
TXHRXR Hee
doc.: IEEE 802.11-09/1011r0
Submission
Verification Procedure
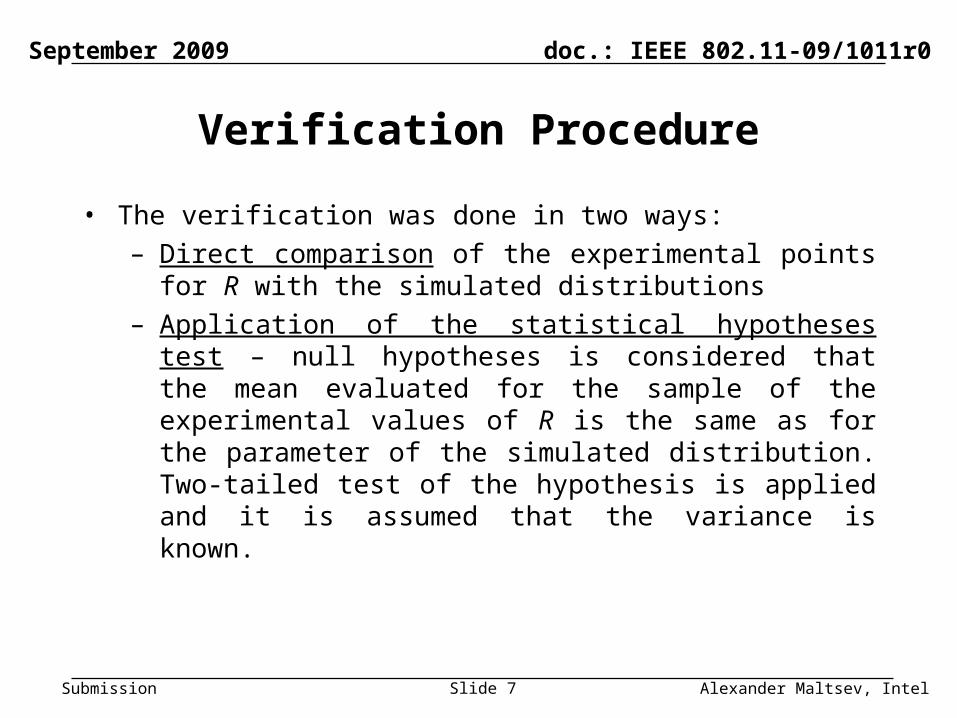
• The verification was done in two ways:
– Direct comparison of the experimental points for R with the simulated distributions
– Application of the statistical hypotheses test – null hypotheses is considered that the mean evaluated for the sample of the experimental values of R is the same as for the parameter of the simulated distribution. Two-tailed test of the hypothesis is applied and it is assumed that the variance is known.
September 2009
Alexander Maltsev, IntelSlide 7
doc.: IEEE 802.11-09/1011r0
Submission
Measurement Scenario• Verification procedure for the polarization impact model is applied for the
conference room (CR) environment scenario and the STA-STA sub-scenario. In this sub-scenario, the transmitter and receiver are placed on the table [2] in the middle of the conference room.
• The 60 GHz prototype [5] was used for performing experimental measurements of the polarization impact. Four different types of antenna polarizations could be set – HLP, VLP, LHCP, and RHCP on both TX and RX sides.
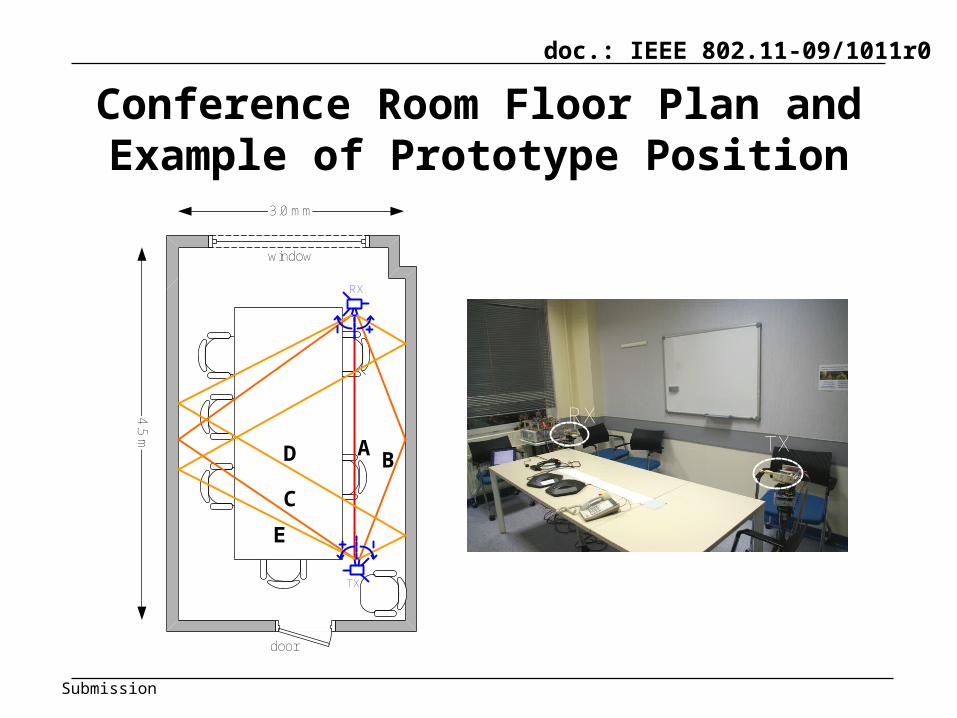
• Three different positions of the prototype in the conference room were tested. An example of the prototype position is shown in the next slide.
• The polarization impact was investigated for six different signal propagation paths in each position of the prototype. These are a LOS path and five reflected signal propagation paths: one first order reflection from ceiling, two first order reflections from walls, and two second order reflections from walls. (Note that other clusters exist for the used positions, but measurements were performed for the mentioned clusters only.)
September 2009
Alexander Maltsev, IntelSlide 8
doc.: IEEE 802.11-09/1011r0
Submission
Conference Room Floor Plan and Example of Prototype Position
4.5 m
3.0 mm
door
RX
TX
window
AB
C
E
D
RXTX
doc.: IEEE 802.11-09/1011r0
Submission
Calculation of Reflection Loss Using Measurements Data
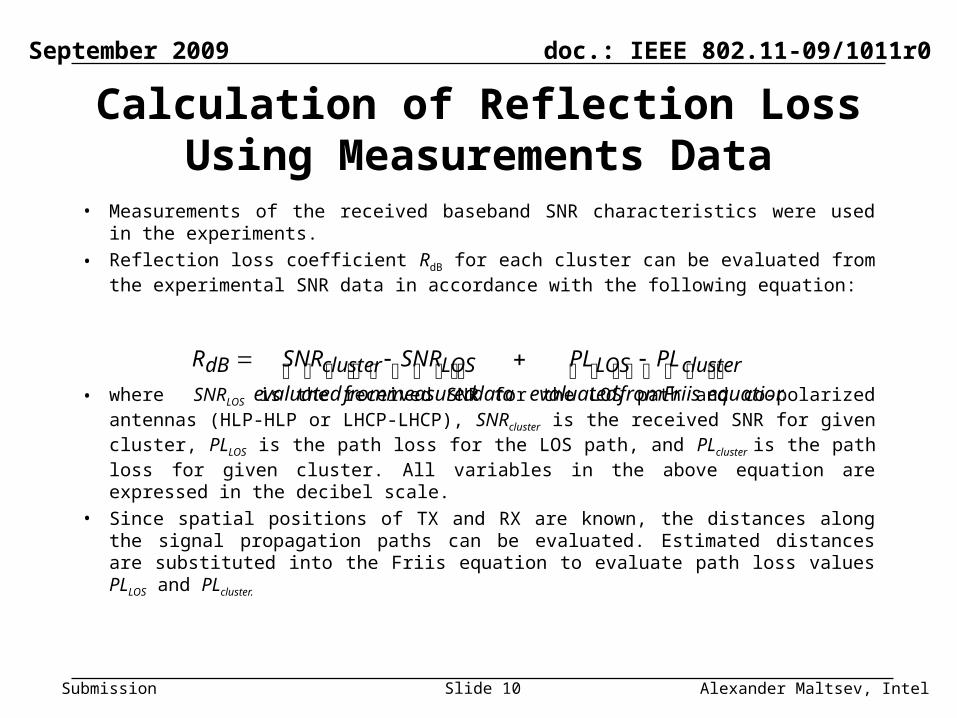
• Measurements of the received baseband SNR characteristics were used in the experiments.
• Reflection loss coefficient RdB for each cluster can be evaluated from the experimental SNR data in accordance with the following equation:
• where SNRLOS is the received SNR for the LOS path and co-polarized antennas (HLP-HLP or LHCP-LHCP), SNRcluster is the received SNR for given cluster, PLLOS is the path loss for the LOS path, and PLcluster is the path loss for given cluster. All variables in the above equation are expressed in the decibel scale.
• Since spatial positions of TX and RX are known, the distances along the signal propagation paths can be evaluated. Estimated distances are substituted into the Friis equation to evaluate path loss values PLLOS and PLcluster.
September 2009
Alexander Maltsev, IntelSlide 10
equationFriisfromevaluated
clusterLOS
datameasuredfromevaluated
LOSclusterdB PLPLSNRSNRR
doc.: IEEE 802.11-09/1011r0
Submission
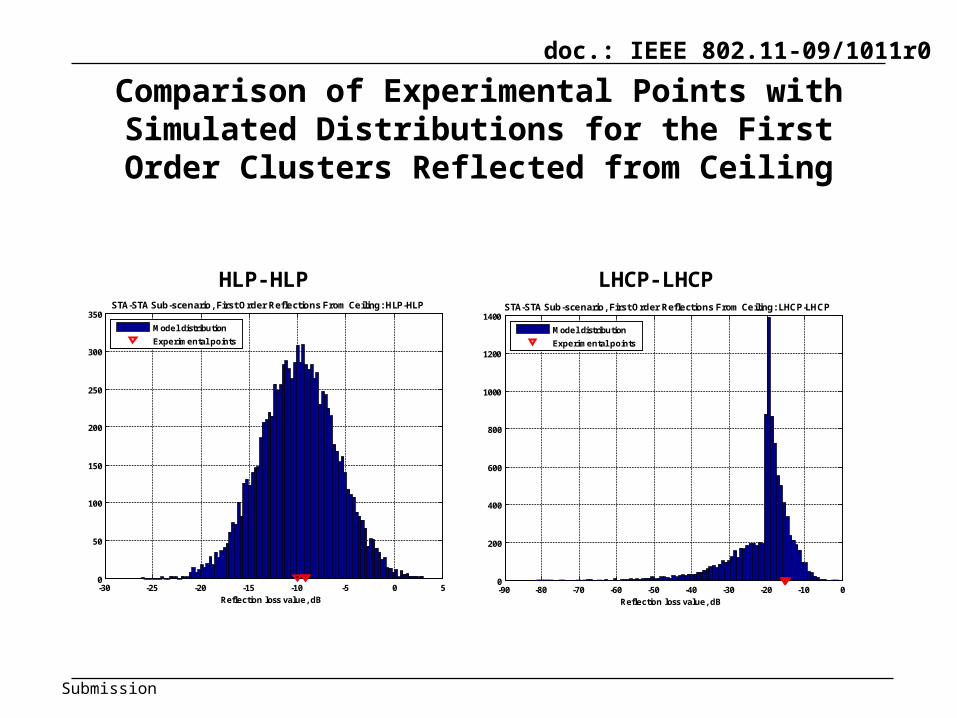
Comparison of Experimental Points with Simulated Distributions for the First Order Clusters Reflected from
Ceiling
HLP-HLP LHCP-LHCP
-30 -25 -20 -15 -10 -5 0 50
50
100
150
200
250
300
350
Reflection loss value, dB
STA-STA Sub-scenario, First Order Reflections From Ceiling: HLP-HLP
Model distribution
Experimental points
-90 -80 -70 -60 -50 -40 -30 -20 -10 00
200
400
600
800
1000
1200
1400
Reflection loss value, dB
STA-STA Sub-scenario, First Order Reflections From Ceiling: LHCP-LHCP
Model distribution
Experimental points
doc.: IEEE 802.11-09/1011r0
Submission
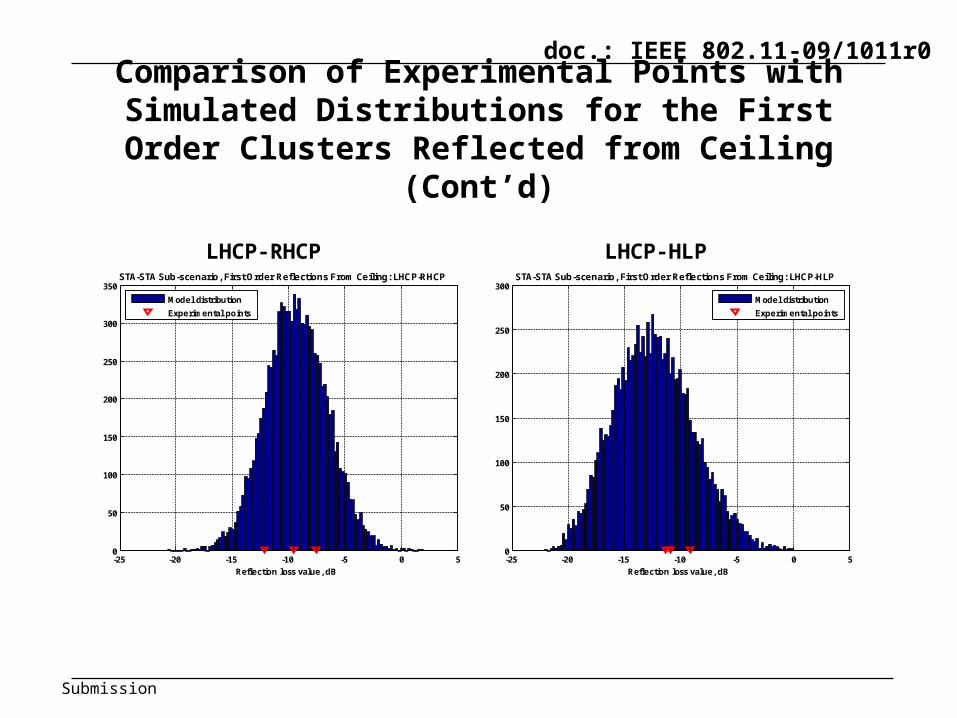
Comparison of Experimental Points with Simulated Distributions for the First Order Clusters Reflected from
Ceiling (Cont’d)
LHCP-RHCP LHCP-HLP
-25 -20 -15 -10 -5 0 50
50
100
150
200
250
300
350
Reflection loss value, dB
STA-STA Sub-scenario, First Order Reflections From Ceiling: LHCP-RHCP
Model distribution
Experimental points
-25 -20 -15 -10 -5 0 50
50
100
150
200
250
300
Reflection loss value, dB
STA-STA Sub-scenario, First Order Reflections From Ceiling: LHCP-HLP
Model distribution
Experimental points

doc.: IEEE 802.11-09/1011r0
Submission
Comparison of Experimental Points with Simulated Distributions for the First Order Clusters Reflected from
WallsHLP-HLP LHCP-LHCP
Polarization pair Null hypotheses for mean for significance level 5%
HLP-HLP accepted
LHCP-LHCP accepted
-30 -25 -20 -15 -10 -5 0 5 100
500
1000
1500
Reflection loss value, dB
STA-STA Sub-scenario, First Order Reflections From Walls: HLP-HLP
Model distribution
Experimental points
-120 -100 -80 -60 -40 -20 0 200
1000
2000
3000
4000
5000
6000
7000
Reflection loss value, dB
STA-STA Sub-scenario, First Order Reflections From Walls: LHCP-LHCP
Model distribution
Experimental points
doc.: IEEE 802.11-09/1011r0
Submission
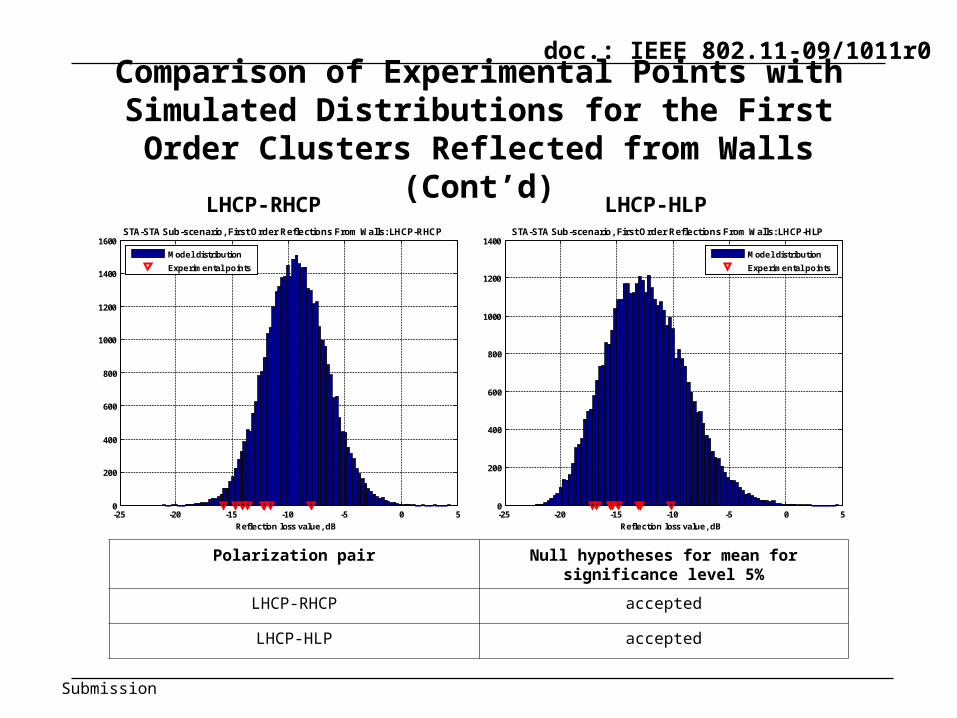
Comparison of Experimental Points with Simulated Distributions for the First Order Clusters Reflected from
Walls (Cont’d)LHCP-RHCP LHCP-HLP
Polarization pair Null hypotheses for mean for significance level 5%
LHCP-RHCP accepted
LHCP-HLP accepted
-25 -20 -15 -10 -5 0 50
200
400
600
800
1000
1200
1400
1600
Reflection loss value, dB
STA-STA Sub-scenario, First Order Reflections From Walls: LHCP-RHCP
Model distribution
Experimental points
-25 -20 -15 -10 -5 0 50
200
400
600
800
1000
1200
1400
Reflection loss value, dB
STA-STA Sub-scenario, First Order Reflections From Walls: LHCP-HLP
Model distribution
Experimental points
doc.: IEEE 802.11-09/1011r0
Submission
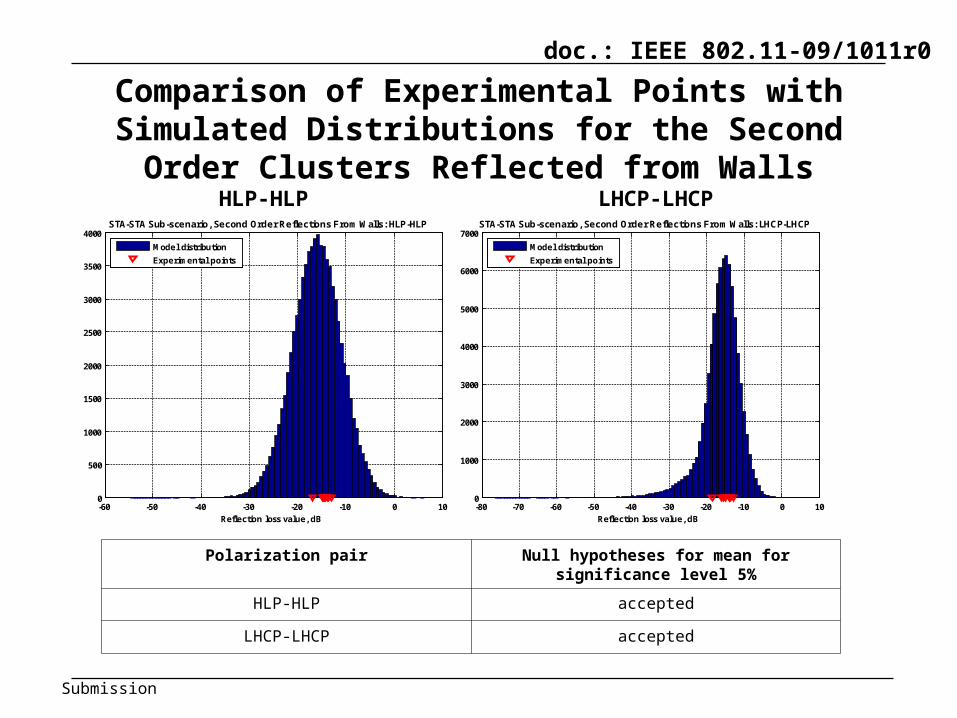
Comparison of Experimental Points with Simulated Distributions for the Second Order Clusters Reflected
from WallsHLP-HLP LHCP-LHCP
Polarization pair Null hypotheses for mean for significance level 5%
HLP-HLP accepted
LHCP-LHCP accepted
-60 -50 -40 -30 -20 -10 0 100
500
1000
1500
2000
2500
3000
3500
4000
Reflection loss value, dB
STA-STA Sub-scenario, Second Order Reflections From Walls: HLP-HLP
Model distribution
Experimental points
-80 -70 -60 -50 -40 -30 -20 -10 0 100
1000
2000
3000
4000
5000
6000
7000
Reflection loss value, dB
STA-STA Sub-scenario, Second Order Reflections From Walls: LHCP-LHCP
Model distribution
Experimental points
doc.: IEEE 802.11-09/1011r0
Submission
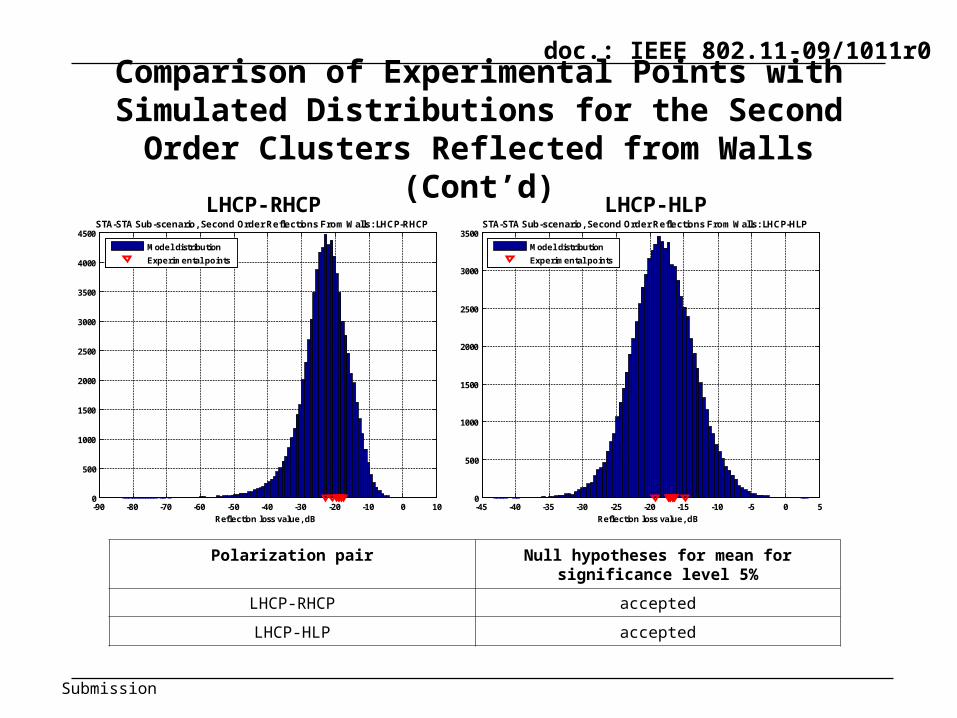
Comparison of Experimental Points with Simulated Distributions for the Second Order Clusters Reflected
from Walls (Cont’d)LHCP-RHCP LHCP-HLP
Polarization pair Null hypotheses for mean for significance level 5%
LHCP-RHCP accepted
LHCP-HLP accepted
-90 -80 -70 -60 -50 -40 -30 -20 -10 0 100
500
1000
1500
2000
2500
3000
3500
4000
4500
Reflection loss value, dB
STA-STA Sub-scenario, Second Order Reflections From Walls: LHCP-RHCP
Model distribution
Experimental points
-45 -40 -35 -30 -25 -20 -15 -10 -5 0 50
500
1000
1500
2000
2500
3000
3500
Reflection loss value, dB
STA-STA Sub-scenario, Second Order Reflections From Walls: LHCP-HLP
Model distribution
Experimental points
doc.: IEEE 802.11-09/1011r0
Submission
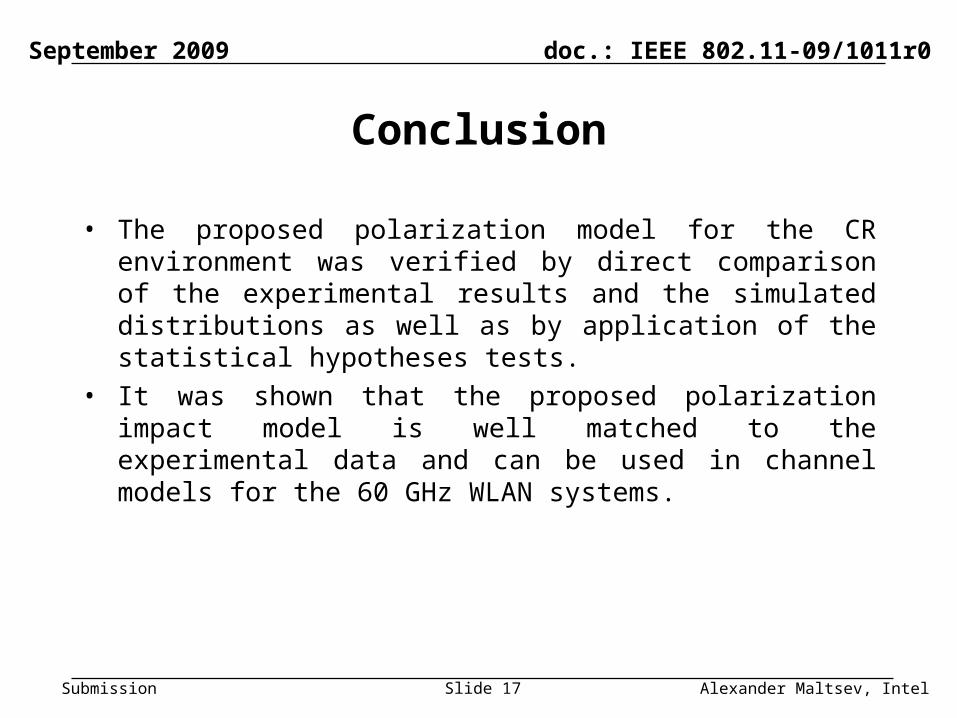
Conclusion
• The proposed polarization model for the CR environment was verified by direct comparison of the experimental results and the simulated distributions as well as by application of the statistical hypotheses tests.
• It was shown that the proposed polarization impact model is well matched to the experimental data and can be used in channel models for the 60 GHz WLAN systems.
September 2009
Alexander Maltsev, IntelSlide 17
doc.: IEEE 802.11-09/1011r0
Submission
September 2009
Alexander Maltsev, IntelSlide 18
References
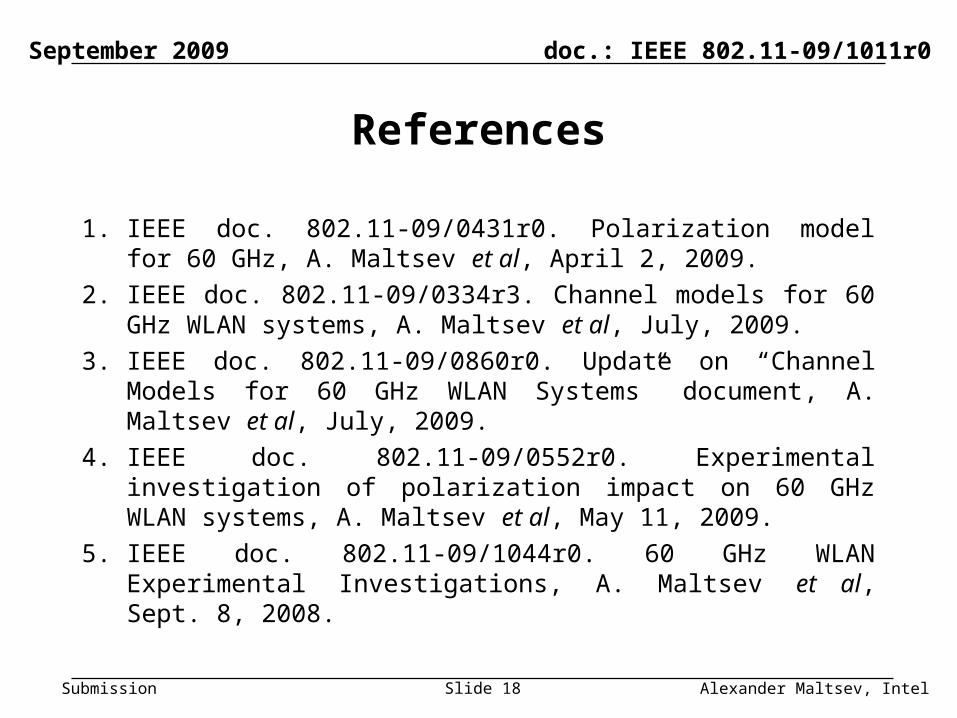
1. IEEE doc. 802.11-09/0431r0. Polarization model for 60 GHz, A. Maltsev et al, April 2, 2009.
2. IEEE doc. 802.11-09/0334r3. Channel models for 60 GHz WLAN systems, A. Maltsev et al, July, 2009.
3. IEEE doc. 802.11-09/0860r0. Update on “Channel Models for 60 GHz WLAN Systems” document, A. Maltsev et al, July, 2009.
4. IEEE doc. 802.11-09/0552r0. Experimental investigation of polarization impact on 60 GHz WLAN systems, A. Maltsev et al, May 11, 2009.
5. IEEE doc. 802.11-09/1044r0. 60 GHz WLAN Experimental Investigations, A. Maltsev et al, Sept. 8, 2008.